the Creative Commons Attribution 4.0 License.
the Creative Commons Attribution 4.0 License.
 | 05 Nov 2020
Fault-controlled fluid circulation and diagenesis along basin-bounding fault systems in rifts – insights from the East Greenland rift system
Eric Salomon
Atle Rotevatn
Thomas Berg Kristensen
Sten-Andreas Grundvåg
Gijs Allard Henstra
Anna Nele Meckler
Richard Albert
Axel Gerdes
In marine rift basins, deep-water clastics (>200 m) in the hanging wall of rift- or basin-bounding fault systems are commonly juxtaposed against crystalline “basement” rocks in the footwall. A distinct feature of such fault systems is therefore the juxtaposition of relatively highly permeable, unconsolidated sediments against relatively low-permeable basement rocks. Due to limited surface exposure of such fault zones, studies elucidating their structure and evolution are rare. Consequently, their impact on fluid circulation and diagenesis within and proximal to the fault zone as well as into the hanging wall strata are also poorly understood. Motivated by this, we here investigate a well-exposed strand of a major basin-bounding fault system in the East Greenland rift system, namely the Dombjerg Fault which bounds the Wollaston Forland Basin, northeast (NE) Greenland. Here, syn-rift deep-water clastics of Late Jurassic to Early Cretaceous age are juxtaposed against Caledonian metamorphic basement.
Previously, a ∼ 1 km wide zone of pervasive pore-filling calcite cementation of the hanging wall sediments along the Dombjerg Fault core was identified (Kristensen et al., 2016). In this study, based on U–Pb calcite dating, we show that cementation and formation of this cementation zone started during the rift climax in Berrisian–Valanginian times. Using clumped isotope analysis, we determined cement formation temperatures of ∼ 30–70 ∘C. The spread in the formation temperatures at similar formation age indicates variable heat flow of upward fluid circulation along the fault in the hanging wall sediments, which may root in permeability variations in the sediments.
Calcite vein formation, postdating and affecting the cementation zone, clusters between ∼ 125 and 100 Ma in the post-rift stage, indicating that fracturing in the hanging wall is not directly related to the main phase of activity of the adjacent Dombjerg Fault. Vein formation temperatures at ∼ 30–80 ∘C are in a similar range as cement formation temperatures. Further, similar minor element concentrations of veins and adjacent cements indicate diffusional mass transfer into fractures, which in turn infers a subdued fluid circulation and low permeability of the fracture network. These results imply that the cementation zone formed a near-impermeable barrier soon after sediment deposition, and that low effective permeabilities were maintained in the cementation zone even after fracture formation, due to poor fracture connectivity. We argue that the existence of such a cementation zone should be considered in any assessments that target basin-bounding fault systems for, e.g., hydrocarbon, groundwater, geothermal energy, and carbon storage exploration. Our study highlights that the understanding of fluid flow properties as well as fault-controlled diagenesis affecting the fault itself and/or adjacent basinal clastics is of great fundamental and economic importance.
- Article
(30497 KB) - Full-text XML
-
Supplement
(1250 KB) - BibTeX
- EndNote


During rifting and continental breakup, the rift border fault systems that develop may reach lengths of more than a hundred kilometers and accumulate vertical displacements of several kilometers (e.g., Morley, 1995; Ebinger et al., 1999; Whipp et al., 2014). Such fault systems, often guided by pre-existing basement structure (e.g., Ring, 1994; Corti et al., 2007; Salomon et al., 2015; Phillips et al., 2016; Rotevatn et al., 2018), generally exert strong controls on rift geometry, basin physiography, accommodation, and routing of syn-rift sedimentary systems (e.g., Gawthorpe et al., 1994; Sharp et al., 2000). A main characteristic of these fault zones is the juxtaposition of clastic syn-rift sediments against crystalline basement rock (e.g., Gawthorpe and Leeder, 2000).
The influence of rift border faults on fluid flow and wall rock diagenesis has only to a limited degree been studied (e.g., Hollinsworth et al., 2019, Hollinsworth et al., 2019, and Kristensen et al., 2016, Kristensen et al., 2016, being notable exceptions), which may primarily root in the limited exposure of such fault zones. In such settings, there is a significant permeability contrast from footwall to hanging wall: the crystalline/metamorphic footwall is commonly relatively low permeable or even near impermeable, while, in contrast, the unconsolidated clastic sediments in the hanging wall may be relatively more porous and permeable. Therefore, whereas fluid circulation mainly occurs in fractures in the crystalline “basement” footwall, large fluid volumes may potentially circulate through the pore space in the clastic hanging wall strata.
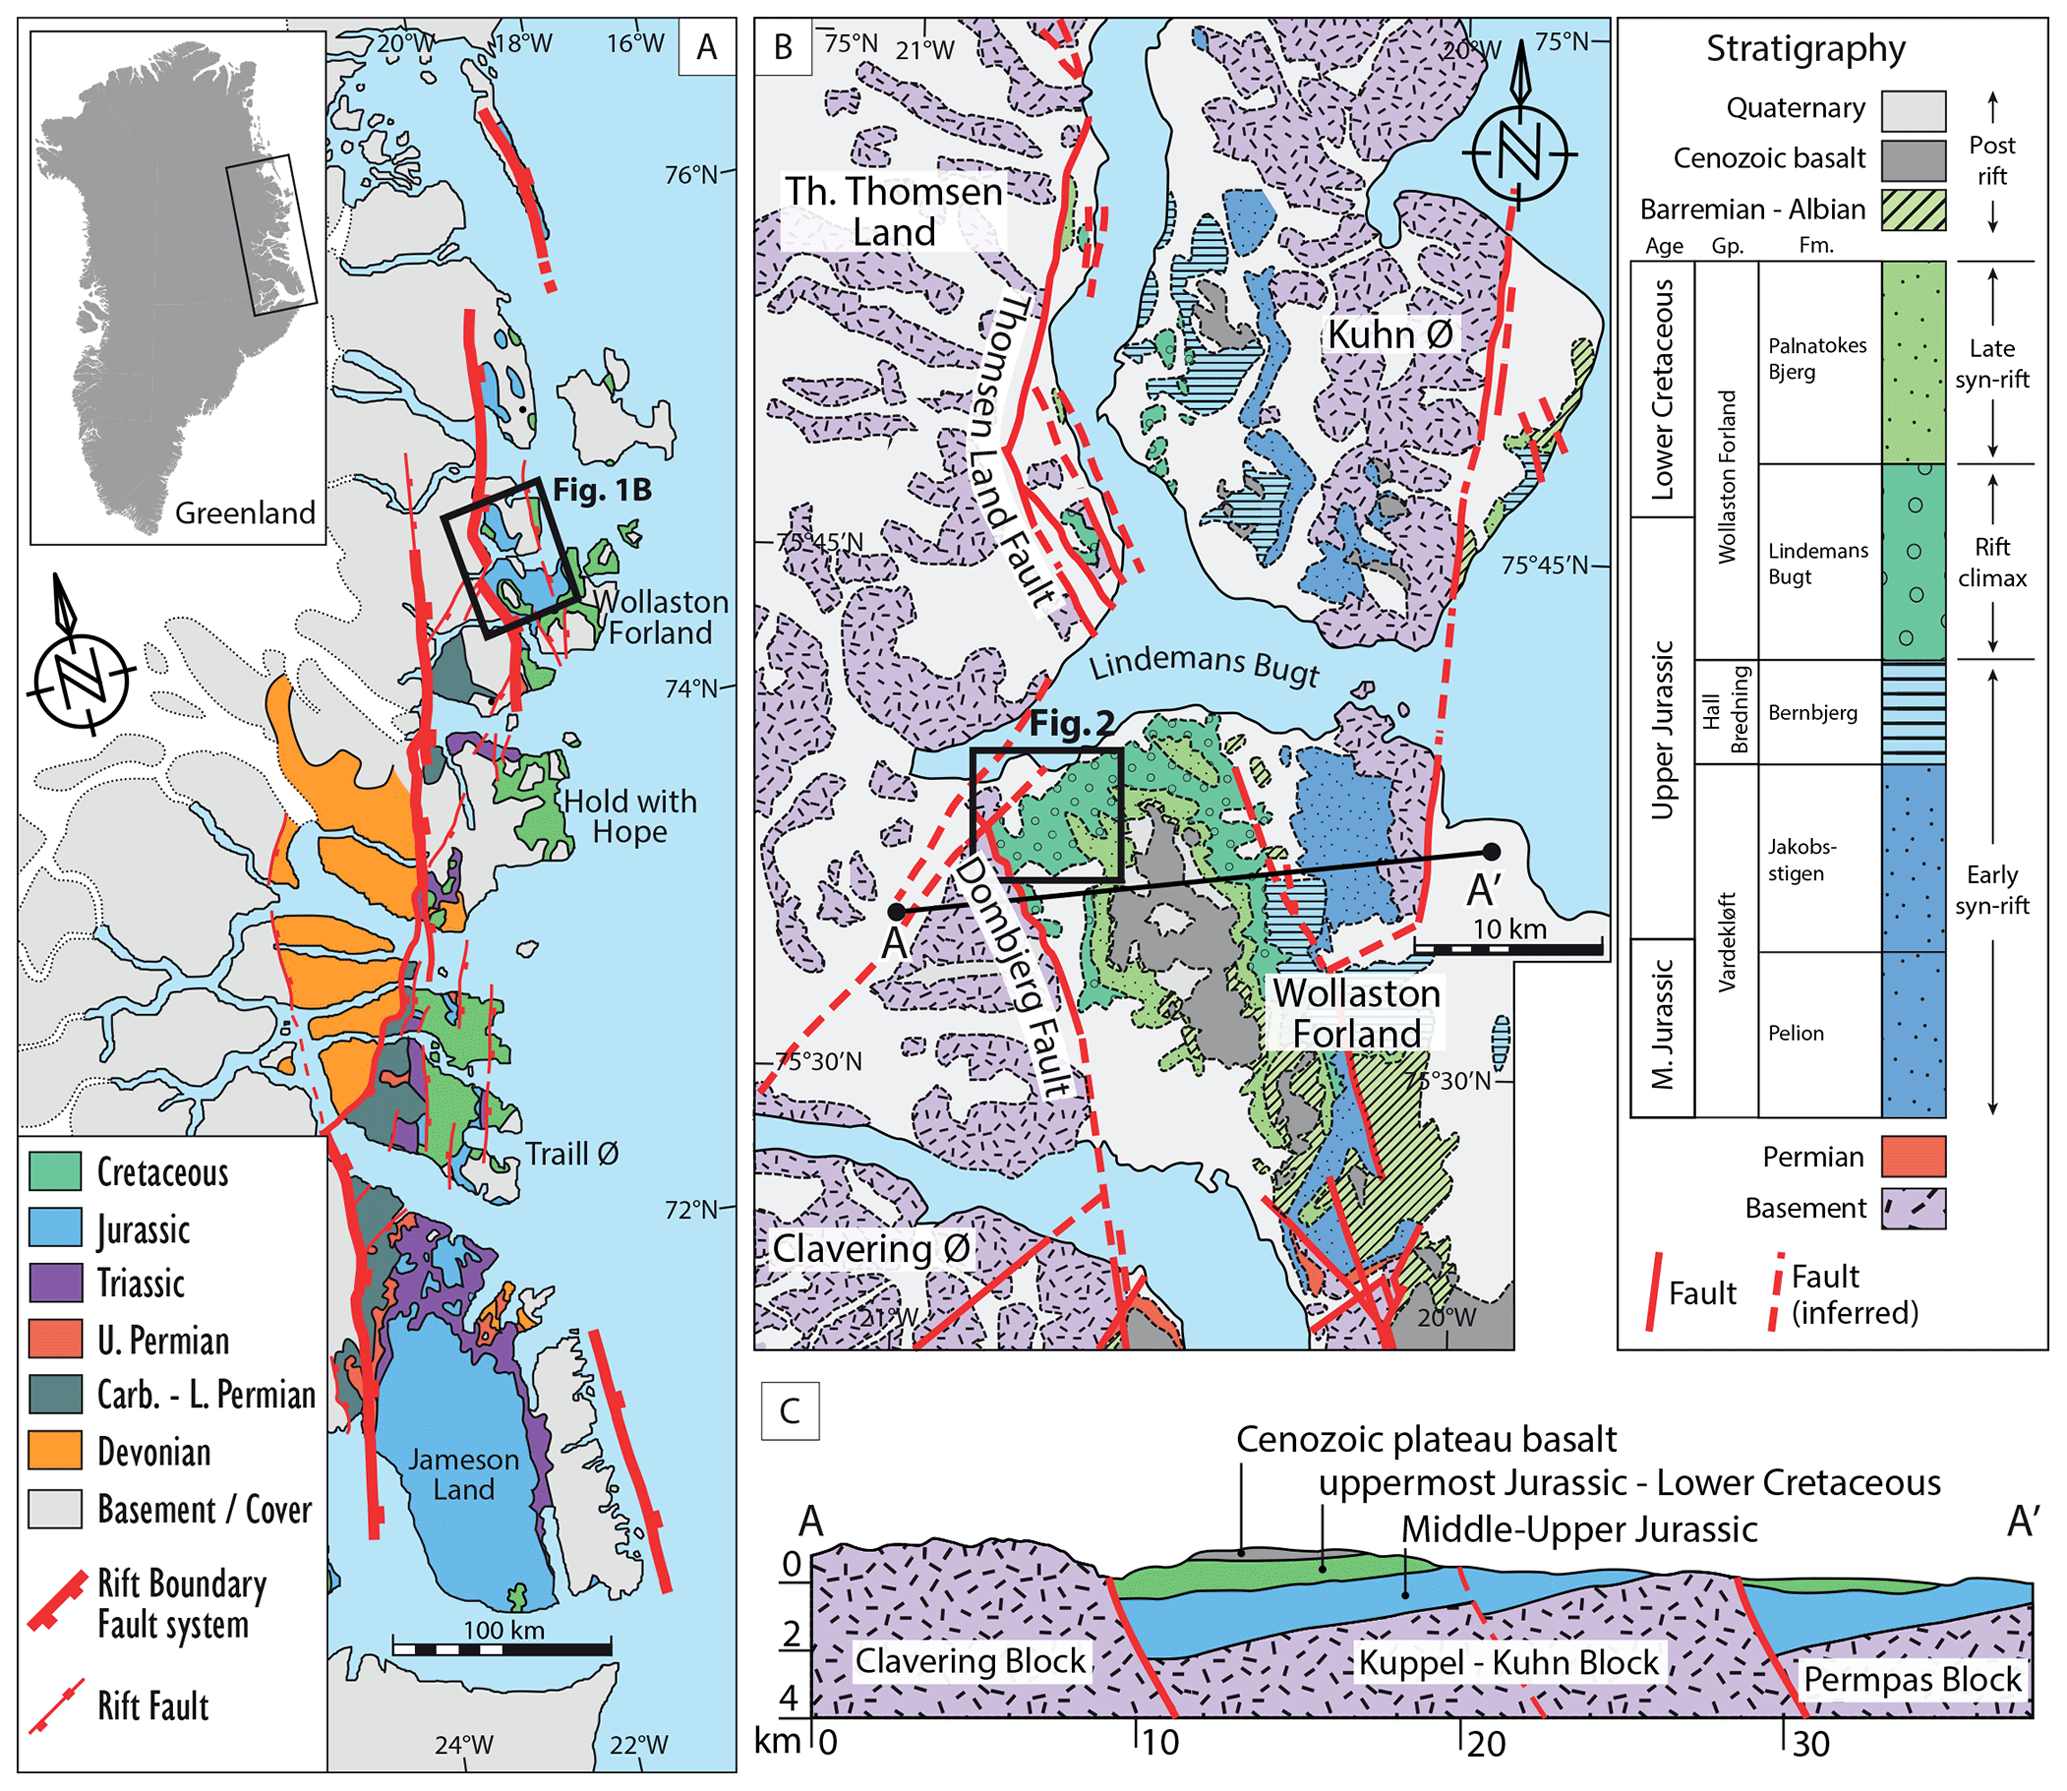
Figure 1(a) Regional geological map of NE Greenland with right-stepping rift boundary fault system separating Devonian–Jurassic sedimentary basins from Caledonian basement. (b) Geological map of the Wollaston Forland and its surroundings. (c) Geological cross section of the Wollaston Forland Basin (see panel b for location). Modified after Rotevatn et al. (2018), based on Surlyk et al. (1993), Surlyk (2003), Henriksen (2003), Surlyk and Korstgård (2013), and Henstra et al. (2016).
At the Dombjerg Fault in northeast (NE) Greenland (Fig. 1), Kristensen et al. (2016) showed that a ∼ 1 km wide envelope of calcite cement formed in the hanging wall along the fault, which strongly indicates a significant influence of the fault on the diagenetic imprint affecting the hanging wall clastics in the proximity of the fault. This is an important observation, as the calcite cementation transforms the sediments from an unconsolidated to a consolidated state. This in turn changes the mechanical properties of the hanging wall rock and affects how later deformation is accommodated: while deformation bands formed in the damage zone within porous, non-cemented clastics, discrete fractures formed in the low- to non-porous cemented clastics (Kristensen et al., 2016). It also significantly affects the permeability of the hanging wall sediments: where porous and non-cemented fluids may flow relatively freely through open pore space, with flow being hampered only by deformation bands; however, where the clastics have low to no porosity due to cementation, fluid flow becomes increasingly dependent on open fractures in an otherwise impermeable cemented sedimentary rock.
Hence, the identification of such a zone of enhanced cementation has important implications for the evaluation of near-fault diagenesis, fluid flow properties, and the understanding of the linked deformational, diagenetic, and fluid flow history of a fault zone. The fact that near-fault diagenesis substantially impacts flow properties makes it economically significant and highly relevant in, e.g., the exploration and exploitation of groundwater, hydrocarbon, and geothermal resources, and for subsurface carbon storage sites. However, at present, fault seal analyses used in, e.g., the oil and gas industry rely mostly on the analysis of the probability for juxtaposition seal and shale smear, neglecting the effect of diagenetic sealing mechanisms (e.g., Sperrevik et al., 2002; Yielding et al., 2010; Karolytė et al., 2020).
In this contribution, we aim to further elucidate the formation of cementation zones along syn-rift border faults. To do this, and building on Kristensen et al. (2016), we here investigate the evolution of the well-exposed cementation zone of the Dombjerg Fault in the Wollaston Forland of NE Greenland, where we combine the analysis of (i) field and microstructural observations, (ii) cement and vein formation temperatures based on clumped isotope analysis, and (iii) cement and vein formation ages based on U–Pb calcite dating, as well as (iv) minor element compositions of cements and veins based on electron microprobe analysis. We demonstrate that the cemented envelope formed soon after the deposition of rift-climax sediments at shallow burial depths, with vein formation occurring predominantly in the post-rift stage. We also show that even after fracturing, the cemented envelope retained low effective permeabilities due to poor fracture connectivity, thus forming a long-lived barrier for fluid flow. The results offer a unique insight into near-fault diagenesis associated with major basin-bounding fault systems in rifts, showcasing the interplay of deformation, fluid flow, and diagenesis.
The study area is located in the Wollaston Forland in NE Greenland and forms part of the East Greenland rift system (Fig. 1). This rift system has experienced a long-lived extensional history since the late Paleozoic that eventually resulted in the opening of the North Atlantic in the Paleocene–Eocene (e.g., Larsen and Watt, 1985; Surlyk, 1990; Stemmerik et al., 1991), followed by regional uplift of up to several kilometers in Cenozoic times (Christiansen et al., 1992; Thomson et al., 1999). Onshore, the East Greenland rift system is exposed along ∼ 600 km where a major right-stepping rift-bounding fault system displaces Permian to Cretaceous syn-rift sedimentary rocks against Caledonian metamorphic and crystalline basement (Fig. 1a). In the Wollaston Forland, this rift-border fault system is marked by the ∼ 25 km long Dombjerg Fault with an approximately 3 km vertical throw (Fig. 1b, c; Surlyk and Korstgård, 2013). Activity of the Dombjerg Fault presumably started in the Mississippian and the fault was repeatedly active prior to the onset of the main rift phase in the Middle Jurassic (Rotevatn et al., 2018). To the north, the fault connects with the Thomsen Land Fault through a ∼ 10 km wide transfer zone.
The footwall block west of the Dombjerg Fault (referred to as the Clavering Block; Fig. 1c) comprises Caledonian migmatite gneisses, pegmatites, amphibolites, felsic gneisses, mafic and ultramafic rocks (Surlyk, 1978; Kristensen et al., 2016). East of the fault in the Wollaston Forland, the earliest sediments deposited, though not directly exposed along the fault, are of Permian age and constitute carbonates and evaporites (Fig. 1b; Surlyk et al., 1986; Surlyk and Korstgård, 2013). These deposits are overlain by an Upper Jurassic to Lower Cretaceous succession of rift-related sediments, which is subdivided into (i) early syn-rift, (ii) rift-climax, and (iii) late syn-rift deposits (sensu Surlyk and Korstgård, 2013; early syn-rift broadly corresponds with the term “rift initiation”, sensu Prosser, 1993). Early syn-rift marine sediments are of Middle to Late Jurassic age (Fig. 1b) and constitute mainly shallow marine sandstone (Pelion Formation), alternating thin mudstone and marine sandstone (Jakobsstigen Formation), and heterolithic deposits of marine origin, as well as alternating basinal mudstones and turbidite sandstones (Bernbjerg Formation; Surlyk and Korstgård, 2013).
Exposed sedimentary rocks in the hanging wall (referred to as the Kuppel–Kuhn Block; Fig. 1c) of the Dombjerg Fault are of Late Jurassic to Early Cretaceous age (Tithonian–Hauterivian) and are mostly sandstones and conglomerates that stratigraphically belong to the up to 3 km thick Wollaston Forland Group (e.g., Surlyk, 1984). The sediments were derived from footwall erosion and were deposited by gravity flows in a fully submarine environment during the rift-climax and late syn-rift phases (e.g., Surlyk, 1978, 1984; Henstra et al., 2016). The Wollaston Forland Group is divided into the rift-climax succession of the Lindemans Bugt Formation (mid-Volgian–late Ryazanian, i.e., ∼ 148–147 Ma) and the late syn-rift succession assigned to the Palnatokes Bjerg Formation (latest Ryazanian–early Hauterivian; Surlyk, 1984; Surlyk and Korstgård, 2013; Henstra et al., 2016). This study only pertains to the rift-climax deposits of the Lindemans Bugt Formation.
The Lindemans Bugt Formation consists mainly of conglomerates and sandstones that form a clastic wedge bounded to the west by the Dombjerg Fault, extending 10–15 km eastward into the basin before it gradually thins across the tilted crest of the hanging wall block (Fig. 1c). Close to the basin-bounding border fault, the hanging wall clastic succession is ∼ 2 km thick with strata dipping at 10–15∘ towards the basin axis to the east (Surlyk and Korstgård, 2013; Henstra et al., 2016). Further basinward, the thickness of the succession decreases and the inclination decreases with strata being subhorizontal. On the adjacent dip-slope of the hanging wall block, the strata display gently dips up to 6∘ towards the basin axis to the west (Surlyk and Korstgård, 2013; Henstra et al., 2016). Collectively, the thickness and dip variations reflect the asymmetric geometry of the basin, which is typical of basins developing from fault block rotation (e.g., Gawthorpe and Leeder, 2000). Thus, it is reasonable to assume that the basin was deepest close to the border fault, offering available accommodation for a thick succession of gravity flow deposits to accumulate (Surlyk, 1984; Henstra et al., 2016).
Within a ∼ 2 km wide zone along the fault, the Lindemans Bugt Formation hosts brecciated clasts up to several meters wide, consisting of metamorphic and crystalline basements rocks, and unsorted boulder to gravel-size conglomerate beds with average thicknesses exceeding 3 m. Some of the thicker conglomerate beds extend far into the basin (Henstra et al., 2016). Further basinward, amalgamated conglomerate–sandstone packages give way to normally graded, gravelly sandstone and sandstone beds with tabular geometries (Henstra et al., 2016). Normally graded, fine-grained sandstone beds alternate with thin mudstone beds to form heterolithic sheet-like units (Henstra et al., 2016) and typically occur in fault-distal locations but locally also occur intercalated with the coarse clastics in close proximity to the fault.
The Dombjerg Fault dips ∼ 65∘ to the ENE (Kristensen et al., 2016) and has an estimated maximum throw of ∼ 3 km to the base of the rift (Surlyk and Korstgård, 2013). Within a zone of ∼ 200 m width, located in basement rock, the fault consists of multiple fault core strands comprising fault gouge and intense brecciation (Kristensen et al., 2016). The footwall damage zone is ∼ 600 m wide, comprising veins, fractures, and minor faults at increasing density towards the fault (i.e., from four joints and one vein per meter outside the damage zone to >50 joints and 20–30 veins per meter near the fault core; Kristensen et al., 2016). In the hanging wall, the sedimentary rock of the Lindemans Bugt Formation is characterized by pervasive calcite cementation extending approximately 1 km into the basin. Calcite veins cut through the cemented rock and are overprinted by joints. Their quantity increases from zero joints and veins per meter outside the damage zone to seven joints and veins per meter near the fault zone (Kristensen et al., 2016).
This study is based on field analyses and samples taken during a 10 d field season in August 2018, supplemented by samples collected in an earlier field season in 2014. Outcrops were chosen by accessibility and were mostly confined to the hanging wall of the Dombjerg Fault as snow fields covered the footwall. In total, 35 polished thin sections were prepared of which 21 comprise only Lindemans Bugt Formation sediments (nine of these are from carbonate-uncemented sediments), nine comprise both cemented sediment and vein material, and five comprise only vein material (three with hanging wall veins, one from fault rock veins, one from vein in basement located in the transfer zone; Fig. 2). The thin sections were analyzed through optical microscopy, scanning electron microscopy (SEM), and SEM cathodoluminescence microscopy on a Zeiss Supra 55VP, cold-cathode cathodoluminescence on a Technosyn 8200 Mk II, and Raman spectroscopy on a Horiba LabRAM HR.
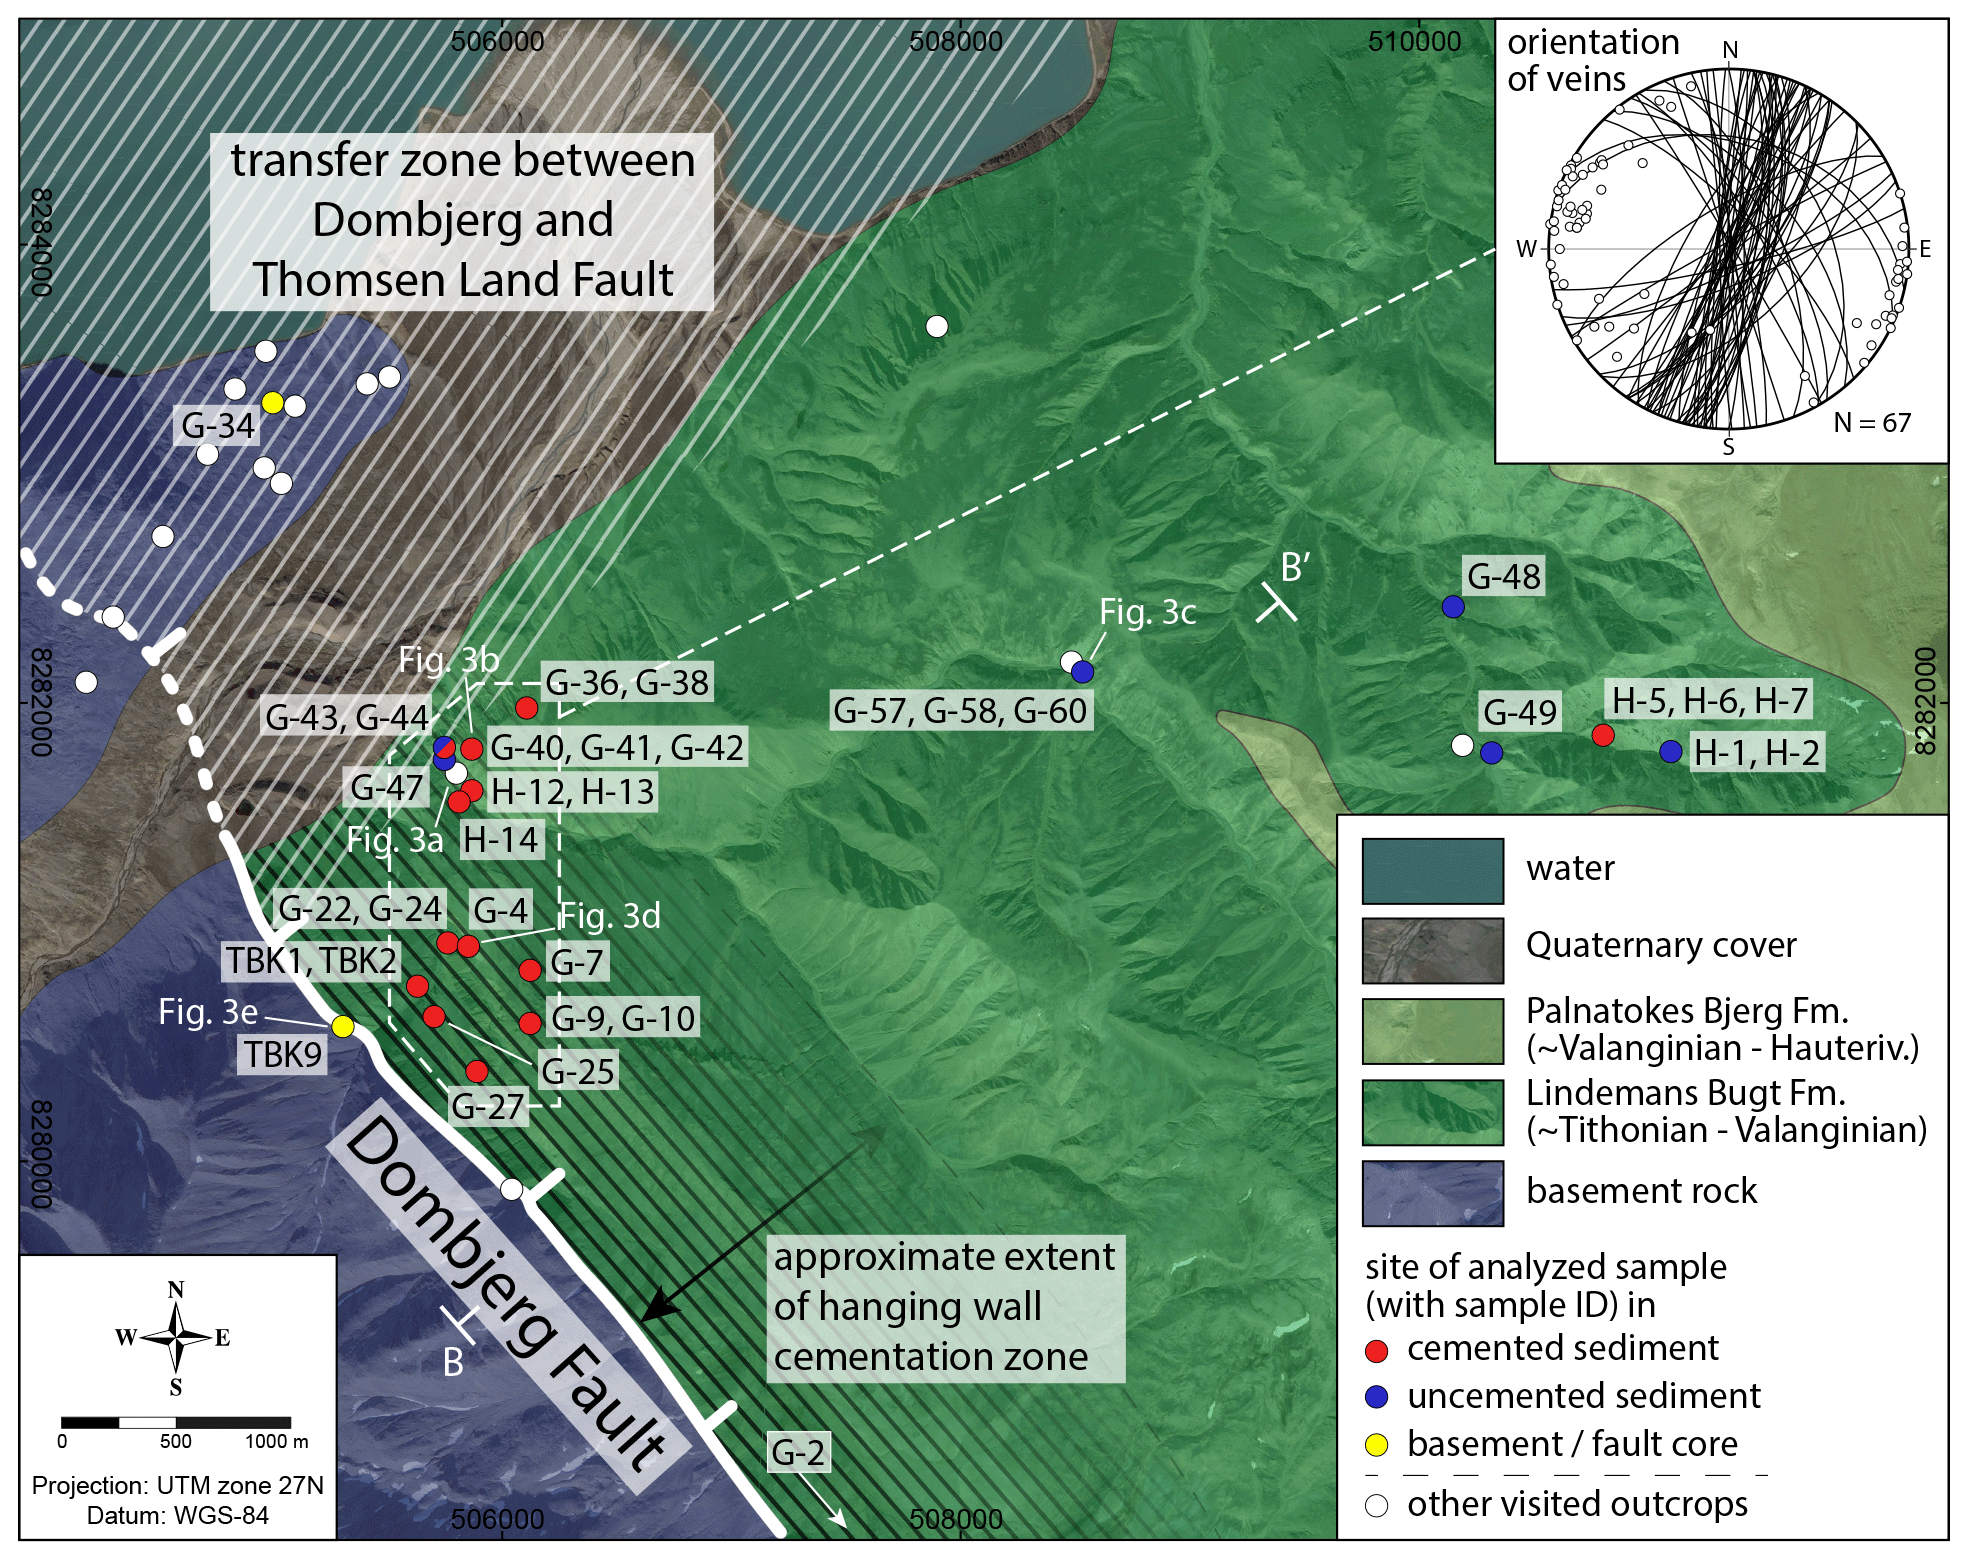
Figure 2Geological map of study area with locations of visited outcrops and samples analyzed in this study. Inset of stereographic plot shows orientation of all collected calcite veins in the hanging wall. Profile B-B′ shown in Fig. 11. Sample coordinates are provided in Table S1 in the Supplement. See Fig. 1b for location. Base satellite image from © Google Maps.
U–Pb analysis for calcite dating was performed at FIERCE (Frankfurt Isotope and Element Research Center), Goethe-University Frankfurt, with a RESOLution 193 nm ArF excimer laser (CompexPro 102) equipped with a two-volume ablation cell (Laurin Technic S155) coupled to a sector field ICP-MS (ElementXr, ThermoScientific). Before the analysis, the samples were screened to find suitable areas for further analysis. This was successful on five calcite cement samples and 12 calcite vein samples, with a total of 25 vein growth phases, of the Lindemans Bugt Formation (we note that we use the term “cement” exclusively for pore-filling calcite and not for vein calcite throughout this paper). Calcite vein samples of the basement and near the fault core did not provide appropriate U and Pb signals. Full details of the U–Pb analysis are described in the Supplement. All uncertainties are reported at the 2σ level.
Clumped isotope analysis was conducted on 11 carbonate vein (10 calcite, one dolomite) and five calcite cement samples. In two calcite veins, two growth generations were analyzed (samples G-10 and G-36). Of the 11 vein samples, eight derive from the hanging wall sedimentary rock of the Lindemans Bugt Formation, two from brecciated basement rock close to the fault core, and one from basement rock in the transfer zone between the Dombjerg Fault and Thomsen Land Fault (Fig. 2). Hanging wall vein samples were chosen to spatially cover the cementation zone as best as possible. The selection of cement samples was guided by the feasibility of mechanically separating sufficient cement from the rock, which was successful on five samples. Four of these cement samples are from within the cementation zone and one (H-5) is from an isolated cemented layer outside the cementation zone.
Clumped isotope analysis was performed at the Department of Earth Science, University of Bergen, on a Thermo Fisher Scientific MAT-253 Plus isotope ratio mass spectrometer coupled to a Thermo Fisher Scientific Kiel IV carbonate preparation device, where samples are reacted individually with phosphoric acid at 70 ∘C. For each sample, 13–14 replicate measurements were performed, spread over 6 months. Results were pressure-baseline corrected (Bernasconi et al., 2013; Meckler et al., 2014) and transferred into the absolute reference frame (Dennis et al., 2011) using carbonate standards (ETH 1–3) measured alongside the samples, employing their accepted values determined by Bernasconi et al. (2018). All data processing was performed with the Easotope software (John and Bowen, 2016). For further details of the method, see Piasecki et al. (2019) or Meinicke et al. (2020). The clumped isotope analysis also yields oxygen and carbon isotope values for each replicate, which have been corrected for drift using the same carbonate standards, with a two-point scale correction (“stretching”) applied to δ18O results.
Clumped isotope results (Δ47) were averaged by sample and formation temperatures were calculated after Kele et al. (2015), using the updated version from Bernasconi et al. (2018), for calcite samples and after Müller et al. (2019) for dolomite samples. For the calculation, we neglected replicates whose Δ47 value deviated from the sample average by 3 times the standard deviation of the standards, which in total affected only one replicate. As clumped isotope temperatures are determined independently of fluid isotopic composition, the results can be used in combination with the measured oxygen isotopic values (carbonate δ18OVPDB) to calculate fluid δ18OVSMOW. For calcite samples, fluid δ18OVSMOW was calculated after Kim and O'Neil (1997, updated with a fractionation factor of 1.01025), and for dolomite samples the calibration of Horita (2014) was used. All uncertainties are presented at the 95 % confidence interval. The uncertainty for fluid δ18OVSMOW is given from the uncertainty propagation using the 95 % confidence intervals of the clumped isotope temperature and carbonate δ18OVSMOW and calculated as
Electron microprobe analysis for minor element concentrations (Mg, Fe, Mn, Sr) of calcite veins and cements was conducted on a Cameca SX100 at accelerating voltage 15 kV, beam current 10 nA, counting time on peak 20 s, and total counting time on background 20 s. Detection limits were 300 (Mg), 540 (Fe), 630 (Mn), and 420 ppm (Sr). For each analyzed vein generation, 10 points were measured, and 20 points for cements as the latter has shown a larger variability in element concentrations.
4.1 Cementation zone and diagenetic character of hanging wall sediments
The cementation zone forms an envelope of variable width along the Dombjerg Fault and, based on investigation of additional outcrops in the 2018 field season, we estimate its maximum width to be ∼ 1.5 km (Fig. 2), which is larger than previously estimated by Kristensen et al. (2016; i.e., ∼ 1 km). Within this zone, calcite cementation is prominently distributed and occurs in sedimentary layers of all grain sizes, while uncemented layers occur occasionally and are usually less than 50 cm thick. At the fault-distal limit of the cementation zone, cementation is mainly confined to conglomerate beds and outcrops show cemented layers with “holes” formerly filled with now-eroded uncemented material (Fig. 3a). It appears that the cemented layers enclosed pockets of calcite-cement-free sediments. Farther to the east, calcite cement is absent in the vast majority of outcropping sediments (Fig. 3c) and only occurs occasionally as single isolated lenses in predominantly fine to coarse sand matrix-supported conglomerates.
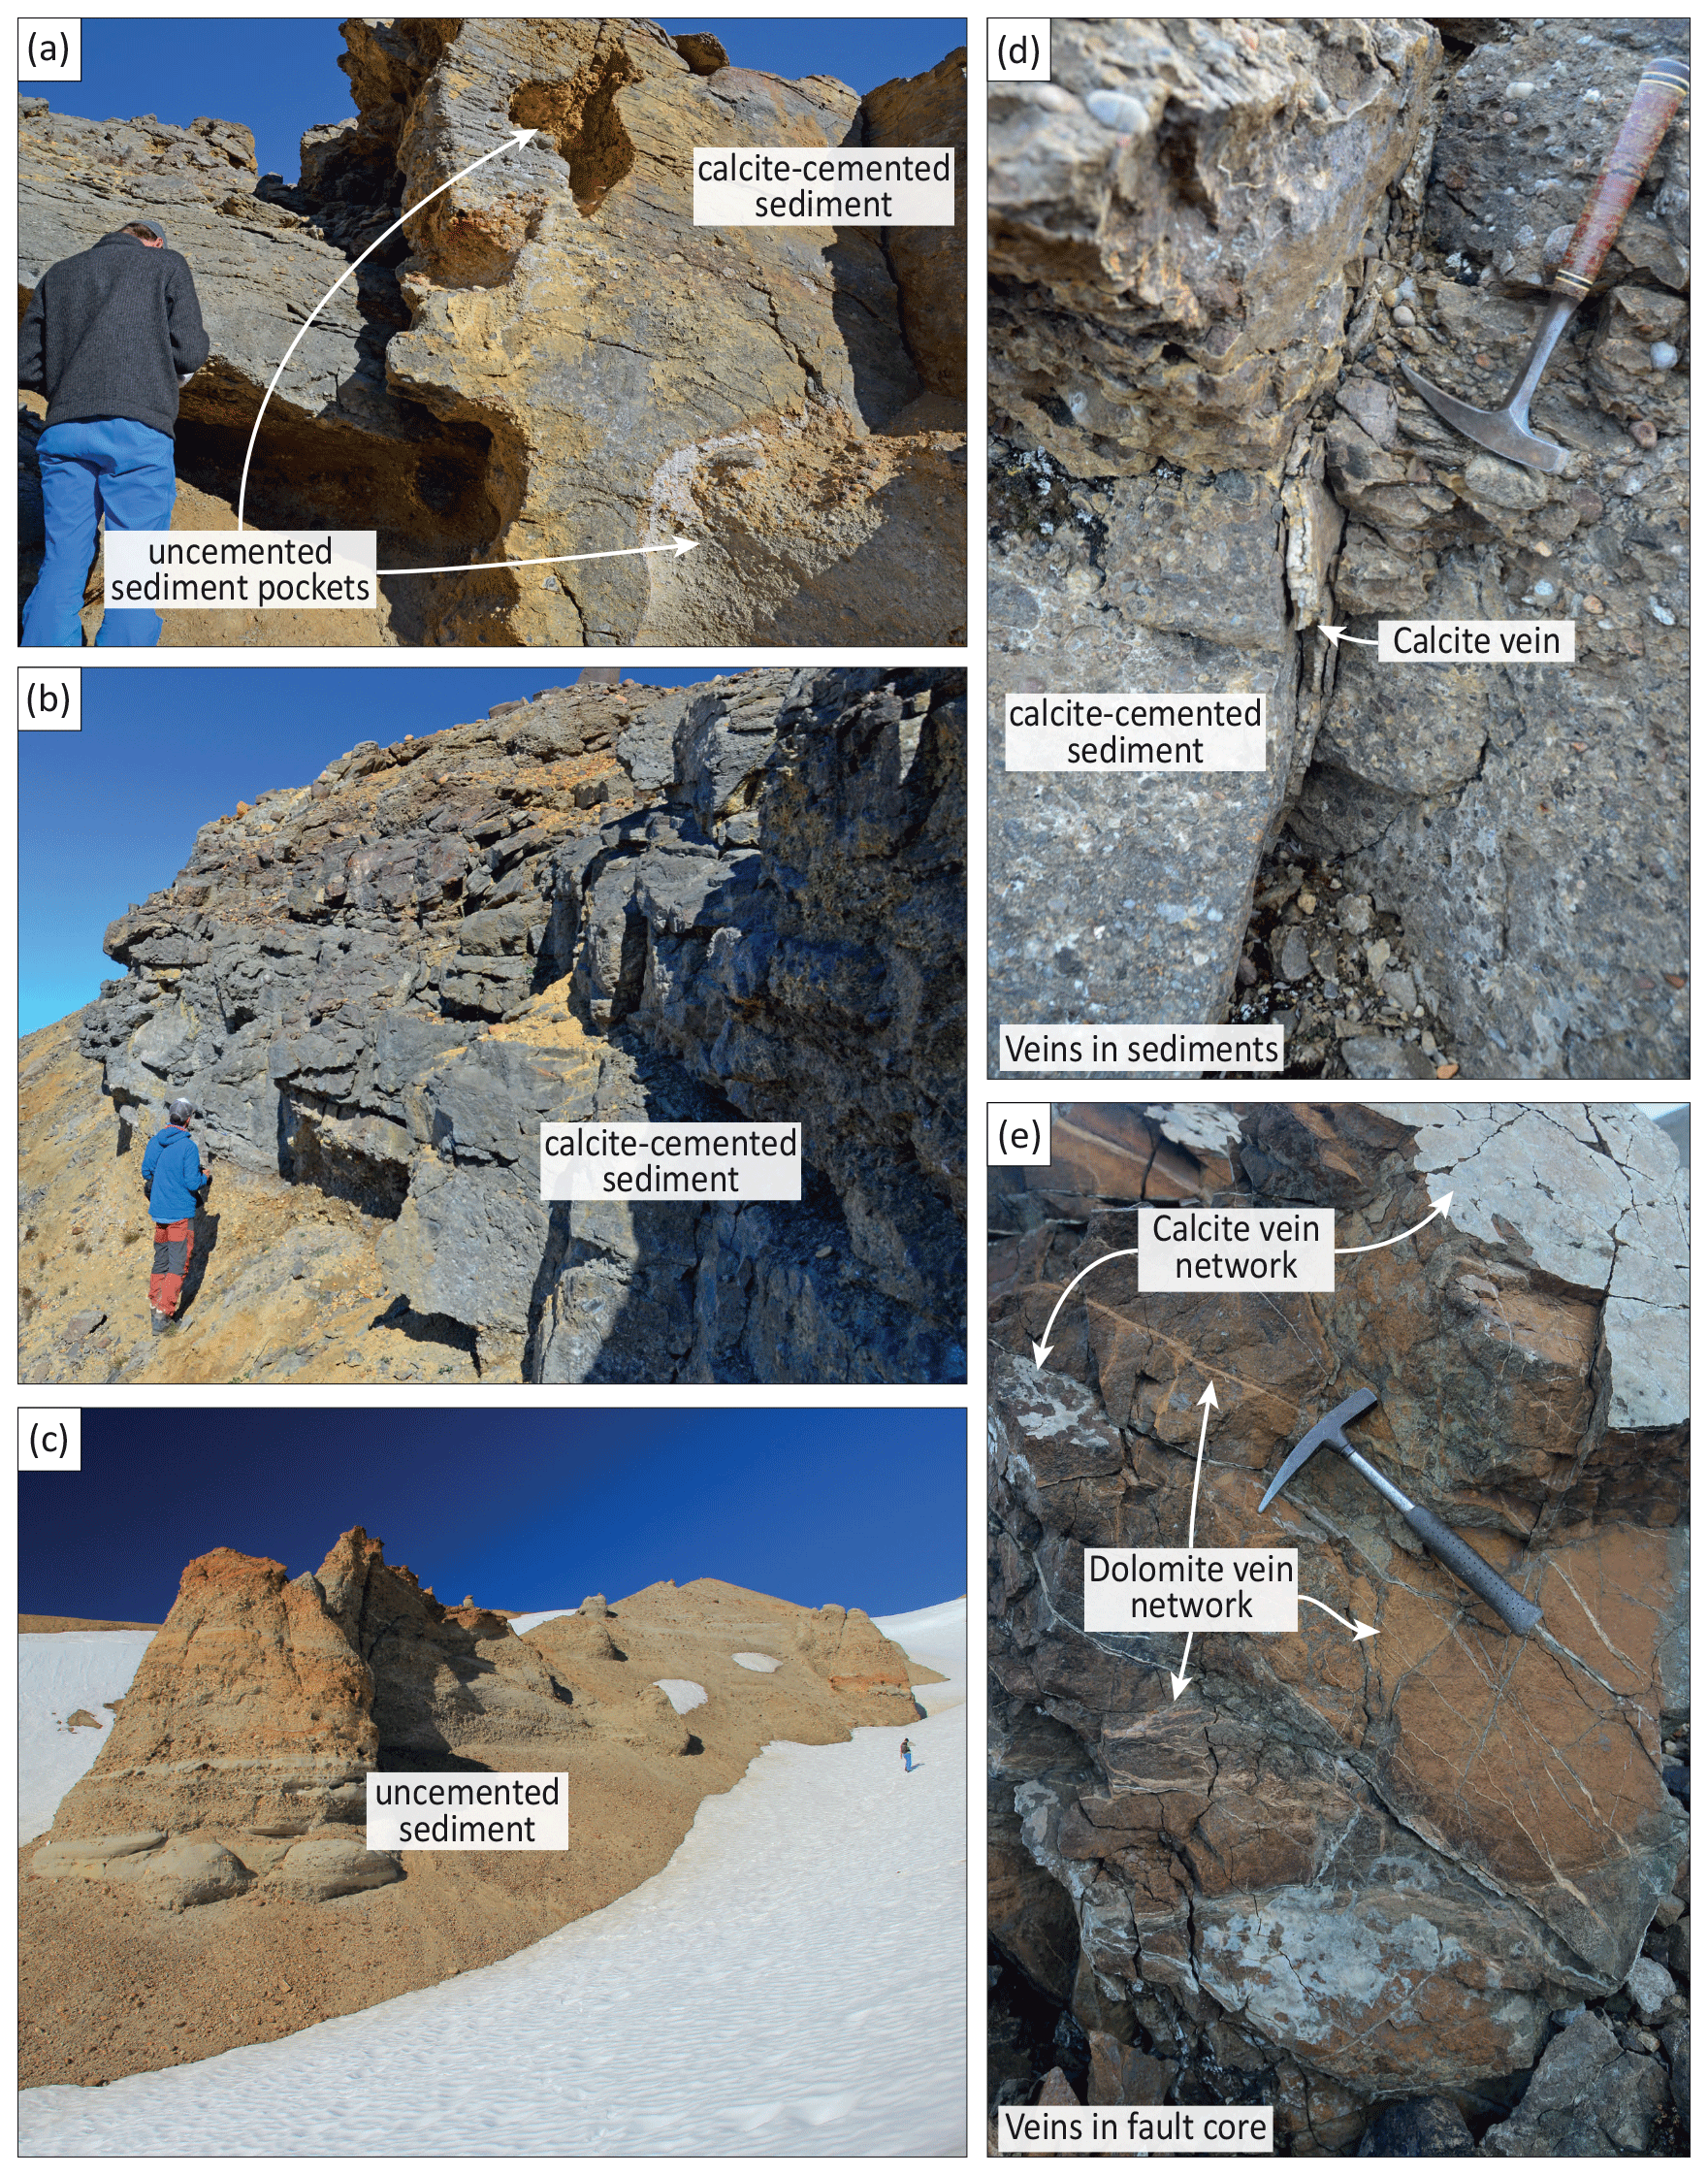
Figure 3(a) Calcite-cemented sandstone with uncemented pockets at the distal end of the cementation zone; (b) calcite-cemented conglomerate at distal end of the cementation zone; (c) uncemented sandstone/conglomerate outside the cementation zone; (d) calcite vein cutting through calcite-cemented sandstone within the cementation zone; (e) dolomite vein network (yellowish) cut by younger calcite vein network (whitish) within Dombjerg Fault core. For the locations of photos, see Fig. 2.
Calcite cement occurs as micrometer-sized spar, anhedral equant spar with crystal sizes up to 200 µm, and subhedral poikilotopic calcite with crystal sizes up to 800 µm (Fig. 4c–f). Micro-spar is present in 12 of 21 samples, all of which also comprise a varying amount of equant calcite spar. The latter is dominant in four samples. Poikilotopic texture occurs in only two samples from within the cementation zone (samples G-9, TKB2) and in three samples from cemented lenses outside the cementation zone (sample H-5). Notably, sample TBK2 hosting poikilotopic calcite derives from the same bed as sample TBK1 hosting dominantly micro-spar (samples taken ∼ 1 m apart from each other; Fig. 4c, d).
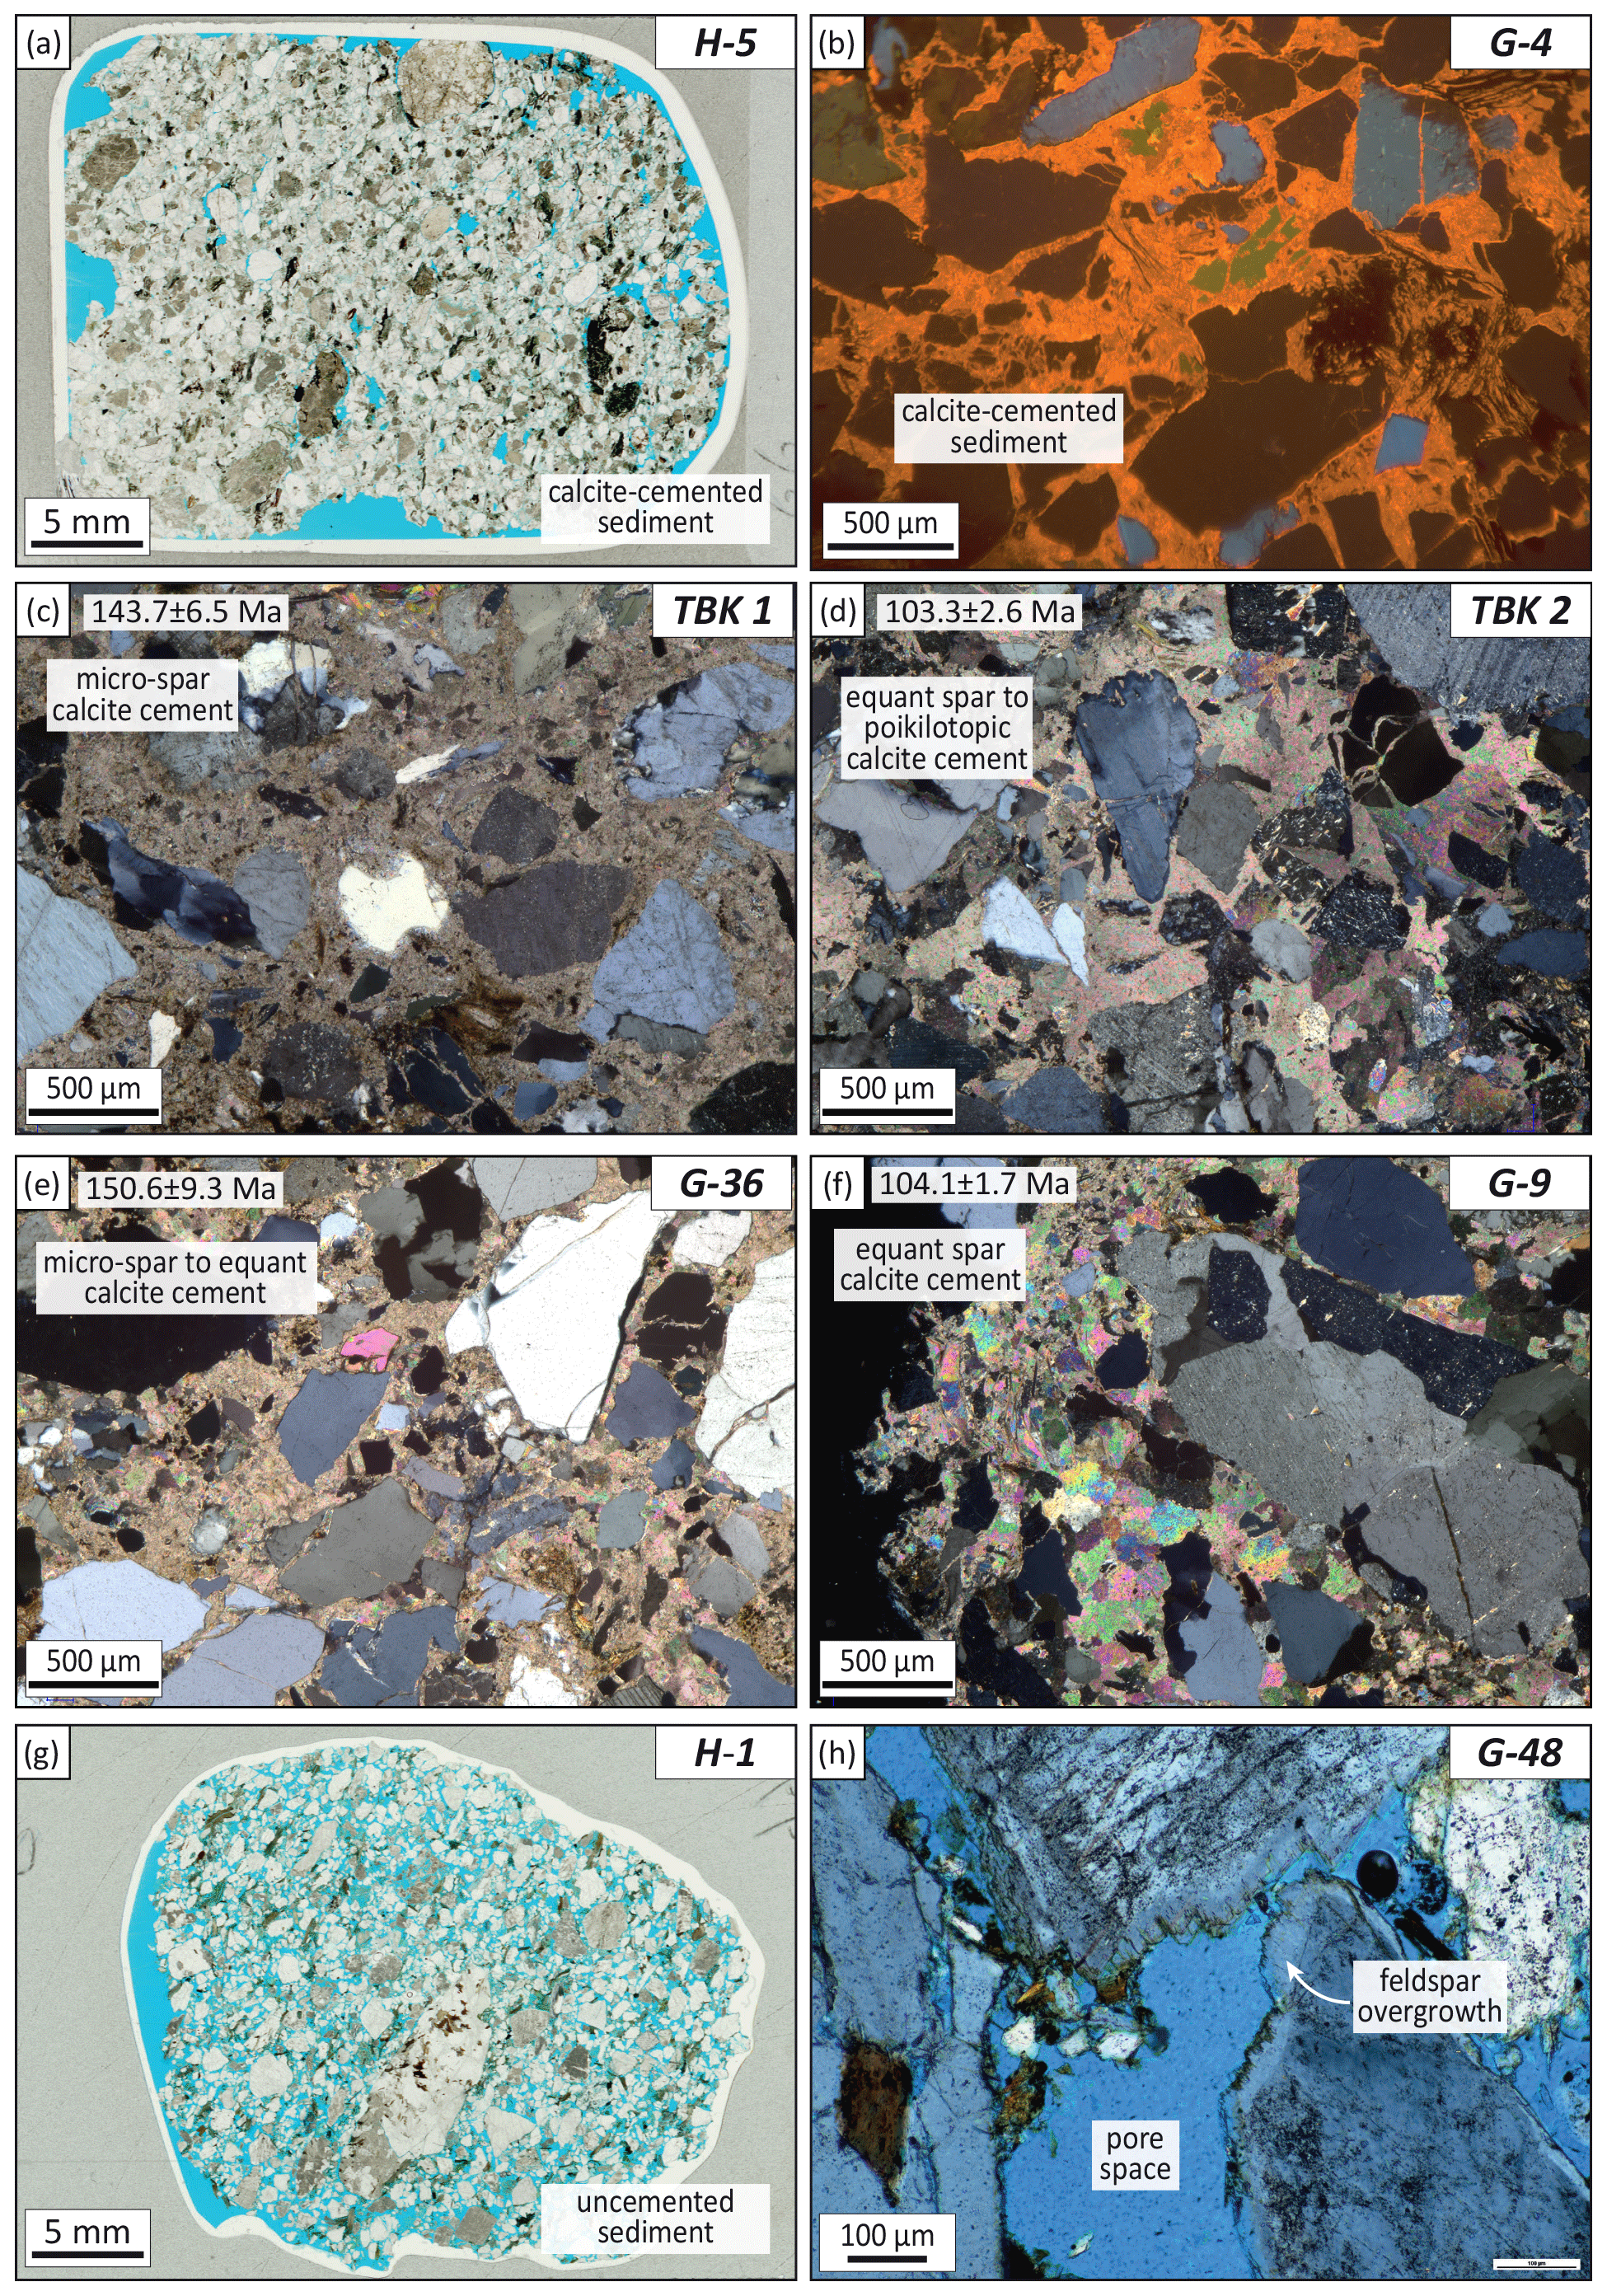
Figure 4Thin section photos of hanging wall sediments (sample ID in the respective upper right corner). (a) Calcite-cemented sample H-5 (plane-polarized light (PPL); oversized pores are caused by plucked grains during sample preparation); (b) cathodoluminescence image of calcite-cemented sample; (c–f) close-up of pore-filling calcite cements with textures ranging from micro-spar to poikilotopic cement (cross-polarized light); (g) calcite-free sediment sample H-1 (PPL); (h) close-up of calcite-free sample with common feldspar overgrowth (XPL with 1∕4λ plate).
Other notable diagenetic features are the following:
-
Feldspar grain dissolution appears in varying degrees and is generally more dominant in the cemented samples, where it is partially replaced by calcite cement. Feldspar overgrowth predates calcite cementation and occurs in both cemented and uncemented samples (Fig. 4b, h).
-
Quartz overgrowth is absent in all samples.
-
Pyrite is common along biotite grains, which itself is a major constituent of the sandstone (Fig. 5). Calcite cement pervasively fills space between separated biotite lamellae.
-
Calcitic bioclasts, which are occasionally present in the samples, are partially fragmented and show no signs of dissolution or recrystallization.
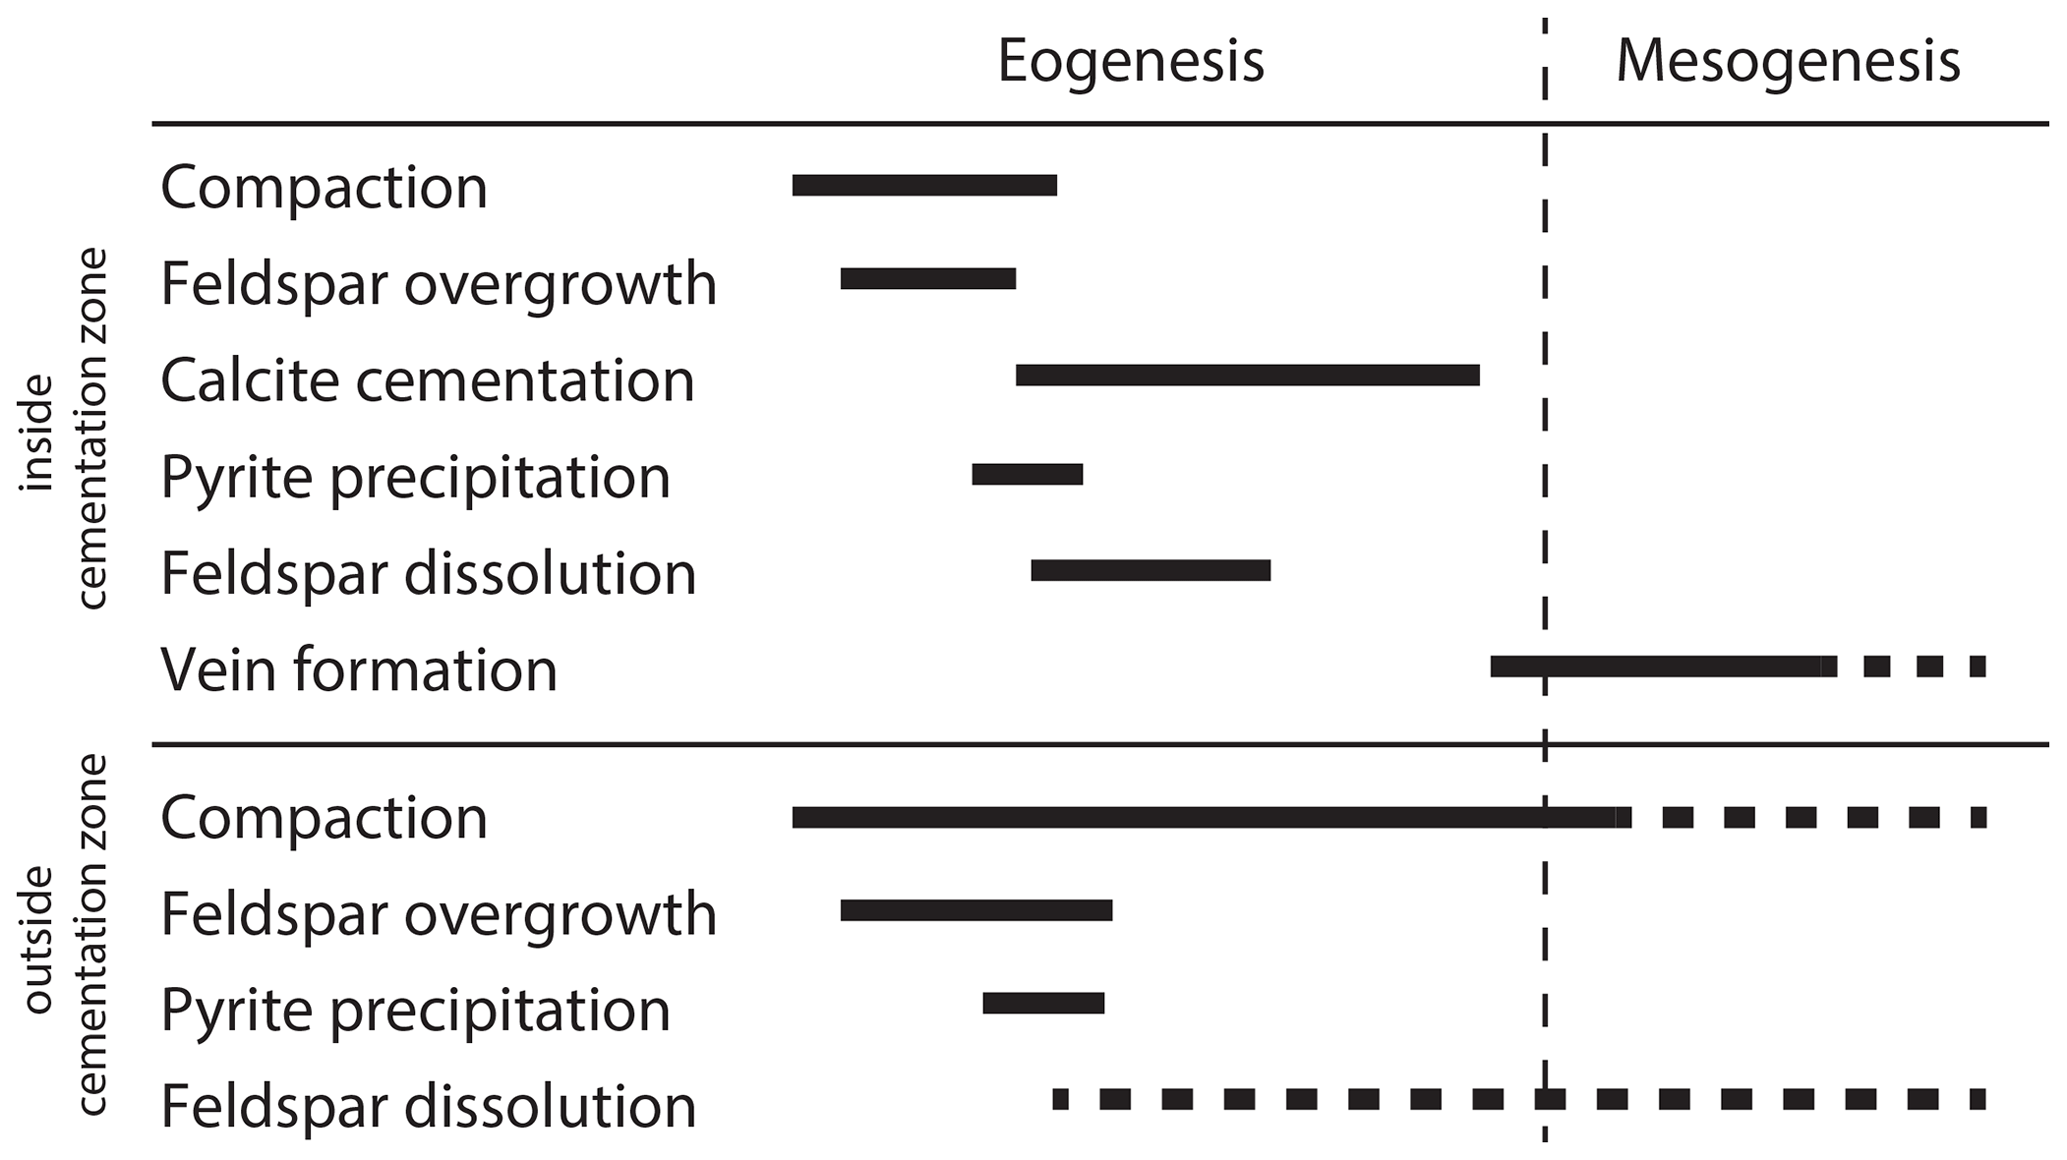
A summary of relative timing of the main diagenetic features is given in Fig. 6.
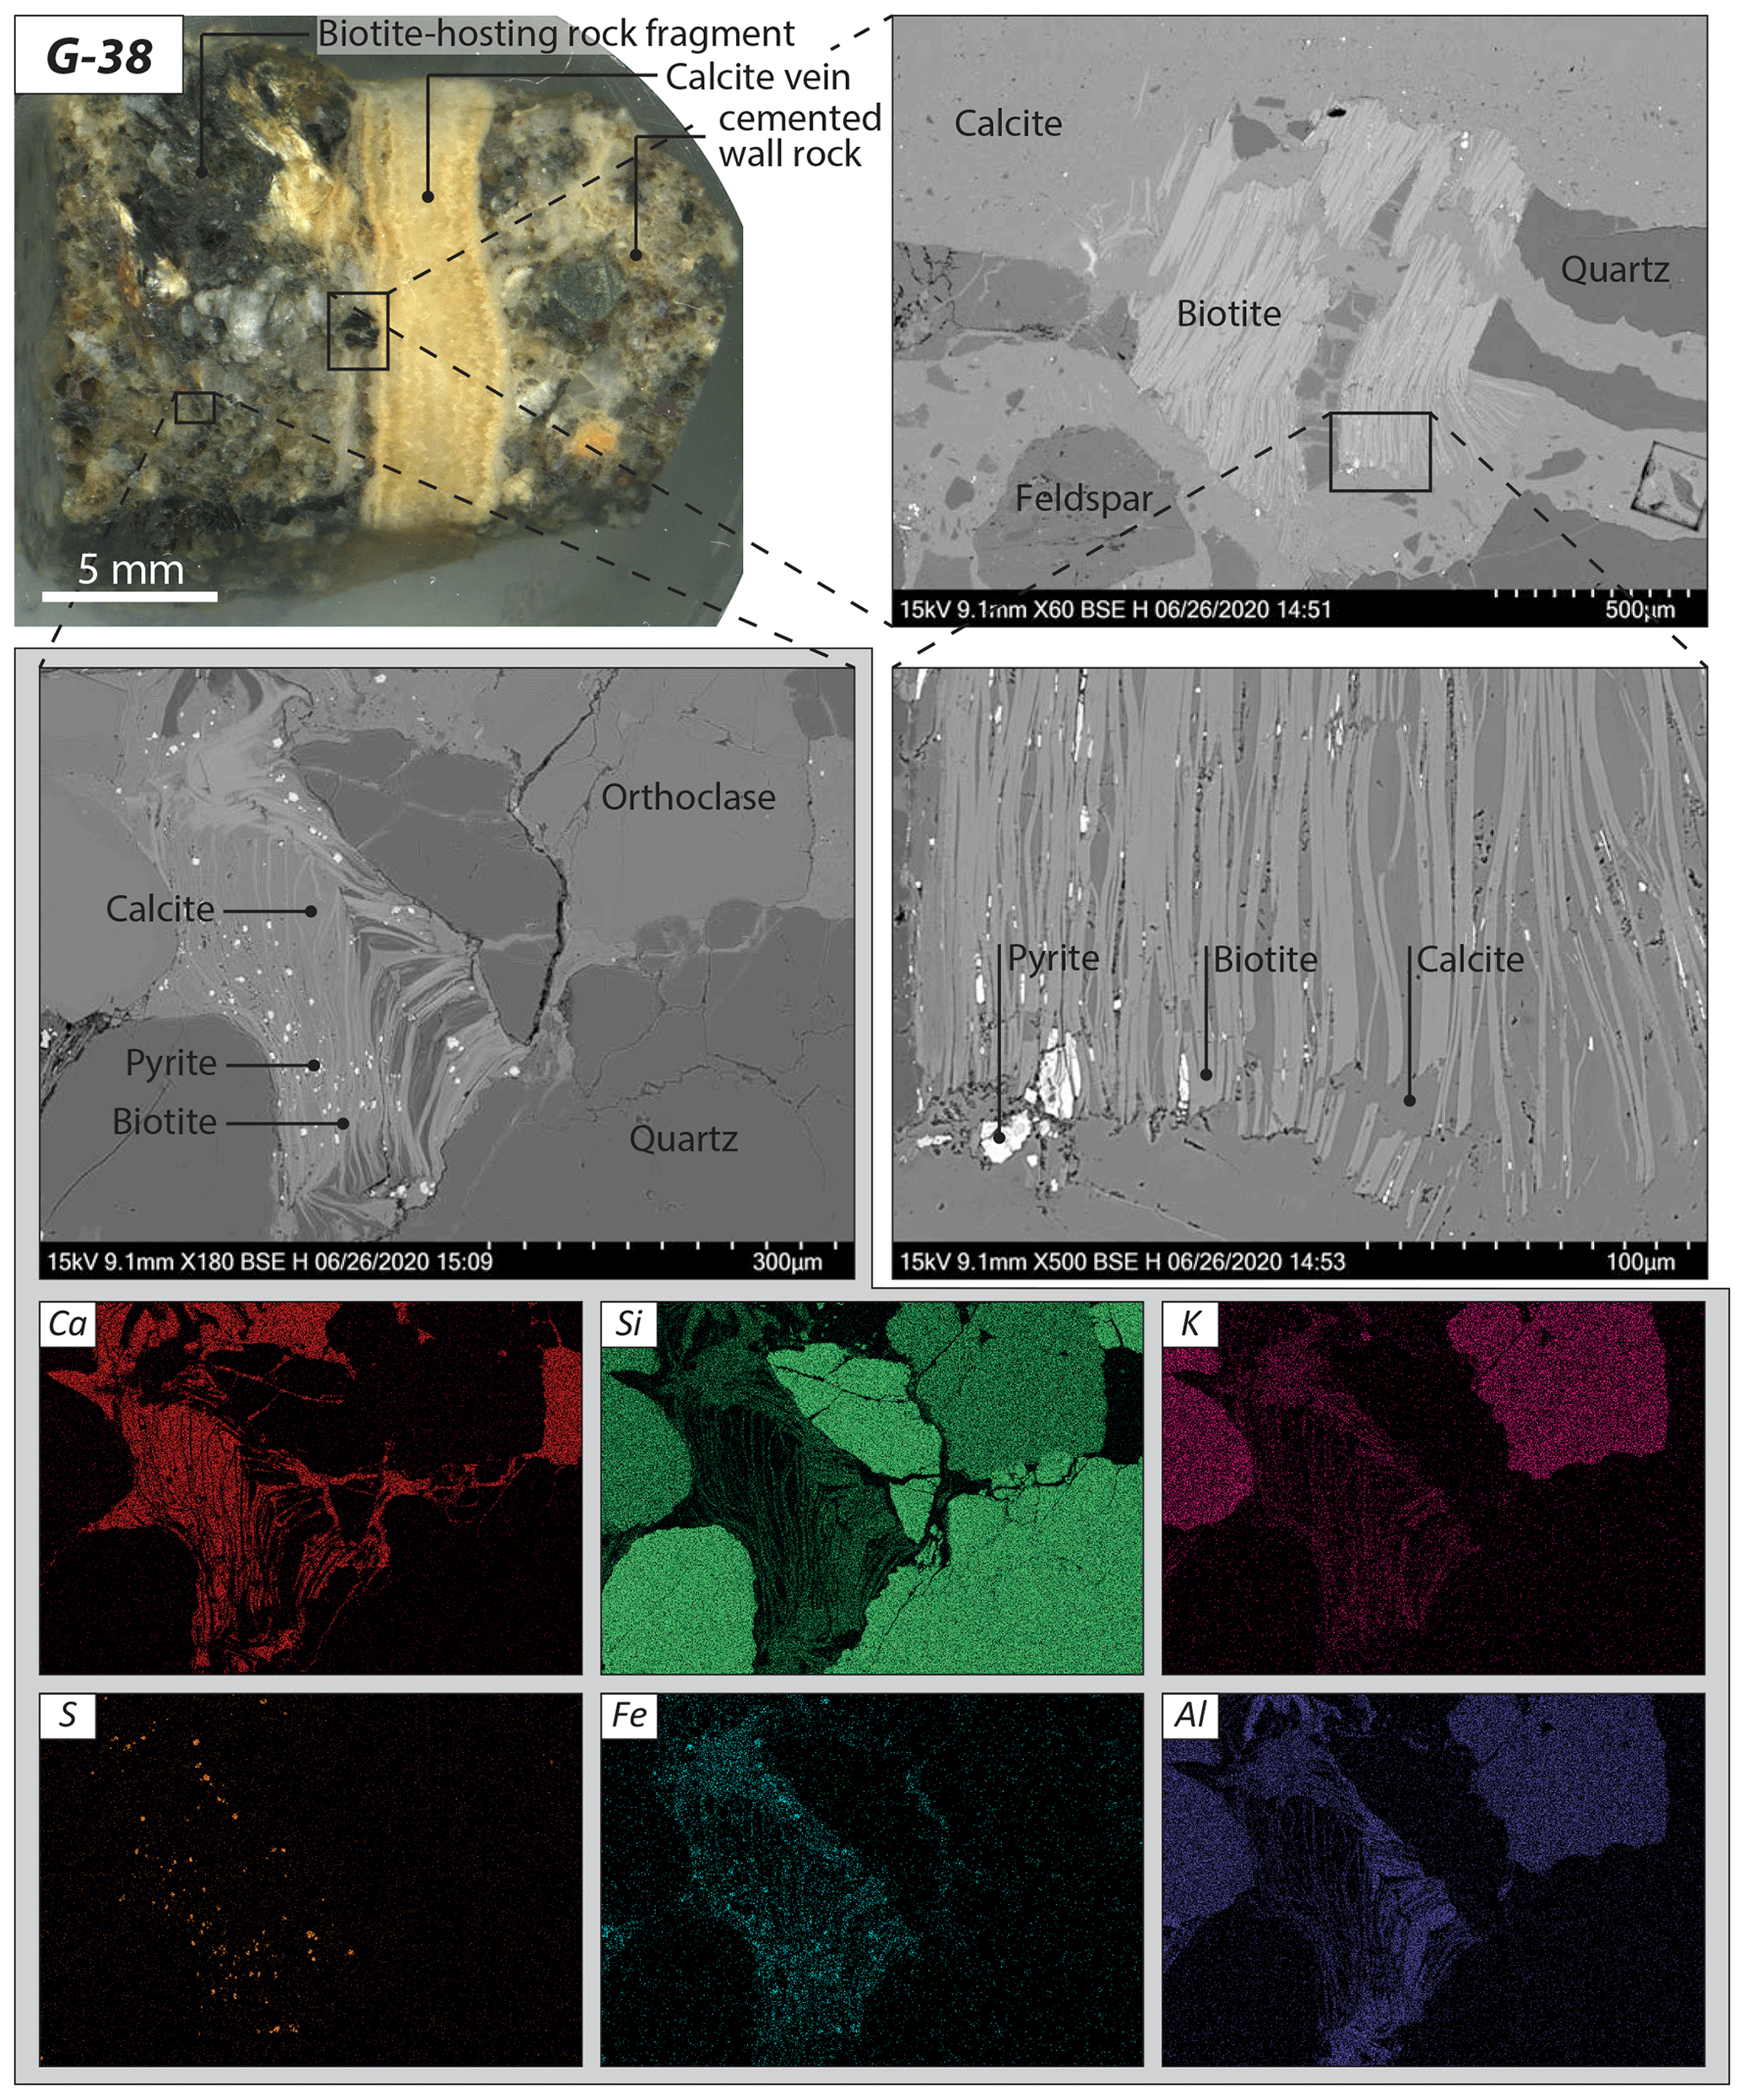
Figure 5Optical, backscattered-electron, and energy-dispersive X-ray imagery of sample G-38, which hosts abundant biotite in the wall rock. Pyrite is present in the vicinity of biotite grains and in between biotite lamellae, which are also pervasively surrounded by calcite.
4.2 Vein structure and composition
In all outcrops within the cementation zone, calcite veins were found (Fig. 3d), which have an overall NNE to NE trend (67 veins measured in total; Fig. 2). Outcrop surfaces were exposed in 3-D, and we hence conclude that this dominant vein trend is true and not biased by outcrop orientation. Veins exclusively occur in cemented parts of the sandstone and are approximately equally distributed in outcrops with spacing varying in the decimeter to meter scale and do not form clusters. Single vein thicknesses span from <1 to 70 mm and veins appear as mode I fractures; i.e., possible shear displacement is only observed in three of 14 samples. In all cases, the veins have a sharp contact with the wall rock, i.e., wall rock grains are cut by the fracture (Fig. 7). All analyzed veins exhibit at least one generation of elongate to blocky syntaxial crystal growth. Two-thirds of the analyzed veins comprise two or more vein growth generations, indicated by either crack-seal texture (i.e., precipitation after reopening of fracture) or growth zonation, as visible in thin section view (Fig. 7a, b). Calcite twin density is generally low and slip zones within veins are found in three samples.
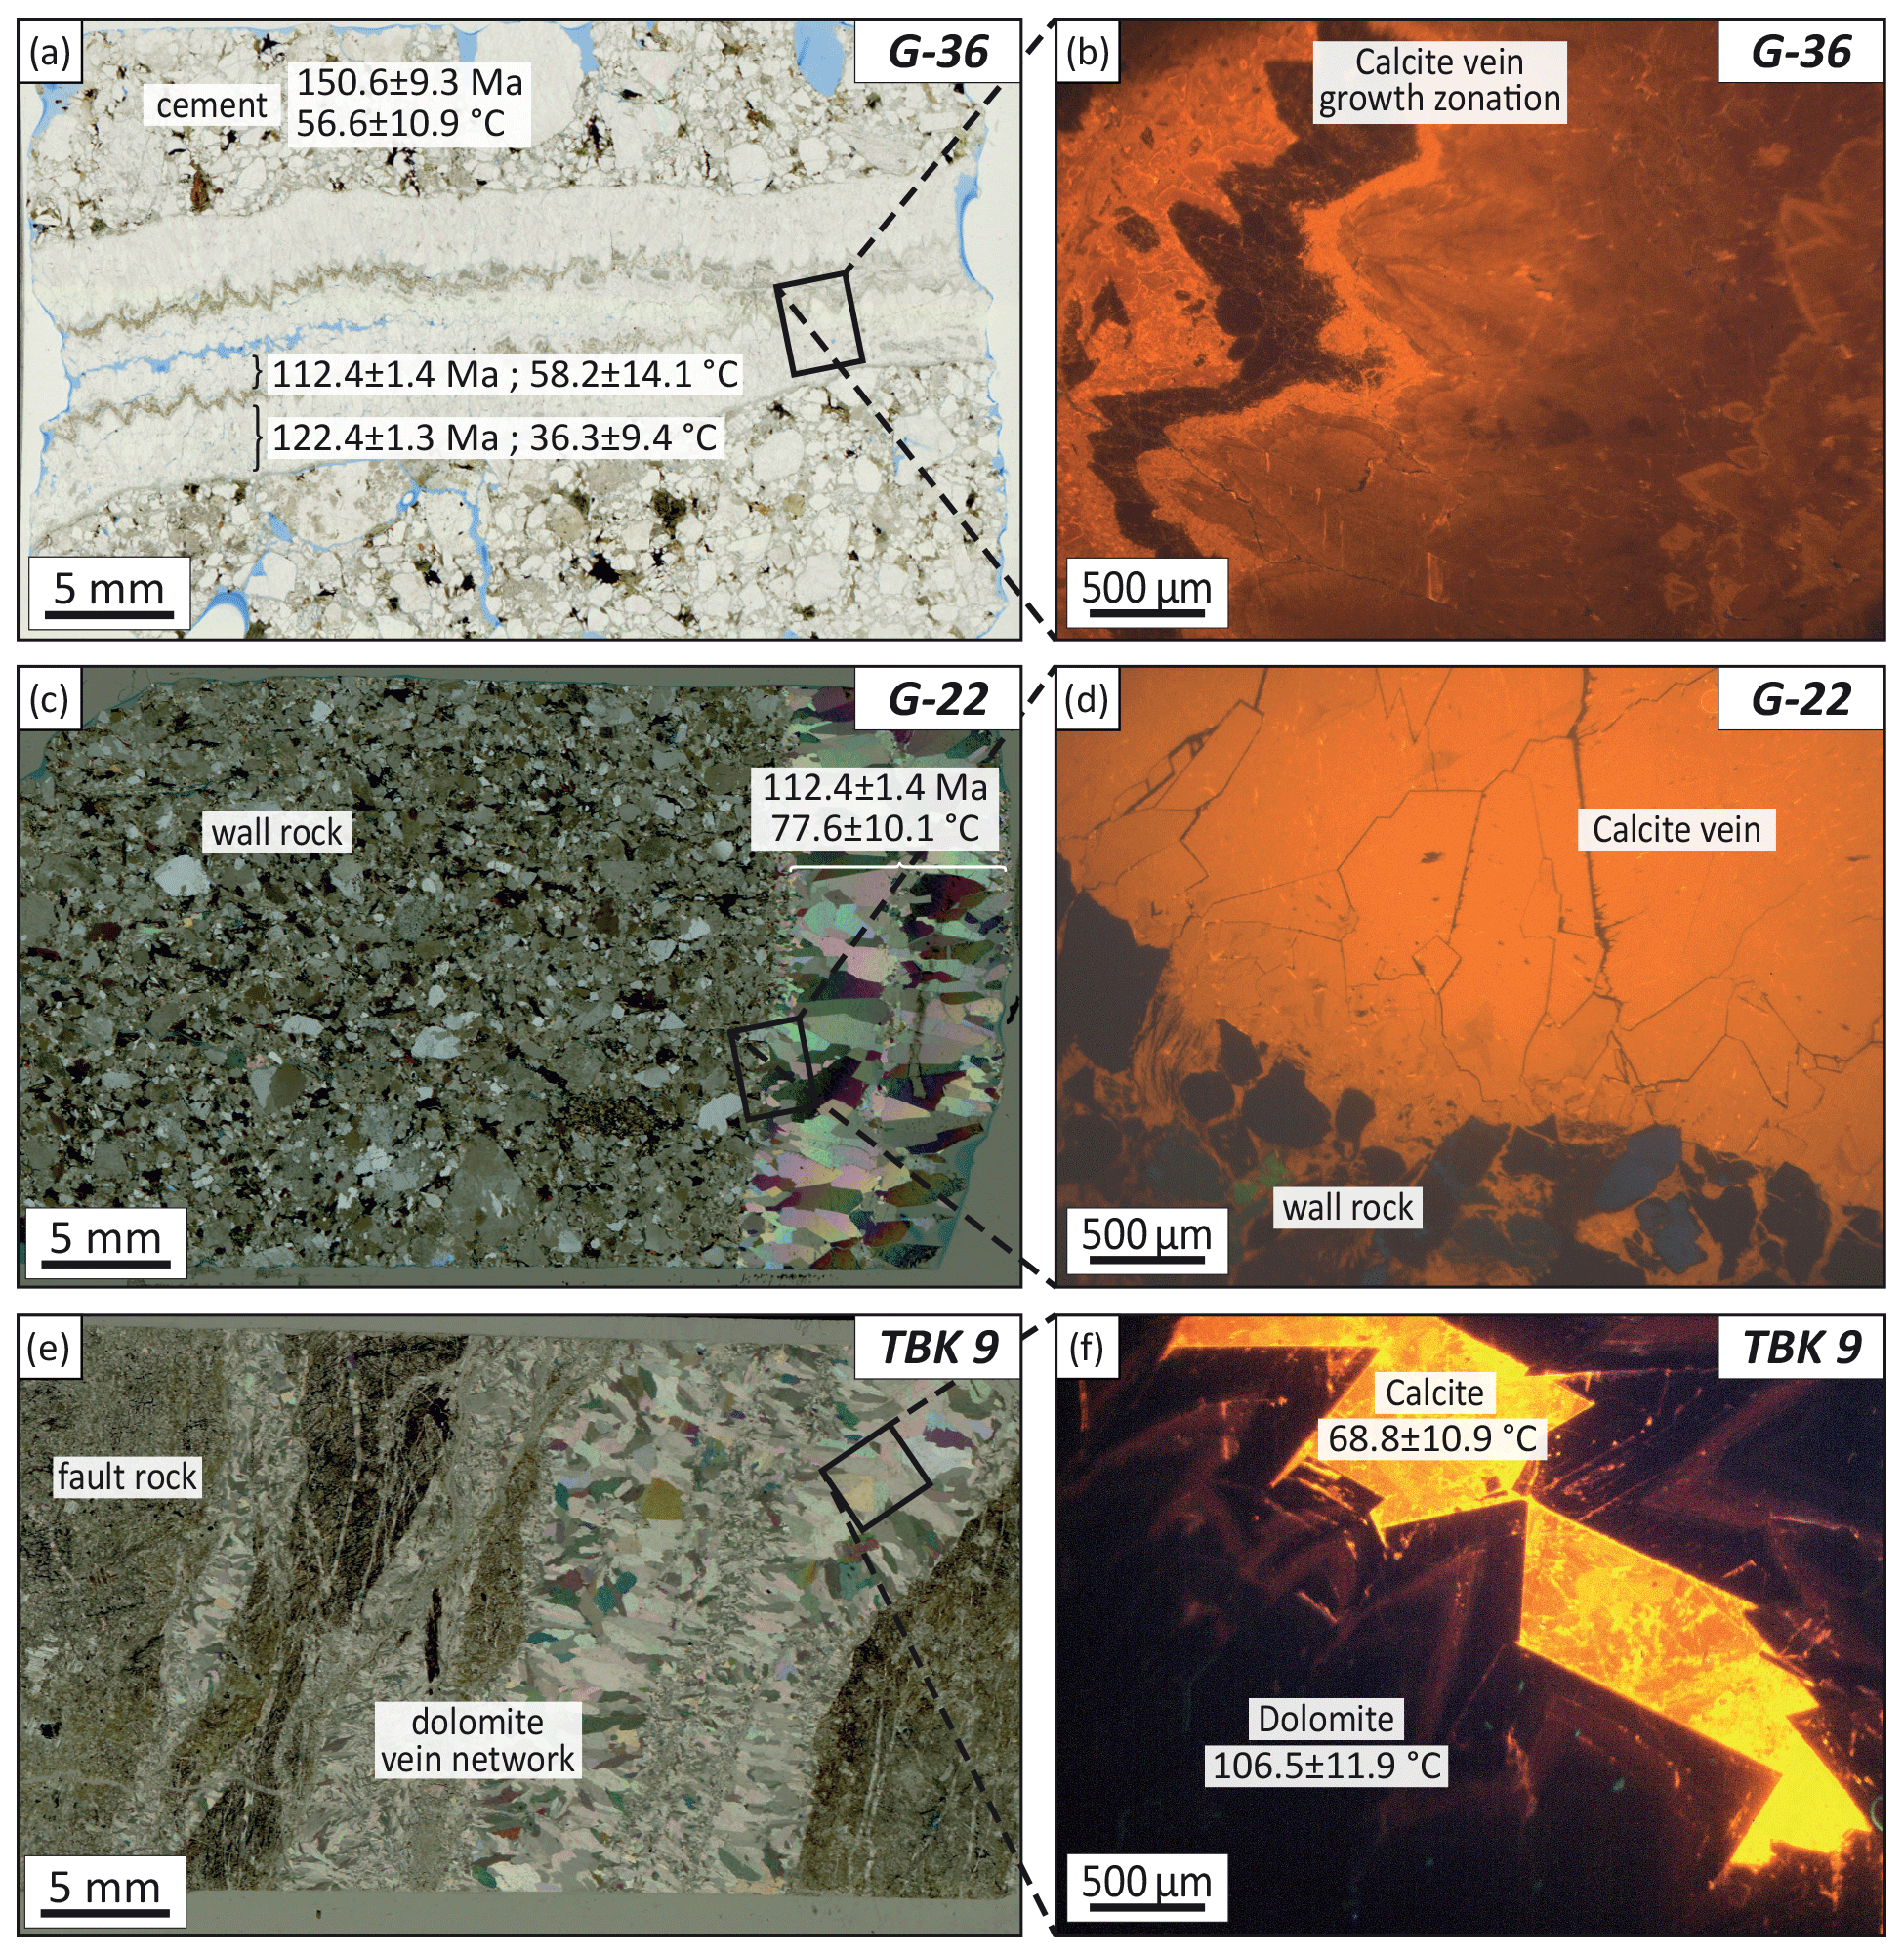
Figure 7Thin section photos of hanging wall veins (a–d) and fault core veins (e, f). The sample ID is given in the upper right corner of the respective image. Formation ages and temperatures given in figures where available (cf. Tables 1, 2). (a) Vein showing growth zonation; note ∼ 10 Myr age difference between outer and inner growth generation (plane-polarized light); (b) cathodoluminescence (CL) close-up image of growth zonation; (c) vein devoid of growth zoning (cross-polarized light; XPL); (d) CL close-up image of calcite vein and calcite-cemented wall rock; (e) dolomite vein network cutting through cataclasite of Dombjerg Fault core (XPL); (f) CL close-up image of dolomite crystals; remaining cavities have been filled with younger calcite.
Near the fault core within brecciated basement rock, two vein generations were identified: a syntaxial dolomite vein network that is cross-cut by a syntaxial calcite vein network (Fig. 3e). The dolomite network composes of continuous, anastomosing veins of thicknesses up to 30 mm wide (Figs. 3e, 7e). The calcite vein network consists of planar veins with thicknesses of ∼ 1–5 mm (Fig. 3e) and also envelopes dolomite in the center of dolomite-filled fractures (Fig. 7f). The dolomite veins are not displaced/offset by the calcite veins and the latter are not displaced by any other fracture set. In the transfer zone, connecting the Dombjerg and Thomsen Land faults (Fig. 2), only one calcite vein was found in a shear fracture that reactivated an older epidote vein situated in basement rock.
4.3 Ages of calcite cements and veins
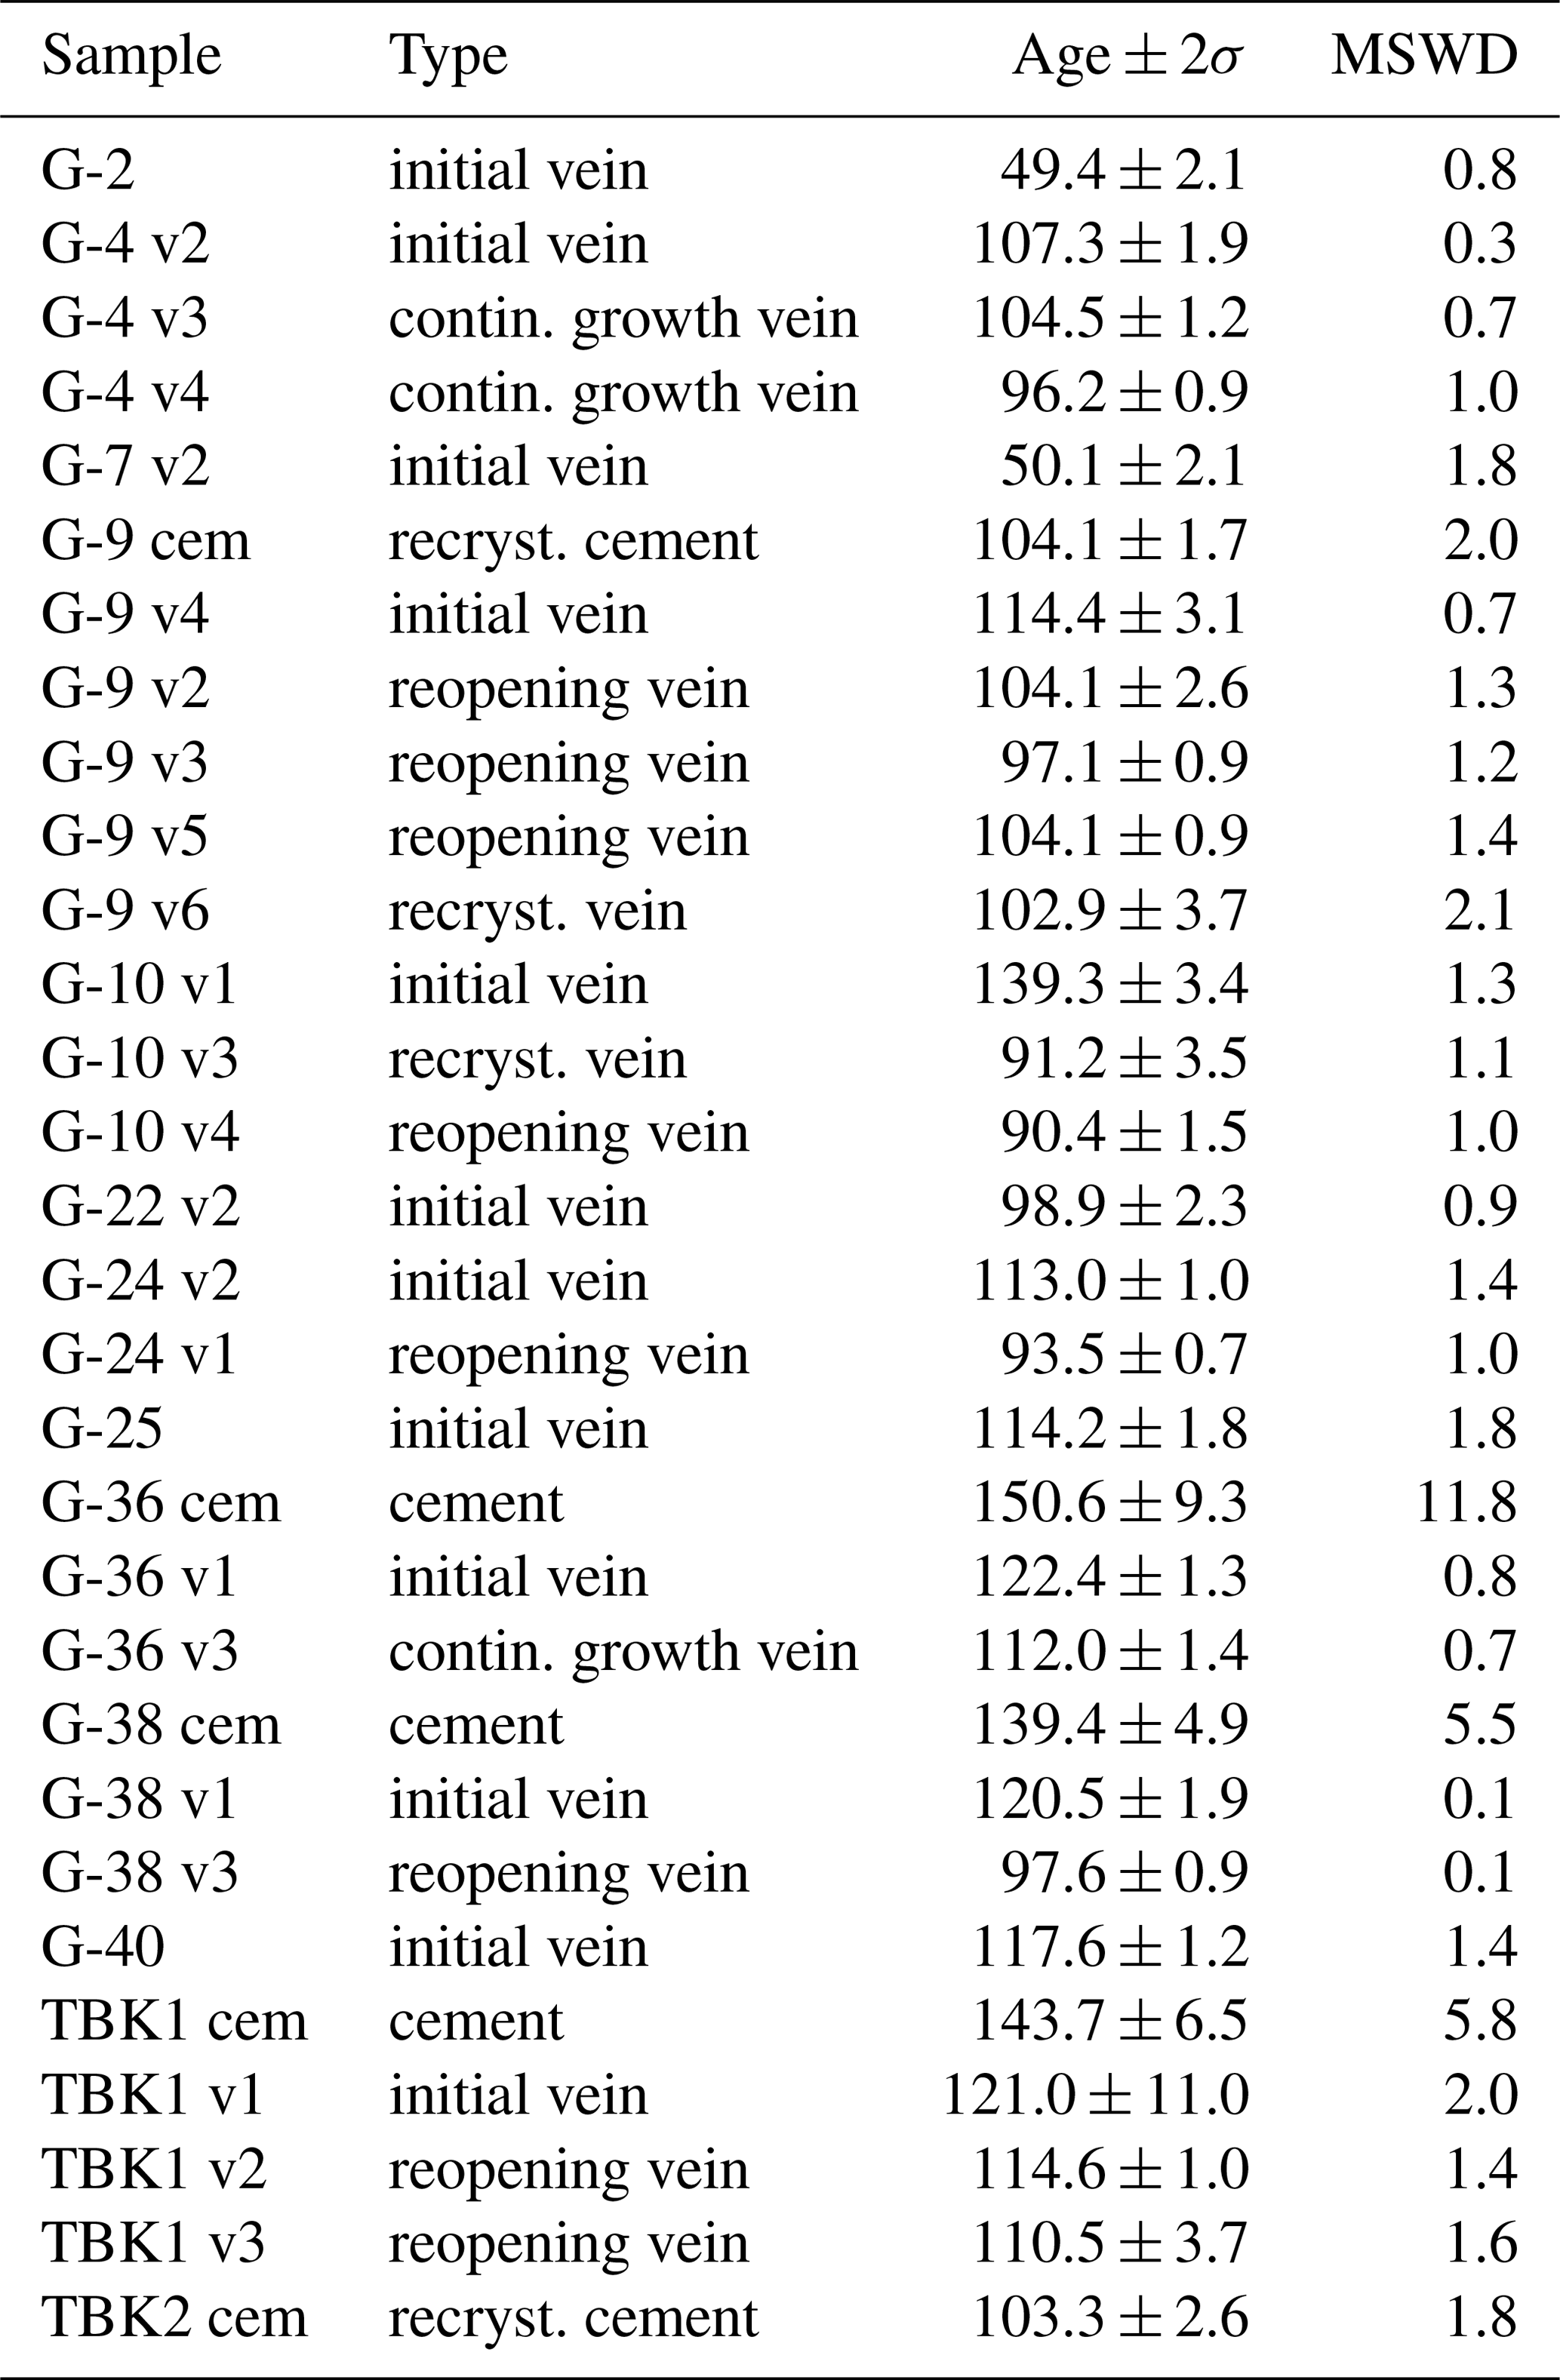
We determined formation ages of five cement samples and 12 vein samples within the sediments of the Lindemans Bugt Formation (Table 1, Fig. 8). As some veins comprise more than one growth generation, as evident by zoning or fracture re-opening (see Sect. 4.2), we obtained a total of 25 growth ages of the 12 vein samples. Age determination of veins within the basement and fault core were not successful due to unsuitable U and Pb signals.
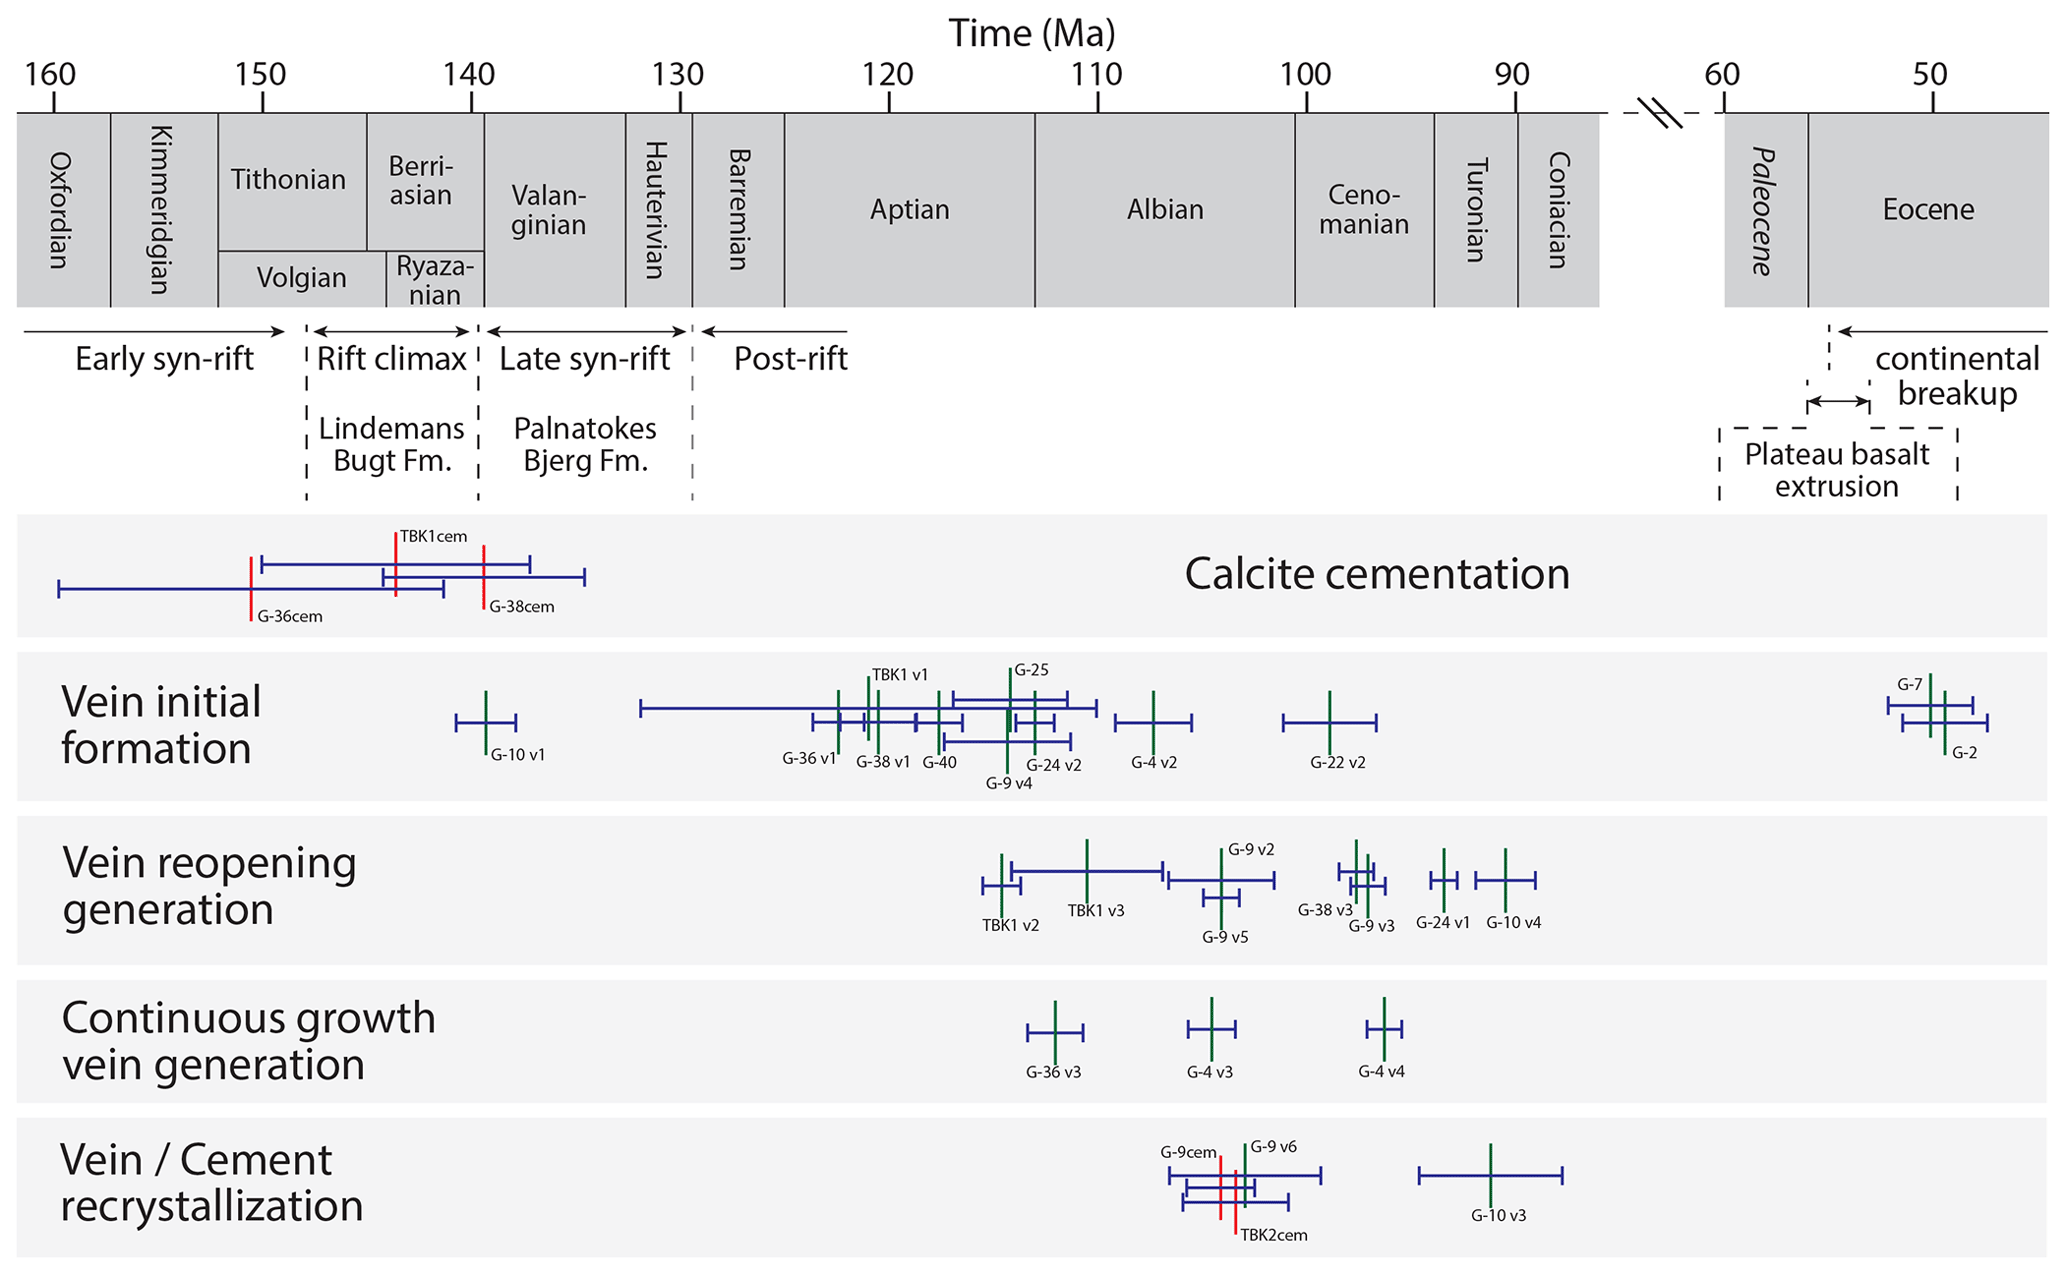
Figure 8Timeline with formation ages of cements (red vertical bar) and veins (green vertical bar), separated into calcite cementation (cement growing in pore space), vein initial formation (first generation of calcite vein growth), vein reopening generation (calcite precipitation after renewed fracture opening of initial vein), continuous growth vein generation (veins showing continuous growth zonation after initial vein formation), and vein/cement recrystallization (ages reset due to calcite recrystallization). All samples derive from the Lindemans Bugt Formation. Cf. Table 3. Horizontal blue bars represent 2σ uncertainty. Numerical ages of regional stages (Volgian and Ryazanian) are after Gradstein et al. (2012).
Three cement ages fall within the previously reported depositional age of the Lindemans Bugt Formation (mid-Volgian–late Ryazanian; Surlyk, 2003) or close to its depositional age boundary with the Palnatokes Bjerg Formation (late Ryazanian–Hauterivian) with 150.6 ± 9.3 Ma (G-36cem), 143.7 ± 6.5 Ma (TBK1cem), and 139.4 ± 4.9 Ma (G-38cem), while two other cement ages are significantly younger with 103.3 ± 2.6 Ma (TBK2cem) and 104.1 ± 1.7 Ma (G-9cem). Of the vein samples, only one falls within the inferred rift stage with 139.3 ± 3.4 Ma (G-10 v1), while the majority of vein ages (both initial formation ages and vein reopening ages) fall within a range of ∼ 125–90 Ma (Fig. 8). Two vein ages are significantly younger with 50.1 ± 2.1 Ma (G-7) and 49.4 ± 2.1 Ma (G-2), closely postdating early Eocene plateau basalt extrusion and the onset of continental breakup (Fig. 8).
4.4 Clumped isotope temperatures of calcite cements and veins
Clumped isotope temperatures of five pore-filling calcite cement samples were obtained. Temperatures from TBK1cem and TBK2cem, which derive from the same outcrop, are 42.0 ± 10.2 and 59.0 ± 9.1 ∘C, respectively. G-25cem, sampled at a similar distance to the main fault core, has a clumped isotope temperature of 42.4 ± 8.8 ∘C, G-36cem at the distal margin of the cementation zone has 56.6 ± 10.9 ∘C, and H-5cem, located well into the basin, has 44.5 ± 9.0 ∘C (Table 2, Fig. 2).
Clumped isotope temperatures of hanging wall veins fall into the range of 36.3 ± 9.4 ∘C (G-36 v1) and 77.6 ± 10.1 ∘C (G-22). In the two samples of which two vein generations were analyzed, a temperature increase exists from old to young vein phase (i.e., G-36 from 36.3 ± 9.4 to 58.2 ± 14.1 ∘C and G-10 from 40.3 ± 7.1 to 61.5 ± 10.5 ∘C; Table 2, Fig. 7a). However, taking all samples, including cement samples, into consideration, no clear relationship between calcite generation and temperature is visible (Fig. 9a), which is also true for the relationship of temperature and distance to the fault core (Fig. 9b). The clumped isotope temperature of the basement vein sample G-34, located in the transfer zone, yields 128.7 ± 19.1 ∘C. Near the fault core in the brecciated basement, the clumped isotope temperature of the calcite vein (TBK9cal) that cross-cuts the dolomite vein network falls with 68.8 ± 10.9 ∘C into the range of hanging wall vein temperatures. The older dolomite vein sample TBK9dol diverges from this pattern with a higher temperature of 106.5 ± 11.9 ∘C (Fig. 7f; Table 2).
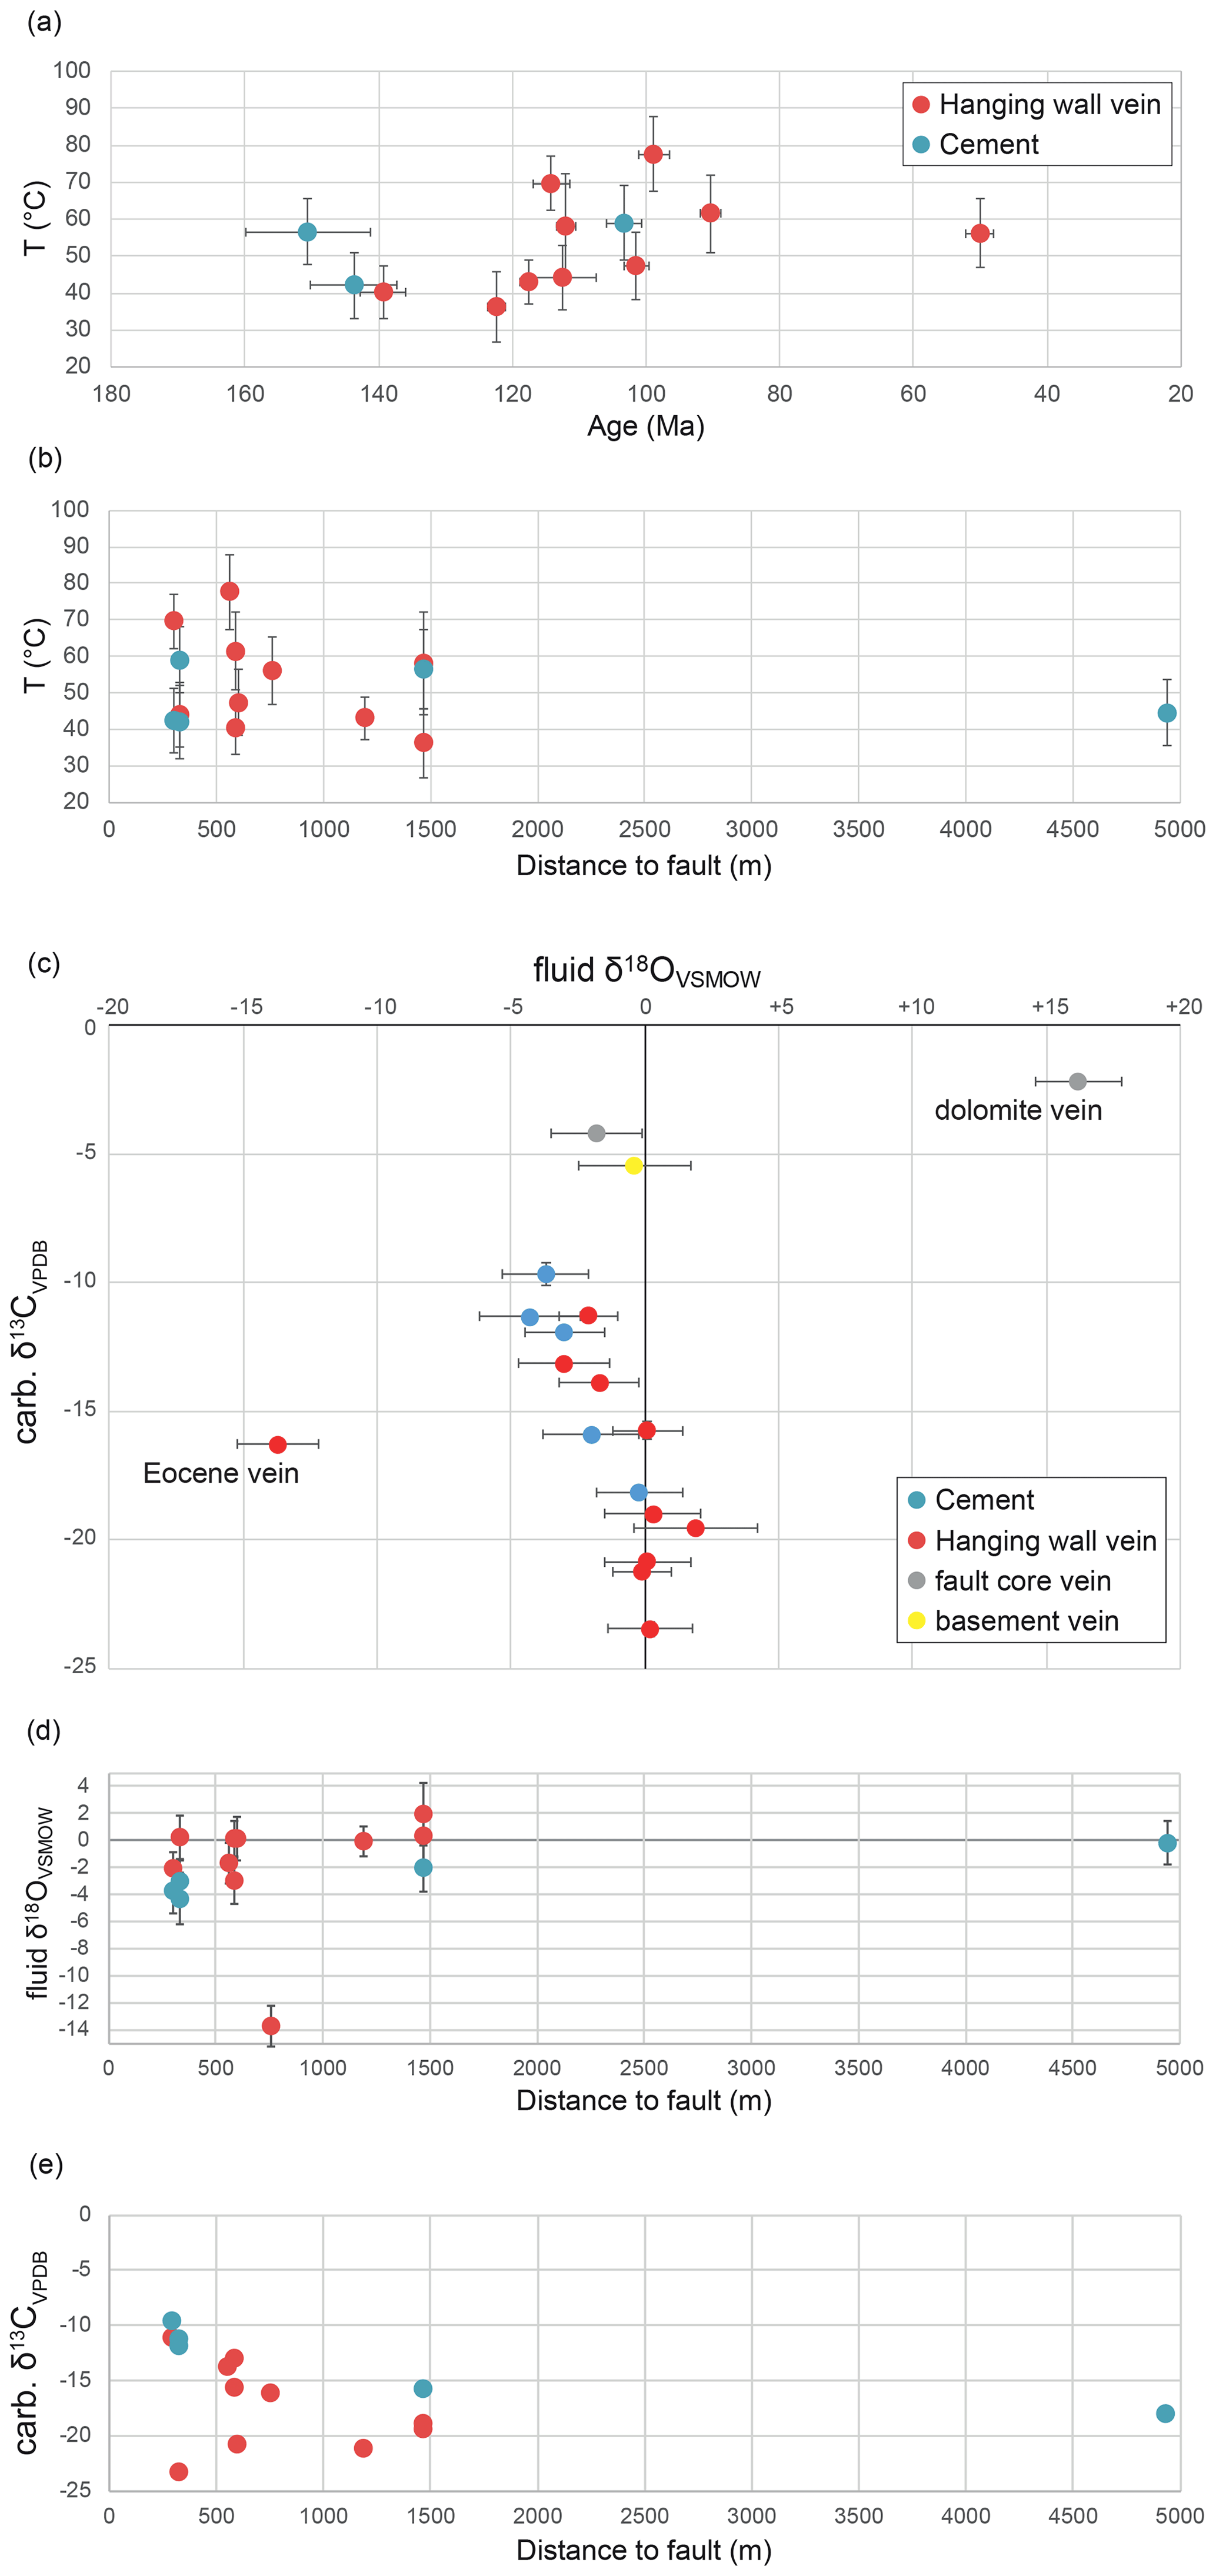
Figure 9(a) Calcite formation temperatures obtained from clumped isotope analysis against formation ages obtained from U–Pb dating; (b) calcite formation temperatures against distance to Dombjerg Fault; (c) fluid δ18OVSMOW against carbonate δ13CVPDB; (d) fluid δ18OVSMOW against distance to fault; (e) carbonate δ13CVPDB against distance to fault (error bars represent the 95 % confidence interval).
Table 1U–Pb calcite formation ages of calcite cements and veins of the Lindemans Bugt Formation. MSWD is the mean squared weighted deviation.
4.5 Oxygen and carbon stable isotope values
Carbonate δ18OVPDB values range from −11.3 ± 0.09 ‰ to −6.1 ± 0.05 ‰ for cements and from −12.8 ± 0.05 ‰ to −4.1 ± 0.09 ‰ for most hanging wall veins, with the exception of vein sample G-7 with −21.4 ± 0.12 ‰ (Table 2). The basement vein sample G-34 comprises −18.0 ± 0.04 ‰ and the two fault core vein samples have values of −15.3 ± 0.33 ‰ (TBK9dol) and −11.7 ± 0.05 ‰ (TBK9cal).
The calculated fluid δ18OVSMOW values range from −4.3 ± 1.9 ‰ to −0.2 ± 1.6 ‰ for cements and −3.0 ± 1.7 ‰ to +1.9 ± 2.3 ‰ for hanging wall veins, while sample G-7 deviates significantly from this suite with −13.7 ± 1.5 ‰ (Fig. 9c; Table 2). The basement sample G-34 as well as the vein calcite sample TBK9cal also fall into this range with −0.4 ± 2.1 ‰ and −1.8 ± 1.7 ‰, respectively. The older vein dolomite sample TBK9dol from the fault core appears to have precipitated from an enriched fluid of +16.2 ± 1.6 ‰.
Table 2Results from clumped isotope analysis with formation ages from U–Pb dating (cf. Table 1). Uncertainties are given at the 95 % confidence interval or as uncertainty propagation (for fluid δ18OVSMOW), n is number of replicates measured of each sample.
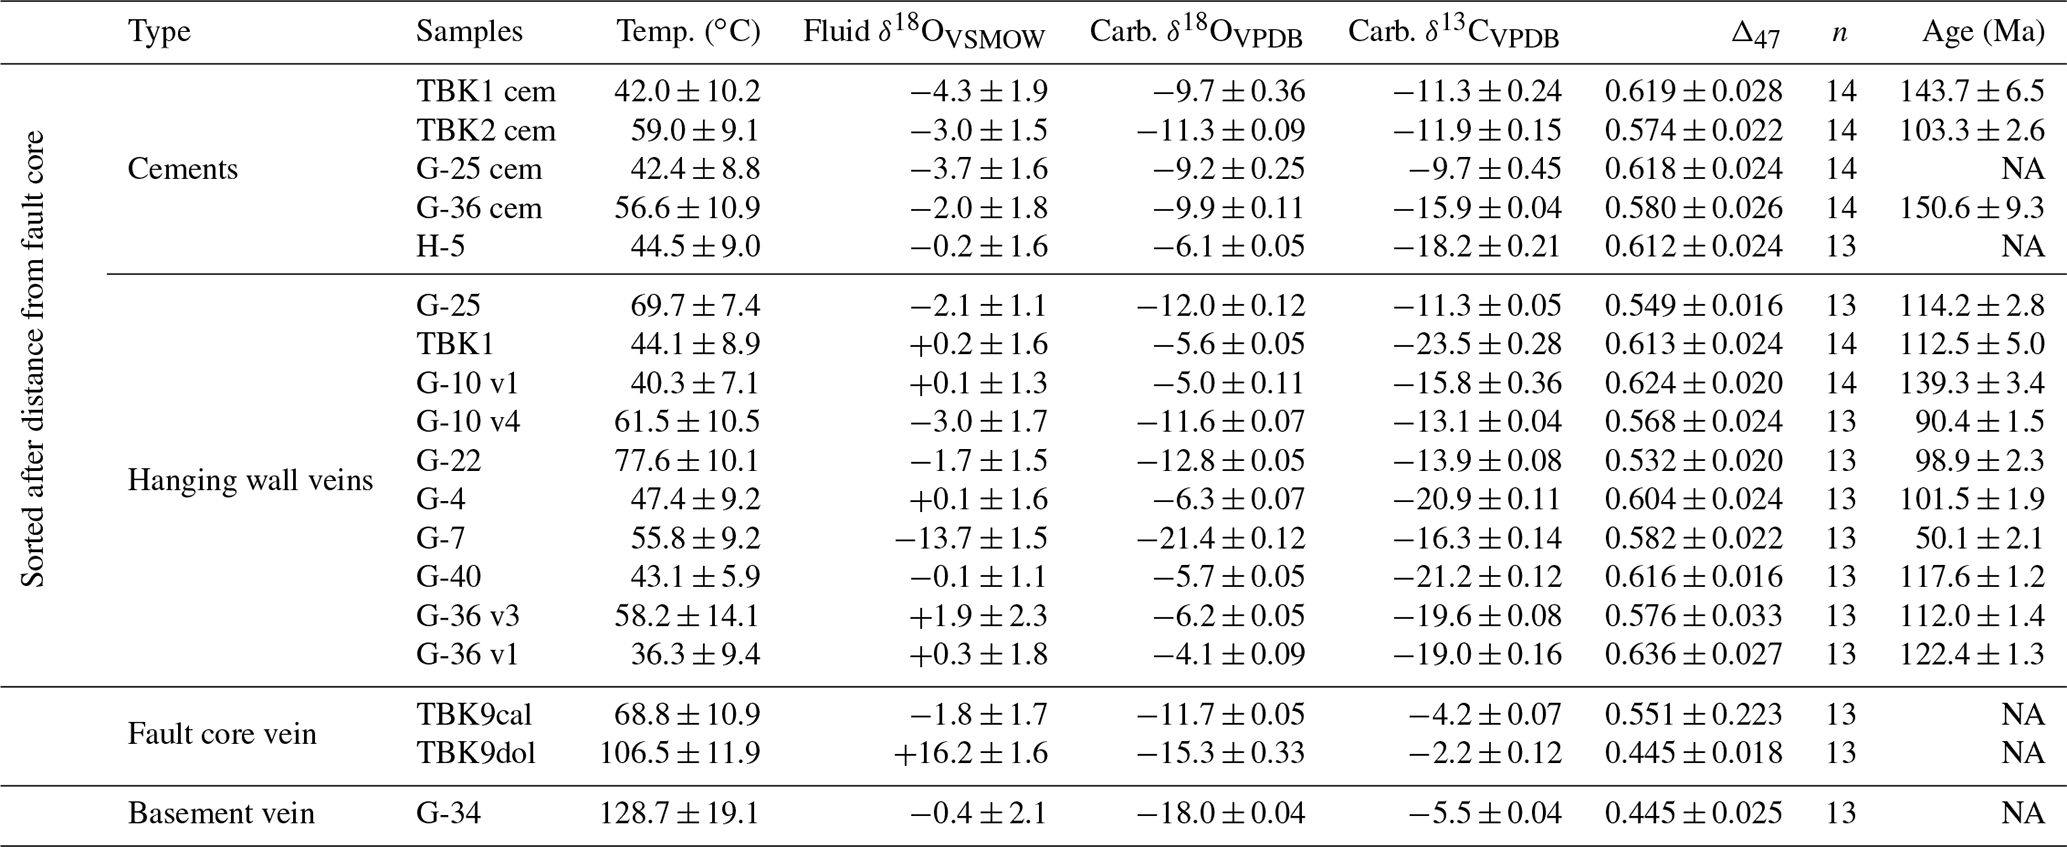
NA: not available.
Carbonate δ13CVPDB values range from −18.2 ± 0.3 ‰ to −9.7 ± 0.8 ‰ for cements and −23.5 ± 0.5 ‰ to −11.3 ± 0.1 ‰ for hanging wall veins (Fig. 9c; Table 2). The basement and fault core samples differ significantly from these values with −5.5 ± 0.1 ‰ (G-34), −4.2 ± 0.1 ‰ (TBK9cal), and −2.2 ± 0.2 ‰ (TBK9dol). In general, and bearing in mind the limited database, samples in the hanging wall might show a slight trend from low carbonate δ13CVPDB and high fluid δ18OVSMOW values to higher carbonate δ13CVPDB and lower fluid δ18OVSMOW values (Fig. 9c). Also, a slight increase in fluid δ18OVSMOW and decrease in carbonate δ13CVPDB with increasing distance to the fault might exist (Fig. 9d, e).
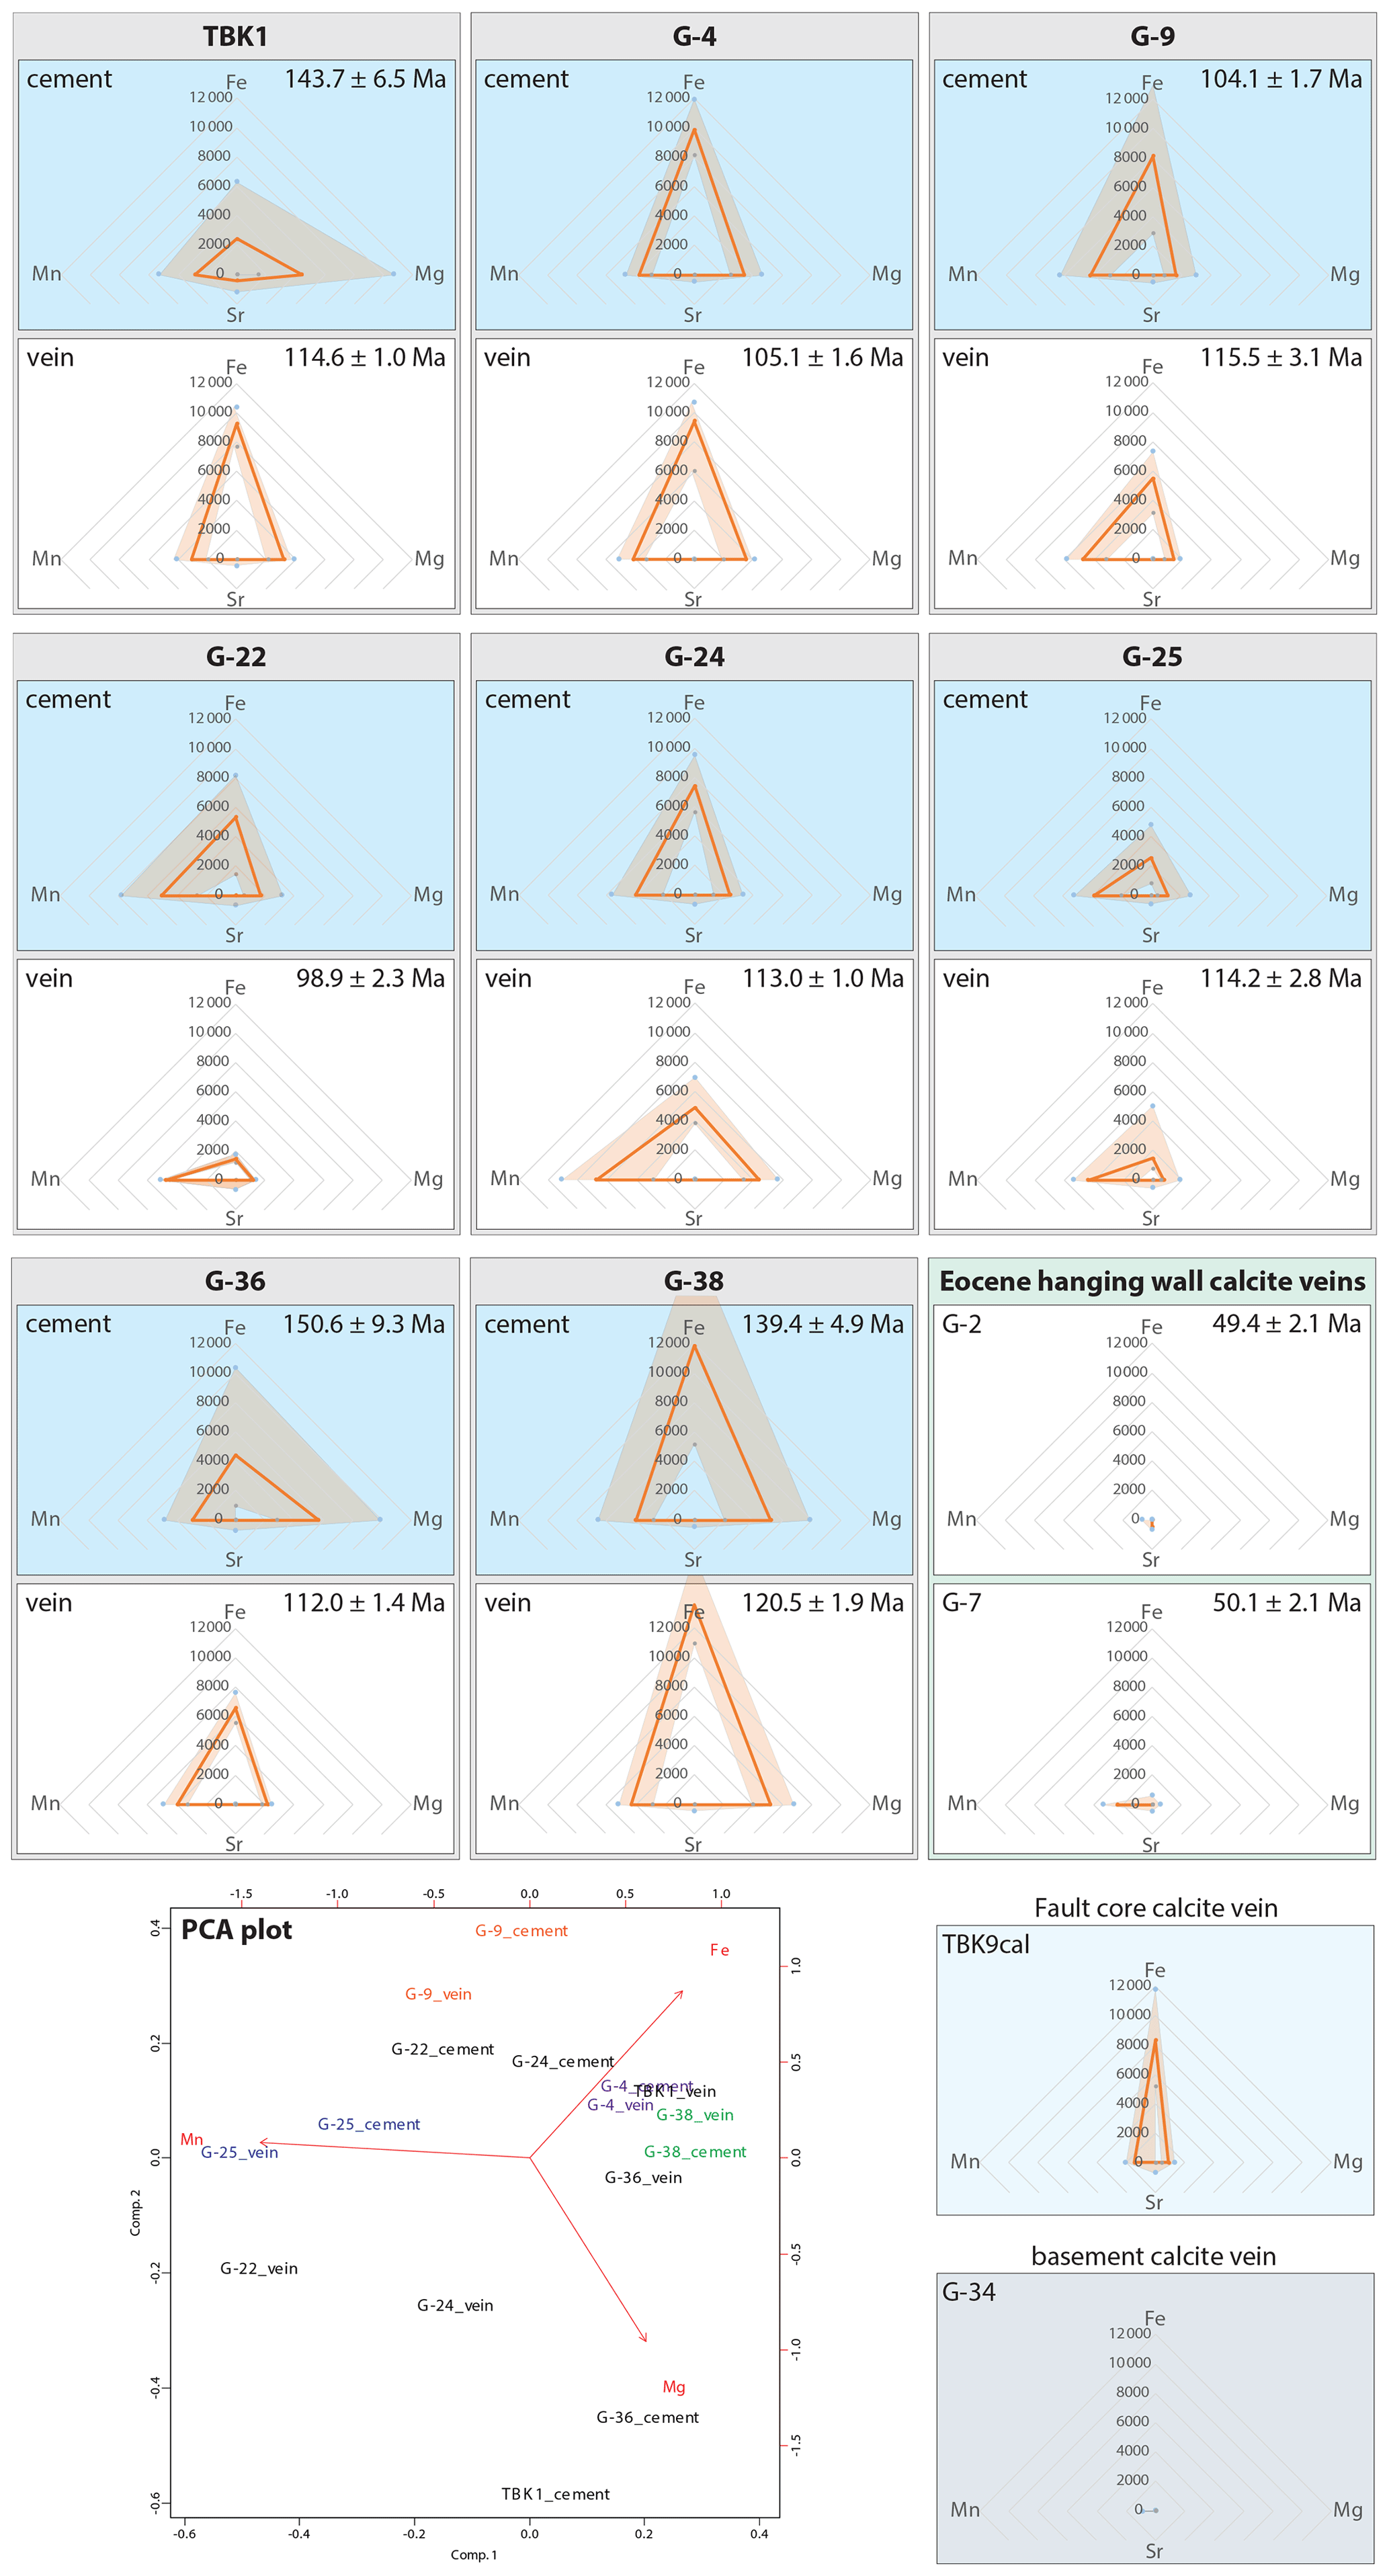
Figure 10Diagrams showing the element concentrations of Fe, Mn, Mg, and Sr (in ppm) in calcite cements and veins. Only samples hosting both cement and veins are shown, and among those samples with multiple vein generations, only data for the thickest vein generation are shown (see Fig. S2 in the Supplement for all diagrams). Exceptions are made for Eocene, fault core, and basement samples for which only vein data exist. The solid orange line refers to mean values; the light orange envelope refers to minimum and maximum values. Note the similarity of element concentration and ratio from cement to vein especially for samples G-4, G-9, G-25, and G-38. The principal component analysis (PCA) plot of the mean values highlights the similar ratio (calculated using the provenance R package; Vermeesch et al., 2016).
4.6 Minor element concentrations of cements and veins
For the minor element concentration analysis, we studied 10 calcite cement samples, 12 hanging wall calcite vein samples, two samples of veins from the fault core (one dolomite, one calcite vein), and one basement calcite vein sample (Table 3, Fig. 10). As some hanging wall samples comprised multiple vein generations, we measured in total 22 growth generations in the 12 hanging wall samples.
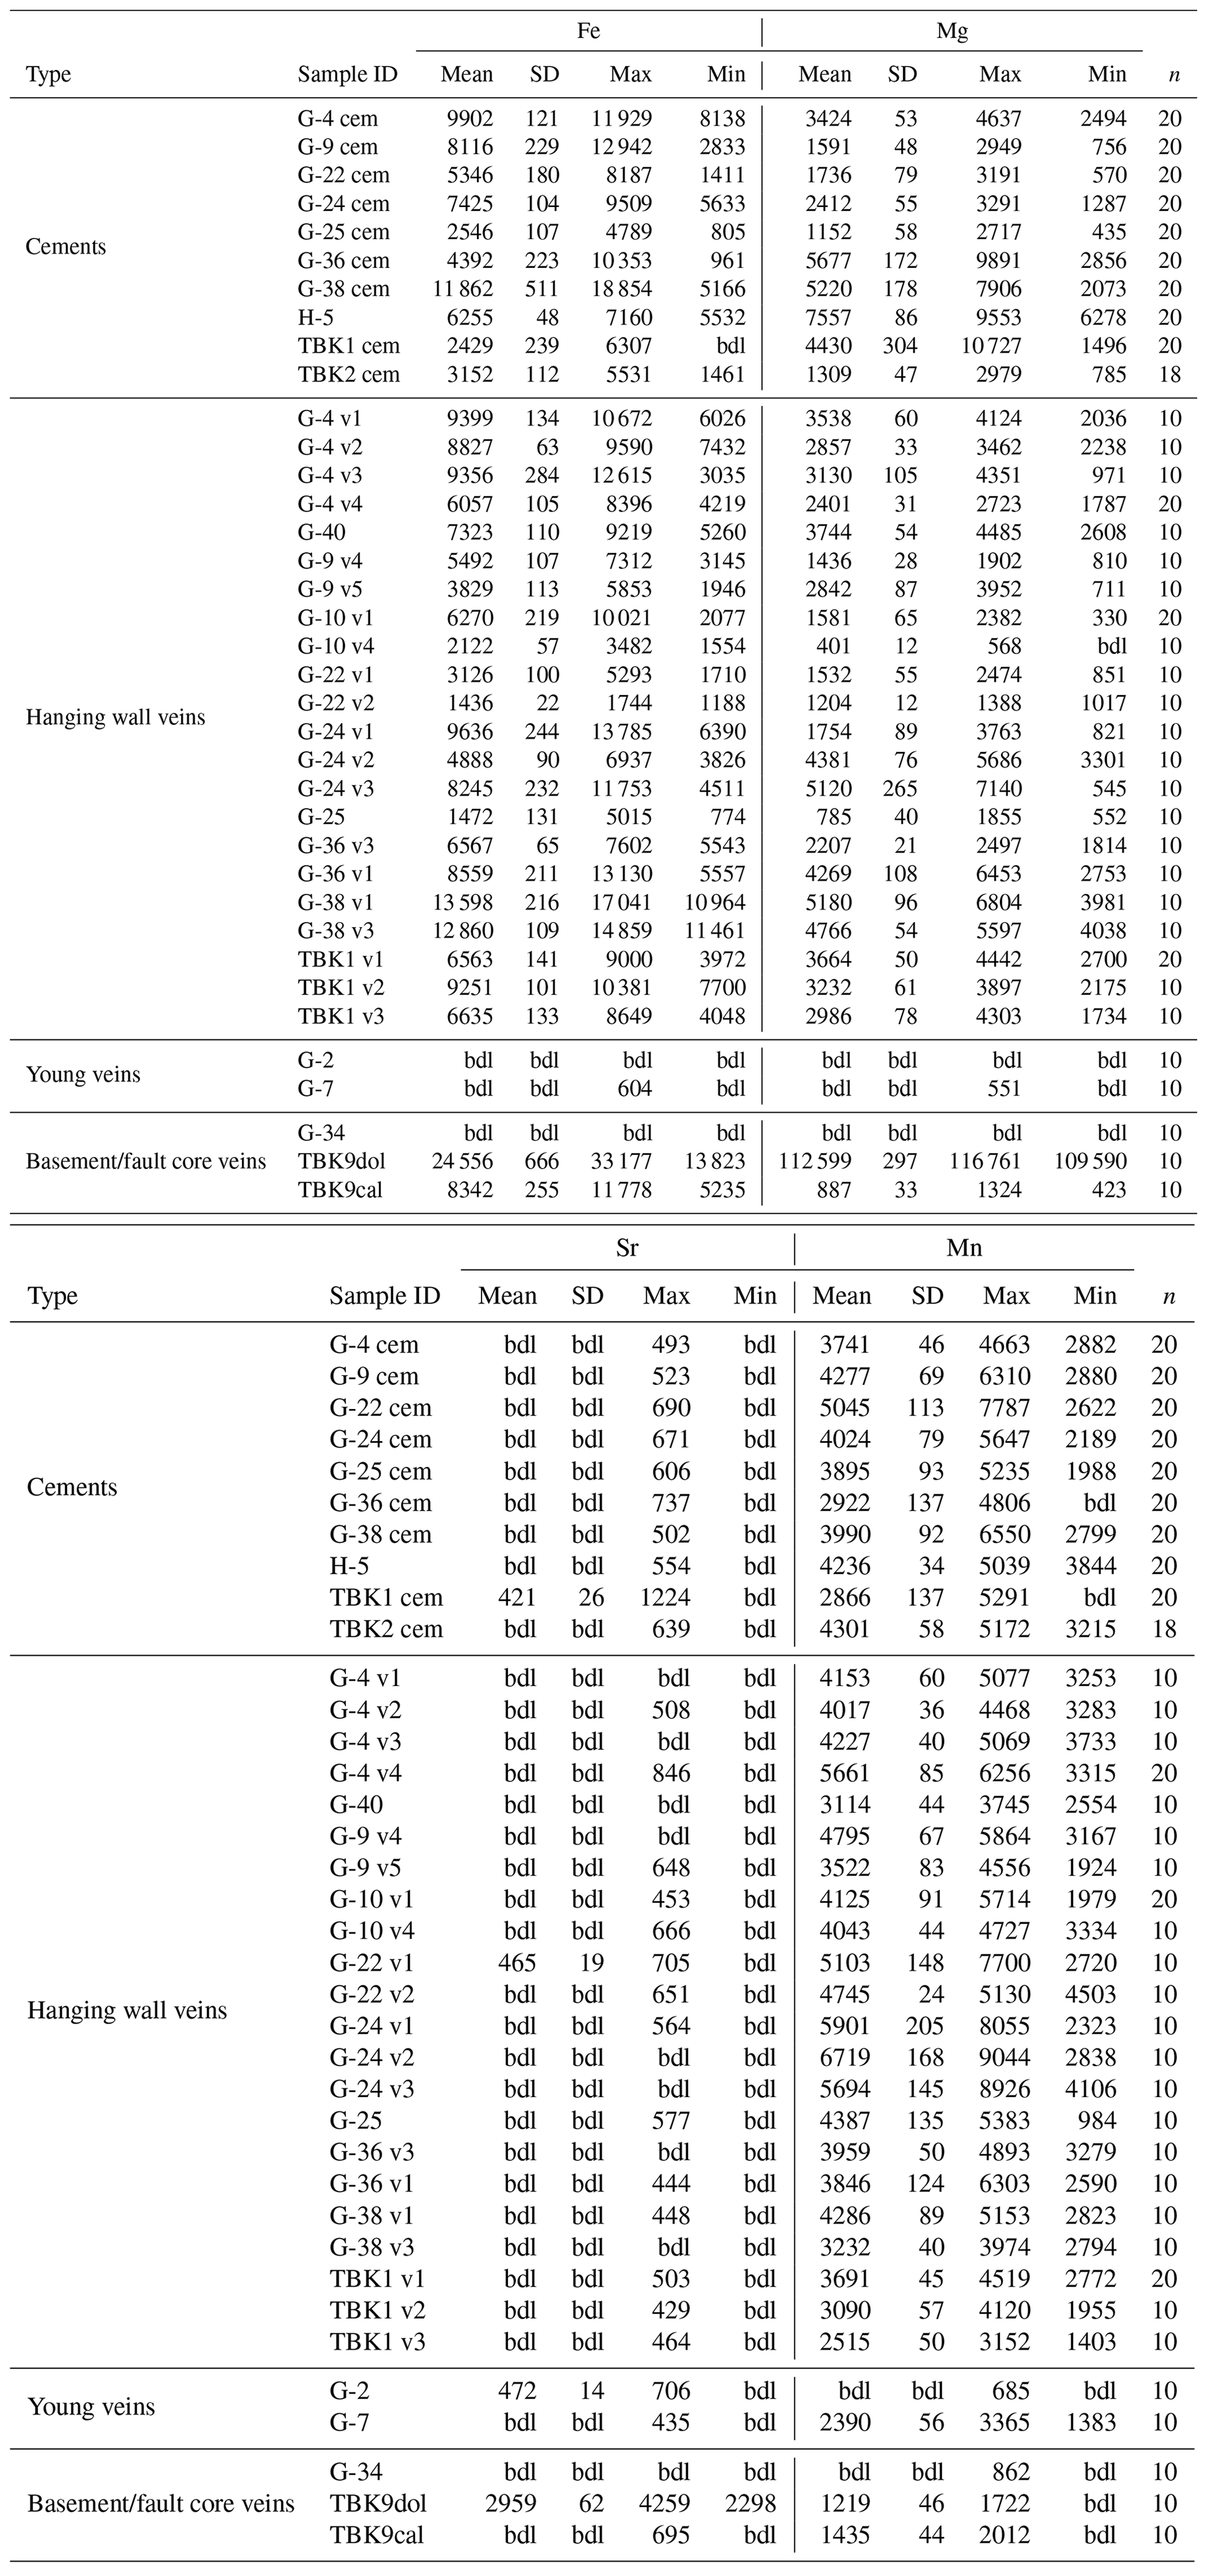
Common to all samples is a Sr concentration below or close to the detection limit and will therefore be neglected in the following. Cements comprise element concentration averages of 2429–11 862 (Fe), 2866–5045 (Mn), and 1152–7557 ppm (Mg) (Table 3). Hanging wall veins yield similar averages with values of 1436–13 598 (Fe), 2515–6719 (Mn), and 401–5180 ppm (Mg). The two Eocene-aged hanging wall veins (G-2 and G-7) differ significantly, with Fe and Mg concentrations being below the detection limit, and Mn concentration below detection in sample G-2, and 2390 ppm in sample G-7. The same applies to the basement sample G-34 with Fe, Mn, and Mg concentrations being below the detection limit. The fault core vein TBK9cal yields concentrations of 8342 (Fe), 1435 (Mn), and 887 ppm (Mg). Naturally, the older fault core dolomite vein TBK9dol diverges from the other samples with a high Mg and Fe concentration of 112 599 and 24 556 ppm, respectively, and a low Mn concentration of 1219 ppm.
The comparison of veins and respective cements from the immediate wall rock within a sample shows similar Mg and Mn concentrations for a majority of samples (i.e., samples G-4, G-9, G-22, G-25, and G-38; Fig. 10), which also partly accounts for Fe (G-4, G-25, G-38; Fig. 10). Overall, the ratio is similar from cement to vein within half of the samples, whereas concentration and ratios differ from sample to sample (e.g., compare G-25 and G-38; Fig. 10). Vein generations within a sample do not show significant variations in minor element concentrations (Fig. S2 in the Supplement). No trends in concentration or ratio versus time or spatial distribution are evident.
Table 3Minor element concentration (in ppm) of calcite cements and veins derived from microprobe analysis (bdl indicates values below detection limit; n indicates the number of measurements).
5.1 Timing and formation environment of the cementation zone
Based on the U–Pb calcite cement ages of 150.6 ± 9.3, 143.7 ± 6.5, and 139.4 ± 4.9 Ma (samples G-36, TBK1, G-38), the formation of the cementation zone in the hanging wall has likely occurred during or immediately after the deposition of the host sediments of the Lindemans Bugt Formation during the rift climax (middle Volgian–late Ryazanian; Surlyk, 2003; Fig. 8). The 150.6 Ma age of G-36 is unrealistic as it predates the Lindemans Bugt Formation; however, its error margin reaches well into the time interval over which this formation was deposited (Fig. 8; e.g., Surlyk, 2003). The upper formation age of the cementation zone is bounded by the age of vein G-10 v1 with 139.3 ± 3.4 Ma (i.e., close to the upper age boundary of the Lindemans Bugt Formation), as the rock had to be cemented to provide the tensile strength for the discrete fracture to form.
The two younger cement ages of 104.1 ± 1.7 (G-9cem) and 103.3 ± 2.6 Ma (TBK2) do not reflect a second cement growth phase but are interpreted to be recrystallization ages for the following reasons: in sample G-9, one vein generation with 115.5 ± 3.1 Ma (G-9 v4) is significantly older than the cement age. In line with our argument based on sample G-10 v1 above, it is plausible that the wall rock was cemented before ∼ 115.5 Ma to allow for a discrete fracture to form. In sample TBK2, derived from the same outcrop as TBK1, the cement has a well-developed equant sparitic to poikilotopic texture (Fig. 4d) with crystal sizes that exceed any other analyzed cement sample. This type of texture has elsewhere been interpreted as evidence for recrystallization (e.g., Saigal and Bjørlykke, 1987; McBride and Milliken, 2006; Worden et al., 2019), which, in conjunction with the similar age of the G-9 cement, gives rise to our similar interpretation for the TBK2 cement, although we cannot fully exclude the possibility of a second cement growth phase.
Having established that the cementation zone formed immediately after deposition of the Lindemans Bugt Formation, its maximum formation depth is constrained by the thickness of the remaining part of the unit above the sampled intervals. The lithostratigraphic top of the Lindemans Bugt Formation is exposed on a ridge ∼ 4500 m away from the Dombjerg Fault (Fig. 2). Using a maximum depositional dip angle of 15∘ for fault-proximal Lindemans Bugt Formation sedimentary strata (Henstra et al., 2016) allows interpolation of the top of this formation towards the fault (Fig. 11). With this approach, we estimate a maximum thickness of the Lindemans Bugt Formation above sample TBK1cem of ∼ 1050 m and above sample G-36cem of ∼ 750 m. These thicknesses represent maximum estimates, because the depositional slope angle of the sediments decreases away from the fault. Applying an angle of 10∘ would, for example, lower the estimated thickness to 740 and 530 m above samples TBK1cem and G-36cem, respectively (Fig. 11). Hence, we estimate that the cementation zone formed at a burial depth of ∼ 1000 m or less (compaction not accounted for).
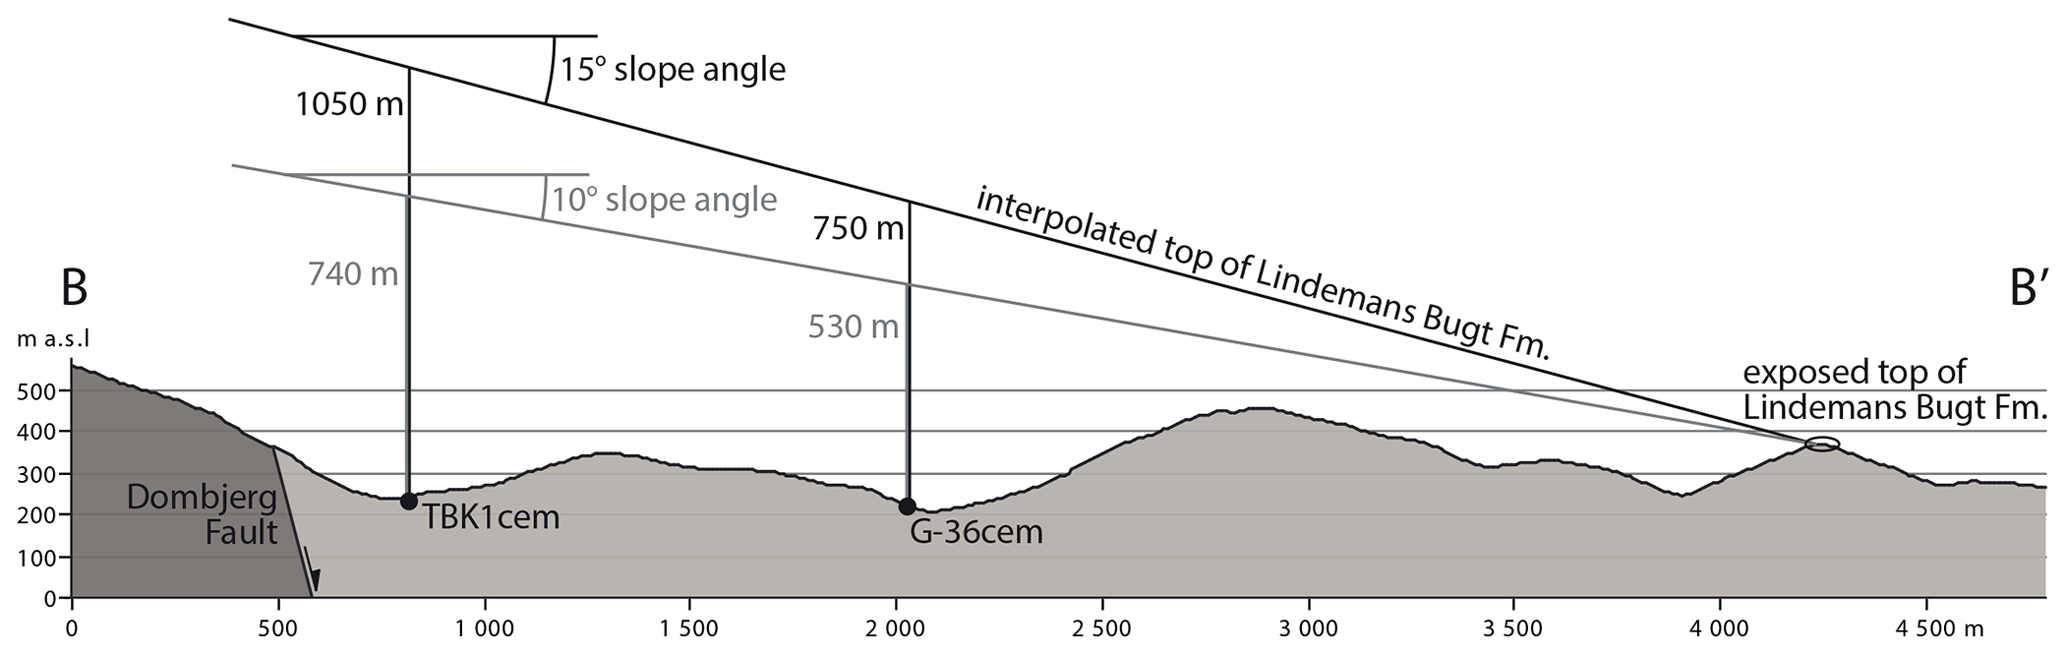
Figure 11Estimation of thickness of Lindemans Bugt Formation above sample sites. A slope angle of 10–15∘ is reported for fault-proximal sediments (Henstra et al., 2016) and is used as an interpolation of the top of the formation from its exposure in the field towards the Dombjerg Fault. Sample sites are interpolated onto the profile. For the location of the profile, see Fig. 2.
Formation temperatures of the cements can be assessed from the clumped isotope temperatures, although their interpretation needs to be taken with care: calcite is subject to solid-state reordering of C–O bonds at ambient temperatures 100 ∘C, which affects the Δ47 composition and subsequently deviates the clumped isotope temperature from the initial formation temperature (Passey and Henkes, 2012). For dolomite, solid-state reordering starts at ambient temperatures of ∼ 150 ∘C (Lloyd et al., 2018). It is documented that this resetting is a challenge especially for samples from sedimentary basins, where the rock may have experienced high burial temperatures for long time periods (Henkes et al., 2014; Shenton et al., 2015). For the sedimentary rock of the Lindemans Bugt Formation, the absence of quartz overgrowth in both calcite-cemented and uncemented sediment samples provides a control on the maximum burial temperature. Temperature is a critical factor for the formation of quartz cement, which is known to start at ∼ 70 ∘C, and its growth rate increases significantly with increasing temperature (e.g., Walderhaug, 1994; Lander and Walderhaug, 1999; Harwood et al., 2013), while, e.g., silica supply is not regarded as a limiting factor (e.g., Walderhaug, 1996, 2000; Lander et al., 2008; Taylor et al., 2010). Therefore, we argue that the analyzed samples from the Lindemans Bugt Formation have not been subject to temperatures above 100 ∘C and that the clumped isotope temperatures reflect the formation temperatures. However, this excludes samples that were subject to recrystallization, i.e., dissolution and reprecipitation (Eiler, 2011), as well as the basement and fault core samples, whose age/temperature history is not known.
Despite being similar in age, the cement samples show a variation in formation temperatures, e.g., 42.0 ± 10.1 ∘C for TBK1cem, located ∼ 300 m away from the fault, and 56.6 ± 10.9 ∘C for G-36cem, located ∼ 1500 m away from the fault (Fig. 9a, b; Tables 1, 2). This indicates that fluid circulation and heat flow was heterogeneously distributed in the hanging wall and that highest temperatures are not necessarily found closest to the fault. This may root in permeability variations within the hanging wall deposits, due to, e.g., grain size, sorting, or onset of cementation, which may cause local perturbation or channeling of fluid flow and advective heat transfer. Subsequently, upwelling hot fluids along the fault would have adapted variably to the ambient geothermal gradient, depending on their fluid pathway and flow rate.
The calculated fluid δ18OVSMOW of the cements allow us to assess the fluid source from which the cements precipitated from. In general, the mean marine δ18OVSMOW is regarded as −1 ‰ for the Cretaceous (e.g., Shackleton and Kennett, 1975; O'Brien et al., 2017). However, it is shown that the marine δ18O has likely been inhomogeneous in the Early Cretaceous with reported values ranging from −5.3 ‰ to +1.5 ‰ (Price and Nunn, 2010; Price et al., 2020), which reflects a similar spread as shown by modern marine δ18O (LeGrande and Schmidt, 2006). The fluid δ18OVSMOW values of the cements, spanning from −4.3 ± 1.9 ‰ to −0.2 ± 1.6 ‰ fit well into this range and likely reflects a marine or potentially mixed meteoric/marine fluid system, which is unsurprising given the marine deposition environment in the hanging wall basin. Henstra et al. (2016) argue for the presence of a delta located to the north of the study area, between the Dombjerg and Thomsen Land faults (Fig. 1b), supplied by a large hinterland catchment area. This river system might have provided sufficient inflow of freshwater into the marine hanging wall basin to shift the δ18O signature to the more negative values. An additional possibility may be the local influx of meteoric groundwater: the δ18OVSMOW values of the cements appear to increase slightly with distance to the fault (Fig. 9d) and with the caveat that this observation is based on a limited number of data points, this may be taken to suggest that meteoric groundwater affected the proximal (near-fault) parts of the hanging wall but did not access the more proximal hanging wall deposits.
5.2 Timing and formation of calcite veins
The analyzed veins cover a U–Pb age range from 140 to 90 Ma. Only one of these veins (sample G-10 v1) formed during the rift-climax stage (Table 1, Fig. 8), whereas the majority formed broadly between 125 and 100 Ma in the post-rift stage, accompanied by renewed fracture opening and vein formation between 115 and 90 Ma (Fig. 8). In the Wollaston Forland Basin, there is, to our knowledge, no published evidence for tectonic activity in Aptian to Turonian times. However, on northern Hold with Hope, ∼ 80 km south of our study area (Fig. 1), a rift period occurred from the late Valanginian to middle Albian times with faulting along a series of N–NNE-trending normal faults (Whitham et al., 1999). Both vein ages and orientations in our study area fit well with these structures and might therefore correspond to this tectonic phase. On the rift counterpart across the Norwegian and Greenland seas, the Lofoten–Vesterålen segment of the Norwegian continental shelf, a rifting phase occurred during the late Albian (Dalland, 1981; Henstra et al., 2017) and may have a minor contribution to fracturing or fracture reopening. We note, however, that with regard to the limited sample number, we cannot fully exclude the possibility of continuous vein formation from the syn-rift into the post-rift.
It is also possible that the veins formed in two stages by (i) fracturing during the main rift stage and (ii) calcite precipitation, in the post-rift stage. However, the vein generation G-10 v1 formed at the end of the rift climax (Fig. 8; Table 1), showing that the formation conditions were favorable for calcite precipitation in fractures. Hence, it would be reasonable to expect that also other fractures forming during rift climax should be calcite filled, and we therefore consider such a two-stage interpretation as less likely, and our preferred interpretation is that the veins formed in their entirety in the post-rift stage. The U–Pb ages of vein samples G-7 (50.1 ± 2.1 Ma) and G-2 (49.4 ± 2.1 Ma) diverge significantly from the main sample suit. These veins closely postdate the extrusion of the Eocene plateau basalts covering the Lower Cretaceous late syn-rift Palnatokes Bjerg Formation, which overlies the Lindemans Bugt Formation. This event is dated to 56–53 Ma (Larsen et al., 2014) and is related to the onset of continental breakup, which started at the latitude of the Wollaston Forland around 55 Ma (Mjelde et al., 2008; Larsen et al., 2014). Hence, the formation of the veins could be directly related to deformation and uplift following breakup. A second striking difference to the main sample suit is the low fluid δ18OVSMOW value of −13 ± 1.5 ‰ of sample G-7. It falls well into the global δ18O range of −8 ‰ to −20 ‰ for modern meteoric water at 60∘ N (Terzer et al., 2013), i.e., the paleolatitude of the study area at 50 Ma (Torsvik et al., 2012; van Hinsbergen et al., 2015), and thus most likely indicates a meteoric fluid. We therefore interpret that deformation and, potential, rift shoulder uplift in response to continental breakup (e.g., Wernicke, 1985; Chéry et al., 1992), was responsible for vein formation, which at this time occurred under meteoric conditions.
As suggested above, the clumped isotope temperatures of the hanging wall veins most likely reflect their formation temperatures. These generally lie close to the cement formation temperatures, which may be explained by (i) similar formation depth, (ii) deeper formation depth but lower geothermal gradient, or (iii) perturbation of fluid flow and advective heat transfer. The latter argument should be valid as the cementation zone has likely created a setting for complex fluid pathways, whereas the evolution of the geothermal gradient is difficult to assess. The burial depth of the analyzed sedimentary rock has increased after the formation of the cementation zone due to deposition of the late syn-rift Palnatokes Bjerg Formation and Barremian to Albian post-rift sediments (e.g., Nøhr-Hansen, 1993; Surlyk and Korstgård, 2013). Two formation temperatures and ages are obtained of successive precipitation generations from two vein samples, respectively (samples G-10 and G-36; Table 2, Fig. 7a). Both samples yield an increase of formation temperature from old to young vein generation (i.e., from 40.3 ± 7.1 ∘C at 139.3 ± 3.4 Ma to 61.5 ± 10.5 ∘C at 90.4 ± 1.5 Ma in sample G-10 and from 36.3 ± 9.4 ∘C at 122.4 ± 1.3 Ma to 58.2 ± 14.1 ∘C at 112.0 ± 1.4 Ma in sample G-36), which might indeed reflect an increasing formation depth.
For the calcite and dolomite samples from the basement and fault core, it is unclear if the clumped isotope temperatures reflect the original formation temperatures, since an age control is missing. Therefore, these samples may have been partially reset due to ambient temperatures above the threshold of C–O bond reordering of ∼ 100 ∘C for calcite (Passey and Henkes, 2012) and ∼ 150 ∘C for dolomite (Lloyd et al., 2018) in the course of time. The clumped isotope temperature of 128.7 ± 19.1 ∘C of the basement sample G-34 could therefore reflect the original formation temperature, a maximum ambient temperature, a cooling temperature if the ambient temperature was >100 ∘C but lower than the calcite formation temperature, or a mixture of these. For the fault core vein samples, only a partial heating signal may be present as the measured clumped isotope temperatures of both veins are still below the temperature threshold (i.e., a fully reset signal would give a clumped isotope temperature above 100 ∘C for calcite and 150 ∘C for dolomite). Therefore, we are confident that the original formation temperatures of the dolomite and calcite vein samples from the fault core are ≤106.5 ± 11.9 and ≤68.8 ± 10.9 ∘C, respectively. Since both vein networks have a continuous, non-faulted appearance in the outcrop (Fig. 3e), we argue that these veins formed in the late stage of fault activity.
5.3 Origin of calcite components and fluid circulation patters
One of the main questions around the formation of the cementation zone is the origin of calcium necessary for the calcite cementation. A first likely candidate for a source is calcium from seawater that circulated through the succession (Morad, 1998). Such a circulation may be expected to follow general subsurface flow patterns in coastal areas. In such areas, groundwater systems are commonly characterized by marine (i.e., seawater) groundwater circulation that is tidal, density, and thermal driven, and meteoric groundwater flow towards the ocean, driven by the hydraulic head (e.g., Cooper, 1959; Wilson, 2005; Jiao and Post, 2019). In the presence of a continuous and undisturbed permeable rock, marine circulation is not restricted to the aquifer underneath the ocean but extends landward beyond the coastline underneath the body of meteoric groundwater (Fig. 12a). The landward extension of marine groundwater circulation partly depends on the permeability of the aquifer (e.g., Houben et al., 2018; Jiao and Post, 2019). Along the Dombjerg Fault, which defined and delineated the coastline during the rift climax (Surlyk, 1989; Henstra et al., 2016), the footwall is composed of low-permeable crystalline and metamorphic rock with a low fracture and vein density (four joints plus one vein per meter; Kristensen et al., 2016). On the other hand, the hanging wall succession has distinctly different flow properties than that of low-permeable crystalline basement. Where uncemented, these deposits are highly porous (Fig. 4g) and therefore presumably permeable, allowing for fluid flux at a much larger degree compared to low-fractured crystalline and metamorphic basement rock (e.g., Brace, 1980). Hence, along the Dombjerg Fault, marine fluid circulation should be predominantly restricted to the permeable fault zone and hanging wall clastic succession (Fig. 12b). Upwelling of warm marine fluids along the fault may have been in a favorable condition for the precipitation of calcite from seawater within the vicinity of the fault zone.
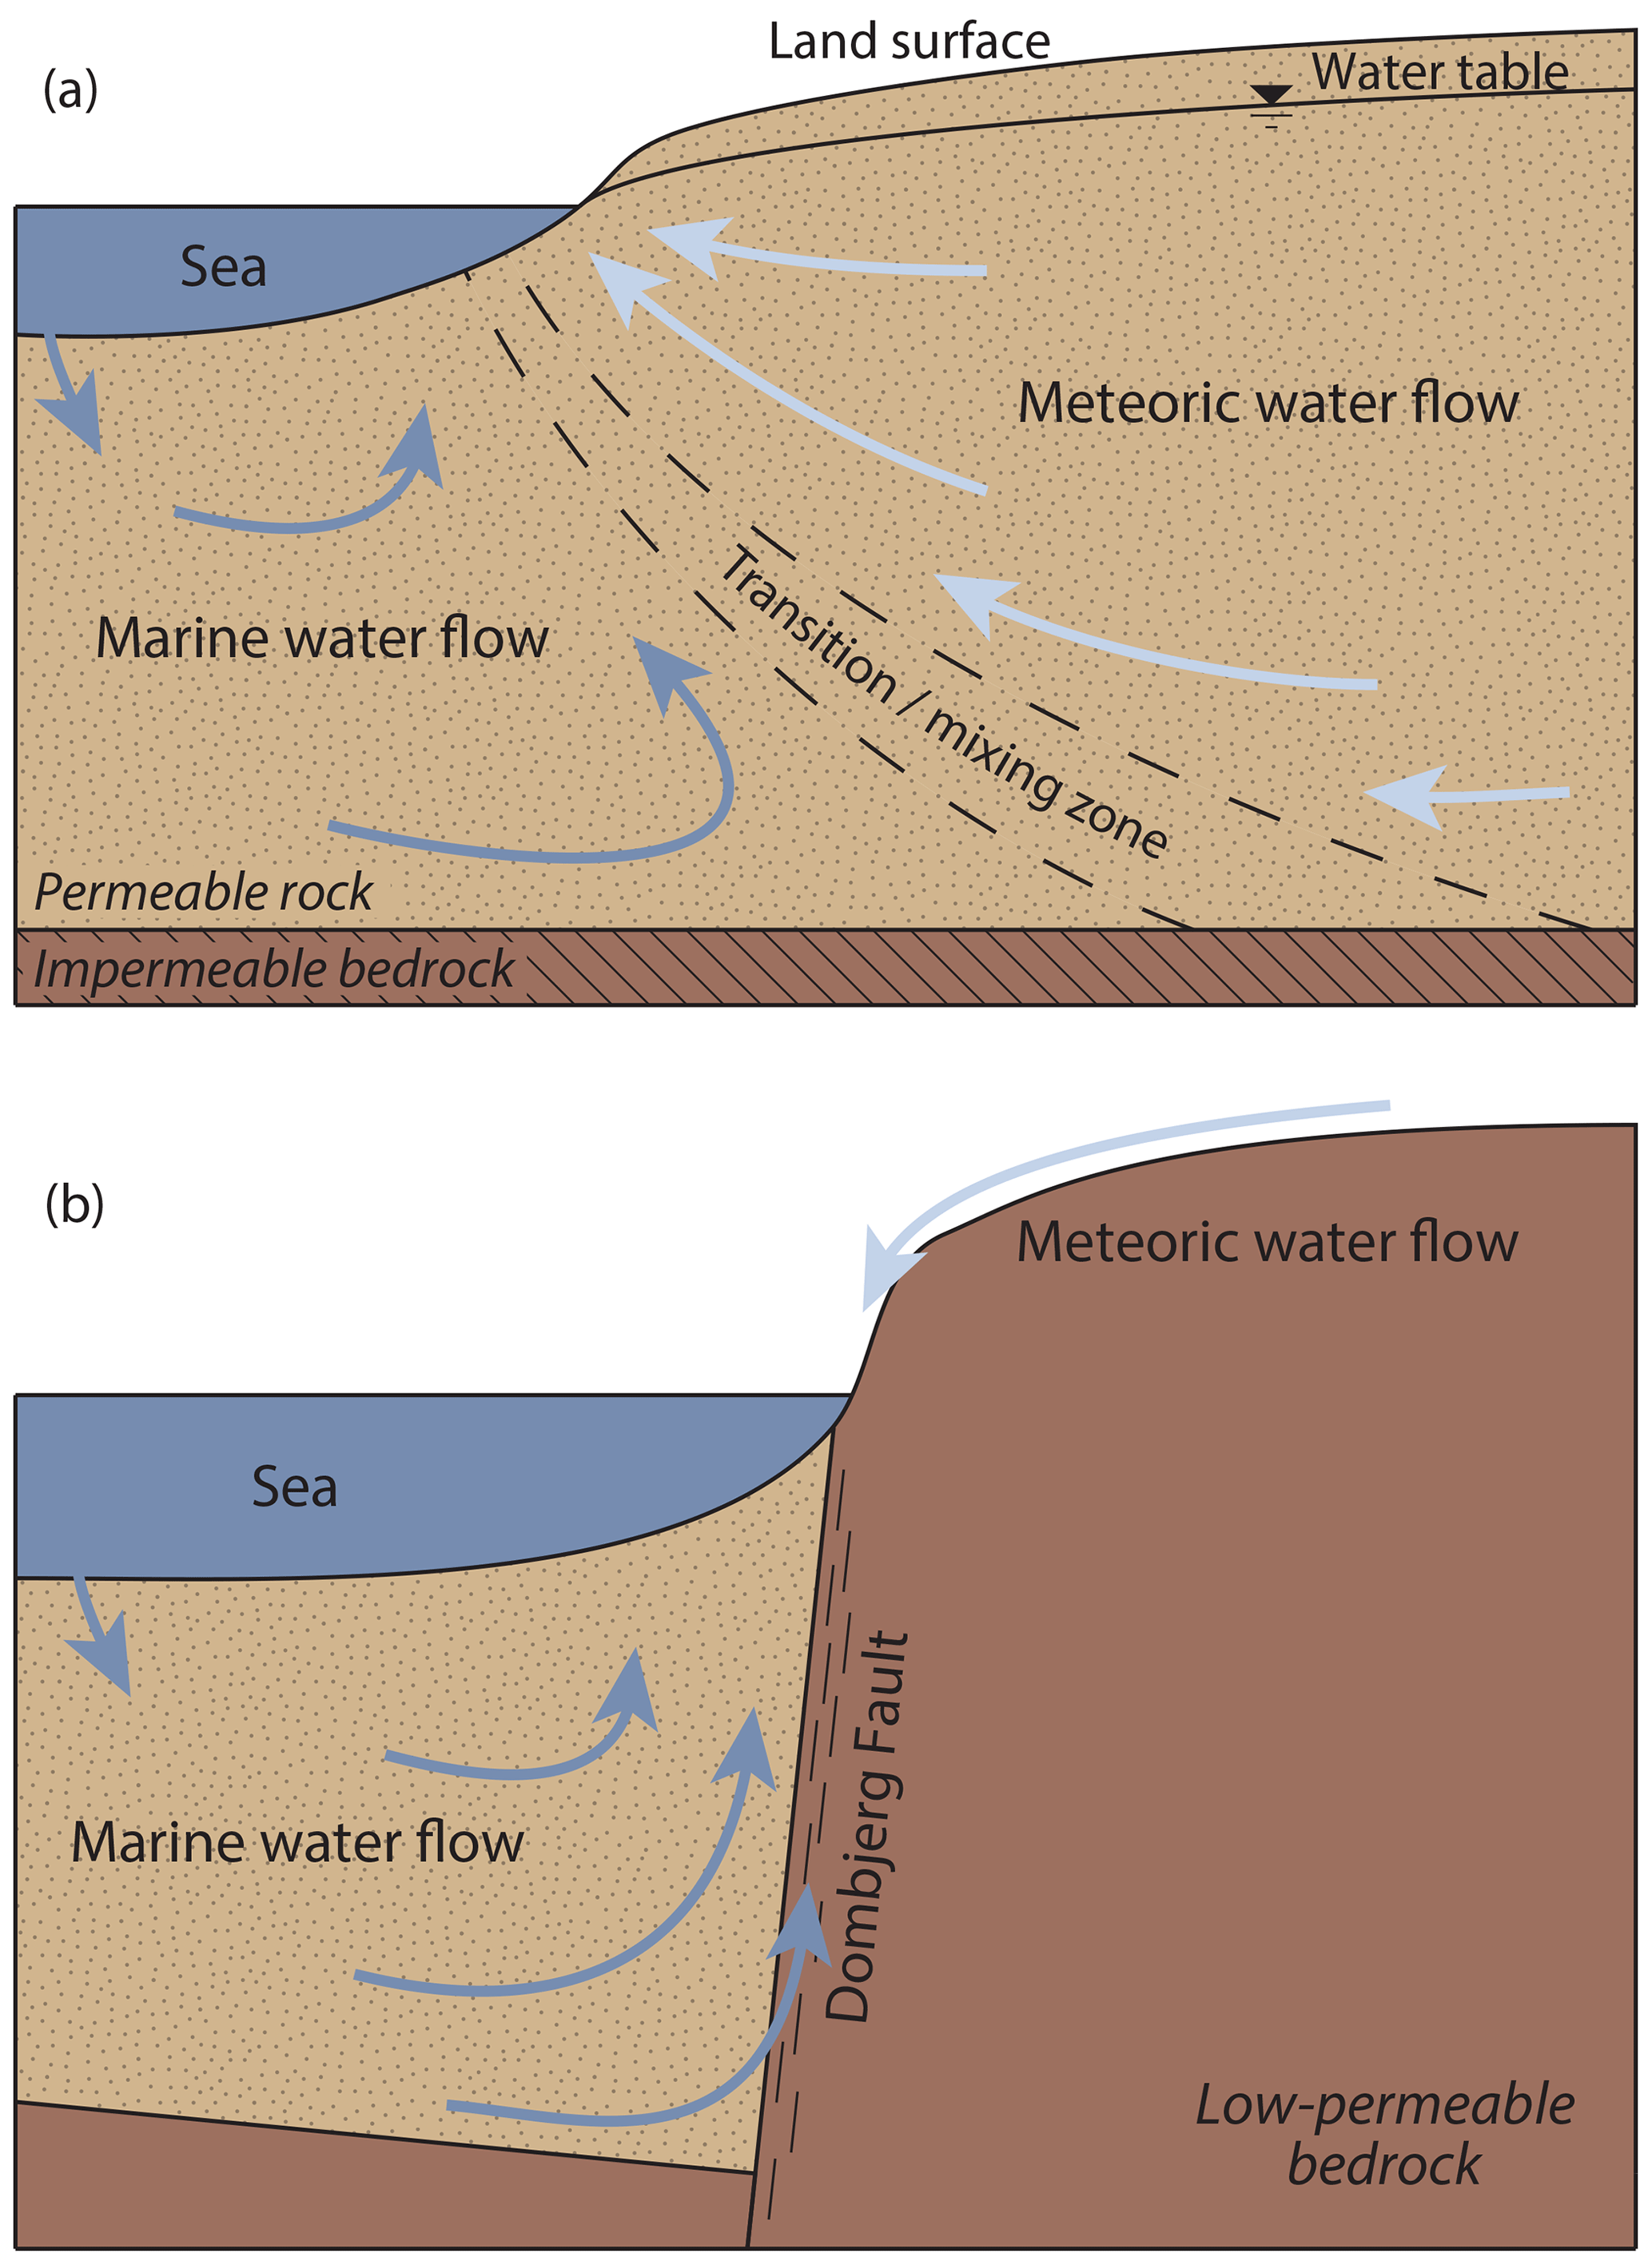
Figure 12(a) Idealized groundwater flow in coastal areas (redrawn after Jiao and Post, 2019; Cooper et al., 1964). Circulation of marine water is tidal, density, and thermal driven. (b) Conceptual adapted fluid flow model at the Dombjerg Fault in the syn-rift stage. Low-permeable footwall rock should cause dominant surficial runoff of meteoric water and circulation of marine water predominantly in the hanging wall and fault zone.
A second candidate for a calcium source is Permian carbonate and evaporite deposits underlying the clastic hanging wall rift sediments. While a direct exposure of such rock along the Dombjerg Fault is missing, a Permian carbonate unit is located along the northern section of the Clavering Fault (Fig. 1b; Surlyk, 1978), which forms the southern extension of the Dombjerg Fault. Permian carbonate rock is also exposed at the southern crest of the hanging wall block of the Dombjerg Fault (Fig. 1b; Surlyk, 1978). It may therefore be a reasonable assumption that the Permian succession is also underlying the Lindemans Bugt Formation along the Dombjerg Fault, especially considering that the fault had been active since the Carboniferous (Rotevatn et al., 2018). It has been proposed and modeled elsewhere that surface waters may convect thermally driven within faults (e.g., López and Smith, 1996; Zhao et al., 2003; Hollis et al., 2017). Such convecting fluids within the Dombjerg Fault may have dissolved the carbonate and transported the solutes into the Lindemans Bugt Formation for the precipitation of calcite.
Other potential sources for calcium can be excluded: no carbonate rock is hosted by the basement and also carbonate deposits in the Palnatokes Bjerg Formation overlying the cementation zone-hosting Lindemans Bugt Formation (i.e., Albrecht Bugt Member; Surlyk and Korstgård, 2013) can be ruled out as a source, since the cementation predates this deposition. Further, dissolution of biogenic carbonate clasts and feldspar alteration appear unlikely as a potential internal source. Although biogenic carbonate clasts occur sporadically in some outcrop sections and are visible in a number of thin sections, they do not show signs of dissolution or recrystallization. The degree of feldspar alteration in the sandstone is low and hence will not have provided a significant amount of calcium. Therefore, whether calcium from seawater or dissolved underlying carbonates, it is clear that the calcium must have been introduced into the sediments of the Lindemans Bugt Formation by advective transfer.
CO2 that is acquired for the formation of calcite may have been generated and transported along in the same process. Yet, the negative δ13CVPDB values of the cements hint towards an (additional) internal source: δ13C values of calcite cements range from −18.2 ‰ to −9.7 ‰, which are typical values for CO2 deriving from the degradation of organic matter (e.g., Clark and Fritz, 1997). The high uranium content of the cements, which allowed the U–Pb calcite dating, also indicates degradation of organic matter, which is commonly bonding uranium (e.g., Spirakis, 1996; Cumberland et al., 2016). Organic matter is common in the Lindemans Bugt Formation, composing mostly of ammonites, bivalves, belemnites, and transported plant and wood fragments (Pauly et al., 2013; Henstra et al., 2016), and the presence of pyrite in the sediment points towards an organic matter degradation in the sulfate reduction zone (e.g., Jørgensen and Kasten, 2006).
Fe and Mn incorporated in the calcite cements and veins are most likely sourced from within the sediments, as their concentration in marine water is generally very low (e.g., Moore and Wade, 2013). Notable is the overall high Fe concentration in the samples, while at the same time being highly variable across the sample suit (Fig. 10, Table 3). A major Fe source has likely been biotite, which is frequent in the sandstone, and the formation of pyrite along these grains demonstrates that Fe was released from biotite (Fig. 5). An inhomogeneous distribution of biotite in the sandstone might subsequently be responsible for the spatial variability of Fe concentration in the calcite. The low Sr concentration is more difficult to explain: Sr uptake into calcite is strongly temperature and precipitation rate dependent, i.e., the Sr concentration in calcite decreases with increasing temperature and increases with precipitation rate (e.g., Tang et al., 2008; Swart, 2015). The low Sr concentration may therefore be a result of the elevated precipitation temperature in reference to calcite precipitating at or near the seafloor.
5.4 Permeability of the fault and the cementation zone
Throughout its seismic activity, the Dombjerg Fault was permeable due to repeated fracturing, as commonly assigned to fault zones (e.g., Sibson, 1990; Indrevær et al., 2014). The anastomosing dolomite vein network (represented by sample TBK9dol) close to the fault core suggests the fault represented a conduit for vertical (up-fault) fluid migration. It yields a fluid δ18OVSMOW value of +16.1 ± 1.6 (Table 2), which is by far the highest value determined in our sample suit and is indicative for a metamorphic fluid (Sheppard, 1986) that was likely sourced from greater depths. On the contrary, its formation temperature of ≤106.5 ± 11.9 ∘C is not particularly high, which might reflect a moderate flow rate allowing the fluid to adapt to the ambient wall rock temperature.
The younger calcite vein network cutting through the dolomite veins is less pronounced and consists of thinner veins. Its fluid δ18OVSMOW value of −1.8 ± 1.7 ‰ (sample TBK9cal; Table 2) presumably indicates a marine fluid, which may be taken to suggest that the marine groundwater circulation was responsible for its formation. The δ13C value of −4.2 ± 0.1 ‰ of this vein differs significantly from hanging wall cements and veins (−23.5 ‰ to −9.7 ‰). Also, the minor element concentration ratio diverges from hanging wall samples with very low Mn and Mg concentrations (Table 3, Fig. 10). This might indicate that the marine groundwater circulation, from which the calcite in the fault core fracture network precipitated, was decoupled from groundwater circulation in the hanging wall sediments.

Figure 13Schematic evolution model of fluid circulation and cementation zone along the Dombjerg Fault. (a) Onset of Dombjerg Fault activity with formation of marine hanging wall basin and syn-rift sedimentation. Circulation of marine fluids is tidal and thermal driven (cf. Jiao and Post, 2019). Fault activity maintains a well-connected fracture network near the fault core allowing for thermal-driven in-fault circulation of marine fluids (e.g., López and Smith, 1996) and upward metamorphic fluid migration. (b) Syn-rift sedimentation continues and calcite cement starts to grow. Source of calcium is either seawater or dissolving Permian carbonate underlying syn-rift sediments. (c) Continued syn-rift sedimentation and growth of cementation zone. The zone forms a low-permeable body, which presumably directs thermal-driven marine fluid circulation farther into the basin, which may also allow the cementation zone to grow. (d) Fracturing in the cementation zone occurs mainly in the post-rift stage and vein calcite precipitates from marine fluids. (e) Eocene basalt extrusion and rift shoulder uplift in response to continental breakup drains the marine basin and allows meteoric fluids (pathways unclear) to infiltrate the hanging wall sediments and Eocene fractures.
In the hanging wall, the cementation zone will have, once formed, significantly lowered the permeability of the fault-proximal hanging wall sediments, as the carbonate cement reduces the pore space towards 0 %. During progressive formation of the cementation zone and accompanying matrix porosity and permeability loss, fluid circulation becomes increasingly dependent on flowing through fractures developed within this zone. Here, the magnitude of circulation and flow direction is then guided by the connectivity and orientation of the fracture network.
The minor element concentration of cements and veins (Fig. 10) may shed light on the fluid flow rate and degree of fracture connectivity in the cementation zone. There is a striking similarity of minor element concentrations between veins and the respective wall rock cement in around half of the analyzed samples, while being variable from sample to sample (Fig. 10, Fig. S2 in the Supplement). Noteworthy is the compositional difference between samples G-36 and G-38: these samples are located ∼ 2 m apart from each other in the same outcrop, yet especially the Fe concentration of cements and veins varies between the samples, while being similar from respective wall rock cement to vein calcite. While sample G-36 yields an Fe concentration below average, sample G-38 yields the highest Fe concentration of all samples (Fig. 5, Table 3). The analyzed sample (G-38) hosts a very large quantity of biotite (Fig. 5), which serves as a Fe source, and could explain this high concentration. If an advective fluid was responsible for both the precipitation of cement and vein calcite, it must have kept a stable minor element composition over ∼ 20 Myr (i.e., the age difference between wall rock cement and vein calcite), which at the same time had to remain highly variable on a local spatial scale. We regard this as unlikely and therefore argue that the solute which formed the vein calcite likely was derived from diffusion from the calcite cement into the fracture. Diffusion of mass from local wall rock into a fracture is a common source of vein material and is promoted by, e.g., chemical and pressure gradients between wall rock and fluid-filled fracture (e.g., Oliver and Bons, 2001, and references therein; Bons et al., 2012, and references therein). In addition, calcite is highly susceptible to pressure solution (e.g., Croizé et al., 2010; Toussaint et al., 2018), which may further stimulate the availability of diffusive material. It should be noted that the possibility of a later equilibrium between cements and vein through solid state diffusion cannot be fully neglected, as this is a process that is poorly understood at low temperatures, though experiments point towards an unlikely mechanism (Fisler and Cygan, 1999; Gorski and Fantle, 2017).
If true, i.e., diffusion being responsible for the vein calcite formation, this indicates very slow advective fluid circulation. Hence, despite being fractured, the effective permeability of the cementation zone remained low, which may root in poor fracture connectivity. The latter may be a reflection of the predominant parallel-striking veins and their near-vertical dips, causing limited fracture intersections (Fig. 2).
The integration of the analyses of our sample suits sheds light on the fluid flow evolution along the Dombjerg Fault since its syn- to late-rift stage activity. Within the fault, a well-connected fracture network existed at the late stage of fault activity allowing upward flow of metamorphic fluids (Fig. 13a), as evident by the dolomite vein network. At depth, these fluids may have been drawn into the highly fractured fault, where thermal-driven upward flow occurred. Presumably, such networks existed repeatedly in the course of the faults activity. Towards the end of its activity, the fault became sealed to deep fluid circulation, as indicated by the less-pronounced, low-temperature calcite vein network postdating the prominent dolomite vein network.
In the hanging wall, fluid advection followed the common model of groundwater flow in coastal aquifers, with the distinction that thermal-driven upward flow occurred within the sediments along the fault and low-permeable footwall rock (Figs. 12, 13). The cementation zone formed quickly after the deposition of its hosting sediments of the Lindemans Bugt Formation (Fig. 13b), with a formation temperature around 30–70 ∘C at a depth <1 km (Fig. 11). While the calcium for the calcite formation derived from advective fluid transport, CO2 likely has a component of local formation. Once formed, the cementation zone acts as a low-permeable body and redirects fluid advection in the hanging wall towards the distal parts of the basin, which may in turn be a contributor of the cementation growth farther away from the fault (Fig. 13c). Fractures and veins within the cementation zone formed predominantly in the post-rift stage (Fig. 13d) at temperatures around 30–80 ∘C and might reflect an extensional period during the Aptian to Turonian that has not been identified in the Wollaston Forland before. However, the fracture network did not significantly increase the permeability of the cementation zone. At continental break-up and extrusion of flood basalts in the early Eocene, the marine basin was drained allowing meteoric water to infiltrate the basin and fractures within the cemented clastics (Fig. 13e).
This study highlights the effect of rift faulting on early sediment diagenesis and shows that clastic sediments can become lithified quickly after their deposition. This has an immediate effect on the style of damage zone evolution, as it inhibits the growth of a damage zone featuring deformation bands that would normally be expected to form in porous sediments. Instead, a fracture-dominated damage zone evolves similar to a hard-rock hosted fault. Depending on the degree of fracturing and fracture connectivity within the cementation zone, two separate, decoupled fluid circulation systems may form: one within the uncemented fault-distal sediments and one within the fractured fault zone. This may have an important impact on potential mixing with fluids from under- or overlying reservoirs that are tapped by the fault.
In the management of fault-dependent subsurface aquifers/reservoirs for petroleum, groundwater, or geothermal resources, and in CO2 storage sites, it is important to be aware that, in the presence of a fault-proximal cementation zone such as the one studied here, permeability and fluid flow in the vicinity of the fault may be greatly reduced. We therefore suggest that the possibility of this type of diagenetic seal should be incorporated in fault seal analyses.
Replicate-level raw data of the clumped isotope analysis are available on the EarthChem database (https://doi.org/10.26022/IEDA/111602, Salomon, 2020).
The supplement related to this article is available online at: https://doi.org/10.5194/se-11-1987-2020-supplement.
ES, AR, TBK, SAG, and GAH conducted the field data collection and rock sampling, ANM and ES operated the clumped isotope analysis, AG and RA conducted the U–Pb analysis, and ES conducted the optical and microprobe analyses. All authors were involved in the data analysis and contributed to the manuscript writing.
The authors declare that they have no conflict of interest.
This article is part of the special issue “Faults, fractures, and fluid flow in the shallow crust”. It is not associated with a conference.
Arild Andresen is thanked for giving support in planning and providing equipment for the field campaign. Sevasti Eleni Modestou and Enver Alagoz are thanked for support in running the mass spectrometer for the clumped isotope analysis at University of Bergen. Muriel Erambert is thanked for support and setting up the electron microprobe data collection at University of Oslo. Very constructive reviews by Cathy Hollis and an anonymous reviewer are gratefully acknowledged and helped to improve this contribution. Roger Soliva is thanked for editorial handling. Michael Joachimski and Luca Caracciolo are thanked for helpful discussions and Billy Andrews for further comments. The Ministry of Environment and Nature and the Mineral License and Safety Authority of the government of Greenland are thanked for allowing access to the Northeast Greenland National Park for fieldwork conducted under KNNO expedition permit C-18-56 and Scientific Survey License VU-00141. Axel Gerdes and Richard Albert would like to acknowledge this paper as FIERCE contribution no. 43. This study was conducted as part of the ARCEx project.
This research has been supported by the Research Council of Norway (grant no. 228107).
This paper was edited by Roger Soliva and reviewed by two anonymous referees.
Bernasconi, S. M., Hu, B., Wacker, U., Fiebig, J., Breitenbach, S. F. M., and Rutz, T.: Background effects on Faraday collectors in gas-source mass spectrometry and implications for clumped isotope measurements, Rapid Commun. Mass Sp., RCM, 27, 603–612, https://doi.org/10.1002/rcm.6490, 2013. a
Bernasconi, S. M., Müller, I. A., Bergmann, K. D., Breitenbach, S. F. M., Fernandez, A., Hodell, D. A., Jaggi, M., Meckler, A. N., Millan, I., and Ziegler, M.: Reducing Uncertainties in Carbonate Clumped Isotope Analysis Through Consistent Carbonate-Based Standardization, Geochem. Geophy. Geosy., 19, 2895–2914, https://doi.org/10.1029/2017gc007385, 2018. a, b
Bons, P. D., Elburg, M. A., and Gomez-Rivas, E.: A review of the formation of tectonic veins and their microstructures, J. Struct. Geol., 43, 33–62, https://doi.org/10.1016/j.jsg.2012.07.005, 2012. a
Brace, W. F.: Permeability of crystalline and argillaceous rocks, Int. J. Rock Mech. Min., 17, 241–251, https://doi.org/10.1016/0148-9062(80)90807-4, 1980. a
Chéry, J., Lucazeau, F., Daignières, M., and Vilotte, J. P.: Large uplift of rift flanks: A genetic link with lithospheric rigidity?, Earth Planet. Sc. Lett., 112, 195–211, https://doi.org/10.1016/0012-821X(92)90016-O, 1992. a
Christiansen, F., Larsen, H., Marcussen, C., Hansen, K., and Krabbe, H.: Uplift study of the Jameson Land basin, East Greenland, Norsk Geologisk Tidsskrift, 72, 291–294, 1992. a
Clark, I. D. and Fritz, P.: Environmental Isotopes in Hydrogeology, CRC Press, Boca Raton, 342 pp., 1997. a
Cooper, H., Kohout, F., Henry, H., and Glover, R.: Sea Water in Coastal Aquifers, Tech. rep., US Government Printing Office, Washington, DC, 84 pp., 1964. a
Cooper, H. H.: A hypothesis concerning the dynamic balance of fresh water and salt water in a coastal aquifer, J. Geophys. Res., 64, 461–467, https://doi.org/10.1029/JZ064i004p00461, 1959. a
Corti, G., van Wijk, J., Cloetingh, S., and Morley, C. K.: Tectonic inheritance and continental rift architecture: Numerical and analogue models of the East African Rift system, Tectonics, 26, 13 pp., https://doi.org/10.1029/2006TC002086, 2007. a
Croizé, D., Renard, F., Bjørlykke, K., and Dysthe, D. K.: Experimental calcite dissolution under stress: Evolution of grain contact microstructure during pressure solution creep, J. Geophys. Res., 115, 15 pp., https://doi.org/10.1029/2010JB000869, 2010. a
Cumberland, S. A., Douglas, G., Grice, K., and Moreau, J. W.: Uranium mobility in organic matter-rich sediments: A review of geological and geochemical processes, Earth-Sci. Rev., 159, 160–185, https://doi.org/10.1016/j.earscirev.2016.05.010, 2016. a
Dalland, A.: Mesozoic sedimentary succession at Andøy, northern Norway, and relation to structural development of the North Atlantic area, in: Geology of the North Atlantic Borderlands, Canadian Society of Petroleum Geologists Memoir, 563–584, 1981. a
Dennis, K. J., Affek, H. P., Passey, B. H., Schrag, D. P., and Eiler, J. M.: Defining an absolute reference frame for `clumped' isotope studies of CO2, Geochim. Cosmochim. Ac., 75, 7117–7131, https://doi.org/10.1016/j.gca.2011.09.025, 2011. a
Ebinger, C. J., Jackson, J. A., Foster, A. N., and Hayward, N. J.: Extensional basin geometry and the elastic lithosphere, Philos. T. R. Soc. Lond. Ser. A, 357, 741–765, https://doi.org/10.1098/rsta.1999.0351, 1999. a
Eiler, J. M.: Paleoclimate reconstruction using carbonate clumped isotope thermometry, Quaternary Sci. Rev., 30, 3575–3588, https://doi.org/10.1016/j.quascirev.2011.09.001, 2011. a
Fisler, D. K. and Cygan, R. T.: Diffusion of Ca and Mg in calcite, Am. Mineral., 84, 1392–1399, https://doi.org/10.2138/am-1999-0917, 1999. a
Gawthorpe, R. L. and Leeder, M. R.: Tectono-sedimentary evolution of active extensional basins, Basin Res., 12, 195–218, https://doi.org/10.1046/j.1365-2117.2000.00121.x, 2000. a, b
Gawthorpe, R. L., Fraser, A. J., and Collier, R. E.: Sequence stratigraphy in active extensional basins: implications for the interpretation of ancient basin-fills, Mar. Petrol. Geol., 11, 642–658, https://doi.org/10.1016/0264-8172(94)90021-3, 1994. a
Gorski, C. A. and Fantle, M. S.: Stable mineral recrystallization in low temperature aqueous systems: A critical review, Geochim. Cosmochim. Ac., 198, 439–465, https://doi.org/10.1016/j.gca.2016.11.013, 2017. a
Gradstein, F. M., Ogg, J. G., Schmitz, M. D., and Ogg, G. M.: The geologic time scale 2012, Elsevier, Amsterdam and Boston, 1st Edn., 1176 pp., 2012. a
Harwood, J., Aplin, A. C., Fialips, C. I., Iliffe, J. E., Kozdon, R., Ushikubo, T., and Valley, J. W.: Quartz Cementation History of Sandstones Revealed By High-Resolution Sims Oxygen Isotope Analysis, J. Sediment. Res., 83, 522–530, https://doi.org/10.2110/jsr.2013.29, 2013. a
Henkes, G. A., Passey, B. H., Grossman, E. L., Shenton, B. J., Pérez-Huerta, A., and Yancey, T. E.: Temperature limits for preservation of primary calcite clumped isotope paleotemperatures, Geochim. Cosmochim. Ac., 139, 362–382, https://doi.org/10.1016/j.gca.2014.04.040, 2014. a
Henriksen, N.: Caledonian Orogen East Greenland 70–82∘ N, Geological map 1:100 000, Tech. rep., GEUS, Copenhagen, Greenland, p. 1, 2003. a
Henstra, G. A., Grundvåg, S.-A., Johannessen, E. P., Kristensen, T. B., Midtkandal, I., Nystuen, J. P., Rotevatn, A., Surlyk, F., Sæther, T., and Windelstad, J.: Depositional processes and stratigraphic architecture within a coarse-grained rift-margin turbidite system: The Wollaston Forland Group, east Greenland, Mar. Petrol. Geol., 76, 187–209, https://doi.org/10.1016/j.marpetgeo.2016.05.018, 2016. a, b, c, d, e, f, g, h, i, j, k, l, m, n
Henstra, G. A., Gawthorpe, R. L., Helland-Hansen, W., Ravnås, R., and Rotevatn, A.: Depositional systems in multiphase rifts: seismic case study from the Lofoten margin, Norway, Basin Res., 29, 447–469, https://doi.org/10.1111/bre.12183, 2017. a
Hollinsworth, A. D., Koehn, D., Dempster, T. J., and Aanyu, K.: Structural controls on the interaction between basin fluids and a rift flank fault: Constraints from the Bwamba Fault, East African Rift, J. Struct. Geol., 118, 236–249, https://doi.org/10.1016/j.jsg.2018.10.012, 2019. a, b
Hollis, C., Bastesen, E., Boyce, A., Corlett, H., Gawthorpe, R., Hirani, J., Rotevatn, A., and Whitaker, F.: Fault-controlled dolomitization in a rift basin, Geology, 45, 219–222, https://doi.org/10.1130/G38s394.1, 2017. a
Horita, J.: Oxygen and carbon isotope fractionation in the system dolomite–water–CO2 to elevated temperatures, Geochim. Cosmochim. Ac., 129, 111–124, https://doi.org/10.1016/j.gca.2013.12.027, 2014. a
Houben, G. J., Stoeckl, L., Mariner, K. E., and Choudhury, A. S.: The influence of heterogeneity on coastal groundwater flow - physical and numerical modeling of fringing reefs, dykes and structured conductivity fields, Adv. Water Resour., 113, 155–166, https://doi.org/10.1016/j.advwatres.2017.11.024, 2018. a
Indrevær, K., Stunitz, H., and Bergh, S. G.: On Palaeozoic–Mesozoic brittle normal faults along the SW Barents Sea margin: fault processes and implications for basement permeability and margin evolution, J. Geol. Soc., 171, 831–846, https://doi.org/10.1144/jgs2014-018, 2014. a
Jiao, J. and Post, V.: Coastal hydrogeology, Cambridge University Press, Cambridge, 403 pp., 2019. a, b, c, d
John, C. M. and Bowen, D.: Community software for challenging isotope analysis: First applications of “Easotope” to clumped isotopes, Rapid communications in mass spectrometry, RCM, 30, 2285–2300, https://doi.org/10.1002/rcm.7720, 2016. a
Jørgensen, B. B. and Kasten, S.: Sulfur Cycling and Methane Oxidation, in: Marine Geochemistry, edited by: Schulz, H. D. and Zabel, M., Springer-Verlag Berlin Heidelberg, Berlin, Heidelberg, 271–309, https://doi.org/10.1007/3-540-32144-6_8, 2006. a
Karolytė, R., Johnson, G., Yielding, G., and Gilfillan, S. M.: Fault seal modelling – the influence of fluid properties on fault sealing capacity in hydrocarbon and CO2 systems, Petroleum Geoscience, 26, 481–497, https://doi.org/10.1144/petgeo2019-126, 2020. a
Kele, S., Breitenbach, S. F., Capezzuoli, E., Meckler, A. N., Ziegler, M., Millan, I. M., Kluge, T., Deák, J., Hanselmann, K., John, C. M., Yan, H., Liu, Z., and Bernasconi, S. M.: Temperature dependence of oxygen- and clumped isotope fractionation in carbonates: A study of travertines and tufas in the 6–95 ∘C temperature range, Geochim. Cosmochim. Ac., 168, 172–192, https://doi.org/10.1016/j.gca.2015.06.032, 2015. a
Kim, S.-T. and O'Neil, J. R.: Equilibrium and nonequilibrium oxygen isotope effects in synthetic carbonates, Geochim. Cosmochim. Ac., 61, 3461–3475, https://doi.org/10.1016/S0016-7037(97)00169-5, 1997. a
Kristensen, T. B., Rotevatn, A., Peacock, D. C., Henstra, G. A., Midtkandal, I., and Grundvåg, S.-A.: Structure and flow properties of syn-rift border faults: The interplay between fault damage and fault-related chemical alteration (Dombjerg Fault, Wollaston Forland, NE Greenland), J. Struct. Geol., 92, 99–115, https://doi.org/10.1016/j.jsg.2016.09.012, 2016. a, b, c, d, e, f, g, h, i, j, k, l
Lander, R. H. and Walderhaug, O.: Predicting Porosity through Simulating Sandstone Compaction and Quartz Cementation, AAPG Bulletin, 433–449, https://doi.org/10.1306/00AA9BC4-1730-11D7-8645000102C1865D, 1999. a
Lander, R. H., Larese, R. E., and Bonnell, L. M.: Toward more accurate quartz cement models: The importance of euhedral versus noneuhedral growth rates, AAPG Bull., 92, 1537–1563, https://doi.org/10.1306/07160808037, 2008. a
Larsen, L. M., Pedersen, A. K., Tegner, C., and Duncan, R. A.: Eocene to Miocene igneous activity in NE Greenland: northward younging of magmatism along the East Greenland margin, J. Geol. Soc., 171, 539–553, https://doi.org/10.1144/jgs2013-118, 2014. a, b
Larsen, L. M. and Watt, W. S.: Episodic volcanism during break-up of the North Atlantic: evidence from the East Greenland plateau basalts, Earth Planet. Sc. Lett., 73, 105–116, https://doi.org/10.1016/0012-821X(85)90038-X, 1985. a
LeGrande, A. N. and Schmidt, G. A.: Global gridded data set of the oxygen isotopic composition in seawater, Geophys. Res. Lett., 33, 5, https://doi.org/10.1029/2006GL026011, 2006. a
Lloyd, M. K., Ryb, U., and Eiler, J. M.: Experimental calibration of clumped isotope reordering in dolomite, Geochim. Cosmochim. Ac., 242, 1–20, https://doi.org/10.1016/j.gca.2018.08.036, 2018. a, b
López, D. L. and Smith, L.: Fluid flow in fault zones: Influence of hydraulic anisotropy and heterogeneity on the fluid flow and heat transfer regime, Water Resour. Res., 32, 3227–3235, https://doi.org/10.1029/96WR02101, 1996. a, b
McBride, E. F. and Milliken, K. L.: Giant calcite-cemented concretions, Dakota Formation, central Kansas, USA, Sedimentology, 53, 1161–1179, https://doi.org/10.1111/j.1365-3091.2006.00813.x, 2006. a
Meckler, A. N., Ziegler, M., Millán, M. I., Breitenbach, S. F. M., and Bernasconi, S. M.: Long-term performance of the Kiel carbonate device with a new correction scheme for clumped isotope measurements, Rapid Commun. Mass S., 28, 1705–1715, https://doi.org/10.1002/rcm.6949, 2014. a
Meinicke, N., Ho, S. L., Hannisdal, B., Nürnberg, D., Tripati, A., Schiebel, R., and Meckler, A. N.: A robust calibration of the clumped isotopes to temperature relationship for foraminifers, Geochim. Cosmochim. Ac., 270, 160–183, https://doi.org/10.1016/j.gca.2019.11.022, 2020. a
Mjelde, R., Breivik, A. J., Raum, T., Mittelstaedt, E., Ito, G., and Faleide, J. I.: Magmatic and tectonic evolution of the North Atlantic, J. Geol. Soc., 165, 31–42, https://doi.org/10.1144/0016-76492007-018, 2008. a
Moore, C. H. and Wade, W. J.: Carbonate reservoirs: Porosity and diagenesis in a sequence stratigraphic framework, Vol. 67, Developments in sedimentology, Elsevier, Amsterdam, 2 Edn., 392 pp., 2013. a
Morad, S. (Ed.): Carbonate cementation in sandstones: Distribution patterns and geochemical evolution, Vol. 26, The international association of sedimentologists special publication, Blackwell Science, [S.l.], 511 pp., 1998. a
Morley, C. K.: Developments in the structural geology of rifts over the last decade and their impact on hydrocarbon exploration, Geol. Soc. Lond. Sp. Publ., 80, 1–32, https://doi.org/10.1144/GSL.SP.1995.080.01.01, 1995. a
Müller, I. A., Rodriguez-Blanco, J. D., Storck, J.-C., do Nascimento, G. S., Bontognali, T. R., Vasconcelos, C., Benning, L. G., and Bernasconi, S. M.: Calibration of the oxygen and clumped isotope thermometers for (proto-)dolomite based on synthetic and natural carbonates, Chem. Geol., 525, 1–17, https://doi.org/10.1016/j.chemgeo.2019.07.014, 2019. a
Nøhr-Hansen, H.: Dinoflagellate cyst stratigraphy of the Barremian to Albian, Lower Cretaceous, North-East Greenland, Grønlands Geologiske Undersøgelse, 1–171, 1993. a
O'Brien, C. L., Robinson, S. A., Pancost, R. D., Sinninghe Damsté, J. S., Schouten, S., Lunt, D. J., Alsenz, H., Bornemann, A., Bottini, C., Brassell, S. C., Farnsworth, A., Forster, A., Huber, B. T., Inglis, G. N., Jenkyns, H. C., Linnert, C., Littler, K., Markwick, P., McAnena, A., Mutterlose, J., Naafs, B. D. A., Püttmann, W., Sluijs, A., van Helmond, N. A., Vellekoop, J., Wagner, T., and Wrobel, N. E.: Cretaceous sea-surface temperature evolution: Constraints from TEX 86 and planktonic foraminiferal oxygen isotopes, Earth-Sci. Rev., 172, 224–247, https://doi.org/10.1016/j.earscirev.2017.07.012, 2017. a
Oliver, N. H. S. and Bons, P. D.: Mechanisms of fluid flow and fluid-rock interaction in fossil metamorphic hydrothermal systems inferred from vein-wallrock patterns, geometry and microstructure, Geofluids, 1, 137–162, https://doi.org/10.1046/j.1468-8123.2001.00013.x, 2001. a
Passey, B. H. and Henkes, G. A.: Carbonate clumped isotope bond reordering and geospeedometry, Earth Planet. Sc. Lett., 351-352, 223–236, https://doi.org/10.1016/j.epsl.2012.07.021, 2012. a, b
Pauly, S., Mutterlose, J., and Alsen, P.: Depositional environments of Lower Cretaceous (Ryazanian–Barremian) sediments from Wollaston Forland and Kuhn Ø, North-East Greenland, Bull. Geol. Soc. Denmark, 61, 19–36, 2013. a
Phillips, T. B., Jackson, C. A.-L., Bell, R. E., Duffy, O. B., and Fossen, H.: Reactivation of intrabasement structures during rifting: A case study from offshore southern Norway, J. Struct. Geol., 91, 54–73, https://doi.org/10.1016/j.jsg.2016.08.008, 2016. a
Piasecki, A., Bernasconi, S. M., Grauel, A.-L., Hannisdal, B., Ho, S. L., Leutert, T. J., Marchitto, T. M., Meinicke, N., Tisserand, A., and Meckler, N.: Application of Clumped Isotope Thermometry to Benthic Foraminifera, Geochem. Geophy. Geosy., 20, 2082–2090, https://doi.org/10.1029/2018GC007961, 2019. a
Price, G. D. and Nunn, E. V.: Valanginian isotope variation in glendonites and belemnites from Arctic Svalbard: Transient glacial temperatures during the Cretaceous greenhouse, Geology, 38, 251–254, https://doi.org/10.1130/G30593.1, 2010. a
Price, G. D., Bajnai, D., and Fiebig, J.: Carbonate clumped isotope evidence for latitudinal seawater temperature gradients and the oxygen isotope composition of Early Cretaceous seas, Palaeogeogr. Palaeocl., 552, 109777, https://doi.org/10.1016/j.palaeo.2020.109777, 2020. a
Prosser, S.: Rift-related linked depositional systems and their seismic expression, Geol. Soc. Lond. Spec. Publ., 71, 35–66, https://doi.org/10.1144/GSL.SP.1993.071.01.03, 1993. a
Ring, U.: The influence of preexisting structure on the evolution of the Cenozoic Malawi rift (East African rift system), Tectonics, 13, 313–326, https://doi.org/10.1029/93TC03188, 1994. a
Rotevatn, A., Kristensen, T. B., Ksienzyk, A. K., Wemmer, K., Henstra, G. A., Midtkandal, I., Grundvåg, S.-A., and Andresen, A.: Structural Inheritance and Rapid Rift-Length Establishment in a Multiphase Rift: The East Greenland Rift System and its Caledonian Orogenic Ancestry, Tectonics, 37, 1858–1875, https://doi.org/10.1029/2018TC005018, 2018. a, b, c, d
Saigal, G. C. and Bjørlykke, K.: Carbonate cements in clastic reservoir rocks from offshore Norway – relationships between isotopic composition, textural development and burial depth, Geol. Soc. Lond. Spec. Publ., 36, 313–324, https://doi.org/10.1144/GSL.SP.1987.036.01.22, 1987. a
Salomon, E.: Clumped Isotope Data of NE Greenland samples from Salomon et al., submitted to Solid Earth, Version 1.0, Interdisciplinary Earth Data Alliance (IEDA), https://doi.org/10.26022/IEDA/111602, last access: 30 October 2020. a
Salomon, E., Koehn, D., and Passchier, C.: Brittle reactivation of ductile shear zones in NW Namibia in relation to South Atlantic rifting, Tectonics, 34, 70–85, https://doi.org/10.1002/2014TC003728, 2015. a
Shackleton, N. J. and Kennett, J. P.: Paleotemperature history of the Cenozoic and the initiation of Antarctic glaciation: oxygen and carbon isotopic analyses in DSDP Sites 277, 279 and 281, Initial Reports of Deep Sea Drilling Project, 29, 743–755, 1975. a
Sharp, I. R., Gawthorpe, R. L., Underhill, J. R., and Gupta, S.: Fault-propagation folding in extensional settings: Examples of structural style and synrift sedimentary response from the Suez rift, Sinai, Egypt, Geol. Soc. Am. Bull., 112, 1877–1899, 2000. a
Shenton, B. J., Grossman, E. L., Passey, B. H., Henkes, G. A., Becker, T. P., Laya, J. C., Perez-Huerta, A., Becker, S. P., and Lawson, M.: Clumped isotope thermometry in deeply buried sedimentary carbonates: The effects of bond reordering and recrystallization, Geol. Soc. Am. Bull., 127, 1036–1051, B31169.1, https://doi.org/10.1130/B31169.1, 2015. a
Sheppard, S. M. F.: Characterization and isotopic variations in natural waters, Rev. Mineral. Geochem., 16, 165–183, 1986. a
Sibson, R. H.: Conditions for fault-valve behaviour, Geol. Soc. Lond. Spec. Publ.s, 54, 15–28, https://doi.org/10.1144/GSL.SP.1990.054.01.02, 1990. a
Sperrevik, S., Gillespie, P. A., Fisher, Q. J., Halvorsen, T., and Knipe, R. J.: Empirical estimation of fault rock properties, in: Hydrocarbon seal quantification, edited by: Hunsdale, R. and Koestler, A., Vol. 11, Special publication/Norwegian Petroleum Society, Elsevier, Amsterdam, 109–125, https://doi.org/10.1016/S0928-8937(02)80010-8, 2002. a
Spirakis, C. S.: The roles of organic matter in the formation of uranium deposits in sedimentary rocks, Ore Geol. Rev., 11, 53–69, https://doi.org/10.1016/0169-1368(95)00015-1, 1996. a
Stemmerik, L., Vigran, J. O., and Piasecki, S.: Dating of late Paleozoic rifting events in the North Atlantic: New biostratigraphic data from the uppermost Devonian and Carboniferous of East Greenland, Geology, 19, 218–221, 1991. a
Surlyk, F.: Submarine fan sedimentation along fault scarps on tilted fault blocks (Jurassic-Cretaceous boundary, East Greenland), Vol. 128, Bulletin/Grønlands Geologiske Undersøgelse, Grønlands Geologiske Undersøgelse, Copenhagen, 108 pp., 1978. a, b, c, d
Surlyk, F.: Fan-delta to submarine fan conglomerates of the Volgian-Valanginian Wollaston Foreland Group, East Greeniand, Sedimentology of gravels and conglomerates, in: Sedimentology of Gravels and Conglomerates, Vol. 10, Canadian Society of Petroleum Geology, 359–382, 1984. a, b, c, d
Surlyk, F.: Mid-Mesozoic syn-rift turbidite systems: controls and predictions, in: Correlation in Hydrocarbon Exploration, edited by: Collinson, J. D., Springer Netherlands, Dordrecht, 231–241, https://doi.org/10.1007/978-94-009-1149-9_18, 1989. a
Surlyk, F.: Timing, style and sedimentary evolution of Late Palaeozoic-Mesozoic extensional basins of East Greenland, Geol. Soc. Lond. Spec. Publ., 55, 107–125, https://doi.org/10.1144/GSL.SP.1990.055.01.05, 1990. a
Surlyk, F.: The Jurassic of East Greenland: a sedimentary record of thermal subsidence, onset and culmination of rifting, Geol. Surv. Den. Greenl., 1, 659–722, 2003. a, b, c
Surlyk, F. and Korstgård, J.: Crestal unconformities on an exposed Jurassic tilted fault block, Wollaston Forland, East Greenland as an analogue for buried hydrocarbon traps, Mar. Petrol. Geol., 44, 82–95, https://doi.org/10.1016/j.marpetgeo.2013.03.009, 2013. a, b, c, d, e, f, g, h, i, j, k
Surlyk, F., Hurst, J. M., Piasecki, S., Rolle, F., Scholle, P. A., Stemmerik, L., and Thomsen, E.: The Permian of the Western Margin of the Greenland Sea – A Future Exploration Target, in: Future Petroleum Provinces of the World, Am. Assoc. Petrol. Geol., 40, 629–659, https://doi.org/10.1306/M40454C30, 1986. a
Surlyk, F., Noe-Nygaard, N., and Dam, G.: High and low resolution sequence stratigraphy in lithological prediction – examples from the Mesozoic around the northern North Atlantic, Geological Society, London, Petroleum Geology Conference series, 4, 199–214, https://doi.org/10.1144/0040199, 1993. a
Swart, P. K.: The geochemistry of carbonate diagenesis: The past, present and future, Sedimentology, 62, 1233–1304, https://doi.org/10.1111/sed.12205, 2015. a
Tang, J., Köhler, S. J., and Dietzel, M.: Sr ∕ Ca and 44Ca ∕ 40Ca fractionation during inorganic calcite formation: I. Sr incorporation, Geochim. Cosmochim. Ac., 72, 3718–3732, https://doi.org/10.1016/j.gca.2008.05.031, 2008. a
Taylor, T. R., Giles, M. R., Hathon, L. A., Diggs, T. N., Braunsdorf, N. R., Birbiglia, G. V., Kittridge, M. G., Macaulay, C. I., and Espejo, I. S.: Sandstone diagenesis and reservoir quality prediction: Models, myths, and reality, AAPG Bull., 94, 1093–1132, https://doi.org/10.1306/04211009123, 2010. a
Terzer, S., Wassenaar, L. I., Araguás-Araguás, L. J., and Aggarwal, P. K.: Global isoscapes for δ18O and δ2H in precipitation: improved prediction using regionalized climatic regression models, Hydrol. Earth Syst. Sci., 17, 4713–4728, https://doi.org/10.5194/hess-17-4713-2013, 2013. a
Thomson, K., Green, P. F., Whitham, A. G., Price, S. P., and Underhill, J. R.: New constraints on the thermal history of North-East Greenland from apatite fission-track analysis, Geol. Soc. Am. Bull., 111, 1054–1068, 1999. a
Torsvik, T. H., van der Voo, R., Preeden, U., Mac Niocaill, C., Steinberger, B., Doubrovine, P. V., van Hinsbergen, D. J., Domeier, M., Gaina, C., Tohver, E., Meert, J. G., McCausland, P. J., and Cocks, L. R. M.: Phanerozoic polar wander, palaeogeography and dynamics, Earth-Sci. Rev., 114, 325–368, https://doi.org/10.1016/j.earscirev.2012.06.007, 2012. a
Toussaint, R., Aharonov, E., Koehn, D., Gratier, J.-P., Ebner, M., Baud, P., Rolland, A., and Renard, F.: Stylolites: A review, J. Struct. Geol., 114, 163–195, https://doi.org/10.1016/j.jsg.2018.05.003, 2018. a
van Hinsbergen, D. J. J., de Groot, L. V., van Schaik, S. J., Spakman, W., Bijl, P. K., Sluijs, A., Langereis, C. G., and Brinkhuis, H.: A Paleolatitude Calculator for Paleoclimate Studies, PloS one, 10, e0126946, https://doi.org/10.1371/journal.pone.0126946, 2015. a
Vermeesch, P., Resentini, A., and Garzanti, E.: An R package for statistical provenance analysis, Sediment. Geol., 336, 14–25, https://doi.org/10.1016/j.sedgeo.2016.01.009, 2016. a
Walderhaug, O.: Precipitation rates for quartz cement in sandstones determined by fluid-inclusion microthermometry and temperature-history modeling, J. Sediment. Res., 64, 324–333, https://doi.org/10.2110/jsr.64.324, 1994. a
Walderhaug, O.: Kinetic Modeling of Quartz Cementation and Porosity Loss in Deeply Buried Sandstone Reservoirs, Geology, 80, 731–745, https://doi.org/10.1306/64ED88A4-1724-11D7-8645000102C1865D, 1996. a
Walderhaug, O.: Modeling Quartz Cementation and Porosity in Middle Jurassic Brent Group Sandstones of the Kvitebjørn Field, Northern North Sea, Geology, 84, 1325–1339, https://doi.org/10.1306/A9673E96-1738-11D7-8645000102C1865D, 2000. a
Wernicke, B.: Uniform-sense normal simple shear of the continental lithosphere, Can. J. Earth Sci., 22, 108–125, https://doi.org/10.1139/e85-009, 1985. a
Whipp, P. S., Jackson, C. A.-L., Gawthorpe, R. L., Dreyer, T., and Quinn, D.: Normal fault array evolution above a reactivated rift fabric; a subsurface example from the northern Horda Platform, Norwegian North Sea, Basin Res., 26, 523–549, https://doi.org/10.1111/bre.12050, 2014. a
Whitham, A. G., Price, S. P., Koraini, A. M., and Kelly, S. R. A.: Cretaceous (post-Valanginian) sedimentation and rift events in NE Greenland (71–77∘ N), Geological Society, London, Petroleum Geology Conference series, 5, 325–336, https://doi.org/10.1144/0050325, 1999. a
Wilson, A. M.: Fresh and saline groundwater discharge to the ocean: A regional perspective, Water Resour. Res., 41, W02016, https://doi.org/10.1029/2004WR003399, 2005. a
Worden, R. H., Morrall, G. T., Kelly, S., Mc Ardle, P., and Barshep, D. V.: A renewed look at calcite cement in marine-deltaic sandstones: the Brent Reservoir, Heather Field, northern North Sea, UK, Geol. Soc. Lond. Spec. Publ., 484, 305–335, https://doi.org/10.1144/SP484-2018-43, 2019. a
Yielding, G., Bretan, P., and Freeman, B.: Fault seal calibration: a brief review, Geol. Soc. Lond. Spec. Publ., 347, 243–255, https://doi.org/10.1144/SP347.14, 2010. a
Zhao, C., Hobbs, B. E., Mühlhaus, H. B., Ord, A., and Lin, G.: Convective instability of 3-D fluid-saturated geological fault zones heated from below, Geophys. J. Int., 155, 213–220, https://doi.org/10.1046/j.1365-246X.2003.02032.x, 2003. a