the Creative Commons Attribution 4.0 License.
the Creative Commons Attribution 4.0 License.
 | 08 Dec 2020
A 2600-year-long paleoseismic record for the Himalayan Main Frontal Thrust (western Bhutan)
Romain Le Roux-Mallouf
Matthieu Ferry
Rodolphe Cattin
Jean-François Ritz
Dowchu Drukpa
Phuntsho Pelgay
In spite of an increasing number of paleoseismic studies carried out over the last decade along the Himalayan Arc, the chronology of historical and prehistorical earthquakes is still poorly constrained. In this paper, we present geomorphologic and paleoseismic studies conducted over a large river-cut exposure along the Main Fontal Thrust in southwestern Bhutan. The Piping site reveals a 30 m high fault-propagation fold deforming late Holocene alluvial deposits. There, we carried out detailed paleoseismic investigations and built a chronological framework on the basis of 22 detrital charcoal samples submitted to radiocarbon dating. Our analysis reveals the occurrence of at least five large and great earthquakes between 485±125 BCE and 1714 CE with an average recurrence interval of 550±211 years. Coseismic slip values for most events reach at least 12 m and suggest associated magnitudes are in the range of Mw 8.5–9. The cumulative deformation yields an average slip rate of 24.9±10.4 mm yr−1 along the Main Frontal Thrust over the last 2600 years, in agreement with geodetic and geomorphological results obtained nearby.
- Article
(36941 KB) - Full-text XML
-
Supplement
(52573 KB) - BibTeX
- EndNote


The Himalayas, accommodating ∼ 50 % of the India–Eurasia collision at a shortening rate of ∼ 20 mm yr−1 (e.g., Lavé and Avouac, 2000; Ader et al., 2012; Burgess et al., 2012; Marechal et al., 2016), are a region of sustained seismicity as illustrated recently by the 2015 Mw 7.8 Gorkha earthquake in Nepal (e.g., Avouac et al., 2015; Grandin et al., 2015). Instrumental and historical records indicate that similar and significantly larger earthquakes have occurred along the Himalayan Arc since medieval times (e.g., Rajendran and Rajendran, 2005; Sapkota et al., 2013; Yule et al., 2006; Kumar et al., 2010; Bollinger et al., 2014; Hetenyi et al., 2016). Records of earlier events are documented as well from man-made and natural paleoseismic exposures (Fig. 1a) (e.g., Nakata et al., 1998; Upreti et al., 2000; Lavé et al., 2005; Yule et al., 2006; Kumar et al., 2010; Mugnier et al., 2013; Sapkota et al., 2013; Bollinger et al., 2014; Berthet et al., 2014; Rajendran et al., 2015; Mishra et al., 2016; Le Roux-Mallouf et al., 2016; Wesnousky et al., 2017a, b, 2019).
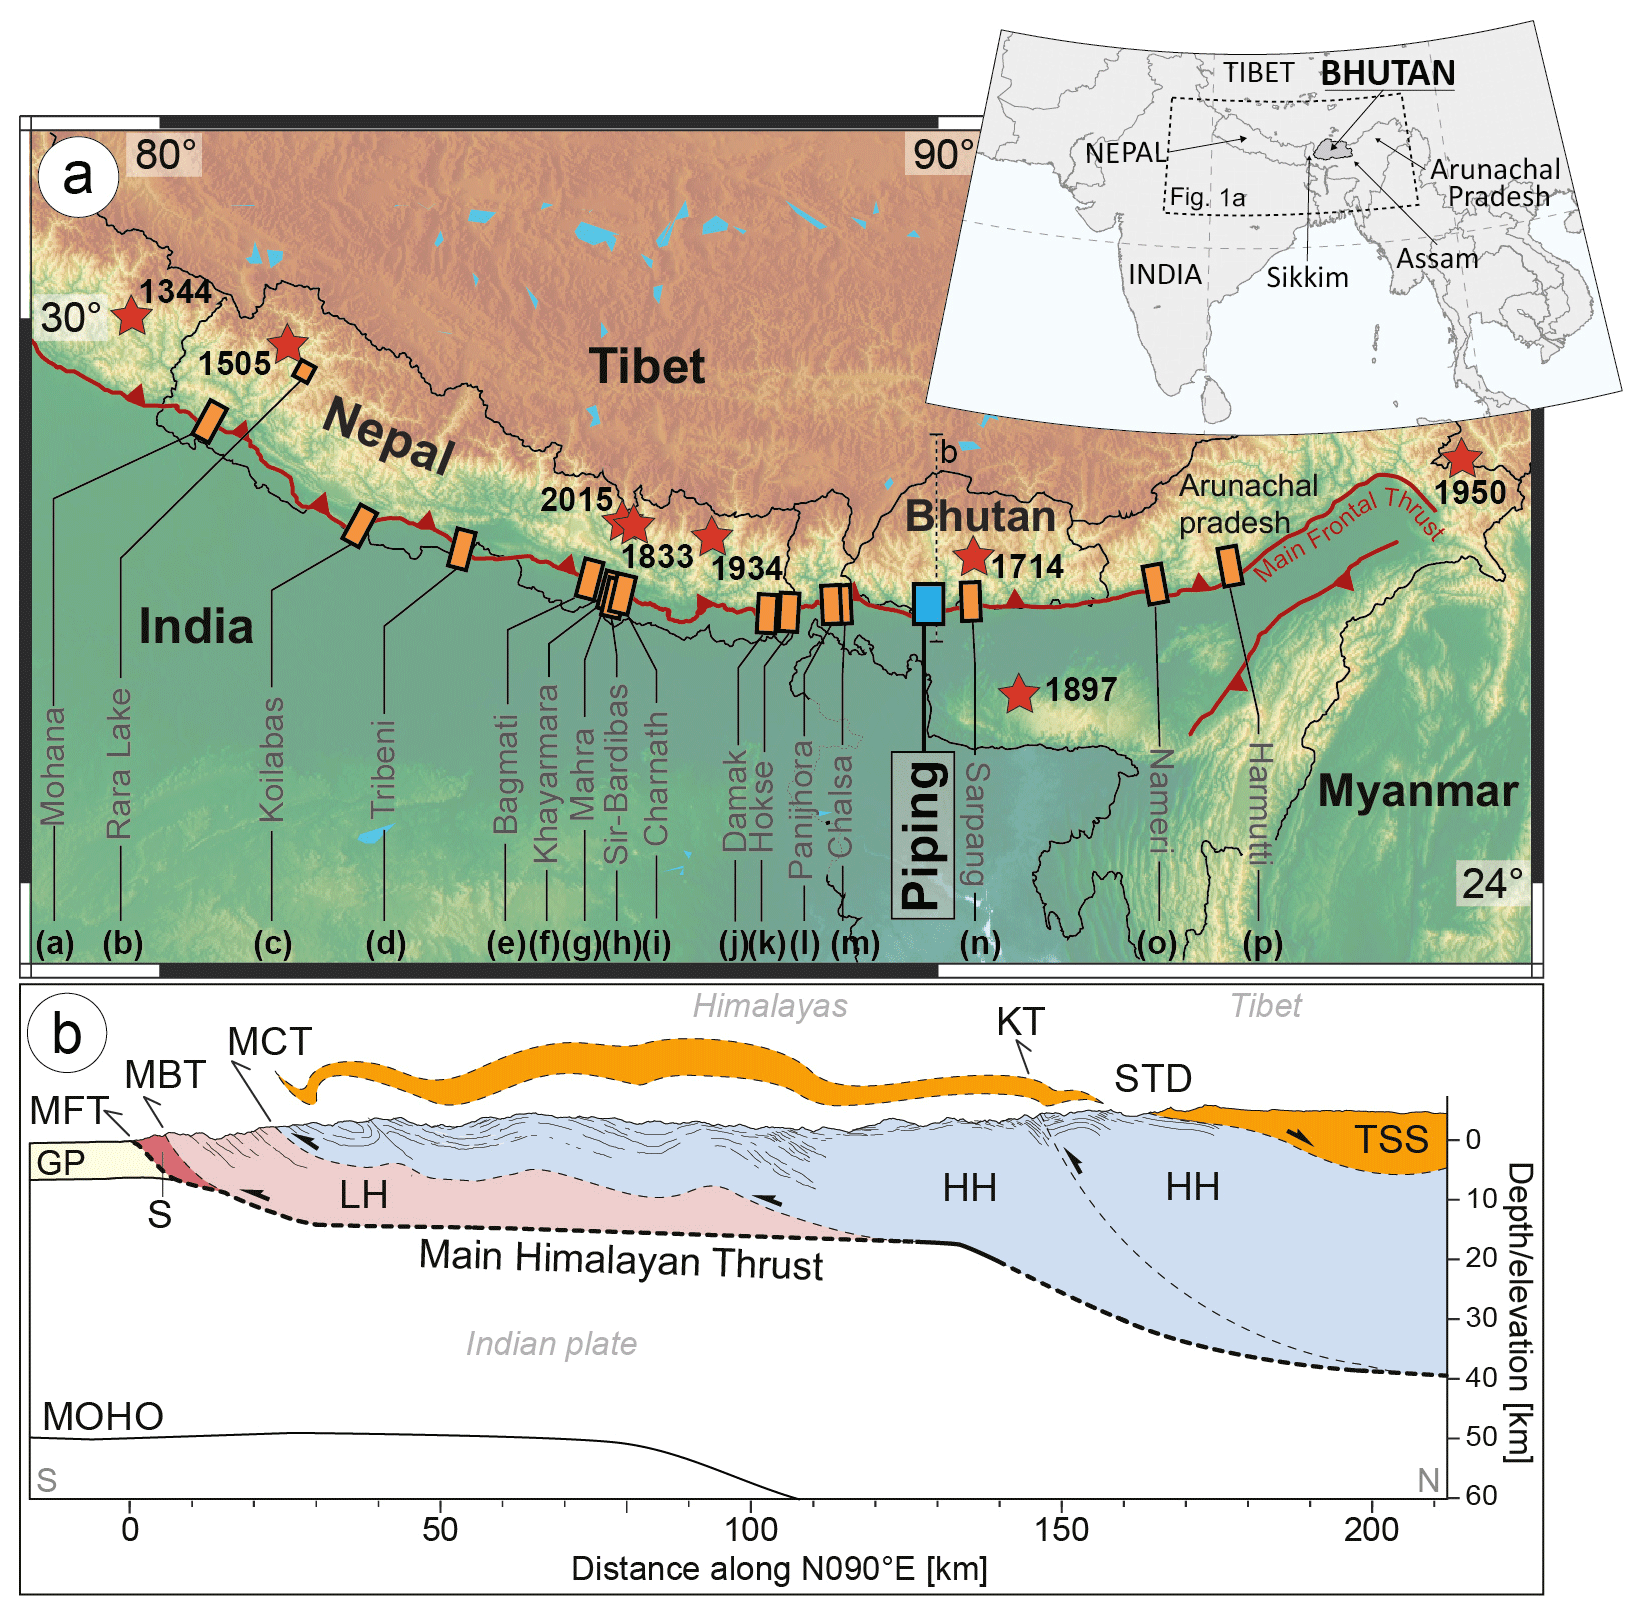
Figure 1Location of the study area and its regional context. Inset shows the location of Bhutan along the Himalayan Arc. (a) Himalayan Arc. Red stars are epicenters of great and large earthquakes from instrumental, historical, and paleoseismic studies. Orange rectangles are previous paleoseismic studies: (a) Mohana Khola (Yule et al., 2006); (b) Rara Lake (Ghazoui et al., 2019); (c) Koilabas Khola (Mugnier et al., 2013); (d, e) Tribeni and Bagmati (Wesnousky et al., 2017a); (f) Khayarmara (Wesnousky et al., 2019); (g) Marha Khola (Lavé et al., 2005); (h) Sir Bardibas (Sapkota et al., 2013; Bollinger et al., 2014); (i) Charnath (Rizza et al., 2019); (j) Damak (Wesnousky et al., 2017b); (k) Hokse (Nakata et al., 1998, Upreti et al., 2000); (l) Panijhora (Mishra et al., 2016); (m) Chalsa (Kumar et al., 2010); (n) Sarpang (Le Roux-Mallouf et al., 2016); (o) Nameri (Kumar et al., 2010); (p) Harmutti (Kumar et al., 2010). The blue rectangle is the location of the paleoseismic study presented in this paper. (b) North–south simplified geological cross section across western Bhutan (modified after Grujic et al., 2011). See Fig. 1a for location; dashed line labeled “b”. Abbreviations are as follows: TSS, Tethyan Sedimentary Sequence; HH, Higher Himalayan; LH, Lesser Himalayan; Sw, Siwaliks sediments; GP, Ganga Plain; STD, Inner South Tibetan Detachment; KT, Kakhtang Thrust; MCT, Main Central Thrust; MBT, Main Boundary Thrust; MFT, Main Frontal Thrust.
A robust estimate of size and recurrence interval needs to extend the time period covered by this catalog of historical events over numerous seismic cycles. With the exception of the study by Bollinger et al. (2014) that yielded five events (and two inferred) from a discontinuous stratigraphic record assembled from four sites, other exposures have only revealed one to two events per site and a total of a dozen distinct events for the ∼ 2500 km long Himalayan Arc. Even the Bollinger et al. (2014) study constitutes a rather short catalog when compared to data available for smaller structures such as the ∼ 1300 km long San Andreas Fault or the ∼ 1000 km long Dead Sea Fault or the North Anatolian Fault (e.g., Meghraoui et al., 2012; Rockwell et al., 2015). This issue is mostly due to the accommodation of a high shortening rate along the frontal thrust faults leading to surface ruptures with vertical offsets of up to 10 m (e.g., Kumar et al., 2010; Le Roux-Mallouf et al., 2016) and an average recurrence interval of 500–1000 years (e.g., Bollinger et al., 2014). Hence, to retrieve long event series, excavations need to reach extraordinarily large dimensions into young unconsolidated deposits, which poses arduous logistics and safety challenges.
In this study, in order to investigate large Himalayan earthquake series, we selected a site in southwestern Bhutan where a ∼ 30 m high natural section is exposed by erosion at the outlet of a trans-Himalayan river called the Wang Chu. After describing the Bhutan Himalaya setting, we present the geomorphological and paleoseismic investigations carried out around and along this exposure. Our results allow us to discuss the timing and the magnitude of five surface-rupturing events that occurred in Bhutan during the last 2600 years.
2.1 Active tectonics in Bhutan
From north to south, Bhutan can be divided into four distinct tectonic units (Fig. 1b): the Tethyan Sedimentary Series (TSS), the Higher Himalaya (HH), the Lesser Himalaya (LH), and the Siwaliks (Sw). All these units are bounded by major faults including the South Tibetan Detachment (STD), the Main Central Thrust (MCT), the Main Boundary Thrust (MBT), and the Main Frontal Thrust (MFT), which is the most recent expression of the thrust sequence that accommodated the deformation over geological timescales (Gansser, 1964; Le Fort, 1975; McQuarrie et al., 2008; Long et al., 2011a). At depth, these four major north-dipping thrust faults connect to the Main Himalayan Thrust (MHT), a mid-crustal decollement under which the Indian plate subducts beneath the Himalayas and Tibet. In terms of geometry, several studies suggest a ramp–flat–ramp geometry of the MHT (e.g., Zhao et al., 1993; Nelson et al., 1996; Cattin and Avouac, 2000; Nábelek et al., 2009; Coutand et al., 2014; Le Roux-Mallouf et al., 2015).
Present-day deformation is constrained by (1) a far-field convergence of 17±0.5 mm yr−1 inferred from geodetic measurements along three profiles across western, central, and eastern Bhutan (Marechal et al., 2016) and (2) a single estimate of Holocene uplift rate of 8.8±2.1 mm yr−1, from the study of alluvial terraces along the front in central Bhutan (Berthet et al., 2014). A first paleoseismic study by Le Roux-Mallouf et al. (2016) suggests that south-central Bhutan has been struck by at least two earthquakes during the last millennium, including (1) a Mw 7.5–8.5 earthquake in central Bhutan that produced ∼ 1 m of coseismic uplift in 1714 CE (see also Hetényi et al., 2016) and (2) a Mw >8.5 earthquake that produced ∼ 8 m of coseismic uplift during medieval times (between 1204 CE and 1464 CE). This last event contributes to the debate about variations in coupling along strike and the possible deficit of seismic moment along the Himalayan Arc (e.g., Bilham et al., 2001; Stevens and Avouac, 2016) and the probability of occurrence of a subduction-type Mw 9 earthquake in this region (Kumar et al., 2010; Mugnier et al., 2013; Srivastava et al., 2013; Stevens and Avouac, 2016; Le Roux-Mallouf et al., 2016; Wesnousky et al., 2017a).
2.2 Geomorphology of the study area
The study site, called Piping, is located in the Lhamoizingkha area (SW Bhutan), immediately upstream of the confluence between the Wang Chu and the Ramphu Chu, a 5 km long tributary that drains a 4.5 km2 watershed (Fig. 2a). There, the MFT crosses the Wang Chu (26.722853∘ N, 89.759980∘ E), and a river-cut exposure reveals geological units and structures (Figs. 2b and 3):
-
the Lesser Himalayan zone-LH (Manas Formation, Neoproterozoic–Cambrian) in the north, composed of quartzite, phyllite, and dolostone (Long et al., 2011a, and references therein) dipping 70–80∘ to the north;
-
the Subhimalayan zone-S (Siwaliks, Miocene-Pliocene), immediately north of the MFT, composed of medium-to-coarse-grained sandstone and pebble-to-cobble conglomeratic sandstone (Long et al., 2011b, and references therein) dipping 50–70∘ to the north and visible over more than 300 m;
-
the Alluvial plain, composed of young unconsolidated sediment.
The MFT separates the flat, mostly undeformed, recent to active deposits of the Alluvial plain to the south from a well-developed 4 km long flight of alluvial terraces deposited by the Wang Chu over the Manas and Siwaliks formations. These terraces are composed of well-stratified cobbles to boulders (dominant lithology is metamorphic from the Manas Formation) with a sandy matrix. Available outcrops display a relatively thin sediment cover (generally less than 6 m) deposited over clear strath surfaces cutting into the Manas and Siwaliks formations. The lower (younger) terraces (T1, T2, and T3) are located directly along the present stream at low elevations (∼ 1, ∼ 11, and ∼ 33 m above the present stream, respectively). T1 and T2 are deposited over the fault trace (Fig. 2a) and display continuous top surfaces suggesting no significant deformation occurred since their deposition. T1 is likely immerged during the monsoon season, as attested by natural and anthropic detritus caught in the low vegetation. Intermediate terraces (T4, T5, and T6) appear as continuous ribbons perched above the present river level at ∼ 43, ∼ 80, and ∼ 90 m, respectively. Finally, higher (older) terraces T8 and T9 are strongly dissected and preserved as thick alluvial sequences (e.g., ∼ 18 m thick for T8) on top of steep buttes forming local heights at ∼ 100 and ∼ 170 m above the present river level, respectively.

Figure 2Geomorphological map of the study area. (a) Geomorphological map of the Main Frontal Thrust, in the Piping area, superimposed on 2 m resolution Pleiades-derived digital elevation model. Alluvial terraces are labeled from T0 (active channel) to T8 (oldest). Camera pictogram indicates the location of the panorama in (b). White star indicates the location of the Piping exposure. Spacing of elevation contours is 20 m. Black dots indicate spot elevations extracted from an in-house Pleiades digital elevation model. (b) Panorama photography (eastward view) of the large-scale Piping site including the southern Piping exposure.
East of the study site, a local watershed basin called Ramphu Chu cuts into the Manas and Siwaliks formations and exits the steep piedmont at the location of the MFT where it forms a 500 m wide alluvial fan (Fig. 2a). The upstream section of the fan was deposited against the main MFT tectonic scarp and over the fault trace as visible on field photographs (Figs. 2b and 3a) and provides the main stratigraphic section studied here to unravel the recent deformation history along the MFT.
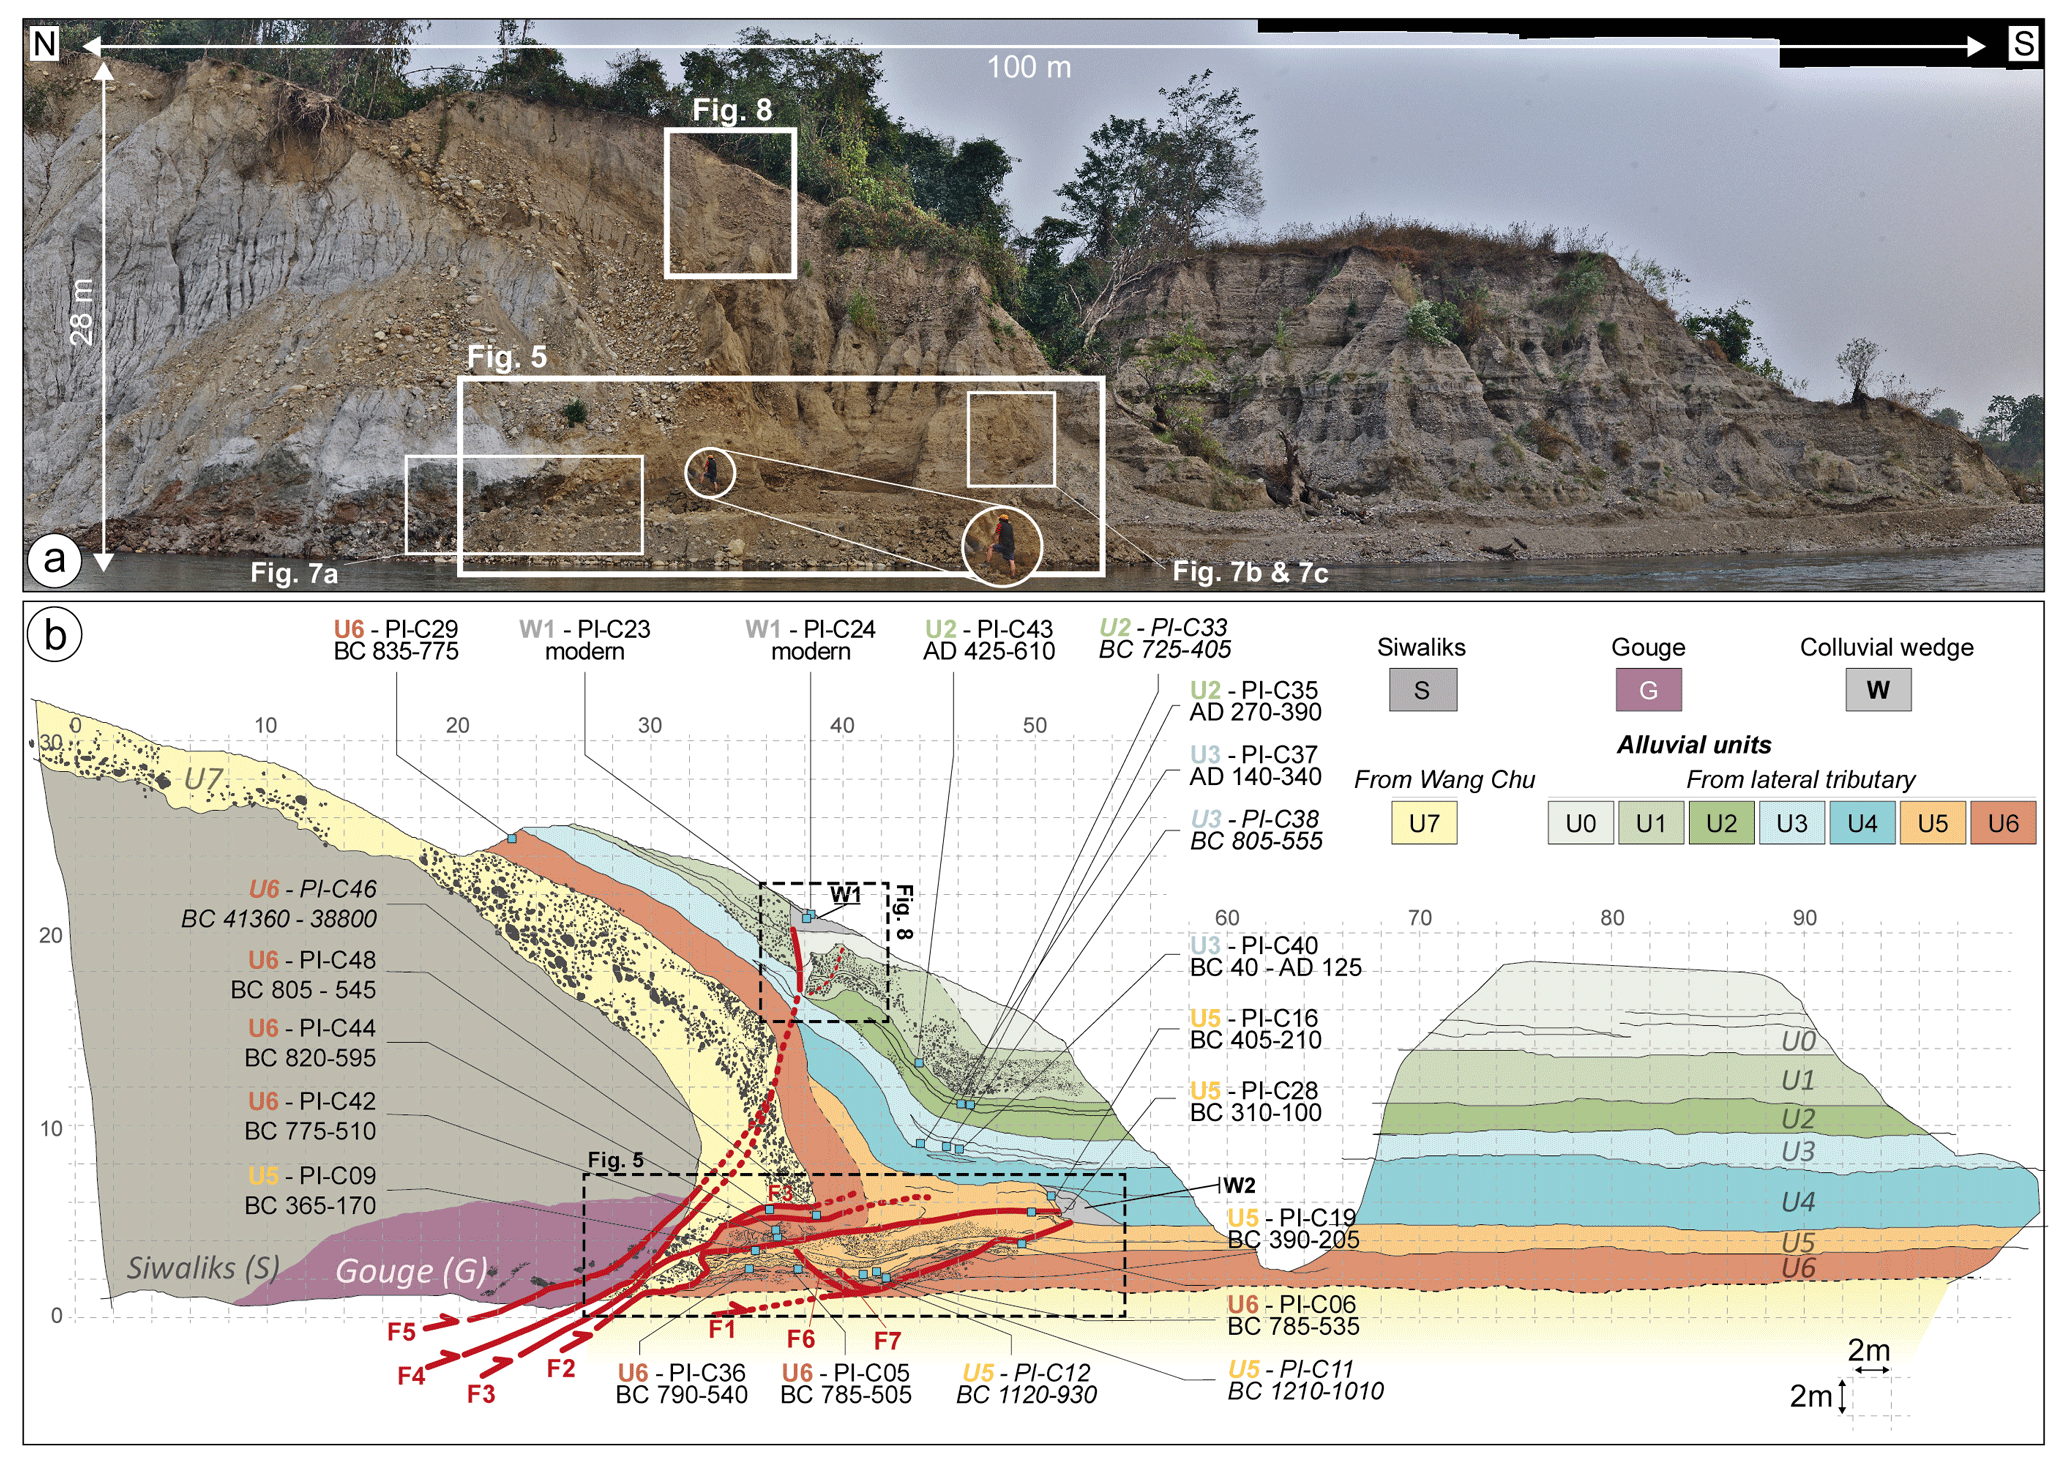
Figure 3Piping paleoseismic exposure. (a) Orthorectified photomosaic of the left bank of the Wang Chu (southernmost section of Fig. 2b) showing the contact between the Siwaliks units (light gray) and Ramphu Chu fan deposits (well-stratified beige to gray units). White rectangles indicate the locations of Figs. 5, 7, and 8. (b) Detailed log over a 2 m grid. Solid and dashed red lines are main faults (certain and suspected, respectively). Blue squares indicate the locations and 2σ-calibrated calendar ages of 22 detrital charcoal samples. Samples in italics were discarded from our analysis (see main text for details). The lower 1.5 m of the exposure is here hidden by the access path built by the backhoe.
An orthorectified photographic mosaic (Fig. 3a) of the site shows the 30 m high river-cut cliff and displays a 40 m wide deformation zone that separates the gray Siwaliks (unit S) to the north, topped by the south-dipping U7 terrace (Wang Chu deposits) from a horizontal 18 m thick sequence of fan deposits (U6 to U0) from the Ramphu Chu. A 50 m long by 30 m high section of the natural exposure was cleaned, partly gridded, and logged in detail (Fig. 3b and Figs. 3, 5, 6, 7, and 8) based on stratigraphy, lithology, and grain size. Overall, 50 samples of organic matter (charcoal and plant debris) were collected, and 22 were selected for radiocarbon age determination (Table 1).
Table 1Accelerator mass spectrometry (AMS) radiocarbon (14C) dates from detrital charcoals collected from the Piping exposure. Samples in italics were discarded from our analysis (see main text for details).
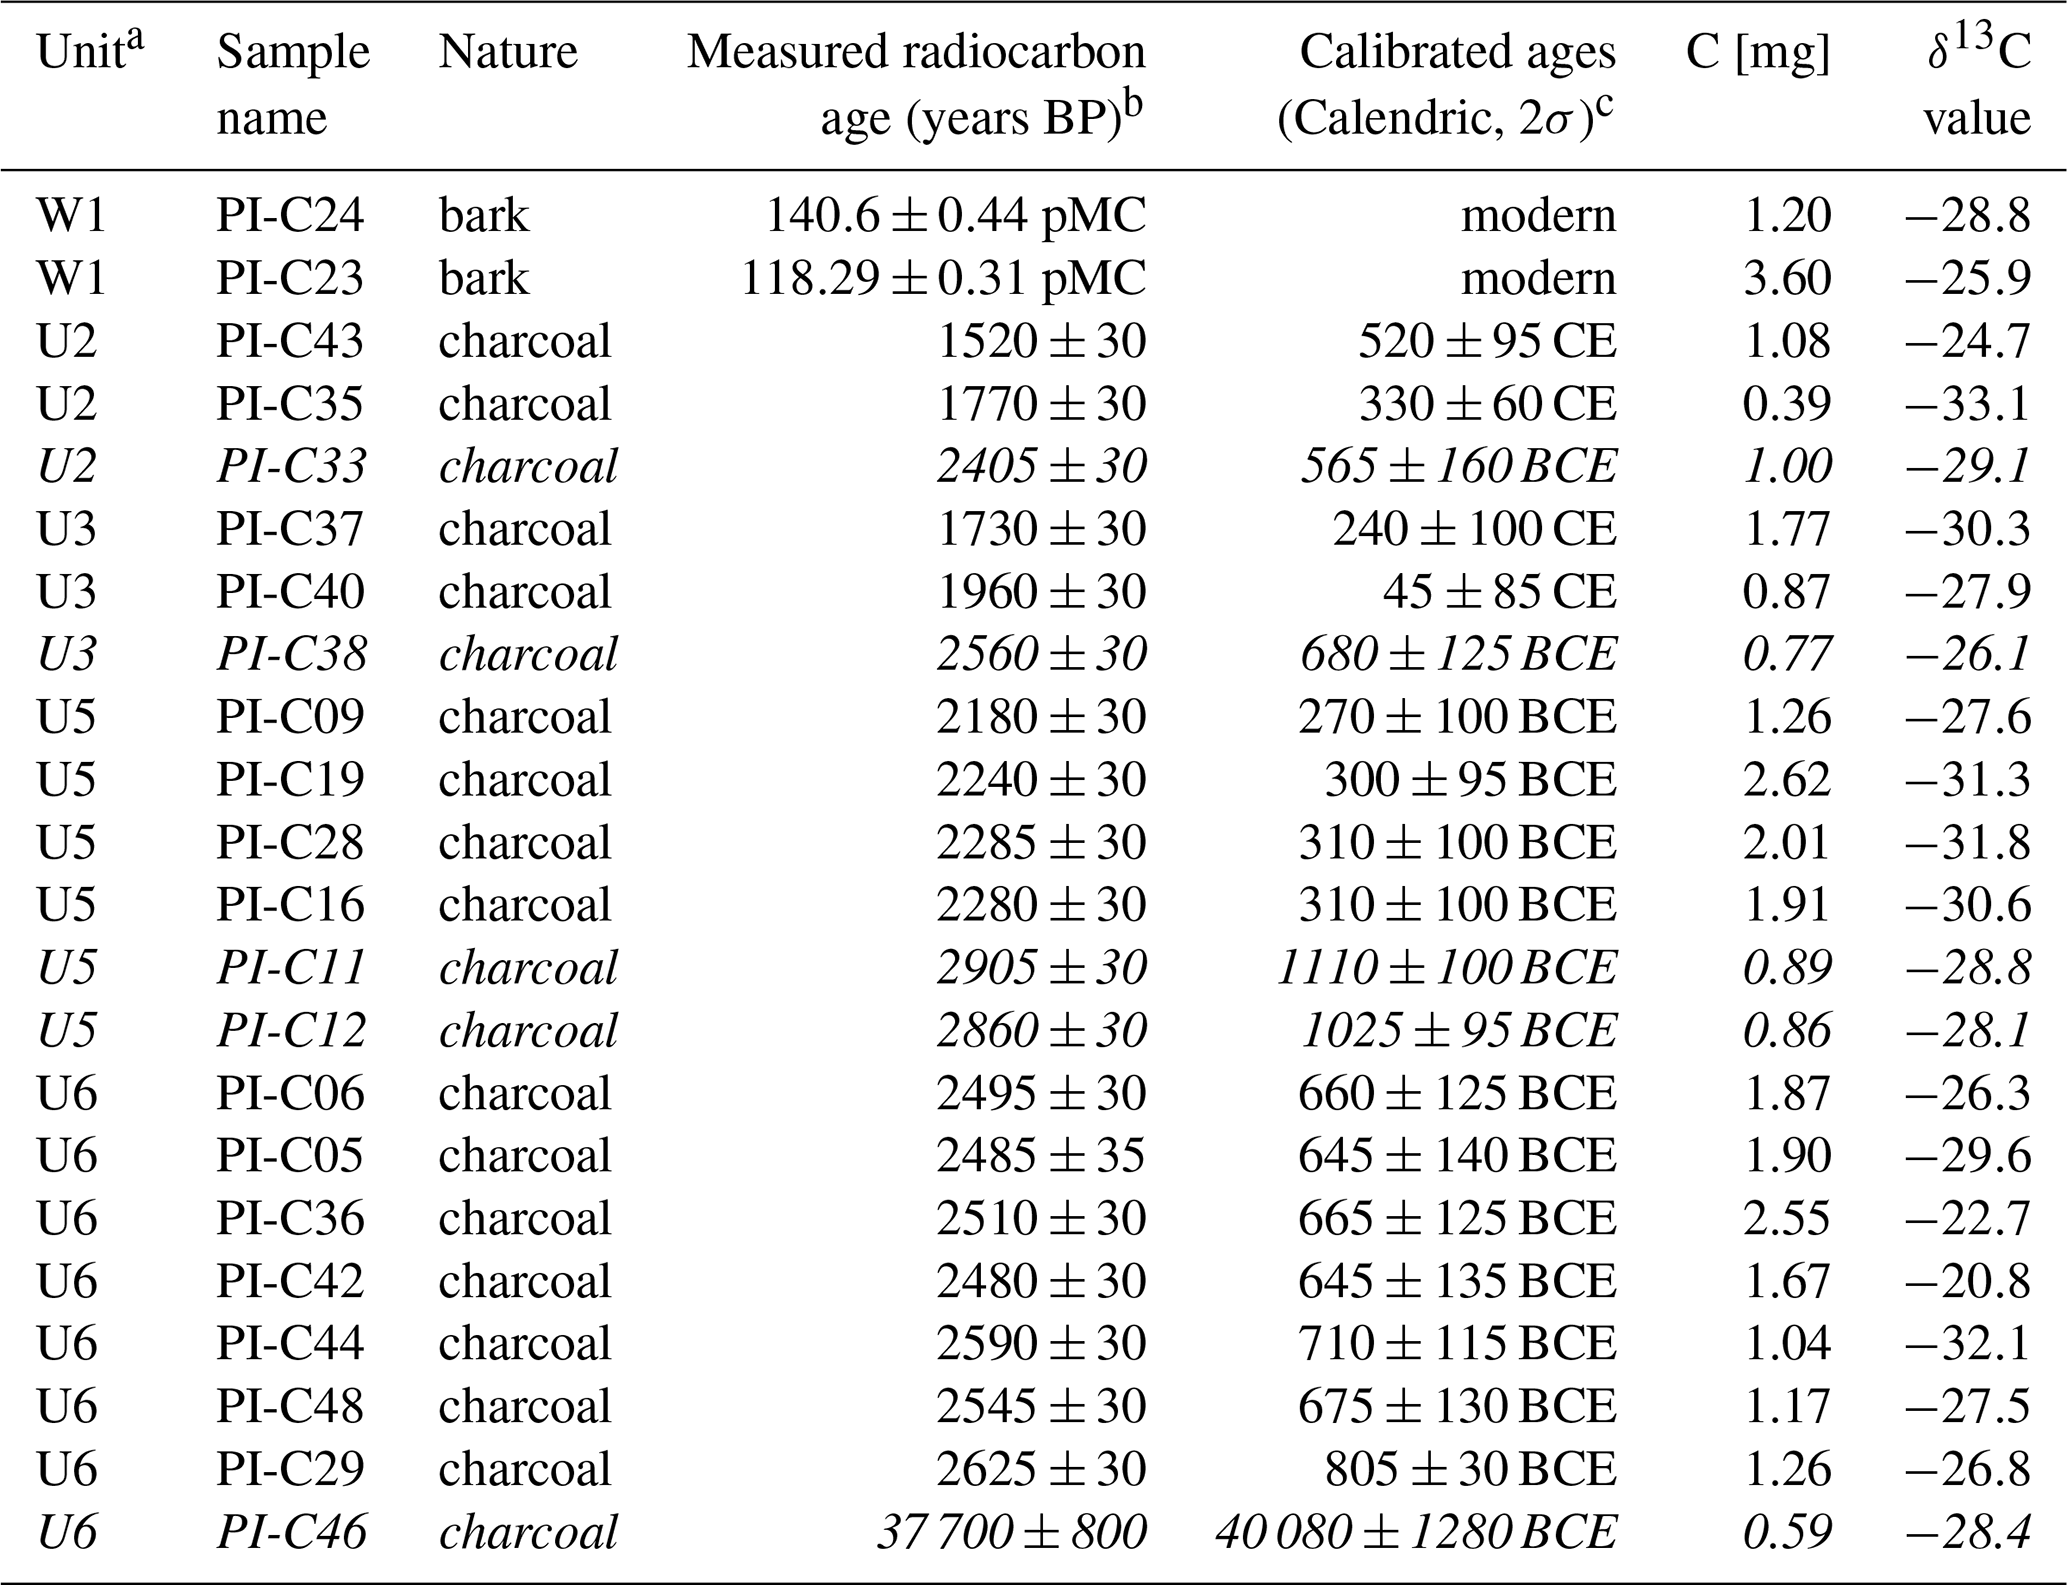
a See trench log for stratigraphic unit designations. b Radiocarbon years BP relative to 1950 CE (with 1σ counting error). All samples were dated by the Poznan Radiocarbon Laboratory. c Calendric dates were calibrated using OxCal and the atmospheric calibration curve IntCal13. Calendric ages have been rounded to the nearest half decade assuming the 5-year accuracy of the IntCal13 curve. d Calendric dates were calibrated using the atmospheric calibration curve IntCal09 for the Northern Hemisphere.
3.1 Chronostratigraphy
The stratigraphy of the northern section of the exposure (Fig. 3) is mostly constituted of massive gray sands with fine beds of white silts, pebbles, and cobbles that outline a ∼ 60∘ dip to the north. This unit crops out along a ∼ 150 m long section of the river cut and exhibits a thickness of at least 90 m. It is widely observed regionally along the mountain front (Long et al., 2011a) and is attributed to the Siwaliks formation (S). Here, it is overlain with a ∼ 4 m thick clast-supported stratified cobbles-to-boulders unit (called U7 hereafter). Observed clasts are generally rounded with a significant contribution of metamorphic lithology from the Higher Himalaya formation (Long et al., 2011a). Considering stratigraphy, clast roundness, distance to the nearest outcrops of said formation (∼ 25 km north of the site), and relationship to the local drainages, we interpret this unit as an alluvial terrace deposit from the trans-Himalayan Wang Chu. Unit U7 is stratigraphically above the Siwaliks (S) and lies over a clear erosion surface (strath) that cuts through the Siwaliks north-dipping stratigraphy. Its top surface is eroded north of grid point (22, 24) and preserved and overlain with a succession of fine-grained units south of it (Fig. 3b); it is hereafter considered to mark the base of the Quaternary stratigraphic record at this site.
On top of unit U7, we observed an 18 m thick succession of deposits comprised of 20 to 40 cm thick massive bluish-gray silt layers and clast-supported gravel layers with a sandy matrix. Major sediment packages are delimited along continuous near-horizontal (in the undeformed section) limits and named U6 (deepest) to U0 (shallowest). They exhibit abundant detrital charcoal lumps, most of them reaching 1 cm in diameter and displaying freshness, compactness, and angularity indicative of a priori short transport and storage times. Overall, 50 samples were collected from units U6 to U0, of which 22 were selected and submitted for radiocarbon dating (Table 1). Fine calibration was performed with OxCal 4.2 using a depositional model where samples from the same unit are defined as a phase (e.g., Lienkaemper and Bronk Ramsey, 2009) and yielded dates consistent with the observed stratigraphic order.
-
Unit U6: the lowest unit lies over unit U7 over the northern section of the exposure (north of x=22) where it is ∼ 2 m thick, while its base is presently below the water table in the southern section and could not be logged (Fig. 3). It is comprised of massive fine to very fine silts, blueish gray in color, interbedded with 30 to 40 cm thick poorly stratified lenses of matrix-supported angular gravels, containing ∼ 50 % of fine to coarse sand. The top of U6 is marked by a relatively smooth poorly expressed erosion surface. The age of the unit is constrained by seven samples with a narrow distribution of radiocarbon ages comprised between 2480±30 and 2625±30 years BP (Table 1) suggesting a relatively fast deposition process. A single obvious outlier (sample PI-C46 with a radiocarbon age of 37 700 ± 800 years BP) was considered reworked and therefore discarded from our analysis. Model calibration yields a deposition date of 670±165 BCE.
-
Unit U5: within the southern undeformed section of the exposure section, this unit displays a thickness of ∼ 1.5 m (south of x=59 m in Fig. 3b). It exhibits a similar grain size distribution to that of U6 but with distinct gravel and sand lenses: the bottom section is marked by well-defined fine gravel lenses, while the top section is evidenced by a ∼ 1 m thick coarse sand and gravel lens. The top of unit U5 is defined by a weakly expressed erosional surface that probably reflects a short depositional hiatus rather than established rill processes. Unit U5 yielded six samples, four of which have ages between 2180±30 and 2285±30 years BP, again indicative of a relatively fast deposition process. The two remaining samples collected at the base of the unit (PI-C11 and PI-C12) are significantly older than other samples from U5 and even U6 (2905±30 and 2860±30 years BP, respectively). We suspect they have been reworked from the lower section of U6 or from an even older unit, and we choose therefore to discard them from our analysis. Model calibration yields a deposition date of 290±120 BCE.
-
Unit U4: this unit is 3 to 4 m thick in the southern section of the exposure (south of x=55 m in Fig. 3b) and thins out to the north where is forms an onlap against U5 then U6 at x=38 m. U4 is almost entirely composed of matrix-supported gravels with a few silt lenses and terminates with a continuous ∼ 15 cm thick sand layer. This unit did not yield any adequate sample for radiocarbon dating, probably on account of the higher-energy regime at the time of its formation.
-
Unit U3: this unit displays a very constant thickness of ∼ 1.5 m over the whole exposure (between x=24 and x=98). It is comprised of massive silts with 20 to 30 cm thick lenses of coarse sand and fine gravel. U3 yielded three samples with radiocarbon ages of 1730±30, 1960±30, and 2560±30 years BP. Since the latter sample is contemporaneous with U6, it is considered reworked and removed from any subsequent analysis. Model calibration yields a deposition date of 240±100 CE.
-
Unit U2: this unit also exhibits a constant thickness of ∼ 1.5 m over the exposure. It is, however, comprised of matrix-supported gravels with a few sand lenses, which suggests a slightly higher-energy fluvial regime. It yielded three samples with radiocarbon ages 1520±30, 1770±30, and 2405±30 years BP. Similarly, since the latter is contemporaneous with U6, it is considered reworked and removed from subsequent analysis. Model calibration yields a deposition date of 440±70 CE.
-
Unit U1: this unit is ∼ 3 m thick over the exposure. It displays a stratigraphic content very similar to that of unit U2 and lies over a weak erosional surface forming the top of U2. For logistics and safety reasons, unit U1 could not be sampled for age determination.
-
Unit U0: this is the ultimate deposit of this section. It displays a variable thickness of ∼ 20 cm to up to 4.5 m with a strongly eroded top surface within the deformed zone, north of x=52 m (Fig. 3b). The top of U0 marks the abandonment of the section before it was intensely and almost entirely incised by a local gully (x = 52–70 m). Although this unit was directly accessed at the location of the uppermost log (box marked “Fig. 8” in Fig. 3), we could not retrieved adequate material for age determination.
Within this succession, clast lithology and roundness are constant, thus suggesting a common nearby source for units U6 to U0 distinct from that of U7. Gravels are very angular and made of quartzite and phyllite from the Manas Formation, sands are fine-grained and well-classed, and silts are massive and blueish gray in color, where not oxidized. Although grain size distribution varies across units from gravel-dominant (with sand lenses) to silt-dominant (with sand and gravel lenses), this does not necessarily reflect significant variations in transport flow velocity (e.g., Miller et al., 2014). Overall, we interpret units U6 to U0 to derive from the same nearby low flow-velocity source consistent with the recent alluvial fan mapped at the outlet of the Ramphu Chu watershed basin (Fig. 2).
Two additional units display specific wedge-shaped geometries: W2 between U5 and U4 and W1 deposited against U0 and immediately below the modern soil. Both units exhibit little stratigraphy, with a clear debris and wash facies for W1 and intense internal deformation typical of a slump for W2 (see details below), and are interpreted as colluvial wedges (more details in the following section). W1 is stratigraphically the youngest unit observed here. Two detrital wood samples (PI-C23 and PI-C24) yield modern ages. Since roots found in the region sometimes resemble tree-trunk bark in terms of size, density, and texture, we suspect the ligneous samples PI-C23 and PI-C24 may derive from in situ roots and may not be representative of W1's true age. These samples are discarded in our analysis.
Additionally, it is quite notable that the undeformed part of the 18 m thick Ramphu Chu section (south of x=54 in Fig. 3b) presents a quasi-continuous (erosion surfaces are poorly expressed and stratigraphic limits are virtually flat) succession of silt, sand, and gravel deposits constrained by 15 radiocarbon samples (Table 1). To better assess the timing of deposition for the uppermost units, we assume that deposition was mostly continuous, and we build an age-versus-height relationship for all samples retained for our analysis (Fig. 4). Our approach yields an average deposition rate of 7.1±0.2 mm yr−1 between 805±30 BCE (U6) and 520±95 CE (U2), with potential short-term variability between silt and gravel beds (e.g., Kumar et al., 2007). On that basis, and considering a similar constant sedimentation rate until the final deposition of U0, we may extrapolate the deposition rate and propose a tentative date with large uncertainties (2σ) for the top of U1 at 940±200 CE. Since U0 is strongly eroded, we did not attempt to date its top surface.

Figure 4Evolution of age versus height for the Ramphu Chu sedimentary sequence. Data (black outline diamonds) describes a satisfactory linear regression (R2=0.95) and allows interpolating towards the present. Modeled points (red outline diamonds) and 2σ variance determined from the height of sedimentary limits suggest the top of U1 was deposited at 940±200 CE. Associated uncertainties are deduced from the 2σ curves.
3.2 Exposure description
Large-scale deformation across the MFT at the Piping site is illustrated by fault-propagation folding affecting terrace unit U7 shown on Fig. 3. U7 crops out ∼ 34 m above the present stream (grid point (0, 34) in Fig. 3b), dips increasingly to the south, is sheared by a system of north-dipping thrust fault splays (F2 to F5 in Fig. 3b), dips reverse to the north and disappears underneath a massive 8 to 10 m thick fault gouge (unit G in Fig. 3b and following). Since U7 does not crop out south of the main fault zone, it is necessarily deeper than the present river level (at least below U6) and has hence recorded more than 34 m of uplift since its deposition.
Subsequent units U6 to U0 are mostly undeformed from the southernmost tip of the exposure to the center of the studied section (i.e., south of x=54 m in Fig. 3b). There, they exhibit various stages of deformation, from warping with minor faulting (U0 to U3) to folding (U4) and intense faulting with duplexing (U5 and U6), indicating than the older units of the Ramphu Chu fan have cumulated more deformation. Furthermore, fault strand F5 cuts through the whole section and reaches the surface with a near-vertical dip and affects U2 to U0 with an apparent normal geometry. To describe faulting and abutting relationships in detail and identify surface-rupturing events, we focus on two excerpts presented at high resolution in Figs. 5 to 8.
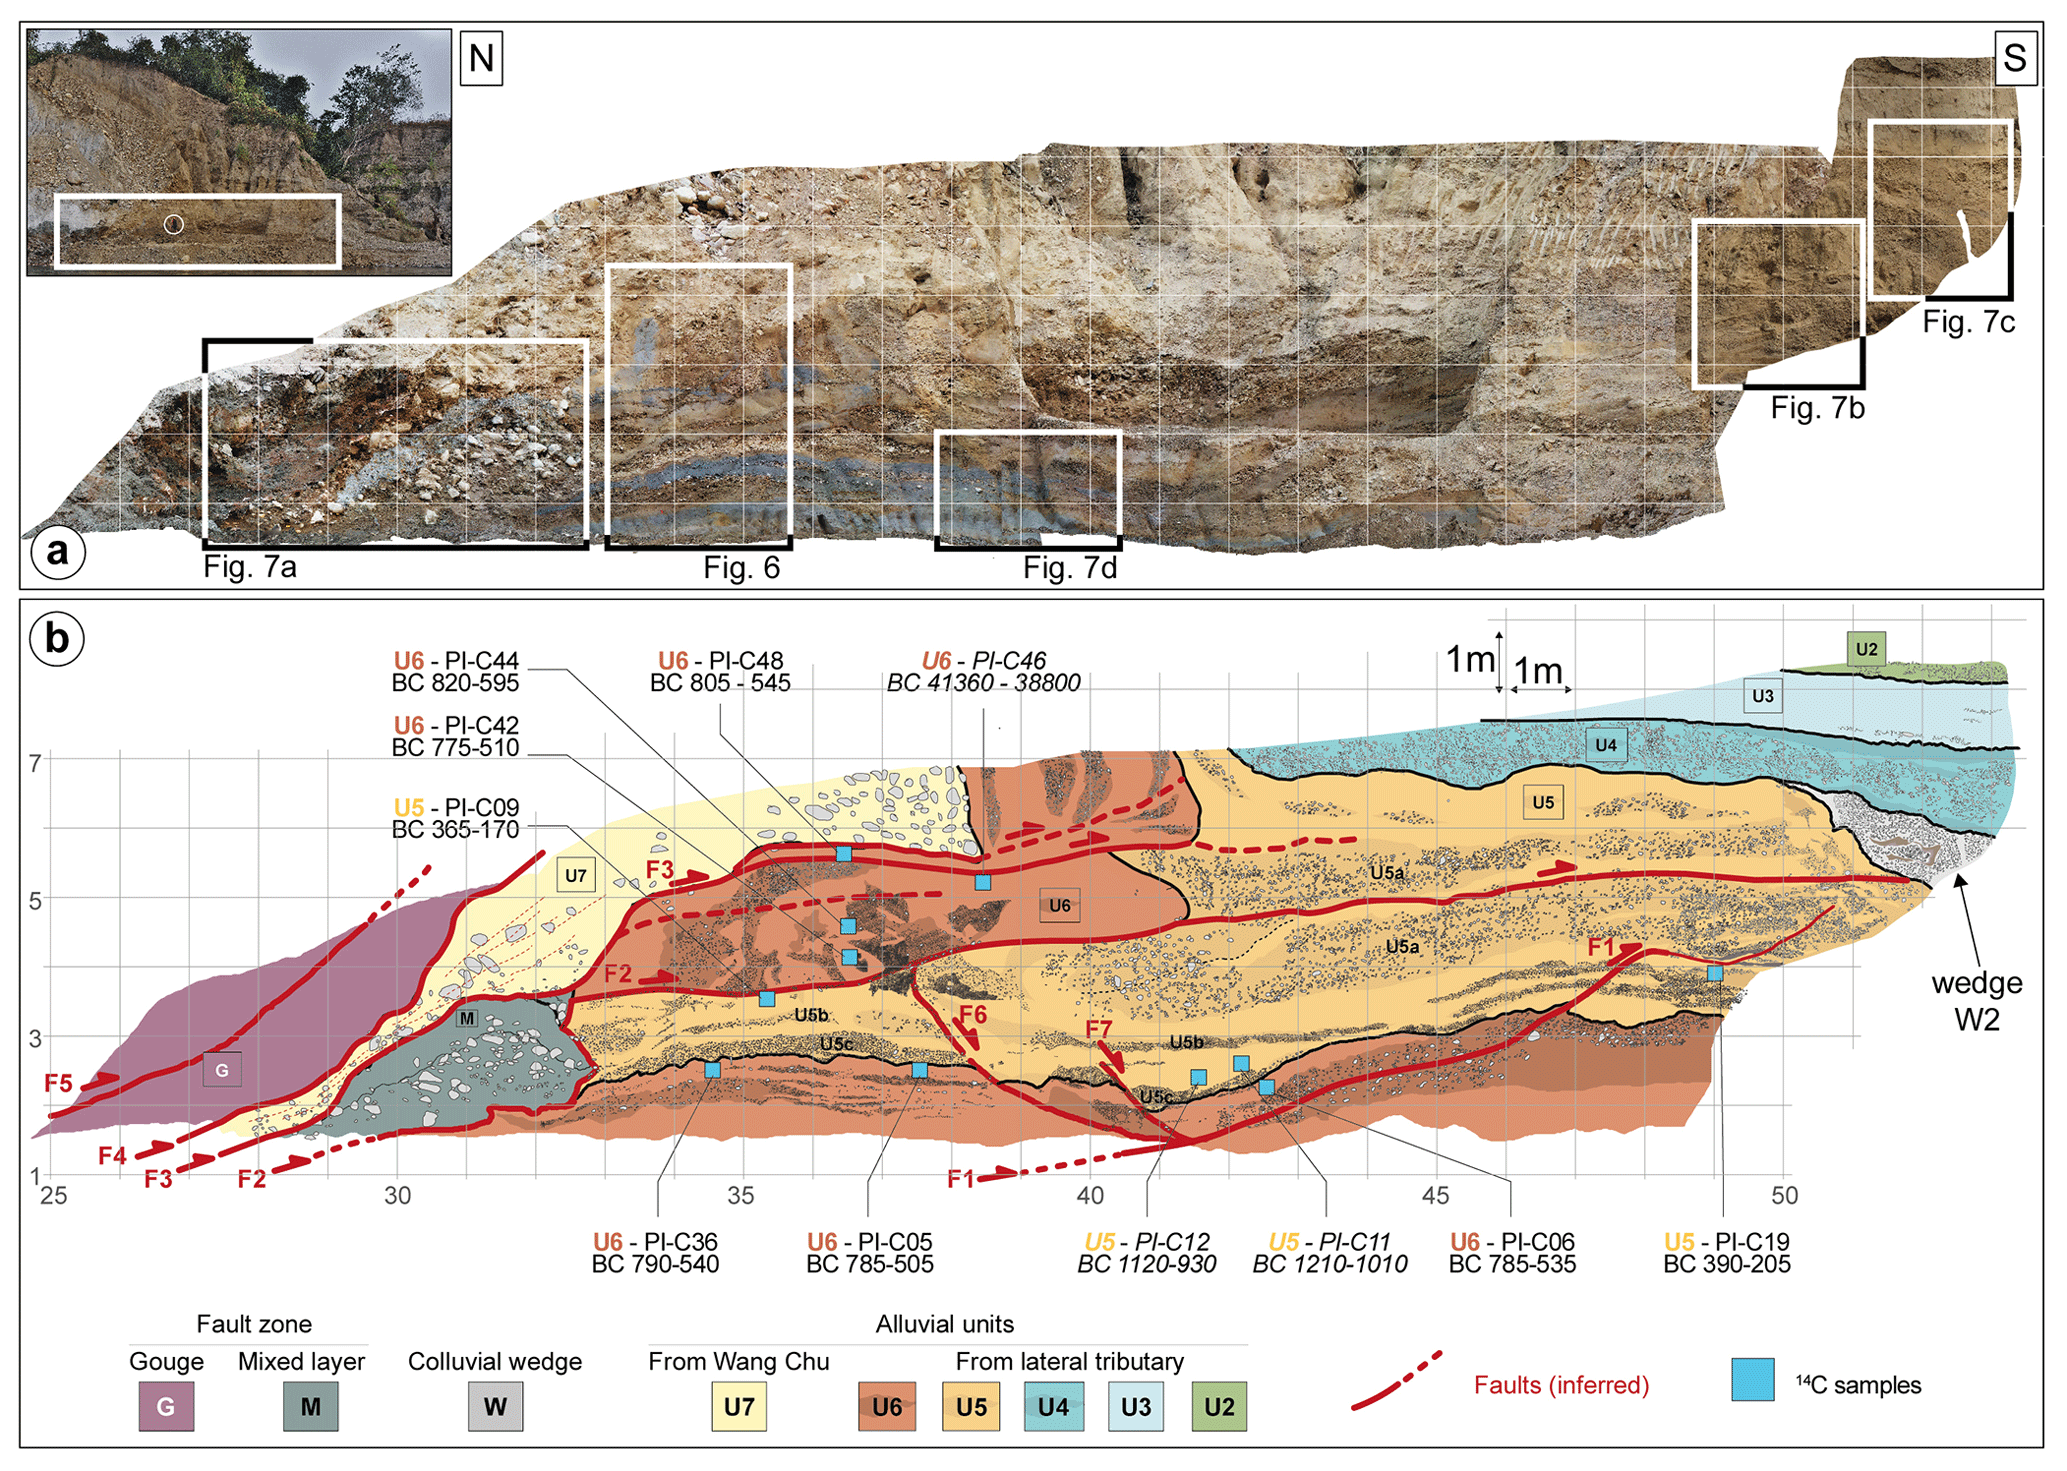
Figure 5Lower part of Piping paleoseismic exposure. (a) Orthorectified photomosaic of the left bank of the Wang Chu. White rectangles indicate the location of Figs. 6 and 7 (a, b, c, and d). (b) Detailed log over a 1 m grid. Solid and dashed red lines are main faults (certain and suspected, respectively). Blue squares indicate the locations and 2σ-calibrated calendar ages of 22 detrital charcoal samples. Samples in italics were discarded from our analysis (see main text for details).
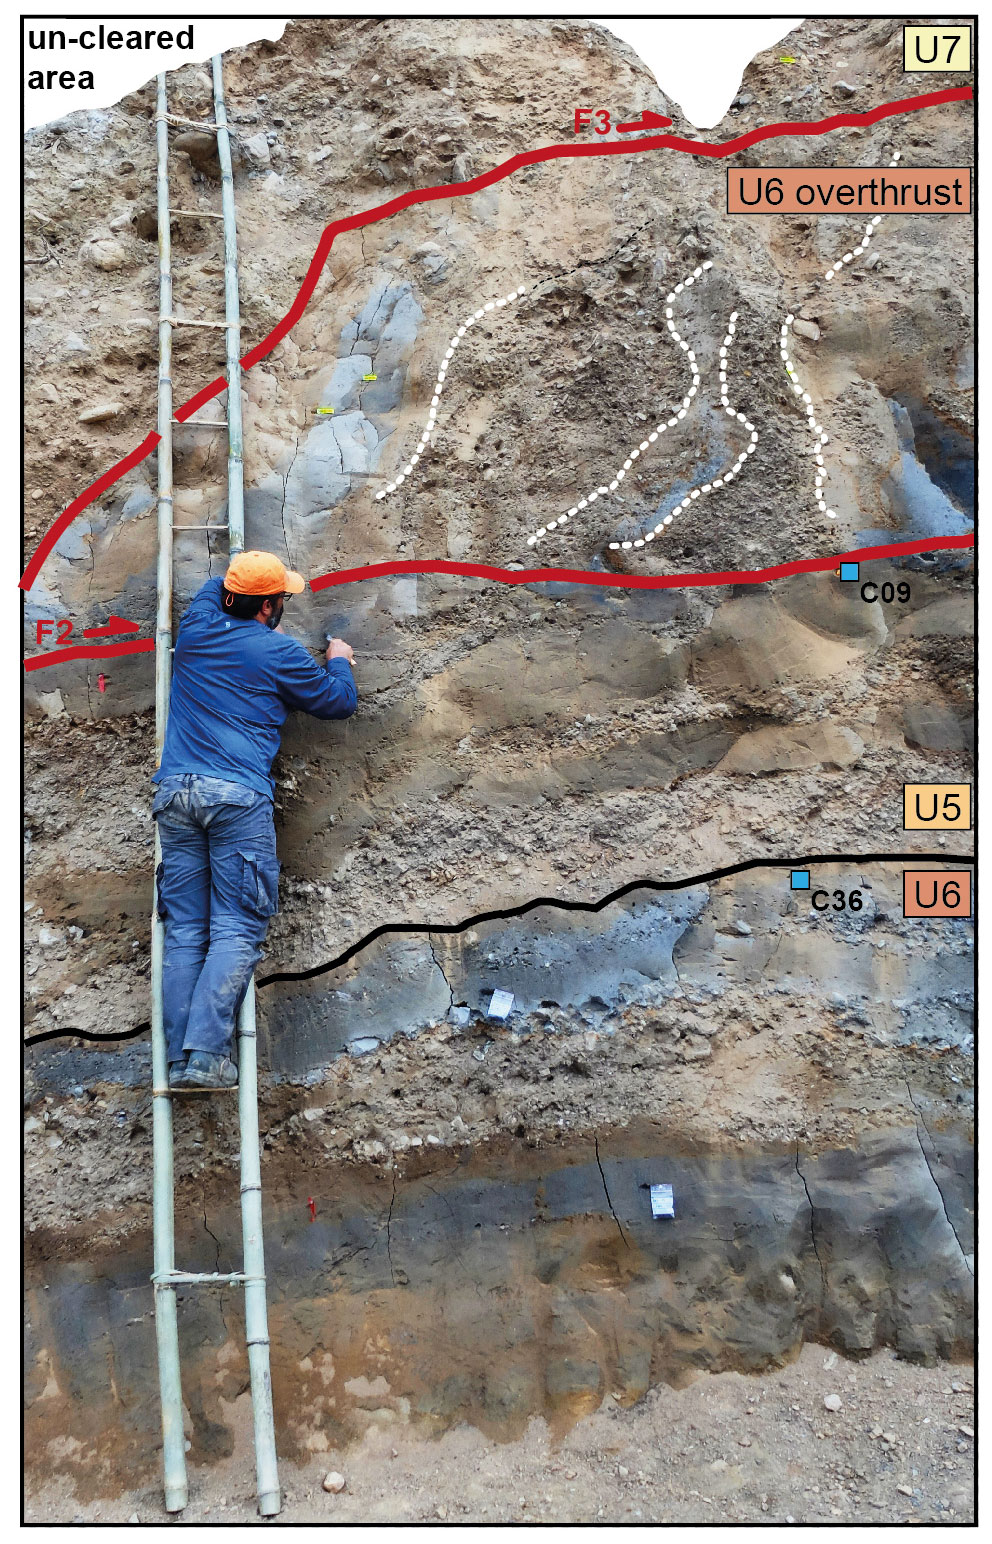
Figure 6Enlarged photograph of the lower part of the exposure (see Fig. 5a for location) showing (1) sub-horizontal deposits of U5 and U6 below the thrust fault F2 and (2) the overturned limb of U6 and U7 characterized by tilted gravel and silty layers and pebbles, respectively.
The lower section documents deformation affecting units U7, U6, and U5 (Figs. 5, 6, and 7). From grid point (28, 2) (Fig. 5b), U7 is overlain with unit (G), which is composed of massive reddish to brownish clay with sheared and fractured clasts from the Siwaliks formation as well as cobbles and boulders from U7. It exhibits intense internal deformation (see close-up in Fig. 7a) typical of a fault gouge. The localized fault contact between G and U7 corresponds to F4 in Figs. 3b and 5b. To the south, U6 crops out at the base of the exposure and is affected by fault F1, which cuts through U6 and U5, and dies out ∼ 4 m southward within U5 (Fig. 5b). F1 accommodates only minor faulting as attested by a relatively small 30 cm offset affecting the base of U5 (Fig. 7b). Secondary normal-geometry splays F6 and F7 branch out from F1 and displace the base of U5 vertically by a total of ∼ 60 cm. F7 tapers out within U5, while F6 cuts it entirely and terminates against the low-dipping fault strand F2 at a right angle. Above F2, U6 displays strongly deformed near-vertical bedding produced by dragging along F2 (Fig. 6) and forms a fault-propagation fold. Hence, F2 is a duplex fault that accommodates major deformation within the exposure. The uppermost part of unit U6 is affected by similar duplexing deformation along the F3 fault strand, though with a much smaller offset. F2 also affects U5 where duplexing produced a clear scarp overlain with the wedge-shaped unit W2. Its stratigraphy is composed of finely layered silts and gravels similar to U5 but exhibits intense deformation with sheath folds typically associated with slumping along a slope (Fig. 7c), here consistent with the frontal slope of the scarp. We interpret W2 as a scarp-derived colluvial wedge deposited during or shortly after a coseismic displacement along F2 affecting U5. The tops of W2 and U5 are in continuation and overlain by U4, which does not exhibit noticeable deformation at this location, and show that F2 was not re-activated after the deposition of U4.
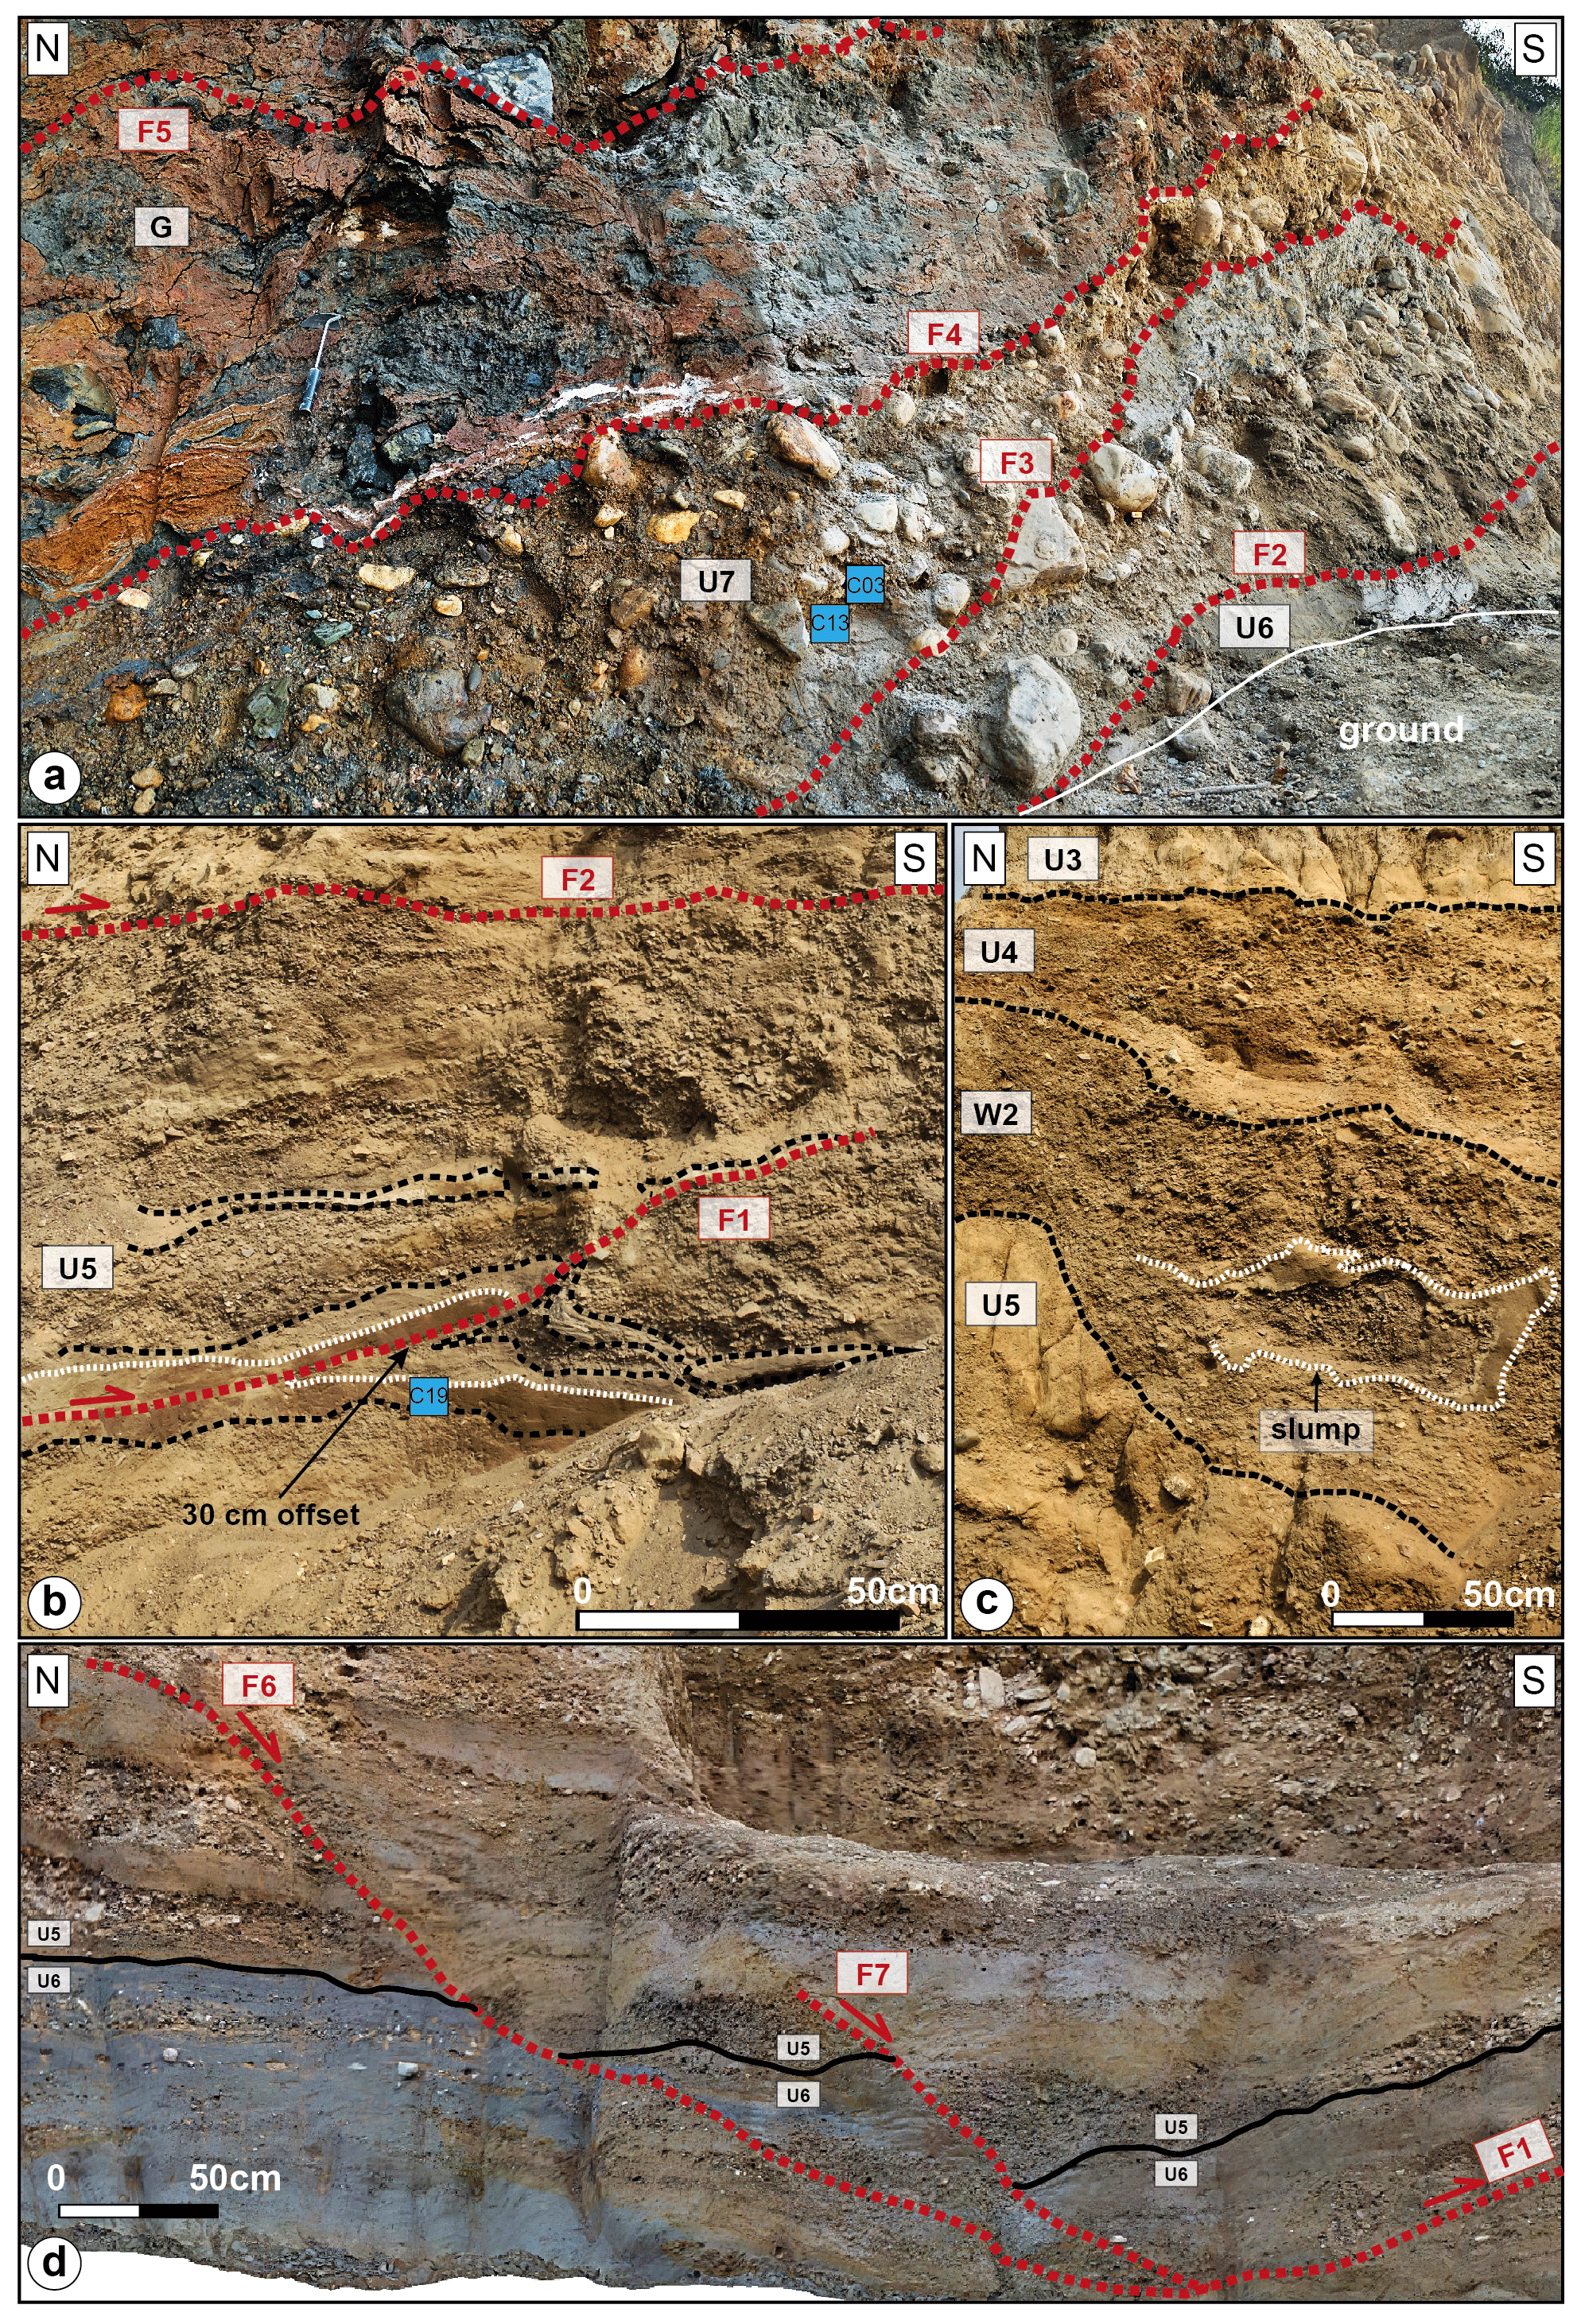
Figure 7Enlarged ortho-photographs showing (a) the northward-dipping-contact between the gouge fault G and the overturned alluvial terrace U7 at the bottom of the exposure, (b) the 50 cm offset and the shear texture induced by the fold termination of the F1 thrust fault at the southern end of the deformation zone, (c) a slump figure within the colluvial wedge W2 associated with event E4 along fault splays F1 and F2, and (d) the secondary normal-geometry splays F6 and F7 branching out from F1 and displacing the base of U5 vertically by a total of ∼ 60 cm.
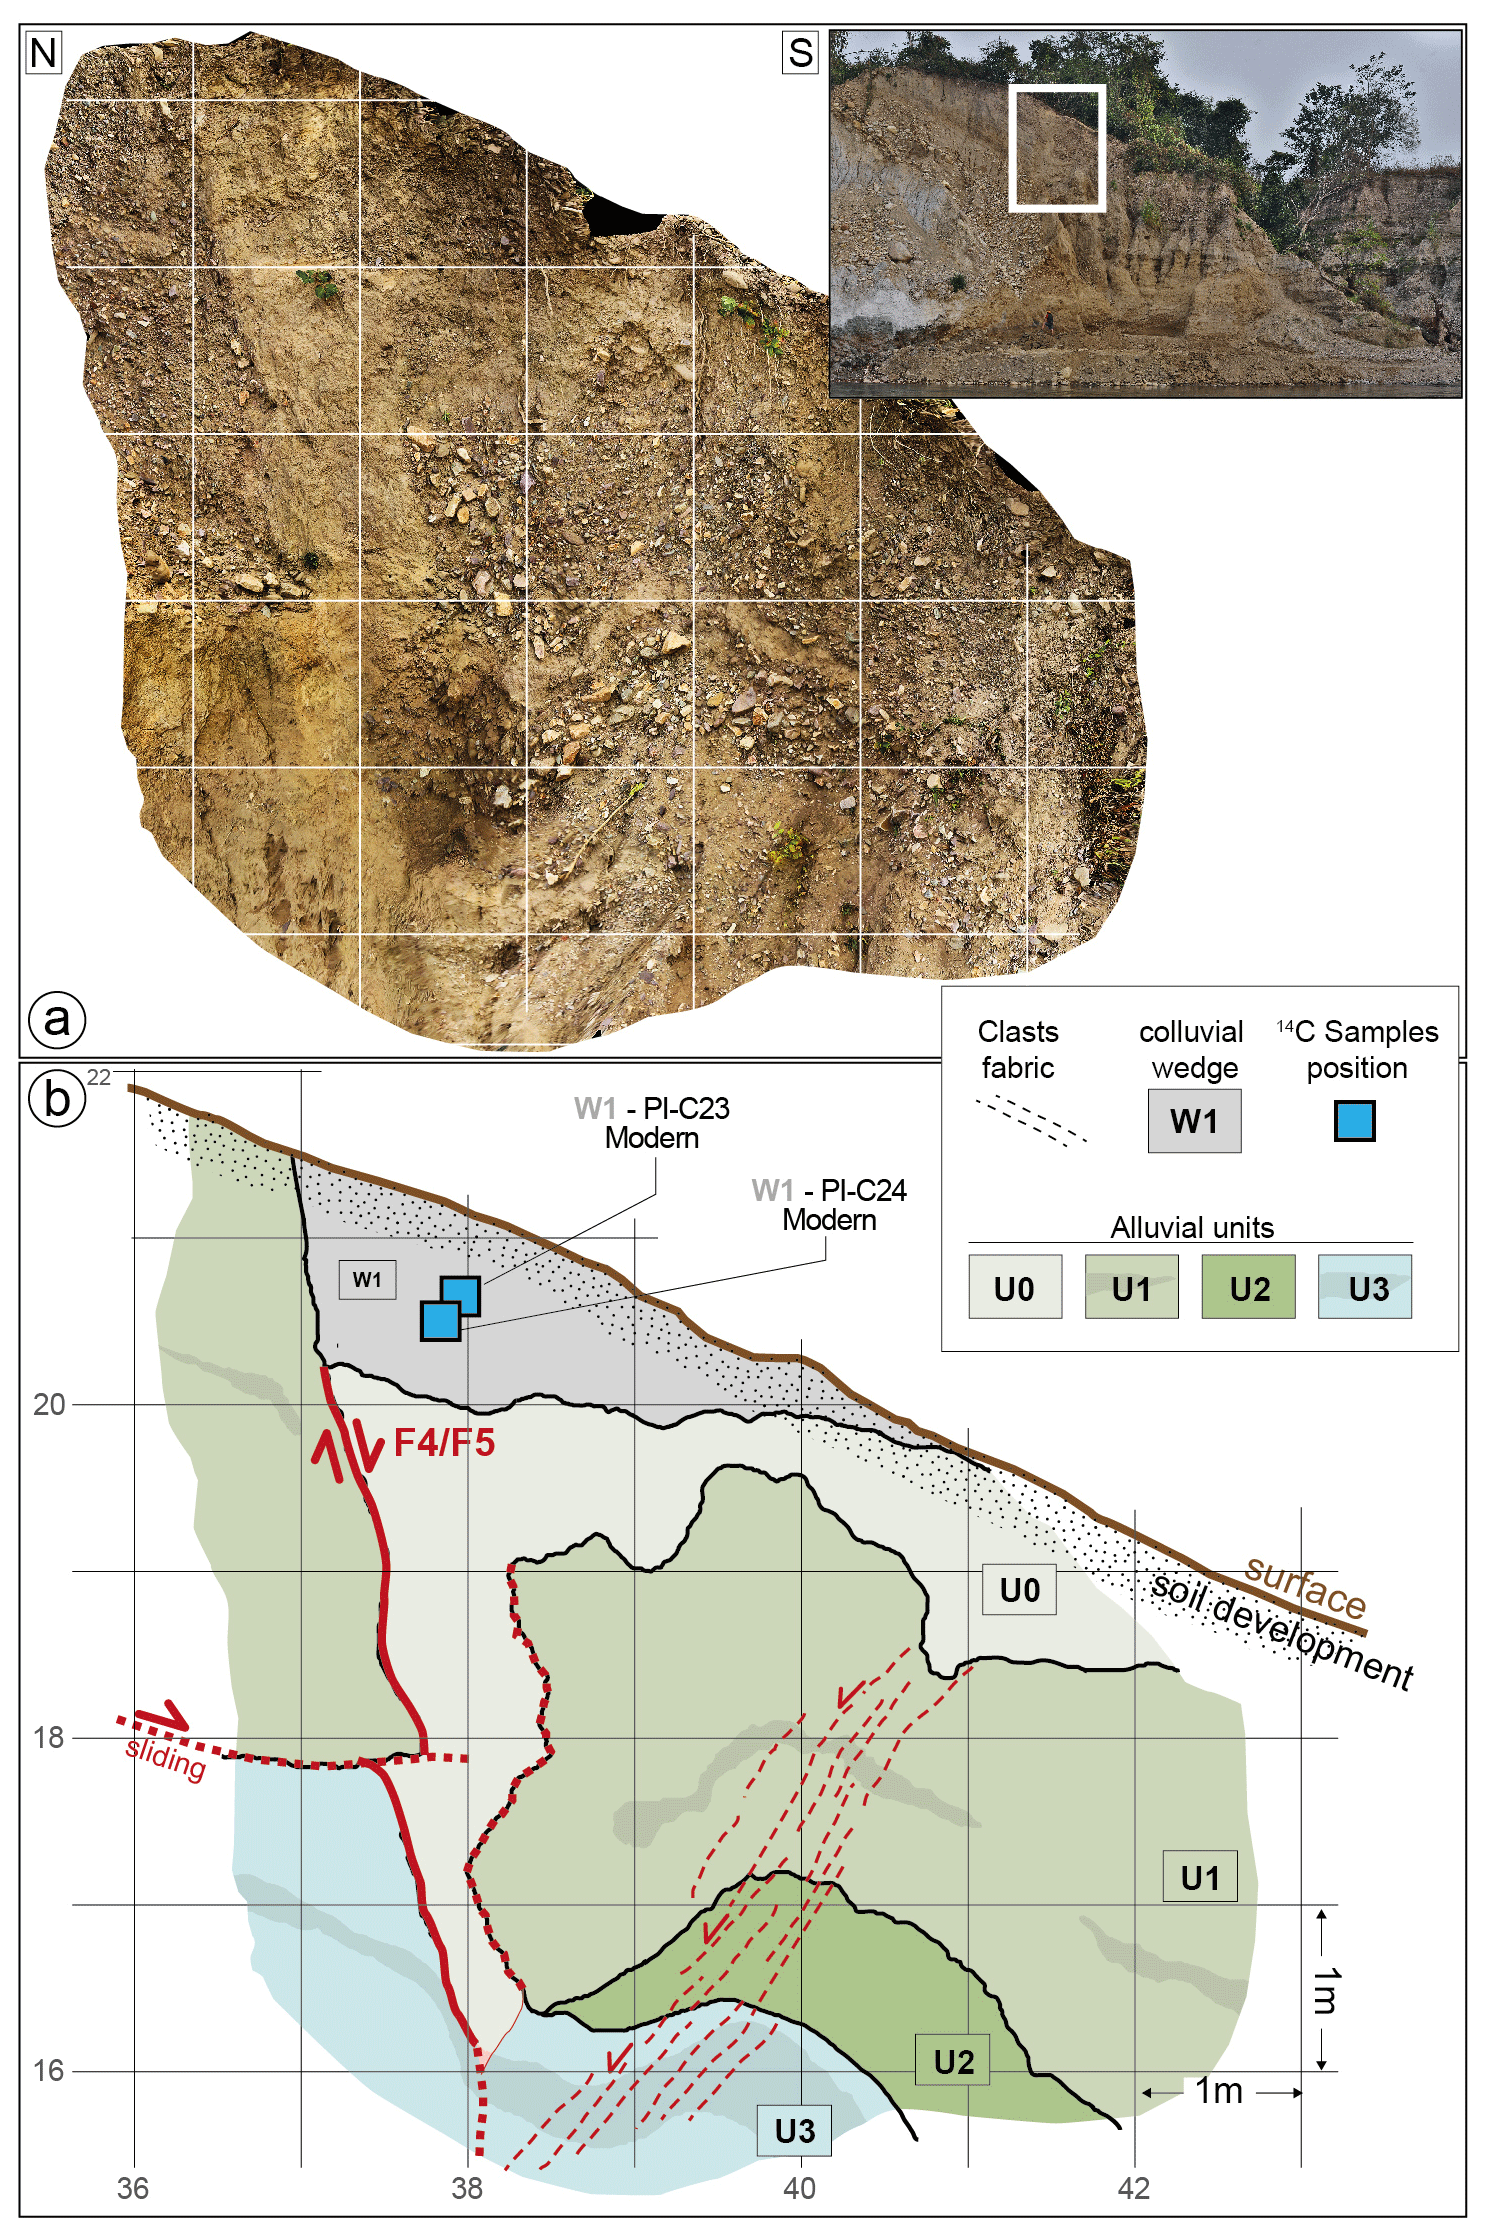
Figure 8Upper part of the Piping paleoseismic exposure. (a) Orthorectified photomosaic of the left bank of the Wang Chu showing fault F4–F5. (b) Detailed log over a 1 m grid. Solid and dashed red lines are main faults (certain and suspected, respectively). F4–F5 is associated with a vertical fabric, affects all alluvial units, and is capped by colluvial wedge W1. Blue squares indicate the locations and calendar ages of two detrital charcoal samples.
The upper section (Fig. 8) documents the northernmost fault strands F4 and F5 as they reach the surface. At the bottom of the trench (Fig. 3b), F4 and F5 originate from the main gouge zone (G) where they dip ∼ 20∘ N, cut through U7 with a steeper dip of ∼ 50∘ N, and merge together as strand F4–F5, cut through U3 at a near-vertical angle and U2 to U0 with a ∼ 85∘ S dip. This change of dip angle and direction is expressed within the shallowest units (U3 to U0) by an apparent normal-geometry fault displacement along F4–F5 (see Fig. 8b). The detailed log of the upper section shows a ∼ 3 m wide V-shaped deformation zone bounded by F4–F5 to the north and by a diffuse deformation band affecting U3 to U0 to the south (x = 38–41 m in Figs. 3b and 8). In between, units exhibit strong warping and chaotic limits suggesting soft-sediment deformation and collapse against F4–F5. Unit U1 is overlain with U0, which is itself collapsed against F4–F5. The amount of associated vertical displacement is difficult to ascertain, due to the wide collapse zone and the fact that U0 has been eroded north of F4–F5. From the base of the hanging wall section of U1 at grid point (37, 18) to the base of the footwall section of U1 at grid point (38.5, 16.5), we estimate a minimum vertical offset of ∼ 1.5 m. Finally, the whole stratigraphic succession is sealed by a ∼ 1.5 m thick wedge-shaped colluvial unit (W1) deposited over U0 and against what we interpret as F4–F5 free face. The very continuous geometry of the topography across U1, W1, and U0 suggests some erosion took place after the deposition of W1, as can be expected in a monsoon-dominated climate. Hence, W1 may have originally been significantly thicker.
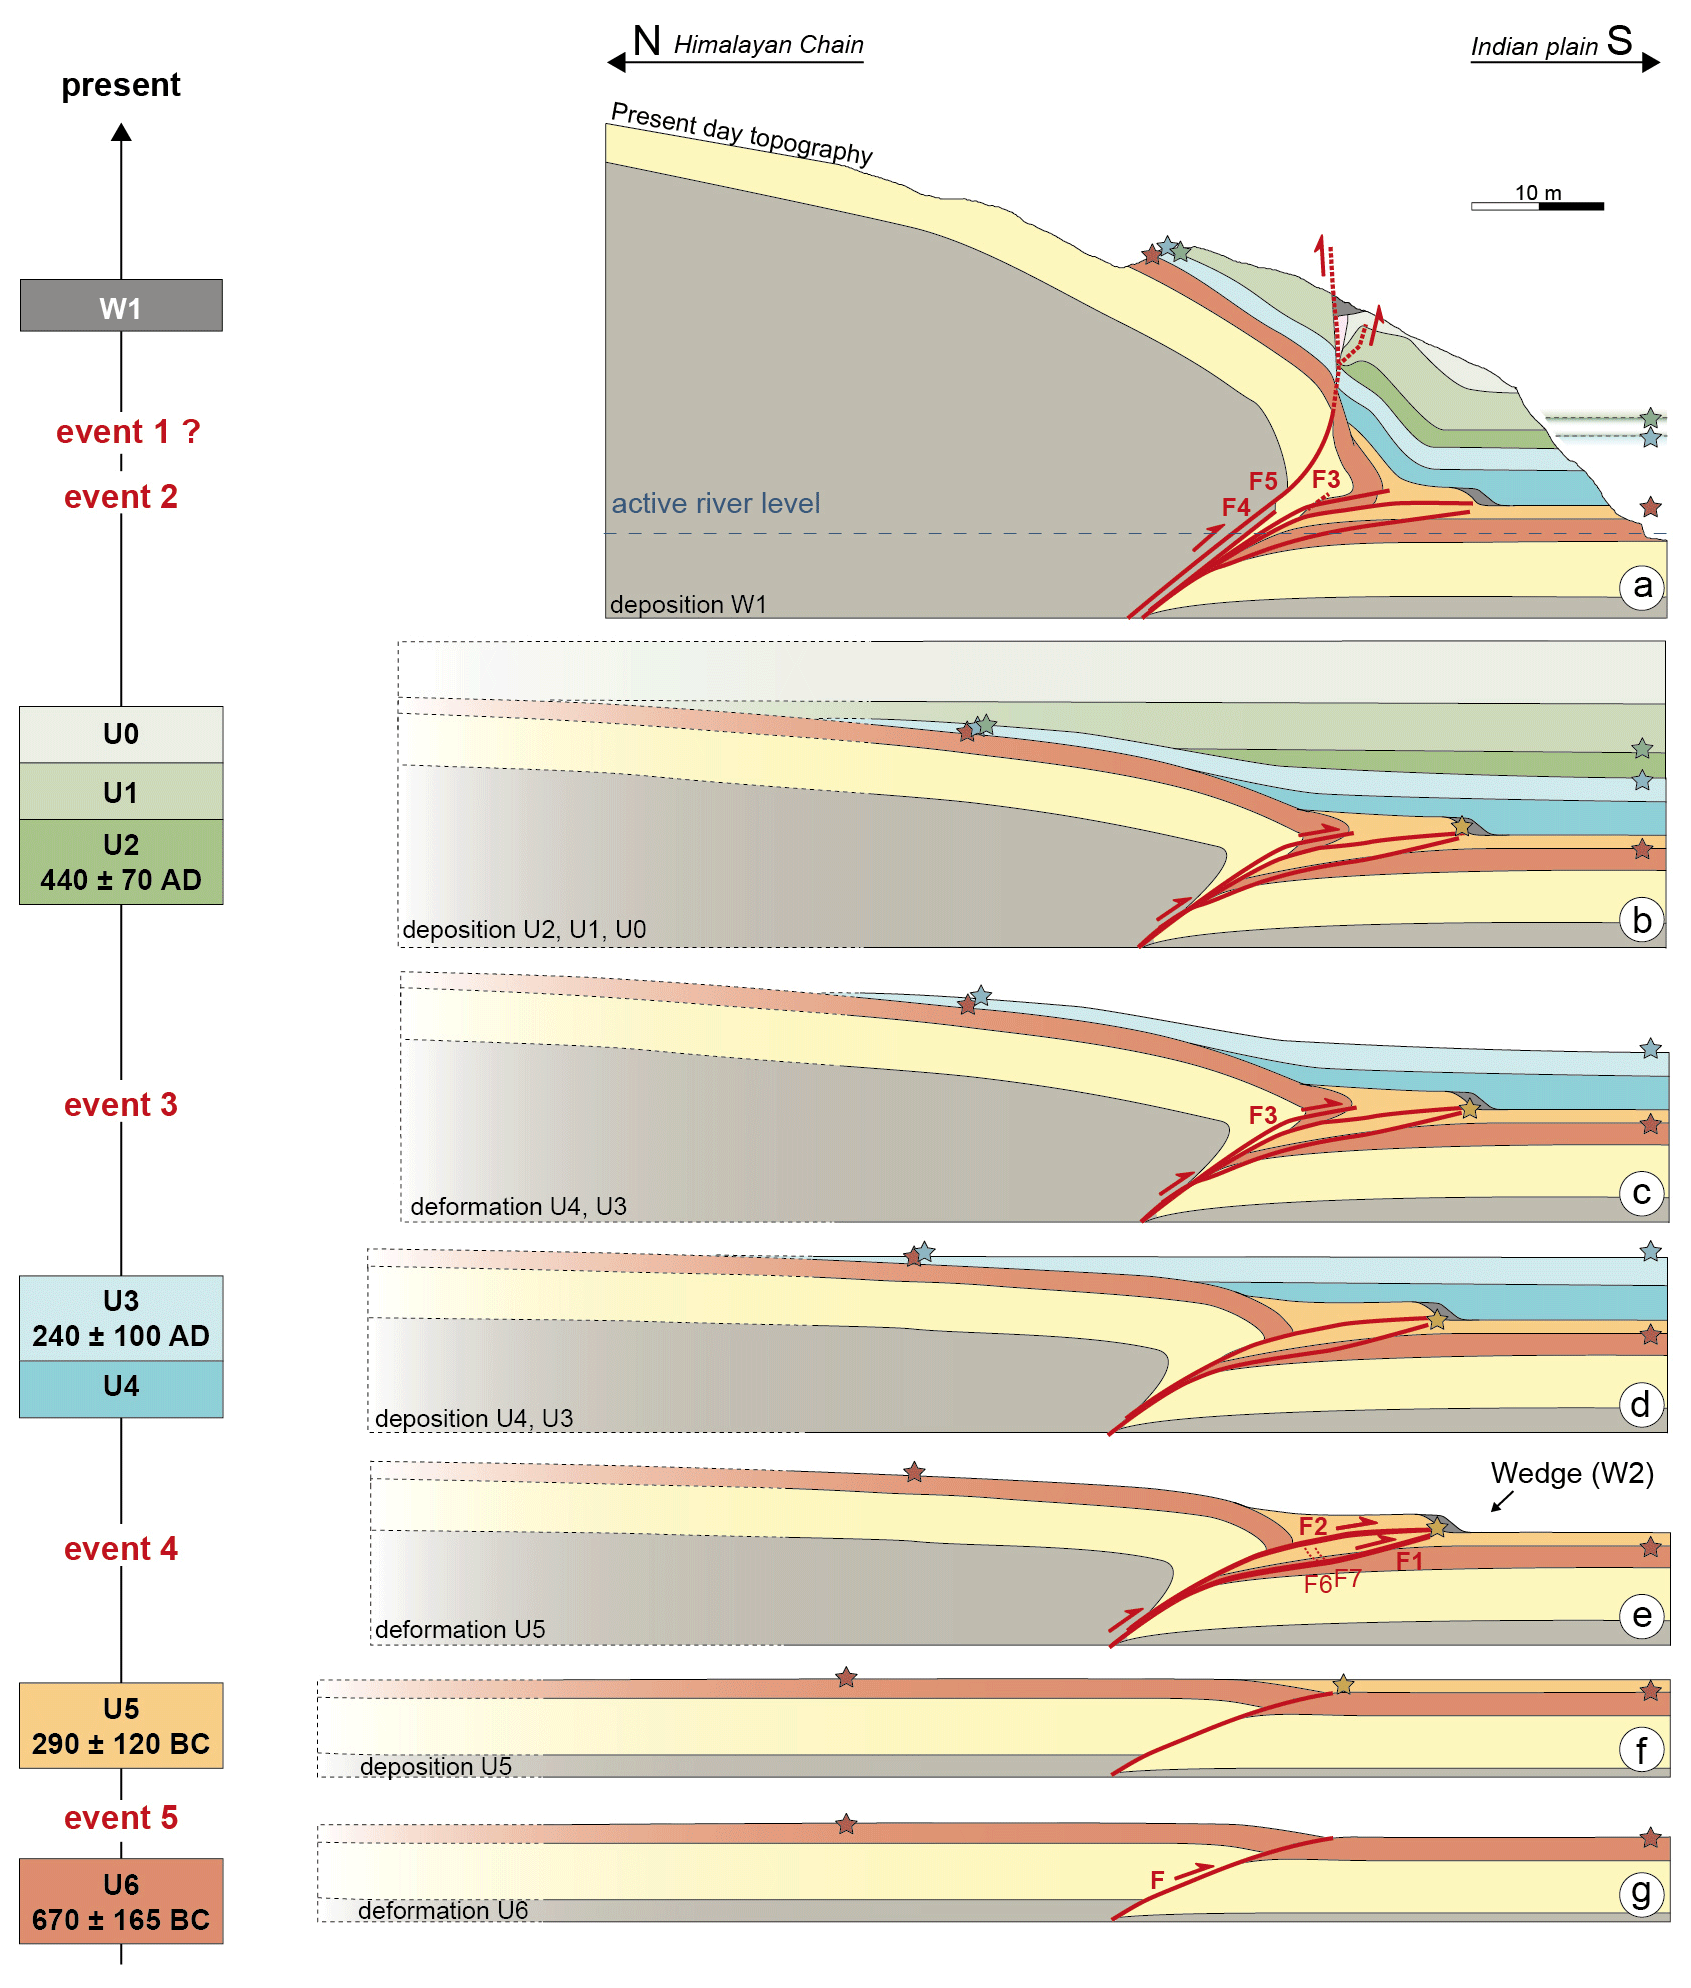
Figure 9Sequentially restored cross section illustrating the chronology of the successive deposition and deformation episodes at the Piping site. All ages are derived from an OxCal chronostratigraphic model.
3.3 Timing of surface ruptures and associated coseismic displacements
In order to identify the various deposition, erosion, and deformation events recorded at the Piping site, we propose a schematic sequential retro-deformation combining all observations collected over the exposure (Fig. 9; see Malik et al., 2017, for a similar approach further west). We start from a simplified log (Fig. 9a) and successively retro-deform the whole section to restore the most recent deposits to their original geometry and infer previous events where deformation remains. In parallel, we present OxCal-modeled (Bronk Ramsey, 2009) event dates constrained by 15 radiocarbon samples (see Sect. 3.1) and a chronostratigraphic model following guidelines from Lienkaemper and Bronk Ramsey (2009) (Fig. 10).
-
Event 1 + Event 2: the most recent unit observed in the exposure is a ∼ 1.5 m thick colluvial wedge (W1 in Figs. 8 and 9a) deposited against a free face affecting unit U1 by faulting along F4–F5. The diffuse deformation observed within U3, U2, and U1 and the collapse of unit U0 within an open fissure are contemporaneous with an event that occurred after the deposition of U0 (Fig. 8). The removal of W1 and retro-deformation of units U0 to U3 restore the continuity of the bottom of U0 and leave large-scale folding affecting units U2 and older. Restoring these deposits to their original horizontal geometry (Fig. 9b) in agreement with the southern section of the exposure (Fig. 3b) involves (at least) bringing the highest observable point of unit U1 (erosion surface at grid point (26, 25.5) marked by the northern green star in Fig. 9b) down to the height of the U1 top observed in the undeformed section (e.g., grid point (50, 14) marked by the southern green star in Fig. 9b). This analysis yields a minimum vertical offset of 11.6 m ± 0.8 m along the 60∘ ± 10∘ north-dipping F4–F5 splay, which corresponds to 13.8 m ± 2.3 m of coseismic dip-slip. The amount of deformation accommodated by faulting at the surface appears disproportionally small compared to folding at depth. This may be explained by efficient attenuation of dragging within soft sedimentary units and the emergence of a small localized surface offset. Alternately, this may suggest the occurrence of two distinct events; a recent faulting event with 1.5 m ± 0.5 m of coseismic dip-slip (called E1) and an older folding event with 12.2 m ± 2.8 m of coseismic dip-slip (called E2). For E2, the coseismic dip-slip is obtained by subtracting slip for E1 from the total slip then projecting the result onto the 60∘ ± 10∘-dipping rupture. Radiocarbon dating of W1 only yielded modern dates (Table 1) – likely due to contamination from actively developing soil – and does not permit us to date E1–E2 accurately. From our chronostratigraphic analysis (Fig. 10), said event(s) occurred after 895 CE and was/were associated with faulting along faults F4 and F5. Removing the now undeformed units U2 to U0 reveals that significant folding and faulting remain for units U3 and older (Fig. 9c).
-
Event 3: by applying the same approach to units U4 and U3 and considering that the uppermost point of the top of unit U3 has been eroded away, we estimate the height difference between grid point (26, 25.5) and the height of the top of U3 in the undeformed section, to be 9.5 m (blue stars in Fig. 9c). This yields a minimum cumulative vertical offset along F3, F4, and F5 of 16 m ± 0.5 m for E3 + E2 + E1 and hence 4.4 m ± 1.3 m of vertical offset for E3 alone. Since slip propagated primarily along F3 with an average dip of 20∘ ± 5∘, we estimate the coseismic dip-slip for E3 along F3 to be 14.7 m ± 7.4 m. U3 is the youngest affected unit, while U2 is the oldest unaffected unit, which indicates E3 occurred between the deposition of U3 and U2. Our radiocarbon chronology (Fig. 10) yields a date of occurrence at 300±70 CE. Retro-deformation along F3, then removal of undeformed units U4 and U3, suggests residual deformation affects units U5 and older (Fig. 9d).
-
Event 4: at this stage (Fig. 9e), units U5 and U6 form a ∼ 2 m high scarp on the ground surface rapidly covered by scarp-derived colluvium W2 at the toe of the scarp. In Figs. 3 and 5, the U5 package located underneath F2 between x=33.5 m and x=38 m only exhibits the lower part of U5 (units U5b and U5c), while the duplexed part above F2 only exhibits the upper section of U5 (U5a). Hence, restoring U5 involves removing W2 then retro-sliding the duplexed part of U5 along F2 to bring grid point (51.5, 5) back to its minimal original position at grid point (39.5, 4) with a coseismic dip-slip offset of 13.5 m ± 0.6 m along F2. In parallel, minor displacements along F1 (∼ 30 cm reverse faulting; see Fig. 7b), F6 (∼ 25 cm normal faulting), and F7 (∼ 35 cm normal faulting) accommodate the counterclockwise rotation of a ∼ 10 m long block of U5 and U6 underneath F2, likely associated with pure shear deformation under the weight of the propagating fold (see Fig. 5b). This event is predated by the deposition of U5 and postdated by the deposition of U4, hence bracketed at 100±160 BCE (Fig. 10). This brings U5 to its original undeformed geometry forming a near-horizontal unit deposited against a pre-existing scarp formed in U6, as attested by the onlap termination visible at grid point (38, 13) in Fig. 3a.
-
Event 5: this event is documented by the remaining scarp affecting U6 once previous events are retro-deformed and U5 is removed (Fig. 9g). Although the height of this scarp is poorly constrained, the retro-deformation analysis suggests it is at least 2 m high and was produced by slip along a shallow-dipping rupture (∼ 10∘ N), similar to F2 and F3 as observed at the base of the exposure (below z=1 m). Hence, we propose that the amount of slip involved during E5 is similar to what is inferred for E4. Furthermore, since the event took place between the deposition of units U6 and U5, it may be dated back to 485±125 BCE (Fig. 10).
A striking feature of surface deformation visible in the Piping exposure is the gradual change in fault dip over time. While all fault strands converge and dip 35–40∘ N below grid point (30, 2) they diverge from ∼ 10 to ∼ 50∘ N (locally 90∘) as they propagate to the south (Figs. 3 and 9), presenting a geometry similar to tri-shear folding (Allmendinger, 1998). In detail, the oldest event (E5) occurred while the top of unit U6 constituted the ground surface (i.e., the event horizon) and is expressed along a shallow 10∘ north-dipping duplex rupture. The situation is similar for E4. After deposition of units U4 and U3 adds 2.5–3 m of sediments on top of the E5 rupture, the following event (E3) emerges higher in the stratigraphic section along F3 with a steeper dip of 25–30∘. A consequent deposition episode adds at least 8.5 m of sediments (units U2, U1, and U0) over these ruptures. The most recent event(s) (E2–E1) exhibit a much steeper rupture (along strands F4 and F5) with a dip reaching ∼ 50∘ within unit U7 (coarse-grained terrace deposits) and 90∘ as it emerges to the present-day surface through unit U0 (fine-grained fan deposits).
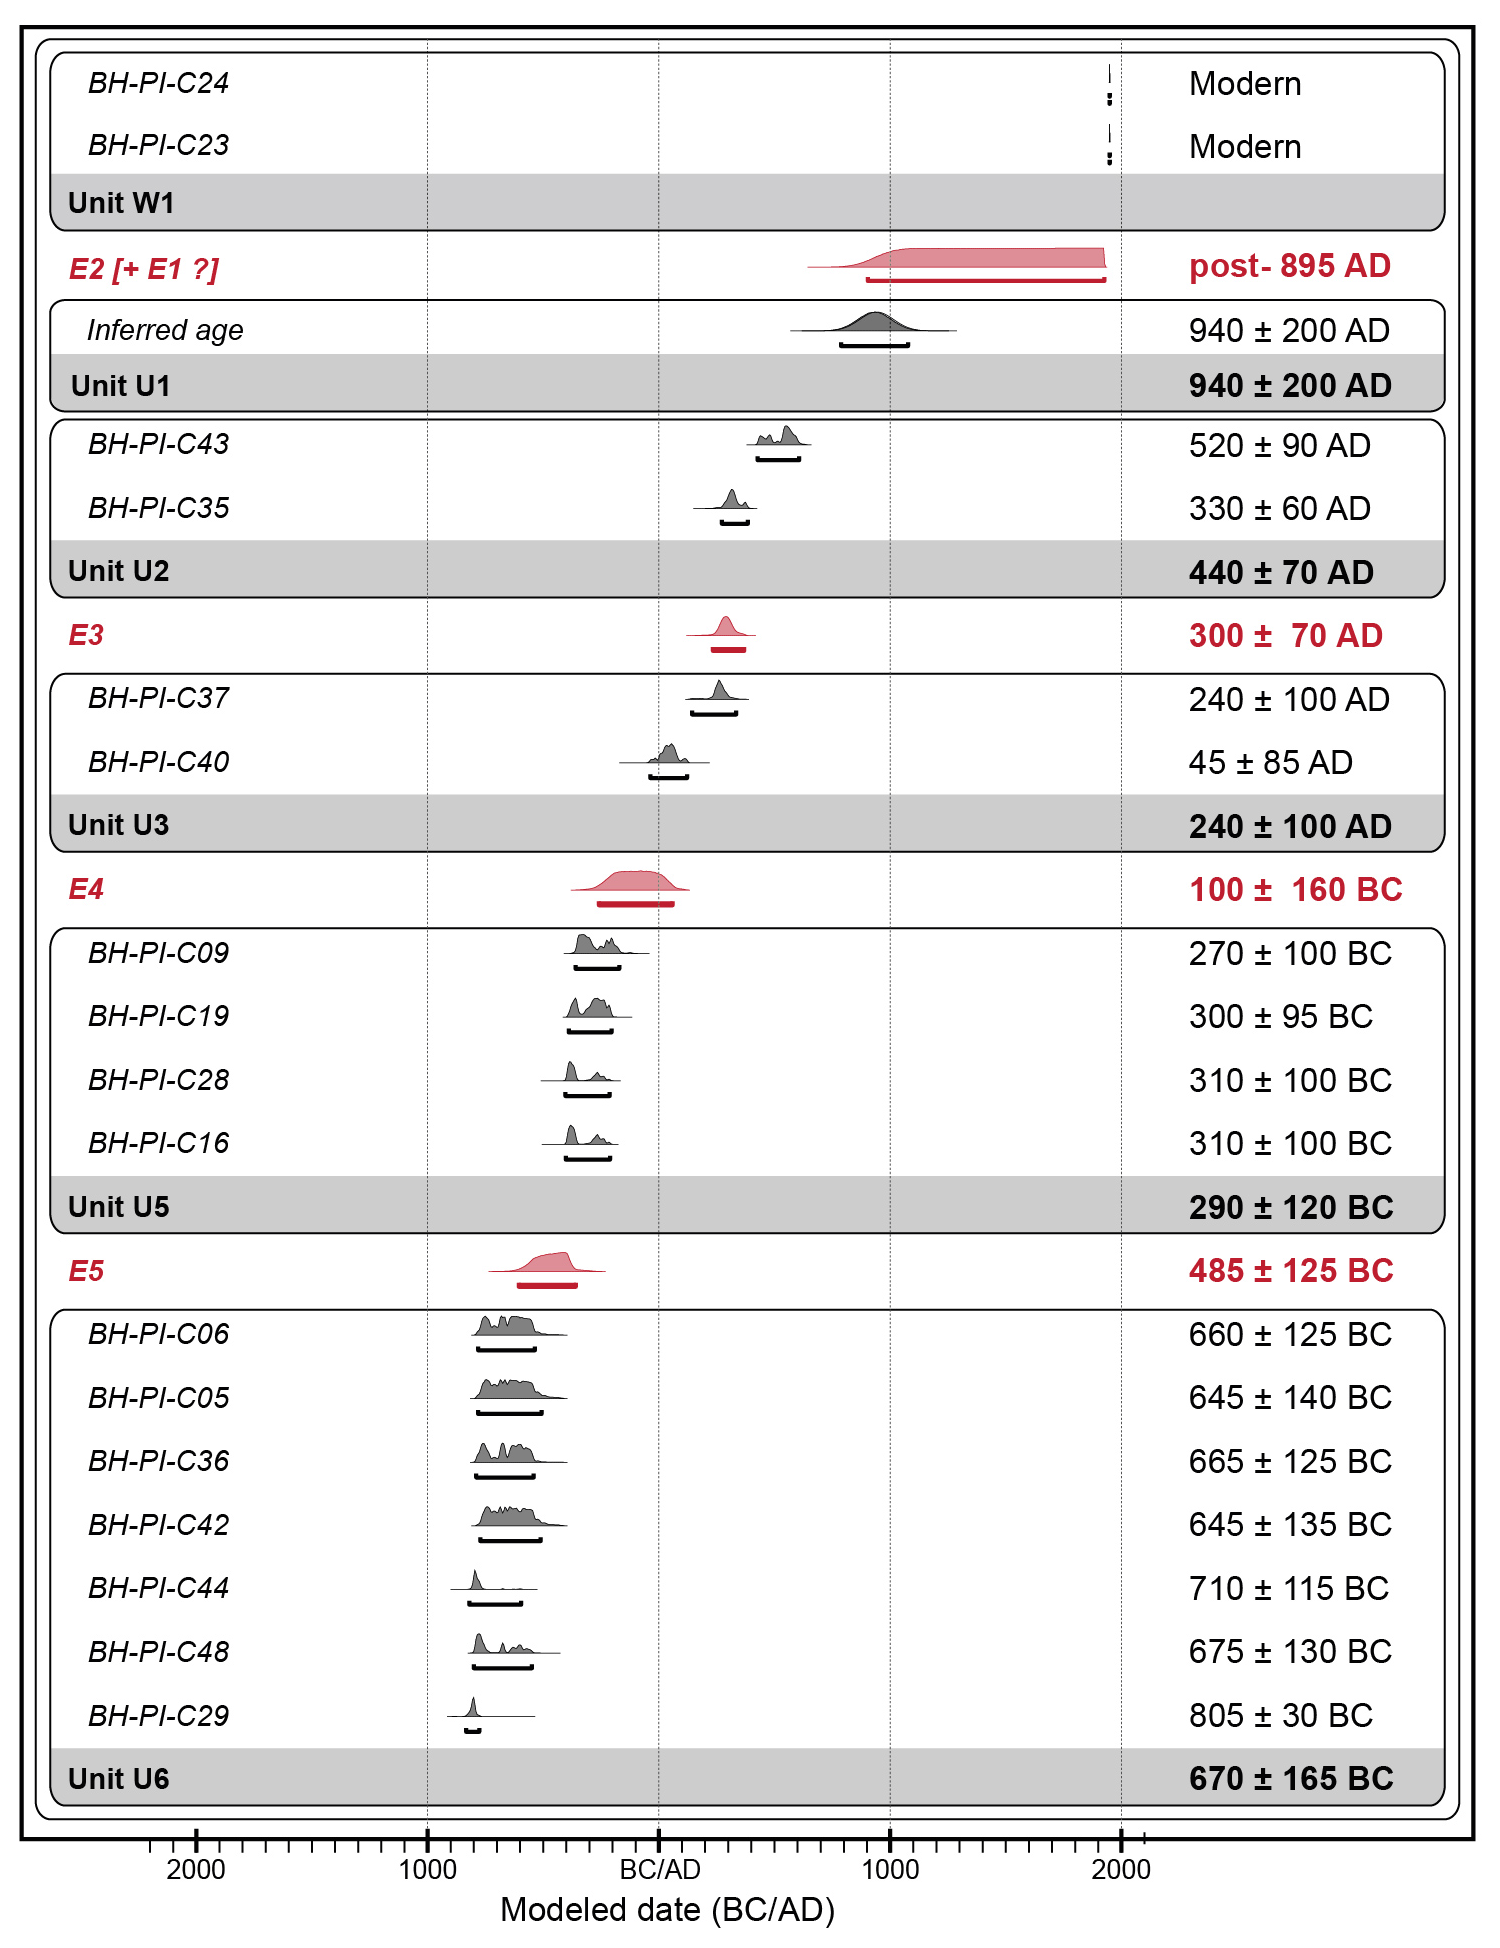
Figure 10Chronostratigraphic model for deposition episodes (alluvial units U0 to U6 and colluvial wedge W1) and surface-rupturing events (E5 to E1) at the Piping exposure. The model is built from abutting relationships between stratigraphy and faulting and is constrained by 18 detrital charcoal samples and one inferred age corresponding to the top of unit U1. All resulting calendar dates are rounded to the nearest multiple of 5.
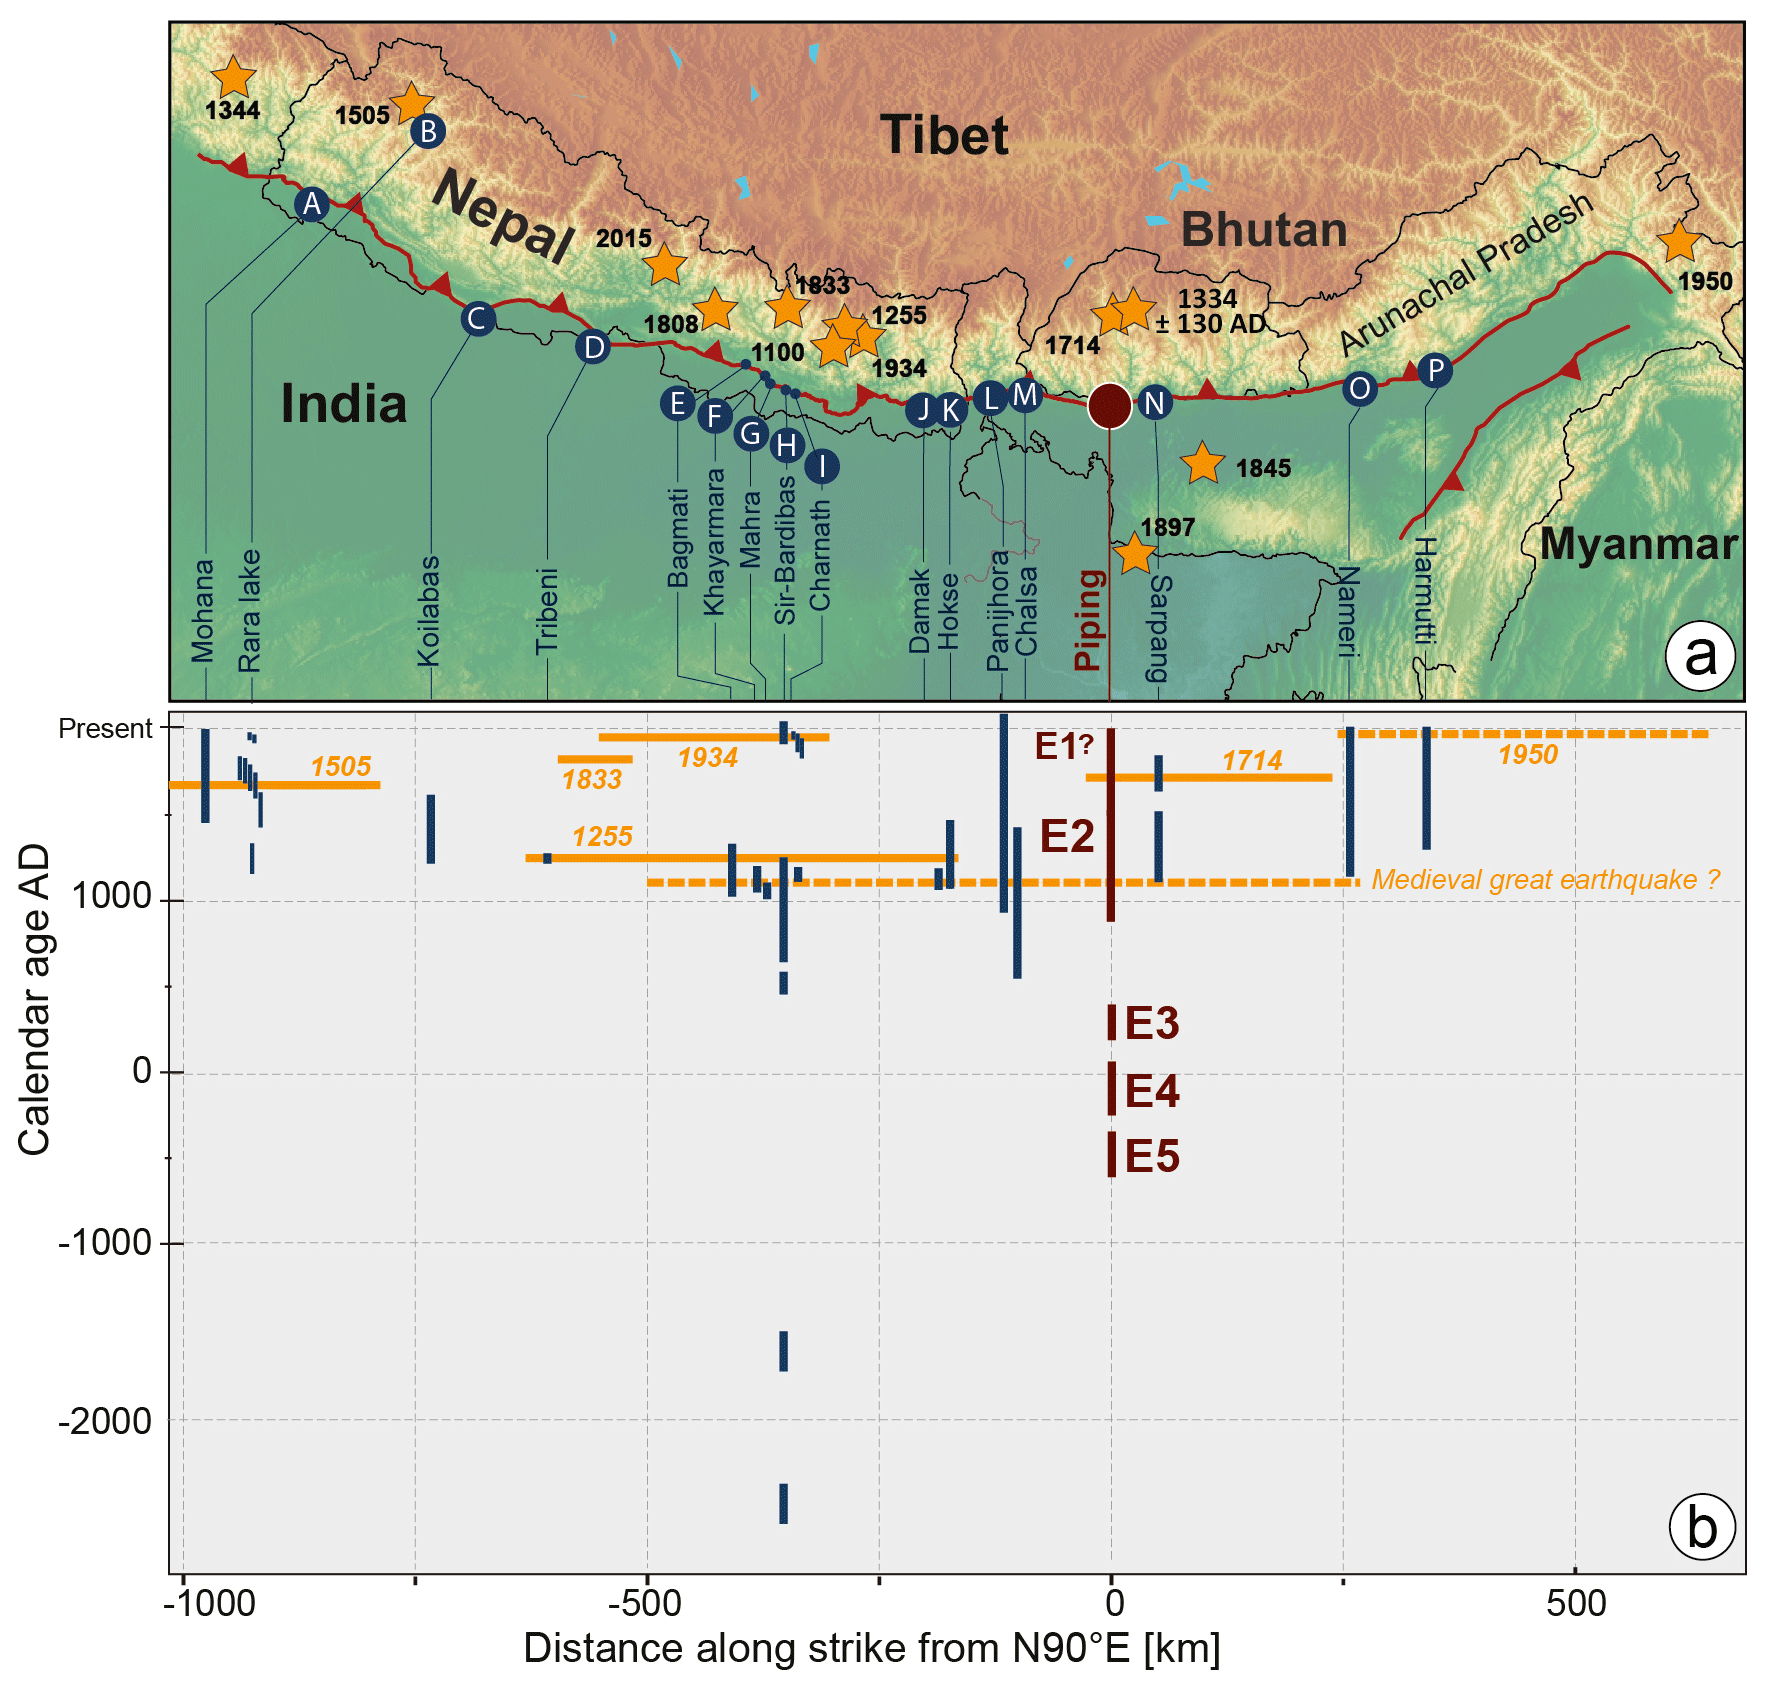
Figure 11(a) Synthesis of available paleoseismic records along the Himalayan Arc. (A) Mohana Khola (Yule et al., 2006); (B) Rara Lake (Ghazoui et al., 2019); (C) Koilabas Khola (Mugnier et al., 2011); (D, E) Tribeni and Bagmati (Wesnousky et al., 2017a); (F) Khayarmara (Wesnousky et al., 2019); (G) Marha Khola (Lavé et al., 2005); (H) Sir Bardibas (Sapkota et al., 2013; Bollinger et al., 2014); (I) Charnath (Rizza et al., 2019); (J) Damak (Wesnousky et al., 2017b); (K) Hokse (Nakata et al., 1998, Upreti et al., 2000); (L) Panijhora (Mishra et al., 2016); (M) Chalsa (Kumar et al., 2010); (N) Sarpang (Le Roux-Mallouf et al., 2016); (O) Nameri (Kumar et al., 2010); (P) Harmutti (Kumar et al., 2010). (b) Synoptic calendar and positions of great/large earthquakes along the Himalayan front (including instrumental, historical, and paleoseismic events). Orange horizontal bars approximate minimum source lengths with or without observed surface rupture. Vertical blue bars correspond to the radiocarbon-model constraints on the timing of the different events. Vertical brown bars correspond to ∼ 2600-year-long record deduced from the present study.
It is a common observation both in the field and in analog experiments that ruptures along thrust faults tend to flatten as they reach the surface under the influence of decreasing lithostatic pressure (e.g., Philip and Meghraoui, 1983; Lee et al., 2001). We propose that the change in deformation style from nearly horizontal (E5 and E4) to steep (E2) and then vertical (E1) displayed in the Piping trench reflects increasing vertical load on the foot of the tectonic scarp associated with the progressive buildup of the Ramphu Chu fan against it.
Paleoseismic investigations conducted along the MFT at the confluence between the Wang Chu and the Ramphu Chu in western Bhutan show an important cumulative deformation zone including a rich chronology of deposition phases and deformation events for the last ∼ 2600 years.
Historically, the most recent earthquake to have provoked massive destruction in the region is the 1714 CE earthquake, previously described as the 1713 CE earthquake by Ambraseys and Jackson (2003) and identified in the paleoseismic record by Berthet et al. (2014) and Le Roux-Mallouf et al. (2016) in the Sarpang area (∼ 50 km to the east; see Fig. 11). By combining historical and paleoseismic constraints, Hétényi et al. (2016) propose that this earthquake reached Mw 7.5–8.5 with a modeled rupture centered on Bhutan and largely encompassing the Piping site. A possible event E1, though insufficiently documented by unfavorable sedimentation here, would be consistent in terms of coseismic slip and chronology, and we propose that it may correspond to the 1714 CE earthquake. Similarly, event E2 is consistent with an event observed at the Sarpang site as well, dated to 1344±130 CE (Fig. 11) and tentatively associated with a medieval earthquake that may have ruptured a large section of the MFT (see Le Roux-Mallouf et al., 2016, and references therein). Hence, we propose that event E2 corresponds to that second event. Events E3, E4, and E5 occurred at 300±70 CE, 100±160 BCE, and 485±125 BCE, respectively.
Hence, according to our retro-deformation analysis and chronostratigraphic model, our results allow constraining the occurrence of five surface-rupturing events between 485±125 BCE and 1714 CE with an average recurrence interval of 550±211 years. When only considering events with the largest documented coseismic slip values (E2 to E5) that are the most likely to be preserved and observed in exposures, the average recurrence interval reaches 610±238 years. Our results are comparable to the lower values obtained for the late Holocene by Bollinger et al. (2014) in eastern Nepal (610 to 1220 years, depending on hypotheses). Furthermore, the relatively small coseismic slip value determined for E1 (and assigned to the 1714 CE earthquake) suggests smaller, though destructive, events may occur on occasion as was the case for the 2015 Gorkha earthquake in Central Nepal (e.g., Grandin et al., 2015), although there was no surface rupture associated with it.
The retro-deformation analysis also allows estimating associated dip-slip coseismic displacements with values ranging from 1.5 m ± 0.5 m for E1 to more than 12 m for E2, E3, E4, and probably E5, a value typical of the largest events documented along the Himalayas in Nepal, Sikkim, Bhutan, and Assam and consistent with extreme magnitudes on the order of Mw 8.5–9 (Le Roux-Mallouf et al., 2016, and references therein). Considering the largest events, this represents 40.4 m ± 10.8 m of slip (E2 + E3 + E4) accrued over 1629±255 years (between E5 and E2) at a rate of 24.9±10.4 mm yr−1. Although the duration of our dataset may be too limited to represent the long-term behavior of the MFT, this slip rate is consistent with those derived from 8 kyr old uplifted terraces in Sarpang (Fig. 11; Berthet et al., 2014) and from far-field GPS shortening rate measurements (Marechal et al., 2016). Together, these results suggest that the Himalayan convergence is mainly seismically accommodated along the MFT in western Bhutan as well.
We presented here the longest continuous record of paleo-earthquakes along the Himalayan Arc from the detailed study of an 18 m thick deformed sedimentary sequence dated from 17 radiocarbon samples. Well-expressed deformation and a detailed retro-deformation analysis reveal the occurrence of five surface-rupturing earthquakes along the MFT in southwestern Bhutan during the past ∼ 2600 years. The two most recent events can be related to the 1714 CE earthquake (Hétényi et al., 2016) and a medieval event (1344±130 CE) already described in south-central Bhutan (Le Roux-Mallouf et al., 2016). More strikingly, events E3, E4, and E5 are documented here for the first time and constitute some of the oldest paleo-earthquakes characterized in the central Himalayas (Fig. 11). Together, these events give an average earthquake recurrence interval of 550±211 years (or 610±238 years for the largest) for the Main Frontal Thrust in Bhutan.
The slip rate of 24.9±10.4 mm yr−1 obtained from cumulative slip is consistent with both Holocene rates obtained from uplifted terraces (Berthet et al., 2014) and the high interseismic coupling level inferred from geodetic measurements (Marechal et al., 2016), which suggests that the Himalayan convergence in western Bhutan is mainly seismically accommodated along the MFT. Moreover, this result suggests that – at least locally – the slip budget does not display significant deficit over the time period of this study (Stevens and Avouac, 2016). Finally, estimated coseismic displacements between ∼ 1.5 m and at least 12 m indicate the likely occurrence of large (between Mw ∼ 7.5 and Mw ∼ 8.5) and great earthquakes (Mw >8.5) at a single site. This complexity should be taken into account in probabilistic seismic hazard calculations.
Correspondence and requests for materials should be addressed to romain.lerouxmallouf@geolithe.com.
The supplement related to this article is available online at: https://doi.org/10.5194/se-11-2359-2020-supplement.
RLRM, MF, JFR, and PP conducted field work. RLRM and MF prepared the paper with contributions from all co-authors.
The authors declare that they have no conflict of interest.
This project is funded by the French Agence Nationale de la Recherche (ANR-13-BS06-0006-01) and CNES (Pleiades satellite images and field support). We would like to thank all people helping in the field and particularly our driver Phajo Kinley from the Department of Geology and Mines, Bhutan. We also thank Stephane Dominguez (Géosciences Montpellier) for fruitful discussions.
This paper was edited by Zoe Mildon and reviewed by two anonymous referees.
Ader, T., Avouac, J. P., Liu-Zeng, J., Lyon-Caen, H., Bollinger, L., Galetzka, J., Genrich, J., Thomas, M., Chanard, K., and Sapkota, S. N.: Convergence rate across the Nepal Himalaya and interseismic coupling on the Main Himalayan Thrust: Implications for seismic hazard, J. Geophys. Res., 117, B04403, https://doi.org/10.1029/2011JB009071, 2012
Allmendinger, R. W.: Inverse and forward numerical modeling of trishear fault-propagation folds, Tectonics, 17, 640656, https://doi.org/10.1029/98tc01907, 1998.
Ambraseys, N. and Jackson, D.: A note on early earthquakes in northern India and southern Tibet, Curr. Sci., 84, 570–582, 2003.
Avouac, J.-P., Meng, L., Wei, S., Wang, T., and Ampuero J.-P.: Lower edge of locked Main Himalayan Thrust unzipped by the 2015 Gorkha earthquake, Nat. Geosci., 9, 708–711, https://doi.org/10.1038/ngeo2518, 2015.
Berthet, T., Ritz, J. F., Ferry, M., Pelgay, P., Cattin, R., Drukpa, D., Braucher, R., and Hetényi, G.: Active tectonics of the eastern Himalaya: New constraints from the first tectonic geomorphology study in southern Bhutan, Geology, 42, 427–430, https://doi.org/10.1130/G35162.1, 2014.
Bilham, R., Gaur, V. K., and Molnar, P.: Himalayan seismic hazard, Science, 293, 1442–1444, 2001.
Bollinger, L., Sapkota, S. N., Tapponnier, P., Klinger, Y., Rizza, M., Van der Woerd, J., Tiwari, D. R., Pandey, R., Bitri, A., and Bes de Berc, S.: Estimating the return times of great Himalayan earthquakes in eastern Nepal: Evidence from the Patu and Bardibas strands of the Main Frontal Thrust, J. Geophys. Res.-Sol. Ea., 119, 7123–7163, https://doi.org/10.1002/2014JB010970, 2014.
Burgess, W. P., Yin, A., Dubey, C. S., Shen, Z. K., and Kelty, T. K.: Holocene shortening across the Main Frontal Thrust zone in the eastern Himalaya, Earth Planet. Sc. Lett., 357, 152–167, 2012.
Bronk Ramsey, C.: Bayesian analysis of radiocarbon dates, Radiocarbon, 51, 337–360, 2009.
Cattin, R. and Avouac, J. P.: Modeling mountain building and the seismic cycle in the Himalaya of Nepal, J. Geophys. Res.-Sol. Ea., 105, 13389–13407, 2000.
Coutand, I., Whipp Jr, D. M., Grujic, D., Bernet, M., Fellin, M. G., Bookhagen, B., Landry, K. R., Ghalley, S. K., and Duncan, C.: Geometry and kinematics of the Main Himalayan Thrust and Neogene crustal exhumation in the Bhutanese Himalaya derived from inversion of multithermochronologic data, J. Geophys. Res.-Sol. Ea., 119, 1446–1481, https://doi.org/10.1002/2013JB010891, 2014.
Gansser, A.: Geology of the Himalayas, Wiley Interscience, 1964.
Ghazoui, Z., Bertrand, S., Vanneste, K., Yokoyama, Y., Nomade, J., Gajurel, A. P., and van der Beek, P. A.: Potentially large post-1505 AD earthquakes in western Nepal revealed by a lake sediment record, Nat. Commun., 10, 1–9, 2019.
Grandin, R., Vallée, M., Satriano, C., Lacassin, R., Klinger, Y., Simoes, M., and Bollinger, L.: Rupture process of the Mw = 7.9 2015 Gorkha earthquake (Nepal): Insights into Himalayan megathrust segmentation, Geophys. Res. Lett., 42, 8373–8382, https://doi.org/10.1002/2015GL066044, 2015.
Grujic, D., Warren, C. J., and Wooden, J. L.: Rapid synconvergent exhumation of Miocene-aged lower orogenic crust in the eastern Himalaya, Lithosphere, 3, 346–366, https://doi.org/10.1130/L154.1, 2011.
Hetényi, G., Le Roux-Mallouf, R., Berthet, T., Cattin, R., Cauzzi, C., Phuntsho, K., and Grolimund, R.: Joint approach combining damage and paleoseismology observations constrains the 1714 A.D. Bhutan earthquake at magnitude 8±0.5, Geophys. Res. Lett., 43, 695–702, 2016.
Kumar, R., Suresh, N., Sangode, S. J., and Kumaravel, V.: Evolution of the Quaternary alluvial fan system in the Himalayan foreland basin: Implications for tectonic and climatic decoupling, Quaternary Int., 159, 6–20, 2007.
Kumar, S., Wesnousky, S. G., Jayangondaperumal, R., Nakata, T., Kumahara, Y., and Singh, V.: Paleoseismological evidence of surface faulting along the northeastern Himalayan front, India: Timing, size, and spatial extent of great earthquakes, J. Geophys. Res.-Sol. Ea., 115, 1–20, https://doi.org/10.1029/2009JB006789, 2010.
Lavé, J. and Avouac, J. P.: Active folding of fluvial terraces across the Siwaliks Hills, Himalayas of central Nepal, J. Geophys. Res.-Sol. Ea., 105, 5735–5770, 2000.
Lavé, J., Yule, D., Sapkota, S., Basant, K., Madden, C., Attal, M., and Pandey, R.: Evidence for a great medieval earthquake (∼ 1100 AD) in the central Himalayas, Nepal, Science, 307, 1302–1305, https://doi.org/10.1126/science.1104804, 2005.
Lee, J.-C., Chen, Y.-G., Sieh, K., Mueller, K., Chen, W.-S., Chu, H.-T., Chan, Y.-C., Rubin, C., and Yeats, R.: A Vertical Exposure of the 1999 Surface Rupture of the Chelungpu Fault at Wufeng, Western Taiwan: Structural and Paleoseismic Implications for an Active Thrust Fault, Bull. Seism. Soc. Am., 91, 914–929, https://doi.org/10.1785/0120000742, 2001.
Le Fort, P.: Himalaya: the collided range. Present knowledge of the continental arc, Am. J. Sci., 275, 1–44, 1975.
Le Roux-Mallouf, R., Godard, V., Cattin, R., Ferry, M., Gyeltshen, J., Ritz, J. F., Drupka, D., Guillou, V., Arnold, M., Aumaître, G., Bourlès, D. L., and Keddadouche, K.: Evidence for a wide and gently dipping Main Himalayan Thrust in western Bhutan, Geophys. Res. Lett., 42, 3257–3265, https://doi.org/10.1002/2015GL063767, 2015.
Le Roux-Mallouf, R., Ferry, M., Ritz, J. F., Berthet, T., Cattin, R., and Drukpa, D.: First paleoseismic evidence for great surface-rupturing earthquakes in the Bhutan Himalayas, J. Geophys. Res.-Sol. Ea., 121, 7271–7283, 2016.
Lienkaemper, J. J. and Bronk Ramsey, C.: OxCal: Versatile Tool for Developing Paleoearthquake Chronologies – A Primer, Seismol. Res. Lett., 80, 431–434, https://doi.org/10.1785/gssrl.80.3.431, 2009.
Long, S., McQuarrie, N., Tobgay, T., Grujic, D., and Hollister, L.: Geologic Map of Bhutan, J. Maps, 7, 184–192, https://doi.org/10.4113/jom.2011.1159, 2011a.
Long, S., McQuarrie, N., Tobgay, T., Rose, C., Gehrels, G., and Grujic, D.: Tectonostratigraphy of the Lesser Himalaya of Bhutan: Implications for the along-strike stratigraphic continuity of the northern Indian margin, Geol. Soc. Am. Bull., 123, 1406–1426, 2011b.
Malik, J. N., Naik, S. P., Sahoo, S., Okumura, K., and Mohanty, A.: Paleoseismic evidence of the CE 1505 (?) and CE 1803 earthquakes from the foothill zone of the Kumaon Himalaya along the Himalayan Frontal Thrust (HFT), India, Tectonophysics, 714/715, 133–145, https://doi.org/10.1016/j.tecto.2016.07.026, 2017.
Marechal, A., Mazzotti, S., Cattin, R., Cazes, G., Vernant, P., Drukpa, D., Kinzang, T., Tarayoun, A., Le Roux-Mallouf, R., and Thapa, B. B.: Evidence of interseismic coupling variations along the Bhutan Himalayan arc from new GPS data, Geophys. Res. Lett., 43, 12399–12406, 2016.
McQuarrie, N., Robinson, D., Long, S., Tobgay, T., Grujic, D., Gehrels, G., and Ducea, M.: Preliminary stratigraphic and structural architecture of Bhutan: Implications for the along strike architecture of the Himalayan system, Earth Planet. Sc. Lett., 272, 105–117, https://doi.org/10.1016/j.epsl.2008.04.030, 2008.
Meghraoui, M., Aksoy, M. E., Akyüz, H. S., Ferry, M., Dikbaş, A., and Altunel, E.: Paleoseismology of the North Anatolian fault at Güzelköy (Ganos segment, Turkey): Size and recurrence time of earthquake ruptures west of the Sea of Marmara, Geochem. Geophy. Geosy., 13, https://doi.org/10.1029/2011GC003960, 2012.
Miller, K. L., Reitz, M. D., and Jerolmack, D. J.: Generalized sorting profile of alluvial fans, Geophys. Res. Lett., 41, 7191–7199. https://doi.org/10.1002/2014gl060991, 2014.
Mishra, R. L., Singh, I., Pandey, A., Rao, P. S., Sahoo, H. K., and Jayangondaperumal, R.: Paleoseismic evidence of a giant medieval earthquake in the eastern Himalaya, Geophys. Res. Lett., 43, 5707–5715, 2016.
Mugnier, J.-L., Gajurel, A., Huyghe, P., Jayangandaperumal, R., Jouanne, F., and Upreti, B.: Structural interpretation of the great earthquakes of the last millennium in the central Himalaya, Earth Sci. Rev., 127, 30–47, https://doi.org/10.1016/j.earscirev.2013.09.003, 2013.
Nábělek, J., Hetényi, G., Vergne, J., Sapkota, S., Kafle, B., Jiang, M., and Huang, B. S.: Underplating in the Himalaya-Tibet collision zone revealed by the Hi-CLIMB experiment, Science, 325, 1371–1374, 2009.
Nakata, T., Kumura, K., and Rockwell, T.: First successful paleoseismic trench study on active faults in the Himalaya, Eos Trans. AGU, 79, 45, 1998.
Nelson, K. D., Zhao, W., Brown, L. D., and Kuo, J.: Partially molten middle crust beneath southern Tibet: synthesis of project INDEPTH results, Science, 274, 1684–1688, 1996.
Philip H. and Meghraoui, M.: Structural analysis and interpretation of the surface deformations of the El Asnam Earthquake of October 10, 1980, Tectonics, 2, 17–49, https://doi.org/10.1029/TC002i001p00017, 1983.
Rajendran, C. P. and Rajendran, K.: The status of central seismic gap: a perspective based on the spatial and temporal aspects of the large Himalayan earthquakes, Tectonophysics, 395, 19–39, https://doi.org/10.1016/j.tecto.2004.09.009, 2005.
Rajendran, C. P., John, B., and Rajendran, K.: Medieval pulse of great earthquakes in the central Himalaya: Viewing past activities on the frontal thrust, J. Geophys. Res.-Sol. Ea., 120, 1623–1641 https://doi.org/10.1002/2014JB011015, 2015.
Rizza, M., Bollinger, L., Sapkota, S. N., Tapponnier, P., Klinger, Y., Karakaş, Ç., Kali, E., Etchebes, M., Tiwari, D. R., and Siwakoti, I.: Post earthquake aggradation processes to hide surface ruptures in thrust systems: The M8.3, 1934, Bihar-Nepal earthquake ruptures at Charnath Khola (Eastern Nepal), J. Geophys. Res.-Sol. Ea., 124, 9182–9207, 2019.
Rockwell, T. K., Dawson, T. E., Ben-Horin, J. Y., and Seitz, G. A.: 21-event, 4,000-year history of surface ruptures in the Anza seismic gap, San Jacinto Fault, and implications for long-term earthquake production on a major plate boundary fault, Pure Appl. Geophys., 172, 1143–1165, 2015.
Sapkota, S. N., Bollinger, L., Klinger, Y., Tapponnier, P., Gaudemer, Y., and Tiwari, D.: Primary surface ruptures of the great Himalayan earthquakes in 1934 and 1255, Nat. Geosci., 6, 71–76, https://doi.org/10.1038/ngeo1669, 2013.
Srivastava, H. N., Bansal, B. K., and Verma, M.: Largest earthquake in Himalaya: An appraisal, J. Geol. Soc. India, 82, 15–22, 2013.
Stevens, V. L. and Avouac, J.-P.: Millenary Mw > 9.0 earthquakes required by geodetic strain in the Himalaya, Geophys. Res. Lett., 43, 1118–1123, https://doi.org/10.1002/2015GL067336, 2016.
Upreti, B. N., Nakata, T., Kumahara, Y., Yagi, H., Okumura, K., Rockwell, T. K., Virdi, N. S., and Maemoku, H.: The latest active faulting in Southeast Nepal, in: Proceedings of the Hokudan International Symposium and School in Active Faulting, Awaji Island, Hyogo Japan, 533–536, 2000.
Wesnousky, S. G., Kumahara, Y., Chamlagain, D., Pierce, I. K., Karki, A., and Gautam, D.: Geological observations on large earthquakes along the Himalayan frontal fault near Kathmandu, Nepal, Earth Planet. Sc. Lett., 457, 366–375, 2017a.
Wesnousky, S. G., Kumahara, Y., Chamlagain, D., Pierce, I. K., Reedy, T., Angster, S. J., and Giri, B.: Large paleoearthquake timing and displacement near Damak in eastern Nepal on the Himalayan Frontal Thrust, Geophys. Res. Lett., 44, 8219–8226, 2017b.
Wesnousky, S. G., Kumahara, Y., Chamlagain, D., and Neupane, P. C.: Large Himalayan Frontal Thrust paleoearthquake at Khayarmara in Eastern Nepal, J. Asian Earth Sci, 174, 346–351, 2019.
Yule, D., Lave, J., Sapkota, S. N., Tiwari, D., Kafle, B., Pandey, M. R., Dawson, S., Madden, C., and Attal, M.: Large surface rupture of the Main Frontal Thrust in east-central and western Nepal-Evidence for an unprecedented type of Himalayan earthquake, in: Proceedings on the International Workshop on Seismology, seismotectonics and seismic hazard in the Himalayan region, Kathmandu, India, 28–29 November 2006, 13–14, 2006.
Zhao, W., Nelson, K. D., Che, J., Quo, J., Lu, D., Wu, C., and Liu, X.: Deep seismic reflection evidence for continental underthrusting beneath southern Tibet, Nature, 366, 557–559, 1993.