the Creative Commons Attribution 4.0 License.
the Creative Commons Attribution 4.0 License.
 | 11 Dec 2020
Measuring hydraulic fracture apertures: a comparison of methods
Chaojie Cheng
Sina Hale
Harald Milsch
Philipp Blum
Hydraulic fracture apertures predominantly control fluid transport in fractured rock masses. Hence, the objective of the current study is to investigate and compare three different laboratory-scale methods to determine hydraulic apertures in fractured (Fontainebleau and Flechtinger) sandstone samples with negligible matrix permeability. Direct measurements were performed by using a flow-through apparatus and a transient-airflow permeameter. In addition, a microscope camera permitted measuring the mechanical fracture apertures from which the corresponding hydraulic apertures were indirectly derived by applying various empirical correlations. Single fractures in the sample cores were generated artificially either by axial splitting or by a saw cut resulting in hydraulic apertures that ranged between 8 and 66 µm. Hydraulic apertures, accurately determined by the flow-through apparatus, are used to compare results obtained by the other methods. The transient-airflow permeameter delivers accurate values, particularly when repeated measurements along the full fracture width are performed. In this case, the derived mean hydraulic fracture apertures are in excellent quantitative agreement. When hydraulic apertures are calculated indirectly from optically determined mechanical apertures using empirical equations, they show larger variations that are difficult to compare with the flow-through-derived results. Variations in hydraulic apertures as observed between methods are almost certainly related to differences in sampled fracture volume. Overall, using direct flow-through measurements as a reference, this study demonstrates the applicability of portable methods to determine hydraulic fracture apertures at both the laboratory and outcrop scales.
- Article
(7747 KB) - Full-text XML
-
Supplement
(109 KB) - BibTeX
- EndNote


Rock fracture aperture, allowing for fluid flow, mainly controls the transport properties of rock masses in the subsurface. This quantity is of significant importance for both natural fluid flow within the Earth's crust and geotechnical applications such as oil and gas exploitation in petroleum reservoirs, hydrothermal fluid flow in geothermal systems, CO2 sequestration, and the underground storage of nuclear waste. Thus, reliable and accurate methods for determining fracture aperture and therefore the permeability of fractured rocks are essential.
The hydraulic aperture, which permits a certain flow rate at a given pressure gradient, represents the capability of fluid flow through a rock fracture. It is typically derived by assuming a parallel-plate model (Snow, 1969; Neuzil and Tracy, 1981; Barton et al., 1985; Tsang, 1992). For the laminar flow of an incompressible Newtonian fluid between two smooth and parallel plates, the flow rate is proportional to the third power of hydraulic aperture, which is commonly referred to as the “cubic law” (Witherspoon et al., 1980). In contrast, the mechanical aperture is defined as the arithmetic average distance between the adjacent fracture walls measured perpendicular to a reference plane (Barton et al., 1985; Hakami and Larsson, 1996; Renshaw et al., 2000). Previously, the relative roughness expressed by the ratio of the standard deviation of the measured mechanical aperture and the mean mechanical aperture was used to estimate hydraulic fracture aperture (Zimmerman et al., 1991; Renshaw, 1995; Barton and de Quadros, 1997; Xiong et al., 2011; Kling et al., 2017). In addition, a correlation between hydraulic and mechanical aperture was established introducing the contact area ratio, defined as the ratio of the true contact area of fracture asperities and the apparent total fracture surface area of a single fracture (Walsh, 1981). The hydraulic aperture of a single fracture can be determined either directly by using the cubic law or indirectly based on the mechanical aperture.
Typically, the evaluation of the hydraulic aperture is often performed on fractured core samples using flow-through apparatuses at the laboratory scale. Moreover, outcrop studies are widely used to characterize fracture patterns involving, e.g., orientations, distribution, length, and networks within a certain reservoir unit to evaluate its hydraulic performance (Zeeb et al., 2013). The fracture information obtained from outcrops can help define a physical model to understand subsurface fractures (e.g., Bruines, 2003; Watkins et al., 2015; Ukar et al., 2019). Therefore, collecting as much detailed information as possible from the outcrop itself is essential for any further assessment of fracture properties and behavior. Although the hydraulic apertures measured on outcrops do not directly represent hydraulic fracture properties at depth, they can provide valuable results in this regard. Lately, portable devices such as airflow permeameters, which are easier to use and less costly in comparison to flow-through tests, were developed to investigate both porous rocks and fractures on outcrop profiles (Brown and Smith, 2013). With such devices, large outcrop surfaces as well as anisotropy in a porous rock's transport properties were investigated (Huysmans et al., 2008; Rogiers et al., 2013, 2014). However, the reliability of this approach for natural rough fractures remains to be elucidated since the basic calibration of such measurements is only performed using parallel-plate fractures.
Furthermore, the hydraulic aperture of a fractured rock can also be characterized indirectly by statistical measurements of mechanical aperture such as image analysis of fracture profiles performed by progressively grinding an epoxy resin-fixed sample in predefined intervals (e.g., Snow, 1970; Hakami and Larsson, 1996; Konzuk and Kueper, 2004), fracture topography determination using profilometry (e.g., Brown and Scholz, 1985a, b; Matsuki, 1999), X-ray computer tomography (e.g., Kling et al., 2016), structure from motion photogrammetry (e.g., Corradetti et al., 2017; Zambrano et al., 2019), magnetic resonance imaging (e.g., Renshaw et al., 2000), and optical methods applied to rock replicas (e.g., Isakov et al., 2001; Ogilvie et al., 2003; Ogilvie et al., 2006). With known fracture surface topographies and fracture aperture patterns, flow-through properties or hydraulic apertures can be evaluated by numerical fluid flow simulations (e.g., Nemoto et al., 2009; Zambrano et al., 2019) or empirical correlations (e.g., Renshaw, 1995; Kling et al., 2017). All these methods have certain limitations, such as being only applicable within the laboratory scale or requiring open fracture surfaces. Correlations between hydraulic and mechanical apertures were commonly established based on 3D information, providing a valuable understanding of the transport properties of fractures (Renshaw, 1995; Barton and de Quadros, 1997; Xiong et al., 2011; Kling et al., 2017). Nevertheless, outcrop studies can only provide single fracture profiles rather than an entire fracture configuration, and the question addressed here is whether one can apply these correlations to estimate hydraulic properties based on representative fracture profiles. Accordingly, hydraulic fracture apertures derived by the aforementioned methods have to be compared and evaluated regarding their reliability.
In this study, a systematic comparison of three different methods to determine hydraulic fracture apertures using (1) a flow-through apparatus, (2) a transient-airflow permeameter, and (3) a microscope camera was performed on the same set of sandstone samples to evaluate the reliability, accuracy, and comparability of the results. Natural fractures might appear aligned or mismatched, rough or relatively smooth at different scales, which would affect their hydraulic properties significantly (Barton et al., 1985; Brown, 1995; Zambrano et al., 2019). Thus, the hydraulic aperture was measured on various types of artificially induced single rock fractures, i.e., mismatched rough tensile fractures with defined relative offsets, a matched rough tensile fracture, a saw-cut rough fracture, and a saw-cut smooth fracture. Hence, the purpose of this study is a methodological comparison rather than a study on specific rock types.
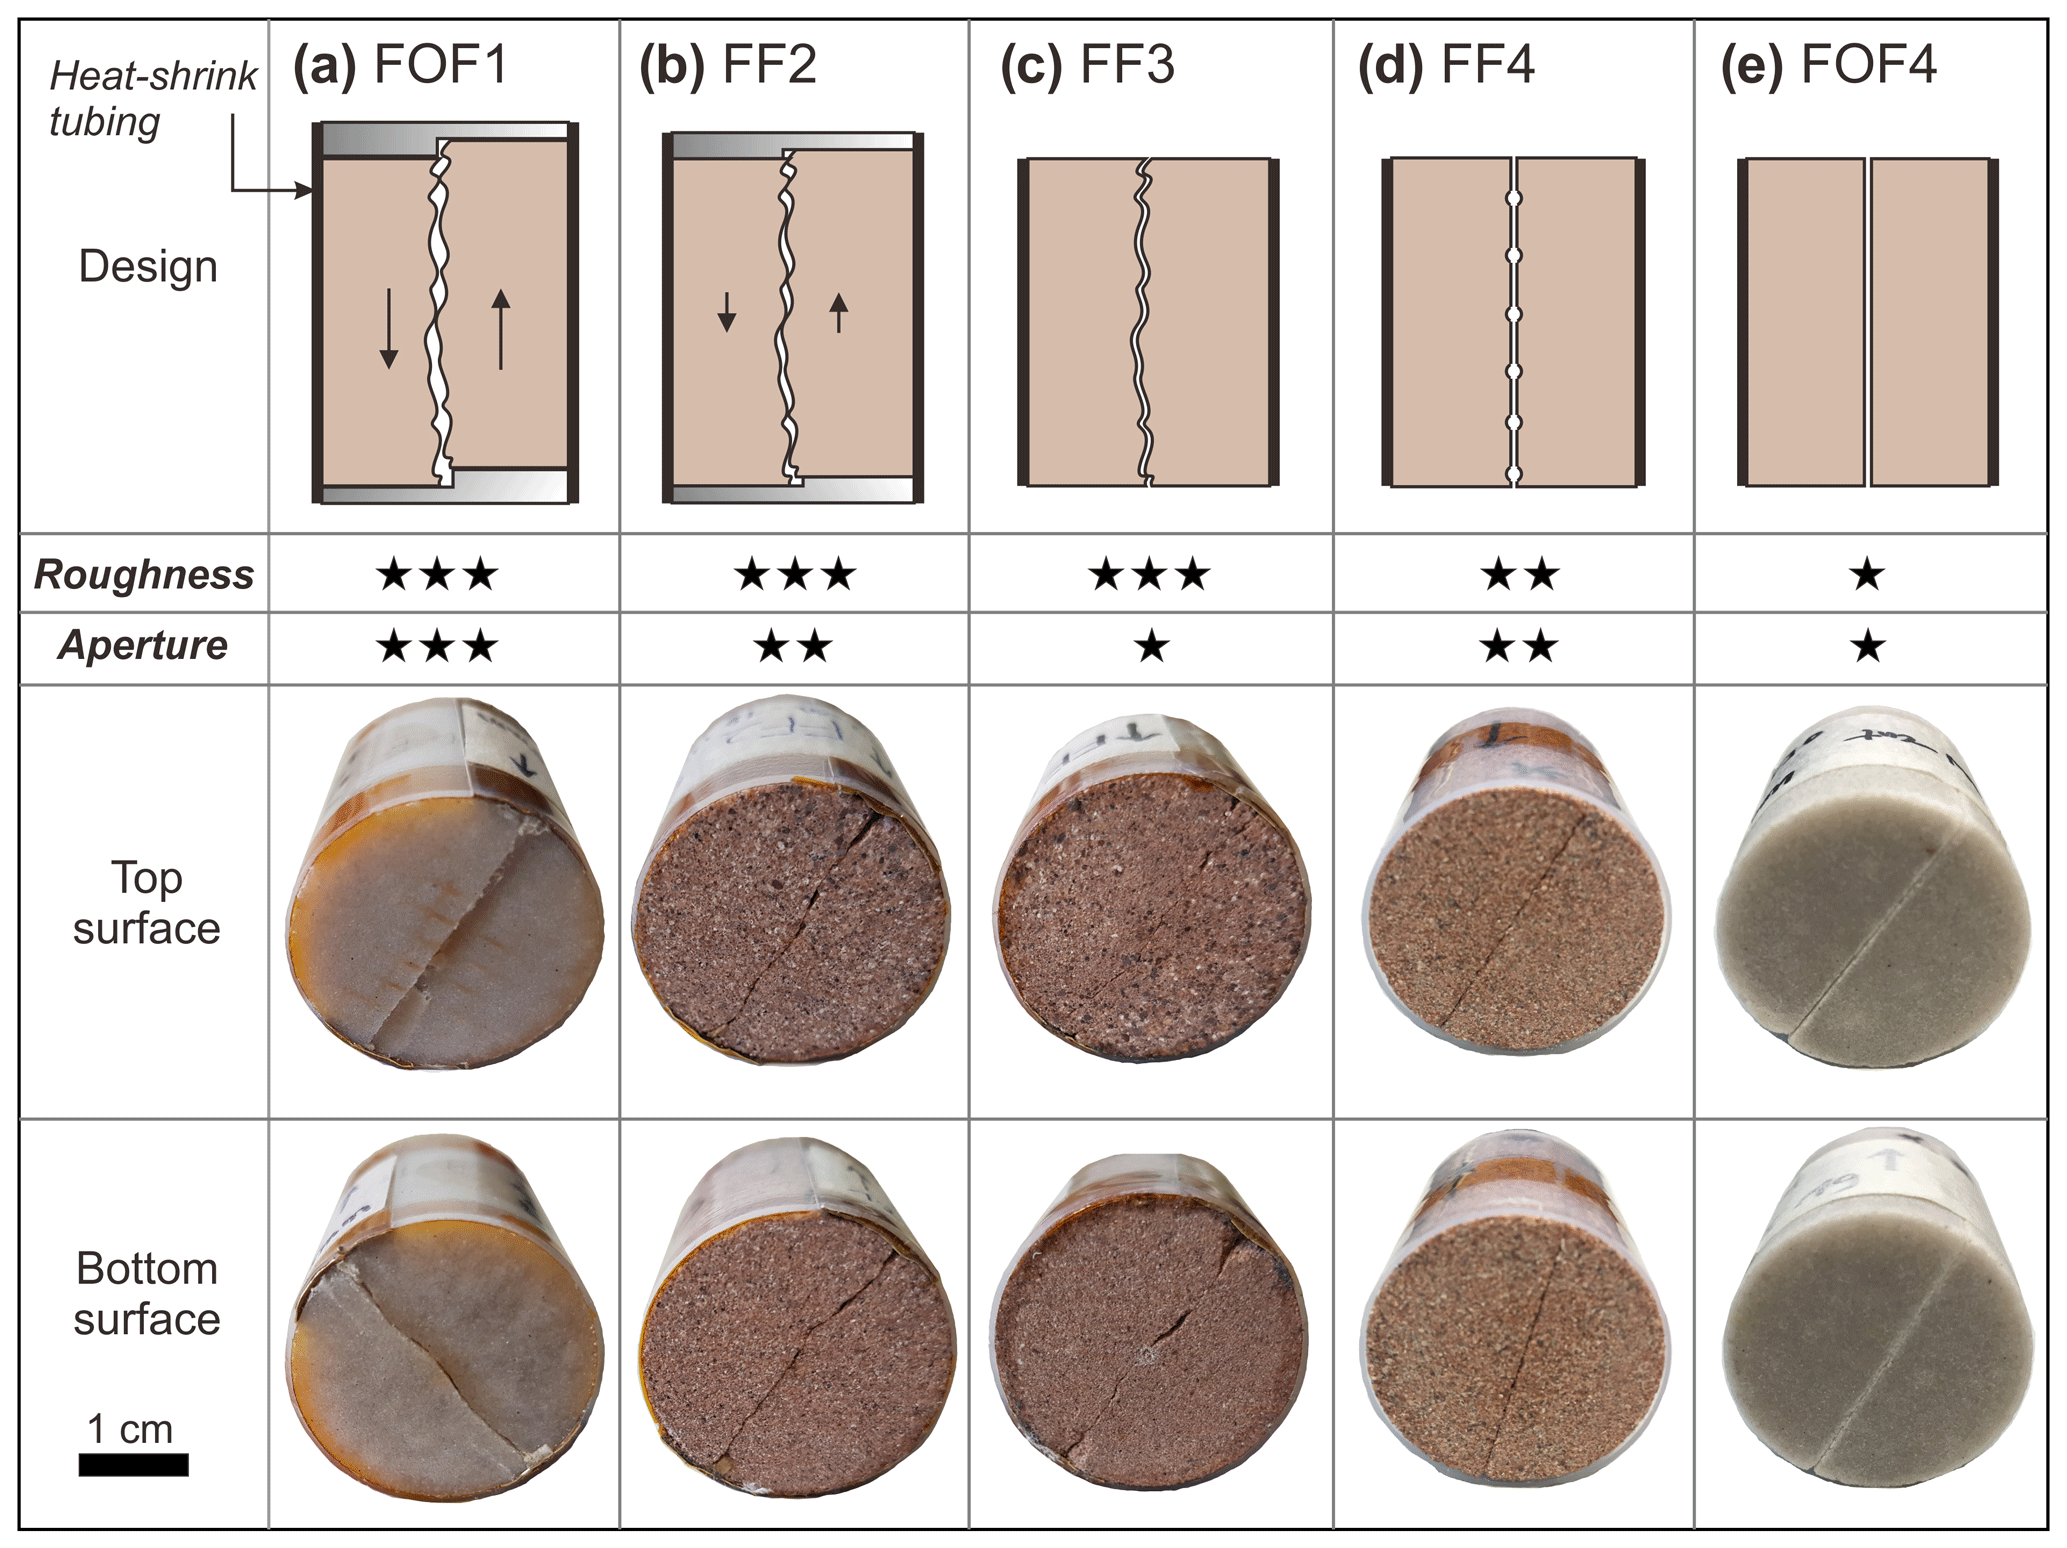
Figure 1Fracture configurations used in this study and strategy of sample preparation. The number of stars qualitatively indicates the relative intensity of surface roughness and fracture aperture. The top and bottom sample surfaces were used for the measurements of the mechanical aperture. (a) FOF1, tensile fracture with a pre-offset of 0.75 mm along the sample axis; (b) FF2, tensile fracture with a pre-offset of 0.2 mm; (c) FF3, matched tensile fracture; (d) FF4, saw-cut rough fracture; (e) FOF4, saw-cut smooth fracture.
2.1 Rock samples
Five cylindrical sandstone core samples, namely Fontainebleau sandstone (e.g., Saadi et al., 2017) (labeled FOF1 and FOF4) and Flechtinger sandstone (e.g., Fischer et al., 2012) (labeled FF2, FF3, and FF4) with 30 mm in diameter and 40 mm in length were prepared for this study. The porosity and the average pore diameter, as determined by mercury intrusion porosimetry, of the present Fontainebleau and Flechtinger sandstones are 2.3 % and 0.7 µm and 9.4 % and 3.8 µm, respectively. Both rocks are characterized by a low matrix permeability in the order of 10−18 m2 as derived from previous measurements (e.g., Blöcher et al., 2009). Single tensile fractures or saw-cut fractures were artificially induced along the sample axis (Fig. 1). Tensile fractures in FOF1, FF2, and FF3 were induced using a Brazilian test setup yielding negligible edge damage at a displacement rate of 2 × 10⁻⁶ m s−1. The separated halves were subsequently assembled with or without installing polyether ether ketone (PEEK) gaskets on the top and bottom of the sample to create fixed displacements with pre-offsets of 0.75 mm (FOF1) and 0.20 mm (FF2). The two halves of sample FF3 were matched without offset. Samples FF4 and FOF4 contained a single saw-cut fracture. Due to the larger pore size and higher porosity of Flechtinger sandstone, the fracture roughness of FF4 is significantly higher compared to that of FOF4. A heat-shrink tubing was used to jacket the samples comprising a thin metal sheet placed between the fracture gap and the jacket to minimize a risk of jacket rupture when the sample is under pressure in the flow-through apparatus. For all measurements, the samples were constrained by this heat-shrink tubing ensuring comparability between methods as the respective fracture configuration was identical in each case.

Figure 2Images of experimental devices (a–c) and illustration of the applied methodology used for hydraulic fracture aperture determination (d–f). (a) Flow-through apparatus; (b) portable transient-airflow permeameter (“TinyPerm 3”); (c) microscope camera; (d) steady-state flow test with (a) to determine hydraulic aperture based on the “cubic law”; (e) hydraulic aperture measured with (b) by transient air withdrawal from the rock sample to the vacuum syringe; (f) 2D mechanical aperture profile observed with (c).
2.2 Experimental methods
As shown in Fig. 2, three different experimental devices were used to investigate the hydraulic aperture of the five samples, namely (1) a flow-through apparatus (FTA; Fig. 2a), (2) a transient-airflow permeameter (TP; Fig. 2b), and (3) a microscope camera (MC; Fig. 2c). All samples were measured with each method in the order FTA, TP, and MC. A brief outline of the three devices and the respective methods is provided subsequently.
2.2.1 Flow-through apparatus
The absolute liquid (water) permeability of the fractured core samples was measured using an FTA, as shown in Fig. 2a (Milsch et al., 2008), where the jacketed sample core is mounted in a pressure vessel (Fig. 2d). The hydrostatic confining pressure is generated with silicon oil using a syringe pump (ISCO 65D). The pore pressure is controlled by a downstream pump (ISCO 260D) set at constant pressure mode. The upstream pump (ISCO 260D) is connected to the inlet at the lower end of the sample providing a constant fluid flow rate. During a flow-through experiment the pressure difference between the sample ends is monitored by a differential pressure transducer (IPD 40, ICS Schneider Messtechnik) with a measurable range of 0.0–0.6 MPa and an accuracy of < 0.2 %. Deionized water was used as the pore fluid and the permeability of the sample ksample was evaluated using Darcy's Law (Darcy, 1856):
where Q, μ, L, and Δp are the flow rate, the dynamic fluid viscosity, the sample length, and the differential pressure between the sample ends, respectively. A is the cross-sectional area of the sample. In the case of the sample permeability being very large compared to the matrix permeability, it is reasonable to assume that the total amount of flow through the sample is equal to the flow through the artificial fracture (Hofmann et al., 2016). Then, based on the cubic law and the assumption of laminar flow through the fracture, the fracture permeability can be evaluated from the hydraulic aperture determined by using a parallel-plate approximation (Snow, 1969; Witherspoon et al., 1980; Milsch et al., 2016):
where W is the fracture width equal to the sample diameter, kf is the fracture permeability, and aFTA is the hydraulic aperture obtained by the flow-through apparatus. In the following, we will compare aFTA as directly derived from hydraulic measurements with the results obtained by the other two methods.
2.2.2 Transient-airflow permeameter
A TP (“TinyPerm 3” by New England Research Inc.) was used to independently determine the hydraulic fracture aperture of a sample (Fig. 2b). This portable device can be applied both in the laboratory and the field for direct measurements on core samples and outcrops, respectively. The theory of this device was derived by Brown and Smith (2013) yielding a response function H:
where Q(t) is the flow profile and P0(t) is the pressure profile through time measured by the instrument's pressure transducer and flowmeters. Figure 2e shows the measurement principle. By pushing down the piston to create a vacuum within the chamber, air starts to flow from the sample to the syringe through the nozzle tip, ultimately re-establishing atmospheric pressure conditions therein. Consequently, two time-dependent profiles Q(t) and P0(t) can be obtained. It should be noted that the measured response function H is strongly related to the sample permeability and that other parameters, such as the geometry of the rock specimen, are also needed to ultimately determine permeability. Some of these parameters may be difficult to obtain, especially in the field. Thus, an empirical calibration of the device was conducted with an artificial fracture consisting of two polished granite samples whose aperture can be controlled by the thickness of feeler gauges in between, yielding (Brown and Smith, 2013)
where aTP is the hydraulic fracture aperture, which is assumed equivalent to the known separation (i.e., the mechanical aperture) of the parallel granite plates, and T is a value obtained from a measurement with the TP, which is the common logarithm of the final H when the pressure in the syringe returns to ambient pressure. Based on this empirical calibration and by directly measuring the response function H, hydraulic fracture apertures can be determined with this device (New England Research, 2015). The validity of this method was tested on parallel-plate fractures in the range between 20 µm and 2 mm, yielding a insignificantly small uncertainty of ± ∼ 1.4 % (Brown and Smith, 2013). Nevertheless, for natural rough fractures, to our knowledge, no validation and also no precision assessment have been performed yet. Based on measurements with this device, we will demonstrate its reliability for applications on natural fractures.
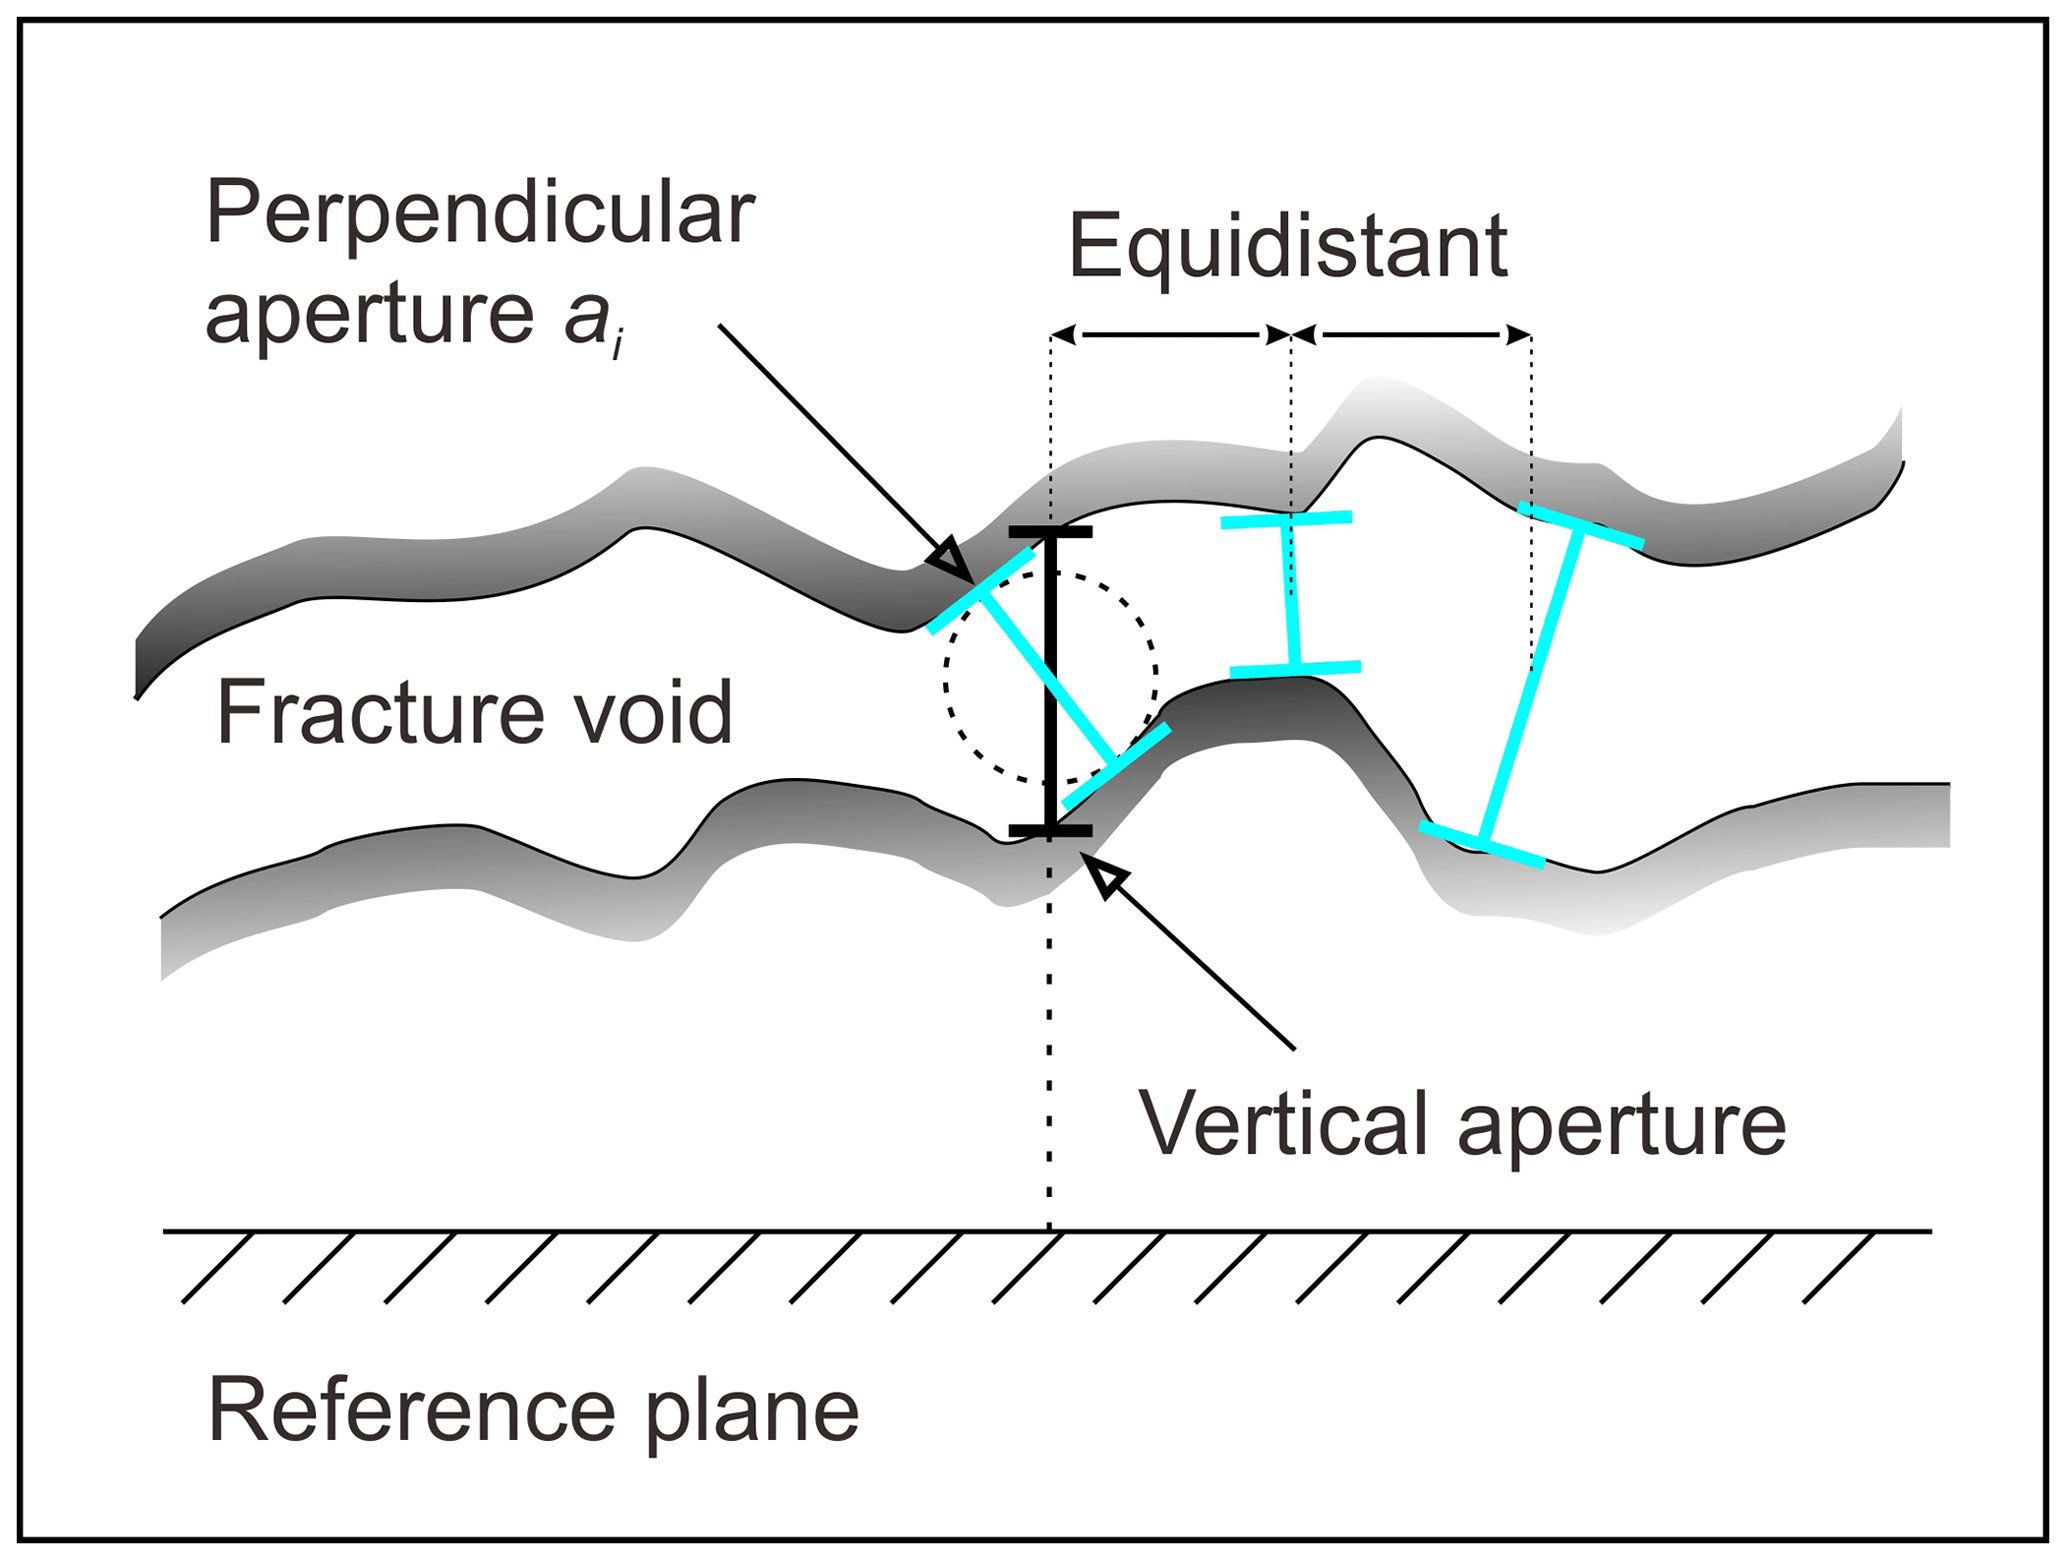
Figure 3Conceptual illustration of different mechanical aperture definitions and the estimation method applied in this study (indicated in blue); modified from Konzuk and Kueper (2004).
2.2.3 Microscope camera
Mechanical aperture can be determined by measuring the vertical distances between the upper and lower fracture walls perpendicular to a predefined global reference plane (Hakami and Larsson, 1996) or by measuring the separation distances oriented perpendicular to the local trend of the fracture walls (Mourzenko et al., 1995; Ge, 1997) as illustrated in Fig. 3. Konzuk and Kueper (2004) compared the two methods with the same fracture aperture revealing that the mean local perpendicular aperture is about 8 % smaller than the mean global vertical aperture, while their aperture histograms essentially yield a similar shape.
In this study, due to the fact that the microscopic images only represent small segments of the fracture in a sample, one cannot unequivocally define a global reference plane that would fit all images. Therefore, an estimation of the local perpendicular distance between the adjacent fracture walls was used to maintain consistency in the analysis between individual images. Two-dimensional aperture profiles were manually obtained at the sample end faces (Fig. 2c, f) using an MC (DigiMicro Mobile, dnt GmbH). Applying the software “PortableCapture”, the perpendicular distance ai (Fig. 3) between the captured fracture edges was measured at 20 equidistant spots on the picture defined by a mesh grid. Knowing the magnification factor of the microscope camera, the true distance between the fracture walls can be calculated for each spot. The magnification factors ranged between 200 and 206, corresponding to an investigated area of 1.72 × 2.29 to 1.67 × 2.23 mm2, respectively. More details can be found in Hale et al. (2019). The mechanical fracture aperture am corresponds to the arithmetic mean of the measured distances in each image and was calculated by
Empirical equations based on am and the standard deviation of measured aperture values σa were subsequently used to estimate the hydraulic aperture ah (Table 1).
Table 1Summary of empirical equations used to estimate hydraulic fracture apertures from measured mechanical apertures.
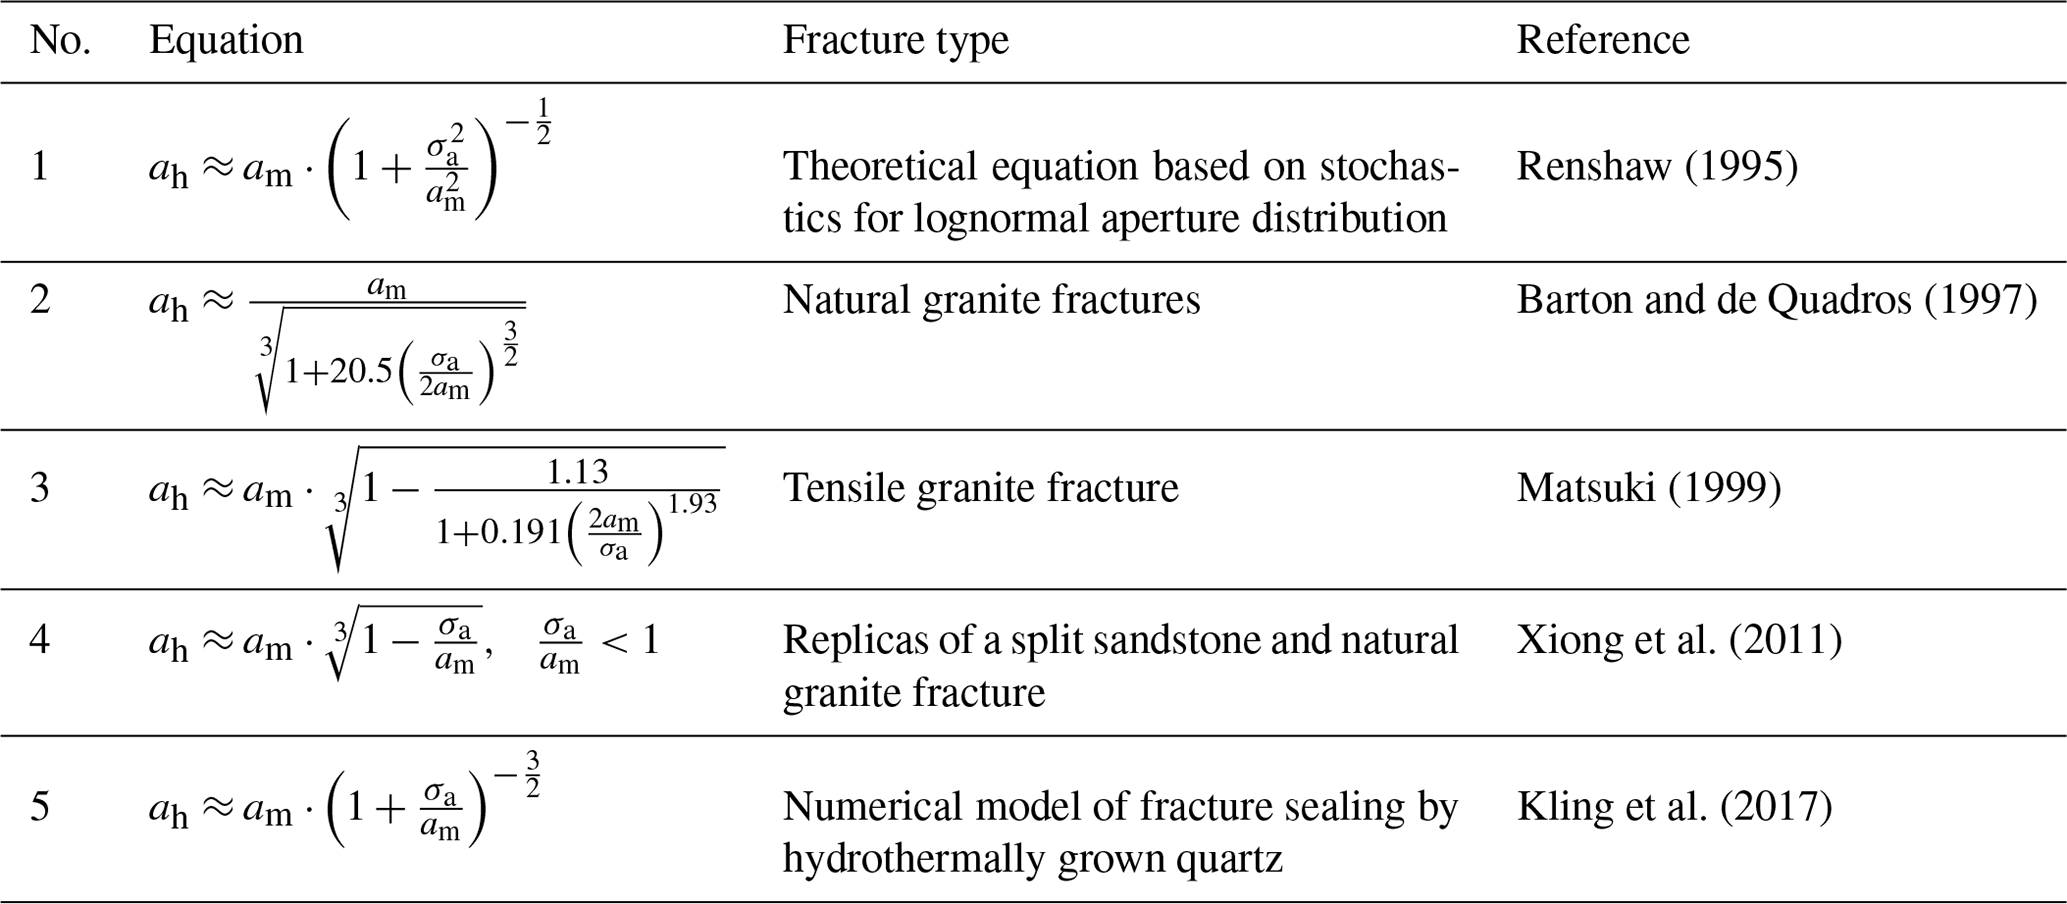
ah is estimated based on the relative roughness of a fracture, which can be expressed as the ratio between the standard deviation σa and the corresponding arithmetic mean mechanical aperture am.
Based on the analysis of all microscopic images for each sample, the mechanical aperture distribution can additionally be determined. As the minimum measurable distance was limited to 10 µm, one can apply a threshold of 10 µm, where mechanical apertures smaller than the threshold are regarded as contacting asperities (Hakami and Larsson, 1996). Consequently, the contact area ratio Rc can be derived by quantifying the ratio of the number of contacting asperities and the total number of ai. By assuming circular contact areas of the asperities oriented in parallel to the fracture plane, a hydraulic aperture aH can be obtained from the total mean mechanical aperture and Rc as follows (Walsh, 1981; Zimmerman et al., 1992):
2.3 Experimental procedures
For the flow-through experiments the assembled rock samples were vacuum-saturated with deionized water in a desiccator. The specimen assembly was mounted in the pressure vessel of the FTA for the permeability measurements. The confining pressure was first increased to 4 MPa and, subsequently, the pore pressure was increased to 1 MPa and maintained constant throughout the measurement. The confining pressure was then increased to 5 MPa, implying that the effective pressure applied to the sample was 4 MPa as the starting condition. It is well known that a first loading ramp causes the largest irreversible aperture closure as compared to further loading–unloading sequences (Hofmann et al., 2016; Milsch et al., 2016). In this study, one confining pressure loading–unloading cycle from 5 to 30 MPa and back to 5 MPa (FOF1) or 2 MPa (FOF4, FF2, FF3, and FF4) was performed at room temperature. The sample permeability was measured at each pressure step in defined confining pressure intervals. Due to the fact that the samples were subject to near-zero effective pressure when applying the other two methods (TP and MC), the hydraulic apertures at zero effective pressure were obtained from curve fitting of the measured data during unloading (Sect. 3.1; Fig. 4) and used for comparison.
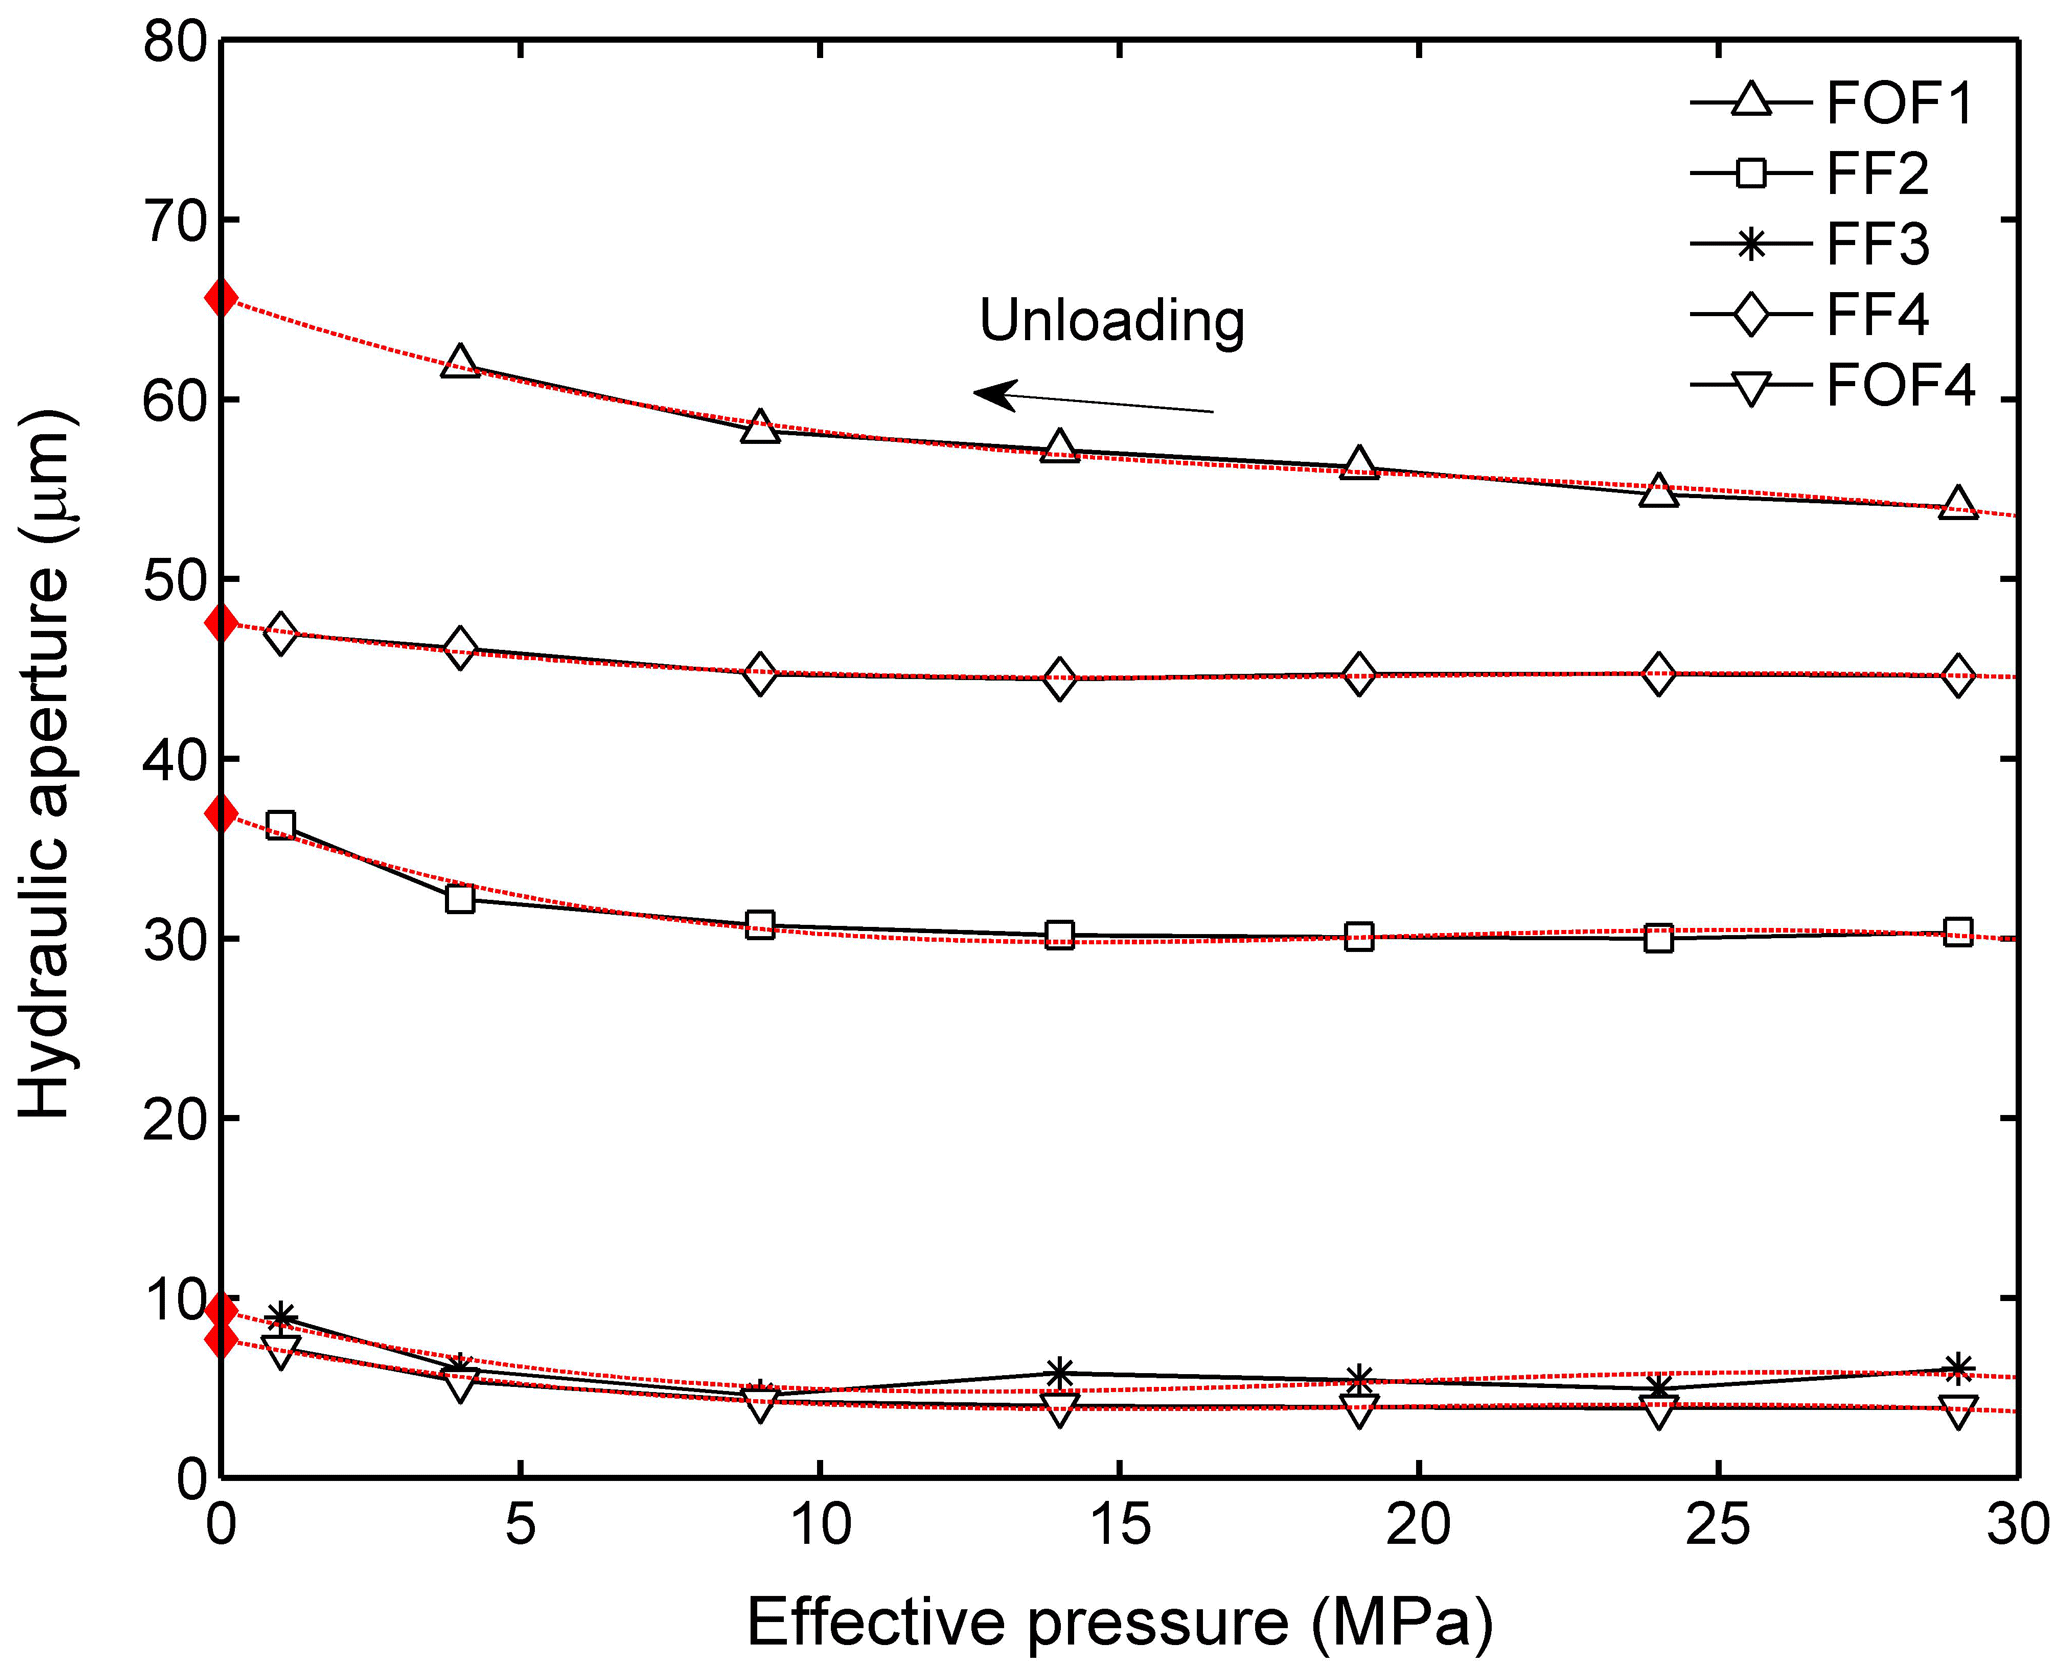
Figure 4Hydraulic aperture aFTA (obtained by the flow-through apparatus) as a function of effective pressure during unloading. Each point is a steady-state permeability measurement at the respective effective pressure. The fitted curves (red lines) represent the hydraulic aperture of each fractured sample at zero effective pressure (red diamonds).
After completion of the flow-through experiment, the respective specimen assembly was removed from the pressure vessel. The plugs and gaskets were taken off to expose the end faces of the samples for the subsequent TP measurements. The heat-shrink tubing, however, was kept in place in order to fasten the two halves of the specimen. The samples were then dried in an oven at 60 ∘C for several days to obtain defined test conditions for the TP measurements. The hydraulic fracture aperture aTP was finally measured with the TP at ambient pressure and temperature conditions. Since the inner diameter of the TP's rubber nozzle is 8 mm and the diameter of the core was 30 mm, the effective cross-sectional area for the airflow is significantly smaller than the total cross-sectional area of the core sample as investigated in the flow-through experiments. Thus, the hydraulic aperture was measured 10 times on both the top and bottom end faces of the sample in order to fully cover the fracture across the sample diameter. Care needs to be taken as, unlike for fractures between adjacent parallel plates, gas might slip asymmetrically from the fracture at the end of the nozzle due to the irregular fracture void space. Single measurements at different sites on the same sample end may lead to discrepancies. Therefore, multiple measurements are essential when applying the TP on rough fractures.
Finally, mechanical aperture profiles on both sample end faces were determined with the MC. A total of 13 to 17 images were taken on each surface, i.e., 26 to 29 images in total for each sample, to fully cover the aperture profile across the sample diameter.
It should be recalled that all samples were tested by TP and MC after the flow-through experiments performed with the FTA yielding identical fracture configurations and nearly identical measurement conditions for evaluating the hydraulic apertures determined by the three methods.
In the following two sub-sections the hydraulic aperture data as determined in this study are presented (Sect. 3.1) and compared among measurement methods (Sect. 3.2). All data related to this publication are attached as a Supplement.
3.1 Measured hydraulic fracture apertures
The FTA experiments and the TP measurements represent direct methods for determining hydraulic fracture aperture. Figure 4 shows the hydraulic apertures measured with the FTA (aFTA) at different effective pressures during unloading. Subsequently, the hydraulic apertures at zero effective pressure were predicted by extrapolation of the different unloading sequences, yielding 65.9 µm for FOF1, 37.0 µm for FF2, 9.8 µm for FF3, 47.6 µm for FF4, and 7.7 µm for FOF4, respectively. The mismatched rough fractures (FOF1 and FF2) and the saw-cut rough fracture (FF4) are characterized by relatively large hydraulic apertures, whereas the matched rough fracture (FF3) and the saw-cut smooth fracture (FOF4) yield significantly smaller and nearly identical hydraulic apertures.
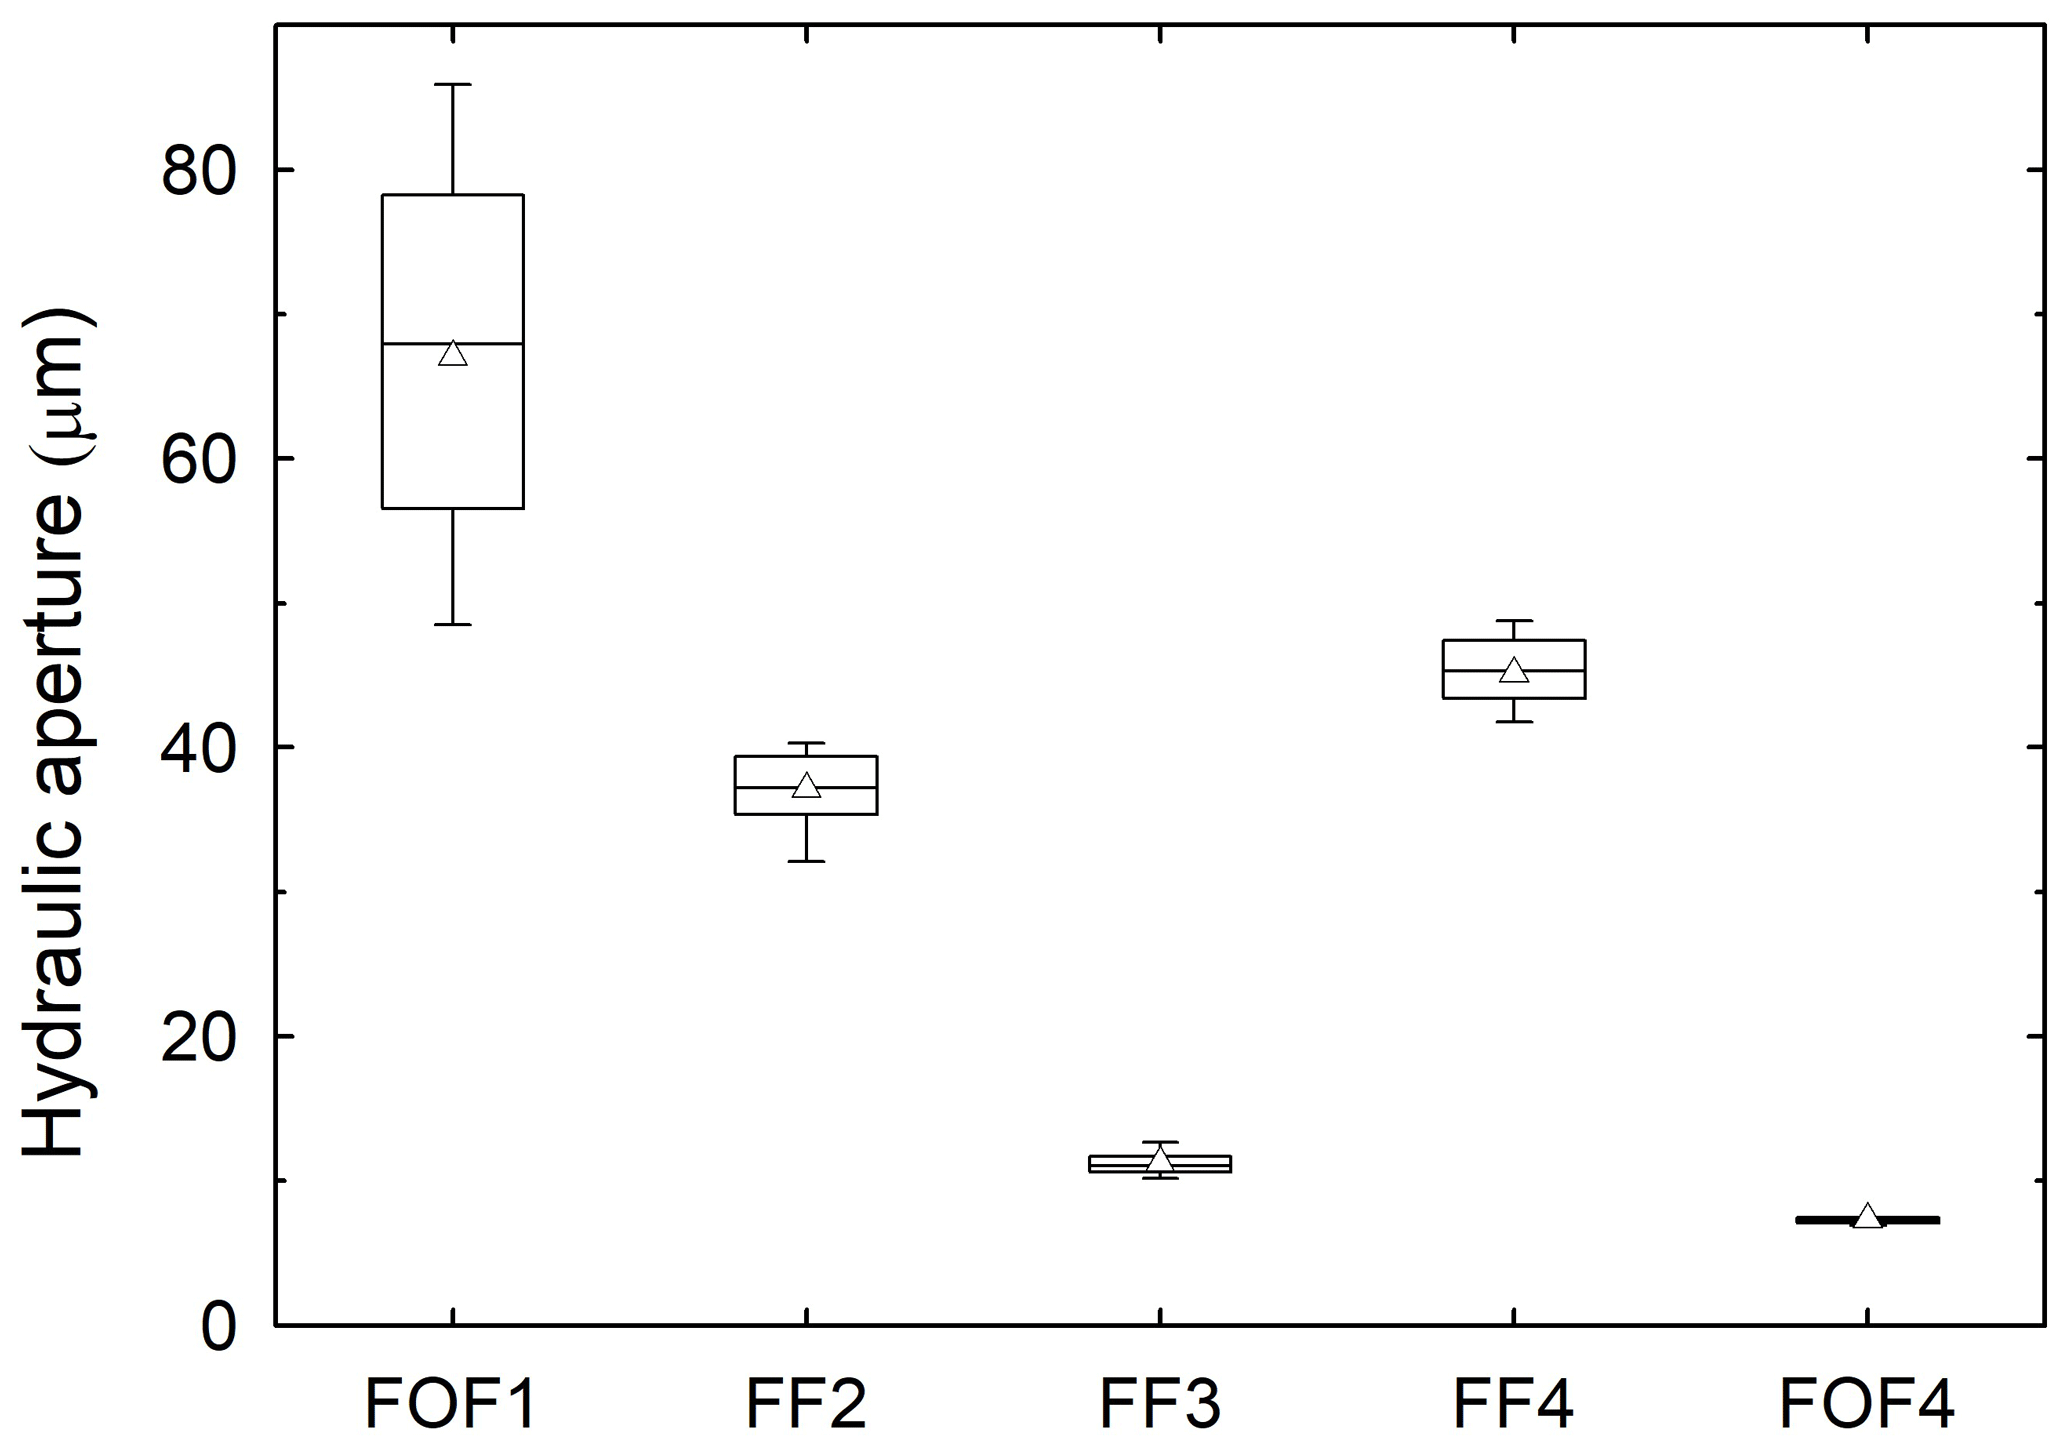
Figure 5Hydraulic fracture aperture of each sample measured with the transient-airflow permeameter (TP), including a total of 20 values for each sample taken at the top and bottom end faces (see Fig. 1). The solid line and the open triangle in the box indicate the median and mean of each dataset, respectively.
Figure 5 shows the hydraulic apertures aTP determined with the TP, where the results show higher variability for the samples with larger apertures (FOF1, FF2, and FF4) in contrast to the samples with smaller apertures (FF3 and FOF4). Since the nozzle of the TP is smaller in size than the cross-sectional area of the present core samples, the individually measured hydraulic aperture values do not necessarily represent the hydraulic aperture of the entire sample. On the other hand, due to the roughness of the fracture profile, airflow from the fracture to the nozzle might be largely asymmetric, particularly close to the fracture edge. This is possibly the reason for large variations in case of larger fractures. Therefore, the range of the hydraulic aperture values of each sample can serve as an indicator for the variability of the hydraulic aperture along the fracture width. Samples FF3 and FOF4 only show insignificant variations resulting from the matched and smooth surfaces, respectively, indicating a rather constant aperture across the samples. Previously, Filomena et al. (2014) demonstrated a sample size effect for permeability measurements using the TP device on 2.54 cm diameter core samples (i.e., porous media without fractures). As core sample permeabilities were about 37 % larger than permeabilities measured on corresponding block samples, they concluded that the discrepancy is mainly due to the effect of shorter flow trajectories in core samples. However, this is not the case for our fractured samples. Firstly, it is impossible to perform fracture permeability measurements at the core sample scale without any constraints. Therefore, all samples were jacketed with a heat-shrink tubing to maintain the fracture patterns. Secondly, when performing TP measurements on fractured core samples, the samples' jacket limits the leakage of the flow from the fracture edges. Thus, the obtained results are in good agreement with the hydraulic apertures determined by the flow-through experiments (Sect. 3.2). For measuring larger fracture profiles in block samples (e.g., Hale et al., 2019) or outcrops, this would not be an issue since the flow trajectories are sufficiently long.
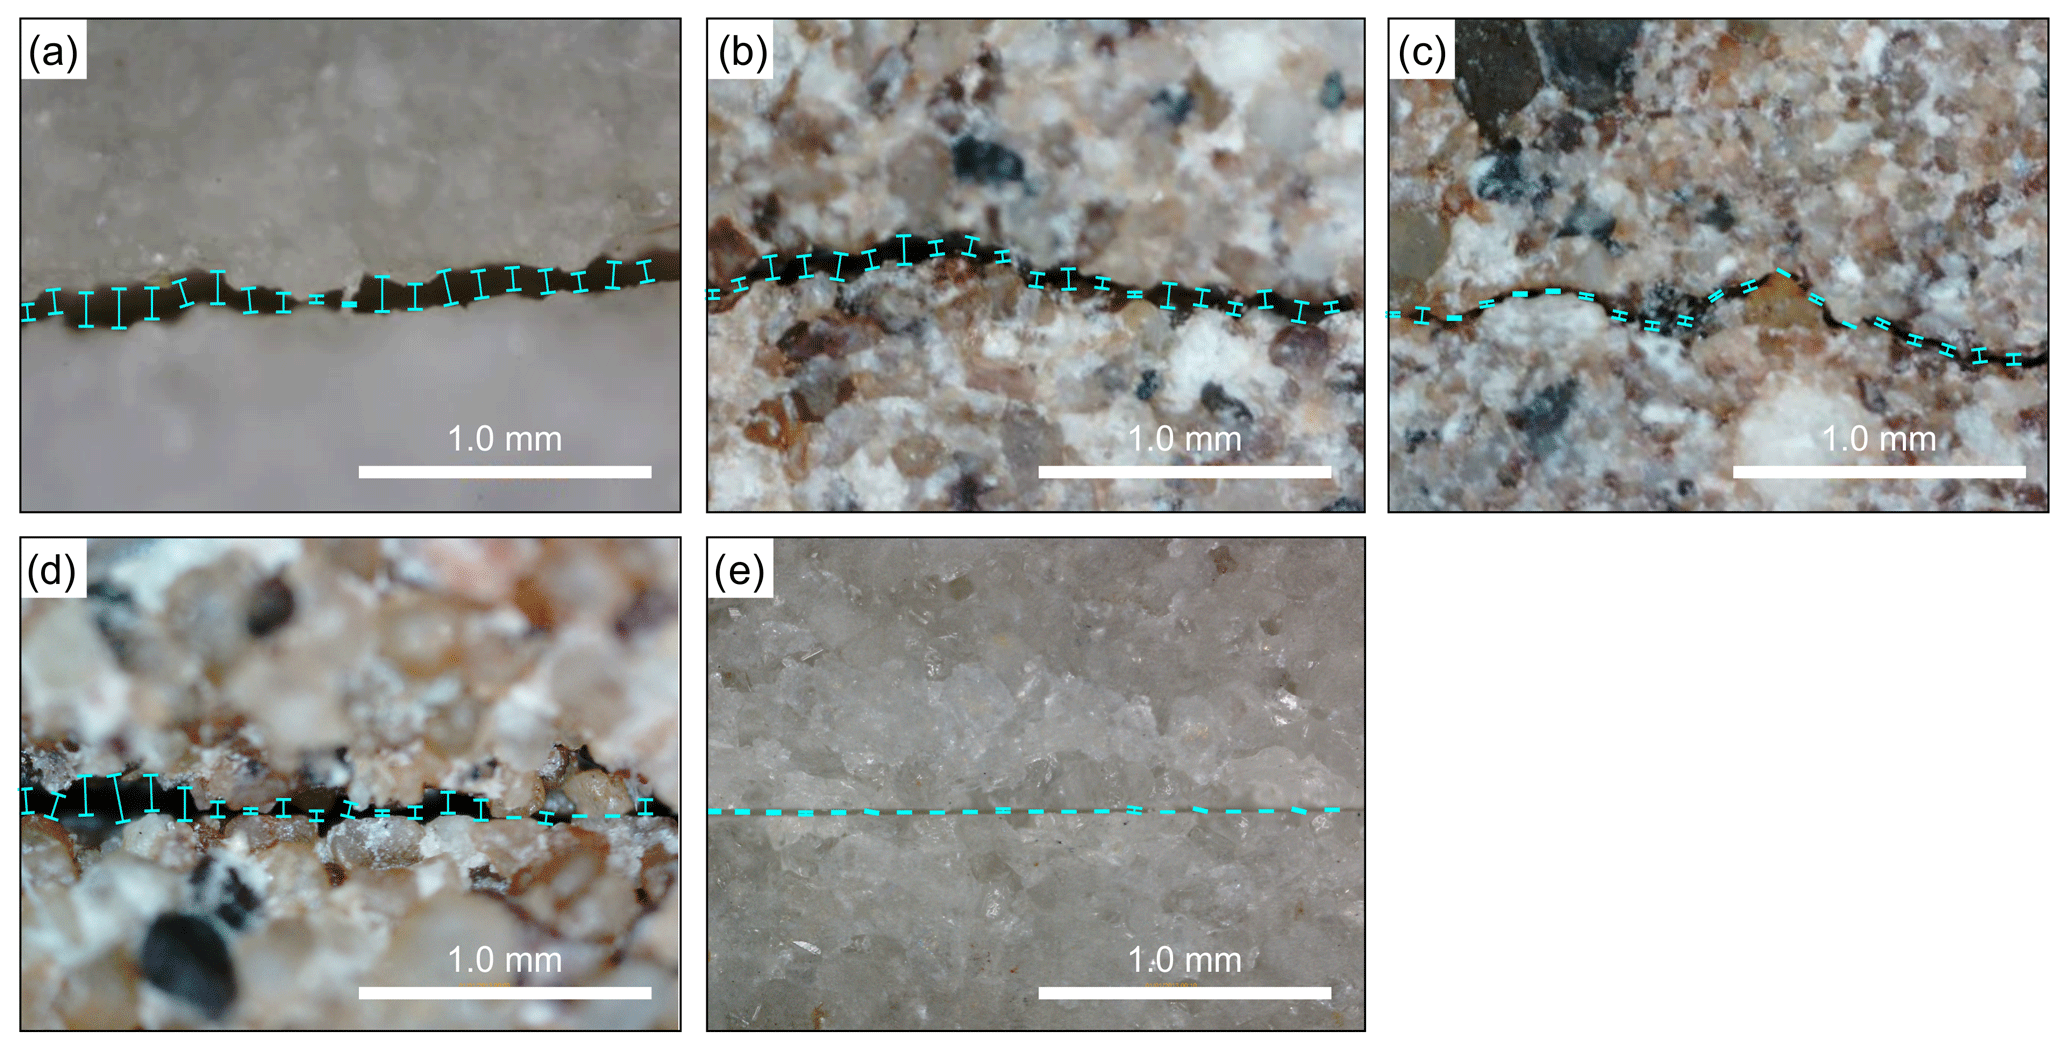
Figure 6Representative microscopic images of the samples comprising parts of the respective fracture profiles. (a) FOF1, with a pre-offset of 0.75 mm; (b) FF2, with a pre-offset of 0.2 mm; (c) FF3, matched rough fracture; (d) FF4, saw-cut rough fracture; (e) FOF4, saw-cut smooth fracture. The distances between the upper and lower fracture walls were measured at equidistant locations.
Figure 6 shows representative microscopic images of the fractures taken with the MC. The 2D mechanical aperture am in each image was measured by determining the distance between the upper and lower fracture wall at 20 evenly spaced spots. The arithmetic mean of the measured distances in each image was subsequently calculated representing the mean mechanical fracture aperture of the observed area. The mechanical apertures derived from all profile images of each sample are shown in Fig. 7, yielding significantly larger variations in aperture values in comparison to the corresponding TP hydraulic apertures aTP (Fig. 5).
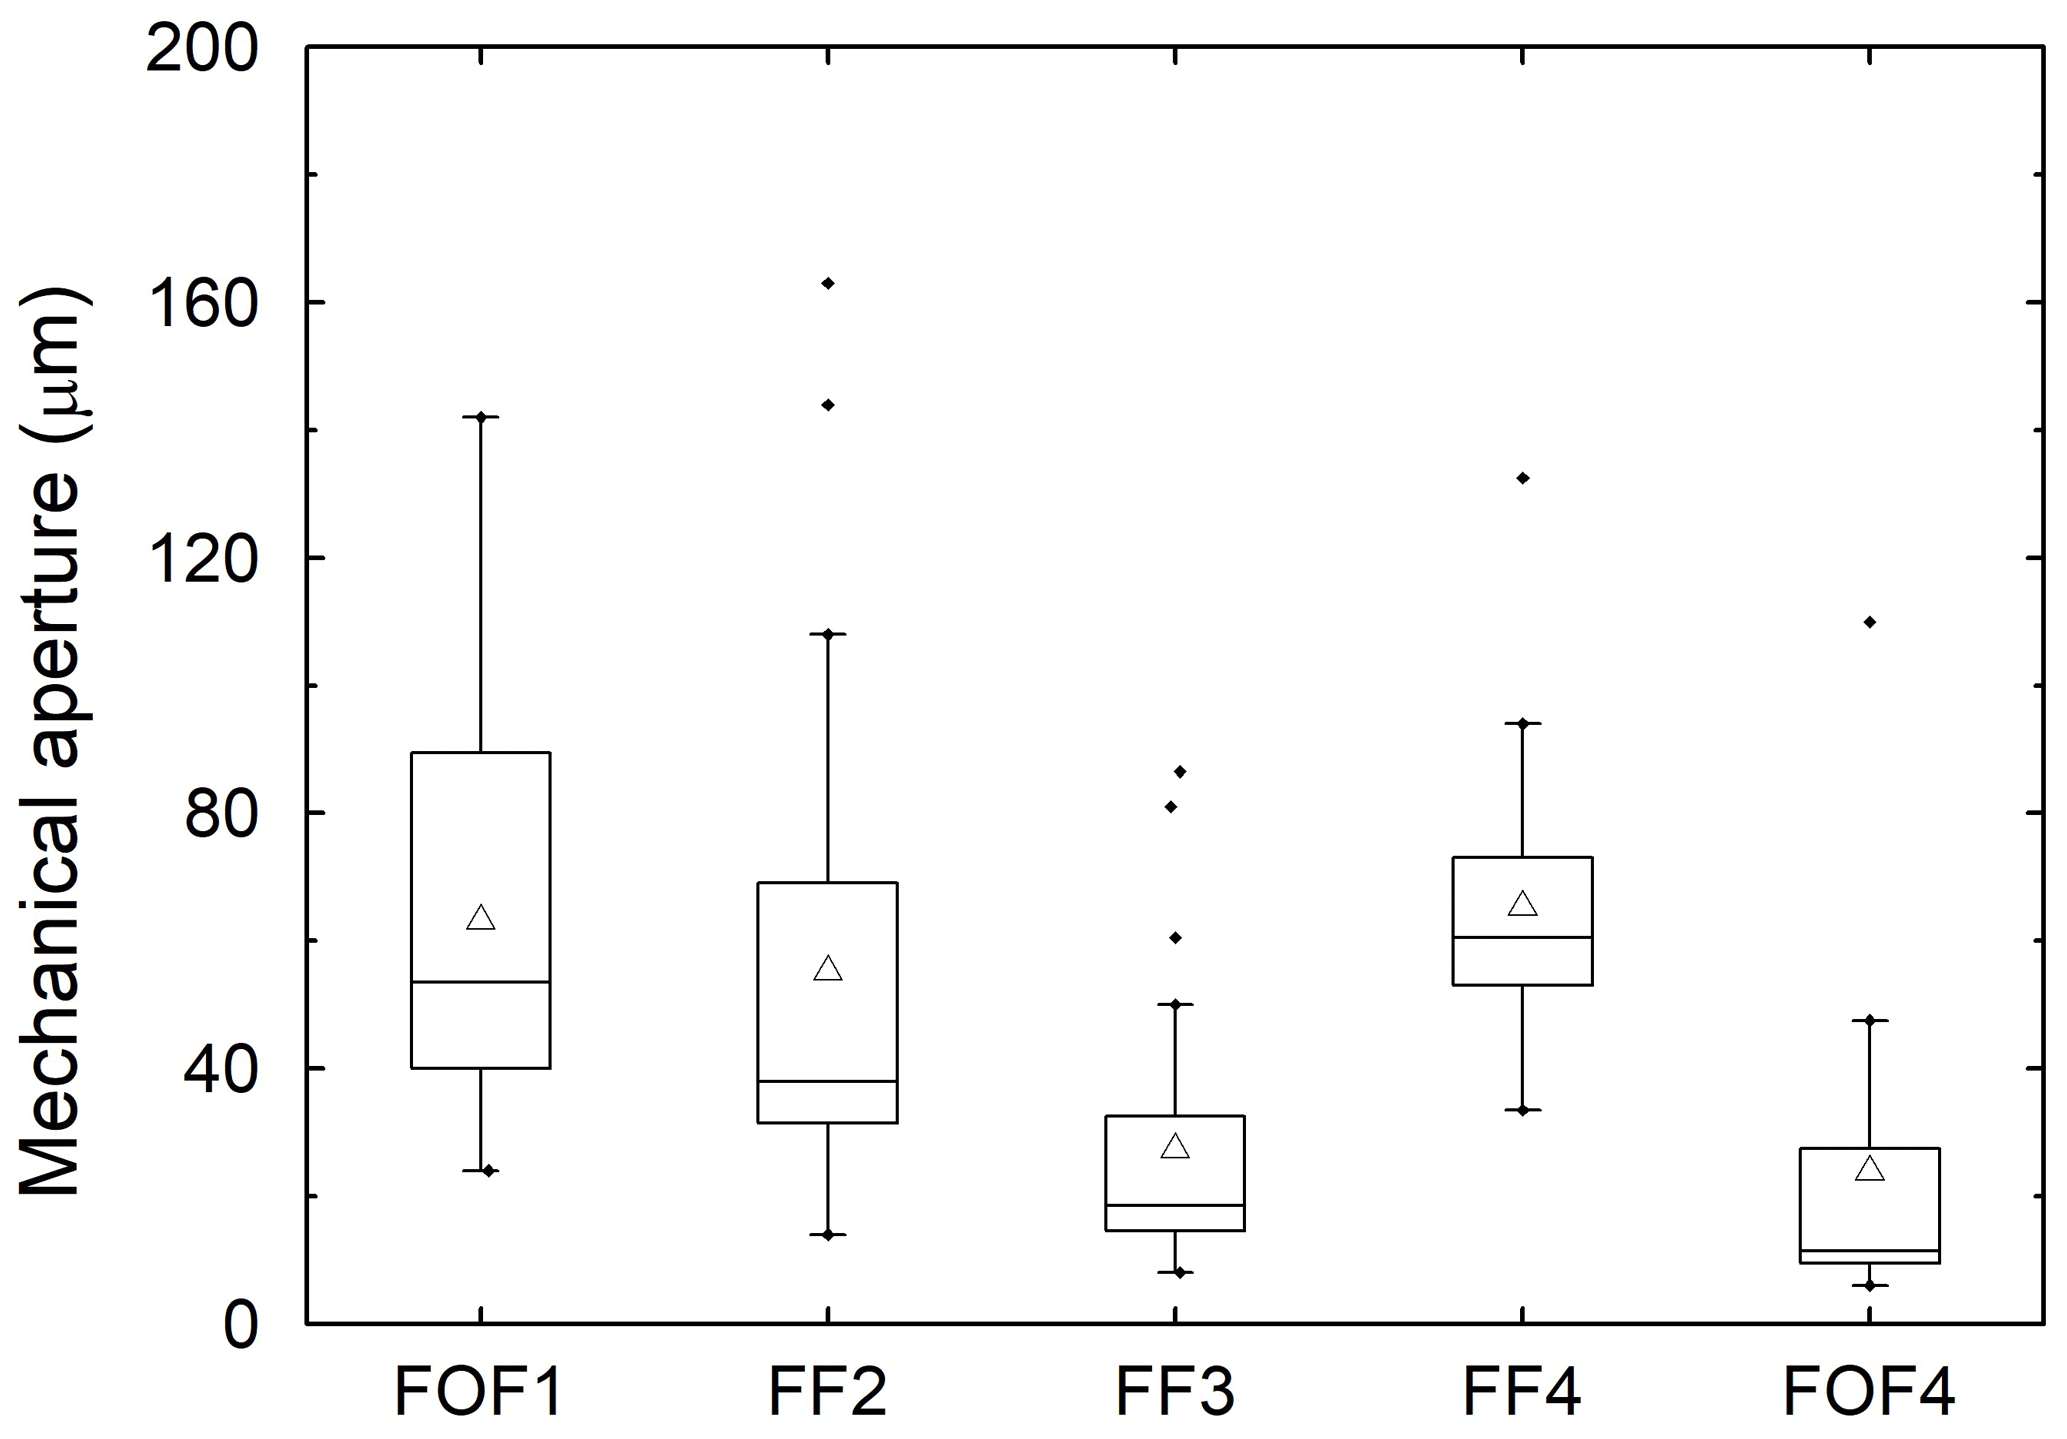
Figure 7Mechanical apertures of the samples derived from image series taken on the top and bottom end faces with the microscope camera (MC). Individual symbols (black dots) above the whiskers represent measured data but are statistical outliers. In the box plots, the boxes signify the lower and upper quartiles (Q1 and Q3) of the datasets, respectively. The upper and lower whiskers indicate the largest and smallest data values for Q3 + 1.5 IQR and Q1 − 1.5 IQR, respectively, where IQR is the interquartile range equal to Q3 − Q1. The solid line and the open triangle in the box indicate the median and mean of each dataset, respectively.
From the totality of measured distances based on all 2D microscope images of each sample, their respective mechanical aperture distributions can be derived as shown in Fig. 8. The contact area ratio Rc of samples FOF1, FF2, FF3, FF4, and FOF4 is 0.142, 0.173, 0.186, 0.054, and 0.150, respectively, as resulting from the loading–unloading cycle in the FTA. As expected, the matched fracture surfaces of FF3 exhibit the largest contact area ratio compared to all other samples. The hydraulic aperture aH can be subsequently derived with Eq. (7) using the corresponding total mean mechanical aperture as well as Rc. The resulting hydraulic apertures of FOF1, FF2, FF3, FF4, and FOF4 are 57.4, 49.1, 24.1, 63.0, and 21.5 µm, respectively. Based on the former total mean mechanical apertures and their standard deviations, hydraulic apertures were additionally evaluated using the empirical equations listed in Table 1 as outlined and discussed in Sect. 3.2 below.
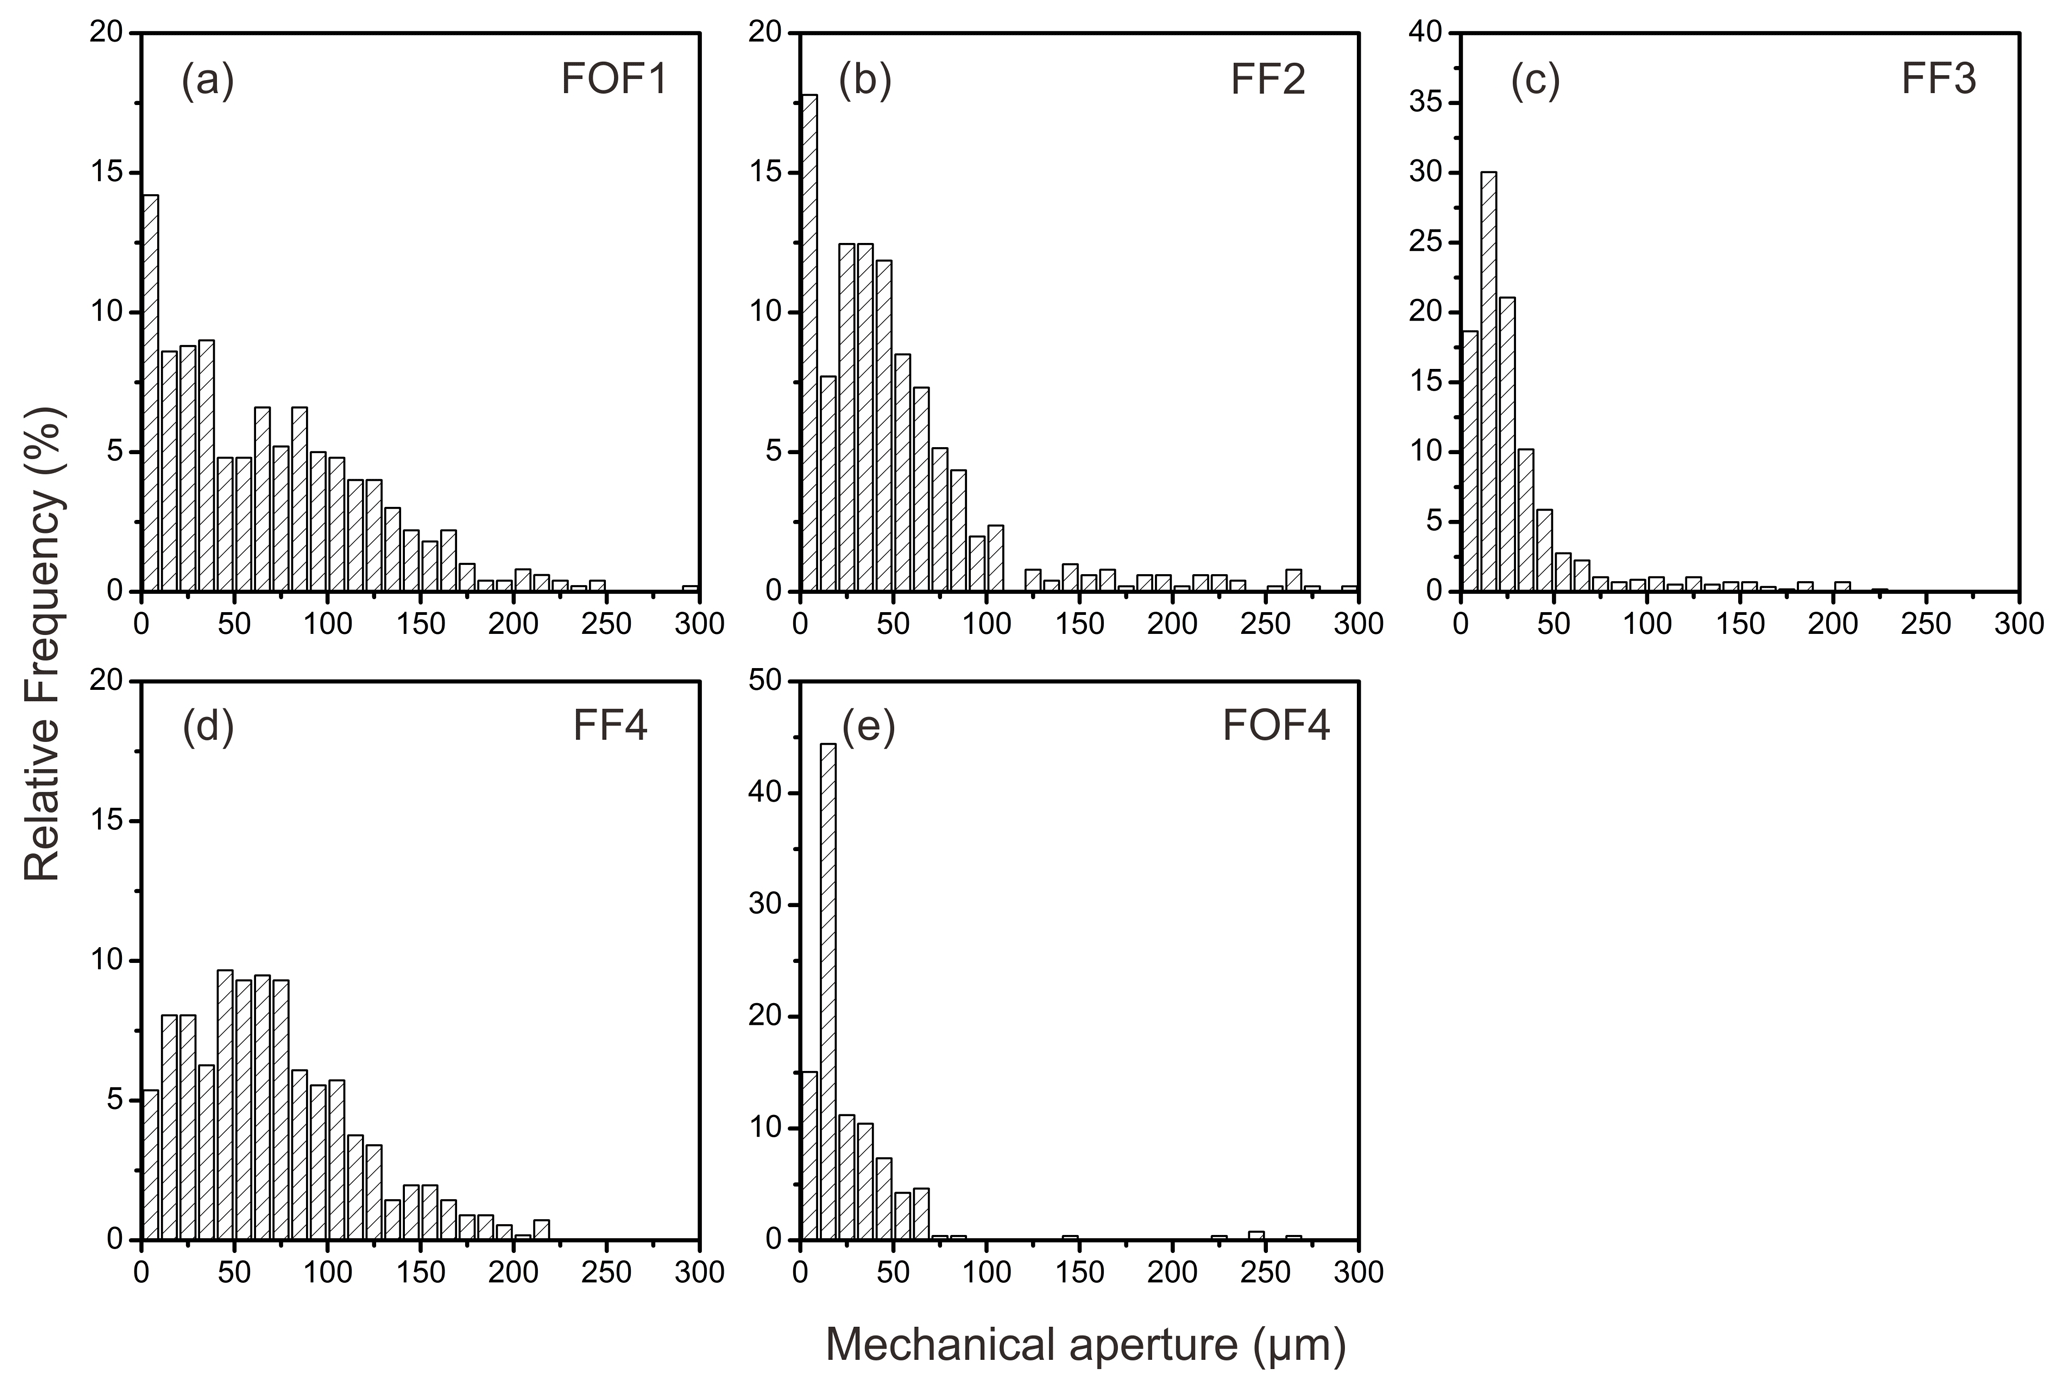
Figure 8Frequency histograms showing the mechanical aperture distribution obtained from the 2D microscopic images of each sample. (a) FOF1; (b) FF2; (c) FF3; (d) FF4; (e) FOF4.
3.2 Comparison of hydraulic fracture apertures
Figure 9 presents an overall comparison of hydraulic apertures of all samples measured with the FTA, the TP, and the MC. The mean and median hydraulic apertures aTP determined with the transient-airflow permeameter are very consistent with the absolute hydraulic apertures aFTA determined by the flow-through experiments. The differences range between 0.2 µm (sample FF2) and 2.5 µm (sample FF4). Furthermore, it can also be seen from this figure that the smaller the hydraulic aperture, the smaller the range of variations. For all samples, the hydraulic apertures ah derived from the empirical equations listed in Table 1 using the mean mechanical aperture and the corresponding standard deviation from each microscopic image show larger variations in comparison to the hydraulic apertures measured with both the FTA and the TP. This is likely due to the fact that for each individual microscopic image only a 2.29 mm wide part of the fracture was considered, which does not represent the studied fracture over its entire width.
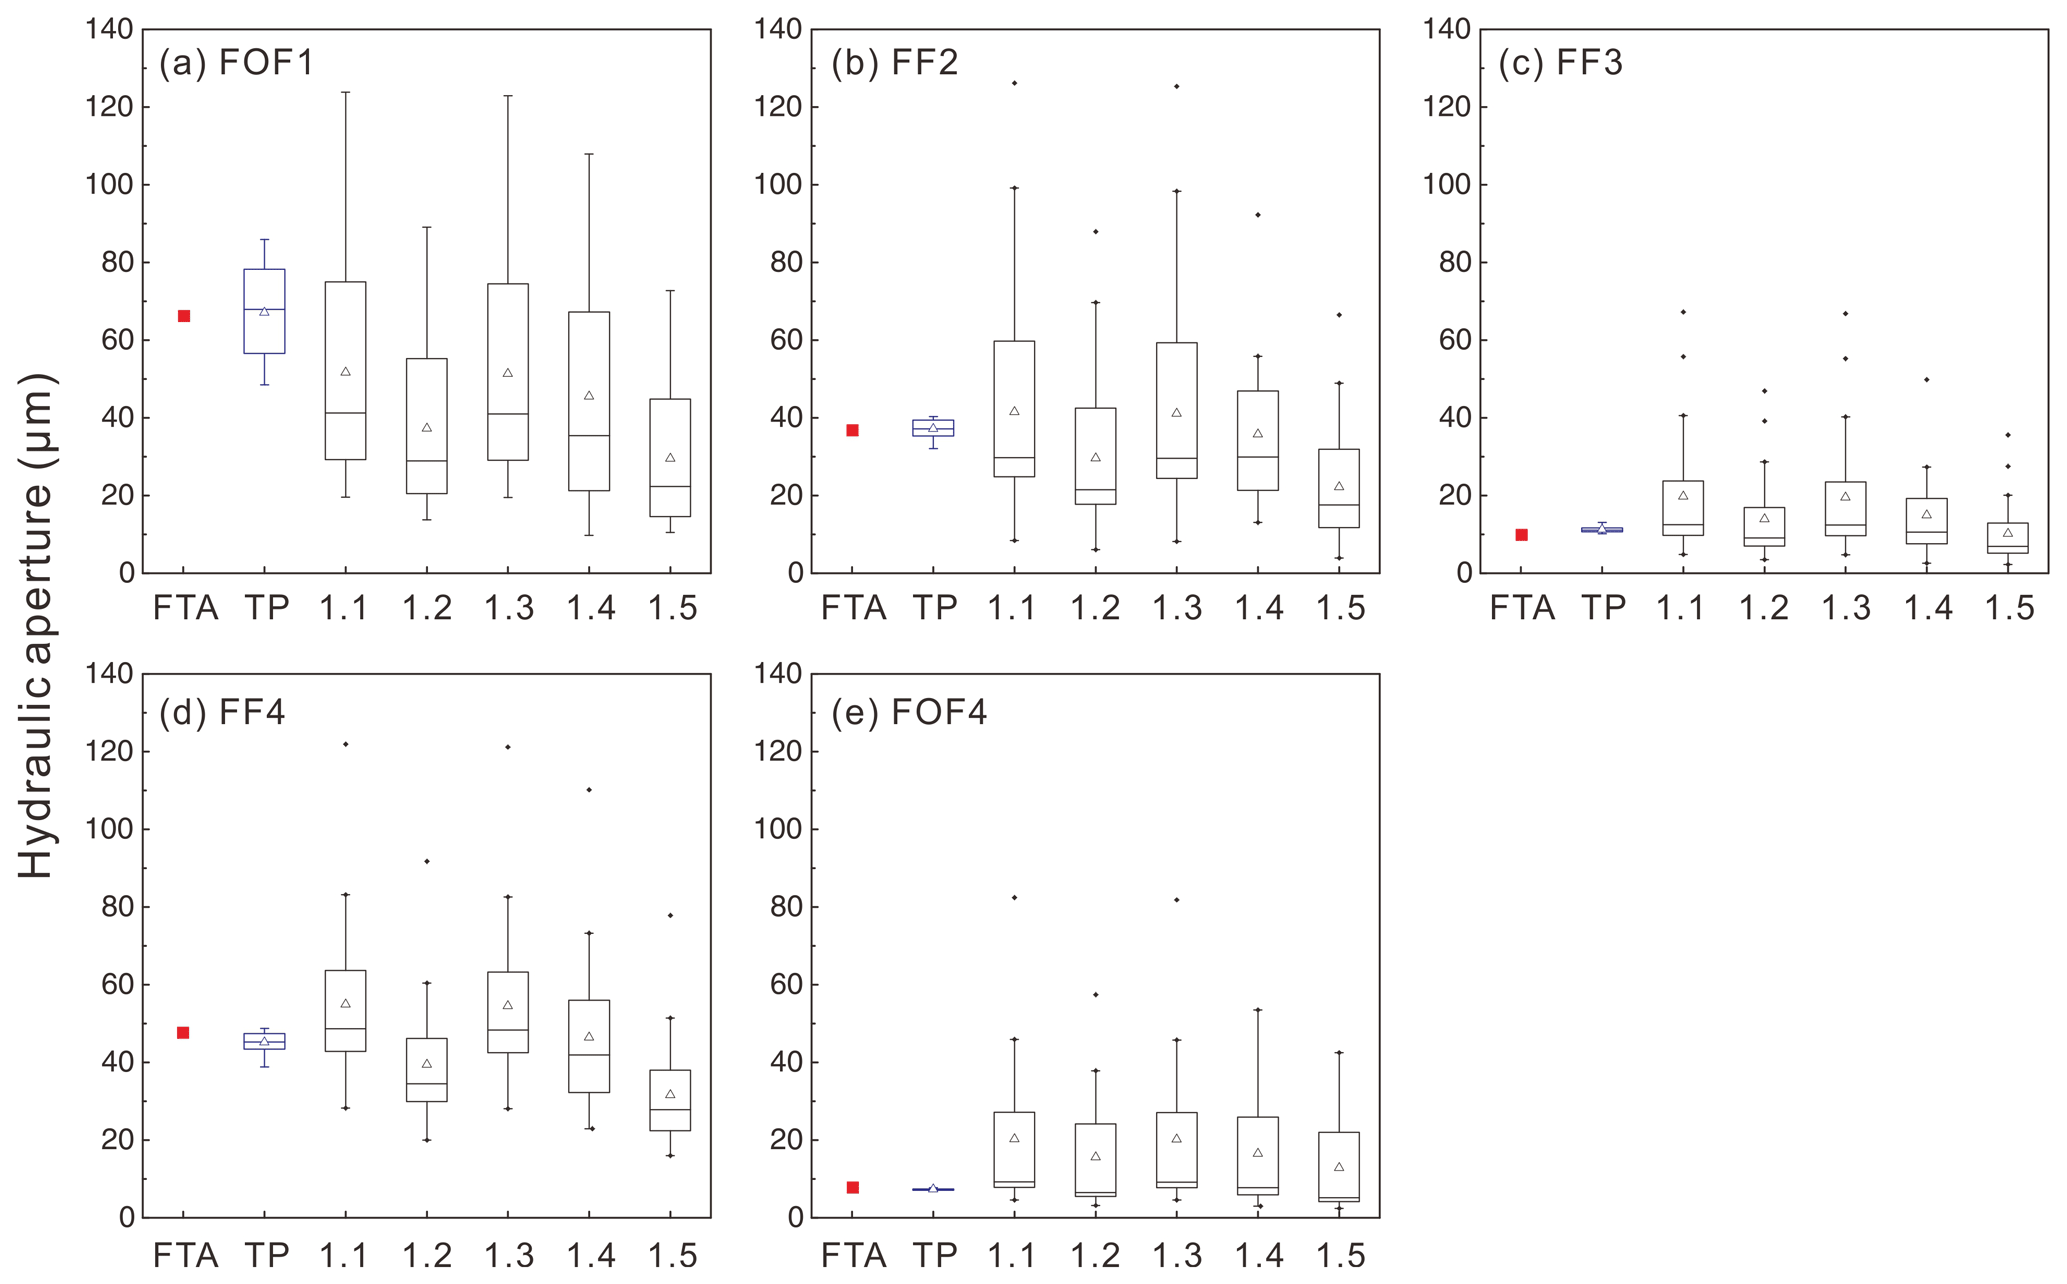
Figure 9Comparison of hydraulic apertures measured with the flow-through apparatus (FTA; red squares) and the transient-airflow permeameter (TP; blue box plot) and derived from MC-measured mechanical apertures (1.1 to 1.5; black box plots) using the empirical equations 1 to 5 listed in Table 1. Individual symbols (black dots) above the whiskers are calculated data but represent statistical outliers.
Figure 10 shows the correlation between the hydraulic apertures aTP measured with the TP and aFTA obtained by the FTA. For each sample, the mean and median values of the TP measurements are in excellent agreement (coefficient of determination R2=0.998) with the ones measured with the FTA. It is noted that all measured aTP of sample FF3 are slightly larger than the determined aFTA. Due to the well-matched rough fracture surfaces of FF3, the fracture aperture is significantly smaller in comparison to the other samples (except FOF4). Hence, already a small applied stress may result in a comparatively significant aperture decrease, and the predicted zero-stress aperture aFTA of FF3 might therefore be slightly underestimated. However, this small discrepancy should be acceptable when the TP is applied in the field. Based on this comparison with samples under unstressed conditions, one can infer that measurements with both FTA and TP would yield even better agreement when hydraulic apertures are determined at elevated stress conditions. This is because the geometric stability of fracture aperture increases as the normal stress on a fracture plane increases (e.g., Fig. 4). In addition, the standard deviations σa of the hydraulic apertures aTP of samples FOF1, FF2, FF3, FF4, and FOF4 are 12.0, 2.3, 0.9, 2.6, and 0.3 µm, respectively, which clearly demonstrates that for smaller hydraulic apertures less variability of measured values can be observed.
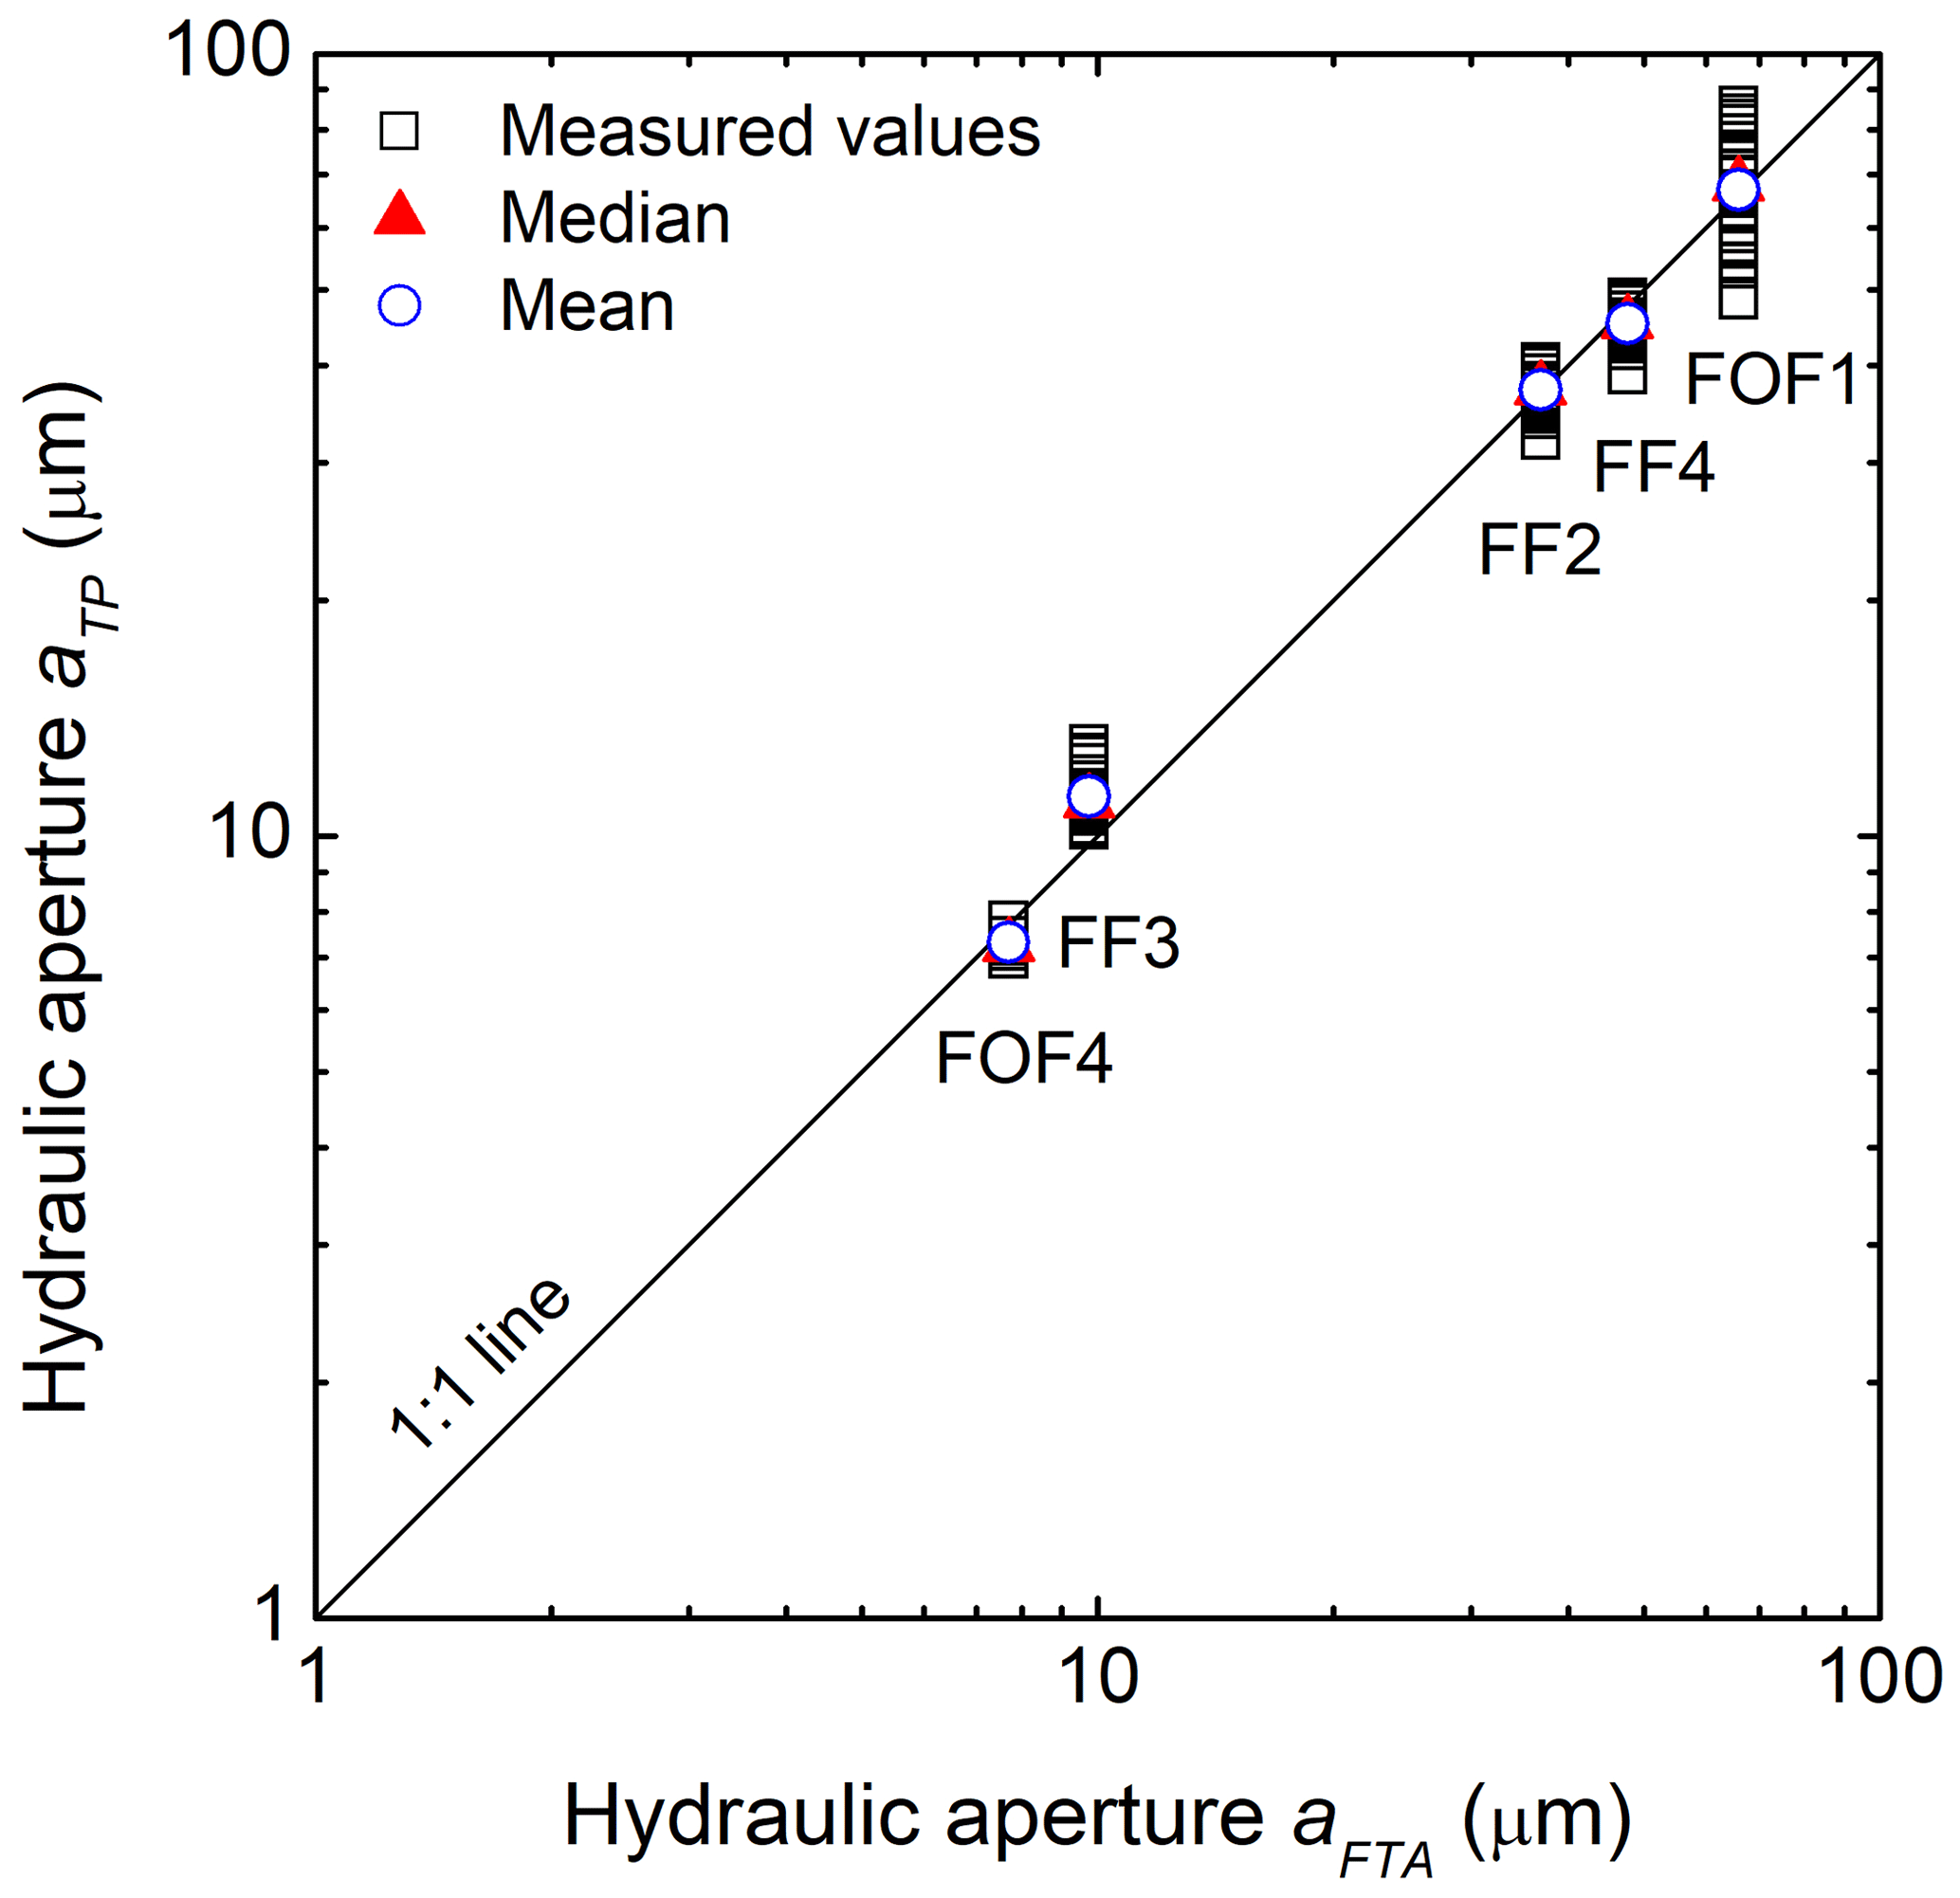
Figure 10Cross-plot of the hydraulic apertures aTP determined with the transient-airflow permeameter (TP) and the hydraulic apertures aFTA measured with the flow-through apparatus (FTA).
As mentioned before, for TP measurements of hydraulic aperture (aTP), the effective sampled area of the rubber nozzle in contact with the sample surface is smaller than the sample's cross-sectional area. Consequently, the results, particularly for samples with a larger hydraulic aperture, show substantial variations. However, by conducting multiple measurements to fully cover the entire cross-sectional area, the mean and median hydraulic aperture aTP and the corresponding absolute hydraulic aperture aFTA showed excellent agreement. The investigation depth of the transient-airflow permeameter for isotropic porous media was estimated to be approximately twice the internal radius of the nozzle tip (Goggin et al., 1988; Jensen et al., 1994; Possemiers et al., 2012) since the largest pressure gradient along a sample occurs near the injection or extraction region. This implies that a certain minimum sample length (i.e., twice the internal radius of the nozzle tip) is required for a reliable permeability measurement. However, for fractures, this minimum length has not been established yet. As mentioned before, the calibration of the TP was performed by using parallel plates as idealized fractures. Increasing the fracture length has no effect on this idealized aperture, while a minimum length of the fracture might be required for sufficient airflow. As the length of the measured core samples was 40 mm (i.e., 10 times the nozzle tip radius), the total fracture volume was only partially covered during a TP measurement provided that the investigation depth in single fractures is comparable to the one in porous media. Overall, the accuracy and the reliability of hydraulic aperture results obtained from TP measurements can be significantly improved by performing repeated measurements along the fracture width as well as a subsequent statistical evaluation. Nevertheless, a rough fracture in a core longer than 40 mm may lead to less conformity of aFTA and aTP since the transient airflow does not fully cover the entire fracture area.
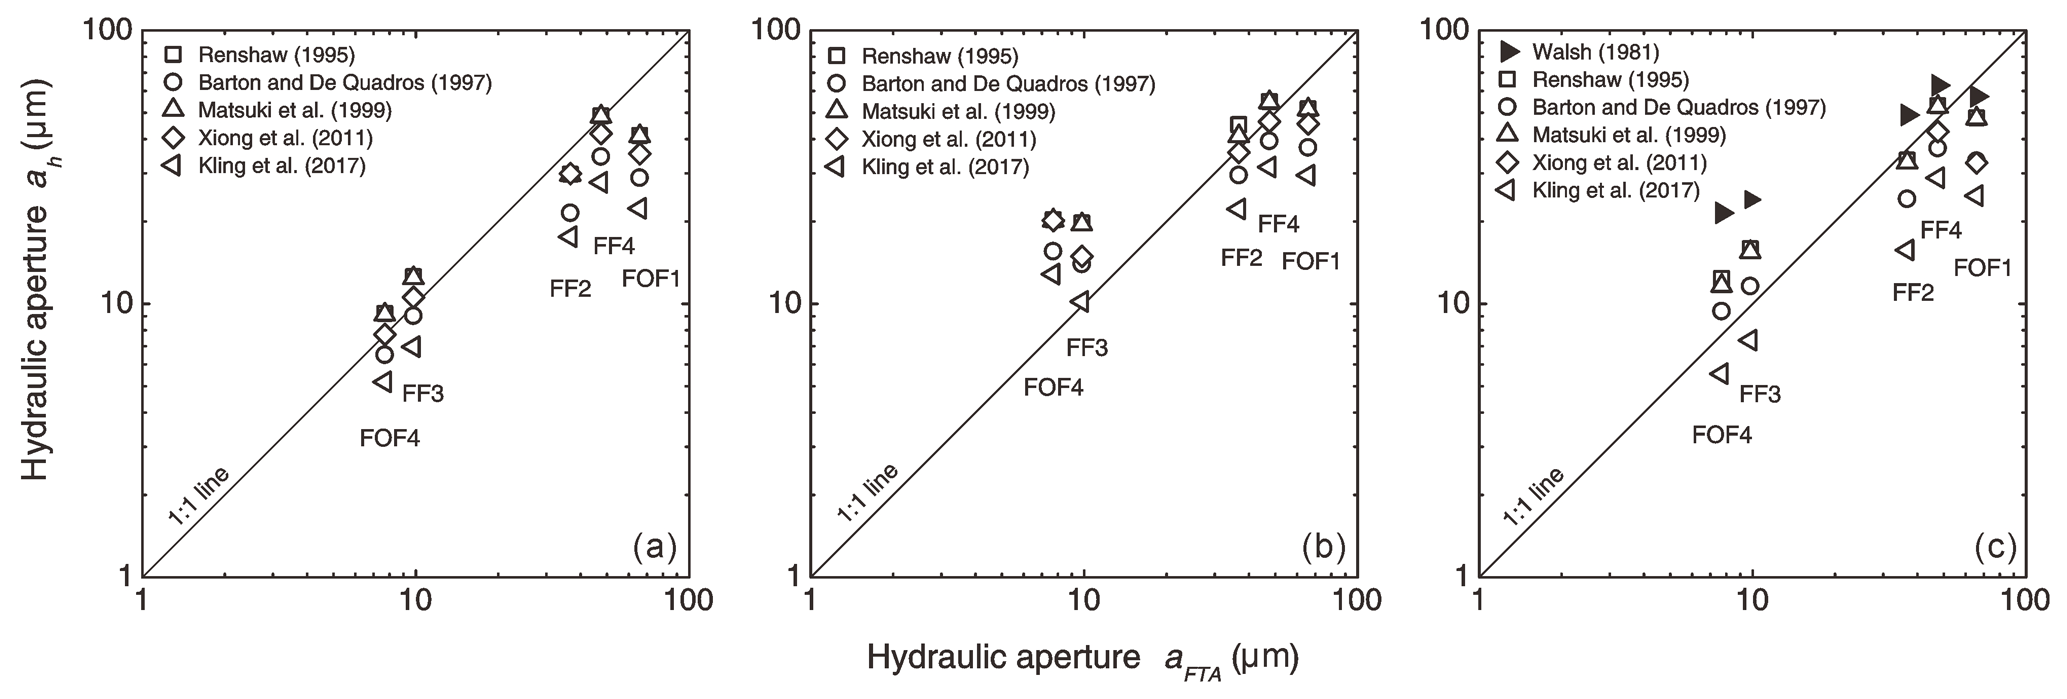
Figure 11Cross-plots of calculated hydraulic apertures based on microscopic images of fracture profiles (ah) and hydraulic apertures aFTA measured with the flow-through apparatus (FTA). (a) Median and (b) mean hydraulic apertures ah using MC-based mechanical apertures of each image in combination with the equations listed in Table 1. (c) Hydraulic apertures aH derived from Eq. (7) (black triangles) and hydraulic apertures ah derived from the totality of measured mechanical apertures of each sample (see Fig. 8) are shown for comparison.
Figure 11 shows the correlations between the hydraulic aperture aFTA (FTA) and the median (a) and mean (b) hydraulic apertures ah derived from measured mechanical apertures (performed with the MC) when applying the empirical equations listed in Table 1. For the relatively narrow fractures in FOF4 and FF3 with hydraulic apertures around 10 µm, the median of ah does replicate the actual hydraulic aperture obtained from the flow-through experiments very well, especially when using the equations of Barton and de Quadros (1997) and Xiong et al. (2011). In contrast, the mean of ah overestimates the respective FTA hydraulic aperture. For the relatively open fractures in FOF1, FF2, and FF4 with hydraulic apertures larger than 30 µm, the arithmetic mean is in better agreement with the respective FTA hydraulic aperture. Overall, it can be concluded that the equations of Barton and de Quadros (1997) and Xiong et al. (2011) yield better matching results for the studied samples as compared to the other equations listed in Table 1.
When additionally deriving the contact area ratio from all images of each sample, Eq. (7) can be applied and compared to the results of hydraulic apertures as calculated using the empirical equations in Table 1 (Fig. 11c). For samples with hydraulic apertures smaller than 10 µm, the derived results overestimate the actual aperture (aFTA) except for Kling et al. (2017). For hydraulic apertures larger than 30 µm, the derived results almost exclusively underestimate the true values with the exception of those obtained from Eq. (7). Possible errors regarding the input data may be related to the size limit of each microscopic image, where the obtained data can only represent the fracture aperture within the individually observed area with a segment width of 2.29 mm. Also, since the mechanical aperture distribution and the contact area ratio are obtained from 2D images of the fracture profiles, these do not fully represent the true fracture aperture distribution and contact area ratio in 3D. Nevertheless, the hydraulic apertures of the different samples as derived from the same respective equation are comparable and reflect the relative aperture differences.
Three different methodological approaches for hydraulic fracture aperture determination, i.e., using a flow-through apparatus (FTA), a transient-airflow permeameter (TP), and a digital microscope camera (MC), were applied and compared. A total of five (Fontainebleau and Flechtinger) sandstone samples containing single fractures of different types and representing a hydraulic aperture range between 8 µm and 66 µm were investigated. The comparison of the results aimed at assessing the applicability, reliability, and accuracy of each method yielding the following conclusions.
The agreement of the mean hydraulic apertures determined with the transient-airflow permeameter (aTP) and the corresponding hydraulic apertures measured by flow-through experiments (aFTA) was excellent for all samples.
For rough fractures with hydraulic apertures larger than 30 µm, measurements with the transient-airflow permeameter have to be repeated across the full fracture width in order to statistically obtain reliable results. The investigations additionally showed that this permeameter can also be reliably used to determine hydraulic fracture apertures as small as approximately 5 µm.
The hydraulic apertures estimated by evaluating 2D mechanical aperture profiles in digital microscope camera images showed large variations for all samples and therefore cannot be directly compared to the results obtained by the two other approaches. On the other hand, when applying empirical equations taken from the literature, the mean and median hydraulic apertures derived from the respective correlation, only reflect the relative aperture differences between the fracture types. This approach, consequently, is less useful for any further analysis in comparison to the direct measurements.
In summary, hydraulic fracture apertures can be measured directly and precisely, also as a function of pressure by performing flow-through experiments in appropriate apparatuses. For a large number of routine measurements at ambient conditions this procedure, however, is time-consuming and costly. For such purposes, this laboratory study shows that the transient-airflow permeameter offers a fast and highly efficient approach for hydraulic aperture determination on fracture profiles of cores and probably on outcrops. Multiple measurements around a sampling point can significantly increase the reliability of the results. For the first time this study quantitatively evaluated the reliability and precision of transient-airflow permeameter measurements on natural rough fractures extending previous calibrations based on ideal parallel plates (Brown and Smith, 2013). When following an optical approach using a digital microscope camera, qualitatively correct estimates of hydraulic aperture variations both along a fracture and between different fracture types are obtained. Although conclusions here are drawn from laboratory-scale measurements on core samples, these should also be valid when applying the portable methods (TP and MC) on fractures displaying the same aperture range at the outcrop scale. Hence, integrating the results of hydraulic aperture measurements on fractures, both from core samples and outcrops applying multiple methods, will improve our understanding of permeability in fractured rock. However, it should be noted that the conclusions drawn from this study are strictly only valid for the environmental conditions applied (i.e., stress and temperature). Consequently, characterizing the hydraulic aperture of fractures at depth from measurements taken at the surface of an outcrop demands information on the mechanical response of a fracture to stress and temperature. This extrapolation will require the continued application of flow-through devices like the one used in this study and measurements of the type displayed in Fig. 4.
All data related to this paper are attached as a Supplement.
The supplement related to this article is available online at: https://doi.org/10.5194/se-11-2411-2020-supplement.
CC prepared all rock samples and performed the experiments with the FTA. SH conducted the TP and MC measurements on the same specimens. All authors (CC, SH, HM, and PB) analyzed and interpreted the results and contributed to drafting the paper.
The authors declare that they have no conflict of interest.
This article is part of the special issue “Faults, fractures, and fluid flow in the shallow crust”. It is not associated with a conference.
The authors thank Christian Kluge and Michael Naumann (GFZ Potsdam) for technical support during sample preparation. Constructive reviews by Marco Antonellini and Miller Zambrano are greatly acknowledged and helped to improve this paper.
This research has been supported by the China Scholarship Council (grant no. 201606410056) and the Bundesministerium für Bildung und Forschung (grant no. 03G0871D).
The article processing charges for this open-access
publication were covered by a Research
Centre of the Helmholtz Association.
This paper was edited by Fabrizio Balsamo and reviewed by Marco Antonellini and Miller Zambrano.
Barton, N., Bandis, S., and Bakhtar, K.: Strength, deformation and conductivity coupling of rock joints, Int. J. Rock Mech. Min. Sci. & Geomech. Abstr., 22, 121–140, https://doi.org/10.1016/0148-9062(85)93227-9, 1985.
Barton, N. and de Quadros, E. F.: Joint aperture and roughness in the prediction of flow and groutability of rock masses, Int. J. Rock Mech. Min. Sci., 34, 252.e1, https://doi.org/10.1016/S1365-1609(97)00081-6, 1997.
Blöcher, G., Zimmermann, G., and Milsch, H.: Impact of poroelastic response of sandstones on geothermal power production, Pure Appl. Geophys., 166, 1107–1123, https://doi.org/10.1007/s00024-009-0475-4, 2009.
Brown, S. and Smith, M.: A transient-flow syringe air permeameter, Geophysics, 78, D307, https://doi.org/10.1190/Geo2012-0534.1, 2013.
Brown, S. R. and Scholz, C. H.: Closure of random elastic surfaces in contact, J. Geophys. Res., 90, 5531–5545, https://doi.org/10.1029/JB090iB07p05531, 1985a.
Brown, S. R. and Scholz, C. H.: Broad bandwidth study of the topography of natural rock surfaces, J. Geophys. Res., 90, 12575–12582, https://doi.org/10.1029/JB090iB14p12575, 1985b.
Brown, S. R.: Simple mathematical model of a rough fracture, J. Geophys. Res.-Sol. Ea., 100, 5941–5952, https://doi.org/10.1029/94jb03262, 1995.
Bruines, P.: Laminar ground water flow through stochastic channel networks in rock, Doctoral dissertation, EPFL, Lausanne, 127 pp., 2003.
Corradetti, A., McCaffrey, K., De Paola, N., and Tavani, S.: Evaluating roughness scaling properties of natural active fault surfaces by means of multi-view photogrammetry, Tectonophysics, 717, 599–606, https://doi.org/10.1016/j.tecto.2017.08.023, 2017.
Darcy, H.: Les fontaines publique de la ville de Dijon, Dalmont, Paris, France, 1856.
Filomena, C. M., Hornung, J., and Stollhofen, H.: Assessing accuracy of gas-driven permeability measurements: a comparative study of diverse Hassler-cell and probe permeameter devices, Solid Earth, 5, 1–11, https://doi.org/10.5194/se-5-1-2014, 2014.
Fischer, C., Dunkl, I., von Eynatten, H., Wijbrans, J. R., and Gaupp, R.: Products and timing of diagenetic processes in Upper Rotliegend sandstones from Bebertal (North German Basin, Parchim Formation, Flechtingen High, Germany), Geol. Mag., 149, 827–840, https://doi.org/10.1017/S0016756811001087, 2012.
Ge, S.: A governing equation for fluid flow in rough fractures, Water Resour. Res., 33, 53–61, https://doi.org/10.1029/96WR02588, 1997.
Goggin, D., Chandler, M., Kocurek, G. T., and Lake, L.: Patterns of permeability in eolian deposits: Page Sandstone (Jurassic), northeastern Arizona, SPE Format. Evalu., 3, 297–306, https://doi.org/10.2118/14893-PA, 1988.
Hakami, E. and Larsson, E.: Aperture measurements and flow experiments on a single natural fracture, Int. J. Rock Mech. Min. Sci. & Geomech. Abstr., 33, 395–404, https://doi.org/10.1016/0148-9062(95)00070-4, 1996.
Hale, S., Naab, C., Butscher, C., and Blum, P.: Method comparison to determine hydraulic apertures of natural fractures, Rock Mech. Rock Eng., 53, 1467–1476, https://doi.org/10.1007/s00603-019-01966-7, 2019.
Hofmann, H., Blocher, G., Milsch, H., Babadagli, T., and Zimmermann, G.: Transmissivity of aligned and displaced tensile fractures in granitic rocks during cyclic loading, Int. J. Rock Mech. Min. Sci., 87, 69-84, https://doi.org/10.1016/j.ijrmms.2016.05.011, 2016.
Huysmans, M., Peeters, L., Moermans, G., and Dassargues, A.: Relating small-scale sedimentary structures and permeability in a cross-bedded aquifer, J. Hydrol., 361, 41–51, https://doi.org/10.1016/j.jhydrol.2008.07.047, 2008.
Isakov, E., Ogilvie, S. R., Taylor, C. W., and Glover, P. W.: Fluid flow through rough fractures in rocks I: high resolution aperture determinations, Earth Planet. Sc. Lett., 191, 267–282, https://doi.org/10.1016/S0012-821x(01)00424-1, 2001.
Jensen, J., Glasbey, C., and Corbett, P.: On the interaction of geology, measurement, and statistical analysis of small-scale permeability measurements, Terra Nova, 6, 397–403, https://doi.org/10.1111/j.1365-3121.1994.tb00513.x, 1994.
Kling, T., Huo, D., Schwarz, J. O., Enzmann, F., Benson, S., and Blum, P.: Simulating stress-dependent fluid flow in a fractured core sample using real-time X-ray CT data, Sol. Ea., 7, 1109–1124, https://doi.org/10.5194/se-7-1109-2016, 2016.
Kling, T., Schwarz, J.-O., Wendler, F., Enzmann, F., and Blum, P.: Fracture flow due to hydrothermally induced quartz growth, Adv. Water Resour., 107, 93–107, https://doi.org/10.1016/j.advwatres.2017.06.011, 2017.
Konzuk, J. S. and Kueper, B. H.: Evaluation of cubic law based models describing single-phase flow through a rough-walled fracture, Water Resour. Res., 40, W02402, https://doi.org/10.1029/2003WR002356, 2004.
Matsuki, K.: Size effect in flow conductance of a small-scale hydraulic fracture in granite, Geoth. Sci. Tech., 6, 113–138, 1999.
Milsch, H., Spangenberg, E., Kulenkampff, J., and Meyhöfer, S.: A new apparatus for long-term petrophysical investigations on geothermal reservoir rocks at simulated in-situ conditions, Transport Porous Med., 74, 73–85, https://doi.org/10.1007/s11242-007-9186-4, 2008.
Milsch, H., Hofmann, H., and Blocher, G.: An experimental and numerical evaluation of continuous fracture permeability measurements during effective pressure cycles, Int. J. Rock Mech. Min. Sci., 89, 109–115, https://doi.org/10.1016/j.ijrmms.2016.09.002, 2016.
Mourzenko, V. V., Thovert, J.-F., and Adler, P. M.: Permeability of a single fracture; validity of the Reynolds equation, J. Phys. II, 5, 465–482, https://doi.org/10.1051/jp2:1995133, 1995.
Nemoto, K., Watanabe, N., Hirano, N., and Tsuchiya, N.: Direct measurement of contact area and stress dependence of anisotropic flow through rock fracture with heterogeneous aperture distribution, Earth Planet Sci. Lett., 281, 81–87, https://doi.org/10.1016/j.epsl.2009.02.005, 2009.
Neuzil, C. E. and Tracy, J. V.: Flow through fractures, Water Resour. Res., 17, 191–199, https://doi.org/10.1029/WR017i001p00191, 1981.
New England Research, TinyPerm 3: available at: https://www.ner.com/site/systems/tinyperm3.html, (last access: 3 January 2017), 2015.
Ogilvie, S., Isakov, E., Taylor, C., and Glover, P.: Characterization of rough-walled fractures in crystalline rocks, Geol. Soc. London, Special Publications, 214, 125–141, 2003.
Ogilvie, S. R., Isakov, E., and Glover, P. W.: Fluid flow through rough fractures in rocks, II: A new matching model for rough rock fractures, Earth Planet. Sc. Lett., 241, 454–465, https://doi.org/10.1016/j.epsl.2005.11.041, 2006.
Possemiers, M., Huysmans, M., Peeters, L., Batelaan, O., and Dassargues, A.: Relationship between sedimentary features and permeability at different scales in the Brussels Sands, Geol. Belg., 15, 156–164, 2012.
Renshaw, C. E.: On the relationship between mechanical and hydraulic apertures in rough-walled fractures, J. Geophys. Res., 100, 24629–24636, https://doi.org/10.1029/95JB02159, 1995.
Renshaw, C. E., Dadakis, J. S., and Brown, S. R.: Measuring fracture apertures: A comparison of methods, Geophys. Res. Lett., 27, 289–292, https://doi.org/10.1029/1999GL008384, 2000.
Rogiers, B., Beerten, K., Smeekens, T., Mallants, D., Gedeon, M., Huysmans, M., Batelaan, O., and Dassargues, A.: Derivation of flow and transport parameters from outcropping sediments of the Neogene aquifer, Belgium, Geol. Belg., 16, 129–147, 2013.
Rogiers, B., Beerten, K., Smeekens, T., Mallants, D., Gedeon, M., Huysmans, M., Batelaan, O., and Dassargues, A.: The usefulness of outcrop analogue air permeameter measurements for analyzing aquifer heterogeneity: quantifying outcrop hydraulic conductivity and its spatial variability, Hydrol. Process., 28, 5176–5188, https://doi.org/10.1002/hyp.10007, 2014.
Saadi, F. A., Wolf, K.-H., and Kruijsdijk, C. v.: Characterization of Fontainebleau sandstone: quartz overgrowth and its impact on pore-throat framework, J. Pet. Environ. Biotechnol., 8, 1–12, https://doi.org/10.4172/2157-7463.1000328, 2017.
Snow, D. T.: Anisotropie permeability of fractured media, Water Resour. Res., 5, 1273–1289, https://doi.org/10.1029/WR005i006p01273, 1969.
Snow, D. T.: The frequency and apertures of fractures in rock, Int. J. Rock Mech. Min. Sci., 7, 23–40, https://doi.org/10.1016/0148-9062(70)90025-2, 1970.
Tsang, Y.: Usage of “equivalent apertures” for rock fractures as derived from hydraulic and tracer tests, Water Resour. Res., 28, 1451–1455, 1992.
Ukar, E., Laubach, S. E., and Hooker, J. N.: Outcrops as guides to subsurface natural fractures: Example from the Nikanassin Formation tight-gas sandstone, Grande Cache, Alberta foothills, Canada, Mar. Petrol. Geol. 103, 255–275, 2019.
Walsh, J.: Effect of pore pressure and confining pressure on fracture permeability, Int. J. Rock Mech. Min. Sci. & Geomech. Abstr., 18, 429–435, https://doi.org/10.1016/0148-9062(81)90006-1, 1981.
Watkins, H., Bond, C. E., Healy, D., and Butler, R. W.: Appraisal of fracture sampling methods and a new workflow to characterise heterogeneous fracture networks at outcrop, J. Struct. Geol., 72, 67–82, https://doi.org/10.1016/j.jsg.2015.02.001, 2015.
Witherspoon, P. A., Wang, J. S., Iwai, K., and Gale, J. E.: Validity of cubic law for fluid flow in a deformable rock fracture, Water Resour. Res., 16, 1016–1024, https://doi.org/10.1029/WR016i006p01016, 1980.
Xiong, X., Li, B., Jiang, Y., Koyama, T., and Zhang, C.: Experimental and numerical study of the geometrical and hydraulic characteristics of a single rock fracture during shear, Int. J. Rock Mech. Min. Sci., 48, 1292–1302, https://doi.org/10.1016/j.ijrmms.2011.09.009, 2011.
Zambrano, M., Pitts, A. D., Salama, A., Volatili, T., Giorgioni, M., and Tondi, E.: Analysis of fracture roughness control on permeability using SfM and fluid flow simulations: implications for carbonate reservoir characterization, Geofluids, 2019, 1–19, https://doi.org/10.1155/2019/4132386, 2019.
Zeeb, C., Gomez-Rivas, E., Bons, P. D., and Blum, P.: Evaluation of sampling methods for fracture network characterization using outcrops, AAPG Bull., 97, 1545–1566, https://doi.org/10.1306/02131312042, 2013.
Zimmerman, R. W., Kumar, S., and Bodvarsson, G. S.: Lubrication theory analysis of the permeability of rough-walled fractures, Int. J. Rock Mech. Min. Sci. & Geomech. Abstr., 28, 325–331, https://doi.org/10.1016/0148-9062(91)90597-F, 1991.
Zimmerman, R. W., Chen, D.-W., and Cook, N. G.: The effect of contact area on the permeability of fractures, J. Hydrol., 139, 79–96, https://doi.org/10.1016/0022-1694(92)90196-3, 1992.