the Creative Commons Attribution 4.0 License.
the Creative Commons Attribution 4.0 License.
 | 17 Dec 2020
In situ hydromechanical responses during well drilling recorded by fiber-optic distributed strain sensing
Xinglin Lei
Tsutomu Hashimoto
Ziqiu Xue
Drilling fluid infiltration during well drilling may induce pore pressure and strain perturbations in neighbored reservoir formations. In this study, we report that such small strain changes (∼20 µε) have been in situ monitored using fiber-optic distributed strain sensing (DSS) in two observation wells with different distances (approximately 3 and 9 m) from the new drilled wellbore in a shallow water aquifer. The results show the layered pattern of the drilling-induced hydromechanical deformation. The pattern could be indicative of (1) fluid pressure diffusion through each zone with distinct permeabilities or (2) the heterogeneous formation damage caused by the mud filter cakes during the drilling. A coupled hydromechanical model is used to interpret the two possibilities. The DSS method could be deployed in similar applications such as geophysical well testing with fluid injection (or extraction) and in studying reservoir fluid flow behavior with hydromechanical responses. The DSS method would be useful for understanding reservoir pressure communication, determining the zones for fluid productions or injection (e.g., for CO2 storage), and optimizing reservoir management and utilization.
- Article
(2858 KB) - Full-text XML
-
Supplement
(335 KB) - BibTeX
- EndNote


The utilization of underground reservoirs includes the exploitation or storage of resources such as groundwater, oil/gas, heat, and more recently, the CO2 for mitigating the effect of CO2 emission on global warming (Benson et al., 2005), as well as storage of compressed air for electric energy storage (Mouli-Castillo et al., 2019) in underground reservoirs. For better utilization, an understanding of fluid flow and reservoir characteristics is required for more manageable and optimized operations. Geophysical methods, such as site-scale seismic, electrical methods, and well logging, have been widely applied for reservoir characterization and monitoring.
Distributed fiber optic sensing is emerging as a novel and practical technology for underground reservoir monitoring by measuring the environmental changes of physical fields, such as temperature, strain, and elastic waves (Barrias et al., 2016; Schenato, 2017; Shanafield et al., 2018). There have been numerous application studies using distributed temperature sensing (DTS) and distributed acoustic sensing (DAS) in subsurface monitoring. DTS data have been useful for understanding fluid flow behavior (such as flow rate and active fluid flow zone) and reservoir characteristics owing to the hydrothermal coupling in addition to heat transport monitoring (Bense et al., 2016; Freifeld et al., 2008; Luo et al., 2020; Maldaner et al., 2019; des Tombe et al., 2019). DAS has been intensively developed and used to monitor the surface, subsurface shallow reservoirs, or deep structures (Daley et al., 2013; Jousset et al., 2018; Lellouch et al., 2019; Lindsey et al., 2019, 2020; Zhu and Stensrud, 2019). On the other hand, the usage of distributed strain sensing (DSS) for subsurface monitoring of quasi-static deformation is comparatively less.
Although the main purpose of DSS is the monitoring of geomechanical deformations or earth subsidence (for safety considerations) (Kogure and Okuda, 2018; Krietsch et al., 2018; Murdoch et al., 2020; Zhang et al., 2018), DSS could also be used to understand reservoir formation and reservoir flow owing to hydromechanical coupling. In principle, the physical coupling between fluid flow and strain is understood by the linear poroelasticity theory (Biot, 1941). In poroelastic theory, the deformation, such as soil consolidation, can induce “solid-to-fluid” coupled pressure change and fluid flow, whereas conversely, the fluid flow with pressure change can modify the effective stress of reservoir formation and cause “fluid-to-solid” coupled deformations (Cheng, 2016; Neuzil, 2003; Wang, 2017). The deformations could be the expression of fluid flow behavior in the reservoir and bear information regarding fluid flow and reservoir characteristics (such as permeability and compressibility) (Barbour and Wyatt, 2014; Schuite et al., 2015, 2017; Schweisinger et al., 2009; Zhang and Xue, 2019). By monitoring strain changes of an aquifer, fluid-to-solid coupling can characterize the hydraulic parameters in the reservoir formation.
Deformation-based reservoir monitoring methods have been recently applied to obtain the lateral permeability distribution (at coarse scales) of underground reservoirs with surface deformation monitored by InSAR technique (Bohloli et al., 2018; Vasco et al., 2008, 2010) and estimate the vertical compressibility with vertical deformation measured by well-based techniques (e.g., radioactive maker technique and extensometer stations) (Ferronato et al., 2003; Hisz et al., 2013; Murdoch et al., 2015). However, such vertical deformation monitoring tools are usually only available at limited points and over limited time intervals. In addition, the contribution of each formation zone to the total surface displacement is not well understood.
It could be suitable for in situ monitoring of such hydromechanical responses in reservoirs via the high accuracy and resolution of DSS using optical fibers. Several studies have used the DSS tool to demonstrate that the deformation recorded during fluid injection in rocks can be utilized to obtain information on permeability, compressibility, and track pressure and fluid plume migration in laboratory experiments (Zhang et al., 2019; Zhang and Xue, 2019). Becker et al. (2017), Lei et al. (2019) and Sun et al. (2020) have recently shown that the hydromechanical responses during reservoir testing (water injection or extraction) can be effectively monitored via DSS. These studies suggest the high application potential of the DSS tool in field studies for monitoring underground fluid reservoirs.
In addition to the purposed reservoir testing, the well-drilling process itself also develops hydromechanical processes – the drilling fluid (also called mud) can infiltrate the reservoir formation under the pressure drive from the wellbore and deform the formation. Considering the hydromechanical response, the spatial variations in reservoir permeability heterogeneity are expected to affect the pattern of formation deformation. Conversely, the deformation pattern could be indicative of the formation permeability structure. Besides, the formation damage may be involved in the drilling process and affect the pressure diffusion process. The formation of mud filter cake near the wall of borehole and the infiltration of solid particles in drilling fluid may occur during the drilling and reduce the permeability around the borehole. This may also affect the hydromechanical deformation.
In this study, we examine the high-resolution DSS records of a field study with strain monitoring in two wells (where optical fiber cables were installed) while drilling a new well. The results suggest that the formation strain pattern during well drilling could be associated to two causes: either by the permeability structure or drilling-induced formation damage (or their combination). For the former cause, the data can be used to understand the reservoir lithological changes and permeability structure. In this paper, we first introduce the measurement principle of high-resolution DSS based on Rayleigh scattering and field site operations considering the installation method; then we present the results of monitoring using DSS while well drilling, and finally we interpret the strain pattern using a coupled hydromechanical numerical model and discuss the two possibilities of the two causes. Some implications and potential applications are emphasized.
Optical fiber sensors work with the principle that the environmental effects (e.g., strain, temperature) can alter the phase, frequency, spectral content, and power of backscattered light propagated through an optical fiber. There are three types of scattering mechanisms – Raman, Brillouin, and Rayleigh scattering – used for measuring temperature or strain changes. In this study, we only consider the Rayleigh backscattering-based method.

Figure 1Illustration of time-domain reflectometer (COTDR) method based on Rayleigh scattering.
Rayleigh backscattering occurs when light propagates due to the existence of small random optical defects or impurities in the fiber core. Rayleigh backscatter spectrum of a point in an optical fiber can be considered as a fingerprint of the fiber. In conventional coherent optical time-domain reflectometer (COTDR) method, Rayleigh backscatter spectrum generated for each region in the longitudinal direction of the optical fiber is obtained through measurement (Fig. 1) (Hartog, 2017). From the frequency shift between the reference Rayleigh-scattering power spectrum (RSPS) and a target RSPS using the cross-correlation method, the strain or temperature change at the point can be calculated. The distance of the scattering occurrence to the input end can be calculated using the travel time of scattered light. Because the length of light pulse in COTDR is large, the spatial resolution of conventional COTDR is low.
To obtain high spatial resolution, the pulse length of incident light must be shortened. However, if the pulse is shortened, the light pulse energy and thus the signal intensity of the backscatters are lowered, and the measurement accuracy becomes low at positions distant from the input end. For overcoming the limitations of conventional COTDRs, in the new tunable wavelength coherent optical time-domain reflectometer (TW-COTDR) method, the tunable wavelength distributed feedback laser and chirp signals by frequency sweeping and modulation methods are used to shorten laser light pulses while simultaneously ensuring sufficient pulse intensity (Kishida et al., 2014; Koyamada et al., 2009). To enhance the intensity of chirped signals and suppress the range side lobe, Gaussian amplitude modulation is performed. An inverse chirp filter is used to obtain RSPS in the analysis. Finally, the cross-correlation method is used for calculating the frequency shift amount of the spectrum, which is further used to calculate the strain or temperature change. TW-COTDR offers the ability of single-end accessing distributed measurements, high sensitivity, wide range of spatial resolutions, and measurements over long distances. Each distributed point (a short portion) along the entire length of an optical fiber can be taken as a sensing element.
The frequency shift (Δf) caused by strain and temperature changes (Δε and ΔT) can be linearly described using the following simple equation:
where A and B (are the coefficients) relate the frequency shift to strain and temperature changes. Under the condition of constant temperature (ΔT=0, assumed in this study), the frequency shift (Δf) simply becomes proportional to the strain change (Δε) by A. A is −0.140 GHz µε−1 for the optical fiber used in this study. The value was obtained from a prior calibration measurement, which was conducted using the tensile tester with a displacement gauge. We used an optical interrogator NBX-SR7000 (Neubrex Co., Ltd., Japan) with TW-COTDR function in this study (Kishida et al., 2014). The instruments can provide high measurement accuracy (0.5 µε) and spatial resolution (5 cm), allowing for the monitoring of very small strains over long distances (∼25 km) in a distributed manner.
The field test site is located in the rural area of Mobara city (Chiba, Japan). The subsurface formation of the site develops near-horizontal layered heterogeneity by the lithological changes of sandstone–mud alternations (Lei et al., 2019). There are two pre-existing vertical wells (obs1 and obs2) with prior installations of optical fiber cables, by installing optical fiber cables behind the casing of the wellbore. In engineering practice, because the silica-fabricated nude optical fiber itself is thin and weak, fabricated fiber cables using extrinsic reinforced jackets are necessary for protecting the central fiber core and practically installing the fiber in underground wellbores. A stainless-steel wire reinforced cable (strain cable) was deployed. In the fiber cable, two stainless-steel wires (SUS304 WBP) are assembled alongside the fiber core (SR15) in the polyolefin elastomer body (Fig. 3). During the installation, the cable with each segment of steel casing was carefully placed downward to the wellbore. The cable was fixed using specially designed clamps, placing the fiber cable between the casing and the formation (Fig. 2c).
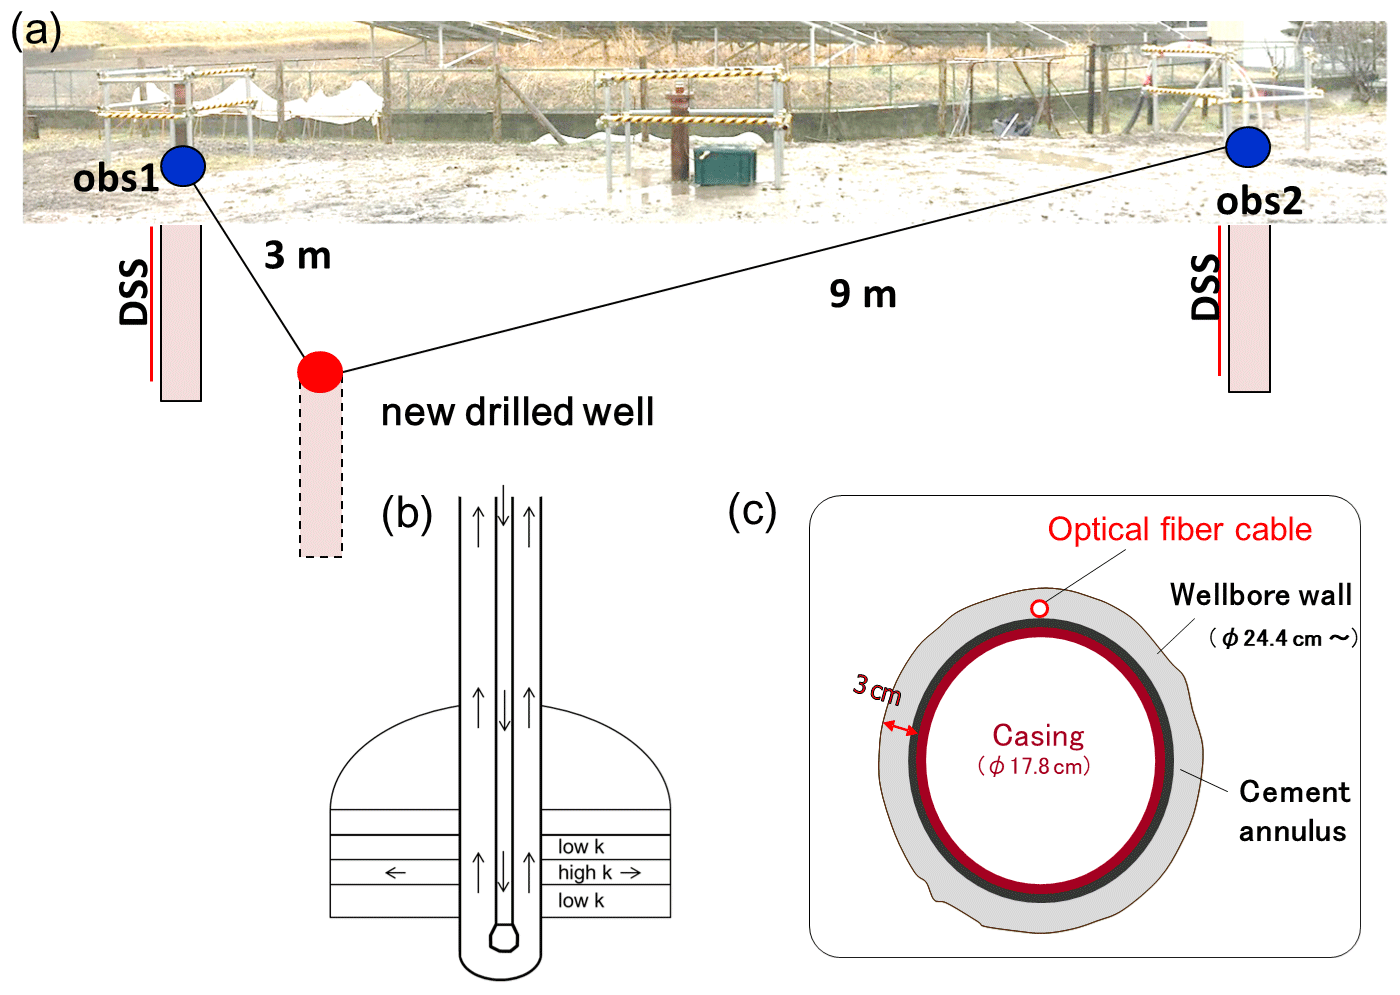
Figure 2(a) Well pattern for wells obs1 and obs2, in which optical fibers were installed, and the new drilled well; (b) schematic of the drilling fluid invading the reservoir formation; and (c) axial cross section of the well showing the area behind the casing installation of optical fiber cable.
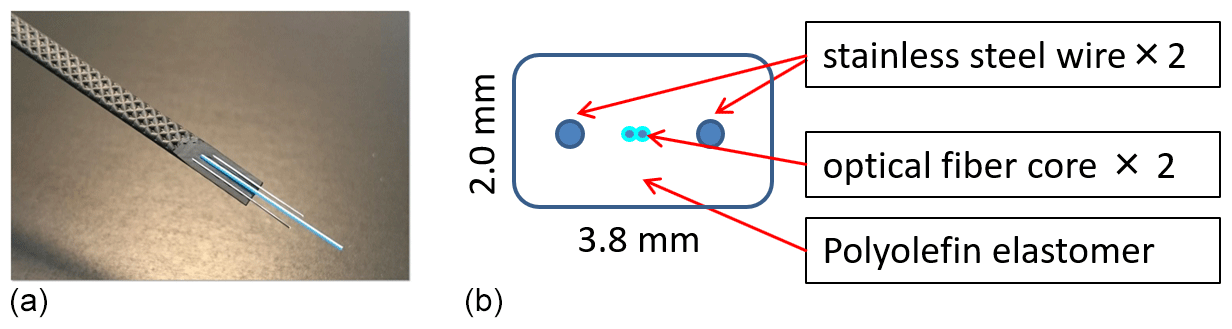
Cementing operations with injection of cement slurry were undertaken to further fix the fiber cable and seal the annulus after the siting of the casing. The cementing operations must be conducted with sufficient care to ensure the integrity of the entire cementing string and avoid sudden downward migration of the cement column or the development of new local cracks or sudden compression, which, in combination with large local strains, may damage the fiber. The cable's width and height are approximately 3.8 and 2.0 mm, respectively. Another kind of fiber cable (temperature cable) with solely sensitivity to temperature was also installed for examining the in situ temperature changes. After well completion with fiber cable installation, the wellbore and formations were equilibrated for a long duration of time (e.g., a month) to reach stability before further monitoring of reservoir testing. The data obtained during this period can be used to evaluate the cementing job and the well stability.
In this study, a new well was drilled approximately 3 m from one observation well and 9 m from the other (Fig. 2a). The diameter of the new well was approximately 15.9 cm. The final drilling depth was 186.5 m. During the drilling, a NP-700 mud pump was used to pump out and circulate the drilling fluid (mud water) flowing in the well; this was done to remove cuttings and maintain the wellbore stability. The bentonite clay-based and ribonite adjusting agents were intermittently and manually added to the drilling fluid. The drilling fluid had a density of approximately 1.1 kg L−1 and a high viscosity (the value is unknown), which require a high pressure to drive the drilling fluid to circulate in the well.
The drilling fluid can partially invade the reservoir formation or permeable layers in the lateral direction under high-pressure conditions at the wellbore (Fig. 2b). This produced hydromechanical deformation in the areas where the pressure propagated towards. The vertical changes in permeability in such lithological layers or zones are expected to guide the pattern of fluid infiltration, pressure change, and formation deformation.
We monitored the real-time strain changes at obs1 and obs2 using DSS while drilling the new well. The fiber optic acquisition was performed using the Neubrescope NBX-SR7000 device in a quick measurement mode (approximately 2 min record−1). The optical fibers for the two wells were connected to the acquisition device through separate channels. We used an optical switch to routinely distribute measurement jobs to each channel.
DSS records obtained during the drilling of the new well were graphed as time–depth–strain value contour images, depth–strain value profiles, and strain value–time curves (Figs. 4–6). In these figures, the time-lapse changes in strain responses accompanying the drilling process are clearly revealed at the locations of both the obs1 and obs2 wells. The spatiotemporal changes in strain are corresponding to each drilling interval. The onset of strain change corresponds to the start of the drilling process at each depth. Strain records clearly indicate the downward migration of drilling operation. Phase delays appear at both wells for strain records at depths of approximately 71, 87, and 144 m (Fig. 6a and b). The drilling process left a marked trace in the strain records (Fig. S1 in the Supplement).
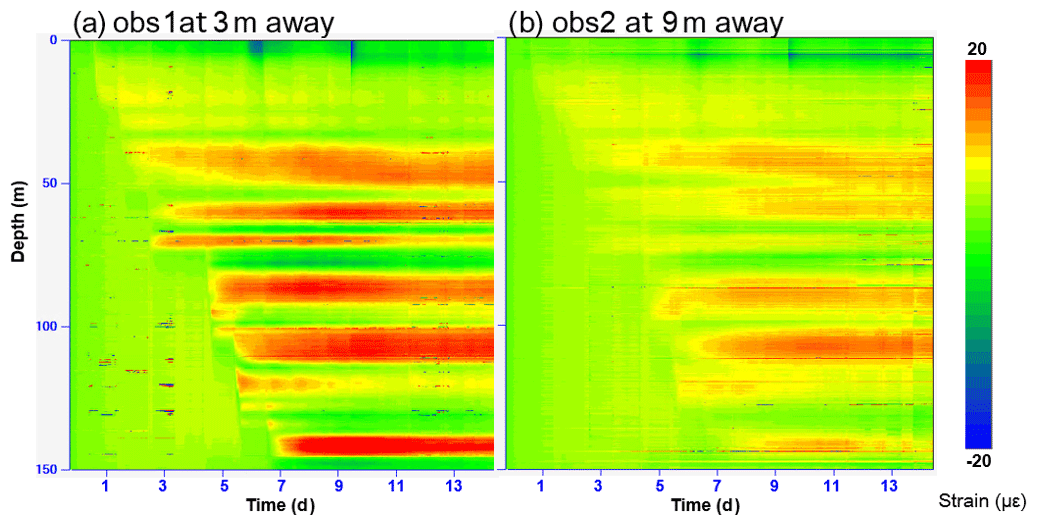
Moreover, the spatiotemporal patterns of changes in strain in the two observation wells match the layered formation structure. The different magnitudes of the changes of strain in the two wells – smaller changes developed in obs2 than in obs1 – may indicate the diffusion of radial pressure and attenuation from the near to far field (Fig. 4a and b) along strata. The drilling fluid invasion induced fluid pressure propagated mostly along the layers. The greatest expansion strain that developed at the closer obs1 well is approximately 25 µε (which is still a small value), whereas at the obs2 well it is approximately 10 µε (Fig. 5f).
Furthermore, variations in strain magnitude in the vertical direction appear at different depths, perhaps indicating depth-dependent lithological heterogeneities (sandstone–mudstone alternation) and permeability changes. These strain peaks may indicate more permeable layers. Figure S2 shows the well logs of compressive and shear wave velocities (Vp and Vs) in the depth range between 100 and 150 m. The lithological changes can be also visible from Vp and Vs logs. Compared to the Vp and Vs, the distributed strain records show a clearer pattern of formation structure. In addition, there appears to be a trend in which the strain magnitude increases with respect to depth. This may be related to the increased pressure at the wall of the drilling well to greater depths, which is caused by the increasing density of drilling fluid under the effect of gravity. Among these positive strain peaks, the transition layers show negative (compressive) strains. The dilation deformation was generally larger than the compressive deformation (Fig. 5f).
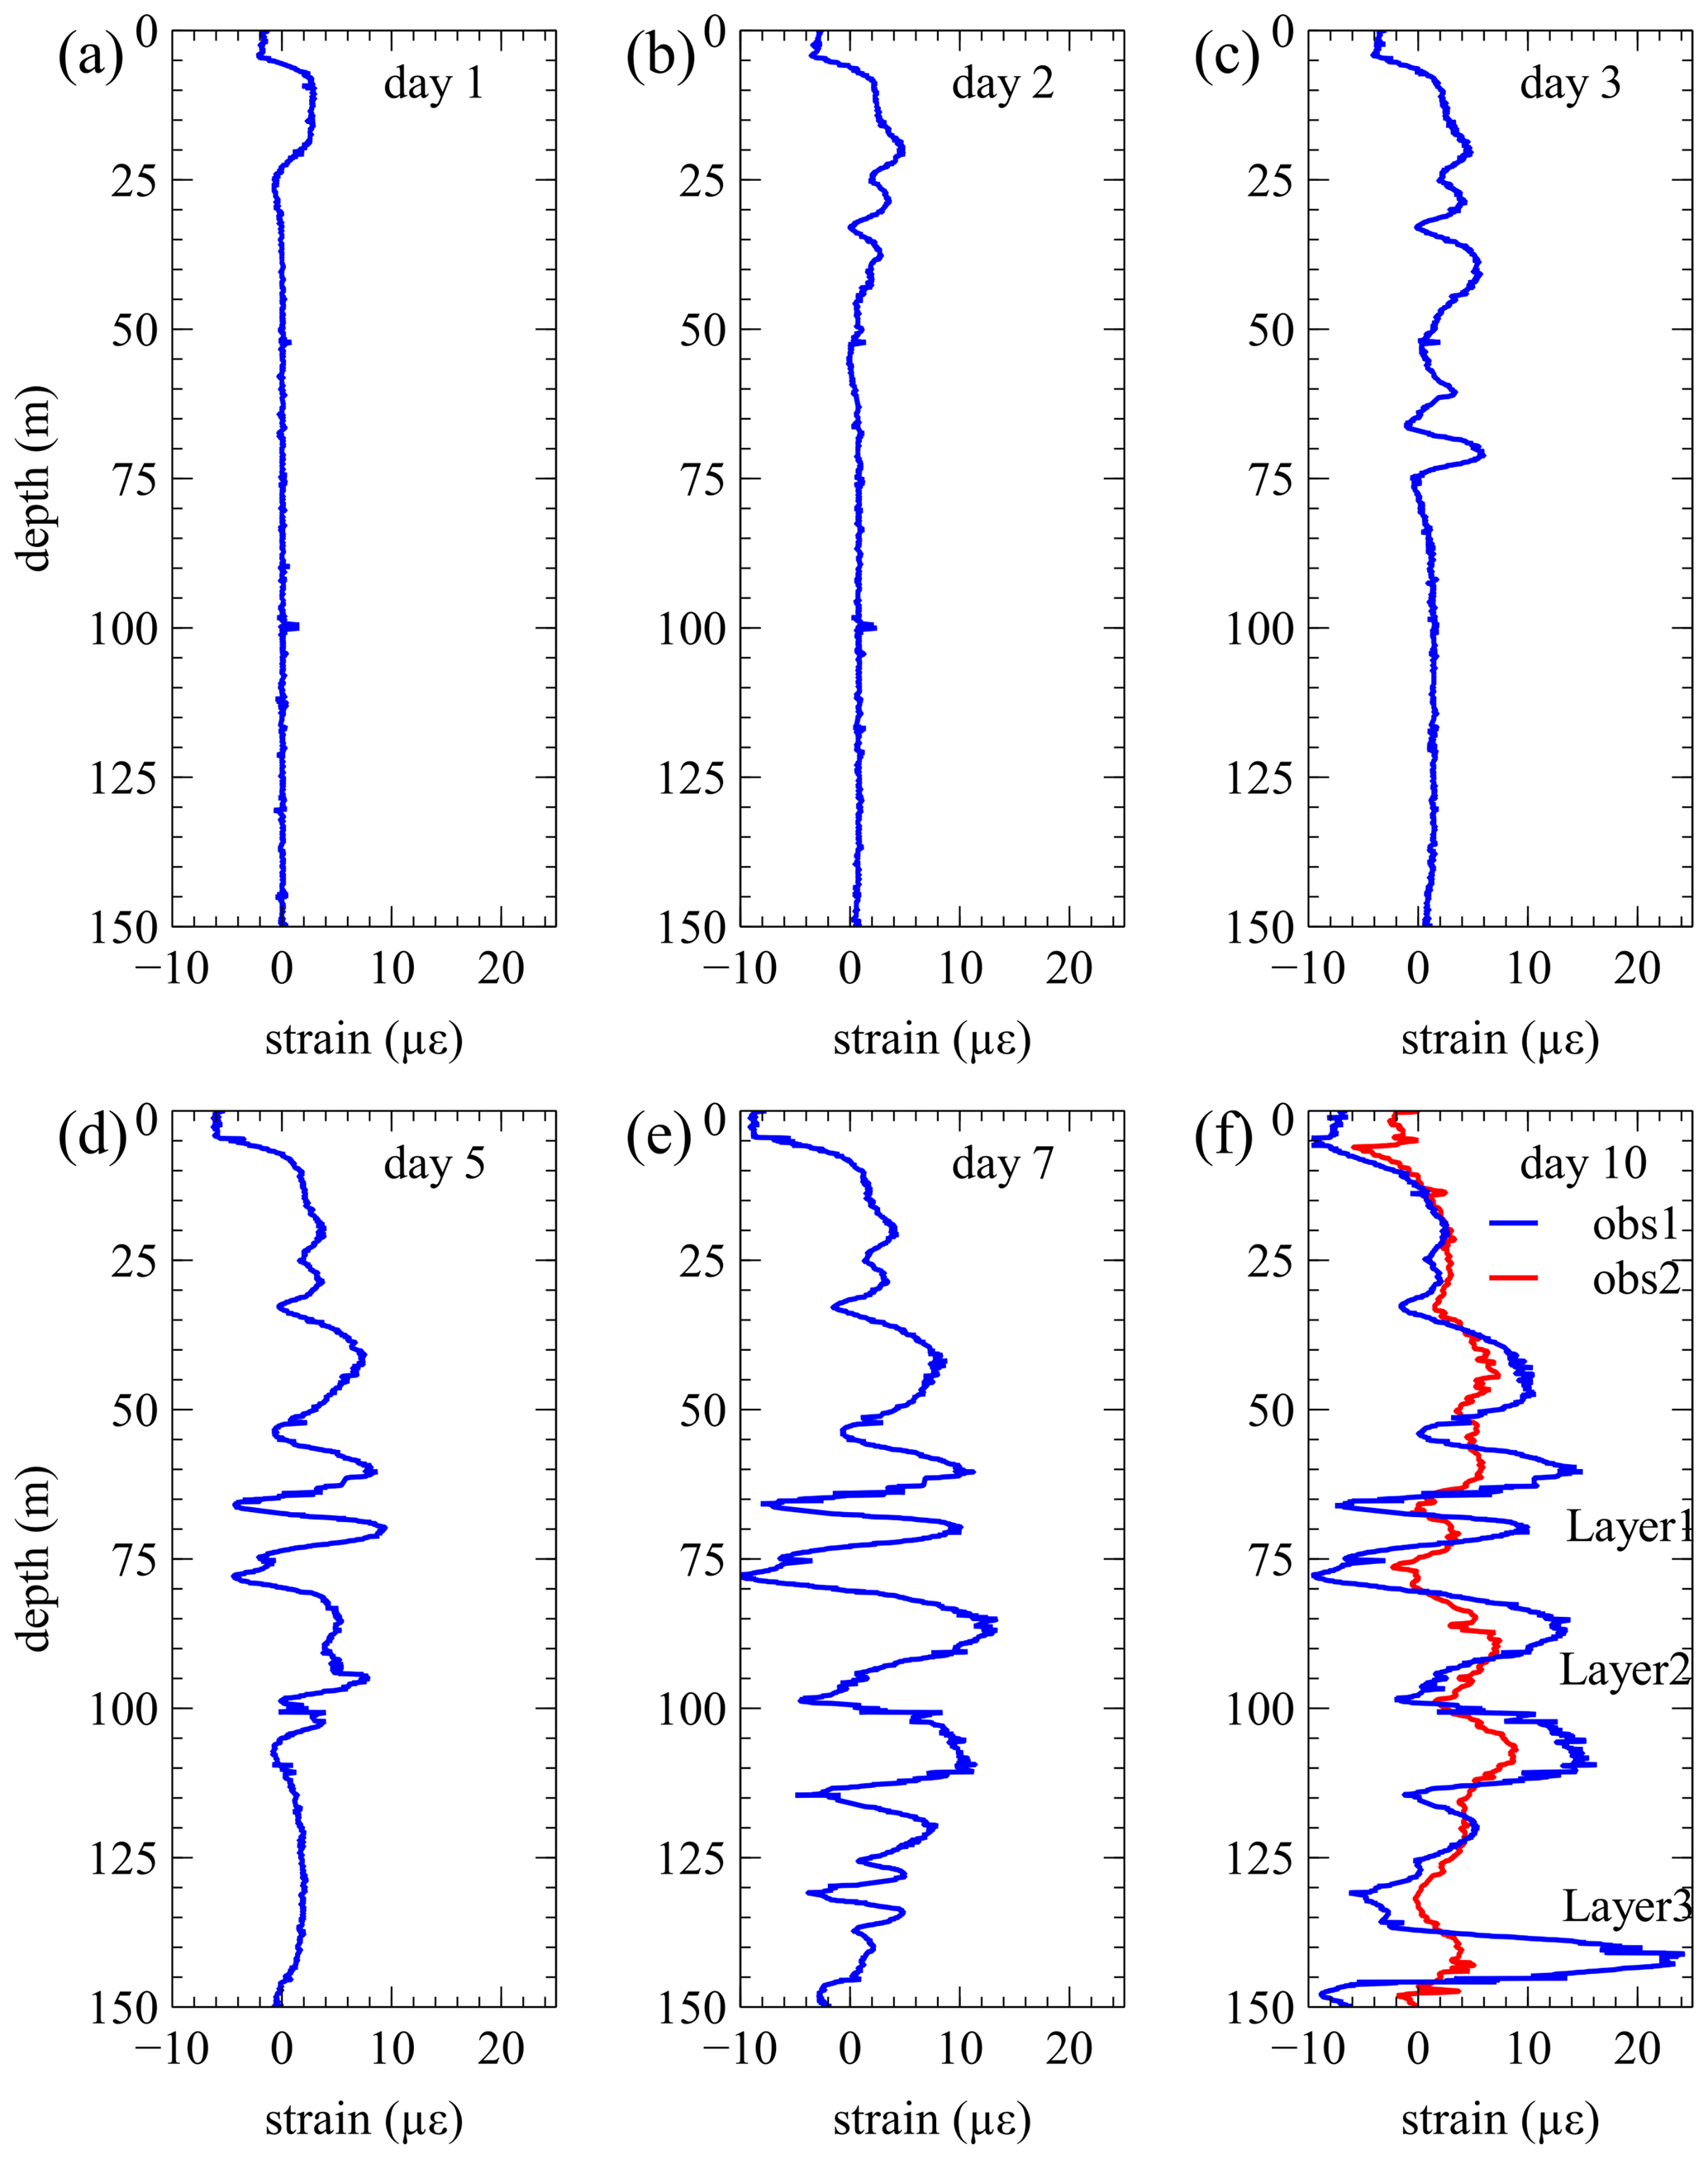
Figure 5Strain profiles along obs1 well on different days. The strain profile of obs2 at day 10 is added in (f) for comparison. The time series of the strain changes for the three arrows refer to depths shown in Fig. 6.
In Fig. 6a and b, the variations in the strain values with respect to time may reflect the time-dependent pressure propagation during drilling. At the initial stage after drilling reached the depth, there were some diffusion-controlled changes as the strain increased gradually; however, after the strain developed to some values, there were some irregular variations followed by a gradual reduction in strain values. The irregular variations and reduction might be due to the instabilities of drilling operations and the formation damage by forming of mud filter cake near the well wall during the ongoing drilling. During the drilling, water and other drilling materials were intermittently added into the drilling fluid at the surface (according to the operator's experience). Regardless, most of the raw strain data (time series) show a quite good trend, manifesting high-quality data and good DSS performance. The subtle hydromechanical deformations caused by well drilling have been clearly captured. Besides, the changes were not relevant to temperature. The records of another optical fiber sensing cable with solely sensitivity to temperature (and insensitive to strain) show no apparent change in temperature (Fig. S3).
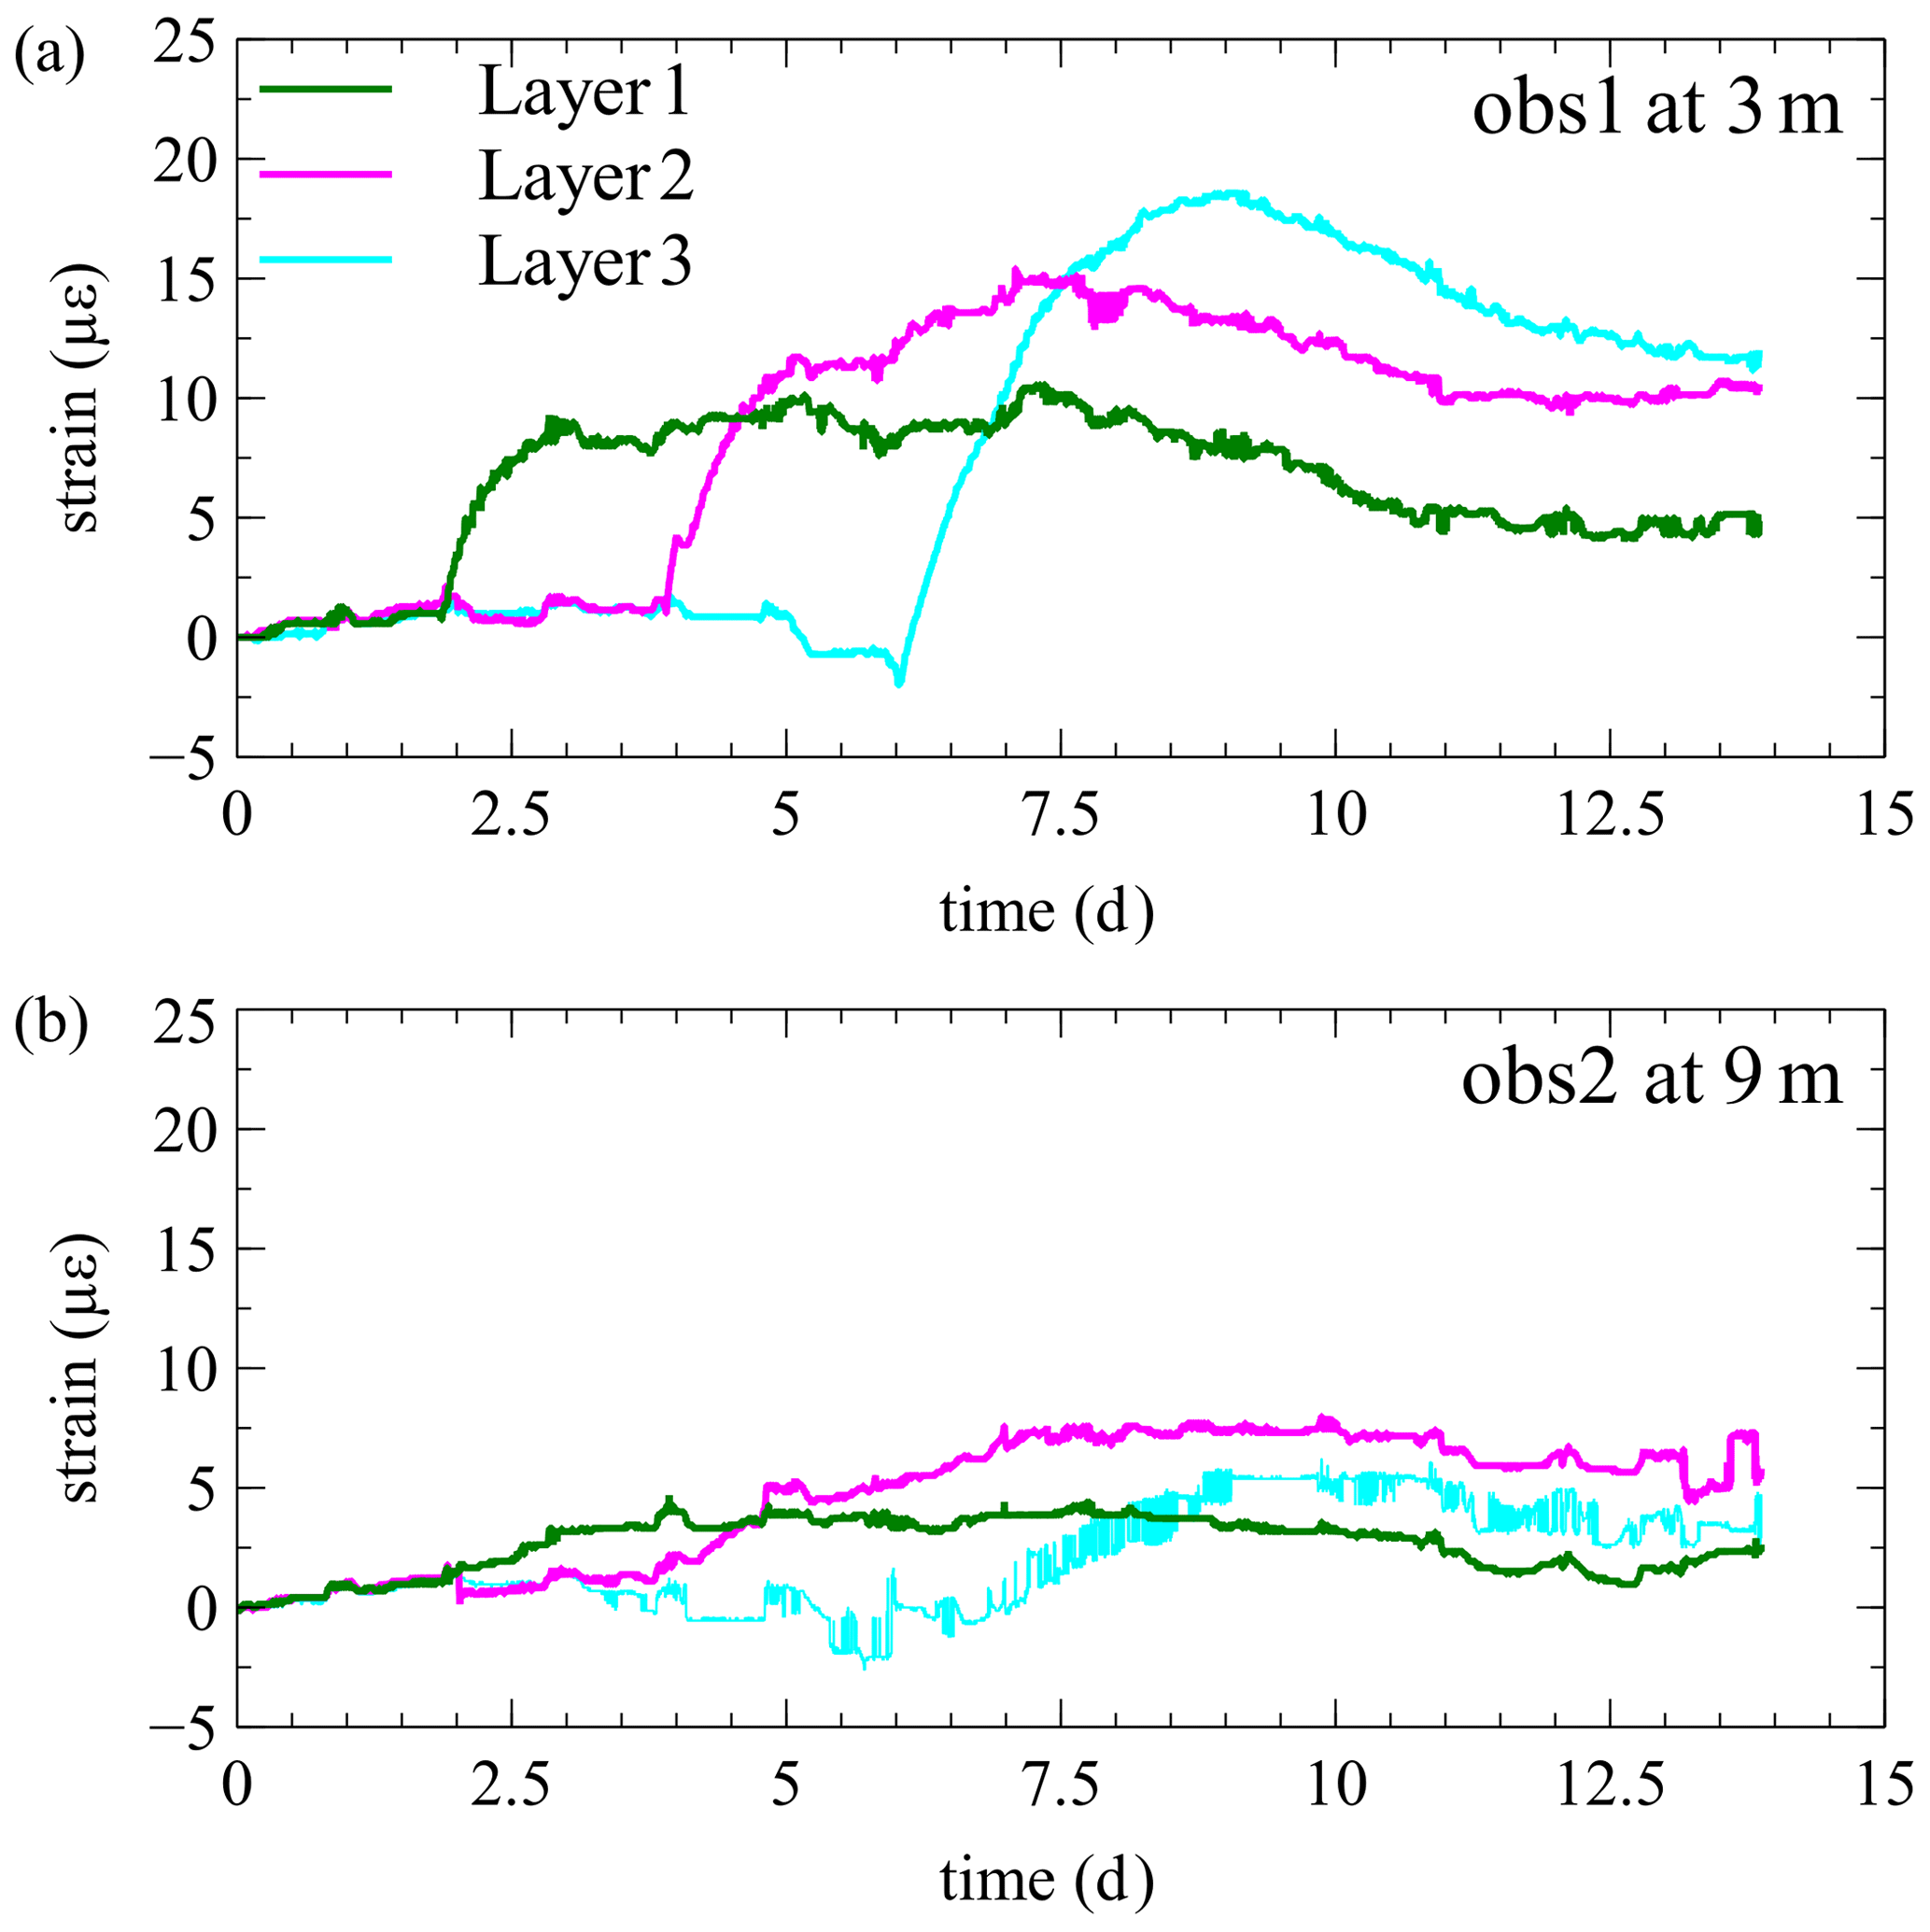
Figure 6Strain changes with respect to time at depths of approximately 71, 87, and 144 m of obs1 (a) and obs2 (b) wells.

Figure 7Schematic illustration of spatial strain (ε) due to changes in pore pressure (ΔP). The latter is controlled by permeability (k) of formation layers.
The strain development at obs1 and obs2 could be understood by considering the poroelastic diffusion (Biot, 1941; Rice and Cleary, 1976; Rudnicki, 1986; Yang et al., 2015). For example, there was an additional pressure change (ΔP0) at the drilling location due to the density increment of drilling fluid relative to the hydrostatic formation pressure. The radial pressure diffusion caused further pressure changes (ΔP1 and ΔP2) at the depths of wells obs1 and obs2, as controlled by the permeability of the layer (Fig. 7). Consequently, the corresponding poroelastic changes occurred for effective stress (σ1 and σ2) and strain (ε1 and ε2) at these sites.
Here we use a hydromechanically coupled model to simulate the poroelastic responses induced by the drilling pressure. For the drilling operation was quite dynamic (with intermittent pause and continuation events), we only consider the strain pattern at a selected stage (which is assumed stable; day 10 in Fig. 5f). Moreover, because there are no other parameter data (such as elastic and permeability parameters) except strain records, our purpose of the modeling here is to interpret and capture the main effect of formation permeability structure on the deformation pattern but not to quantify the exact value. Essentially, we consider the extra fluid pressure in the wellbore exerted by the depth-dependent density increment of the drilling fluid and do not consider the dynamic processes (e.g., pause and continuation, addition of drilling mud, and pressure perturbations).
An axisymmetric cylindrical 2D model (300 m×300 m) is built to represent the site setting. The vertical axis represents the new drilled well. We compare the modeled strain at distance of 3 and 9 m to the vertical axis with the strain records of obs1 and obs2. The finite element modeling framework MOOSE is used to solve the coupled model (Permann et al., 2020). A Dirichlet condition with depth-dependent pressure (=Δρgz) is set at the drilling location and a constant pressure at the outer side. The normal component of the displacements at the outer side and bottom of the model is set to zero. We use constant values for Young's modulus, 2.5×10⁸ Pa, Poisson's ratio, 0.29, and Biot's coefficient, 1, in the entire domain. The values are rather arbitrarily selected for they are unknown. Importantly, we set distinct permeability for each layer in the hydromechanical model. We vary the permeability values to find a result with the similar strain pattern compared to the measurement.
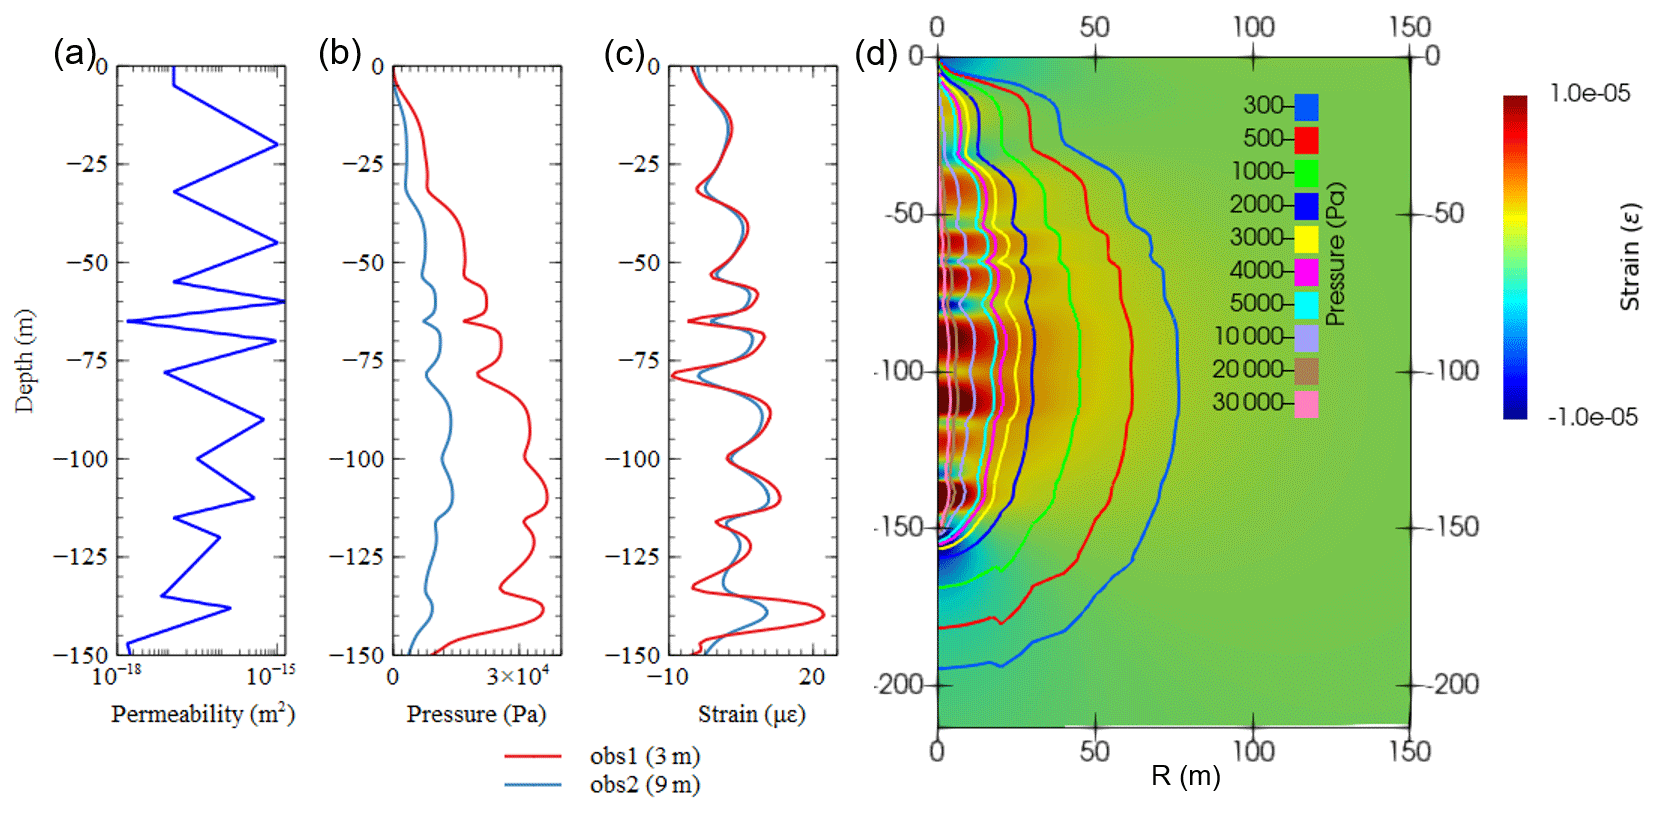
Figure 8Assumed permeability structure (a); profiles of the modeled pore pressure (b) and strain (c) changes at the distance of wells obs1 and obs2; and spatial image of strain with contour of pressure changes (d) on day 10.
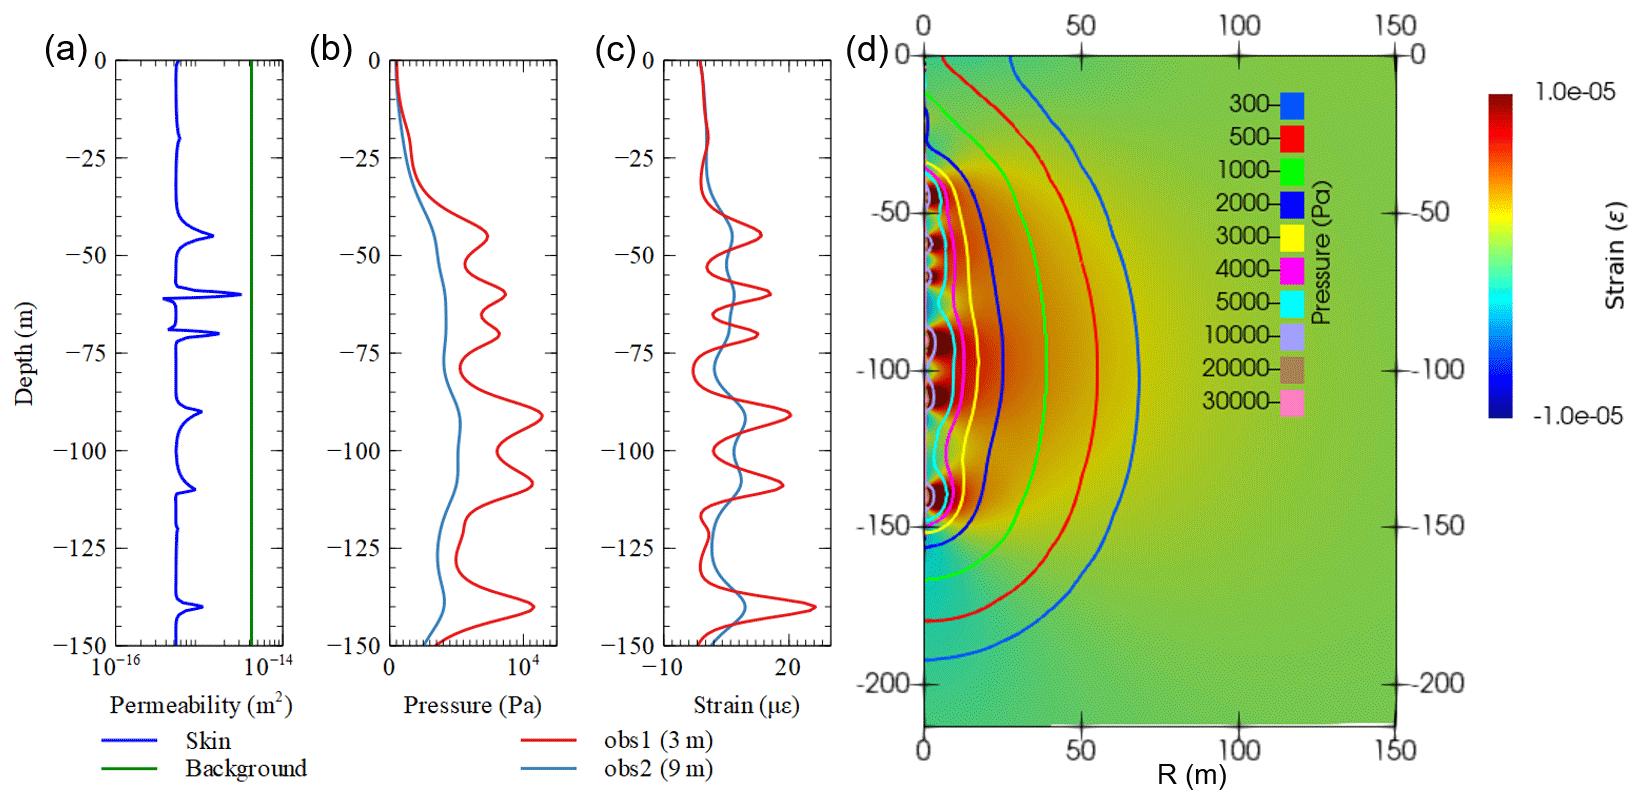
Figure 9Assumed permeability structure of the skin formed by mud filter cakes (a); profiles of the modeled pore pressure (b) and strain (c) changes at the distance of wells obs1 and obs2; and spatial image of strain with contour of pressure changes (d) on day 10.
Figure 8b–d show the modeling results with the assumed layered permeability structure (Fig. 8a). The modeled strain pattern on day 10 is largely consistent with the measurement. As expected, the strain pattern reveals the main structure of the assumed permeability. This suggests that the detected strain changes are explainable by the permeability-dependent poroelastic diffusion induced by the drilling. In addition, it seems that the strain records contain more abundant information on the spatial variations and are more sensitive to the formation permeability structure than the fluid pressure. The latter initially has significant variations (which are proportional to the permeability); however, it gradually becomes spatially smooth in a later phase (e.g., on day 10) due to pressure diffusion.
From the modeling results, we can also observe the passive compressive deformation in the low-permeability layers as in the DSS records. The compressive deformation is developed by the mechanically compacted forces exerted by the positive strain in the neighbored layers where the poroelastic expansion occurs. In the modeling, we find that the magnitude of the compressive deformation depends on the contrast of the permeability between layers (and the elastic modulus; however, it is not considered here). Therefore, these low-permeability layers play a role in the compensation of the positive deformation developed in those high-permeability layers, although the entire formation is dominated by the dilation deformation.
In several previous studies, the surface displacement caused by fluid injection or extraction has been investigated using geodetic techniques (e.g., InSAR) and used to estimate reservoir properties (Alghamdi et al., 2020; Bohloli et al., 2018; Bonì et al., 2020; Rezaei and Mousavi, 2019; Smith and Knight, 2019; Vasco et al., 2008). Here our results suggest that the dilation deformation caused by fluid injection is partially compensated by adjacent zones. Therefore, using solely surface data to estimate reservoir hydraulic parameters may need to consider the compensation effect. DSS data are expected to be complementary to the surface-based monitoring methods in resolution and dimension.
The modeling is useful for examining the spatial range where there are obvious pressure and strain changes. With the assumed parameters, the drilling fluid can produce a small strain (approximately 1 µε) at a distance approximately 80 m away from the drilling well on day 10. The changes thus could be monitored by the DSS. However, we find that the spatial range where a clearly layered strain pattern develops can be extended to approximately 30 m. Beyond the range, the layered pattern of the poroelastic strain disappears; the deformation in each layer becomes smooth and the strain magnitude becomes small. Therefore, for an observation well at a farther distance, the layered pattern could not be observed. The range is expected to be expanded with the increasing of layers' permeability and the contrast between layers and the rate of fluid injection (or extraction).
As mentioned above, the formation damage may be involved in the drilling process and affect the pressure diffusion process. The formation of mud filter cake near the wall of the borehole and the infiltration of solid particles in the drilling fluid may occur during the drilling and reduce the permeability around the borehole. Above, we interpret the strain pattern is controlled by the formation's intrinsic permeability structure. Another possibility is that the formation damage and the formation of the low-permeability skin may be the source of formation heterogeneity. To investigate this possibility, here we consider a uniform formation background in permeability ( m2) and a near-well skin shell (i.e., 30 cm from the wall of the drilling well) with the different degrees of permeability reduction by the mud filter cake at each depth.
We make an adjustment to the permeability values for each section of the skin shell to examine whether the strain pattern can be produced by heterogeneous skin. Figure 9c and d show the modeling results with the assumed permeability values (Fig. 9a). The results suggest that the formation damage can also cause the strain pattern at obs1 and obs2. Although it is just a thin shell of mud filter cake, the resulting “strain shadow” with layered pattern can propagate to approximately 10 m away from the borehole location. Beyond the range, the fluid pressure and strain become more homogeneous. Compared to the case without formation damage, there is a larger pressure loss (with large gradient; Fig. 9d) in the nearby of the borehole, and the range showing the layered pattern is narrower if the low-permeability skin is added.
As shown above, both models of layered formation with different intrinsic permeabilities and heterogeneous formation damage caused by the mud filter cakes during the drilling could result in the observed strain pattern. For uncertainties in the source (i.e., drilling) and formation parameters, we cannot rule out either of them in the data acquisition range. The real situation may include the combination of the two causes – the formation damage could be more severe for the low-permeability strata. There was a chance to distinguish the two causes by conducting further investigations following the drilling, such as analyzing the recovery data after the wellbore cleaning. However, the data were not recorded. Nevertheless, our modeling results suggest that the DSS records can be basically explained by the hydromechanical responses of fluid pressure diffusion.
Pore fluid extractions from or injections into reservoirs can induce changes in fluid pressure, modify effective stress, and deform aquifer formation. Before massive changes in mass, such fluid-to-solid hydromechanical (HM) deformations are usually subtle, linearly elastic, and recoverable; however, the deformations are often neglected because the stratum formation remains stable. In this study, we successfully measured such weak HM deformations induced by small pressure perturbations (e.g., 1 kPa) using a high-resolution DSS tool during well drilling. Both observation wells recorded the clear strain changes that accompanied well-drilling operations. By numerical modeling, we have shown that the spatial pattern of deformation of the two wells may indicate the vertical permeability heterogeneity of the formation or the heterogeneous formation damage caused by the forming of mud filter cakes.
DSS provides more details of reservoir deformation along the vertical direction, which should be helpful for understanding the contribution of each layer to the overall displacement. One noteworthy issue is that the dilation deformation caused by drilling fluid injection may be compensated by adjacent layers or zones. Therefore, one may need to be cautious for the compensation effect when using solely surface geodetic data to estimate reservoir hydraulic parameters for multilayer aquifers. Vertical observation through DSS and surface-based monitoring methods (e.g., InSAR) complement each other in resolution and dimension.
This study demonstrated the good performance of a Rayleigh scattering-based DSS using TW-COTDR method. A functionality similar to the one shown here could be deployed in well testing involved with fluid injection/extraction or in studying aquifer fluid flow behavior with hydromechanical responses (e.g., those for natural fluids such as water, gas and oil, or those used for geological storage of CO2) (Murdoch et al., 2020; Vilarrasa et al., 2013; Wu et al., 2017; Yang et al., 2019; Zappone et al., 2020). Because of the high resolution and accuracy, the use of DSS would be beneficial in operations, for proper fluid injection or extraction and pressure management, the detection of fluid leakage from reservoirs (Rutqvist et al., 2016), rock fracking and stimulation (Krietsch et al., 2020), and optimizing reservoir utilization. DSS could be also deployed in studying natural processes involving hydromechanical responses, such as at seismogenic structures (e.g., faults) related to earthquake occurrences (Guglielmi et al., 2020; Kinoshita and Saffer, 2018).
The strain data are available at https://doi.org/10.6084/m9.figshare.12009504 (Zhang et al., 2020).
The supplement related to this article is available online at: https://doi.org/10.5194/se-11-2487-2020-supplement.
YZ participated the field work, performed the data processing and numerical analysis, and wrote the manuscript. XL gave suggestions in numerical analysis. TH and ZX contributed to project management and field work.
The authors declare that they have no conflict of interest.
This article is part of the special issue “Fibre-optic sensing in Earth sciences”. It is not associated with a conference.
This paper is based on results obtained from a project (JPNP18006) commissioned by the New Energy and Industrial Technology Development Organization (NEDO) and the Ministry of Economy, Trade and Industry (METI) of Japan.
This research has been supported by the New Energy and Industrial Technology Development Organization (NEDO) and the Ministry of Economy, Trade and Industry (METI) of Japan (grant no. JPNP18006).
This paper was edited by Zack Spica and reviewed by two anonymous referees.
Alghamdi, A., Hesse, M. A., Chen, J., and Ghattas, O.: Bayesian Poroelastic Aquifer Characterization From InSAR Surface Deformation Data. Part I: Maximum A Posteriori Estimate, Water Resour. Res., 56, e2020WR027391, https://doi.org/10.1029/2020WR027391, 2020.
Barbour, A. J. and Wyatt, F. K.: Modeling strain and pore pressure associated with fluid extraction: The Pathfinder Ranch experiment, J. Geophys. Res.-Sol. Ea., 119, 5254–5273, https://doi.org/10.1002/2014JB011169, 2014.
Barrias, A., Casas, J., and Villalba, S.: A review of distributed optical fiber sensors for civil engineering applications, Sensors, 16, 748, https://doi.org/10.3390/s16050748, 2016.
Becker, M. W., Ciervo, C., Cole, M., Coleman, T., and Mondanos, M.: Fracture hydromechanical response measured by fiber optic distributed acoustic sensing at milliHertz frequencies, Geophys. Res. Lett., 44, 7295–7302, https://doi.org/10.1002/2017GL073931, 2017.
Bense, V. F., Read, T., Bour, O., Le Borgne, T., Coleman, T., Krause, S., Chalari, A., Mondanos, M., Ciocca, F., and Selker, J. S.: Distributed T emperature S ensing as a downhole tool in hydrogeology, Water Resour. Res., 52, 9259–9273, 2016.
Benson, S., Cook, P., Anderson, J., Bachu, S., Nimir, H. B., Basu, B., Bradshaw, J., Deguchi, G., Gale, J., and von Goerne, G.: Underground geological storage, IPCC Spec. Rep. carbon dioxide capture storage, 195–276, 2005.
Biot, M. A.: General theory of three-dimensional consolidation, J. Appl. Phys., 12, 155–164, 1941.
Bohloli, B., Bjørnarå, T. I., Park, J., and Rucci, A.: Can we use surface uplift data for reservoir performance monitoring? A case study from In Salah, Algeria, Int. J. Greenh. Gas Con., 76, 200–207, https://doi.org/10.1016/j.ijggc.2018.06.024, 2018.
Bonì, R., Meisina, C., Teatini, P., Zucca, F., Zoccarato, C., Franceschini, A., Ezquerro, P., Béjar-Pizarro, M., Antonio Fernández-Merodo, J., Guardiola-Albert, C., Luis Pastor, J., Tomás, R., and Herrera, G.: 3D groundwater flow and deformation modelling of Madrid aquifer, J. Hydrol., 585, 124773, https://doi.org/10.1016/j.jhydrol.2020.124773, 2020.
Cheng, A. H.-D.: Poroelasticity, Springer, Cham, https://doi.org/10.1007/978-3-319-25202-5, 2016.
Daley, T. M., Freifeld, B. M., Ajo-Franklin, J., Dou, S., Pevzner, R., Shulakova, V., Kashikar, S., Miller, D. E., Goetz, J., and Henninges, J.: Field testing of fiber-optic distributed acoustic sensing (DAS) for subsurface seismic monitoring, Lead. Edge, 32, 699–706, 2013.
des Tombe, B. F., Bakker, M., Smits, F., Schaars, F., and van der Made, K.: Estimation of the variation in specific discharge over large depth using Distributed Temperature Sensing (DTS) measurements of the heat pulse response, Water Resour. Res., 55, 811–826, 2019.
Ferronato, M., Gambolati, G., Teatini, P., and Baù, D.: Interpretation of radioactive marker measurements to evaluate compaction in the Northern Adriatic gas fields, SPE Reserv. Eval. Eng., 6, 401–411, 2003.
Freifeld, B. M., Finsterle, S., Onstott, T. C., Toole, P., and Pratt, L. M.: Ground surface temperature reconstructions: Using in situ estimates for thermal conductivity acquired with a fiber-optic distributed thermal perturbation sensor, Geophys. Res. Lett., 35, L14309, https://doi.org/10.1029/2008GL034762, 2008.
Guglielmi, Y., Nussbaum, C., Jeanne, P., Rutqvist, J., Cappa, F., and Birkholzer, J.: Complexity of Fault Rupture and Fluid Leakage in Shale: Insights From a Controlled Fault Activation Experiment, J. Geophys. Res.-Sol. Ea., 125, e2019JB017781, https://doi.org/10.1029/2019JB017781, 2020.
Hartog, A. H.: An introduction to distributed optical fibre sensors, CRC press, Boca Raton, FL, USA, 2017.
Hisz, D. B., Murdoch, L. C., and Germanovich, L. N.: A portable borehole extensometer and tiltmeter for characterizing aquifers, Water Resour. Res., 49, 7900–7910, 2013.
Jousset, P., Reinsch, T., Ryberg, T., Blanck, H., Clarke, A., Aghayev, R., Hersir, G. P., Henninges, J., Weber, M., and Krawczyk, C. M.: Dynamic strain determination using fibre-optic cables allows imaging of seismological and structural features, Nat. Commun., 9, 2509, https://doi.org/10.1038/s41467-018-04860-y, 2018.
Kinoshita, C. and Saffer, D. M.: In Situ Permeability and Scale Dependence of an Active Accretionary Prism Determined From Cross-Borehole Experiments, Geophys. Res. Lett., 45, 6935–6943, https://doi.org/10.1029/2018GL078304, 2018.
Kishida, K., Yamauchi, Y., and Guzik, A.: Study of Optical Fibers Strain-Temperature Sensitivities Using Hybrid Brillouin-Rayleigh System, Photonic Sensors, 4, 1–11, https://doi.org/10.1007/s13320-013-0136-1, 2014.
Kogure, T. and Okuda, Y.: Monitoring the vertical distribution of rainfall-induced strain changes in a landslide measured by distributed fiber optic sensing (DFOS) with Rayleigh backscattering, Geophys. Res. Lett., 45, 4033–4040, https://doi.org/10.1029/2018GL077607, 2018.
Koyamada, Y., Imahama, M., Kubota, K., and Hogari, K.: Fiber-optic distributed strain and temperature sensing with very high measurand resolution over long range using coherent OTDR, J. Lightwave Technol., 27, 1142–1146, 2009.
Krietsch, H., Gischig, V., Jalali, M. R., Doetsch, J., Valley, B., and Amann, F.: A comparison of FBG-and Brillouin-strain sensing in the framework of a decameter-scale hydraulic stimulation experiment, in: 52nd US Rock Mechanics/Geomechanics Symposium, American Rock Mechanics Association, 2018.
Krietsch, H., Gischig, V. S., Doetsch, J., Evans, K. F., Villiger, L., Jalali, M., Valley, B., Löw, S., and Amann, F.: Hydromechanical processes and their influence on the stimulation effected volume: observations from a decameter-scale hydraulic stimulation project, Solid Earth, 11, 1699–1729, https://doi.org/10.5194/se-11-1699-2020, 2020.
Lei, X., Xue, Z., and Hashimoto, T.: Fiber Optic Sensing for Geomechanical Monitoring: (2) – Distributed Strain Measurements at a Pumping Test and Geomechanical Modeling of Deformation of Reservoir Rocks, Appl. Sci., 9, 417, https://doi.org/10.3390/app9030417, 2019.
Lellouch, A., Yuan, S., Spica, Z., Biondi, B., and Ellsworth, W. L.: Seismic Velocity Estimation Using Passive Downhole Distributed Acoustic Sensing Records: Examples From the San Andreas Fault Observatory at Depth, J. Geophys. Res.-Sol. Ea., 124, 6931–6948, https://doi.org/10.1029/2019JB017533, 2019.
Lindsey, N. J., Dawe, T. C., and Ajo-franklin, J. B.: Illuminating seafloor faults and ocean dynamics with dark fiber distributed acoustic sensing, Science, 1107, 1103–1107, 2019.
Lindsey, N. J., Rademacher, H., and Ajo-Franklin, J. B.: On the Broadband Instrument Response of Fiber-Optic DAS Arrays, J. Geophys. Res.-Sol. Ea., 125, e2019JB018145, https://doi.org/10.1029/2019JB018145, 2020.
Luo, H., Li, H., Lu, Y., Li, Y., and Guo, Z.: Inversion of distributed temperature measurements to interpret the flow profile for a multistage fractured horizontal well in low-permeability gas reservoir, Appl. Math. Model., 77, 360–377, https://doi.org/10.1016/j.apm.2019.07.047, 2020.
Maldaner, C. H., Munn, J. D., Coleman, T. I., Molson, J. W., and Parker, B. L.: Groundwater Flow Quantification in Fractured Rock Boreholes Using Active Distributed Temperature Sensing Under Natural Gradient Conditions, Water Resour. Res., 55, 3285–3306, https://doi.org/10.1029/2018WR024319, 2019.
Mouli-Castillo, J., Wilkinson, M., Mignard, D., McDermott, C., Haszeldine, R. S., and Shipton, Z. K.: Inter-seasonal compressed-air energy storage using saline aquifers, Nat. Energy, 4, 131–139, 2019.
Murdoch, L. C., Freeman, C. E., Germanovich, L. N., Thrash, C., and DeWolf, S.: Using in situ vertical displacements to characterize changes in moisture load, Water Resour. Res., 51, 5998–6016, https://doi.org/10.1002/2015WR017335, 2015.
Murdoch, L. C., Germanovich, L. N., DeWolf, S. J., Moysey, S. M. J., Hanna, A. C., Kim, S., and Duncan, R. G.: Feasibility of using in situ deformation to monitor CO2 storage, Int. J. Greenh. Gas Con., 93, 102853, https://doi.org/10.1016/j.ijggc.2019.102853, 2020.
Neuzil, C. E.: Hydromechanical coupling in geologic processes, Hydrogeol. J., 11, 41–83, 2003.
Permann, C. J., Gaston, D. R., Andrš, D., Carlsen, R. W., Kong, F., Lindsay, A. D., Miller, J. M., Peterson, J. W., Slaughter, A. E., Stogner, R. H., and Martineau, R. C.: MOOSE: Enabling massively parallel multiphysics simulation, SoftwareX, 11, 100430, https://doi.org/10.1016/j.softx.2020.100430, 2020.
Rezaei, A. and Mousavi, Z.: Characterization of land deformation, hydraulic head, and aquifer properties of the Gorgan confined aquifer, Iran, from InSAR observations, J. Hydrol., 579, 124196, https://doi.org/10.1016/j.jhydrol.2019.124196, 2019.
Rice, J. R. and Cleary, M. P.: Some basic stress diffusion solutions for fluid-saturated elastic porous media with compressible constituents, Rev. Geophys., 14, 227–241, 1976.
Rudnicki, J. W.: Fluid mass sources and point forces in linear elastic diffusive solids, Mech. Mater., 5, 383–393, 1986.
Rutqvist, J., Rinaldi, A. P., Cappa, F., Jeanne, P., Mazzoldi, A., Urpi, L., Guglielmi, Y., and Vilarrasa, V.: Fault activation and induced seismicity in geological carbon storage – Lessons learned from recent modeling studies, J. Rock Mech. Geotech. Eng., 8, 789–804, https://doi.org/10.1016/j.jrmge.2016.09.001, 2016.
Schenato, L.: A review of distributed fibre optic sensors for geo-hydrological applications, Appl. Sci., 7, 896, https://doi.org/10.3390/app7090896, 2017.
Schuite, J., Longuevergne, L., Bour, O., Boudin, F., Durand, S., and Lavenant, N.: Inferring field-scale properties of a fractured aquifer from ground surface deformation during a well test, Geophys. Res. Lett., 42, 10–696, 2015.
Schuite, J., Longuevergne, L., Bour, O., Burbey, T. J., Boudin, F., Lavenant, N., and Davy, P.: Understanding the hydromechanical behavior of a fault zone from transient surface tilt and fluid pressure observations at hourly time scales, Water Resour. Res., 53, 10558–10582, 2017.
Schweisinger, T., Svenson, E. J., and Murdoch, L. C.: Introduction to hydromechanical well tests in fractured rock aquifers, Ground Water, 47, 69–79, https://doi.org/10.1111/j.1745-6584.2008.00501.x, 2009.
Shanafield, M., Banks, E. W., Arkwright, J. W., and Hausner, M. B.: Fiber-optic Sensing for Environmental Applications: Where We've Come From- and What's Possible?, Water Resour. Res., 54, 2012–2017, https://doi.org/10.1029/2018WR022768, 2018.
Smith, R. and Knight, R.: Modeling Land Subsidence Using InSAR and Airborne Electromagnetic Data, Water Resour. Res., 55, 2801–2819, https://doi.org/10.1029/2018WR024185, 2019.
Sun, Y., Xue, Z., Hashimoto, T., and Lei, X.: Distributed Fiber Optic Sensing System for Well-based Monitoring Water Injection Tests – A Geomechanical Responses Perspective, Water Resour. Res., 56, 1–30, https://doi.org/10.1029/2019WR024794, 2020.
Vasco, D. W., Ferretti, A., and Novali, F.: Reservoir monitoring and characterization using satellite geodetic data: Interferometric synthetic aperture radar observations from the Krechba field, Algeria, Geophysics, 73, WA113–WA122, 2008.
Vasco, D. W., Rucci, A., Ferretti, A., Novali, F., Bissell, R. C., Ringrose, P. S., Mathieson, A. S., and Wright, I. W.: Satellite-based measurements of surface deformation reveal fluid flow associated with the geological storage of carbon dioxide, Geophys. Res. Lett., 37, L03303, https://doi.org/10.1029/2009GL041544, 2010.
Vilarrasa, V., Carrera, J., and Olivella, S.: Hydromechanical characterization of CO2 injection sites, Int. J. Greenh. Gas Con., 19, 665–677, 2013.
Wang, H. F.: Theory of linear poroelasticity with applications to geomechanics and hydrogeology, Princeton University Press, Princeton, New Jersey, 2017.
Wu, Q., Nair, S., Shuck, M., van Oort, E., Guzik, A., and Kishida, K.: Advanced distributed fiber optic sensors for monitoring real-time cementing operations and long term zonal isolation, J. Petrol Sci. Eng., 158, 479–493, 2017.
Yang, D., Li, Q., and Zhang, L.: Propagation of pore pressure diffusion waves in saturated porous media, J. Appl. Phys., 117, 134902, https://doi.org/10.1063/1.4916805, 2015.
Yang, D., Li, Q., and Zhang, L.: Characteristics of carbon dioxide emissions from a seismically active fault, Aerosol Air Qual. Res., 19, 1911–1919, 2019.
Zappone, A., Rinaldi, A. P., Grab, M., Wenning, Q., Roques, C., Madonna, C., Obermann, A., Bernasconi, S. M., Soom, F., Cook, P., Guglielmi, Y., Nussbaum, C., Giardini, D., and Wiemer, S.: Fault sealing and caprock integrity for CO2 storage: an in-situ injection experiment, Solid Earth Discuss., https://doi.org/10.5194/se-2020-100, in review, 2020.
Zhang, C., Shi, B., Gu, K., Liu, S., Wu, J., Zhang, S., Zhang, L., Jiang, H., and Wei, G.: Vertically distributed sensing of deformation using fiber optic sensing, Geophys. Res. Lett., 45, 11–732, 2018.
Zhang, Y. and Xue, Z.: Deformation-Based Monitoring of Water Migration in Rocks Using Distributed Fiber Optic Strain Sensing: A Laboratory Study, Water Resour. Res., 55, 8368–8383, 2019.
Zhang, Y., Xue, Z., Park, H., Shi, J., Kiyama, T., Lei, X., Sun, Y., and Liang, Y.: Tracking CO2 Plumes in Clay-Rich Rock by Distributed Fiber Optic Strain Sensing (DFOSS): A Laboratory Demonstration, Water Resour. Res., 55, 856–867, 2019.
Zhang, Y., Lei, X., Hashimoto, T., and Xue, Z.: In situ hydromechanical responses during well drilling recorded by fiber-optic distributed strain sensing (Dataset), Figshare, https://doi.org/10.6084/m9.figshare.12009504, 2020.
Zhu, T. and Stensrud, D. J.: Characterizing Thunder-Induced Ground Motions Using Fiber-Optic Distributed Acoustic Sensing Array, J. Geophys. Res.-Atmos., 124, 12810–12823, 2019.