the Creative Commons Attribution 4.0 License.
the Creative Commons Attribution 4.0 License.
 | 18 Dec 2020
What can seismic noise tell us about the Alpine reactivation of the Iberian Massif? An example in the Iberian Central System
Juvenal Andrés
Puy Ayarza
Martin Schimmel
Imma Palomeras
Mario Ruiz
The Iberian Central System, formed after the Alpine reactivation of the Variscan Iberian Massif, features maximum altitudes of 2500 m. It is surrounded by two foreland basins with contrasting elevation: the Duero Basin to the north, located at 750–800 m, and the Tajo Basin to the south, lying at 450–500 m. The deep crustal structure of this mountain range seems to be characterized by the existence of a moderate crustal root that provides isostatic support for its topography. New seismic data are able to constrain the geometry of this crustal root, which appears to be defined by a northward lower-crustal imbrication of the southern Central Iberian crust underneath this range. Contrarily to what was expected, this imbrication also affects the upper crust, as the existing orogen-scale mid-crustal Variscan detachment was probably assimilated during the Carboniferous crustal melting that gave rise to the Central System batholith. In addition, the lower crust might have thinned, allowing coupled deformation at both crustal levels. This implies that the reactivated upper-crustal fractures can reach lower-crustal depths, thus allowing the entire crust to sink. This new model can explain the differences in topography between the Central System foreland basins. Also, it provides further constraints on the crustal geometry of this mountain range, as it seems to be that of an asymmetric Alpine-type orogen, thus hindering the existence of buckling processes as the sole origin of the deformation. The results presented here have been achieved after autocorrelation of seismic noise along the CIMDEF (Central Iberian Massif DEFormation Mechanisms) profile. Although the resolution of the dataset features limited resolution (0.5–4 Hz, stations placed at ∼ 5 km), this methodology has allowed us to pinpoint some key structures that helped to constraint the deformation mechanisms that affected Central Iberia during the Alpine orogeny.
- Article
(4539 KB) - Full-text XML
- BibTeX
- EndNote


The Iberian Central System (ICS) is an intraplate mountain range that divides the Iberian central meseta into two sectors – the northern Duero Basin (DB) and the Tajo Basin (TB) to the south (Fig. 1, Andrés et al., 2019). The most striking feature of the central meseta is its highly variable topography, with the Tajo Basin having an average altitude of 450–500 m while the Duero Basin presents a higher altitude of ∼ 750–800 m. It is thought that this contrast in altitude of about 300 m should mainly respond to subsurface characteristics (e.g. crustal structure or rheological properties of the lithosphere) but its origin is, as yet, unknown. The ICS range acts as a boundary between the two basins, which are enclosed within the Iberian Massif (IB), and extends in a NE–SW to ENE–WSW direction across the Iberian Peninsula for over 300 km, with elevations of over 2500 m.
The lithospheric structure of the IB has been intensively studied since the 1990s by different seismic techniques, e.g. controlled-source seismic studies (Banda et al., 1981; ILIHA DSS Group, 1993; Pulgar et al., 1996; Ayarza et al., 1998, 2004; Suriñach and Vegas, 1998; Simancas et al., 2003; Carbonell et al., 2004; Julià and Mejía, 2004; Flecha et al., 2009; Palomeras et al., 2009, 2011; Martínez Poyatos et al., 2012; Ehsan et al., 2014, 2015), receiver functions (Mancilla and Díaz, 2015), and shear wave tomography (Palomeras et al., 2017). Also, potential field modelling (e.g. de Vicente et al., 2007; Torne et al., 2015; Andrés et al., 2018) has been used to unravel the crustal structure of the lithosphere of the Iberian microplate. Most of these studies have focused mainly on the southern and northern parts of the IB. Only the regional study of de Vicente et al. (2007) and the large-scale studies of Mancilla and Díaz (2015), Díaz et al. (2016), Palomeras et al. (2017), and Torne et al. (2015) cover the ICS, the DB, and the TB. However, the lack of detailed seismic data on the centre of the IB hinders the complete comprehension of the current lithospheric structure of the ICS, its evolution, and that of its bounding basins.
To overcome this problem, the CIMDEF (Central Iberian Massif DEFormation Mechanisms) project was designed to acquire natural and controlled-source seismic data across the ICS, the DB and the TB. The resulting data can be integrated with the existing models and provide a complete section of the IB. As the first result of this effort, Andrés et al. (2019) presented a lithospheric model of the area using Global Phase Seismic Interferometry (GloPSI) of teleseismic data (Ruigrok and Wapennar, 2012). In this paper, ambient seismic noise recordings are used to construct a lithospheric profile coincident with that of Andrés et al. (2019). Ambient noise has lately proven to be a useful and inexpensive tool for lithospheric imaging. Recent studies have exploited the recorded ambient noise field (e.g. Tibuleac and von Seggern, 2012; Gorbatov et al., 2013; Taylor et al., 2016; Kennett et al., 2015; Becker and Knapmeyer-Endrun, 2018; Buffoni et al., 2019) to image lithospheric discontinuities such as the Moho, the Hales discontinuity, or the lithosphere–asthenosphere boundary (LAB). These studies rely on the construction of autocorrelograms of the recorded ambient noise seismic field as they retrieve the Green's function of the response of the subsurface structure.
This work aims to contribute to the knowledge on the crustal structure and crustal thickness across the ICS and its relationship with the DB and TB. The results will provide us with constraints that are an asset to study the origin and evolution of the topography and the intraplate deformation dynamics of Central Iberia during the Alpine orogeny. The observations presented in this work are derived from the CIMDEF experiment and present a continuation and additional support to those of Andrés et al. (2019), complementing and extending the previous knowledge of the ICS orogen.
The geological framework of the ICS is marked by the footprint of two orogenies that affected the area, namely, the Variscan orogeny and the Alpine orogeny. The former took place during late Paleozoic times by the collision between Laurussia and Gondwana (Matte, 2001), which closed the Rheic Ocean and amalgamated these continents along with other minor terranes like Armorica (Franke, 2000; Matte, 2001) to define the Pangaea supercontinent. These terranes constitute the basement of the Iberian Peninsula and are composed of upper Proterozoic to Carboniferous rocks deformed and intruded by granites.
The IB, the Iberian outcrop of the European Variscides, is subdivided into six zones (Fig. 1) (Julivert et al., 1972) from north to south these are the Cantabrian Zone (CZ), the West Asturian Leonese Zone (WALZ), the Galicia Trás-os-Montes Zone (GTMZ), the Central Iberian Zone (CIZ), the Ossa-Morena Zone (OMZ), and the South Portuguese Zone (SPZ). The CZ and the SPZ are interpreted as the foreland fold and thrust belts, while the rest of the areas correspond to the internal zones of the orogen. The GTMZ is an allochthonous unit which overlies the CIZ, and it is composed of Gondwana terranes and ophiolites corresponding to vestiges of oceanic crust with high-pressure metamorphism (Martínez Catalan et al., 2014). These rocks, together with those found between the SPZ, OMZ, and CIZ, suggest the existence of one or more sutures (Simancas et al., 2013). Three out of these six domains, the CIZ, CZ and WALZ, represent continental portions of the passive margin along Gondwana before the Variscan orogeny. The significance of the CIZ, the widest of all zones, is currently under discussion. Some authors have therein defined the Central Iberian Arc (CIA) (Martínez Catalán, 2011a, b), which, together with the Ibero-Armorican Arc, would define a double Variscan orocline. However, Pastor-Galán et al. (2015, 2016, and 2017) argue that it is not a double orocline but a curve originating as a combination of processes that occurred in Variscan times and later in the Cenozoic, during the Alpine tectonics. Overlying the CIZ, the GTMZ is a relic of the Rheic Ocean formed partly by ophiolites. The OMZ is interpreted as a ribbon continental domain that drifted to some extent from Gondwana. Finally, the SPZ is interpreted as a fragment of Laurussia.
The disaggregation of Pangaea from the Triassic led to an extensive period (Ziegler, 1990; Van Wees et al., 1998) that formed new plate boundaries. As a result, during the Cenozoic, Iberia was a microplate enclosed between the African and Eurasian plates. The relative movement of the African plate in a NNW direction compressed the Iberian plate and led to the inversion of previously generated intraplate basins and the formation of the Pyrenean–Basque–Cantabrian range (Dercourt et al., 1986; Cloetingh et al., 2002). When the formation of the Pyrenees was completed, by the mid-Oligocene (Vergés et al., 1995), the deformation was absorbed by the Betic Rift system and the interior of the Iberian Plate. By Tortonian times, the peak of intraplate deformation was reached (Dewey et al., 1989) and the ICS was generated by the reactivation of previous Variscan structures.
The CIMDEF seismic transect is located within the CIZ (Fig. 1). The latter is subdivided into two zones (Díez Balda et al., 1990): the Ollo de Sapo Domain to the north and the Schist–Greywacke Complex to the south. The first is characterized by high-grade metamorphism, high deformation (Barbero and Villaseca, 2000), and a great volume of outcropping Carboniferous granites (Bea et al., 2004). To the south, the Schist–Greywacke Complex presents NW–SE-trending upright folds and faults and a much more moderate volume of granites.
The profile presented in this paper crosses three geological domains within Central Iberia: the ICS and its Tertiary foreland basins, the DB, and the TB. The ICS is an intraplate range described as a thick-skin pop-up and pop-down configuration with an E–W to NE–SW orientation, which runs from the Iberian Chain to Portugal (de Vicente et al., 2007, 2018). It started to develop by the Alpine compression that affects the Iberian Peninsula since the Late Cretaceous. Outcrops in the chain are primarily composed of Variscan granites with minor outcrops of metamorphic rocks, which correspond to the Variscan basement of the Iberian Peninsula. (Vegas et al., 1990; De Vicente et al., 1996, 2007). The profile is enclosed in the western sector of the range, namely, the Gredos sector.
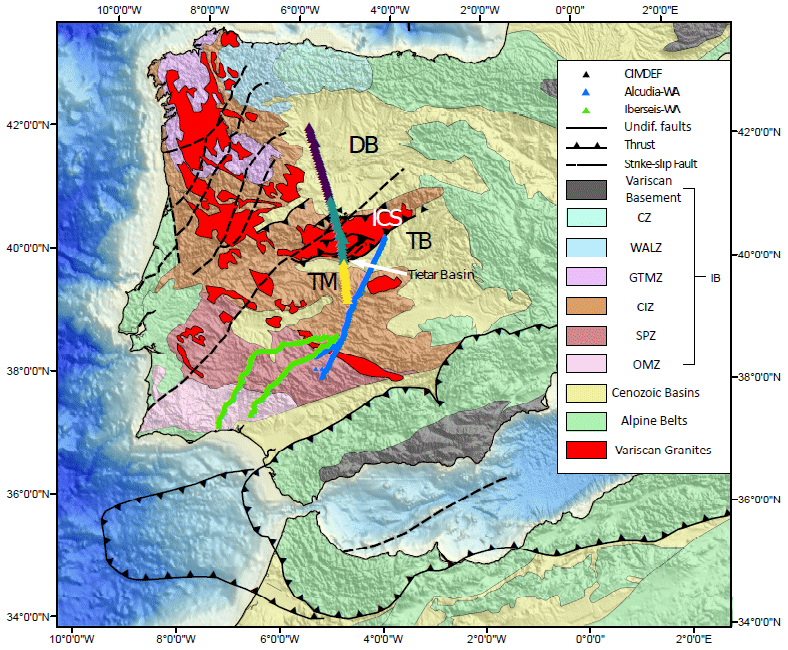
Figure 1Simplified geological map of the study area with major tectonic provinces and structures of the Iberian Massif (modified after Andrés et al., 2019). Location of the main seismic profiles acquired in the area is also shown. Colour-coded by deployment: green (first deployment), yellow (second deployment), and purple (third deployment). TM: Toledo mountains; ICS: Iberian Central System; DB: Duero Basin; TB: Tajo Basin; CZ: Cantabrian Zone; WALZ: West Asturian Leonese Zone; GTMZ: Galicia–Trás-os-Montes Zone; CIZ: Central Iberian Zone; OMZ: Ossa-Morena Zone; SPZ: South Portuguese Zone. Locations of Variscan granites and granitic zonation are taken from Simancas et al. (2013).
The knowledge of the lithospheric structure of the ICS and surrounding basins comes from seismic studies (Suriñach and Vegas, 1988; Mancilla and Díaz, 2015) and inversion and forward modelling of potential field data (De Vicente et al., 2007; Carballo et al., 2015; Torne et al., 2015; Andrés et al., 2018). These results have led to the interpretation of a slightly thickened symmetric crust below the ICS with a Moho depth that deepens from 31 to 35 km. Lately, Andrés et al. (2019) used autocorrelation of teleseismic data to partly image this change in the Moho depth. These authors suggested that an imbrication of the crust below the ICS in an asymmetric Alpine-like subduction structure results in a ∼ 7 km Moho offset to the north of the ICS.
Data used in this study were acquired within the CIMDEF experiment by 69 short-period (2 Hz), three-component stations. These were operational during three different time periods. The central segment (Fig. 1) of the profile was recorded between May and June 2017 by 24 stations and covered almost 120 km. The second acquisition time was held from February to April 2018 and consisted of a deployment of 15 stations, covering the southern part of the profile. The northern and longest part, almost 170 km, was acquired between July and September 2018, and 30 new stations were installed. The data were acquired in continuous recording mode at 250 samples per second (sps) during a period ranging from 28 to 60 d depending on the survey. The stations were deployed in a linear array running NW–SE with an average inter-station spacing of 4.8 km covering a total length of almost 330 km (Fig. 1). All data were collected using the same equipment of sensor and data loggers and the same acquisition parameters. While the duration of each deployment was different, the minimum amount of time devoted to recording data was 28 d.
The methodology used in this study aims to retrieve the Earth's reflection response below single stations by applying autocorrelation of ambient seismic noise. Autocorrelation evaluates the similarity of a seismic trace with a delayed version of itself, whose response depends on the subsurface structure. We have used the vertical component of the data as it is expected to be the one where more P-wave energy is recorded.
Processing of the continuous recordings includes (i) pre-processing and (ii) construction of stacked autocorrelograms of the vertical component of the ambient noise. We base our processing steps on the phase cross-correlation (PCC) technique (Schimmel, 1999) and the time–frequency domain phase-weighted stack (tf-PWS) (Schimmel and Gallart, 2007). The PCC utilizes the instantaneous phases of the analytical signal of the data trace and produces a similarity measurement of the trace relative to a delayed version of itself. The use of the instantaneous phases makes the correlation amplitude unbiased, which eases the pre-processing as no corrections for high-amplitude events have to be applied (Bensen et al., 2007; Schimmel et al., 2011, 2018) The tf-PWS is a linear stack weighted by the time–frequency-dependent instantaneous phase coherency. It enhances the signal by the summation of the envelope normalized analytic signals, strengthening coherent arrivals and attenuating incoherent signals.
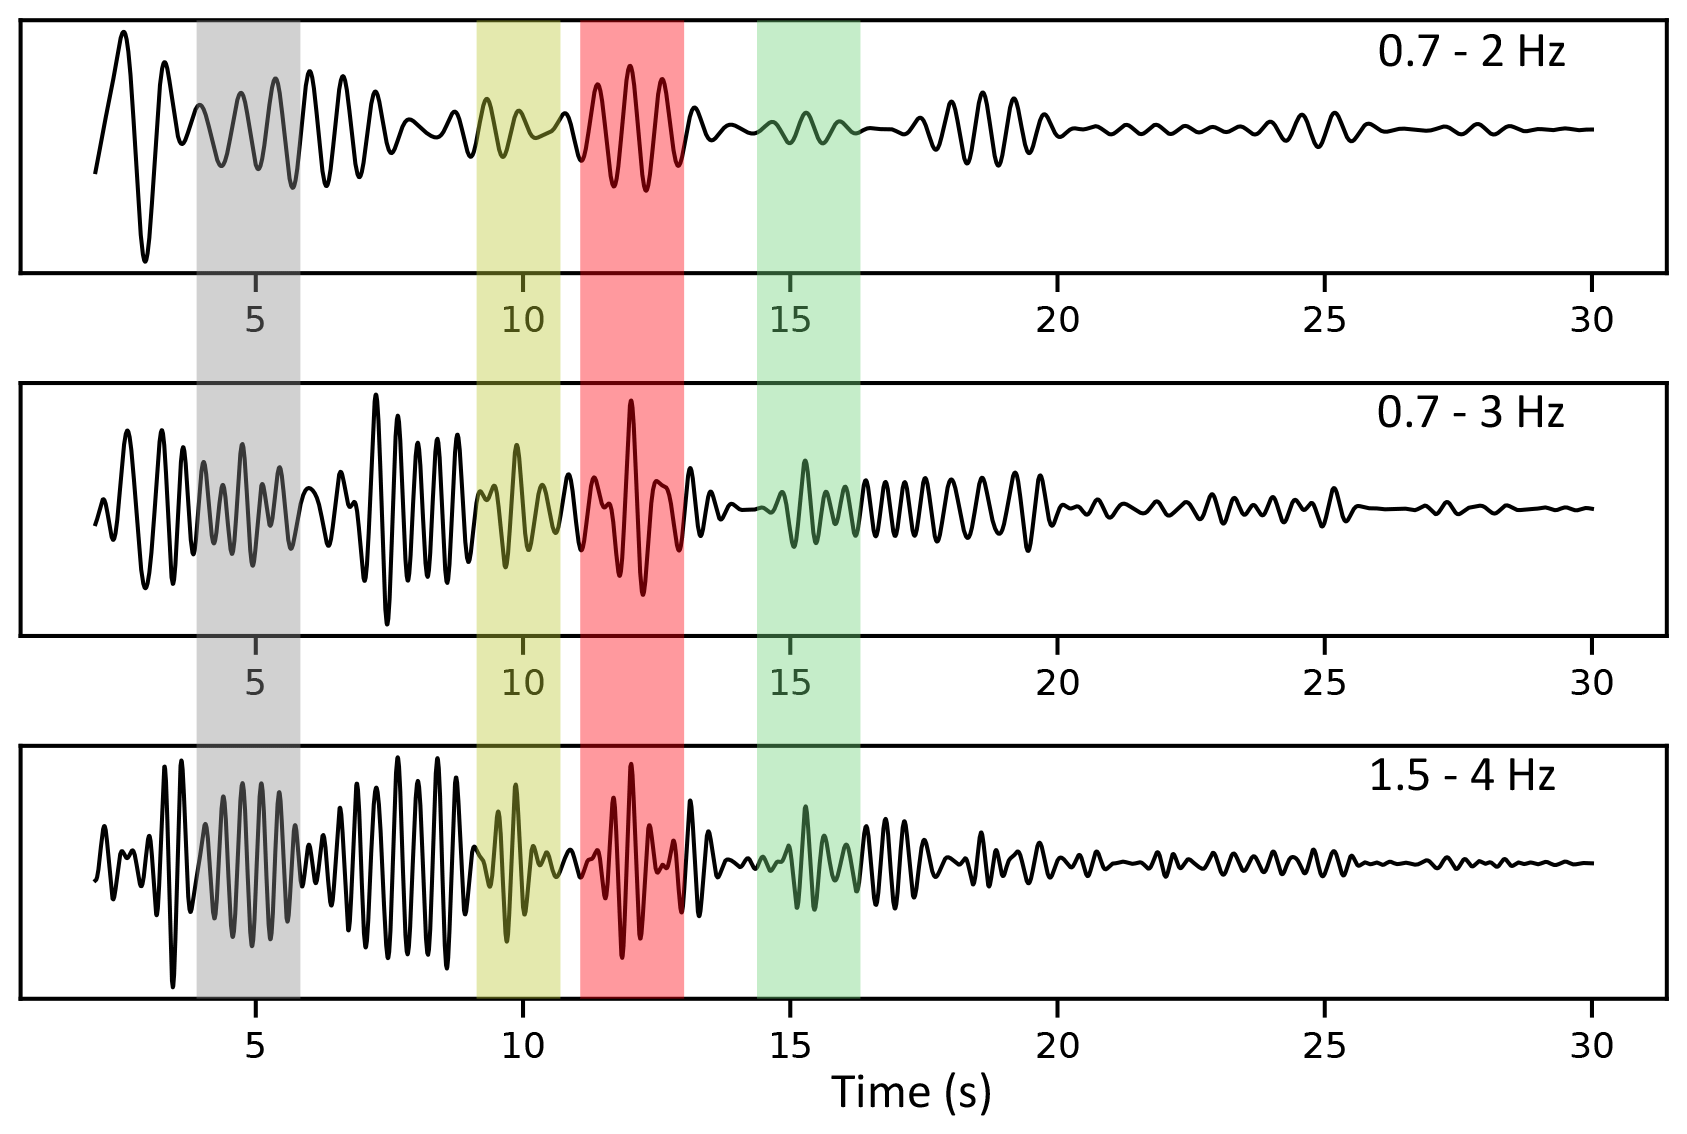
Figure 2Example of frequency bands tests, ranging from low frequencies (top) to higher frequencies (bottom). Coherent identified reflections are enclosed in colour bands. It is clear that, as frequency increases, more details are retrieved in the autocorrelations, while the main reflections are consistently captured.
To assess the quality of the data, it was visually inspected for gaps or anomalous trends. The pre-processing applied consisted of windowing the daily data in 1 h long, non-overlapping traces, removing the mean and linear trends and decimating the data from 250 to 125 sps. The next step consisted of applying a zero-phase band-pass filter to the data to enhance frequency bands where we expect the target information to be found. There is no general agreement about the best frequency band to be used in autocorrelation of ambient noise data, although higher frequencies are generally employed to resolve shallow discontinuities which otherwise would be hidden in side lobes of the zero-lag autocorrelation peak (e.g. Romero and Schimmel, 2018). Different authors have used various sets of frequency ranges for the same purposes. Gorbatov et al. (2013) used 2–4 Hz frequency to retrieve PmP (P reflection from the outer side of the Moho) in Australia using autocorrelations of ambient noise. Kennet et al. (2015) utilized 0.5–4 Hz in Australia to image lithosphere–asthenosphere reflectivity. Oren et al. (2017) used lower frequencies (between 0.3–0.55 Hz) to retrieve body waves in North America. Recently, Taylor et al. (2016) also utilized low frequencies (0.2–0.4 Hz) in Turkey to retrieve crustal reflectivity. Higher frequencies between 3–12 Hz have been used by Romero and Schimmel (2018) to map the crystalline basement of the Ebro Basin in Spain, but they also showed retrieval of Moho reflections with frequencies of 2–4 Hz. Therefore, it can be argued that the best frequency range depends on the data, structural complexities, and the objective of the study. We have tested frequencies ranging from 0.3–0.5 to 1.5–4 Hz to assess the best-suited band to retrieve body waves for lithospheric imaging in the study area. As seen in Fig. 2, at higher frequencies the vertical resolution increases. The red box marks a reflection that at lower FB (frequency band) range only resolves a big-amplitude event, whereas at higher FB it is clear that it also contains a signal from other features. Therefore, the selection of the best frequencies was based on the recovered reflectivity and the consistency of the daily stacks of the stations. For each frequency band we computed daily stacks of the data and check the convergence of the autocorrelations. For frequencies above 4 Hz the daily stacks did not converge as expected. Accordingly, and due to the limited amount of recorded days, we set the top frequency to 4 Hz. The bottom limit of the filter was set so it avoids the microseismic noise peaks that strongly influence the lower frequencies. Thus, the selected frequency band applied to all stations was 1.5–4 Hz as it provides good reflectivity down to upper-mantle depths along with consistent daily stacks for all stations. After applying the band-pass filter, the 1h data segments were autocorrelated for a 0–30 s lag-time window using the PCC (Schimmel, 1999). The consistency of the autocorrelograms is checked by plotting the daily autocorrelations together to highlight coherent arrivals (Fig. 3). Where arrivals are consistently retrieved for most of the days, it is considered that they are reflections responding to the subsurface structure. Note that a P-to-P wave reflection at an impedance increase is expected to have a negative amplitude (blue and/or troughs) owing to the free-surface reflection. The data are then stacked daily using the PWS, and finally the daily stacks are summed to get the final autocorrelogram. Through stacking autocorrelograms we obtain the P-wave reflectivity of the subsurface. The autocorrelation process creates a strong arrival at t=0 s which ideally corresponds to a delta function (Claerbout, 1968) whose side lobes dominate and obscure the early time of the autocorrelation trace. The side lobes are due to the convolution of the zero-lag delta pulse with the effective noise source time function. To eliminate this effect and for visualization purposes, we have muted the signal from 0 to 3 s, and data have been amplitude normalized.
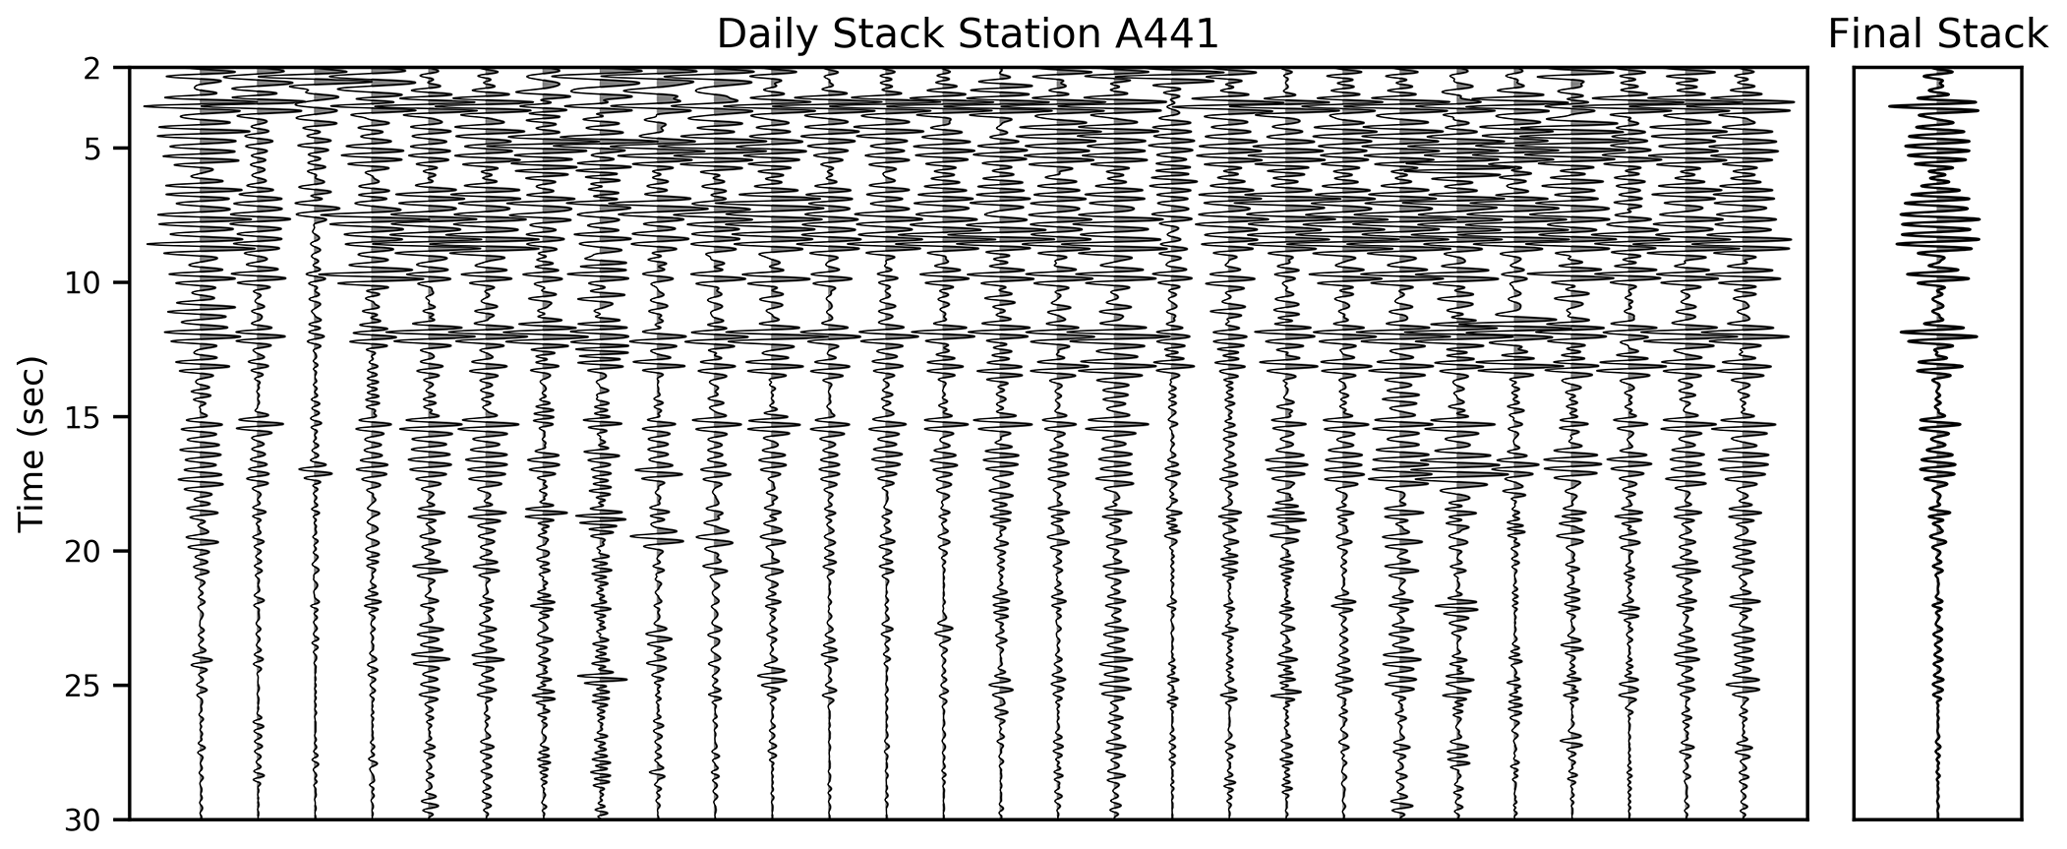
Figure 3Daily autocorrelation section for station A441 showing the consistency of the retrieved reflections. On the right, the final stack is shown to compare the signal. Autocorrelations were computed using phase cross correlation within a frequency band between 1.5 to 4 Hz.
The procedure described above led us to obtain a P-wave reflectivity profile (Fig. 4a), crossing the ICS, the DB, and the TB. It can be regarded as the reflectivity of the upper lithosphere down to 30 s two-way travel time (TWT). To estimate the approximate depth at which reflections are present, we adopted the same time-to-depth conversion used by Andrés et al. (2019). This conversion takes as a reference the velocity profile of shot 3 from the ALCUDIA wide-angle (WA) experiment (Fig. 1, Ehsan et al., 2015) for crustal velocity while for sub-Moho reflections a constant velocity of 8 km/s has been used. In areas with a sedimentary cover or where the crust is thicker than that of the ALCUDIA-WA shot 3 section, the conversion might not be accurate because of the lower velocity in sediments and the crust, thus resulting in an overestimation of the depths at which reflectors are present. The profile covers a distance of approximately 330 km and the inter-station spacing (≈ 4.8 km) ensures a high lateral resolution of the crustal structure of the study area.
In general, the profile shows bands of high reflectivity and other rather transparent areas (Fig. 4a). It allows us to divide the crust in the upper and lower crust, similar to the pattern obtained in the ALCUDIA and previous CIMDEF datasets. The upper crust extends from 0 to 5–6 s TWT, while the crust–mantle boundary is located between 10–12.5 s TWT. The deepest reflection present in the profile is located between 18–19 s, and it is visibly scattered throughout the array. The profile can be divided into three areas on the basis of its geological interpretation: northern, central, and southern segments. The northern sector comprises 30 stations, covering almost 140 km, and crosses the Tertiary DB. The central segment covers the core of the ICS (around 120 km) and presents the highest structural complexity of the profile. The southern segment is the shortest and covers only 72 km, crossing part of the TB/Tietar River basin (TRB) and the CIZ.
Unfortunately, we cannot rule out the presence of S-wave reflections or P-to-S reflection conversions. These waves are not expected to have a high amplitude on the vertical components but can occur due to lateral heterogeneities and to an ambient noise wave field which is not diffuse. Here, we interpret dominant signals as P waves and assume that S waves are much weaker on the vertical components and, thus, not considered here.
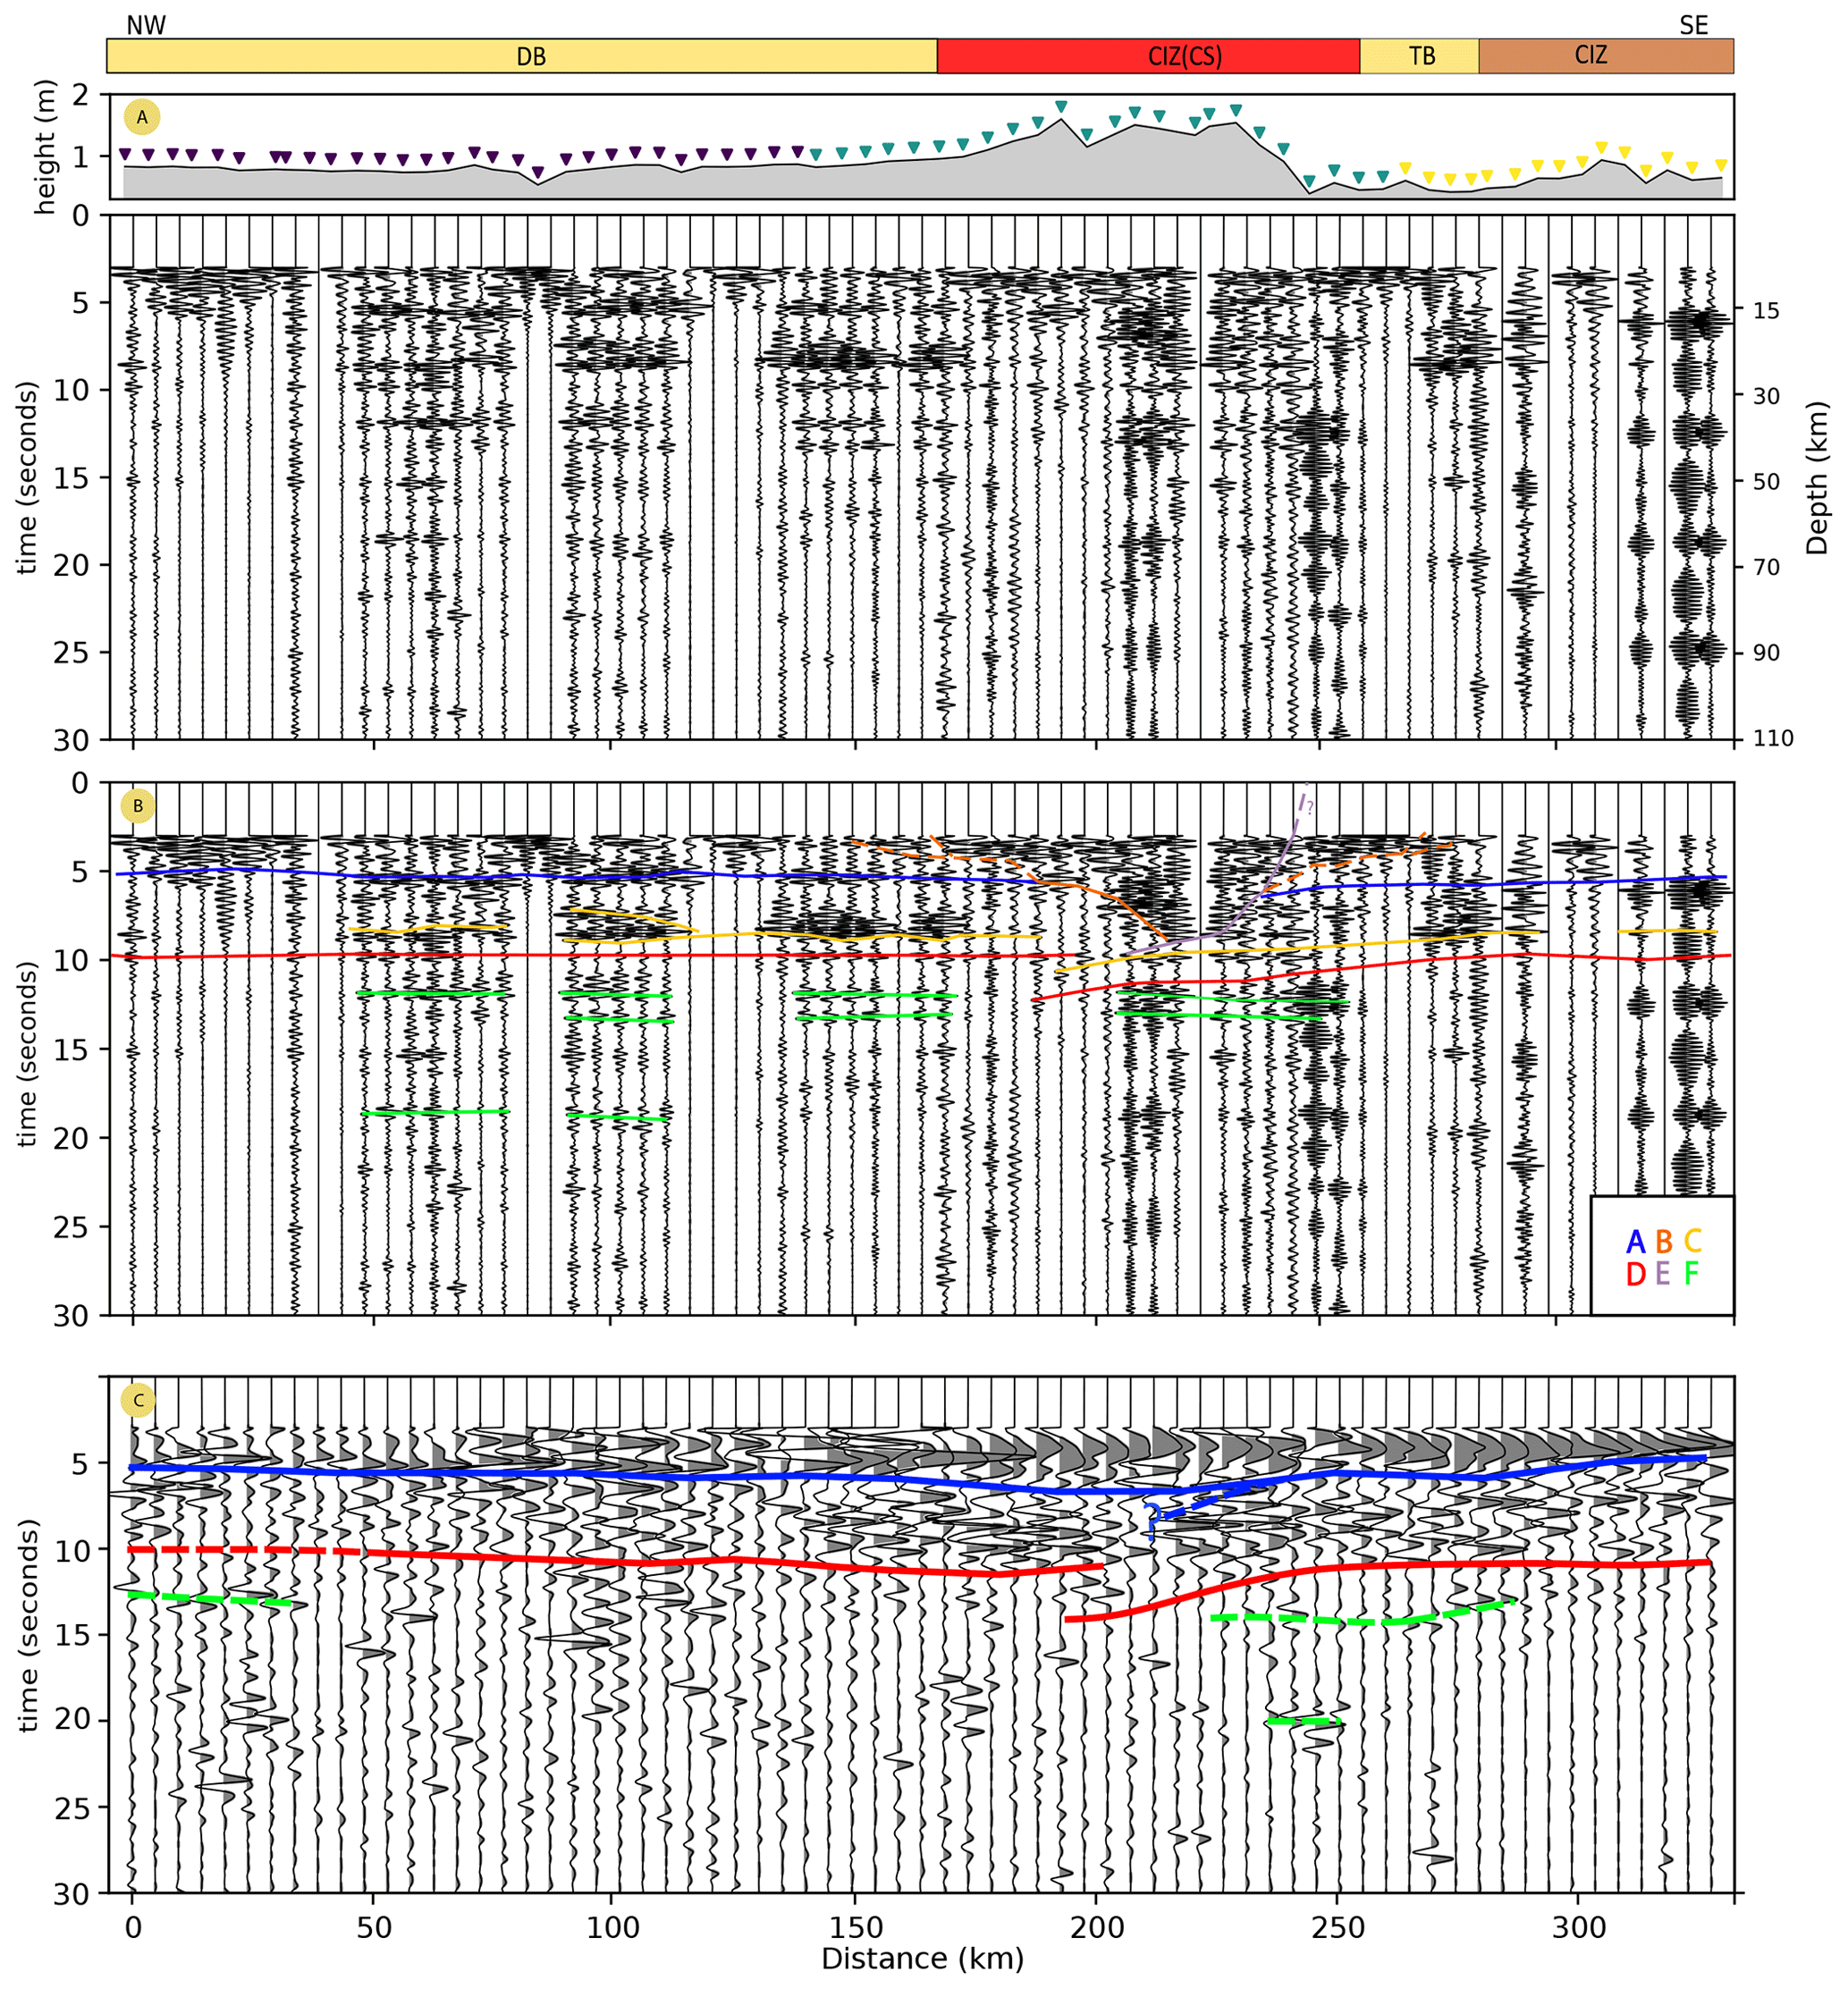
Figure 4(a) Reflectivity profile retrieved by autocorrelation of ambient seismic noise. In the wiggle plots, the grey lobes indicate negative polarity. Coloured triangles placed over a topographic section represent the different acquisition stages (from north to south: third, first, and second deployments). (b) Interpretation of different reflectors, which are labelled between A to F. A marks the boundary between the upper crust and the lower crust. B represents the interpreted depth extension of granites below the ICS. C marks a intracrustal reflector within the lower crust. D is the crust–mantle boundary. E represents a key S-verging thrust affecting the southern end of the ICS. F marks the scattered reflectivity within the upper mantle. (c) Reflectivity profile extracted from autocorrelations of teleseismic events over the same deployment array (modified from Andrés et al., 2019).
5.1 Northern segment
The northern sector (Fig. 4a) covers a distance of 140 km and lies entirely within the Cenozoic DB. In general, good reflectivity is recovered down to almost 20 s TWT, despite the fact that the first eight stations to the north present poor reflectivity below 5–6 s TWT. Nonetheless, several bands of reflectivity within the crust are observed. First, an upper band of reflectivity appears at 5–6 s as a high-amplitude event. Below this reflection, another less reflective band appears to be limited by a strong reflector at around 8 s. Further down, at ∼ 9.5–10.5 s, a sharp continuous reflection can be identified along the entire section. Below, reflectivity and coherency decrease, and only two more sets of reflections seem to be visible throughout the segment. These events are enclosed between 12.5 and 14 s TWT. Finally, some local reflections appear, e.g. one at 18 s TWT, but they are only detected below certain stations.
5.2 Central segment
The central segment hosts the most complex reflectivity pattern. Nevertheless, clear events are identified at various depths (Fig. 4a). First, a package of clear reflectivity is found between 3 to 5–8 s, slightly thinning towards the N and S limits of the ICS. It is characterized by higher amplitudes and lower frequencies compared to the reflectivity seen elsewhere, where higher frequencies are found. The boundary of this reflective area is deeper in the centre of the ICS (8 s TWT) and shallower towards the north and south, getting up to ∼ 3 s in the upper part of the section. It also presents higher but less coherent amplitude towards the northern sector while decreasing towards the south of the ICS. Between 200 and 250 km along the profile, the bottom of this band of reflectivity is poorly defined as more events are probably interfering. Nonetheless, its lateral continuity is easily identified.
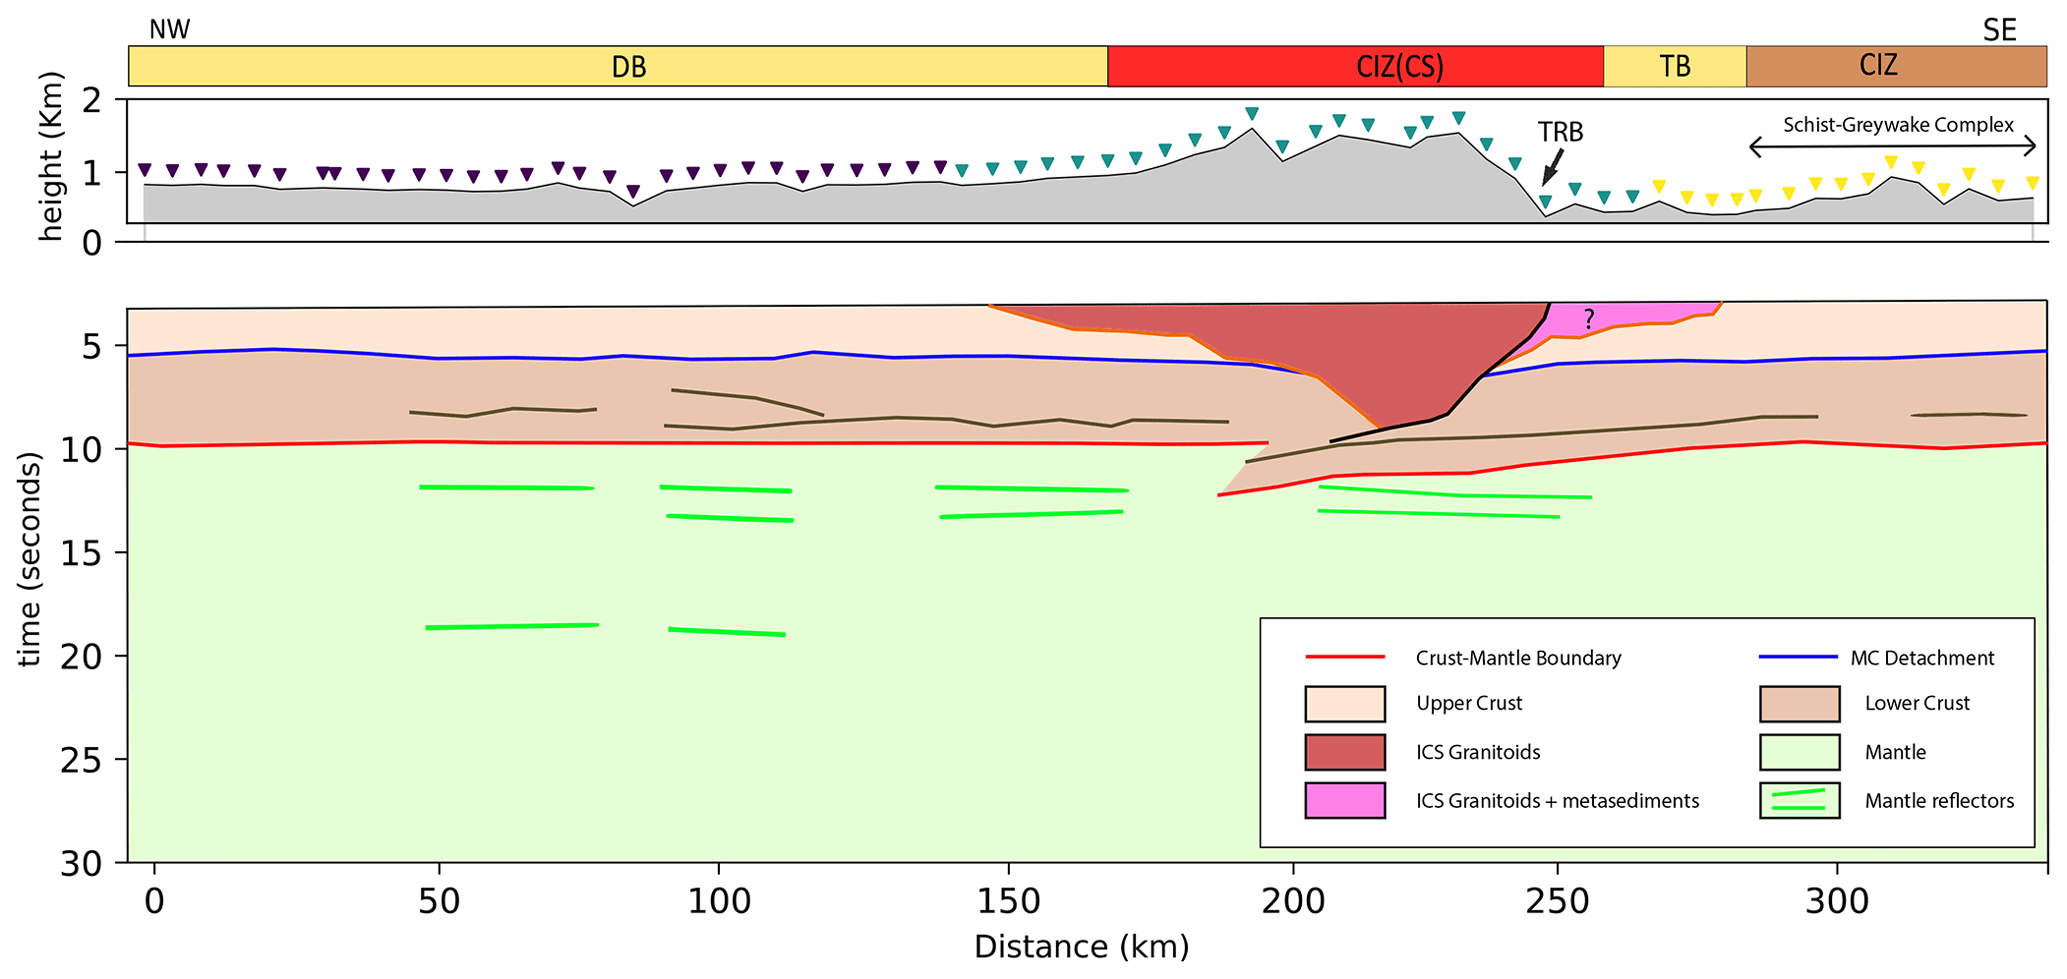
Figure 5Sketch of the proposed crustal structure below the Iberian Central System and the Duero and Tajo basins. Black solid line defines the ICS southern thrust. A crustal-scale thrust can be defined to the south of the ICS. In its upper part it may coincide with the Tietar River fault (TRF). It then follows the southern boundary of the ICS and reaches the lower crust, offsetting it to define a crustal imbrication.
An interesting feature located underneath this upper band of reflectivity is the contrasting signature and opposite polarity of events to the north and south of the 200 km point. Between 160 and 200 km, the sub-horizontal low-amplitude reflectivity located at ∼ 10 s contrasts with that found between 200 and 250 km, where a slightly N-dipping, high-amplitude, and high-frequency package of reflectivity appears. The high-amplitude reflectivity observed at ∼ 10 s to the north of the ICS appears to sink down to ∼ 12.5 s in the central part of the segment. This band of reflections, which is sub-horizontal elsewhere, is characterized by a marked lateral continuity throughout the profile. However, underneath the northern part of the ICS, this event presents a N-dipping attitude. Another package of very high-amplitude reflections parallel to the one above described but 1–1.5 shallower (Fig. 4C) is found along the section, also in the southern and central parts of the ICS, at 11 to 11.5 s.
At later times, two sub-parallel reflectors are found at 12.5 and 13.5 s TWT and are visible at both ends of the segment but not in the central part. Below these reflections, the coherence of the reflectivity decreases. Still, some tentative events can be followed locally at 15 s TWT and between 18–19 s TWT.
5.3 Southern segment
The southern segment represents the shortest section of the profile, approximately 70 km located south of the ICS. The deployment was undertaken during an anomalous period of heavy rainfall in the area. Variations in seismic velocities have been observed due to the presence of highly saturated media in shallow layers (Sens-Schönfelder and Wegler, 2006; Obermann et al., 2014; Fores et al., 2018). According to previous studies, high rainfalls can be related to de-coherence in the retrieved signal and increasingly at higher frequencies. During the deployment period, precipitations 2 to 3 times above the average took place. As a consequence, the coherency of the calculated autocorrelations is worse compared to the other two deployments, i.e. reflections are weaker and more noise seems to be retrieved. Altogether, this makes the assessment of the retrieved autocorrelations difficult to interpret and results should be taken with caution.
In this context, the main reflections found in the central segment (5–6 and ≥ 10 s reflections, Fig. 4a) can be followed to the south. The 5–6 s reflection has a rather horizontal geometry shallowing towards the south, getting up to 5–4.5 s. The reflection at around 10 s is more difficult to recognize although the one parallel to it but shallower (8.5–9 s TWT) is a bit more conspicuous. In any case, clear reflections of both events are retrieved just at a few stations but not continuously along the array. Moreover, their amplitude and coherence is low. Finally, reflectivity below 10.5 s is scarce and difficult to correlate.
The interpretation of our data relies on the identification of arrivals with high amplitudes, lateral coherence, and similar waveforms to those at their neighbouring stations. In addition, it is supported by previous knowledge of geological/geophysical features of the study area. In this regard, the ALCUDIA wide-angle (WA) profile (Ehsan et al., 2015) located to the south (Fig. 1) is especially helpful as its resulting velocity model can be used to carry out the depth conversion of main features. Furthermore, the interpreted boundaries in the time section in the ALCUDIA-NI seismic profile are used as a guideline to identify the upper–lower crust and the crust–mantle boundaries in the presented image of this work. Also, we have used constraints of the recently published CIMDEF coincident transect, where interferometry of earthquake phases with epicentral distance > 120∘ was applied (Andrés et al., 2019).
In general, clear reflectivity and good lateral continuity is retrieved along the profile presented here (Fig. 4b). Unfortunately, to the SE, where higher-frequency data could indicate the existence of more heterogeneities and small-scale features, noise due to weather conditions hinders a detailed interpretation. Nevertheless, the resulting profile allow us to identify crustal and even upper-mantle reflectivity. The crust could be divided into upper and lower crust according to the present reflections. The upper crust extends from the surface to ∼ 5–6 s TWT where a clear crustal-scale discontinuity is observed (Fig. 4b – line A, Fig. 5). The lower crust extends down to 12.5 s TWT in its deeper part with the Moho being marked by a discontinuity placed between 9.5 and 12.5 s TWT (Fig. 4b, line D). Below this discontinuity, within the upper mantle, lower-amplitude scattered events are present at different times, e.g. 12–13 s TWT and 18–19 s TWT (Fig. 4b, line F). As expected, the upper mantle presents less reflectivity than the crust.
6.1 Crustal features
As described above, two crustal-scale discontinuities can be traced in the reflectivity profile (Figs. 4b and 5): a mid-crustal discontinuity and the crustal-mantle boundary. Moreover, a conspicuous package of high-amplitude reflectivity is observed in the lower crust, at ∼ 8 s TWT (Fig. 4b, line C), in some parts of the profile.
6.1.1 Upper crust
The upper set of reflections is related to the upper–lower crust boundary. It appears mainly at 5 s TWT, being shallower towards both ends of the profile and slightly deeper below the ICS, mostly in its southern part (∼ 6 s TWT). It constitutes a high-amplitude reflection which underlies an upper crust featuring heterogeneous reflectivity. This boundary is well correlated with a mid-crustal discontinuity interpreted as the upper–lower crust boundary by Andrés et al. (2019) along this same transect, and it is also consistent with a similar one identified in the ALCUDIA dataset (Ehsan et al., 2014, 2015; Martínez Poyatos et al., 2012). In all cases, this upper–lower crust boundary coincides in geometry, depth, and regional extent character. A little discrepancy exists below the NW end of the ICS, where the boundary, as identified by GloPSI, is slightly deeper than that presented in this work (compare Fig. 4b and C). Furthermore, the same depth/time has been identified in the southern ALCUDIA-WA/NI dataset, thus backing up the interpreted boundary.
The upper crust presents a heterogeneous response throughout the profile, being the central segment where the highest-amplitude events are localized. The outcropping rocks of the ICS are mainly Carboniferous granites (Bea, 2004). In fact, previous studies have inferred that granites below the ICS exist down to ∼ 18 km based on the low-frequency/high-amplitude reflectivity retrieved above that depth (Andrés et al., 2019). Nonetheless, in our profile we found two distinctive zones within the upper crust below the ICS (Fig. 5): (i) from 210–240 km, i.e. the central part, and (ii) in the prolongation to the N and S boundary of the ICS. The latter is defined by the edge of the low-frequency/high-amplitude reflections (Fig. 4b, lines B and E). This signature can be regarded as the seismic expression of a highly homogenous body and/or with little internal reflectivity. When considered as a whole, the ICS area defined here would correlate well with that identified with GloPSI as the upper granitic crust (Andrés et al., 2019). However, the higher frequencies used in this study allow us to improve this interpretation. In the central part of the granitic area (210–240 km), a pattern of higher-frequency/higher-amplitude reflections is found, which extends down to 8 s TWT (Fig. 5), cross-cutting the proposed upper–lower crust boundary. However, towards both edges, this pattern of reflectivity occupies shallower zones, showing N- and S-dipping contacts with the neighbouring areas. Given these two zonations, we can infer that, the granitoids representing the ICS reach down to 8 s TWT (Fig. 4b, lines B and E) at its deepest point, shallowing to 3.5∕4 s TWT towards the south and north. To the north, this characteristic granitic signature fades when entering the DB, as according to our section, it partly overlaps the granites. To the south, this package of reflectivity is bounded by an area of lower-amplitude reflectivity that could define some sort of ICS southern thrust. The reflectivity package south of this thrust presents higher frequencies and amplitude. The signature could be related to the presence of a mixture of granites with high-impedance contrast metasediments from the Schist–Greywacke Complex, which dominates the outcrops of the southern part of the CIZ. Although this is a feasible interpretation, we lack the constraints provided from the first 3 s TWT of data, and additional geophysical information is needed to confirm this feature. In addition, it is also overlapped by the TB, thus hiding the nature of the basement. Finally, a loss of coherency in the autocorrelations marks the end of the granites although the existence of granitic rocks outcropping further to the SE of the CIMDEF profile (east of the Toledo mountains, TM in Fig. 1) might indicate that they somehow continue in depth, irregularly distributed underneath the TB. Again, the lack of information above 3 s TWT hinders a more accurate interpretation of the geometry of these granitoids.
The ICS granites represent a large volume of Carboniferous melts derived from crustal thickening and extension during the Variscan orogeny (Pérez Estaún et al., 1991). The fact that the base of the granites presented in this work extends below the proposed mid-crustal discontinuity (Fig. 5) could indicate that melting of the crust below the central part of the ICS was greater than in other areas of the CIZ and affected deeper areas, partly including the lower crust. In fact, some authors have shown the major presence of I-type granites in the ICS (Villaseca et al., 2017) suggesting that they have a deep source.
It is not clear how the faults controlling the pop-up/pop-down structure (de Vicente et al., 2007) of the ICS affect its deep configuration. They probably play an important role in defining the northern and mostly the southern limit of the ICS (Fig. 4b lines B and E). To the south of the identified ICS, where the upper–lower crust boundary is deeper than the granites, the lower-amplitude reflectivity below them would represent the seismic response of the Schist–Greywacke Complex (Vendian to lower Cambrian metasediments) and underlying rocks. These lithologies extend southwards and dominate the outcropping geology until the southern end of the profile.
As stated above, the interpreted upper–lower crust boundary correlates well with that deduced in Andrés et al. (2019) and with similar reflectors seen in the IBERSEIS and ALCUDIA datasets (e.g. Simancas et al., 2003, 2013; Martínez Poyatos et al., 2012; Ehsan et al., 2014, 2015). Accordingly, this reflection runs from the southern part of the SPZ, along the OMZ and up to the southern part of the ICS in the CIZ; i.e. it has, at least, a length of around 500 km. This boundary has been proposed to represent the brittle/ductile transition (Simancas et al., 2003; Martínez Poyatos et al., 2012; Ehsan et al., 2014), being the boundary between two crustal levels where tectonic shortening is resolved by different mechanisms (Simancas et al., 2013). In the CIMDEF profile, the heterogeneous seismic signature of the upper crust seems to picture some dipping reflectors, while the lower crust presents mostly sub-horizontal and laterally coherent features. This different response, partly observed by Andrés et al. (2019) might be the representation of two zones undergoing decoupled deformation, making the correlation between this reflection and the brittle/ductile transition also feasible. However, due to the fact that ductile deformation exists above this boundary, we suggest that this reflector mostly represents a detachment, probable the rheological boundary between a pre-Variscan basement and the deformed rocks on top (Ayarza et al., 2020). However, and according to the interpretation included in this paper, the development and emplacement of the ICS granites erased the imprint of this detachment underneath this mountain range. Therefore, it has not existed or been active in this area since the late Carboniferous, imposing some constraints on the Alpine accommodation of the deformation that will be discussed later.
6.1.2 Lower crust
The lower crust is characterized by some thick sub-horizontal and coherent packages of high-frequency/high-amplitude reflections that seem pretty continuous and well defined at places. The northern sector is less reflective, being almost transparent between 0 and 40 km along the profile. Further to the south, high-amplitude sub-horizontal events are retrieved between 7–8 s TWT, e.g. from 40 to 75 km, from 90 to 160 km, and from 190 to 280 km along the profile. Those features could represent a laminated lower crust, similar to that observed southward of this profile (e.g. ALCUDIA-NI and IBERSEIS-NI), although its amplitude is too high. Again, this same reflectivity, although with less resolution, has also been imaged by Andrés et al. (2019), after autocorrelations of teleseismic data. However, in the northern end of the ALCUDIA-NI profile (Poyatos et al., 2012), below the granites of the mora pluton, there is a strong reflector at ∼ 8 s TWT that the authors correlate with the top of a thinned lower crust. This feature matches the arrival time of the strong lower-crustal internal reflections identified in this dataset. If the latter also represented the top of the lower crust, this would be very thin, something that is supported by the intense late orogenic Variscan extension and partial melting of the lower crust undergone by this area and witnessed by big volumes of granites. Nevertheless, such a thin lower is not expected below the DB where late orogenic extension has not left an imprint and was probably not so important. In addition, along the entire profile, a somewhat patchy but fairly continuous band of reflectivity at 5–6 s defines the upper–lower-crustal boundary. Although the resolution of the dataset does not allow us to solve this issue, we suggest that this high-amplitude internal reflectivity found in the lower crust might be a remnant feature or just describe a partial extension and melting of the lower crust restricted to the locations where granites exist. Modelling of the already acquired CIMDEF WA data will probably provide velocities for such reflections and shed some more light on this issue.
The fact that the lower crust is less reflective in the northernmost part of the profile underneath the DB indicates either a change in the nature of the lower crust (i.e. the pre-Variscan basement), a different tectonic evolution for this area, or a stronger absorption of P-wave energy by the DB sediments. In fact, reflectivity is low at every level below 5 s TWT in the first 40 km of the seismic profile, thus suggesting that attenuation of wave energy may play a key role. On the other side, some cross-cutting relationships can be addressed at lower-crustal levels in this section (e.g. ∼ 100 km). Even though this dataset does not have enough resolution, other authors have seen similar features in vertical incidence seismic reflection datasets further south (ALCUDIA-NI and IBERSEIS-NI) and have interpreted it as the tectonic Variscan imprint on the lower-crust pre-Variscan deformation (Ayarza et al., 2020).
6.1.3 Crust-mantle boundary
Probably, the most relevant reflection in this profile is the crust–mantle boundary. Previous studies based on gravity modelling (de Vicente et al., 2007) and receiver functions (Mancilla and Díaz, 2015) have proposed that the Moho underneath the ICS has a synform-like structure, with a gentle thickening of 2–3 km. However, Andrés et al. (2019) proposed that there is an imbrication of the lower crust below the ICS, where the southern CIZ lower crust underthrusts that to the north, defining a Moho offset underneath the highest peaks of the mountain range. In our study, the Moho is presented as a distinctive and sharp reflection identified between ∼ 9.5 and 12.5 s TWT (29–38 km depth). The boundary between the crust and the mantle presents a rather horizontal geometry, being shallower to the north, around 9.5–10 s, and deepening below the ICS, although shallowing again towards the south. In the central part, a set of north-dipping features can be inferred between 10.5 and 12.5 s. The general depth of the profile to the south is in agreement with that interpreted from the ALCUDIA-NI seismic profile (Poyatos et al., 2012). These reflections run from the southern end of the central segment until the centre of the ICS and represent the base of the reflective crust. Therefore, this new image depicts a Moho boundary featuring an offset compatible with an imbrication of lower crust underneath the ICS. This structure defines the ICS crustal thickening, picturing an asymmetric crustal structure for this mountain range. The crustal thickening identified here appears at the same location as in Andrés et al. (2019), thus supporting their interpretation. The underthrust lower crust, would account for the crustal root seen in gravity models although with a different geometry, which has some geodynamic implications. The time offset observed in the Moho is ∼ 2–2.5 s, which translates to a thickening of around 6–8 km. The shortening addressed by this crustal imbrication is approximately of ∼ 20 km, although it could be larger. Another possible candidate to be the crust–mantle boundary would be the reflection seen at 8–9 s TWT. However, that would mean a Moho interface located at 24–28 km depth (with an average velocity of the crust of 6.2 km/s), which is way shallower than what is proposed in other studies (Poyatos et al., 2012; Ehsan et al., 2015; Diaz et al., 2016; Palomeras et al., 2017).
Comparing the profile and interpretations presented in this study (Figs. 4 and 5) with those generated with earthquake recordings (Andrés et al., 2019), the same Moho offset can be identified. However, some differences are observed as the resolving power of both datasets is different. The present data show reflections depicting the imbrication describing a smooth underthrusting. Crustal thickening is defined by the signal retrieved from five stations, from 185 to 210 km approx., and not only by two or three, like in Andrés et al. (2019). Moreover, now we can observe another reflection at ∼ 10 s TWT in the root zone. This feature is clearly visible below the three stations that recover the deepest part of the imbrication, from 185 to 200 km. These stations present two reflectors – one located at ∼ 10 s TWT and another located at ∼ 12.5 s TWT – clearly defining the Moho offset that affects the internal parts of the lower crust. We suggest that this pattern is identifiable due to the higher resolution of the data used for the study. The frequency band applied to the data, might not might not be able to clearly resolve the complexity of the structure at hand and its spatial extension, but it does image an imbrication whose lateral extent (around 20 km at lower-crustal level) could be compared with that estimated from field data at the upper crust. High conductivity at lower-crustal level found by Pous et al. (2012) at this same location is consistent with the existence of such an imbrication affecting the entire lower crust, as interpreted here.
The imbrication of the lower crust below the ICS is an expected consequence of the compression that occurred during the Alpine orogeny within the Iberian Peninsula, driven by the collision between the Eurasian and African plates. This compressional stage reactivated normal faults formed during the late orogenic Variscan extension and made them play a crucial role in the formation of the ICS. These faults created the pop-up/pop-down structure that configures the topography of the ICS (de Vicente et al., 2007). In its south-western border, the Tietar River fault (TRF) and the Southern Central System Thrust may play a crucial role in the crustal structure of the area and the topographic differences between the DB and the TB, as they may be involved in the crustal imbrication process (Andrés et al., 2019). In our image, the upper part of the underthrusting lower crust is well defined and seems to continue upwards, to at least, the lower part of the granitic complex defining the mountain rage (kilometre 220). From there, it continues, still at depth, along the southern edge of the ICS, linking upwards with what we interpret as the depth continuation of the TRF (E in Fig. 4). As the ICS granitoids have assimilated the mid-crustal detachment in this area, we argue that some of the faults affecting the upper crust (e.g. the TRF) do not root in this detachment but continue to depth, thus forcing the upper crust to sink. This would imply that the upper crust to the south of the ICS is very slightly underthrusting it, lowering the topography and thus defining a contrast in altitude between the two ICS foreland basins, located to the north (DB) and south (TB), with the TB being ∼ 300–400 m lower. Therefore, the depth extent of the granitoids implies the local lack of the mid-crustal detachment, which would have prevented the CIZ upper crust located to the south of the ICS from underthrusting, as suggested by Andrés et al. (2019). By contrast, if the detachment has been assimilated, coupled deformation between the upper and lower crust has allowed upper-crustal fractures to find their way into the lower crust, thus allowing the upper crust to sink. This model is partly in conflict with the seismic images obtained for transects along the TB further to the east (de Vicente et al., 2013), which do not show evidence of upper-crustal underthrusting. However, they show some downward bending of sediments in the contact between the TB and the ICS. In addition, the present dataset does not cross the NE–SW-oriented TB but the E–W TRF (Fig. 1), and the configuration might be slightly different. An estimation of the shortening at upper and lower-crustal levels implied by each of the involved structures could help us to support this interpretation.
Previous estimates of the shortening accommodated by the ICS in Iberia based on field observations portrayed a minimum of 5–9 km and a maximum of 20 km (de Vicente and Muñoz-Martín, 2012; de Vicente et al., 2018) These values suggest that the amount of shortening observed at the upper-crustal level is similar to that imaged at the lower crust in Figs. 4 and 5, thus supporting our model. However, other possibilities exist and cannot be ruled out. Lower-crustal deformation is sometimes ductile and homogenously distributed (Ayarza et al., 2020) or localized along ductile shear zones and displaced in relation to upper-crustal features (e.g. Simancas et al., 2013). In any case, further deep normal seismic studies with higher lateral resolution are needed in order to assess the amount of shortening accommodated at lower-crust levels.
6.2 Upper mantle
Within the upper mantle, locally continuous and well-defined reflections are retrieved (Figs. 4b, line F, and 5). They are observed within the northern and central sector, while in the southern sector less coherent mantle reflectivity is retrieved. These reflections are found within the profile at two main levels: between 13 and 14 s TWT (40–45 km) and between 19 and 20 s TWT (∼ 70 km). The upper set is observed in the northern and central segments, while the deepest reflections are only found in restricted areas between 50 and 120 km and 200 to 250 km along the profile. The top package of reflectivity is composed of two sub-parallel and sub-horizontal reflections separated by ∼ 1 s TWT and slightly deepening towards the south. The second set of reflections is also tilted towards the south, but it is less continuous.
In southern Iberia reflections at depths similar to our deepest feature have been reported previously (Martínez Poyatos et al., 2012; Andrés et al., 2019), e.g. between 61–72 km in the IBERSEIS profile. These reflections have been proposed to be related to a mineral phase transition from spinel lherzolite to garnet lherzolites within the upper mantle: the Hales discontinuity (Hales, 1969). The coincidence in depths between previous observations and the deepest of the reflections found in this work suggests a correlation between them, implying that the Hales discontinuity might also exist below the ICS and surrounding basins. Relatively large horizontal-scale heterogeneities within the upper mantle would also result in laterally limited reflection events, as seen in other orogens (Carbonell, 2004). No interpretations exist so far for the upper band of mantle reflectivity. Travel time estimations of P-to-S conversions and multiples indicate that they are not related to those processes. Further modelling is necessary to interpret these reflections. However, that is, as yet, beyond the scope of this paper.
In this study, we present a new lithospheric model of the Central Iberian Zone within the Iberian Massif constructed from autocorrelations of ambient seismic noise, as part of the CIMDEF project. The present work shows that this methodology has potential to provide key constraints in orogen-scale studies and complements previous results obtained along the same transect by autocorrelation of teleseismic data. Resulting models have important implications for the understanding of the accommodation of intraplate deformation during the Alpine reactivation of Central Iberia. The profile runs through three major geological features within central Iberia, namely, the Iberian Central System and its foreland Duero and Tajo basins.
Our results highlight a crust divided between an upper part, which is on average 15 km thick, and the lower crust with a thickness of between 15 to 18 km. The boundary in between is well defined throughout most of the profile, although some internal reflections in the lower crust might challenge this interpretation. Within the upper crust the new dataset has allowed us to map, laterally and in depth, the extent of the granites forming the Iberian Central System. This batholith has an extension along the profile of around 120 km, although only half of it outcrops. Based in this new dataset, we have estimated a maximum thickness of 8 s TWT, equivalent to 24 km for these granitic batholiths, although it gets thinner towards its N and S boundaries.
The most important findings of the study are (i) the presence of an imbrication of the crust below the Central System and (ii) the assimilation of the orogen-scale mid-crustal detachment and part of the lower crust by the granitoids of the Iberian Central System. The former defines a crustal root, where the Central Iberian Zone crust to the south of the Central System underthrusts this mountain range depicting a Moho offset of ∼ 6–8 km, from ∼ 30 to 36–38 km. The disruption of the mid-crustal detachment by Carboniferous crustal melting at the Central System allows coupled deformation at both crustal levels, letting upper-crustal fractures reach deep levels in the crust, as they are not forced to root in the detachment. This implies that the imbrication of the crust is not restricted to its lower part but also affects the upper crust. Accordingly, the crustal thickening appears to be bounded to the south by a system of interconnected fractures that might outcrop at the Tietar River basin, or further to the east at the Southern Central System thrust. In fact, a conspicuous area of high-reflectivity/high-amplitude events interpreted as granitoids (with variable amounts of metasediments) are found to bound with the main faults, although it is not yet clear how much of the upper crust is affected by this deformation. This configuration would force it to sink, thus explaining the lower topography that the Tajo Basin, to the south of the Central System, has when compared with that of the Duero Basin, to the north of this mountain range. Estimated shortening at upper and lower-crustal level suggest that this model is coherent and does not need an important amount of upper-crustal underthrusting to explain the vertical ∼ 300 m difference in topography between both foreland basins.
Within the upper mantle, scattered reflectivity is found below the northern and central segments of the profile. This defines two bands enclosed at depths of 40–45 km for the top band and around 70 km for the bottom one. The geometry of these reflectors is relatively flat; however, a slight deepening towards the south is visible below the Iberian Central System. We describe the deepest of these features as part of the transition zone from spinel lherzolite to garnet lherzolite, known as the Hales discontinuity, a regional-scale discontinuity already described towards the south of the profile in other studies.
The data used for the research carried out in this contribution are stored at the DIGITAL.CSIC data repository. Data are available in the Labsis repository by selecting the corresponding year for each deployment. For access to the data, contact Juvenal Andrés or Ramon Carbonell.
JA, MR, IP, and PA acquired the data. JA processed the data. JA prepared the article. JA, PA, RC, IP, and MR contributed to the discussion and article review.
The authors declare that they have no conflict of interest.
This article is part of the special issue “The Iberian Massif in the frame of the European Variscan Belt”. It is not associated with a conference.
We would like to acknowledge the GEO3BCN-CSIC Seismic Laboratory (http://labsis.ictja.csic.es/, last access: 11 November 2019) for making their seismic station available for this experiment.
This research has been supported by the Ministerio de Ciencia e Innovación (grant nos. CGL2014-56548-P and CGL2016-81964-REDE), the Consejería de Educación, Junta de Castilla y León (grant no. SA065P17), and the Generalitat de Catalunya (grant no. 2017-SGR-1022).
We acknowledge support for the publication fee by the CSIC Open Access Publication Support Initiative through its Unit of Information Resources for Research (URICI).
This paper was edited by Irene Bianchi and reviewed by Jordi Julià Casas and one anonymous referee.
Andrés, J., Marzán, I., Ayarza, P., Martí, D., Palomeras, I., Torné, M., Campbell, S., and Carbonell, R.: Curie point depth of the Iberian Peninsula and surrounding margins, A thermal and tectonic perspective of its evolution, J. Geophys. Res.-Sol. Ea., 123, 2049–2068, https://doi.org/10.1002/2017JB014994, 2018.
Andrés, J., Draganov, D., Schimmel, M., Ayarza, P., Palomeras, I., Ruiz, M., and Carbonell, R.: Lithospheric image of the Central Iberian Zone (Iberian Massif) using global-phase seismic interferometry, Solid Earth, 10, 1937–1950, https://doi.org/10.5194/se-10-1937-2019, 2019.
Ayarza, P., Martínez Catalán, J., Zeyen, H., and Juhlin, C.: Geophysical constraints on the deep structure of a limited ocean-continent subduction zone at the(2004) North Iberian Margin, Tectonics, 23.1., https://doi.org/10.1029/2002TC001487, 2004.
Ayarza, P., Martínez Catalán, J., Gallart, J., Pulgar, J. A., and Dañobeitia, J. J.: Estudio Sismico de la Corteza Iberica Norte 3.3: A seismic image of the Variscan crust in the hinterland of the NW Iberian Massif, Tectonics, 17.2, 171–186, https://doi.org/10.1029/97TC03411, 1998.
Ayarza, P., Palomeras, I., Carbonell, R., Afonso, J. C., and Simancas, F.: A wide-angle upper mantle reflector in SW Iberia: Some constraints on its nature, Phys. Earth Planet. Int., 181, 88–102, https://doi.org/10.1016/j.pepi.2010.05.004, 2010.
Banda, E., Suriñach, E., Aparicio, A., Sierra, J., and Ruiz de la Parte, E.: Crust and upper mantle structure of the central Iberian meseta (Spain), Geophys. J. Int., 67, 779–789, 1981.
Barbero, L. and Villaseca, C.: Eclogite facies relicts in metabasites from the Sierra de Guadarrama (Spanish Central System): P-T estimations for the Hercynian evolution, Mineral. Mag., 64, 815–836, 2000.
Bea, F.: La naturaleza del magmatismo de la Zona Centroibérica: Consideraciones generales y ensayo de correlación, in: Geología de España, edited by: Vera, J. A., SGE-IGME, Madrid, Spain, 128–133, 2004.
Becker, G. and Knapmeyer-Endrun, B.: Crustal thickness across the Trans-European Suture Zone from ambient noise autocorrelations, Geophys. J. Int., 212, 1237–1254, https://doi.org/10.1093/gji/ggx485, 2018.
Bensen, G. D., Ritzwoller, M. H., Barmin, M. P., Levshin, A. L., Lin, F., Moschetti, M. P., Shapiro, N. M., and Yang, Y.: Processing seismic ambient noise data to obtain reliable broad-band surface wave dispersion measurements, Geophys. J. Int., 169, 1239–1260, https://doi.org/10.1111/j.1365-246X.2007.03374.x, 2007.
Buffoni, C., Schimmel, M., Sabbione, N. C., Rosa, M. L., and Connon, G.: Crustal structure beneath Tierra del Fuego, Argentina, inferred from seismic P-wave receiver functions and ambient noise autocorrelations, Tectonophysics, 751, 41–53, https://doi.org/10.1016/j.tecto.2018.12.013, 2019.
Carbonell, R.: On the nature of mantle heterogeneities and discontinuities: evidence from a very dense wide-angle shot record, Tectonophysics, 388, 103–117, https://doi.org/10.1016/j.tecto.2004.07.025, 2004.
Claerbout, J.: Synthesis of a layered medium from its acoustic transmission response, Geophysics, 33, 264–269, https://doi.org/10.1190/1.1439927, 1968.
Cloetingh, S., Burov, E., Beekman, F., Andeweg, B., Andriessen, P. A. M., Garcia-Castellanos, D., de Vicente, G., and Vegas, R.: Lithospheric folding in Iberia, Tectonics, 21, 1041, https://doi.org/10.1029/2001TC901031, 2002.
Dercourt, J., Zonenshain, L. P., Ricou, L. E., Kazmin, V. G., Le Pichon, X., Knipper, A. L., Grandjacquet, C., Sbortshikov, I. M., Geyssant, J., and Lepvrier, C.: Geological evolution of the tethys belt from the atlantic to the pamirs since the LIAS, Tectonophysics, 123, 241–315, 1986.
De Vicente, G., Giner, J. L., Muñoz-Martín, A., González-Casado, J. M., and Lindo, R.: Determination of present-day stress tensor and neotectonic interval in the Spanish Central System and madrid Basin, central Spain: Dynamics of Extensional Basins and Inversion Tectonics, Tectonophysics, 266, 405–424, https://doi.org/10.1016/S0040-1951(96)00200-4, 1996.
De Vicente, G., Vegas, R., Muñoz Martín, A., Silva, P. G., Andriessen, P., Cloetingh, S., González Casado, J. M., Van Wees, J. D., Álvarez, J., Carbó, A., and Olaiz, A.: Cenozoic thick-skinned deformation and topography evolution of the Spanish Central System, Global Planet. Change, 58, 335–381. https://doi.org/10.1016/j.gloplacha.2006.11.042, 2007.
De Vicente, G., Cunha, P. P., Muñoz-Martín, A., Cloetingh, S. A. P. L., Olaiz, A., and Vegas, R.: The Spanish-Portuguese Central System: An Example of Intense Intraplate Deformation and Strain Partitioning, Tectonics 37, 4444–4469, https://doi.org/10.1029/2018TC005204, 2018.
Dewey, J. F., Helman, M. L., Knott, S. D., Turco, E., and Hutton, D. H. W.: Kinematics of the western mediterranean, Geol. Soc. Spec. Publ., 45, 265–283, https://doi.org/10.1144/GSL.SP.1989.045.01.15, 1989.
Díaz, J., Gallart, J., and Carbonell, R.: moho topography beneath the Iberian-Western mediterranean region mapped from controlled-source and natural seismicity surveys, Tectonophysics, 692, 74–85, https://doi.org/10.1016/j.tecto.2016.08.023, 2016.
Díez Balda, M. A., Vegas, R., and González Lodeiro, F.: Central-Iberian Zone, Autochthonous Sequences, in: Pre-Mesozoic Geology of Iberia, edited by: Dallmeyer, R. D. and Martínez García, E., Springer, Berlin, Germany, 172–188, 1990.
Ehsan, S. A., Carbonell, R., Ayarza, P., Martí, D., Pérez-Estaún, A., Martínez Poyatos, D., Simancas, F., Azor, A., and Mansilla, L.: Crustal deformation styles along the reprocessed deep seismic reflection transect of the Central Iberian Zone (Iberian Peninsula), Tectonophysics, 621, 159–174, https://doi.org/10.1016/j.tecto.2014.02.014, 2014.
Ehsan, S. A., Carbonell, R., Ayarza, P., Martí, D., Martínez Poyatos, D., Simancas, J. F., Azor, A., Ayala, C., Torné, M., and Pérez-Estaún, A.: Lithospheric velocity model across the Southern Central Iberian Zone (Variscan Iberian massif): The ALCUDIA wide-angle seismic reflection transect, Tectonics, 34, 535–554, https://doi.org/10.1002/2014TC003661, 2015.
Flecha, I., Palomeras, I., Carbonell, R., Simancas, F., Ayarza, P., Matas, J., González-Lodeiro F., and Peréz-Estaún, A.: Seismic imaging and modelling of the lithosphere of SW-Iberia, Tectonophysics, 472, 148–15, https://doi.org/10.1016/j.tecto.2008.05.033, 2009.
Fores, B., Champollion, C., Mainsant, G., Albaric, J., and Fort, A.: monitoring saturation changes with ambient seismic noise and gravimetry in a karst environment, Vadose Zone J., 17, 170163, https://doi.org/10.2136/vzj2017.09.0163, 2018.
Franke, W.: The mid-European segment of the Variscides: tectonostratigraphic units, terrane boundaries and plate tectonic evolution, in: Orogenic Processes: Quantification and modelling in the Variscan Belt, Geol. Soc. Spec. Publ., 179, 35–61, https://doi.org/10.1144/GSL.SP.2000.179.01.05, 2000.
Gorbatov, A., Saygin, E., and Kennett, B. L. N.: Crustal properties from seismic station autocorrelograms, Geophys. J. Int., 192, 861–870, 2013.
ILIHA DSS Group.: A deep seismic sounding investigation of lithospheric heterogeneity and anisotropy beneath the Iberian Peninsula, Tectonophysics 221, 35–51, 1993.
Julià, J. and Mejía, J.: Thickness and Vp/Vs ratio variation of the Iberian crust, Geophys. J. Int., 156, 59–72, 2004.
Julivert, M., Fontboté, M., Ribeiro, A., and Conde, L. E.: mapa y memoria Explicativa del mapa Tectónico de la Península Ibérica y Baleares, scale 1:1,000,000, Inst. Geol. y min. de Esp., Madrid, Spain, 113, 1972.
Kennett, B. L. N.: Lithosphere-asthenosphere P-wave reflectivity across Australia, Earth Planet. Sci.e Lett., 431, 225–235, https://doi.org/10.1016/j.epsl.2015.09.039, 2015.
Kennett, B. L. N., Saygin, E., and Salmon, M.: Stacking autocorrelograms to map Moho depth with high spatial resolution in southeastern Australia, Geophys. Res. Lett., 42, 7490–7497, https://doi.org/10.1002/2015GL065345, 2015.
Mancilla, F. L. and Díaz, J.: High resolution moho topography map beneath Iberia and Northern morocco from receiver function analysis, Tectonophysics, 663, 203–211, https://doi.org/10.1016/j.tecto.2015.06.017, 2015.
Martínez Catalán, J. R.: Are the oroclines of the Variscan belt related to late Variscan strike-slip tectonics?, Terra Nova, 23, 241–247, 2011a.
Martínez Catalán, J. R.: The Central Iberian arc: implications for the Iberian massif, Geogaceta, 50, 7–10, 2011b.
Martínez Catalán, J. R., Rubio Pascual, F. J., Díez Montes, A., Díez Fernández, R., Gómez Barreiro, J., Dias da Silva, I., González Clavijo, I., Ayarza, P., and Alcock, J. E.: The late Variscan HT/LP metamorphic event in NW and Central Iberia: relationships to crustal thickening, extension, orocline development and crustal evolution, Geol. Soc. Spec. Publ., 405, 225–247, https://doi.org/10.1144/SP405.1, 2014.
Martínez Poyatos, D., Carbonell, R., Palomeras, I., Simancas, F., Ayarza, P., Martí, D., Azor, A., Jabaloy, A., González Cuadra, P., Tejero, R., Martín Parra, L. M., Matas, J., González Lodeiro, F., Pérez-Estaún, A., García Lobón, J. L., and Mansilla, L.: Imaging the crustal structure of the Central Iberian Zone (Variscan Belt): the ALCUDIA deep seismic reflection transect, Tectonics 31, TC3017, https://doi.org/10.1029/2011TC002995, 2012.
Matte, P.: The Variscan collage and orogeny (480–290 ma) and the tectonic definition of the Amorica microplate: A review, Terra Nova, 13, 122–128, https://doi.org/10.1046/j.1365-3121.2001.00327.x., 2001.
Obermann, A., Froment, B., Campillo, M., Larose, E., Planès, T., Valette, B., Chen, J. H., and Liu, Q. Y.: Seismic noise correlations to image structural and mechanical changes associated with the mw 7.9 2008 Wenchuan earth-quake, J. Geophys. Res.-Sol. Ea., 119, 3155–3168, https://doi.org/10.1002/2013JB010932, 2014.
Palomeras, I., Carbonell, R., Flecha, I., Simancas, F., Ayarza, P., Matas, J., Martínez Poyatos, D., Azor, A., González Lodeiro, F., and Pérez-Estaún, A.: The nature of the lithosphere across the Variscan Orogen of SW-Iberia: Dense wide-angle seismic reflection data, J. Geophys. Res., 114, B02302, https://doi.org/10.1029/2007JB005050, 2009.
Palomeras, I., Carbonell, R., Ayarza, P., Fernandez, M., Simancas, F., Martínez Poyatos, D., González Lodeiro, F., and Pérez-Estaún, A.: Geophysical model of the lithospher across the Variscan Belt of SW-Iberia: multidisciplinary assessment, Tectonophysics, 508, 42–51, https://doi.org/10.1016/j.tecto.2010.07.010, 2011.
Palomeras, I., Villaseñor, A., Thurner, S., Levander, A., Gallart, J., Harnafi, M.: Lithospheric strcuture of Iberia and morocco using finite-frequency Rayleigh wave tomogrpahy from earthquakes and seismic ambient noise, Geochem., Geophy. Geosy., 18, 1824–1840, https://doi.org/10.1002/2016GC006657, 2017.
Pastor-Galán, D., Groenewegen, T., Brouwer, D., Krijgsman, W., and Dekkers, M. J.: One or two orocilnes in the Variscan orogen of Iberia? Implications for Pangea amalgamation, Geology, 43, 527–530, https://doi.org/10.1130/G36701.1, 2015.
Pastor-Galán, D., Dekkers, M. J., Gutiérrez-Alonso, G., Brouwer, D., Groenewegen, T., and Krijgsman, W.: Paleomagnetism of the Central Iberian curve's putative hinge: Too many oroclines in the Iberian Variscides, Gondwana Res., 39, 96–113. https://doi.org/10.1016/j.gr.2016.06.016, 2016.
Pastor-Galán, D., Gutiérrez-Alonso, G., Dekkers, M. J., and Langereis, C. G.: Paleomagnetism in Extremadura (Central Iberian Zone, Spain) Paleozoic rocks: Extensive remagnetizations and further constraints on the extent of the Cantabrian orocline, J. Iber. Geol., 43, 583–600, https://doi.org/10.1007/s41513-017-0039-x, 2017.
Pérez Estaún, A., Martínez Catalán, J. R., and Bastida, F.: Crustal thickening and deformation sequence in the footwall to the suture of the Variscan belt of northwest Spain, Tectonophysics, 191, 243–253, 1991.
Pous, J., Muñoz-Martín, A., Olaiz, A. J., Seillé, H., and de Vicente, G.: Analisis de la estructura alpina de la corteza del centro de la Peninsula Iberica: Una seccion Magneto-Telurica a traves del Sistema Central (Sierra de Gredos), Geo-Temas, 13, 4–8, 2012.
Pulgar, J. A., Gallart, J., Fernández-Viejo, G., Pérez-Estaún, A., and Álvarez-Marrón, J.: Seismic image of the Cantabrian Mountains in the western extension of the Pyrenees from integrated ESCIN reflection and refraction data, Tectonophysics, 264, 1–19, https://doi.org/10.1016/S0040-1951(96)00114-X, 1996.
Romero, P. and Schimmel, M.: mapping the basement of the Ebro Basin in Spain with seismic ambient noise autocorrelations, J. Geophys. Res., 123, 5052–5067, https://doi.org/10.1029/2018JB015498, 2018.
Ruigrok, E. and Kees, W.: Global-phase seismic interferometry unveils P-wave reflectivity below the Himalayas and Tibet, Geophys. Res. Lett., 39, https://doi.org/10.1029/2012GL051672, 2012.
Simancas, J. F., Ayarza, P., Azor, A., Carbonell, R., Martínez Poyatos, D., Pérez-Estaún, A., and González Lodeiro, F.: A seismic geotraverse across the Iberian Variscides: Orogenic shortening, collisional magmatism, and orocline development, Tectonics, 32, 417–432, https://doi.org/10.1002/tect.20035, 2013.
Schimmel, M.: Phase cross-correlations: design, comparisons and applications, Bull. Seismol. Soc. Am., 89, 1366–1378, 1999.
Schimmel, M. and Gallart, J.: Frequency-dependent phase coherence for noise suppression in seismic array data, J. Geophys. Res., 112, B04303, https://doi.org/10.1029/2006JB004680, 2007.
Schimmel, M., Stutzmann, E., Gallart, J.: Using instantaneous phase coherence for signal extraction from ambient noise data at a local to a global scale, Geophys. J. Int., 184, 494–506, https://doi.org/10.1111/j.1365-246X.2010.04861.x, 2011.
Schimmel, M., Stutzmann, E., and Ventosa, S.: Low-frequency ambient noise autocorrelations: Waveforms and normal modes, Seismol. Res. Lett., 89, 1488–1496, https://doi.org/10.1785/0220180027, 2018.
Sens-Schönfelder, C. and Wegler, U.: Passive image interferometry and seasonal variations of seismic velocities at merapi Volcano, Indonesia, Geophys. Res. Lett. 33, 21302, https://doi.org/10.1029/2006GL027797, 2006.
Simancas, J. F., Carbonell, R., González Lodeiro, F., Pérez-Estaún, A., Juhlin, C., Ayarza, P., Kashubin, A., Azor, A., Martínez Poyatos, D., Almodóvar, G. R., Pascual, E., Sáez, R., and Expósito, I.: Crustal structure of the transpressional Variscan orogen of SW Iberia: SW Iberia deep seismic reflection profile (IBERSEIS), Tectonics, 22, 1062, https://doi.org/10.1029/2002TC001479, 2003.
Suriñach, E. and Vegas, R.: Lateral inhomogeneities of the Hercynian crust in central Spain, Phys. Earth Planet. Inter., 51, 226–234, 1988.
Taylor, G., Rost, S., and Houseman, G.: Crustal imaging across the North Anatolian Fault Zone from the autocorrelation of ambient seismic noise, Geophys. Res. Lett., 43, 2502–2509, https://doi.org/10.1002/2016GL067715, 2016.
Tibuleac, I., M. and von Seggern, D.: Crust-mantle boundary reflectors in Nevada from ambient seismic noise autocorrelations, Geophys. J. Int., 189, 493–500, https://doi.org/10.1111/j.1365-246X.2011.05336.x, 2012.
Torne, M., Fernàndez, M., Vergés, J., Ayala, C., Salas, M. C., Jimenez-Munt, I., and Diaz, J.: Crust and mantle lithospheric structure of the Iberian Peninsula deduced from potential field modeling and thermal analysis, Tectonophysics, 663, 419–433, https://doi.org/10.1016/j.tecto.2015.06.003, 2015.
Van Wees, J. D., Arche, A., Beijdorff, C. G., LopezGomez, J., and Cloetingh, S. A. P. L.: Temporal and spatial variations in tectonic subsidence in the Iberian Basin (eastern Spain): Inferences from automated modelling of high-resolution stratigraphy (Permian-Mesozoic), Tectonophysics, 300, 285–310, 1998.
Vegas, R., Vázquez, J. T., Suriñach, E., and Marcos, A.: model of distributed deformation, block rotations and crustal thickening for the formation of the Spanish Central System, Tectonophysics 184, 367–378, https://doi.org/10.1016/0040-1951(90)90449-I, 1990.
Vergés, J.,Mmillán, H., Roca, E., Muñoz, J. A., Marzo, M., Cirés, J., Den Bezemer, T., Zoetemeijer, R., and Cloetingh, S.: Eastern Pyrenees and related foreland basins: pre-, syn- and post-collisional crustal-scale cross-sections, Mar. Petrol. Geol., 12, 903–915, https://doi.org/10.1016/0264-8172(95)98854-X, 1995.
Villaseca, C., Ruiz-Martínez, V. C., and Pérez-Soba, C.: magnetic susceptibility of Variscan granite-types of the Spanish central system and the redox state of magma, Geol. Acta, 15, 379–394, 2017.
Ziegler, P.: Geological atlas of Western and Central Europe, City: Shell.isbn: 9789066441255, 1990.