the Creative Commons Attribution 4.0 License.
the Creative Commons Attribution 4.0 License.
 | 16 Mar 2020
Using seismic attributes in seismotectonic research: an application to the Norcia Mw = 6.5 earthquake (30 October 2016) in central Italy
Maurizio Ercoli
Emanuele Forte
Massimiliano Porreca
Ramon Carbonell
Cristina Pauselli
Giorgio Minelli
Massimiliano R. Barchi
In seismotectonic studies, seismic reflection data are a powerful tool to unravel the complex deep architecture of active faults. Such tectonic structures are usually mapped at the surface through traditional geological surveying, whilst seismic reflection data may help to trace their continuation from the near surface down to hypocentral depths. On seismic reflection data, seismic attributes are commonly used by the oil and gas industry to aid exploration. In this study, we propose using seismic attributes in seismotectonic research for the first time. The study area is a geologically complex region of central Italy, struck during 2016–2017 by a long-lasting seismic sequence, including a Mw 6.5 main shock. Three vintage seismic reflection profiles are currently the only ones available at the regional scale across the epicentral zone. These represent a singular opportunity to attempt a seismic attribute analysis by running attributes like the “energy” and the “pseudo-relief”. Our results are critical, as they provide information on the relatively deep structural setting, mapping a prominent, high-amplitude regional reflector interpreted as the top of basement, which is an important rheological boundary. Complex patterns of high-angle discontinuities crossing the reflectors have also been identified by seismic attributes. These steeply dipping fabrics are interpreted as the expression of fault zones belonging to the active normal fault systems responsible for the seismicity of the region. Such peculiar seismic signatures of faulting are consistent with the principal geological and tectonic structures exposed at surface. In addition, we also provide convincing evidence of an important primary tectonic structure currently debated in the literature (the Norcia antithetic fault) as well as several buried secondary fault splays. This work demonstrates that seismic attribute analysis, even if used on low-quality vintage 2D data, may contribute to improving the subsurface geological interpretation in areas characterized by limited and/or low-quality subsurface data but with potentially high seismic hazard.
- Article
(58034 KB) - Full-text XML
-
Supplement
(15973 KB) - BibTeX
- EndNote


Studying the connections between earthquakes and the faults with which they are associated is a primary goal of seismotectonics (Allen et al., 1965; Schwartz and Coppersmith, 1984). Within this field, it is generally complex to fill the gap between the exposed geology (including the active “geological faults”) and the seismological data (e.g., focal mechanisms, earthquake locations, etc.), indicators of the geometry and kinematics of the seismic source at hypocentral depth (“seismological faults”, sensu Barchi and Mirabella, 2008). The recovery of information on the seismogenic structures at depth is difficult, primarily due to the lack of high-resolution geophysical data and/or well stratigraphy. The lack of these data results in relatively high degrees of uncertainty and drives contrasting geological models and interpretations.
Different geophysical methods (e.g., active and passive seismology, gravimetry, magnetics, electrics, and electromagnetics such as magnetotellurics and ground-penetrating radar) may contribute to defining the stratigraphy and structural setting of the upper crust at different scales. The data provided by the seismic reflection technique are not directly affected by well-known inversion problems typical of the potential methods (Snieder and Trampert, 1999) and are largely the most powerful tool able to produce high-resolution images of the subsurface. This type of data, if calibrated with deep well stratigraphy, provides very strong constraints on the definition of subsurface geological architecture. These profiles are useful to unveil the deep geometry of active faults mapped in the field and extend them down to hypocentral depths. Unfortunately, the ex novo acquisition (possibly 3D) of onshore deep seismic reflection data for research purposes is hampered by high costs, environmental problems, and complex logistics (e.g., prohibition of dynamite or vibroseis trucks in natural parks or urban areas). Significant exceptions are research projects for deep crustal investigations like BIRPS (Brewer et al., 1983), CoCORP (Cook et al., 1979), ECORS (Roure et al., 1989), CROP (Barchi et al., 1998; Finetti et al., 2001), IBERSEIS (Simancas et al., 2003), and ALCUDIA (Ehsan et al., 2014, 2015) among others. In seismically active regions, old profiles (legacy data) acquired by the industry have been successfully used to connect the active faults mapped at the surface with the earthquake seismogenic sources depicted by seismological records (Boncio et al., 2000; Bonini et al., 2014; Carvalho et al., 2008; Beidinger et al., 2011; Maesano et al., 2015; Porreca et al., 2018). Legacy seismic lines have, in fact, some advantages: (1) they are already available from oil companies and national archives; (2) they represent a nice source of information in places where new data are difficult to acquire; and (3) they can be used to build up and refine geological models. Moreover, such data are often the only ones available. Therefore, these legacy data are very valuable and it is worth using them to constrain the subsurface geological setting and to provide new data on active tectonic structures (see the DISS database; Basili et al., 2008). Vintage profiles can therefore significantly contribute to seismotectonic research, even if characterized by intrinsic limitations: (i) their location, orientation, and acquisition parameters were not specifically designed for this aim; (ii) they were collected using relatively old seismic technologies and acquisition and/or processing strategies. Consequently, these data were produced with a relatively low signal-to-noise ratio (SNR) and low resolution, especially when compared to modern standards (Manning et al., 2019). In order to improve the image quality and increase the accuracy of the interpretation, two main strategies, ordinarily used by the oil and gas industry, can be applied to legacy data: (1) reprocessing from raw data using modern processing strategies and newly designed algorithms and software; (2) using post-stack analysis techniques such as seismic attributes.
An attribute analysis is, perhaps, one of the easiest, cheapest, and fastest strategies to qualitatively emphasize the geophysical features and data properties of reflection seismic datasets, producing benefits particularly in complex geological areas. A seismic attribute is a quantity derived from seismic data (pre-stack and/or post-stack) commonly used to extract additional information that may be unclear in conventionally processed seismic lines. Examples of applications on dense 3D seismic volumes produced impressive results, including the identification of ancient river channels or sets of faults at variable scales (Chopra and Marfurt, 2005; Chopra and Marfurt, 2007, 2008; Marfurt et al., 2011; Hale, 2013; Barnes, 2016; Iacopini et al., 2016; Marfurt, 2018; Wrona et al., 2018; Di and AlRegib, 2019; Naeini and Prindle, 2019).
There are several advantages in using 3D seismic data instead of 2D. Advantages of 3D and pitfalls of 2D are extensively discussed in Torvela et al. (2013) and Hutchinson (2016). 2D seismic data are more limited, and 2D post-stack seismic attribute analysis may not provide the same quality of information as when using 3D (Marfurt and Alves, 2015; Ha et al., 2019). However, the main point is that in the past, it was common to sample study areas inland by 2D grids of seismic profiles, with full 3D seismic surveys being rare. Hence, it is relevant to extract as much information as possible from 2D data.
In this work, the selected study area is located between the southeastern part of the Umbria–Marche Apennines and the Laga domain, in the outer northern Apennines (central Italy) (e.g., Barchi et al., 2001). This area presents ideal characteristics to test the application of seismic attributes as a new approach in seismotectonics. In the past, several seismic profiles were acquired in this region for hydrocarbon exploration and were later used to constrain subsurface geological structures (Bally et al., 1986; Barchi et al., 1991, 1998, 2009; Ciaccio et al., 2005; Pauselli et al., 2006; Mirabella et al., 2008; Bigi et al., 2011). After the 2016–2017 seismic sequence, Porreca et al. (2018) provided an updated regional geological model based on the interpretation of vintage seismic lines. However, remarkable differences in the seismic data quality across the region prevented a straightforward seismic interpretation. Therefore, the present work exploits the use of seismic attributes on three low-quality seismic profiles located close to the Mw 6.5 main shock of the 2016–2017 seismic sequence. The main goal is to squeeze additional information from the 2D data, obtaining as many constraints as possible on the geological structures responsible for the seismicity in the area by defining the following:
-
the geological and structural setting at depth (e.g., the depth of the basement and its involvement); and
-
the trace of potentially seismogenic faults (connection between the active faults mapped at the surface and the earthquake foci).
Any improvements achievable on the data quality and visualization, for example an increase in the resolution and/or an enhancement of the lateral extent or limits of the seismic reflectors, would represent a valuable contribution considering the limited amount of data available in this area. We think that this innovative approach to seismotectonic research can be extended to other onshore seismically active areas in the world, especially if covered only by sparse vintage low-quality seismic surveys. In such cases, we think seismotectonic research may benefit from the potential and improvements generated by seismic attributes.
The study area is located in the southeastern part of the northern Apennines fold-and-thrust belt. The area includes the Umbria–Marche domain and the Laga domain, which are separated by an important regional tectonic structure known as the Monti Sibillini thrust (MSt) (Fig. 1). The Umbria–Marche domain involves the rocks of the sedimentary cover, represented by three main units (top to bottom), characterized by different interval velocities (Bally et al., 1986; Barchi et al., 1998; Porreca et al., 2018).
-
On top is the Laga sequence (late Messinian–lower Pliocene, up to 3000 m thick, average seismic velocity; Vav=4000 m s−1). It consists of siliciclastic turbidites made up of alternating layers of sandstones, marls, and evaporites deposited in a marine depositional environment (Milli et al., 2007; Bigi et al., 2011); it outcrops in the eastern sector of the study area (i.e., the Laga domain).
-
The carbonate formations are next (Jurassic–Oligocene, about 2000 m thick, Vav=5800 m s−1), formed by pelagic limestones (Mirabella et al., 2008) with subordinated marly levels overlying an Early Jurassic carbonate platform (Calcare Massiccio Fm.). It outcrops mainly in the Umbria–Marche domain.
-
At the bottom are the Late Triassic evaporites (1500–2500 m thick, Vav=6400 m s−1). They consist of alternated layers of anhydrites and dolomites (Anidriti di Burano Fm. and Raethavicula Contorta beds; Martinis and Pieri, 1964), never outcropping and intercepted only by deep wells (Porreca et al., 2018, and references therein).
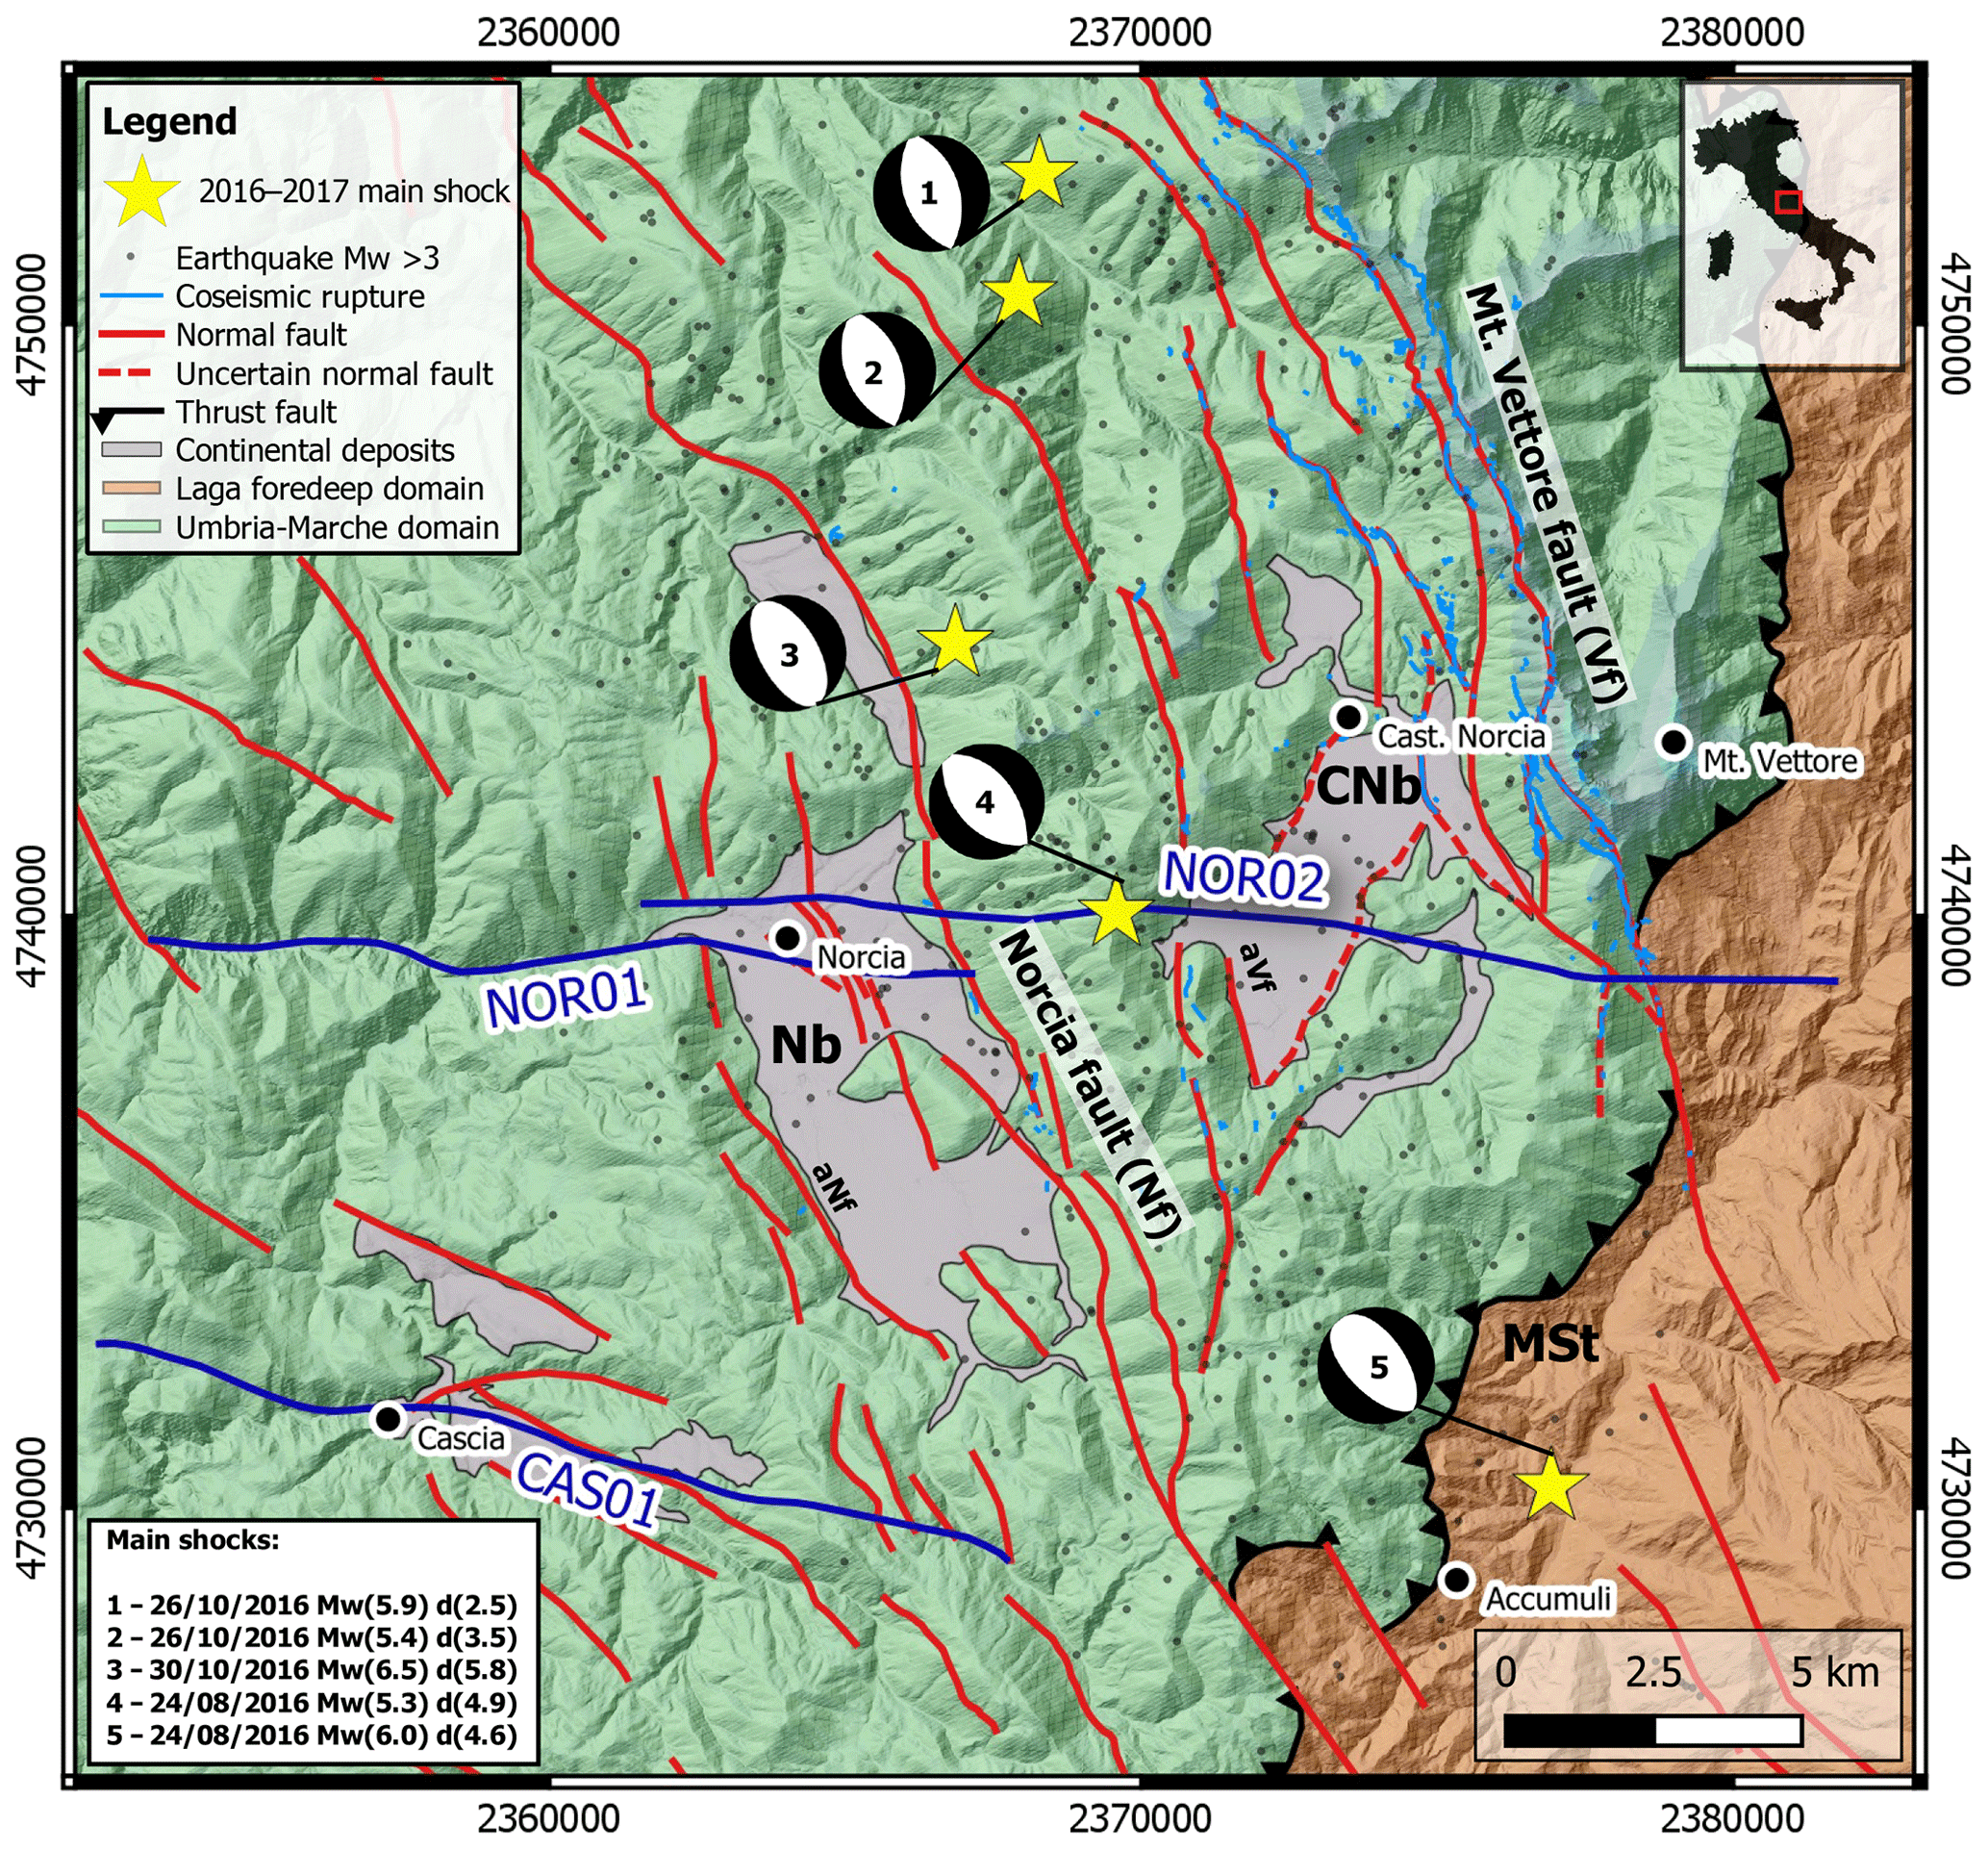
Figure 1Simplified geological map of the study area (modified after Porreca et al., 2018), showing the location of the 2D seismic reflection lines. The locations of the 2016–2017 main shock are indicated by beach balls, including the earthquake magnitudes and estimated depth (d) (Chiaraluce et al., 2017). The surface ruptures and the known master faults are also highlighted. Norcia basin (Nb), Castelluccio di Norcia basin (CNb), Monti Sibillini thrust (MSt), Mt. Vettore fault (Vf), antithetic fault (aVf), Norcia fault (Nf), and antithetic Norcia fault (aNf).
For further details on the stratigraphic characteristics of the area, the reader can refer to the works by Centamore et al. (1992) and Pierantoni et al. (2013).
These units rest on a basement with variable lithology (Permian–Late Triassic, Vav=5100 m s−1) that never crops out in the study area (Vai, 2001). It has only been intercepted by deep wells (Bally et al., 1986; Minelli and Menichetti, 1990; Anelli et al., 1994; Patacca and Scandone, 2001).
This sedimentary sequence is involved in the late Miocene fold-and-thrust belt, including a set of N–S-trending anticlines, formed at the hanging wall of the W-dipping arc-shaped major thrusts. The most important compressional structure is the M. Sibillini thrust (MSt; Koopman, 1983; Lavecchia, 1985), where the Umbria–Marche domain is overthrusted on the Laga domain.
This is a geologically complex region, where in the past the analysis of 2D seismic profiles has produced contrasting interpretations of the upper crust structural setting, i.e., thin- vs. thick-skinned tectonics, fault reactivation and/or inversion, and basement depth (Bally et al., 1986; Barchi, 1991; Barchi et al., 2001; Bigi et al., 2011; Calamita et al., 2012). A review of the geological history of this area has recently been provided by Porreca et al. (2018). These authors propose a tectonic style characterized by the coexistence of thick- and thin-skinned tectonics with multiple detachments localized at different structural levels.
These compressional structures have later been disrupted by extensional faults since the late Pliocene (Fig. 1) (Blumetti et al., 1993; Boncio et al., 1998; Brozzetti and Lavecchia, 1994; Calamita and Pizzi, 1994; Pierantoni et al., 2013).
The late Pliocene–Quaternary extensional tectonic phase, characterized by NNW–SSE-striking normal faults, is consistent with the present-day active strain field as deduced by geodetic data (e.g., Anderlini et al., 2016). The latter faults have high dip angles (50–70∘) and can be synthetic or antithetic normal structures (WSW- or ENE-dipping, respectively). These faults were also responsible of the tectono-sedimentary evolution of intra-mountain continental basins (Calamita and Pizzi, 1992; Cavinato and De Celles, 1999). The most evident Quaternary basins of this part of the Apennines are the Castelluccio di Norcia and Norcia basins (Fig. 1), located at 1270 and 700 m a.s.l., here named CNb and Nb, respectively. A phase of lacustrine and fluvial sedimentation infilled both basins with hundreds of meters of deposits, characterized by fine clayey to coarse-grained material (Blumetti et al., 1993; Coltorti and Farabollini, 1995).
The area is affected by frequent moderate-magnitude earthquakes (5<Mw<7) and has a high seismogenic potential revealed by both historical and instrumental data (e.g., Barchi et al., 2000; Boncio and Lavecchia, 2000; Basili et al., 2008; Rovida et al., 2016; DISS Working Group, 2018). The major seismogenic structures recognized in the area are the Norcia fault (Nf) and the M. Vettore fault (Vf). The Norcia fault (Nf; Fig. 1) is associated with several historical events (Galli et al., 2005; Pauselli et al., 2010; Rovida et al., 2016), probably including the 1979 earthquake (Nottoria–Preci fault; Deschamps et al., 1984; Brozzetti and Lavecchia, 1994; Rovida et al., 2016) and the largest event in 1703 (Me=6.8; Rovida et al., 2016). The Vettore fault (Vf) is part of the easternmost alignment whose historical and pre-historical activity was recognized by paleoseismological and shallow geophysical surveys (Galadini and Galli, 2003; Galli et al., 2008, 2018, 2019; Ercoli et al., 2013, 2014; Galadini et al., 2018; Cinti et al., 2019). This system was reactivated during the 2016–2017 sequence, characterized by multi-fault ruptures occurring within a few months (nine M>5 earthquakes at hypocentral depth < 12 km between August 2016 and January 2017) having characteristics comparable to previous seismic sequences in central Italy (e.g., L'Aquila 2009 and Colfiorito 1997–1998, Valoroso et al., 2013; Chiaraluce et al., 2005).
The strongest main shock (Mw 6.5) occurred on 30 October 2016 (Chiaraluce et al., 2017; Chiarabba et al., 2018; Gruppo di Lavoro Sequenza Centro Italia, 2019; Improta et al., 2019; ISIDe working group, 2019), generating up to 2 m (vertical offset) coseismic ruptures (Civico et al., 2018; Gori et al., 2018; Villani et al., 2018a; Brozzetti et al., 2019), mainly localized along the Mt. Vettore fault (thin blue lines in Fig. 1).
Despite the large amount of surface data collected (Livio et al., 2016; Pucci at al., 2017; Wilkinson et al., 2017; De Guidi et al., 2017; Brozzetti et al., 2019), the deep extension of the Norcia and Castelluccio antithetic and synthetic faults (particularly Nf and Vf) as well as the overall complex structure of the area are still debated (Lavecchia et al., 2016; Porreca et al., 2018; Bonini et al., 2019; Cheloni et al., 2018; Improta et al., 2019; Di Giulio et al., 2020) and remain an open question.
We have performed seismic attribute analysis on three W–E-trending 2D seismic reflection data profiles crossing the epicentral area between the Umbria and Marche regions (central Italy; Fig. 1). These seismic profiles are part of a much larger, unpublished dataset including 97 seismic profiles and a few boreholes drilled for hydrocarbon exploration by Ente Nazionale Idrocarburi (ENI) in the period 1970–1998. The data quality is extremely variable (medium to poor) with limited fold (generally <60 traces that are each common midpoints – CMPs), mainly due to environmental and logistical factors. Among the latter, we can list the different acquisition technologies, limited site access, the complex tectonic setting, and especially the different (and contrasting) outcropping lithologies (e.g., Mazzotti et al., 2000; Mirabella et al., 2008). The eastern area, showing higher data quality, consists of siliciclastic units of the Laga foredeep sequence, located at the footwall of the MSt. On the other hand, the lowest SNR recordings coincide with outcropping carbonate formations and Quaternary deposits.
The analyzed lines include seismic reflection profiles NOR01 (stack, 14 km long) and NOR02 (time-migrated, 20 km long, partially parallel to NOR01 on the western sector), located to the west and east of the Nb, respectively, and CAS01 (stack, 16 km long), located further to the south crossing Cascia village (Fig. 1).
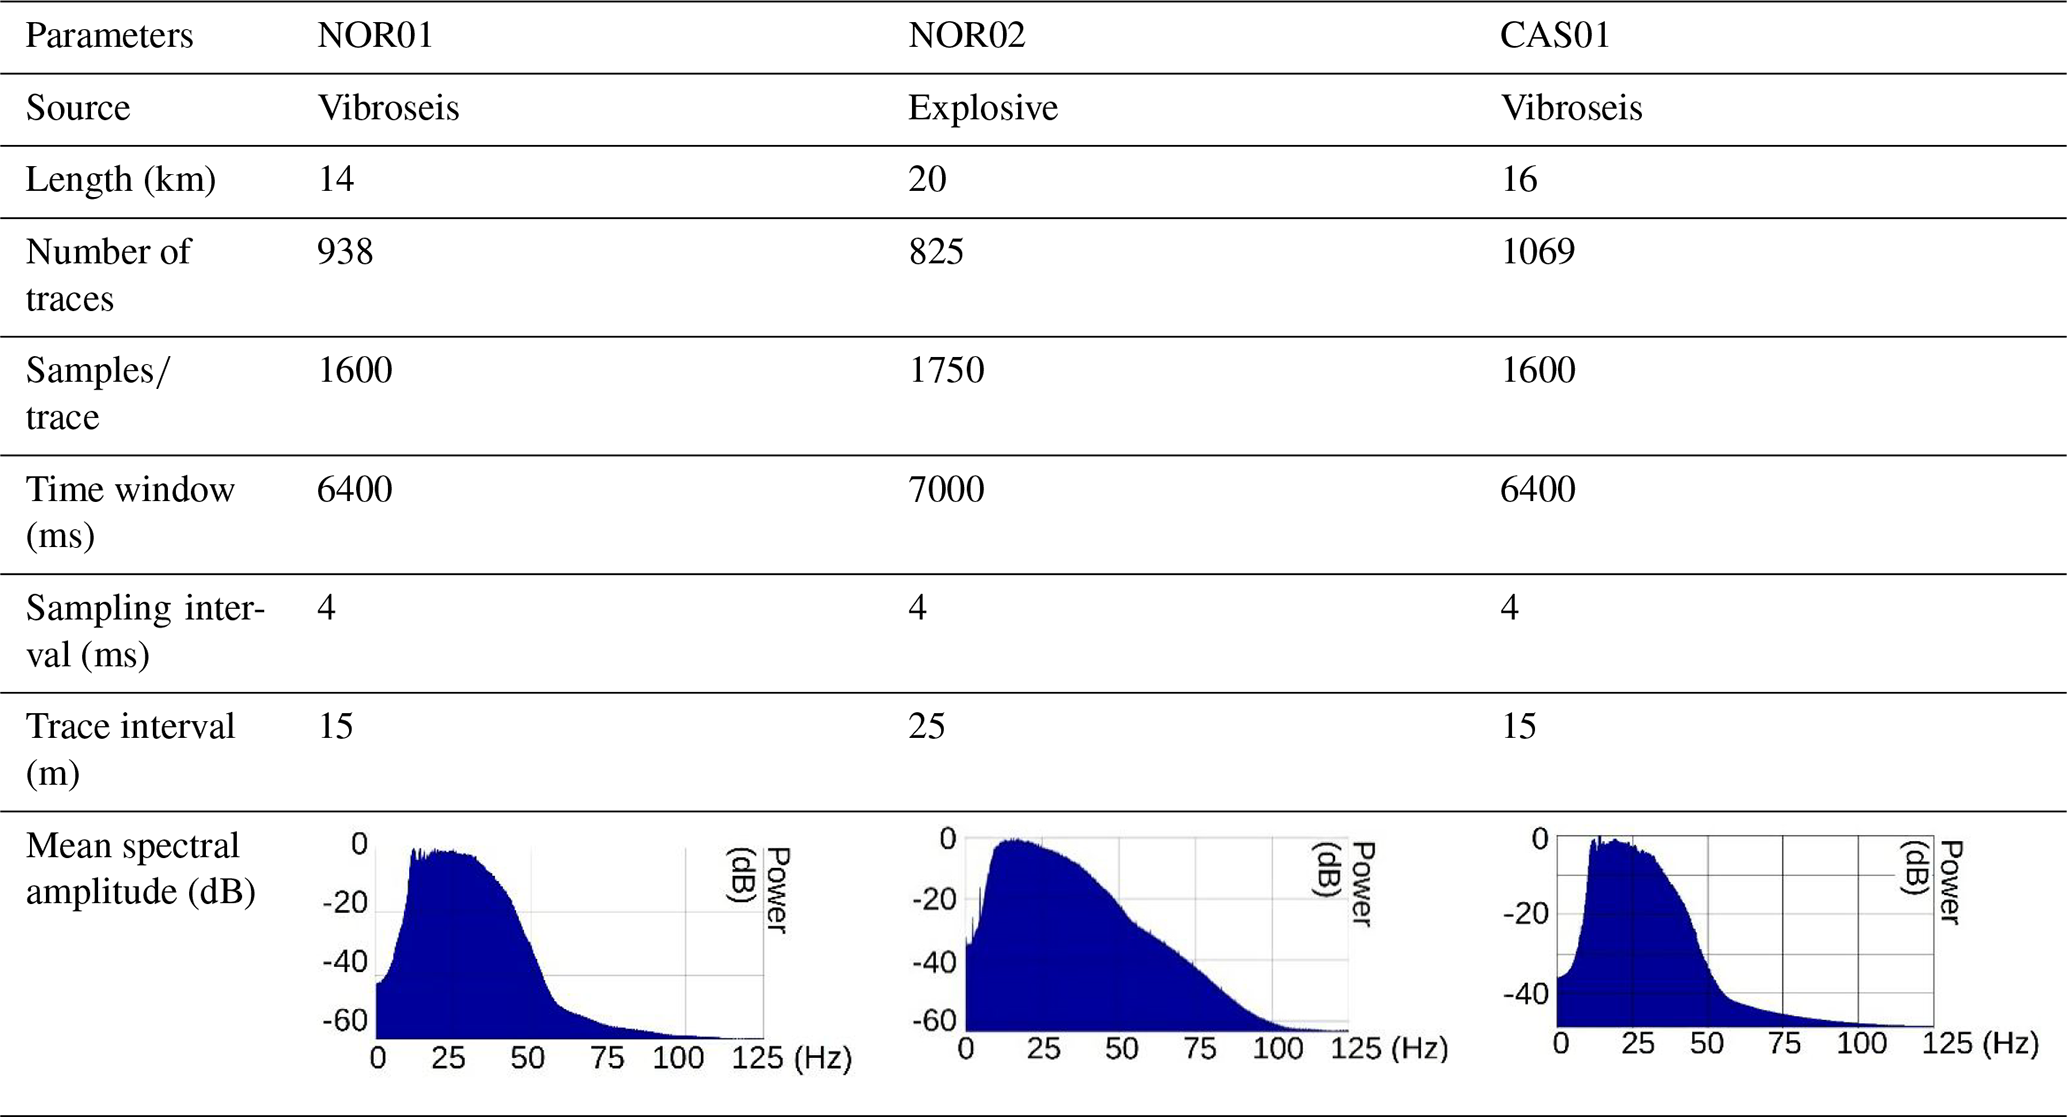
NOR01 and CAS01 were acquired using a vibroseis source, while explosives were used for NOR02; all the lines are displayed in two-way travel time (TWT) limited to 4.5 s. The amplitude–frequency spectra (computed on the entire time window) of the processed lines show a bandwidth in a range of 10–50 Hz, with the NOR02 spectrum displaying a slightly higher-frequency content (Table 1). Assuming an average peak frequency of 20 Hz, a vertical resolution of ca. 80 m can be estimated (using an average carbonate velocity of 6 km s−1; parameters in Table 1). Some processing artifacts are visible in NOR01 as a horizontal signal at ca. 1 s (yellow dashed line and label A in Fig. 2a) and another in CAS01 (Fig. 3a). As suggested in the Introduction, the interpretation could benefit from the application of seismic attributes to the seismic images. However, different sets of parameters need to be tested to achieve relevant improvements. Therefore, we loaded the profiles into the software OpendTect (OdT; https://www.dgbes.com/index.php/software#free, last access: January 2019). A common seismic datum of 500 m was considered for the transect. Unfortunately, deep borehole stratigraphy is not available for the study area (all details about surrounding deep wells have already been summarized in Porreca et al., 2018). The OdT seismic project was also enriched by ancillary data, extracted by a complementary geographic information system (GIS) project (QGis; https://www.qgis.org/it/site/, last access: January 2019). As is visible in Fig. 1, we have included a detailed summary of the main normal faults and surface ruptures of the area (Civico et al., 2018; Villani et al., 2018a; Brozzetti et al., 2019), obtained after carefully checking the most important regional geological maps and fault patterns (Koopman, 1983; Centamore et al., 1993; Pierantoni et al., 2013; Carta Geologica Regionale 1:10 000 – Regione Marche, 2014; Carta Geologica Regionale 1:10 000 – Regione Umbria, 2016; Ithaca database, http://www.isprambiente.gov.it/it/progetti/suolo-e-territorio-1/ithaca-catalogo-delle-faglie-capaci, last access: January 2019), as well as the most recent works published in the literature (e.g., Brozzetti et al., 2019; Porreca et al., 2020). The topography was also included using a regional 10 m resolution digital elevation model (DEM) database (Tarquini et al., 2007, 2012). The other important external dataset consists of seismological data, i.e., the inferred location and approximated fault geometry as suggested by the focal mechanisms of the main shocks and by the distribution of the aftershocks (Iside database; http://iside.rm.ingv.it/iside/ (last access: January 2019); Chiaraluce et al., 2017). The integration of such information in a pseudo-3D environment offered us a multidisciplinary platform to clearly display the seismic lines and establish links between surface data and the interpreted deep geologic structures located at hypocentral depths.
Table 1List of some parameters extracted from SEG-Y headers and the three mean frequency spectra of the three seismic lines. An approximate vertical resolution equal to 75 m has been estimated using v=6 km s−1.
Seismic reflection data interpretation is generally accomplished by correlating specific signal characteristics (seismic signature) with the different geological domains identified within the study area. A standard seismic interpretation is affected by a certain degree of uncertainty and/or subjectivity (particularly in the case of poor data quality) because it is generally based on a qualitative analysis of the amplitude, geometry, and lateral continuity of the reflections. Over the last years, the introduction of seismic attributes and related automated–semiautomated procedures has had an important role in reducing the subjectivity of seismic interpretations and achieving quantitative results. A seismic attribute is a descriptive and quantifiable parameter that can be calculated on a single trace, on multiple traces, or 3D volumes and can be displayed at the same scale as the original data. Seismic data can therefore be considered a composition of constituent attributes (Barnes, 2000; Taner et al., 1979; Forte et al., 2012). Their benefits were first appreciated in 2D and 3D seismic reflection data (Barnes, 1996, 2000; Taner et al., 1979; Chen and Sidney, 1997; Taner, 2001; Chopra and Marfurt, 2007, 2008; Iacopini and Butler, 2011; Iacopini et al., 2012; McArdle et al., 2014; Botter et al., 2014; Hale, 2013, for a review; Marfurt and Alves, 2015; Forte et al., 2016) and, more recently, have also been appreciated in other subsurface imaging techniques like ground-penetrating radar (e.g., McClymont et al., 2008; Forte et al., 2012; Ercoli et al., 2015; Lima et al., 2018). In this work, we have tested several post-stack attributes on three 2D vintage seismic lines (original seismic data in the Supplement in Fig. S1). We started our analysis by first using well-known and widely used attributes like instantaneous amplitude, phase, frequency, and their combinations. We also used composite multi-attribute displays (i.e., simultaneous overlay and display of different attributes, e.g., primarily phase, frequency, envelope; Chopra and Marfurt, 2005, 2011). Later on, we also tested other attributes like coherency and similarity, which are generally more efficient on 3D volumes. These did not result in positive outcomes due to the limited vertical and lateral resolution of our legacy data. Among the tested attributes, we selected three that resulted in the best images (provided in Figs. S2, S3, and S4 of the Supplement, without any line drawing or labels), aiding the detection of peculiar seismic signatures related to regional seismogenic layers and fault zones. The attributes, computed using OdT software, are the following.
-
Energy (EN). One of the root mean square (RMS) amplitude-based attributes, it is defined as the ratio between the squared sum of the sample amplitude values in a specified time gate and the number of samples in the gate (Taner, 1979; Gersztenkorn and Marfurt, 1999; Chopra and Marfurt, 2005, 2007; for a review of formulas see Appendix A in Forte et al., 2012). The energy measures the reflectivity in a specified time gate, so the higher the energy, the higher the reflection amplitude. In comparison to the original seismic amplitude, it is independent of the polarity of the seismic data, being always positive and in turn preventing the zero-crossing problems of the seismic amplitude (Forte et al., 2012; Ercoli et al., 2015; Lima et al., 2018; Zhao et al., 2018). This attribute is useful to emphasize the most reflective zones (e.g., characterization of the acoustic properties of rocks). It may also enhance sharp lateral variations in seismic reflectors, highlighting discontinuities like fractures and faults. In this work, we decided to use a 20 ms time window (i.e., close to the average wavelet length), obtaining considerable improvements in the visualization of higher acoustic impedance contrasts.
-
Energy gradient (EG). It is the first derivative of the energy with respect to time (or depth). The algorithm calculates the derivative in moving windows and returns the variation of the calculated energy as a function of time or depth (Chopra and Marfurt, 2007; Forte et al., 2012). It is a simple and robust attribute, also useful for a detailed semiautomatic mapping of horizons with a relatively low level of subjectivity. The attribute acts as an edge detection tool. It is effective in the mapping of reflection patterns as well as the continuity of both steep discontinuities, like faults and fractures, and channels, particularly in slices of 3D data (Chopra and Marfurt, 2007). In this work, we have selected a time window of 20 ms. We have obtained considerable improvements in the visualization not only of the strong acoustic impedance reflectors, but also particularly in the signature of faults imaged in the shallowest part of the seismic sections.
-
Pseudo-relief (PR). It is obtained in two steps: the energy attribute is first computed in a short time window, followed by the Hilbert transform (phase rotation of −90∘). The pseudo-relief is considered very useful in 2D seismic interpretation to generate “outcrop-like” images. It allows for an easier detection of both faults and horizons (Bulhões, 1999; Barnes et al., 2011; Vernengo et al., 2017; Lima et al., 2018). In this work, considerable improvements have been obtained by computing the pseudo-relief using a window length of 20 ms. In comparison to the standard-amplitude image, it highlights the reflection patterns and thus the continuity or discontinuity of reflectors, enhancing steep discontinuities and fault zones.
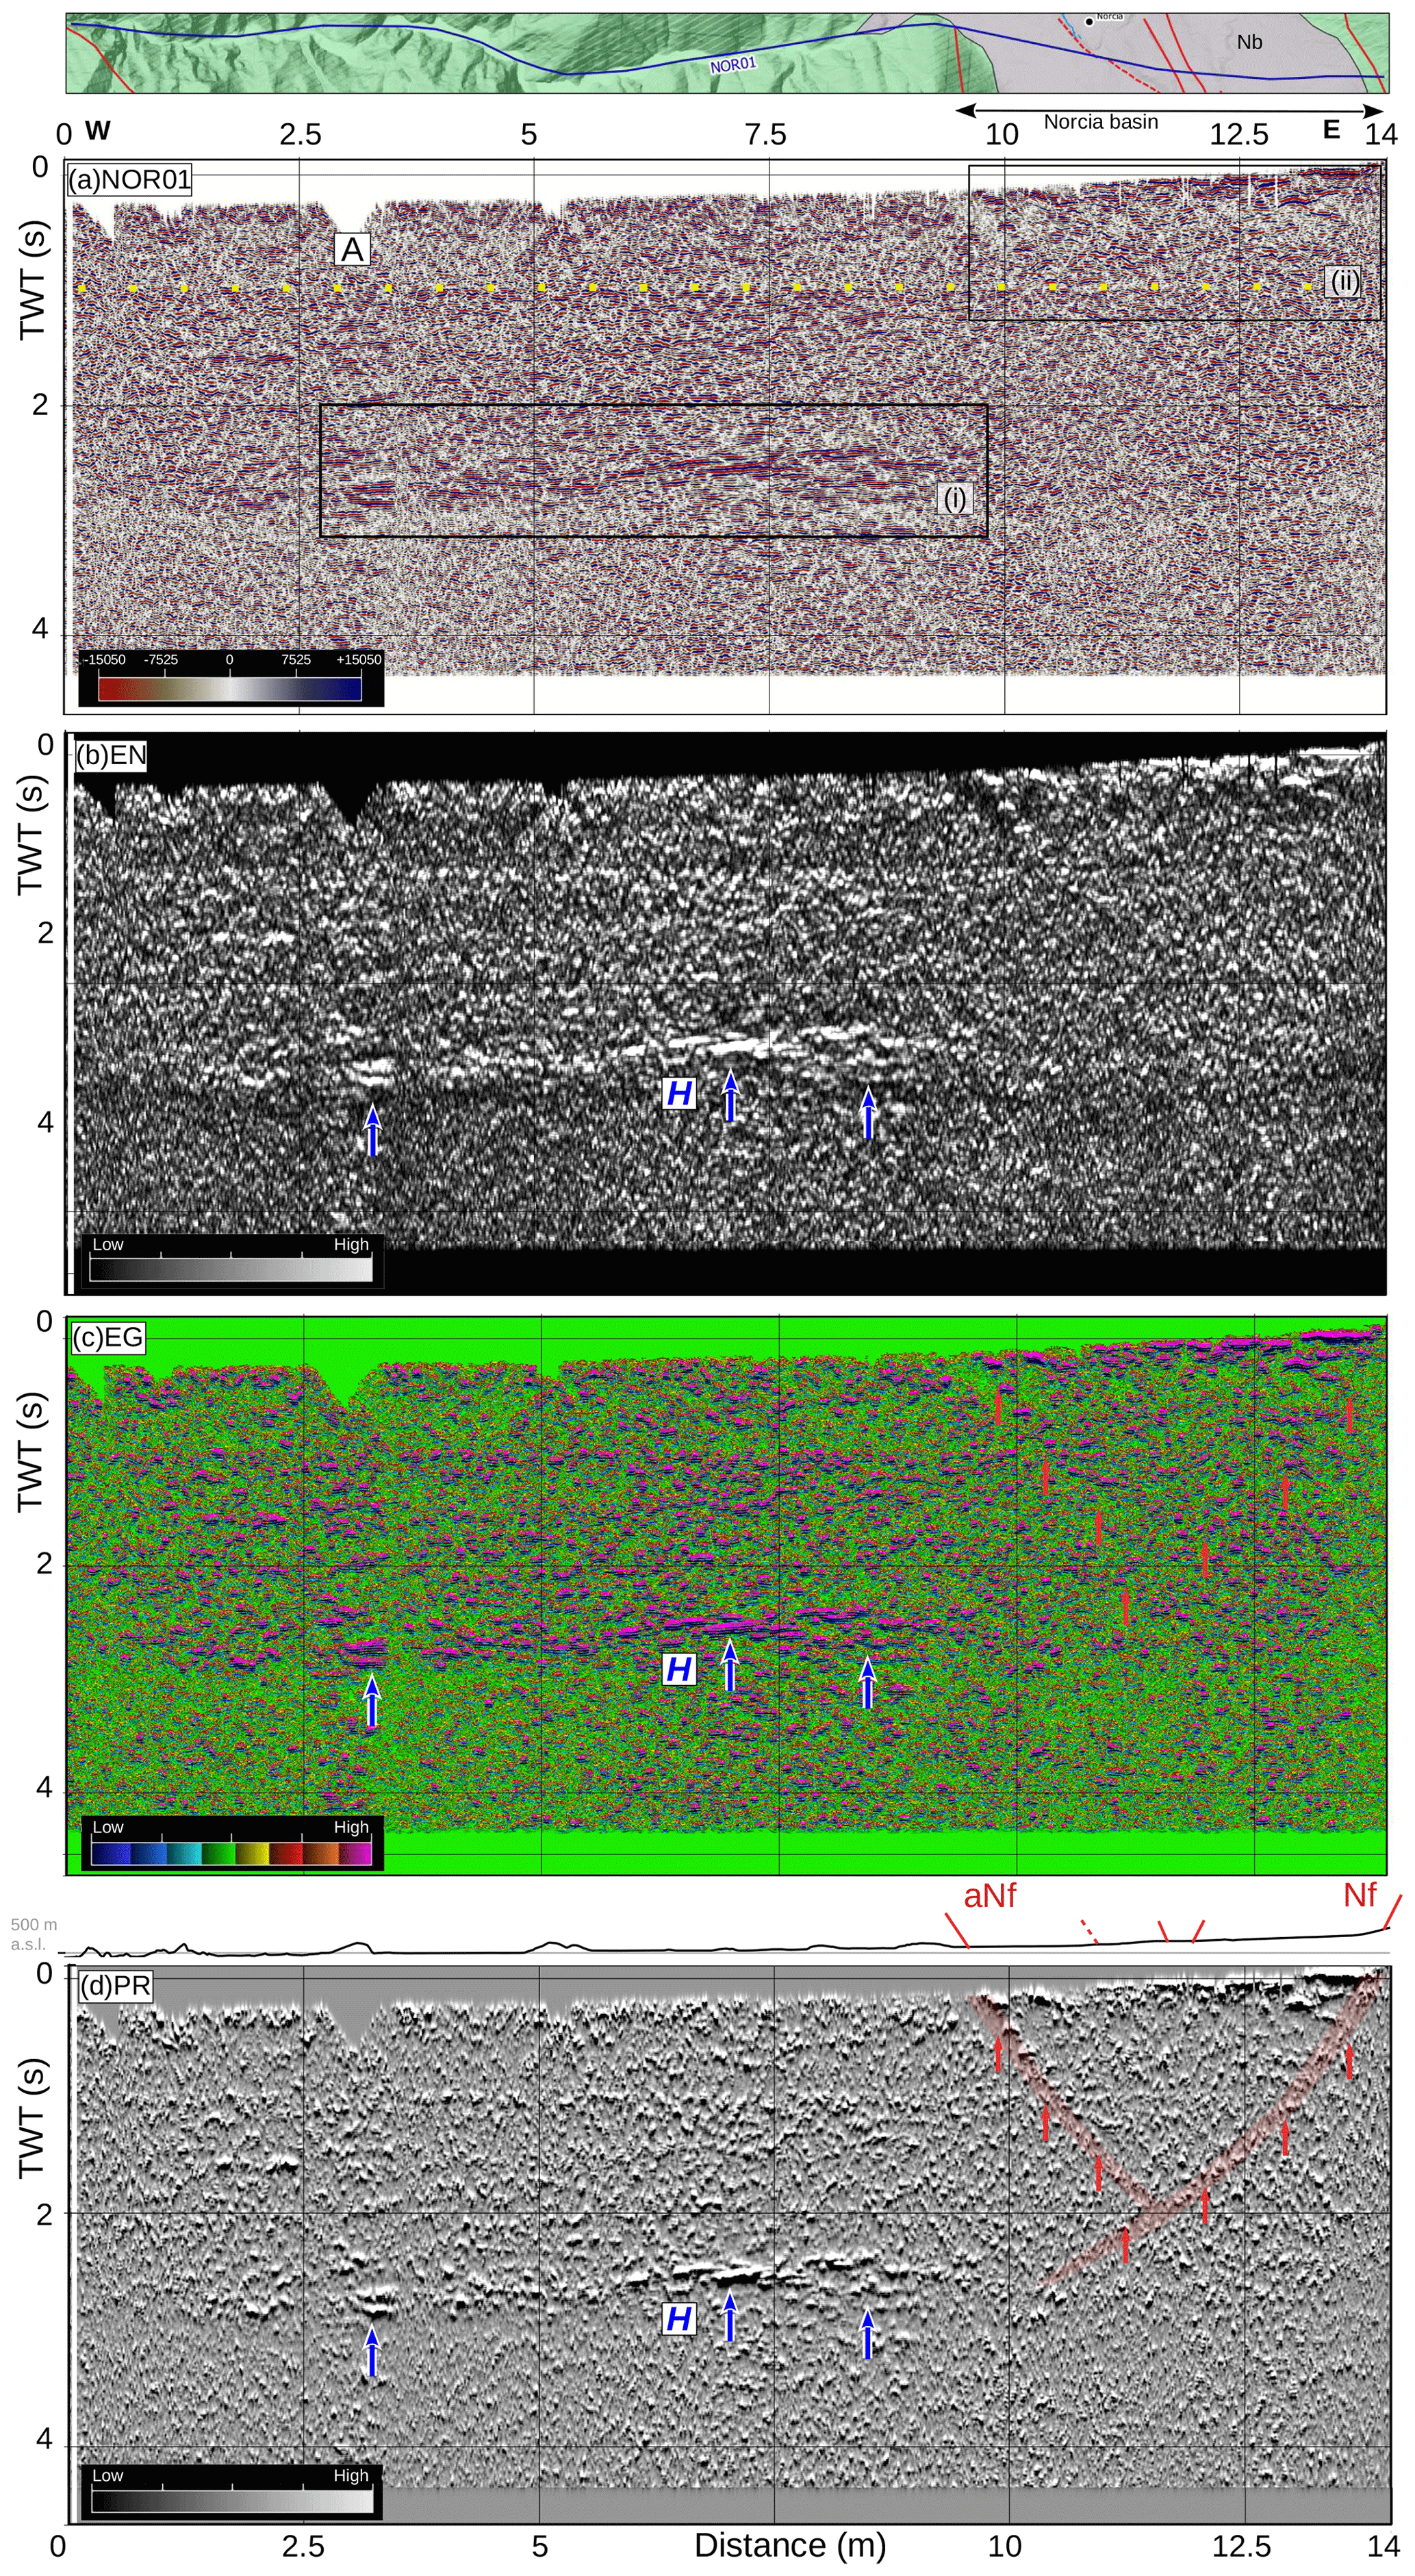
Figure 2Conventional stack image of the NOR01 transect; (a) image generated by a conventional seismic reflection amplitude line (no attributes applied). The standard-amplitude image refers to this conventional processing flow. The top inset depicts the main faults mapped at the surface. “A” underlines a processing artifact. Boxes (i) and (ii) indicate the clearest reflectors; (b) energy attribute enhancing strong reflectivity contrasts (H); (c) energy gradient, improving the detection of dipping alignments and the continuity of reflectors; (d) pseudo-relief attribute that enhances the reflection patterns cross-cut by steep discontinuities. Nf: Norcia fault, aNf: antithetic Norcia fault at surface, yellow dots: A, blue arrows: H, red arrows: indication of the main lineaments and areas with major discontinuities; features are highlighted by the attributes.
Figures 2, 3, and 4 show the comparison between the original seismic lines in amplitude and the images obtained after the attribute analysis, revealing significant improvements in the visualization and interpretability of the geophysical features. In profiles NOR01, CAS01, and NOR02 we focus our analysis on three types of geophysical features highlighted by the attributes: subhorizontal deep reflectors, low-angle discontinuities, and high-angle discontinuities. The main faults known at the surface (Fig. 1) have also been plotted on top of each seismic line.
In the original seismic line NOR01 (Fig. 2a), the overall low SNR hampers the detection of clear and continuous reflectors. At ca. 1 s, a horizontal processing artifact is visible (label A, yellow dots), possibly related to a windowed filter. The most prominent subhorizontal reflections (labeled H) are located in the central portion between 2 and 3 s (TWT) (strong reflectors in black box i). Shallower and less continuous reflectors are also visible in the eastern side of the profile, beneath the Nb (black box ii). The EN attribute (Fig. 2b) enhances the reflectivity contrast, better focusing the high-amplitude, gently W-dipping reflector H (blue arrows) and also outlining its lateral extension. In this image most of the reflected energy is concentrated on its top at ca. 2.5 s; it is readily apparent that H separates two seismic facies, with a higher-amplitude (top) and lower-amplitude (bottom) response, respectively. The EG and PR attributes of NOR01 (Fig. 2c, d) better display the geometry of horizon H, characterized by a continuous, ca. 8 km long package of reflectors (ca. 200 ms thick) having common characteristics in terms of reflection strength and period. In the eastern part of the profile, below the Nb, the EG and PR attributes also enhance two major opposite-dipping high-angle geophysical features (red arrows in Fig. 2c and d), crossing and disrupting the shallower reflectors. The W-dipping lineament propagates down to ca. 2.5 s, intercepting the eastern termination of the reflector H. The two discontinuities define a relatively transparent, shallow seismic facies, corresponding to the area where the Nb outcrops. In the same sector, the reflectors are pervasively disrupted by many other minor discontinuities.
The original seismic reflection line CAS01 (Fig. 3a) displays a generalized high-frequency noise content. As in NOR01, a shallow processing artifact (A, yellow dots) is visible and possibly related to the application of a windowed filter. Fragmented packages of high-amplitude reflectors (H) are visible at the same time interval observed in NOR01 (ca. 2.5 s) in both the western (black box i; Fig. 3a) and, more discontinuously, in the eastern part of the line (black box ii; Fig. 3a). The EN attribute (Fig. 3b) emphasizes the presence of the H reflector, better focusing its reflectivity (blue arrows). Both the EG and PR attributes (Fig. 3c and d) further help to delineate the reflector H. The steeper discontinuities have been analyzed mainly in the western part of the profile, closer to the 2016–2017 seismically active area. A major high-angle, east-dipping discontinuity has been traced at about 13 km (alignment of red arrows in Fig. 3c and d).
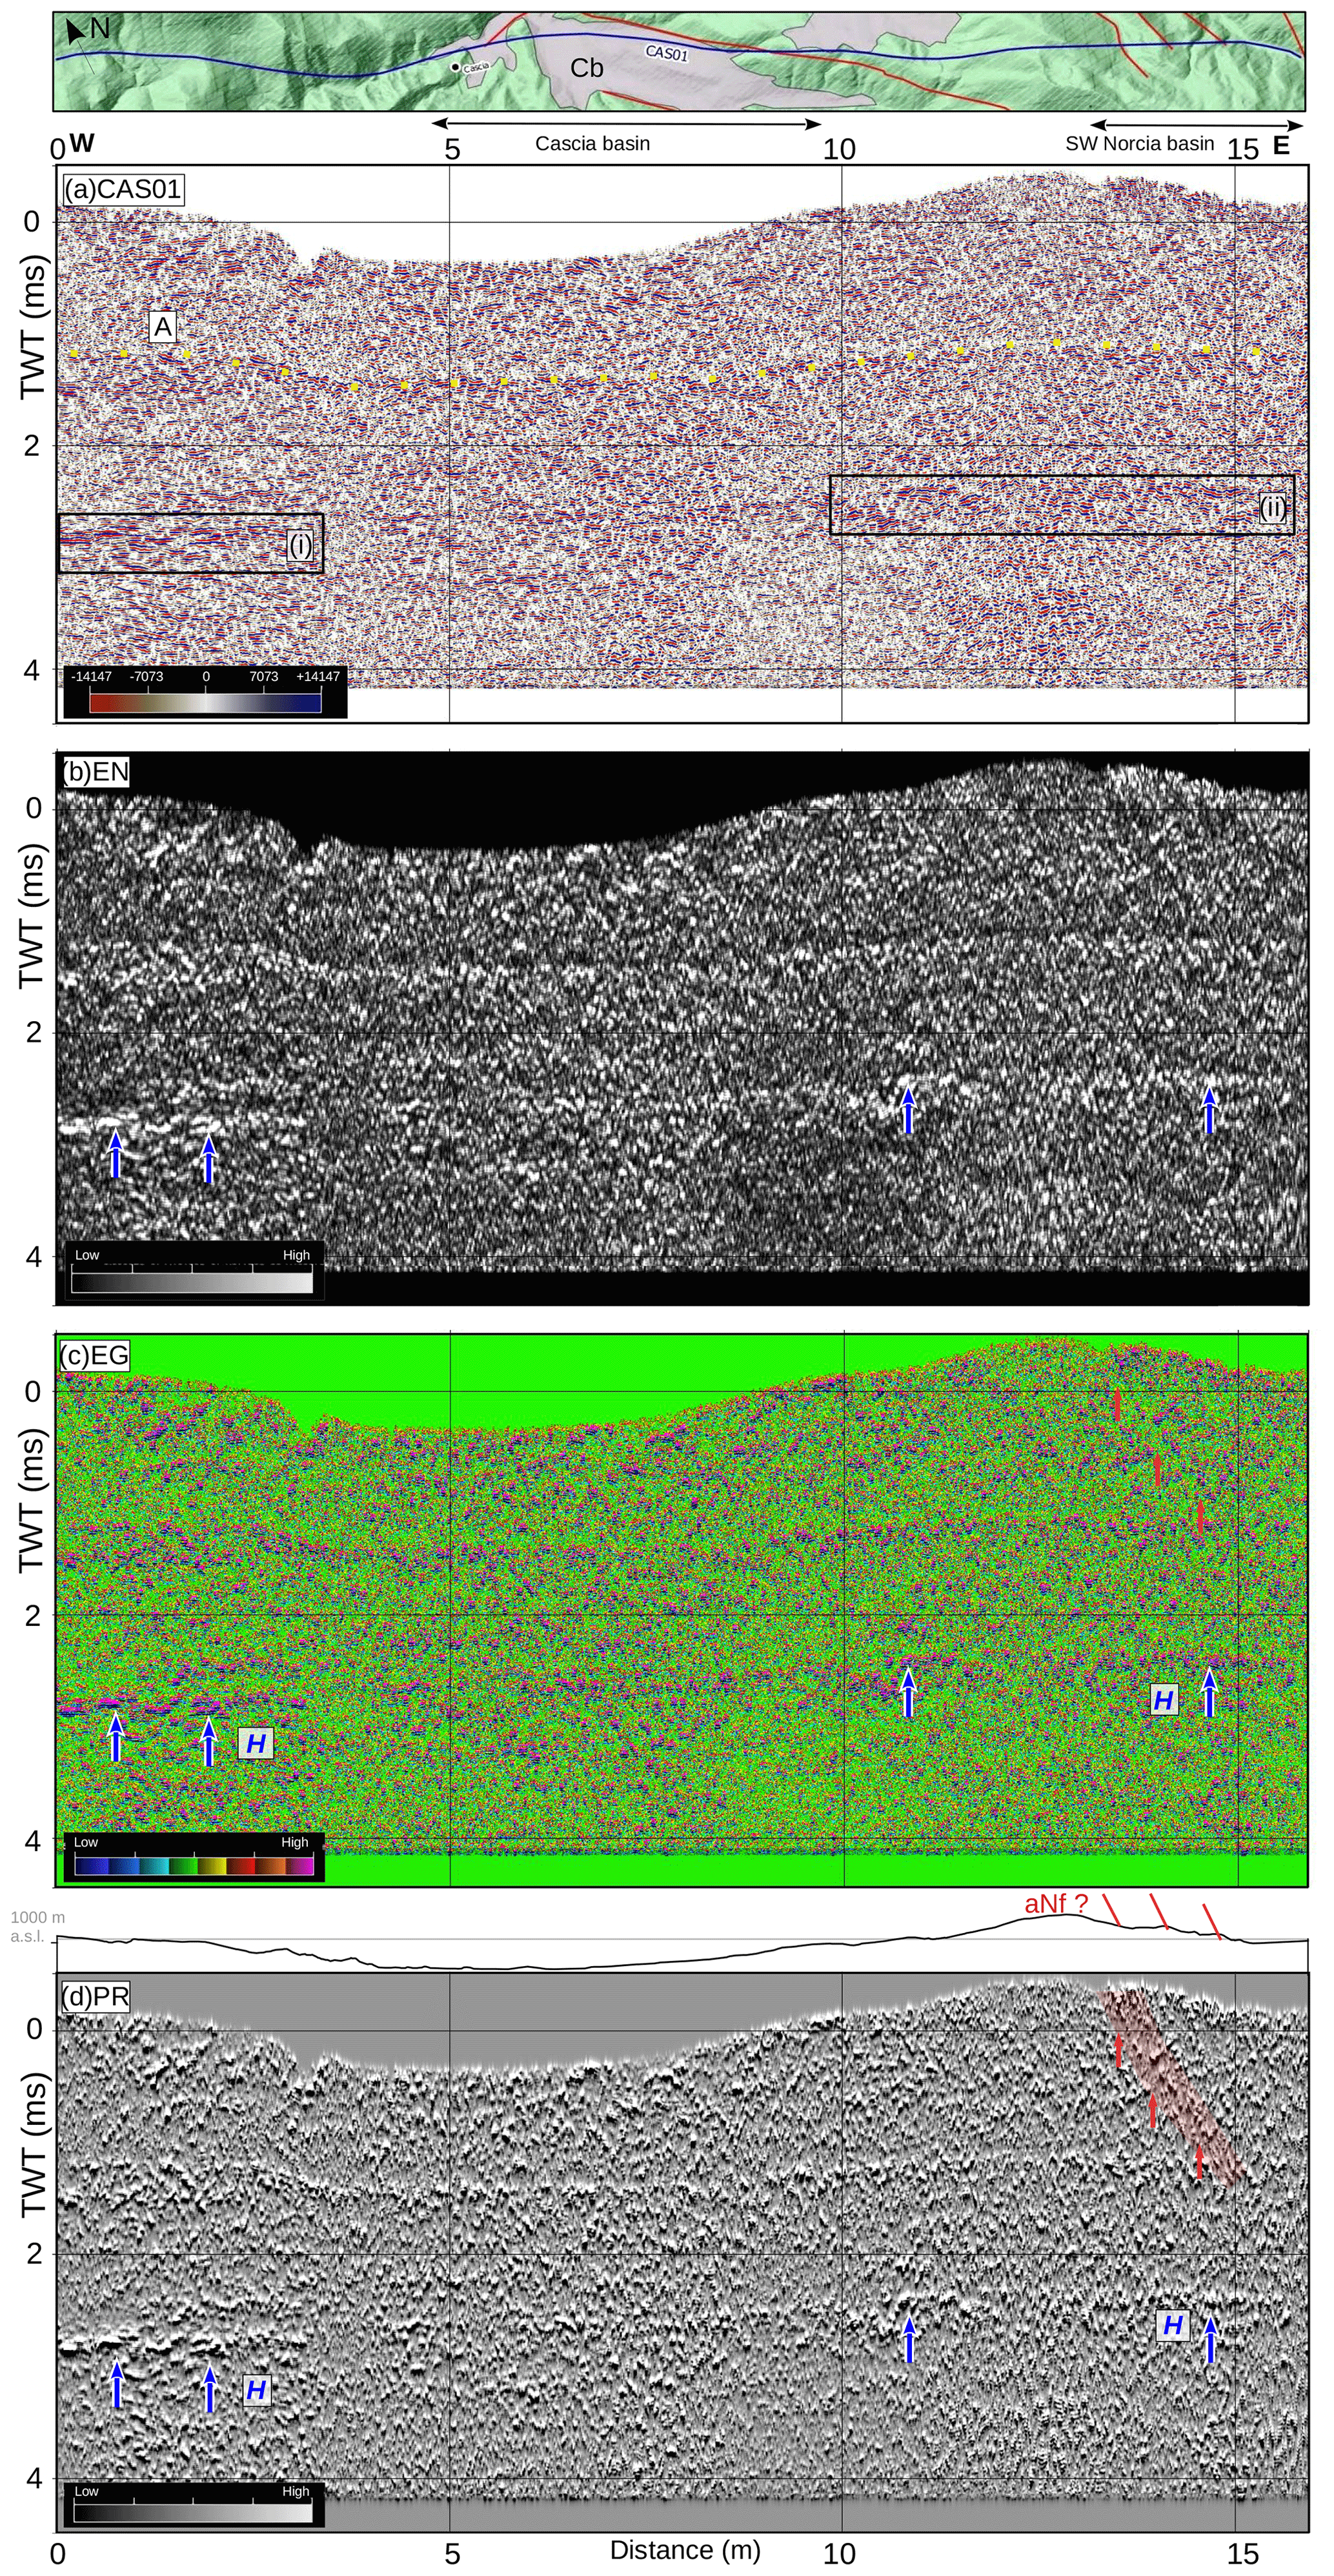
Figure 3Conventional stack image of CAS01: (a) standard reflection amplitude image line. The top insert emphasizes the main faults mapped at the surface. The label A indicates a processing artifact. Boxes (i) and (ii) indicate the main visible reflectors; (b) energy attribute image; (c) energy gradient attribute image; (d) pseudo-relief image, showing the strong regional reflector H. A high-angle discontinuity on the western margin corresponds to the southern extension of aNf inferred at the surface – aNf: antithetic Norcia fault map at the surface, yellow dots: A, blue arrows: H. The red arrows emphasize the main lineaments and main signal discontinuities enhanced by the attribute's analysis.
The original seismic line NOR02 (Fig. 4a) displays geophysical features similar to the ones detected in NOR01 and CAS01. This seismic profile shows a generalized poor or limited lateral continuity of the reflectors, with the exception of the eastern side. In this sector, a set of west-dipping coherent reflections can be recognized: the higher SNR correlates with the outcropping turbidites of the Laga sequence, which are known to favor the seismic energy penetration and reflection in comparison to carbonates (e.g., Bally et al., 1986; Barchi et al., 1998). The prominent reflection H, gently east-dipping and relatively continuous for more than 8 km (black box in Fig. 4a), is located in the center of the line at a greater depth (3.2–3.5 s TWT) with respect to the previously described NOR01 and CAS01 profiles. As in the previous cases, the EN attribute (Fig. 4b) effectively focuses the reflectivity of the horizons, emphasizing the high amplitude of the reflector H (blue arrows). The EG and PR attributes (Fig. 4c and d) improve the overall visualization of the reflection patterns, aiding the detection of the low-angle and high-angle discontinuities. A major westward low-angle discontinuity T (green dots in Fig. 4c and d) crosses the entire profile, descending from ca. 2 s (east) to ca. 4 s (west), where it intersects the reflector H. Several high-angle discontinuities have been traced along the section, marked by the alignments of red arrows in Fig. 4c and d. The most relevant alignments have been recognized beneath the two major Quaternary basins (i.e., Nb and CNb) crossed by the profile: in both cases, major W-dipping alignments can be traced from the near surface, where they correspond to the eastern border of the abovementioned basins, down to a depth of ca. 4 s TWT. Other discontinuities, W- and E-dipping, have been traced in the hanging wall of these two major alignments. In the seismic line sector bounded by these features, many secondary (minor) discontinuities pervasively cross-cut the set of reflectors, producing a densely fragmented pattern. Unfortunately, the limited resolution and data quality in the deeper part of the section hampers an univocal interpretation of the cross-cutting relationships between the low-angle discontinuity T and the W-dipping high-angle discontinuity: two alternative interpretations are possible, which will be discussed in detail in Sect. 6.
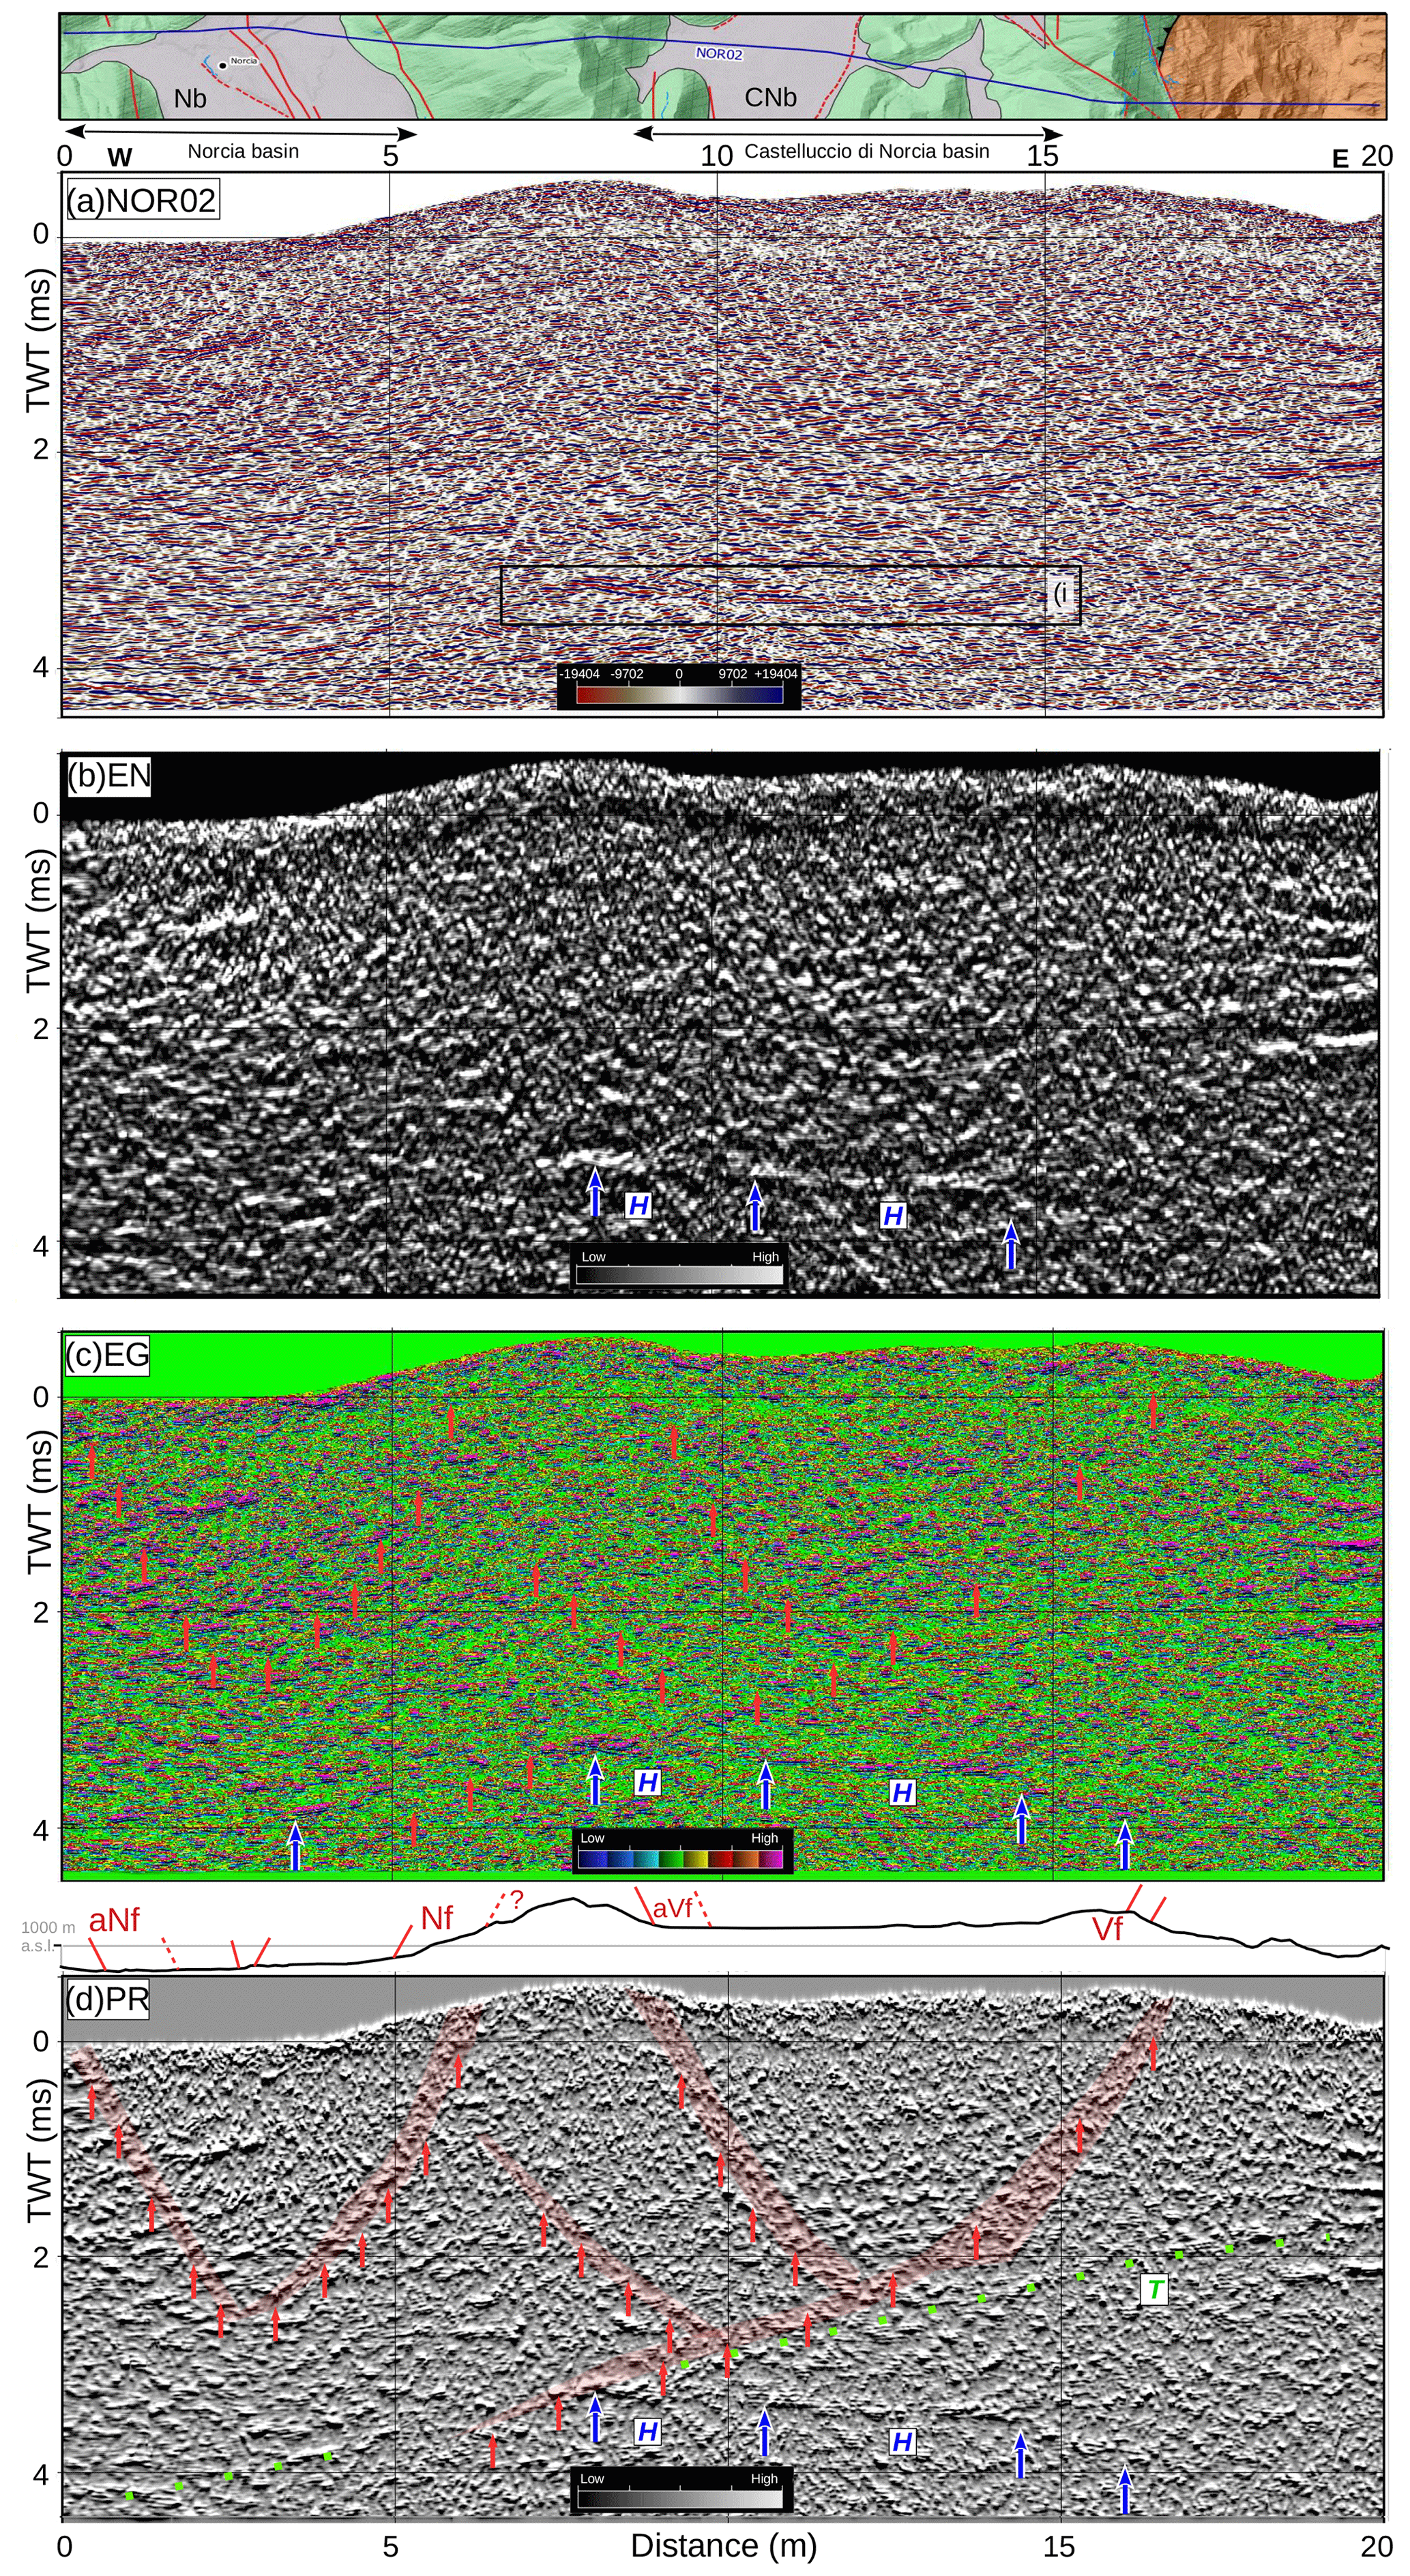
Figure 4Time-migrated image of the NOR02 profile; (a) standard reflection amplitude image of the profile. The inset indicates the main faults mapped at the surface; box (i) points out the most visible reflector. (b) Energy attribute image displaying the reflector H and a possible low-angle discontinuity (T); (c) energy gradient attribute image, showing the main lineaments detected; (d) pseudo-relief attribute image, improving the continuity or discontinuity of the reflectors and the display of the areas with main signal discontinuities (red polygon) after the attribute computation. Nf: Norcia fault, aNf: antithetic Norcia fault, Vf: Mt. Vettore fault, aVf: antithetic Mt. Vettore fault at the surface, yellow dots: A, blue arrows: H, green dots: T, red arrows: indication of the main lineaments.
The global improvement in the dataset interpretability can be better appreciated in a 3D visualization of the seismic attributes, also using multi-attribute displays (Fig. 5). Such images reveal the deep geometry of the main reflectors and the location of the geophysical discontinuities, later interpreted in light of known and debated tectonic structures on the study area. In Fig. 5a we report a 3D perspective of the seismic line NOR02, after combining the EN attribute with the PR attribute (EN+PR) in a transparency plot. The reflector characteristics and a pattern of discontinuities are clearly visible at different levels of detail, and a link with the faults at the surface is again proposed (red segments on the top). The two boxes (blue and black in Fig. 5a, respectively) point out the most representative seismic facies described above. Figure 5b and c display a comparison of the signature of reflector H in the standard-amplitude image line (SA) (Fig. 5b) and in a version including the PR attribute in a transparency plot with SA. Again, in the inserts in Fig. 5d and e, an analogous data comparison shows the scarce detectability of the dense pattern of steep discontinuities in the original seismic profile. Figure 5e displays the enhancement obtained by plotting the PR attribute plus SA in a transparency plot; this image greatly improves the visualization of the fragmentation of the reflectors.
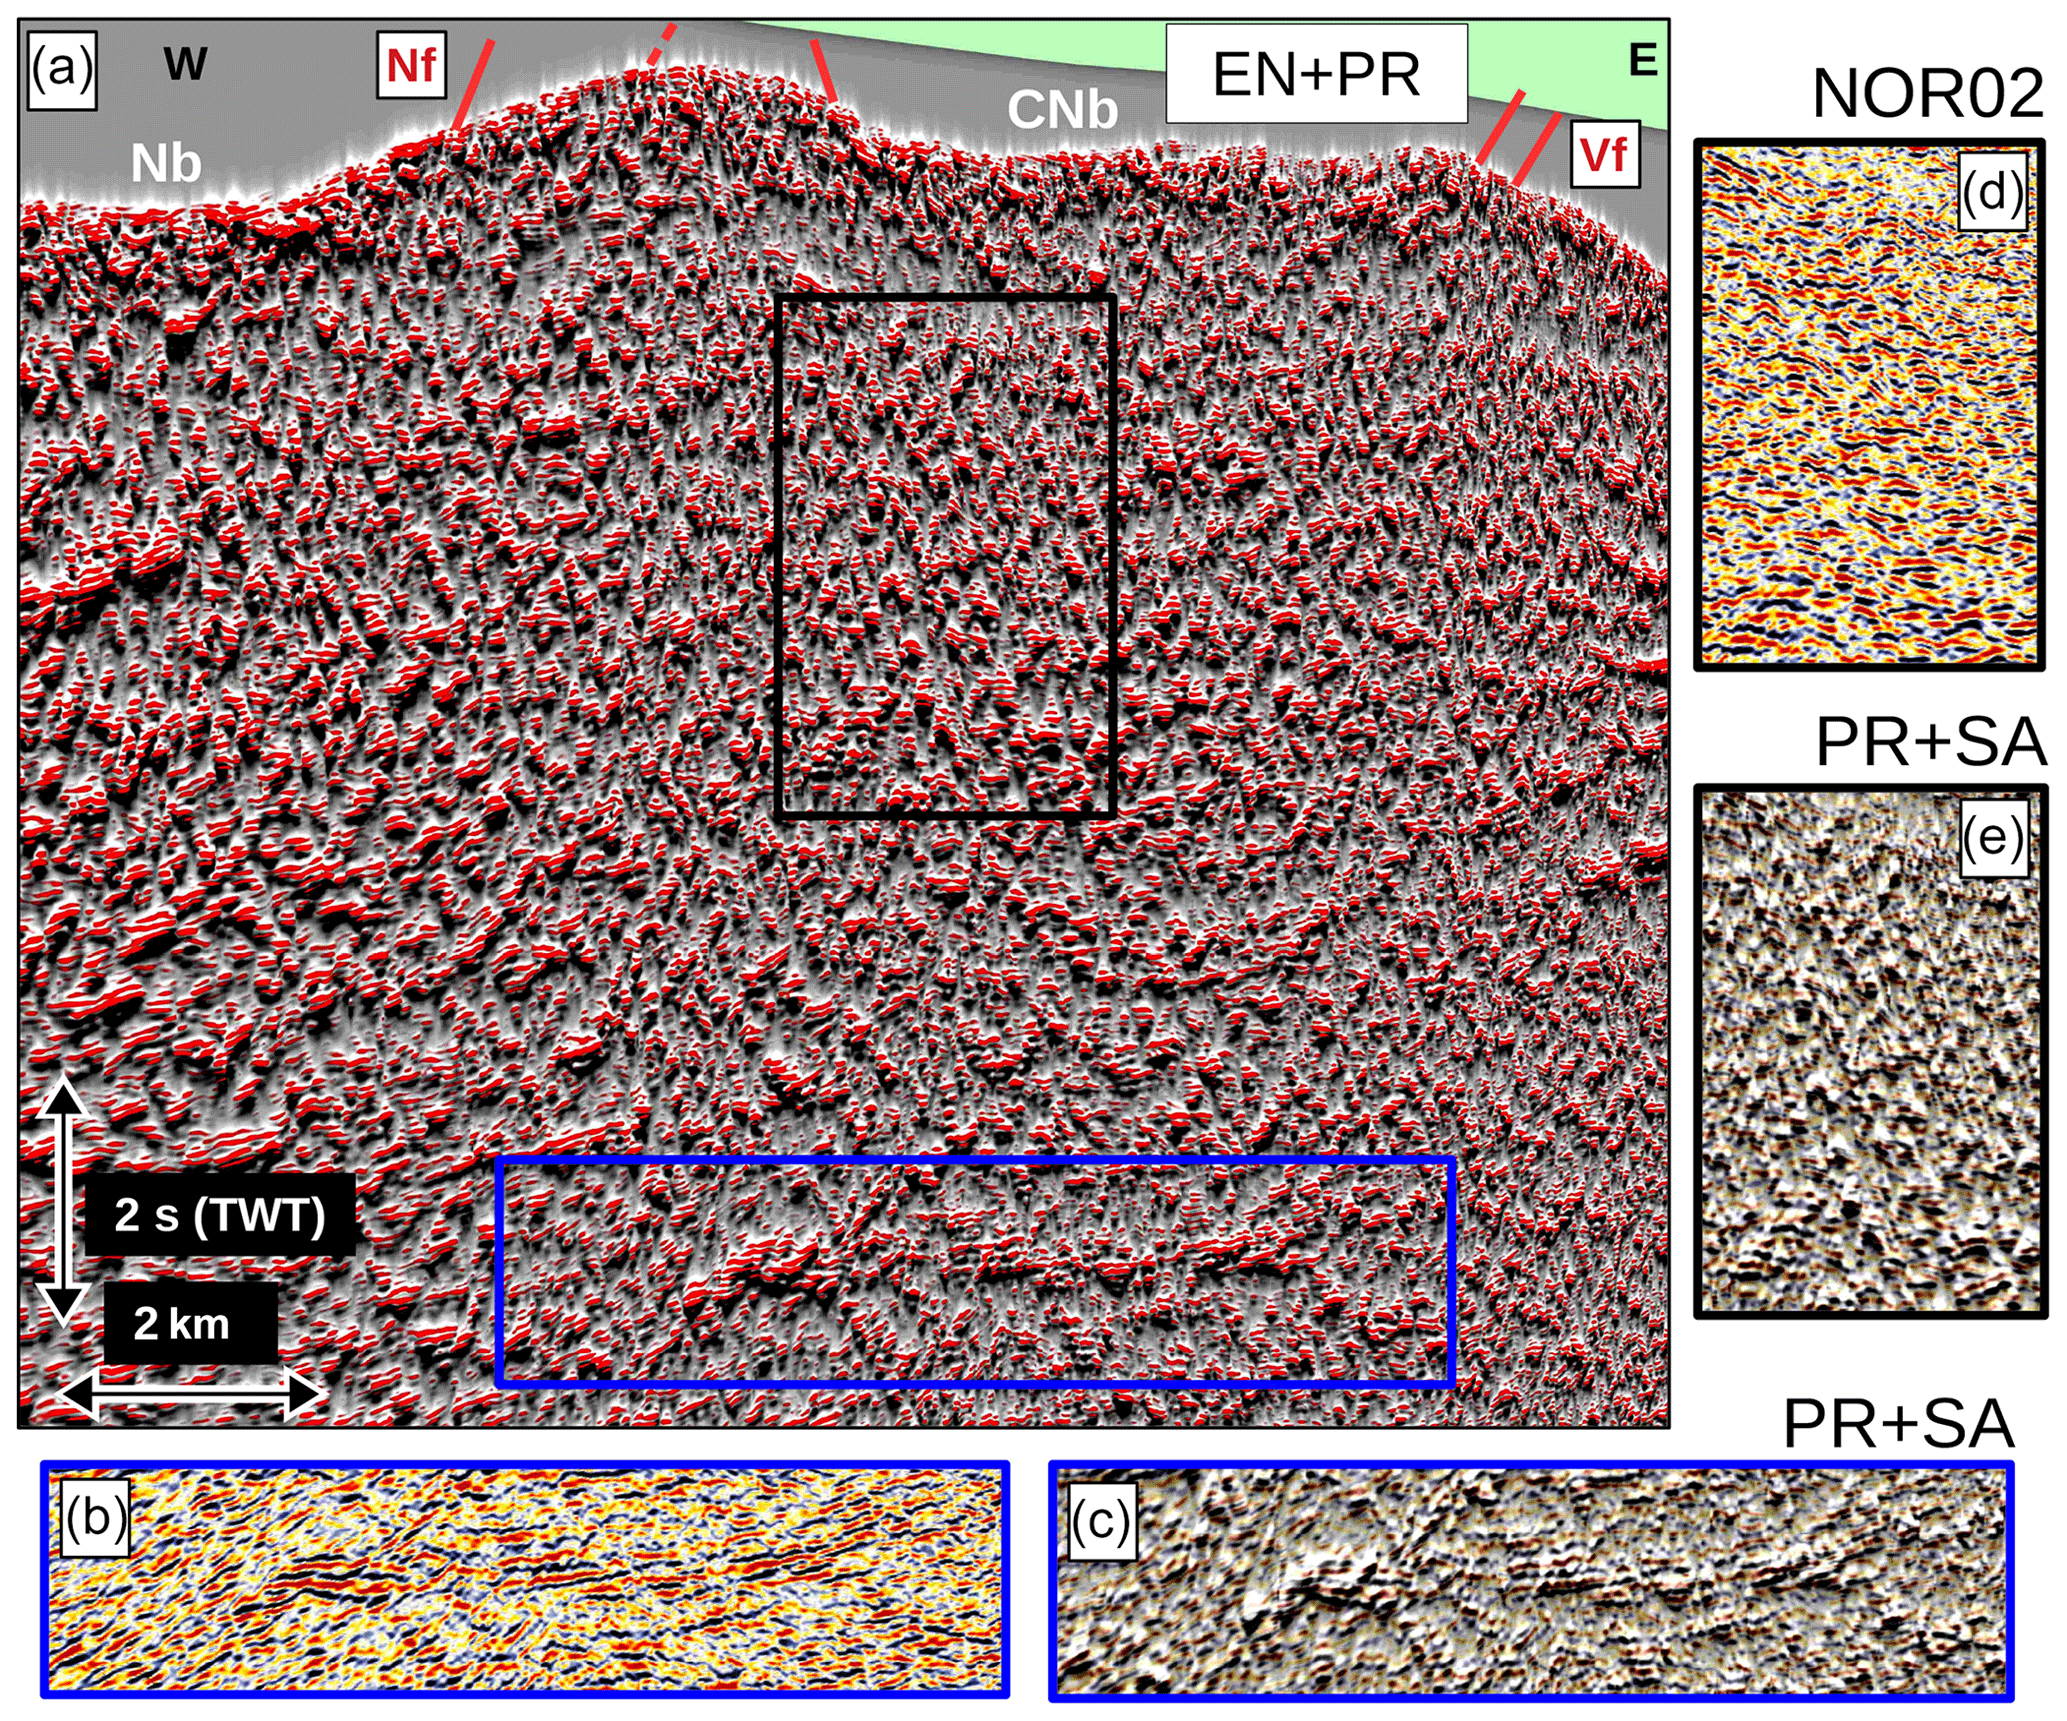
Figure 5Composite multi-attribute display of NOR02, showing the position of the main faults at the surface in relation to their deep seismic attribute signature. (a) Energy+pseudo-relief attributes; the seismic facies in the blue box is compared with the original amplitude image of the transect. (b) Energy+pseudo-relief (c) for comparison; the same plot for the black box is reported in (d) and (e) (original line and pseudo-relief+standard amplitude, respectively).
An analogous 3D multi-display of attributes EN and PR is proposed in Fig. 6a for the seismic line NOR01. The comparison between the original line (blue box in Fig. 6b) and EN+PR (Fig. 6c) shows the improved and peculiar signature of the strong reflector H. The black box again reports the original plot vs. PR+SA, which clearly boosts the visualization of the high-angle discontinuities.
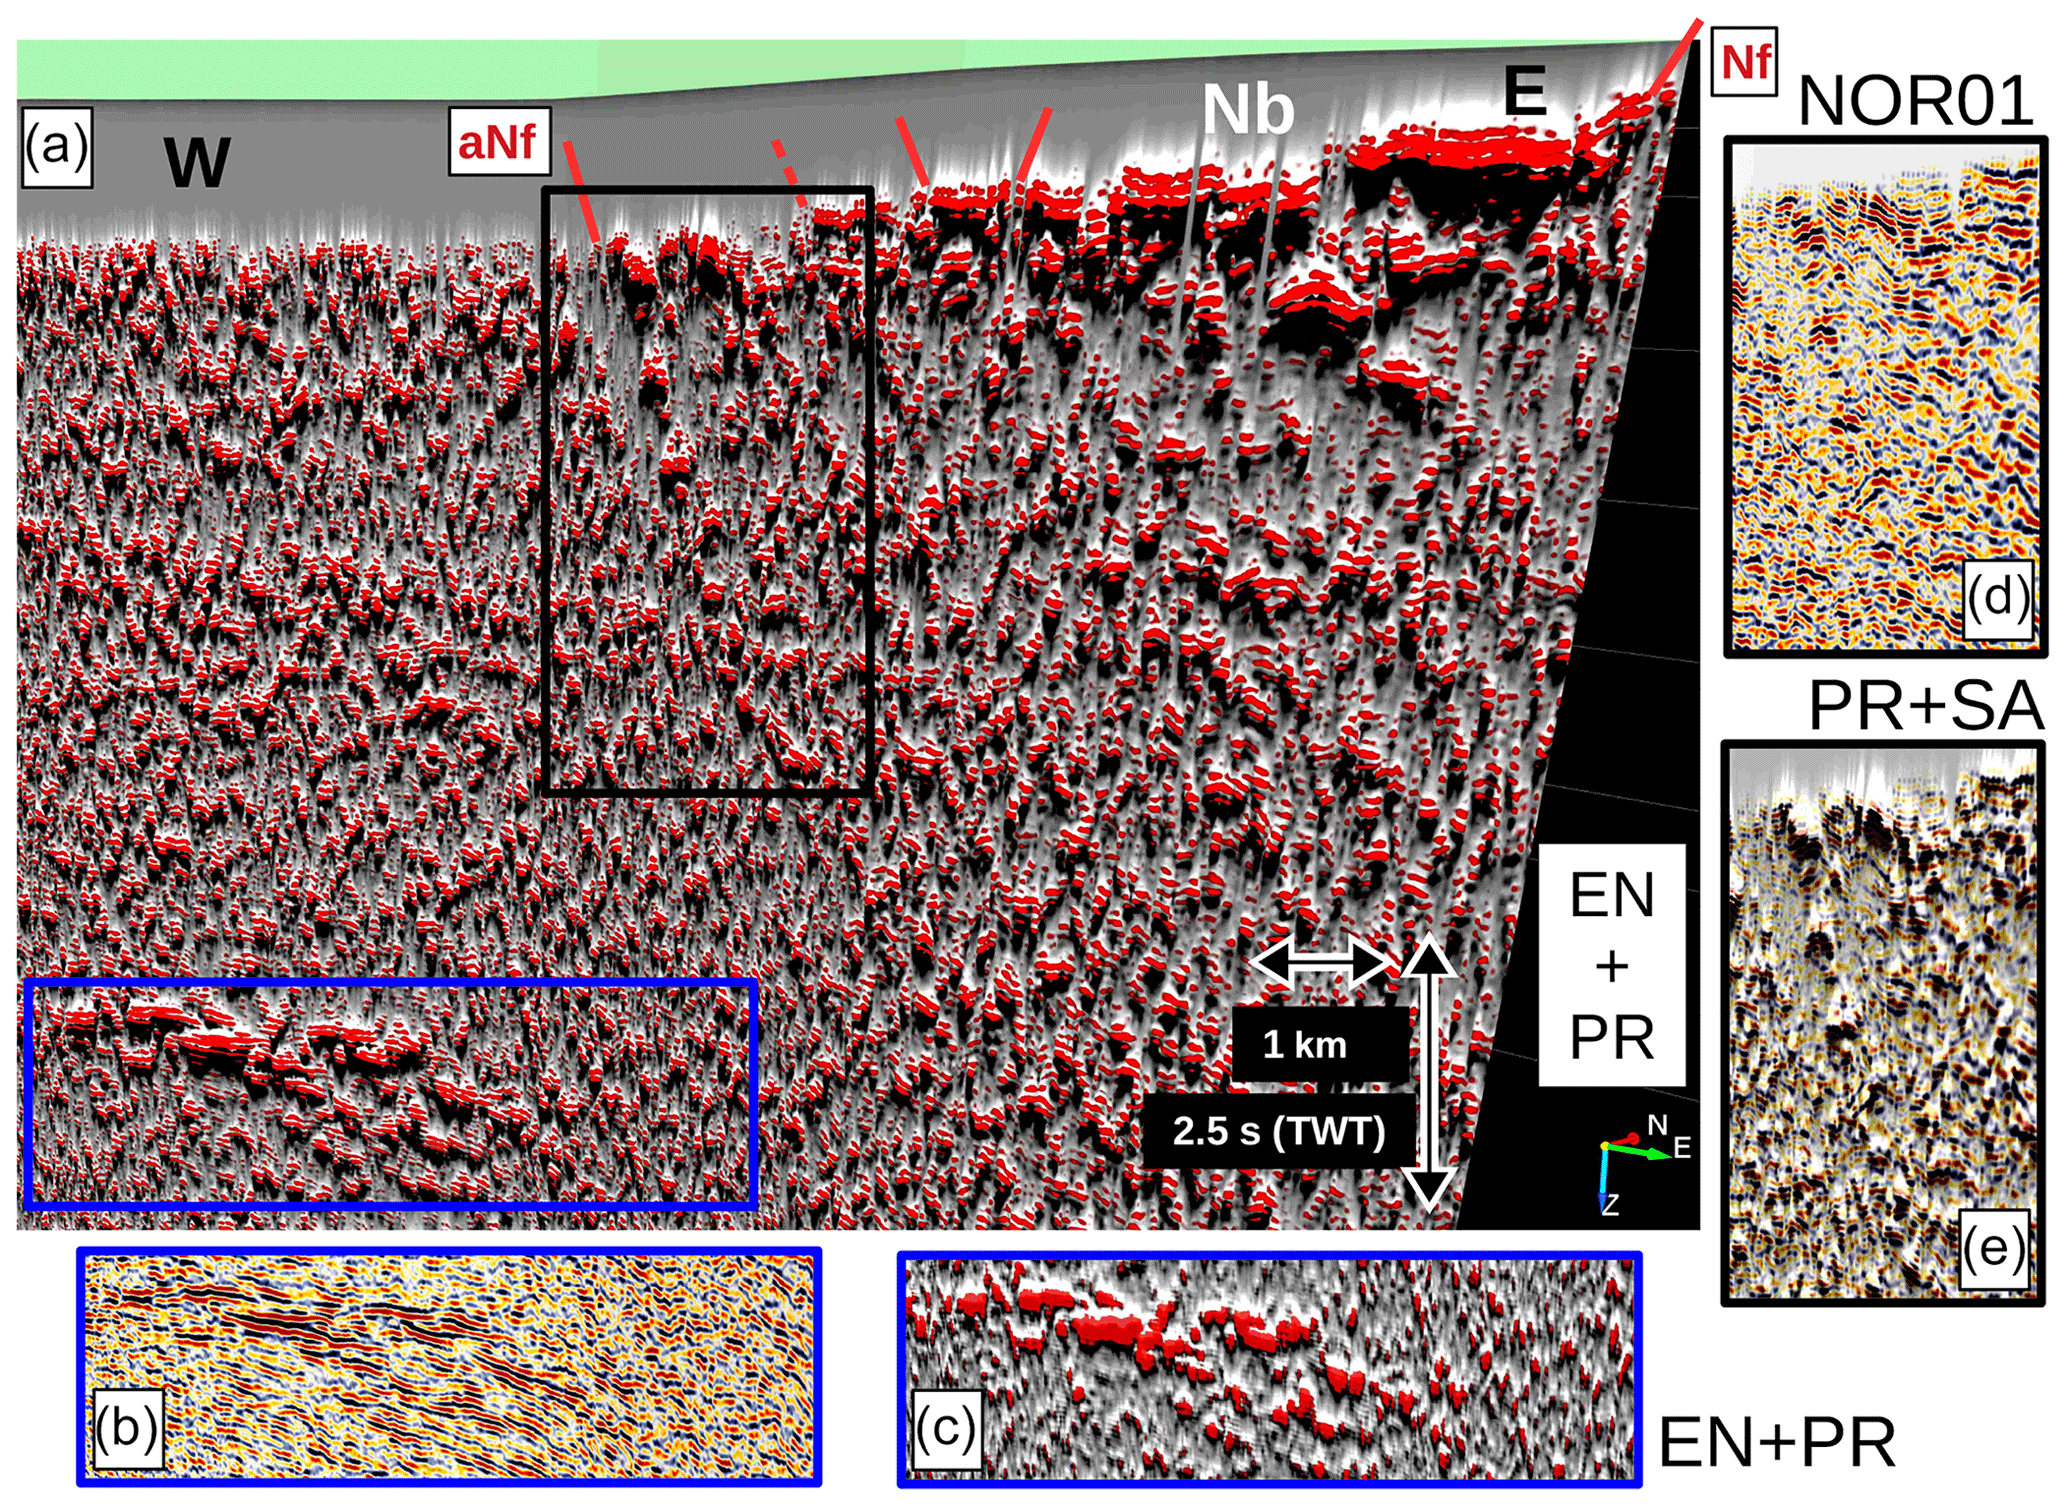
Figure 6Composite multi-attribute rendering of NOR01, displaying the position of the main faults at the surface in relation to their deep seismic attribute signature. (a) Energy+pseudo-relief attributes; the seismic facies in the blue box shows a strong set of deep reflectors compared with the original-amplitude image of the seismic profile. (b) The energy+pseudo-relief. (c) An analogous plot of the black box reported in (d). (e) The original-amplitude image of the line and the combination pseudo-relief+standard amplitude.
The comparison between the original seismic data and the images obtained by the attribute analysis ensures an easier and more detailed interpretation of the geophysical features, allowing for the extension of the surface geological data in depth. The geological interpretation of these features requires a thoughtful comparison and a calibration with other data available in the area, e.g., geological and structural maps, coseismic ruptures, high-resolution topography, and main-shock hypocenters. The seismic attributes provide a multiple view of the original data through the enhancement of different physical quantities. Therefore, peculiar geophysical signatures have been detected, delineating interpretative criteria (e.g., high-amplitude reflectors, phase discontinuities, fragmented reflectors patterns, etc.). Such geophysical features, after a first-order interpretation, correlate well with the main outcropping geologic structures. Using the same interpretation criteria, other surface-uncorrelated discontinuities, poorly visible in the original images (amplitude lines), are apparent at a more detailed scale after the attribute analysis. In addition, deep reflectors showing a common signature have also been recognized, revealing a regional character. The geological meaning and the relation of such geophysical features with the surface geology as well as with the hypocenter location of the main earthquakes are hereafter discussed.
Figure 7 reports a global pseudo-3D view of the study region summarizing all the data analyzed across the area, together with all the faults mapped at the surface (Fig. 7a) and the location of the Mw 6.5 main shock (30 October 2016). The two seismic images in Fig. 7b and c have been obtained using again a multi-attribute visualization, overlapping the PR and EN attributes in transparency plots with the original seismic lines NOR01 and NOR02, following the same procedure used for the images in Figs. 5 and 6. Figure 7d and e propose an interpretation of the geophysical features as associated with the faults highlighted after an accurate analysis of the discontinuities of attributes signatures, as shown in Fig. S5. Regarding the deeper parts of the sections, reflector H (blue arrows and dashed line), highlighted in NOR01 (and in CAS01), presents a seismic character and an attribute signature compatible with the deeper reflector in NOR02 beneath CNb. This set of reflectors is interpreted as a high acoustic impedance contrast, possibly related to an important velocity inversion occurring between the Triassic evaporites (anhydrites and dolostones, Vp≈6 km s−1; e.g., Trippetta et al., 2010) and the underlying acoustic basement (metasedimentary rocks, Vp≈5 km s−1; sensu Bally et al., 1986). Comparable deep and prominent reflectors were also detected in other legacy data across adjacent regions of the Umbria–Marche Apennines (e.g., Barchi et al., 1998; Mirabella et al., 2008). This fact confirms its regional importance, particularly because it represents a lithological control indicating a seismicity cutoff (Chiaraluce et al., 2017; Mirabella et al., 2008; Porreca et al., 2018; Mancinelli et al., 2019).
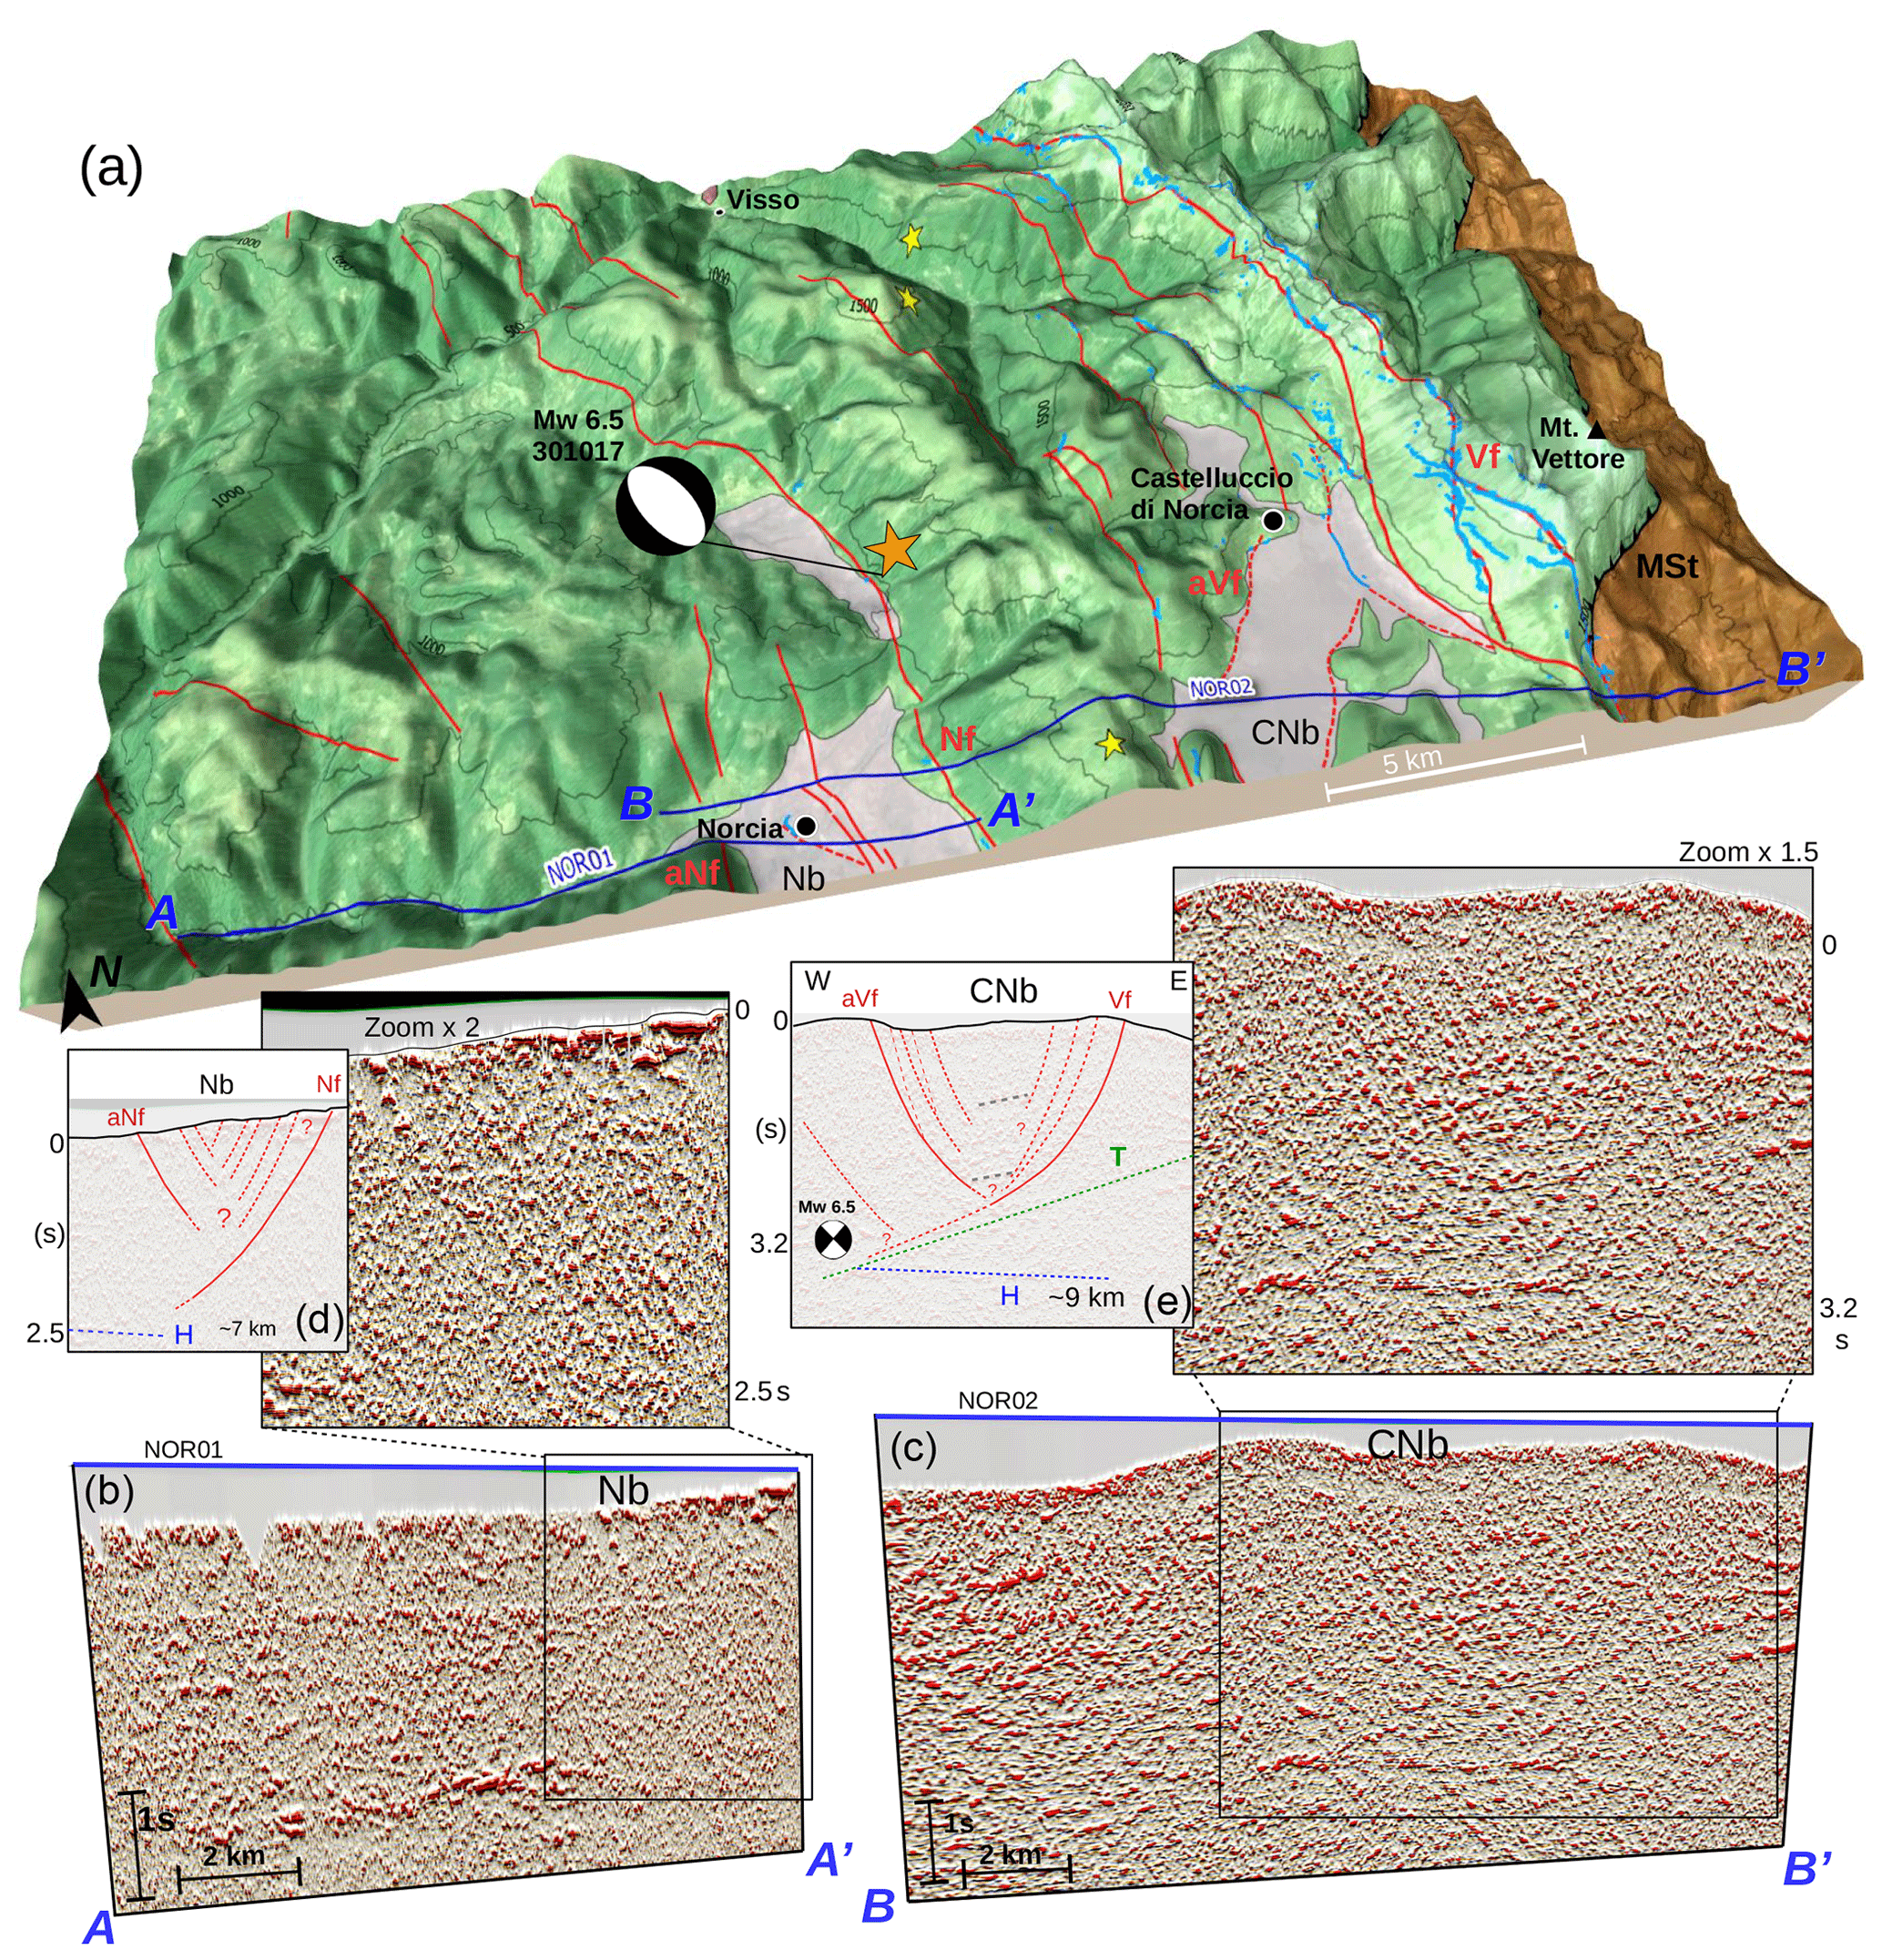
Figure 7Integration of the surface and subsurface data; (a) 3D view (DEM by Tarquini et al., 2012) of a W–E section, crossing the Norcia and Castelluccio di Norcia basins (Nb and CNb), and the main-shock locations (ISIDe working group, 2016). Surface and deep data allow for the correlation of the master faults and coseismic ruptures mapped at the surface. The composite multi-attribute display of NOR01 (b) and NOR02 (c) is obtained by overlapping the reflection amplitude in a transparency plot with the pseudo-relief and energy attributes (red palette). The black boxes centered on Nb and CNb have been magnified. An important improvement of the subsurface images provides additional details on the seismogenic fault zones: the sketches in (d) and (e) show an interpretation reporting two conjugate basins, showing master faults along the borders and several minor synthetic and antithetic splays.
As already pointed out in the previous figures, the continuity of the deep reflector H is interrupted in the western edge by the low-angle west-dipping discontinuity T crossing NOR02 (Fig. 7e), and it is not identified in the interpretation by Porreca et al. (2018). This deep discontinuity can be interpreted as a regional thrust emerging at the footwall of the MSt in the easternmost sector of the region, corresponding to the Acquasanta thrust (Centamore et al., 1992).
In NOR01, the most visible high-angle seismic discontinuity is marked by an E-dipping fault bordering the western area of Nb (Fig. 7d). The location and geometry of this fault, whose presence is still debated in the literature, perfectly correlate with its supposed position at the surface (Blumetti et al., 1993; Pizzi et al., 2002; Galadini et al., 2018; Galli et al., 2018). Therefore, it may represent the first clear geophysical evidence at depth of the antithetic normal fault of Norcia (aNf), suggested by morphological studies (Blumetti et al., 1990) and paleoseismological records (Borre et al., 2003), belonging to a conjugate tectonic system (Brozzetti and Lavecchia, 1994; Lavecchia et al., 1994).
The other principal structure is a synthetic (W-dipping) high-angle normal fault bordering the eastern flank of Nb (the Nottoria–Preci fault – Nf; Calamita et al., 1982; Blumetti et al., 1993; Calamita and Pizzi, 1994). The Nf in NOR02 is marked by the downward propagation of a steep alignment (continuous red line in Fig. 7d). This area is also fragmented by several minor strands parallel to the main faults (dashed lines in Fig. 7d). In particular, several west-dipping minor faults are observed in Fig. S5a, where the shallower high-amplitude reflectors of the PR attribute are clearly disrupted.
Another discontinuity interpretable as a deep fault is visible slightly eastward, close to the main-shock hypocentral location (Fig. 7e). This E-dipping discontinuity, emphasized by the attribute analysis, does not reach the surface. The presence of this blind fault has been suggested by several authors in relation to the occurrence of an aftershock (Mw 5.4), which “ruptured a buried antithetic normal fault on eastern side of Nb, parallel to the western bounding fault of CNb” (Chiaraluce et al., 2017; Porreca et al., 2018; Improta et al., 2019).
The central portion of NOR02, corresponding to CNb, shows a peculiar reflection fabric dominated by high-angle discontinuities; it is interpreted as two opposite-dipping normal faults bordering the basin, correlating with their positions mapped at the surface (see Pierantoni et al., 2013). The main fault is represented here by the W-dipping Vf, reactivated during the 2016 earthquake (e.g., Villani et al., 2018a), which can be traced from its surface expression downward to the hypocenter location. Parallel to the Vf, several high-angle seismic discontinuities representing minor normal faults cross-cut the gently W-dipping reflectors (Fig. 7e; further details in Fig. S5).
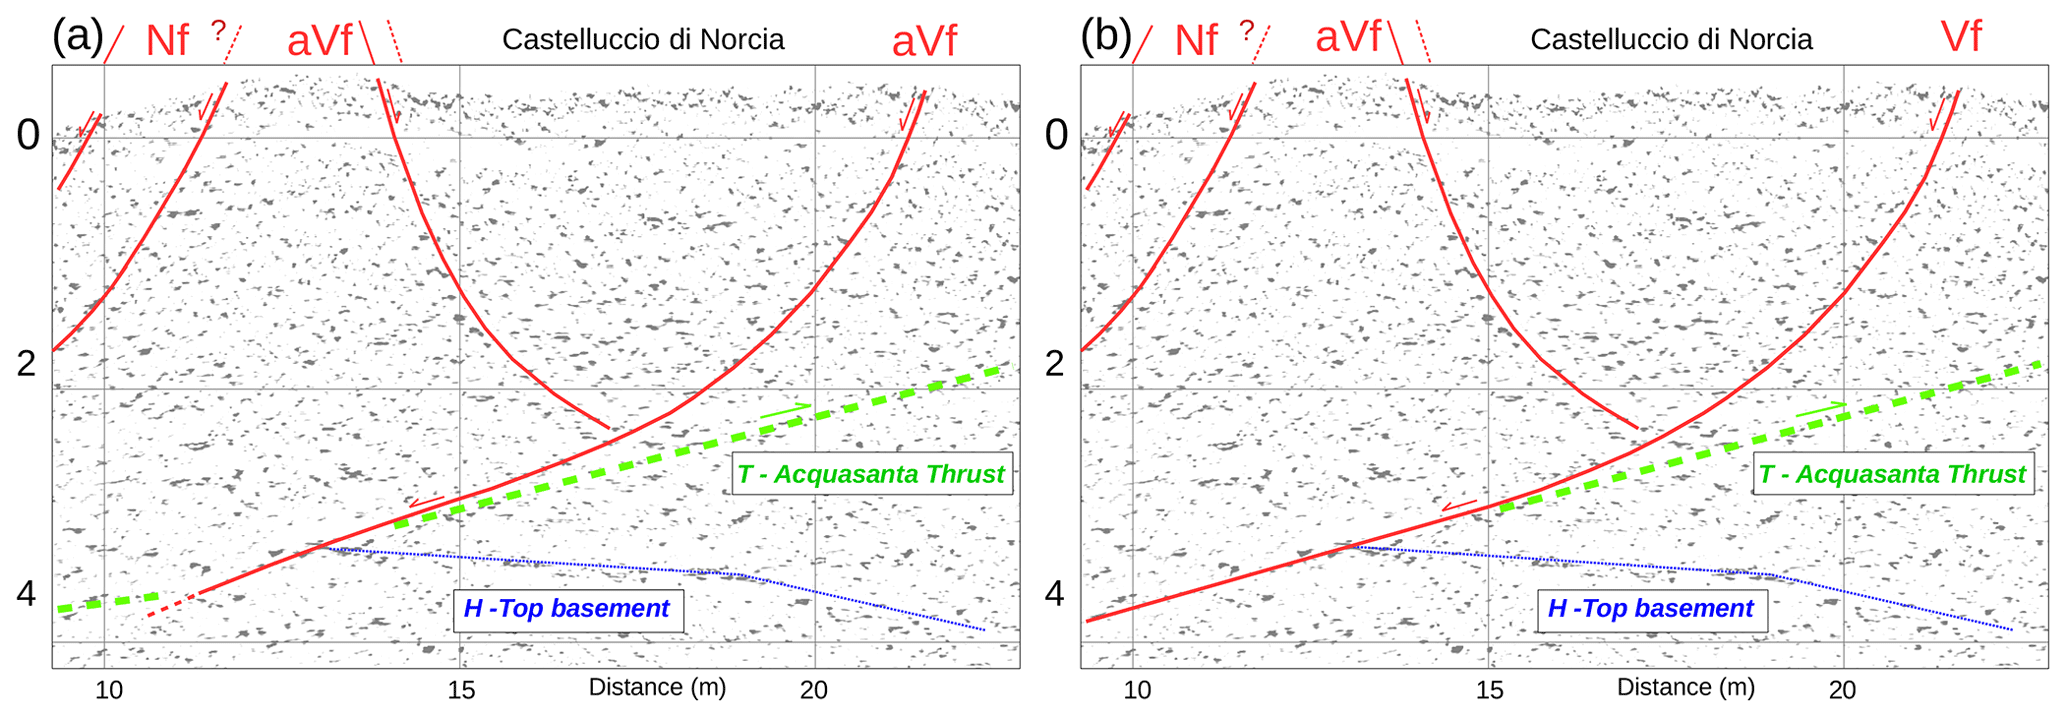
Figure 8The figure proposes two alternative interpretations of the relation between the normal Vf, the deep Acquasanta thrust (T), and the top basement reflector (H). Panel (a) reports a model in which Vf merges into the deep Acquasanta thrust, suggesting a negative inversion, similar to the models proposed by some authors (e.g., Calamita and Pizzi, 1994; Pizzi et al., 2017; Scognamiglio et al., 2018). In (b), Vf cuts and displaces the Acquasanta thrust, following a steeper trajectory (ramp) as proposed by other researchers (Lavecchia et al., 1994; Porreca et al., 2018, 2020).
Analogous considerations can be extended to a multitude of E-dipping steep discontinuities at the westward side of CNb. These may represent evidence of an antithetic fault (aVf) and several minor fault strands characterized by high-angle dip at shallow depths (Villani et al., 2018b). Such a fault appears connected at about 2–3 s to the W-dipping master Vf, producing a conjugate system geometry like that observed at Nb (Fig. 8e). At a depth of 3.2 s, the Vf fault clearly interrupts the continuity of the top basement reflector H, whilst the relationship with the Acquasanta thrust (low-angle discontinuity T) is more ambiguous. Two alternative interpretations can be proposed, schematically represented in Fig. 8. In Fig. 8a, we propose a model in which Vf merges into the deep Acquasanta thrust, suggesting a negative inversion, as a mechanism proposed by other authors (e.g., Calamita and Pizzi, 1994; Pizzi et al., 2017; Scognamiglio et al., 2018). In Fig. 8b, Vf cuts and displaces the Acquasanta thrust, following a steeper trajectory (ramp) (Lavecchia et al., 1994; Porreca et al., 2018). For both the Norcia and Castelluccio di Norcia basins, the interpreted data suggest two slightly asymmetric fault systems. These are due to conjugate sets of seismogenic master faults (Ramsay and Huber, 1987) producing a “basin-and-range” morphology (Serva at al., 2002), progressively lowering the topography from east to west and producing two major topographic steps corresponding to the CNb and Nb, respectively. Such fault systems control the evolution of the continental basins, and are associated with several complex sets of secondary strands building up complex fault zones. Such fault strands are able to produce surface ruptures in future earthquakes, as occurred in the 2016–2017 seismic swarm, and would require further studies through high-resolution geophysical investigations (e.g., Bohm et al., 2011; Villani et al., 2019).
The results of the seismic interpretation proposed in this work, supported by the attribute analysis, suggest that such synthetic and antithetic tectonic structures at the Norcia and Castelluccio di Norcia basins cannot actually be simplified as a unique fault plane, but they could be interpreted as complex and fractured fault zones, as conceived by Ferrario and Livio (2018) as “distributed faulting and rupture zones”.
Taking into account the important role that seismic attributes play in the oil and gas industry, their usage might also be of high interest and impact for improving the geological interpretation of vintage seismic data aimed at other scientific objectives. When applied to seismically active areas, this analysis may contribute to constraining the buried geological setting. Legacy data powered by seismic attributes, when combined with seismological data (i.e., focal mechanisms and accurate earthquake locations), may have a high potential impact for the identification and characterization of possible seismogenic structures (sources) and eventually earthquake hazard assessment. This contribution presents one of the first case studies in which a seismic attribute analysis is used for seismotectonic purposes, specifically on legacy seismic reflection data, in this case collected more than 30 years ago in central Italy. Such industrial data, which are currently irreproducible in regions where seismic exploration is forbidden or difficult, represent a unique source of information on the geological setting at depth despite their limited or poor quality.
This contribution reveals that the use of seismic attributes can improve interpretations for subsurface assessment and structural characterization. Certainly, the overall low quality of the datasets did not allow for the extraction of rock petrophysical parameters or more quantitative information. However, the attributes aid the seismic interpretation to better display the reflection patterns of interest and provided new and original details on a complex tectonic region in central Italy. Our attribute analysis considerably improved the overall interpretability of the vintage seismic lines crossing the epicentral area of the 2016–2017 Norcia–Amatrice seismic sequence. In particular, we detected peculiar seismic signatures of a deep horizon of regional importance, most probably corresponding to the base of the seismogenic layer and to the location and geometry of the complex active fault zones. Those consist of several secondary synthetic and antithetic splays in two Quaternary basins. These fabrics correlate with the mapped main structures at the surface. But our interpretation also reveals the existence of several faults with no clear surface outcrop, an issue currently much debated in the literature. The analysis and integration of the seismic attributes allowed for the determination of the deep continuation of the (known and supposed) faults and the recently mapped coseismic ruptures at the surface, providing a pseudo-3D picture of the buried structural setting of the area. The seismic attributes may help to reduce the gap between the surface geology and deep seismological data, also revealing a high structural complexity at different scales, which cannot generally be detected only by using traditional interpretation techniques. This approach has shown the potential of attribute analysis, which even when applied on 2D vintage seismic lines may significantly increase the data value. For all these reasons, we strongly encourage its application to seismotectonic research aimed at providing new information and additional constraints across seismically active regions around the world, thus contributing to hazard analysis.
The original SEG-Y files were provided by ENI S.p.A. under a temporary agreement. The raw images of the seismic reflection lines are available in the Supplement.
The supplement related to this article is available online at: https://doi.org/10.5194/se-11-329-2020-supplement.
ME was responsible for conceptualization, data curation, formal analysis, investigation, methodology, software, validation, visualization, writing the original draft, and review and editing.
EF was responsible for methodology, data curation, visualization, validation, and review and editing.
MP was responsible for conceptualization, data curation, validation, resources, and review and editing.
RC was responsible for methodology, validation, visualization, and review and editing.
CP was responsible for formal analysis, investigation, and review and editing.
GM was responsible for resources, visualization, and review and editing.
MRB was responsible for conceptualization, resources, supervision, and review and editing.
The authors declare that they have no conflict of interest.
We are grateful to Eni S.p.A. for providing an inedited set of seismic reflection lines after the 2016–2017 seismic crisis in central Italy (raw data images available in Fig. S1 of the Supplement). The high-resolution Figs. 2, 3, 4, and 7 are available in the Supplement. The authors are very grateful to dgB Earth Sciences and to QGIS teams for providing the academic software used in this work. We thank Christian Berndt and David Iacopini for their valuable comments provided for this paper. We also thank the two anonymous reviewers for their patience in providing useful suggestions and detailed corrections that considerably improved this work.
This paper was edited by Mark Allen and reviewed by two anonymous referees.
Allen, C. R., St. Amand, P., Richter, C. F., and Nordquist, J.: Relationship between seismicity and geologic structure in the southern California region, Bull. Seismol. Soc. Am., 55, 753–797, 1965.
Anderlini, L., Serpelloni, E., and Belardinelli, M. E.: Creep and locking of a low-angle normal fault: Insights from the Altotiberina fault in the Northern Apennines (Italy), Geophys. Res. Lett., 43, 4321–4329, https://doi.org/10.1002/2016GL068604, 2016.
Anelli, L., Gorza, M., Pieri, M., and Riva, M.: Subsurface well data in the Northern Apennines (Italy). Memorie della Società Geologica Italiana, 48, 461–471, 1994.
Bally, A. W., Burbi, L., Cooper, C., and Ghelardoni, R.: Balanced cross-sections and seismic reflection profiles across the central Apennines, Memorie della Societa Geologica Italiana, 35, 257–310, 1986.
Barchi, M.: Integration of a seismic profile with surface and subsurface geology in a cross-section through the Umbria-Marche Apennines, Bollettino della Società Geologica Italiana, 110, 469–479, 1991.
Barchi, M., Landuzzi, A., Minelli, G., and Pialli, G.: Outer northern Apennines. In anatomy of an orogen: The Apennines and adjacent Mediterranean Basins, Netherlands, Springer, 215–253, 2001.
Barchi, M. R. and Mirabella, F.: The 1997–98 Umbria-Marche earthquake sequence: “Geological” vs. “seismological” faults, Tectonophysics, 476, 170–179, https://doi.org/10.1016/j.tecto.2008.09.013, 2008.
Barchi, M. R., Minelli, G., and Pialli, G.: The CROP 03 Profile: a synthesis of results on deep structures of the Northern Apennines, Mem. Soc. Geol. It., 52, 383–400, 1998.
Barchi, M. R., Galadini, F., Lavecchia, G., Messina, P., Michetti, A. M., Peruzza, L., Pizzi, A., Tondi, E., and Vittori, E.: Sintesi delle conoscenze sulle faglie attive in Italia Centrale: parametrizzazione ai fini della caratterizzazione della pericolosità sismica, CNR-Gruppo Nazionale per la Difesa dai Terremoti, Roma, 62 pp., 2000.
Barnes, A. E.: Theory of two-dimensional complex seismic trace analysis, Geophysics, 61, 264–272, 1996.
Barnes, A. E.: Attributes for automating seismic facies analysis, Seg. Technical Program Expanded Abstracts, 19, 553–556, https://doi.org/10.1190/1.1816121, 2000.
Barnes, A. E.: Displaying Seismic Data to Look Like Geology, in: Attributes: New Views on Seismic Imaging–Their Use in Exploration and Production, edited by: Marfurt, K. J., Gao, D., Barnes, A., Chopra, S., Corrao, A., Hart, B., James, H., Pacht, J., and Rosen, N. C., SEPM Society for Sedimentary Geology, 31, https://doi.org/10.5724/gcs.11.31, 2011.
Barnes, A. E.: Handbook of Poststack Seismic Attributes, Society of Exploration Geophysicists, 21, 268 pp., https://doi.org/10.1190/1.9781560803324, 2016.
Basili, R., Valensise, G., Vannoli, P., Burrato, P., Fracassi, U., Mariano, S., Tiberti, M. M., and Boschi, E.: The Database of Individual Seismogenic Sources (DISS), version 3: summarizing 20 years of research on Italy's earthquake geology, Tectonophysics, 453, 20–43, 2008.
Beidinger, A., Decker, K., and Roch, K. H.: The Lassee segment of the Vienna Basin fault system as a potential source of the earthquake of Carnuntum in the fourth century AD, Int. J. Earth Sci., 100, 1315–1329, 2011.
Bigi, S., Casero, P., and Ciotoli, G.: Seismic interpretation of the Laga basin; constraints on the structural setting and kinematics of the central Apennines, J. Geol. Soc., 168, 179–190, https://doi.org/10.1144/0016-76492010-084, 2011.
Blumetti, A. M., Coltorti, M., Dramis, F., and Farabollini, P.: Due sezioni stratigrafiche nel Pleistocene medio della conca di Norcia; implicazioni geomorfologiche e neotettoniche, Rend. Soc. Geol. Ital., 13, 17–26, 1990.
Blumetti, A. M., Dramis, F., and Michetti, A. M.: Fault-generated mountain fronts in the central Apennines (Central Italy): Geomorphological features and seismotectonic implications, Earth Surf. Proc. Land., 18, 203–223, https://doi.org/10.1002/esp.3290180304, 1993.
Bohm, G., Luzi, L., and Galadini, F.: Tomographic depth seismic velocity model below the plain of Norcia (Italy) for site effect studies, Bollettino di geofisica Teorica ed Applicata, 52, 197–209, https://doi.org/10.4430/bgta0002, 2011.
Boncio, P., Brozzetti, F., Ponziani, F., Barchi, M., Lavecchia, G., and Pialli, G.: Seismicity and extensional tectonics in the northern Umbriamarche Apennines, Memorie della Societa Geologica Italiana, 52, 539–555, 1998.
Boncio, P., Brozzetti, F., and Lavecchia, G.: Architecture and seismotectonics of a regional low-angle normal fault zone in central Italy, Tectonics, 19, 1038–1055, https://doi.org/10.1029/2000TC900023, 2000.
Bonini, L., Toscani, G., and Seno, S.: Three-dimensional segmentation and different rupture behavior during the 2012 Emilia seismic sequence (Northern Italy), Tectonophysics, 630, 33–42, 2014.
Bonini, L., Basili, R., Burrato, P., Cannelli, V., Fracassi, U., Maesano, F. E., Melini, D., Tarabusi, G., Tiberti, M. M., Vannoli, P., and Valensise, G.: Testing different tectonic models for the source of the Mw 6.5, 30 October 2016, Norcia earthquake (central Italy): A youthful normal fault, or negative inversion of an old thrust?, Tectonics, 38, 990–1017, https://doi.org/10.1029/2018TC005185, 2019.
Borre, K., Cacon, S., Cello, G., Kontny, B., Likke Andersen, H., Moratti, G., Piccardi, L., Stemberk, J., Tondi, E., and Vilimek, V.: The COST project in Italy: analysis and monitoring of seismogenic faults in the Gargano and Norcia areas (centralsouthern Apennines, Italy), J. Geodyn., 36, 3–18, 2003.
Botter, C., Cardozo, N., Hardy, S., Leconte, I., and Escalona, A.: From mechanical modeling to seismic imaging of faults: a synthetic workflow to study the impact of faults on seismic, Mar. Pet. Geol., 57, 187–207, 2014.
Brewer, J. A., Matthews, D. H., Warner, M. R., Hall, J., Smythe, D. K., and Whittington, R. J.: BIRPS deep seismic reflection studies of the British Caledonides, Nature, 305, 206–210, https://doi.org/10.1038/305206a0, 1983.
Brozzetti, F. and Lavecchia, G.: Seismicity and related extensional stress field: the case of the Norcia seismic zone, Annales Tectonicae, 8, 38–57, 1994.
Brozzetti, F., Boncio, P., Cirillo, D., Ferrarini, F., de Nardis, R., Testa, A., Liberi, F., and Lavecchia, G.: High resolution field mapping and analysis of the August–October 2016 coseismic surface faulting (Central Italy Earthquakes): slip distribution, parameterization and comparison with global earthquakes, Tectonics, 38, 417–439, https://doi.org/10.1029/2018TC005305, 2019.
Bulhões, E. M.: Técnica “Volume de Amplitudes”. SBGF/6∘ Congresso Internacional da Sociedade Brasileira de Geofísica, Rio de Janeiro, Anais, 1999 (in Portuguese).
Calamita, F. and Pizzi, A. Tettonica quaternaria nella dorsale appenninica umbromarchigiana e bacini intrappenninici associati, Studi Geol. Camerti n. speciale, 17–25, https://doi.org/10.15165/studgeocam-1186, 1992.
Calamita, F. and Pizzi, A.: Recent and active extensional tectonics in the southern Umbro-Marchean Apennines (Central Italy), Memorie della Società Geologica Italiana, 48, 541–548, 1994.
Calamita, F., Coltorti, M., Deiana, G., Dramis, F., and Pambianchi, G.: Neotectonic evolution and geomorphology of the Cascia and Norcia depressions (Umbria-Marche Apennines), Geografia Fisica e Dinamica Quaternaria, 5, 263–276, 1982.
Calamita, F., Pace, P., and Satolli, S.: Coexistence of fault-propagation and fault-bend folding in curve-shaped foreland fold-and-thrust belts: examples from the Northern Apennines (Italy), Terra Nova, 24, 396–406, 2012.
Carvalho, J., Taha, R., Cabral, J., Carrilho, F., and Miranda, M.: Geophysical characterization of the OtaVila Franca de Xira-Lisbon-Sesimbra fault zone, Portugal, Geophys. J. Int., 174, 567-584, 2008.
Cavinato, G. P. and De Celles, P. G.: Extensional basins in the tectonically bimodal central Apennines fold-thrust belt, Italy: Response to corner flow above a subducting slab in retrograde motion, Geology, 27, 955–958, 1999.
Centamore, E., Adamoli, L., Berti, D., Bigi, G., Bigi, S., Casnedi, R., Cantalamessa, G. Fumanti, F. Morelli, C. Micarelli, A. Ridolfi, M., and Salvucci, R.: Carta geologica dei bacini della Laga e del Cellino e dei rilievi carbonatici circostanti, in: Studi Geologici Camerti, Vol. Spec. Università degli Studi, Dipartimento di Scienze della Terra, SELCA, available at: http://193.204.8.201:8080/jspui/handle/1336/782, Firenze, 1992.
Cheloni, D., Falcucci, E., and Gori, S.: Half-graben rupture geometry of the 30 October 2016 MW 6.6 Mt. Vettore-Mt. Bove earthquake, central Italy, J. Geophys. Res.-Sol. Ea., 124 , 4091–4118, https://doi.org/10.1029/2018JB015851, 2018.
Chen, Q. and Sidney, S.: Seismic Attribute Technology for Reservoir Forecasting and Monitoring, The Leading Edge, 16, 445, https://doi.org/10.1190/1.1437657, 1997.
Chiarabba, C., De Gori, P., Cattaneo, M., Spallarossa, D., and Segou, M.: Faults geometry and the role of fluids in the 2016–2017 Central Italy seismic sequence, Geophys. Res. Lett., 45, 6963–6971, 2018.
Chiaraluce, L., Barchi, M., Collettini, C., Mirabella, F., and Pucci, S.: Connecting seismically active normal faults with Quaternary geological structures in a complex extensional environment: the Colfiorito 1997 case history (northern Apennines, Italy), Tectonics 24, TC1002, https://doi.org/10.1029/2004TC001627, 2005.
Chiaraluce, L., Di Stefano, R., Tinti, E., Scognamiglio, L., Michele, M., Casarotti, E., Cattaneo, M., De Gori, P., Chiarabba, C., Monachesi, G., Lombardi, A., Valoroso, L., Latorre, D., and Marzorati, S.: The 2016 Central Italy seismic sequence: A first look at the mainshocks, aftershocks, and source models, Seismol. Res. Lett., 88, 757–771, https://doi.org/10.1785/0220160221, 2017.
Chopra, S. and Marfurt, K. J.: Seismic attributes – A Historical Perspective, Geophysics, 70, 3, https://doi.org/10.1190/1.2098670, 2005.
Chopra, S. and Marfurt, K. J.: Seismic Attributes for Prospect Identification and Reservoir Characterization, SEG Geophysical Developments Series No. 11, edited by: Hill, S. J. (series editor and volume editor), ISBN 978-1-56080-141-2 (volume) – ISBN 978-0-931830-41-9 (series), 464 pp., 2007.
Chopra, S. and Marfurt, K. J.: Emerging and future trends in seismic attributes, The Leading Edge, 27, 298–318, https://doi.org/10.1190/1.2896620, 2008.
Chopra, S. and Marfurt, K. J.: Volume co-rendering of seismic attributes – A great aid to seismic interpretation, SEG Technical Program Expanded Abstracts, January 2011, 1150–1154, 2011.
Ciaccio, M., Barchi, M. R., Chiarabba, C., Mirabella, F., and Stucchi, E.: Seismological, geological and geophysical constraints for the Gualdo Tadino fault, Umbria-Marche Apennines (central Italy), Tectonophysics, 406, 233–247, 2005.
Cinti, F. R., De Martini, P. M., Pantosti, D., Baize, S., Smedile, A., Villani, F., Civico, R., Pucci, S., Lombardi, A. M., Sapia, V., Pizzimenti, L., Caciagli, M., and Brunori, C. A.: 22-kyr-long record of surface faulting along the source of the 30 October 2016 earthquake (central Apennines, Italy), from integrated paleoseismic data sets, J. Geophys. Res.-Sol. Ea., 124, 9021–9048, https://doi.org/10.1029/2019JB017757, 2019.
Civico, R., Pucci, S., Villani, F., Pizzimenti, L., De Martini, P. M., Nappi, R., and the Open EMERGEO Working Group: Surface ruptures following the 30 October 2016 Mw 6.5 Norcia earthquake, central Italy, J. Maps, 14, 151–160, https://doi.org/10.1080/17445647.2018.1441756, 2018.
Coltorti, M. and Farabollini, P.: Quaternary evolution of the “Castelluccio di Norcia” basin (Umbro-Marchean Apennines, central Italy), Il Quaternario, 8, 149–166, 1995.
Cook, F. A., Albaugh, D. S., Brown, L. D., Kaufman, S., Oliver, J. E., and Hatcher Jr., R. D.: Thin-skinned tectonics in the crystalline southern Appalachians; COCORP seismic-reflection profiling of the Blue Ridge and Piedmont, Geology, 7, 563–567, 1979.
De Guidi, G., Vecchio, A., Brighenti, F., Caputo, R., Carnemolla, F., Di Pietro, A., Lupo, M., Maggini, M., Marchese, S., Messina, D., Monaco, C., and Naso, S.: Brief communication: Co-seismic displacement on 26 and 30 October 2016 (Mw = 5.9 and 6.5) – earthquakes in central Italy from the analysis of a local GNSS network, Nat. Hazards Earth Syst. Sci., 17, 1885–1892, https://doi.org/10.5194/nhess-17-1885-2017, 2017.
Deschamps, A., Iannaccone, G., and Scarpa, R.: The Umbrian earthquake (Italy) of 19 September 1979, Annales Geophysicae, 2, 29–36, 1984.
Di, H. and AlRegib, G.: Semi-automatic fault/fracture interpretation based on seismic geometry analysis, Geophysical Prospecting, 67, 1379–1391, https://doi.org/10.1111/1365-2478.12769, 2019.
Di Giulio, G., Ercoli, M., Vassallo, M., and Porreca, M.: Investigation of the Norcia basin (Central Italy) through ambient vibration measurements and geological surveys, Eng. Geol., 267, 105501, https://doi.org/10.1016/j.enggeo.2020.105501, 2020.
DISS Working Group: Database of Individual Seismogenic Sources (DISS), Version 3.2.1: A compilation of potential sources for earthquakes larger than M 5.5 in Italy and surrounding areas, available at: http://diss.rm.ingv.it/diss/ (last access: January 2019), Istituto Nazionale di Geofisica e Vulcanologia, https://doi.org/10.6092/INGV.IT-DISS3.2.1, 2018.
Ehsan, S. A., Carbonell, R., Ayarza, P., Martí, D., Pérez-Estaún, A., Martínez-Poyatos, D. J., Simancas, J. F., Azor, A., and Mansilla, L.: Crustal deformation styles along the reprocessed deep seismic reflection transect of the Central Iberian Zone (Iberian Peninsula), Tectonophysics, 621, 159–174, https://doi.org/10.1016/j.tecto.2014.02.014, 2014.
Ehsan, S. A., Carbonell, R., Ayarza, P., Martí, D., Martínez Poyatos, D., Simancas, J. F., Azor, A., Ayala, C., Torné, M., and Pérez-Estaún, A.: Lithospheric velocity model across the Southern Central Iberian Zone (Variscan Iberian Massif): The ALCUDIA wide-angle seismic reflection transect, Tectonics, 34, 535–554, https://doi.org/10.1002/2014TC003661, 2015.
Ercoli, M., Pauselli, C., Frigeri, A., Forte, E., and Federico, C.: “Geophysical paleoseismology” through high resolution GPR data: A case of shallow faulting imaging in Central Italy, J. Appl. Geophys., 90, 27–40, https://doi.org/10.1016/j.jappgeo.2012.12.001, 2013.
Ercoli, M., Pauselli, C., Frigeri, A., Forte, E., and Federico, C.: 3-D GPR data analysis for high-resolution imaging of shallow subsurface faults: the Mt Vettore case study (Central Apennines, Italy), Geophys. J. Int., 198, 609–621, https://doi.org/10.1093/gji/ggu156, 2014.
Ercoli, M., Pauselli, C., Cinti, F. R., Forte, E., and Volpe, R.: Imaging of an active fault: Comparison between 3D GPR data and outcrops at the Castrovillari fault, Calabria, Italy, Interpretation, 3, SY57–SY66, 2015.
Ferrario, M. F. and Livio, F.: Characterizing the distributed faulting during the 30 October 2016, Central Italy earthquake: A reference for fault displacement hazard assessment, Tectonics, 37, 1256–1273, https://doi.org/10.1029/2017TC004935, 2018.
Finetti, I. R., Boccaletti, M., Bonini, M., Del Ben, A., Geletti, R., Pipan, M., and Sani, F.: Crustal section based on CROP seismic data across the North Tyrrhenian–Northern Apennines–Adriatic Sea, Tectonophysics, 343, 135–163, 2001.
Forte, E., Pipan, M., Casabianca, D., Di Cuia, R., and Riva, A.: Imaging and characterization of a carbonate hydrocarbon reservoir analogue using GPR attributes, J. Appl. Geophys., 81, 76–87, 2012.
Forte, E., Dossi, M., Pipan, M., and Del Ben, A.: Automated phase attribute-based picking applied to reflection seismics, Geophysics, 81, V55–V64, https://doi.org/10.1190/GEO2015-0333.1, 2016.
Galadini, F. and Galli, P.: Paleoseismology of silent faults in the central Apennines (Italy): The Mt. Vettore and Laga Mts. Faults, Ann. Geophys., 46, 815–836, https://doi.org/10.4401/ag-3457, 2003.
Galadini, F., Falcucci, E., Gori, S., Zimmaro, P., Cheloni, D., and Stewart, J. P.: Active Faulting in Source Region of 2016–2017 Central Italy Event Sequence, Earthquake Spectra, 34, 1557–1583, 2018.
Galli, P., Galadini, F., and Calzoni, F.: Surface faulting in Norcia (Central Italy): a “paleoseismological perspective”, Tectonophysics, 403, 117–130, 2005.
Galli, P., Galadini, F., and Pantosti, D.: Twenty years of paleoseismology in Italy, Earth-Sci. Rev., 88, 89–117, 2008.
Galli,P., Galderisi, A., Ilardo, I., Piscitelli, S., Scionti, V., Bellanova, J., and Calzoni, F.: Holocene paleoseismology of the Norcia fault system (Central Italy), Tectonophysics, 745, 154–169, https://doi.org/10.1016/j.tecto.2018.08.008, 2018.
Galli, P., Galderisi, A., Peronace, E., Giaccio, B., Hajdas, I., Messina, P., Pileggi, D., and Polpetta, F.: The awakening of the dormant Mount Vettore fault (2016 central Italy earthquake, Mw 6.6): Paleoseismic clues on its millennial silences, Tectonics, 38, 687–705, https://doi.org/10.1029/2018TC005326, 2019.
Gersztenkorn, G. and Marfurt, K. J.: Eigenstructure-based coherence computations as an aid to 3-D structural and stratigraphic mapping, Geophysics, 64, 1468–1479, 1999.
Gori, S., Falcucci, E., Galadini, F., Zimmaro, P., Stewart, J. P., Kayen, R. E., Lingwall, B., Moro, M., Saroli, M., Pizzi, A., and Di Domenica, A.: Surface faulting caused by the 2016 Central Italy seismic sequence, Earthquake Spectra, 34, 1585–1610, https://doi.org/10.1193/111417EQS236MR, 2018.
Gruppo di Lavoro Sequenza Centro Italia: Rapporto Bollettino Sismico Italiano sulla revisione dei giorni 24–26 agosto; 26–27 ottobre; 30 ottobre – 1∘ novembre 2016, Bollettino Sismico Italiano (BSI), 13 pp., 2019.
Ha, T. N., Marfurt, K. J., Wallet, B. C., and Hutchinson, B.: Pitfalls and implementation of data conditioning, attribute analysis, and self-organizing maps to 2D data: Application to the Exmouth Plateau, North Carnarvon Basin, Australia, Interpretation, 7, SG23–SG42, 2019.
Hale, D.: Methods to compute fault images, extract fault surfaces, and estimate fault throws from 3D seismic images, Geophysics, 78, O33–O43, https://doi.org/10.1190/geo2012-0331.1, 2013.
Hutchinson, B.: Application and Limitations of Seismic Attributes on 2D Reconnaissance Surveys: Master's thesis, University of Oklahoma, 130 pp., available at: https://shareok.org/handle/11244/34658 (last access: January 2019), 2016.
Iacopini, D. and Butler, R. W. H.: Imaging deformation in submarine thrust belts using seismic attributes, Earth Planet. Sci. Lett., 302, 414–422, 2011.
Iacopini, D., Butler, R. W. H., and Purves, S.: Seismic imaging of thrust faults and structural damage: a visualization workflow for deepwater thrust belts, First Break, 30, 39–46, 2012.
Iacopini, D., Butler, R. W. H., Purves, S., McArdle, N., and De Freslon, N.: Exploring the seismic expression of fault zones in 3D seismic volumes, J. Struct. Geol., 89, 54–73, 2016.
Improta, L., Latorre, D., Margheriti, L., Nardi, A., Marchetti, A., Lombardi, A. M., Castello, B., Villani, F., Ciaccio, M. G., Mele, F. M., Moretti, M., and the Bollettino sismico Italiano Working Group: Multi-segment rupture of the 2016 Amatrice-Visso-Norcia seismic sequence (central Italy) constrained by the first high-quality catalog of early Aftershocks, Scientific Reports, 9, 6921, https://doi.org/10.1038/s41598-019-43393-2, 2019.
ISIDe working group: version 1.0, https://doi.org/10.13127/ISIDe, 2016.
Ithaca catalogue: http://www.isprambiente.gov.it/it/progetti/suolo-e-territorio-1/ithaca-catalogo-delle-faglie-capaci, last access: January 2019.
Koopman, A.: Detachment tectonics in the central Apennines, Italy, Geologica Eltraiectina, 30, 1–155, 1983.
Lavecchia, G.: Il sovrascorrimento dei Monti Sibillini: Analisi cinematica e strutturale, Bollettino della Società Geologica Italiana, 104, 161–194, 1985.
Lavecchia, G., Brozzetti, F., Barchi, M., Keller, J., and Menichetti, M.: Seismotectonic zoning in east-central Italy deduced from the analysis of the Neogene to present deformations and related stress fields, Geol. Soc. Am. Bull., 106, 1107–1120, 1994.
Lavecchia, G., Castaldo, R., de Nardis, R., De Novellis, V., Ferrarini, F., Pepe, S., Brozzetti, F., Solaro, G., Cirillo, D., Bonano, M., Boncio, P., Casu, F., De Luca, C., Lanari, R., Manunta, M., Manzo, M., Pepe, A., Zinno, I., and Tizzani, P.: Ground deformation and source geometry of the 24 August 2016 Amatrice earthquake (Central Italy) investigated through analytical and numerical modeling of DInSAR measurements and structural-geological data, Geophys. Res. Lett., 43, 12389–12398, 2016.
Lima, R., Teixeira, L. E. W., de Albuquerque, F. R., and Lima-Filho, F.: Ground Penetrating Radar digital imaging and modeling of microbialites from the Salitre Formation, Northeast Brazil, Geologia USP – Serie Cientifica, 18, 187–200, https://doi.org/10.11606/issn.2316-9095.v18-146075, 2018.
Livio, F., Michetti, A. M., Vittori, E., Gregory, L., Wedmore, L., Piccardi, L., Tondi, E., Roberts, G. and CENTRAL ITALY EARTHQUAKE W.G., Blumetti, A. M., Bonadeo, L., Brunamonte, F., Comerci, V., Dimanna, P., Ferrario, M. F., Faure Walker, J., Frigerio, C., Fumanti, F., Guerrieri, L., Iezzi, F., Leoni, G., McCaffrey, K., Mildon, Z., Phillips, R., Rhodes, E., Walters, R. J., and Wilkinson, M.: Surface faulting during the August 24, 2016, central Italy earthquake (Mw 6.0): Preliminary results, Ann. Geophys., 59, 1–8, https://doi.org/10.4401/ag-7197, 2016.
Maesano, F. E., D'Ambrogi, C., Burrato, P., and Toscani, G.: Slip-rates of blind thrusts in slow deforming areas: examples from the Po Plain (Italy), Tectonophysics, 643, 8–25, 2015.
Mancinelli, P., Porreca, M., Pauselli, C., Minelli, G., Barchi, M. R., and Speranza, F.: Gravity and magnetic modeling of Central Italy: Insights into the depth extent of the seismogenic layer, Geochem. Geophy. Geosy., 20, 2157–2172, https://doi.org/10.1029/2018GC008002, 2019.
Manning, T., Ablyazina, D., and Quigley, J.: The nimble node – Million-channel land recording systems have arrived, The Leading Edge, 38, 706–714, https://doi.org/10.1190/tle38090706.1, 2019.
Marfurt, K. J.: Seismic Attributes as the Framework for Data Integration throughout the Oilfield Life Cycle, SEG, 508 pp., 2018.
Marfurt, K. J. and Alves, T. M.: Pitfalls and limitations in seismic attribute interpretation of tectonic features, Interpretation, 3, 5–15, https://doi.org/10.1190/INT-2014-0122.1, 2015.
Marfurt, K. J. Gao, D., Barnes, A., Chopra, S., Corrao, A., Hart, B., James, H., Pacht, J., and Rosen, N. C.: SEPM Society for Sedimentary Geology, 31, https://doi.org/10.5724/gcs.11.31, 2011.
Martinis, B. and Pieri, M.: Alcune notizie sulla formazione evaporitica dell'Italia centrale e meridionale, Bollettino della Società Entomologica Italiana, 4, 649–678, 1964.
Mazzotti, A., Stucchi, E., Fradelizio, G., Zanzi, L., and Scandone, P.: Seismic exploration in complex terrains: A processing experience in the southern Apennines, Geophysics, 65, 1402–1417, https://doi.org/10.1190/1.1444830, 2000.
McArdle, N. J., Iacopini, D., KunleDare, M. A., and Paton, G. S.: The use of geologic expression workflows for basin scale reconnaissance: a case study from the Exmouth Subbasin, North Carnarvon Basin, northwestern Australia, Interpretation, 2, 163–177, 2014.
McClymont, A. F., Green, A. G., Villamor, P., Horstmeyer, H., Grass, C., and Nobes, D. C.: Characterization of the shallow structures of active fault zones using 3-D ground-penetrating radar data, J. Geophys. Res., 113, B10315, https://doi.org/10.1029/2007JB005402, 2008.
Milli, S., Moscatelli, M., Stanzione, O., and Falcini, F.: Sedimentology and physical stratigraphy of the Messinian turbidites deposits of the Laga basin (Central Apennines, Italy), Bollettino della Società Geologica Italiana, 126, 37–48, 2007.
Minelli, G. and Menichetti, M.: Tectonic evolution of the Perugia massifs area (Central Italy), Bollettino della Società Entomologica Italiana, 109, 445–453, 1990.
Mirabella, F., Barchi, M. R., and Lupattelli, A.: Seismic reflection data in the Umbria Marche region: Limits and capabilities to unravel the subsurface structure in a seismically active area, Ann. Geophys., 51, 383–396, https://doi.org/10.4401/ag-3032, 2008.
Naeini, E. Z. and Prindle, K.: Machine learning and learning from machines, The Leading Edge, 37, 886–893, 2018.
Patacca, E. and Scandone, P.: Late thrust propagation and sedimentary response in the thrust-belt foredeep system of the southern Apennines (Pliocene–Pleistocene), in: Anatomy of an Orogen: The Apennines and adjacent Mediterranean basins, edited by: Vai, G. and Martini, I., 441–454, Norwell, MA: Kluwer Acad., 2001.
Pauselli, C., Barchi, M. R., Federico, C., Magnani, M. B., and Minelli, G.: The crustal structure of the northern Apennines (Central Italy): An insight by the CROP03 seismic line, Am. J. Sci., 306, 428–450, https://doi.org/10.2475/06.2006.02, 2006.
Pauselli, C., Federico, C., Frigeri, A., Orosei, R., Barchi, M. R., and Basile, G.: Ground Penetrating Radar investigations to study active faults in the Norcia Basin (Central Italy), J. Appl. Geophys., 72, 39–45, 2010.
Pierantoni, P. P., Deiana, G., and Galdenzi, S.: Stratigraphic and structural features of the Sibillini Mountains (Umbria–Marche Apennines, Italy), Italian Journal of Geosciences, 132, 497–520, https://doi.org/10.3301/IJG.2013.08, 2013.
Pizzi, A., Calamita, F., Coltorti, M., and Pieruccini, P.: Quaternary normal faults, intramontane basins and seismicity in the Umbria-MarcheAbruzzi Apennine Ridge (Italy): Contribution of neotectonic analysis to seismic hazard assessment, Bollettino Società Geologica Italiana Special Publication, 1, 923–929, 2002.
Pizzi, A., Di Domenica, A., Gallovič, F., Luzi, L., and Puglia, R.: Fault segmentation as constraint to the occurrence of the main shocks of the 2016 Central Italy seismic sequence, Tectonics, 36, 2370–2387, https://doi.org/10.1002/2017TC004652, 2017.
Porreca, M., Minelli, G., Ercoli, M., Brobia, A., Mancinelli, P., Cruciani, F., Giorgetti, C., Carboni, C., Mirabella, F., Cavinato, G., Cannata, A., Pauselli, C., and Barchi, M. R.: Seismic reflection profiles and subsurface geology of the area interested by the 2016–2017 earthquake sequence (Central Italy), Tectonics, 37, 1–22, https://doi.org/10.1002/2017TC004915, 2018.
Porreca, M., Fabbrizzi, A., Azzaro, S., Pucci, S., Del Rio, L., Pierantoni, P. P., Giorgetti, C., Roberts, G., and Barchi, M. R.: 3D geological reconstruction of the M. Vettore seismogenic fault system (Central Apennines, Italy): Cross-cutting relationship with the M. Sibillini thrust, J. Struct. Geol., 131, 103938, https://doi.org/10.1016/j.jsg.2019.103938, 2020.
Pucci, S., De Martini, P. M., Civico, R., Villani, F., Nappi, R., Ricci, T., Azzaro, R., Brunori, C. A., Caciagli, M., Cinti, F. R., Sapia, V., De Ritis, R., Mazzarini, F., Tarquini, S., Gaudiosi, G., Nave, R., Alessio, G., Smedile, A., Alfonsi, L., Cucci, L., and Pantosti, D.: Coseismic ruptures of the 24 August 2016, Mw6.0 Amatrice earthquake (central Italy), Geophys. Res. Lett., 44, 2138–2147, https://doi.org/10.1002/2016GL071859, 2017.
Ramsay, J. G. and Huber, M. I.: The Techniques of Modern Structural Geology: Folds and Fractures, Elsevier Science, 391 pp., 1987.
Roure, F., Choukroune, P., Berastegui, X., Munoz, J. A., Villien, A., Matheron, P., Bareyt, M., Seguret, M., Camara, P., and Deramond, J.: Ecors deep seismic data and balanced cross sections: Geometric constraints on the evolution of the Pyrenees, Tectonics, 8, 41–50, https://doi.org/10.1029/TC008i001p00041, 1989.
Rovida, A., Locati, M., Camassi, R., Lolli, B., and Gasperini P. (Eds.): CPTI15, the 2015 version of the parametric catalogue of Italian earthquakes, Istituto Nazionale di Geofisica e Vulcanologia, https://doi.org/10.6092/INGV.IT-CPTI15, 2016.
Schwartz, D. P. and Coppersmith, K. J.: Fault behavior and characteristic earthquakes: Examples from the Wasatch and San Andreas fault zones, J. Geophys. Res.-Sol. Ea., 89, 5681–5698, 1984.
Scognamiglio, L., Tinti, E., Casarotti, E., Pucci, S., Villani, F., Cocco, M., Magnoni, F., Michelini, A., and Dreger, D.: Complex fault geometry and rupture dynamics of the Mw 6.5, 2016, October 30th central Italy earthquake, J. Geophys. Res.-Sol. Ea., 123, 2943–2964, https://doi.org/10.1002/2018jb015603, 2018.
Serva, L., Blumetti, A. M., Guerrieri, L., and Michetti, A. M.: The Apennine intermountain basins: the result of repeated strong earthquakes over a geological time interval, Boll. Soc. Geol. It., 1, 939–946, 2002.
Simancas, J. F., Carbonell, R., González Lodeiro, F., Pérez Estaún, A., Juhlin, C., Ayarza, P., Kashubin, A., Azor, A., Martínez Poyatos, D., Almodóvar, G. R., Pascual, E., Sáez, R., and Expósito, I.: Crustal structure of the transpressional Variscan orogen of SW Iberia: SW Iberia deep seismic reflection profile (IBERSEIS), Tectonics, 22, 1062, https://doi.org/10.1029/2002TC001479, 2003.
Snieder, R. and Trampert, J.: Inverse Problems in Geophysics. In: Wirgin A. (eds) Wavefield Inversion. International Centre for Mechanical Sciences (Courses and Lectures), vol. 398, Springer, Vienna, 1999.
Taner, M. T.: Seismic attributes. Canadian Society of Exploration Geophysicists Recorder, 26, 48–56, 2001.
Taner, M. T., Koehler, F., and Sheriff, R. E.: Complex Seismic Trace Analysis, Geophysics, 44, 1041, https://doi.org/10.1190/1.1440994, 1979.
Tarquini, S., Isola, I., Favalli, M., and Boschi, E.: TINITALY/01: a new triangular irregular network of Italy, Ann. Geophys., 50, 407–425, 2007.
Tarquini, S., Vinci, S., Favalli, M., Doumaz, F., Fornaciai, A., and Nannipieri, L.: Release of a 10-m-resolution DEM for the Italian territory: Comparison with global-coverage DEMs and anaglyph-mode exploration via the web, Comput. Geosci., 38, 168–170. https://doi.org/10.1016/j.cageo.2011.04.018, 2012.
Trippetta, F., Collettini, C., Vinciguerra, S., and Meredith, P. G.: Laboratory measurements of the physical properties of Triassic evaporites from Central Italy and correlation with geophysical data, Tectonophysics, 492, 121–132, 2010.
Torvela, T., Moreau, J., Butler, R. W. H., Korja, A., and Heikkinen, P.: The mode of deformation in the orogenic mid-crust revealed by seismic attribute analysis, Geochem. Geophys. Geosy., 14, 1069–1086, 2013.
Vai, G. B.: Basement and early (pre-Alpine) history, in: Anatomy of an orogen: The Apennines and adjacent Mediterranean basins, edited by: Vai, G. B. and Martini, I. P., 121–150, Dordrecht, Netherlands: Kluwer Academic Publisher, https://doi.org/10.1007/978-94-015-9829-3_10, 2001.
Valoroso, L., Chiaraluce, L., Piccinini, D., Di Stefano, R., Schaff, D., and Waldhauser, F.: Radiography of a normal fault system by 64,000 high-precision earthquake locations: The 2009 L'Aquila (central Italy) case study, J. Geophys. Res.-Sol. Ea., 118, 1156–1176, https://doi.org/10.1002/jgrb.50130, 2013.
Vernengo, L., Trinchero, E., Torrejón, M. G., and Rovira, I.: Amplitude volume technique attributes and multidimensional seismic interpretation, The Leading Edge, 36, 776–781, https://doi.org/10.1190/tle36090776.1, 2017.
Villani, F., Pucci, S., Civico, R., De Martini, P. M., Cinti, F. R., and Pantosti, D.: Surface faulting of the 30 October 2016 Mw 6.5 central Italy earthquake: Detailed analysis of a complex coseismic rupture, Tectonics, 37, 3378–3410, https://doi.org/10.1029/2018TC005175, 2018a.
Villani, F., Sapia, V., Baccheschi, P., Civico, R., Di Giulio, G., Vassallo, M., Marchetti, M., and Pantosti, D.: Geometry and structure of a fault bounded extensional basin by integrating geophysical surveys and seismic anisotropy across the 30 October 2016 Mw 6.5 earthquake fault (central Italy): The Pian Grande di Castelluccio basin, Tectonics, 38, 26–48, https://doi.org/10.1029/2018TC005205, 2018b.
Villani, F., Maraio, S., Bruno, P. P., Improta, L., Wood, K., Civico, R., Baccheschi, P., Sapia., V., Pucci, S., Brunori, C. A., De Martini, P. M., Pantosti, D., Conti, P., and Doglioni, C.: High-resolution seismic profiling of the Castelluccio basin: new constraints on the shallow subsurface of the 30 October 2016 Mw 6.5 Norcia earthquake fault (central Italy), Proceeding of the 38∘ Convegno GNGTS, 2019.
Wilkinson, M. W., McCaffrey, K. J. W., Jones, R. R., Roberts, G. P., Holdsworth, R. E., Gregory, L. C., Walters, R. J., Wedmore, L., Goodall, H., and Iezzi, F. : Near-field fault slip of the 2016 Vettore Mw 6.6 earthquake (Central Italy) measured using low-cost GNSS, Scientific Reports, 7, 4612, https://doi.org/10.1038/s41598-017-04917-w, 2017.
Wrona, T., Pan, I., Gawthorpe, R. L., and Fossen, H.: Seismic facies analysis using machine learning, Geophysics, 83, O83–O95, 2018.
Zhao, W., Forte, E., Fontolan, G., and Pipan, M.: Advanced GPR imaging of sedimentary features: integrated attribute analysis applied to sand dunes, Geophys. J. Int., 213, 147–156, https://doi.org/10.1093/gji/ggx541, 2018.
- Abstract
- Introduction
- Geological framework and seismotectonics of the study area
- Data
- Methods
- Results
- Data interpretation: new elements and insights on the deep geological structure of the study area
- Conclusions
- Data availability
- Author contributions
- Competing interests
- Acknowledgements
- Review statement
- References
- Supplement