the Creative Commons Attribution 4.0 License.
the Creative Commons Attribution 4.0 License.
 | 23 Sep 2021
Micromechanisms leading to shear failure of Opalinus Clay in a triaxial test: a high-resolution BIB–SEM study
Lisa Winhausen
Jop Klaver
Joyce Schmatz
Guillaume Desbois
Janos L. Urai
Florian Amann
Christophe Nussbaum
A microphysics-based understanding of mechanical and hydraulic processes in clay shales is required for developing advanced constitutive models, which can be extrapolated to long-term deformation. Although many geomechanical tests have been performed to characterise the bulk mechanical, hydro-mechanical, and failure behaviour of Opalinus Clay, important questions remain about micromechanisms: how do microstructural evolution and deformation mechanisms control the complex rheology? What is the in situ microstructural shear evolution, and can it be mimicked in the laboratory? In this contribution, scanning electron microscopy (SEM) was used to image microstructures in an Opalinus Clay sample deformed in an unconsolidated–undrained triaxial compression test at 4 MPa confining stress followed by argon broad ion beam (BIB) polishing. Axial load was applied (sub-)perpendicular to bedding until the sample failed. The test was terminated at an axial strain of 1.35 %. Volumetric strain measurements showed bulk compaction throughout the compression test. Observations on the centimetre to micrometre scale showed that the samples exhibited shear failure and that deformation localised by forming a network of micrometre-wide fractures, which are oriented with angles of 50∘ with respect to horizontal. In BIB–SEM at the grain scale, macroscale fractures are shown to be incipient shear bands, which show dilatant intergranular and intragranular microfracturing, granular flow, bending of phyllosilicate grains, and pore collapse in fossils. Outside these zones, no deformation microstructures were observed, indicating only localised permanent deformation. Thus, micromechanisms of deformation appear to be controlled by both brittle and ductile processes along preferred deformation bands. Anastomosing networks of fractures develop into the main deformation bands with widths up to tens of micrometres along which the sample fails. Microstructural observations and the stress–strain behaviour were integrated into a deformation model with three different stages of damage accumulation representative for the deformation of the compressed Opalinus Clay sample. Results on the microscale explain how the sample locally dilates, while bulk measurement shows compaction, with an inferred major effect on permeability by an increase in hydraulic conductivity within the deformation band. Comparison with the microstructure of highly strained Opalinus Clay in fault zones shows partial similarity and suggests that during long-term deformation additional solution–precipitation processes operate.
- Article
(18857 KB) - Full-text XML
-
Supplement
(249446 KB) - BibTeX
- EndNote


Due to its low permeability and self-sealing capability, Opalinus Clay (OPA) has been chosen as host rock for radioactive waste disposal in deep geological formations in Switzerland. Major effort has been made to study its mechanical and hydro-mechanical behaviour in laboratory experiments (e.g. Nüesch, 1991; Aristorenas, 1992; Bock, 2010; Amann et al., 2011; Wild et al., 2015, 2018; Favero et al., 2018; Giger et al., 2018). From a geomechanical point of view, the behaviour of OPA is at the transition from a stiff soil to a weak rock. The strain response upon loading suggests a yielding stress threshold that coincides with the onset of dilation. Micro-acoustic measurements on both laboratory and field scale suggest that the onset of dilatancy is associated with micro-acoustic events, which is typically observed for brittle rocks (Amann et al., 2011, 2018; Wild et al., 2015).
After sedimentation, physical compaction, and development of diagenetic bonding (Marschall et al., 2005), OPA shows a well-pronounced bedding and foliation, resulting in transversely isotropic hydraulic and mechanical characteristics. Centimetre-scale lithological heterogeneity and the pronounced microfabric, i.e. preferred grain and pore orientation, govern the macroscopic lamination. Houben et al. (2013, 2014) give an overview of the microstructure of the pristine material (unfaulted shaly OPA). SEM-based studies (scanning electron microscopy) have shown that the microfabric consists of larger sub-millimetre domains embedded in a matrix of sub-parallel platy clay aggregates (Klinkenberg, 2009; Houben et al., 2013, 2014; Seiphoori et al., 2017).
Typically, the mineral composition consists of the following components: siderite, biogenic calcium carbonate (fossil shells), mica, calcite, organic matter, quartz, pyrite, feldspar, and clay matrix. These components can be porous such as the clay matrix, fossils, framboidal pyrite, and organic matter or non-porous such as such as quartz, mica, and calcite grains. The SEM-visible void space consists of bedding-parallel fractures, pores in the fossils or pyrite, and three different pore types in the clay matrix (Houben et al., 2013; Desbois et al., 2009). The SEM-visible pore area can be described by a power-law distribution, which, when extrapolated to pore sizes at the resolution of the bulk porosity measurements, matches the measured porosity of the shaly facies of OPA of 15.3 % (Houben et al., 2013, 2014). This value is slightly lower than petrophysical porosities measured by various methods such as water content porosity, helium pycnometry, and neutron-scattering techniques (Busch et al., 2017). Elongated pores in the clay matrix, as well as elongated grains such as micas and calcite clasts, are oriented parallel to bedding (Wenk et al., 2008; Houben et al., 2014). The combination of BIB–SEM (broad ion beam polishing and scanning electron microscopy), FIB-n (focused ion beam nano-tomography), and STEM (scanning transmission electron microscopy) allows a multi-scale description of the pore structure, indicating a more connected pore network parallel to bedding compared to normal to bedding (Keller et al., 2011, 2013).
Micromechanisms of deformation in clay-rich rocks are complex (e.g. Desbois et al., 2016, 2017; Chandler et al., 2016; Forbes Inskip et al., 2018; Gehne et al., 2020; Nejati et al., 2020; Schuck et al., 2020). Early macroscopic studies on experimentally deformed shales by compressive loading show that failure is accompanied by shear faulting both across and in-plane of anisotropy, plastic flow or slip along the plane of anisotropy, or kinking (McLamore and Gray, 1967). These processes depend on the confining stress and the orientation of the anisotropy plane with respect to the applied stress. For example, deformation tests on shales from the Wilcox shale formation show that deformation at confining stresses less than 100 MPa is prone to develop macroscopic sharp shear fractures, while experiments at higher confining pressures above 100 MPa reveal macroscopic shear zones with en echelon fractures and kink bands following compositional layering (Ibanez and Kronenberg, 1993). Their microscale analyses indicate brittle, dilatant microfracturing over a wide range of scales with deformation accompanied by kinking of clay minerals. The deformation behaviour of shales or clay-rich materials can be brittle, ductile, or a combination of both. Underlying micromechanisms are cataclasis, granular flow, frictional sliding, and crystal plasticity (Morgenstern and Tchalenko, 1967; Handin et al., 1963; Maltman, 1987; Logan et al., 1979, 1987; Wang et al., 1980; Lupini et al., 1981; Rutter et al., 1986; Blenkinsop, 2000; Desbois et al., 2016, 2017; Schuck et al., 2020). Additionally, Ibanez and Kronenberg (1993) distinguished deformation modes based on the loading direction with respect to bedding. Individual and conjugate fractures with orientations between 33 and 73∘ towards horizontal were found in samples loaded normal to bedding, whereas samples loaded parallel to bedding are prone to develop macroscopic kink bands with an orientation of 47 to 75∘ and material rotation. Shear zones with orientations of 56 to 46∘ including echelon fractures are typically observed for samples in which the maximum load is oriented by 45∘ to bedding. The influence of anisotropy on fracture mode and propagation has also been studied in fracture toughness experiments on shales and shows that the direction of fracture growth is dependent on (i) the orientation of anisotropy, (ii) the extent of anisotropy, and (ii) the loading mode (Forbes Inskip et al., 2018; Nejati et al., 2020).
Holland et al. (2006) presented a model for deformation of shales with a high brittleness index (Ingram and Urai, 1999) wherein initial deformation leads to the formation of dilatant microfracture arrays with a strong increase in permeability, with progressive deformation and cataclasis of fragments forming a ductile clay gouge and resealing of the fractures.
Microphysical models of phyllosilicate-rich fault gouge for different crustal regimes have been developed using ring shear experiments with rock analogues consisting of mixtures of granular halite and fine-grained muscovite or kaolinite (Bos and Spiers, 2000, 2002). The rheology is controlled by frictional or frictional–viscous behaviour depending on strain rates and the effect of pressure solution. Later, the model was extended by plastic flow of phyllosilicates and the competing processes of shear-induced dilatation and compaction due to pressure solution (Niemeijer and Spiers, 2007). For OPA, links from structural analyses to deformation mechanisms have been derived using natural outcrops and laboratory experiments. Faulted OPA in outcrops of the Jura Mountains indicate discrete shear surfaces with thicknesses of 1–4 µm (Jordan and Nüesch, 1991). These shiny and mirror-like surfaces (i.e. slickensides), which are optically and microscopically visible, consist of more densely packed clay material. They are characterised by a grain size reduction and a preferred alignment of clay aggregates parallel to the shear zone forming R- and Y-shears (see Passchier and Trouw, 2005). Studies on the so-called “main fault” in the Mont Terri Underground Research Laboratory (MT-URL) show that thin shear zones are constituted by slickensides on fracture surfaces along which samples break (Laurich et al., 2014, 2017). The dominantly brittle and friction-controlled deformation mechanism is supported by a series of compression tests covering a broad range of ultimate strains (ε up to > 20 %) and confining stresses (50 to 250 MPa; Nüesch, 1989; Jordan and Nüesch, 1991). The authors interpreted the experimentally produced R-surfaces to act as “sliding surfaces” on water interlayers of clay minerals and to comprise the dominant deformation mechanisms. Kaufhold et al. (2016) performed microstructural analyses using different X-ray computed tomography (CT) techniques with varying resolutions and found two prominent fracture sets in an experimentally deformed OPA under unconsolidated–undrained conditions at 6 MPa confining stress. Detailed investigations in combination with SEM show an obliquely oriented macro-fracture accompanied by small fractures, cracks, and the rearrangement of particles. The authors interpret the microstructural deformation as a mylonitic shear zone.
Although CT and SEM analysis provide important insights for an advanced understanding of failure processes in OPA, they remain inconclusive at the grain scale. Currently, only a few studies exist which investigate grain-scale processes using high-resolution images. Laurich et al. (2014, 2017, 2018) analysed the deformation structure from the mesoscale down to the grain scale on samples from the main fault in the MT-URL. Results show a network of localised, micron-thick shear zones strongly reduced in porosity, slickensides, and scaly clay forming mostly undeformed microlithons. The formation of gouge is associated with both brittle deformation including microfracturing and cataclasis, pressure solution, and ductile flow of the clay matrix, forming relays which ultimately lead to the formation of scaly clay. The formation of scaly clay has also been analysed experimentally by use of direct shear tests on samples sheared both parallel and normal to the bedding direction at various normal stresses (Orellana et al., 2018). Deformation is localised in R-shear planes, creating slickenside surfaces, and for samples sheared normal to bedding a rotation of the original fabric, creating millimetre-sized offsets along the R-shears.
However, at this point there are almost no data published on grain-scale deformation mechanisms and microstructure evolution of OPA in laboratory experiments. Furthermore, existing studies (see the references above) present deformation structures resulting from shear displacements in the order of metres (fault rock) to centimetres (experimentally deformed samples), resulting in an advanced stage of deformation up to residual or ultimate rock strength. For understanding the rheology during the entire deformation process, earlier stages of deformation and the influence of anisotropy on the grain scale are fundamental. In particular, knowledge of micromechanical deformation and the localisation of strain is relevant for the implementation of damage in constitutive models (e.g. Oka et al., 1995; Pietruszszak, 1999; Kimoto et al., 2004; Haghighat and Pietruszczak, 2015).
In this contribution, the deformation structures were analysed of a sample that has been deformed under triaxial stress conditions to peak stress; damage has been initiated but has not reached its residual strength state. We integrate the bulk mechanical failure behaviour under well-defined experimental conditions with the underlying micro-deformation processes to constrain a microstructural progressive failure model. This work presents a first look and precedes a systematic study of multiple samples deformed at a range of conditions.
2.1 Material description and core sample preparation
A detailed description of the experimental setup as well as the petrophysical and mechanical results of the sample used in this study can be found in Amann et al. (2012, their sample no. 214-38) and will be summarised only briefly in this contribution. The core material from which the sample was extracted originated from shaly facies of Opalinus Clay of the Mont Terri Underground Research Laboratory. The typical mass fractions of the main mineralogical components are (i) clay minerals (50 %–66 %) composed of a 2:1 layer with illite, muscovite, smectite, and illite–smectite mixed layer minerals (20-30 %), as well as chlorite (7 %–8 %) and kaolinite (20 %–25 %); (ii) quartz (10 %–20 %); (iii) carbonates (8 %–20 %); (iv) iron-rich minerals (4 %–6 %); and (v) feldspars (3 %–5 %) (Thury and Bossart, 1999; Klinkenberg et al., 2009). The cores were drilled dry utilising triple-tube core barrels and compressed air-cooling followed by hermetical sealing in vacuum-evacuated foil (Amann et al., 2012). The cylindrical sample with a length of 179 mm and a diameter or 89 mm was prepared by dry cutting and polishing of end faces using a lathe with a bedding orientation inclined 85±5∘ to the sample axis. For the water content measurement and calculation of total porosity as well as saturation degree, remaining core pieces were used (ISRM, 1979; Amann et al., 2011), indicating full saturation for the sample used in this study.

Figure 1Stress versus strain development during the shearing phase. The shearing was conducted circumferential-displacement-controlled (0.08 mm min−1) and at constant confining stress of 4 MPa. Peak stress was reached at 11.3 MPa differential stress, and fracture (see Amann et al., 2012) initiation was observed at 2.3 MPa. The volumetric strain curve corresponds to bulk compaction over the entire experiment.
2.2 Triaxial testing
The sample was installed in a triaxial testing machine equipped with two axial strain transducers and one circumferential strain transducer. The unconsolidated, undrained triaxial compression test (UU test) was performed at constant 4 MPa confining stress and was circumferential-displacement-controlled to give a constant circumferential displacement rate of 0.08 mm min−1 (see Fairhurst and Hudson, 1999). The test was terminated right after peak stress showed an axial stress drop (Fig. 1). At the end of the test, a total circumferential strain of about −0.60 % and a total axial strain of about 1.35 % were achieved. At rupture, the axial stress was 15.3 MPa and the axial strain 1.25 %. After the test, the sample remained hermetically sealed in the FEP fluorocarbon jacket and was stored at room conditions.

Figure 2Methodology and sample preparation for the BIB–SEM: after dismantling and sample stabilisation by epoxy resin, the sample was cut normal to the fracture plane. Subsampling followed on selected regions of interest (red boxes), which were subjected to ion beam polishing. Finally, BSE–SEM (back-scattered electron) micrographs were taken at low magnifications (110× to 200×), and detailed high-resolution SE2 (secondary electron) and BSE–SEM images were produced from regions of interest. Pore segmentation was carried out by threshold segmentation of SE2 images.
2.3 Sample preparation for image analysis and BIB–SEM
For the microstructural analyses, the deformed sample was removed from the jacket, dried, and mechanically stabilised with epoxy resin (Fig. 2). Subsequently, the sample was cut dry along the long axis of the sample and normal to the fracture plane using a diamond saw. Eight subsamples along the fracture network were cut dry with a micro-diamond saw to a size of approximately cm3 (Fig. 3). The surface of each subsample was mechanically pre-polished with SiC grinding papers from P800 to P4000 grit size and glued on a stainless-steel sample holder with silver paste. Subsequently, the surfaces of the subsamples were polished using the BIB surface polishing procedure (Leica TIC3X) using a low-incident Ar ion beam angle (10.5∘ at 7 kV for 45 min followed by 4.5∘ at 5 KV for 4 h and for some selected subsamples followed by 4.5∘ at 5 kV for 18 h, similarly to e.g. Schuck et al., 2020; Laurich et al., 2018; Oelker, 2019).
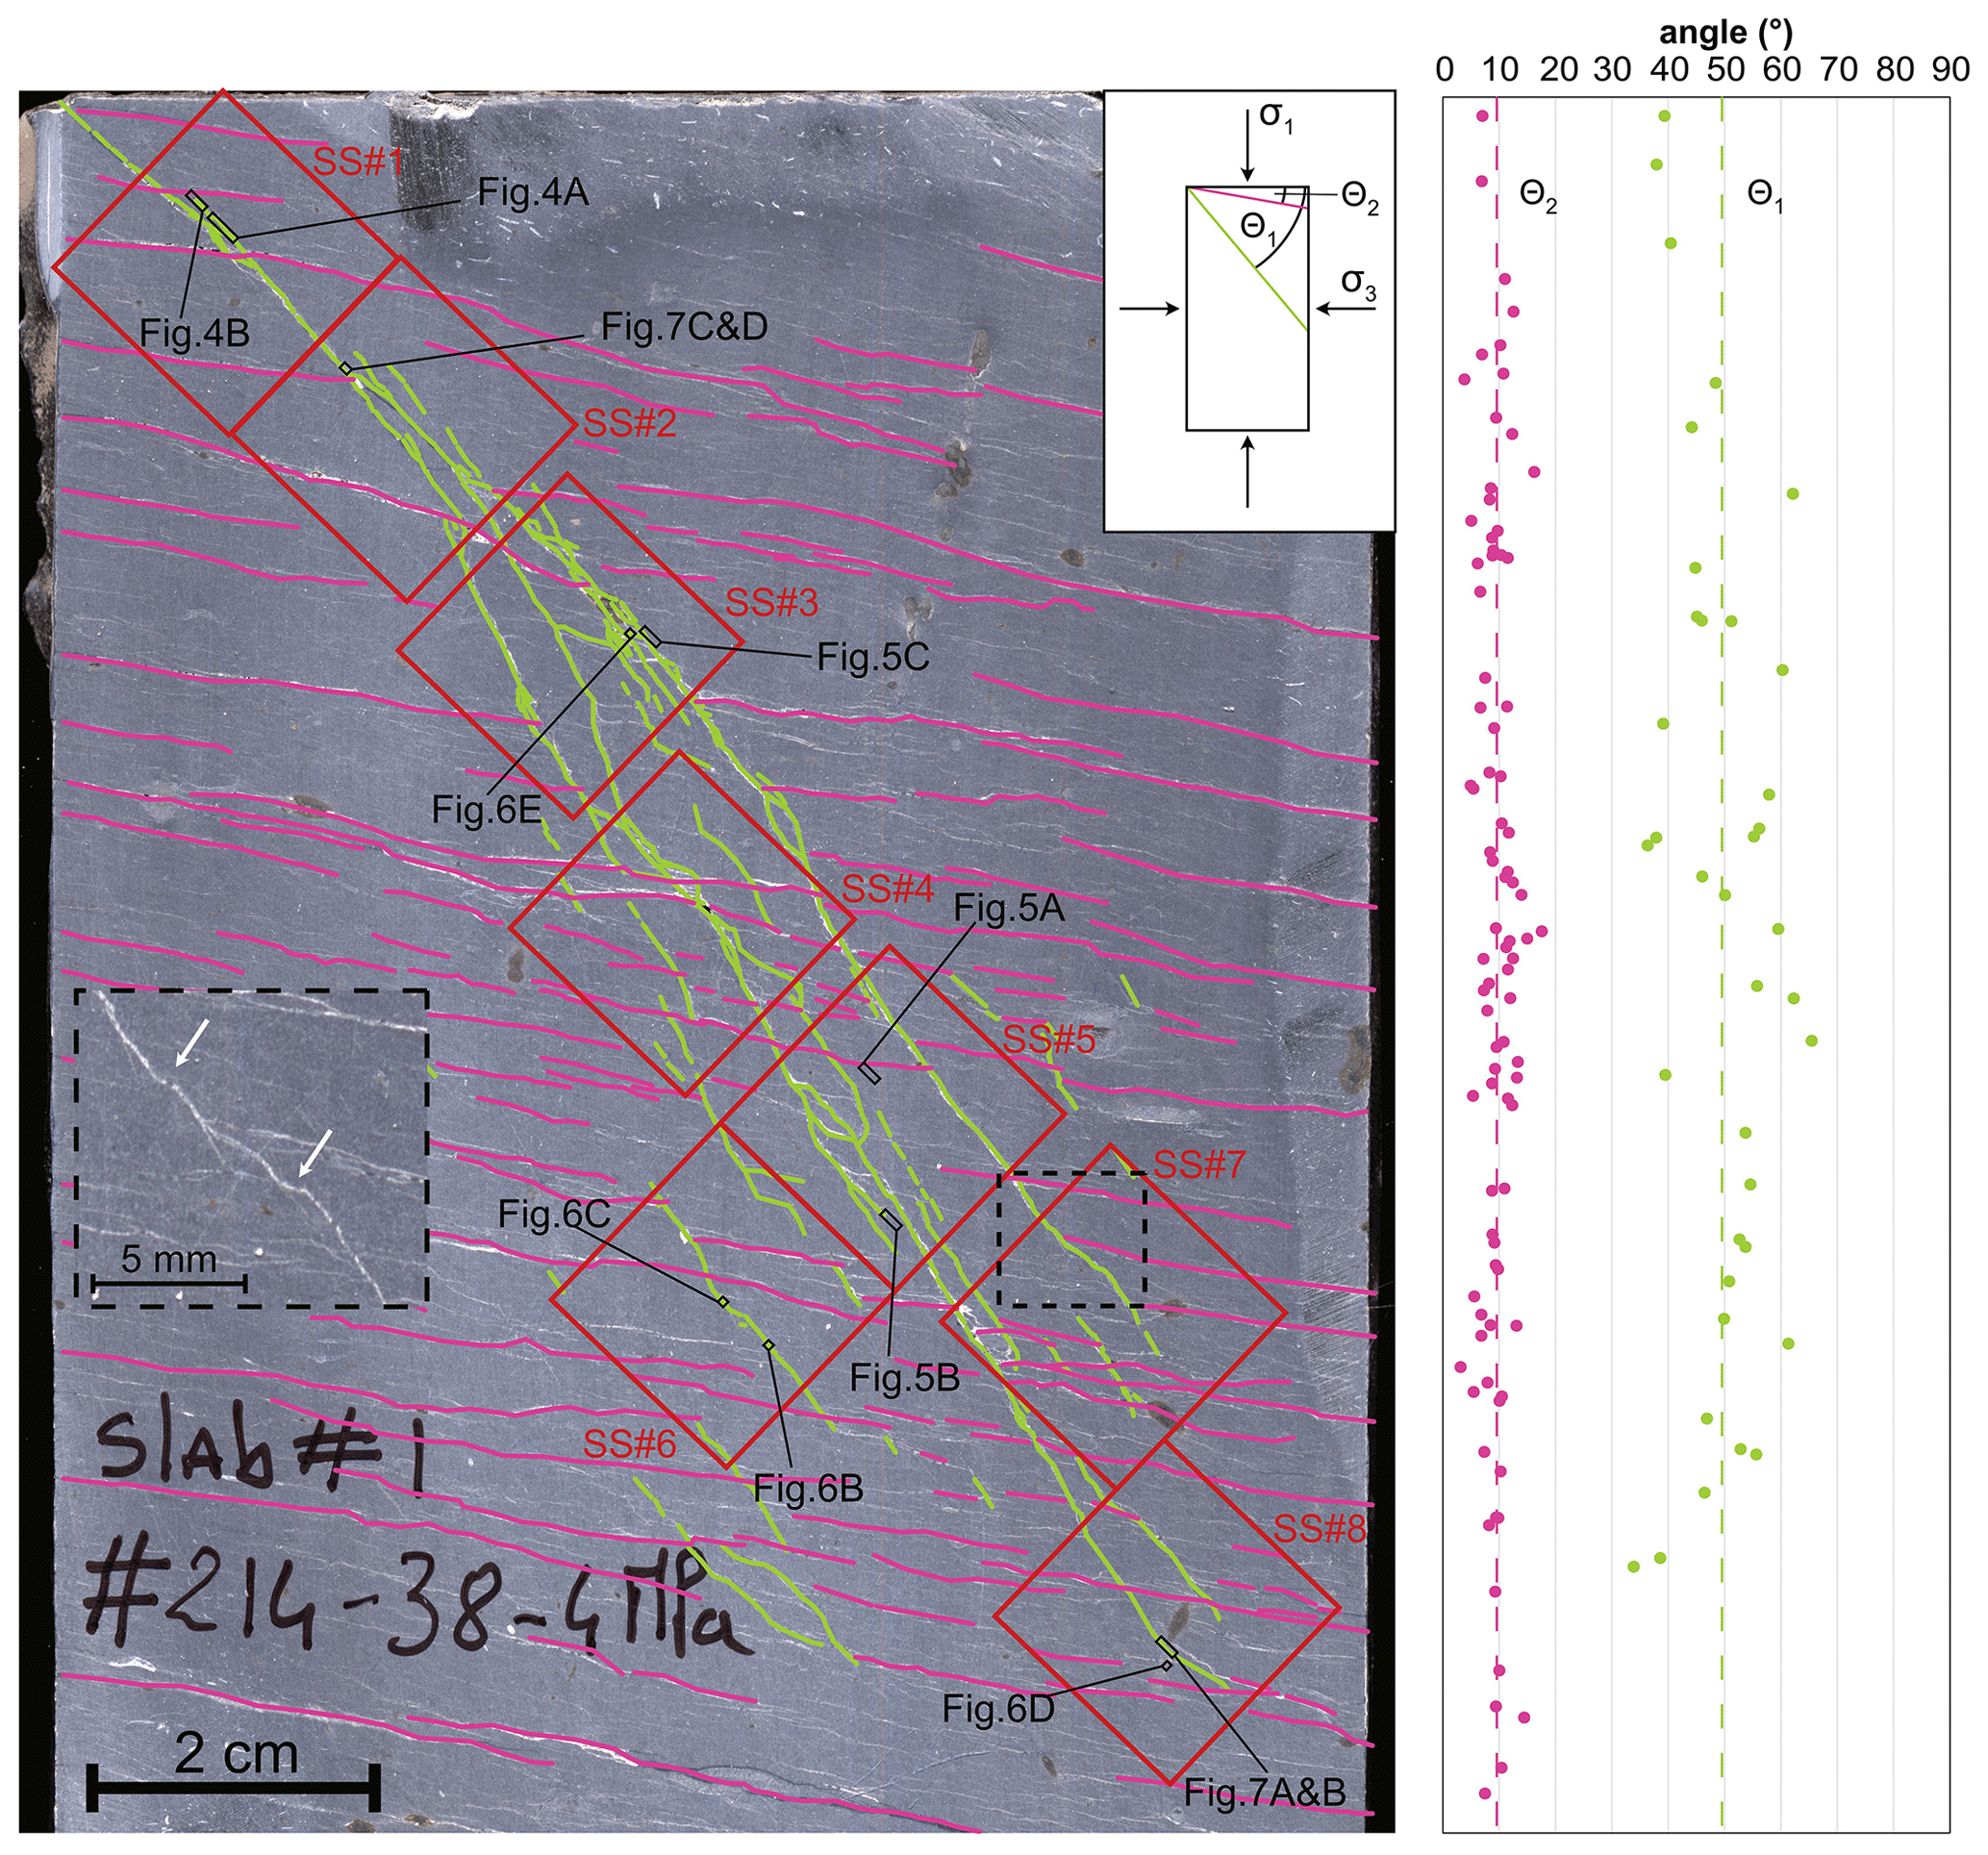
Figure 3Macroscopic observations of the deformed sample. Red boxes indicate the location of the subsamples, and black boxes show the selected regions of interest for large mosaic maps at mesoscale and grain-scale magnifications. The macroscopically mapped fracture network showed two fracture sets: fracture set 1 (green) showed a branching pattern and had an average inclination angle of 49.5∘ (Θ1), whereas the sub-horizontal fractures of fracture set 2 (pink) were inclined by 9.8∘ (Θ2) with respect to horizontal. Angles of mapped fracture set 1 along the sample length showed a slight increase towards the centre of the sample; the angles of fracture set 2 were consistent throughout the entire sample.
The BIB-polished surfaces were imaged with an SEM (Zeiss Supra 55) after surface coating with a 7 nm thick tungsten layer (Leica EM ACE600). Sample areas imaged with SEM were mapped using mosaic imaging at magnifications ranging from ×120 (pixel size of 2440 nm) to ×30 000 (pixel size of 9.8 nm) depending on the total area and level of detail desired. Single images were stitched automatically using the Aztec software (Oxford Instrument, version 2.3) to produce large mosaics.
The typical strategy included imaging the total subsample area with a BSE detector at low magnification (×110–×200, 2730–1508 nm) to provide reference maps for localisation of sub-areas. Regions of interests were selected and imaged with BSE and SE2 detectors at magnifications ranging from ×5000 to ×15 000 (61.8–20.1 nm) to provide mesoscale information about the mineral and pore fabrics. Finally, high-level microstructural details down to the grain and pore scale at magnifications up to ×30 000 (10.0 nm) are imaged with BSE and SE2 detectors to analyse mineral and pore structures. Pore segmentation and quantitative analyses were performed by applying threshold segmentation of SE2 images using the image processing software ImageJ.
Prior to the qualitative description of macrostructures and microstructures encountered, we define the terminology for our observations and the subsequent discussion. First of all, we use – where possible and not explicitly implied in the section title – prefixes such as “macro” or “micro” for structures which are visible with the naked eye or under the SEM, i.e. under magnification of at least ×100. In general, we subdivide where possible the general term “fracture” – the surface formed through an initially intact solid material – into “tensile”, “shear”, or “hybrid fracture” according to their movement along the surface, i.e. normal, parallel, or a mixture of both, respectively. Furthermore, we call broader zones of multiple fractures and deformed microstructure a “deformation band” and the case of elongated zones with increased porosity a “dilation band”; where shearing is interpreted, we use the term “shear band” (see Du Bernard 2002).
3.1 Macroscale observations
The deformed sample showed a fracture network with two fracture sets (Fig. 3). In the following, all angles are defined as deviations from the horizontal, i.e. minimum principal stress direction (see diagram in Fig. 3). The first set (marked in green and further referred to as fracture set 1) was oriented oblique to the horizontal by an average angle of 49.5∘ (Θ1), and the second fracture set was oriented sub-horizontal, i.e. parallel to the bedding, with an average angle of 9.8∘ (Θ2, marked in pink and further referred to as fracture set 2). At the top left corner, the sample showed a single fracture, which splits into branches at a distance of 2 cm from the top. Towards the tips of these branches, the fractures deflected sub-horizontally along bedding-parallel fractures. The inclination of the fracture set changed from approximately 40∘ of the single fracture at the top towards the branches by more than 50∘ in the centre of the sample with respect to the horizontal. The branching fractures (marked in green) displayed an anastomosing pattern forming crudely lens-shaped fragments. Additional oblique fractures sub-parallel to the branching fracture were observed throughout the sample, which are not connected to the central branching fracture but show relay connections between the two fracture sets (Fig. 3, black box).
3.2 Microscale observations
Selected regions for microscale observations were located close to the larger macro-fractures of set 1 (Fig. 3). However, many of the long, high-aperture macro-fractures crossing larger parts of the sample were inferred to contain artefacts produced due to unloading and dust accumulation during sawing and mechanical polishing. Additionally, some locations showed secondary gypsum mineralisation caused by chemical reactions during sample storage before or after the experiment, which was about 5 years. When exposed to air, pyrite will oxidise, creating sulfate, and the presence of Ca ions from calcite (and dolomite) will lead to the formation of gypsum. These mineral alterations are common features also observed in excavation-induced fractures of the EDZ (excavation damage zone; Vinsot et al., 2014; De Craen et al., 2008), and hence the timing of this process could not be determined. Therefore, these regions were excluded from microscale analysis.
The fractures of set 2 and the microstructure within their close vicinity, i.e. the mineral fabric, grain size, and pore structure, corresponded to intact shaly OPA samples analysed by Houben et al. (2013, 2014). These bedding-parallel microfractures were inferred to have formed in response to drying, preparation, and/or unloading (Houben et al., 2013; Soe et al., 2009) and were therefore interpreted to have formed during and after the experiment. The obliquely oriented fractures of set 1, however, correspond to localised deformation. In general, the deformation was presented in the form of tensile microfractures or in the form of elongated zones indicating shearing. Both cases comprised varying local dilatancy.
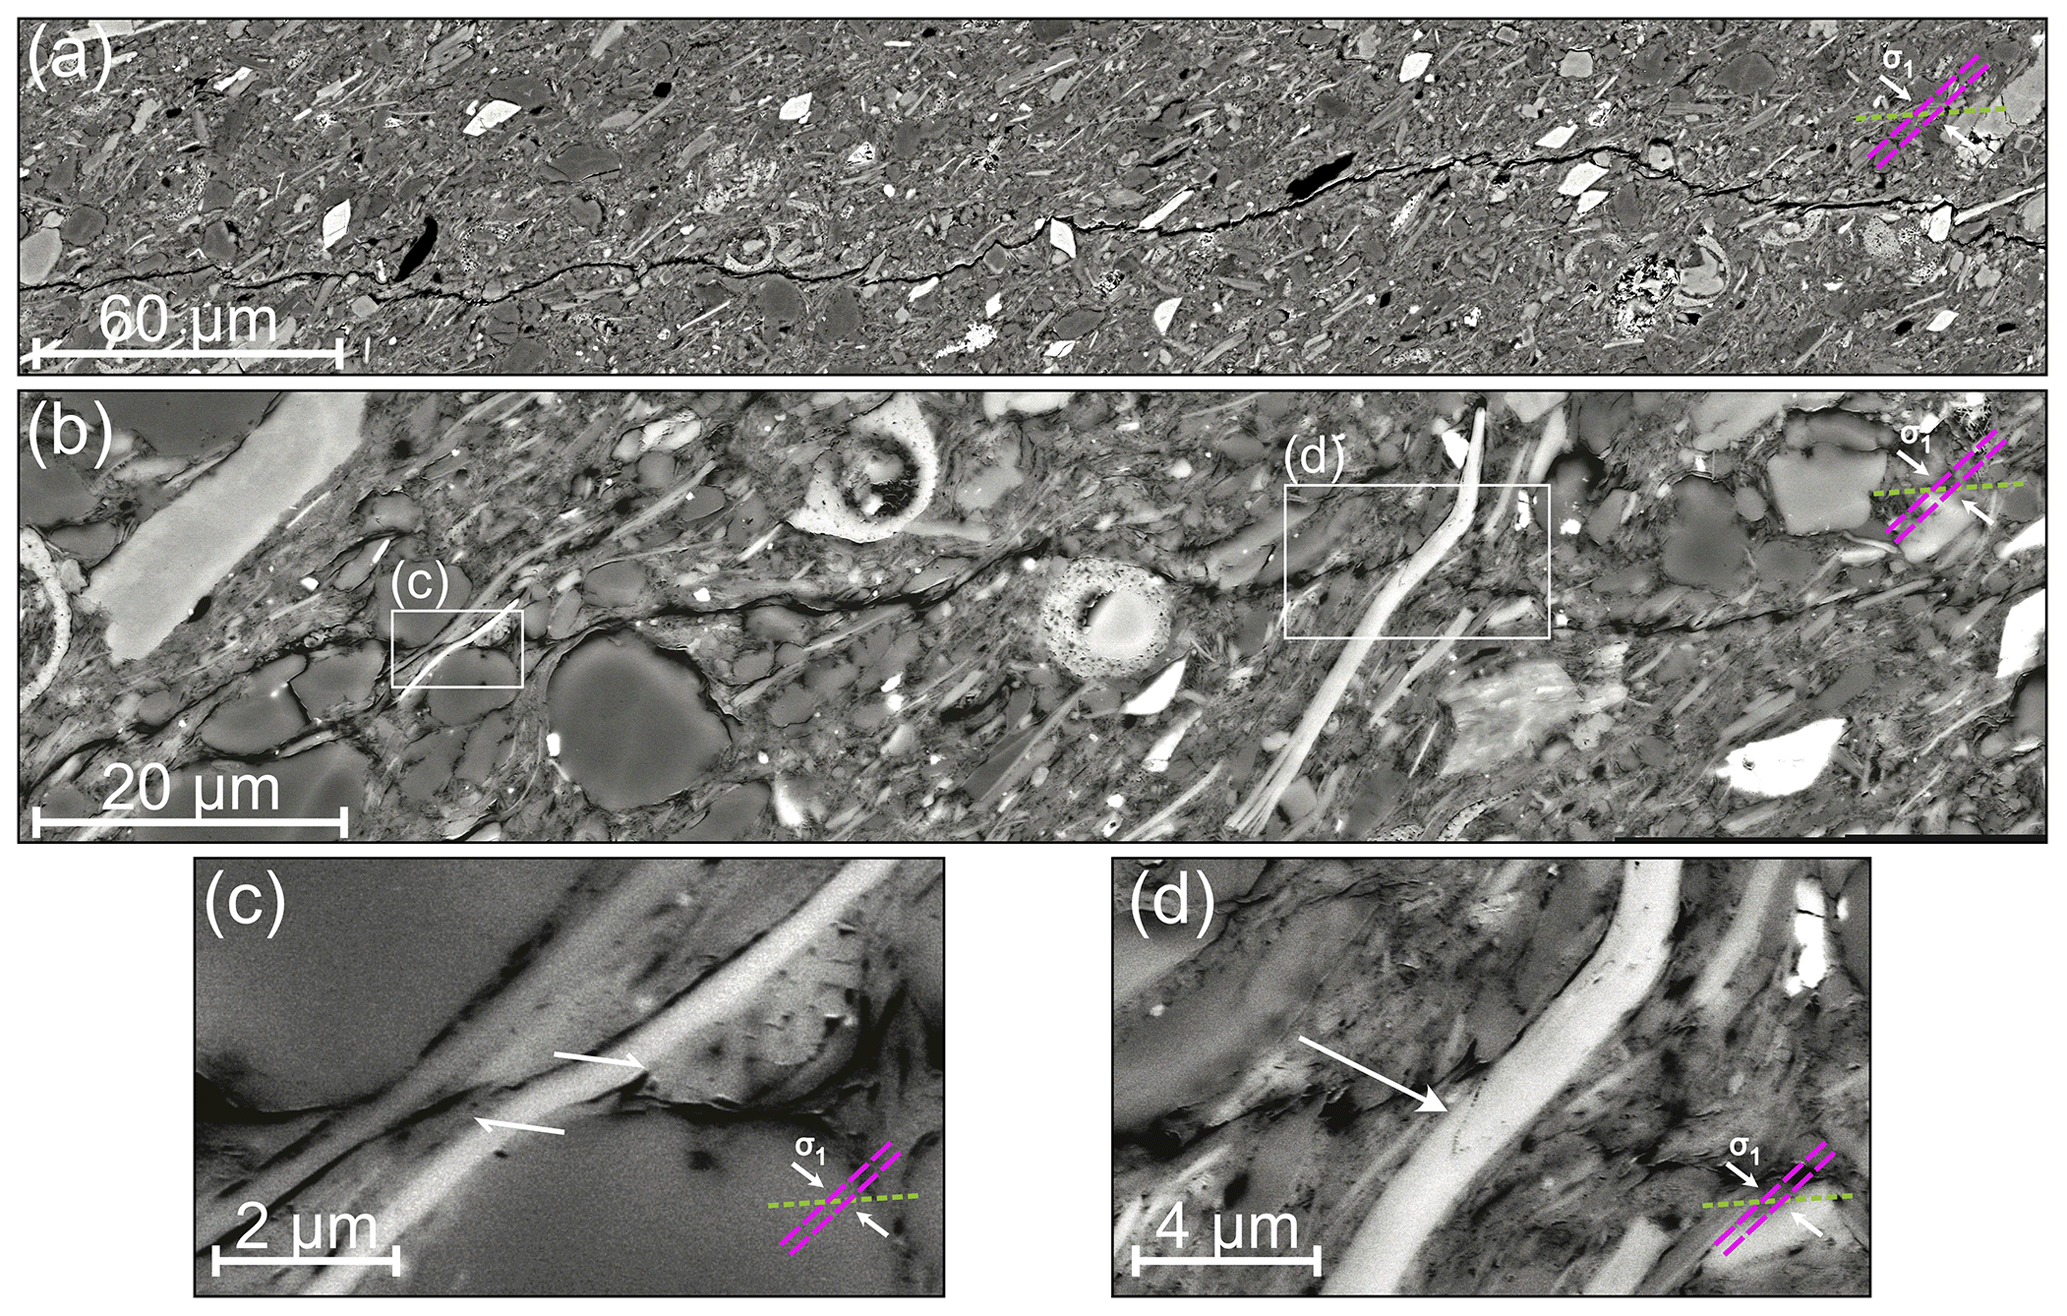
Figure 4BIB–SEM micrographs (BSE) showing microfractures of variable sizes with apertures of a few micrometres, which cross the bedding obliquely. Fractures formed along larger grains (a) or across elongated mica grains (b) by either creating shear displacements (c) or brittle transgranular fractures (d). Maximum loading direction, macroscopic fracture set 1 (green), and bedding direction (pink) are indicated for each micrograph in this and all subsequent figures.
Microfractures, which belong to fracture set 1, were often oblique to bedding with angles in the range of 40 to 55∘ with respect to the horizontal. Their apertures were up to a few micrometres and they had variable lengths (Fig. 4). The fractures mainly formed in the clay matrix, whereas adjacent larger components, such as shell fragments and quartz grains, remained intact. In a few cases, the fractures crossed larger, elongated mica grains, producing intergranular fracturing or bending (Fig. 4c, d). Locally, multiple dilatant fractures formed an anastomosing network with lens-shaped microlithons of up to 50 µm width (Fig. 5a, b). The foliation within these microlithons, which is indicated by the shape-preferred orientation (SPO) of elongated grains and pores, is deflected towards the fractures. Some of these deformation structures showed less dilatancy, mostly ductile deformation, and a more pronounced shear component on the grain scale (Fig. 5c). Here, the SPO of non-clay minerals and clay aggregates was oblique with respect to the bedding and curved according to the shear sense of the microfracture. Additionally, thin mica grains were bent according to the shear sense or intersected by a fracture.
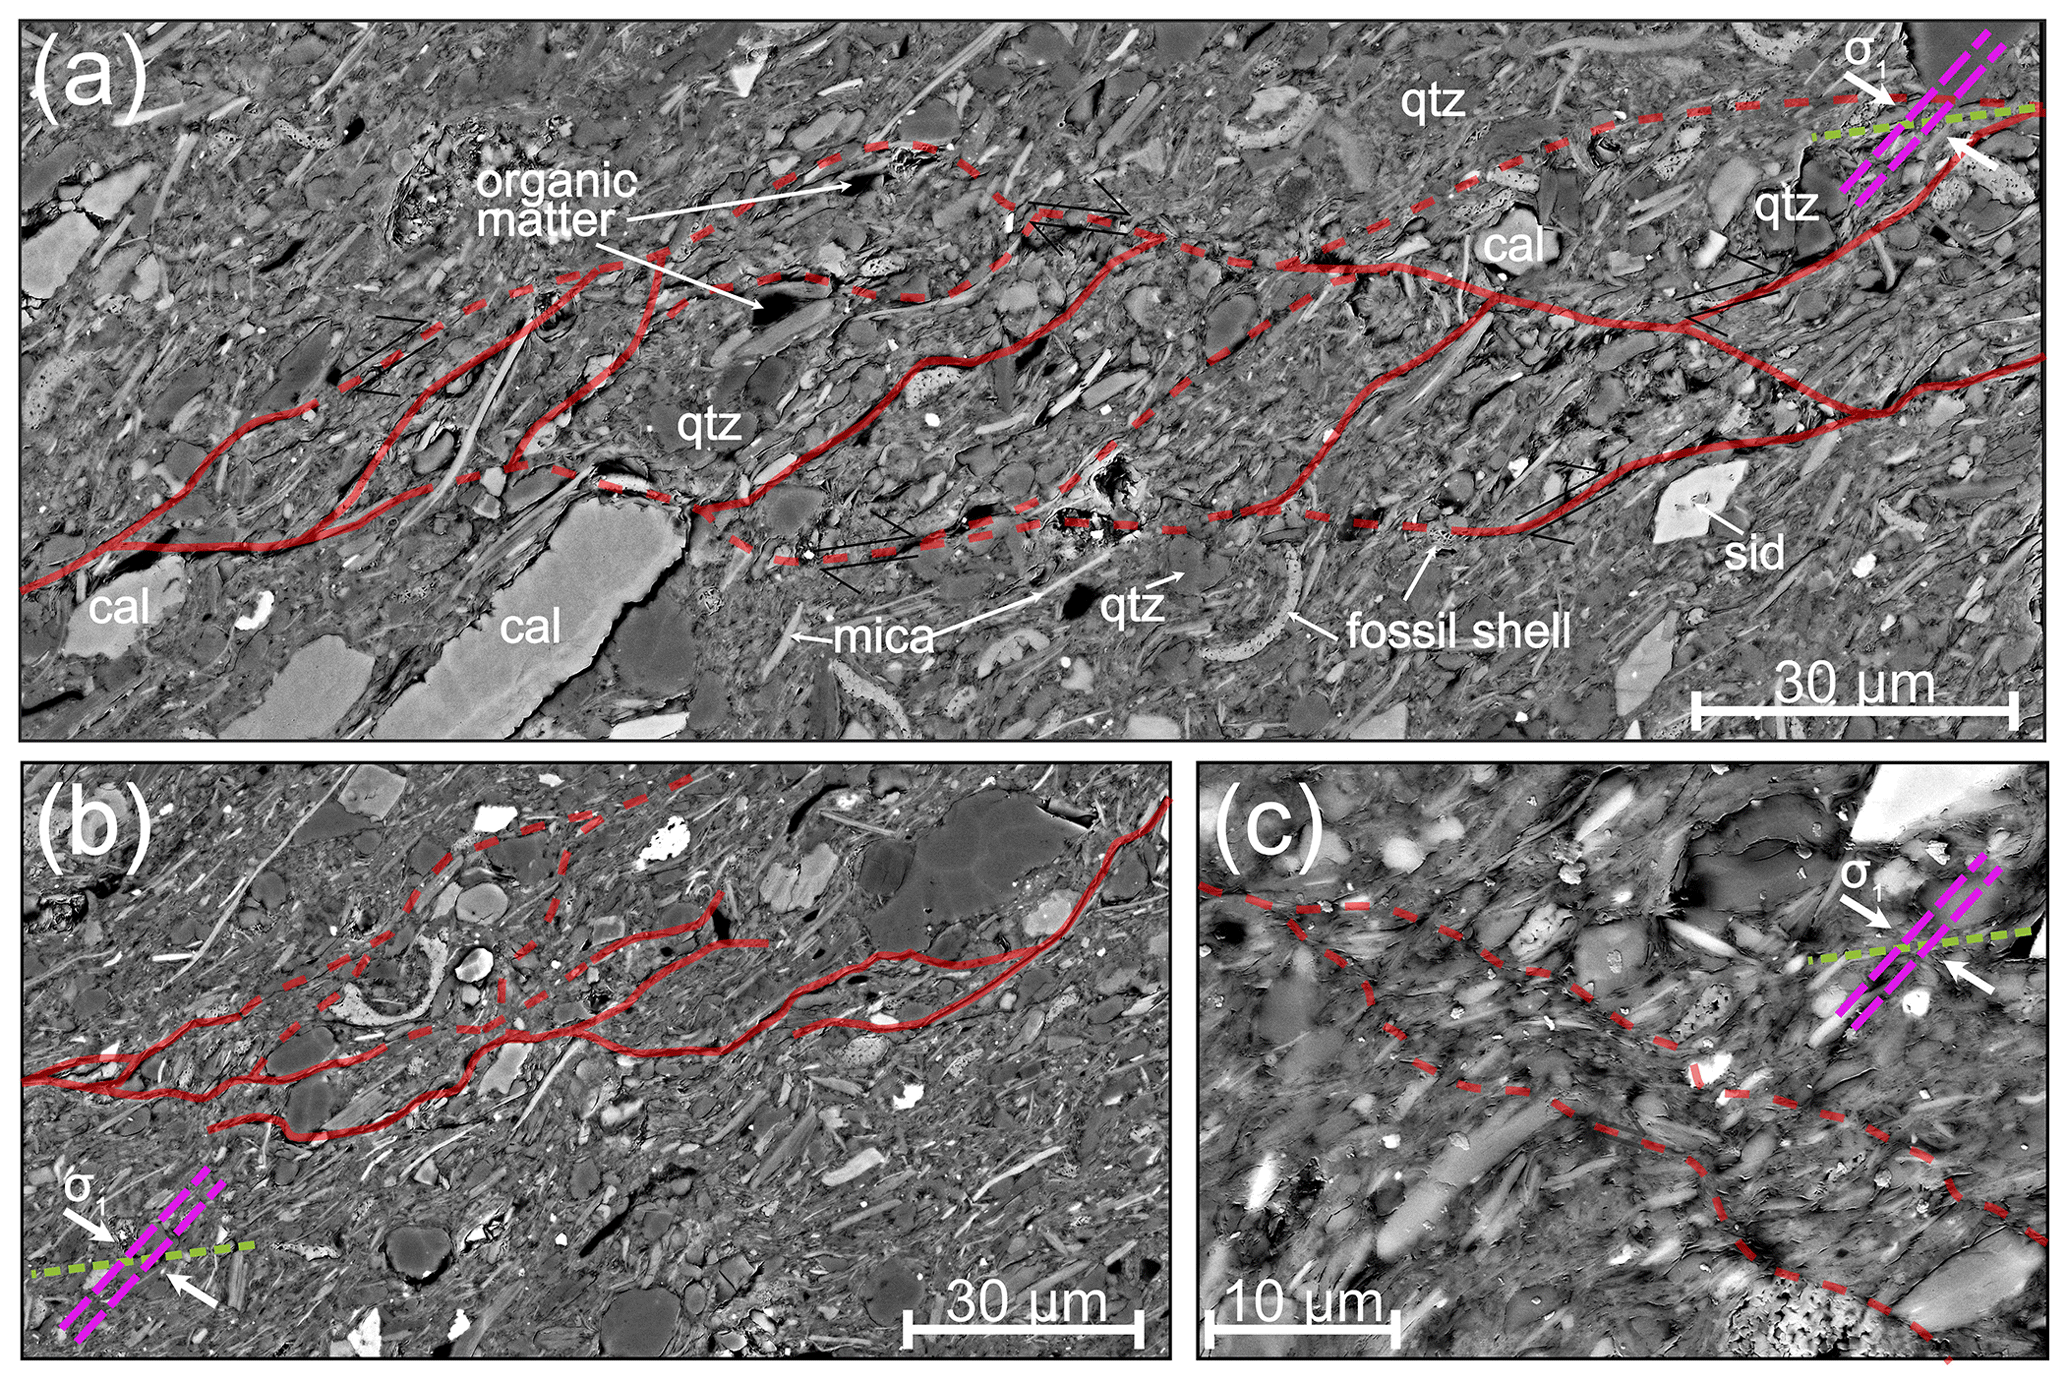
Figure 5BIB–SEM (BSE) micrographs showing typical deformation structures associated with both brittle and ductile deformation. Red lines indicate strain localisation in the form of fractures (a, b) or lineations of shear displacement (c). (a) Anastomosing intergranular fractures with apertures of some micrometres formed lens-shaped islands, whereas some grains displayed intragranular fractures. Panel (b) shows fractures with intergranular porosity, which formed a network that is not fully developed with minor indications of ductile deformation by clay-layer bending. Panel (c) shows a deformation band with low porosity and predominantly ductile deformation indicated by the change in particle alignments.
Apart from the microfractures and small strain regions, elongated deformation bands of variable widths up to tens of micrometres in thickness and different deformation intensities were be observed. In these zones, structural deformation included a variety of brittle and ductile deformation markers: disintegrated framboidal pyrite aggregates, broken and fragmented or collapsed fossil shells, broken calcite and silica grains, intergranular and transgranular fractures, bent and broken mica grains, delamination of clay aggregates, and a change in foliation indicated by a rotated SPO of clay aggregates (Fig. 6). In the latter case, the original SPO was broken up and elongated grains re-oriented to a parallel alignment with the elongated deformation band and, hence, the shear movement.
The deformation bands indicated zones of increased porosity (see the so-called “dilation bands” of Du Bernard et al., 2002) and were usually located in the vicinity of the larger macro-fractures shown in Fig. 3. Locally, narrower bands formed around large, angular, and preserved matrix fragments with sizes up to 20 µm. The structure within these bands showed varying deformation intensities. Its characteristic microstructure shows individual grains separated from the surrounding, often indicated by porous rims, and clay aggregates as well as pores with a random distribution and in a loss of SPO (Fig. 7). These bands with widths of up to 50 µm hosted a variety of deformation markers and showed increased porosity in rims around larger quartz grains by the break-up and disintegration of clay particles forming “saddle-reef pores” (Figs. 6, 7a, b) and by the disaggregation of collapsed fossil fragments and pyrite aggregates (Fig. 7c). Additionally, they presented intragranular and intergranular fractures, kinking of mica grains, or a loss of SPO of clay aggregates and elongated pores. The transition between the deformed and undeformed zone appeared as a sharp boundary.
3.3 Pore size analysis
Qualitative observations of increased porosity within the deformation bands were verified by statistical pore size analysis. Figure 8 shows cumulative pore size distributions derived from binarised, segmented SE2 images within and outside the deformation band for two different subsamples. The subsample locations are shown in Fig. 7 (blue boxes). Cumulative visible porosity in the undeformed zones was 2.84 % and 4.07 % for sub-areas from subsamples SS no. 2 (Fig. 8a) and SS no. 8 (Fig. 8b), and for the deformed zones two sub-areas for each subsample yielded porosities of 16.13 % and 21.16 % as well as 8.79 % and 9.84 %, respectively. Furthermore, undeformed zones are characterised by a larger portion of smaller pores, i.e. ≤ 0.006 µm2, and a minor portion of larger pores, i.e. ≥ 0.02 µm2, compared to the deformed zones.
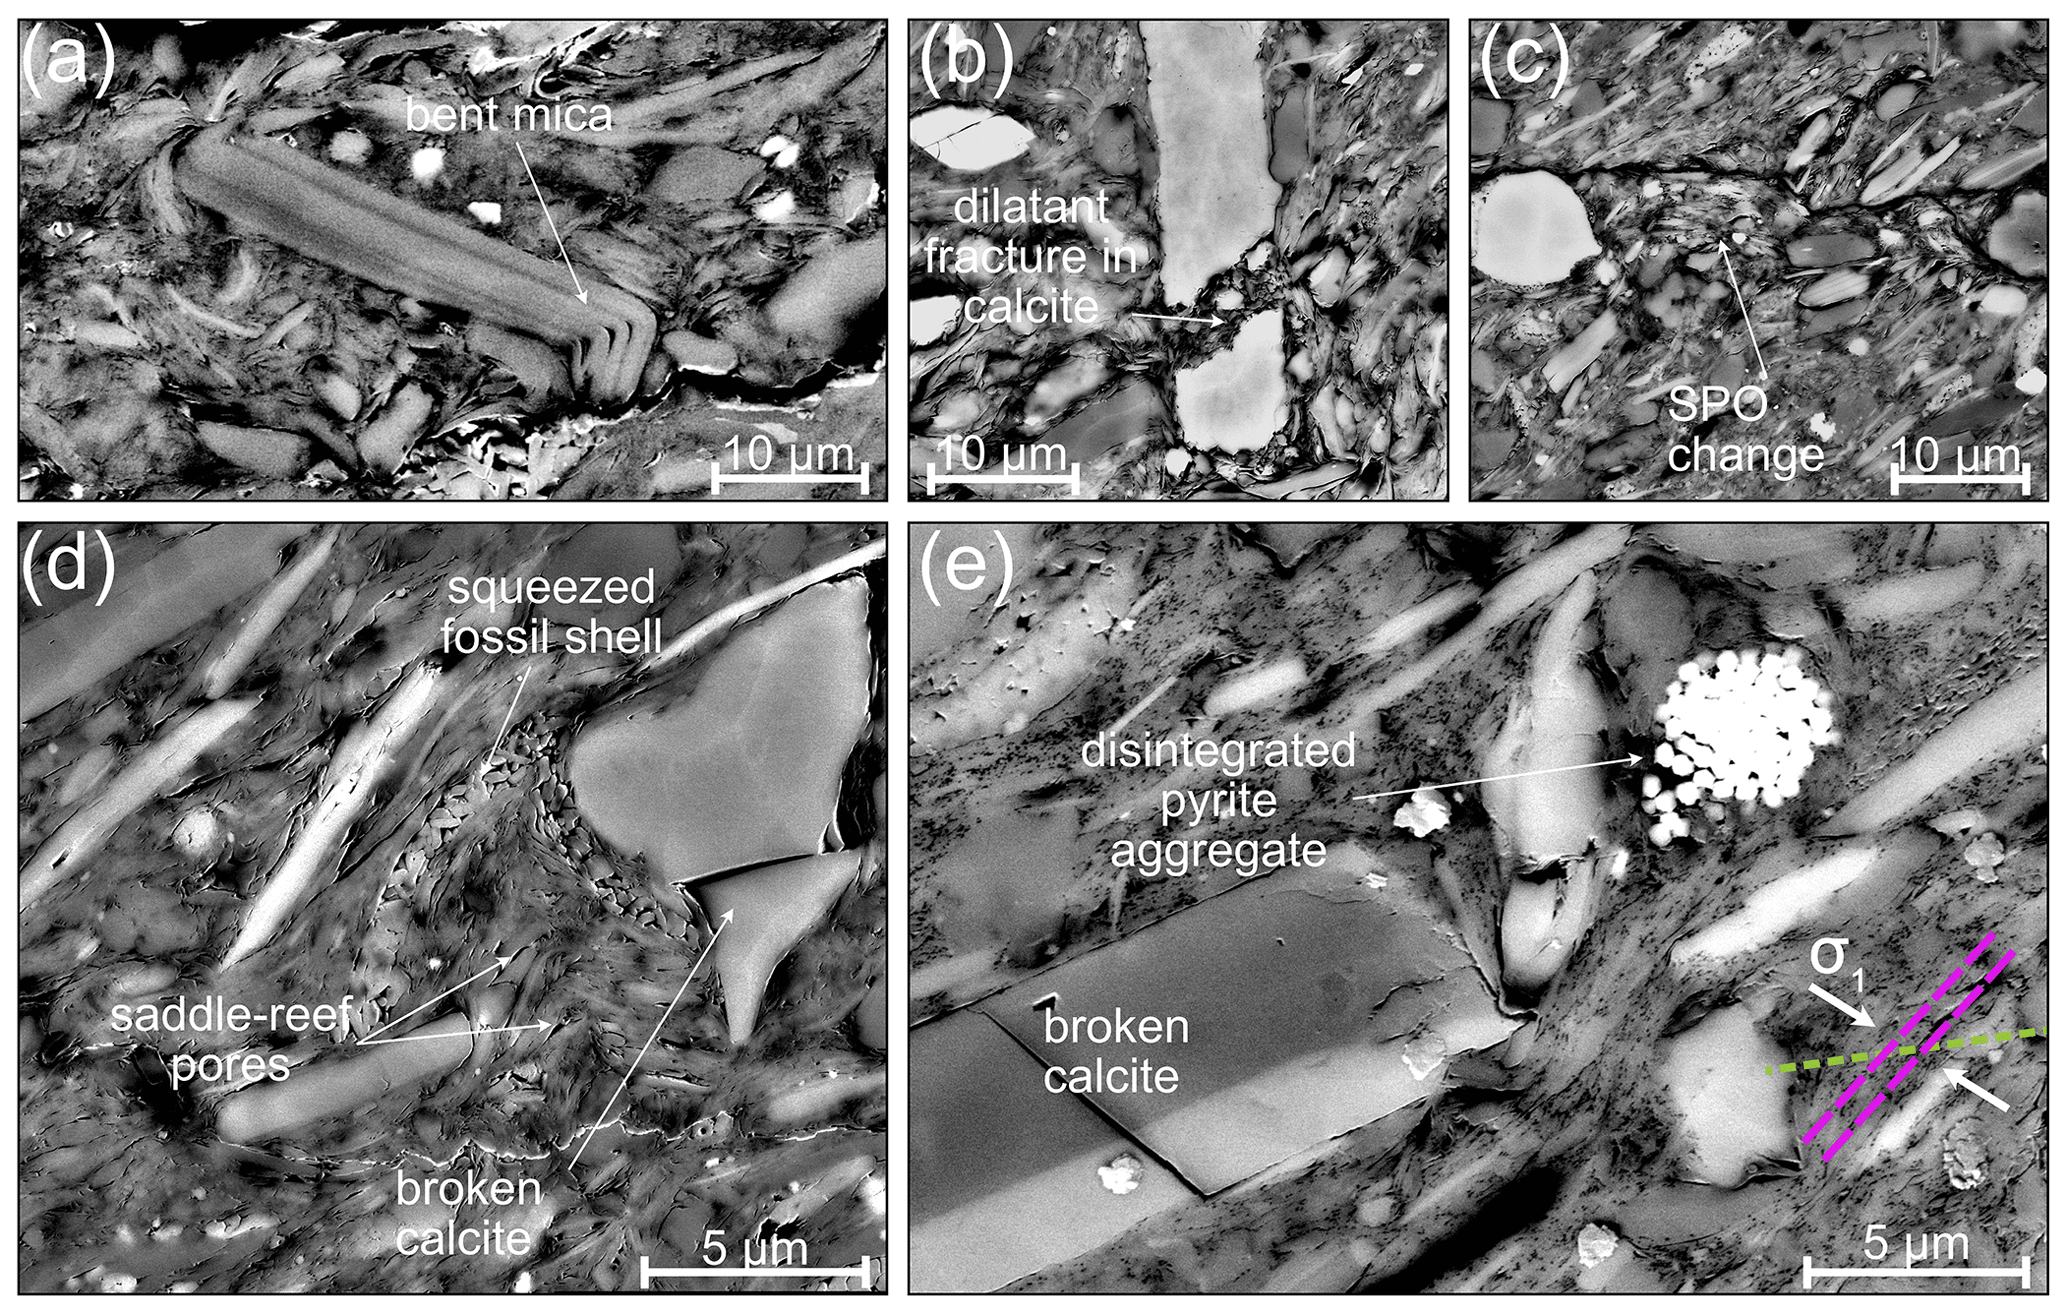
Figure 6BIB–SEM (BSE) micrographs presenting different deformation markers: bent and delaminated mica grain (a), dilatant fracturing of calcite grain and matrix fill (b); loss of shape-preferred orientation (SPO) of clay aggregates and elongated minerals parallel to the direction of displacement (c); squeezed and broken fossil shell, broken calcite grain, and “saddle-reef pores” (d); and broken calcite grain and disintegrated pyrite aggregate (e). The illustration of loading direction, macroscopic fracture (green), and bedding direction (pink) in (e) applies for all micrographs in this figure.
4.1 Deformation mechanisms
The two prominent macro-fracture sets (Fig. 3) were formed due to different processes. Fracture set 1 is associated with shrinkage due to drying when the material is exposed to air. Bedding-parallel fracture formation is commonly found in clay-rich rocks at the microscale and macroscale (e.g. Soe et al., 2009; Ewy, 2015; Fauchille et al., 2016). Mechanical forces acting on the sample during preparation as well as oven-drying and storage between experiment and BIB–SEM analysis can promote artificial fractures. Analyses by Houben et al. (2013) showed that different drying techniques of OPA produces the same undeformed microstructure between the unwanted artificial fractures. The undeformed microstructure in the vicinity of these fractures was indistinguishable from the microstructure of undeformed OPA and is therefore not associated with damage in the triaxial experiment. Fracture set 2, however, is dominated by both brittle and ductile deformation. The general orientation of the macro-fractures with respect to horizontal showed an average inclination of ca. 50∘ and was consistent with the orientation of microfractures (Fig. 4) and elongated deformation bands (Figs. 5, 7) showing inclinations between 40 and 55∘. Observations of the sample surface after the experiment revealed macroscopic oblique and bedding-parallel side steps which were connected via relays (Amann et al., 2012). After drying and sample preparation for the SEM analysis, these side steps appeared on the microscale as tensile fractures along the bedding, i.e. with inclinations of approximately 9∘ towards the horizontal, but could not be distinguished from bedding-parallel desiccation fractures, which were ubiquitous within the sample. Indications of shearing along these side steps could not be inferred from our SEM analysis. Fracture kinking or deflection is a common process in anisotropic rocks and is due to the competing influences of applied load direction and the direction of anisotropy plane (Forbes Inskip et al., 2018; Nejati et al., 2020). Our observations suggest that both factors play a role for fracture orientation and propagation since, on the grain scale, fractures cross the bedding and form along bedding (Figs. 4a, 5). However, more work on samples with various loading configurations is required to quantify the influence of mechanical anisotropy on the fracture orientation.
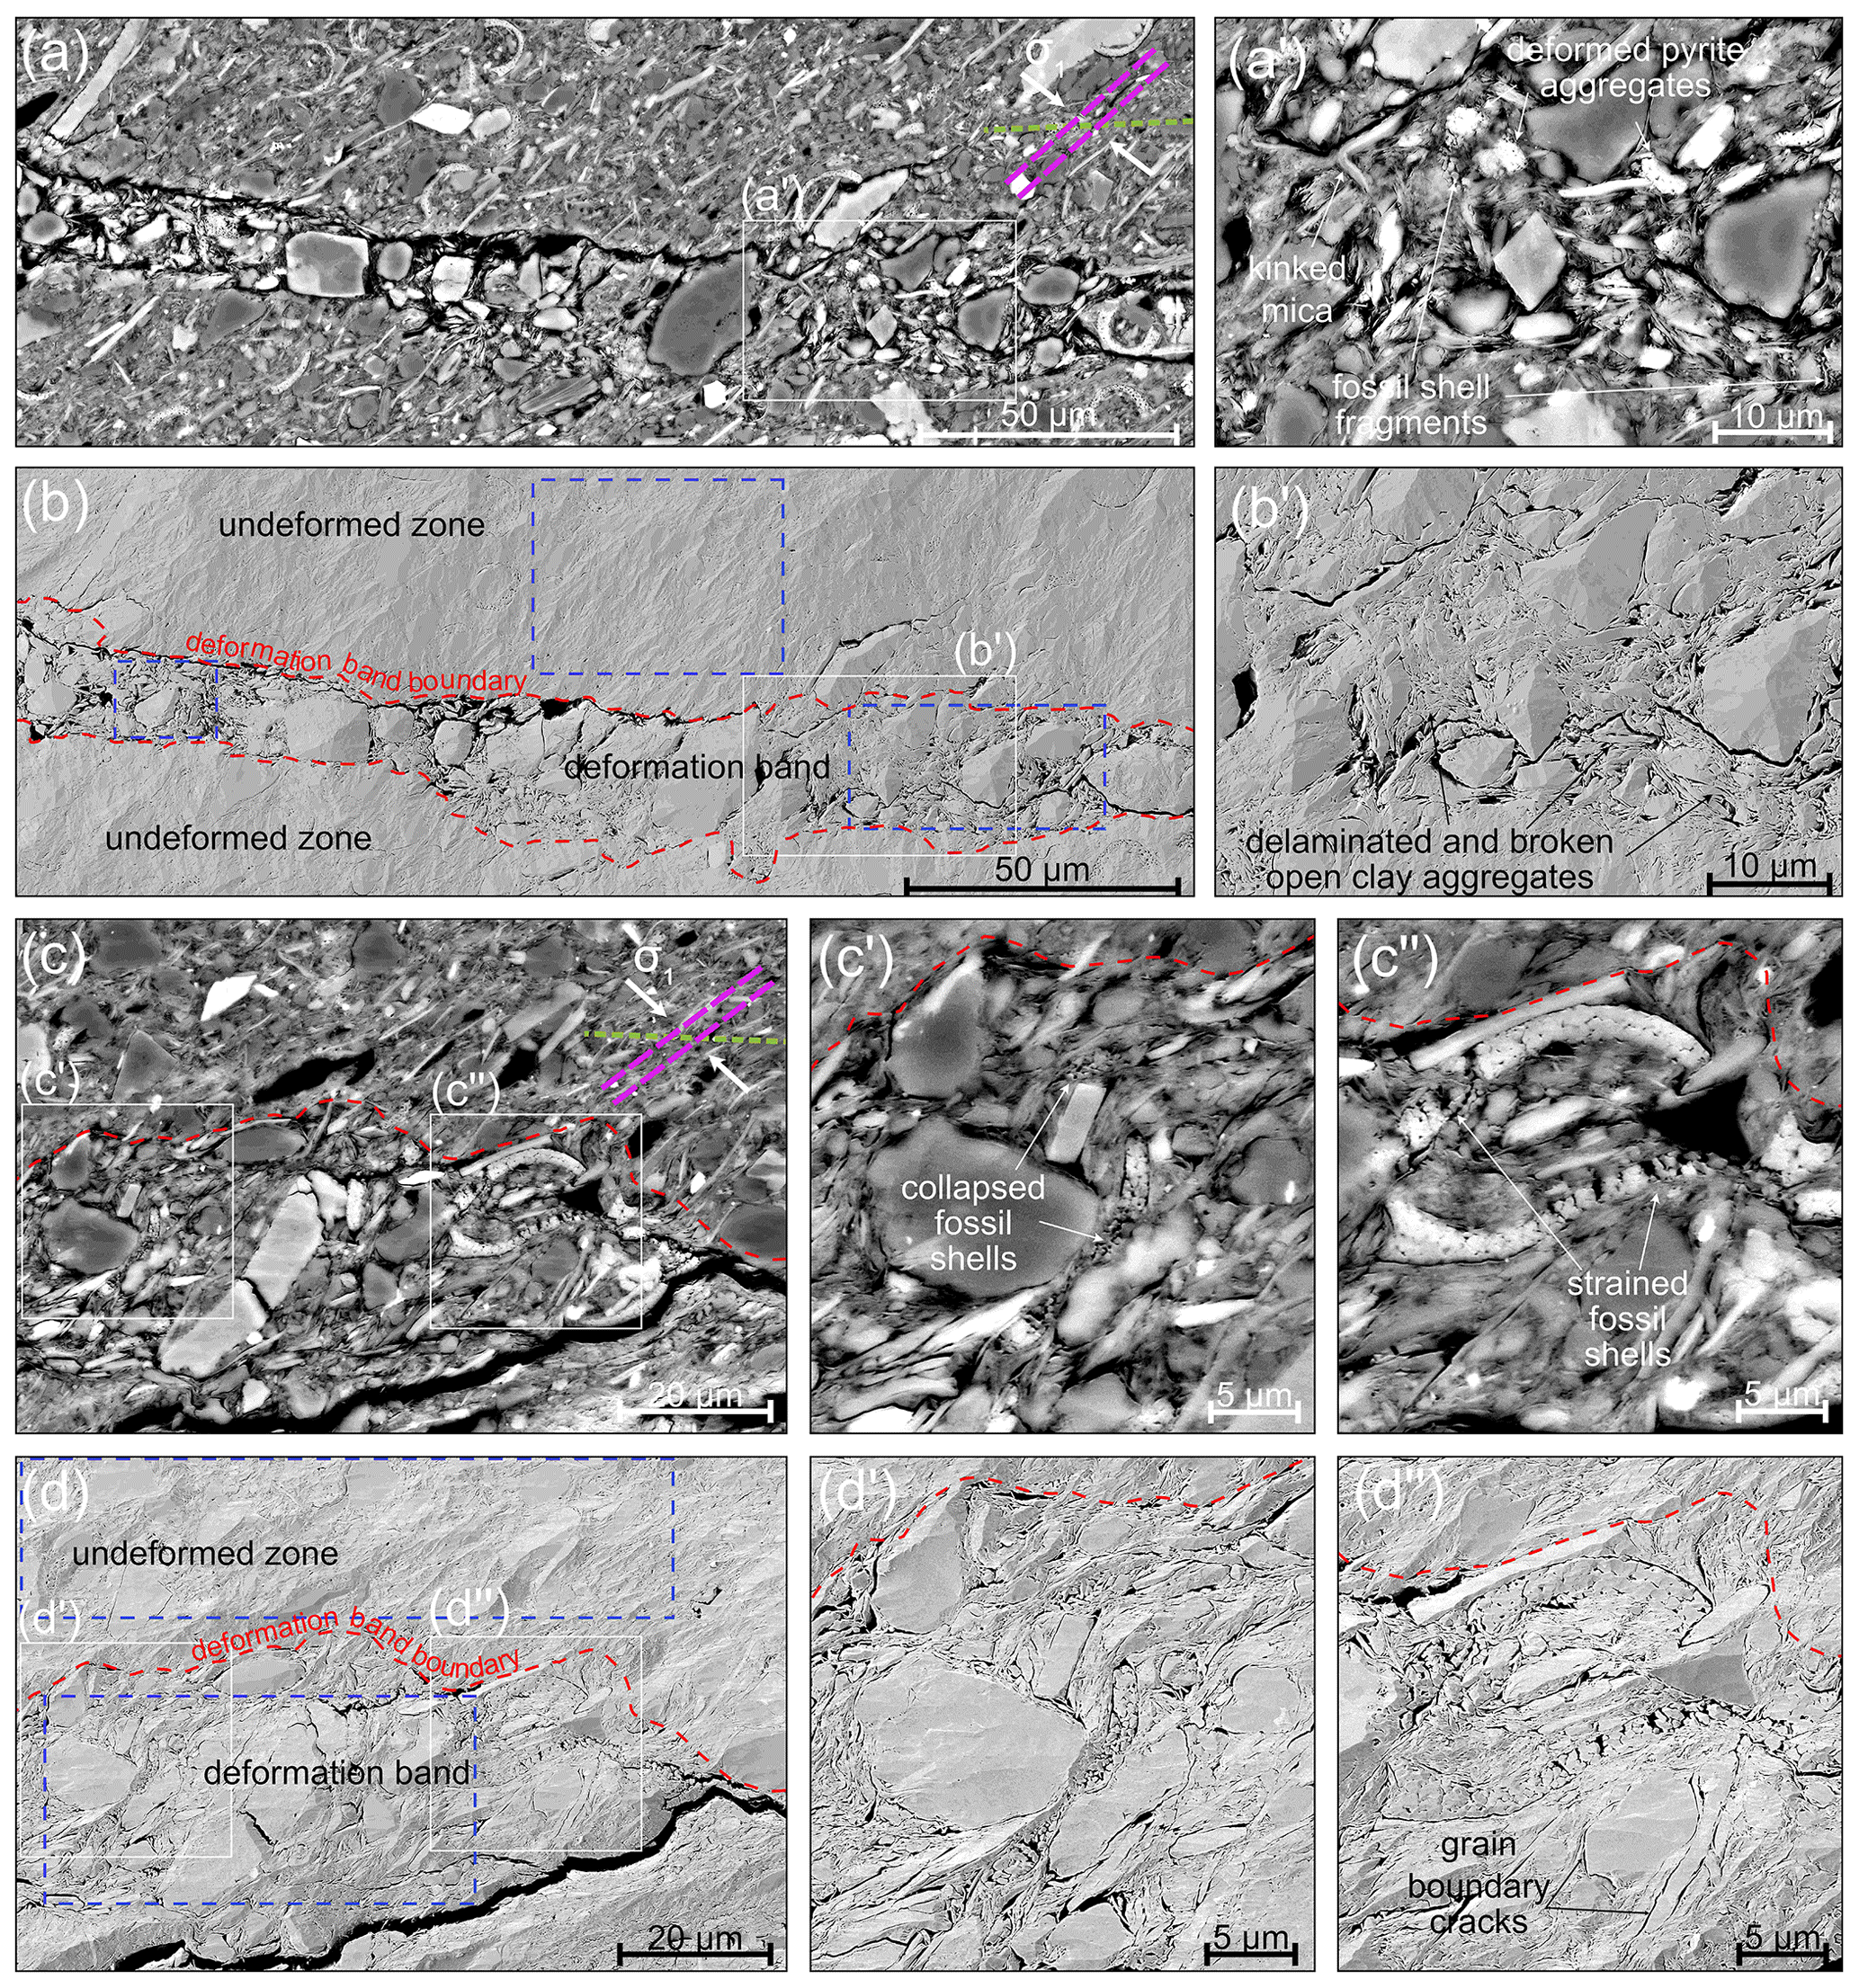
Figure 7BIB–SEM micrographs showing a zone of increased porosity. Panels (a, a') and (c, c' ,c”) are BSE images indicating the grain structures within the dilatation band of up to 25 µm thickness. The detailed micrograph (a') shows typical strain indicators such as kinked mica, deformed pyrite aggregates, and remnants of fossil shells. Panels (b) and (b') are SE2 images showing the pore structure with considerably increased porosity along and within the deformation band, as well as the delamination of clay aggregates at higher magnification. Panels (c) and (c', c”) present intragranular fractures and strained as well as collapsed and disintegrated fossil shells. The SE2 image (d) shows an increased number of fractures within the deformation band, as well as increased pore space between disintegrated shell fragments and clay aggregates (d'). Panel (d”) displays grain boundary fractures, which appear as porous rims around quartz grains. Blue boxes indicate the locations where porosity has been measured.
In general, the deformation of both the clay-rich matrix and larger quartz, calcite, and mica grains as well as pyrite aggregates is governed by brittle or ductile processes. On the one hand, grain-scale clay splitting, grain abrasion, and intragranular and intergranular fracturing point to cataclasis localised in the deformation band. On the other hand, re-orientation of clay aggregates and bending of elongated grains indicate structural reworking on the grain scale to enable granular sliding. The former processes suggest a local loss of cohesion, whereas the latter process enables the development of a new foliation parallel to the shear direction. The rock rheology is thus dominated by mixed-mode deformation due to the distributed contrasting stiffness of the multi-component mineralogy. Besides many other factors controlling the bulk failure behaviour, e.g. the amount of effective stress, the orientation of applied stresses, temperature, and deformation rate (Popp and Salzer, 2006; Giger et al., 2018; Wild and Amann, 2018), our microstructural observations of OPA promote an intermediate tendency to brittle behaviour compared to other clay-rich rocks, e.g. the Callovo–Oxfordian mudrock (COx) from France and the Boom Clay (BC) from Belgium. The deformation mechanism of COx under triaxial compression is mainly associated with cataclastic mechanisms by grain and matrix fracturing, abrasion, and comminution (Desbois et al., 2017). In contrast, deformation mechanisms in BC consist of pore collapse outside the shear zone and grain boundary sliding as well as particle rotation within the shear zone (Oelker, 2019; Schuck et al., 2020). We note here that these experiments were conducted up to axial strains of ca. 6 % and 20 %, respectively. The deformation structures and inferred mechanisms can be related to the amount of calcite, which serves as the cementing agent in these rocks (Klinkenberg et al., 2009; Kaufhold et al., 2013). For OPA, a large amount of calcite is part of the fossil shells rather than diagenetic bonding.
Deformation bands showed an increased internal porosity compared to the surrounding microstructure (Fig. 7). The abundant intragranular and intergranular fractures, the delamination of clay aggregates creating saddle-reef pore structures, i.e. the pore space created at the hinge of a kinked or folded mineral (see Hildenbrand et al., 2005), and the strained and collapsed fossil fragments within these dilated zones created the space required for particle movement and led to a locally increased porosity. Porosity values based on SE2 image segmentation of different sub-areas were 4 to 5 times higher inside these deformation bands compared to the intact rock (Fig. 8). The pore size distribution showed a higher number of smaller pores in the undeformed zone and a higher number of larger pores within the deformed zone. We note here that the estimated porosity may be underestimated due to the resolution of our SEM images. However, Houben et al. (2014) showed that porosity upscaling from a power-law distribution function of pore sizes yields porosity values which are in the range of values determined by e.g. water loss porosity measurements. Our estimations of visible porosity outside the deformation bands are in agreement with that of undeformed OPA from the shaly facies of MT-URL (Houben et al., 2014). On the other hand, the porosity may be overestimated as part of it could have formed during unloading of the sample. If we assume that during unloading the compressibility is roughly equal in and outside deformation bands, then the ratio of porosity within and outside the deformation bands remains constant. Keeping all the above in mind, we infer that the deformation bands formed a local increase in porosity during the experiment.
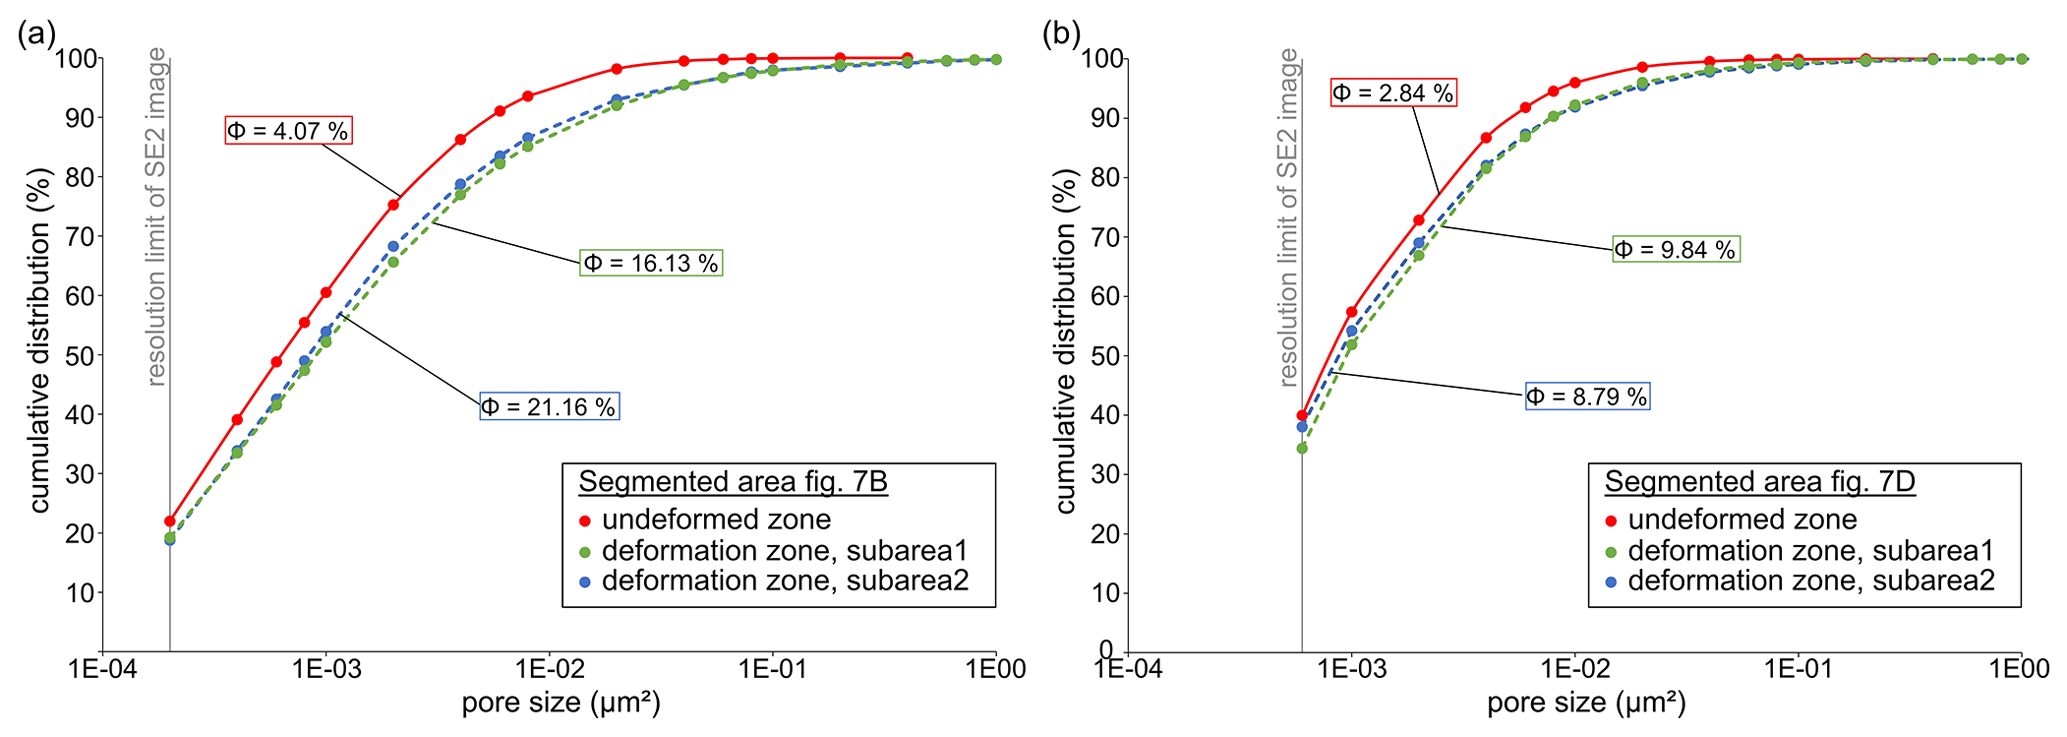
Figure 8Pore size distributions of undeformed and deformed OPA based on SE2 image segmentation from Fig. 7b and d. Deformed zones present an increased porosity by a factor of 4 to 5 and show a higher portion of larger pores. Note that porosities estimated from SEM image segmentation are underestimated due to the limited image resolution of µm2 and µm2, respectively.
4.2 Damage accumulation during compressive loading
In our triaxial experiment, we observe that elastic and irreversible inelastic deformation occurred and that both occurred simultaneously. Elastic deformation took place by deformation of the solid component and of pores – this was inferred to be reversed by unloading the sample. From our SEM investigations, plastic deformation was governed by damage accumulation in deformation bands, but also by homogeneous matrix bulk compaction (see Allirot et al., 1977). Bulk compression in clay-rich rocks is associated with clay matrix compaction and pore collapse (Schuck et al., 2020). However, matrix compaction is difficult to image as a large portion of pores in the clay matrix is at the nanometre scale (Houben et al., 2014; Hemes et al., 2016; Klaver et al., 2015), which cannot be resolved using an SEM. For the case of localised plastic deformation, the microstructural analysis showed local damage accumulation in the form of (i) micrometre-thin microfractures (fracture set 1) with a strong preferred orientation of 50∘ towards horizontal (Fig. 3) and (ii) wider deformation bands with increased porosity. The deformation markers (Figs. 4–7) are inferred to have formed due to shear failure since these are absent in the microstructure of tectonically undeformed OPA samples from MT-URL (Houben et al., 2013, 2014). Furthermore, Winhausen et al. (2021) analysed the microstructure of a shaly OPA sample, which has been used for hydraulic testing at maximum 24 MPa effective stress, and found no deformation features. Their comparison to a non-loaded twin sample and to other microstructural studies on OPA indicate no structural damage due to isostatic loading at this effective stress (Winhausen et al., 2021).
The formation of loading-parallel, dilatant microfractures as a response to axial compression is well known in brittle-deforming, hard rocks (e.g. Bieniawski, 1967; Scholz, 1968; Tapponier and Brace, 1976). Similarly, microfracturing during compressive deformation has also been demonstrated for OPA by micro-acoustic emission (Amann et al., 2012) as well as P- and S-wave velocity measurements (Popp and Salzer, 2007). Amann et al. (2012) showed that fracture initiation, which is the point at which the volumetric strain curve deviated from linearity (“crack initiation” in Amann et al., 2012), occurs long before the stress peak at approximately 2 MPa differential stress independent from confining stress. Corkum and Martin (2007) discussed uniaxial and triaxial tests on OPA and presented similar results. They associated the opening of microfractures with damage by the breaking of diagenetic bonds in tensile failure, which ultimately leads to a degradation in stiffness and strength.
However, the orientation and distribution of microfractures remained unknown. Based on our microstructural analysis, the concept of microfracturing can be applied in slightly modified form compared to the theory previously formulated for hard, brittle rocks: tensile microfractures form as obliquely – instead of vertically – oriented fractures along grain boundaries, which is inferred to be a result of loading direction and the orientation of anisotropy plane. This leads to a non-linear increase in bulk radial extension and a simultaneous reduction in stiffness based on the axial strain response. The process of fracture nucleation coincides with the onset of volumetric dilation, i.e. the deviation from linearity of the bulk volumetric strain (Amann et al., 2011), and it is interpreted as a non-localised process within the sample as reported in other studies (Kranz, 1983, and references therein).
Towards an advanced deformation stage close to the stress peak, these fractures localise along distinct planes within the sample and ultimately develop to macroscopic shear bands as observed on both hard rocks (Lockner et al., 1992; Tapponier and Brace, 1976) and other shales (Sarout et al., 2017). Our microstructural analysis showed an increased number of microfractures in the vicinity of the macroscopic shear fracture, showing the extent of localisation. Furthermore, anastomosing fracture networks (Fig. 4) support the assumption that the single tensile-mode fractures formed in pre-failure. With progressive deformation, they changed into hybrid mode with a shear component and coalesced to develop larger deformation bands or, once fully developed, shear zones. The deformation bands are therefore interpreted to have formed from multiple coalescing microfractures as supported by the fact that some immature bands still contain undeformed microlithons of the host rock. Adjacent tips of microfractures are joined by both brittle and ductile deformation mechanisms on the grain scale. These anastomosing fracture networks also show the influence of mechanical anisotropy as dilatant fractures form along the bedding plane as opposed to the general orientation of the fracture network (Fig. 6a).
Once these deformation bands were established, shear strain localised within them and the internal structure became disrupted. Shear movement along the deformation band boundary could be inferred from bending of clay particles (Figs. 5, 6c, 7) and the highly strained and stretched fossil shell fragments (Fig. 7c' and c”). Furthermore, the internal microstructure within these bands, i.e. the porous rims, the fractures around and through larger particles, and the random distribution of such indicated cataclastic flow by grain rotation and material destruction. Correlation indicators for absolute shear displacement within and along these zones were missing. However, if strain had localised within and along these bands, estimations derived from the amount of maximum principal strain during the test and the orientation of the deformation bands would yield in an accommodation of maximum 0.4 % shear strain along these zones.
At the confining stress tested, OPA from the MT-URL typically shows a brittle bulk mechanical behaviour with ongoing deformation beyond peak stress, resulting in a stress decrease to residual strength (Wild and Amann, 2018; Giger et al., 2018; Favero et al., 2018). The deformation structures presented in this study support the strain-softening behaviour and a reducing frictional resistance: cohesional bonds were partly lost within the observed deformation bands by intergranular fractures and grain rotation, and clay particle rotation led to an alignment parallel to the deformation band, enhancing clay particle sliding. In this regime, we hypothesise that the deformation bands would continuously be sheared and form a macroscopic shear band through the sample in the post-peak region (Morgenstern and Tchalenko, 1967).
Cataclastic flow and particle movement within these deformation bands led to a local porosity increase at the confining stress tested. On the other hand, the bulk mechanical behaviour showed a net increase in volumetric strain, i.e. bulk compaction, up to and shortly beyond peak stress (Fig. 1). This indicates that the matrix compaction was dominating the bulk deformation process to this stage. At the same time, a local increase in porosity may imply an increased permeability. This is striking and important to note since micrometre-thin shear zones from the main fault in OPA at the MT-URL usually present a decreased porosity (Laurich et al., 2017), and deformed OPA in direct shear experiments shows a reduction in permeability (Bakker and Bresser, 2020). However, fracture-sealing veins (mostly calcite) in the main fault also indicate a paleo-fluid flow. Isotopic studies suggest that these veins formed contemporaneously with the initial fault activation, which supports or results in localised dilation in the early stage of shear development (Clauer et al., 2017).
The local increase in porosity in the deformation band leads to a local reduction in pore water pressure under undrained conditions and a related local increase in effective stress in the shear zones. The increase in effective stress involves a shear-hardening effect, which represents the competing effect of shear softening due to the loss of cohesional bonds. Here, further research is required to investigate the dependency of permeability and porosity evolution with an increasing amount of shear stress and the effect of undrained and drained conditions within the sample.
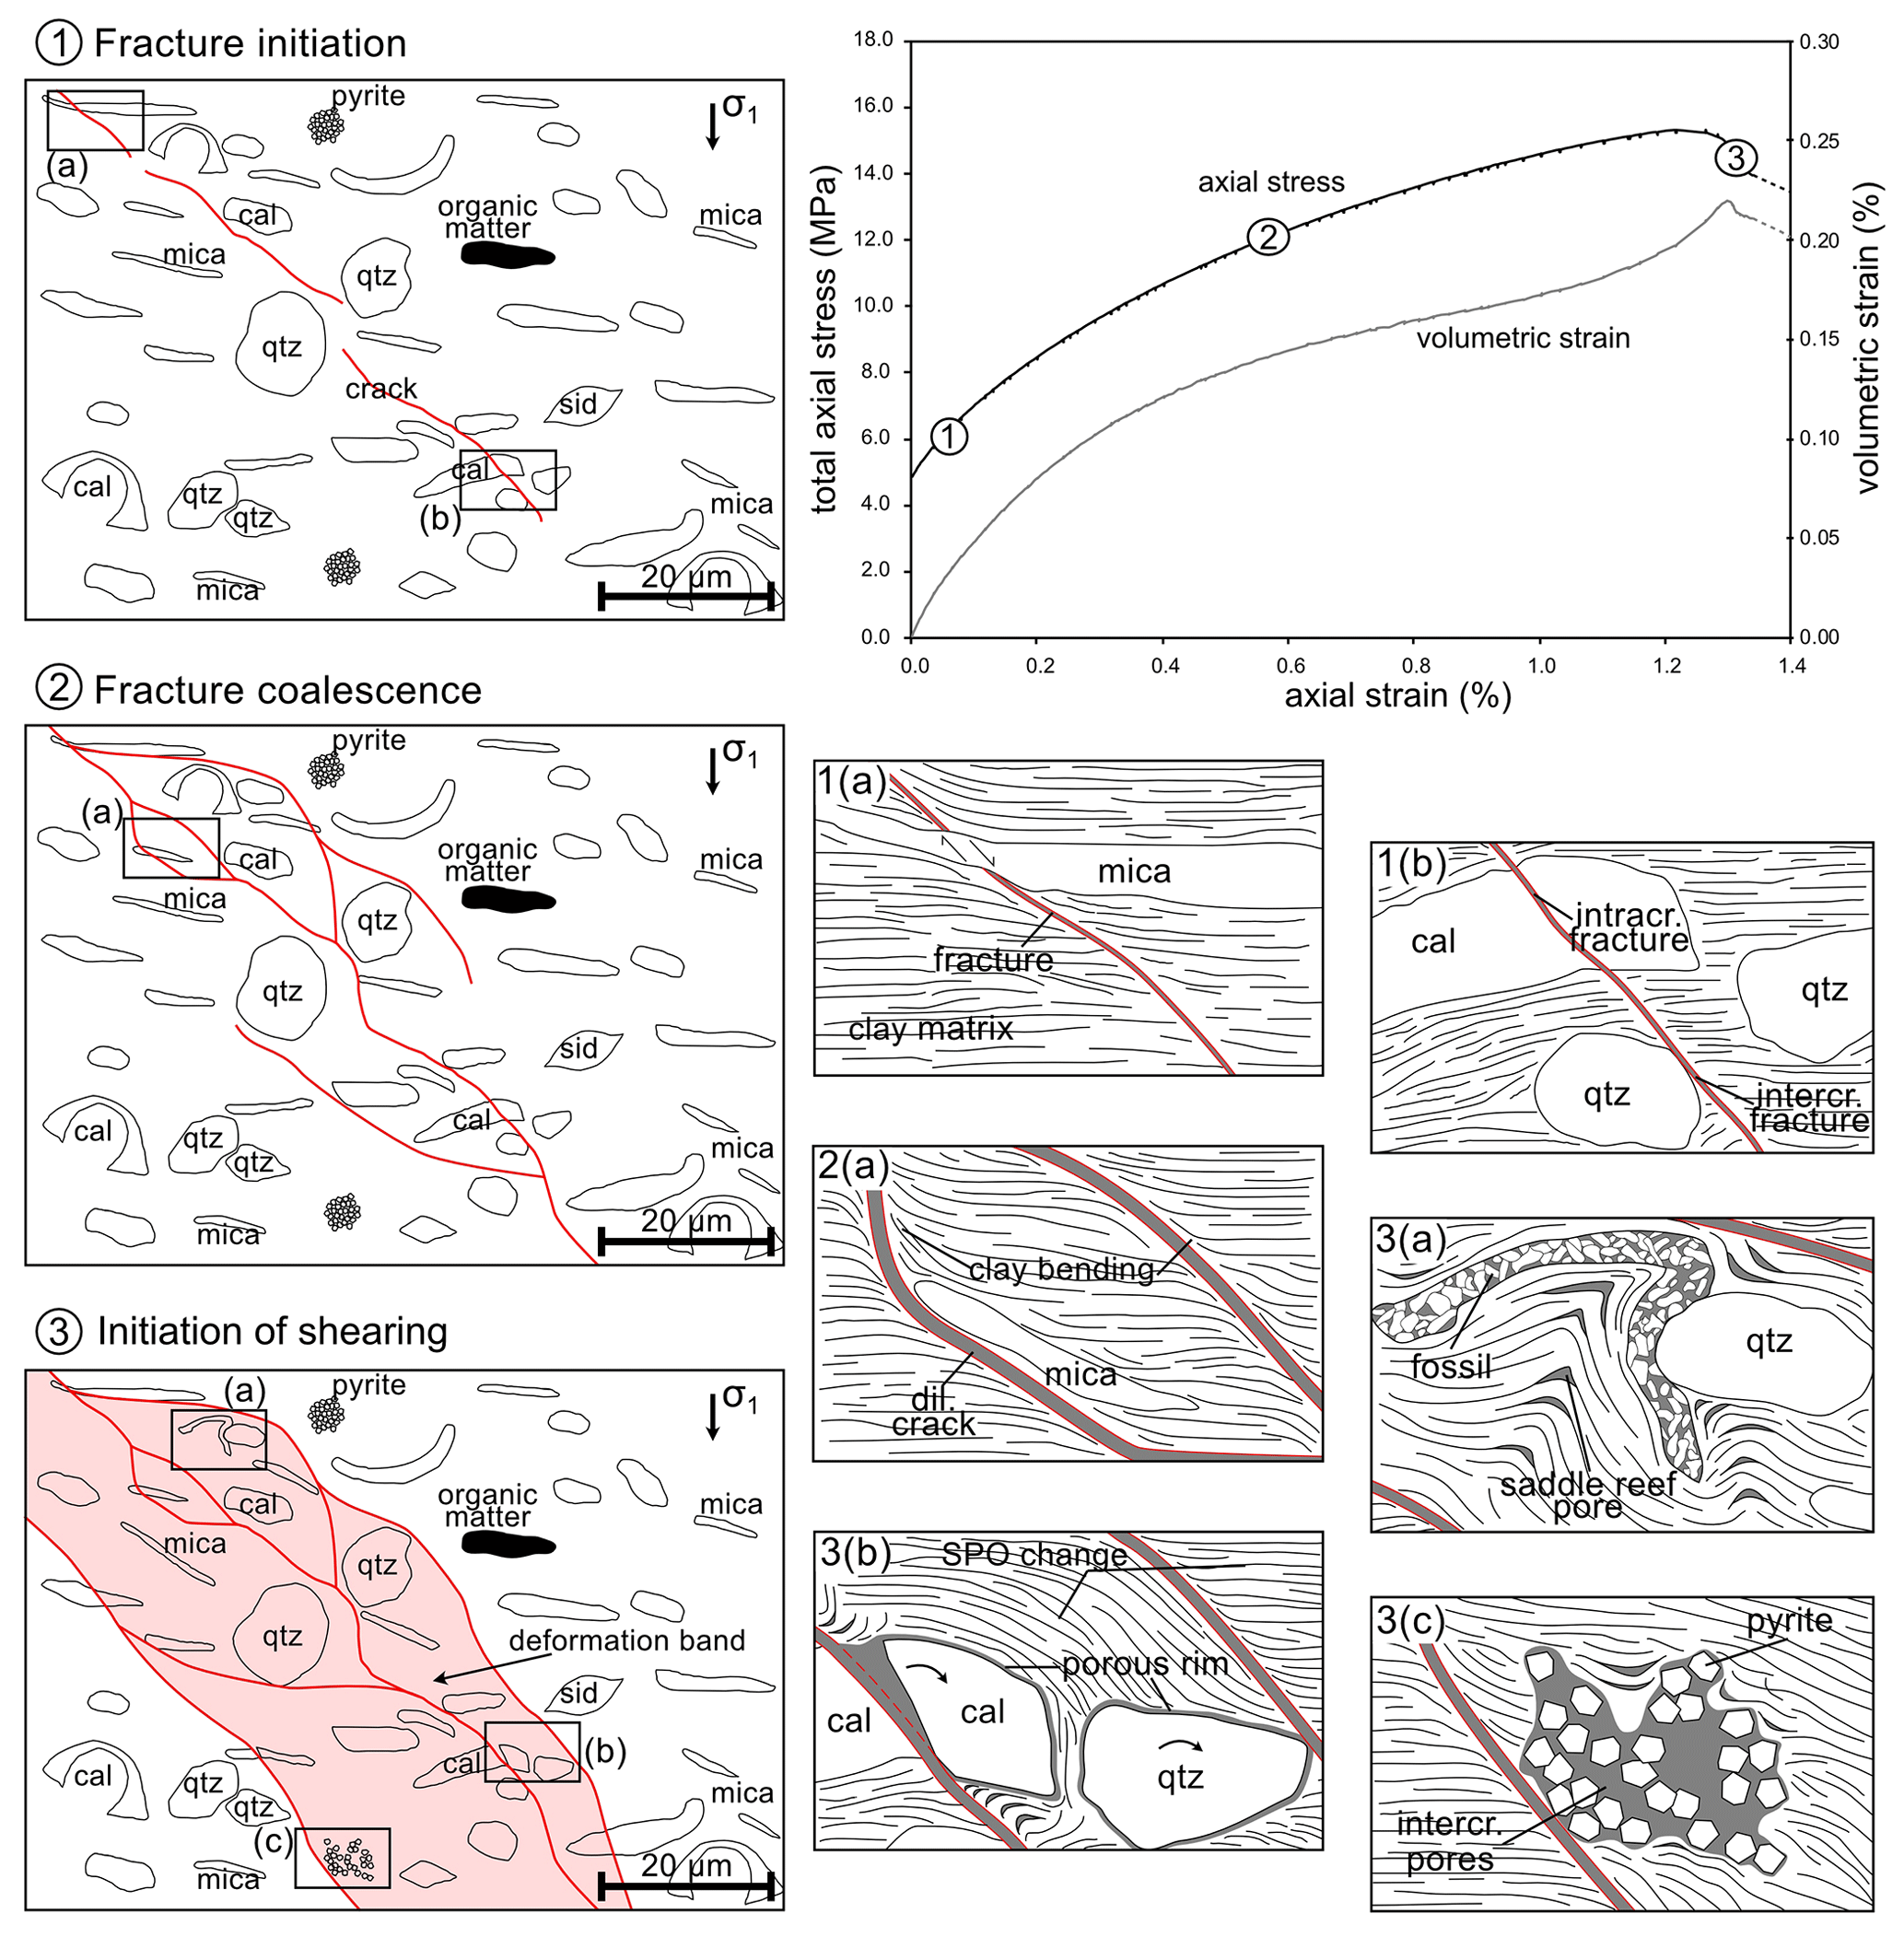
Figure 9Deformation model for experimentally deformed OPA in a triaxial test consisting of different stages of damage accumulation: stage 1 is associated with fracture initiation whereby fractures form along a preferred oblique orientation. Stage 2 is characterised by microfracture coalescence and the formation of anastomosing fracture networks. Here, fractures dilate and clay particles bend towards the fractures. In stage 3, deformation bands show highly deformed microstructures such as strained fossils, delaminated clay aggregates, dilatant microfractures, and an SPO change. Within these bands, porosity is increased by “saddle-reef pores” between clay layers, collapsed fossil shells, porous rims around larger grains, and the formation of intracrystalline pores in pyrite aggregates.
Some structures found in this study, such as the anastomosing fracture network, strained fossil shells, and bending of phyllosilicates, resemble those found in highly strained OPA (Laurich et al., 2017; Orellana et al., 2018) and predict the early stage of Y-shear development. However, highly sheared OPA is characterised by grain size and porosity reduction, pressure solution, and gouge development (Laurich et al., 2017). Similar observations have been made in other clay-rich rocks (e.g. Haines et al., 2013; Holland et al., 2006; Rutter et al., 1986). Therefore, microstructures and related processes investigated in a sample, which has been experimentally deformed up to peak stress, partly resemble those observed in naturally deformed OPA. Furthermore, the influence of strain amount and strain rate, pore pressure evolution during deformation, pressure solution, and mineral precipitation as well as self-sealing plays an important role (Laurich et al., 2018; Voltolini and Ajo-Franklin, 2020).
Many of these processes become effective at long timescales under natural conditions. In tunnelling, however, low-permeability rocks such as OPA are subjected to undrained loading conditions during excavation. Thus, the triaxial compression tests have been performed as classical UU tests without prior saturation and consolidation. The pore water pressure development and effective stress inside the sample remain unknown. The test provides the undrained shear strength representative for the near field of a tunnel excavated at the consolidation conditions found at the MT-URL (Martin and Lanyon, 2003). Therefore, micro-deformation processes observed in the sample are considered to be similar to those found in the near field of a freshly excavated tunnel in Mont Terri. This is further corroborated by the similarities between microstructural EDZ–BDZ (borehole damage zone) observations (Bossart et al., 2002, 2004; Yong et al., 2007; Nussbaum et al., 2011) and microstructures found in this study.
These studies show that purely extensional fractures coexist with shear fractures in the EDZ–BDZ. The latter – compared to tectonic fractures – are characterised by poorly developed striations but indicate re-oriented clay particles (Nussbaum et al., 2011). Furthermore, BDZ structures in a resin-impregnated over-core from the shaly facies of OPA at MT-URL showed branching fracture patterns on a millimetre scale similar to the structures observed in our study (Kupferschmid et al., 2015).
Studies of samples deformed under undrained consolidated conditions to higher strains are currently under investigation and will address the effects of pore pressure, effective stress conditions, and sample orientation on the development of deformation microstructures.
4.3 Microstructural deformation model
For the unconsolidated, undrained deformation of OPA under differential compressive load at a total confinement of 4 MPa, we propose the following deformation mechanisms based on our microstructural observations in combination with the bulk mechanical behaviour (Fig. 9): in the early stage of differential loading, the sample is subjected to axial shortening and elastic compression up to a differential stress of approximately 2 MPa. From stage 1, yielding starts caused by the formation of fractures and the related reduction of stiffness. These fractures form in the whole sample with preferred orientations crossing the bedding and with ongoing deformation; they concentrate with a higher density in the centre. The non-linear increase in volumetric strain indicates a more abundant fracture formation in the beginning at lower axial strains. At stage 2, these fractures coalesce to create networks forming deformation zones with widths in the range of 20 to 50 µm. Clay bending and intracrystalline fractures correspond to a coexistence of brittle and ductile deformation processes on the grain scale due to the contrasting mineral rheology. When peak stress is reached and slightly exceeded at stage 3, shearing initiates and deformation bands begin to develop with distinct boundaries to the undeformed host rock. These deformation bands are characterised by both brittle and ductile deformation in the form of matrix cataclasis and re-orientation of mineral fabric on the scale of micrometres to tens of micrometres, even though on a bulk scale the sample deforms in a brittle manner. Locally, these zones showed increased porosity due to strained and crushed fossil shells, rotated calcite and quartz clasts, and delamination of clay particles forming saddle-reef pores (see Figs. 6, 9(3a)). We note here that the microstructure in the vicinity of the larger macro-fractures, i.e. close to the “main” fractures where most of the shear strain is potentially accommodated, hosts microstructural artefacts from sample preparation (see Sect. 3.2), and we hypothesise that with ongoing deformation shear strain will localise along a macroscopic shear band cross-cutting the sample with a reduction in porosity and grain sizes.
We derived a deformation model for Opalinus Clay based on a sample that has been deformed in a triaxial test and whose post-experimental microstructure was analysed using BIB–SEM. The strain-controlled test (circumferential displacement control rate of 0.08 mm min−1) was performed at 4 MPa confining stress under undrained and unconsolidated conditions. The bulk mechanical behaviour was controlled by the microscale deformation, which is a combination of brittle and ductile processes. The microstructural damage in OPA consists of, with respect to the horizontal, obliquely oriented single and coalescing microfractures as well as up to 50 µm thick deformation bands, pointing to deformation processes such as pore collapse, grain rotation, and the rearrangement of clay aggregates due to bending and shear straining. Even though the pre-peak bulk volumetric strain showed a compacting behaviour, the microstructure was characterised by dilatant fractures and a local increase in porosity in the deformation bands, i.e. incipient shear bands. Consequently, the accumulation of damage upon compression created additional pathways for fluid flow, which can increase the permeability of the rock.
Our high-resolution study gives insights into the macroscale and microscale structures with some similarities to excavation or naturally induced structures. However, OPA – deformed up to peak stress – also shows structural differences to naturally deformed OPA, which shows drastically reduced porosity. Strain amount and rate in natural fault systems, as well as elevated temperatures or clay-mineral hydration processes, may influence the deformation mechanisms and structures. On the other hand, natural veins as an indication for paleo-fluid flow in the early faulting stage (Clauer et al., 2017) support localised dilation as similarly found in this study. Future experiments covering a broader range of boundary conditions for consolidated samples are required to analyse the deformation processes under shallow upper crustal conditions and to formulate an effective stress-dependent deformation model.
The results of this study support recent efforts (e.g. Pardoen et al., 2020; Jameei and Pietruszczak, 2021) to provide input to constrain damage in constitutive models of OPA or similar clay shales, which allow reproducing local porosity and permeability changes due to fracture formation, fracture coalescence, and the development of shear zones. Further studies tested to larger axial strains on consolidated–undrained samples will test our model of strain localisation and pore space reduction. Furthermore, this will include the role of pore pressure development during deformation, and it will offer the possibility to properly compare experimentally and naturally deformed OPA.
High-resolution BIB–SEM images and pore size data are available in the Supplement provided.
The supplement related to this article is available online at: https://doi.org/10.5194/se-12-2109-2021-supplement.
GD and JK performed sample preparation and BIB–SEM microscopy. JLU acquired funding, managed the project, and discussed results at all stages. FA carried out the deformation experiment, acquired funding, and managed the project. LW and GD analysed the data, and LW wrote the text with contributions from all co-authors. All co-authors contributed to the discussion.
The authors declare that they have no conflict of interest.
Publisher's note: Copernicus Publications remains neutral with regard to jurisdictional claims in published maps and institutional affiliations.
We would like to thank Swisstopo for the financial support. Ben Laurich and two anonymous reviewers are thanked for their thorough reviews and constructive comments, which helped to improve the paper significantly.
This open-access publication was funded by the RWTH Aachen University.
This paper was edited by Florian Fusseis and reviewed by Ben Laurich and two anonymous referees.
Allirot, D., Boehler, J. P., and Sawczuk, A.: Irreversible deformations of an anisotropic rock under hydrostatic pressure, Int. J. Rock Mech. Min. Sci. Geomech. Abstr., Pergamon, 14, 77–83, 1977.
Amann, F., Button, E. A., Evans, K. F., Gischig, V. S., and Blümel, M.: Experimental study of the brittle behavior of clay shale in rapid unconfined compression, Rock Mech. Rock Eng., 44, 415–430, 2011.
Amann, F., Kaiser, P., and Button, E. A.: Experimental study of brittle behavior of clay shale in rapid triaxial compression, Rock Mech. Rock Eng., 45, 21–33, 2012.
Amann, F., Wild, K. M., Loew, S., Yong, S., Thoeny, R., and Frank, E.: Geomechanical behaviour of Opalinus Clay at multiple scales: results from Mont Terri rock laboratory (Switzerland), in: Mont Terri Rock Laboratory, 20 Years, Birkhäuser, Cham., 153–173, 2018.
Aristorenas, G. V.: Time-dependent behavior of tunnels excavated in shale, Doctoral dissertation, Massachusetts Institute of Technology, 553 pp., 1992.
Bakker, E. and de Bresser, J. H. P.: Anisotropic transport and frictional properties of simulated clay-rich fault gouges, Solid Earth Discuss. [preprint], https://doi.org/10.5194/se-2020-178, in review, 2020.
Bieniawski, Z. T.: Mechanism of brittle fracture of rock: part I – theory of the fracture process, Int. J. Rock Mech. Min. Sci. Geomech. Abstr., Pergamon, 4, 395–406, 1967.
Blenkinsop, T.: Deformation Microstructures and Mechanisms in Minerals and Rocks, Springer, p. 163, 2000.
Bock, H., Dehandschutter, B., Martin, C.D., Mazurek, M., De Haller, A., Skoczylas, F., and Davy, C.: Self-sealing of fractures in argillaceous formations in the context of geological disposal of radioactive waste, ISBN 978-92-64-99095-1, 2010.
Bos, B. and Spiers, C. J.: Frictional-viscous flow of phyllosilicate-bearing fault rock: Microphysical model and implications for crustal strength profiles, J. Geophys. Res.-Sol. Ea., 107, https://doi.org/10.1029/2001JB000301, 2002.
Bos, B., Peach, C. J., and Spiers, C. J.: Frictional-viscous flow of simulated fault gouge caused by the combined effects of phyllosilicates and pressure solution, Tectonophysics, 327, 173–194, 2000.
Bossart, P., Meier, P. M., Moeri, A., Trick, T., and Mayor, J.-C.: Geological and hydraulic characterisation of the excavation disturbed zone in the Opalinus Clay of the Mont Terri Rock Laboratory, Eng. Geol., 66, 19–38, 2002.
Bossart, P., Trick, T., Meier, P. M., and Mayor, J.-C.: Structural and hydrogeological characterisation of the excavation-disturbed zone in the Opalinus Clay (Mont Terri Project, Switzerland), Appl. Clay Sci., 26, 429–448, 2004.
Busch, A., Schweinar, K., Kampman, N., Coorn, A., Pipich, V., Feoktystov, A., Leu, L., Amann-Hildenbrand, A., and Bertier, P.: Determining the porosity of mudrocks using methodological pluralism, Geological Society, London, Special Publications, 454, 15–38, 2017.
Chandler, M. R., Meredith, P. G., Brantut, N., and Crawford, B. R.: Fracture toughness anisotropy in shale, J. Geophys. Res., 24, https://doi.org/10.1002/2015JB012756, 2016.
Clauer, N., Techer, I., Nussbaum, C., and Laurich, B.: Geochemical signature of paleofluids in microstructures from Main Fault in the Opalinus Clay of the Mont Terri rock laboratory, Switzerland, Swiss J. Geosci., 110, 105–128, 2017.
Corkum, A. G. and Martin, C. D.: The mechanical behaviour of weak mudstone (Opalinus Clay) at low stresses, Int. J. Rock Mech. Min. Sci., 44, 196–209, 2007.
De Craen, M., Van Geet, M., Honty, M., Weetjens, E., and Sillen, X.: Extent of oxidation in Boom Clay as a result of excavation and ventilation of the HADES URF: Experimental and modelling assessments, Phys. Chem. Earth., 33, 350–362, 2008.
Desbois, G., Urai, J. L., and Kukla, P. A.: Morphology of the pore space in claystones–evidence from BIB/FIB ion beam sectioning and cryo-SEM observations, eEarth Discussions, 4, 1–19, 2009.
Desbois, G., Hemes, S., Laurich, B., Houben, M., Klaver, J., Höhne, N., Urai, J. L., Viggiani, G., and Bésuelle, P.: Investigation of microstructures in naturally and experimentally deformed reference clay rocks using innovative methods in scanning electron microscopy, The Clay Minerals Society Workshop Lectures, 21, 1–14, https://doi.org/10.1346/CMS-WLS-21.1, 2016.
Desbois, G., Höhne, N., Urai, J. L., Bésuelle, P., and Viggiani, G.: Deformation in cemented mudrock (Callovo–Oxfordian Clay) by microcracking, granular flow and phyllosilicate plasticity: insights from triaxial deformation, broad ion beam polishing and scanning electron microscopy, Solid Earth, 8, 291–305, https://doi.org/10.5194/se-8-291-2017, 2017.
Du Bernard, X., Eichhubl, P., and Aydin, A.: Dilation bands: A new form of localized failure in granular media, Geophys. Res. Lett., 29, 1–4, 2002.
Ewy, R. T.: Shale/claystone response to air and liquid exposure, and implications for handling, sampling and testing, Int. J. Rock Mech. Min., 80, 388–401, 2015.
Fairhurst, C. E. and Hudson, J. A.: Draft ISRM suggested method for the complete stress-strain curve for intact rock in uniaxial compression, Int. J. Rock Mech. Min. Sci., 36, 279–289, 1999.
Fauchille, A. L., Hedan, S., Valle, V., Pret, D., Cabrera, J., and Cosenza, P.: Multi-scale study on the deformation and fracture evolution of clay rock sample subjected to desiccation, Appl. Clay Sci., 132, 251–260, 2016.
Favero, V., Ferrari, A., and Laloui, L.: Anisotropic behaviour of opalinus clay through consolidated and drained triaxial testing in saturated conditions, Rock Mech. Rock Eng., 51, 1305–1319, 2018.
Forbes Inskip, N. D., Meredith, P. G., Chandler, M. R., and Gudmundsson, A.: Fracture Properties of Nash Point Shale as a Function of Orientation to Bedding. J. Geophys. Res. Solid Earth 123, 8428–8444, 2018
Gehne, S., Forbes Inskip, N. D., Benson, P. M., Meredith, P. G., and Koor, N.: Fluid-Driven Tensile Fracture and Fracture Toughness in Nash Point Shale at Elevated Pressure, J. Geophys. Res.-Sol. Ea., 125, https://doi.org/10.1029/2019JB018971, 2020.
Giger, S. B., Ewy, R. T., Favero, V., Stankovic, R., and Keller, L. M.: Consolidated-undrained triaxial testing of Opalinus Clay: Results and method validation, Geomechanics for Energy and the Environment, 14, 16–28, 2018.
Haghighat, E. and Pietruszczak, S.: On modeling of discrete propagation of localized damage in cohesive-frictional materials, Int. J. Numer. Anal. Methods Geomech., 39, 1774–1790, 2015.
Haines, S. H., Kaproth, B., Marone, C., Saffer, D., and Van der Pluijm, B.: Shear zones in clay-rich fault gouge: A laboratory study of fabric development and evolution, J. Struc. Geol., 51, 206–225, 2013.
Handin, J., Hager Jr, R. V., Friedman, M., and Feather, J. N.: Experimental deformation of sedimentary rocks under confining pressure: pore pressure tests, AAPG Bull., 47, 717–755, 1963.
Hemes, S., Desbois, G., Klaver, J., and Urai, J. L.: Microstructural characterisation of the Ypresian clays (Kallo-1) at nanometre resolution, using broad-ion beam milling and scanning electron microscopy, Neth. J. Geosci., 95, 293–313, 2016.
Hildenbrand, A., Krooss, B., M., and Urai, J. L.: Relationship Between Pore Structure and Fluid Transport in Argillaceous Rocks, in: IUTAM Symposium on Physicochemical and Electromechanical Interactions in Porous Media, edited by: Gladwell, G. M. L., Huyghe, J. M., Raats, P. A. C. and Cowin, S. C., Springer-Verlag, 125, 231–237, 2005.
Holland, M., Urai, J. L., van der Zee, W., Stanjek, H., and Konstanty, J.: Fault gouge evolution in highly overconsolidated claystones, J. Struc. Geol., 28, 323–332, 2006.
Houben, M., Desbois, G., and Urai, J. L.: A comparative study of representative microstructures in shaly and sandy facies of Opalinus Clay (Mont Terri, Switzerland) inferred from BIB-SEM and MIP methods, Mar. Pet. Geol., 49, 143–161, 2014.
Houben, M. E., Desbois, G., and Urai, J. L.: Pore morphology and distribution in the shaly facies of Opalinus Clay (Mont Terri, Switzerland): Insights from representative 2D BIB-SEM investigations on mm to nm scale, Appl. Clay Sci., 71, 82–97, 2013.
Ibanez, W. D. and Kronenberg, A. K.: Experimental deformation of shale: Mechanical properties and microstructural indicators of mechanisms, Int. J. Rock Mech. Min. Sci. Geomech. Abstr., Pergamon, 30, 723–734, 1993.
Ingram, G. M. and Urai, J. L.: Top-seal leakage through faults and fractures: the role of mudrock properties, Geological Society, London, Special Publications, 158, 125–135, 1999.
ISRM: Suggested Methods for Determining Water Content, Porosity, Density, Absorption and Related Properties and Swelling and Slake-Durability Index Properties, Int. J. Rock Mech. Min., 16, 141–156, 1979.
Jameei, A. A. and Pietruszczak, S.: On the hydromechanical interaction during propagation of localized damage on rocks, Minerals, 11, https://doi.org/10.3390/min11020162, 2021.
Jordan, P. and Nüesch, R.: Deformational behavior of shale interlayers in evaporite detachment horizons, Jura overthrust, Switzerland, J. Struc. Geol., 11, 859–871, 1989.
Kaufhold, A., Halisch, M., Zacher, G., and Kaufhold, S.: X-ray computed tomography investigation of structures in Opalinus Clay from large-scale to small-scale after mechanical testing, Solid Earth, 7, 1171–1183, https://doi.org/10.5194/se-7-1171-2016, 2016.
Keller, L. M., Holzer, L., Wepf, R., Gasser, P., Münch, B., and Marschall, P.: On the application of focused ion beam nanotomography in characterizing the 3D pore space geometry of Opalinus clay, Phys. Chem. Earth, 36, 1539–1544, 2011.
Keller, L. M., Schuetz, P., Erni, R., Rossell, M. D., Lucas, F., Gasser, P., and Holzer, L.: Characterization of multi-scale microstructural features in Opalinus Clay, Microporous and mesoporous materials, 170, 83–94, 2013.
Kimoto, S., Oka, F., and Higo, Y.: Strain localization analysis of elasto-viscoplastic soil considering structural degradation, Compt. Method. Appl. M., 193, 2845–2866, 2004.
Klaver, J., Hemes, S., Houben, M., Desbois, G., Radi, Z., and Urai, J. L.: The connectivity of pore space in mudstones: insights from high pressure Wood's Metal Injection, BIB-SEM imaging and Mercury Intrusion Porosimetry, Geofluids, 2015.
Klinkenberg, M., Kaufhold, S., Dohrmann, R., and Siegesmund, S.: Influence of carbonate microfabrics on the failure strength of claystones, Eng. Geol., 107, 42–54, 2009.
Kranz, R., L.: Microcracks in rocks: A review, Tectonophysics, 100, 449–480, 1983.
Kupferschmied, N., Wild, K. M., Amann, F., Nussbaum, C., and Jaeggi, D., Badertscher, N.: Time-dependent fracture formation around a borehole in a clay shale, Int. J. Rock Mech. Min. Sci., 77, 105–114, 2015.
Laurich, B., Urai, J. L., and Nussbaum, C.: Microstructures and deformation mechanisms in Opalinus Clay: insights from scaly clay from the Main Fault in the Mont Terri Rock Laboratory (CH), Solid Earth, 8, 27–44, https://doi.org/10.5194/se-8-27-2017, 2017.
Laurich, B., Urai, J. L., Desbois, G., Vollmer, C., and Nussbaum, C.: Microstructural evolution of an incipient fault zone in Opalinus Clay: Insights from an optical and electron microscopic study of ion-beam polished samples from the Main Fault in the Mt-Terri Underground Research Laboratory, J. Struc. Geol., 67, 107–128, 2014.
Laurich, B., Urai, J. L., Vollmer, C., and Nussbaum, C.: Deformation mechanisms and evolution of the microstructure of gouge in the Main Fault in Opalinus Clay in the Mont Terri rock laboratory (CH), Solid Earth, 9, 1–24, https://doi.org/10.5194/se-9-1-2018, 2018.
Lockner, D. A., Moore, D. E., and Reches, Z.: Microcrack interaction leading to shear fracture, edited by: Tillerson and Wawersik, 33rd US Rock Mechanics Symposium, 908–816, 1992.
Logan, J. M. and Rauenzahn, K. A.: Frictional dependence of gouge mixtures of quartz and montmorillonite on velocity, composition and fabric, Tectonophysics, 144, 87–108, 1987.
Logan, J. M., Friedman, M., Higgs, N., Dengo, C. and Shimamoto, T.: Experimental studies of simulated gouge and their application to studies of natural fault zones, Open File Report, In: Proceedings of Conference VIII on Analysis of Actual Fault Zones in Bedrock, US Geological Survey, 79–1239, 1979.
Lupini, J. F., Skinner, A. E. and Vaughan, P. R.: The drained residual strength of cohesive soils, Geotechnique, 31, 181–213, 2015.
Maltman, A.: Shear zones in argillaceous sediments – an experimental study, Spec. Pubis geol. Soc. Lond., 29, 77–87, 1987,
Marschall, P., Horseman, S., and Gimmi, T.: Characterisation of gas transport properties of the Opalinus Clay, a potential host rock formation for radioactive waste disposal, Oil Gas Sci. Technol., 60, 121–139, 2005.
Martin, C. D. and Lanyon, G. W.: Measurement of in-situ stress in weak rocks at Mont Terri Rock Laboratory, Switzerland, Int. J. Rock Mech. Min. Sci., 40, 1077–1088, 2003.
McLamore, R. and Gray, K. E.: The mechanical behavior of anisotropic sedimentary rocks, J. Eng. Ind., 89, 62–73, 1967.
Morgenstern, N. R., and Tchalenko, J. S.: Microscopic structures in kaolin subjected to direct shear, Geotechnique, 17, 309–328, 1967
Nejati, M., Aminzadeh, A., Amann, F., Saar, M. O., and Driesner, T.: Mode I fracture growth in anisotropic rocks: Theory and experiment, Int. J. Solids Struc., 195, 74–90, 2020.
Niemeijer, A. R. and Spiers, C. J.: A microphysical model for strong velocity weakening in phyllosilicate-bearing fault gouges, J. Geophys. Res.-Sol. Ea., 112, https://doi.org/10.1029/2007JB005008, 2007.
Nüesch, R.: Das mechanische Verhalten von Opalinuston, Doctoral dissertation, ETH Zurich, 247 pp., Diss. ETH Nr. 9349, 1991.
Nussbaum, C., Bossart, P., Amann, F., and Aubourg, C.: Analysis of tectonic structures and excavation induced fractures in the Opalinus Clay, Mont Terri underground rock laboratory (Switzerland) Swiss, J. Geosci., 104, 187, https://doi.org/10.1007/s00015-011-0070-4, 2011.
Oelker, A.: Deformation properties of Boom Clay: Implementation of a multi-scale concept, PhD Thesis, RWTH Aachen, available at: https://publications.rwth-aachen.de/record/771048, last access: 11 June 2019.
Oka, F., Adachi, T., and Yashima, A: A strain localization analysis using a viscoplastic softening model for clay, Int- J. Plast, 11, 523–545, 1995.
Orellana, L. F., Scuderi, M. M., Collettini, C., and Violay, M.: Frictional properties of Opalinus Clay: Implications for nuclear waste storage, J. Geophys. Res.-Sol. Ea., 123, 157–175, 2018.
Pardoen, B., Bésuelle, P., Dal Pont, S., Cosenza, P., and Desrues, J.: Accounting for small-scale heterogeneity and variability of clay rock in homogenised numerical micromechanical response and microcracking, Rock Mech. Rock Eng., 53, 2727–2746, 2020.
Passchier, C. W. and Trouw, R. A.: Microtectonics, Springer Science & Business Media, 366 pp., 2005.
Pietruszczak, S.: On homogeneous and localized deformation in water-infiltrated soils, Int. J. Damage Mech., 8, 233–253, 1999.
Popp, T. and Salzer, K.: Anisotropy of seismic and mechanical properties of Opalinus clay during triaxial deformation in a multi-anvil apparatus, Phys. Chem. Earth, 32, 879–888, 2007.
Rutter, E. H., Maddock, R. H., Hall, S. H., and White, S. H.: Comparative microstructures of natural and experimentally produced clay-bearing fault gouges, Pure Appl. Geophys. Approx., 124, 3–30, 1986.
Sarout, J., Le Gonidec, Y., Ougier-Simonin, A., Schubnel, A., Guéguen, Y., and Dewhurst, D. N.: Laboratory micro-seismic signature of shear faulting and fault slip in shale, Phys. Earth Planet. Inter., 264, 47–62, 2017.
Scholz, C. H.: Experimental study of the fracturing process in brittle rock. J. Geophys. Res.-Sol. Ea., 73, 1447–1454, 1968.
Schuck, B., Desbois, G., and Urai, J. L: Grain-scale deformation mechanisms and evolution of porosity in experimentally deformed Boom Clay, J. Struc. Geol., 130, 103894, https://doi.org/10.1016/j.jsg.2019.103894, 2020.
Seiphoori, A., Whittle, A. J., Krakowiak, K. J., and Einstein, H. H.: Insights into diagenesis and pore structure of opalinus shale through comparative studies of natural and reconstituted materials, Clay Clay Miner., 65, 135–153, 2017,
Soe, A. K. K., Osada, M., Takahashi, M., and Sasaki, T.: Characterization of drying-induced deformation behaviour of Opalinus Clay and tuff in no-stress regime, Environ. Geol., 58, 1215–1225, 2009.
Tapponier, P. and Brace, W. F.: Development of stress induced micro-cracks in Westerly granite, Int. J. Rock Mech. Min. Sci., 13, https://doi.org/10.1016/0148-9062(76)91937-9, 1976.
Thury, M. and Bossart, P.: The Mont Terri rock laboratory, a new international research project in a Mesozoic shale formation, in Switzerland, Eng. Geol., 52, 347–359, 1999.
Vinsot, A., Leveau, F., Bouchet, A., and Arnould, A.: Oxidation front and oxygen transfer in the fractured zone surrounding the Meuse/Haute-Marne URL drifts in the Callovian–Oxfordian argillaceous rock, Geological Society, London, Special Publications, 400, 207–220, 2014.
Voltolini, M. and Ajo-Franklin, J.: Evolution of propped fractures in shales: the microscale controlling factors as revealed by in situ X-Ray microtomography, J. Pet. Sci. Eng, 188, 106861, https://doi.org/10.3389/feart.2020.00207, 2020.
Wang, C., Mao, N. and Wu, F. T.: Mechanical properties of clays at high pressure, J. Geophys. Res., 85, 1462–1468, 1980.
Wenk, H. R., Voltolini, M., Kern, H., Popp, T., and Mazurek, M.: Anisotropy in shale from Mont Terri, The Leading Edge, 27, 742–748, 2008.
Winhausen, L., Amann-Hildenbrand, A., Fink, R., Jalali, M., Khaledi, K., Hamdi, P., Urai, J.L., Schmatz, J. and Amann, F.: A comparative study on methods for determining the hydraulic properties of a clay shale, Geoph. J. Int., 224, 1523–1539, 2021.
Wild, K. M. and Amann, F.: Experimental study of the hydro-mechanical response of Opalinus Clay–Part 1: Pore pressure response and effective geomechanical properties under consideration of confinement and anisotropy, Eng. Geol., 237, 32–41, 2018.
Wild, K. M., Wymann, L. P., Zimmer, S., Thoeny, R., and Amann, F.: Water retention characteristics and state-dependent mechanical and petro-physical properties of a clay shale, Rock Mech. Rock Eng., 48, 427–439, 2015.
Yong, S.: A three-dimensional analysis of excavation-induced perturbations in the Opalinus Clay at the Mont Terri Rock Laboratory, (ETH Zurich, 2007), https://doi.org/10.3929/ethz-a-005591763, 2007.