the Creative Commons Attribution 4.0 License.
the Creative Commons Attribution 4.0 License.
 | 02 Feb 2021
Seismic evidence of the COVID-19 lockdown measures: a case study from eastern Sicily (Italy)
Andrea Cannata
Flavio Cannavò
Giuseppe Di Grazia
Marco Aliotta
Carmelo Cassisi
Raphael S. M. De Plaen
Stefano Gresta
Thomas Lecocq
Placido Montalto
Mariangela Sciotto
During the COVID-19 pandemic, most countries put in place social interventions, restricting the mobility of citizens, to slow the spread of the epidemic. Italy, the first European country severely impacted by the COVID-19 outbreak, applied a sequence of progressive restrictions to reduce human mobility from the end of February to mid-March 2020. Here, we analysed the seismic signatures of these lockdown measures in densely populated eastern Sicily, characterized by the presence of a permanent seismic network used for earthquake and volcanic monitoring. We emphasize how the anthropogenic seismic noise decrease is visible even at stations located in remote areas (Etna and Aeolian Islands) and that the amount of this reduction (reaching ∼ 50 %–60 %), its temporal pattern and spectral content are strongly station-dependent. Concerning the latter, we showed that on average the frequencies above 10 Hz are the most influenced by the anthropogenic seismic noise. We found similarities between the temporal patterns of anthropogenic seismic noise and human mobility, as quantified by the mobile-phone-derived data shared by Google, Facebook and Apple, as well as by ship traffic data. These results further confirm how seismic data, routinely acquired worldwide for seismic and volcanic surveillance, can be used to monitor human mobility too.
- Article
(20594 KB) - Full-text XML
- BibTeX
- EndNote


During the end of 2019, several cases of pneumonia, due to the novel coronavirus SARS-CoV-2, were identified in the city of Wuhan, China (Wang et al., 2020a). The disease due to this coronavirus, called COVID-19, then rapidly spread from China to other areas, as a pandemic wave (as declared by the World Health Organization, WHO, in March 2020) currently affecting 216 countries with almost 14 300 000 confirmed cases (at the time of writing 21 July 2020; WHO, 2020). COVID-19 is considered the most severe global health crisis of our time and the greatest challenge human beings have faced since World War II (WHO, 2020).
While huge efforts are being made to find pharmacological cures to heal the sick and to stop the spread of the disease (e.g. Cannata et al., 2020a; Graham, 2020; Wang et al., 2020b), most countries worldwide have put in place social interventions, consisting of restricting the mobility of citizens, aimed at slowing and mitigating the epidemic (Pepe et al., 2020). Italy was the first country in Europe to be severely impacted by the COVID-19 pandemic wave at the end of February and the beginning of March 2020. Hence, Italy was also the first European country to apply a sequence of progressive restrictions to reduce both human mobility and human-to-human contacts. Restrictions were first implemented on 23 February 2020 in some regions of northern Italy (Lombardy, Emilia–Romagna, Veneto, Friuli Venezia Giulia, Piedmont, and the Autonomous Province of Trento). On 11 March, the entire country was put under lockdown (Gatto et al., 2020) until May, when the restrictions were gradually lifted.
To provide information about the effectiveness of the quarantine measures during the COVID-19 emergency, Apple, Facebook and Google made available mobility data, mostly based on mobile-phone locations, for almost every country in the world (Apple, 2020; Facebook, 2020; Google, 2020). At the same time, different studies showed the effectiveness of seismic noise monitoring as a tool to quantify human activity and its changes over time (Dias et al., 2020; Hong et al., 2020; Lindsey et al., 2020; Lecocq et al., 2020; Poli et al., 2020). Indeed, the Earth is continuously vibrating due to a wide spectrum of elastic energy sources including tectonic forces (Stein and Wysession, 2003), volcanic processes (Chouet and Matoza, 2013), the ocean (Cannata et al., 2020b) and human (Diaz et al., 2017) activity. As for the last point, it typically generates a high-frequency continuous signal (>1 Hz), called anthropogenic or cultural seismic noise, associated with phenomena such as traffic, construction, industrial operations and mining (Diaz et al., 2017; Hong et al., 2020). Recent papers identified clear seismic signatures of the lockdown measures applied by different countries (Lindsey et al., 2020; Lecocq et al., 2020; Piccinini et al., 2020; Poli et al., 2020; Xiao et al., 2020). For instance, Lindsey et al. (2020) showed a 50 % decrease in vehicle count in the Palo Alto area (California) immediately following the lockdown order by using fibre-optic distributed acoustic sensing connected to a telecommunications cable. Lecocq et al. (2020) performed a global-scale analysis of anthropogenic seismic noise using hundreds of seismometers located around the world, which evidenced how the 2020 lockdown period has produced the longest and most dramatic global anthropogenic seismic noise reduction on record. Poli et al. (2020) and Piccinini et al. (2020) analysed the anthropogenic seismic noise reduction following the lockdown for the area of northern Italy and its socio-economic implications.
In this work, we analyse the seismic signatures of the lockdown measures in highly populated eastern Sicily (Italy), which benefits from the presence of a dense permanent seismic network used for both seismic and volcanic monitoring. Hence, this is the first study to show the effects of uniform lockdown measures in the seismic noise acquired by such a dense seismic network. In particular, we investigate the decrease in the anthropogenic seismic noise amplitude, characterize its spectral content and compare the observed changes with mobility data.
2.1 Data
The seismic data were recorded by 18 stations, located on the eastern part of Sicily and belonging to the seismic permanent network, run by Istituto Nazionale di Geofisica e Vulcanologia, Osservatorio Etneo (INGV-OE) (Table 1, Figs. 1 and A1 in Appendix). These stations, selected both for the good data continuity and the even spatial distribution on the investigated area, are equipped with broadband (40 s cutoff period), three-component Trillium Nanometrics™ seismometers, acquiring at a sampling rate of 100 Hz. The stations are installed in shallow vaults (depth ∼ 1.5 m) made of concrete, and show very different site conditions in terms of possible sources of anthropogenic seismic noise; some are close to towns, highways or industrial plants, others near agricultural areas, and yet others in small islands or on the flanks of the Mt Etna volcano (see Table 1). The analysed time interval was 1 November 2019–23 May 2020.
Table 1List of the seismic stations used in this work, with information about location and site conditions in terms of possible sources of anthropogenic seismic noise.
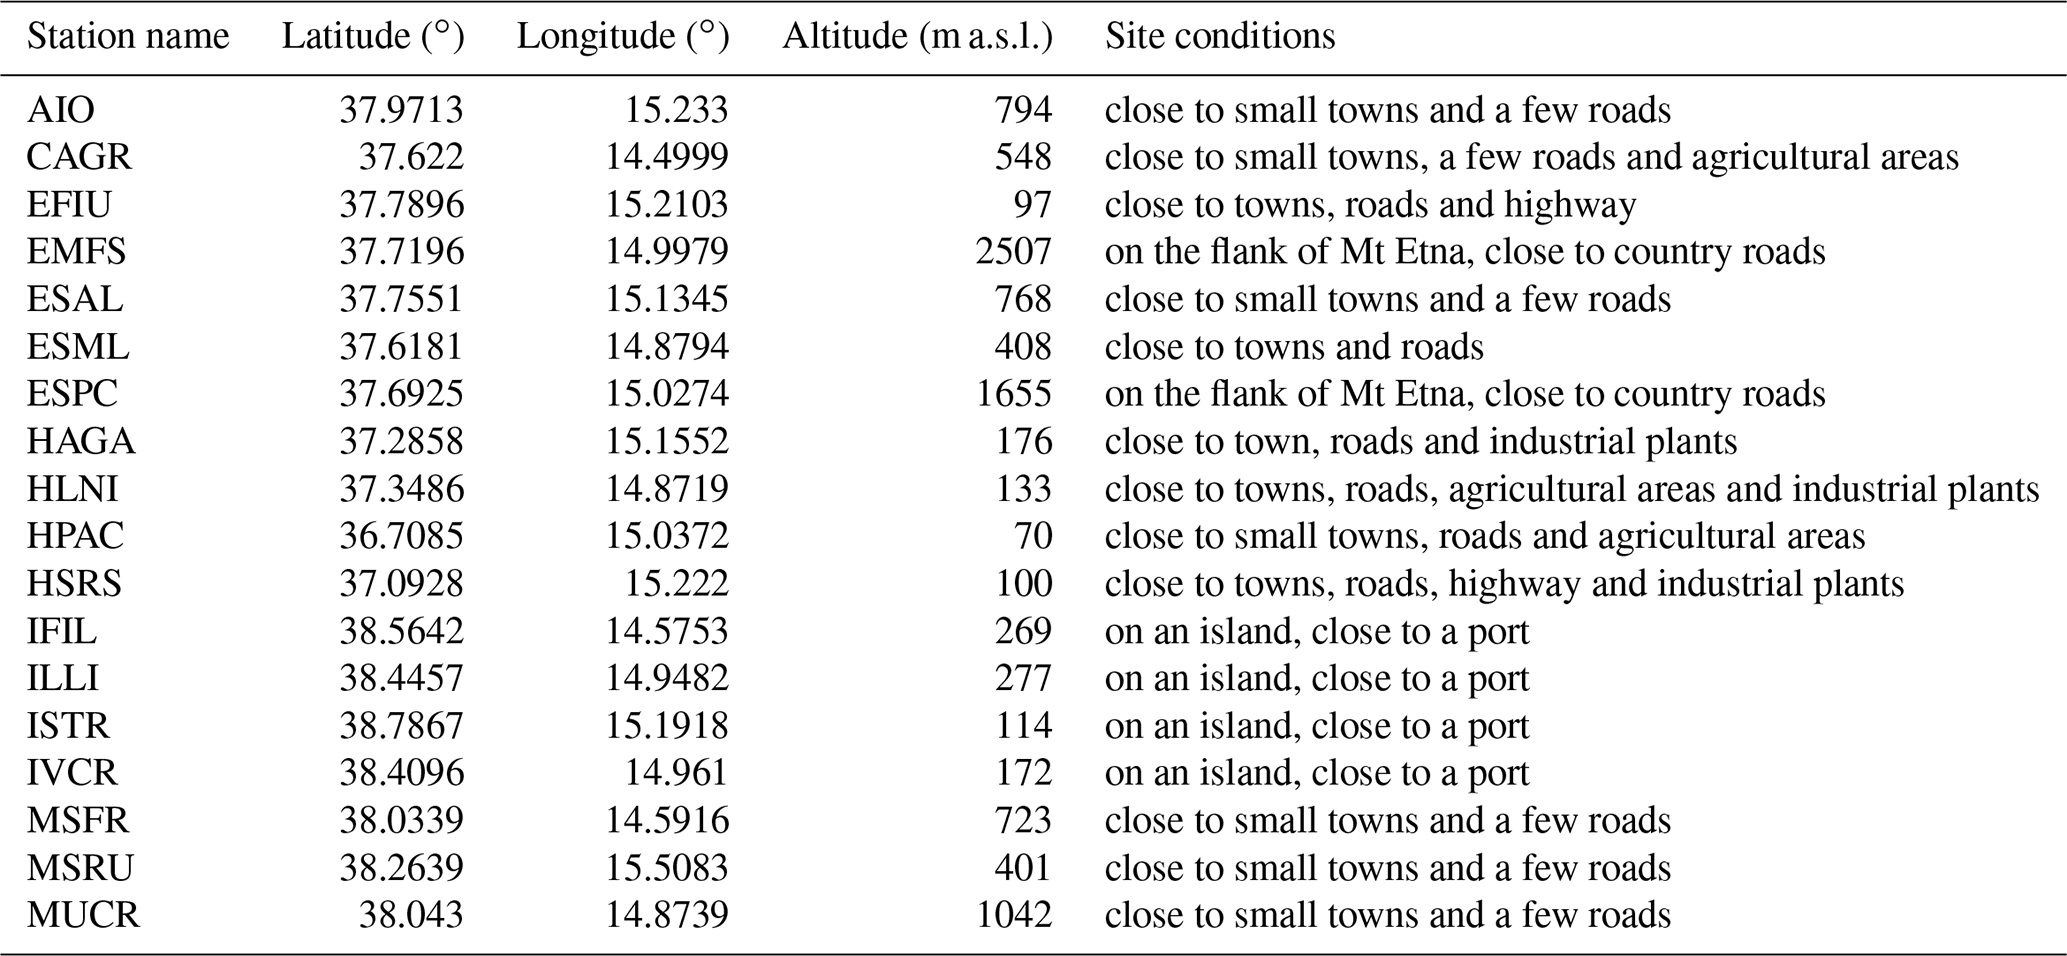
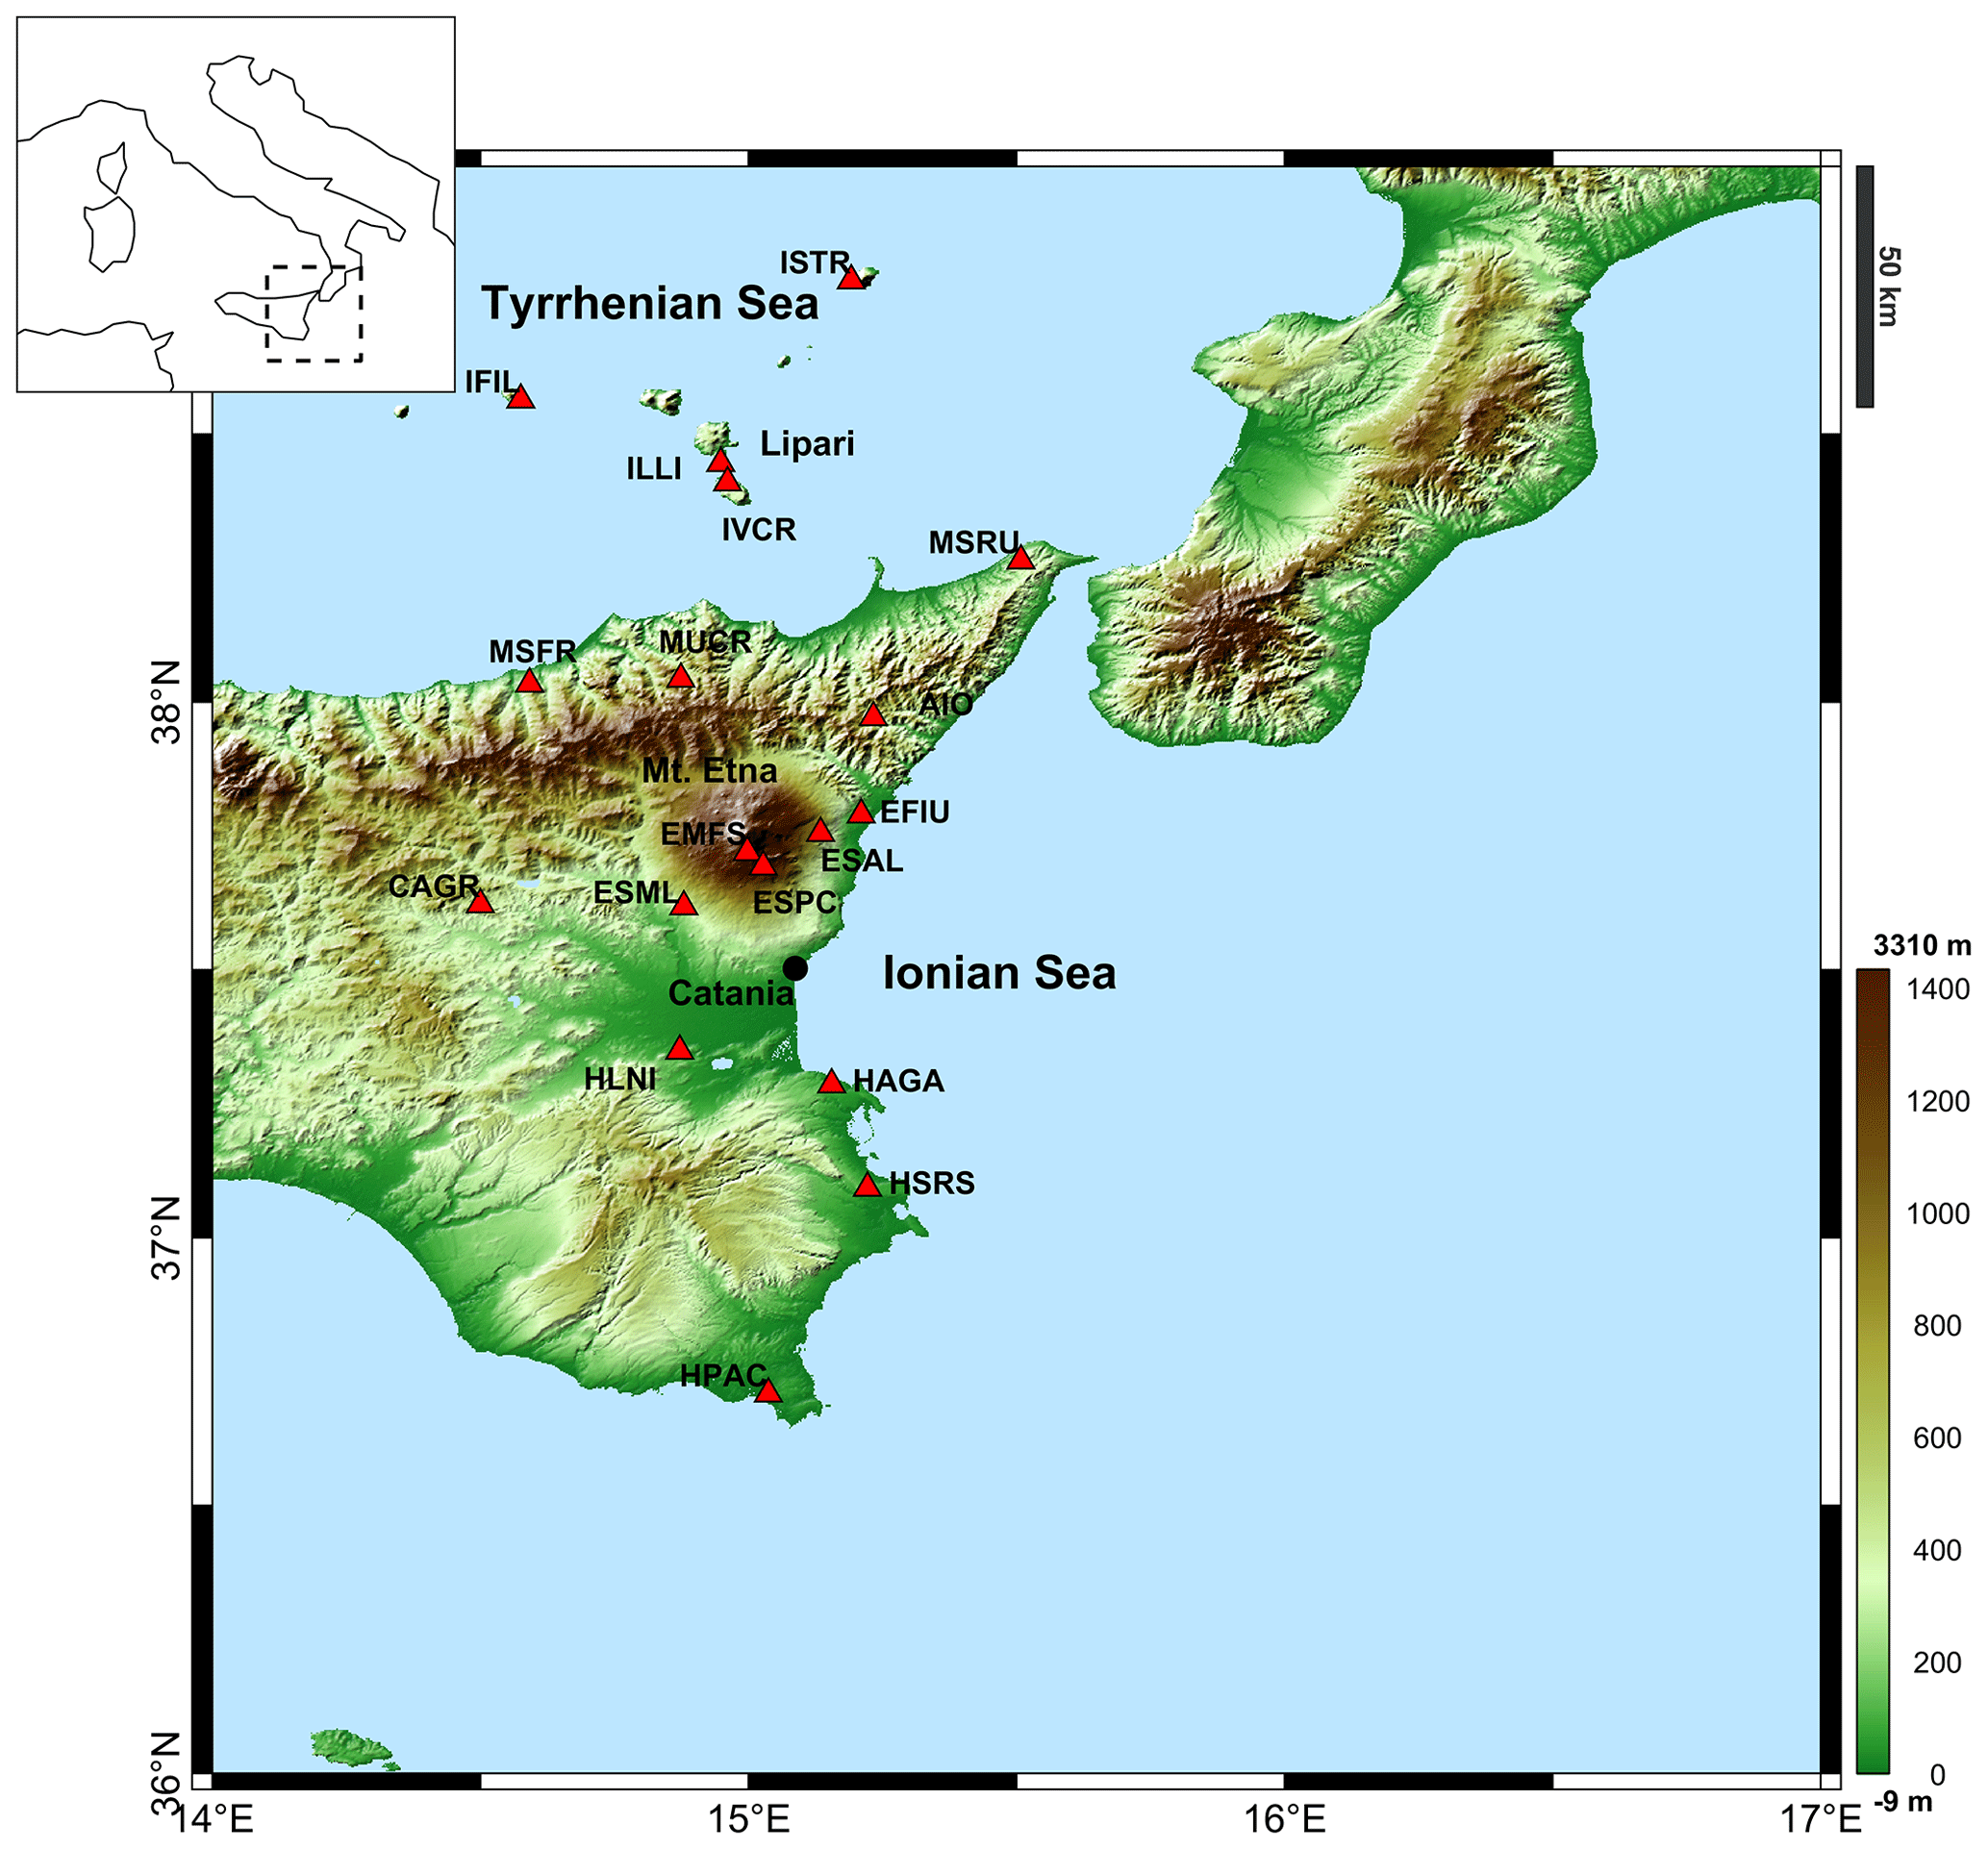
Figure 1Map of eastern Sicily with the location of the seismic stations (red triangles) used in this work. The top left panel shows where the area is located in Italy. The map was drawn by using NASA Shuttle Radar Topography Mission (SRTM) data and the readhgt.m Matlab® function (Beauducel, 2020).
2.2 Spectral and amplitude analysis
Both spectral and amplitude analyses were carried out to characterize the temporal variations in the seismic noise features. As for the former, the daily spectra of the vertical component of the seismic signal were calculated by using Welch's method (Welch, 1967) with windows of 81.92 s. All the daily spectra were gathered and visualized as spectrograms, with time on the x axis, frequency on the y axis and power spectral density (PSD) indicated by a colour scale (Fig. 2). It is worth noting that the sharp decrease in the spectral amplitude, evident at frequencies above 40 Hz, is due to the digitizer anti-aliasing filter. Hence, the following analyses have been performed at frequencies up to 40 Hz.
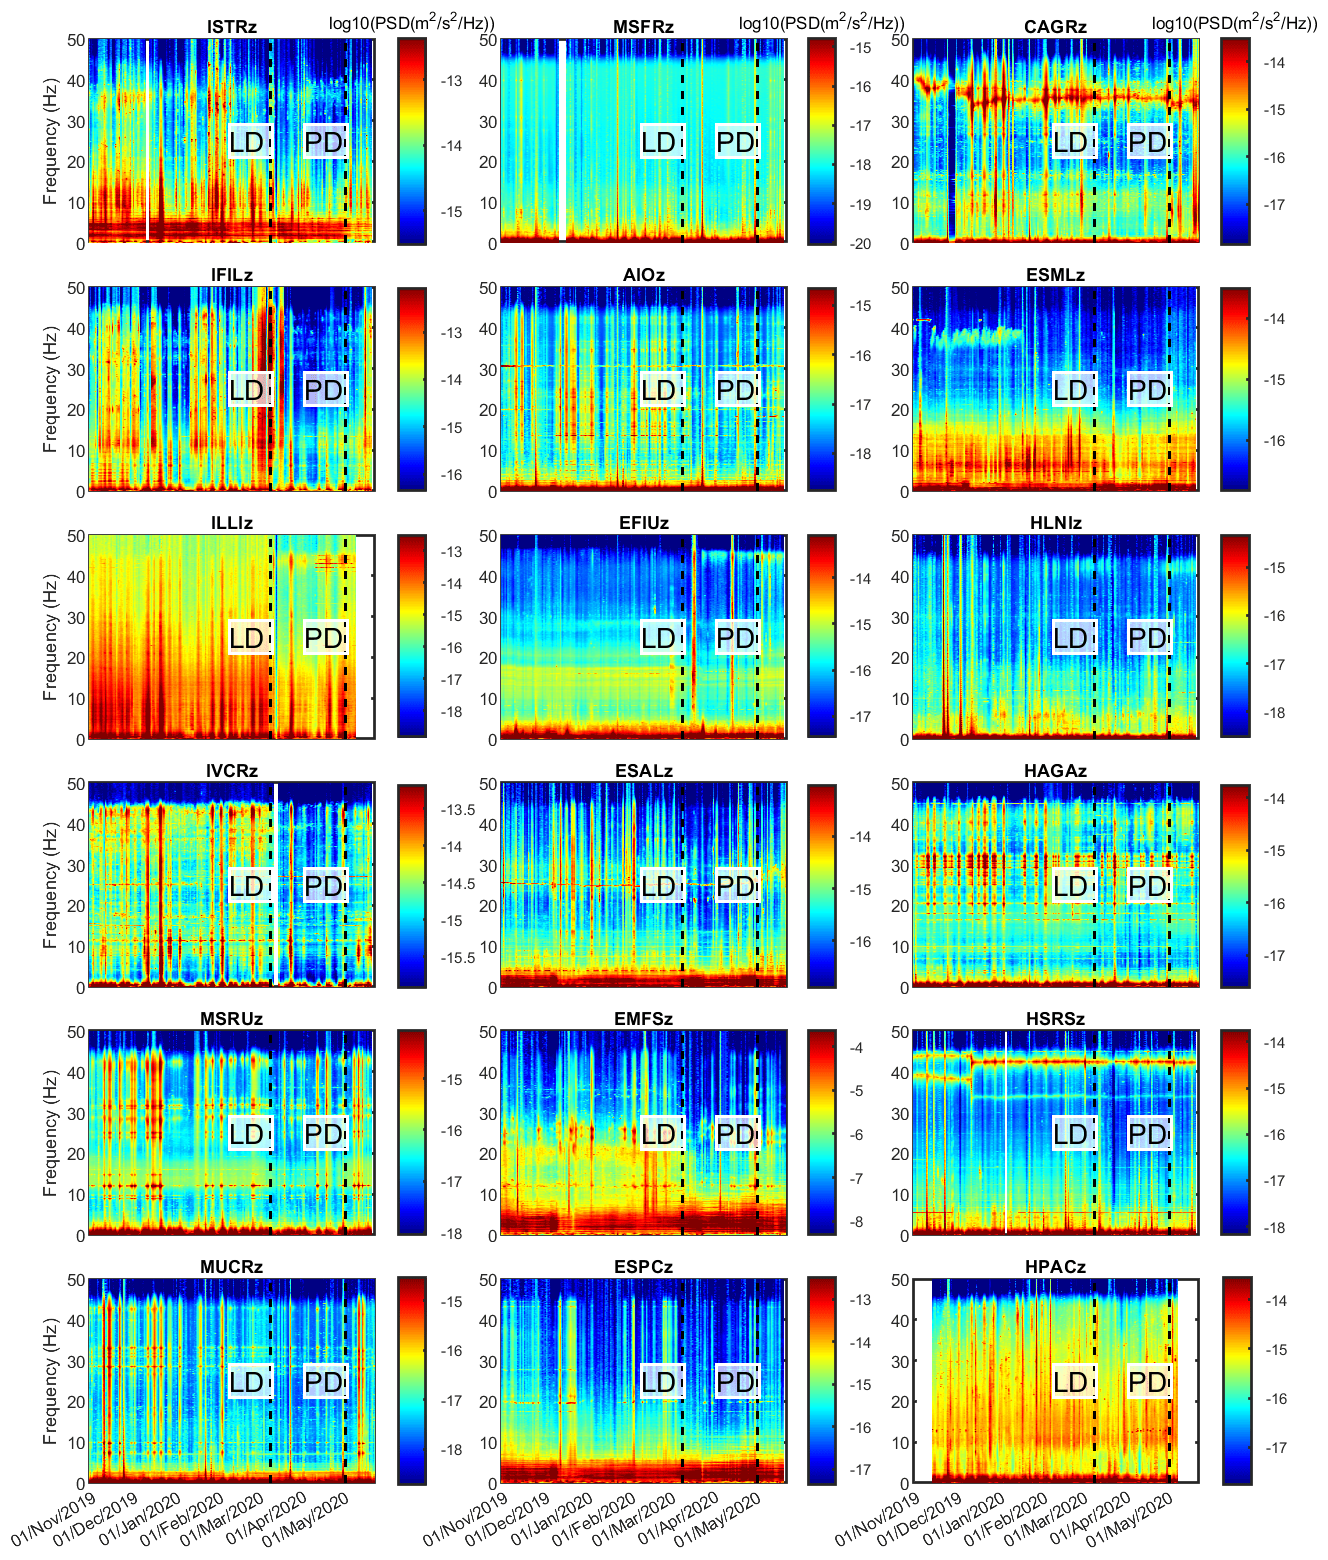
Figure 2Spectrograms of the vertical component of the seismic signals. The vertical dashed lines and the labels “LD” and “PD” indicate the times when the national lockdown measures were implemented in Italy (11 March 2020) and when the first presidential decree, slightly lifting the lockdown measures, was issued (4 May 2020), respectively. The stations are sorted by decreasing latitude from upper left to bottom right.
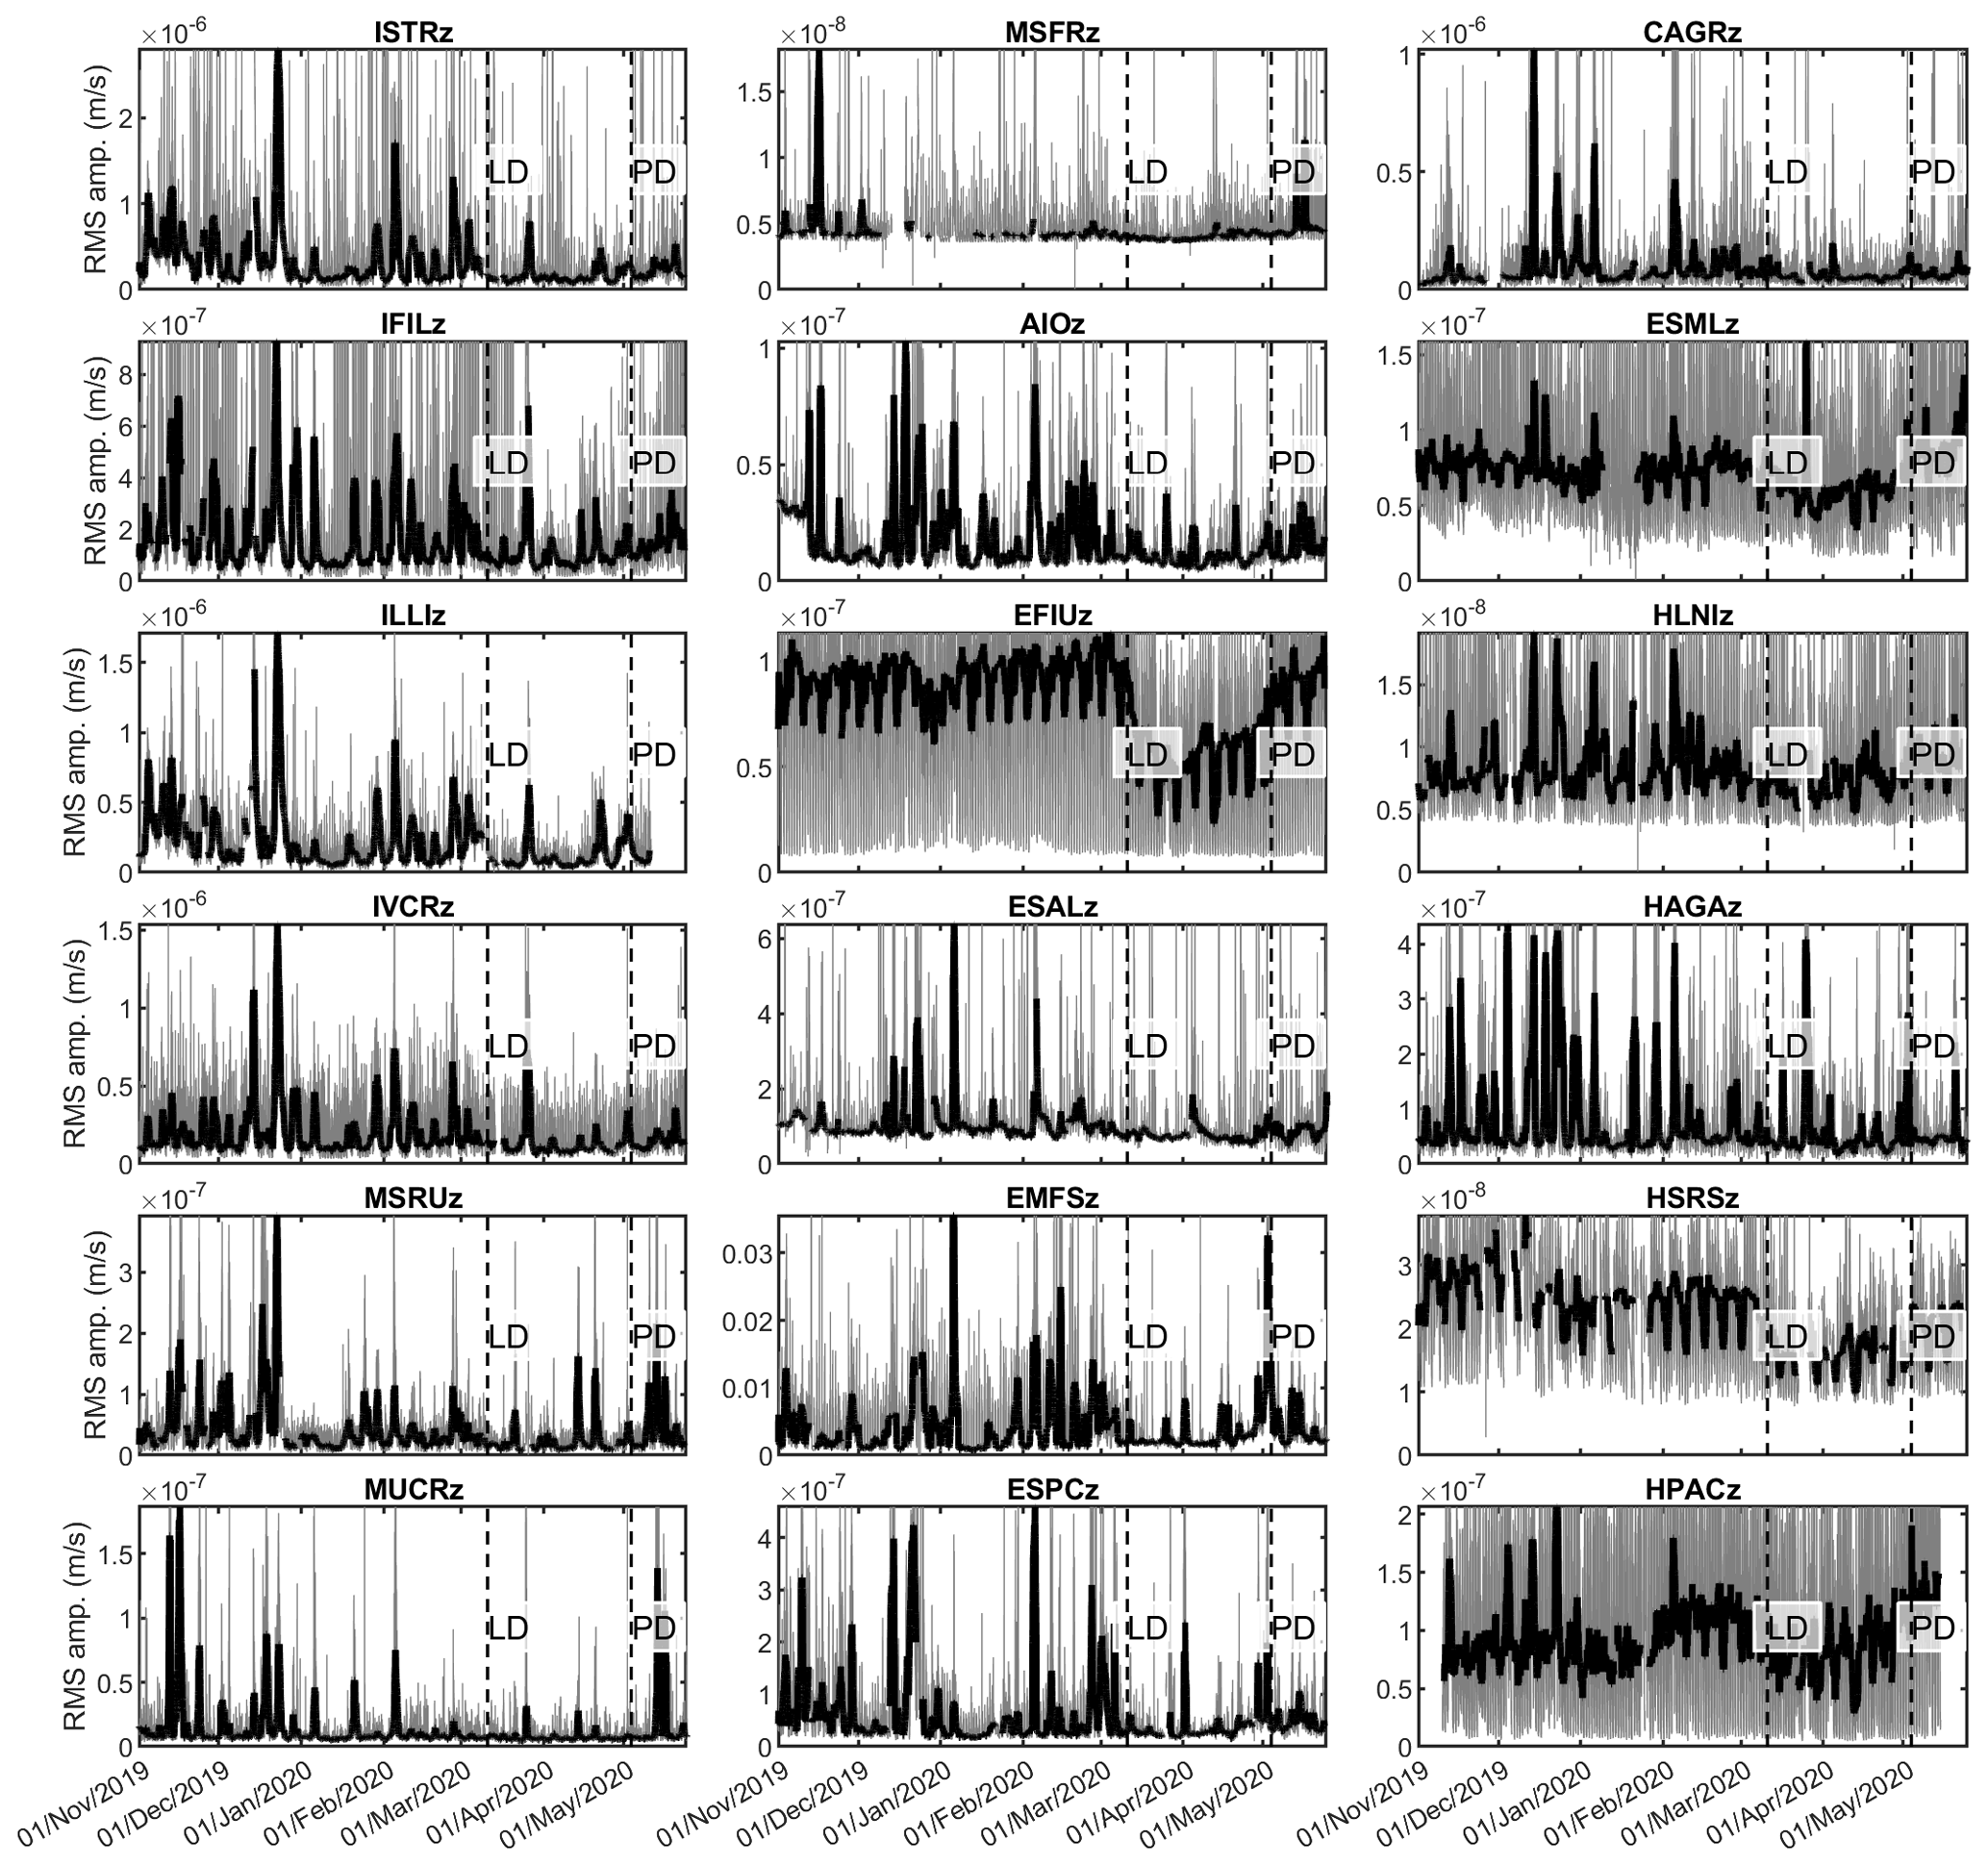
Figure 3Rms amplitude time series of the vertical component of the seismic signals, filtered in the band 10–40 Hz (grey line), and corresponding moving median computed on 1 d long sliding windows (thick black line). The vertical dashed lines and the labels “LD” and “PD” indicate the times when the national lockdown measures were implemented in Italy (11 March 2020) and when the first presidential decree, slightly lifting the lockdown measures, was issued (4 May 2020), respectively. The stations are sorted by decreasing latitude from upper left to bottom right.
Concerning the amplitude analysis, the time series of the root mean square (rms) amplitude of the seismic signal, filtered in the band 10–40 Hz, were obtained on 15 min long sliding windows (Fig. 3). This frequency band was chosen because, as will be shown in Sect. 3, it is the most influenced band by the anthropogenic seismic noise. To visually show the general temporal pattern of the seismic noise amplitude in eastern Sicily, the rms amplitude time series were averaged on 3 d long sliding windows, normalized, gathered and represented by a coloured checkerboard plot (Fig. 4). To make the changes in the noise background level as clear as possible in the checkerboard plot, the normalization was performed by (i) setting all the values greater than the 90th percentile equal to the 90th percentile, (ii) subtracting the minimum value and (iii) dividing by the maximum value. In addition, the percentage change in seismic rms amplitude in the band 10–40 Hz in the period 11 March–11 April 2020 was calculated by using the rms amplitude during 20 January–20 February 2020 as a baseline (Fig. 5).
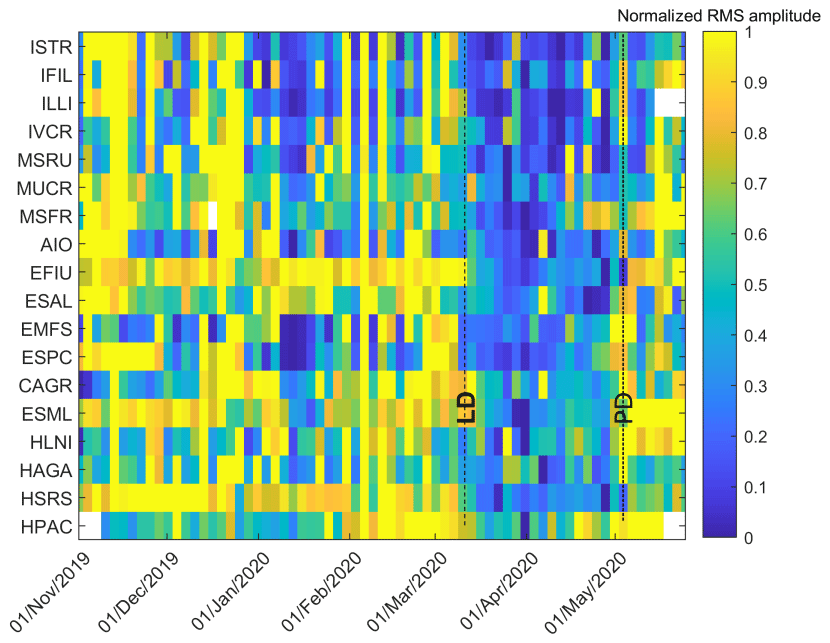
Figure 4Temporal changes in the normalized seismic rms amplitude at 18 seismic stations sorted by decreasing latitude (see labels on the left y axis). Data gaps are coloured white. The vertical dashed lines and the labels “LD” and “PD” indicate the times when the national lockdown measures were implemented in Italy (11 March 2020) and when the first presidential decree, slightly lifting the lockdown measures, was issued (4 May 2020), respectively.
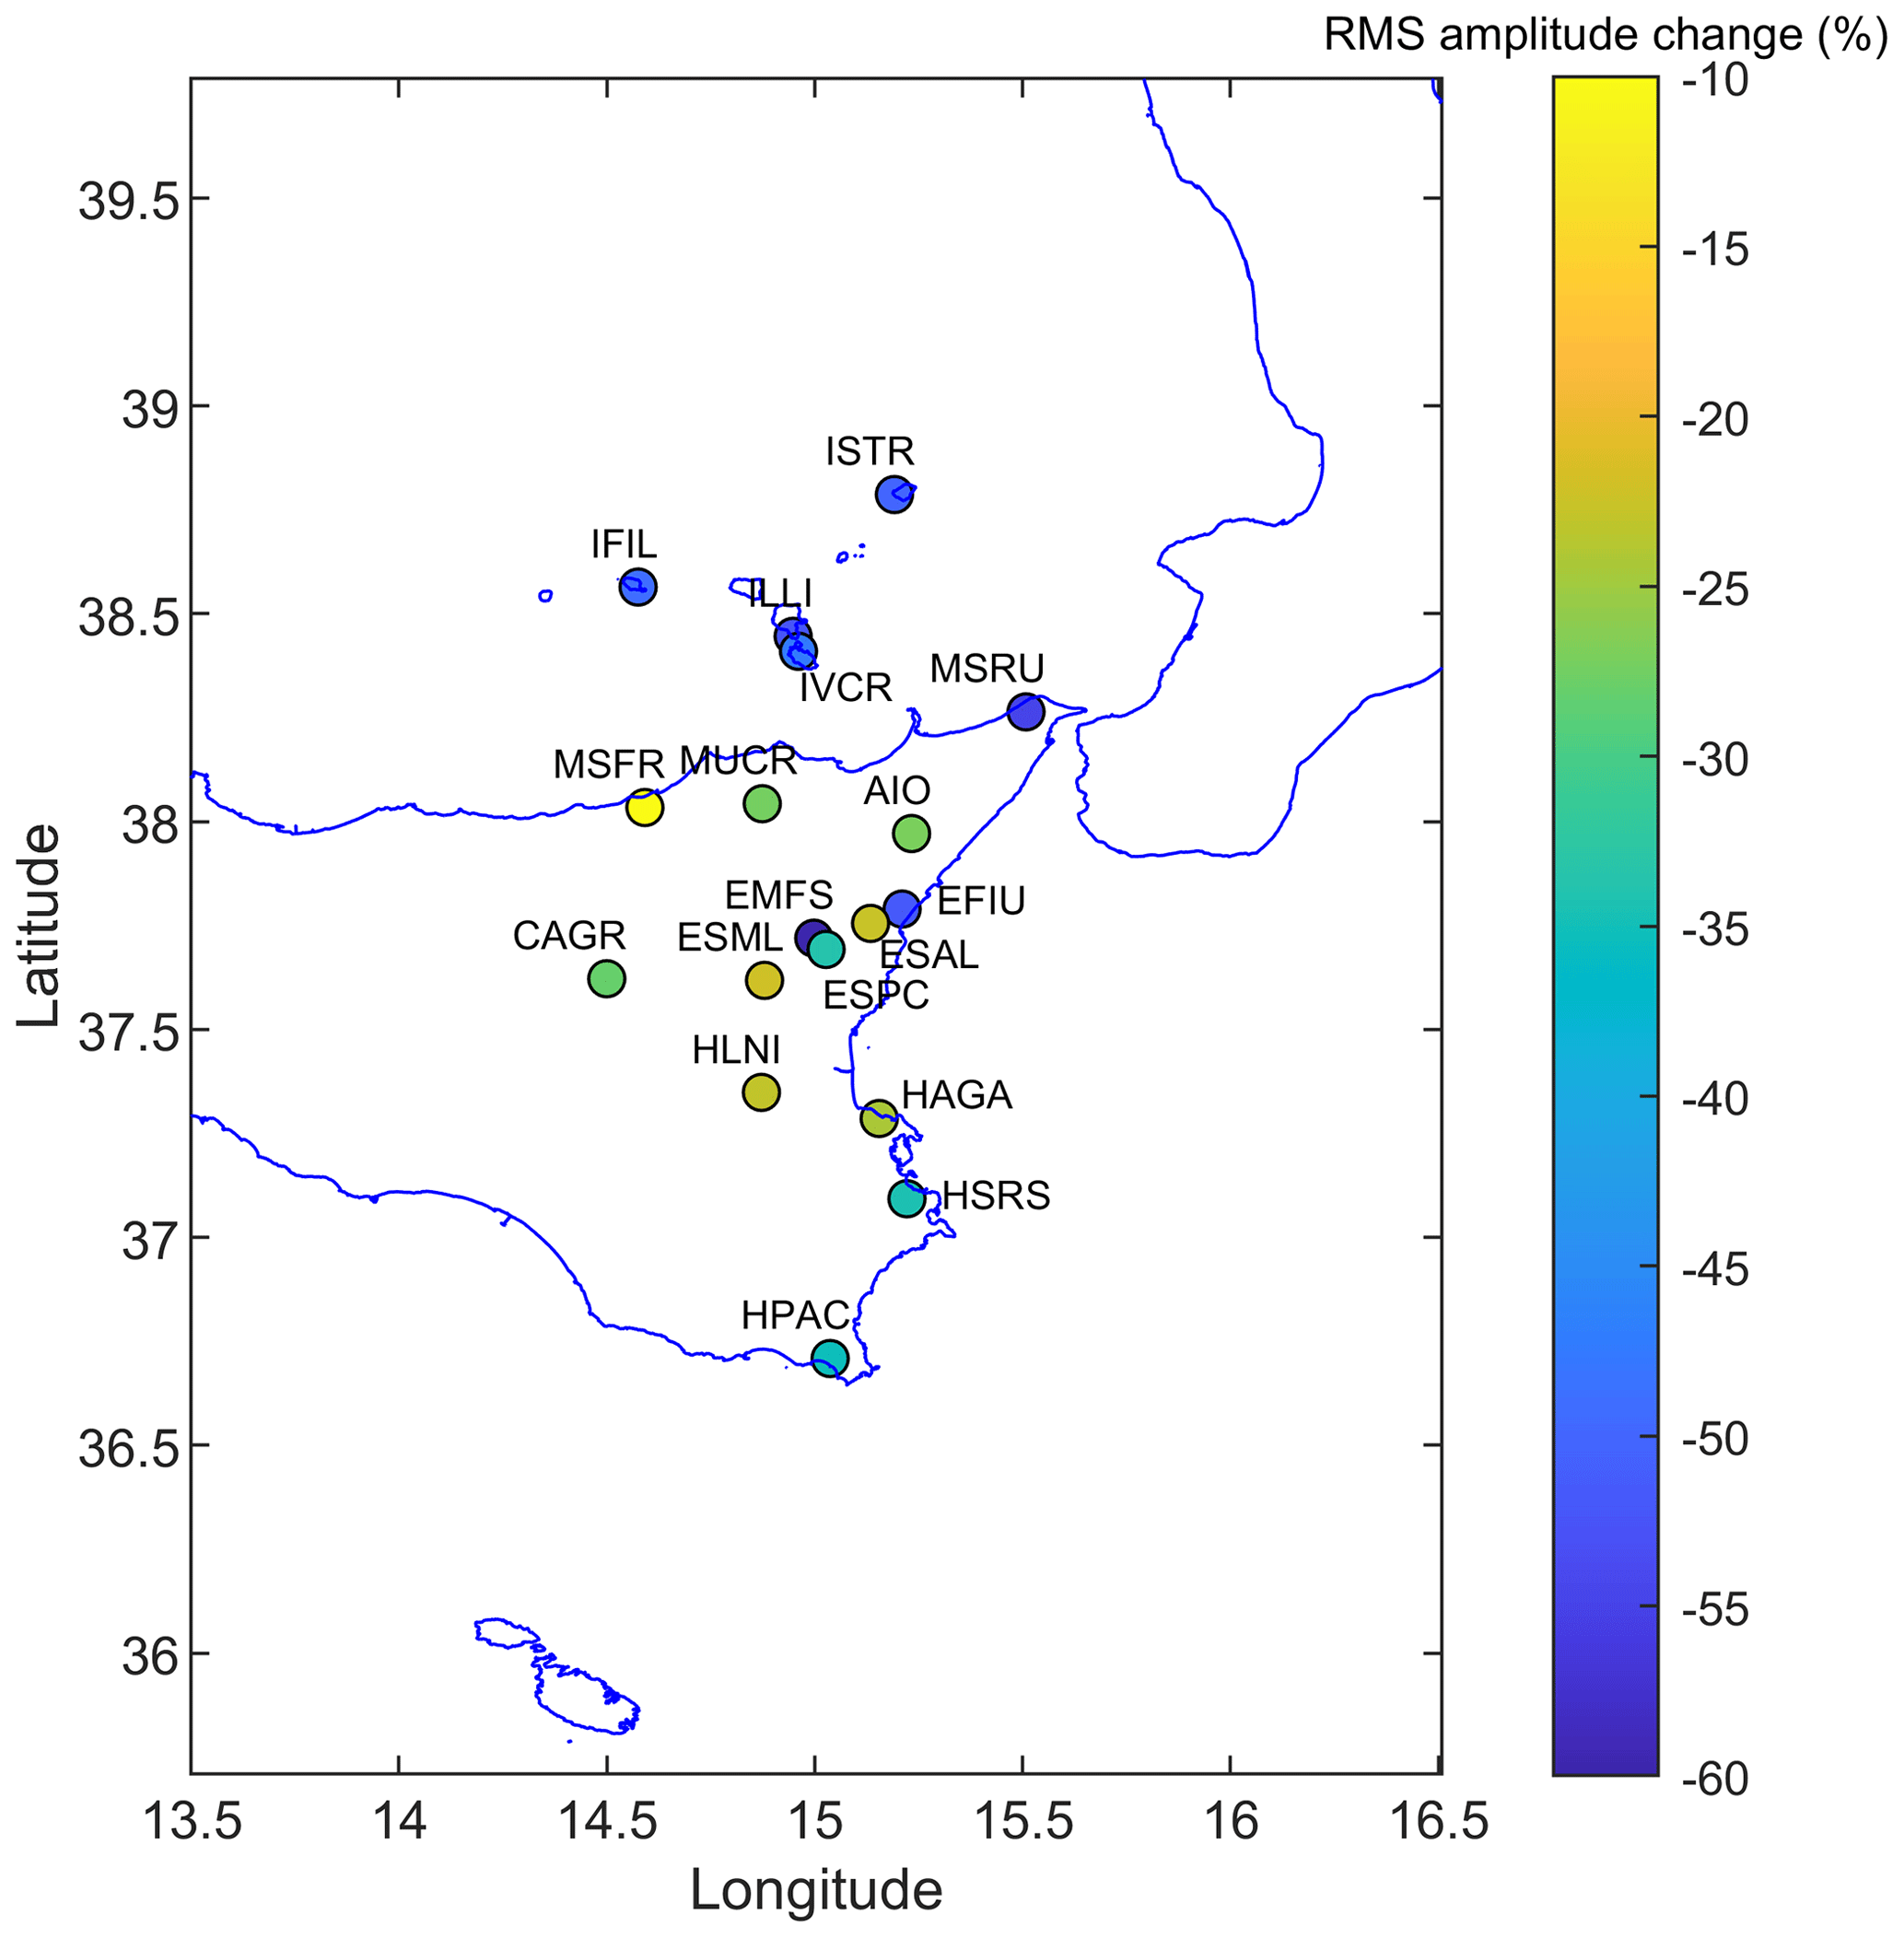
Figure 5Percent change in seismic rms amplitude in the band 10–40 Hz during the period 11 March–11 April 2020 (right after the lockdown measures entered into force) with respect to the interval 20 January–20 February 2020.
Finally, to highlight the frequency band showing the most evident amplitude changes due to the lockdown, two 20 d long time windows, extracted before (1–20 February) and during (11 March–1 April) the lockdown, were considered. Two average spectra, representing the seismic spectral content before and during the lockdown, were computed on the two windows, and, successively, a ratio between them was calculated (Figs. 6 and 7). All the ratios were stacked and the result is shown in Fig. 8.
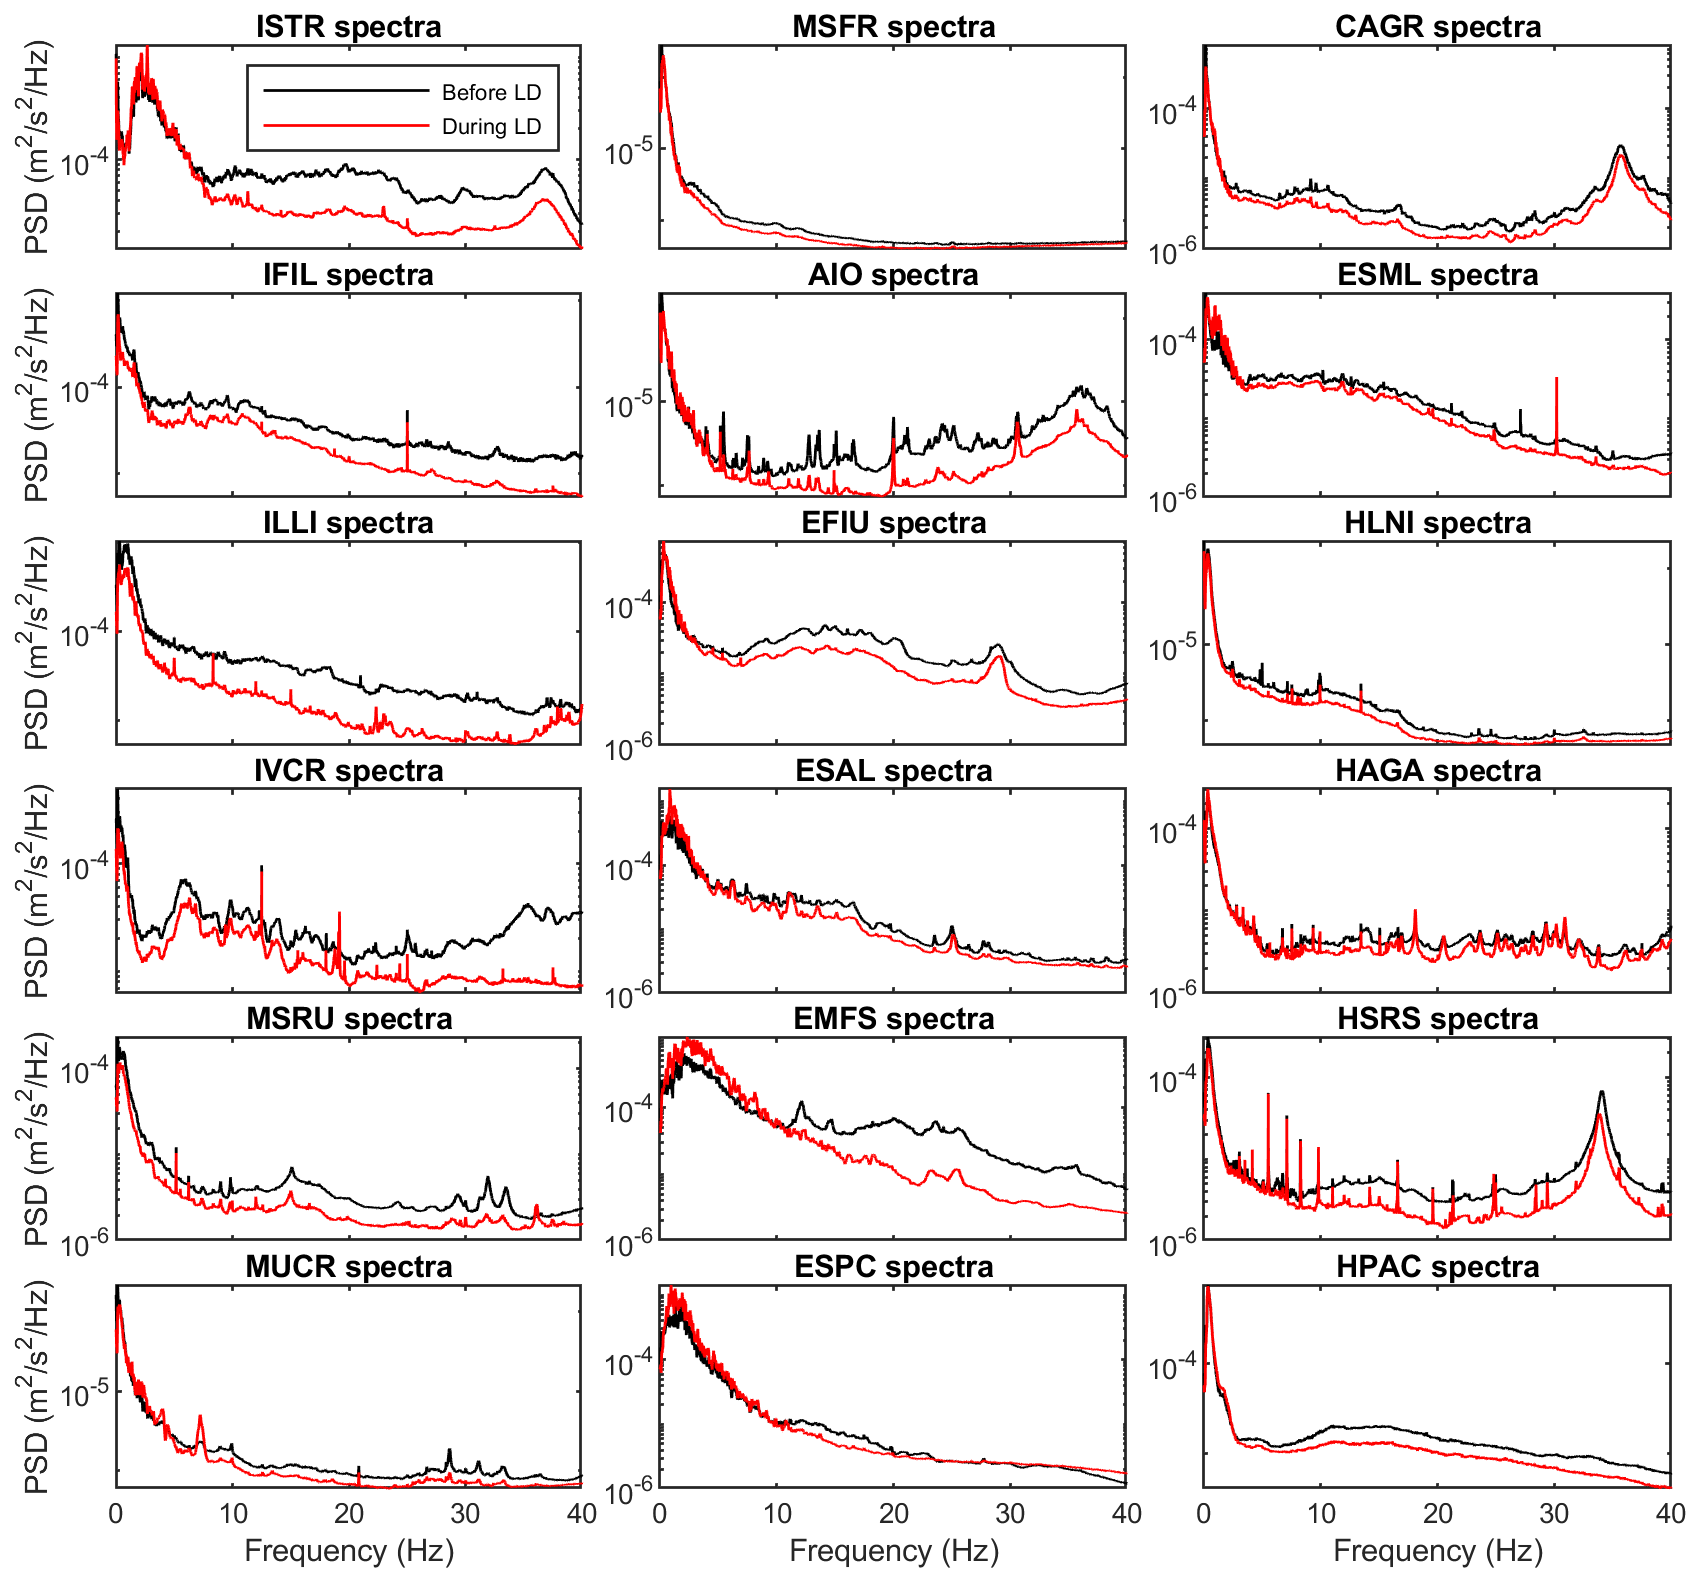
Figure 6Spectra of the vertical component of the seismic signals recorded during two 20 d long time windows, extracted before (black line; 1–20 February) and during (red line; 11 March–1 April) the lockdown. The stations are sorted by decreasing latitude from upper left to bottom right.
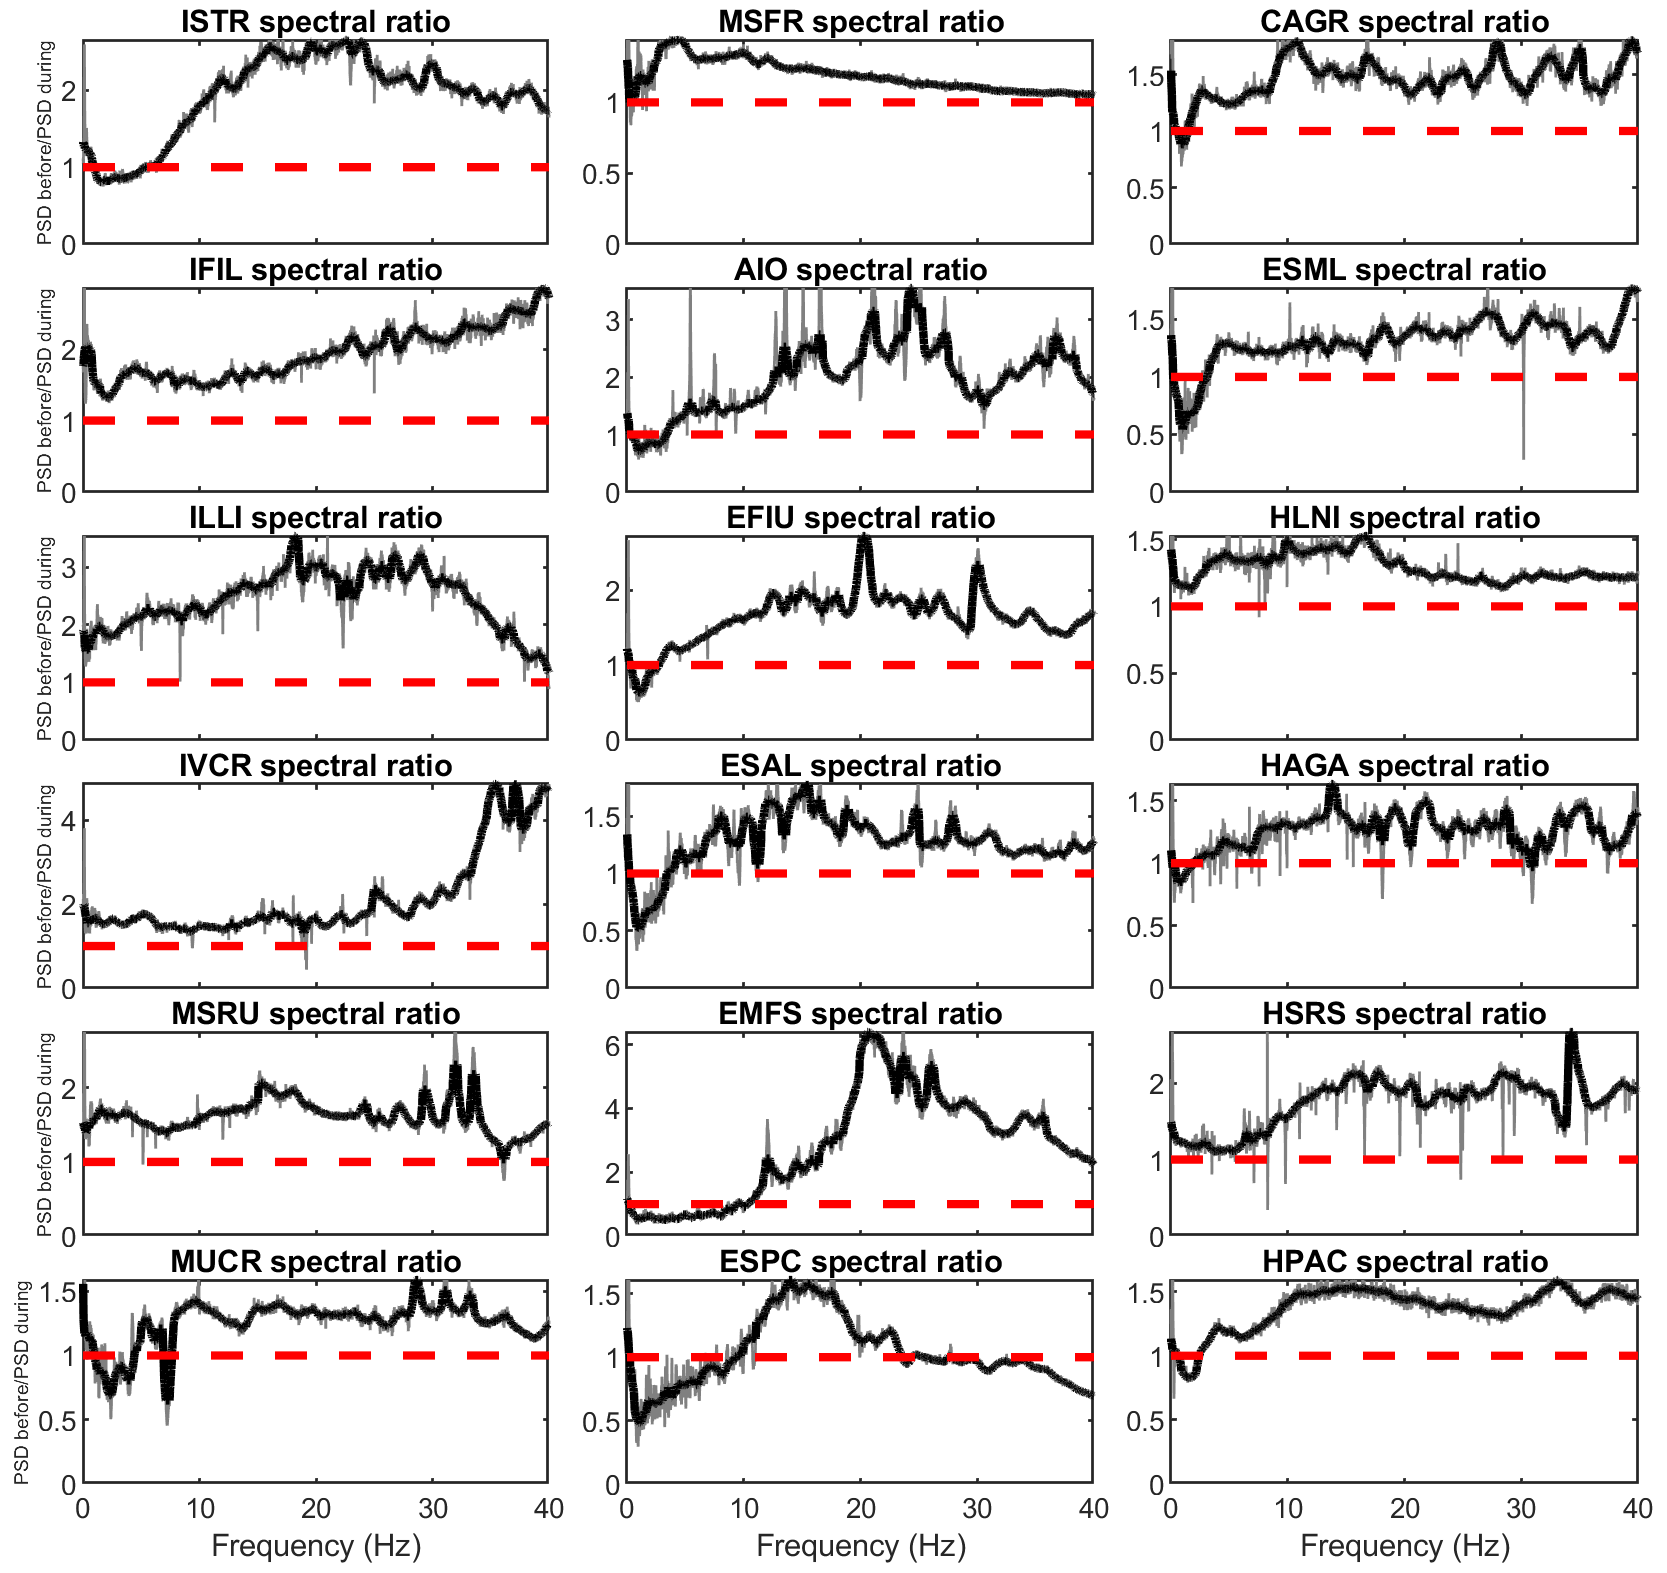
Figure 7Ratios between the spectra of the vertical component of the seismic signals recorded during two 20 d long time windows, extracted before (1–20 February) and during (11 March–1 April) the lockdown (grey lines; see Fig. 6) and corresponding moving median over 0.6 Hz (black thick line). The red horizontal dashed lines indicate ratio values equal to 1. The stations are sorted by decreasing latitude from upper left to bottom right.
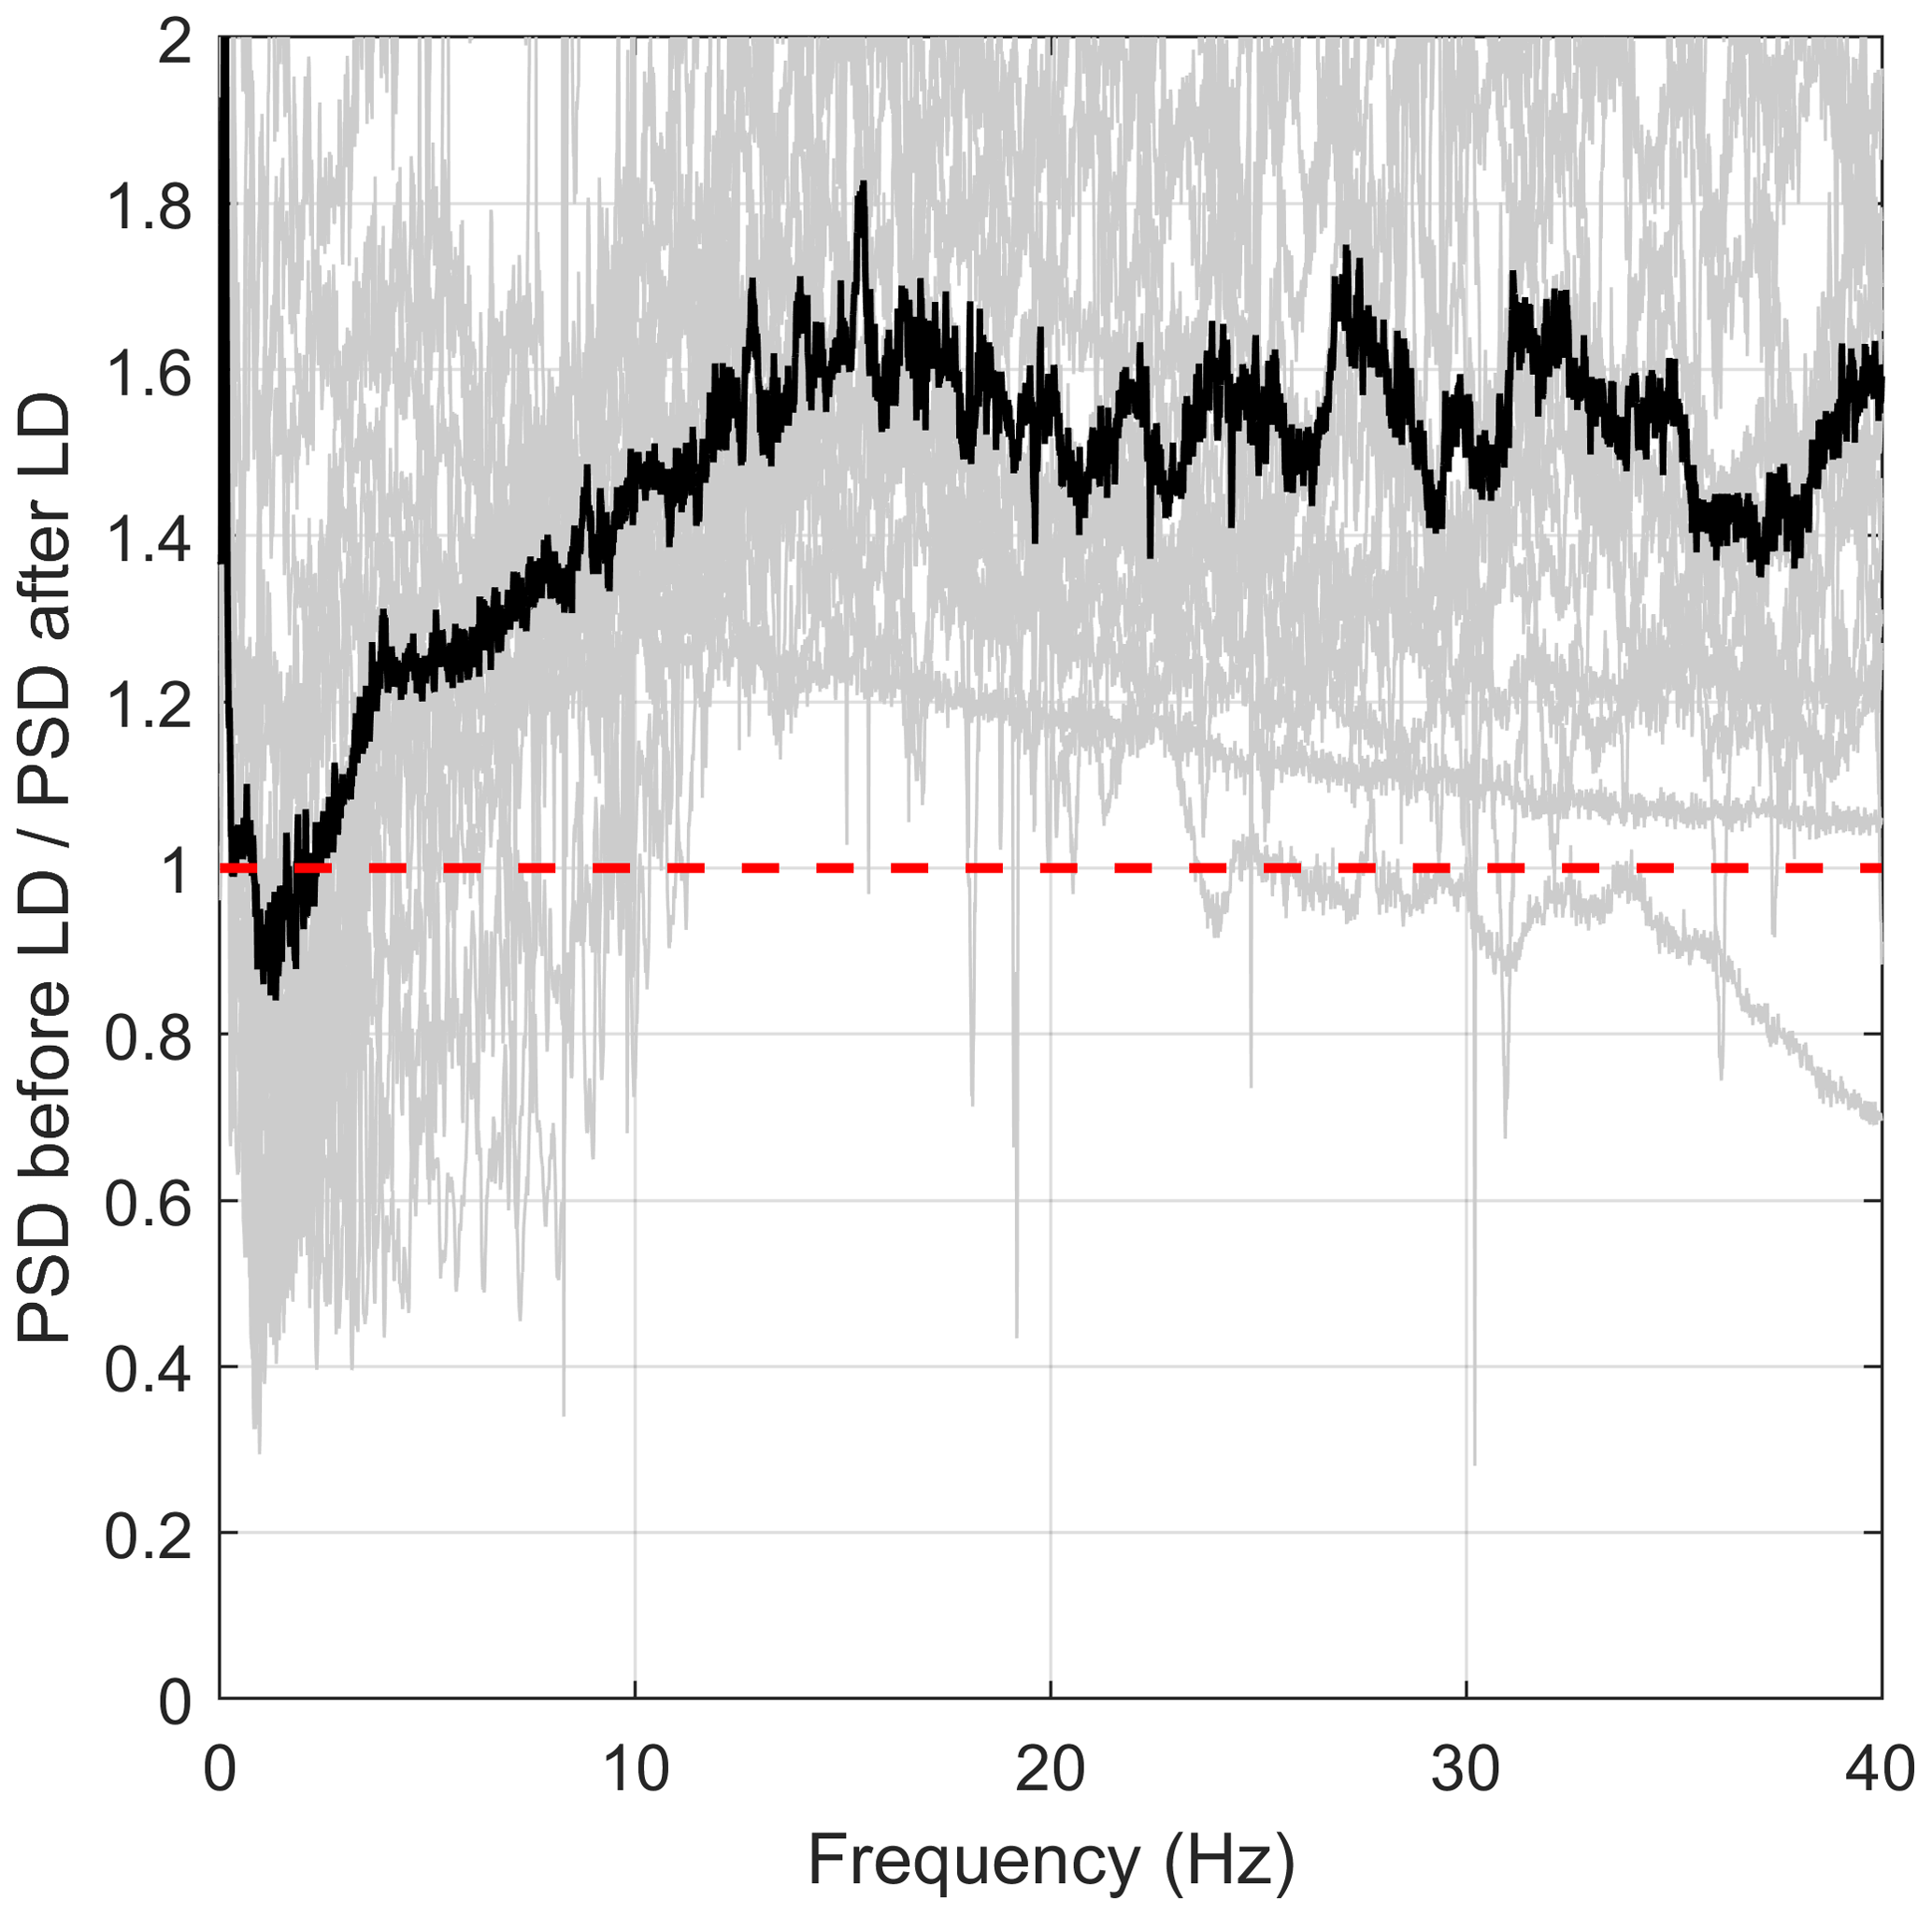
Figure 8Ratios between the spectra computed before and during the lockdown (grey lines; see Fig. 7) and the corresponding stacked ratio (black line). The red horizontal dashed line indicates a ratio value equal to 1.
2.3 Comparison with mobility data
Google, Apple and Facebook made human mobility data available for almost every country worldwide as support for public health policy during the COVID-19 crisis. For our study area, Google and Facebook provided aggregated data for the Sicily region and Apple shared data for Catania, which is the main city in eastern Sicily (Fig. 1). The Google community mobility corresponds to the percentage of change relative to a baseline defined as the median value of the corresponding day of the week, during the period 3 January–6 February 2020. The data are structured in categories to group some of the places with similar characteristics: grocery stores and pharmacies, parks, transit stations, retail and recreation places, and residences and workplaces (Google, 2020). Apple shared information about the percent change in the public's walking and driving compared with the baseline value from the 13 January (Apple, 2020). Finally, Facebook provided data regarding the human movement percent changes measured throughout March, April and May 2020 relative to a baseline value in February (Facebook, 2020).
To understand how much the seismic noise could reflect society's mobility level, a preliminary visual comparison between time series of the seismic rms amplitude and the corresponding above-mentioned community mobility data was performed (Fig. 9a). Then, to quantify the similarity, a correlation analysis was performed. In place of using the more common Pearson correlation coefficient, we made use of the Spearman correlation coefficient, allowing us to compare series which do not have a normal distribution and to explore nonlinear relationships (e.g. Craig et al., 2016; Cannata et al., 2019). To identify the frequencies that better correlate with the human mobility data, we performed the correlation analysis between all the time series of seismic rms amplitudes, filtered in narrow bands (bandwidth: 1 Hz, fourth-order Butterworth filter; Lyons, 2004) around the integer frequencies between 1 and 40 Hz, and the community mobility datasets provided by Google, Apple and Facebook. Successively, we computed an average value of the Spearman correlation coefficients of all the stations per each frequency band (Fig. 9b). In addition, to show how the correlation changes at the different considered stations, the Spearman correlation coefficient was calculated between the seismic rms amplitude time series of each station in the 10–40 Hz range and the community mobility datasets (Fig. 10). To verify if the obtained Spearman correlation coefficients are significantly different from zero or not (null hypothesis), the t test was performed and the p value (probability value) was calculated (Fig. A3). P values lower than the significance level of 0.05 were considered sufficient to reject the null hypothesis. Such a value, which means that the probability that the result of the statistical test is due to chance alone is less than 5 %, is a commonly accepted threshold for this statistical test (e.g. Anthony et al., 2017).
In addition, since some seismic stations are located on the Aeolian Islands (ISTR, IFIL, ILLI, IVCR), we took into account ship traffic data from Lipari port (∼ 2.7 km from ILLI station; see Fig. 1), provided by FleetMon, containing information about the daily number of port calls of all the boats, as well as each boat category (passenger, high-speed, tanker, cargo and yacht) and their gross tonnage. All these data were compared with the seismic rms amplitude time series of ILLI station in the 10–40 Hz band again by Spearman correlation coefficient (Fig. 11a–d). As the only parameters showing p values lower than 0.05 were the overall daily gross tonnage and the daily number of port calls of tankers, the frequency dependence analysis shown above was repeated on these two time series (Fig. 11e).
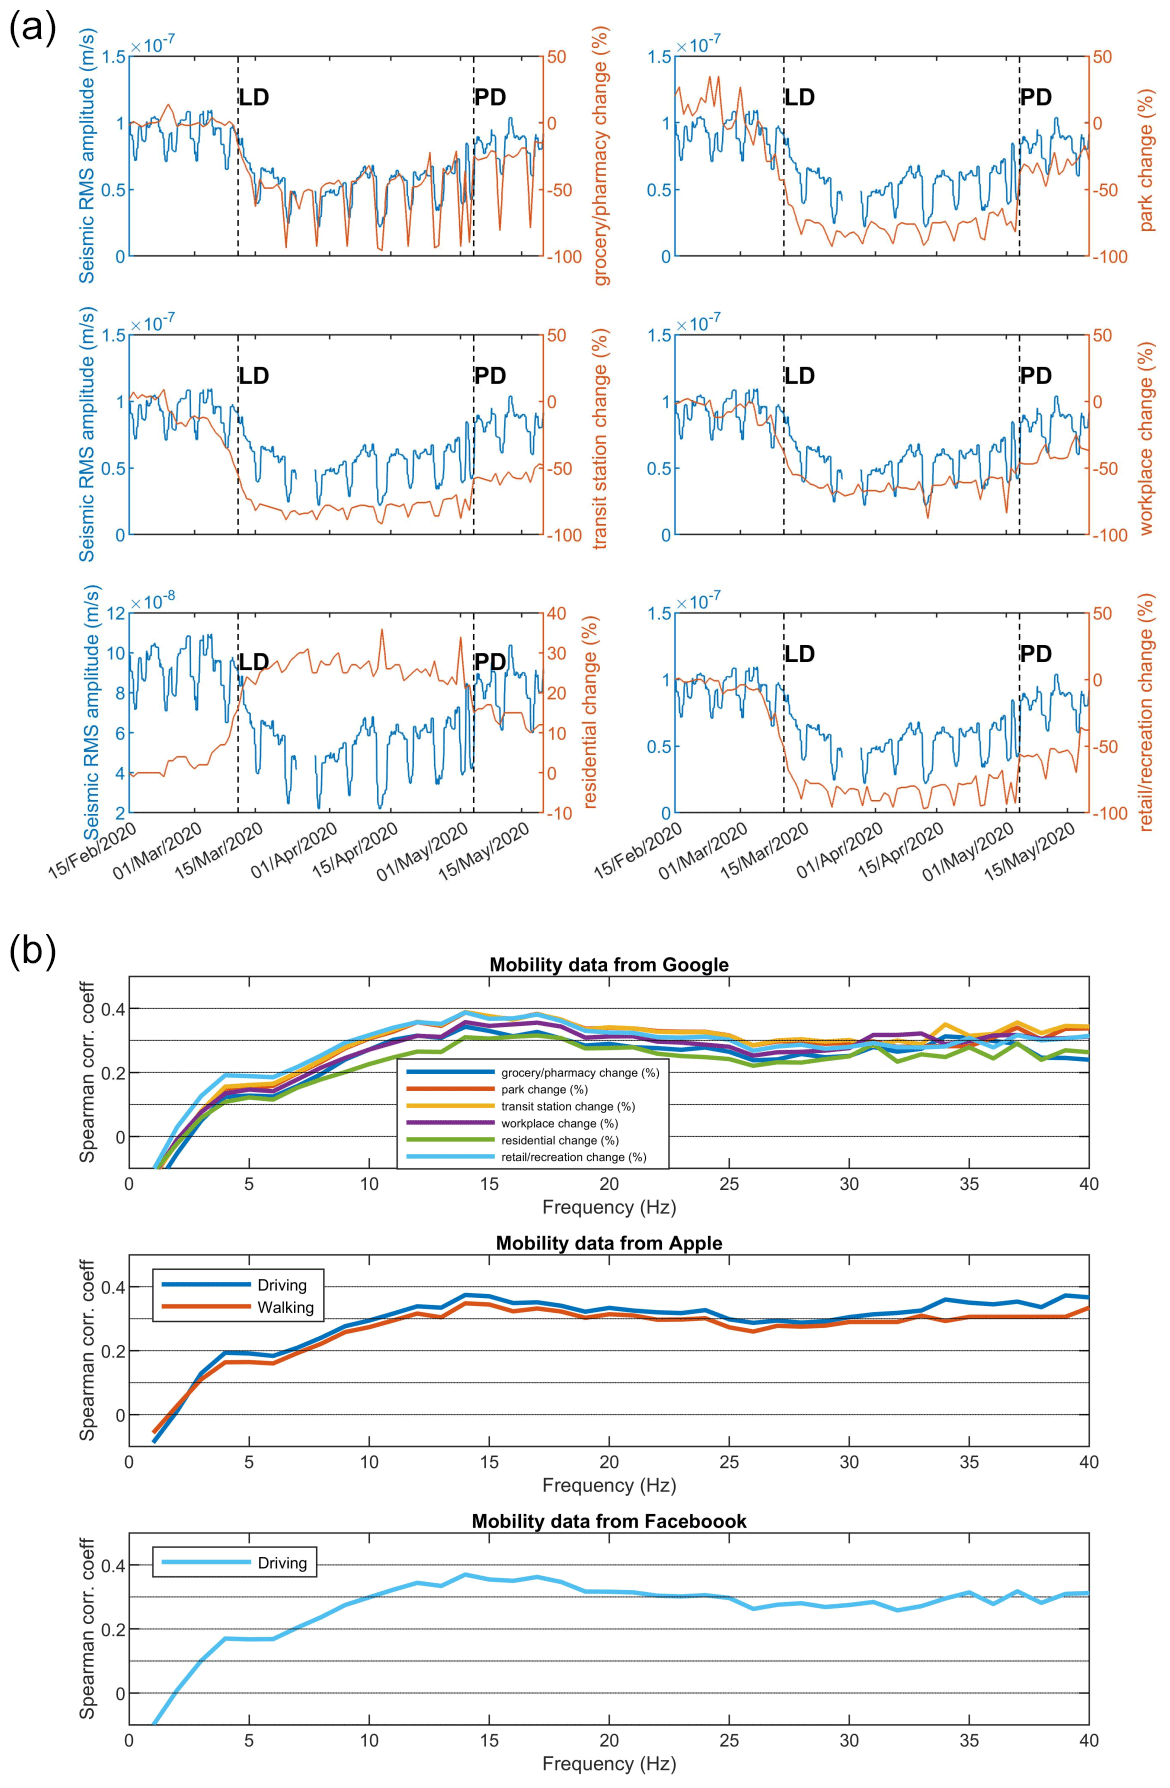
Figure 9(a) Time series of rms amplitude of the vertical component of the seismic signal recorded by EFIU station and filtered in the band 10–40 Hz (blue line) and the different categories of human mobility as provided by Google (red line). The vertical dashed lines and the labels “LD” and “PD” indicate the times when the national lockdown measures were implemented in Italy (11 March 2020) and when the first presidential decree, slightly lifting the lockdown measures, was issued (4 May 2020), respectively. (b) Spearman correlation coefficient, calculated between seismic rms amplitude at the different stations and the mobility parameters, as a function of the frequency band of the seismic noise. The Spearman correlation coefficient obtained for the residential change (top plot in b) was multiplied by −1 to make it positive.
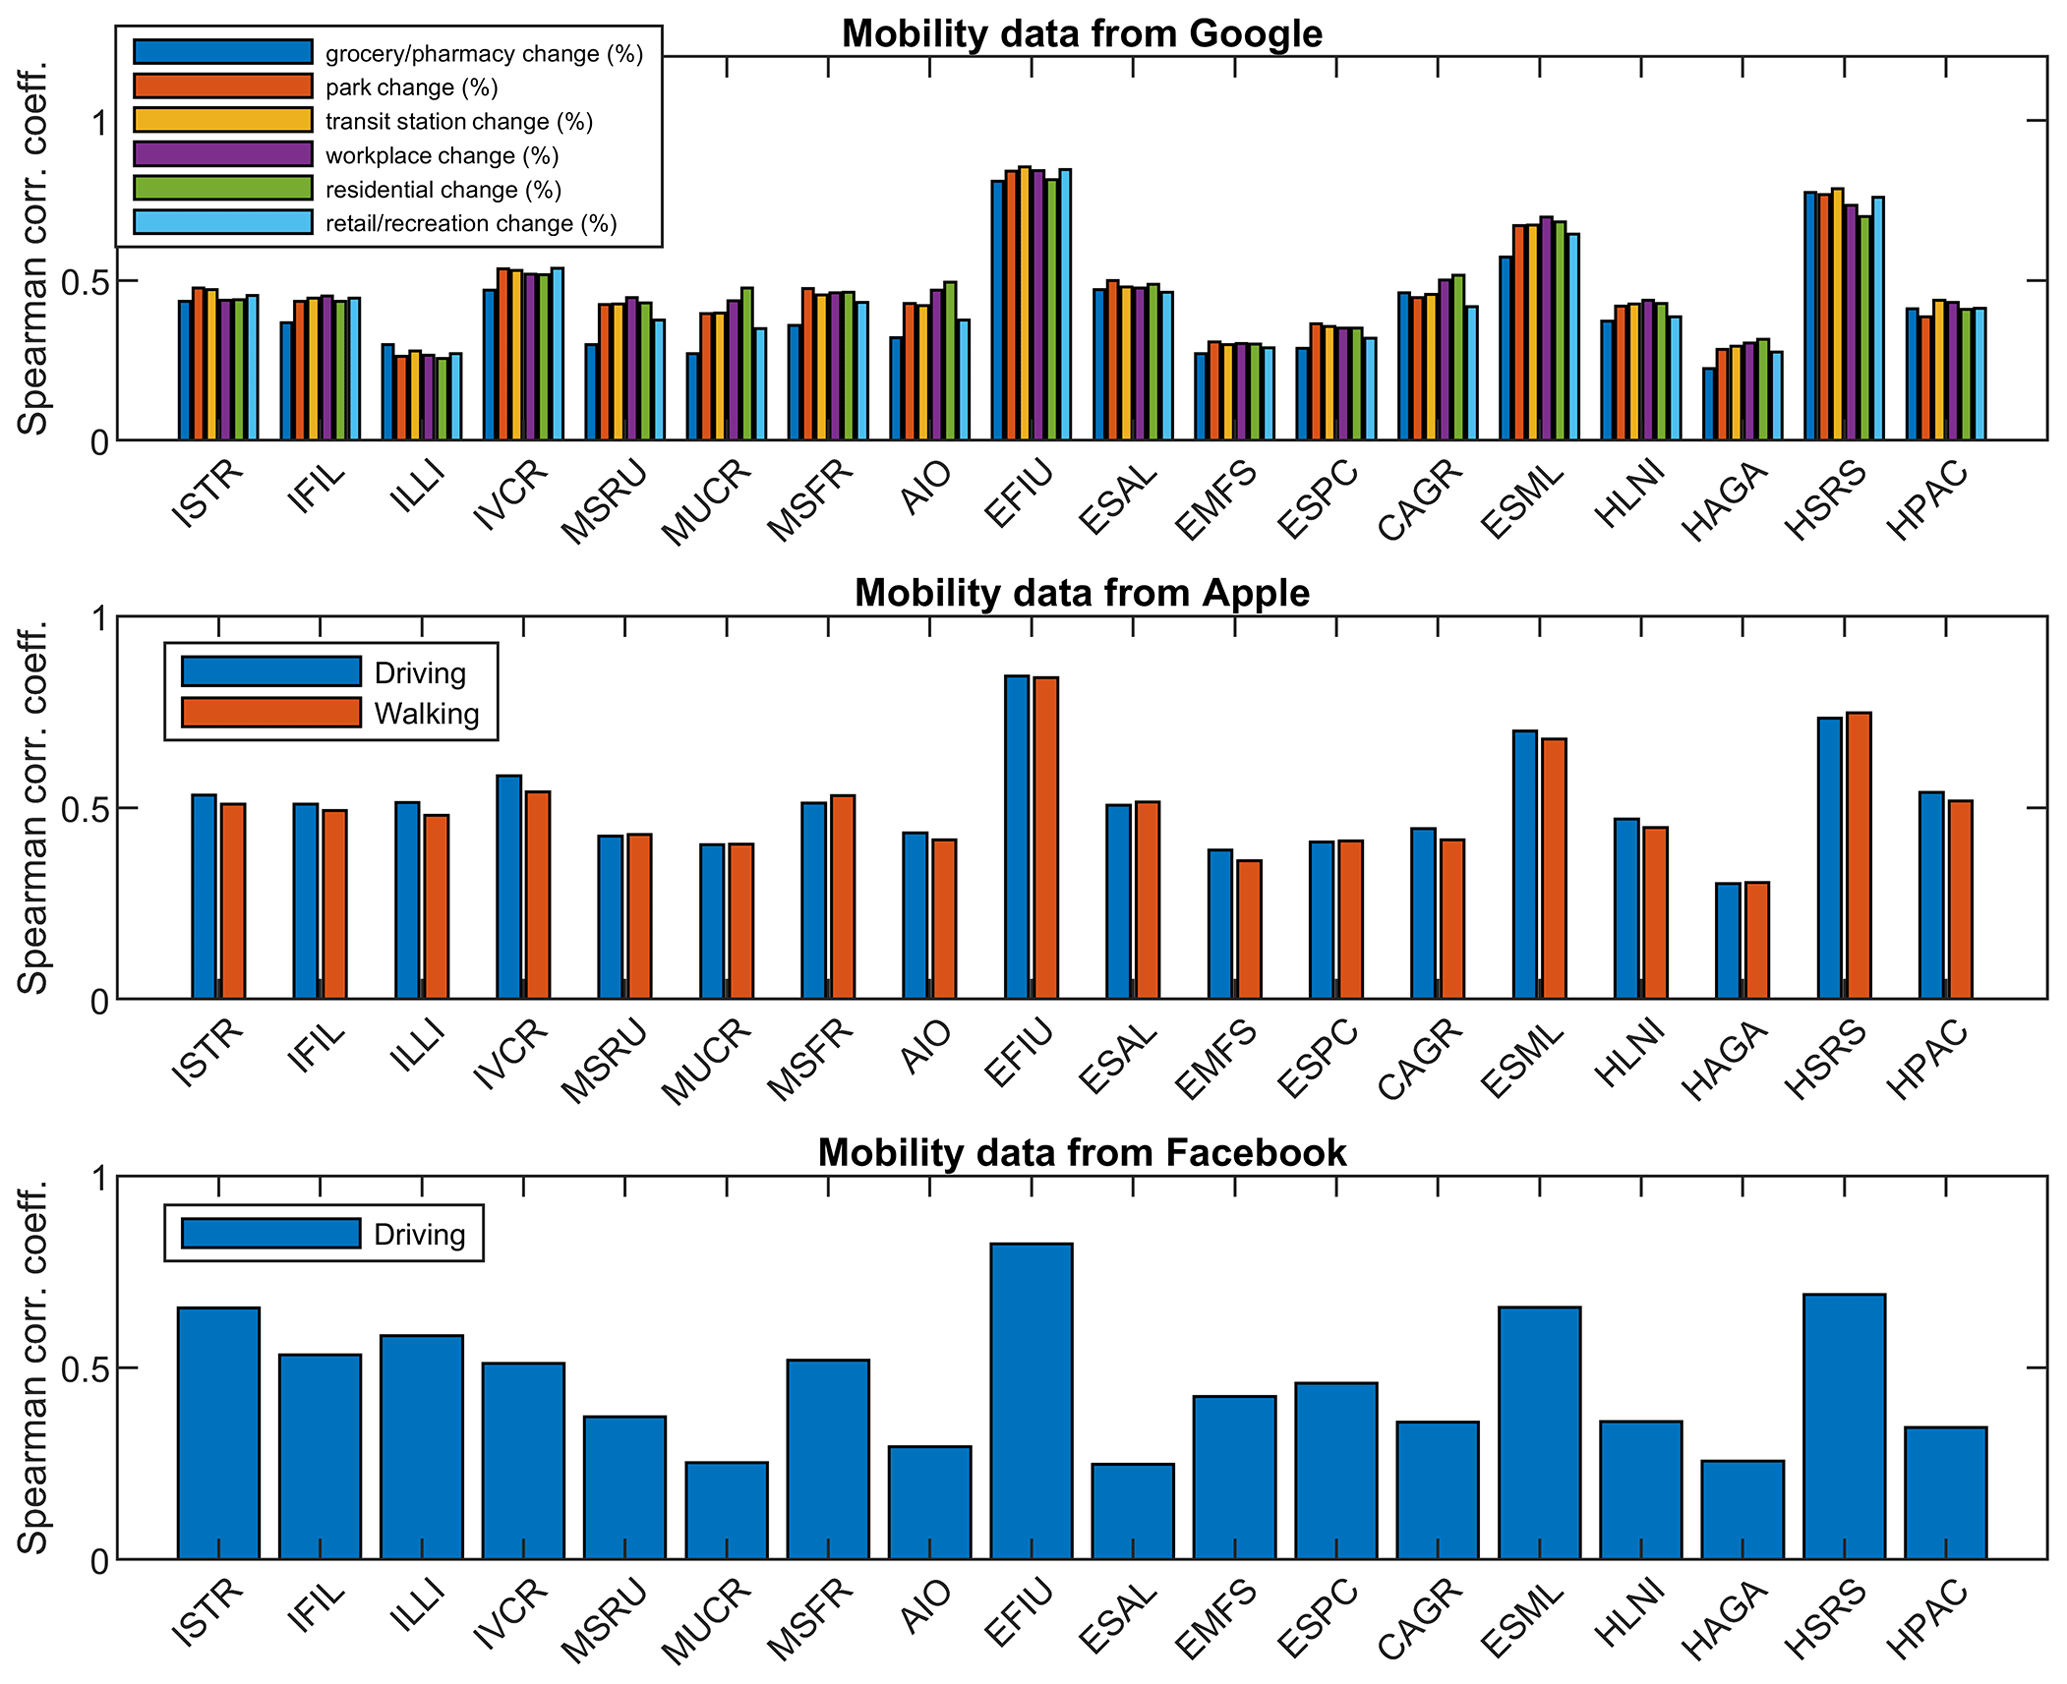
Figure 10Spearman correlation coefficient calculated between seismic rms amplitude at the different stations in the band 10–40 Hz and the mobility parameters, as provided by Google, Apple and Facebook. The Spearman correlation coefficient obtained for the residential change (see top plot) was multiplied by −1 to make it positive.
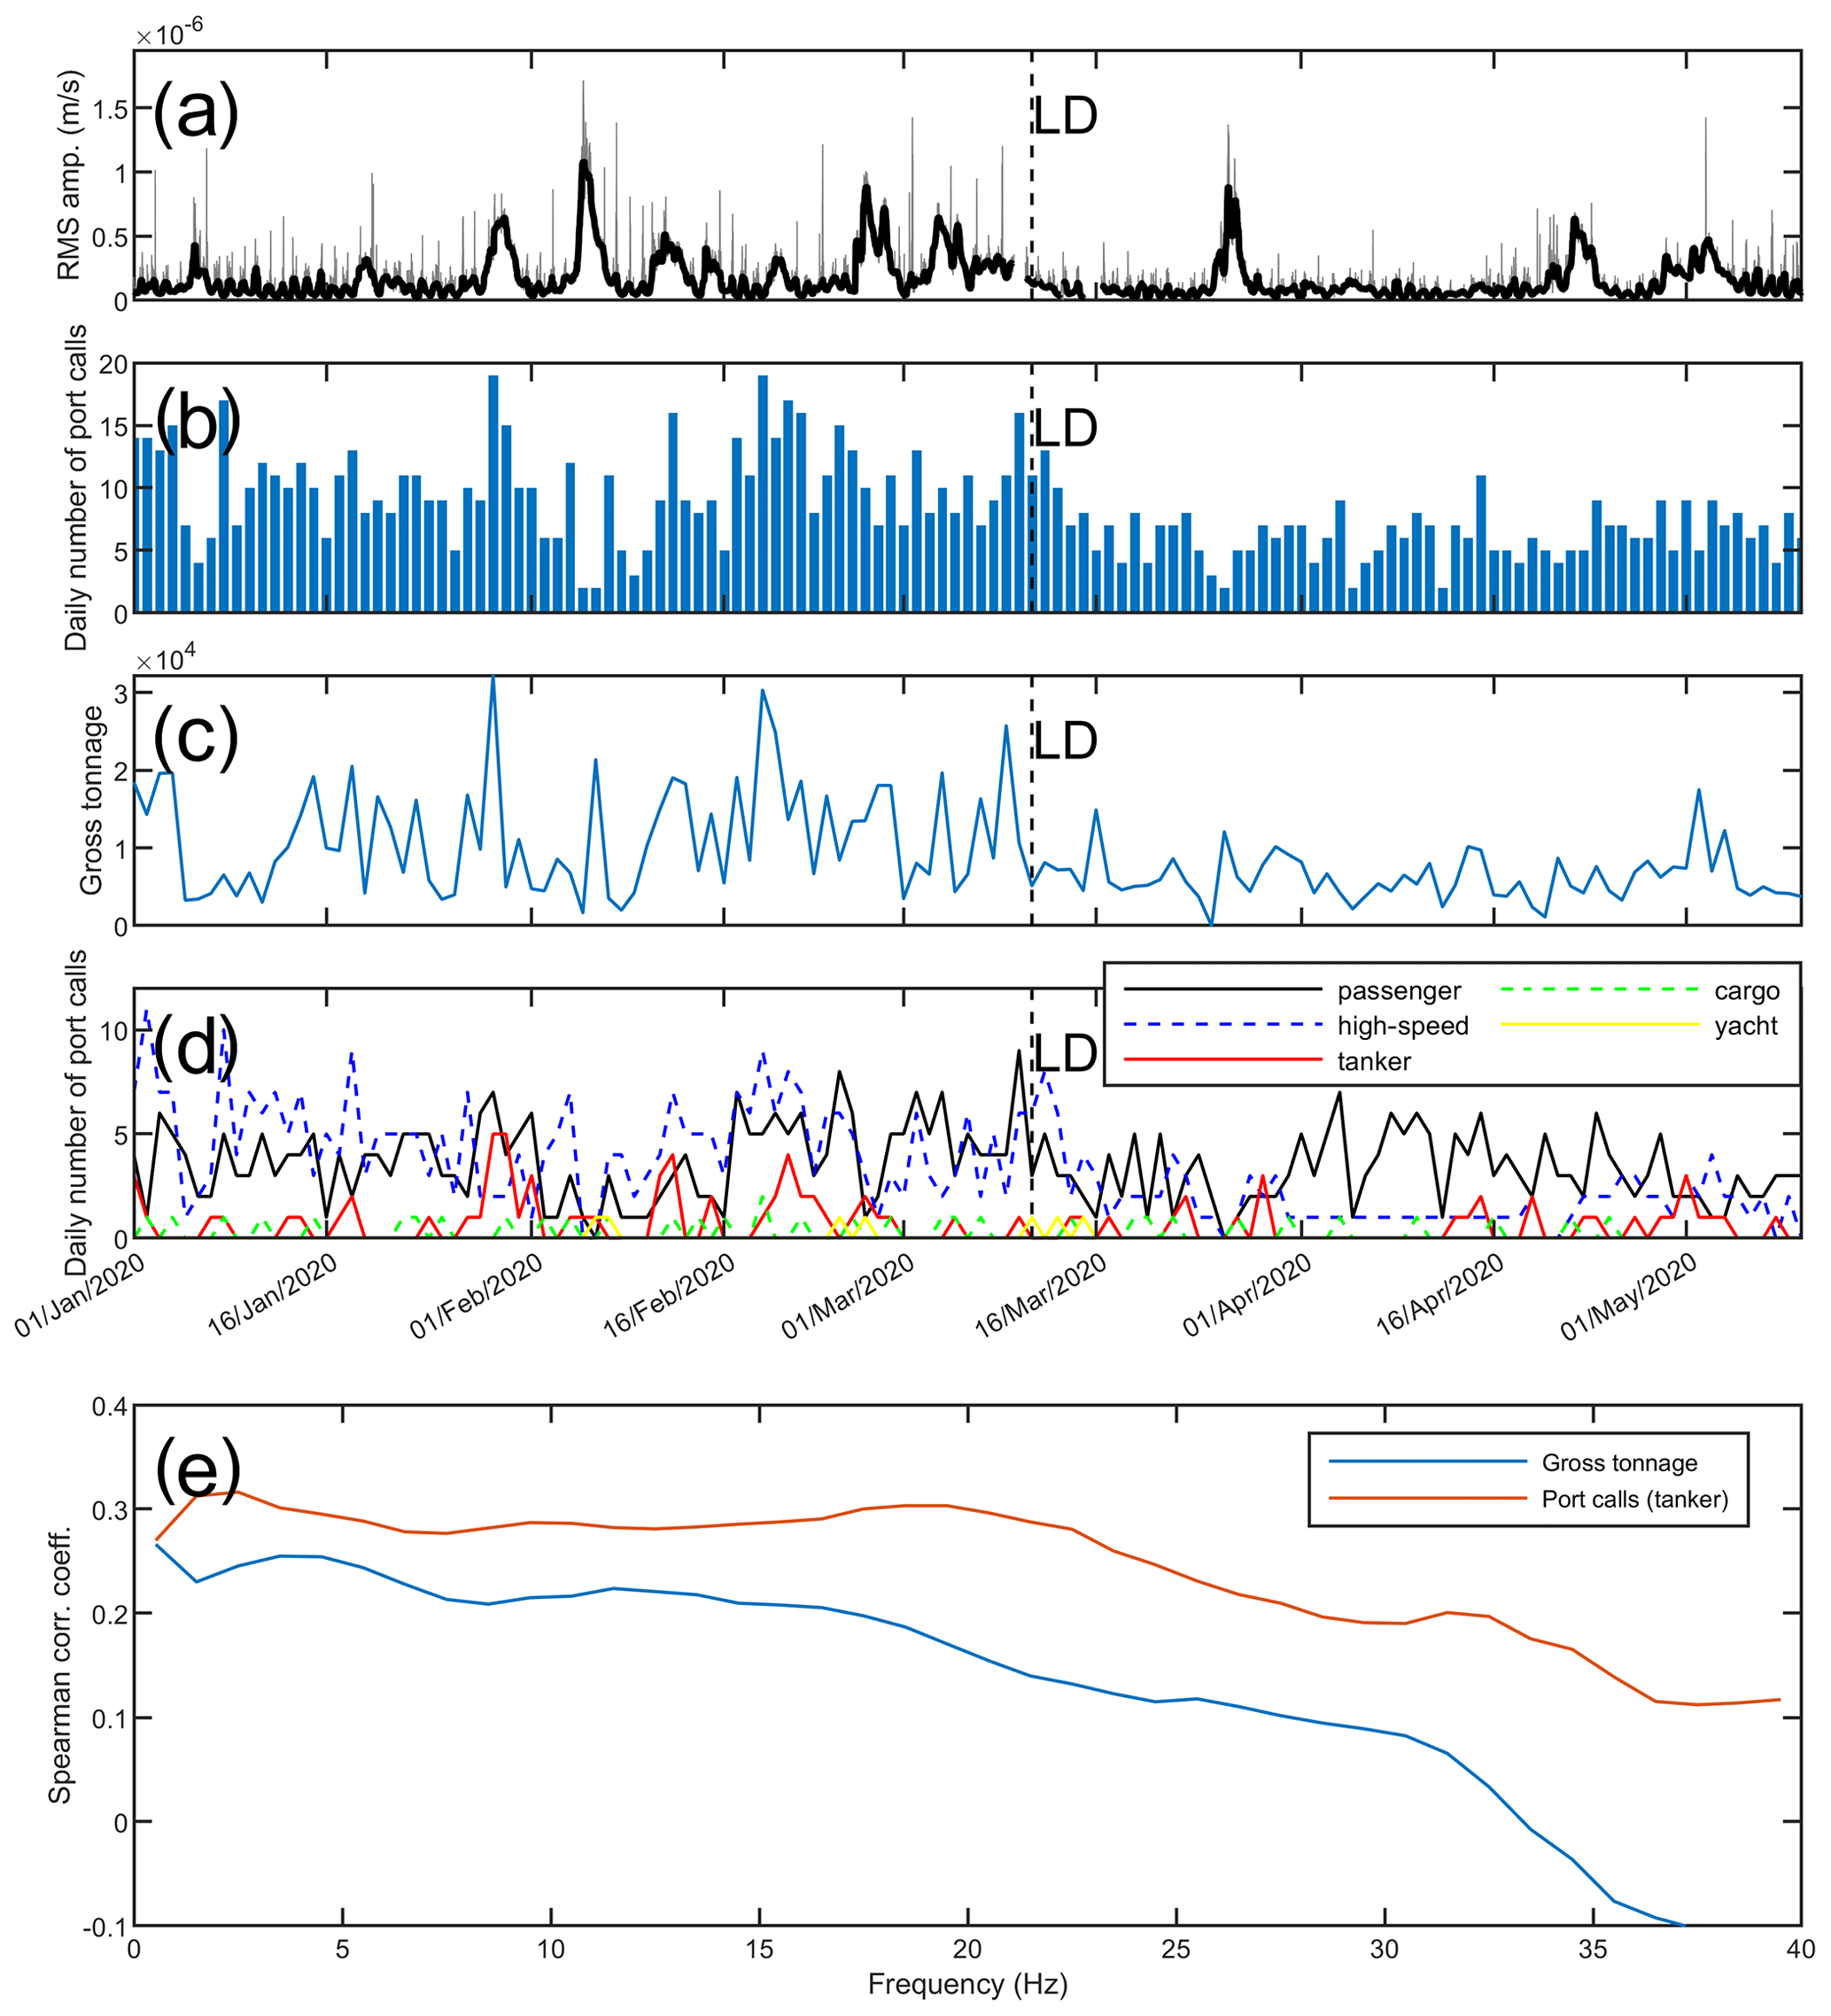
Figure 11(a) Rms amplitude time series of the vertical component of the seismic signal, recorded by ILLI station and filtered in the band 10–40 Hz (grey line) and corresponding moving median computed on 1 d long sliding windows (thick black line). (b) Daily number of port calls in the Lipari port. (c) Daily overall gross tonnage in Lipari port. (d) Daily number of port calls in Lipari port, separated on the basis of the boat category. (e) Spearman correlation coefficient, calculated between seismic rms amplitude at ILLI and two ship traffic parameters (see the legend in the upper right corner), as a function of the frequency band of the seismic noise. The vertical dashed line and the label “LD” in (a)–(d) indicate the time when the national lockdown measures were implemented in Italy (11 March 2020).
The seismic data, collected by 18 stations located in eastern Sicily during 1 November 2019–23 May 2020, were analysed. The spectrograms show a wide variety of spectral features and their variability over time (Fig. 2). Some stations show broad spectra with significant amplitude up to 30–40 Hz (such as ISTR and IVCR) and others narrower spectra with almost no energy above 10 Hz (such as MSFR and ESPC). In addition, very stable spectral peaks are evident in some stations (such as IVCR, ESAL and HAGA) probably due to continuously active seismic noise sources. More interestingly, a general reduction in the amplitude of seismic noise at all the stations, even at the ones located in remote areas such as Mt Etna's flanks and the Aeolian Islands, is observed following the enforcement of lockdown measures (on 11 March 2020; Figs. 2–5). However, the amount of reduction, as well as the pattern of the investigated seismic rms amplitude time series, varies significantly as a function of the station considered. For instance, the stations located close to towns and infrastructures, such as busy roads, highways, industrial plants and agricultural areas (EFIU, ESML, HSRS, HPAC; Table 1), show the typical temporal pattern of the anthropogenic seismic noise with minima during the weekends and the night-time and maxima during the weekdays and the daytime (Fig. A4; Lecocq et al., 2020; Xiao et al., 2020). Focusing on the frequency band 10–40 Hz, the amplitude noise reduction due to the lockdown measures reaches ∼ 50 % at EFIU station (Fig. 5), which also shows a slight amplitude decrease (∼ 10 %) during the Christmas–New Year holidays. This station is close to towns and to a busy highway called A18 (Fig. A1 and Table 1). Other stations show less regular patterns with clear peaks interspersed throughout the time series, whose origin depends also in this case on the station considered. In the stations located in the Aeolian Islands (ISTR, ILLI, IVCR, IFIL), the peaks are closely related to the ships rather than to road traffic or industrial activities (Figs. A1 and A5, Table 1). The amplitude and rate of occurrence of those peaks also clearly decreased right after the implementation of the lockdown measures. Indeed, after March 2020 marine traffic was affected by a dramatic decrease at the global scale, which was particularly marked in the Mediterranean Sea (March et al., 2020; Fig. 11b–d). Overall, the reduction in seismic noise in the band 10–40 Hz in the Aeolian Islands ranges between ∼ 40 %–50 % (Fig. 5). At stations EMFS and ESPC, located on the flanks of Mt Etna, the anthropogenic seismic noise is mostly related to tourist excursions, as both stations are located close to country roads used to bring tourists to the top of the volcano (Fig. A1 and Table 1). These excursions were suspended on 9 March following the COVID-19 outbreak, leading to a decrease in the seismic noise in the band 10–40 Hz of 30 % and 60 % for ESPC and EMFS, respectively (Fig. 5). Some notable increases in seismic amplitudes, visible at more than one stations at the same time, are not caused by human activities but rather are due to bad weather conditions. For instance, the amplitude increase on 25–26 March, visible at almost all the stations (Figs. 2 and 3), was associated with bad weather conditions, which affected the whole of southern Italy. The amplitude of the anthropogenic seismic noise interestingly increased again at the end of April (Figs. 3 and 4), a few days before the introduction of the first presidential decree, slightly lifting the lockdown measures (4 May 2020), and many days before the subsequent presidential decree lifting those measures for many economic activities (18 May 2020).
As for the frequency content analysis, the spectral ratios show that the band characterized by anthropogenic seismic noise is strongly station-dependent (Figs. 6 and 7). Indeed, the frequency with the maximum ratio value, coinciding with the frequency most affected by the anthropogenic noise, ranges from a few Hertz (i.e. MSFR) to 20 Hz or even more (i.e. EFIU, ESML). Moreover, the maximum ratio value, which indicates the amount of anthropogenic noise affecting the station, shows a fairly wide variability, from 1.5 (i.e. ESPC, HPAC) to 6 (EMFS). It is also noteworthy that some stations show a ratio lower than 1 at low frequencies (<5 Hz), indicating that the seismic amplitude was higher during the lockdown than before. The stations on or around Mt Etna (ESPC, ESAL, EFIU, AIO, EMFS, ESML) and the station on Stromboli (ISTR) exhibit this behaviour due to the increase in volcanic tremor amplitude in both volcanoes during the second analysed time window (11 March–1 April) with respect to the first one (1–20 February). Indeed, the Mt Etna and Stromboli volcanoes are characterized by continuous volcanic tremor, with energy mainly radiating in the band ∼ 0.5–5.5 Hz (e.g. Cannata et al., 2010; Falsaperla et al., 1998). In addition, the variability of the spectral ratio values below 1 Hz is not related to temporal changes in anthropogenic noise but rather to the variations in the amplitude of microseism, the most continuous and ubiquitous seismic signal on Earth, generated by ocean wave energy coupled with the Earth's ground (e.g. Longuet-Higgins, 1950; Hasselmann, 1963; Ardhuin et al., 2015). Finally, the spectral ratio derived from stacking the spectral ratio plots of all the considered stations clearly shows that the frequency band most affected by the anthropogenic seismic noise (that is, the one showing the highest ratio values) is above 10 Hz (Fig. 8).
Concerning the comparison between the time series of seismic noise and human mobility, these are positively correlated, suggesting that seismic noise amplitude increases with increasing human mobility, with the exception of the residential visit changes provided by Google (Fig. A2). Indeed, this category quantifies the change in duration of time spent at places of residence, which, unlike the other categories, increased during the lockdown period. We obtained a wide range of Spearman correlation coefficients, whose absolute values range from 0.25 to more than 0.85 according to the considered station and mobility parameter (Fig. 10). In particular, stations EFIU, ESML and HSRS, displaying the typical temporal pattern of the anthropogenic seismic noise with minima during the weekends and maxima during the weekdays, showed the highest correlation coefficients. The similarity between seismic noise and human mobility patterns is remarkably high at station EFIU characterized by correlation coefficients higher than 0.8 (Figs. 9a and A2). For other stations (e.g. EMFS, HAGA, MUCR), the correlation is not as clear. However, even if the correlation between seismic noise and human mobility is strongly station-dependent, p values lower than 0.05 were obtained in all the comparisons (Fig. A3), suggesting how the obtained Spearman correlation coefficients are significantly different from zero. This confirms that seismic data from all the considered stations contain plenty of information about human mobility. The seismic noise frequencies better correlated with human mobility data turned out to be above 10 Hz (maximum values are reached in the band 11–18 Hz; Fig. 9b). This result, in line with the information obtained by computing the ratios between the seismic spectra before and during the lockdown (Fig. 8), shows how the seismic frequency band most affected by human activities is above 10 Hz. As for the comparison between the time series of seismic noise at ILLI station in the band 10–40 Hz and ship traffic data of Lipari port, only daily overall gross tonnage and the daily number of port calls of tanker showed p values lower than 0.05 (with Spearman correlation coefficients equal to 0.18 and 0.25, respectively). In this case, the seismic noise frequencies better correlated with ship traffic data were below ∼ 25 Hz. This analysis, focused on ship traffic data, highlights how particular types of boats (likely the ones with higher gross tonnage, among which are the tankers) are mainly responsible for the seismic noise generation recorded close to ports. In addition, the frequency band most affected by such seismic noise seems to be different (in particular lower) from the band most influenced by other human activities (see Figs. 9b and 11e).
Since the general reduction in the amplitude of seismic noise at all the stations in mid-March took place at the end of the winter and the beginning of the spring and when the meteorological conditions improved, such a decrease could also be interpreted as being due to weather changes. Indeed, wind generates a broadband seismic noise with frequencies from ∼ 0.5 Hz up to ∼ 60 Hz (e.g. Bormann and Wielandt, 2013). However, we exclude such a possibility on the basis of (i) the increase in seismic noise amplitude, observed again at the end of April, and (ii) the correlation analysis results, which confirm how the amplitude reduction in mid-March is related to the decrease in human mobility.
The amplitude reduction in the anthropogenic seismic noise, due to the lockdown measures restricting the mobility of citizens during the COVID-19 pandemic, provides an opportunity to investigate in detail the characteristics of such an anthropogenic signal in eastern Sicily.
We emphasize how the seismic amplitude decrease is visible even at stations located in remote areas, such as the Mt Etna volcano and the Aeolian Islands. The amount of the amplitude reduction, its temporal pattern and spectral content proved to be strongly station-dependent. As for the first point, we found decreases of 30 %–60 % in most of the considered stations, located close to towns and busy highway, as well as on the flanks of Mt Etna where country roads are used to bring tourists to the top of the volcano or in the Aeolian Islands, due to ship traffic reduction. Regarding the temporal patterns of seismic noise amplitude, the stations installed close to towns or infrastructures (like busy roads and highways) showed the typical pattern of the anthropogenic seismic noise with minima during the weekends and the night-time and maxima during the weekdays and the daytime. Other stations show less regular patterns with clear peaks interspersed throughout the time series. Concerning the spectral content, the frequency band most affected by anthropogenic seismic noise ranges from a few Hertz to more than 20 Hz, depending on the station. On average, the frequencies above 10 Hz are the most influenced by anthropogenic seismic noise.
We found that human mobility influenced the seismic noise mostly in frequencies above 10 Hz with remarkably high correlations between them observed at some stations. Furthermore, the comparison between seismic noise data acquired at ILLI station (located in Lipari, Aeolian Islands) and ship traffic data from Lipari port highlighted a significant correlation, especially in the case of ships with high gross tonnage. These results further confirm how seismic data, routinely acquired worldwide mainly for earthquake and volcanic surveillance, can also be used to monitor human mobility, especially during emergency periods such as the COVID-19 pandemic. As highlighted by Lindsey et al. (2020), seismic data also present advantages over mobile-phone-derived information as they are anonymous in nature and not affected by biases due to data sampling according to socio-economic class, age and region.
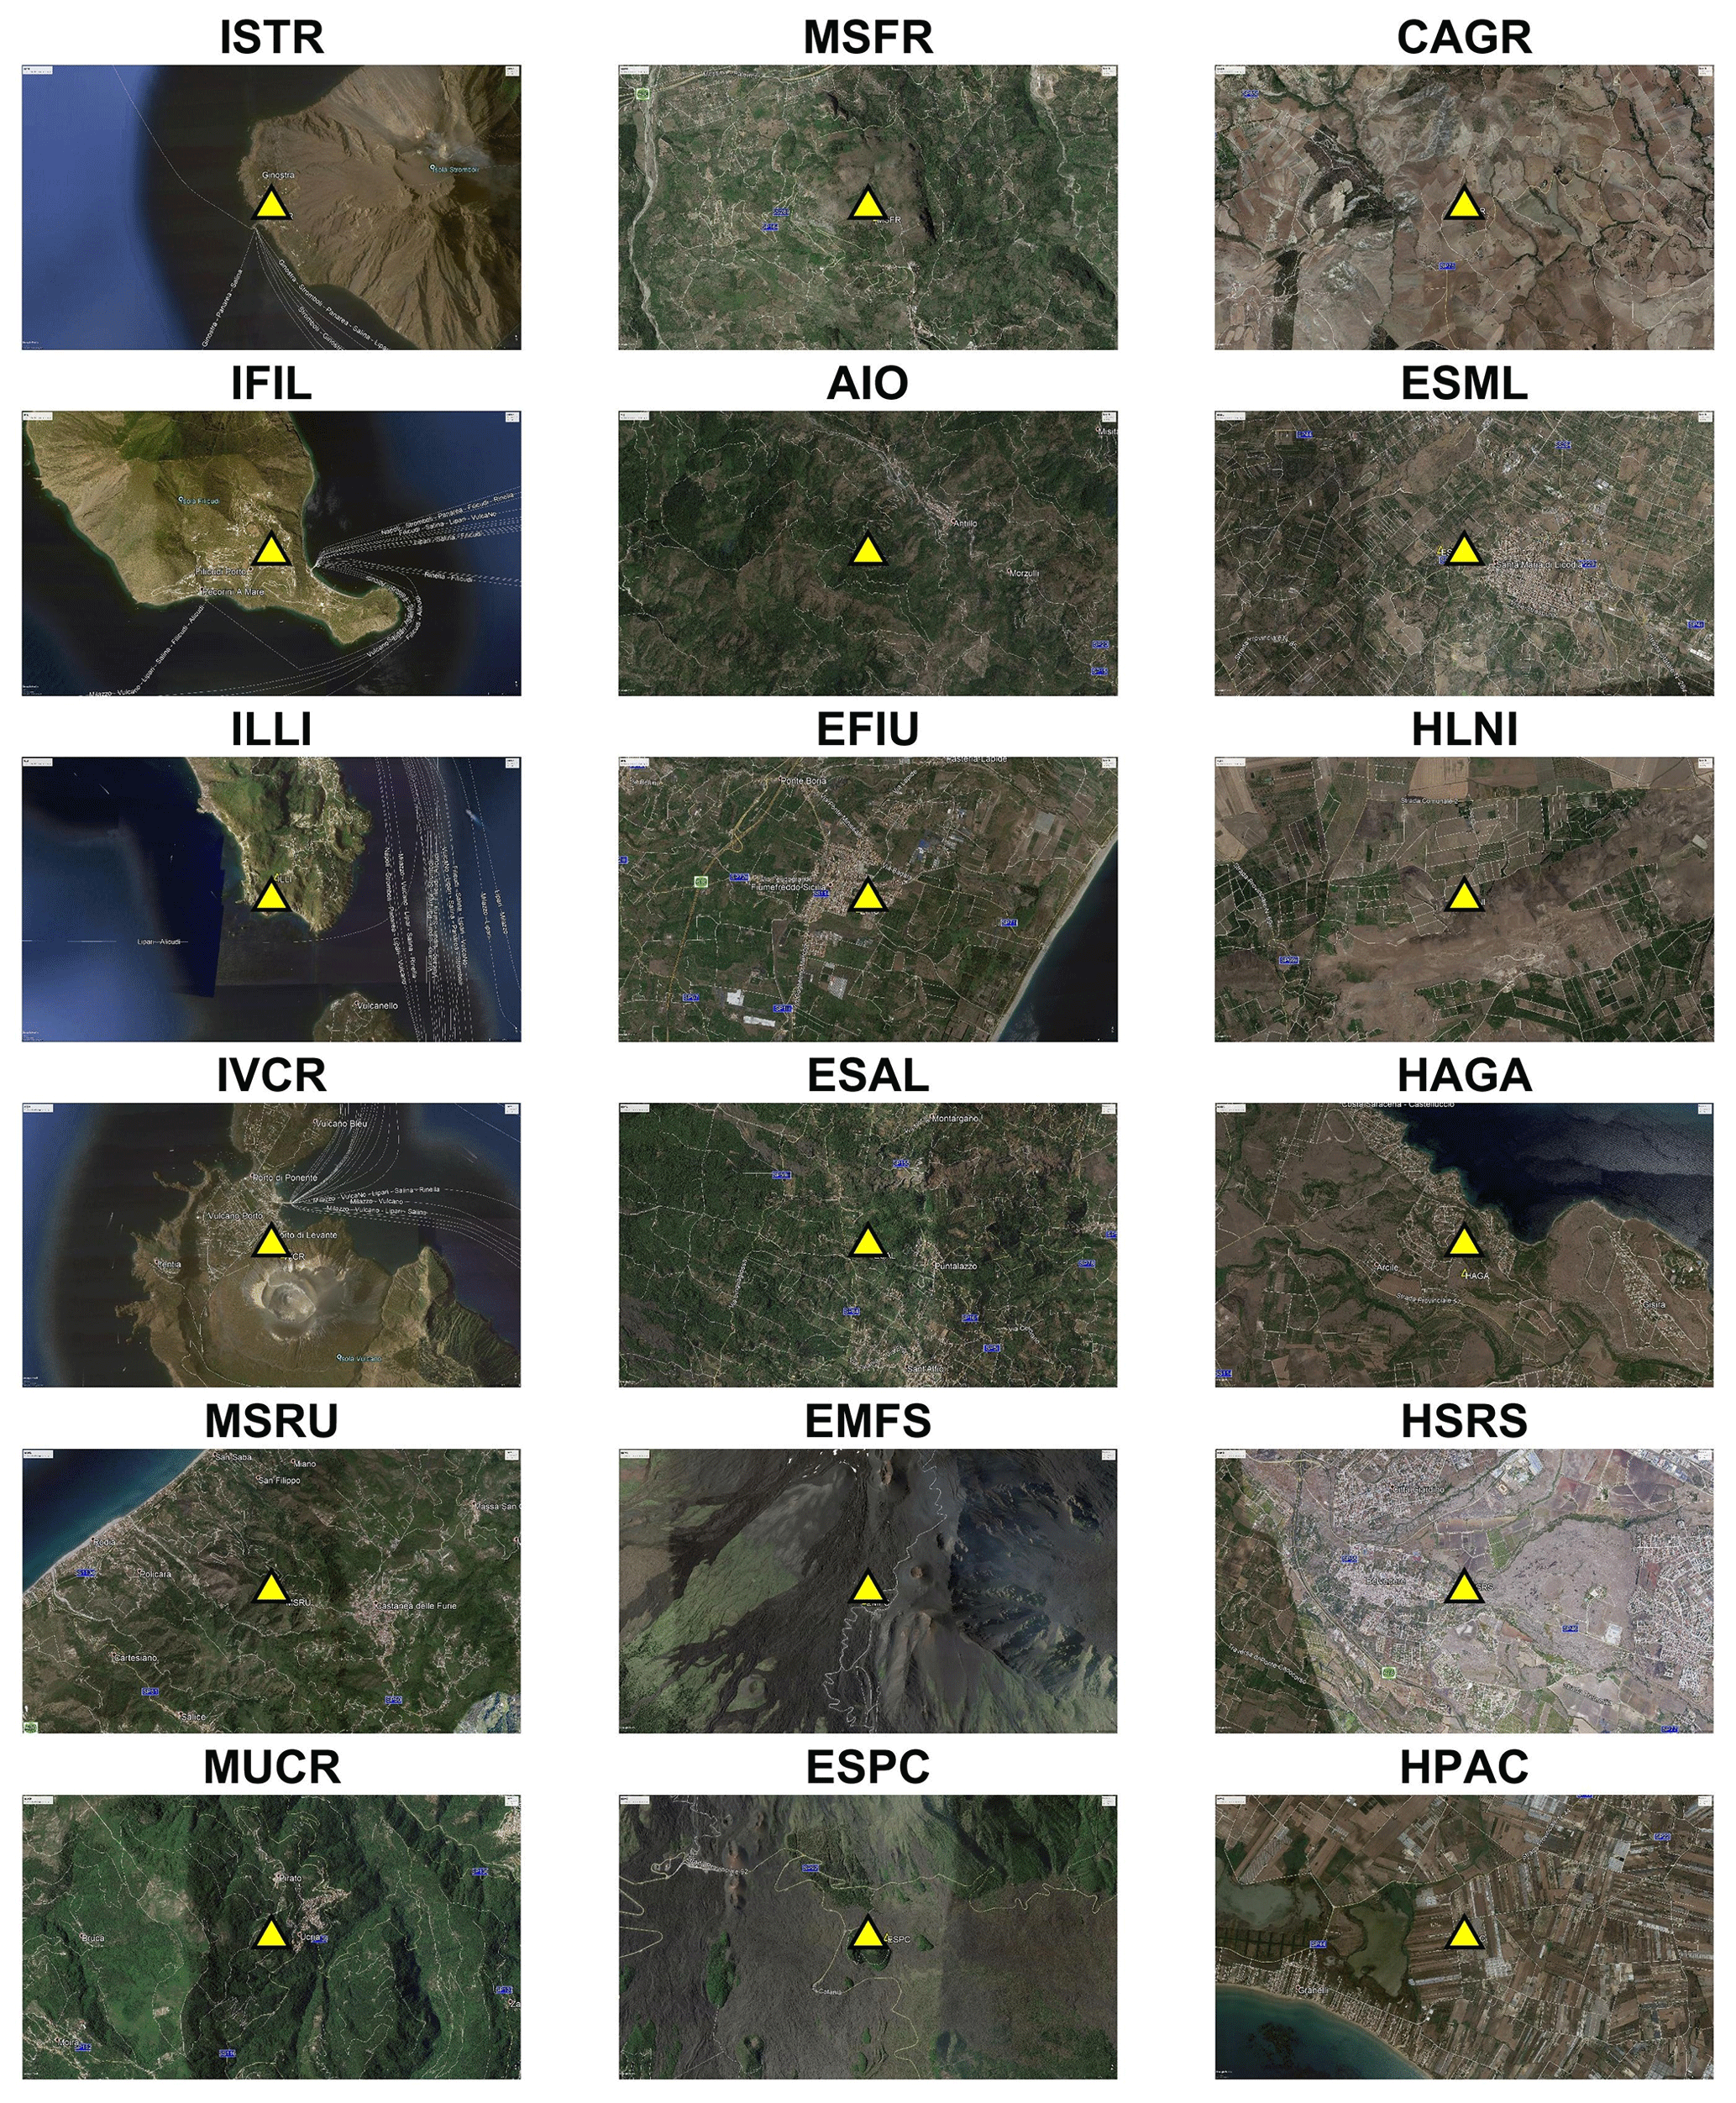
Figure A1Photos from © Google Earth of the installation site areas of the seismic stations (yellow triangles) used in this work. The width of the area shown in each picture is ∼ 5 km. The stations are sorted by decreasing latitude from upper left to bottom right.
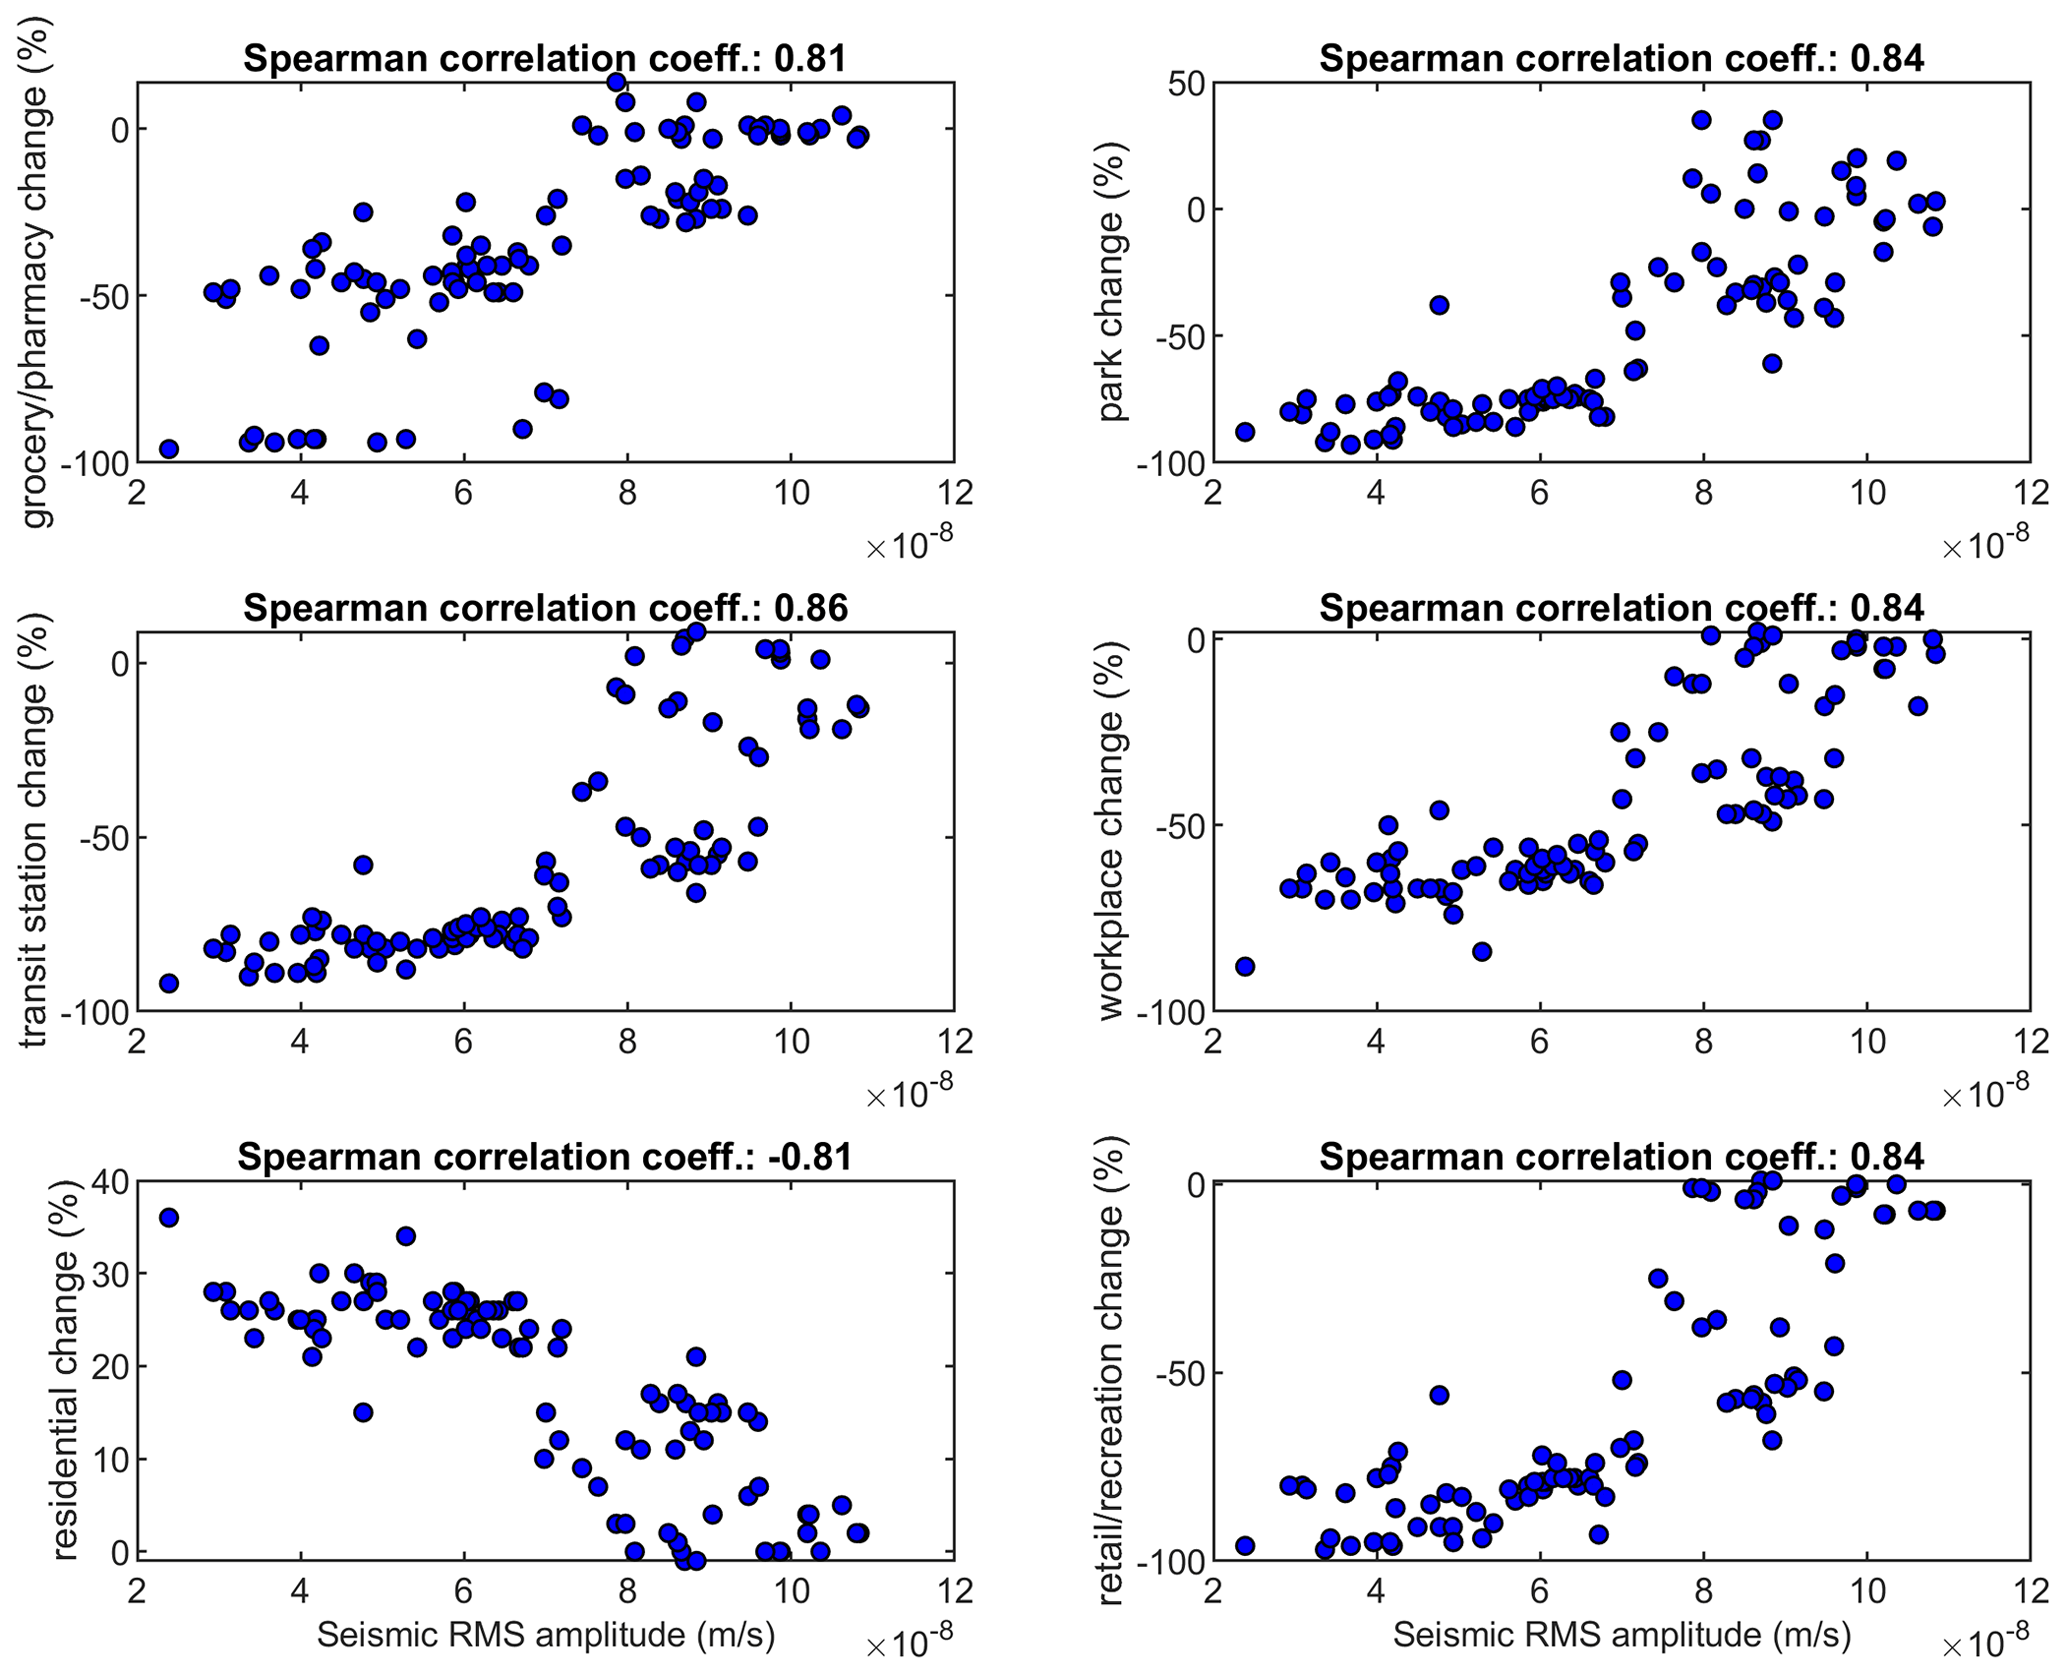
Figure A2Cross plots showing the seismic rms amplitude of EFIU station in the band 10–40 Hz in the x axis and the different categories of human mobility from Google in the y axis from 15 February to 20 May 2020. The values of the Spearman correlation coefficient, computed between the time series plotted in the graph, are shown in the title.
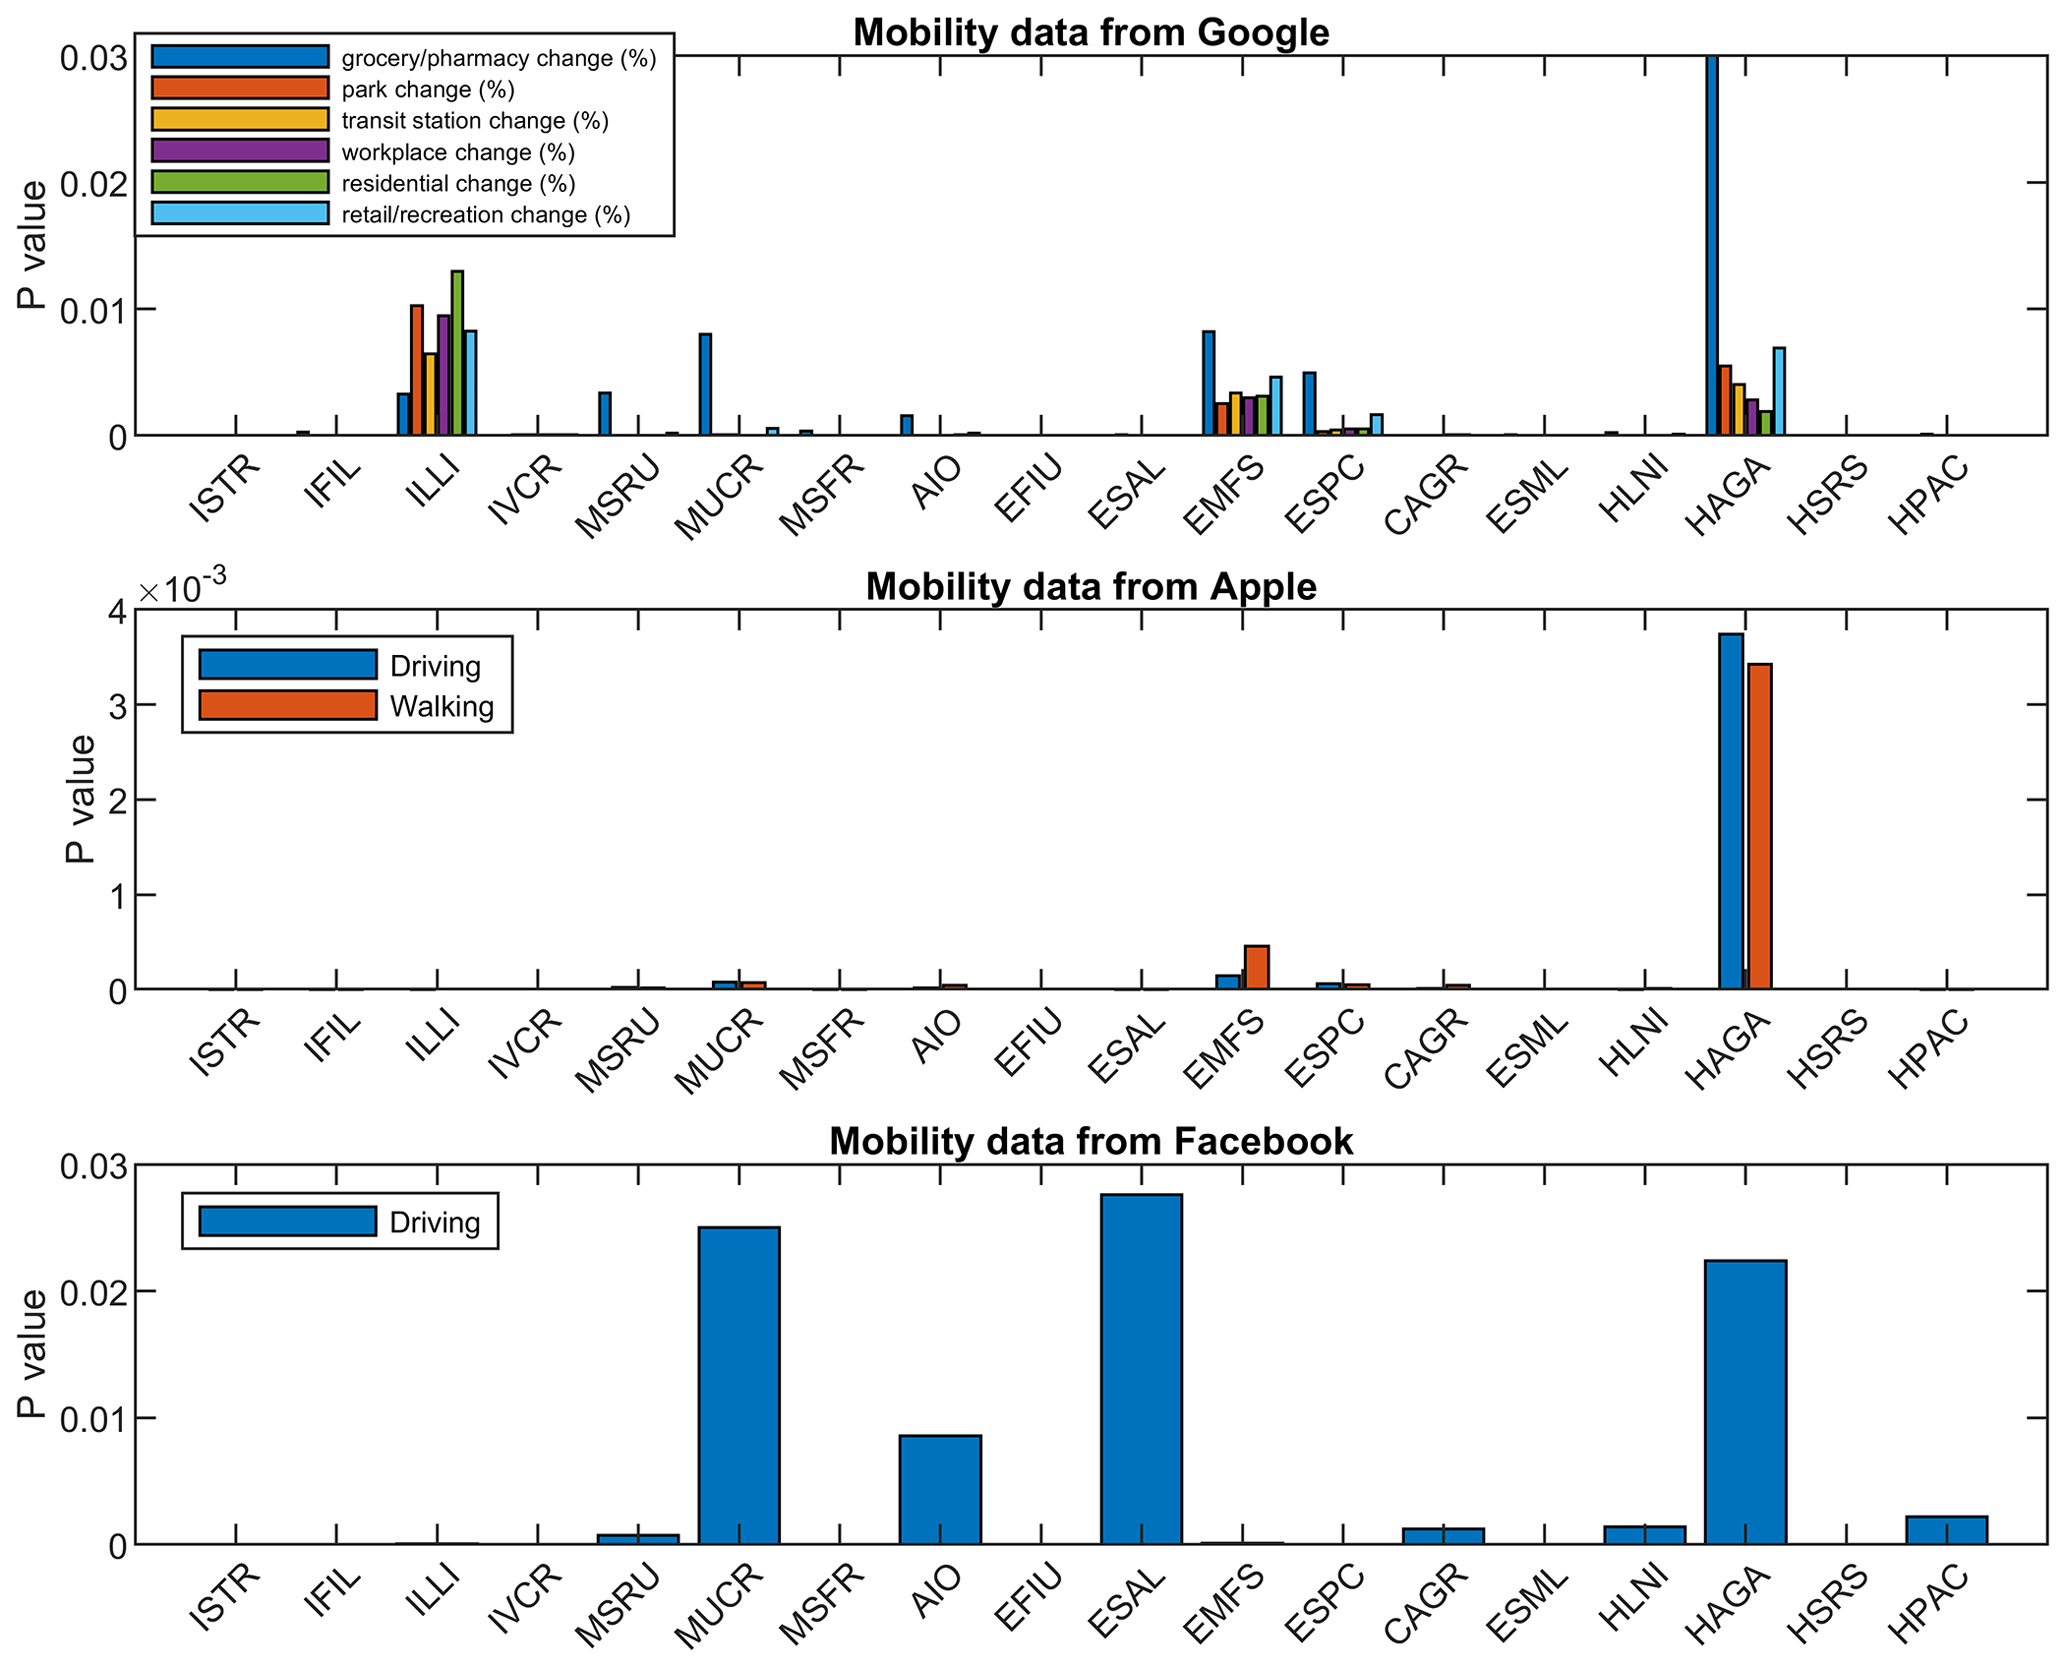
Figure A3Probability values (p values), obtained by the Spearman correlation analysis performed between seismic rms amplitude at the different stations and the human mobility parameters, as provided by Google, Apple and Facebook.
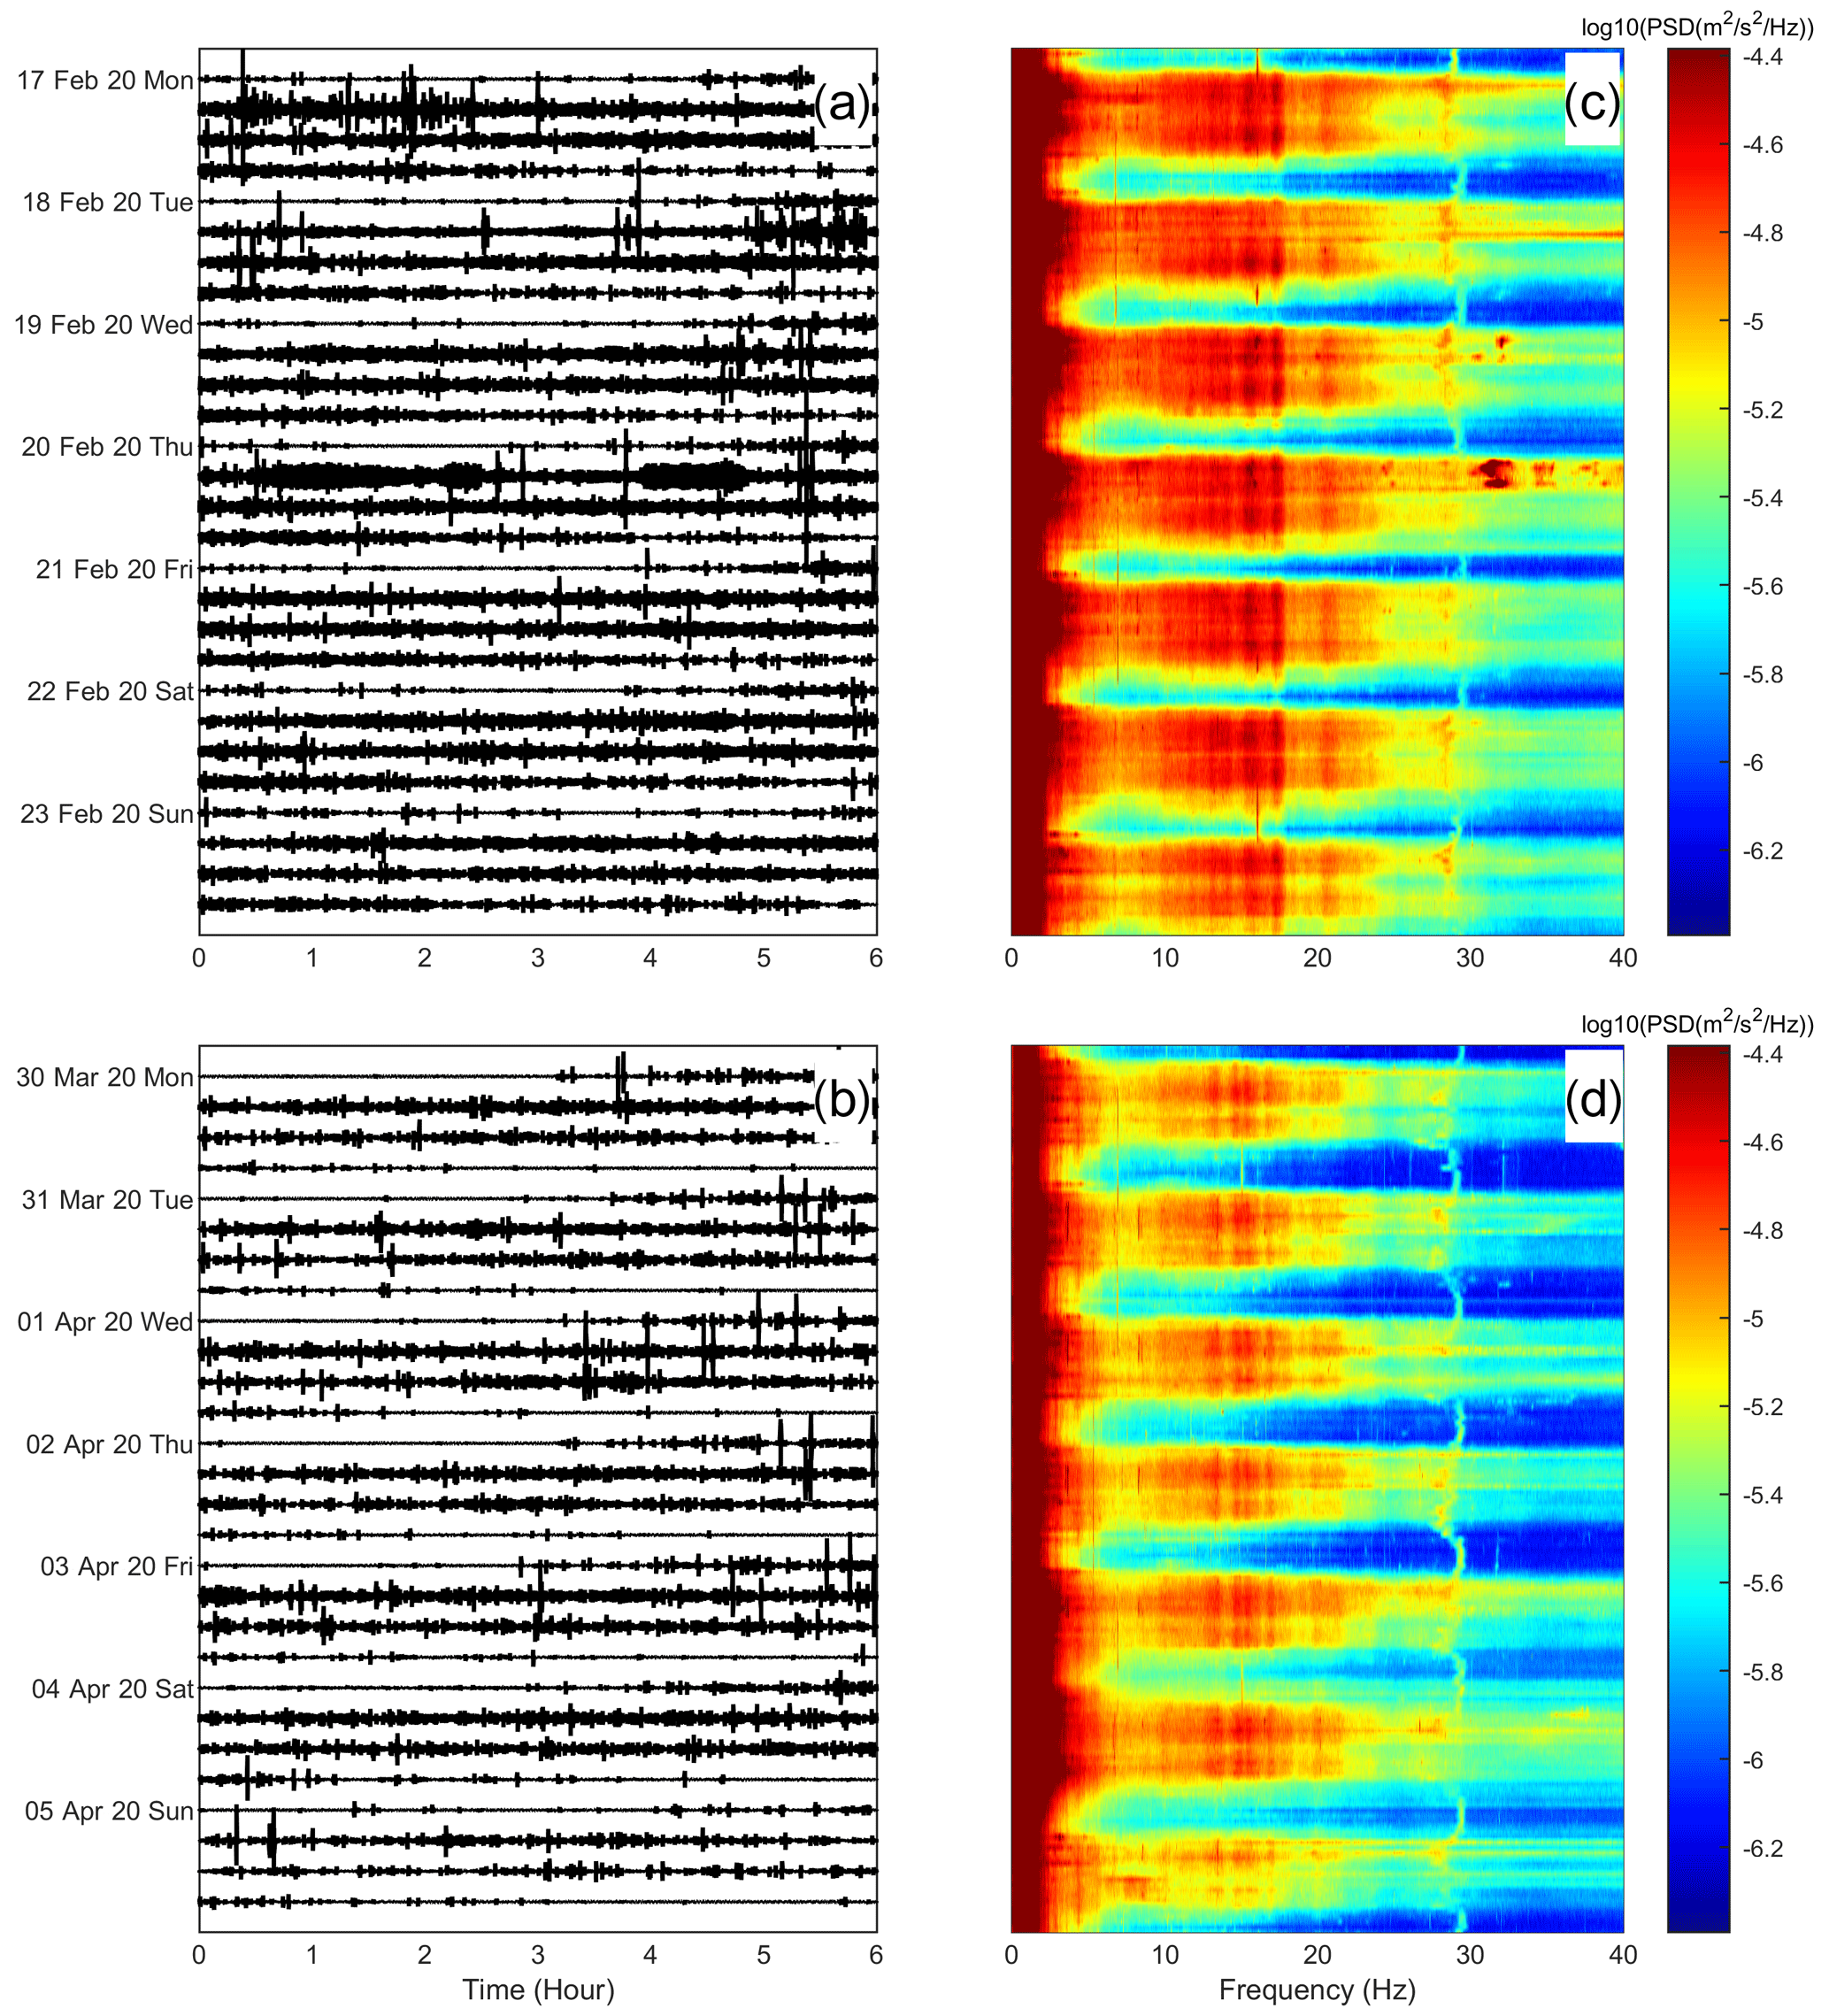
Figure A4(a) Seismogram showing the seismic signal recorded by the vertical component of the station EFIU and filtered in the band 10–40 Hz during the week 17–23 February 2020 and (c) the corresponding spectrogram of the non-filtered signal. (b) Seismogram showing the seismic signal recorded by the vertical component of the station EFIU and filtered in the band 10–40 Hz during the week 30 March–5 April 2020 and (d) the corresponding spectrogram of the non-filtered signal.
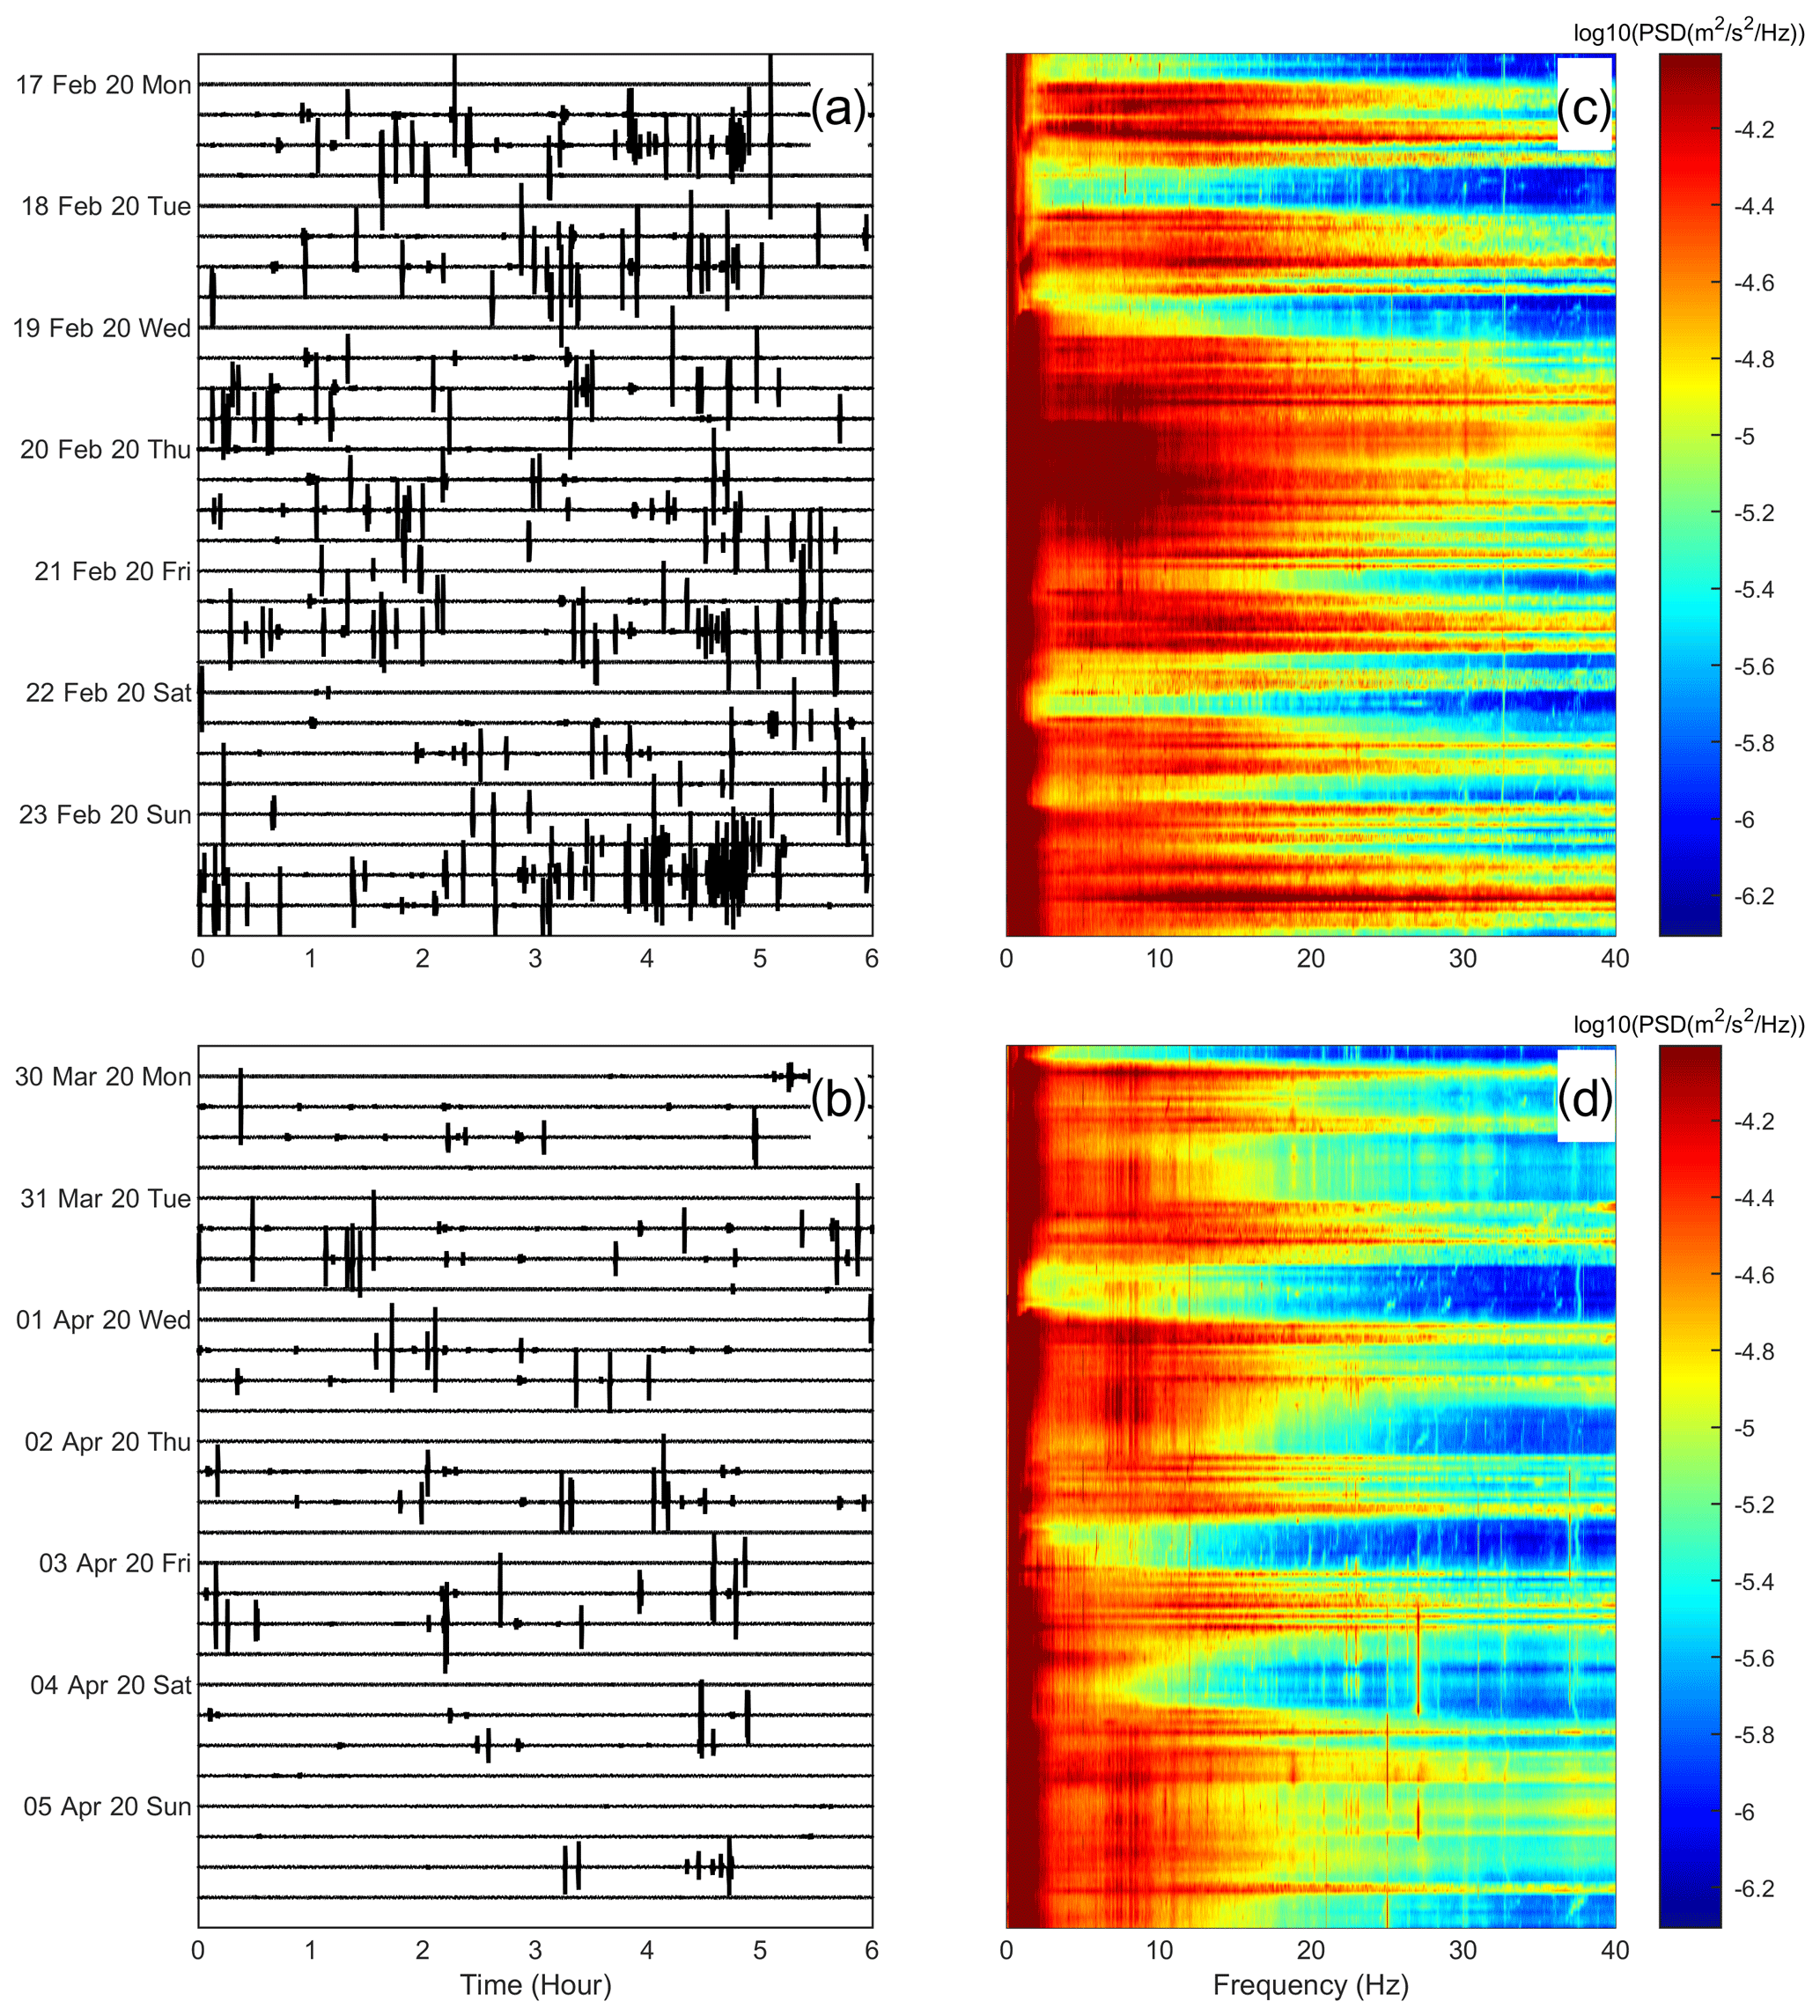
Figure A5(a) Seismogram showing the seismic signal recorded by the vertical component of the station ILLI and filtered in the band 10–40 Hz during the week 17–23 February 2020 and (c) the corresponding spectrogram of the non-filtered signal. (b) Seismogram showing the seismic signal recorded by the vertical component of the station ILLI and filtered in the band 10–40 Hz during the week 30 March–5 April 2020 and (d) the corresponding spectrogram of the non-filtered signal.
The data that support the findings of this study are available on request from the corresponding author.
AC, FC and TL designed the study. All the authors analysed the seismic data. AC, FC, RSMDP and GDG wrote the paper. All the authors interpreted the results and revised the article.
The authors declare that they have no conflict of interest.
This article is part of the special issue “Social seismology – the effect of COVID-19 lockdown measures on seismology”. It is not associated with a conference.
We are indebted to the technicians of the INGV-OE for enabling the acquisition of seismic data. We also sincerely acknowledge all the essential workers who, placing themselves at risk, are taking care of the sick, assisting the communities and serving in any way during this COVID-19 pandemic. Figure 1 was drawn by the readhgt.m Matlab® function (© 2020, François 20 Beauducel; https://it.mathworks.com/matlabcentral/fileexchange/36379-readhgt-import-download-nasa-srtm-data-files-hgt, last access: 26 January 2021) and shows topography data provided by NASA Shuttle Radar Topography Mission (SRTM). We would like to thank Stephen Hicks, Kasper van Wijk and an anonymous reviewer for their great help to improve this paper. Ship traffic data from Lipari port was provided by FleetMon, JAKOTA Cruise Systems GmbH, Rostock, Germany (data provided on 10 October 2020).
This research has been supported by the Università degli Studi di Catania (Italy): grant CHANCE, II Edition, 2020-22 programme (principal investigator Andrea Cannata) and grant PIACERI, 2020-22 programme (PAROSSISMA project, code 22722132140; principal investigator Marco Viccaro).
This paper was edited by Tarje Nissen-Meyer and reviewed by Stephen Hicks, Kasper van Wijk, and one anonymous referee.
Anthony, R. E., Aster, R. C., and McGrath, D.: Links between atmosphere, ocean, and cryosphere from two decades of microseism observations on the Antarctic Peninsula, J. Geophys. Res.-Earth Surf., 122, 153–166, https://doi.org/10.1002/2016JF004098, 2017.
Apple: Mobility Trends Reports, available at: https://www.apple.com/covid19/mobility (last access: 05 June 2020), 2020.
Ardhuin, F., Gualtieri, L., and Stutzmann, E.: How ocean waves rock the Earth: Two mechanisms explain microseisms with periods 3 to 300 s, Geophys. Res. Lett., 42, 765–772, https://doi.org/10.1002/2014GL062782, 2015.
Beauducel, F.: READHGT: Import/download NASA SRTM data files (HGT), MATLAB Central File Exchange, available at: https://www.mathworks.com/matlabcentral/fileexchange/36379-readhgt-import-download-nasa-srtm-data-files-hgt (last access: 26 January 2021), 2020.
Bormann, P. and Wielandt, E.: Seismic signals and noise, in: New Manual of Seismological Observatory Practice 2 (NMSOP2), 2nd edn., edited by: Bormann, P., GFZ, Potsdam, Germany, 1–62, 2013.
Cannata, A., Di Grazia, G., Montalto, P., Ferrari, F., Nunnari, G., Patanè, D., and Privitera, E.: New insights into banded tremor from the 2008–2009 Mount Etna eruption, J. Geophys. Res., 115, 1–22, 2010.
Cannata, A., Cannavò, F., Moschella, S., Gresta, S., and Spina, L.: Exploring the link between microseism and sea ice in Antarctica by using machine learning, Sci. Rep., 9, 13050, https://doi.org/10.1038/s41598-019-49586-z, 2019.
Cannata, F., Chiarito, M., Reimers, B., Azzolini, E., Ferrante, G., My, I., Viggiani, G., Panico, C., Regazzoli, D., Ciccarelli, M., Voza, A., Aghemo, A., Li, H., Wang, Y., Condorelli, G., and Stefanini, G. G.: Continuation versus discontinuation of ACE inhibitors or angiotensin II receptor blockers in COVID-19: effects on blood pressure control and mortality, Eur. Heart J., 6, 412–414, pvaa056, https://doi.org/10.1093/ehjcvp/pvaa056, 2020a.
Cannata, A., Cannavò, F., Moschella, S., Di Grazia, G., Nardone, G., Orasi, A., Picone, M., Ferla, M., and Gresta, S.: Unravelling the Relationship Between Microseisms and Spatial Distribution of Sea Wave Height by Statistical and Machine Learning Approaches, Remote Sens.-Basel, 12, 761, https://doi.org/10.3390/rs12050761, 2020b.
Chouet, B. A. and Matoza, R. S.: A multi-decadal view of seismic methods for detecting precursors of magma movement and eruption, J. Volcanol. Geotherm. Res., 252, 108–175, https://doi.org/10.1016/j.jvolgeores.2012.11.013, 2013.
Craig, D., Bean, C., Lokmer, I., and Mollhoff, M.: Correlation of Wavefield-Separated Ocean-Generated Microseisms with North Atlantic Source Regions, B. Seismol. Soc. Am., 106, 1002–1010, 2016.
Dias, F. L., Assumpção, M., Peixoto, P. S., Bianchi, M. B., Collaço, B., and Calhau, J.: Using Seismic Noise Levels to Monitor Social Isolation: An Example from Rio de Janeiro, Brazil, Geophys. Res. Lett., 47, e2020GL088748, https://doi.org/10.1029/2020GL088748, 2020.
Díaz, J., Ruiz, M., Sánchez-Pastor, P. S., and Romero, P.: Urban seismology: On the origin of earth vibrations within a city, Sci. Rep.-UK, 7, 1–11, 2017.
Facebook: COVID-19 Mobility Data Network, available at: https://data.humdata.org/dataset/movement-range-maps (last access: 5 June 2020), 2020.
Falsaperla, S., Langer, H., and Spampinato, S.: Statistical analyses and characteristics of volcanic tremor on Stromboli volcano (Italy), Bull. Volcanol., 60, 75–88, 1998.
Gatto, M., Bertuzzo, E., Mari, L., Miccoli, S., Carraro, L., Casagrandi, R., and Rinaldo, A.: Spread and dynamics of the COVID-19 epidemic in Italy: effects of emergency containment measures, P. Natl. Acad. Sci. USA, 117, 10484–10491, https://doi.org/10.1073/pnas.2004978117, 2020.
Google: COVID-19 Community Mobility Reports, available at: https://www.google.com/covid19/mobility/ (last access: 5 June 2020), 2020.
Graham, B. S.: Rapid COVID-19 vaccine development, Science, 368, 945–946, https://doi.org/10.1126/science.abb8923, 2020.
Hasselmann, K. A.: Statistical analysis of the generation of microseisms, Rev. Geophys., 1, 177–210, 1963.
Hong, T.-K., Lee, J., Lee, G., Lee, J., and Park, S.: Correlation between Ambient Seismic Noises and Economic Growth, Seismol. Res. Lett., 20, 1–12, https://doi.org/10.1785/0220190369, 2020.
Lecocq, T., Hicks, S., Van Noten, K., et al.: Global quieting of high-frequency seismic noise due to COVID-19 pandemic lockdown measures, Science, 369, 1338–1343, https://doi.org/10.1126/science.abd2438, 2020.
Lindsey, N. J., Yuan, S., Lellouch, A., Gualtieri, L., Lecocq, T., and Biondi, B.: City-scale dark fiber DAS measurements of infrastructure use during the COVID-19 pandemic, Sci. Adv., submitted, 2020.
Longuet-Higgins, M. S.: A theory of the origin of microseisms, Philos. Trans. R. Soc. London, Ser. A, 243, 1–35, 1950.
Lyons, R. G.:. Understanding digital signal processing, Pearson Education India, Upper Saddle River, NJ 07458 United States, 2004.
March, D., Metcalfe, K., Tintoré, J., and Godley, B. J.: Tracking the global reduction of marine traffic during the COVID-19 pandemic, ResearchSquare, in review, https://doi.org/10.21203/rs.3.rs-47243/v1, 2020.
Pepe, E., Bajardi, P., Gauvin, L., Privitera, F., Lake, B., Cattuto, C., and Tizzoni, M.: COVID-19 outbreak response, a dataset to assess mobility changes in Italy following national lockdown, Sci. Data, 7, 230, https://doi.org/10.1038/s41597-020-00575-2, 2020.
Piccinini, D., Giunchi, C., Olivieri, M., Frattini, F., Di Giovanni, M., Prodi, G., and Chiarabba, C.: COVID-19 lockdown and its latency in Northern Italy: seismic evidence and socio-economic interpretation, Sci. Rep.-UK, 10, 16487, https://doi.org/10.1038/s41598-020-73102-3, 2020.
Poli, P., Boaga, J., Molinari, I., Cascone, V., and Boschi, L.: The 2020 coronavirus lockdown and seismic monitoring of anthropic activities in Northern Italy, Sci. Rep.-UK, 10, 9404, https://doi.org/10.1038/s41598-020-66368-0, 2020.
Stein, S. and Wysession, M.: An introduction to seismology, earthquakes, and earth structure, Blackwell, Malden, MA, USA, 2003.
Wang, C., Li, W., Drabek, D., Okba, N. M. A., van Haperen, R., Osterhaus, A. D. M. E., van Kuppeveld, F. J. M., Haagmans, B. L., Grosveld, F., and Bosch, B. J.: A human monoclonal antibody blocking SARS-CoV-2 infection, Nat. Commun., 11, 2251, https://doi.org/10.1038/s41467-020-16256-y, 2020b.
Wang, D., Hu, B., Hu, C., Zhu, F., Liu, X., Zhang, J.,, Wang, Xiang, H., Cheng, Z., Xiong, Y.,, Zhao, Li, Y., Wang, X., and Peng, Z.: Clinical Characteristics of 138 Hospitalized Patients With 2019 Novel Coronavirus – Infected Pneumonia in Wuhan, China, JAMA, 323, 1061–1069, https://doi.org/10.1001/jama.2020.1585, 2020a.
Welch, P. D.: The use of Fast Fourier Transform for the estimation of power spectra: a method based on time averaging over short, modified periodograms, IEEE T. Audio Electroacoust. 15, 70–73, https://doi.org/10.1109/TAU.1967.1161901, 1967.
World Health Organization: Coronavirus disease (COVID-2019) situation reports, available at: https://www.who.int/emergencies/diseases/novel-coronavirus-2019/situation-reports/ (last access: 21 July 2020), 2020.
Xiao, H., Eilon, Z., Ji, C., and Tanimoto, T.: COVID-19 societal response captured by seismic noise in China and Italy, Seismol. Res. Lett., 20, 1–12, https://doi.org/10.1785/0220200147, 2020.