the Creative Commons Attribution 4.0 License.
the Creative Commons Attribution 4.0 License.
 | 05 Feb 2021
Fault sealing and caprock integrity for CO2 storage: an in situ injection experiment
Alba Zappone
Antonio Pio Rinaldi
Melchior Grab
Quinn C. Wenning
Clément Roques
Claudio Madonna
Anne C. Obermann
Stefano M. Bernasconi
Matthias S. Brennwald
Rolf Kipfer
Florian Soom
Paul Cook
Yves Guglielmi
Christophe Nussbaum
Domenico Giardini
Marco Mazzotti
Stefan Wiemer
The success of geological carbon storage depends on the assurance of permanent containment for injected carbon dioxide (CO2) in the storage formation at depth. One of the critical elements of the safekeeping of CO2 is the sealing capacity of the caprock overlying the storage formation despite faults and/or fractures, which may occur in it. In this work, we present an ongoing injection experiment performed in a fault hosted in clay at the Mont Terri underground rock laboratory (NW Switzerland). The experiment aims to improve our understanding of the main physical and chemical mechanisms controlling (i) the migration of CO2 through a fault damage zone, (ii) the interaction of the CO2 with the neighboring intact rock, and (iii) the impact of the injection on the transmissivity in the fault. To this end, we inject CO2-saturated saline water in the top of a 3 m thick fault in the Opalinus Clay, a clay formation that is a good analog of common caprock for CO2 storage at depth. The mobility of the CO2 within the fault is studied at the decameter scale by using a comprehensive monitoring system. Our experiment aims to close the knowledge gap between laboratory and reservoir scales. Therefore, an important aspect of the experiment is the decameter scale and the prolonged duration of observations over many months. We collect observations and data from a wide range of monitoring systems, such as a seismic network, pressure temperature and electrical conductivity sensors, fiber optics, extensometers, and an in situ mass spectrometer for dissolved gas monitoring. The observations are complemented by laboratory data on collected fluids and rock samples. Here we show the details of the experimental concept and installed instrumentation, as well as the first results of the preliminary characterization. An analysis of borehole logging allows for identifying potential hydraulic transmissive structures within the fault zone. A preliminary analysis of the injection tests helped estimate the transmissivity of such structures within the fault zone and the pressure required to mechanically open such features. The preliminary tests did not record any induced microseismic events. Active seismic tomography enabled sharp imaging the fault zone.
- Article
(11055 KB) - Full-text XML
-
Supplement
(1405 KB) - BibTeX
- EndNote


Carbon capture and storage (CCS) has a fundamental role in reducing the amount of anthropogenic CO2 in the atmosphere and achieving the Paris Agreement's challenging objective of keeping global temperature rise below 2 ∘C above pre-industrial levels (IPCC, 2018, 2019; Cozier, 2015).
Carbon storage at the megaton scale has been proven to be successful (e.g., Sleipner, Snøhvit, Weyburn, Aquistore, Quest), but it needs to be increased to the gigaton scale in order to achieve global emission reduction targets (IPCC, 2018; Zoback and Gorelick, 2012). Achievement of this upscaling is critically linked to better estimates of storage capacity and improved risk management strategies that rely on detailed monitoring with combined geophysical, geochemical, and hydrogeological methods (e.g., Aagaard et al., 2018; Fang et al., 2010; Rutqvist, 2012). One of the challenges in both evaluating storage capacity and pressure-managing strategies is the assessment of the long-term integrity of sealing formations. CO2 leakage along potential high-permeability pathways into near-surface aquifers or to the surface is potentially one of the main geological hazards for CCS that might challenge the technical feasibility and the social and political acceptability of the technology (Zoback and Gorelick, 2012).
Faults within the caprock represent one of the possible pathways for CO2 to migrate out of the storage reservoir. The presence of faults will greatly affect the site characterization process in terms of safety assessment and consequently of monitoring plan and risk management (prevention, mitigation, remediation actions). Faults are also key elements in the evaluation of induced seismicity risk during injection operations (Rutqvist et al., 2016). It has been argued that the injection of large volumes of CO2 at relatively shallow depth (a few kilometers) in brittle rocks could trigger earthquakes (Zoback and Gorelick, 2012), although injecting in a soft sedimentary basin (Vilarrasa and Carrera, 2015) might reduce such potential risk. However, if earthquakes of even modest magnitude can damage the caprock and jeopardize its sealing capacity, CCS may result in an unsuccessful strategy for significantly reducing greenhouse gas emissions (Zoback and Gorelick, 2012).
Fault internal structure, mechanical properties, and fluid flow are inextricably coupled (Caine et al., 1996; Faulkner et al., 2010; Bush and Kapmann, 2018). Despite fault zone complexity, a close coupling exists between thermal, hydraulic, mechanical, and chemical processes in fractures and faults. Several studies have focused on understanding the geomechanical processes related to CO2 injection at both the lab and field scale (Vilarrasa et al., 2019, and references therein). Often, caprock failure has been linked to changing thermomechanical and hydromechanical (THM) processes. Numerical simulations have highlighted how fault and fracture reactivation in caprocks is affected by two-phase fluid flow (Jha and Juanes, 2014), the presence of heterogeneities (Rinaldi et al., 2014), or temperature changes (Vilarrasa et al., 2017). Field studies on deformation (Vasco et al., 2010, 2018) corroborated by numerical modeling (Gemmer et al., 2012; Shi et al., 2013; Rinaldi and Rutqvist, 2013; Rinaldi et al., 2017), have highlighted the importance of potential caprock failure for successful CO2 storage. The coupling between chemical and mechanical processes has been studied in the laboratory (Le Guen et al., 2007; Hangx et al., 2013; Amann et al., 2017; Vialle and Vanorio, 2011; Mikhaltsevitch et al., 2014) and through field evidence (Rinehart et al., 2016; Hovorka et al., 2013; Al Hosni et al., 2016; Skurtveit et al., 2018), mostly for storage reservoir rocks. These geochemical reactions could influence other characteristics of the rocks (e.g., mechanical parameters), which can in turn be linked to fault reactivation and induced seismicity (Vilarrasa and Makhnenko, 2017). A limited set of experimental studies have reported on the chemical processes that occur in caprocks, such as clays, shales, and carbonate-rich shales (Kaszuba et al., 2005; Credoz et al., 2009; Alemu et al., 2011; Kapman et al., 2016), highlighting a relevant knowledge gap when it comes to successful CO2 storage.
A large number of empirical observations is provided by CO2 injection operations conducted by the oil and gas industry (e.g., Jia et al., 2019; Michael et al., 2010, and references therein), but experiments targeting faults, especially geomechanical and geochemical coupling, are still quite rare. Over the past decade a few in-situ-scale experiments have been conducted on the controlled release of CO2 (free phase or dissolved) to better understand environmental impacts and test monitoring techniques (Roberts and Stalker, 2017, and references therein). The experiments differ in many aspects, such as geological environments, injection depth, and injection strategy. Most experiments released CO2 into unconsolidated formations such as sand or gravel, with only one exception to date, whereby gaseous CO2 was injected into a lithified carbonate formation at only 3 m of depth (Rillard et al., 2015). These experiments usually mimic the effects of leakage from wells by injecting into a vertical structure from a point source. The leakage through a fault is simulated by injecting from a linear feature. Besides the experiment described in this contribution, to the best of our knowledge only two other test sites, the CISIRO in situ laboratory project in Western Australia (Myers et al., 2020, and references therein) and the CO2CRC at the Otway National Research Facility in Victoria, Australia (Feitz et al., 2018; Tenthorey et al., 2019), foresee experiments on the controlled release of CO2 at shallow depth. The project in Western Australia targets a fault in a reservoir formation with the injection of a small volume of CO2, with the purpose of evaluating the ability to monitor and detect unwanted leakage of carbon dioxide from a storage complex (Michael et al., 2019). The Western Australian experiment is ongoing as injection started in early 2019 (Karsten Michael, personal communication, 2019). The experiment at the Otway National Research Facility has reached the stage of completed site characterization and design of the monitoring system, while the experiment involving the shallow release of CO2 will take place in the coming months (Feitz et al., 2018; Tenthorey et al., 2019).
Recently, the Mont Terri rock laboratory (MTRL) hosted a decameter-scale experiment (FS experiment) aiming to observe the rupture and sliding mechanisms on a fault subjected to injections of large amounts of fluid. The FS experiment aims to understand the conditions for slip activation and stability of clay faults, as well as the evolution of the coupling between fault slip, pore pressure, and fluid migration. The experiment revealed complex rupture mechanisms associated with microseismicity (e.g., Guglielmi et al., 2020a, b). Results obtained in the course of the experiment are crucial in defining mechanisms of natural and induced earthquakes, their precursors, and risk assessment. The FS test and its findings constitute a valid basis to develop the experiment we describe in this work.
However, experiments that aim to investigate the transport and migration of CO2 in caprock formations at the decameter scale under controlled conditions (i.e., confining pressure, pore pressure, temperature, saturation degree) are still rare. To the best of our knowledge, the only experiment to date dealing with an injection prolonged for many months was conducted at Daniel Electric Generating Plant, Mississippi, which specifically targeted the effects of dissolved CO2 on a shallow groundwater reservoir and not on the transport and migration of CO2. Hence, the testing of faulted caprocks subjected to CO2 injection and the monitoring of coupled geomechanical and geochemical effects are of particular interest because they offer direct observations that will help to gain insight into coupled THMC processes in faulted caprock and ultimately improve assessments of storage sites.
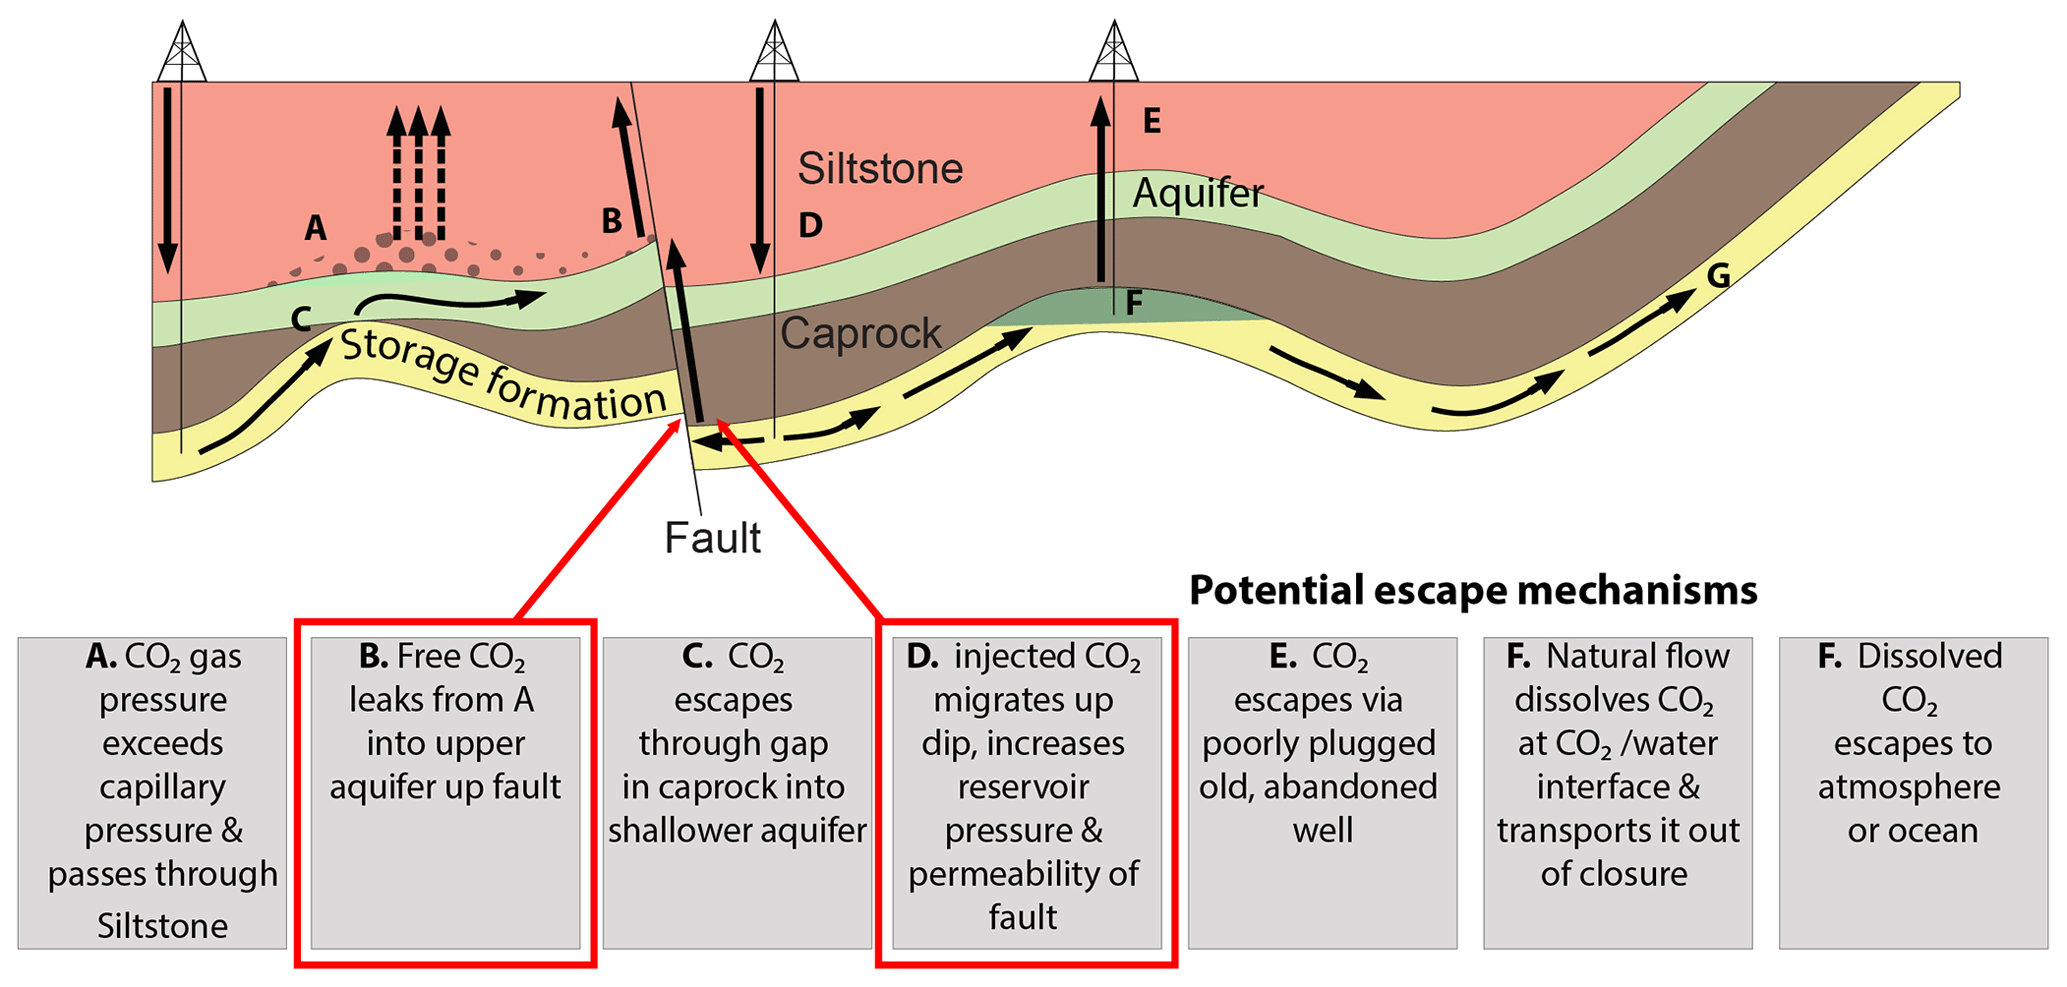
Figure 1Potential leakage routes (modified after the IPCC special report, 2005). The scientific objective of the experiment is to better understand how prolonged exposure to CO2-rich water could affect the properties of a fault hosted in a caprock, altering its sealing properties (red arrows).
We are currently running an experiment that aims to cover this knowledge gap by providing observations of CO2 migration in a fault system at a decameter scale, which is therefore under well-controlled conditions, but targeting a rock volume that can capture heterogeneities representative of a large-scale in situ injection. We want to simulate a situation in which the CO2 contained in a storage site reaches a caprock that is crosscut by faults. We want to target one of the most critical conditions, when CO2 could escape the reservoir through the fault and possibly contaminate freshwater aquifers in the overburden and/or reach the surface and be released to the atmosphere (Fig. 1). The MTRL located in northwestern Switzerland (Fig. 2) allows in situ access to a fault (the Mont Terri main fault) hosted in a clay formation, the Opalinus Clay, and offers a unique opportunity for a prolonged (multiple months) decameter-scale CO2 injection experiment (CS-D: Carbon Sequestration – Series D) into a fault to study relevant geomechanical and geochemical processes of leakage and fault properties.
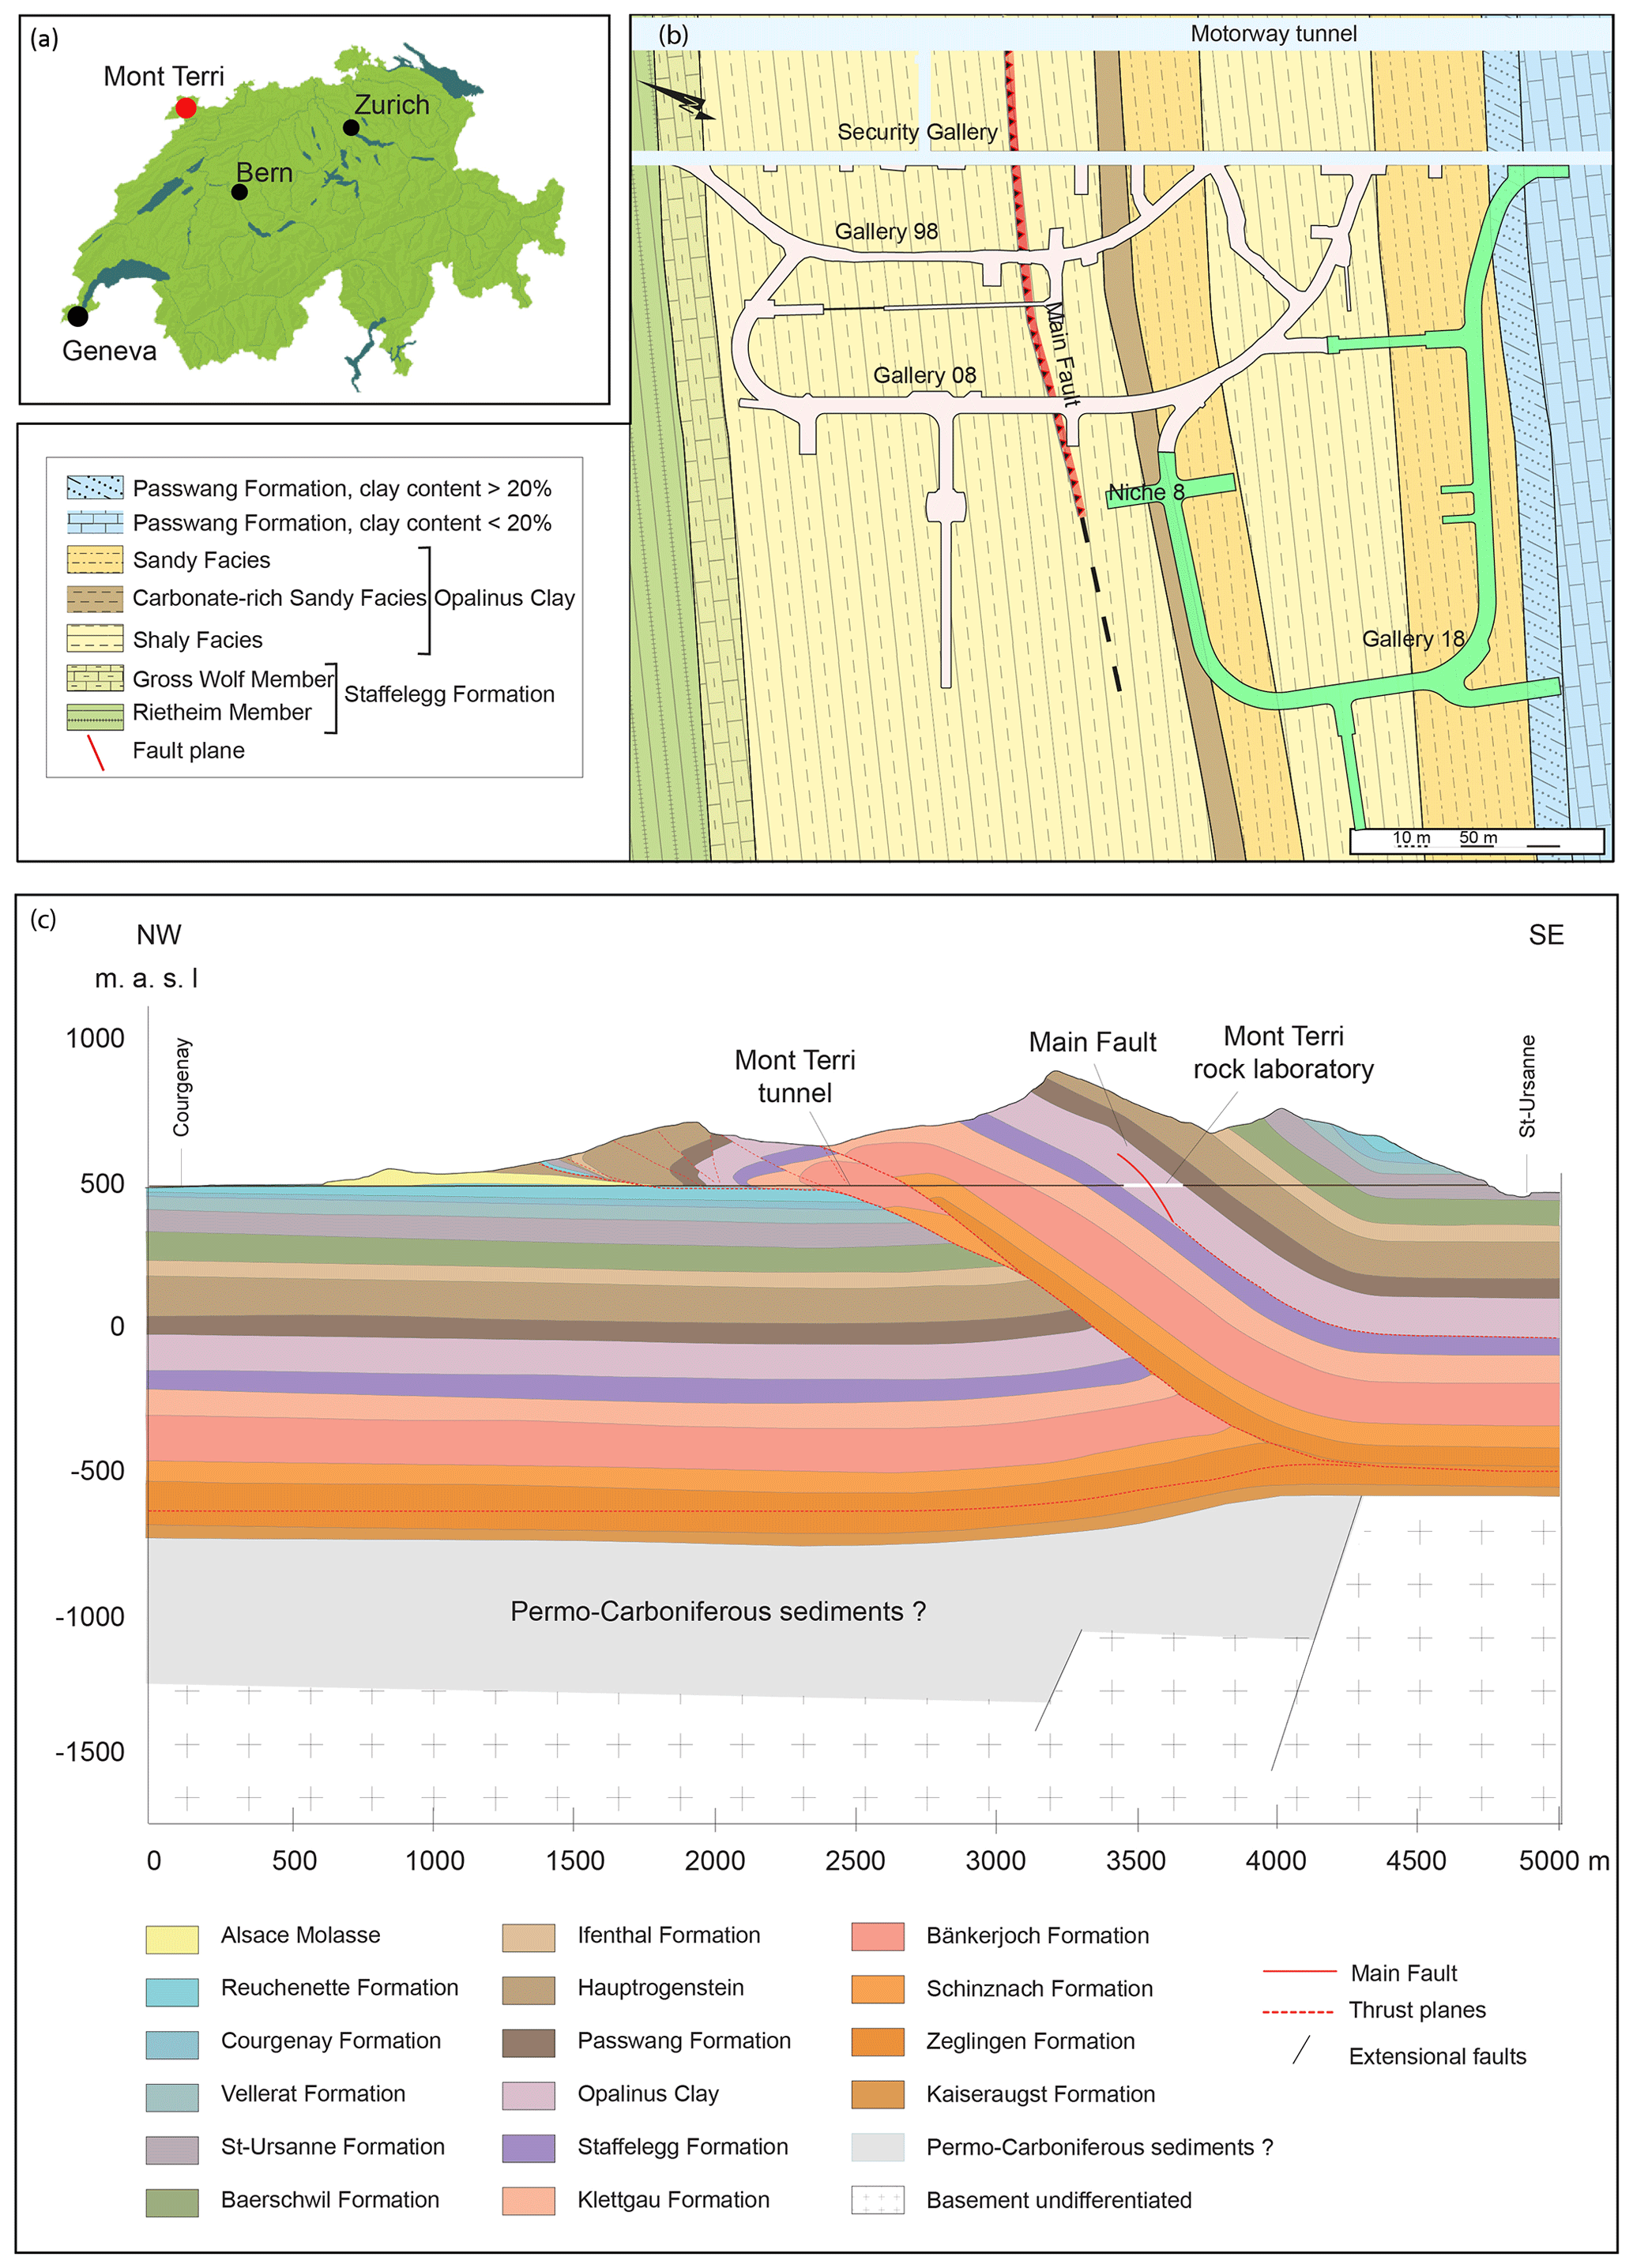
Figure 2(a) Location of the MTRL. (b) Schematic geological map of the laboratory area with the new tunnels in light green (after Thury and Bossart, 1999). (c) Geological interpretation of the main structures along a profile crosscutting the security gallery (Nussbaum et al., 2017).
This paper presents the concept of the CS-D, a general overview of the CS-D test site, the conceptual design, and the details of the experimental instrumentation. We also present results from the characterization of the rock volume prior to CO2 injection, which provided the parameters adopted for the continuous long-term CO2 injection that is currently ongoing. Finally, we discuss the implications of the current observations and speculate on the potential impact of the long-term experiment.
The general concept of the CS-D experiment is to introduce CO2-saturated water and tracers in the fault at MTRL in a long-term (12-month) steady-state continuous injection, forerun and intercalated by short, pulse-wise pressure increase steps that would be repeated at regular intervals during long-term injection. The effects of the injection are monitored by a synchronized complex monitoring system that is described in detail in Sect. 3.3.
2.1 Aims
With the CS-D experiment, we want to understand how exposure to CO2 affects the sealing integrity of a caprock hosting a fault through observations of permeability changes, fluid migration along the fault, and interaction with the surrounding environment. With this we want to test the hypothesis that the retention capacity of the rock, even if faulted, is not affected by exposure to CO2 if the pressure conditions are not causing fault rupture. We also want to test the hypothesis of self-sealing of the fault after eventual rupture and slip events. We want to investigate the concerns expressed by Zoback and Gorelick (2012) that the sealing integrity of CO2 repositories can be threatened by earthquakes even of small size and to what extent the concern can be generalized. Finally, we want to validate instrumentation and methods for monitoring and imaging fluid transport, generate well-constrained parameters as inputs for hydromechanical–chemical (HMC) simulations, and validate the observation of the mobility of CO2 in the caprock and the possibility of leakage in the overburden.
With the CS-D experiment, we aim to better understand the processes governing the following:
-
the mobility of CO2-rich water through the damaged zones of a fault;
-
the impact of long-term (ca. 12-month) exposure to CO2-rich water on permeability and porosity in the damaged zone and in the intact rock;
-
the coupled geochemical and geomechanical variations due to rock–water interaction;
-
the propagation of the transient field pressure in the fault and in the host rock;
-
the deformation of the rock mass as a response to pressurization and slip, if any; and
-
the occurrence of induced microseismicity in clay.
With its dense network of monitoring systems, the experiment aims to collect multiparameter observations and data from independent but strongly integrated monitoring techniques. Over the course of the experiment, we aim to establish a dataset at high spatial resolution that will yield insight into the interrelationship of hydraulic, geomechanical, and geochemical processes within the fault. Therefore, a dense network of multiparameter sensors is installed around the injection site to monitor the rock volume hosting the fault zone. The installation of the CS-D experiment in MTRL includes microseismicity and active seismic monitoring, cross-hole electrical resistivity monitoring, axial deformation coupled with a three-dimensional displacement probe (SIMFIP; Guglielmi et al., 2013), and in situ dissolved gas monitoring. The installation of a permanent infrastructure allows for long-term experiments.
Direct laboratory measurements from rock and fluid samples at the centimeter scale are also an essential part of the experiment. The aim is to integrate geophysical observations with analytical tests on fluid samples collected within the fault and on rock samples either from the fault or from the intact rock. Samples from intact rock and fault zone collected before and after the injections will allow for the characterization of mineralogical and chemical changes due to the rock–fluid interaction; geomechanical tests will reveal possible changes due to exposure to CO2-rich water. This part is not discussed in the present paper, and a detailed description of the methodology adopted for lab studies is reported in Wenning et al. (2019a).
Numerical modeling assists the design and analysis of different phases of the experiment, and a primary aim of the experiment is also to provide parameters to calibrate numerical models that can be used to enhance process understanding, sensitivity studies, and upscaling.
The CS-D experiment takes advantage of close cooperation with a partner experiment, FS-B (Guglielmi et al., 2019), at a nearby location, also injecting fluids into faults but having complementary objectives.
-
The FS-B main aim is to image fluid flow, permeability, and stress variations during rupture along the main fault zone to better understand the role of fluids in earthquake rupture and fault reactivation. The experiment will feature large injection volumes and long-term monitoring of the recovery phase.
-
The CS-D experiment discussed in this work focuses on the role of CO2-rich water in hydromechanical–chemical properties and addresses the long-term behavior of clays exposed to several months of low-flow-rate injection.
The time schedule of the two projects is closely coordinated. Because the FS-B experiment will stimulate the same fault targeted by the CS-D injection, it simulates the case of a seismic event causing a rupture and a slip, and provides an opportunity for the CS-D motoring equipment to record the event and to detect possible leakages due to the slip. The FS-B stimulation is planned at a late stage of the CS-D experiment, after a long-term injection phase in CS-D when the observation of the evolution of the CO2 in the fault indicates a steady-state flow path.
2.2 Location
The MTRL is an underground facility located in northwestern Switzerland (Fig. 2a) in the Jura Mountains, a small fold-and-thrust belt (Fig. 2c) that represents the youngest and most external deformation zone of the Alps (Pfiffner, 2014). The laboratory is located 280 m below the surface and comprises ca. 700 m of galleries and niches. The MTRL, under the responsibility of the Swiss Geological Survey, swisstopo, hosts experiments by 22 organizations from various countries worldwide and offers a technical and scientific platform facilitating the realization of scientific projects in the field of deep geological disposal.
Experiments in the MTRL investigate the properties of a pristine claystone, the Opalinus Clay, that has been indicated as a possible host rock for radioactive waste in Switzerland (Bossart et al., 2017, and references therein). Because of its very low hydraulic permeability and its regional extension over the Swiss Molasse basin, the formation is also considered a good seal for underground reservoirs (i.e., CO2 storage) at the regional scale.
The Opalinus Clay is sequence of shale deposited around 174 Myr ago (Hostettler et al., 2017). It has been subdivided into three main facies, clayey, sandy, and carbonate-rich (Blaesi et al. 1996; Hostettler et al., 2017), on the basis of the content of clay minerals, quartz, and carbonate. It is an overconsolidated clay, which has reached an estimated maximum burial depth of around 1350 m at the current laboratory area, with an overconsolidation ratio of almost 5, assuming a current average overload of 280 m (Hostettler et al., 2017). The formation is 131 m thick (Bossart et al., 2017) at the MTRL. The Opalinus Clay and the adjacent formations form an anticline crosscut by the tunnels of the lab. This structure is interpreted as a fault–bend fold, where a series of thrust faults, extensional faults, and strike-slip faults intersect in a complex pattern (Nussbaum et al., 2011). Among these tectonic features, the most evident is the so-called main fault, a thrust fault located in the shaly facies with shear movement towards NNW (Nussbaum et al., 2011). The fault zone consists of several architectonic elements: fault gouge, S-C bands, mesoscale and microscale folds, numerous intersecting fault planes, and apparently undeformed volumes. The thickness of the fault zone varies between 1 and 4.5 m (Nussbaum et al., 2011).
The CS-D experiment takes place across the main fault, accessed from the newly excavated niche 8 (Fig. 2b). The niche is located entirely in the shaly facies of the Opalinus Clay. Vertical and inclined boreholes have been drilled and instrumented from niche 8 going through the fault zone.
2.3 Timeline
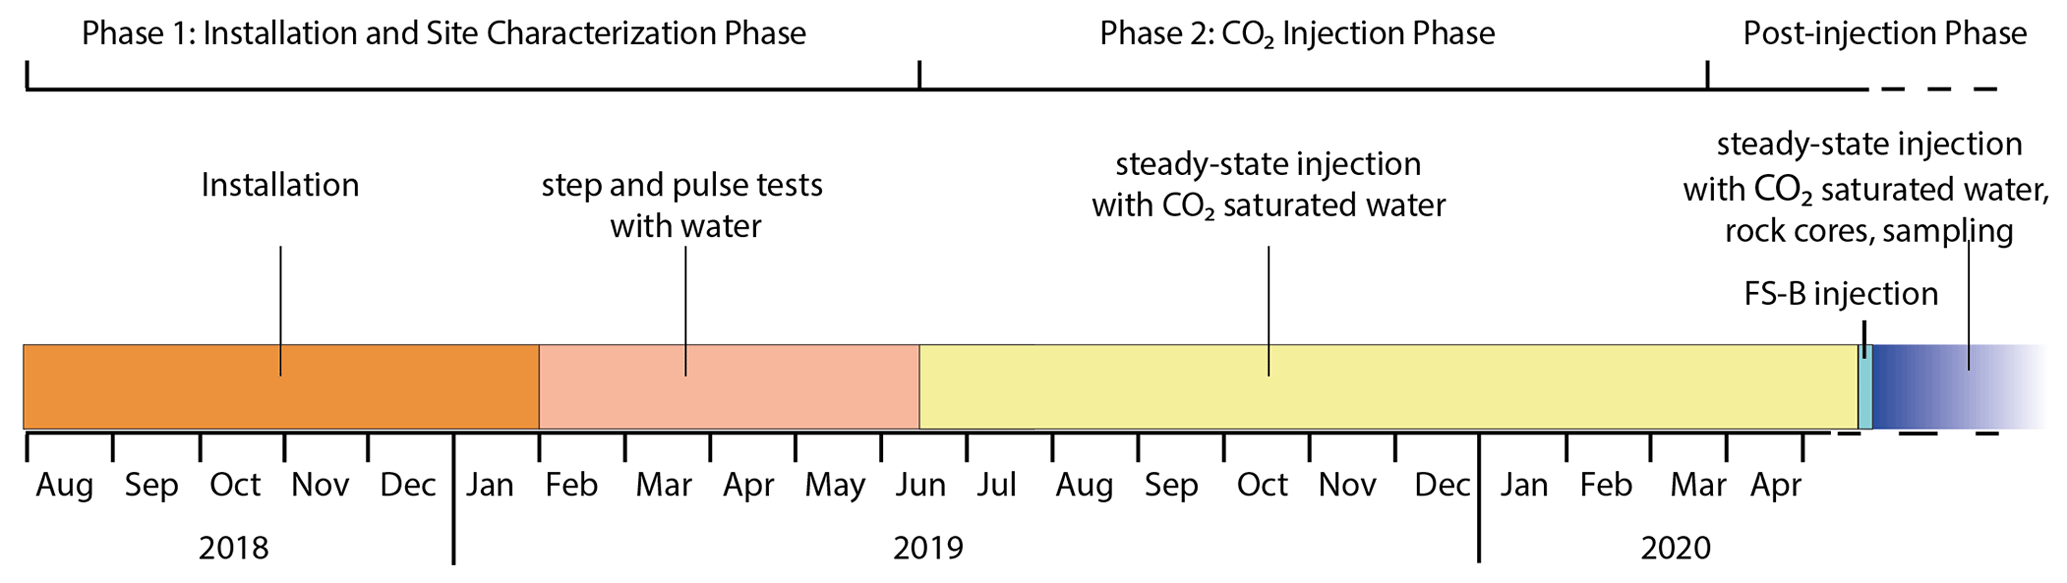
The CS-D experiment comprises three main phases (Fig. 3).
-
Phase 1. Preparation of the long-term injection phase included the planning and realization of the experimental infrastructure: drilling of boreholes, logging, collection and storage of samples, borehole completion and instrumentation, installation of surface geophysical monitoring equipment, and all ancillary operations aimed at the completion of the experimental infrastructure. Moreover, in this phase we characterized the rock volume in terms of geological and structural features, hydraulic properties, and seismic velocity distribution, all of which are essential for the design of the long-term fluid injection and the interpretation of the experimental results. During the first phase, one main goal was to define the long-term injection pressure. To this end we performed repeated hydraulic tests in order to define the pressure at which the fault suddenly shows a large increase in flow rate for small pressure increments, otherwise known as the fault opening pressure (FOP; Guglielmi et al., 2016). The concept of FOP, defined as the pressure threshold at which a large increase in flow rate is registered at the injection point and considered the start of activation of the fault (Guglielmi et al., 2016), was particularly helpful in designing the CS-D injection protocol. We performed these tests in different injection intervals within the fault in order to determine what, if any, zones are more reactive to pressure changes and plan the installation of fluid sampling and monitoring equipment. The experimental installation was performed from August to December 2018. Baseline acquisition started immediately after the installation completion and lasted until May 2019. The results of these baseline measurements are presented in this paper.
-
Phase 2. For long steady-state injection below the FOP, we inject CO2-saturated water and tracers while we keep monitoring pressure, electrical resistivity and pH, seismic velocity changes, and gas content. Water is sampled from the fault at regular time intervals and analyzed in laboratories to monitor chemical variations. In this phase, we regularly repeat hydraulic tests and compare the results to detect possible variation in the fluid mobility. The long-term constant pressure injection with CO2-saturated water started in June 2019. This phase will be terminated when the neighbor experiment FS-B takes place (at present still pending). The FS-B experiment will inject large quantities of water at high pressure at a distance of ca. 20 m from the CS-D injection point, aiming to substantially increase the permeability of the fault zone.
-
Phase 3. For post-long-term injection operations, we will repeat the characterization tests and prolonged injection test to identify possible effects of the FS-B experiment on the CS-D injection site. This phase may also include the collection of rock cores from sampling drills that will reach the volume exposed to CO2-saturated water for further detailed petrophysical, geomechanical, and geochemical characterization at the lab scale. A new long-term injection phase is foreseen to highlight possible changes in leakage rate after a major fault zone stimulation.
All the phases are integrated by continuous monitoring of pressure, deformation, pH, and water electrical conductivity, as described in detail in the following section.
The layout of the boreholes used in the CS-D experiment was determined from constraints defined by the geometry of the fault by bedding of the clay and by preliminary numerical modeling of fluid flow, aimed to define the position of the boreholes and ensure the accuracy of the monitoring instrumentation. To avoid interference from the excavation damage zone (EDZ) around the tunnel, we planned the injection boreholes and the fluid-monitoring borehole to intersect the fault at a depth greater than 10 m, given the tunnel radius of 5 m (Bossart et al., 2002).
The position and geometry of the main fault were the basis to start the planning of the experimental layout. The depth of the fault was preliminarily calculated through a 3-D geological model provided by swisstopo. The main fault is primarily strike-oriented N080∘ and dipping ∼ 50–65∘ SE. From the fault geometry model, we expected the fault to be approximately 10 to 25 m below niche 8, increasing in depth towards the southern end of the niche, well below the EDZ (Fig. 5a). During the drilling phase, core mapping and borehole image logs provided a more precise understanding of the main fault geometry and allowed for adaptations to the borehole positioning.

Figure 4(a) Modeling domain and main properties. (b) The pressure at injection follows a stepwise behavior with monthly increase. (c) Example of a simulated distribution of pressure changes around the injection point after 8 months of constant head injection for a permeability of m2. (d) Simulated injected brine distribution after 8 months of constant head injection for a permeability of m2.
3.1 Numerical scoping calculations
Preliminary numerical modeling results with the coupled numerical simulator TOUGH-FLAC (Rutqvist, 2011; Rinaldi and Rutqvist, 2019) helped constrain the distance between injection and monitoring boreholes. Such a simulator allows us to solve for coupled fluid flow and geomechanics. For planning, we tested scenarios with both constant and stress-dependent permeability. Similar to previous numerical modeling of the FS experiment (Guglielmi et al., 2020a, b), the injection occurs with constant head at the center of a 20 × 20 × 20 m domain and with a planar feature representing the fault zone (Fig. 4a). The fault plane, embedded in a 3-D model, is simulated with a finite width (1 m). The preliminary model assumed an injection strategy similar to the previous FS experiment (Guglielmi et al., 2020a), whereby the injection time was extended to account for a long-term injection (12 months, given some preliminary planning for the experiment – Fig. 4b). The main goal of this preliminary modeling was to assess the maximum reach of the pressure front and of the injected water.
In a first set of simulations, we assumed that the permeability would remain constant during injection. We considered permeability values ranging from 10−21 to 10−19 m2; therefore, we simulated cases with permeability slightly larger and slightly smaller than values found in the literature (Marschall et al., 2003, 2005). Results show that the pressure perturbation has a long reach, while the injected water is confined within a few meters around the injection well. Figure 4c–d show the results for the case of a permeability of m2; while the pressure front can be up to 8 m away, the injected fluid is confined around the injection point. A larger (smaller) permeability results in a larger (smaller) reach of the injected fluid. Simulating permeability to vary as a function of elastic or tensile opening of a fracture results in a much larger reach as soon as the pressure is increased above the leakage threshold (Zappone et al., 2018). However, this condition was considered a worst-case scenario, as the CS-D experiments aims to inject at a pressure below the FOP.
Results of the preliminary modeling suggested that a fluid-monitoring borehole needed to be placed at the minimum distance allowed by the setup (i.e., 2 m inter-distance at the gallery floor). All the different scenario results with fixed permeability and stress-dependent permeability are provided in the Supplement (Sects. S1 and S2, respectively).
3.2 Borehole geometry
Due to the considerable anisotropy of seismic (e.g., Nicollin et al., 2008; anisotropy 28 %) and electrical (e.g., Nicollin et al., 2010; anisotropy 85 %) properties of Opalinus Clay, the geophysical monitoring boreholes were oriented in a way that would facilitate the data processing. For this reason, they are oriented such that the 2-D tomographic planes between these boreholes are normal to the bedding planes (anisotropy symmetry axis within tomography planes). Three geophysical boreholes were drilled with an inclination of 48–51∘ from vertical to have a perpendicular intersection with the fault and bedding. In addition, the intervals in the injection borehole needed to be in the vicinity of the field of view of the geophysical arrays.
Table 1Parameters defining the CS-D boreholes: inclination equals deviation from the vertical (vertical 0∘); borehole depth is approximately 0.5 m. The order of the boreholes in the table represents the drilling sequence. The borehole BCS-D7 has an initial diameter of 116 mm from 0 to 13.60 and a diameter of 101 mm from 13.60 to 30.5 due to overcoring to retrieve a stuck drill bit. ERT: electrical resistivity tomography.
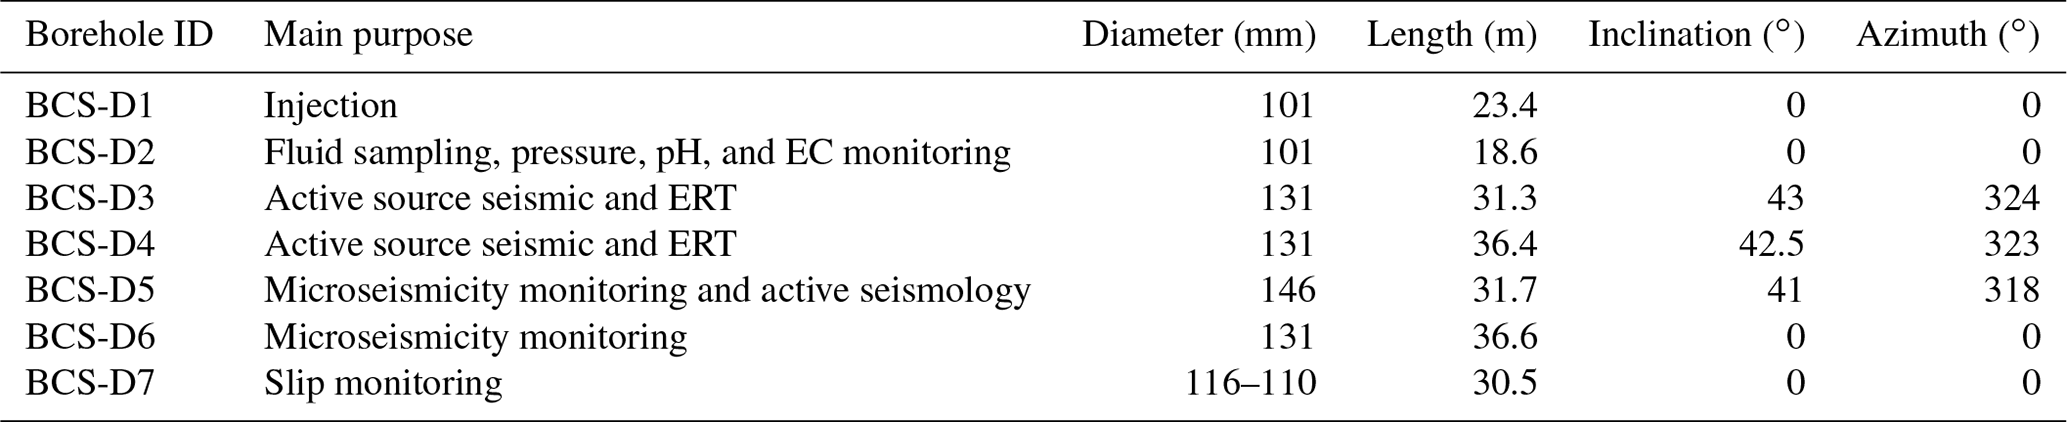
A total of seven boreholes, four vertical (BCS-D1, BCS-D2, BCS-D6, and BCS-D7) and three inclined (BCS-D3, BCS-D4, and BCS-D5), were drilled and equipped in order to perform and monitor a long-term (12-month) injection of CO2-saturated water in the fault, as well as to monitor the movement of the water in the fault through geophysical methods and sampling of fluids. The geometrical layout of the boreholes is illustrated in Fig. 5. Table 1 gives the specifications of the borehole purpose, diameter, length, and orientation.
Boreholes BCS-D3 to BCS-D6 were drilled for specific geophysical investigations. BCS-D3 and BCS-D4 were drilled coplanar to each other, such that they create a plane that intersects the fault zone at a distance of 2 m from the injection intervals. BCS-D5 was drilled on the opposite side of the injection borehole and is also coplanar to BCS-D3. This allows for an additional tomography plane across the injection zone. BCS-D6 is drilled vertical at a distance of 3 m from BCS-D7 with the purpose of placing sensors for continuous seismic monitoring to better locate seismic events in 3-D.
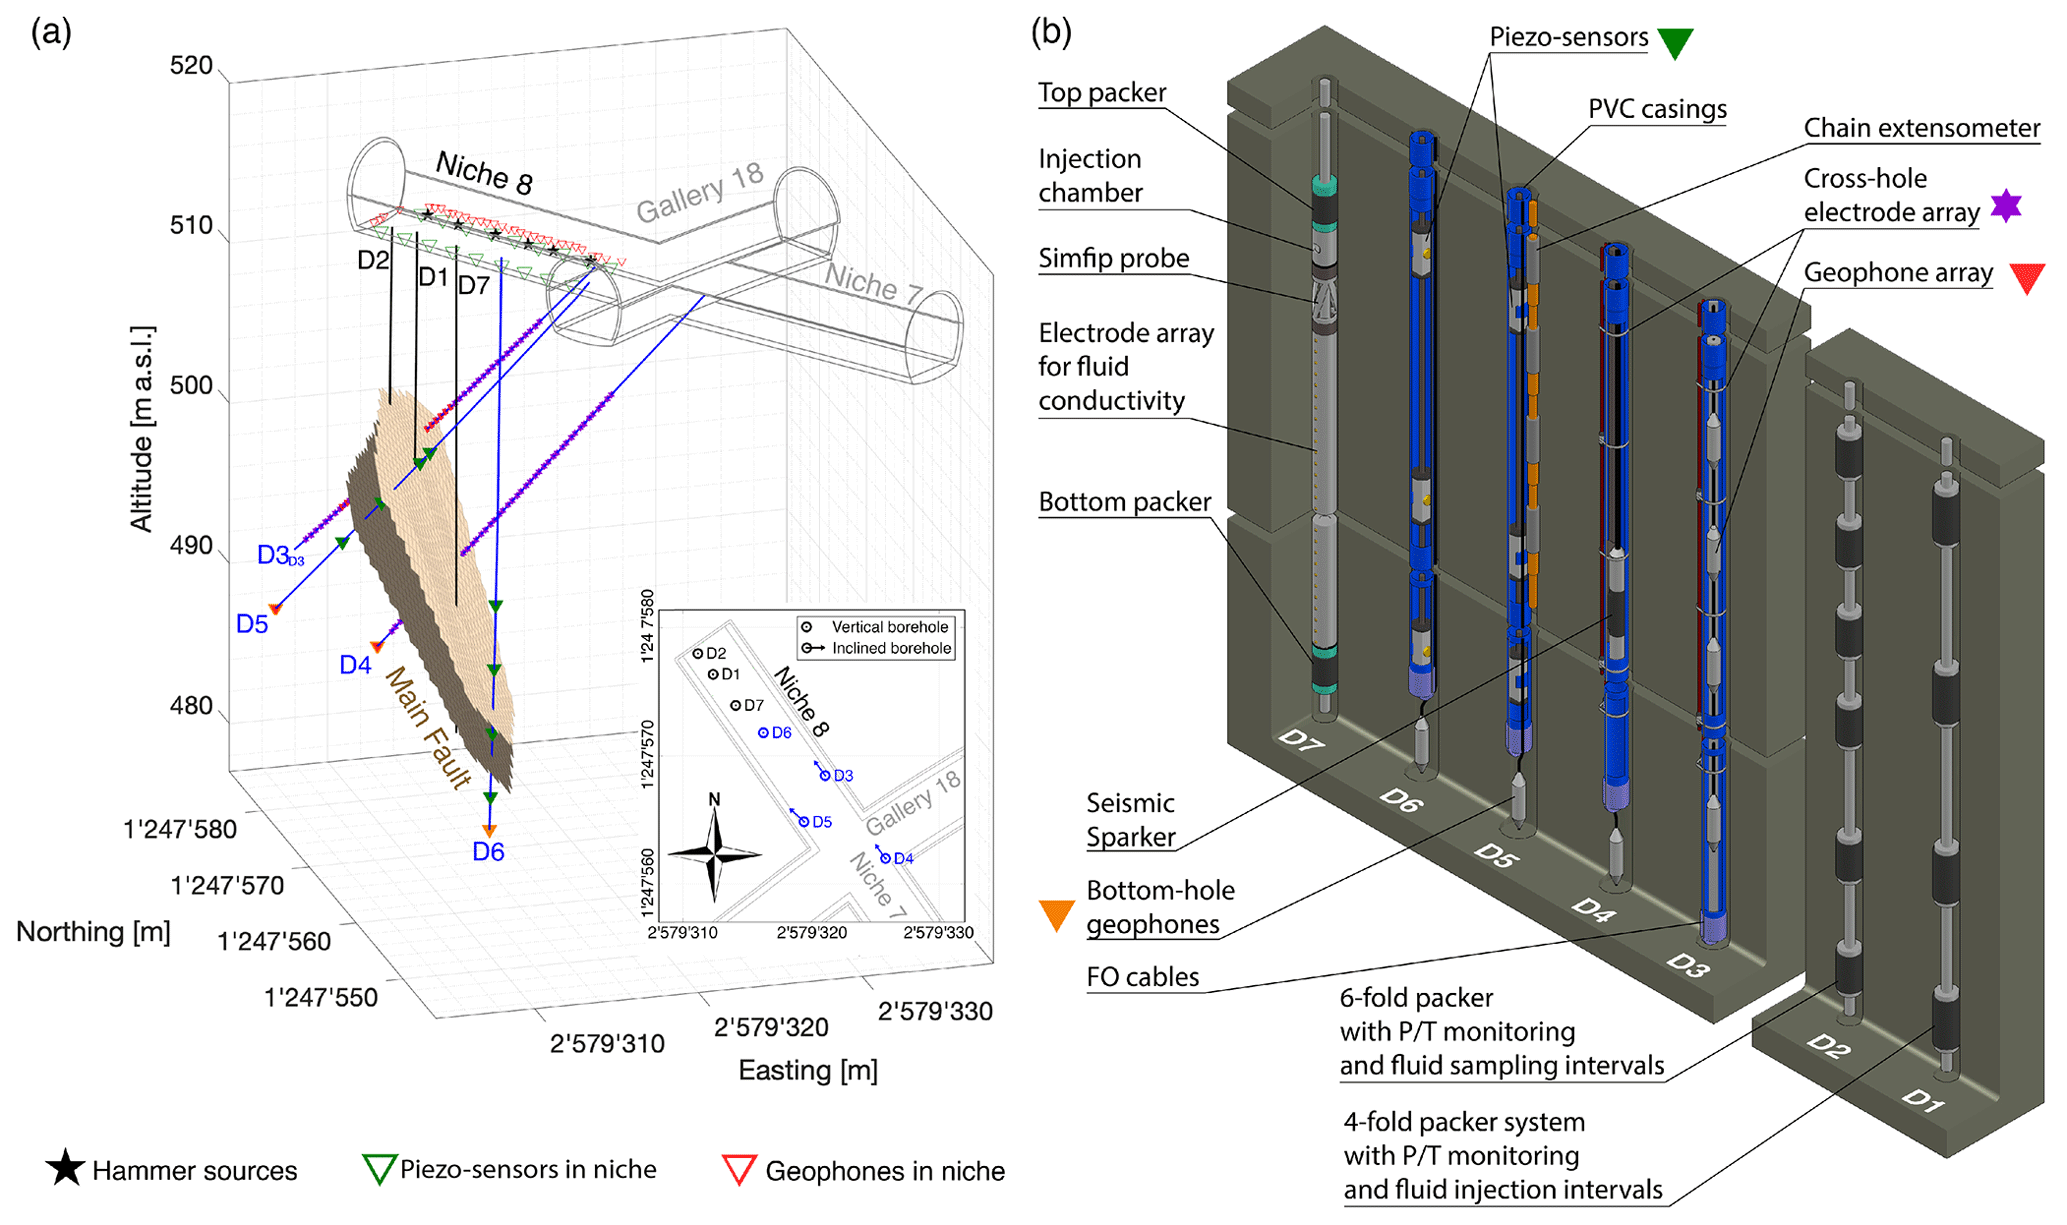
Figure 5(a) Geometry of boreholes and of the main fault below niche 8; (b) planar view of the borehole location in niche 8.
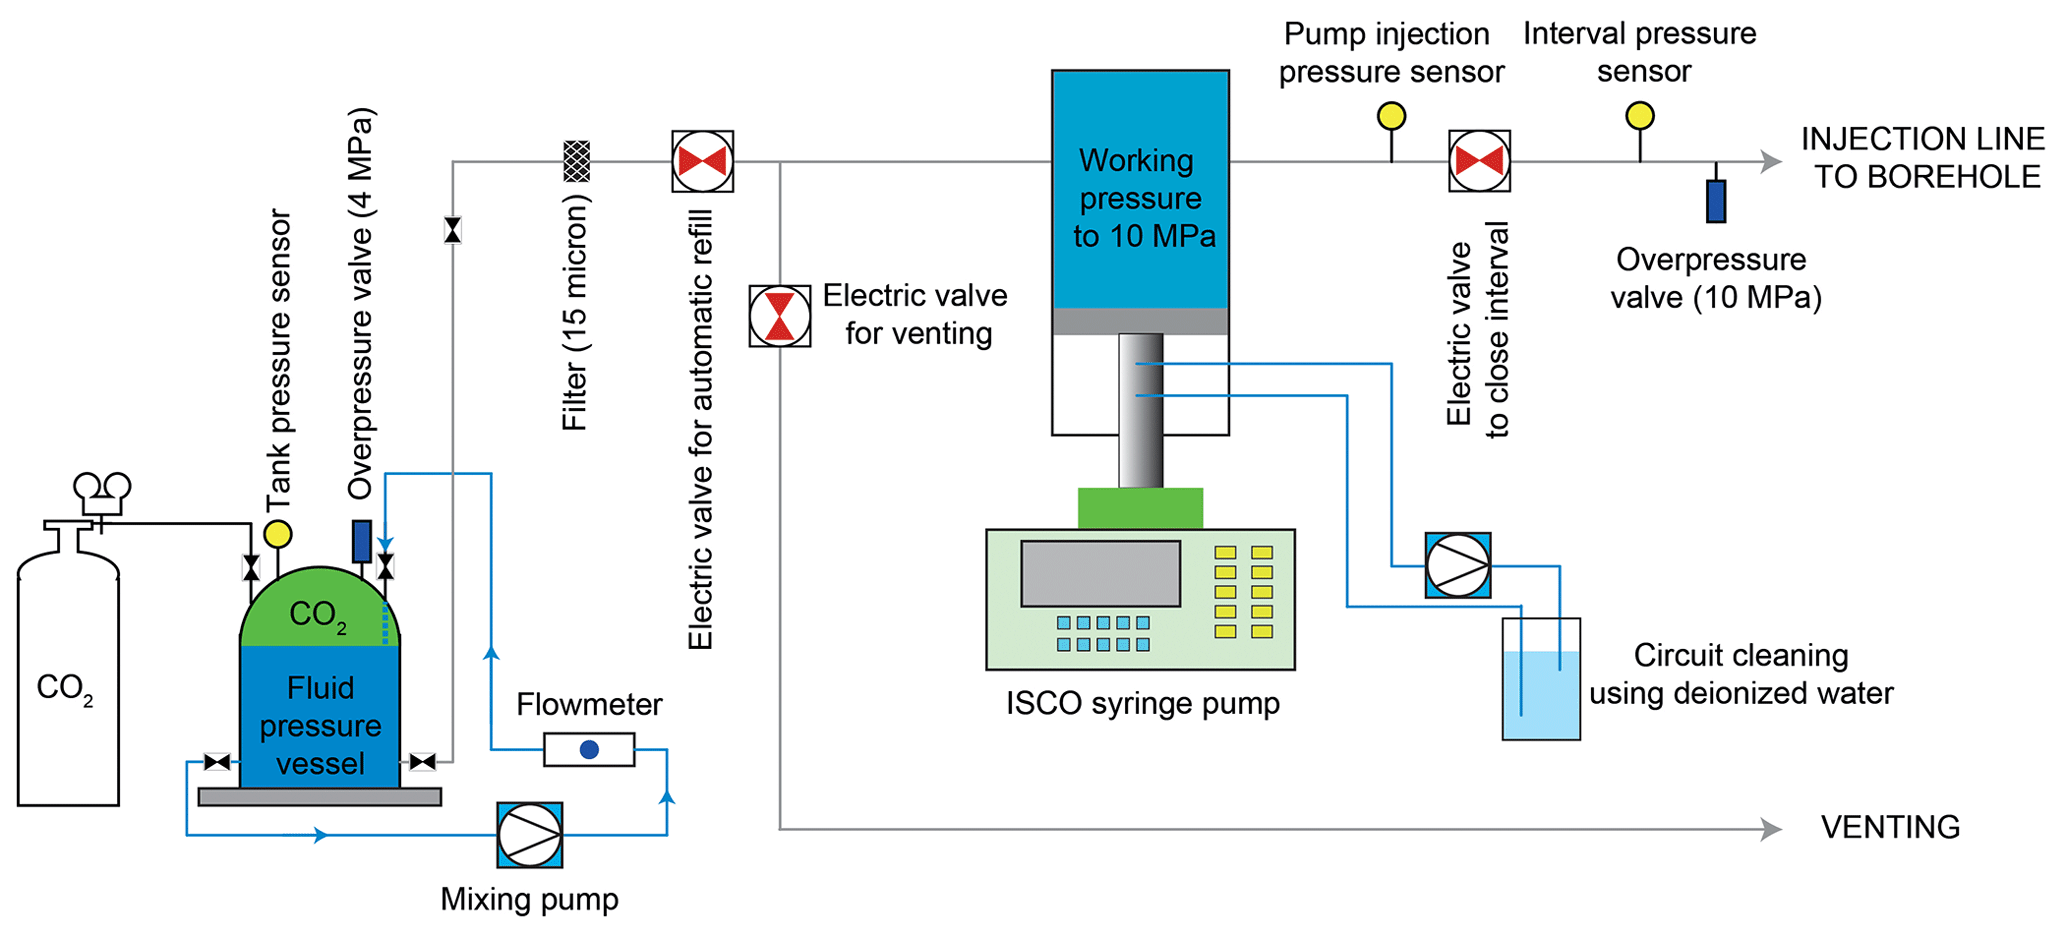
Figure 6Injection system design for the CS-D experiment (modified after Solexperts AG, Switzerland).
3.3 Instrumentation
3.3.1 Injection system
The injection system is designed to perform injections separately at four depth intervals in the fault zone. An injection module (Fig. 6) designed for injection over long periods was connected to borehole BCS-D1. The injection is carried out using a syringe pump (Teledyne ISCO 500D) that is remotely controlled through dedicated software (DCAM) developed by Solexperts AG. The pump allows the injection of moderate volumes of fluids, with an injection chamber volume of 0.5 L, refill breaks of 2.5 min, and an accurate control of injection rate from 0.001 to 200mL min−1. The pump is connected to a 10 L tank, where the injection water is pressurized at about 2 MPa and mixed with carbon dioxide (CO2) and krypton (Kr) by bubbling. The pressure in the mixing tank is sustained by a pressure regulator mounted on the CO2 bottle. A circulation pump and a flowmeter enable controlled mixing. To resemble the natural composition of the formation water, we inject Pearson water A1 type (Manceau et al., 2016), depleted of Mg and Ca, to avoid mineral precipitation and consequent clogging of the lines. Kr is added to the mixture as a tracer because it is not present in the formation water and is not reactive. The pressure of CO2 in the mixing tank is continuously monitored, and the CO2 content in the injection water is calculated on the basis of the CO2 dissolution in saline water at the pressure and temperature conditions of the mixing tank and given the salinity of the Pearson water. The injection module is designed for permanent and remote-controlled injections.
3.3.2 Borehole instrumentation
Borehole BCS-D1, the injection borehole, and BCS-D2, the fluid-monitoring borehole, were equipped with a 4-fold and 6-fold packer system, respectively. Figure 9a displays a schematic layout of the packer system showing packer and interval depths and the intersection with the fault, as from borehole logging.
The pressure at each injection and monitoring interval is monitored with sensors connected at the surface; flow lines and packer lines are realized in stainless steel to avoid corrosion from CO2 exposure.
Deformation is monitored through distributed strain-sensing (DSS) fiber-optic (FO) cables integrated into the packer system and anchored at each interval to avoid the effect of packer inflation on strain measurements. The multiple-packer system allows for multiple injection monitoring intervals in both the fault zone and the host rock. All the intervals were saturated with Pearson water A1 type (Manceau et al., 2016), depleted from Mg and Ca, to avoid mineral precipitation.
Boreholes BCS-D3 to BCS-D6 were all cased with PVC tubes to ensure impermeability of the inner chamber and instrumented with DSS FO cables fixed to the casing to allow distributed deformation measurements. After installation, the annulus between the PVC casing and the borehole wall was grouted with a mixture of bentonite and cement. In order to prevent any possible leakage of CO2 at the surface of the niche through the monitoring wells, epoxy resin was injected between the PVC and borehole wall at a depth below the EDZ and above the fault.
The fiber-optic strain-sensing cables, 3.2 mm in diameter, are flexible cables armored with a central metal tube surrounded by a structured outer nylon sheath, containing one single optical fiber (BRUsens strain-sensing cables). They are designed to measure a strain range up to 1 % (10 000 µ strain). Axial deformation is also measured with a chain potentiometer grouted outside the PVC casing in borehole BCS-D5, including 12 measuring sections, 10 of which cross the fault with 0.5 m of inter-distance between each element. The chain potentiometer consists of anchor elements connected to each other by PVC tubes. The anchors measure unidirectional displacements relative to each other. Standard potentiometric displacement sensors with a measuring range of 100 mm are used for the measurements in the chain.
A total of 50 ring-shaped stainless-steel electrodes, with an interspacing of 0.5 m, were clamped to the casing in BCS-D3 and BCS-D4 to allow for electrical resistivity tomography and time-lapse observations on a 2-D plane between the two boreholes. Inside the casing of BCS-D3 a three-component geophone array of 24 geophones (100 Hz) with an interspacing of 0.5 m was installed, while identical single three-component geophones were installed at the bottom of boreholes BCS-D4 to BCS-D6. The three-component geophones were custom-designed by Omniquest Int. and are identical to those installed in a previous MTRL experiment (Manukyan and Maurer, 2018). Eight piezo-sensor elements for high-frequency seismic detections were installed in boreholes BCS-D5 and BCS-D6 (four each). We used piezoelectric sensors (type GMuG MA-Bls-7-70) designed by the Gesellschaft für Materialprüfung und Geophysik (GMuG). These sensors are similar to those commonly used in laboratory acoustic emission experiments (e.g., Ishida, 2001) and are highly sensitive in the frequency range of 1–100 kHz, with the highest sensitivity at 70 kHz.
As seismic sources, a P- and S-wave sparker is employed in the water-filled PVC casings of boreholes BCS-D4 and BCS-D5 (in BCS-D5 for the baseline and optionally after the injection experiment). Both these boreholes are in-plane with borehole BCS-D3, thus enabling 2-D tomography within the two corresponding planes at relatively high resolution.
3.3.3 Seismic instrumentation in niche 8
To complete the seismic monitoring network (active and passive), 33 one-component geophones (Geospace Corp. Texas) were coupled to the rock behind the shotcrete in the niche. An additional network of 18 piezo-sensors (type GMuG Ma-BSL-7-70, sensitivity between 1 and 100 kHz) were set up at the surface (clamped to the niche floor) in two parallel lines along the tunnel walls. The sensor spacing is about 2 m. As the piezo-sensors do not have a well-defined instrument response due to resonance peaks that depend upon sensor design and local installation in the rock (Kwiatek et al., 2011), we combined one piezo-sensor with a calibrated one-component accelerometer (type Wilcoxon 736T) that has a flat instrument response in the range 2–17 kHz. The surface instrumentation also comprises six hammer sources installed in a parallel line along the tunnel wall that are within the plane between BCS-D3 and BCS-D4.
3.3.4 Fluid sampling and dissolved gas analysis
Two circulation modules were installed for fluid sampling in the intervals of the 6-fold packer system in borehole BCS-D2. The first circulation loop is connected to a gear pump with a flowmeter that allows fluid circulation in one selected interval from which fluid samples can be extracted and collected in stainless-steel vials maintaining, in situ pressure conditions and therefore avoiding degassing. The circulation guarantees chemical homogeneity in the interval. An EC probe (Hamilton Conducell, 1–300ms cm−1) and a pH probe (Hamilton Polilyte Plus, pH range 0–14) are also connected to the flow-through cell. Fluid major element compositions are determined using ion chromatography. Carbon isotopes in dissolved inorganic carbon are determined by isotope ratio mass spectrometry after acidification of the sample to pH < 2 to quantitatively extract the inorganic carbon as CO2 with an analytical reproducibility better than 0.2 ‰.
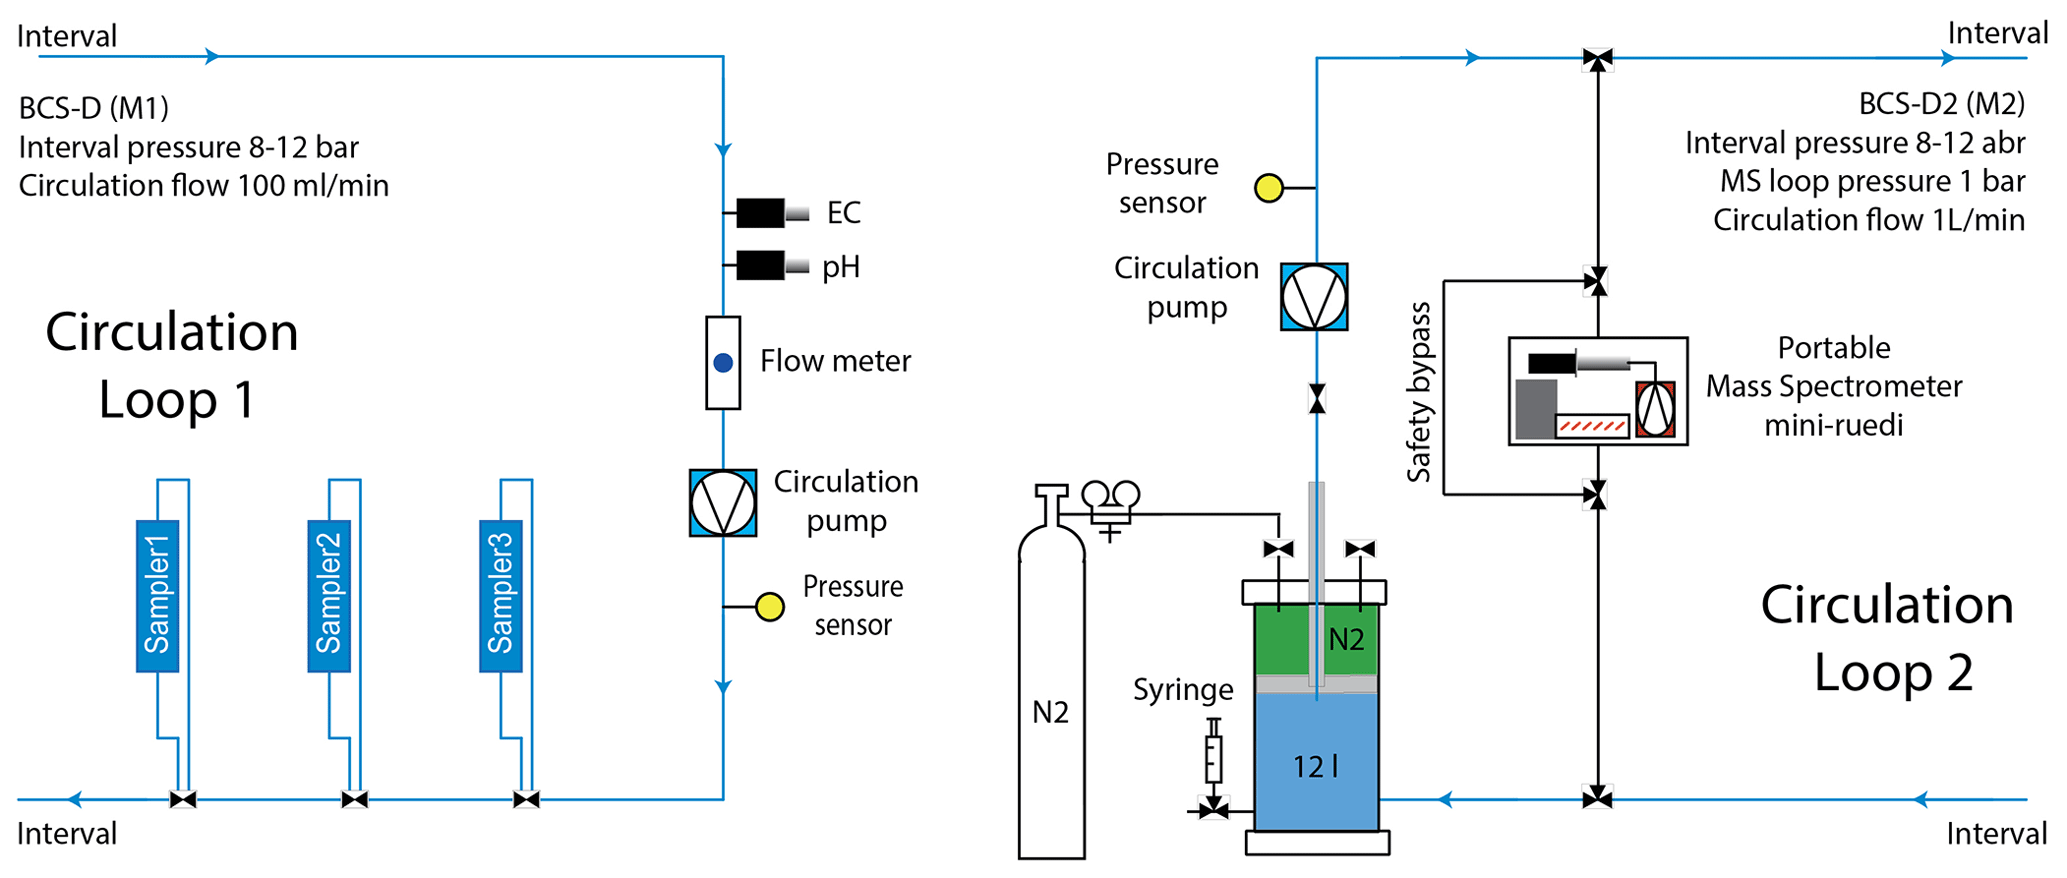
Figure 7Circulation loops for the CS-D experiment (modified after Solexperts AG, Switzerland).
A second circulation loop (Fig. 7) allows for in situ analysis of dissolved gas in the fluids in a selected interval. The measurements are performed with a portable mass spectrometer called “mini-Ruedi” (Brennwald et al., 2016; Gasometrix GmbH, Switzerland) that allows for the quantification of He, Ar, Kr, N2, O2, and CO2 partial pressure ratios with a relative analytical uncertainty of about 3 %. In addition to monitoring CO2, we aim to track the restitution of Kr that is used as an artificial conservative tracer. In this perspective, both conservative and reactive transport processes will be quantified and discussed. We also focus our attention on the evolution of natural dissolved noble gases such as dissolved He and Ar that might reveal mixing with in situ remobilized fluid (Roques et al., 2020).
3.3.5 Pressure, displacements, and water resistivity monitoring in borehole CS-D7
The CS-D experiment uses a new prototype of the SIMFIP hydromechanical borehole probe (Guglielmi et al., 2013). This new SIMFIP prototype, developed at the Lawrence Berkeley National Laboratory, has been designed for long-term borehole monitoring of micrometer fault zone displacements and eventual associated CO2 leakage. The main prototype development concerned the possibility for a SIMFIP probe to isolate a long borehole interval including an entire fault zone thickness that would have been identified from an initial borehole logging program. The MTRL, its main fault, and the CS-D project constitute the perfect site to test this new prototype at the relevant field scale.
In order to monitor the hydromechanical behavior of the entire fault zone, a 6.3 m long SIMFIP interval has been designed and sealed by two 0.9 m long inflatable packers. In this configuration, the SIMFIP sensor measures the relative displacement of the upper packer, with the lower packer considered fixed. The packers play two roles: sealing the interval to isolate fault zone pore pressure variations and anchoring the SIMFIP sensor to measure the displacement of the fault hanging wall relative to the footwall. A compass set above the upper packer allows for orienting the displacement measurements. The SIMFIP sensor is a 0.49 m long and 0.1 m diameter precalibrated aluminum cage set on the tube connecting the two packers. When the fault straddled by the packers' interval is deforming, the cage allows for obtaining angle-dependent strain measurements, which can be used to constrain the full three-dimensional displacement tensor and the three rotations of the upper packer relative to the lower packer.
Borehole pressures are monitored below the lower packer, between the packers, and above the upper packer. Water resistivity electrodes have been distributed every 5.54 cm along the entire length of the SIMFIP chamber in order to localize where leaks would possibly occur from the fault zone into the borehole. It was assumed that, for example, a dissolved CO2 leak would slightly change the formation water resistivity enough to be detected by the resistivity probe. After several months of tests and monitoring, measurement sensitivities are 10−6 m for displacements and 10−3 Pa for pore pressure (paragraph 4.4). A remote control allows for programming the SIMFIP and, for example, varying the sampling rate from 1 Hz to 1 kHz depending on the testing protocol.
4.1 Main fault geometry from cores and logs
All boreholes were cored with exception of BCS-D4. Cores were recovered with a double-barrel technique, with the exception of D1 where the main fault section has been cored with a triple-barrel technique. Core recovery was higher than 90 %. The boreholes were logged with an oriented optical borehole televiewer, total count natural gamma rays, dual induction, and callipers (four arms in vertical boreholes and a single arm in inclined boreholes). A cross-analysis of the cores and of the logs allowed for the accurate reconstruction of the oriented geological log for each borehole. The position of the instrumentation in injection and fluid-monitoring boreholes was then decided based on the fault depth.
Table 2Main fault geometry. Top: top of the main fault (middle point), bottom: bottom of the main fault (middle point), dip dir: direction from true north; due to poor image log quality in BCS-D3, no orientation could be identified.
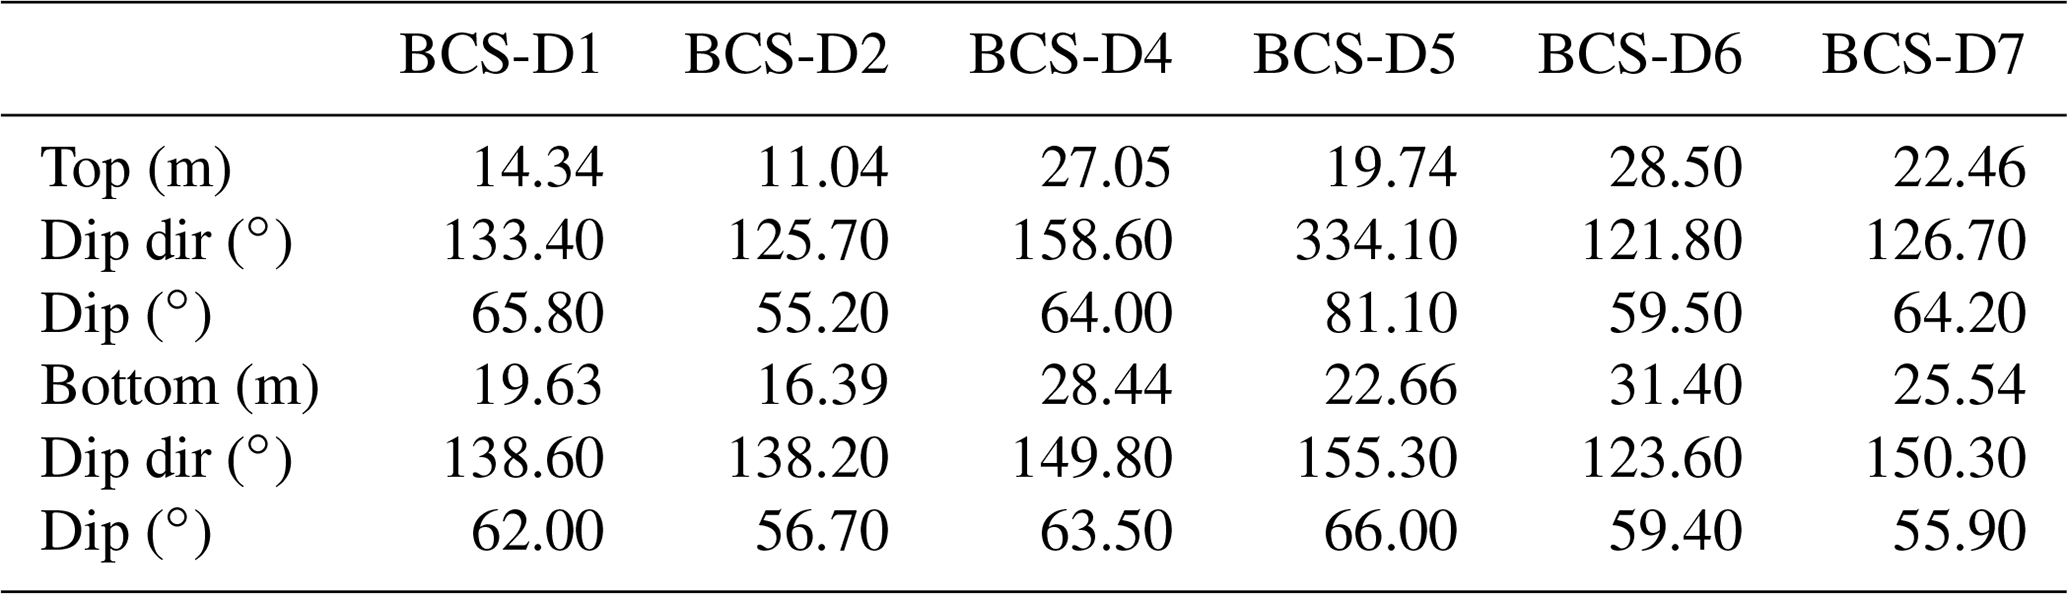
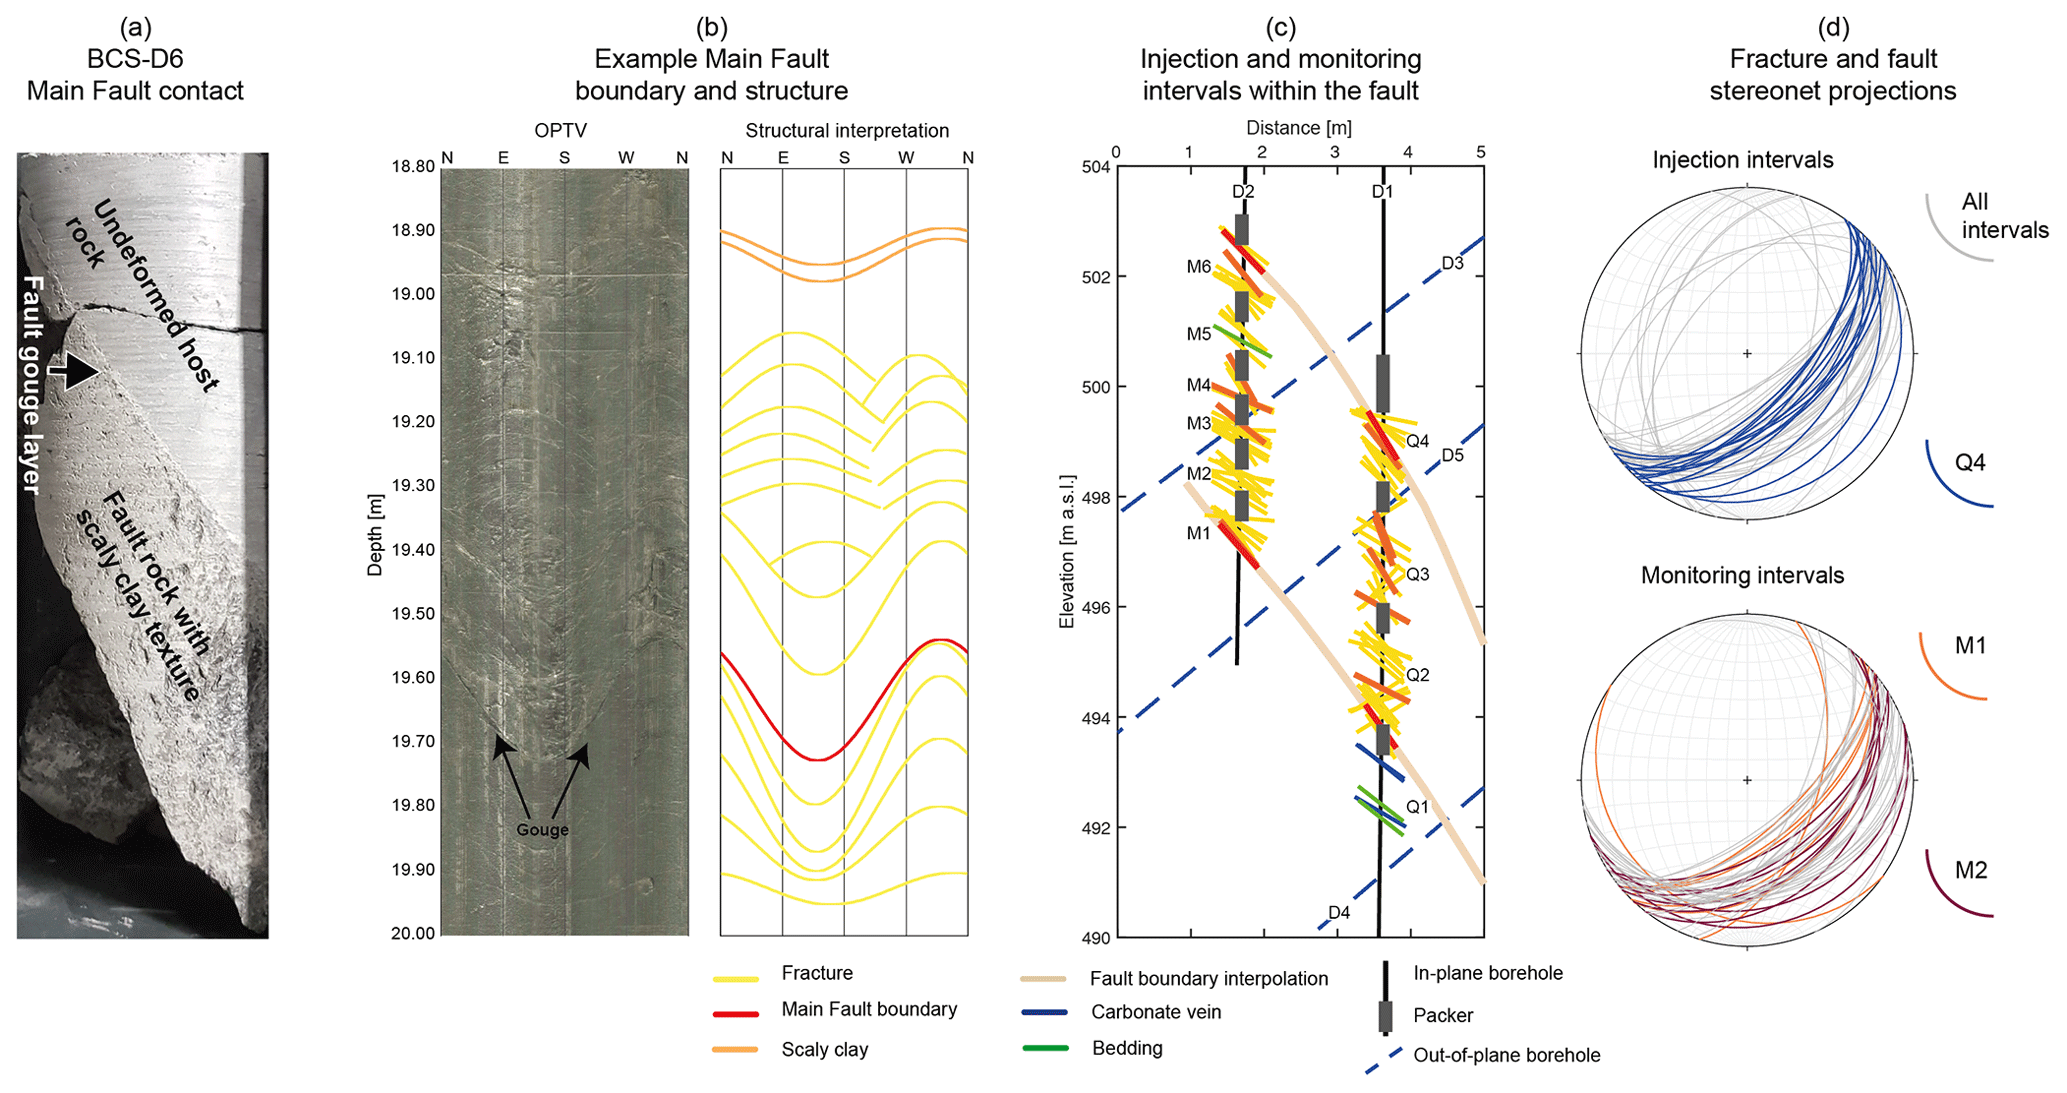
Figure 8(a) An example image log of the contact between the main fault and the host rock is shown. (b) An example of the contact between the host rock and the main fault from the core. (c) Injection and monitoring intervals and mapped structures within the main fault boundaries. (d) Fracture and fault stereonet projections within the injection borehole (top) and monitoring borehole (bottom). The stereonets highlight all the structures within the main fault (grey) and the structures from the injection interval Q4 (blue), monitoring interval M1 (orange), and monitoring interval M2 (red).
The bedding is uniform on both sides of the fault, with a mean orientation striking N053∘ and a dip of 46∘ SE. A top and a base plane, both clearly identified in cores and image logs (Fig. 8a, b), spaced ca. 1.5 to 3 m define the main fault. In the core there is a sharp discontinuity between undeformed bedding and highly deformed scaly clay material that consists of a tangled web of slickensides bounding largely unaltered microlithons (Jaeggi et al., 2017); it is also visible in the image logs. Table 2 displays the depth and orientation of the top and bottom of the main fault in all boreholes from image log analysis. The top and bottom of the main fault plane within our study area are variable, with typical strike oriented N031–068∘ and dipping 56–65∘ SE. In borehole BCS-D5, the top of the fault has a very steep dip, which is nearly vertical or perhaps overturned. The fault material between these two planes is heterogeneous, including zones with fault gouge, C'-type shear bands, mesoscale folds, microfolds, numerous fault planes, apparently undisturbed parts, and a “scaly” fabric on which the rock splits progressively into smaller fish-like flakes. Moreover, sparse and discontinuous secondary fault planes have been observed above and below the main fault.
There are numerous fractures and faults within the main fault. The locations of the injection (BCS-D1) and monitoring (BCS-D2) intervals within the main fault are depicted in Fig. 8c. Within the injection borehole there are fractures with an orientation similar to the main fault and a set with a conjugate orientation (Fig. 8b, d). Borehole injection tests revealed a pressure response in monitoring intervals M1 and M2 (see the nomenclature of intervals in Fig. 8c) when injecting from injection interval Q4. As such, the structures within these intervals are highlighted in Fig. 8d. While we observe northward-dipping fractures that might be connected to the Q4 and M1–M2 intervals in other parts of the borehole, these fractures are not directly observed in these intervals.
Core pieces longer than 10 cm were sampled and sealed after undergoing an on-site quality control (i.e., no open fractures, no drilling-induced features). Samples were wrapped in barrier foil aluminum laminate and vacuum-sealed to limit contact with air. Samples were labeled with respect to the borehole name and order number. For samples that contain fault zone or carbonate lenses, this property is also written beside the sample name on the label. After sealing and labeling samples were stored in a wooden box and shipped to ETH Zurich. Studies of multi-flow transport in fractured rock and geomechanical characterization of the fault and host rock from the CS-D site have been developed in laboratories at Imperial College London, ETH, and EPFL (Wenning et al., 2019a, 2021; Minardi et al., 2020).
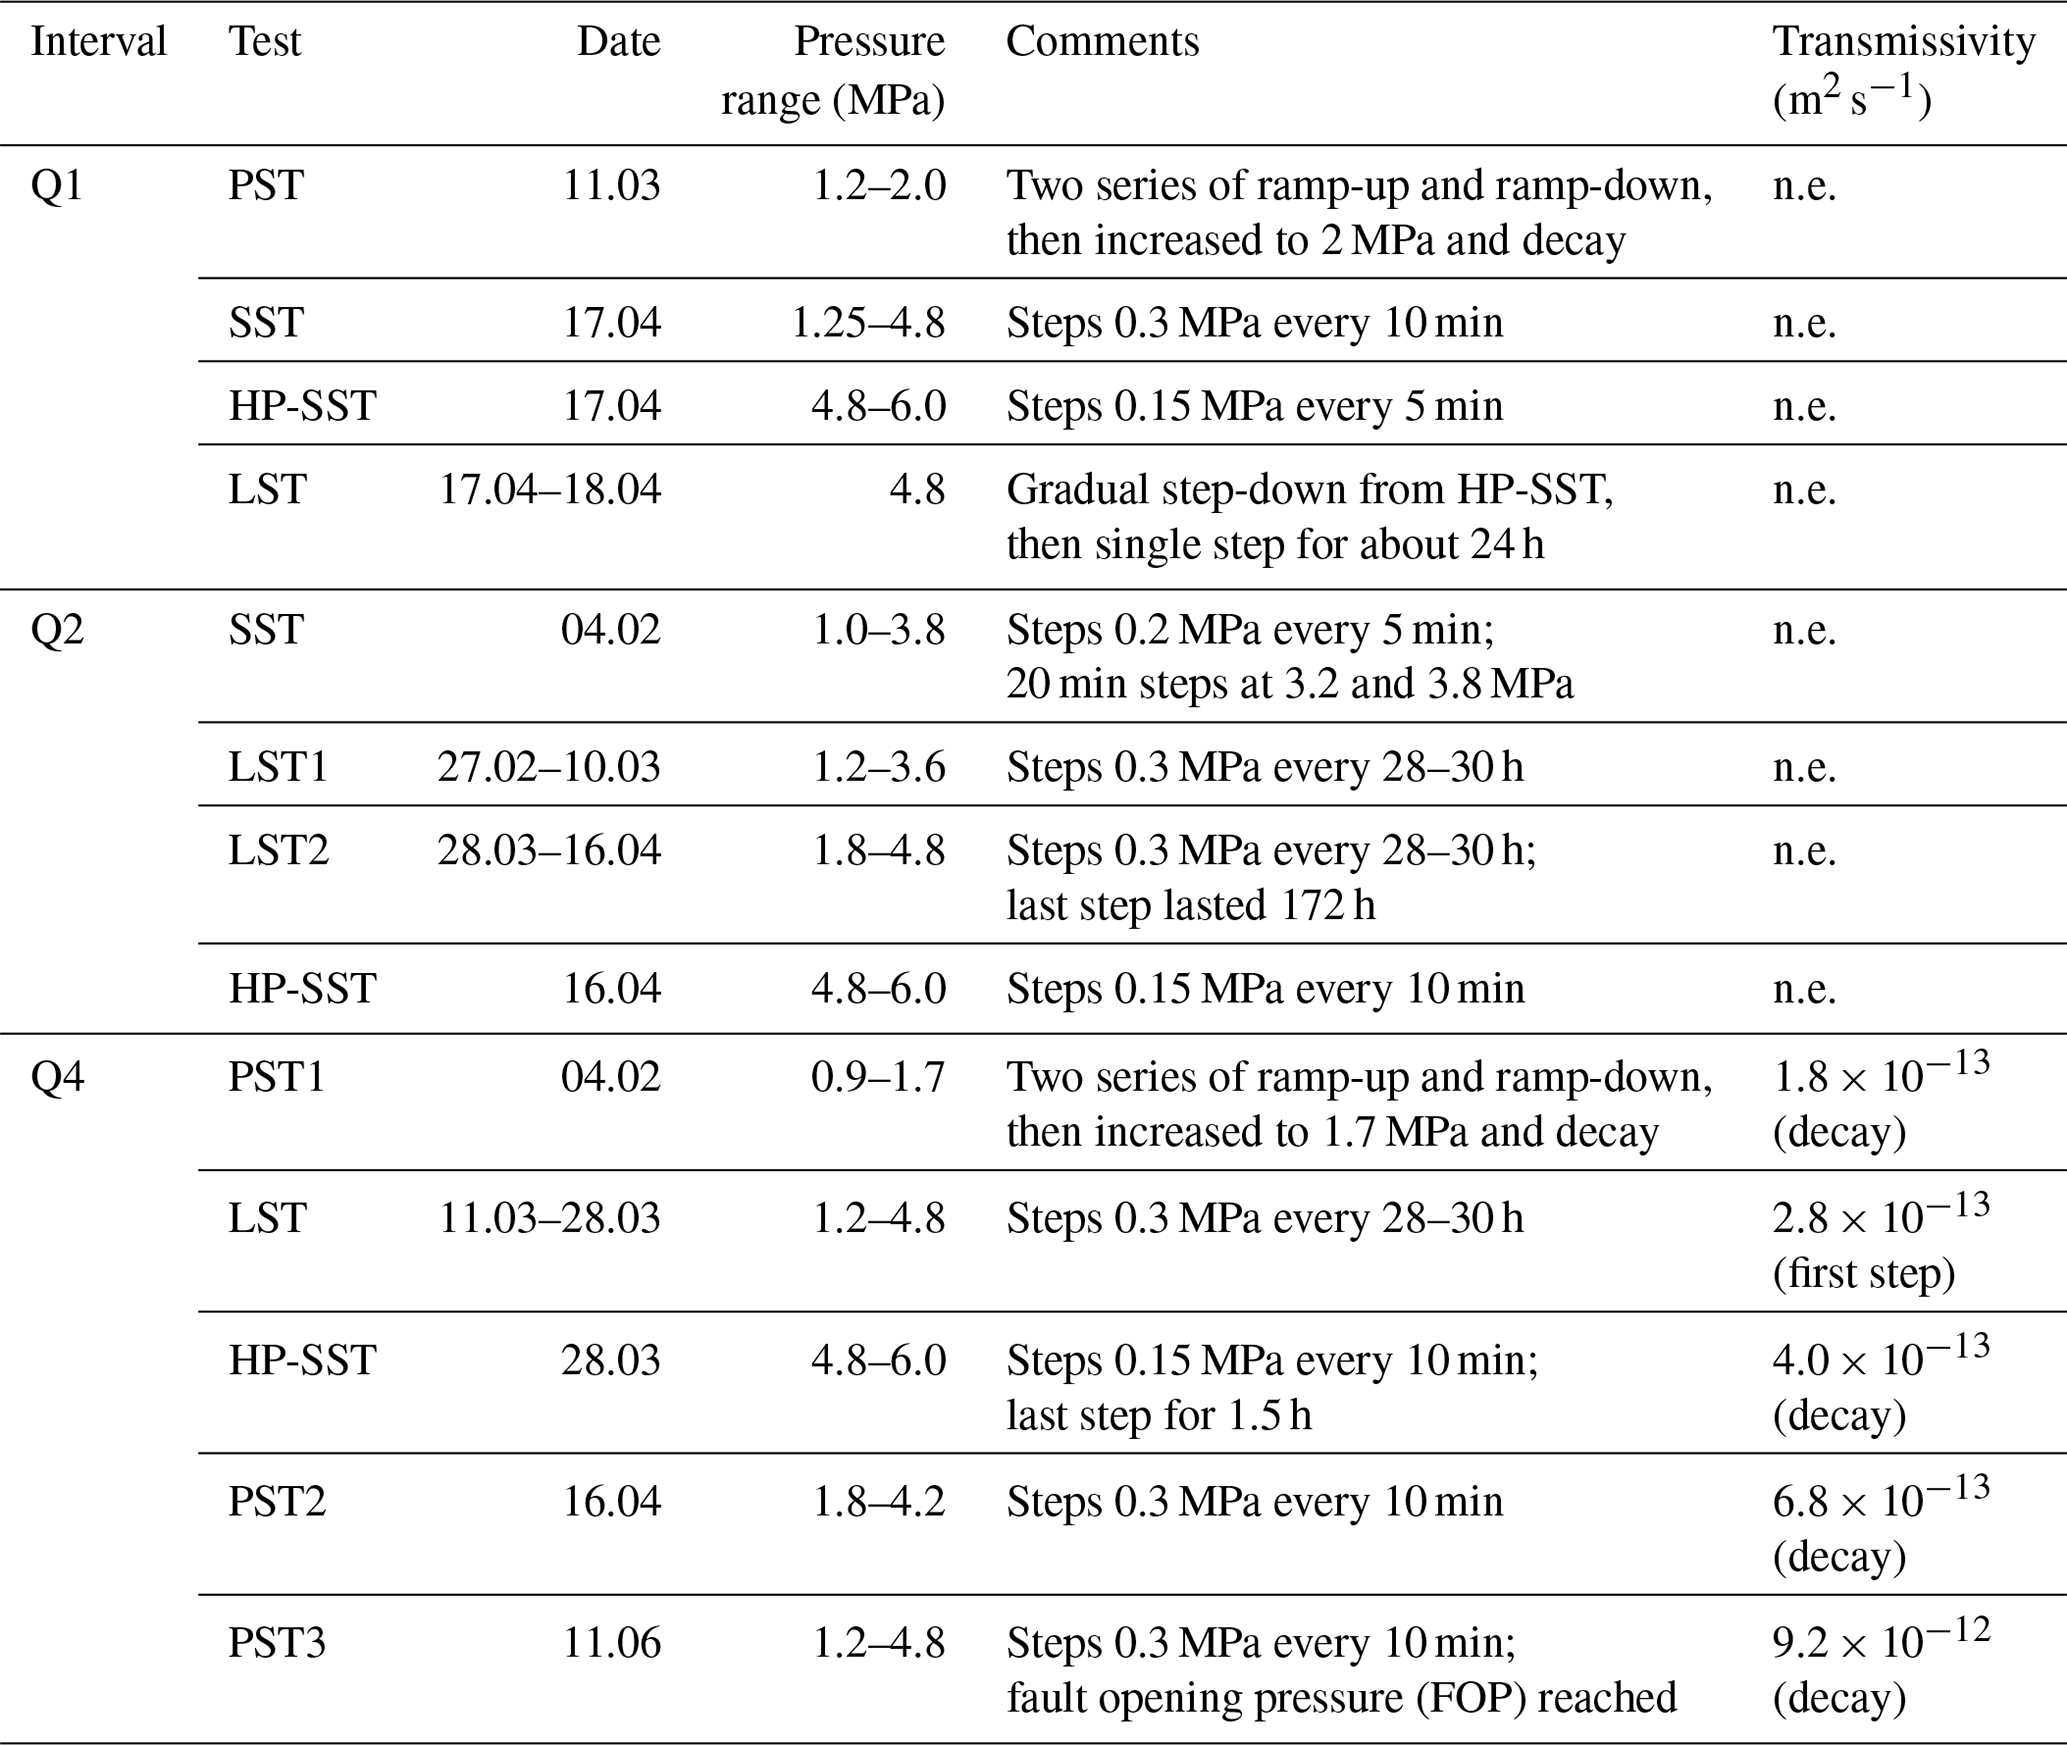
Table 3Summary of all injection tests performed. Transmissivity has been estimated only for tests in injection interval Q4 of borehole BCS-D1 (n.e.: not estimated). We calculated transmissivity only for this interval, as only when injection occurred here was there a response in the monitoring borehole (BCS-D2). Note that the transmissivity was always estimated by modeling the injection pressure and never as a cross-hole response.
4.2 Hydraulic characterization
We performed several injection tests to estimate the hydraulic properties and opening pressure (FOP) of the fault zone. These tests were essential to identify which intervals would be the best candidates for injection and monitoring. Injection always occurred in intervals of the BCS-D1 borehole. The different tests are reported in Table 3 and include the following:
-
a long step test at constant head with 28–30 h of inter-step time (LST);
-
a short step test at constant head with 5–10 min of inter-step time (SST);
-
a high-pressure short step up test at constant head with 5–10 min of inter-step time (HP-SST – these tests were usually performed after an LST); and
-
a pulse step test with the pump stopped after reaching the desired pressure then a 10 min decay before a new step (PST).
While we carried out the tests in several intervals (Q1, Q2, Q4), we performed the analysis only on interval Q4, which is the shallowest interval in the injection borehole (BCS-D1) and which is the one finally chosen for the CO2-saturated water injection in phase 2. Our tests gave first-order estimates of the initial transmissivity of the fault zone from this interval. Figure 9 shows the results of an LST in interval Q4; only when injecting in this interval did we observe a hydraulic response in the fluid-monitoring borehole (BCS-D2). This was critical information to decide the injection interval for the phase 2 injection. Figures 5a (insert) and 9a show a schematic (plane view) of the distance between the interval Q4 and two monitoring intervals (M1 and M5). Quite interestingly, when injecting in Q4, only the bottom intervals of the fluid-monitoring boreholes show pressure variation (e.g., M1 less than 0.1 MPa; Fig. 9b, red curve), while all the others show no variation (e.g., M5; Fig. 9b, green curve). We note that the flow rate never reaches steady conditions for all the steps performed in the analyzed test (Fig. 9c).
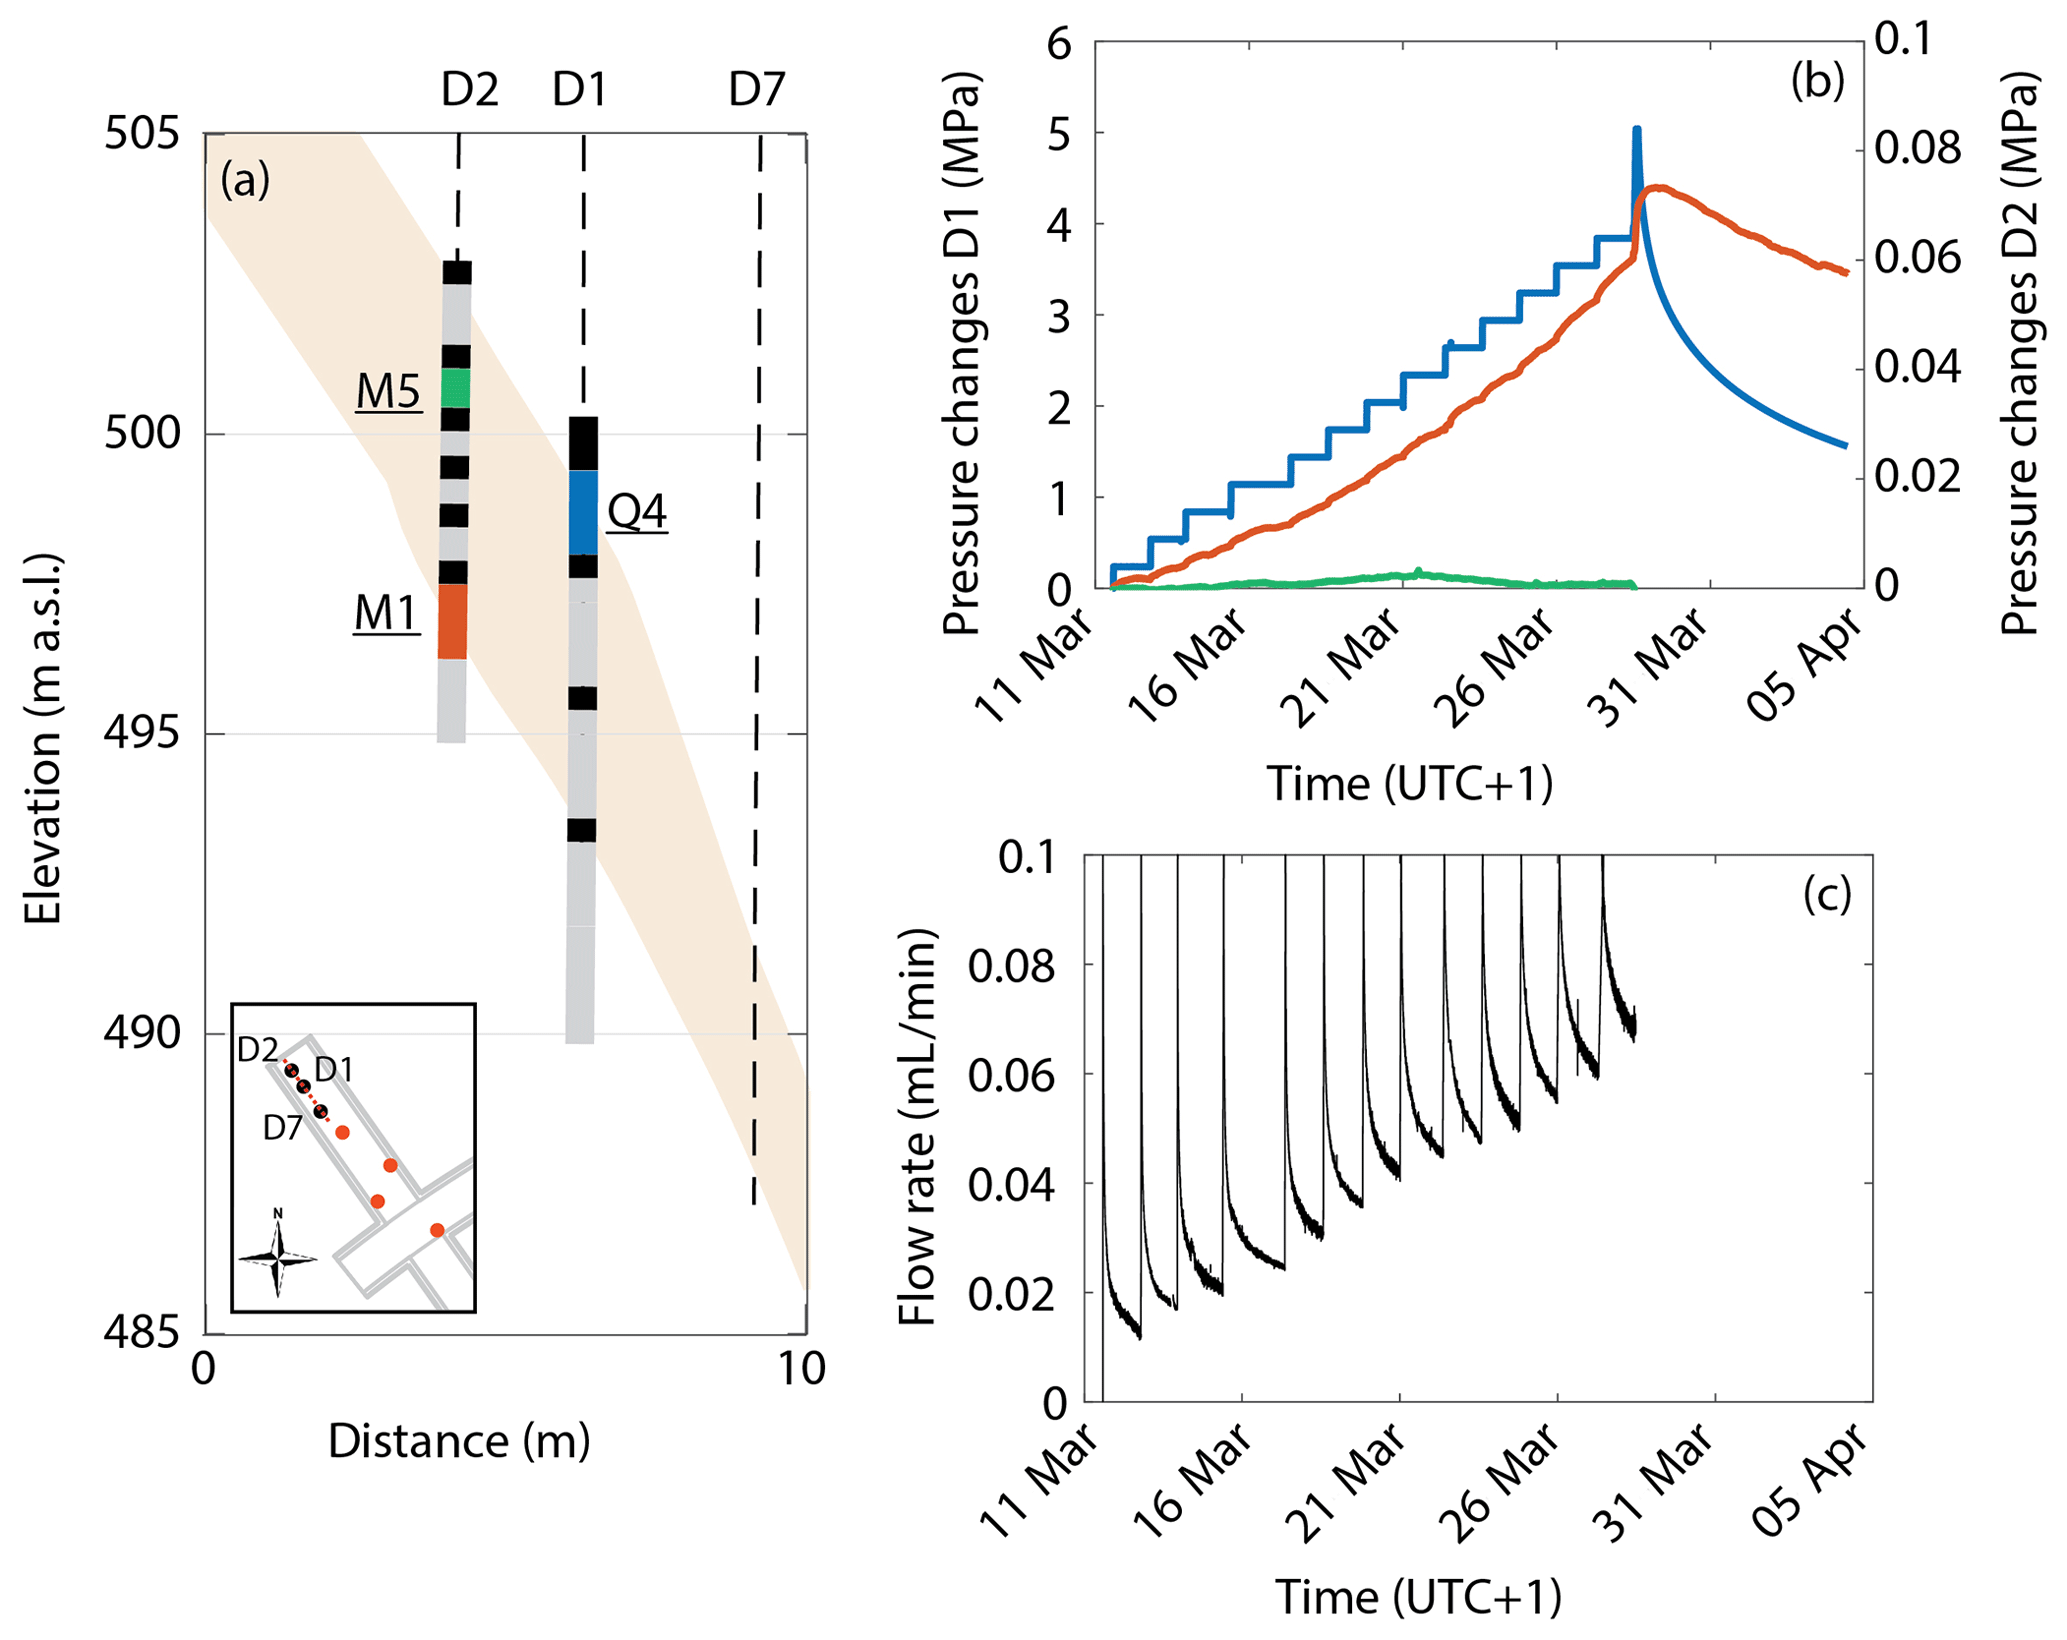
Figure 9(a) Projection on plane of boreholes BCS-D1 and BCS-D2 and their intervals. The inlet shows the location of the boreholes and the orientation of the plane. (b) Pressure changes in the injection interval Q4 (blue) and response at two intervals in the fluid-monitoring borehole (M1 in red and M5 in green). The positions of the monitor intervals with respect to the injection interval are shown in (a). (c) Flow rate at the syringe pump.
The transmissivity of the fault zone was estimated by analyzing a pulse test (also performed in interval Q4) with a Cooper–Bredehoeft–Papadopulos–Neuzil model (Cooper at al., 1967; Neuzil, 1982; Renard, 2017). Figure 10a–b show the pressure variation and the comparison with the model that result in a transmissivity of 1.8 × 10⁻¹³ m2 s−1. In the model, the pressure decay is normalized to the peak, and both pressure variation and its derivative are used to estimate transmissivity. We discarded the first 30 s of data as these could be influenced by interval storage. For this model, the compressibility of the system was estimated given the injected volume to reach the peak pressure (1.7 MPa). A similar value of transmissivity (2.8 × 10⁻¹³ m2 s−1) is obtained by analyzing the first step of the LST (Fig. 10c–d) with a Jacob and Lohman model (Renard, 2017). For this model, only the flow rate is used to estimate the transmissivity. As above, we discarded the first seconds of data as these are strongly affected by the interval volume and near-borehole skin effects.
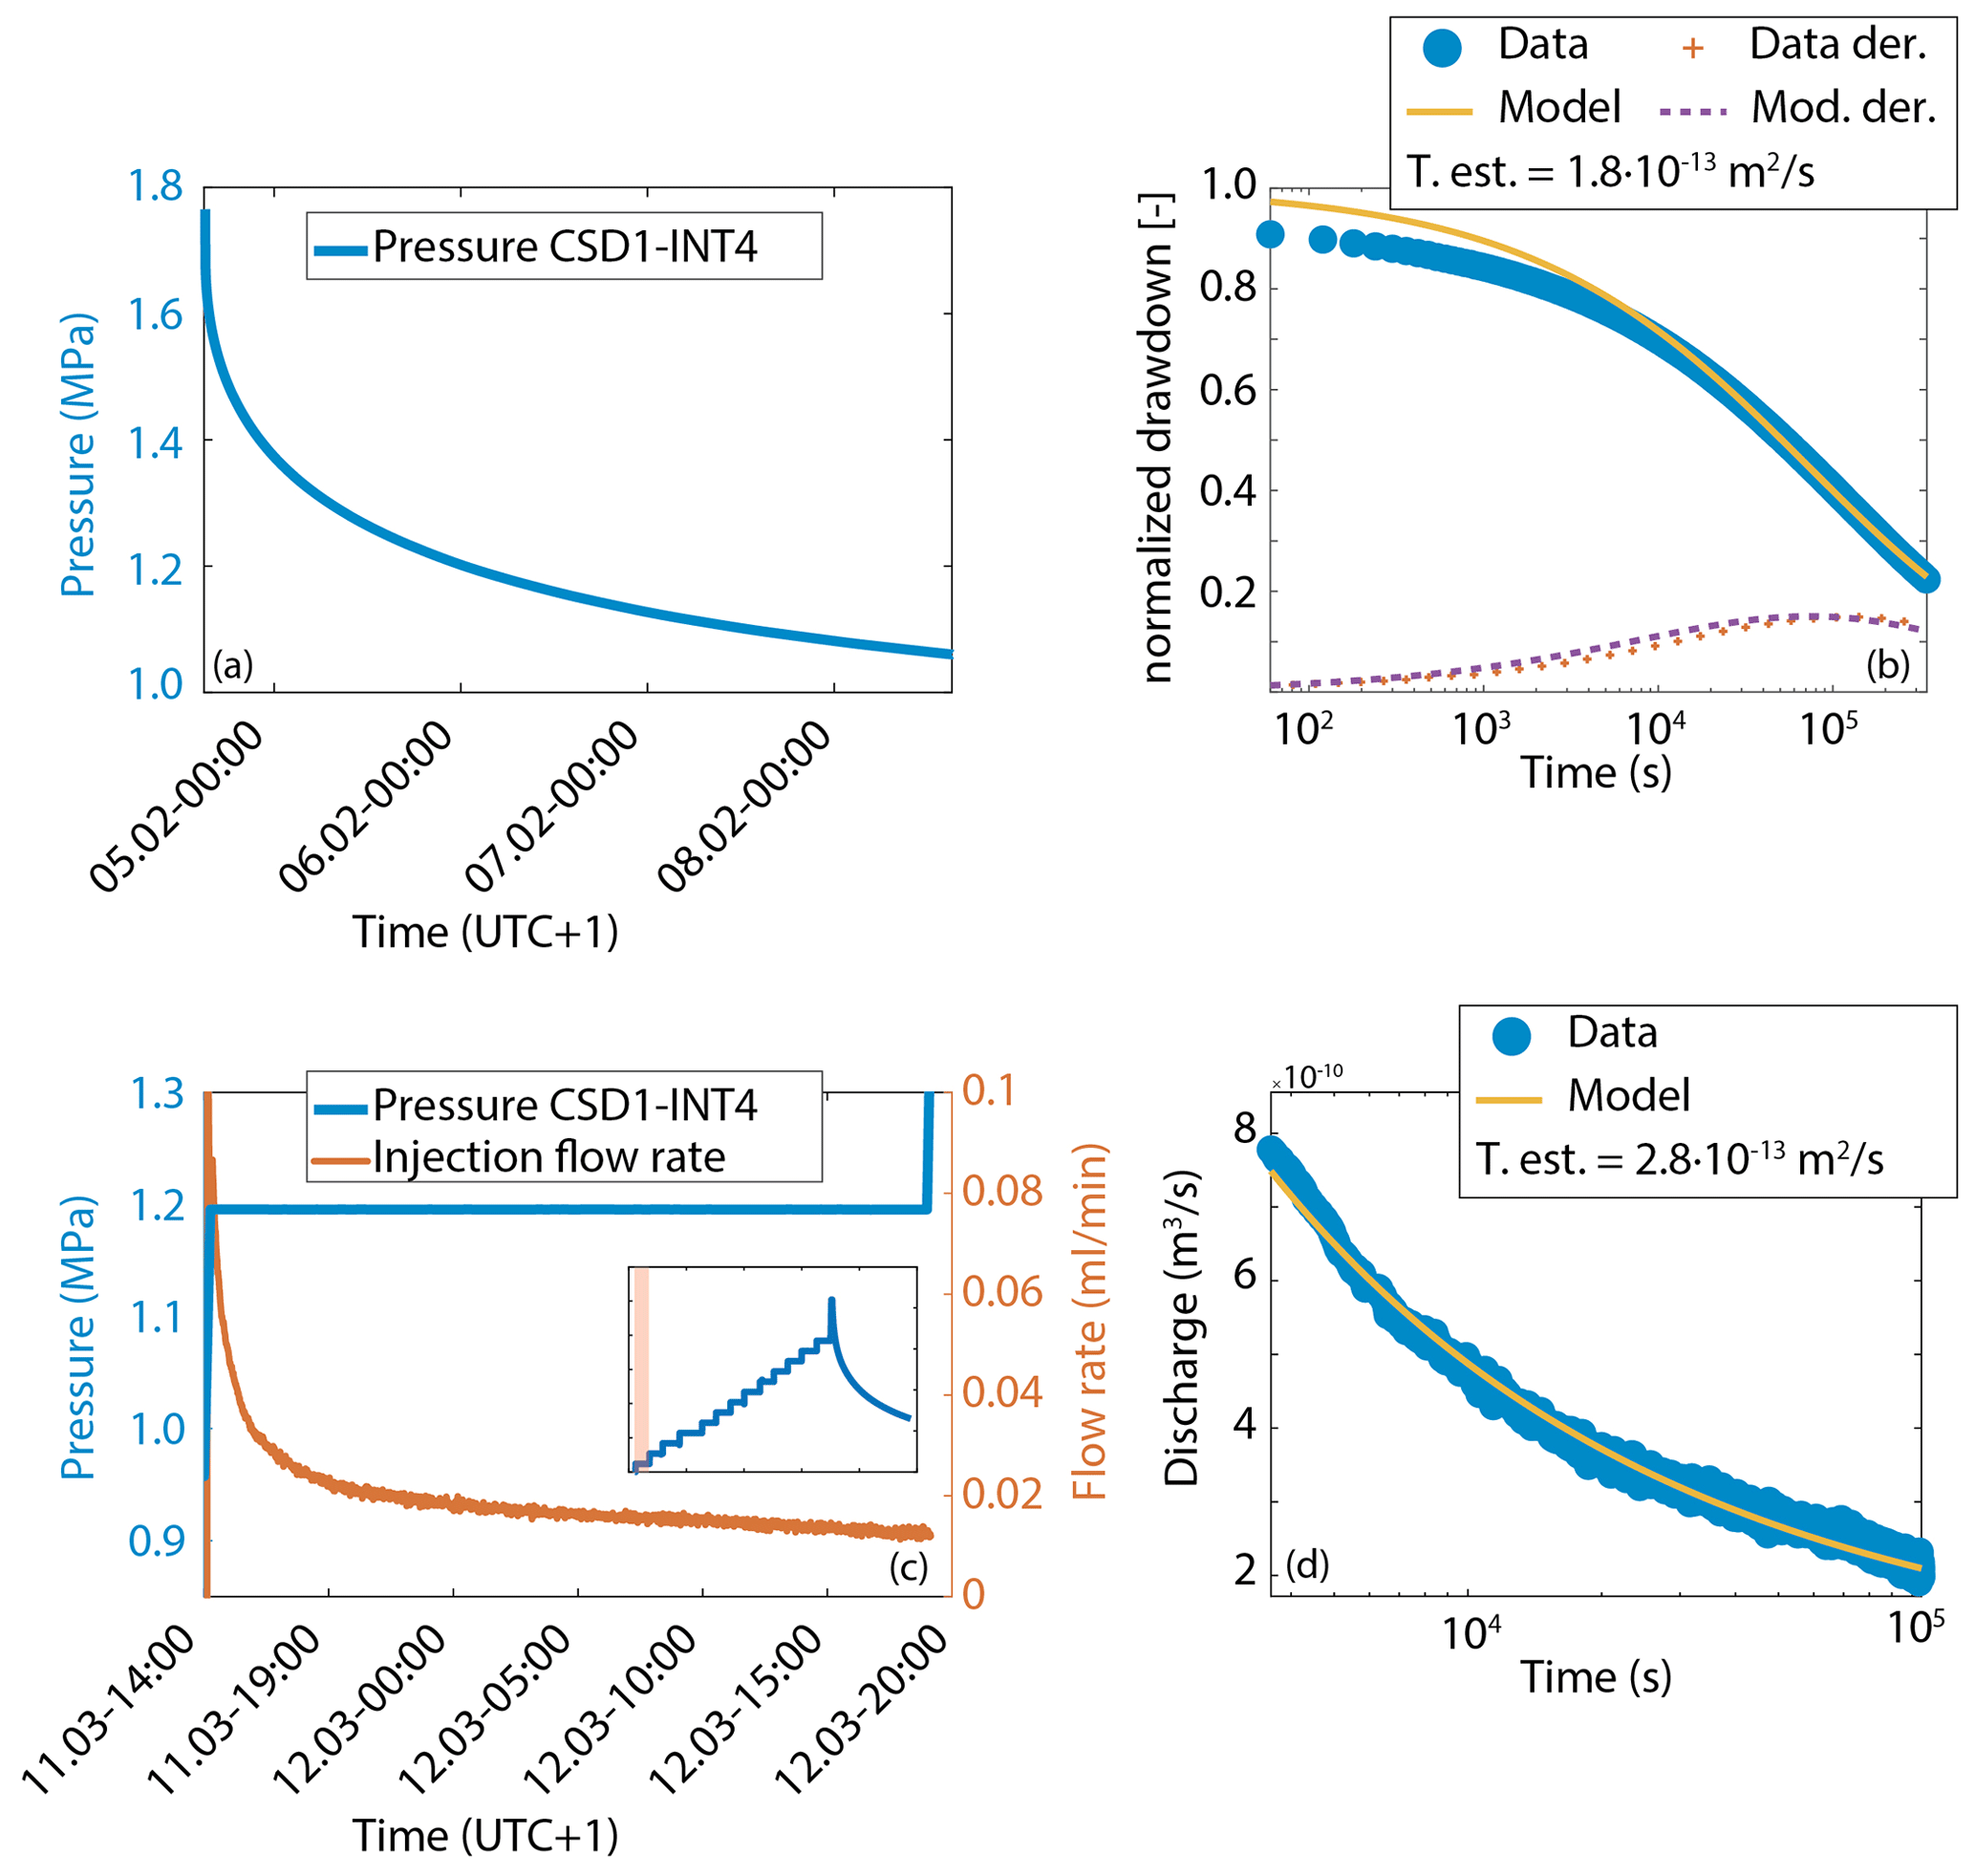
Figure 10(a) Pressure decay after pulse in interval BCS-D1–Q4 (PST1). (b) Analytical model and model derivative for pressure decay (Renard, 2017) and estimated transmissivity. (c) First step of the test LST in interval BCS-D1–Q4 (red is the flow rate, blue the pressure at injection). (d) Analytical model of discharge (Renard, 2017) and estimated transmissivity.
4.3 Fault opening pressure
The fault opening pressure (FOP) in interval Q4 was determined prior to starting the long-term injection with CO2-saturated water in phase 2. During the PST, the pressure was increased in steps of 0.3 MPa and shut in after reaching the desired pressure. Figure 11a shows the pressure recorded at the injection interval (BCS-D1–Q4). Figure 11b shows an enlargement of the recorded pressure when the pressure drop was more consistent. Figure 11c shows the pressure difference after 10 min of waiting time compared to the injection pressure. The pressure response was nonlinear when injection pressure was raised above 4.5 MPa. The large steps (0.3 MPa) employed do not allow for a precise measure of the FOP, but we can conclude that it is in the range 4.5–4.8 MPa. We performed this test only in injection interval Q4 because it was the only interval showing a pressure response in the monitoring borehole. After reaching this “reactivation”, we started the long-term CO2-saturated fluid injection below the FOP at a constant pressure of 4.5 MPa. An analysis of the decay curve from 4.8 MPa with a Cooper–Neuzil model (Renard, 2017) results in an estimated transmissivity of 9.2 × 10⁻¹² m2 s−1, which is more than 1 order magnitude larger compared to previous estimates (see above). It is worth noting that for the estimate, we considered only the last step and analyzed the decay from considering the previous step pressure (i.e., from 4.8 to 4.5 MPa).
4.4 Borehole stability monitoring in BCS-D7
The SIMFIP probe was installed in the borehole immediately after drilling on October 2018. Figure 12a shows the location of the probe across the fault zone. The installation phase was followed by a period of tuning the packers' pressure until 19 December. Figure 12b–d show the results of the first 5-month monitoring period, with the packer testing phase highlighted by the red shaded area. The main issue was to maintain the packer pressure as constant. For example, during November 2018, packers exhibited a slow deflation that required several manual re-inflations. The problem was fixed in late December 2018 by installing an automatic control of the packer pressure. The four periods of packer pressure variations on 10 and 16 January, 1 February, and 27 March correspond to complementary manual adjustments of the packer system. This probe is equipped with sliding-end packers in order to ensure an optimal sealing of the isolated interval. The dimension of the interval evolves in response to the pressure variation and to the consequent deformation of the clay walls. The control of the packers' response is therefore crucial. Because the packers slide while their pressure is varying, the chamber pressure and the displacement measurements (since the SIMFIP is anchored with the packers; Fig. 11d) also vary. The packers' pressure increase induces a chamber pressure decrease, a SIMFIP vertical extension (positive Dz variation), and an equal radial displacement (EW = −NS; see, for example, February 2019; Fig. 12d). This response matches laboratory calibrations, and thus any deviation from them observed in the field might highlight a true hydromechanical evolution of the formation.
Interestingly, the chamber pressure increased by 0.2 MPa during the first month after installation. This period (red shaded area in Fig. 11b–d) could be interpreted as a stress relaxation after borehole drilling. Then, from early December to February, pressure decreased, indicating a potential coupled hydromechanical relaxation (orange shaded area in Fig. 11b–d). Finally, in February 2019 the pressure in the SIMFIP stabilized at about the initial pressurization (∼ 0.3 MPa) (green shaded area in Fig. 11b–d). These long-term pressure variations are not clearly related to the packer effect (although the influence of the packers is observed over shorter periods). Both variations thus relate to the complex borehole pressure equilibration with formation pressure, which occurred in about 5 months. Displacement variations followed these long-term pressure variations. Displacement amplitudes are from 0.3 to 1 mm, with the norm of the displacement vector being estimated at 0.95 mm in March 2019 after 5 months of monitoring (more than 70 % of the displacement occurred after about 1.5 months). These values are in reasonable accordance with strain relaxation effects associated with borehole or gallery excavation observed in other Mont Terri experiments (Amann et al., 2017). The SIMFIP data exhibit displacement variations in all three EW, NS, and Z directions, thus highlighting the three-dimensional characteristics of such relaxation effects.
The pressure in the interval, pressure in the packer, and displacement have been overall constant since then, with some gaps due to on-site operation in April 2019 (grey shaded area in Fig. 11b–d). Starting from April 2019, the effect of a nearby tunnel excavation is visible on the probe up to a maximum displacement of about 0.2 mm (Rinaldi et al., 2020).
The accuracy of the SIMFIP is shown in detail in Fig. 12e and f. The figure refers to data taken during the LST test in the same time window shown in Fig. 9. The relative and detrended displacement is measured with a delta of about 1 µm (Fig. 12e); after a more accurate calibration of the packer pressure, the delta is reduced to less than 0.5 µm (Fig. 12f).
4.5 Seismic characterization
Active seismic baseline measurements were conducted in January 2019 before the first injection test. They were repeated on 11 June 2019 before the start of the long-term injection. These baseline measurements were performed with hammer sources applied to the gallery floor and with a seismic sparker source employed in boreholes BCS-D4 and BCS-D5, while all geophones and piezo-electric transducers installed in boreholes and in the gallery were recording. Example data are shown in Fig. 13. They have been recorded with a geophone cemented in borehole BCS-D3, while the sparker source was fired in 25 cm intervals in borehole BCS-D4. It shows a clear P-wave arrival (A), which is slightly delayed for sources fired within the main fault (B). Additionally, slow and fast S-wave modes can be identified (C), and strong linear events, which are caused by tube waves propagating along the source borehole (D), are reflected at the main fault (F).
The data shown in Fig. 13 have been processed using the following steps:
-
median filter (subtraction of median amplitude of entire trace, removing a constant shift from the signal);
-
bandpass filter;
-
zero-time correction by cross-correlation of recorded trigger signals; and
-
trace stacking of 5–10 repeated shots.
For characterizing the seismic P-wave velocity (VP) structure in the region of the CS-D experiment, two-dimensional P-wave travel-time tomography was carried out within planes between boreholes BCS-D3 and BCS-D4 as well as between boreholes BCS-D3 and BCS-D5. Here we show the tomogram measured with a P-wave sparker source from borehole BCS-D4 and with the cemented geophone array in borehole BCS-D3. The tomographic imaging involved the following procedure:
-
automatic picking of first arrival times;
-
picking refinement with cross-correlation (e.g., Schopper et al., 2020);
-
anisotropy correction; and
-
iterative travel-time inversion (after Lanz et al., 1998).
The clay bedding, along which the VP attains maximum values, is oriented normal to the tomographic planes. Therefore, it was assumed that no off-plane effects occur due to the VP anisotropy. Anisotropic effects within the tomographic plane were minimized by normalizing the travel times. This travel-time normalization is displayed in Fig. 14, where prior to normalization (a) VP along the bedding plane reaches values of approximately 2870 m s−1, and extrapolating to angles normal to the bedding planes yields VP≈2280 (Fig. 14a). This leads to an overall VP anisotropy coefficient of . After normalization of travel times, normalized P-wave velocities VP,n are around 2580 m s−1 on average (Fig. 14b).
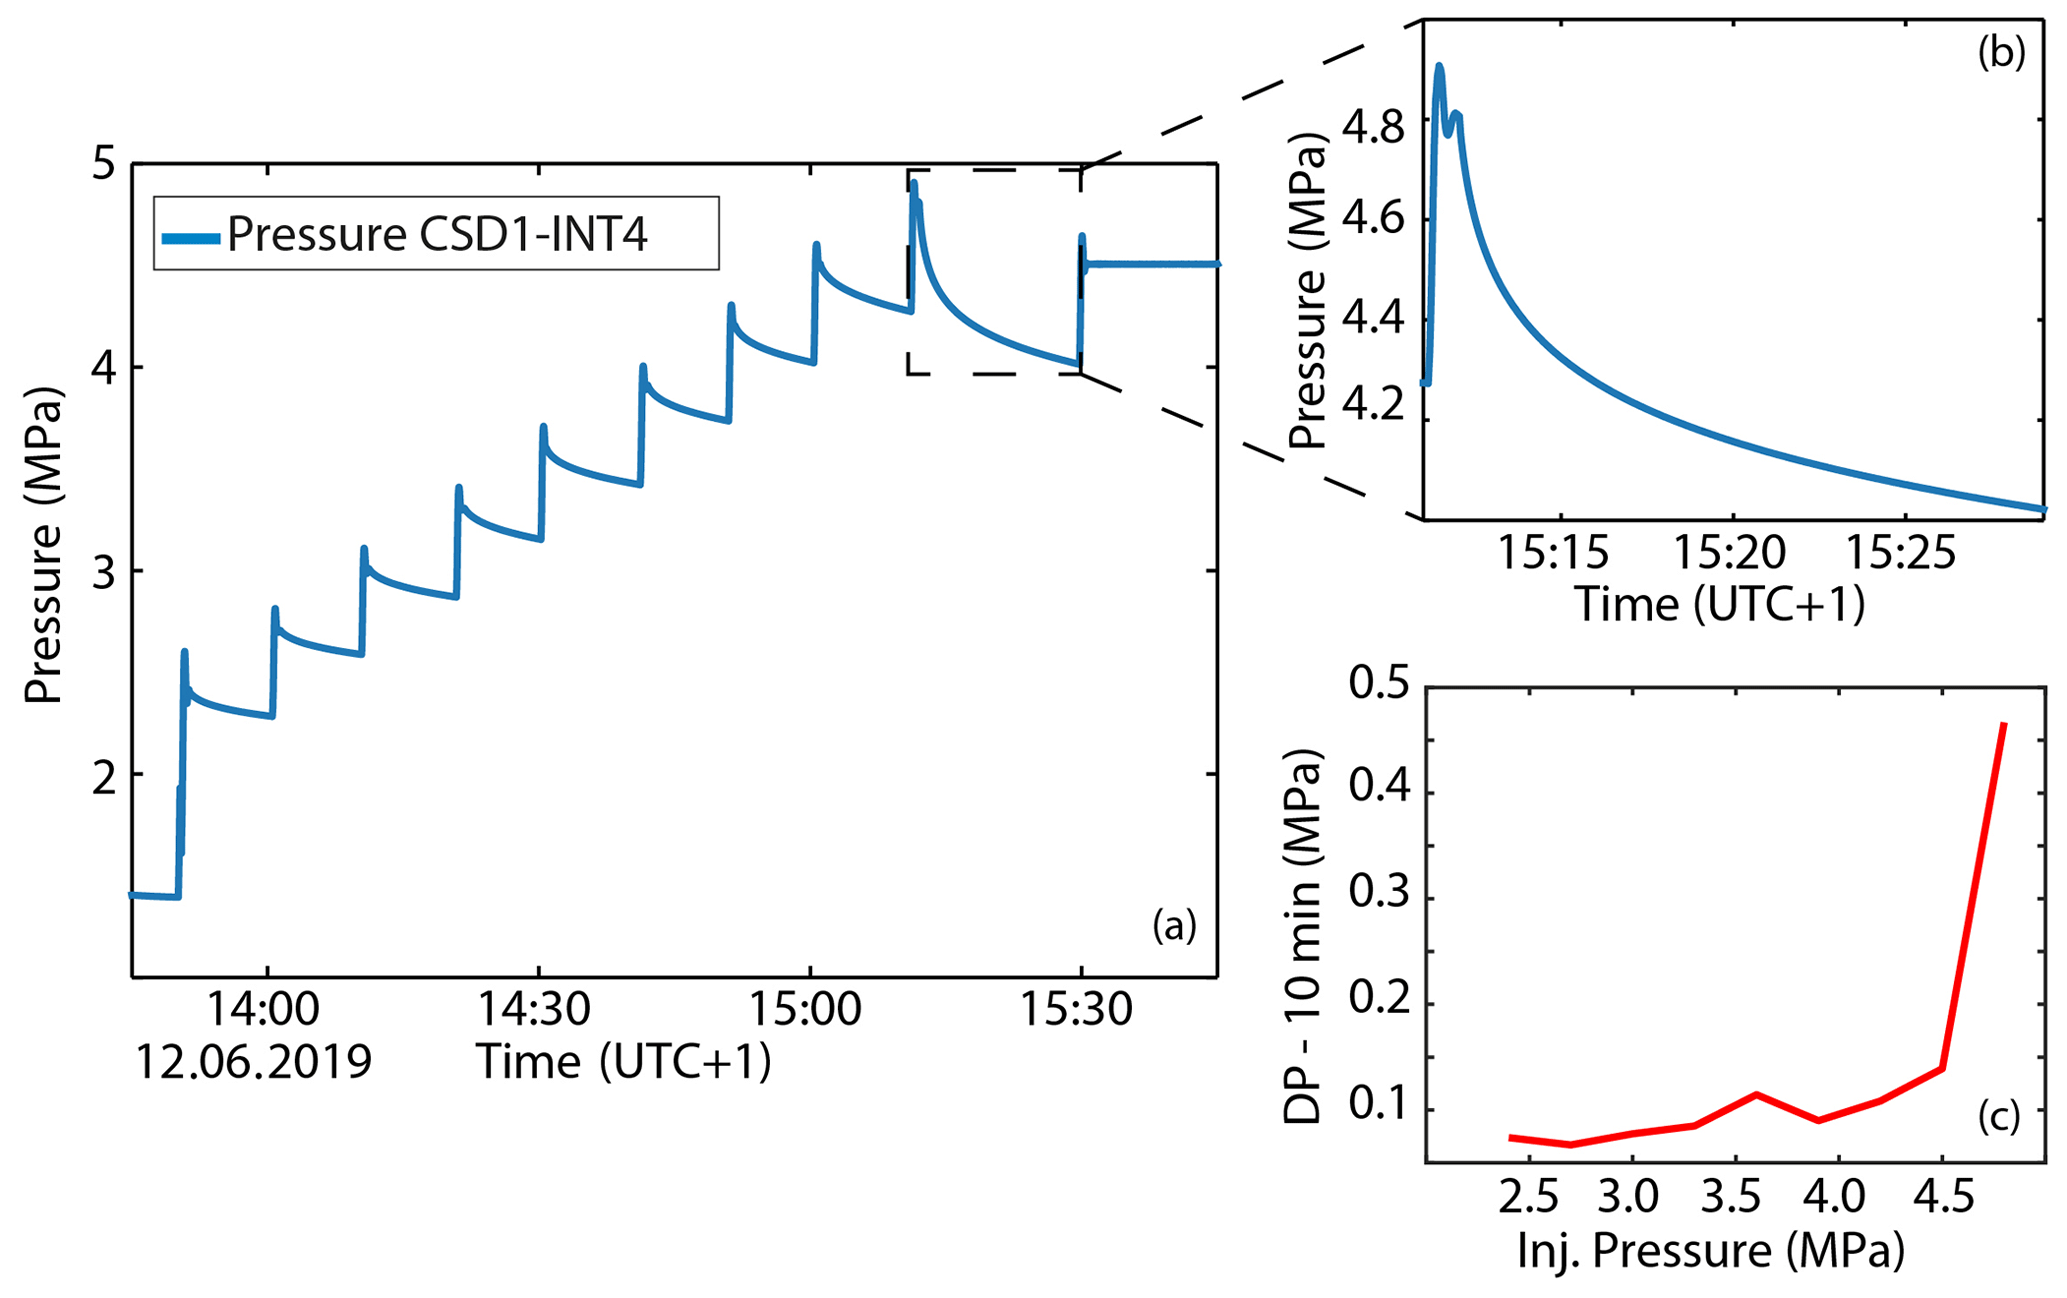
Figure 11(a) PST in interval BCS-D1–Q4 to determine fault opening pressure (FOP). (b) Enlarged view of the pressure drop after reaching opening conditions; note that the decay curve is much larger when the FOP is reached. (c) Pressure changes after the 10 min step vs. injection pressure: the system is nonlinear above 4.5 MPa injection pressure.
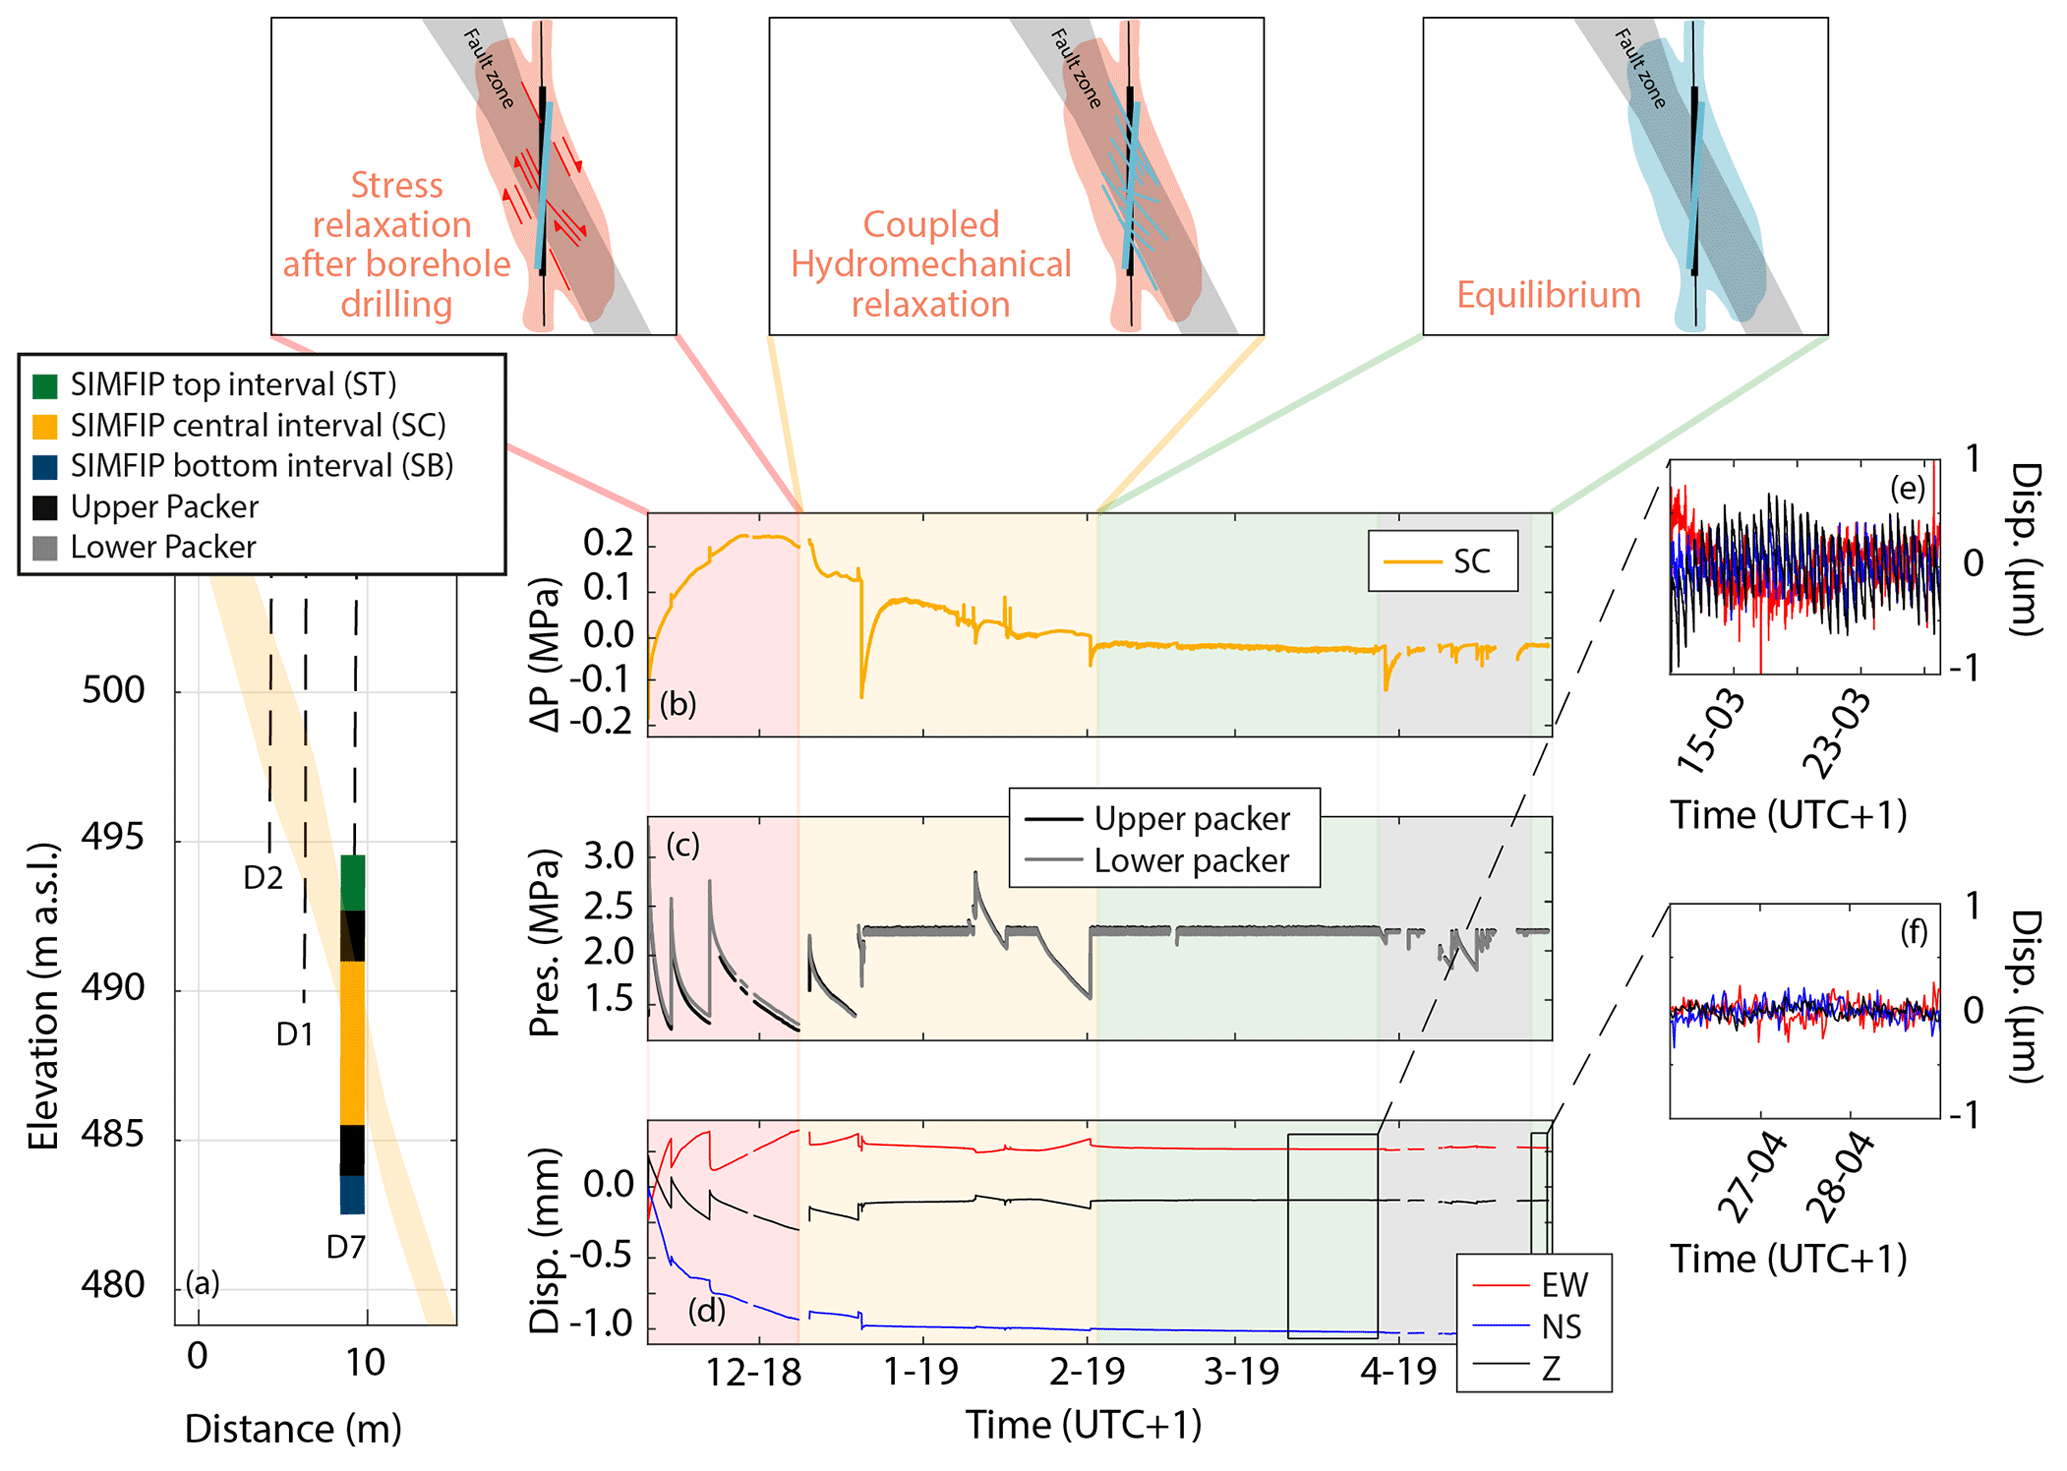
Figure 12(a) Position of the SIMFIP probe across the fault zone in borehole BCS-D7. (b–d) Long-term fault zone displacement and pore pressure monitoring: (b) interval pressure, (c) packer pressure, (d) (EW, NS, Z) displacement of the upper packer of the SIMFIP probe (fault hanging wall). (e, f) Enlargement of relative and detrended displacement monitoring in stable periods before and after packer pressure calibration.
In Fig. 15, the resulting VP,n tomogram between boreholes BCS-D3 and BCS-D4 is shown. It was computed with the baseline data recorded on 11 June 2019. The inverted VP model explains the observed travel times with an average root mean square error (RMSE) of 0.05 ms. The velocity values of the tomogram are displayed as normalized values according to Fig. 14, which means that they are average values of the in fact anisotropic velocities. The location of the main fault, estimated by interpolating observations from all CS-D boreholes (Fig. 4a), is displayed by the thin black lines. The main fault causes a clear low-velocity zone in the VP tomogram, which can be clearly identified by cross-hole seismic imaging. Furthermore, VP appears to be larger in the footwall than in the hanging wall. Heterogeneities within these two units were most probably due to our assumption that the anisotropy is homogeneous, whereas in fact the anisotropy is slightly higher in the footwall than in the hanging wall, as shown in Fig. 14a.
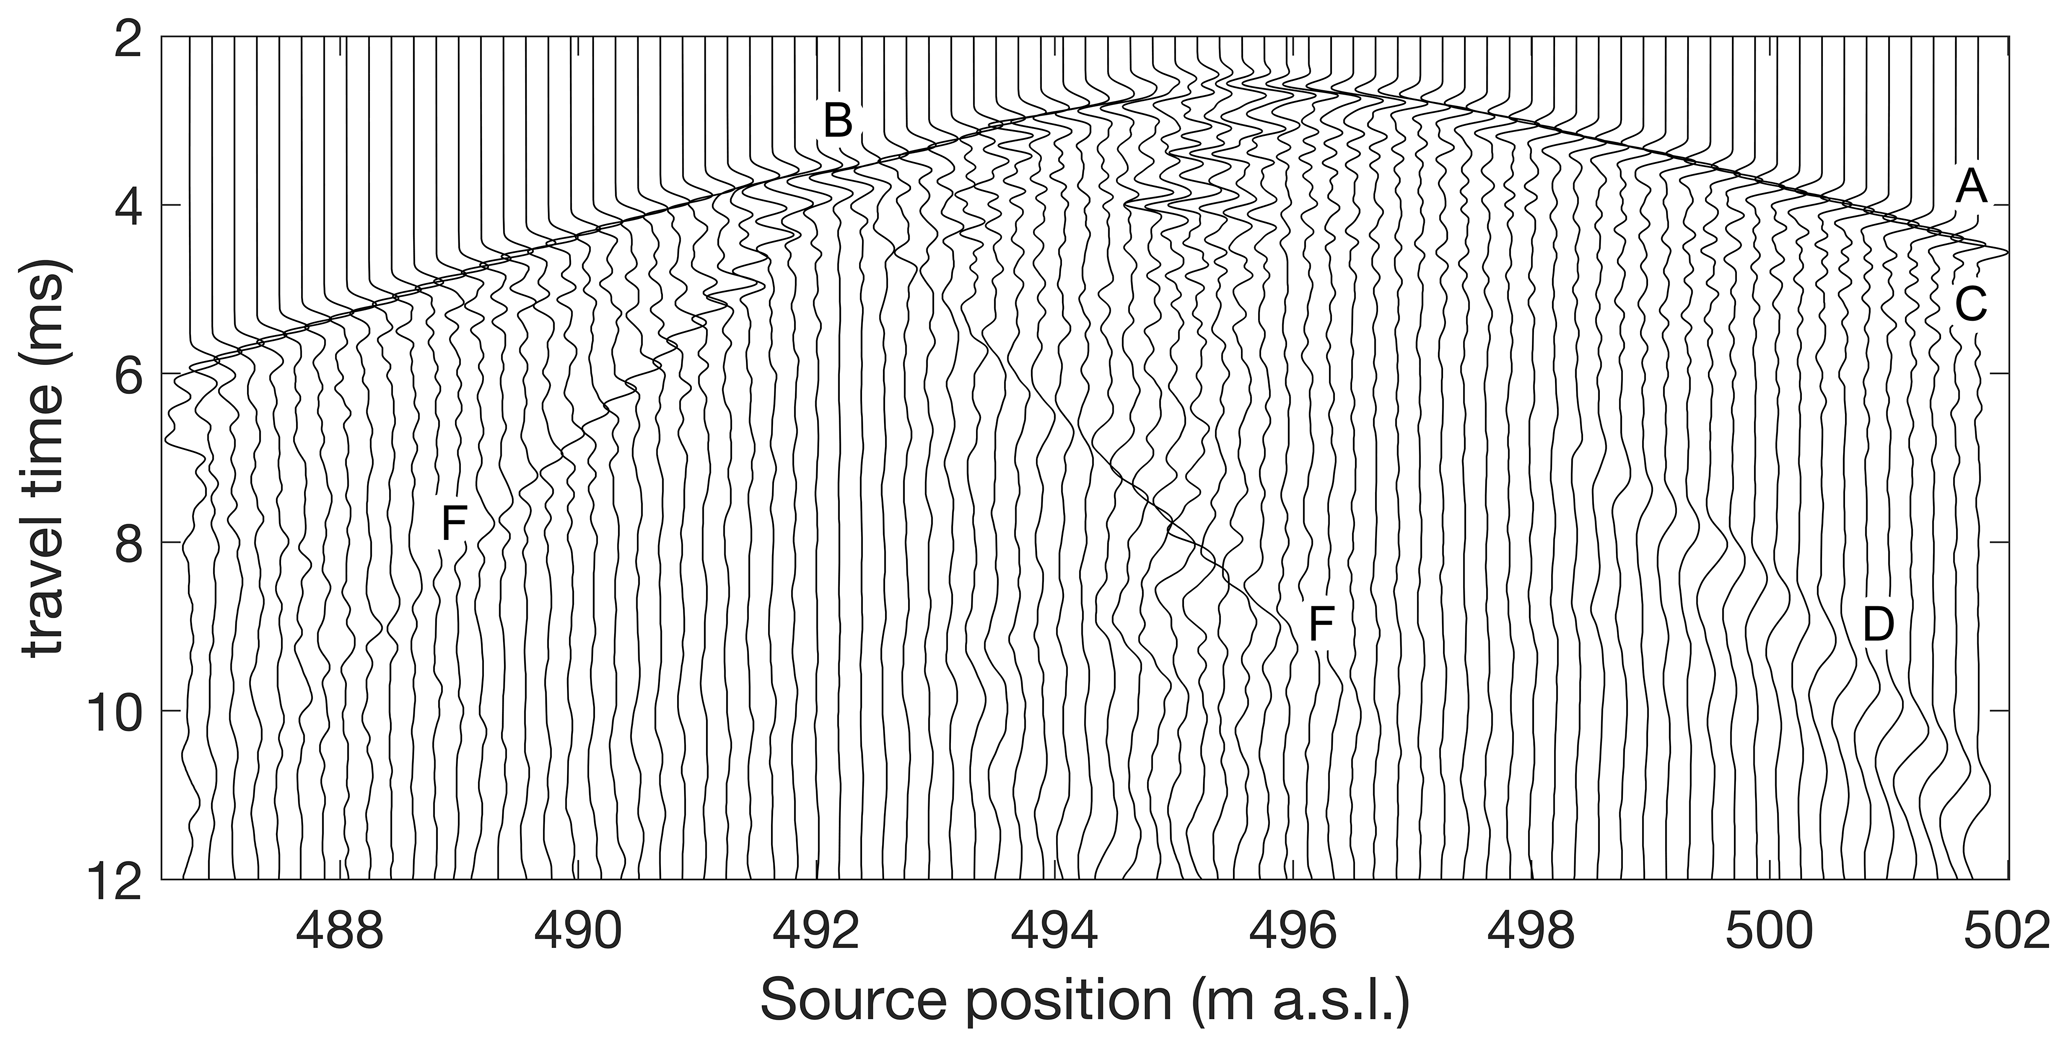
Figure 13Common receiver gather of processed seismic data recorded with a cemented geophone in borehole BCS-D3 while a P-wave sparker source was employed at 25 cm intervals in borehole BCS-D4. Labeled seismic events are the P-wave arrivals (A) with a notable delay for sources fired within the main fault (B), slow and fast S-wave modes (C), a tube wave propagating along the source borehole (D), and a tube wave reflected at the main fault (F).
Although focusing on the characterization of the reservoir and on the development of our experimental setup at the meter scale, the initial results presented in this contribution already provide important insights for our understanding of the processes involved in large-scale CO2 storage operations.
The structural mapping during drilling allowed us to adjust the borehole positions and to install the packers in the injection, the monitoring systems, and the SIMFIP boreholes to span the entire thickness of the fault zone. Core mapping and borehole optical televiewer logs clearly identify the main fault in the host Opalinus Clay, marked by centimeter-thick dark fault gouge and scaly clay texture (Jaeggi et al., 2017). The contact between the fault and host rock is sharp (Fig. 8a). The main fault in the vicinity of the CS-D experiment is between 1 and 3 m thick with typical strike oriented N031–068 and dipping 56–65∘ SE. The upper contact, marked by the ∼ 1 cm thick gouge layer followed by a ∼ 10 to 20 cm thick scaly clay, is similar to the upper fault contact in gallery 98 (Jaeggi et al., 2017) and the faults observed in the FS-B boreholes (Guglielmi et al., 2020a). A layer of scaly clay also marks the bottom of the main fault. These trends show the strike-parallel similarities that span across > 50 m in the rock laboratory. While the tops and bottoms have similar orientations to the main fault in the gallery and other boreholes (Nussbaum et al., 2011; Jaeggi et al., 2017; Guglielmi et al., 2020), the internal structure is very heterogeneous. The majority of fractures within the main fault have a similar trend as the boundaries (see Jaeggi et al., 2017). However, several conjugate structures and fractures do not fall within the main fault trend. These fractures correspond to S-C and Riedel R and P structures (Nussbaum et al., 2011). The heterogeneity of structural fabrics within the fault core that characterizes the main fault is a common feature of faults in clay and makes it difficult to determine the hydraulic properties of such faults. The internal architecture of a fault in clay, similar in scale to the main fault at MTRL, has been described at the Tournemire underground lab in France (Dick et al., 2016, and references therein). In this case a fault core has been distinguished from a damaged zone; the core comprises a gouge with thin dark centimeter-thick bands, cataclasites, rock portions with folded foliation planes, and lenses of less deformed rock, all elements similar to the main fault at MTRL. The damage zone is represented by a dense network of small faults, fractures, and calcite veins that extends 2–3 m from the fault core. Pulse tests in Tournemire revealed hydraulic conductivity along the core damage zone boundary 1–2 orders of magnitude greater than in the undisturbed rock (Dick et al., 2016). Marschall et al. (2005) hydraulically investigated sections of the fault zone at MTRL and showed that the permeability of faulted Opalinus Clay and of undisturbed rock is not significantly different.
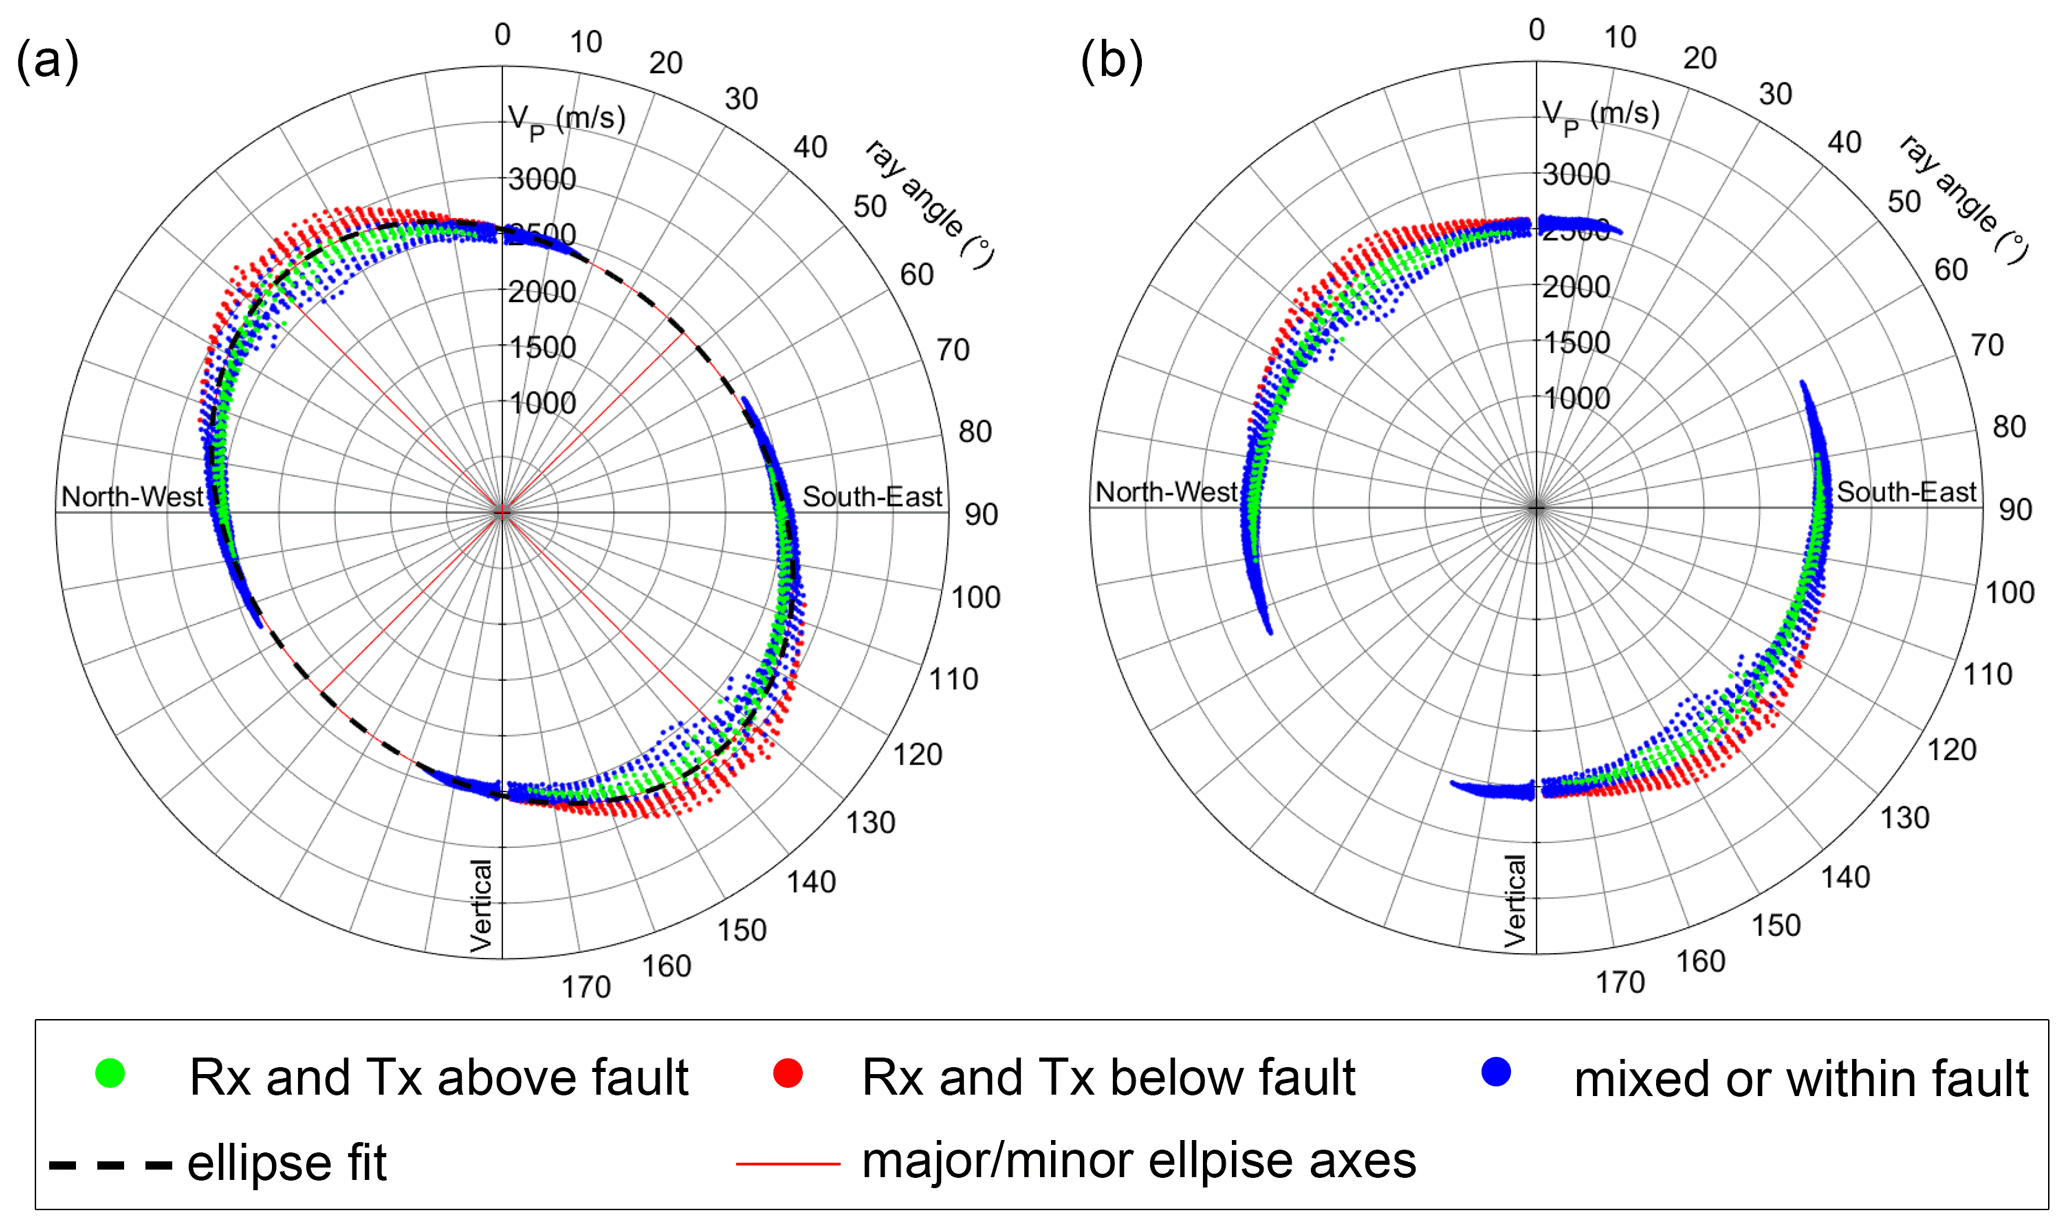
Figure 14Average VP for all receiver–transmitter (Rx–Tx) pairs within the same plane as the one displayed in Fig. 15. Since VP shows a strong anisotropy (a), velocities were normalized (b) prior to performing the travel-time inversion.
During phase 1, several injection tests were performed to characterize the hydraulic response of the site and to determine if there was any hydraulic response between the injection and monitoring boreholes. An important first result of the CS-D experiment is that the injected fluid is channeled along preferential pathways rather than along the fault plane, although the transmissivity of these pathways remains extremely low (of the order of 10−13 m2 s−1). During the hydraulic tests, a clear pressure response was observed in the monitoring borehole (BCS-D2, intervals M1, M2) when injection occurred in the uppermost interval of the injection borehole (BCS-D1, interval Q4). If this observation was linked to poroelastic effects, we would expect a similar pressure increase in all intervals at approximately the same distance, although the heterogeneity of the medium might generate some differences. As the pressure variation in the monitor borehole is only observed in the bottom intervals, we argue that the poroelastic response is negligible and that the flow follows complex pathways within the fault. A pronounced fracture possibly connecting injection and monitoring boreholes in the direction Q4-M1 was not identified in these specific intervals, but conjugate structures (NW-dipping fractures; Fig. 8b, d) could explain the fluid pressure connection of the Q4 injection interval to the M1 and M2 monitoring intervals.
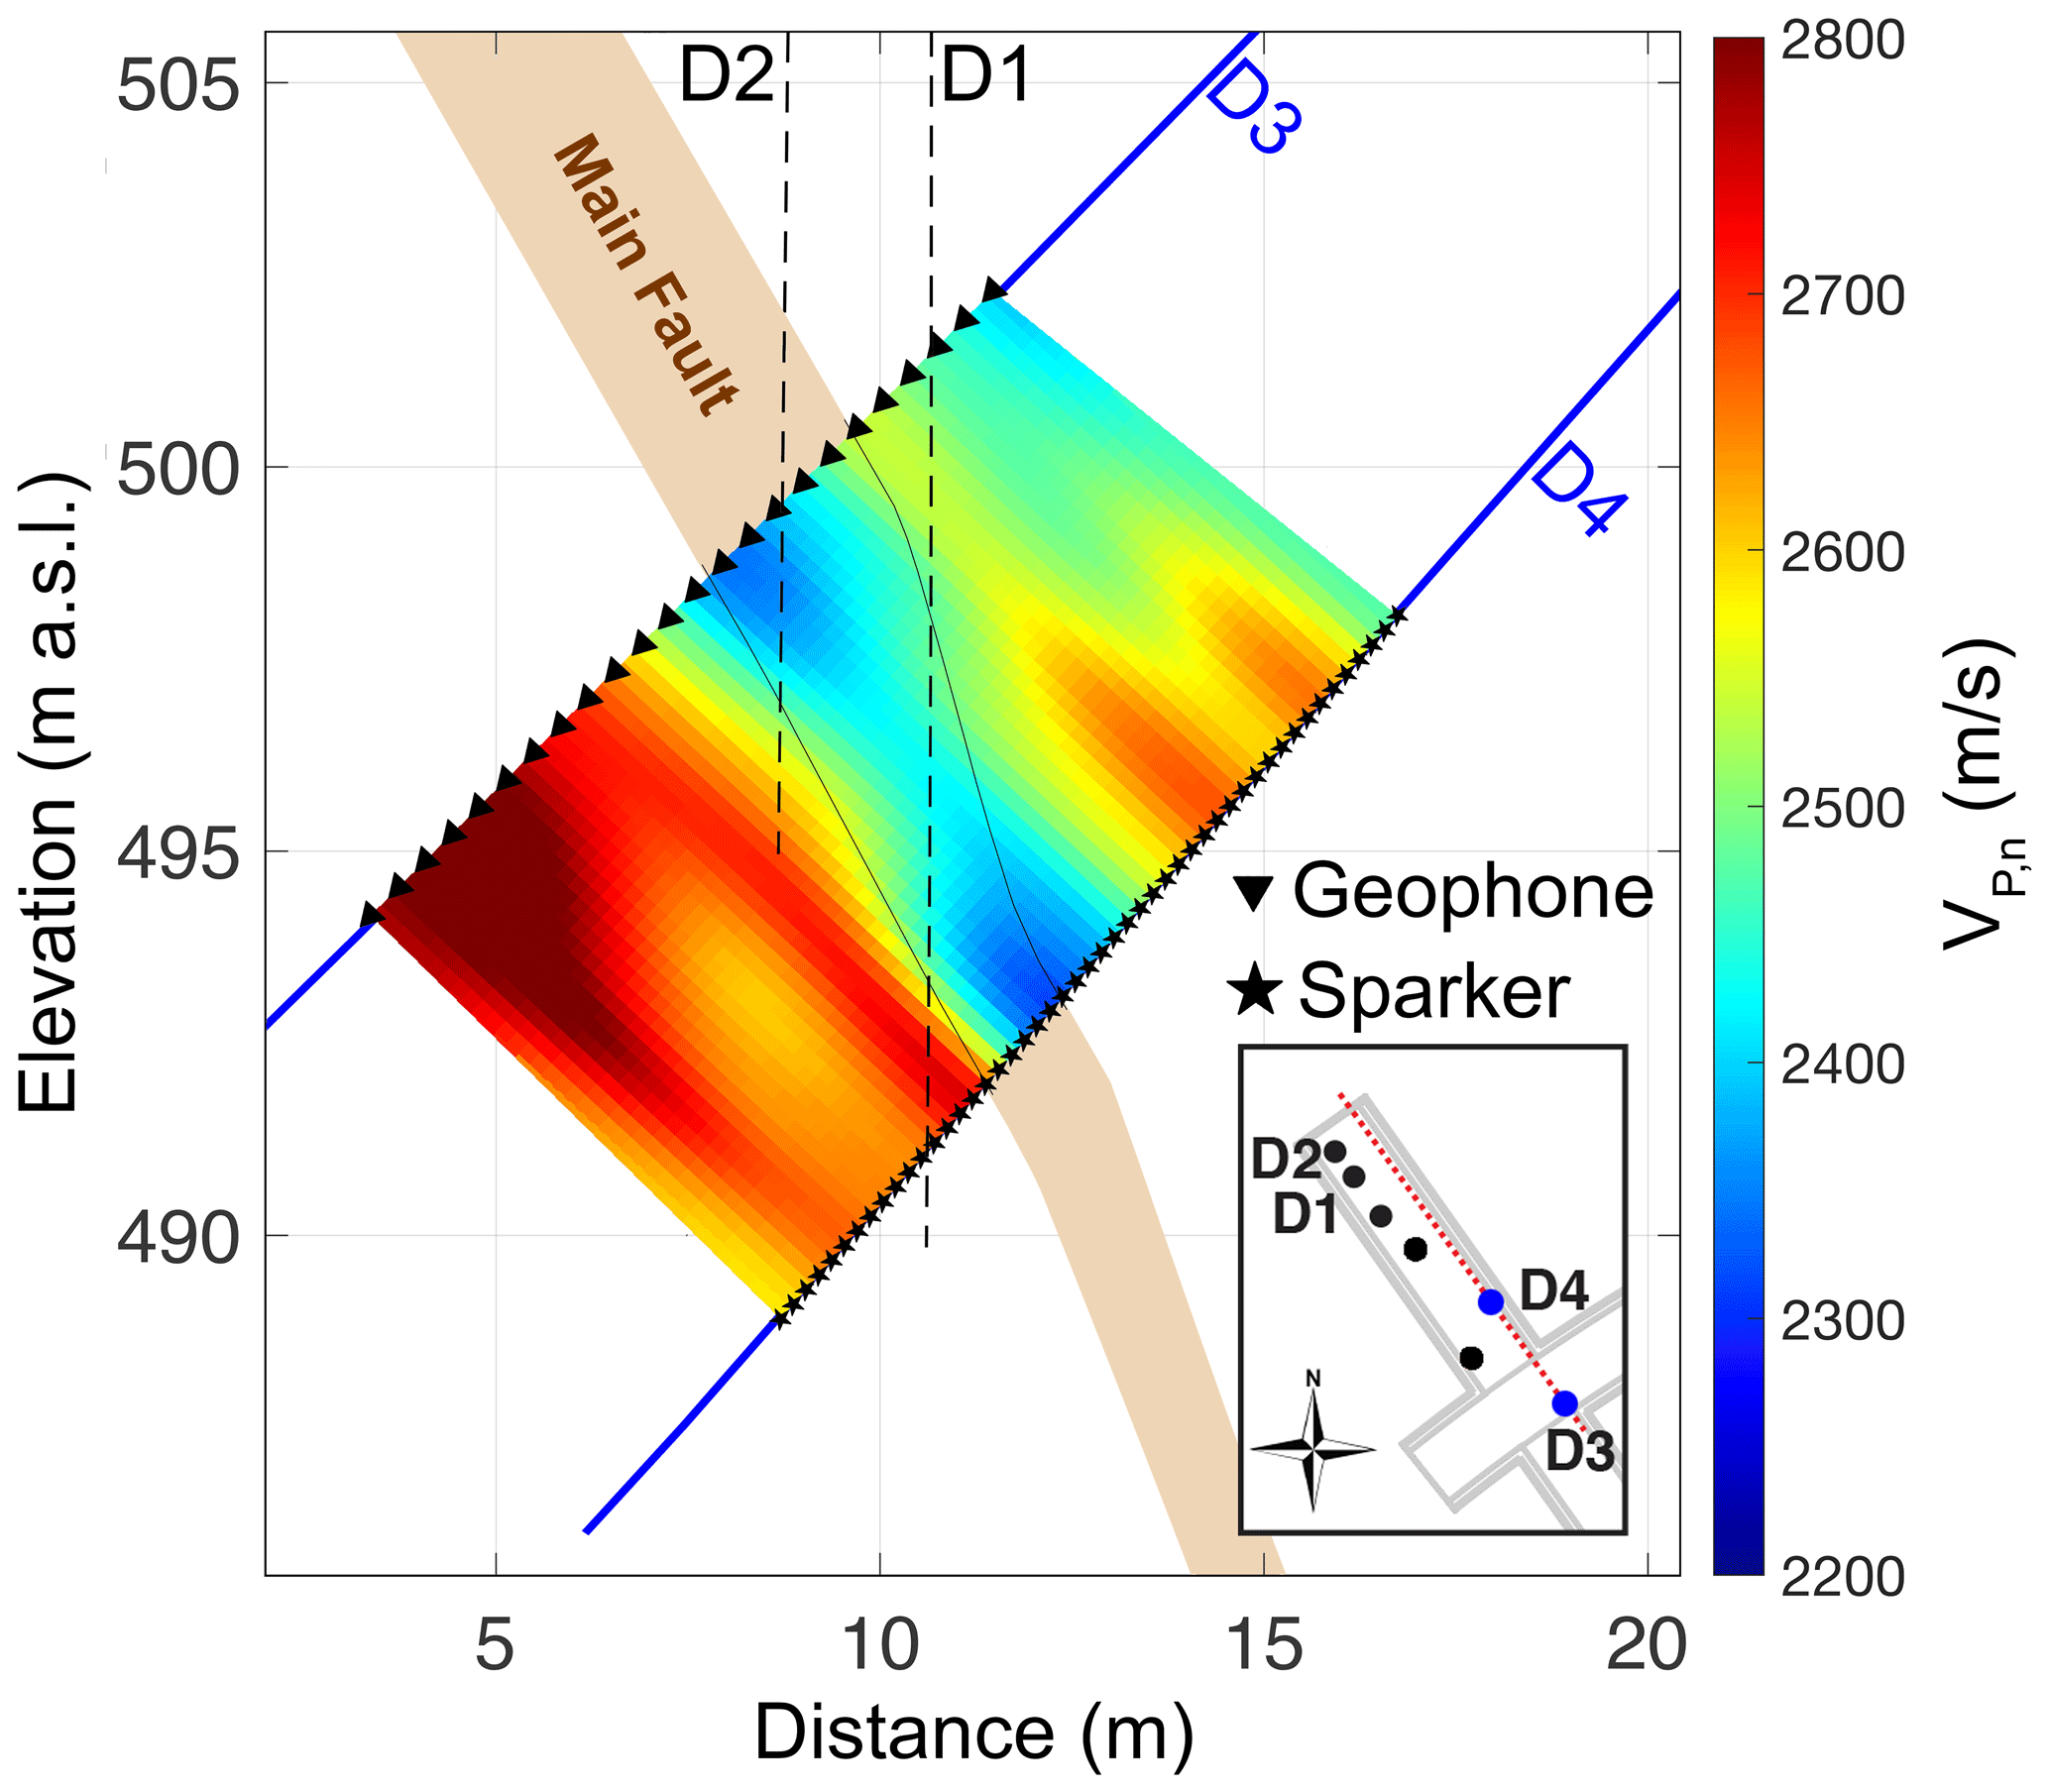
Figure 15VP tomogram obtained by cross-hole travel-time inversion between borehole BCS-D3 (geophones) and BCS-D4 (sparker sources). Locations of geophones and sources are indicated by triangle and star symbols, respectively.
Fault transmissivity models assume that the system is a homogeneous porous medium, with radial flow from the borehole. However, it should be noted that the main fault may behave rather as a fractured system, given the interconnection of specific intervals, rather than yielding a uniform and homogeneous response. In other words, our estimate relies on the assumption of a homogeneous representation of the rock with effective hydraulic properties, which might fail in capturing the real pressure distribution in such a fractured environment. Nevertheless, the transmissivity estimates agree with previous tests conducted in boreholes reaching the fault in shaly facies at ca. 9 m of depth from another niche (Marschall et al., 2005) and could indicate a permeability in the fault zone of the order of 10−20 m2 when assuming a layer as thick as the injection interval (1.4 m). An analysis of all other tests and the decay curve results in a similar value for the transmissivity.
The estimated permeability is extremely low, and extrapolating this value to full-scale injection plants would not result in major CO2 leakage if constant through the operational phase. Indeed, such a low value makes the fault as impermeable as the caprock itself, but changes in permeability and/or porosity due to geochemical–geomechanical processes could in the long term affect the sealing capacity, albeit in a more heterogeneous way compared to what would be expected during the planning phase of the experiment.
An additional injection test was designed to determine the fault opening pressure (FOP), i.e., the pressure at which the fractures are jacked opened and allow leakage. By performing a series of step tests, the FOP occurred in the range 4.5 to 4.8 MPa. This value is in agreement with previous studies at Mont Terri (e.g.. 5.4 MPa; Guglielmi et al., 2020a). While the recorded signal at the injection point clearly indicated a fracture reactivation, and the estimated transmissivity increased by 1 order of magnitude, the pressure response was not clear at the monitoring point. It should be noted, however, that the FOP test (PST3; Table 3) was performed right after an important excavation that occurred in a tunnel nearby (Rinaldi et al., 2020), which could have affected the local state of stress, thus allowing for opening of fractures and/or cracks at lower pressure.
The reactivation of a fracture resulted in a stronger pressure decay compared to previous steps, although no obvious deformation was recorded at the SIMFIP, the potentiometer chain, or the fiber optics. It is then difficult to estimate the orientation of the reactivated fracture(s) by looking at the injection data alone. Some minor deformations were observed in the potentiometer chain during previous tests in the period March–April 2019 (see Supplement Sect. S3), but it is hard to discriminate the small effect of injection from other processes occurring at depth in the long term, such as borehole stabilization or stress relaxation after excavation. For example, the SIMFIP probe, placed about 7 m from the injection point and being able to capture submicron deformation, should be able to record some signals. However, data exhibit complex three-dimensional strain relaxation effects that lasted about 1.5 months after drilling. These effects with deformations of the order of microns are affecting the boreholes' interval fluid pressures in and outside the fault zone and may mask any effect linked to the injection. Such a “long” relaxation period is consistent with observations made in other Mont Terri experiments dedicated to the long-term hydromechanical behavior of the excavation damage zone around galleries and boreholes in low-permeability Opalinus Clay (Bossard et al., 2017). How permanent and how amplified these effects are in the fault zone will provide information on the evolution of the damage zone in the near field of boreholes drilled through faulted caprocks.
From the active seismic baseline data recorded during phase 1, we analyzed the P-wave velocity (VP) anisotropy. VP values averaged over the entire rock volume including the main fault were observed to be around 2870 m s−1 in the direction of the clay bedding in the host rock and around 2280 m s−1 normal to the clay bedding. Two-dimensional tomographic imaging was carried out using anisotropy-normalized P-wave travel times. The resulting tomogram was capable of clearly revealing the location of the main fault in the form of a pronounced low-velocity zone correlating well with direct borehole observations. Values of VP we observed in situ are clearly smaller than what has been previously measured by other researchers from drill cores in the laboratory (e.g., Bossart et al., 2017; 2220–3020 m s−1 normal to bedding, 3170–3650 m s−1 parallel to bedding), but they exhibit a similar degree of anisotropy, with A=0.26, which is close to A=0.3 estimated after Bossart et al. (2017). Lower values in absolute VP compared to ultrasonic measurements are expected in accordance with the Kramers–Kronig dispersion relation (e.g., Mavko et al., 2009). In situ seismic cross-hole measurements have previously been performed by Schuster et al. (2017). For apparent velocities outside the EDZ, they recorded values of around 3100 m s−1 for ray paths approximately parallel to bedding and around 2600 m s−1 for rays normal to bedding. Fitting an ellipse through the apparent velocities (similar to Fig. 14), they estimated an anisotropy coefficient A=0.20, which is close to our observation. The difference could be due to heterogeneities within the shaly facies of the Opalinus Clay but also because in our case ray coverage normal to the bedding was poor, whereas Schuster et al. (2017) did not cover ray paths exactly parallel to bedding. To the best of our knowledge, seismic travel-time tomography across a larger fault in Opalinus Clay has not been performed before, but Jaeggi et al. (2017) measured ultrasonic interval velocities along a borehole that crosses the main fault in Mont Terri and is oriented around 40∘ to the bedding planes. Within main fault sections with scaly clay, they observed distinctly reduced VP values as low as 2000 m s−1. This is even lower than what we observed in Fig. 15 and can be attributed to the higher resolution of the interval velocities, which enables the resolution of individual sections of scaly clay, whereas with our cross-hole measurements we measured VP of the main fault consisting of a mixture of scaly clay and lenses of undisturbed Opalinus Clay.
All the injection tests during phase 1 were also monitored for induced acoustic emissions. Eight piezo-sensors installed in boreholes at a distance varying from about 2.5 to 10 m from the injection point (Fig. 5a, b) were recording at very high sample frequency (0.2 MHz) during all injection tests. Despite reaching elevated pressure (e.g., 6 MPa in test Q4, HPP-SST; Table 4), and while the pressure response was clear at a distance of about 2.5 m, no signal was recorded by the piezo-sensors. This is not surprising given the very low tendency of clay rock to generate seismic events (Orellana et al., 2018), but in similar conditions some seismicity was observed in an experiment nearby with resulting enhanced flow (Guglielmi et al., 2020a). Furthermore, the Opalinus Clay features quite high attenuation of seismic waves, in particular in regions where fractures and cracks exist (Nicollin et al., 2008); hence, even for the tests in which a clear geomechanical response is observed (FOP test – Fig. 11), the 2.5 m minimum distance between the injection point and piezo-sensor could already be enough to damp the high frequency at which the acoustic emission should be observed.
Based on the hydraulic observations, the pressure response suggests that the highest probability of possible flow connection exists between injection interval Q4 and monitoring intervals M1 and M2. Therefore, long-term injection began in June 2019 (phase 2) from the Q4 injection interval in the uppermost part of the fault, with Pearson water saturated with a mixture of CO2 and Kr at a constant pressure of 4.5 MPa (below the FOP). The injection is as of November 2020 still ongoing.
The long-term injection at CS-D will shed light on the several points listed below.
-
The fault transmissivity evolution will be observed over a long period of time (12–18 months). Continuous pressurization might weaken the fault, inducing seismic events or aseismic deformation that could enhance the permeability of the fault. Results from previous experiments (Guglielmi et al., 2020a), data from the CO2 demonstration site at In Salah, Algeria (Rinaldi et al., 2017; Shi et al., 2013), and numerical modeling (Rutqvist et al., 2016) clearly show that this could happen in caprocks. We will also observe possible fault healing mechanisms (swelling of the clay) over a prolonged time.
-
While a 1-year experiment might not allow for capturing all the geochemical processes involved in a long-term injection operation, this experimental setup will allow for monitoring the breakthrough of a CO2-rich fluid, the quantification of mixing with resident fluids over a prolonged period of time, and possibly also the description of the main geochemical interactions between the fluids and the rock.
-
Advanced monitoring instrumentation will be tested in the long term. In particular, two instruments that strongly enhance the monitoring capabilities are the following: (i) the SIMFIP, a probe capable of measuring three-dimensional deformation of the entire fault zone; and (ii) the mini-Ruedi, a portable mass spectrometer that allows for monitoring possible CO2 breakthrough at given intervals at depth. The highly dense network of instruments will allow us to fully characterize the fluid dynamic at an unprecedented level of detail for a fault zone in a caprock. Understanding the dynamic of the system will allow us to better understand processes relevant for enabling full-scale underground CO2 storage.
-
Geophysical measurements will further strengthen the point above. Given the dense active seismic sensor networks, regular surveys will allow us to monitor changes in the flow, in particular if the CO2 separates from the fluid as a gas phase and saturates the fault zone. In addition to seismic measurement, we will perform regular rock electrical resistivity measurements to allow imaging any changes in fluid properties; the difference between in situ water and CO2-saturated synthetic water could already create enough contrast in the decameter scale of the experiment. Regular monitoring at CS-D will allow for time-lapse images with detailed spatial and temporal resolution; in this way, we aim to reach the lowest threshold to detect fluid flow in low-permeability formations.
-
Finally, the CS-D permanent installation will allow for more than one single test. The CS-D experiment, and its successive series of tests, will produce a considerable amount of data that are essential for a proper calibration of numerical models. With a data-driven approach, they will help to fill the gap between observed changes in rock permeability and modeling.
In this paper, we describe the setup of the in situ CS-D experiment (Carbon Sequestration – Series D) at the Mont Terry rock laboratory. We drilled and instrumented a series of boreholes to perform long-term (1-year) experiments and to study sealing and induced seismicity related to leakage through low-permeability faulted caprocks. The decameter-scale experimental setup allows for close monitoring of fluid injected into a fault zone in the Opalinus Clay, simulating leakage through a faulted caprock at shallow depth. We installed geophysical, hydraulic, geomechanical, and geochemical instrumentation that enables the monitoring of several thermomechanical and hydromechanical–chemical processes that occur at reservoir depth. In particular, our monitoring capabilities profited from two innovative instruments, which consist of (i) a probe capable of measuring three-dimensional deformation of the entire fault zone and (ii) a portable mass spectrometer that measures partial pressure of dissolved gases (He, Ar, Kr, CO2, etc.) in water, thus allowing for the detection of CO2 breakthrough (i.e., the dissolved CO2 from the injected CO2-rich water) at given intervals at depth.
We also present the results of the site characterization (phase 1), which highlights the complexity and uniqueness of the experiment.
Some of the aims of the CS-D experiment listed in Sect. 2.1 could already be achieved in the characterization phase. One of them was to better understand the mobility of CO2-rich water through the fault. Structural mapping and hydraulic characterization show that the fluid does not flow preferentially along the fault, but it is confined in small regions with fractures crosscutting the fault, even if the estimated permeability is extremely low.
Another aim of the CS-D experiment was to test the occurrence of induced microseismicity in clay. No induced seismicity has been detected, even at an injection pressure higher than the fault opening pressure determined in previous experiments.
The seismic characterization successfully highlights the fault zone as a region of low-velocity anomaly. While the rock samples from the host rock and fault zone exhibit very similar elastic properties (Wenning et al., 2021), the internal structure of the fault defines a different anisotropy pattern inside the fault juxtaposed to the host rock, thus strongly contributing to the seismic anomaly. Nevertheless, the resolution does not allow us to image small fractures through which fluid flow may occur.
Many aims of the CS-D experiment (evolution of permeability after long-term exposure to CO2, variation of geomechanical response with time) remain to be tackled and will hopefully be achieved through the analysis of the data obtained during the second phase, i.e., the long-term injection of CO2-saturated water.
Codes for numerical modeling are copyright of the LBNL. Codes for the analysis of injection tests are available at https://github.com/UniNE-CHYN/hytool (last access: 21 January 2021, Renard, 2017). All data analyzed in this paper are available by request from alba.zappone@sed.ethz.ch.
Core samples can be obtained by submitting a proposal for experiment to claudio.madonna@erdw.ethz.ch.
The supplement related to this article is available online at: https://doi.org/10.5194/se-12-319-2021-supplement.
AZ, APR, MG, QCW, AO, MSB, FS, PC, and YG designed the experimental setup. AZ, APR, MG, QCW, and CR conducted the experiments. QCW performed the analysis of the core and logging as well as producing the relative figure. APR performed all the numerical simulations and the analysis of the injection tests with the relative figures. MG analyzed the geophysical measurements and produced the relative figures. FS, PC, and YG, with the contribution of APR, performed the analysis of the borehole stability. All authors contributed to the installation of the experimental setup and to writing the paper.
The authors declare that they have no conflict of interest.
We are thankful to swisstopo, in particular to Paul Bossart, David Jaeggi, Senecio Schefer, Thierry Theurillat, and the Mont Terri rock laboratory team, for on-site support. We thank Hans-Ruedi Maurer from the Earth Science Department at ETH Zurich for productive and cooperative discussions on data analysis. We are grateful to Ulrich W. Weber from the University of Uppsala for providing support for dissolved gas monitoring and for data discussion. We thank Demir Semih Baris, Madalina Jaggi, Maria Kakurina, Nils Knornschild, Marija Lukovic, Linus Villiger, Thomas Mörgeli, Michelle Robertson, and Chet Hopp for technical support, scientific advice, and/or on-site assistance.
Key contractors of the CS-D experiment are the following:
-
GeoSonic France for the drilling of the boreholes;
-
Solexperts Switzerland for the design, installation, operation, and maintenance of the injection equipment; and
-
Terratec Germany for borehole logging.
This research has been supported by the ACT ELEGANCY, project no. 271498. ELEGANCY has received funding from DETEC (CH), BMWi (DE), RVO (NL), Gassnova (NO), BEIS (UK), Gassco, Equinor, and Total, and it is co-funded by the European Commission under the Horizon 2020 program, ACT grant agreement no. 691712. This project is supported by the Pilot and demonstration Programme of the Swiss Federal Office of Energy (SFOE). CS-D is co-funded by swisstopo, Chevron, and Total, as well as receiving in-kind contributions from the Lawrence Berkeley National Laboratory.
This paper was edited by Charlotte Krawczyk and reviewed by two anonymous referees.
Aagaard, B. K., Skurtveit E., and Wangen, M.: Critical Factors for Considering CO2 Injectivity in Saline Aquifers, FME SUCCESS Synthesis report Volume 3, edited by: Miri, R. and Hellevang, H., pp. 24, 2018.
Alemu, B. L., Aagaard, P., Munz, I. A., and Skurtveit, E.: Caprock interaction with CO2: A laboratory study of reactivity of shale with supercritical CO2 and brine, Appl. Geochem., 26, 1975–1989, 2011.
Al Hosni, M., Vialle, S., Gurevich, B., and Daley, T. M.: Estimation of rock frame weakening using time-lapse crosswell: The Frio brine pilot project, Geophysics, 81, B235–B245, 2016.
Amann, F., Wild, K. M., Loew, S., Yong, S., Thoeny, R., and Frank, E.: Geomechanical behaviour of Opalinus Clay at multiple scales: results from Mont Terri rock laboratory (Switzerland), Swiss J. Geosci., 110, 151–171, 2017.
Blaesi, H. R., Moeri, A., and Bossart, P.: Results of the Phase 1 drilling campaign, Mont Terri Technical Report, TR96-01, Federal Office of Topography (swisstopo), Wabern, Switzerland, 1996.
Bossart, P., Bernier, F., Birkholzer, J., Bruggeman, C., Connolly, P., Dewonck, S., Fukaya, M., Herfort, M., Jensen, M., Matray, J.-M., Mayor, J. C., Moeri, A., Oyama, T., Schuster, K., Shigeta, N., Vietor, T., and Wieczorek, K.: Mont Terri rock laboratory, 20 years of research: introduction, site characteristics and overview of experiments, Swiss J. Geosci., 110, 3–22, 2017.
Bossart, P., Meier, P. M., Moeri, A., Trick, T., and Mayor, J.-C.: Geological and hydraulic characterisation of the excavation disturbed zone in the Opalinus Clay of the Mont Terri Rock Laboratory, Eng. Geol., 66, 19–38, 2002.
Brennwald, M. S., Schmidt, M., Oser, J., and Kipfer, R. A: Portable and Autonomous Mass Spectrometric System for On-Site Environmental Gas Analysis, Environ. Sci. Technol., 50, 13455–13463, 2016.
Busch, A. and Kampman, N.: Migration and Leakage of CO2 From Deep Geological Storage Sites, in: Geological Carbon Storage: Subsurface seals and caprock integrity, edited by: Vialle, S., Ajo-Franklin, J., and Carey, J. W., Geophysical Monograph Series, https://doi.org/10.1002/9781119118657.ch14, 285–303, 2018.
Caine, J. S., Evans, J. P., and Forster C. B.: Fault zone architecture and permeability structure, Geology, 24, 1025–1028 https://doi.org/10.1130/0091-7613(1996)024<1025:FZAAPS>2.3.CO;2, 1996.
Cooper, H. H., Bredehoeft, J. D., and Papadopulos I. S.: Response of a finite-diameter well to an instantaneous charge of water, Water Resour. Res., 3, 263–269, 1967.
Cozier, M.: The UN COP21 Climate Change Conference and the role of CCS, Greenh. Gases, 5, 697–700, https://doi.org/10.1002/ghg.1577, 2015.
Credoz, A., Bildstein, O., Jullien, M., Raynal, J., Pétronin, J.-C., Lillo, M., Pozo, C., and Geniaut, G.: Experimental and modeling study of geochemical reactivity between clayey caprocks and CO2 in geological storage conditions, Enrgy. Proced., 1, 3445–3452, 2009.
Dick, P., Wittebroodt, C., Courbet, C., Sammaljärvi, J., Estève, I., Matray, J.-M., Siitari-Kauppi, M., Voutilainen, M., Dauzères, A.:: The internal architecture and permeability structures of faults in shale formations, The Clay Minerals Society Workshop Lectures Series, 21, 227–242, 2016.
Fang, Y., Baojun, B., Dazhen, T., Dunn-Norman, S., and Wronkiewicz, D.: Characteristics of CO2 sequestration in saline aquifers, Pet. Sci., 7, 83–92, https://doi.org/10.1007/s12182-010-0010-3, 2010.
Faulkner, D. R., Jackson, C. A. L., Lunn, R. J., Schlische, R. W., Shipton, Z. K., Wibberley, C. A. J., and Withjack, M. O.: A review of recent developments concerning the structure, mechanics and fluid flow properties of fault zones, J. Struct. Geol., 32, 1557–1575, https://doi.org/10.1016/j.jsg.2010.06.009, 2010.
Feitz, A., Tertyshnikov, K., Pevzner, R., Ricard, L., Harris, B., Schaa, R., Schacht, U., Kalinowski, A., Vialle, S., Glubokovskikh, S., Lebedev, M., Tenthorey, E., Pan, Z., Ennis-King, J., Wang, L., Hossein, S., Ransley, T., Radke, B., Urosevic, M., Singh, R.: The CO2CRC Otway shallow CO2 controlled release experiment: Preparation for Phase 2, Enrgy. Proced., 154, 145–150, https://doi.org/10.1016/j.egypro.2018.11.024, 2018.
Gemmer, L., Hansen, O., Iding, M., Leary, S., and Ringrose, P.: Geomechanical response to CO2 injection at Krechba, In Salah, Algeria, First Break, 30, 79–84, 2012.
Guglielmi, Y. , Cappa, F., Lançon, H., Janowczyk, J. B., Rutqvist, J., Tsang C. F., and Wang, J. S. Y.: ISRM Suggested Method for Step-Rate Injection Method for Fracture In-Situ Properties (SIMFIP): Using a 3-Components Borehole Deformation Sensor, in: The ISRM Suggested Methods for Rock Characterization, Testing and Monitoring: 2007–2014, edited by: Ulusay R., Springer, Cham, https://doi.org/10.1007/978-3-319-07713-0_ 14, 2013.
Guglielmi, Y., Birkholzer, J., Rutqvist, J., Jeanne P., and Nussbaum C.: Can fault leakage occur before or without reactivation? Results from an in situ fault reactivation experiment at Mont Terri, Enrgy. Proced., 114, 3167–3174, 2016.
Guglielmi, Y., Nussbaum, C., Robertson, M., Ajo-Franklin, J., Zappone, A., Kloppenburg, A., and Birkholzer, J.: FS-B Experiment: Imaging the long-term loss of faulted host rock integrity - Test plan, Mont Terri Technical Note TN2018-20, 2019.
Guglielmi, Y., Nussbaum, C., Jeanne, P., Rutqvist, J., Cappa, F., and Birkholzer, J.: Complexity of fault rupture and fluid leakage in shale: Insights from a controlled fault activation experiment, J. Geophys.l Res.-Sol. Ea., 125, e2019JB017781, https://doi.org/10.1029/2019JB017781, 2020a.
Guglielmi, Y., Nussbaum, C., Rutqvist, J., Cappa, F., Jeanne, P., and Birkholzer, J.: Estimating perturbed stress from 3-D borehole displacements induced by fluid injection in fractured or faulted shales, Geophys. J. Int., 221, 1684–1695, https://doi.org/10.1093/gji/ggaa103, 2020b.
Hangx, S., van der Linden, A., Marcelis, F., and Bauer, A.: The effect of CO2 on the mechanical properties of the Captain Sandstone: Geological storage of CO2 at the Goldeneye field (UK), Int. J. Greenh. Gas Con., 19, 609–619, 2013.
Hostettler, B., Reisdorf, A. G., Jaeggi, D., Deplazes, G., Bläsi, H.-R., Morard, A., Feist-Burkhardt, S., Waltschew, A., Dietze, V., and Menkveld-Gfeller, U.: Litho- and biostratigraphy of the Opalinus Clay and bounding formations in the Mont Terri rock laboratory (Switzerland), Swiss J. Geosci., 110, 23–29, https://doi.org/10.1007/s00015-016-0250-3, 2017.
Hovorka, S. D., Meckel, T. A., and Treviño, R. H.: Monitoring a large-volume injection at Cranfield, Mississippi–Project design and recommendations, Int. J. Greenh. Gas Con., 18, 345–360, 2013.
IPCC 2005: Carbon Dioxide Capture and Storage. An IPCC Special Report on Carbon Dioxide Capture and Storage, in: IPCC special report on carbon dioxide capture and storage, edited by: Metz, B., Davidson, O., de Coninck, H., Loos, M., and Meyer, L., Cambridge University Press, Cambridge United Kingdom and New York, NY, USA, 2005.
IPCC 2018: Global warming of 1.5∘C. An IPCC Special Report on the impacts of global warming of 1.5∘C above pre-industrial levels and related global greenhouse gas emission pathways, in the context of strengthening the global response to the threat of climate change, available at: https://www.ipcc.ch/report/2019-refinement-to-the-2006-ipcc-guidelines-for-national-greenhouse-gas-inventories, (last access: 21 January 2021), 2018.
IPCC 2019: Refinement to the 2006 IPCC Guidelines for National Greenhouse Gas Inventories, available at: https://www.ipcc.ch/report/2019-refinement-to-the-2006-ipcc-guidelines-for-national-greenhouse-gas-inventories, (last access: 21 January 2021), 2019.
Ishida, T.: Acoustic emission monitoring of hydraulic fracturing in laboratory and field, Constr. Build. Mater., 15, 283–295, https://doi.org/10.1016/S0950-0618(00)00077-5, 2001.
Jaeggi, D., Laurich, B., Nussbaum, C., Schuster, K., and Connolly, P.: Tectonic structure of the “Main Fault” in the Opalinus Clay, Mont Terri rock laboratory (Switzerland), Swiss J. Geosci., 110, 67–84, https://doi.org/10.1007/s00015-016-0243-2, 2017.
Jha, B. and Juanes, R.: Coupled modeling of multiphase flow and fault poromechanics during geologic CO2 storage, Energy. Proced., 63, 3313–3329, https://doi.org/10.1016/j.egypro.2014.11.360, 2014.
Jia, B., Tsau, J.-S., and Barati, R.: A review of the current progress of CO2 injection EOR and carbon storage in shale oil reservoirs, Fuel, 236, 404–427, https://doi.org/10.1016/j.fuel.2018.08.103, 2019.
Kampman, N., Busch, A., Bertier, P., Snippe, J., Hangx, S., Pipich, V., Di, Z., Rother, G., Harrington, J. F., Evans, J. P., Maskell, A., Chapman, H. J., and Bickle, M. J.: Observational evidence confirms modelling of the long-term integrity of CO2-reservoir caprocks, Nat. Commun., 7, 12268, https://doi.org/10.1038/ncomms12268, 2016.
Kaszuba, J. P., Janecky, D. R., and Snow, M. G.: Experimental evaluation of mixed fluid reactions between supercritical carbon dioxide and NaCl brine: Relevance to the integrity of a geologic carbon repository, Chem. Geol., 217, 277–293, 2005.
Kwiatek, G., Plenkers, K., Dresen, G., and Group, J. R.: Source pa-rameters of picoseismicity recorded at mponeng deep gold mine, South Africa: implications for scaling relations, B. Seismol. Soc. Am., 101, 2592–2608, https://doi.org/10.1785/0120110094, 2011.
Lanz, E., Maurer, H., and Green, A. G.: Refraction tomography over a buried waste disposal site, Geophysics, 63, 1414–1433, 1998.
Le Guen, Y., Renard, F., Hellmann, R., Brosse, E., Collombet, M., Tisserand, D., and Gratier, J.-P.: Enhanced deformation of limestone and sandstone in the presence of high pCO2 fluids, J. Geophys. Res., 112, B5, https://doi.org/10.1029/2006JB004637, 2007.
Manceau, J. C., Tremosa, J., Lerouge, C., Gherardi, F. , Nussbaum, C., Wasch, L. J., Alberic, P. , Audigane, P., and Claret, F.: Well integrity assessment by a 1:1 scale wellbore experiment: Exposition to dissolved CO2 and overcoring, Int. J. Greenh. Gas Con., 54, 258–271, 2016.
Manukyan, E. and Maurer, H.: Imaging of radioactive waste repository with vertically transversely isotropic full waveform inversion, SEG Technical Program Expanded Abstracts, 4743–4747, https://doi.org/10.1190/segam2018-2995460.1, 2018.
Marschall, P., Crosisé, J., Schlickenrieder, L., Boisson, J. Y., Vogel, P., and Yamamoto, S.: Synthesis of hydrogeological investigations at the Mont Terri site (Phases 1 to 5), Mont Terri Technical Report, TR2001-02, Federal Office of Topography (swisstopo), Wabern, Switzerland, 2003.
Marschall, P., Horseman, S., and Gimmi, T.: Characterisation of gas transport properties of the Opalinus Clay, a potential host rock formation for radioactive waste disposal, Oil Gas Sci. Technol., 60, 121–139, 2005.
Mavko, G., Mukerji, T., and Dvorkin, J.: The Rock Physics Handbook: Tools for Seismic Analysis of Porous Media (2nd Edn.), Cambridge University Press, https://doi.org/10.1017/CBO9780511626753, 2009.
Michael, K., Avijegon, A., Ricard, L., Myers, M., Tertyshnikov, K., Pevzner, R., Strand, J., Freifeld, B.,Woitt, M., Pervukhina, M., Feitz,, A., Pejcic, B., Stalker, L., Harris, B., Myers, J., Larcher, A., Rachakonda, P., Langhi, L., Dance, T., Hortle, A. ,Roberts, J., Woltering, M., White, C., and Delle-Piane, C.: In-Situ Laboratory for CO2 controlled-release experiments and monitoring in a fault zone in Western Australia, ASEG Extended Abstracts, 1, 1–3, https://doi.org/10.1080/22020586.2019.12073207, 2019.
Michael, K., Golab, A., Shulakova, V., Ennis-King, J., Allinson, G., Sharma, S., and Aiken, T.: Geological storage of CO2 in saline aquifers—A review of the experience from existing storage operations, Int. J. Greenh. Gas Con., 4, 659–667, https://doi.org/10.1016/j.ijggc.2009.12.011, 2010.
Mikhaltsevitch, V., Lebedev, M., and Gurevich, B. A.: Laboratory Study of the Elastic and Anelastic Properties of the Sandstone Flooded with Supercritical CO2 at Seismic Frequencies, Enrgy. Proced., 63, 4289–4296, 2014.
Minardi, A., Stavropoulou, E., Kim, T., Ferrari, A., and Laloui, L.: Experimental assessment of the hydro-mechanical behaviour of a shale caprock during CO2 injection, Int. J. Gas Con., submitted, 2020.
Myers, M., White, C., Pejcic, B., Feitz, A., Roberts, J., Oh,Y-Y., Xu, L., Ricard, L., Michael, K., Avijegon, A., Rachakonda, P. K., Woltering, M., Larcher, A., Stalker, L., Hortle, A.: CSIRO In-Situ Lab: A multi-pronged approach to surface gas and groundwater monitoring at geological CO2 storage sites, Chem. Geol., 545, 119642, https://doi.org/10.1016/j.chemgeo.2020.119642, 2020.
Neuzil, C. E.: On conducting the modified slug test in tight formations, Water Resour. Res.., 18, 439–441, 1982.
Nicollin, F., Gibert, D., Bossart, P., Nussbaum, C., and Guervilly, C.: Seismic tomography of the excavation damaged zone of the Gallery 04 in the Mont Terri Rock Laboratory, Geophys. J. Int., 172, 226–239, 2008.
Nicollin, F., Gibert, D., Lesparre, N., and Nussbaum, C.: Anisotropy of electrical conductivity of the excavation damaged zone in the Mont Terri Underground Rock Laboratory, Geophys. J. Int., 181, 303–320, 2010.
Nussbaum, C., Bossart, P., Amann, F., and Aubourg, C.: Analysis of tectonic structures and excavation induced fractures in the Opalinus Clay, Mont Terri underground rock laboratory (Switzerland), Swiss J. Geosci., 104, 187–210, 2011.
Nussbaum, C., Kloppenburg, A., Bossart, P., and Caër, T.: Tectonic evolution around the Mont Terri rock laboratory, northwestern Swiss Jura: constraints from kinematic forward modelling, Swiss J. Geosci., 110, 39–66, https://doi.org/10.1007/s00015-016-0248-x, 2017.
Orellana, L. F., Scuderi, M. M., Collettini, C., and Violay, M.: Frictional Properties of Opalinus Clay: Implications for Nuclear Waste Storage, J. Geophys. Res.-Sol. Ea. 123, 157–175, https://doi.org/10.1002/2017JB014931, 2018.
Pfiffner, O. A.: Geology of the Alps, Wiley-Blackwell, Chichester, 376 pp., 2014.
Renard, P.: Hytool: an open source matlab toolbox for the interpretation of hydraulic tests using analytical solutions, J. Open Source Soft., 2, 441, https://doi.org/10.21105/joss.00441, 2017.
Rillard, J., Loisy, C., Le Roux, O., Cerepi, A., Garcia, B., Noirez, S., Rouchon, V., Delaplace, P., Willequet, O., and Bertrand, C.: The DEMO- CO2 project: A vadose zone CO2 and tracer leakage field experiment, Int. J. Greenh. Gas Con., 39, 302–317, https://doi.org/10.1016/j.ijggc.2015.04.012, 2015.
Rinaldi, A. P. and Rutqvist, J.: Modeling of deep fracture zone opening and transient ground surface uplift at KB-502 CO2 injection well, In Salah, Algeria, Int, J. Greenh. Gas Con., 12, 155–167, https://doi.org/10.1016/j.ijggc.2012.10.017, 2013.
Rinaldi, A. P. and Rutqvist, J.: Joint opening or hydroshearing? Analyzing a fracture zone stimulation at Fenton Hill, Geothermics, 77, 83–98, https://doi.org/10.1016/ 10.1016/j.geothermics.2018.08.006, 2019.
Rinaldi, A. P., Jeanne, P., Rutqvist, J., Cappa, F., and Guglielmi, Y.: Effects of fault-zone architecture on earthquake magnitude and gas leakage related to CO2 injection in a multi-layered sedimentary system, Greenh. Gases, 4, 99–120, 2014.
Rinaldi, A. P., Rutqvist, J., Finsterle, S., and Liu, H. H.: Inverse modeling of ground surface uplift and pressure with iTOUGH-PEST and TOUGH-FLAC: the case of CO2 injection at In Salah Algeria, Comput. Geosci., 108, 98–109, https://doi.org/10.1016/j.cageo.2016.10.009, 2017.
Rinaldi, A. P., Guglielmi, Y., Zappone, A., Soom, F., Robertson, M., Cook, P., Kakurina, M., Wenning, Q., Rebscher, D., and Nussbaum, C.: Coupled processes in clay during tunnel excavation, EGU General Assembly 2020, Online, 4–8 May 2020, EGU2020-18041, https://doi.org/10.5194/egusphere-egu2020-18041, 2020.
Rinehart, A. J., Dewers, T. A., Broome, S. T., and Eichhubl, P.: Effects of CO2 on mechanical variability and constitutive behavior of the Lower Tuscaloosa Formation, Cranfield Injection Site, USA, International Journal of Greenhouse Gas Control, 53, 305–318, 2016.
Roberts, J. J. and Stalker, L.: What have we learned about CO2 leakage from field Injection tests? Enrgy. Proced., 114, 5711–5731, https://doi.org/10.1016/j.egypro.2017.03.1710, 2017.
Roques, C., Weber, U. W., Brixel, B., Krietsch, H., Dutler, N., Brennwald, M. S., Villiger, L., Doetsch, J., Jalali, M., Gischig, V., Amann, F., Valley, B., Klepikova, M., and Kipfer, R.: In situ observation of helium and argon release during fluid-pressure-triggered rock deformation, Sci. Rep.-UK, 10, 6949, https://doi.org/10.1038/s41598-020-63458-x, 2020.
Rutqvist, J.: Status of TOUGH-FLAC simulator and recent applications related to coupled fluid flow and crustal deformations, Comput. Geosci., 37, 739–750, 2011.
Rutqvist, J.: The Geomechanics of CO2 storage in deep sedimentary formations, Geotech. Geol. Eng., 30, 525–551 https://doi.org/10.1007/s10706-011-9491-0, 2012.
Rutqvist, J., Rinaldi, A. P., Cappa, F., Jeanne, P., Mazzoldi, A., Urpi, L., Guglielmi, Y., and Vilarrasa, V.: Fault activation and induced seismicity in geological carbon storage – Lessons learned from recent modeling studies, J. Rock Mech. Geotech. Eng., 8, 789–804, https://doi.org/10.1016/j.jrmge.2016.09.001, 2016.
Schuster, K., Amann, F., Yong, S., Bossart, P., and Connolly, P.: High-resolution mini-seismic methods applied in the Mont Terri rock laboratory (Switzerland), Swiss J. Geosci., 110, 213–231, 2017.
Skurtveit, E., Miri, R., and Hellevang, H.: Fluid-Rock Interactions in Clay-Rich Seals, in: Geological Carbon Storage: Subsurface seals and caprock integrity, edited by: Vialle, S., Ajo-Franklin, J., and Carey, J. W., American Geophysical Union, Geophysical Monograph Series, https://doi.org/10.1002/9781119118657.ch8, 2018.
Shi, J.-Q., Smith, J., Durucan, S., and Korre, A.: A Coupled Reservoir Simulation-geomechanical Modeling Study of the CO2 Injection-induced Ground Surface Uplift Observed at Krechba, in Salah, Enrgy. Proced., 37, 3719–3726, 2013.
Tenthorey, E., Feitz, A., Credoz, A., Lavina, M., Coene, E., Idiart, A., and Jordana, S.: The CO2CRC Otway Controlled CO2 Release Experiment in a Fault: geomechanical Characterisation Pre-Injection European Association of Geoscientists & Engineers, Conference Proceedings, Fifth International Conference on Fault and Top Seals, Sep 2019, Palermo, Italy, 2019, 1–5, https://doi.org/10.3997/2214-4609.201902321, 2019.
Thury M. and Bossart P.: The Mont Terri Rock Laboratory, a New International Research Project in Mesozoic Shale Formation in Switzerland, Eng. Geol., 52, 347–359, 1999.
Vasco, D. W., Rucci, A., Ferretti, A., Novali, F., Bissell, R. C., Ringrose, P. S., Mathieson, A. S., and Wright, I. W.: Satellite-based measurements of surface deformation reveal fluid flow associated with the geological storage of carbon dioxide, Geophys. Res. Lett., 37, L03303, https://doi.org/10.1029/2009GL041544, 2010.
Vasco, D. W., Bissell, R. C., Bohloli, B., Daley, T. M., Ferretti, A., Foxall, W., Goertz-Allmann, B. P., Korneev, V., Morris, J. P., Oye, V., Ramirez A., Rinaldi A. P., Rucci, A., Rutqvist J., White J., and Zhang, R.: Monitoring and Modeling Caprock Integrity at the In Salah Carbon Dioxide Storage Site, Algeria, in: Geological Carbon Storage: Subsurface Seals and Caprock Integrity, edited by: Stéphanie, V., Ajo-Franklin, J., and Carey, J. W., American Geophysical Union, Geophysical Monograph Series, 243–269, 2018.
Vialle, S. and Vanorio, T.: Laboratory measurements of elastic properties of carbonate rocks during injection of reactive CO2 -saturated water, Geophys. Res. Lett., 38, L01302, https://doi.org/10.1029/2010GL045606, 2011.
Vilarrasa, V. and Carrera, J.: Geologic carbon storage is unlikely to trigger large earthquakes and reactivate faults through which CO2 could leak, P. Natl Acad. Sci., 112, 5938–5943, https://doi.org/10.1073/pnas.1413284112, 2015.
Vilarrasa, V., Carrera, J., Olivella, S., Rutqvist, J., and Laloui, L.: Induced seismicity in geologic carbon storage, Solid Earth, 10, 871–892, https://doi.org/10.5194/se-10-871-2019, 2019.
Vilarrasa, V. and Makhnenko, R. Y.: Caprock Integrity and Induced Seismicity from Laboratory and Numerical Experiments, Enrgy. Proced., 125, 494–503, 2017.
Vilarrasa, V., Rinaldi, A. P., and Rutqvist, J.: Long-term thermal effects on injectivity evolution during CO2 storage, Int. J. Greenh. Gas Con., 64, 314–322, 2017.
Wenning, Q. C., Madonna, C., Kurotori, T., and Pini, R.: Spatial mapping of fracture aperture changes with shear displacement using X-ray computerized tomography, J. Geophys. Res.-Sol. Ea., 2019a.
Wenning, Q. C., Madonna, C., Kurotori, T., Pini, R., and Zappone, A.: Fracture aperture and flow evolution due to confined shear displacement using X-ray computerized tomography on crystalline and clay-rich rocks, 13th EURO – Conference on Rock Physics and Geomechanics, Potsdam, Germany, 2019b.
Wenning, Q.C., Madonna, C., Zappone, A., Grab, M., Rinaldi, A. P., Plötze, M., Nussbaum, C., Giardini, D., Wiemer, S.: Shale fault zone structure and stress dependent anisotropic permeability and seismic velocity properties (Opalinus Clay, Switzerland), J. Struct. Geol., 144, 104273, https://doi.org/10.1016/j.jsg.2020.104273, 2021.
Zappone, A., Rinaldi, A. P., Grab, M., Obermann, A., Madonna, C., Nussbaum, C., and Wiemer, S.: CO2 Sequestration: Studying Caprock And Fault Sealing Integrity, The CS-D Experiment In Mont Terri, European Association of Geoscientists & Engineers, Conference Proceedings, Fifth CO2 Geological Storage Workshop, Nov 2018, 1–5, https://doi.org/10.3997/2214-4609.201803002, 2018.
Zoback, M. D. and Gorelick, S. M.: Earthquake triggering and large-scale geologic storage of carbon dioxide, P. Natl Acad. Sci., 109, 10164–10168, https://doi.org/10.1073/pnas.1202473109, 2012.
- Abstract
- Introduction
- Overview of the experiment
- Layout of the installation
- Results from phase 1
- Discussion
- Outlook for long-term injection and implications for large-scale storage
- Conclusions
- Code availability
- Sample availability
- Author contributions
- Competing interests
- Acknowledgements
- Financial support
- Review statement
- References
- Supplement