the Creative Commons Attribution 4.0 License.
the Creative Commons Attribution 4.0 License.
 | 24 Feb 2021
Sparse 3D reflection seismic survey for deep-targeting iron oxide deposits and their host rocks, Ludvika Mines, Sweden
Alireza Malehmir
Magdalena Markovic
Paul Marsden
Stefan Buske
Lukasz Sito
Emma Bäckström
Martiya Sadeghi
Stefan Luth
Many metallic mineral deposits have sufficient physical property contrasts, particularly density, to be detectable using seismic methods. These deposits are sometimes significant for our society and economic growth and can help to accelerate the energy transition towards decarbonization. However, their exploration at depth requires high-resolution and sensitive methods. Following a series of 2D seismic trials, a sparse, narrow source–receiver azimuth, 3D seismic survey was conducted in the Blötberget mine, in central Sweden, covering an area of approximately 6 km2 for deep-targeting iron oxide deposits and their host rock structures. The survey benefited from a collaborative work by putting together 1266 seismic recorders and a 32 t vibrator, generating 1056 shot points in a fixed geometry setup. Shots were fired at every 10 m where possible, and receivers were placed at every 10–20 m. Notable quality data were acquired despite the area being dominated by swampy places as well as by built-up roads and historical tailings. The data processing had to overcome these challenges for the static corrections and strong surface waves in particular. A tailored for hardrock setting and processing workflow was developed for handling such a dataset, where the use of mixed 2D and 3D refraction static corrections was relevant. The resulting seismic volume is rich in terms of reflectivity, with clear southeast-dipping reflections originating from the iron oxide deposits extending vertically and laterally at least 300 m beyond what was known from available boreholes. As a result, we estimate potential additional resources from the 3D reflection seismic experiment on the order of 10 Mt to be worth drilling for detailed assessments. The mineralization is crosscut by at least two major sets of northwest-dipping reflections interpreted to dominantly be normal faults and to be responsible for much of the lowland in the Blötberget area. Moreover, these post-mineralization faults likely control the current 3D geometry of the deposits. Curved and submerged reflections interpreted from folds or later intrusions are also observed, showing the geological complexity of the study area. The seismic survey also delineates the near-surface expression of a historical tailing as a by-product of refraction static corrections, demonstrating why 3D seismic data are so valuable for both mineral exploration and mine planning applications.
- Article
(27728 KB) - Full-text XML
- BibTeX
- EndNote


The mineral exploration industry is challenged to provide fresh resources of the so-called critical raw materials that are important for green technologies and to help accelerate the energy transition towards decarbonization. These critical materials (e.g. rare earth elements, REEs) are often found as associated minerals in other deposits. Because they are often associated minerals, other deposits such as ferrous and non-ferrous minerals still need to be found, and the presence and quantity of the critical minerals that are usually beyond the detection limit of geophysical methods need to be studied. This also applies to iron oxide deposits; they may contain apatite and a reasonable amount of REEs (in relationship to apatite), titanium, and vanadium. In fact, because of their tonnage and economic potential, iron ores are still the number one commodity being mined and consumed worldwide (Fizaine, 2018). However, what makes the contemporary discovery of these deposits difficult is their presence at depth. As it is generally believed that most economically viable deposits at shallow depths have already been found and exploited, bigger deposits are likely only to be found at depth. Therefore, deep direct targeting requires sensitive high-resolution methods, as well as a multidisciplinary approach, to avoid the failure of an expensive deep drilling exploration programme. Lessons and successful progress in the hydrocarbon industry may be used for deep exploration in hardrock settings despite them having a much more complex geology than those of hydrocarbon settings. Seismic methods, particularly seismic reflection, after being tested for over 3 decades in crystalline rock settings (Reed, 1993; Eaton et al., 2003a, b, and references therein; Milkereit et al., 1996, 2000; Pretorius et al., 2003; Malehmir et al., 2011, 2012a, and references therein; Cheraghi et al., 2011; Dehghannejad et al., 2012; Heinonen et al., 2013; Buske et al., 2015, and references therein; Koivisto et al., 2015), are opening their approach to use the mineral exploration toolbox as a standard method. The recent number of publications (Bellefleur et al., 2019, and references therein; Malehmir et al., 2020 and references therein) illustrates why the method is so attractive for deep targeting and mineral exploration.
Nonetheless, most hardrock seismic surveys are conducted (in 2D or in rare cases 3D) of various rectangular setups using overlapping patches (Adam et al., 2003; Schmelzbach et al., 2007; Malinowski et al., 2012; Manzi et al., 2012, 2020; Malehmir and Bellefleur, 2009; Malehmir et al., 2012b; Urosevic et al., 2012; White et al., 2012; Cheraghi et al., 2012; Bellefleur et al., 2015; Maries et al., 2020). Conventional 3D surveys using a high fold and many parallel shot and receiver lines may satisfy regular sampling (Vermeer, 1998), but they require extensive line cutting and clearance in northern countries. Therefore, they are considered very environmentally unfriendly and are substantially expensive to conduct. Sparse and dedicated 3D surveys are an alternative that is being developed (Bouska 1997; Singh et al., 2019) in which deep-targeting is designed so that a particular target will be imaged using a suitable illumination angle.
The Blötberget mining area (Fig. 1) in central Sweden within the so-called Ludvika Mines was the target of an experimental sparse 3D reflection survey chosen due to its wealth of earlier 2D seismic lines (e.g. Malehmir et al., 2017a; Balentrini et al., 2020; Bräunig et al., 2020; Maries et al., 2020; Markovic et al., 2020; Papadopoulou et al., 2020), downhole logging data (Maries et al., 2017), and publicly available high-resolution aeromagnetic data in the area. The seismic survey had the following two main objectives: (1) to delineate depth and lateral continuation of iron oxide deposits and (2) to unravel important structures that may be relevant for deep mining and how the deposits are currently configured and extended at depth. However, the survey was challenged by of the limited number of receivers available and logistical challenges including swampy areas, canals, dense forests, built-up roads from previous mining activities in the region, and historical tailings. The extent or severity of some of these features were only recognized after the survey was completed and during the processing work, as will be discussed later.
Given that the dataset is currently the subject of a few other studies, the purpose of this inventory publication is to present how the survey was planned and executed, the standard processing workflow, the results, and our interpretation of major features in the seismic volume. We demonstrate how a dedicated planning work using a limited number of receivers in an area of approximately 3 by 2 km helped not only to image both vertical and lateral extent of the mineralization but also a number of structural features that crosscut the mineralization. The 3D survey also clearly maps historical tailings in the area as a by-product of the near-surface static solution. While there have been numerous hardrock seismic surveys conducted in Sweden, this is the first one reported for mineral exploration and should therefore be considered a pilot study for encouraging the numerous mining companies in the country and elsewhere to try the method more extensively than relying on limited 2D surveys.
Blötberget iron oxide deposits of the Ludvika Mines sit within one of the three major mineral districts of Sweden known as Bergslagen (Rippa and Kübler, 2003; Stephens et al., 2009). Bergslagen mineral endowment is diverse, ranging from iron oxides to massive sulfides, as well as skarns and potentially a good amount of REEs. Iron oxide deposits are, however, better known because of their historical importance and due to their role as the cornerstone of the Swedish mining industry. These deposits are currently not mined. Mining iron oxide deposits peaked in the late 1970s (Magnusson, 1970). Following this, due to the decrease in iron ore prices and a drop in tonnage, mining these deposits was no longer economically viable, especially using underground mining methods (such as block-caving). Mining also has a long history in Blötberget (our study area). Deposits were mined for 25–30 years until mining stopped in 1979; much of this mining took place down to 280–360 m depth levels at two of the main deposits. Nordic Iron Ore, who operates the site, plans to restart mining operations at 400–420 m depth level. The company expects to utilize the existing underground infrastructure after the planned restart of the operation and after the necessary renovations and additions. Current mining in the Bergslagen district is mainly focused on massive sulfides in three major underground mines: Zinkgruvan, Garpenberg, and Lovisagruvan (Fig. 1).
In the Ludvika region, however, good quality iron oxides such as Blötberget and Grängesberg have attracted recent attention. These deposits have high-quality magnetite and hematite with 25 %–60 % Fe content but are readily upgradable to as high as 71 % Fe content with low impurities (e.g. S, Hg, and P), making them highly attractive for iron ore mining and production. The deposits occur within inliers of ca. 1.90–1.85 Ga felsic volcanic rocks (usually metamorphosed) surrounded by migmatite and later granitic and pegmatitic intrusions (Kathol et al., 2020). Mafic lenses also sometimes occur within the volcanic rocks. Mineralization, in sheet-like occurrences, is usually magnetite dominated but sometimes has some hematite content and some amount of apatite. In Blötberget, the iron oxide deposits occur in four sheet-like bodies: Kalvgruvan (apatite-rich magnetite mineralization: 92 % magnetite versus 8 % hematite), Hugget (apatite-rich magnetite and hematite mineralization: 39 % magnetite versus 61 % hematite), Flygruvan (apatite-rich magnetite and hematite mineralization: 67 % magnetite versus 33 % hematite), and Sandellmalmen (apatite-rich magnetite mineralization). Stratigraphically, the hematite-rich zones (Hugget-Flygruvan) overlie the magnetite-rich zones (i.e. Kalvgruvan). According to Jonsson et al. (2013), Grängesberg, which is approximately 10 km southwest of Blötberget and occurs along a similar geological environment with similar magnetic trend, is of Kiruna-type magmatic or high-temperature hydrothermal origin. Kiruna is a world-class iron oxide mine (+600 Mt of proven reserves) producing approximately 3 %–5 % of global iron ore.
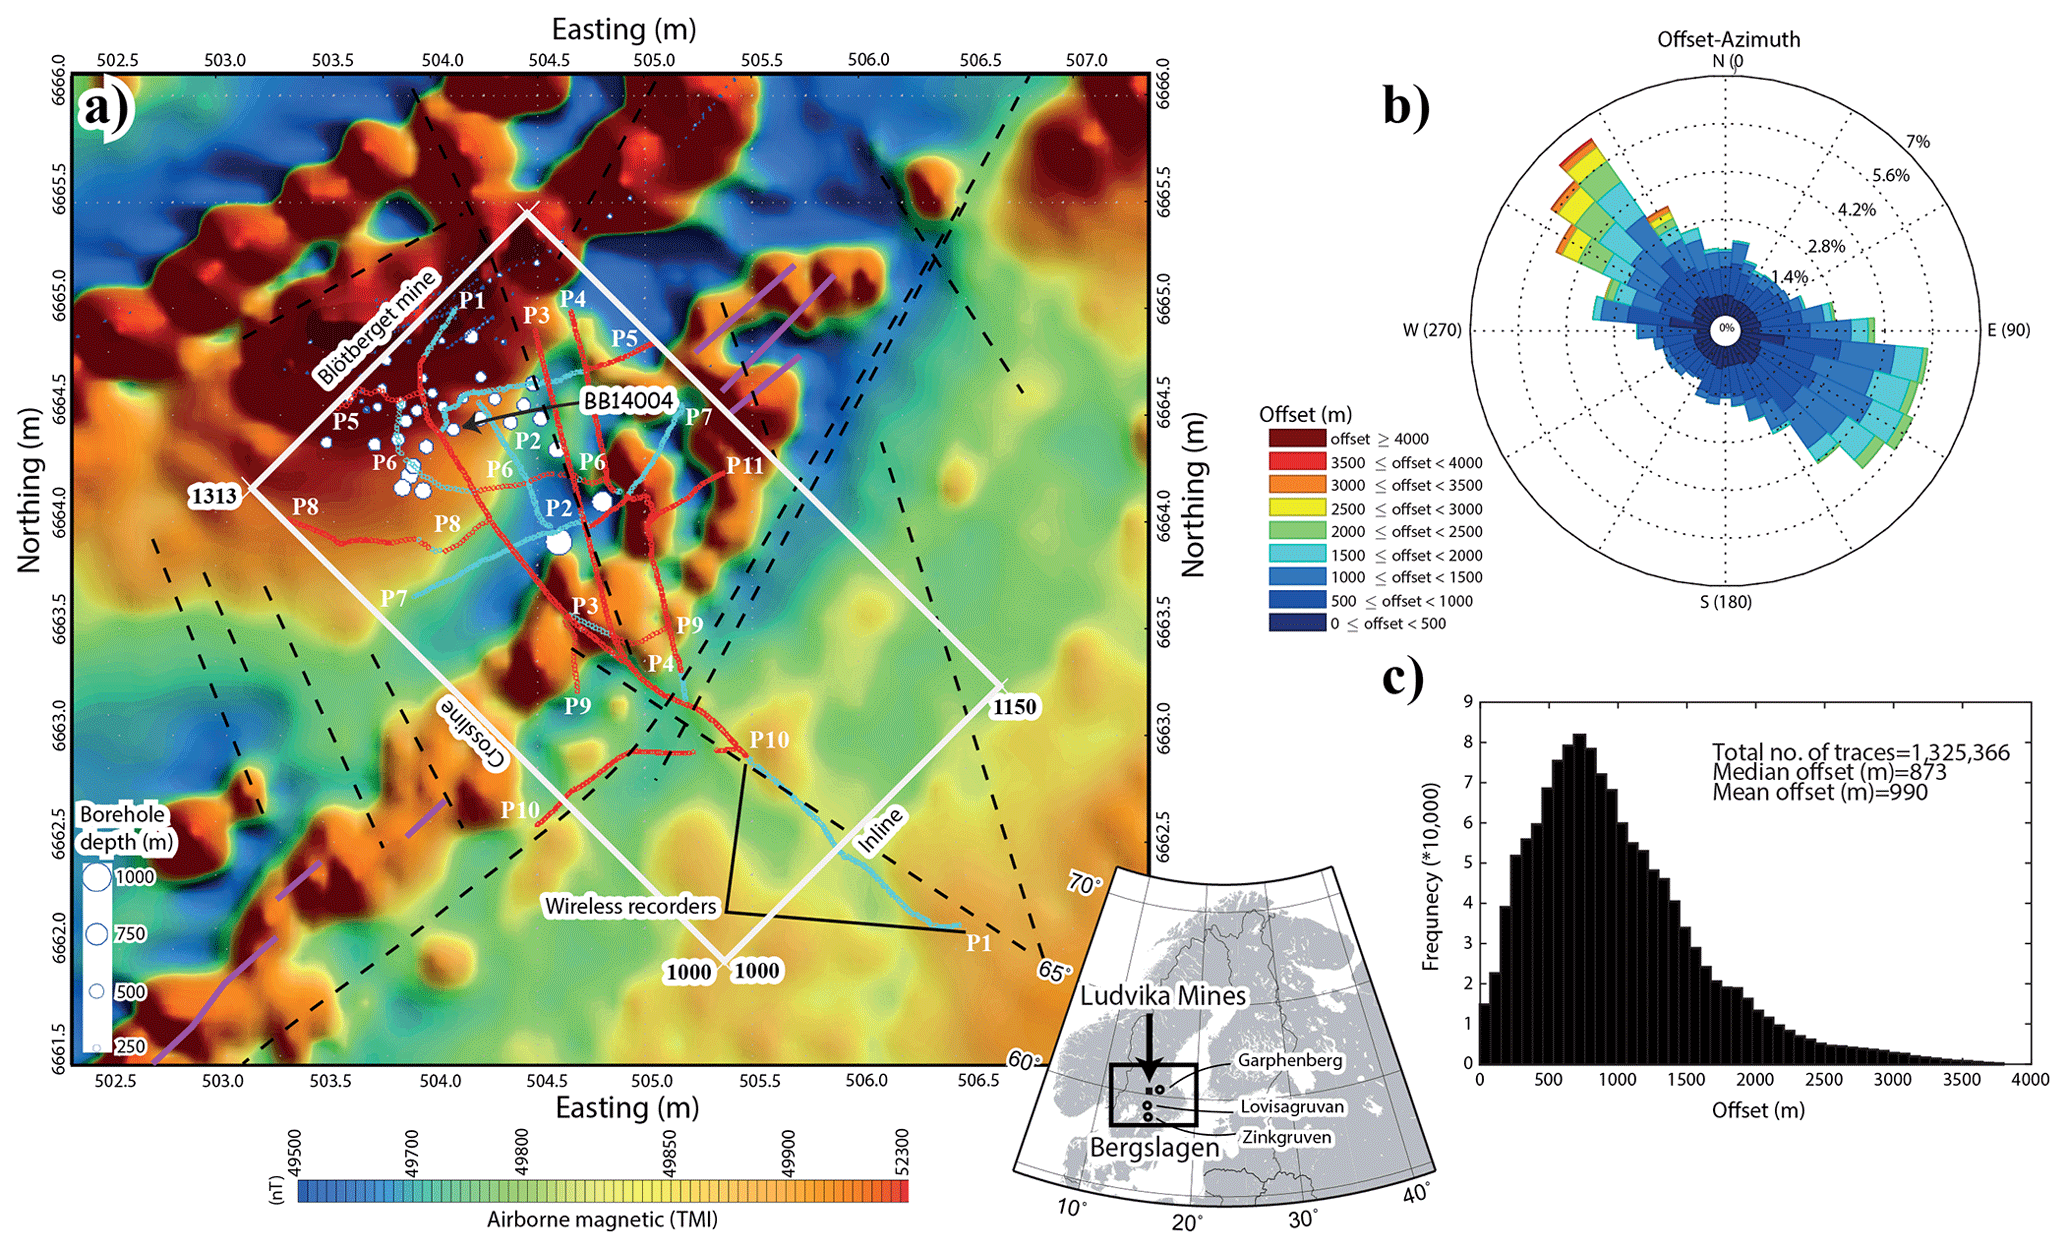
Figure 1(a) Total-field aeromagnetic map of the Blötberget mine in central Sweden and the sparse 3D seismic survey area. P1–P11 were set up as part of the survey (fixed geometry). The red dots show the shot locations (1056 points), and the blue dots are the receiver locations (1266 points). P10 and P11 were added later to improve fold and azimuth coverage and comprise only shots. Along P1, several co-located 2D profiles have since 2015 been acquired (land streamer survey in 2015 and conventional plant-type geophones in 2016). Downhole logging data from BB14004 are presented in this study. (b) Offset-azimuth coverage showing a narrow azimuth survey setup primarily for targeting the known southeast dipping of the iron oxide deposits and (c) an offset distribution showing a median offset of approximately 900 m for the whole dataset. Magnetic data were provided by the Geological Survey of Sweden. Dashed lines in (a) are topographic and structural lineaments extracted from the geological map of the study area. Solid purple lines are interpreted as dykes.
According to Nordic Iron Ore, mineral resources at Blötberget are known to strike NE–SW for several hundreds of metres and down up to 800 m (based on two deep holes drilled in the early 1970s; see Fig. 1) in sheets of 10–50 m thickness. Estimated tonnage is 45.4 Mt of which 41.7 % is classified as iron, and 9.6 Mt of which 36.2 % is iron. In terms of inferred resources, one can add another 11.8 Mt of 36.2 % iron. The site may have much more potential, given that the lateral extent of the deposits is less known and that there are currently no boreholes available deeper than 800 m, on either the eastern and western parts of the survey area. These areas were obviously one of the main targets of the 3D seismic survey to provide insight into whether drilling these places would add to the existing resources.
In terms of structures, the deposits dip moderately (40–50∘) towards the SE in repeated horizons that are seemingly concordant in the stratigraphy; at a depth of approximately 500 m, they dip much more gently in a listric-form manner. The Geological Survey of Sweden has mapped a number of topographic and magnetic lineaments in the area striking dominantly in the NNW–SSE direction (Fig. 1a), although their nature and 3D geometry are uncertain. Recent hydrological tests in preparation for the feasibility of mining in the existing boreholes suggest the potential for similarly trending structures (e.g. fracture systems) immediately south the Blötberget. However, not many depth constraints are available nor is there evidence of any clear offset (faults). Historical mine plans also suggest a NNW–SSE-trending fracture system intersected at depth during the mining activities. In terms of tectonic history, the Bergslagen area is known for its multiphase deformation, with several faults being reactivated as either normal or reverse, meaning that the present displacement cannot be simply linked to one event (see Stephens et al., 2009; Malehmir et al., 2011).
With the exception of a speculative anti-form axis mapped nearly 20 km south of the Blötberget, no clear evidence of folding is present on public geological maps. Outcrops are scarce in the area, making detailed mapping extremely difficult. In Blötberget, this is even more problematic since it occurs in a rather swampy lowland area (Blöt means wet in Swedish; Blötberget means wetland) with only a few locations south of the study area where a few patchy outcrops are present. Knowing any structures and their geometries at depth is important, not only for future mining operations but also to help understand the geological settings at which the deposits are emplaced, thus optimizing future drilling programmes in the area.
A good understanding of reflection seismic response is more accessible when physical properties are studied in situ using downhole logging methods (Salisbury et al., 2000). Through the years 2015 and 2016, six boreholes (400–550 m deep) were logged downhole using various probes; relevant for this study is the full-waveform triple sonic probe (Maries et al., 2017). Density measurements could only be done on core samples at 1 m intervals. These studies showed (Fig. 2) that with the presence of suitable geometries and sufficient signal-to-noise ratios, direct targeting of iron oxide deposits (magnetite and hematite) is possible and should be extremely helpful for deep exploration at the site. In particular, it was found that iron oxide deposits, due primarily to their large density contrast with the host rocks, should allow strong seismic signal, a fact that was later also confirmed through 2D and cross-profile seismic recording studies (Malehmir et al., 2017a; Markovic et al., 2020; Maries et al., 2020).
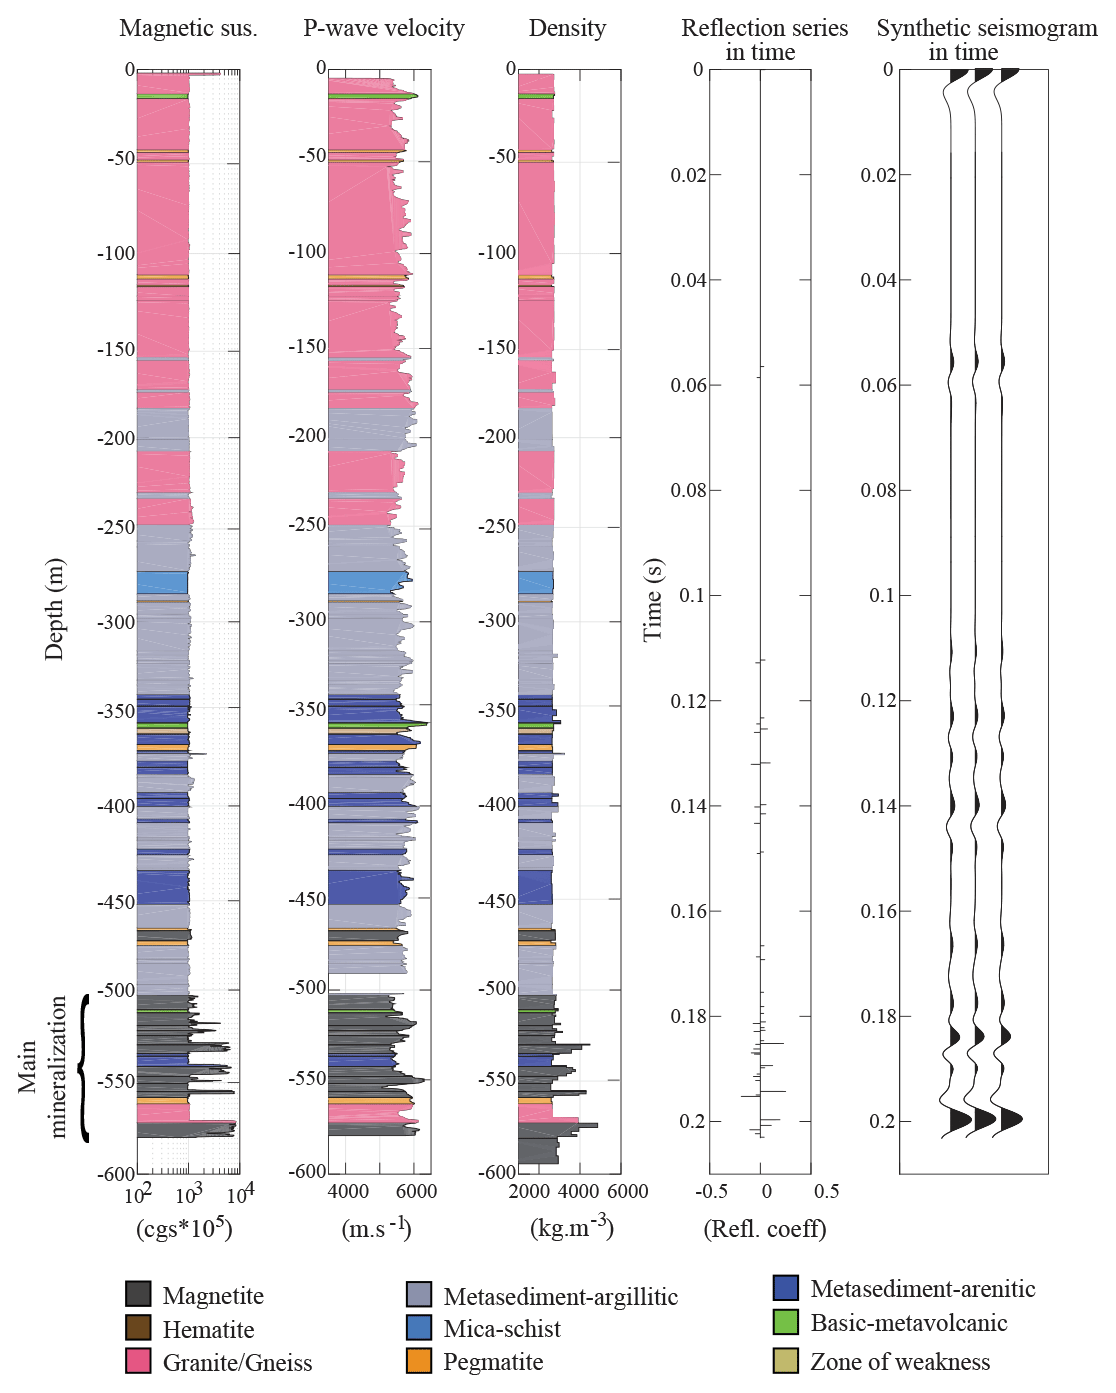
Figure 2Example of downhole logging data from borehole BB14004 (Fig. 1a) showing why a strong seismic response from the iron oxide mineralization is expected based on the synthetic seismograms (70 Hz Ricker wavelet) generated from the data. Adapted from Maries et al. (2017).
Before the acquisition of the 3D dataset, a number of 2D surveys were conducted at the site. Starting in 2015, a newly developed MEMS (micro-electromechanical system)-based seismic land streamer was tested for a pilot deep-targeting work at the Blötberget site. Data were acquired using 100-MEMS sensors placed 2–4 m apart on the streamer (240 m long) and 75 wireless recorders placed north and south of the profile (fixed position, moved from the south to the north once the streamer progressed halfway along the length of the profile). A 500 kg Bobcat-mounted drop hammer was used as the seismic source. In total, the streamer moved nine times providing, together with the wireless recorders, a nominal fold of 40. During approximately half a week, 3.5 km of seismic data along profile 1 (P1) were acquired using 1049 receivers and 533 shot locations. This combination allowed for imaging of the iron oxide deposits down to 800 m depth (Malehmir et al., 2017a), a landmark for the use of land streamers for such a purpose but also the potential of the seismic methods for their depth targeting.
In 2016, a more commercial-type survey using cabled-plant geophones and the same drop hammer seismic source but a much higher fold (fold of 208 using 5 m shot and receiver spacing) was conducted (Bräunig et al., 2020; Markovic et al., 2020). A cross-profile recording was also attempted using a fixed geometry along P1 (451 receivers) and a shorter perpendicular profile (75 receivers spaced at every 10 m) along P6. Shots were recorded onto both profiles simultaneously. The 2016 experiment showed deeper imaging of the iron oxide deposits down to 1200 m. The cross-profile study (Maries et al., 2020) also suggested a 300 m depth extension of the deposits similar to that of the ore body block models from the borehole data. Potential geological structures were also identified, but a 3D seismic survey was needed to account for the 3D geology of the site and its complex tectonic history. Our earlier studies of 2D versus 3D seismic surveys (Malehmir et al., 2017b) were a further motivation not to push the 2D interpretations further until a 3D seismic dataset becomes available.
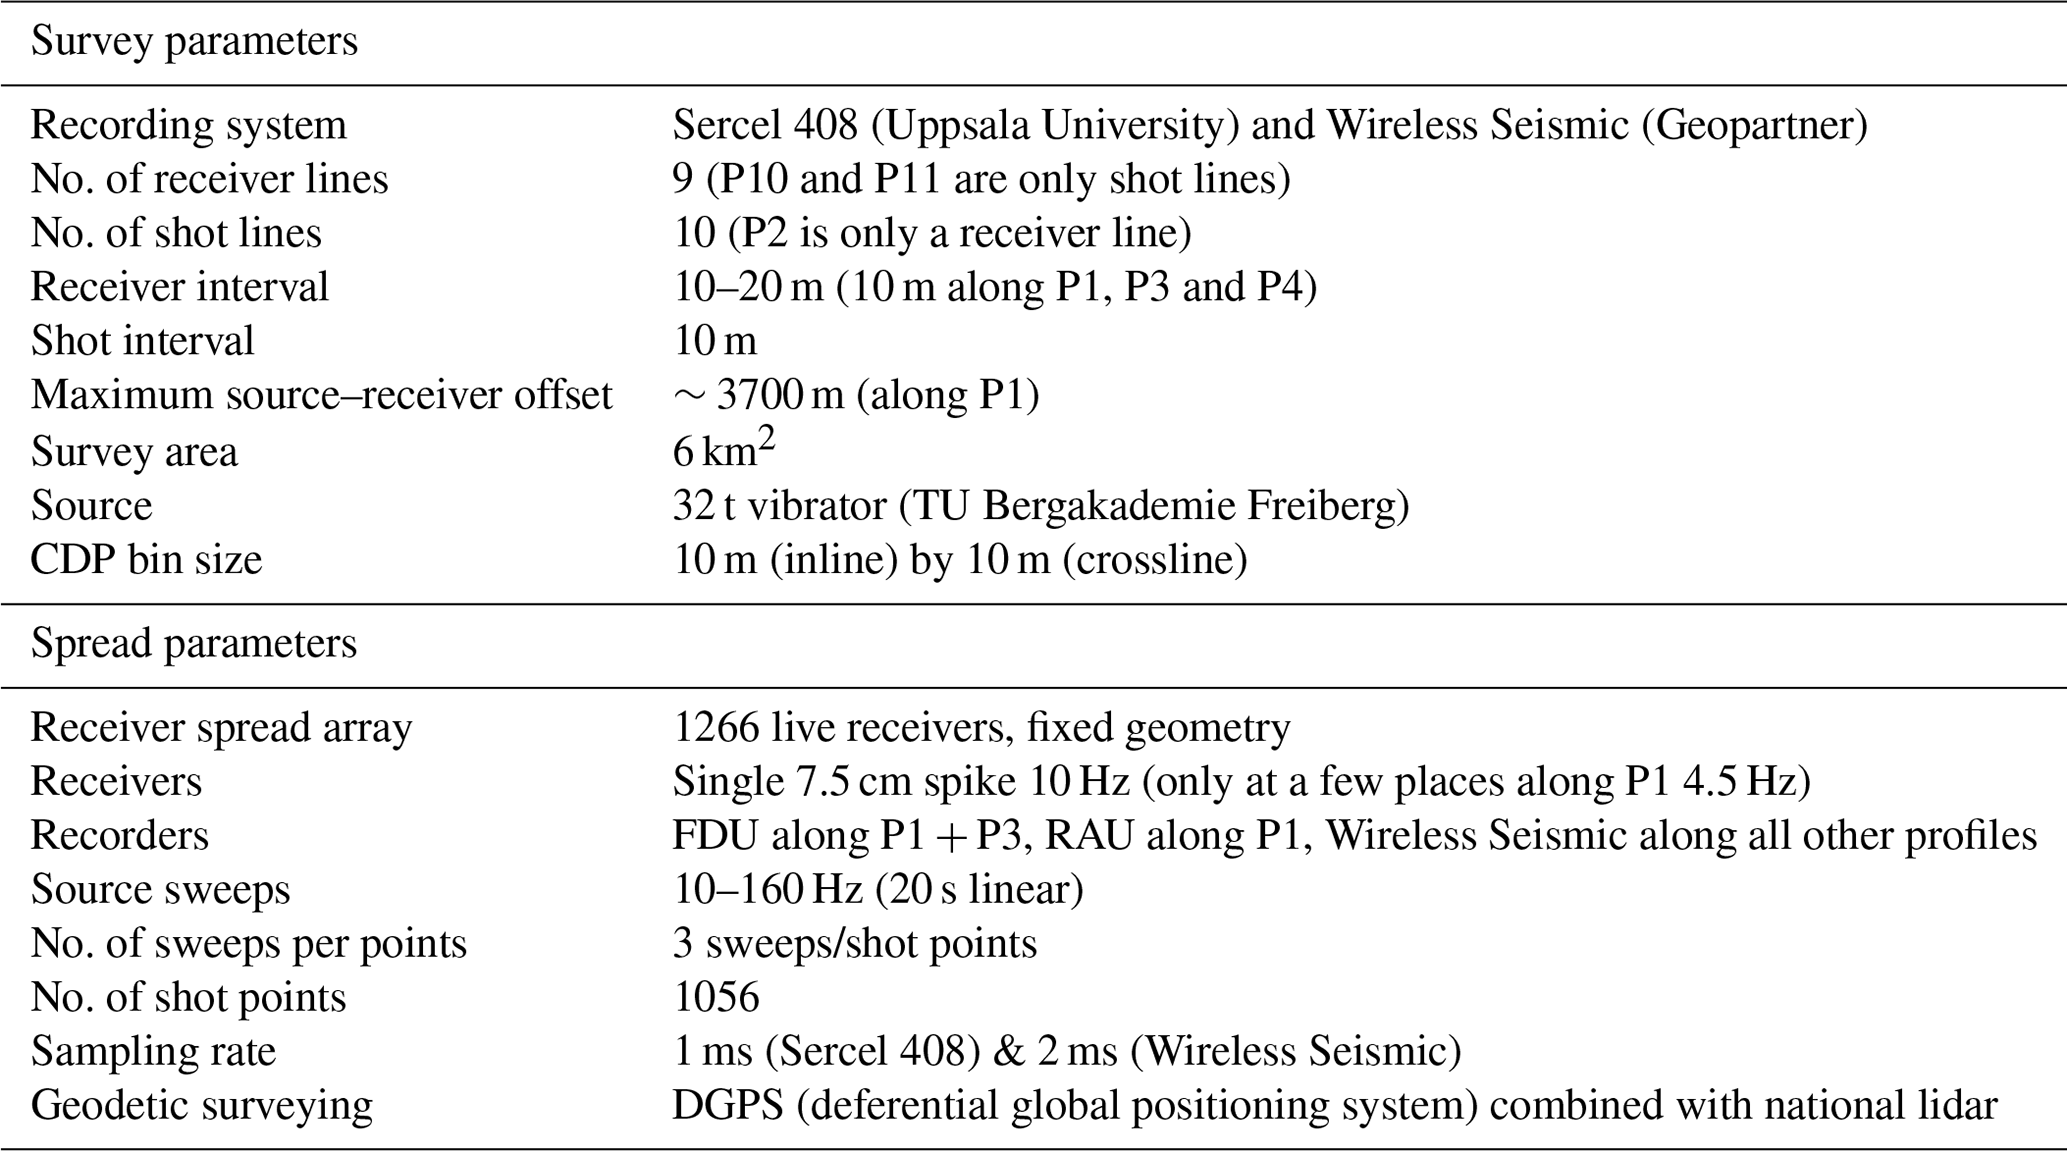
As part of a large research and innovation project (Malehmir et al., 2019), a 3D seismic dataset (approximately 3 by 2 km) was acquired during April–May 2019 using a fixed geometry comprising 1266 receivers (9 receiver lines, P1–P9) and 1056 shots (10 shot lines, no shots on P2) and the 32 t vibrator of TU Bergakademie Freiberg generating three shot records per location with a 20 s long sweep ranging from 10–160 Hz (Figs. 1 and 3). A combination of 10 and 20 m receiver spacing was used depending on profile location after a pre-study of the fold and offset-azimuthal coverage using the equipment available to this study. In the survey both cabled (P1 and P3) and wireless recorders (P1–P2, P4–P9) were used from two suppliers, Sercel and Wireless Seismic (Fig. 4). The seismic profiles were planned to provide the best illumination angle, orthogonal to the known strike of the mineralization. Table 1 details the main acquisition parameters of the 3D survey.

Figure 3Field photos from the 3D seismic survey (April–May 2019) in the Blötberget mine. The survey was conducted using the 32 t vibrator of TU Bergakademie Freiberg, with 1266 receivers, 414 of which were cabled (part of P1 and entire P3). The cabled profiles were used for live data quality control and sweep parameter tests. Earlier reported 2D profiles (years 2015 and 2016) were also along P1. Photos by Alireza Malehmir.
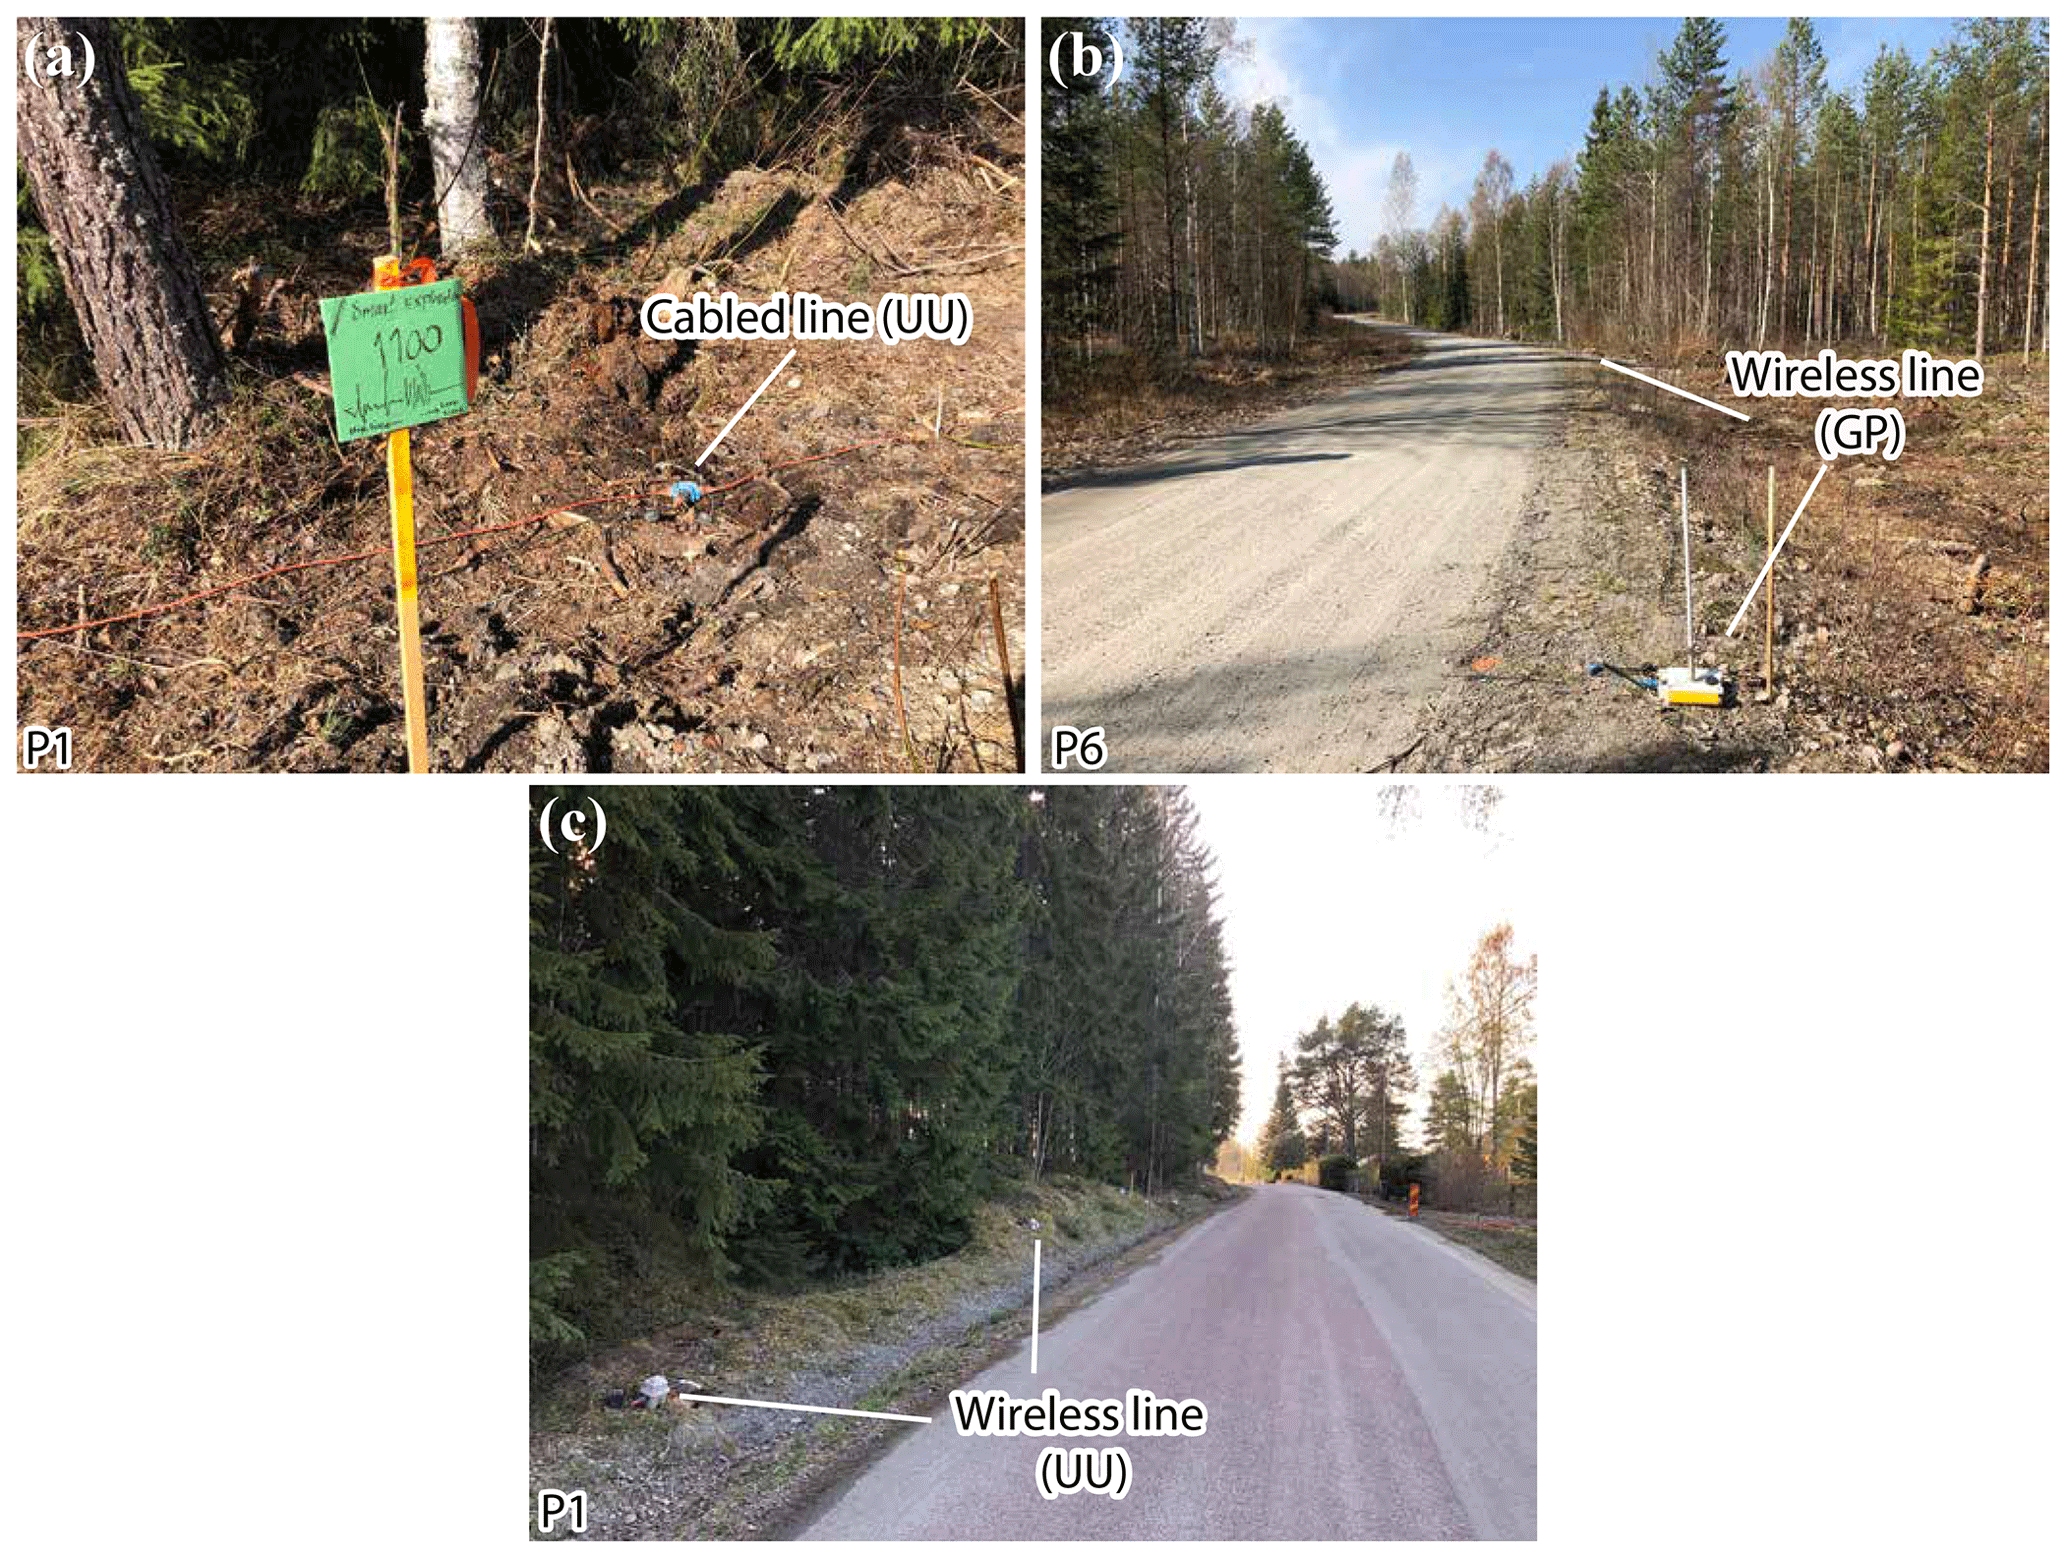
Figure 4Field photos showing different seismic recorders used during the 3D survey. (a, c) With the exception of P1 and P3, where a Sercel recording system was used (cabled and wireless recorders along P1 and only cabled along P3), (b) all other profiles were acquired using RT2 Wireless Seismic requiring a maximum distance of 50 m for data crosstalk and live data harvesting. The choice of the recorders was solely dictated by their availability to the research team. UU stands for Uppsala University, and GP stands for Geopartner. Photos by Alireza Malehmir.
Table 1The main acquisition parameters of the Blötberget 3D seismic survey, April–May 2019.
5.1 Planned versus executed survey
Prior to the main survey, a number of visits had to be done in order to check for the location of shot and receiver lines. Earlier surveys in 2015 and 2016 were helpful in deciding which one of the profiles needs to be acquired but also for answering the geological questions concerning both depth and lateral extent of the deposits. We counted on 1500 receivers with a spacing of 10 m for both shots and receivers. However, this turned out to be impractical as nearly 250 extra receivers were needed during the survey. The planned survey counted for shots on the southern part of the area, which were not permitted at the end, as well as shots along P7. Figure 5a and b show planned receiver and shot profiles and CDP (common depth point) bins for 10 and 20 m, respectively. The planning aimed to acquire a uniform source–receiver offset-azimuth coverage (Fig. 5d). However, in practice this was not possible and compromises had to be made. Figure 5c shows the executed survey and its fold coverage using a 10 m CDP bin size. Adding shot lines P10 and P11 and more shots along P8 helped to obtain a more azimuthally favourable 3D dataset with respect to the dip and strike of the known mineralization. With the exception of P1, P3, and P4, receivers were placed every 20 m on average, but shots where possible generated at every 10 m spacing. This setup helped to extend the survey area towards the west compared to the planned setup. The receiver setup had also taken a maximum distance of 50 m into consideration for the wireless seismic recorders, which explains the way the receiver profiles are connected in the 3D setup.
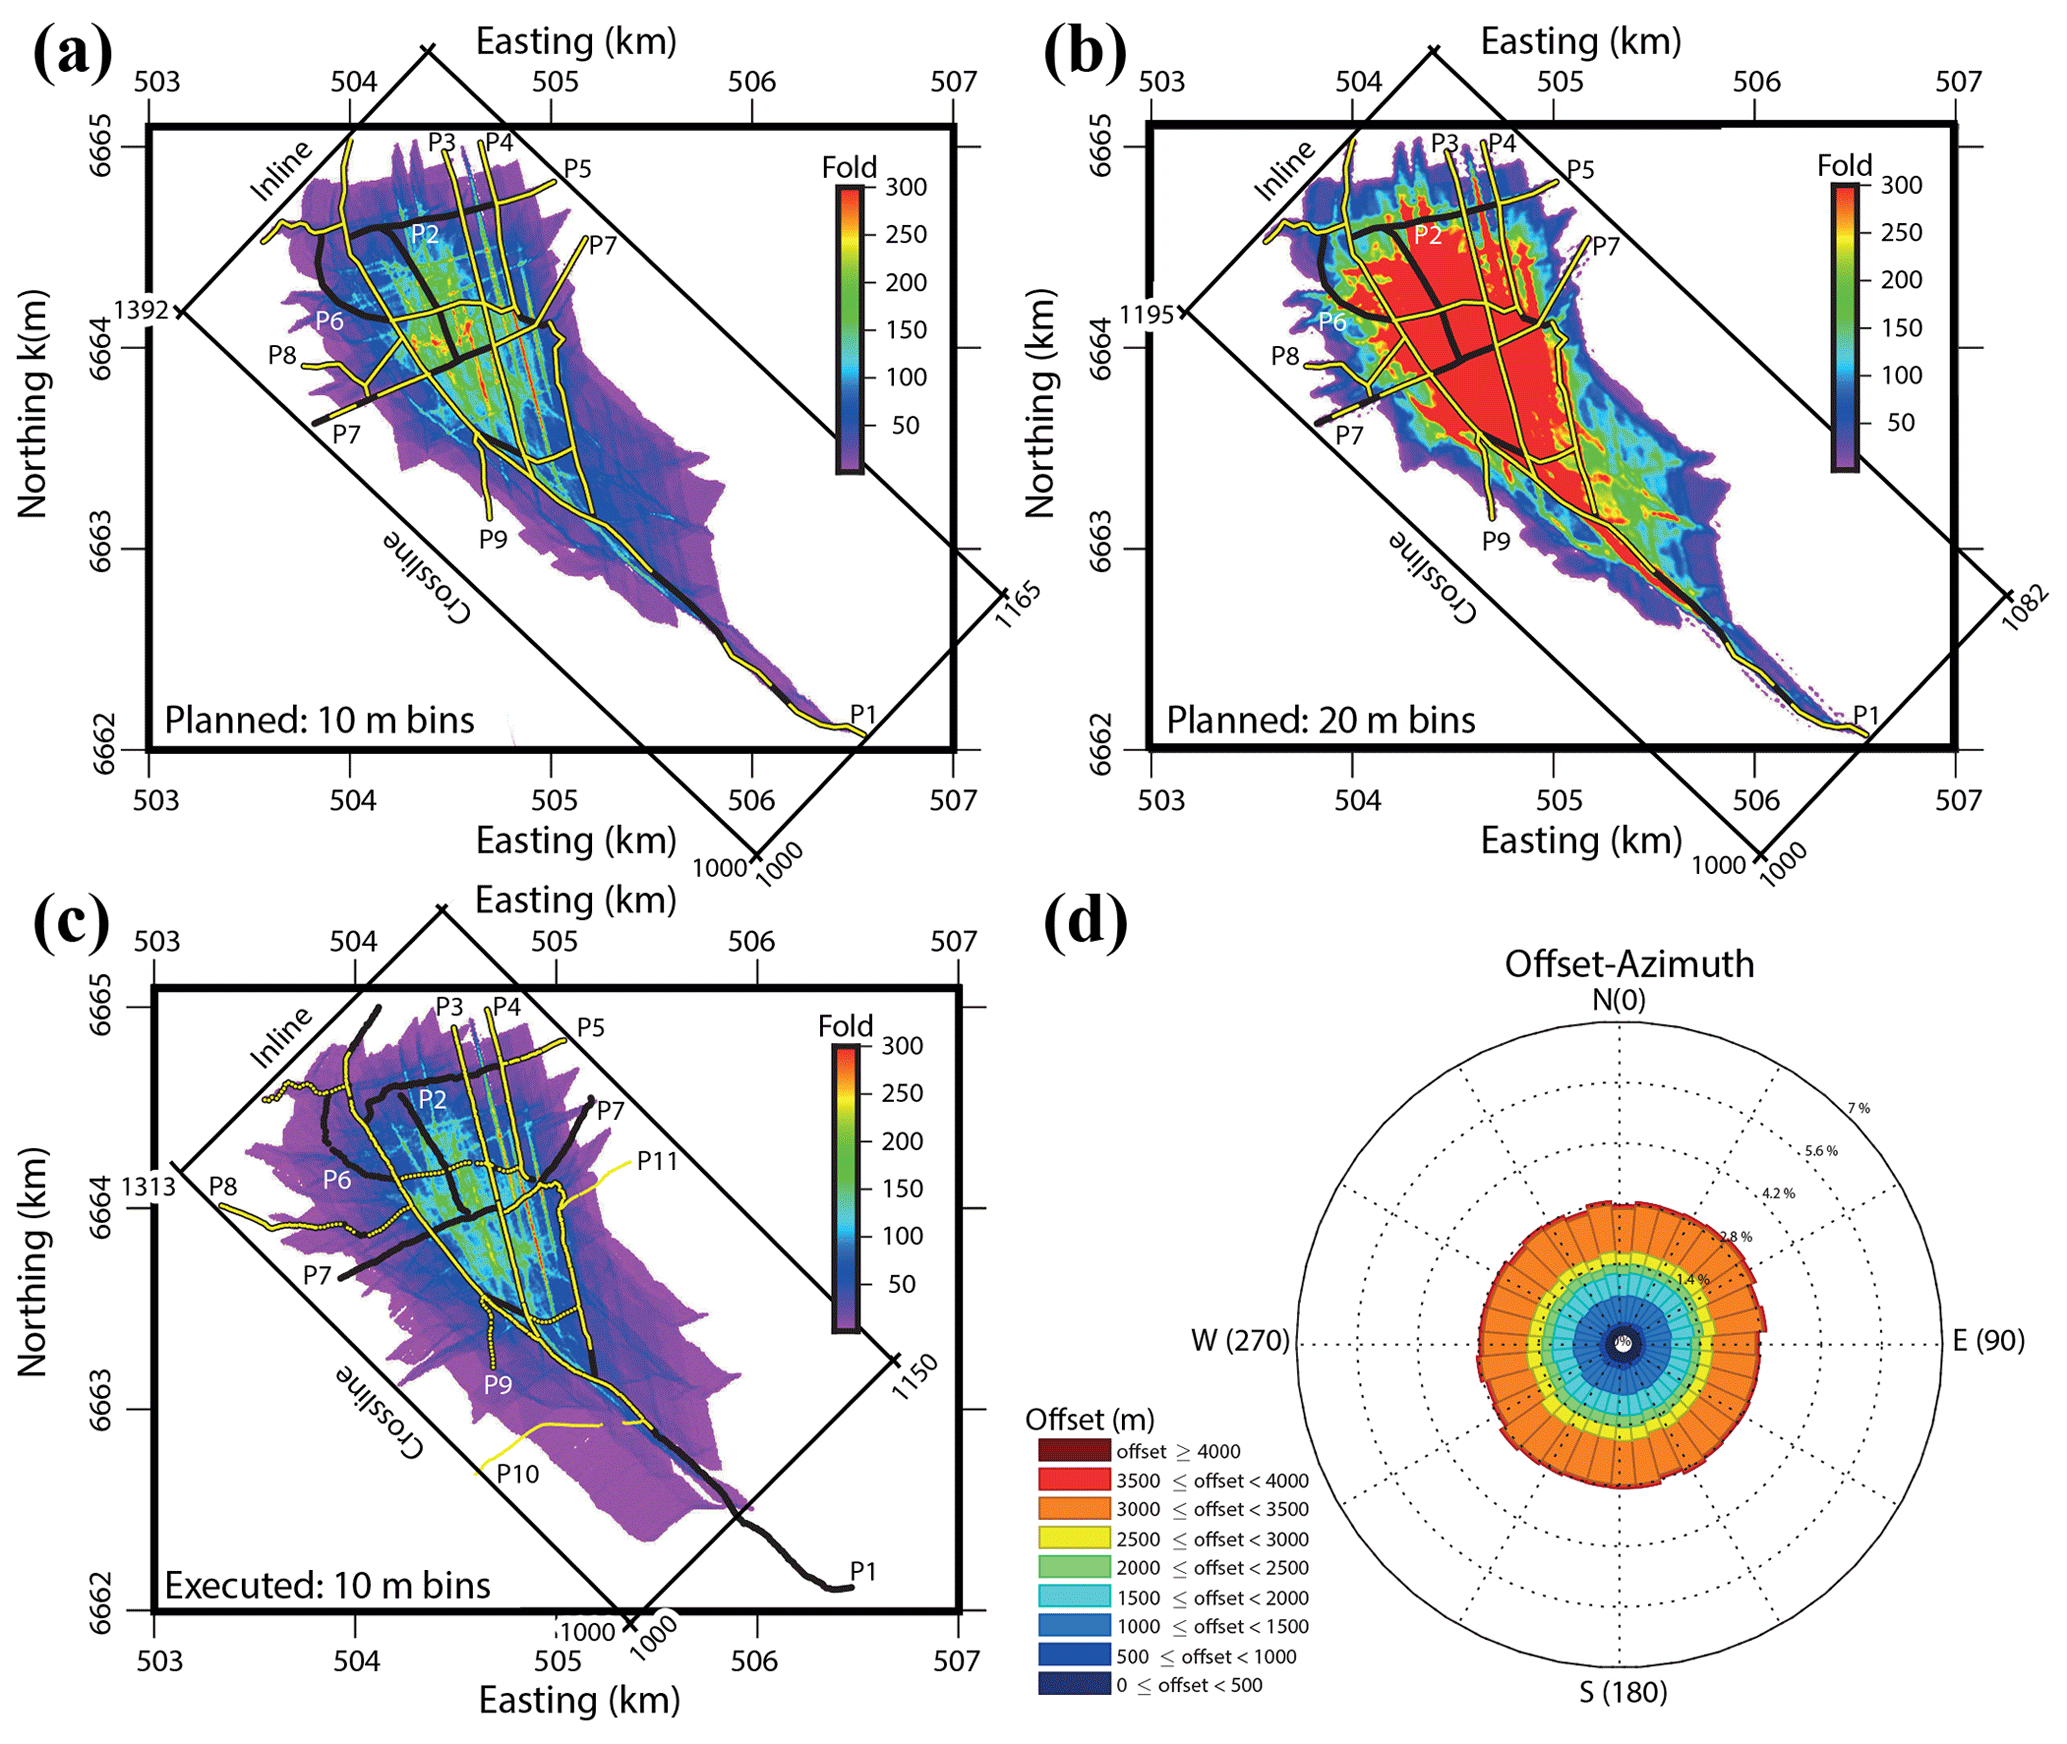
Figure 5Planned versus executed 3D survey at Blötberget. Planned survey and fold coverage using (a) 10 m and (b) 20 m regular CDP bins. (c) Executed survey and fold coverage using 10 m regular bins as used for the processing of the dataset. (d) Planned offset-azimuth coverage. The executed survey is shown in Fig. 1b. Yellow points are shot locations, and black points are receiver positions (see also Fig. 1a). While the planned survey had more uniform offset-azimuth coverage, due to permitting issues shots on the southern portions of P1, P7 and parts of P5 could not be covered. The planned survey also aimed for 1500 receivers, whereas at the end only 1266 became available. The executed survey ended to cover more areas west of the survey area, which was important in imaging westward extension of the deposits as discussed in the article.
5.2 Sweep parameter tests
We spent one day to test optimum sweep parameters given the swampy conditions of the Blötberget area. The cabled P1 and P3 lines were used for this purpose but also for live data quality control during the main survey. About 70 different sweeps were tested with different frequency ranges, drive forces, and sweep lengths. Figure 6 shows a selection of shot gathers along P1 (after cross-correlation) for various sweep ranges. A drive force of 60 % was chosen to guarantee sufficient signal strength for the envisaged target depth (<2000 m). The lower end of the tested frequency bands (10 Hz) was mainly dictated by the vibrator specifications, while the upper end of the tested frequency band and the sweep length were more carefully tested. Our analysis of the test shots convinced us to choose a linear sweep ranging from 10 to 160 Hz with a sweep length of 20 s to allow more low frequencies to be generated compared to 17 s long sweeps. The choice of sweep length has some influence in the bandwidth of the signal, with 20 s appearing much flatter than 17 s, which is a further reason why 20 s sweep length was chosen. As for the cross-correlation, we tested this with both the pilot and the theoretical sweep, and without question the theoretical sweep produced the most convincing results. Therefore, it is used in the study for data quality control during the survey and for processing the dataset.
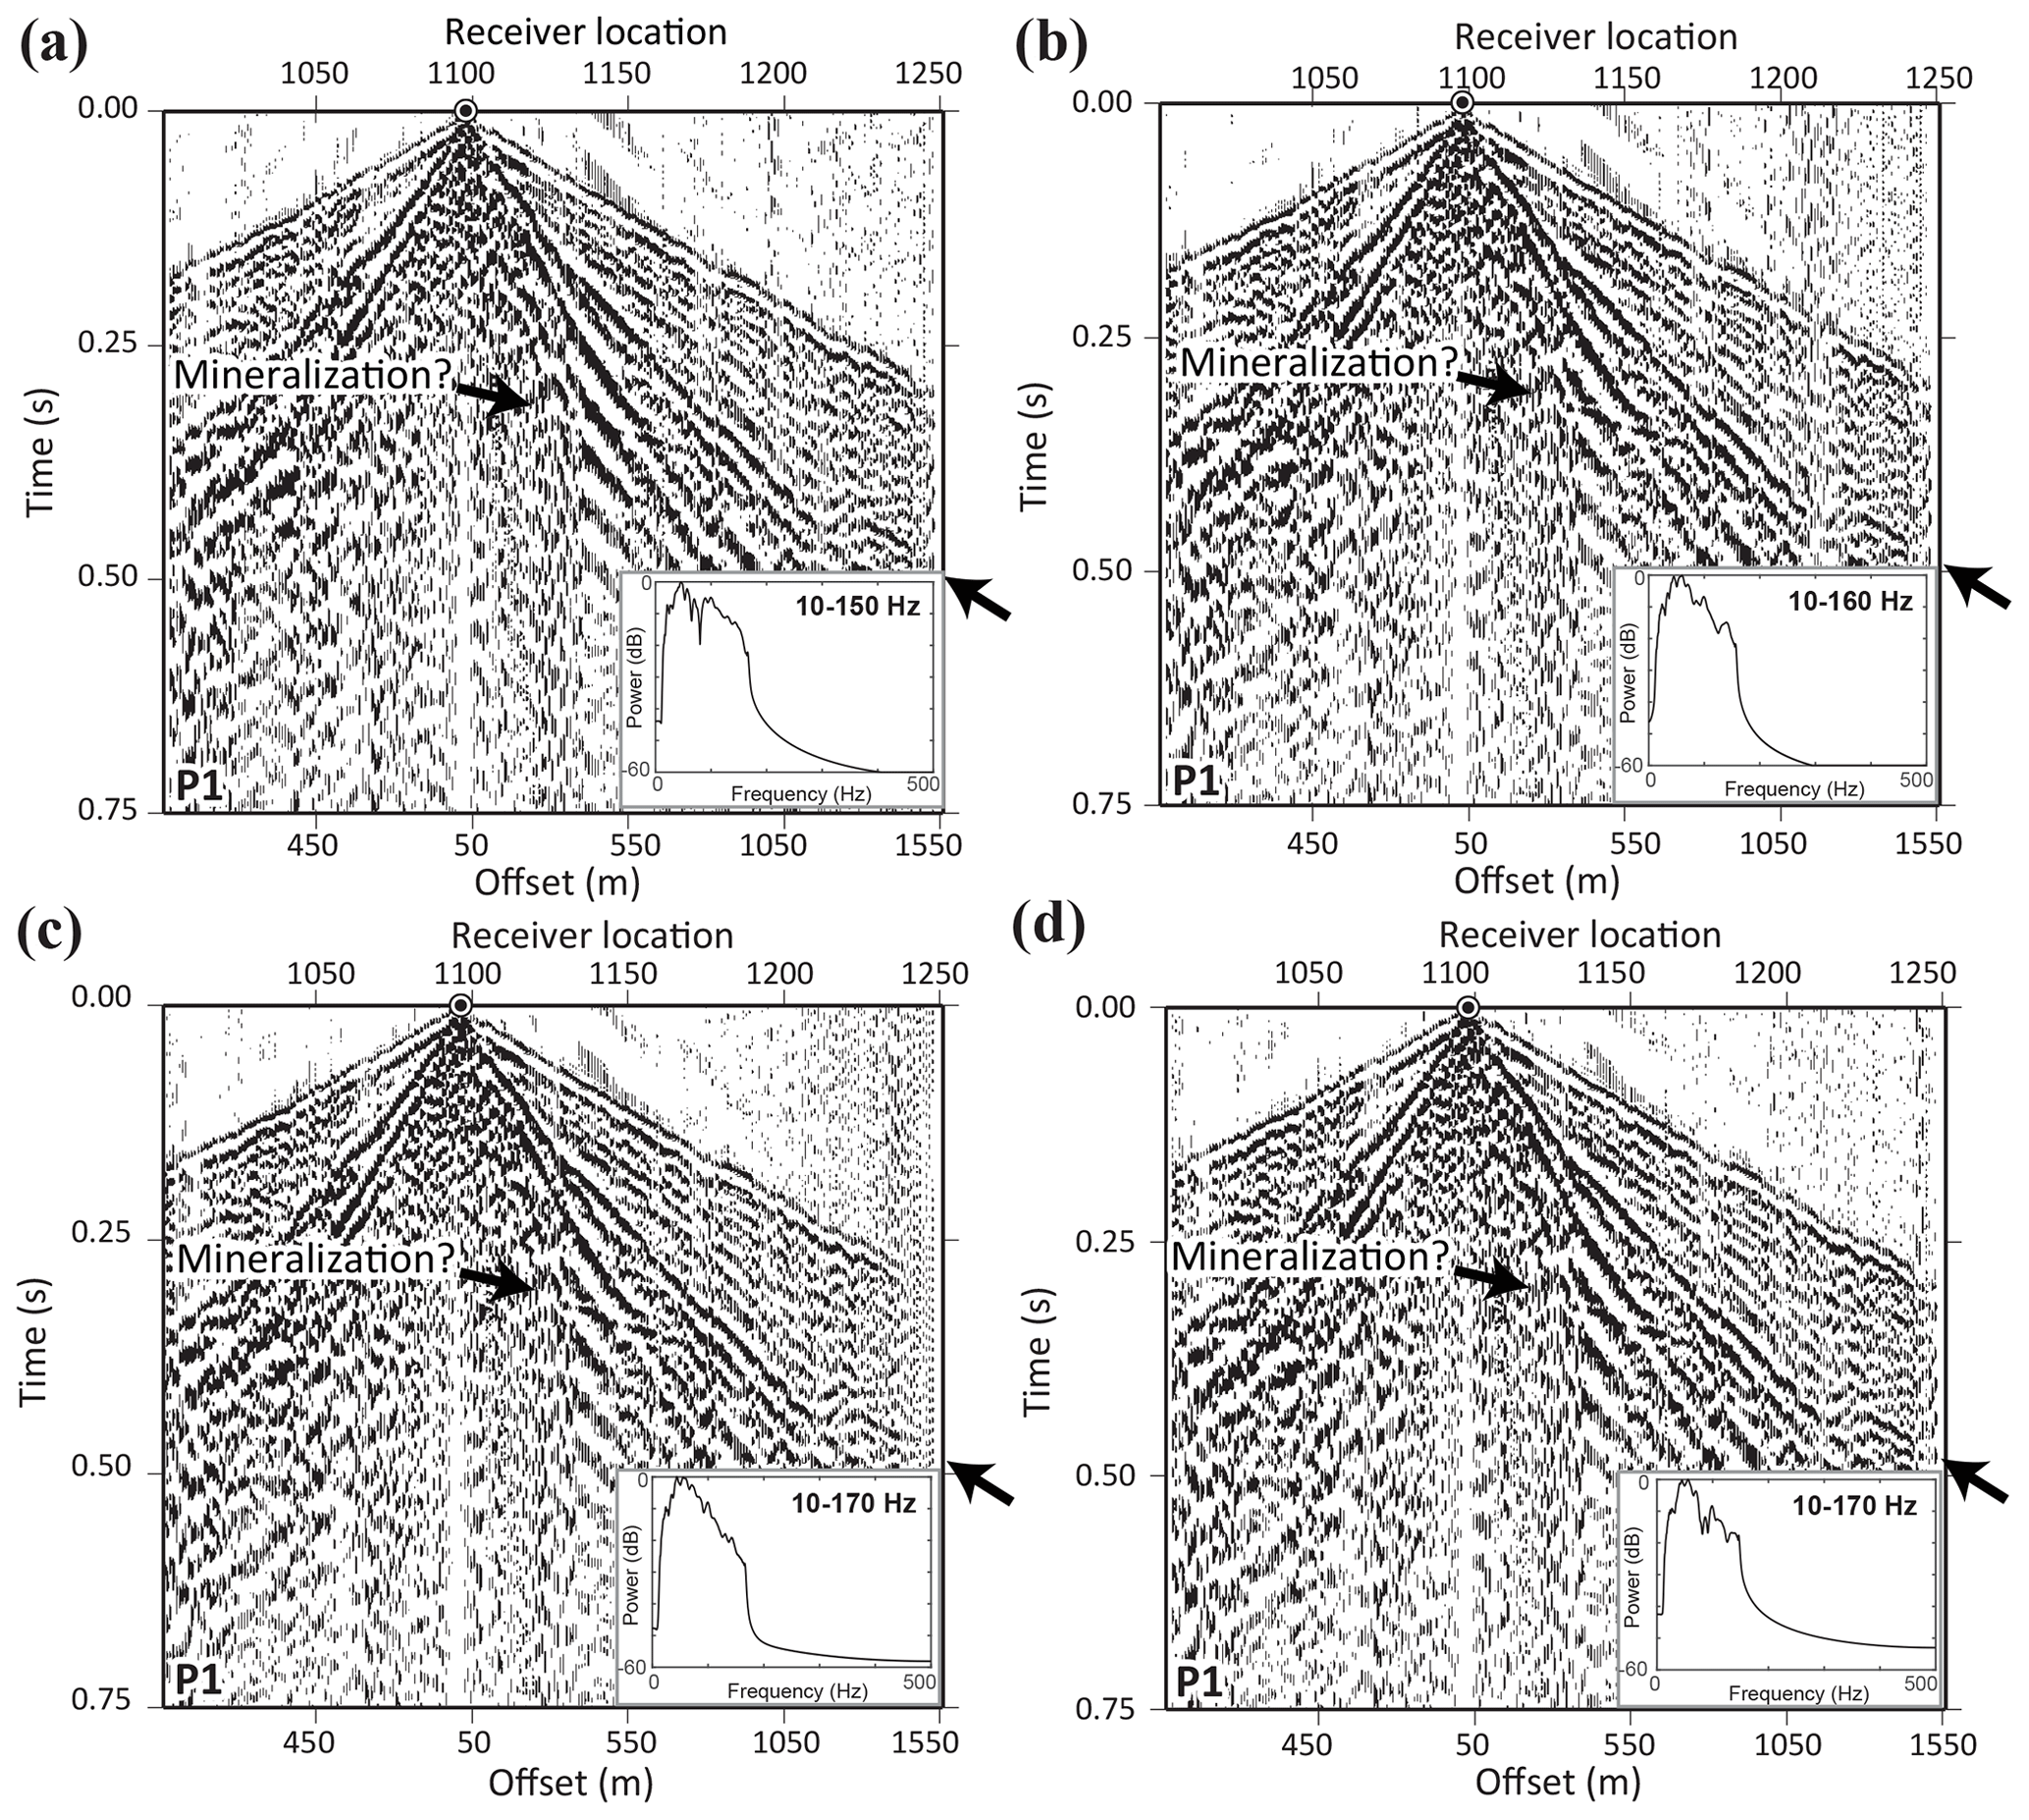
Figure 6Shot gathers (after cross-correlation) and their corresponding amplitude spectra along the cabled part of P1 showing sweep parameter tests with the following parameters: (a) 10–150 Hz, 60 % force, and 17 s sweep length; (b) 10–160 Hz, 60 % force, and 17 s sweep length; (c) 10–170 Hz, 60 % force, and 20 s sweep length; and (d) 10–170 Hz, 70 % force, and 20 s sweep length. Both higher end frequencies of 160 and 170 Hz were judged to be suitable; however, we decided to choose 160 Hz because it produced less ground-roll energy compared to 170 Hz. The arrow shows the expected reflection from the mineralization.
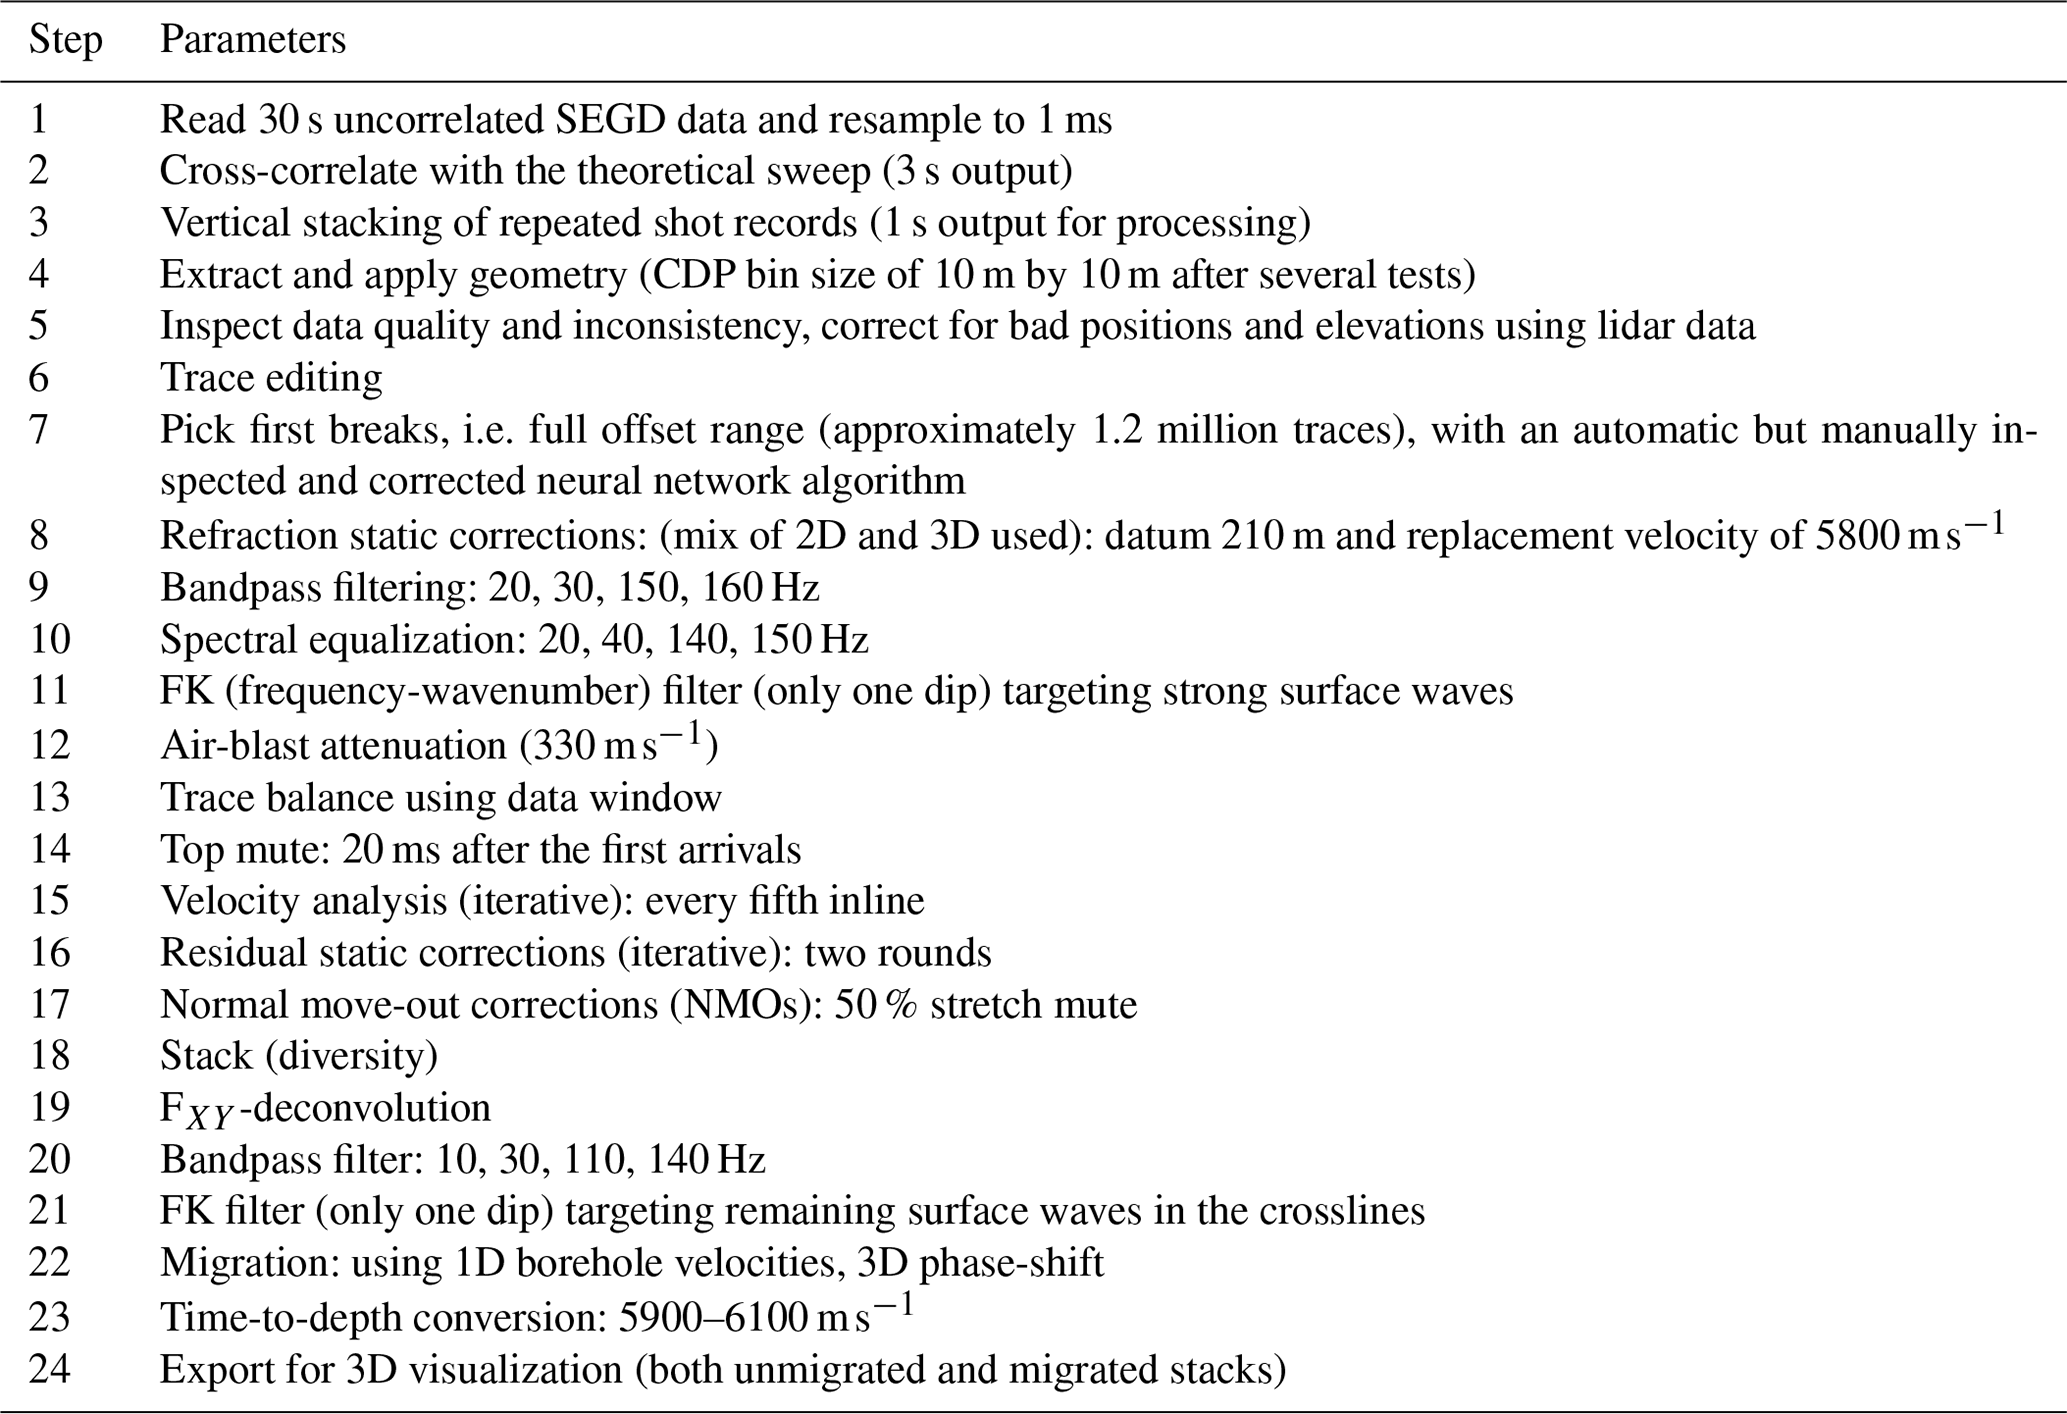
5.3 Tailored processing workflow
Although Blötberget is known for its swampy areas, human-made built-up places and several water streams can be found in the area. The 3D seismic data show remarkable quality with the first breaks clear in all shot gathers. To showcase this, we present a shot gather after cross-correlation and vertical stacking of three repeated shot records in Fig. 7a. While near-surface conditions vary extremely from one profile to another, it is already possible to observe a strong reflection in nearly all the receiver lines. This excellent data quality can also be judged as an argument on the choice of the source and sweep parameters used in the survey. To illustrate that quality data were also acquired on other profiles, in Fig. 8a we present a receiver gather from P2 that was positioned along a major canal (most likely related to the past mining activities in Blötberget) in the central part of the study area. Note that along P2 and most of P5 and P7 only receivers were able to be placed and thus there are no shots from, e.g. P2. Judging again from the quality of the first breaks and a strong reflection observed on all the shot lines, one can already argue for the quality of the dataset and hence a quality control for reliable interpretation of the reflections in the final seismic volume. These recorded examples, however, show the challenges encountered with the processing of such a dataset, namely (1) the strong presence of near-surface heterogeneity and (2) the strong surface-wave noise. Therefore, data processing had to be carefully tailored to handle these two issues through a carefully designed workflow and parameter selection. Table 2 details the processing workflow and parameters applied to the 3D dataset. Here we detail a few of the steps given their significance and the sparse nature of the 3D dataset.
Table 2Principal processing steps applied to the Blötberget 3D dataset (2020).
To correct for the effect of near-surface statics due to uneven overburden cover and velocity, approximately 1.2 million first breaks were picked automatically and corrected manually where needed. The 3D refraction static corrections using a two-layer generalized reciprocal method (GRM; e.g. Hampson and Russell, 1984) were first estimated with an rms (root-mean-square) value of 5.5 ms. This was obtained using a moderate smoothing parameter and using only offsets between 10–750 m. Three different rounds of iterations using 300, 200, and 100 m cells split into four triangles were consecutively used to obtain this solution and helped to narrow down the rms from 15 to 5.5 ms. While the 3D static corrections partly improved the coherency of the reflections (Figs. 7b and 8b) and the first breaks, along some of the profiles such as P4 and P5 the resulting corrections were found to be too smooth to be effective. This is clear if one carefully looks at the coherency of the first arrivals. Given the sparse nature of the 3D data, we decided to also check if 2D refraction static solutions individually, estimated only for shots and receivers along a specific profile, could produce more coherent reflections than the 3D static solution. This was in fact the case, especially along P4 and P5 where even an rms of 3 ms was obtained and the coherency of the first breaks is much better after the 2D static corrections. We decided at this stage to produce a number of brute stacks, checking which of the solutions would better suit the dataset. The best brute-stacked volume was obtained using a combination of 3D static corrections along those profiles where only receivers or shots were placed (i.e. P2, P7, P10, and P11) and 2D static corrections for the remaining profiles (Figs. 7c and 8c).

Figure 7(a) An example of raw shot gather along P8 after (b) 3D static corrections; (c) mixed 2D and 3D static corrections (used for processing); and (d) bandpass filter, deconvolution (zero-phase or spectral whitening), and top mute. Note the increase in the signal quality and especially the coherency of the reflections marked using the arrows (we expect these to be from the mineralization from the earlier 2D surveys and downhole logging data).
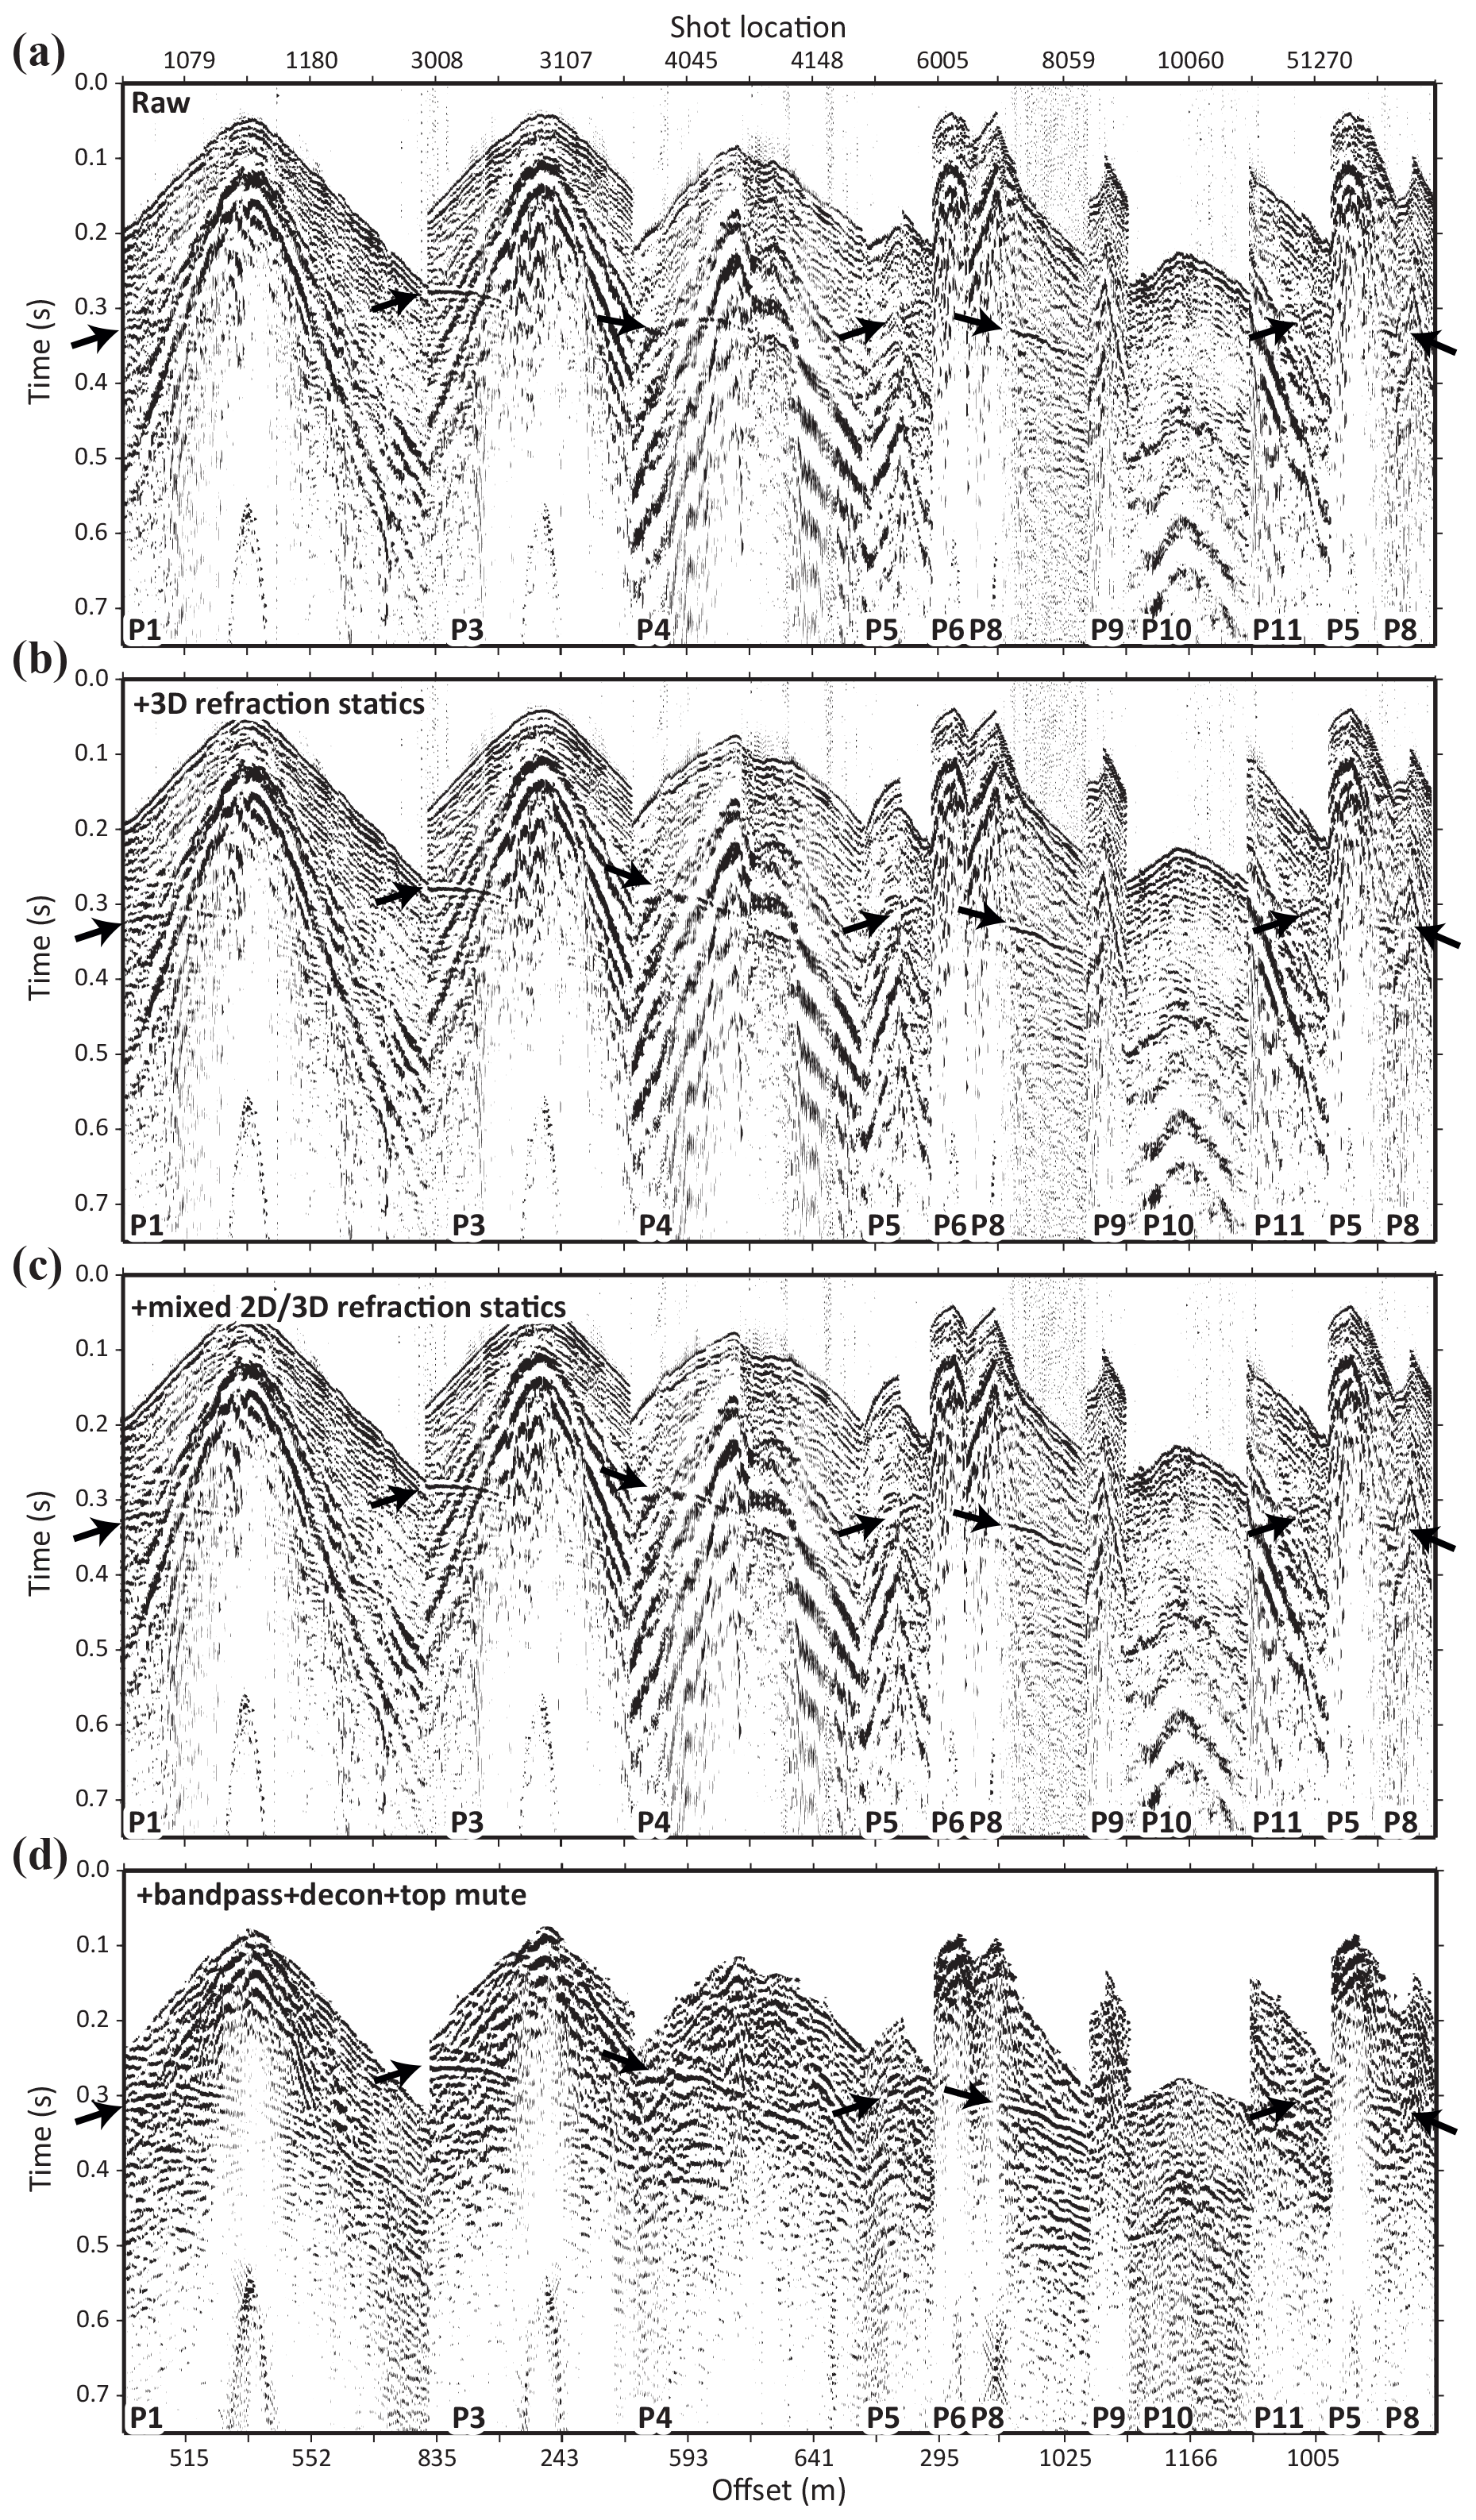
Figure 8(a) An example of raw receiver gather along P2 after (b) 3D static corrections; (c) mixed 2D and 3D static corrections (used for processing; and (d) bandpass filter, deconvolution, and top mute. Note the increase in the signal quality and especially the coherency of the reflections marked using the arrows (we expect these to be from the mineralization observed on the earlier 2D surveys and downhole logging data). Note that shots are only sorted based on their peg numbers as the in-between receivers were shot and named differently (multiplied by 10, e.g. 51 270 is a shot along P5 and at the position between 5127 and 5128).
To attenuate the strong surface waves in the data, three different sets of filters were designed. First a broad bandpass filter (zero-phase filter with a quasi-trapezoidal amplitude spectrum) was applied to the data, keeping frequencies between 30–150 Hz. This partly removed some of the surface waves, but a strong portion still remained. To make sure surface waves would stack out during the stacking step, a spectral equalization filter (zero-phase deconvolution affected by spectral whitening in the frequency domain) was applied between 40–140 Hz. At a later stage an FK filter had to also be applied, without which surface waves would have been still been dominant in the final unmigrated volume. A top-mute function then was designed using the chosen first breaks to make sure first arrivals would not leak as steep events in the final volume. Figures 7d and 8d show the effect of these processing steps on the shot gather example of P8 and the receiver gather example of P2. It is clear that the observed reflections are dominantly improved, though there are still some surface waves remaining in the data.
For the CDP binning of the data, after a number of tests, a bin size of 10 m by 10 m was chosen with inlines following the main direction of the receiver lines (receiver lines were intentionally positioned in this orientation to favour the down-dip direction of the mineralization) in a NW–SE direction (Fig. 5c). According to Yilmaz (2001, Eq. 1), using such a bin size, the maximum non-aliased frequency, fmax, for a reflector dipping at 60∘, α, and using a mean velocity of, vrms, 6000 m s−1,
would be 170 Hz, which is comparable with the sweep frequencies used in the survey (10–160 Hz) and the maximum frequencies (140 Hz) kept in the data. A 20 m bin size would have implied 85 Hz maximum non-aliased frequency and would be considered too low for this hardrock setting.
We decided to employ a conventional NMO-based processing algorithm to the data to make sure a first-hand result is obtained, and if any processing treatment is needed can be applied post-stack or through an iterative process to the pre-stack data. Velocity analysis was done although we found the range was not varying beyond 5800–6100 m s−1. DMO (dip moveout) corrections were attempted; however, due to the sparse nature of the data and offsets, it was already clear this would not be a suitable choice. Thus, to avoid DMO artefacts, this process was excluded. NMO-corrected gathers were then used iteratively to obtain surface-consistent reflection residual statics (two rounds) before stacking the data. The choice of the stretch mute was important as the main reflections were observed at wide-angle, implying a risk of loss if too low stretch mute was used. After a series of tests and making sure that the first breaks were mostly muted, we chose a stretch mute of 50 % and a diversity-type stack rather than just summing the traces (normal stack).
After generating the unmigrated stacked volume using CDP bins of 10 m by 10 m at inlines with low folds (i.e. margins of the survey area), notable surface waves were observed (not shown here) with horizontal characters in the inlines. To be able to attenuate them, data resorted to crosslines and these noises were selectively FK filtered. For the migration, a phase-shift algorithm worked best. Data were then time-to-depth converted using a smooth 1D velocity starting from 5900 m s−1 in the top and 6100 m s−1 at 1 s. Both unmigrated and migrated stacks were exported for 3D visualization and interpretation and for checking if any time shift was needed to tie the reflections to known features observed in the existing boreholes (primarily iron oxide horizons).
6.1 Near-surface statics and historical tailings
Although the 3D static solution was not fully applied for the reflection data processing, given its potential value in understanding near-surface conditions (Malehmir et al., 2018) and potential geological features near the surface (e.g. fault and fracture systems) we present the results visualized in 3D together with the lidar (light detection and ranging) elevation map of the study area (Fig. 9). Figure 9a shows the high-resolution elevation map (1 m horizontal resolution and a few centimetres vertical resolution when compared with the DGPS of the receivers surveyed during the acquisition) of the study area. As is evident in the eastern part of the study area, immediately in the northern and eastern part of P4 and P5 an unusual built-up area occurs. We only realized this after the survey was completed, although we were warned about vibrating on the eastern portion of P5 prior to the survey due to the possible loose ground conditions. This built-up area is related to a historical tailing position that remains from past mining activities. The near-surface velocities estimated from the 3D static solution (Fig. 9b) clearly depict the position of this tailing and two cascades of ponds south of it on the eastern portion of P4. P-wave velocities estimated for the overburden are on average around 700–1000 m s−1, which is remarkably much lower than those observed for glacial tills (usually around 1500–2000 m s−1). Bedrock velocity and depth (Fig. 9c, d) from the 3D refraction static solution also provide linear features particularly one immediately north of a railroad where no more shots could be generated due to the permitting issues. This bedrock level lineament is also associated with a lidar topographic lineament (Fig. 9d) and most likely represents a major fault holding down much of the survey area and is responsible for the swampy environment of the Blötberget. This means that, with its west-dipping orientation, much of the displacement along the fault during its history and likely the latest displacements have all been down-faulting (or normal).
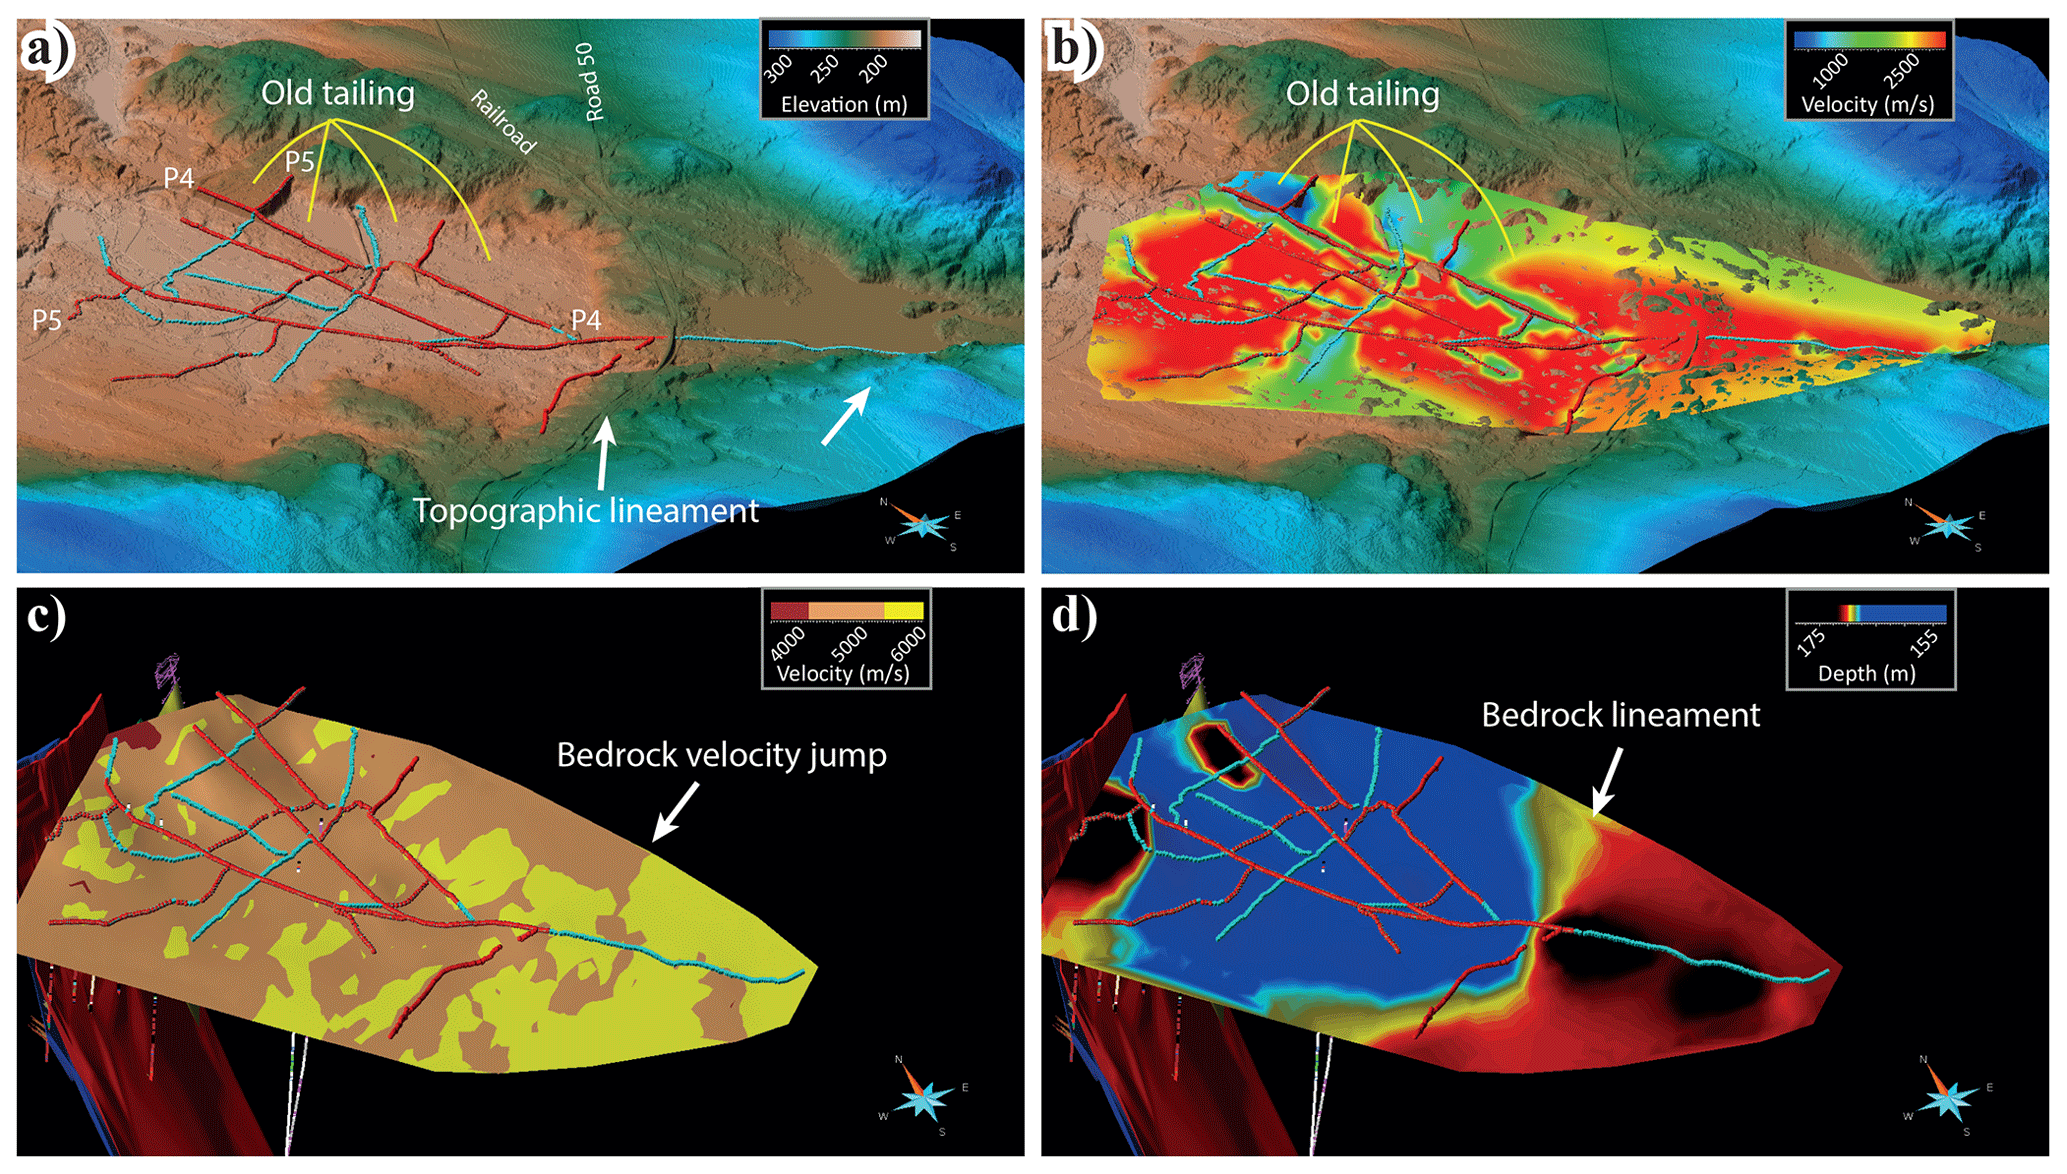
Figure 9(a) Lidar elevation map of a portion of the 3D survey area showing built-up roads and a historical tailing where P4 and P5 were positioned. (b) Near-surface velocities derived from the 3D refraction static solution showing the clear position of the tailing as low-velocity materials and the two separate ponds immediately south of it. (c) Bedrock velocities and a sharp jump in the velocity south of the survey area and (d) bedrock level from the 3D refraction static solution showing a clear lineament (higher ground) immediately south of the road 50 (and the railroad). We attribute the bedrock lineament to a single (or a set of) normal fault.
6.2 Unmigrated stacked volume
To provide a measure for the quality of the migrated volume, it is important that unmigrated stacked volume is assessed and any migration artefacts are recognized, while their features also need to be interpreted. For this purpose, we present a series of slices through the unmigrated volume in Fig. 10. The slices show a time slice (320 ms), an inline (1065), and a crossline (1221) from the unmigrated stacked volume. The inline section shows a series of southeast-dipping reflections down to 400 ms (M1 and M2), after which the quality of the reflections or their continuity is weak. The reflections appear to end with two sets of diffractions (D1 and D2) and crosscut by a moderately northwest-dipping reflection (F1). In the corresponding crossline section, these reflections appear to be two sets that have a gentle dip towards the west with a middle steeper reflection (F2) crosscutting them. A careful analysis of these features in conjunction with the time slice suggests that the two sets of reflections have different strikes and dips. These reflections, given their strong amplitude, are likely from the iron oxide mineralization. The diffractions imaged nearly at the tails of the reflections at approximately where the crosscutting northwest-dipping reflection intersects them may suggest an abrupt termination of the mineralization or a sudden change in their geometries. We discuss this later, when implications for deep-targeting are presented in the study area.
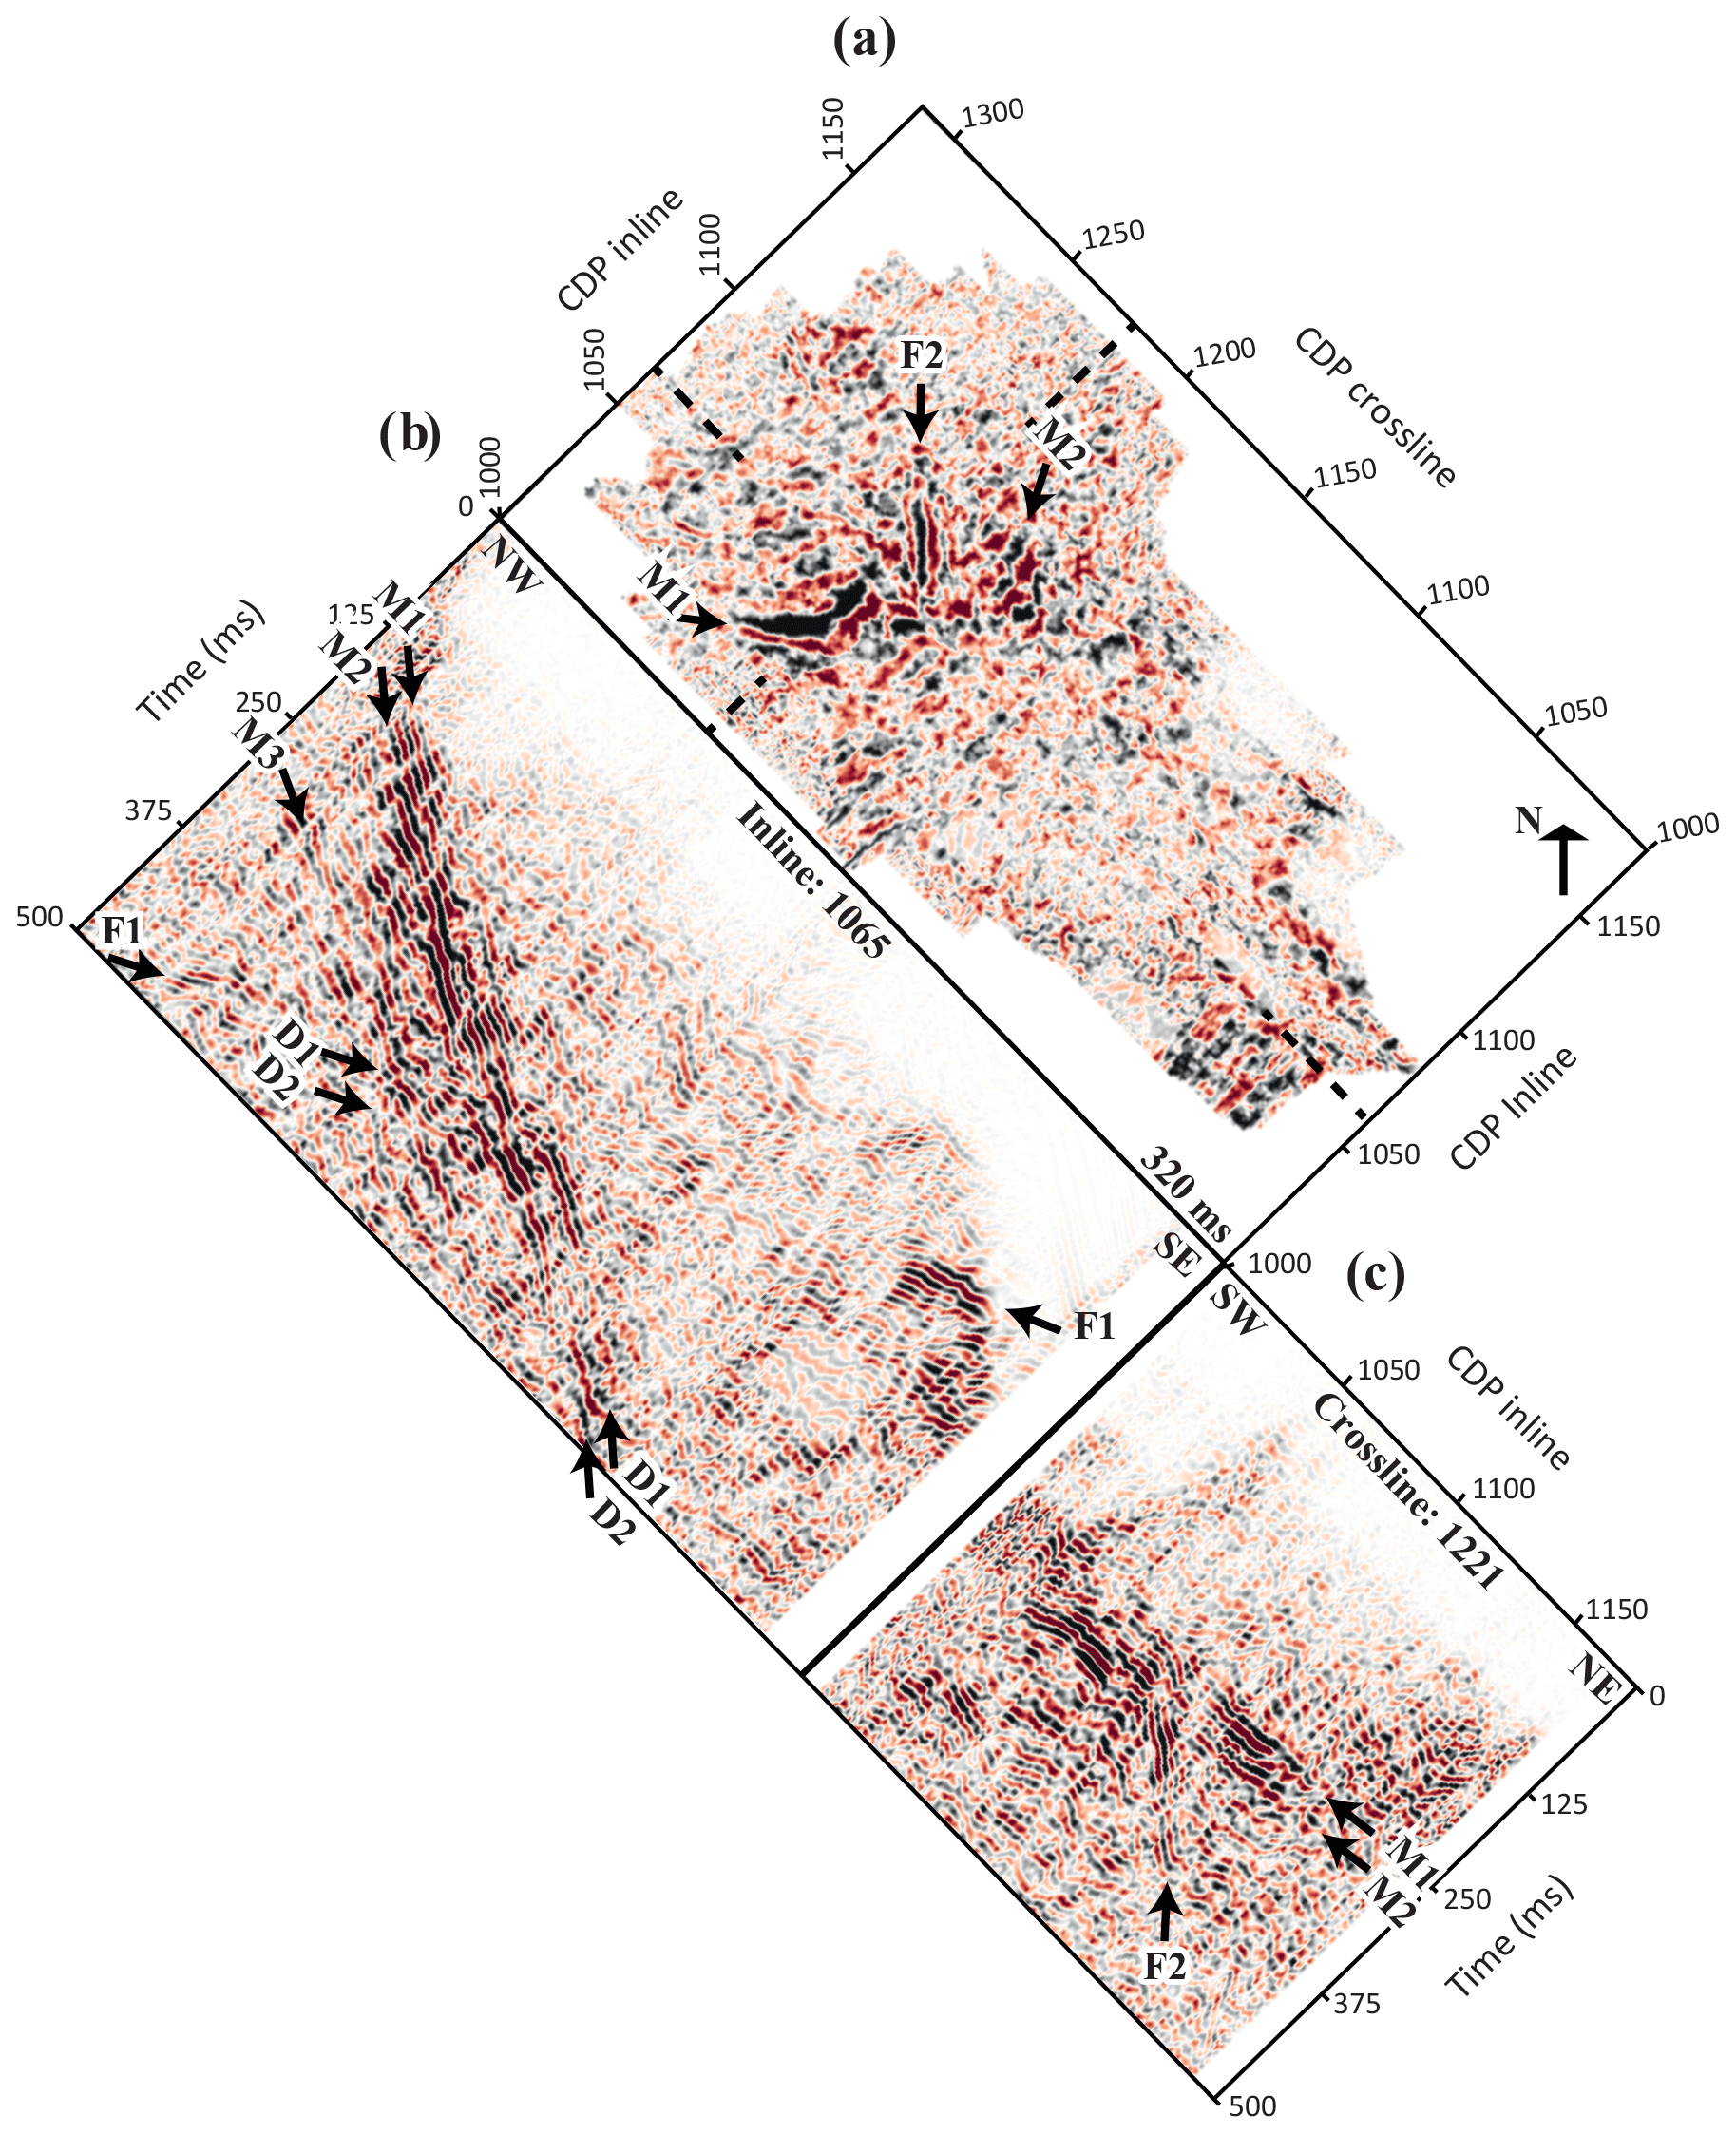
Figure 10A series of slices. (a) Time slice, (b) inline, and (c) crossline through the unmigrated stacked volume showing two major sets of southeast-dipping reflections (M1 and M2) terminated by a northwest-dipping one (F1), where two sets of diffractions (D1 and D2) are present at the intersection between the F1, M1, and M2 reflections. The crossline section shows these two sets of reflections have gentle but different dips towards the west. A reflection (F2) appears to cut through these two sets. Another submerging reflection (M3) is observed underlying the M1 and M2 reflections.
6.3 3D image of the mineralization and potential resources
Figure 11 shows a series of slices extracted from the migrated and time-to-depth-converted stacked volume. The slices show two clear sets of reflections (M1 and M2) extending down to approximately 1200 m depth with a lateral extent of approximately 500 m each. In order to better interpret these features, we visualized the slices in 3D (Fig. 12a) with the known ore block models (Fig. 12b and c). The 3D visualization helps us to associate the strong southeast-dipping reflections to the known mineralization, providing a better estimate of how much more they may extend vertically and laterally beyond what has been modelled by the intersecting boreholes. To avoid a manual interpretation of the reflections, through a thresholding exercise and adjusting amplitudes that better match the intersection of the mineralization in the boreholes, we extracted regions of high amplitudes associated with these reflections (Fig. 13a). Before doing this, all amplitudes were squared to account for both positive and negative (peak and trough) values. This helped to automatically identify a minimum 300 m vertical and lateral extent from what was provided by the borehole data (yellow shell in Fig. 13b, c). Specifically, the possible lateral extent of the mineralization towards the west and the complicated reflectivity with curved (F2) and submerging features are great pieces of additional information from this 3D visualization of the results.
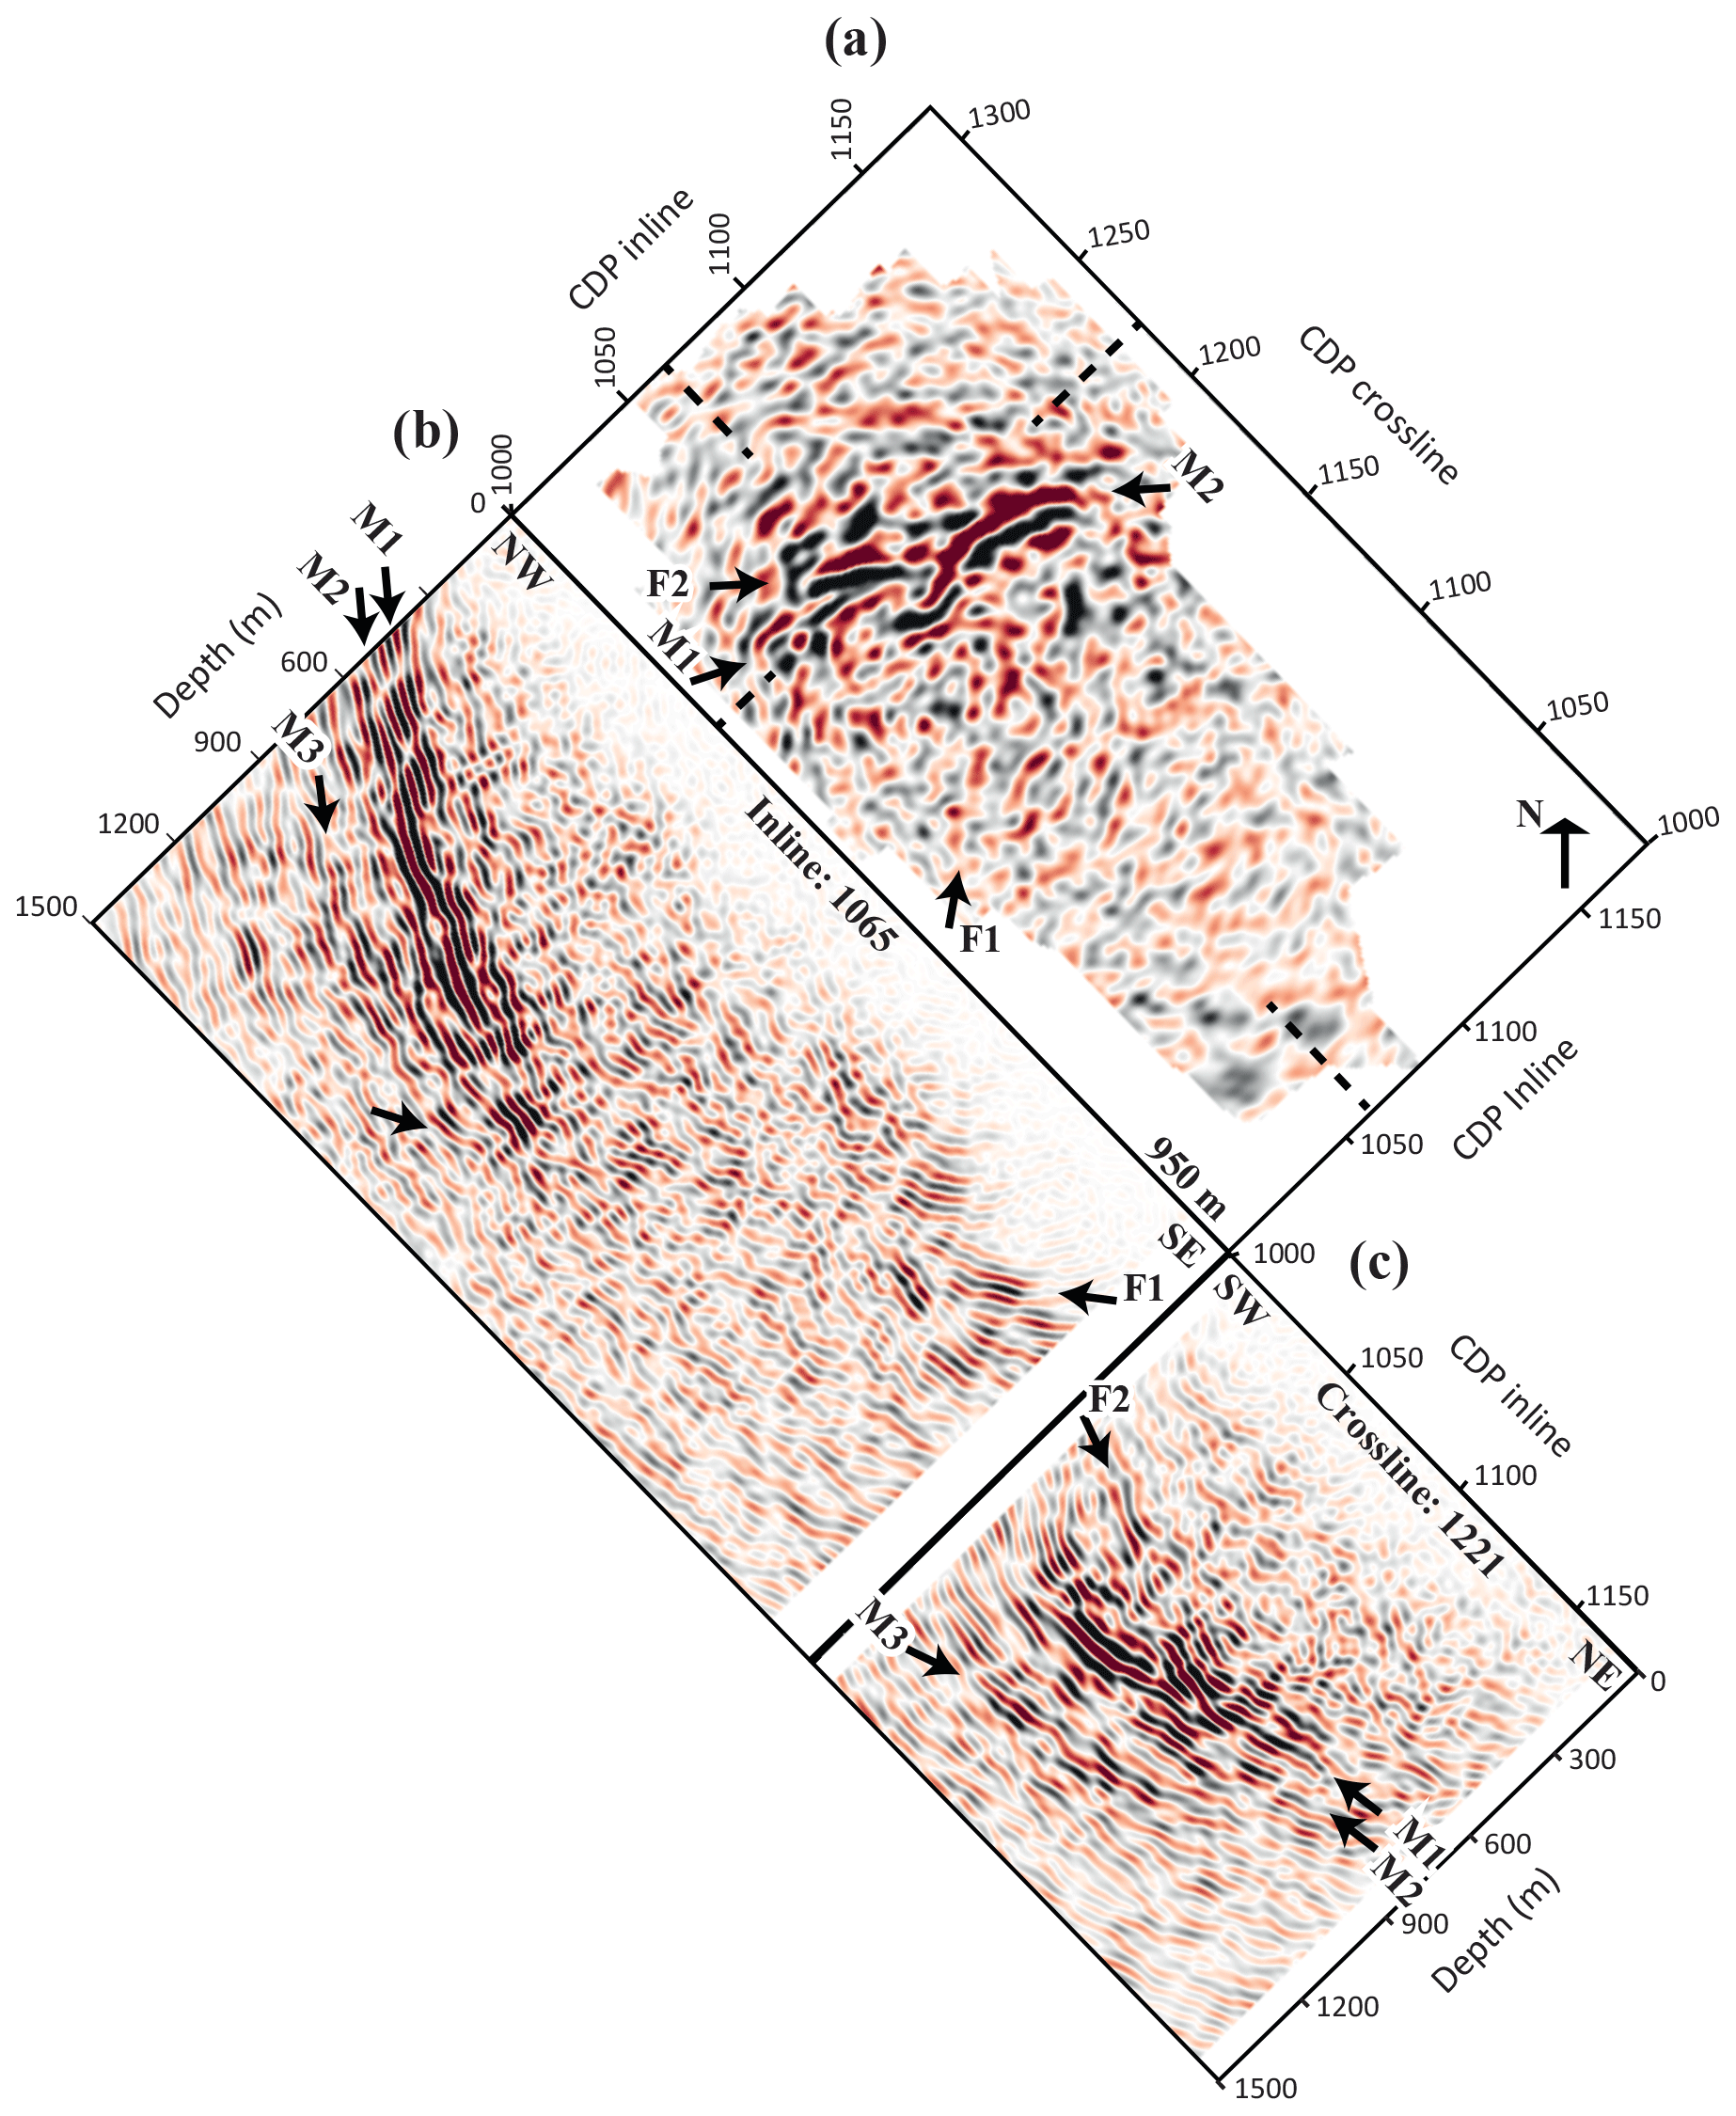
Figure 11A series of slices. (a) Depth slice, (b) inline, and (c) crossline through the migrated and time-to-depth-converted stacked volume showing two major sets of southeast-dipping reflections (M1 and M2) terminated by a northwest-dipping one (F1). The crossline section shows these two sets of reflections have gentle but different dips towards the west. The F2 reflection appears to submerge (downlap) with M1. In the footwall of M1 and M2, another submerging reflection (M3) appears, although it is weaker.
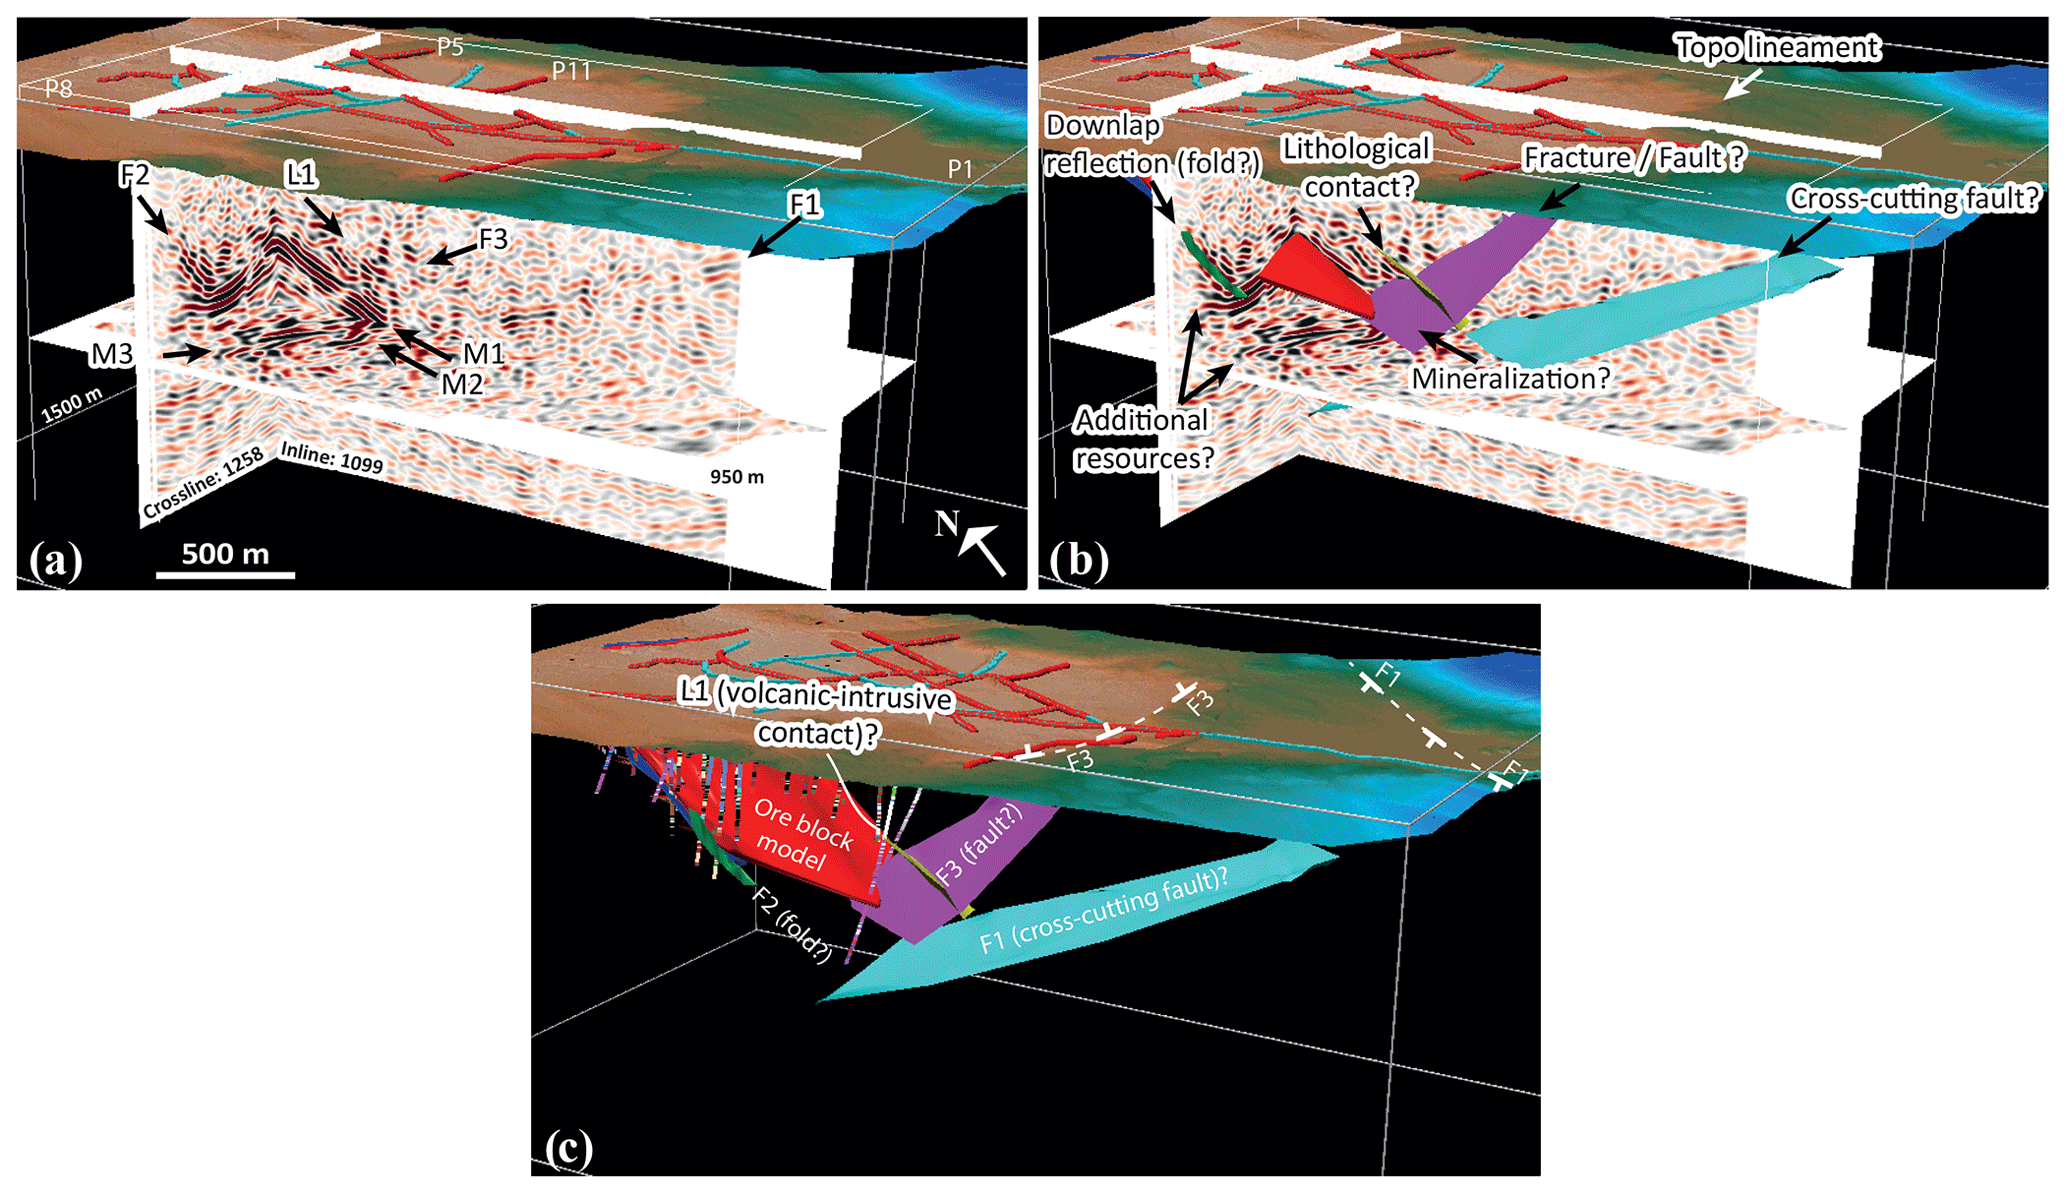
Figure 12The 3D views from the migrated and time-to-depth-converted stacked volume showing (a) a series of strong southeast-dipping reflections (e.g. M1 and M2) and a number of northwest-dipping ones (e.g. F1 and F2), as well as how (b) they have been picked to represent various surfaces within the volume. The red surface is the ore block model derived from borehole data. (c) F1–F3 are interpreted to be either from fault and fracture systems or from folds. Note also that F1 and F3 may be correlated with the topographic lineaments observed on the lidar data. Reflection L1 is interpreted to be from the contact between volcanic and intrusive rocks.
6.4 Structures and their implications
At least four sets of reflections aside from the main southeast-dipping ones could be identified. The first and most notable one is the F1 northwest-dipping reflection which usually appears weak in the volume and only traceable in a few inlines (Fig. 12a). This reflection was picked from different inlines where it was visible. A surface was then generated from the picks (Fig. 12b). Because there are no shots on the southern part of the 3D volume, the reflection could not be imaged all the way to the surface. Therefore, a plane was fitted to the extracted surface in order to better find where it would project to the surface and if there is any corresponding feature associated with the reflection. This reflection was also observed in the earlier 2D surveys (Maries et al., 2020; Markovic et al., 2020), as will be discussed later. However, the 3D seismic data provide better information about its 3D geometry. The reflection strikes approximately N6∘E and dips around 25∘ predominantly towards the west (Fig. 12c). Similar trending features have also been reported in the mine during the time of mining activities but mainly as fracture systems instead (no clear offset reported). We think, however, from its intersection with the mineralization at approximately 1200 m depth, that this feature is likely a major (normal or downthrown displacement) fault system. While there is no marker horizon providing information about its nature, we interpret this as a normal fault (multiphase but with down-faulting still dominant). As mentioned above, multiphase faults are abundant in the Bergslagen region (Stephens et al., 2009; Malehmir et al., 2011) due to its complex and long tectonic history. An alternative but weakly supported interpretation for F1 reflection could be that it is a continuation of the mineralization forming a large curved synform-shaped system.
A second northwest-dipping reflection, which is much weaker and slightly steeper, can also be identified partly disturbing the continuity of the main southeast-dipping reflections (F3 in Fig. 12a). We were able to pick this reflection by looking into only the phase of the data and extracting a new surface (Fig. 12b) from the picks in different inlines. Interestingly, F3 reflection appears where the refraction static solution suggests a bedrock lineament (Fig. 9d), but the lidar data also show an elevated ground surface (Figs. 9a and 12b). Much of the area north of this lineament is lowland, where the swamps or wetlands are present (i.e. Blötberget). We therefore interpret the F3 reflection, which strikes nearly N–S and dips approximately 45–50∘ towards the west, to be a dominant normal fault responsible for much of the lowland in the Blötberget region (Figs. 12c and 13c). The F1 reflection, while stronger in terms of seismic amplitude, does not show such a strong topographic lineament, although it is gentler in dip, and this may explain its stronger amplitude character. F1 and F3 could also be formed during an identical tectonic event. We have no geological constraints to prefer any of these scenarios, i.e. whether F1, F3, or both are major faults as a result of the deformation history.
We also identified two smaller reflections, one with similar dip and trend as the mineralization (L1) but that is likely from the contact of volcanic with the intrusive rocks, as it could be matched in boreholes (Fig. 12a, b), and another down-lapping with the interpreted reflections from the mineralization (F2). The F2 reflection (Fig. 12a, b) may be an intrusion or could show a folded structure with the mineralization. Due to the lack of any borehole west of the survey area, we cannot conclusively present a geological interpretation for this feature. However, if it is from the mineralization, it may reach closer to the surface towards the west, making the western part of the study area strongly prospective.
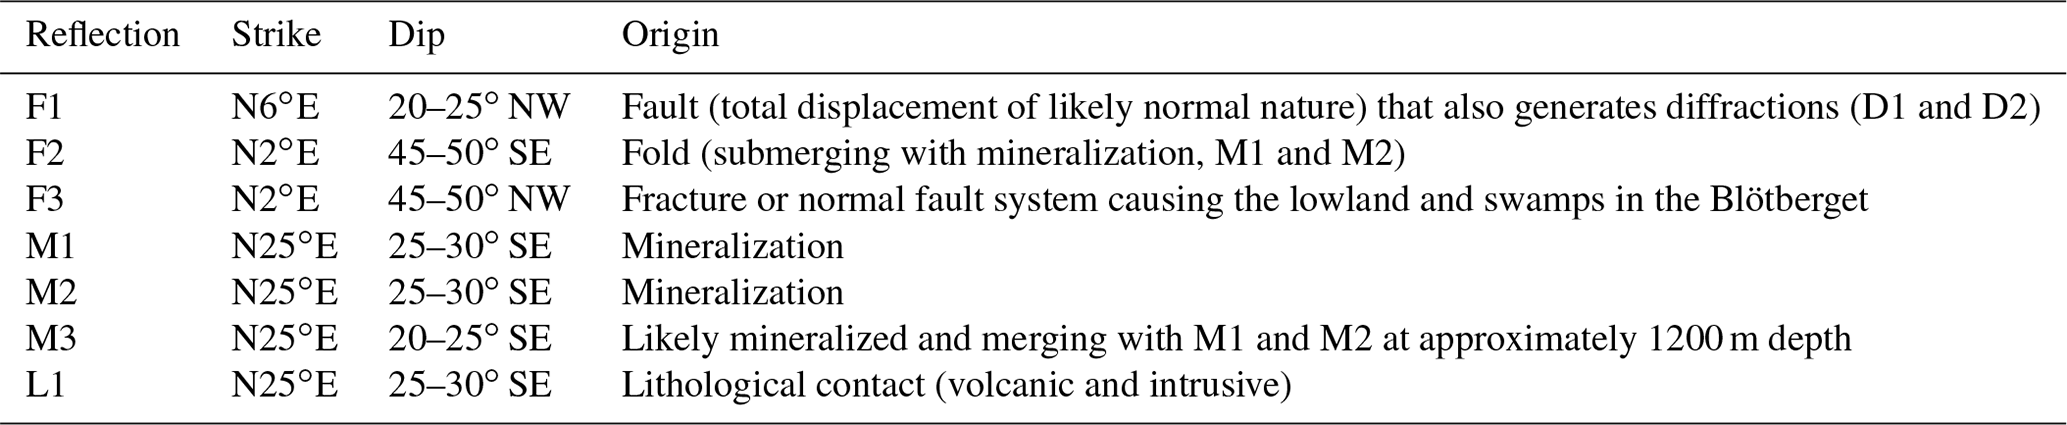
Similar to the earlier studies (e.g. Malehmir et al., 2017a; Markovic et al., 2020), underlying the main mineralization there are weak but parallel reflections (e.g. M3 in Fig. 12a) that may present additional resources in the footwall of the known resources. These reflections appear to merge with the main reflections from the mineralization (M1 and M2) and are only 200–300 m deeper in their footwall. Therefore, any future deep drilling should continue for 200–300 m deeper to check if these reflections are associated with mineralization. Table 3 summarizes the main features of the 3D seismic volume in terms of geometry and our interpretation of their origins.
The Ludvika 3D sparse seismic survey only employed existing roads and forest tracks for generating shots and proved to be instrumental in delineating 3D geometry of the iron oxide deposits, providing information on potential additional resources in the down dip (vertical extent) and laterally (horizontal extent) for a minimum of 300 m in each direction (Fig. 13c). Assuming an average thickness of 30 m (a minimum from the logging and borehole data where the mineralization is intersected elsewhere) and a density of 3800 kg m−3 (which is an underestimation for the ore), this would add approximately 10 Mt potential additional resources that are worth being drilled for mineral resource assessments. Tying the high-amplitude regions with the borehole data (Fig. 13a) was a great way of extracting places where iron oxide deposits could be present (Fig. 13b). The 3D seismic survey, to the best of our knowledge, is the first published account of using 3D seismic methods in Sweden for deep-targeting and mineral resource exploration. While the earlier 2D surveys also provided key information (Marries et al., 2020), the 3D geometry of the structures is much better defined in the 3D survey (Vestrum and Gittins, 2009; Malehmir et al., 2017b). For example, the F1 structure should be an out-of-the-plane feature that intersected the earlier 2D profiles (Fig. 14a, c) obliquely with a strike similar to those reported in the underground mine (when operational) and hence is important for future planning of the mine. It is still unclear if F1 is a fracture system or a fault, although our preferred interpretation is that it is a major normal fault possibly contributing to the repeated reflectivity in the footwall of the known (drilled) deposits. Given the narrow azimuth nature of the 3D survey (dominantly NW–SE), structures like F1 would require better sampling in the E–W direction, and this likely contributed into its weak imaging rather than reflecting its actual physical property contrast. Structures such as F3 and M1–M3 reflections were also imaged (Fig. 14b) in the earlier 2D profiles, but their definition and submerging nature are better defined in the 3D volume. This illustrates why 3D seismic surveys are better suited for complex geological structures in hardrock settings.
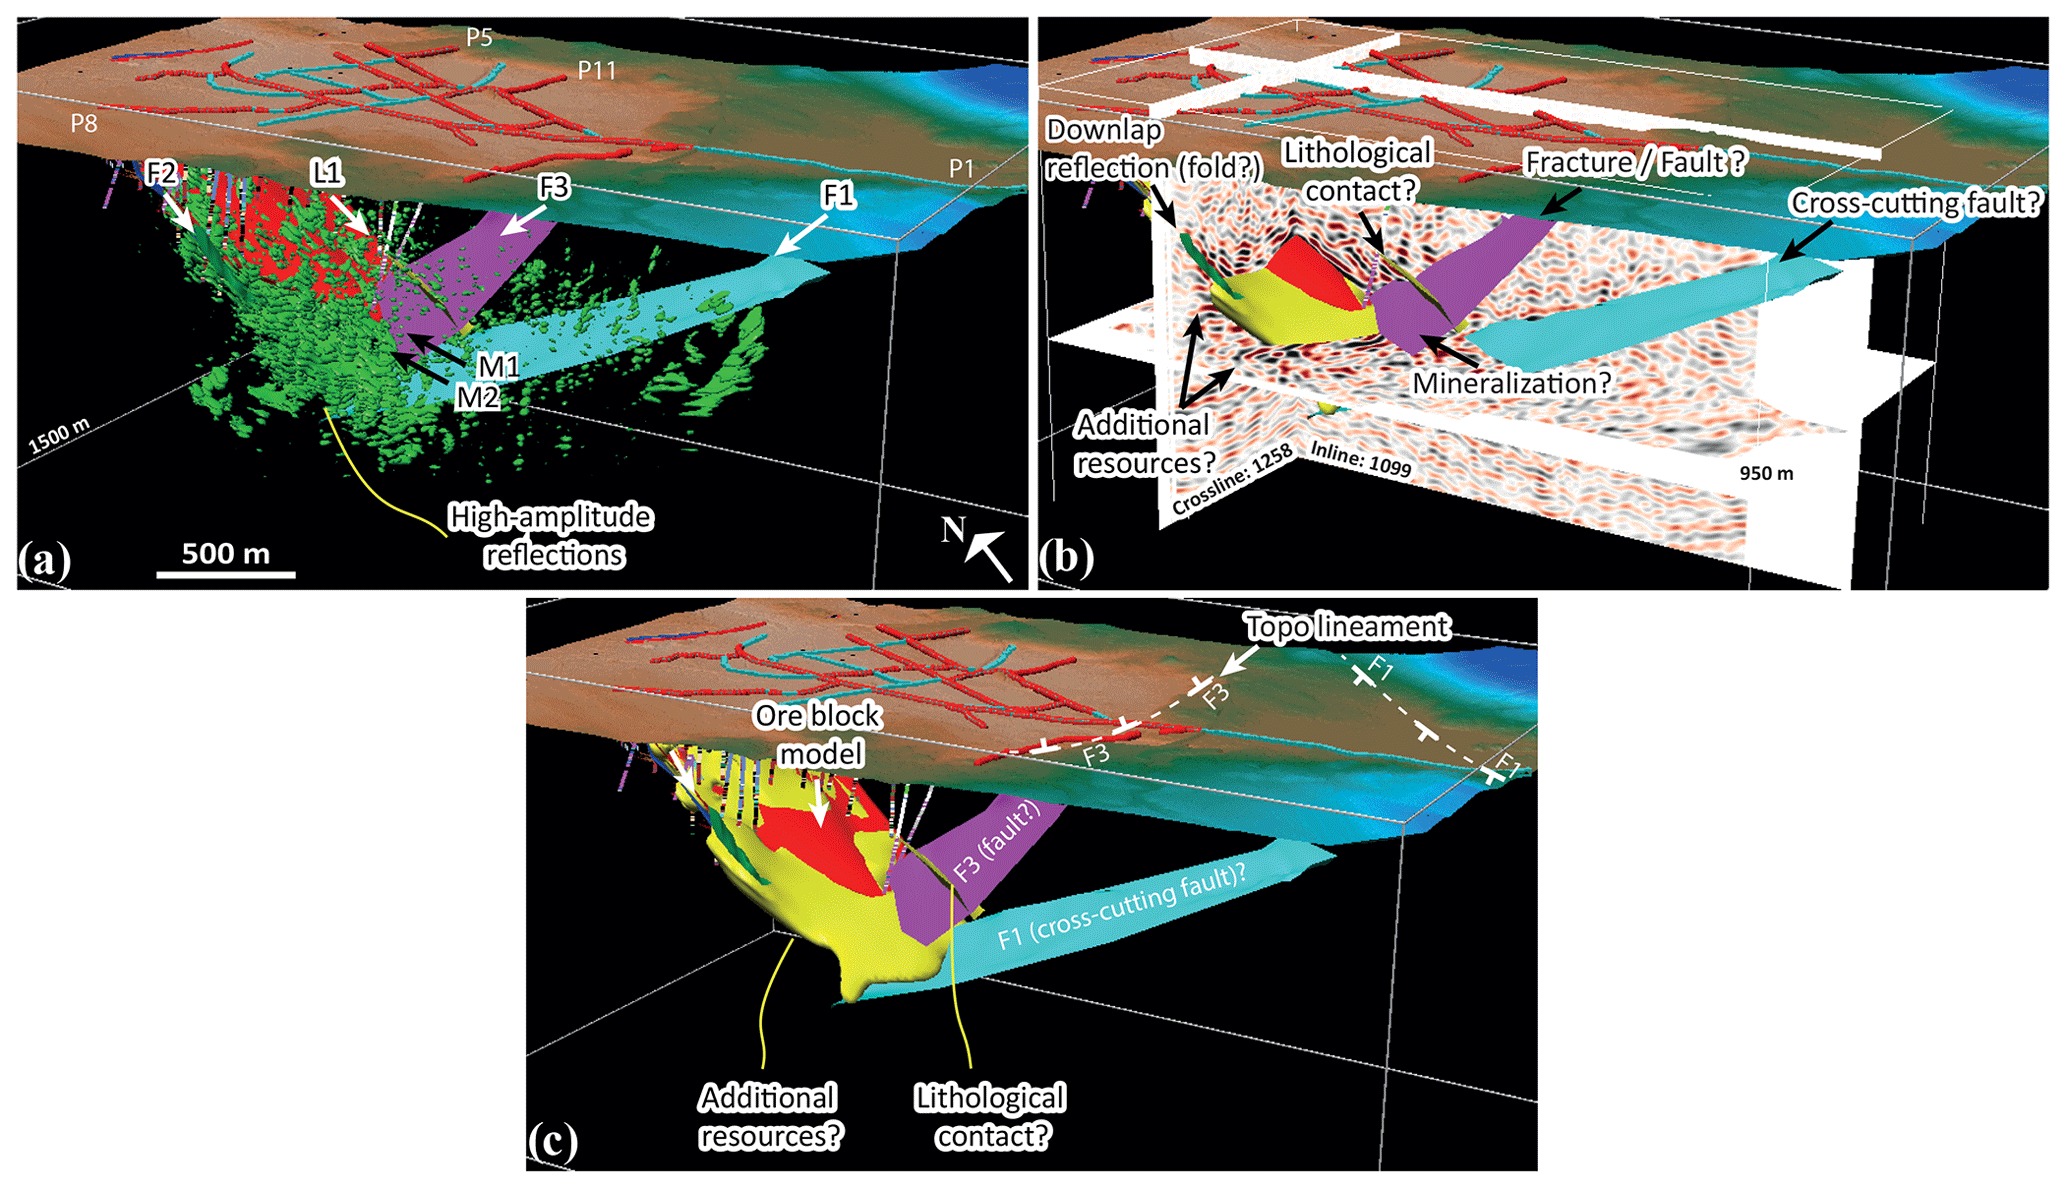
Figure 13A set of 3D views showing how additional potential resources were identified from the 3D seismic volume. (a) High-amplitude reflections were first extracted through a thresholding procedure as iso-shells (green shells) and then (b) matched with the boreholes intersecting the mineralization and merged with the ore block model to produce an updated resource model (yellow shell). (c) The refined resource model shows both lateral (to the west) and vertical extension (approximately of 300 m) of the ore block model from the available boreholes.
In terms of data resolution, the seismic data contain a good band of useful frequency content with a dominant frequency of about 70–75 Hz, which based on an average medium velocity of 6000 m s−1 would be equivalent to approximately 80 m wavelength. Given the two distinct diffractions (D1 and D2) observed in the data (Fig. 10), we estimate a vertical resolution on the order of 20 m, implying that the strong southeast-dipping reflections are each more likely to be from a body of mineralized horizons than their top and bottom. The diffractions were also studied for the velocity they would require to collapse to a point (using the diffraction hyperbolic equation), which was around 5900 m s−1, consistent with the velocities picked for the NMO corrections, migration, and time-to-depth conversions. There are a few other notable diffractions in the unmigrated stacked volume that have potential to be further studied to provide geological information and scale of heterogeneity in the dataset, and we recommend this to be done in future studies.

Figure 14A set of 3D views from (a) the earlier 2D surveys (Markovic et al., 2020) and (b) interpretation of the main features in the 2D profile (along P1 of the 3D survey) and (c) how various features extracted from the 3D volume manifest themselves in this 2D profile result. In particular, note that the F1 and M3 are better defined in the 3D volume (Figs. 12 and 13), showing a westward plunge for F1 and a submerging character for M3, implying they have a major out-of-the-plane nature in the 2D profile.
As for the data processing of such a dataset, DMO corrections were applied and partly helped to better image the F1 reflection in a few inlines, but overall they produced a noisy volume that required more processing treatments (due to partial migration artefacts) than the volume without the DMO corrections. Hence, DMO corrections were excluded from the processing workflow. This is not surprising, as the 3D dataset is a sparse, narrow azimuth and contains irregular offset-azimuth traces (Beasley and Klotz, 1992; Ronen et al., 1995; Vermeer et al., 1995). We did not consider any trace interpolation given the complexity of the reflections and their crosscutting natures. While more receivers and shots could have solved this issue, we were limited to the number of recorders made available for the survey, and we did not want to make additional shot lines due to cutting forests or other environmental and ultimately also cost issues. However, more shot points in the southern part of the study area would have been useful in order to obtain a deeper image of the mineralized horizons (if possible) and a better definition of F1 reflection near the surface. These shot points were initially planned; however, due to the permitting issues for vehicles heavier than 12 t, the seismic vibrator (32 t) could not be used there. As was well noted by Bouska (1997), 3D surveys should be designed for providing details that allow geological interpretations for economic success. If 3D seismic surveys are too pessimistically designed using only the worst scenarios and account for too much unknown complex geology, one might acquire far fewer 3D surveys and miss opportunities. In the case of Blötberget, the combination of 2D and downhole logging surveys and the use of borehole information and ore body block models helped to plan the 3D survey and provided great added value, being likely 40 % cheaper than that if acquired at full azimuth and high fold (plus 100) by commercial contractors using rule-of-thumb approaches.
In terms of 3D acquisition footprints (Vermeer, 1998; Gulunay et al., 2006; Cheraghi et al., 2012), we only observed that strong surface-wave noise remained at the margins of the volume due to having a lower fold. No other footprints were noted. It is, however, worth mentioning one reason to reduce this could be due to the use of the diversity stack for CDP stacking. The choice of a mix of 2D and 3D statics was important in order to provide an improved image of the reflections, and we suggest this to be considered for complex datasets, as 3D statics may only provide a smooth and long-wavelength static solution that would not necessarily allow for higher-resolution imaging. When we considered this, a careful analysis was done to make sure that the shifts from 2D to 3D are not so significant so that a mix was then plausible. Two runs of surface-consistent residual static corrections then helped to adjust any remaining mismatches. This approach was also attempted using the 3D static solution but was not as successful as when the mixed solutions were employed.
Parallel to this study, 3D focusing pre-stack depth imaging algorithms (Buske et al., 2009) are being applied to this dataset, but the corresponding results are not the focus of this study. Instead, this paper provides an inventory publication on the nature of the 3D seismic survey, how it was implemented, and how a tailored processing workflow provided suitable information for deep exploration and targeting in the site. What is worth emphasizing is that the 3D seismic survey also provided additional information on the location and characteristics of the historical tailings and bedrock lineaments. This information was complementary and further showcases why 3D reflection seismic data are an asset for mining and mineral exploration and why they should be used more often for both purposes (Malehmir et al., 2018).
A sparse 3D seismic dataset was acquired in the Blötberget mining area of central Sweden for deep-targeting and for a better understanding of geological structures hosting iron oxide deposits at the site. The survey benefited from careful planning, downhole logging data, earlier 2D and cross-profile recording surveys, and the existence of roughly 3D geometry of the deposits from borehole observations, some of which were from the early 1970s. The survey was a joint effort of a few organizations putting their 1266 seismic recorders and a 32 t seismic vibrator together. While data quality is very good considering they are acquired in a hardrock setting, processing work was challenging due to the extreme ground conditions from built-up roads, historical tailings, and swampy areas, producing a significant amount of surface waves to handle in this narrow source–receiver offset-azimuth dataset.
In particular, the choice of refraction static corrections and attenuating surface waves were the key parts for producing quality seismic volumes (both unmigrated and migrated stacks). The 3D seismic volume helped to image the down-dip and lateral continuation of the mineralization for a minimum of 300 m, especially in the western part of the survey area where there are currently no boreholes available. If this interpretation is correct and the strong reflections originate from iron oxide horizons, our estimate suggests potential additional resources of about 10 Mt at depth that can be accounted for or argued for further drilling and resource assessments. The 3D seismic survey also provided oppositely dipping features, i.e. westerly dipping, interpreted to be from major normal faults responsible for much of the lowland of the Blötberget and the repeated reflectivity pattern observed in the footwall of the known deposits. These structural features and their potential resources should be the targets of future drilling to maximize the value the 3D seismic survey provided. As the by-product of the processing work, the 3D refraction static solution helped to map the historical tailings and areas immediately south of it, illustrating why 3D seismic surveys have much more value than just for providing targets for mineral exploration. Given the positive results of the survey, we encourage mining companies in Sweden and elsewhere to attempt such a survey, as the added value is reasonably high.
Original data underlying the material presented are available by contacting the corresponding author. However, as the dataset is the subject of other PhD studies, there is a period of 3 years embargo on their availability.
AM and PM designed the survey and study and obtained funding. AM, MM, SB, AG, LS, and EB took part in the planning and acquisition of the dataset. MS and SL took part in the interpretation of the results. AM wrote the main content and together with MM performed the seismic data processing. All authors contributed to the discussions and interpretation of the results.
The authors declare that they have no conflict of interest.
This article is part of the special issue “State of the art in mineral exploration”. It is a result of the EGU General Assembly 2020, 3–8 May 2020.
We thank Nordic Iron Ore and several young professionals from Uppsala University, Geopartner, TUBAF, and TU Delft who worked with and supported us during the survey to acquire this research-innovation dataset. In particular we thank Nordic Iron Ore for collaborating with us in the project and this study. Globe Claritas™ was used for the data processing. GOCAD® was used for 3D visualization and sponsored by Emerson Paradigm in the project. We thank three anonymous reviewers and the editor for their constructive comments that helped to improve the original version of the manuscript. This study was conducted through the Smart Exploration project. Smart Exploration has received funding from the European Union's Horizon 2020 research and innovation programme under grant agreement no. 775971. The authors acknowledge the usage of the Vibroseis truck of Technische Universität Bergakademie Freiberg, operated by the Institute of Geophysics and Geoinformatics and funded by the Deutsche Forschungsgemeinschaft (DFG) under grant no. INST 267/127-1 FUGG.
This research has been supported by the European Commission, Executive Agency for Small and Medium-sized Enterprises (Smart Exploration grant no. 775971).
This paper was edited by Juan Alcalde and reviewed by three anonymous referees.
Adam, E., Perron, G., Arnold, G., Matthews, L., and Milkeriet, B.: 3D seismic imaging for VMS deposit exploration, Matagami, Quebec, in: Hardrock seismic exploration, edited by: Eaton, D. W., Milkereit, B., and Salisbury, M. H., SEG, Tulsa, USA, 2003.
Beasley, C. J. and Klotz, R.: Equalization of DMO for Irregular Spatial Sampling, SEG, New Orleans, 970–973, 1992.
Balestrini, F., Draganov, D., Malehmir, A., Marsden, P., and Ghose, R.: Improved target illumination at Ludvika mines of Sweden through seismic-interferometric noise reduction, Geophys. Prospect., 68, 200–213, 2020.
Bellefleur, G., Schetselaar, E., White, D., Miah, K., and Dueck, P.: 3D seismic imaging of the Lalor volcanogenic massive sulphide deposit, Manitoba, Canada, Geophys. Prospect., 63, 813–832, 2015.
Bellefleur, G., Malinowski, M., and Urosevic, M.: Editorial for Special Issue “Seismic Methods in Mineral Exploration”, Minerals, 9, 630, https://doi.org/10.3390/min9100630, 2019.
Bräunig, L., Buske, S., Malehmir, A., Bäckström, E., Schön, M., and Marsden, P.: Seismic depth imaging of iron-oxide deposits and their host rocks in the Ludvika mining area of central Sweden, Geophys. Prospect., 68, 24–43, 2020.
Bouska, J.: Sparse 3D, what's in a name?, Recorders, 22, https://csegrecorder.com/articles/view/sparse-3d-whats-in-a-name (last access: 19 February 2021), 1997.
Buske, S., Gutjahr, S., and Sick, C.: Fresnel volume migration of single-component seismic data, Geophysics, 74, WCA47–WCA55, 2009.
Buske, S., Bellefleur, G., and Malehmir, A.: Introduction to Special Issue on “Hard Rock Seismic Imaging”, Geophys. Prospect., 63, 751–753, 2015.
Cheraghi, S., Malehmir, A., and Bellefleur, G.: Crustal-scale reflection seismic investigations in the Bathurst Mining Camp, New Brunswick, Canada, Tectonophysics, 506, 55–72, 2011.
Cheraghi, S., Malehmir, A., and Bellefleur, G.: 3D imaging challenges in steeply dipping mining environment: new lights on acquisition geometry and processing from the Brunswick No. 6 seismic data, Canada, Geophysics, 77, WC109–WC122, 2012.
Dehghannejad, M., Malehmir, A., Juhlin, C., and Skyttä, P.: 3D constraints and finite-difference modeling of massive sulfide deposits: The Kristineberg seismic lines revisited, northern Sweden, Geophysics, 77, WC69–WC79, 2012.
Eaton, D., Milkereit, B., and Salisbury, M. (Eds.): Hardrock seismic exploration, SEG, Tulsa, USA, ISBN: 978-1-56080-114-6, 2003a.
Eaton, D.W., Milkereit, B., and Salisbury, M. (Eds.): Seismic methods for deep mineral exploration: Mature technologies adapted to new targets, The leading edge, 22, 580–585, 2003b.
Fizaine, F.: Toward generalization of futures contracts for raw materials: A probabilistic answer applied to metal markets, Resour. Policy, 59, 379–388, 2018.
Gulunay, N., Benjamin, N., and Magesan, M.: Acquisition footprint suppression on 3D land surveys, First Break, 24, 71–77, 2006.
Hampson, D. and Russell, B.: First-break interpretation using generalized linear inversion, Journal of the Canadian Society of Exploration Geophysicists, 20, 40–54, 1984.
Heinonen, S., Heikkinen, P. J., Kousa, J., Kukkonen, I. T., and Snyder, D. B.: Enhancing hardrock seismic images: Reprocessing of high-resolution seismic reflection data from Vihanti, Finland, J. Appl. Geophys., 93, 1–11, 2013.
Jonsson, E., Troll, V. R., Högdahl, K., Harris, C., Weis, F., Nilsson, K. P., and Skelton, A.: Magmatic origin of giant “Kiruna-type” apatite-iron-oxide ores in Central Sweden, Sci. Rep.-UK, 3, 1644, https://doi.org/10.1038/srep01644, 2013.
Kathol, B., Hansen Serre, S., and Thomsen, T. B.: Provenance of Svecofennian sedimentary rocks in Bergslagen and surrounding areas, SGU-rapport 2020:22. http://resource.sgu.se/produkter/sgurapp/s2022-rapport.pdf (last access: 19 February 2021), 2020.
Koivisto, E., Malehmir, A., Hellqvist, N., Voipio, T., and Wijns, C.: Building a 3D model of lithological contacts and near-mine structures in the Kevitsa mining and exploration site, northern Finland: constraints from 2D and 3D reflection seismic data, Geophys. Prospect., 63, 754–773, 2015.
Magnusson, N.H.: The origin of the iron ores in central Sweden and the history of their alterations, P.1, Sveriges geologiska undersökning, Serie C, Avhandlingar och uppsatser, Stockholm, 1970.
Malehmir, A. and Bellefleur, G.: 3D seismic reflection imaging of VHMS deposits, Insights from re-processing of the Halfmile Lake data, New Brunswick, Canada, Geophysics, 74, B209–B219. https://doi.org/10.1190/1.3230495, 2009,
Malehmir, A., Dahlin, P., Lundberg, E., Juhlin, C., Sjöström, H., and Högdahl, K.: Reflection seismic investigations in the Dannemora area, central Sweden: insights into the geometry of poly-phase deformation zones and magnetite-skarn deposits, J. Geophys. Res., 116, B11307, https://doi.org/10.1029/2011JB008643, 2011.
Malehmir, A., Durrheim, R., Bellefleur, G., Urosevic, M., Juhlin, C., White, D., Milkereit, B., and Campbell, G.: Seismic methods in mineral exploration and mine planning: A general overview of past and present case histories and a look into the future, Geophysics, 77, WC173–WC190, 2012a.
Malehmir, A., Juhlin, C., Wijns, C., Urosevic, M., Valasti, P., and Koivisto, E.: 3D reflection seismic investigation for open-pit mine planning and exploration in the Kevitsa Ni-Cu-PGE deposit, Northern Finland, Geophysics, 77, WC95–WC108, 2012b.
Malehmir, A., Maries, G., Bäckström, E., Schön, M., and Marsden, P.: Developing cost-effective seismic mineral exploration methods using a landstreamer and a drophammer, Sci. Rep.-UK, 7, 10325, https://doi.org/10.1038/s41598-017-10451-6, 2017a.
Malehmir, A., Bellefleur, G., Koivisto, E., and Juhlin, C.: Pros and cons of 2D vs 3D seismic mineral exploration surveys, First Break, 35, 49–55, 2017b.
Malehmir, A., Tryggvason, A., Wijns, C., Koivisto, E., Lindqvist, T., Skyttä, P., and Montonen, M.: Why 3D seismic data are an asset for both exploration and mine planning? Velocity tomography of weakness zones in the Kevitsa Ni-Cu-PGE mine, northern Finland, Geophysics, 83, B33–B46, 2018.
Malehmir, A., Donoso, G., Markovic, M., Maries, G., Dynesius, L., Brodic, B., Pecheco, N., Marsden, P., Bäckström, E., Penney, M., and Araujo, V.: Smart Exploration: from legacy data to state-of-the-art data acquisition and imaging, First Break, 37, 71–74, 2019.
Malehmir, A., Manzi, M., Draganov, D., Weckmann, U., and Auken, E.: Introduction to the special issue on “Cost-effective and innovative mineral exploration solutions”, Geophys. Prospect., 68, 3–6, 2020.
Malinowski, M., Schetselaar, E., and White, D.: 3D seismic imaging in the Flin Flon VMS mining camp – Part II: Forward modelling, Geophysics, 77, WC81–WC93, 2012.
Manzi, M. S. D., Durrheim, R. J., Hein, K. A. A., and King, N.: 3D edge detection seismic attributes used to map potential conduits for water and methane in deep gold mines in the Witwatersrand basin, South Africa, Geophysics, 77, WC133–WC147, 2012.
Manzi, M., Copper, G. R. J., Malehmir, A., and Durrheim, R. J.: Improved structural interpretation of legacy 3D seismic data from Karee platinum mine (South Africa) through the application of novel seismic attributes, Geophys. Prospect., 68, 145–163, 2020.
Maries, G., Malehmir, A., Bäckström, E., Schön, M., and Marsden, P.: Downhole physical property logging for iron-oxide exploration, rock quality, and mining: An example from central Sweden, Ore Geol. Rev., 90, 1–13, 2017.
Maries, G., Malehmir, A., and Marsden, P.: Cross-profile seismic data acquisition, imaging and modeling of iron-oxide deposits: a case study from Blötberget, south-central Sweden, Geophysics, 85, B233–B247, 2020.
Markovic, M., Maries, G., Malehmir, A., von Ketelholdt, J., Bäckström, E., Schön, M., and Marsden, P.: Deep reflection seismic imaging of iron-oxide deposits in the Ludvika mining area of central Sweden, Geophys. Prospect., 68, 7–23, 2020.
Milkereit, B., Eaton, D.W., Wu, J., Perron, G., Salisbury, M. H., Berrer, E., and Morrison, G.: Seismic imaging of massive sulfide deposits: Part II. Reflection seismic profiling, Econ. Geol., 91, 829–834, 1996.
Milkereit, B., Berrer, E. K., King, A. R., Watts, A. H., Roberts, B., Adam, E., Eaton, D. W., Wu, J., and Salisbury, M. H.: Development of 3-D seismic exploration technology for deep nickel-copper deposits-A case history from the Sudbury basin, Canada, Geophysics, 65, 1890–1899, 2000.
Papadopoulou, M., Da Col, F., Mi, B., Bäckström, E. M., Marsden, P., Malehmir, A., and Socco, L. V.: Surface-wave analysis for static corrections in mineral exploration: A case study from central Sweden, Geophys. Prospect., 68, 214–231, 2020.
Pretorius, C. C., Muller, M. R., Larroque, M., and Wilkins, C.: A review of 16 years of hardrock seismics on the Kaapvaal Craton, in: Hardrock seismic exploration, edited by: Eaton, D. W., Milkereit, B., and Salisbury, M. H., SEG, Tulsa, USA, 2003.
Reed, L. E.: Seismic Reflection Surveying for Mining Exploration Applications, A Review of Practice Past and Current with an Outlook for the Future, Toronto, Mineral Industry Technology Council of Canada (MI-TEC) Report, 219 pp., 1993.
Ripa, M. and Kübler, L.: Apatite-bearing iron ores in the Bergslagen region of south-central Sweden, Sveriges geologiska undersökning Rapporter och meddelanden, Sveriges Geologiska Undersökning, Uppsala, 2003.
Ronen, S., Nichols, D., Bale, R., and Ferber, R.: Dealiasing DMO: Good-pass, bad-pass, and unconstrained, SEG Abstract, Houston, 743–745, 1995.
Salisbury, M. H., Milkereit, B., Ascough, G., Adair, R., Matthews, L., Schmitt, D. R., Mwenifumbo, J., Eaton, D. W., and Wu, J.: Physical properties and seismic imaging of massive sulphides, Geophysics, 65, 1882–1889, 2000.
Schmelzbach, C., Horstmeyer, H., and Juhlin, C.: Shallow 3D seismic-reflection imaging of fracture zones in crystalline rock, Geophysics, 72, 149–160, 2007.
Singh, B., Malinowski, M., Hlousek, F., Koivisto, E., Heinonen, S., Hellwig, O., Buske, S., Chamarczuk, M., and Juurela, S.: Sparse 3D Seismic Imaging in the Kylylahti Mine Area, Eastern Finland: Comparison of Time Versus Depth Approach, Minerals, 9, 305, https://doi.org/10.3390/min9050305, 2019.
Stephens, M. B., Ripa, MI. Lundström, IL. Persson, L., Bergman, T., Ahl, M., Wahlgren, C. H., Persson, P., and Wickström, L.: Synthesis of the Bedrock Geology in the Bergslagen Region, Fennoscandian Shield, South-Central Sweden, Sveriges geologiska undersökning (SGU), Uppsala, Sweden, 2009.
Urosevic, M., Bhat, G., and Grochau, M.: Targeting nickel sulfide deposits from 3D seismic reflection data at Kambalda, Australia, Geophysics, 77, WC123–WC132, 2012.
Vermeer, G. J. O., den Rooijen, H. P. G. M., and Douma, J.: DMO in arbitrary 3-D acquisition geometries, SEG Abstract, Houston, 935–938, https://doi.org/10.1190/1.1887282, 1995.
Vermeer, G. J. O.: 3D symmetric sampling, Geophysics, 63, 1629–1647, https://doi.org/10.1190/1.1444459, 1998.
Vestrum, R. and Gittins, J.: Technologies from foothills seismic imaging: replacement or complements?, First Break, 27, 61–66, 2009.
White, D. J., Secord, D., and Malinowski, M.: 3D seismic imaging in the Flin Flon VMS mining camp: Part I – Seismic results, Geophysics, 77, WC47–WC58, 2012.
Yilmaz, O.: Seismic data analysis: Processing, inversion and interpretation of seismic data, SEG, Tulsa, USA, 2001.
- Abstract
- Introduction
- Geology of the study area
- Physical properties of iron oxide deposits
- Previous seismic surveys (2015 and 2016)
- Sparse 3D survey (2019)
- Results and interpretation
- Discussion
- Conclusions
- Data availability
- Author contributions
- Competing interests
- Special issue statement
- Acknowledgements
- Financial support
- Review statement
- References