the Creative Commons Attribution 4.0 License.
the Creative Commons Attribution 4.0 License.
 | 25 Feb 2021
Wireline distributed acoustic sensing allows 4.2 km deep vertical seismic profiling of the Rotliegend 150 °C geothermal reservoir in the North German Basin
Evgeniia Martuganova
Manfred Stiller
Ben Norden
Charlotte M. Krawczyk
We performed so-far-unprecedented deep wireline vertical seismic profiling at the Groß Schönebeck site with the novel method of distributed acoustic sensing (DAS) to gain more detailed information on the structural setting and geometry of the geothermal reservoir, which is comprised of volcanic rocks and sediments of Lower Permian age. During the survey of 4 d only, we acquired data for 61 source positions using hybrid wireline fiber-optic sensor cables deployed in two 4.3 km deep, already existing wells. While most of the recorded data have a very good signal-to-noise ratio, individual sections of the profiles are affected by characteristic coherent noise patterns. This ringing noise results from incomplete coupling of the sensor cable to the borehole wall, and it can be suppressed to a large extent using suitable filtering methods. After conversion to strain rate, the DAS data exhibit a high similarity to the vertical component data of a conventional borehole geophone. We derived accurate time–depth relationships, interval velocities, and corridor stacks from the recorded data. Based on integration with other well data and geological information, we show that the top of a porous and permeable sandstone interval of the geothermal reservoir can be identified by a positive reflection event. Overall, the sequence of reflection events shows a different character for both wells explained by lateral changes in lithology. The top of the volcanic rocks has a somewhat different seismic response in both wells, and no clear reflection event is obvious at the postulated base of the volcanic rocks, so that their thickness cannot be inferred from individual reflection events in the seismic data alone. The DAS method enabled measurements at elevated temperatures up to 150 ∘C over extended periods and led to significant time and cost savings compared to deployment of a conventional borehole geophone string. This wireline approach finally suggests significant implications for observation options in old wells for a variety of purposes.
- Article
(12576 KB) - Full-text XML
- BibTeX
- EndNote


Borehole seismic array measurements benefit from deploying fiber-optic cables and using the novel distributed acoustic sensing (DAS) method. This technique allows for rapid seismic data acquisition, because DAS provides continuous measurements along the cable and therefore does not require vertical repositioning of the cable during vertical seismic profiling (VSP) campaigns, as opposed to conventional borehole geophone strings (see proofs of concept in, e.g., Mestayer et al., 2011; Miller et al., 2012). While issues like the mechanical coupling of the sensor cable and the transfer from strain to geophone-equivalent data are still under discussion (see Hartog et al., 2014; Daley et al., 2016), we used this survey technique and further improved the processing of this new data type for geothermal applications to overcome the classical resolution problem and derive accurate time–depth relationships.
The Groß Schönebeck site is located 40 km N of Berlin in the state of Brandenburg, Germany. It is a research platform operated by the GFZ German Research Centre for Geosciences, which has been set up in order to test if production of geothermal energy from deep-seated reservoirs in the North German Basin is feasible. An enhanced geothermal system (EGS) has been created by hydraulic stimulation of low-permeability sedimentary and volcanic rocks of Lower Permian (Rotliegend) age (Huenges et al., 2006; Zimmermann et al., 2010). So far, two deep research boreholes, the former E GrSk 3/90 hydrocarbon exploration well and the Gt GrSk 4/05 geothermal well (referred to as GrSk3 and GrSk4 in the following), exist at the site. For further development of the site, the implementation of a new stimulation concept and drilling of a new well have been proposed (Blöcher et al., 2015).
In order to gain more detailed information on the structural setting and geometry of the reservoir, a 3-D seismic survey within an 8 km × 8 km permit area has been carried out in February and March 2017 (Krawczyk et al., 2019). In addition, VSP has been performed within the GrSk3 and GrSk4 wells. The primary aims of the VSP survey were to establish precise time–depth and velocity profiles, and to image structural elements within the reservoir interval of the Rotliegend at 4200 m depth in the vicinity of the boreholes with higher resolution in three dimensions. The imaging of structures in the target reservoir interval is a special challenge, as it is overlain by the 1400 m thick Upper Permian Zechstein salt complex.
The VSP measurement was performed using the novel DAS method. This method is based on optical time-domain reflectometry and enables us to register strain changes along optical sensor cables with high spatial and temporal resolution (Parker et al., 2014). Within recent years, a growing number of VSP surveys have been reported, where the DAS method has successfully been applied using sensor cables permanently installed behind casing or along tubing (e.g., Mestayer et al., 2011; Daley et al., 2013; Götz et al., 2018). This deployment method is very convenient as it allows for data acquisition without well intervention. There is also a growing number of studies reporting on successful application of DAS for microseismic monitoring during hydraulic stimulation (e.g., Molteni et al., 2017; Karrenbach et al., 2017), also including EGS reservoirs (Lellouch et al., 2020). In cases where such a permanent installation is not possible or has not been performed during construction of the well, a sensor cable can be lowered downhole temporarily, similar to conventional wireline logging. For this wireline deployment method, nevertheless, only very few experiences have existed until now. First tests using an experimental optical wireline logging cable deployed in a 625 m well were described by Hartog et al. (2014), while a more extensive DAS walkaway VSP survey has been performed by Yu et al. (2016) in a vertical well to a depth of 4004 m. Within the current study, we report on the results of a DAS-VSP acquisition on wireline cable to a depth of 4256 m, which to the authors' knowledge represents the deepest survey currently documented in literature worldwide. In the following, the survey design and data acquisition, the overall characteristics of the acquired data, and the data processing and evaluation for a zero-offset source position are described. The processing and interpretation of a 3-D VSP seismic cube will be the subject of a separate publication.
The target area was defined by the positions of the existing wells, the expected extent of the hydraulic fractures, and the trajectory of the proposed new well. It has a horizontal extent of approximately 700 m × 500 m and a vertical thickness of approximately 300 m. A spiral pattern of 61 source points with offsets between 180 and 2000 m from the wellheads was chosen, in order to achieve a good 3-D coverage of the target area with a uniform distribution of azimuths (Fig. 1). Survey planning was based on well trajectories and geometry of the major geologic units (Moeck et al., 2009), taking into account DAS-specific acquisition characteristics like directivity and signal-to-noise ratio. The source-point positions were optimized based on ray tracing, using average acoustic properties of the major geologic units from a previous regional seismic survey (Bauer et al., 2010). Based on the ray tracing, reflection-point fold maps for representative layers at target depth and incidence angles of upgoing reflected waves at the sensor cables were calculated and compared for different source-point distributions. The most suitable source-point distribution was then selected, and individual source-point locations were further adjusted according to the conditions within the survey area, i.e., location of roads and agricultural areas, as well as required distances to sensible infrastructures like gas lines or buildings.
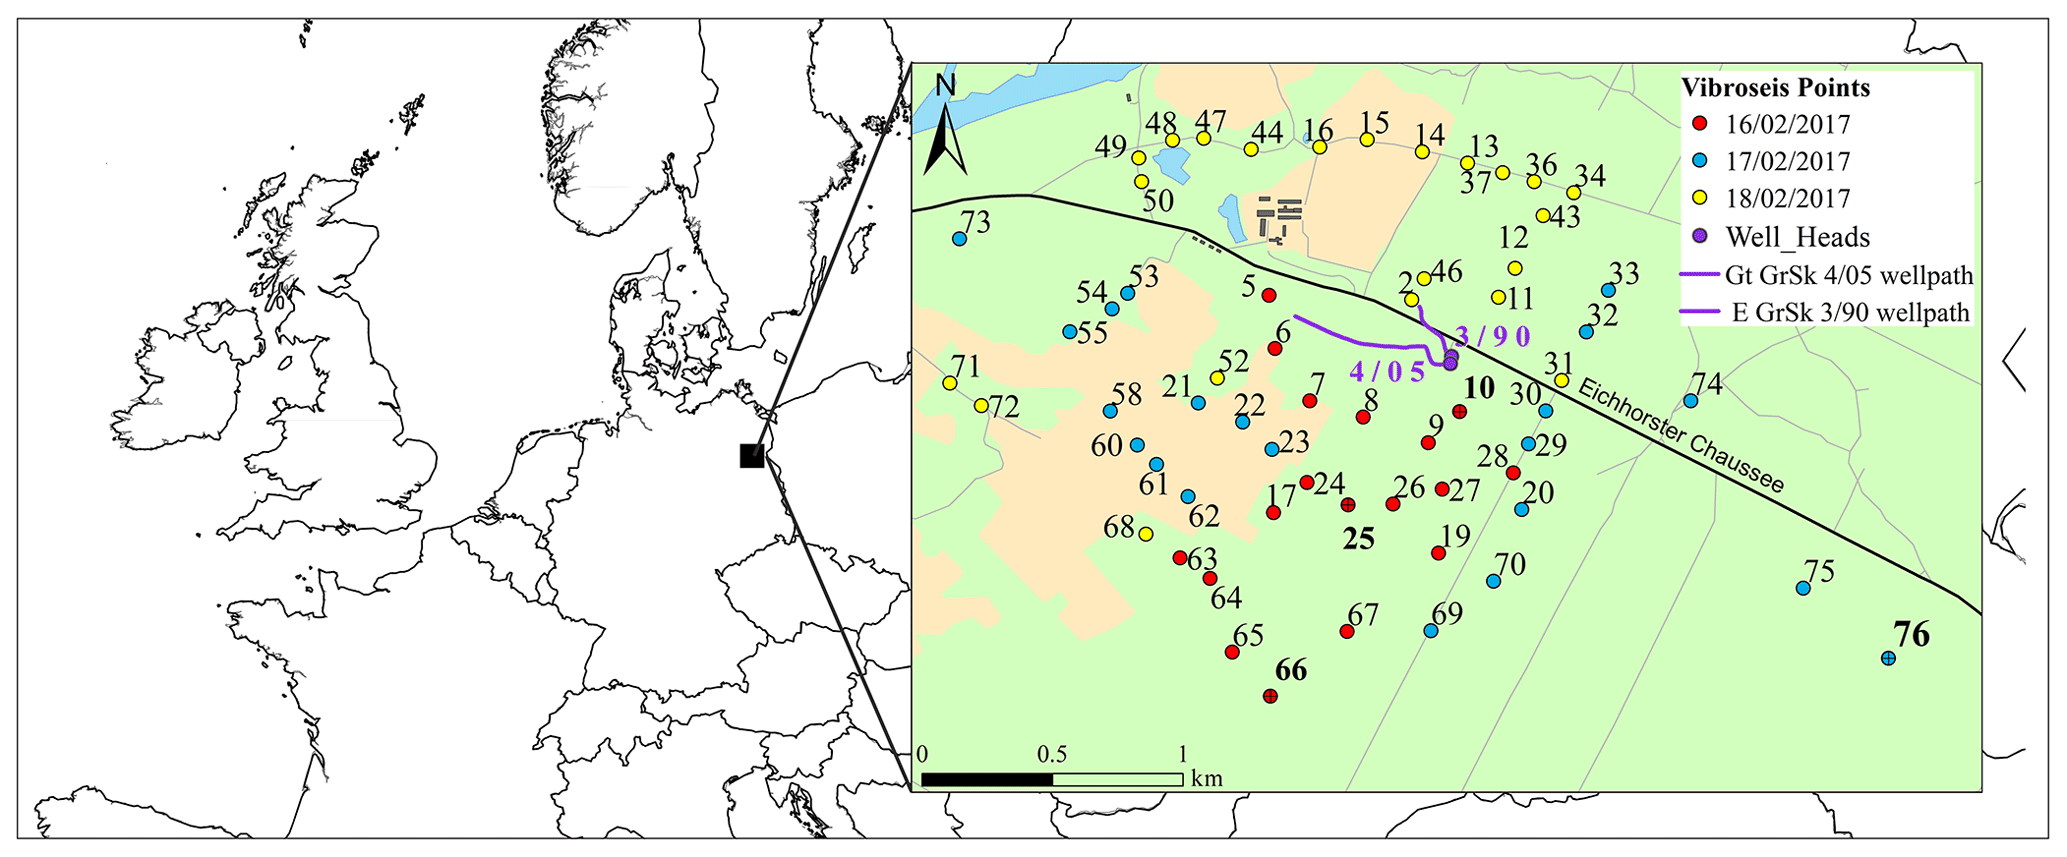
Figure 1Overview map of central Europe with location of survey area in NE Germany. Inset shows detail of survey area with VSP source-point positions and borehole trajectories of wells E GrSk 3/90 and Gt GrSk 4/05. Selected source-point positions for which common-source gathers are displayed in Figs. 3 and 4 are marked with crosses and printed with bold type.
A listing of the acquisition parameters is shown in Table 1. Energy excitation was performed with four heavy vibrator trucks operating simultaneously at each source position. For acquisition of the DAS data in well E GrSk 3/90, the GFZ hybrid borehole measurement system was used, which allows for deployment of fiber-optic sensors and electric downhole tools in parallel (Henninges et al., 2011). The GrSk3 well is near vertical (maximum inclination 7.2∘), and the fiber-optic data were acquired to a measured depth (MD) of 4256 m below ground level, which corresponds to a true vertical depth (TVD) of 4245.8 m below ground level (note that all depths in this study are given in MD, if not stated otherwise). Within the well Gt GrSk 4/05, which is deviated up to 49∘ in the reservoir interval, a second wireline cable containing optical fibers was deployed (maximum DAS acquisition depth 4196 m MD/4126.1 m TVD). This is an experimental optical wireline cable developed by Schlumberger, referred to as an optical heptacable (Hartog et al., 2014). This cable was also used to deploy a conventional three-component borehole geophone with acceleration characteristics (Versatile Seismic Imager (VSI) tool; Schlumberger), in order to record several check shots1 at specific depths within the GrSk4 well. DAS data were acquired on both cables using two separate Schlumberger hDVS (heterodyne distributed vibration sensing) optical interrogator units.
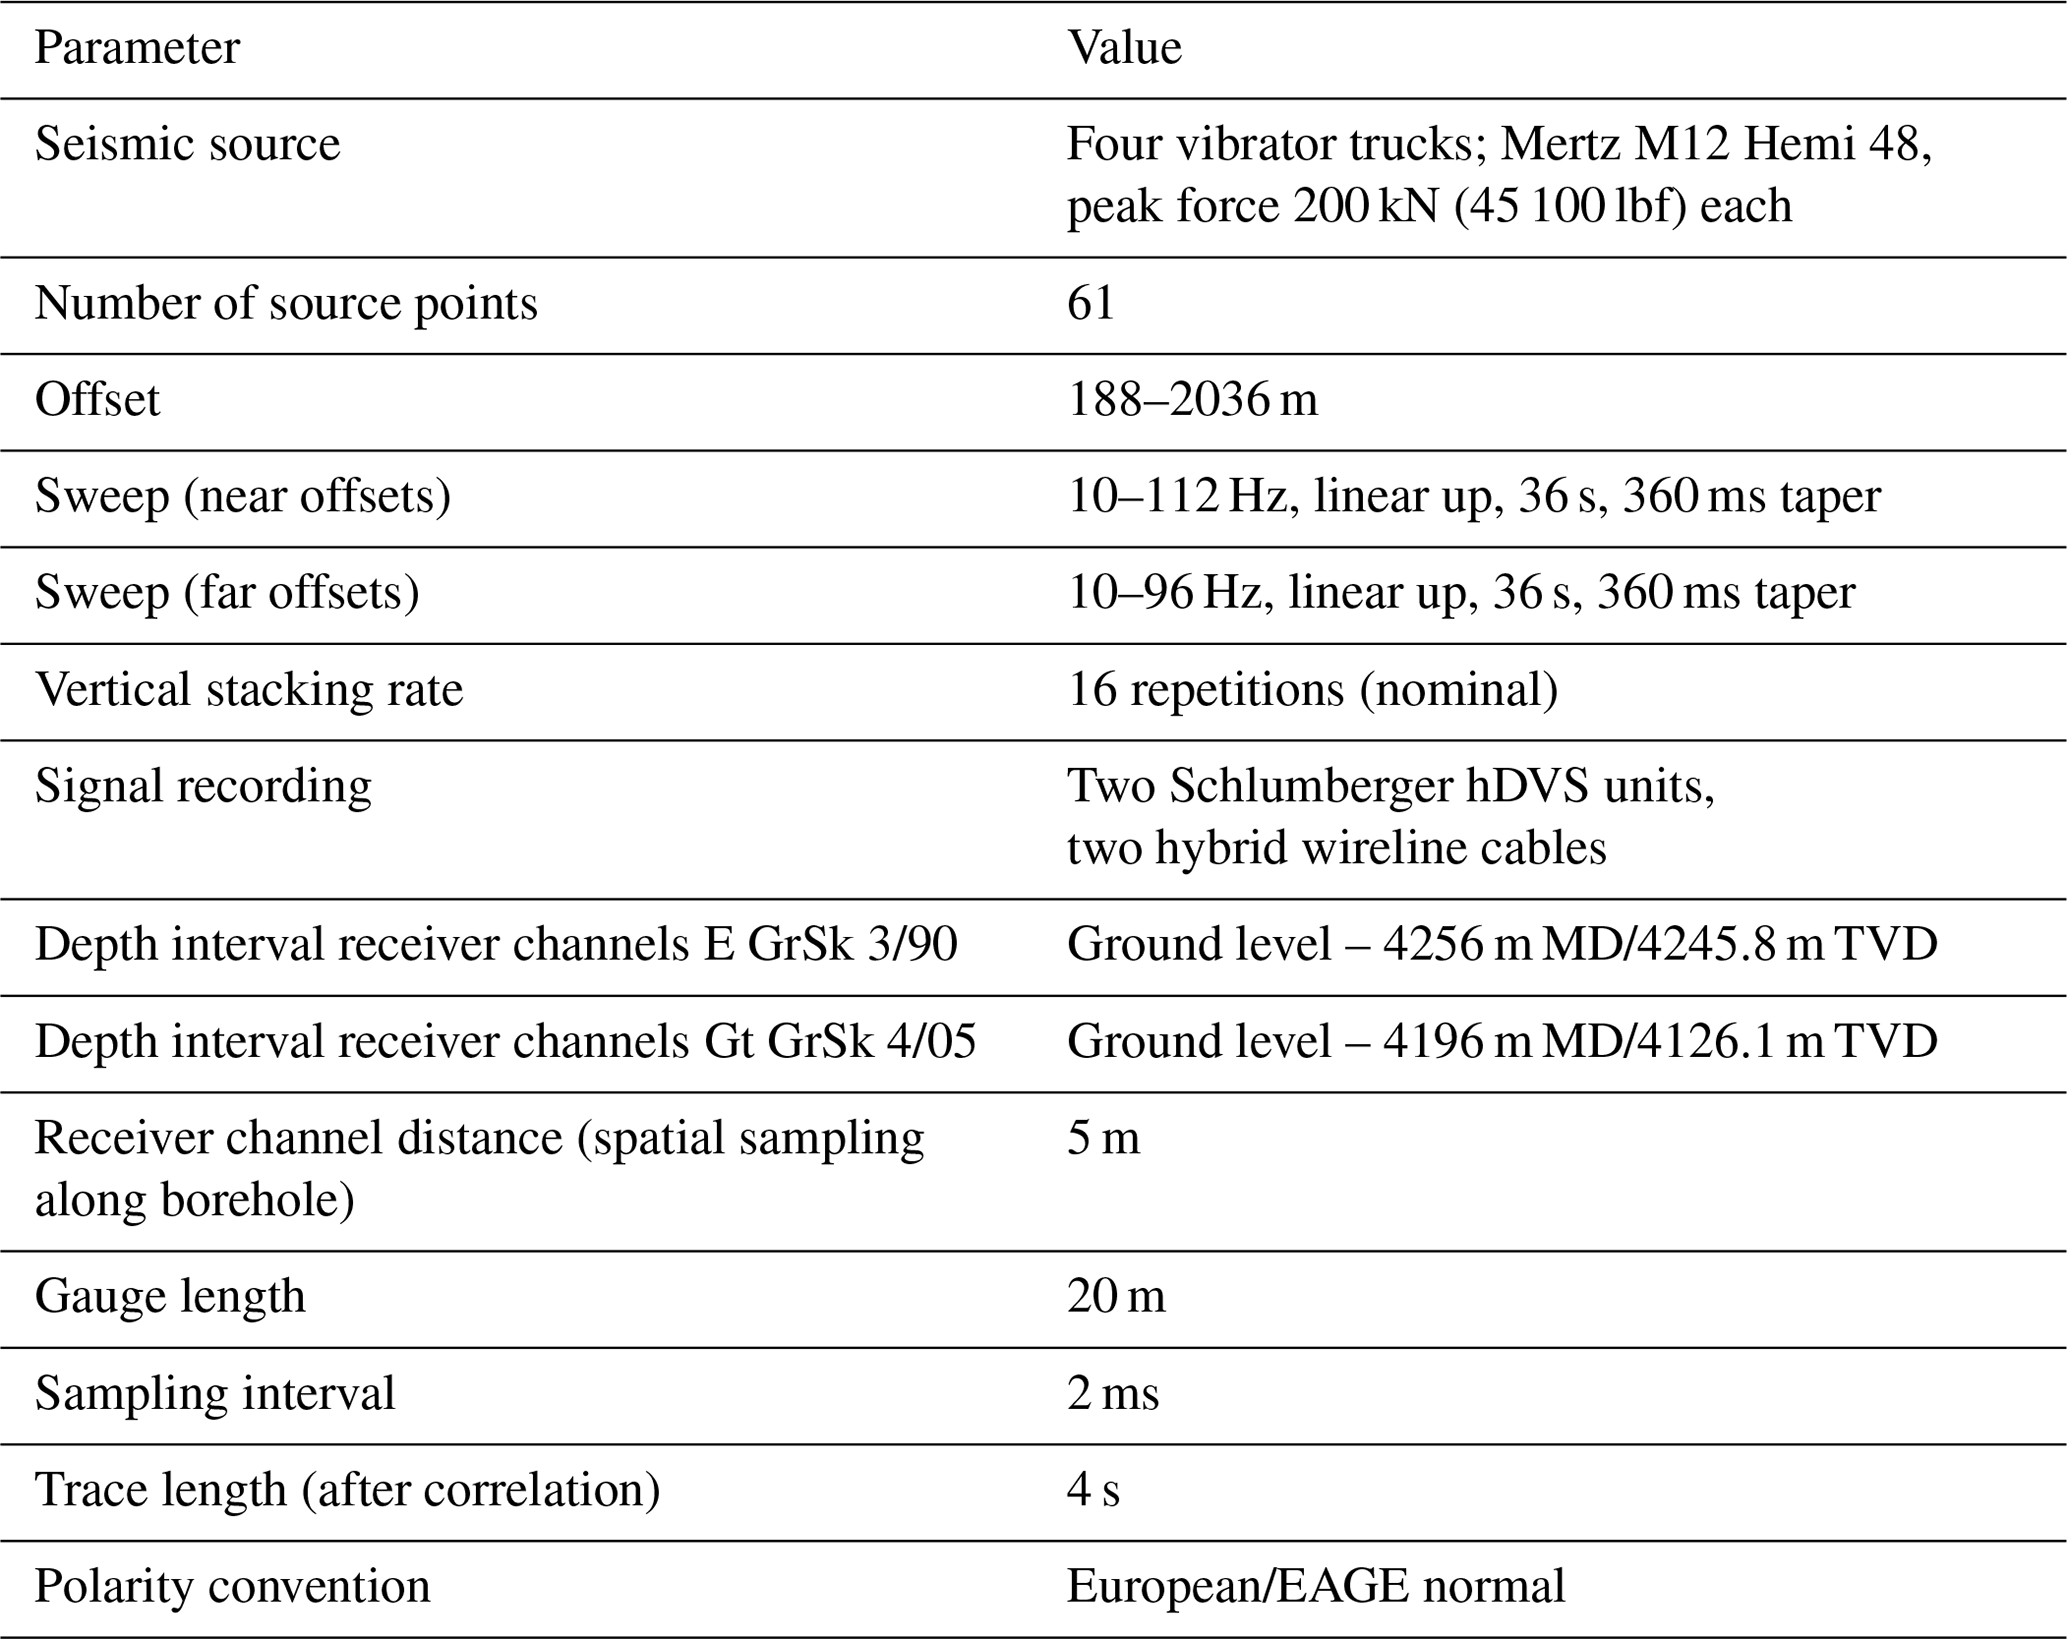
Fieldwork was carried out within 4 d from 15 to 18 February 2017. At the beginning, we performed a start-up test (referred to as day 0 in the following), where suitable source and recording parameters were determined. As a result, we selected a sweep with 10–112 Hz (linear) and 36 s duration for acquisition. For some of the larger offsets, a sweep with reduced frequency range of 10–96 Hz was used. After testing of several different gauge length values (see Henninges et al., 2021), which can be varied with the hDVS interrogator, a gauge length value of 20 m was selected for online DAS data processing during recording. This value was later adjusted to 40 m during post-processing as a result of an optimization procedure (see Sect. 3.1). The DAS measurements were recorded with a temporal sampling of 2 ms and a spatial sampling of 5 m spacing across the entire length of the wells.
During the start-up test, we recorded several shots with variation of the wireline cable tension in the GrSk3 well, in order to test the influence on the mechanical coupling of the cable and the quality of the recorded signals (cf. Frignet and Hartog, 2014; Constantinou et al., 2016). After the bottom of the drivable depth in well GrSk3 had been reached at 4259 m MD, recordings with increasing amounts of cable slack of 1, 5, 11, and 20 m were performed. Based on the results, it was decided to keep the wireline cable under almost full tension for recording, as the best overall data quality was found to be achieved under these conditions (see Sect. 4.2).
Within the following 3 d (days 1–3), acquisition was performed with a nominal number of 16 repeats for the 61 source positions distributed around the wells (see Fig. 1). Nevertheless, due to a technical problem with acquisition in well GrSk4 during day 1, mainly only data for well GrSk3 could be recorded during this time. Therefore, in order to improve the reduced coverage around the GrSk4 well caused hereby, we relocated some of the original source positions from the northern to the southwestern part of the survey area.
As one of the first processing steps, the DAS data recorded along the length of the sensor cables were correlated to the measured depth along the boreholes. This depth correlation was performed using the gamma-ray logs recorded during running in hole with the sensor cables, as well as travel-time data from check shots recorded at 1200, 2400, 3600, and 4207 m depths in the GrSk4 well. During further processing, the depths were transferred to vertical depths below the seismic reference datum, which is mean sea level (true vertical depth below mean sea level; TVDSS), using the geometries of the borehole trajectories.
3.1 Gauge length optimization
The choice of an optimized gauge length value is an essential part of the DAS data acquisition and processing. This parameter has a significant effect on the signal-to-noise ratio of the data and on resolution in the frequency domain. Dean et al. (2017) presented an approach which helps to maximize the signal-to-noise ratio while keeping interfering influences on the frequency content below a desired threshold value. By selecting an optimum gauge length GLopt (m), a favorable compromise between these two factors can be achieved, using
with R the gauge length spatial wavelength ratio (–), v (apparent) acoustic velocity (m/s), and fp peak frequency (Hz).
The graphs presented in Fig. 2 show the dependence of signal-to-noise ratio and resulting wavelength on R for the conditions of the current survey. According to this, optimum conditions within the desired limits are found for R values between 0.46 and 0.56. For an intermediate R value of 0.5, an optimum gauge length of 39 m is calculated using Eq. (1), for a velocity of 4800 m/s, which has been extracted from the interval velocities derived for the Rotliegend reservoir interval (see Sect. 4.3), and a middle frequency of 61 Hz for the 10–112 Hz sweep. Therefore, the acquired DAS-VSP data were reprocessed accordingly using the derived optimum gauge length value. It would also be possible to apply a depth-dependent gauge length optimization, as suggested by Dean et al. (2017), by taking local variations of velocity and frequency content into account. This was nevertheless not performed in the current study, because the focus here is predominantly on the deeper Rotliegend reservoir section only.
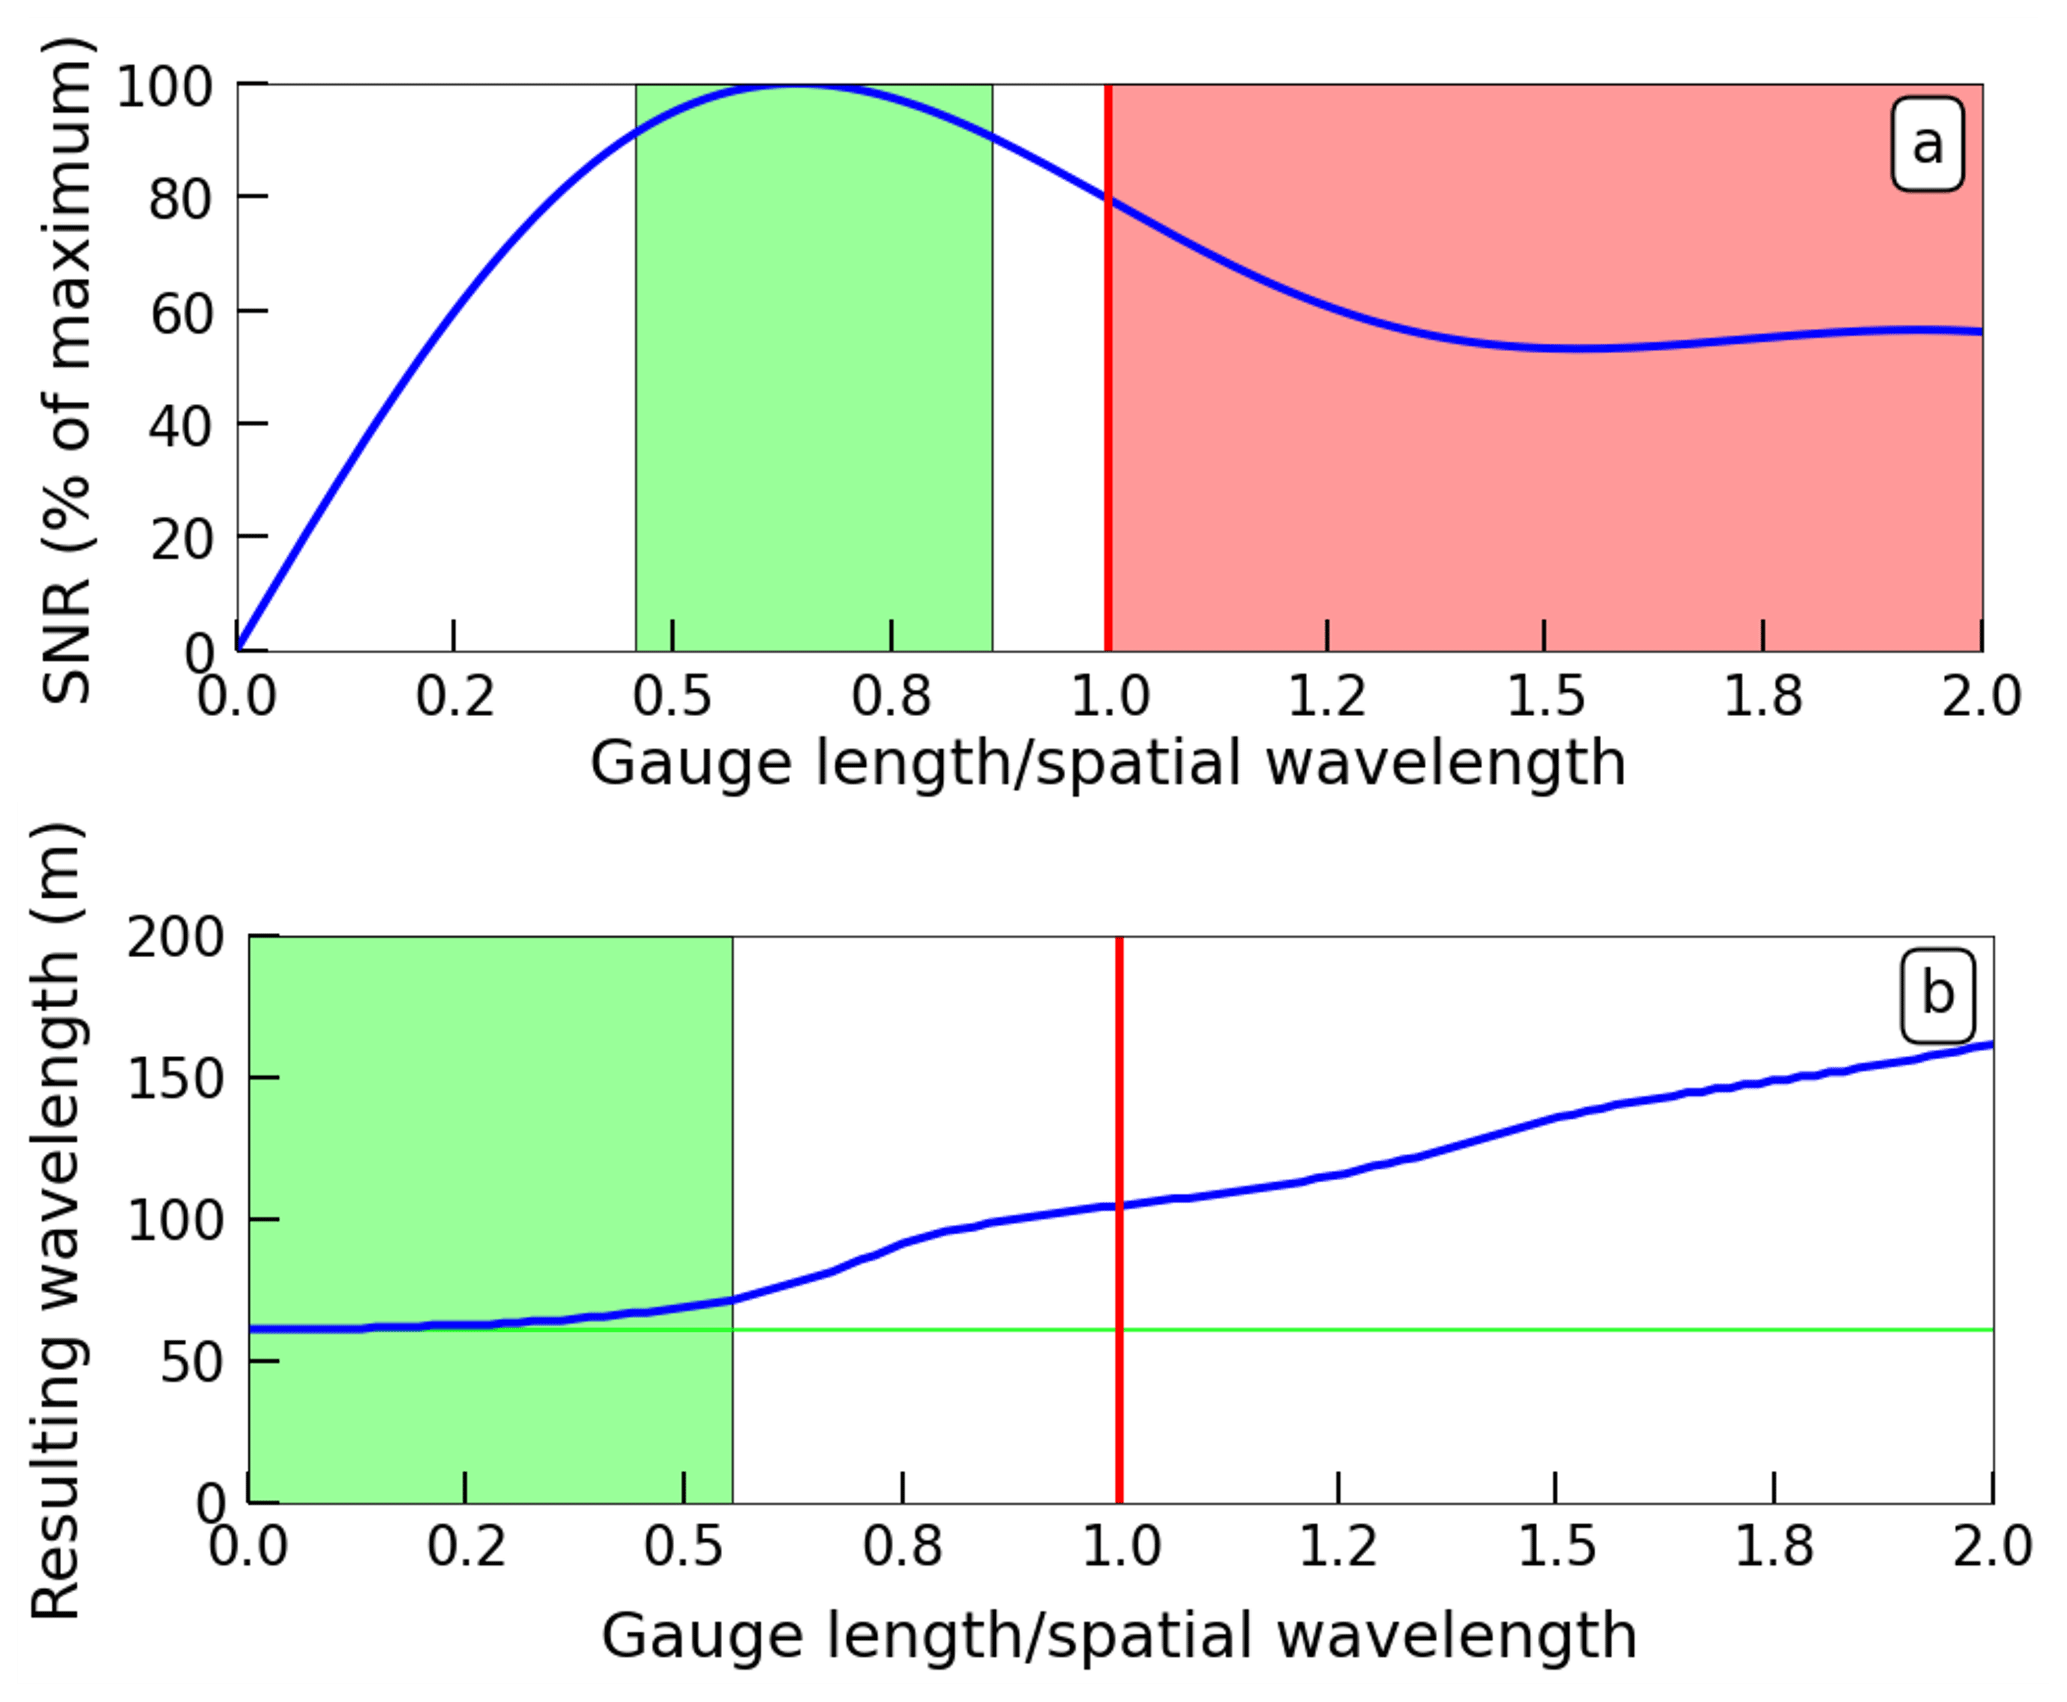
Figure 2The signal-to-noise ratio (SNR) (a) and resulting wavelength (b) for different ratios of gauge length to spatial wavelength for a 10–112 Hz Klauder wavelet with a velocity of 4800 m/s. The green boxes indicate the range of ratios where SNR >90 % of the maximum, and the resulting wavelength is within 3 m of the actual wavelength (indicated by green line). If the gauge length is larger than the spatial wavelength (red box, ratio of 1 indicated by the red line), the wavelet shape is distorted. The optimum conditions satisfying both constraints are found in the region where the two green boxes in panels (a) and (b) overlap.
3.2 Pre-processing
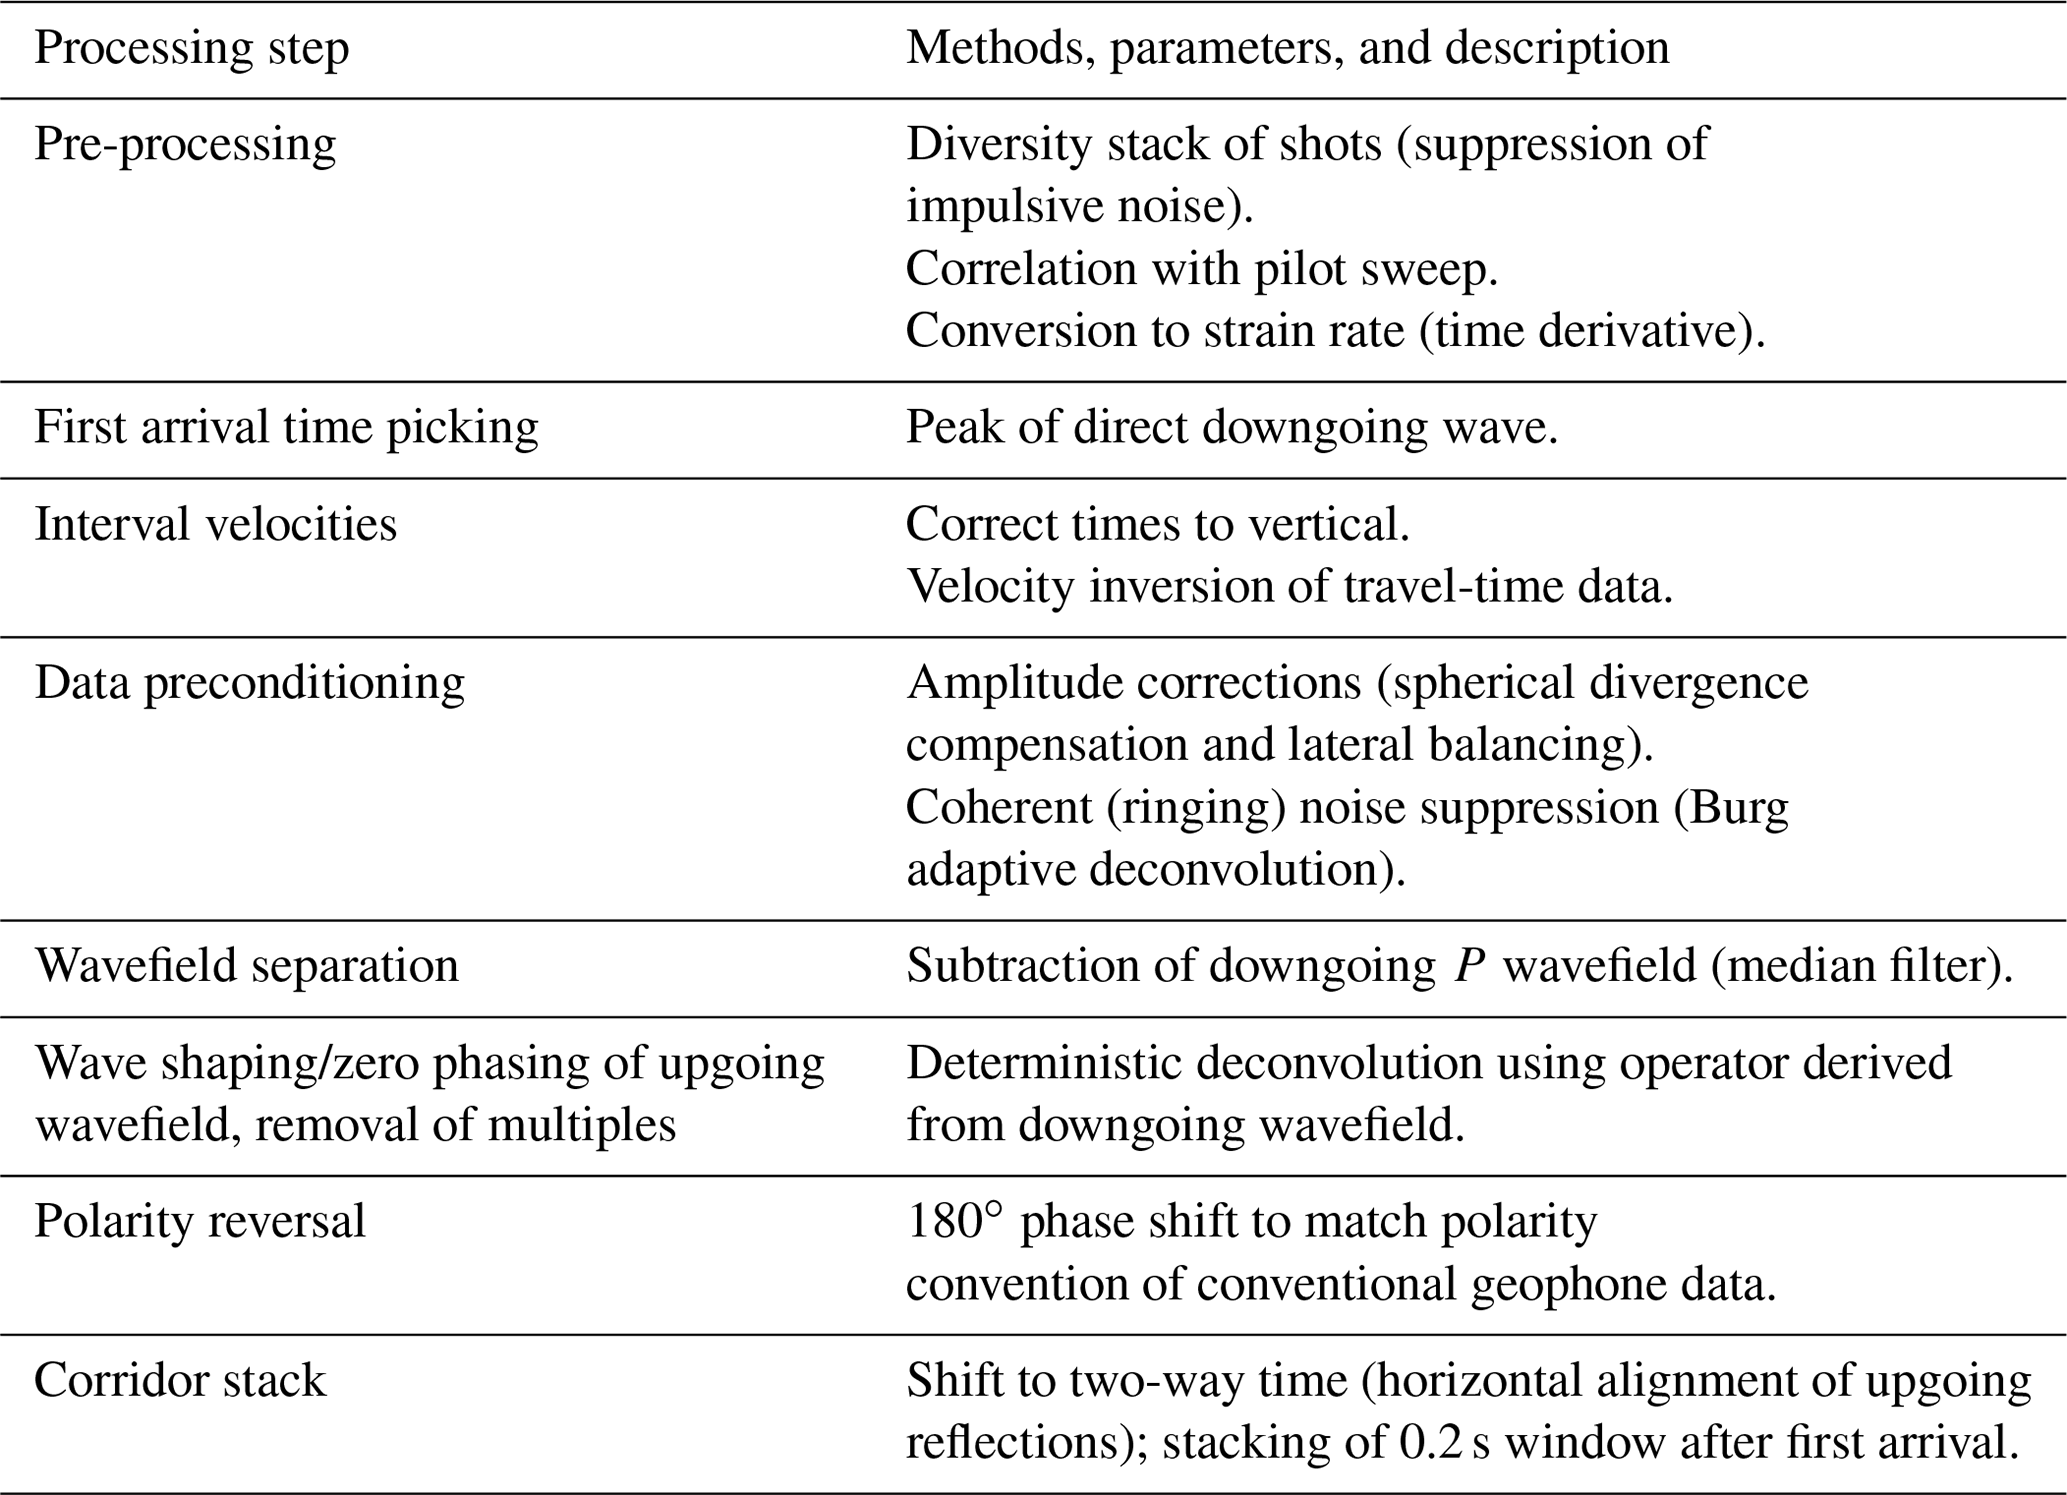
An overview of the further seismic data processing steps is shown in Table 2. Seismic pre-processing included stacking and correlation with the pilot sweep. The hDVS output strain data were then transformed to strain rate by differentiation in time, resulting in a 90∘ phase shift. The strain-rate data are proportional to acceleration (Daley et al., 2016), and acceleration is in phase with the pilot sweep (Sallas, 1984).
Table 2Sequence of processing steps for zero-offset DAS-VSP data sets.
3.3 Common-source gathers and coherent noise suppression
Common-source gathers for zero-offset, intermediate, and far-offset source positions are displayed in Figs. 3 and 4. The common-source gathers are dominated by downgoing P-wave arrivals and arrivals of upgoing waves originating from several reflectors at different depths. For several shots, a strong tube wave arriving at later times is clearly visible as well.
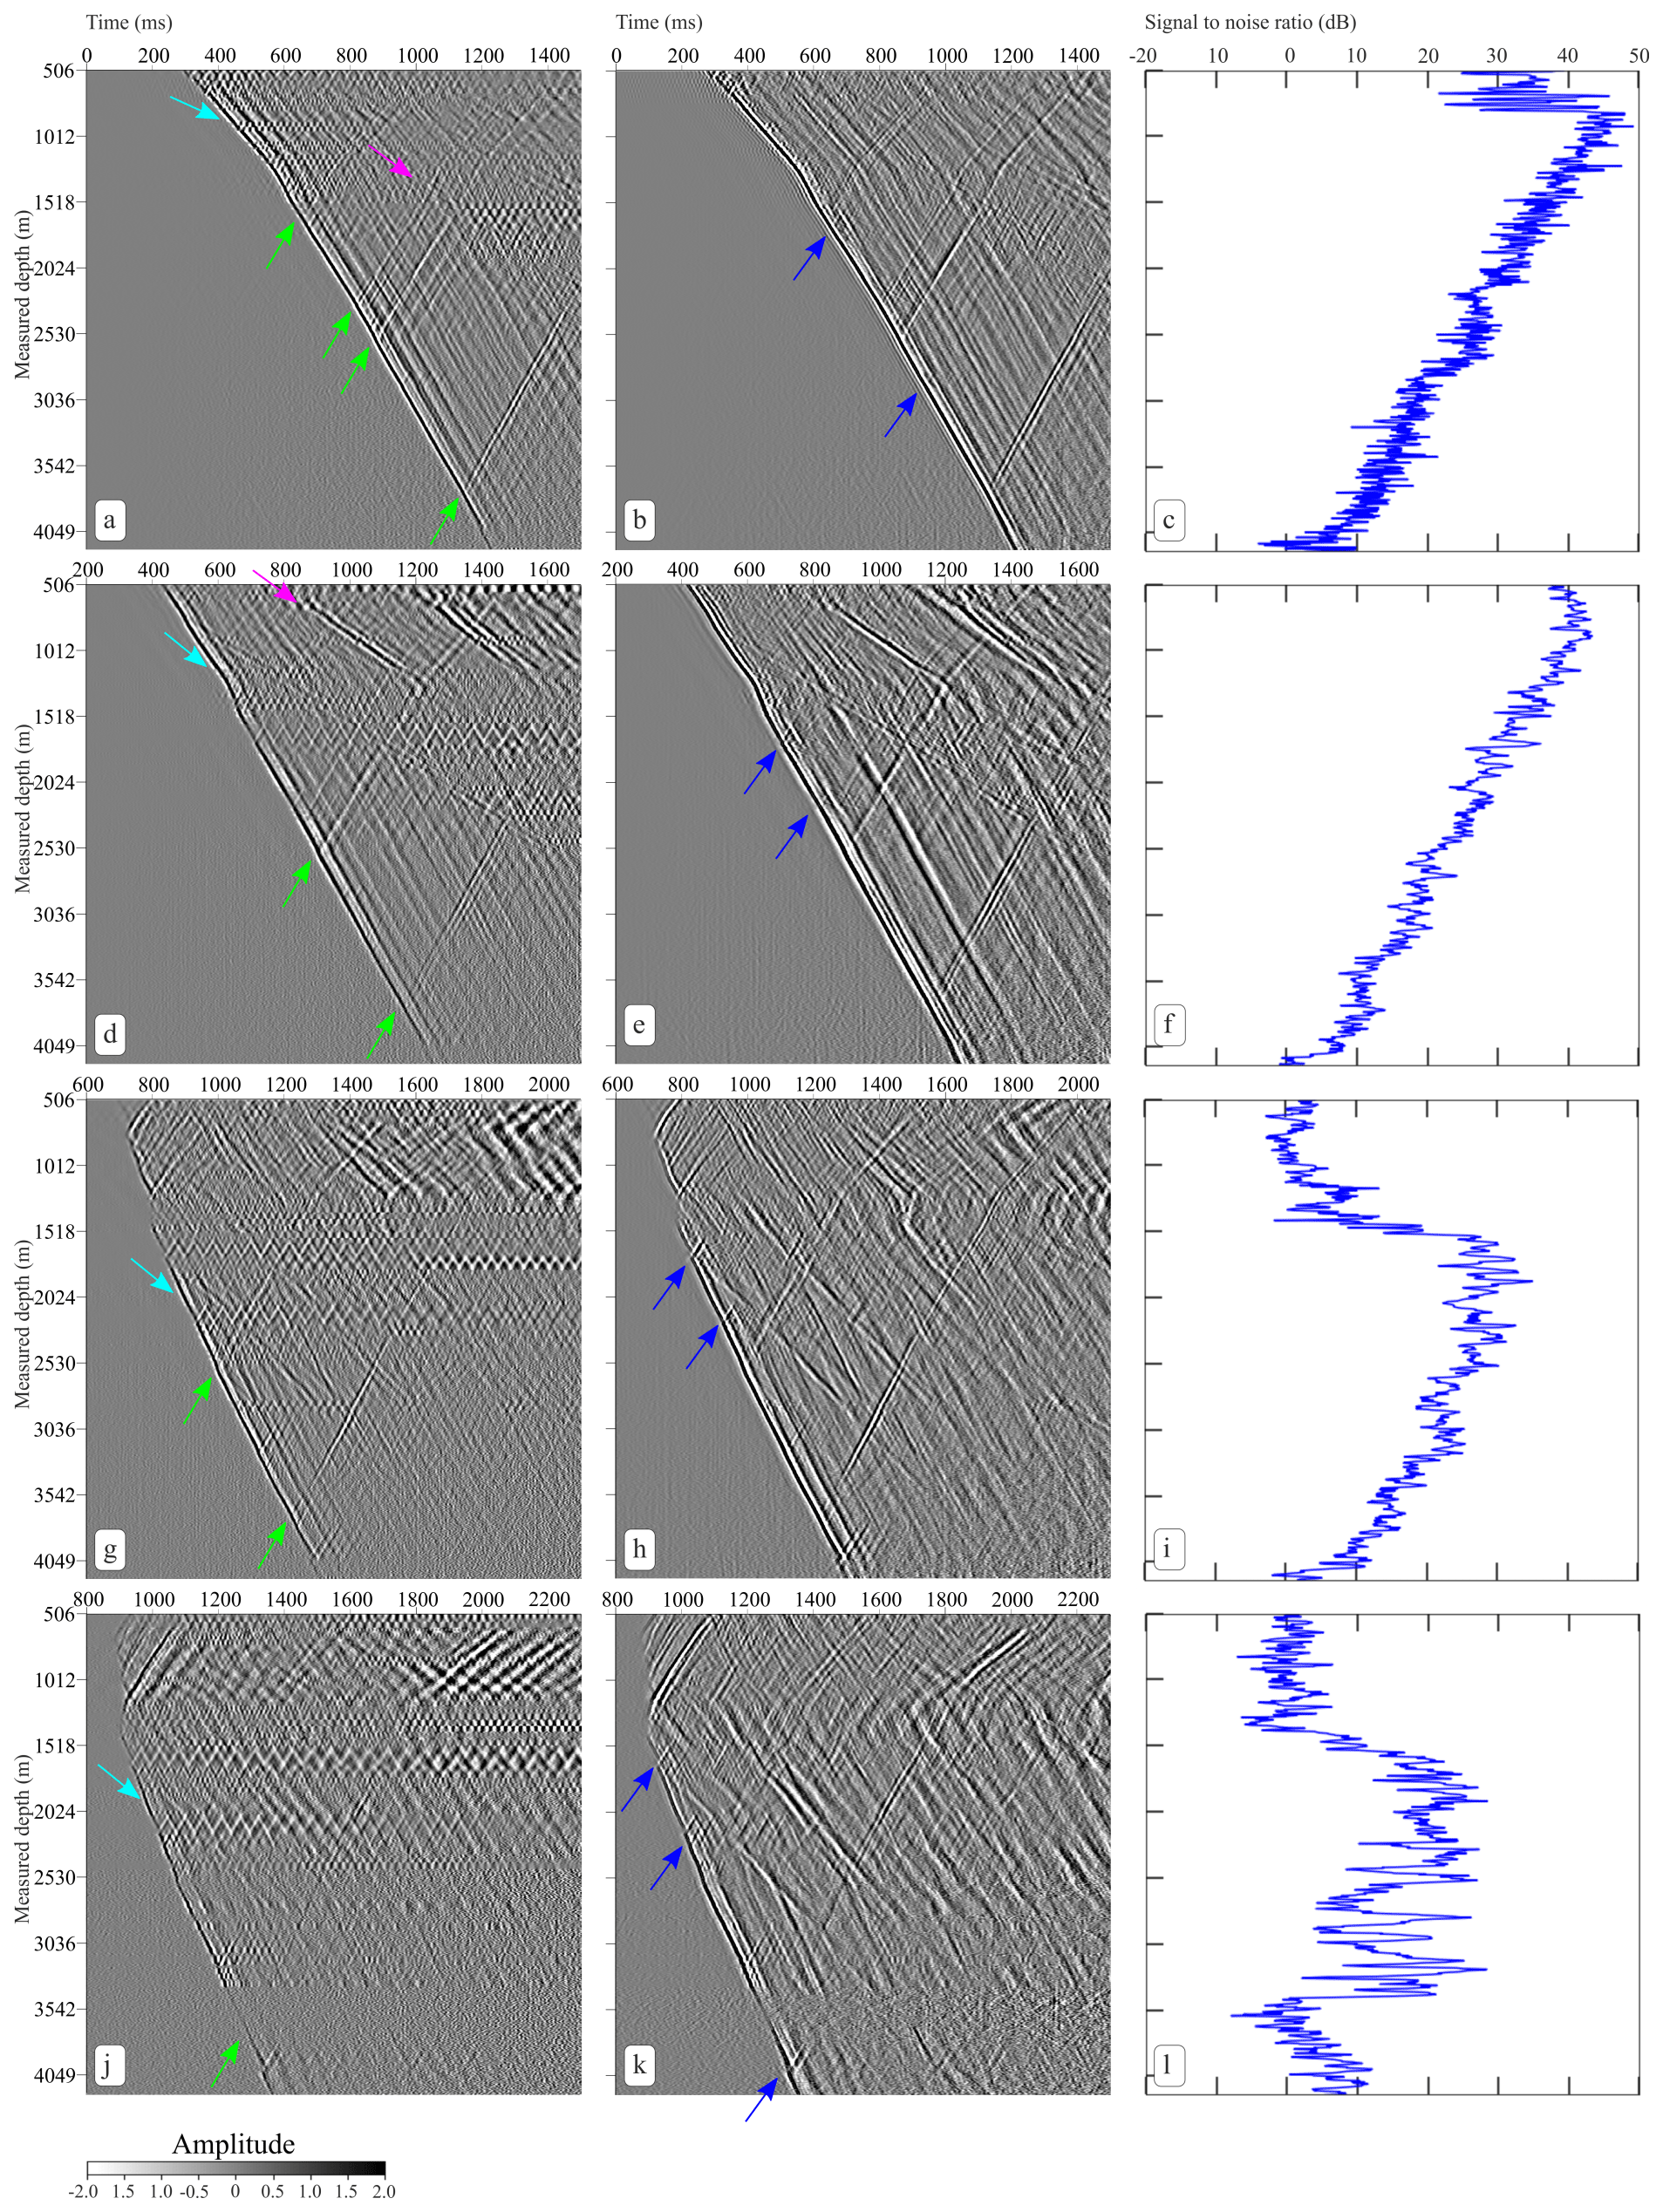
Figure 3Selected common-source gathers for well GrSk3 for zero-offset, intermediate, and far-offset source positions. First column of panels shows data after pre-processing for source positions 10 (a), 25 (d), 66 (g), and 76 (j). Second column (panels b, e, h, and k) shows the data for the same source positions after ringing-noise suppression (Burg adaptive deconvolution) and moderate coherency enhancement. For display, we applied a windowed trace equalization. The third column (panels c, f, i, and l) shows the signal-to-noise ratio of the data after pre-processing. Colored arrows (exemplary): direct downgoing P wave (light blue), upgoing reflected P–P waves (green), tube wave (magenta), residual noise after application of ringing-noise filter (dark blue).

Figure 4Selected common-source gathers for well GrSk4 for zero-offset, intermediate, and far-offset source positions. First column of panels shows data after pre-processing for source positions 10 (a), 25 (d), and 66 (g). Second column (panels b, e, and h) shows the data for the same source positions after ringing-noise suppression (Burg adaptive deconvolution) and moderate coherency enhancement. For display, we applied a windowed trace equalization. The third column (panels c, f, and i) shows the signal-to-noise ratio of the data after pre-processing. Colored arrows (exemplary): direct downgoing P wave (light blue), upgoing reflected P–P waves (green), tube wave (magenta), residual noise after application of ringing-noise filter (dark blue).
Over several intervals along the wells, a coherent noise with a particular zigzag pattern can be recognized in the DAS data. Similar noise in DAS data recorded using cables suspended in boreholes has also been described in some earlier studies, e.g., by Miller et al. (2012), Yu et al. (2016), Cai et al. (2016), and Willis et al. (2019). It has also been found to occur for tubing-deployed cables, e.g., in the studies of Barberan et al. (2012) and Didraga (2015).
Several methods for elimination of this “ringing” noise, like spectral balancing, deconvolution, and time–frequency domain filtering (Elboth et al., 2008), were tested. For zero-offset data processing, we selected the Burg adaptive deconvolution (Griffiths et al., 1977). This method is a good compromise between computational effort, robustness, and application simplicity. A more thorough description of this ringing noise and further methods of noise suppression can be found in Martuganova et al. (2021). The filtered data sets are displayed in Figs. 3 and 4, together with the unfiltered data sets for comparison.
Usage of self-updating linear prediction operators is the foundation of the Burg adaptive deconvolution method. The designed filter operator is different at each trace sample. A set of filter coefficients is convolved with the data in order to predict the future data values at some prediction distance. Coefficient values are recomputed for each data sample in the seismic record with the criterion of minimizing the root-mean-square error. The computations are performed in forward and reverse directions in the time domain.
The application of Burg adaptive deconvolution resulted in a significant reduction of the coherent ringing noise (Figs. 3 and 4). After filtering, reflections are better visible and sharpened. Nevertheless, not all parts of the noise can be suppressed, especially in a short time window after the first-break arrivals. This residual noise is difficult to distinguish from upgoing reflected waves, as the velocity of the noise traveling along the cable is similar to the compressional velocity of the formation (Martuganova et al., 2021).
4.1 Comparison of DAS and borehole geophone data
A comparison between the DAS strain-rate data and the vertical component of the borehole geophone acceleration data recorded at specific depths in the GrSk4 well is displayed in Fig. 5. Note that during recording of the check-shot data a sweep with 10–88 Hz was used, which is different from the recording of most of the other data during the survey.

Figure 5VSP traces and frequency spectra for borehole geophone data (VSI, solid red line) and DAS strain-rate data (dashed blue line) recorded in well GrSk4 at measured depths of 1200 (a, b), 2400 (c, d), 3600 (e, f), and 4207 m (g, h). The borehole geophone is a three-component accelerometer, and the vertical component parallel to the tool/borehole axis is displayed. The recorded amplitudes have been normalized to the absolute maximum first-break amplitude of the individual traces.
The traces recorded at 1200 and 3600 m depth both contain direct P-wave arrivals, at 520 and 1090 ms, respectively. The DAS trace for 1200 m depth is strongly influenced by the ringing noise described above, which is confined to a narrow frequency band between 40 and 50 Hz (Fig. 5b) at this location. Similar noise characteristics have been observed, e.g., in the study of Chen et al. (2019). This noise is however not evident in the geophone data recorded at the same depth, which suggests that the ringing noise in the DAS data is related to the deployment method of the DAS sensor cable. While the DAS sensor cable is freely suspended inside the borehole, the geophone tool is clamped to the borehole wall. Closer analysis of the ringing noise shows that the sensor cable acts like a vibrating string within the affected intervals, with resonances occurring at a fundamental frequency and higher overtones (Didraga et al., 2015; Martuganova et al., 2021).
The traces recorded at 3600 m depth (Fig. 5e) also contain strong reflected waves, which arrive at around 1190 ms and originate from the base of Zechstein reflectors, at around 3850 m depth (see Fig. 4). Overall, the DAS strain-rate data exhibit a high similarity to the geophone measurements, except for the upgoing reflections. Here, the DAS strain-rate data display the opposite polarity as the geophone data. This polarity reversal for reflected upgoing waves has also been observed in previous studies, e.g., by Hartog et al. (2014), Mateeva et al. (2014), or Willis et al. (2016). Frignet and Hartog (2014) note that such a polarity flip compared to geophone data is similar to the characteristics of hydrophone sensors.
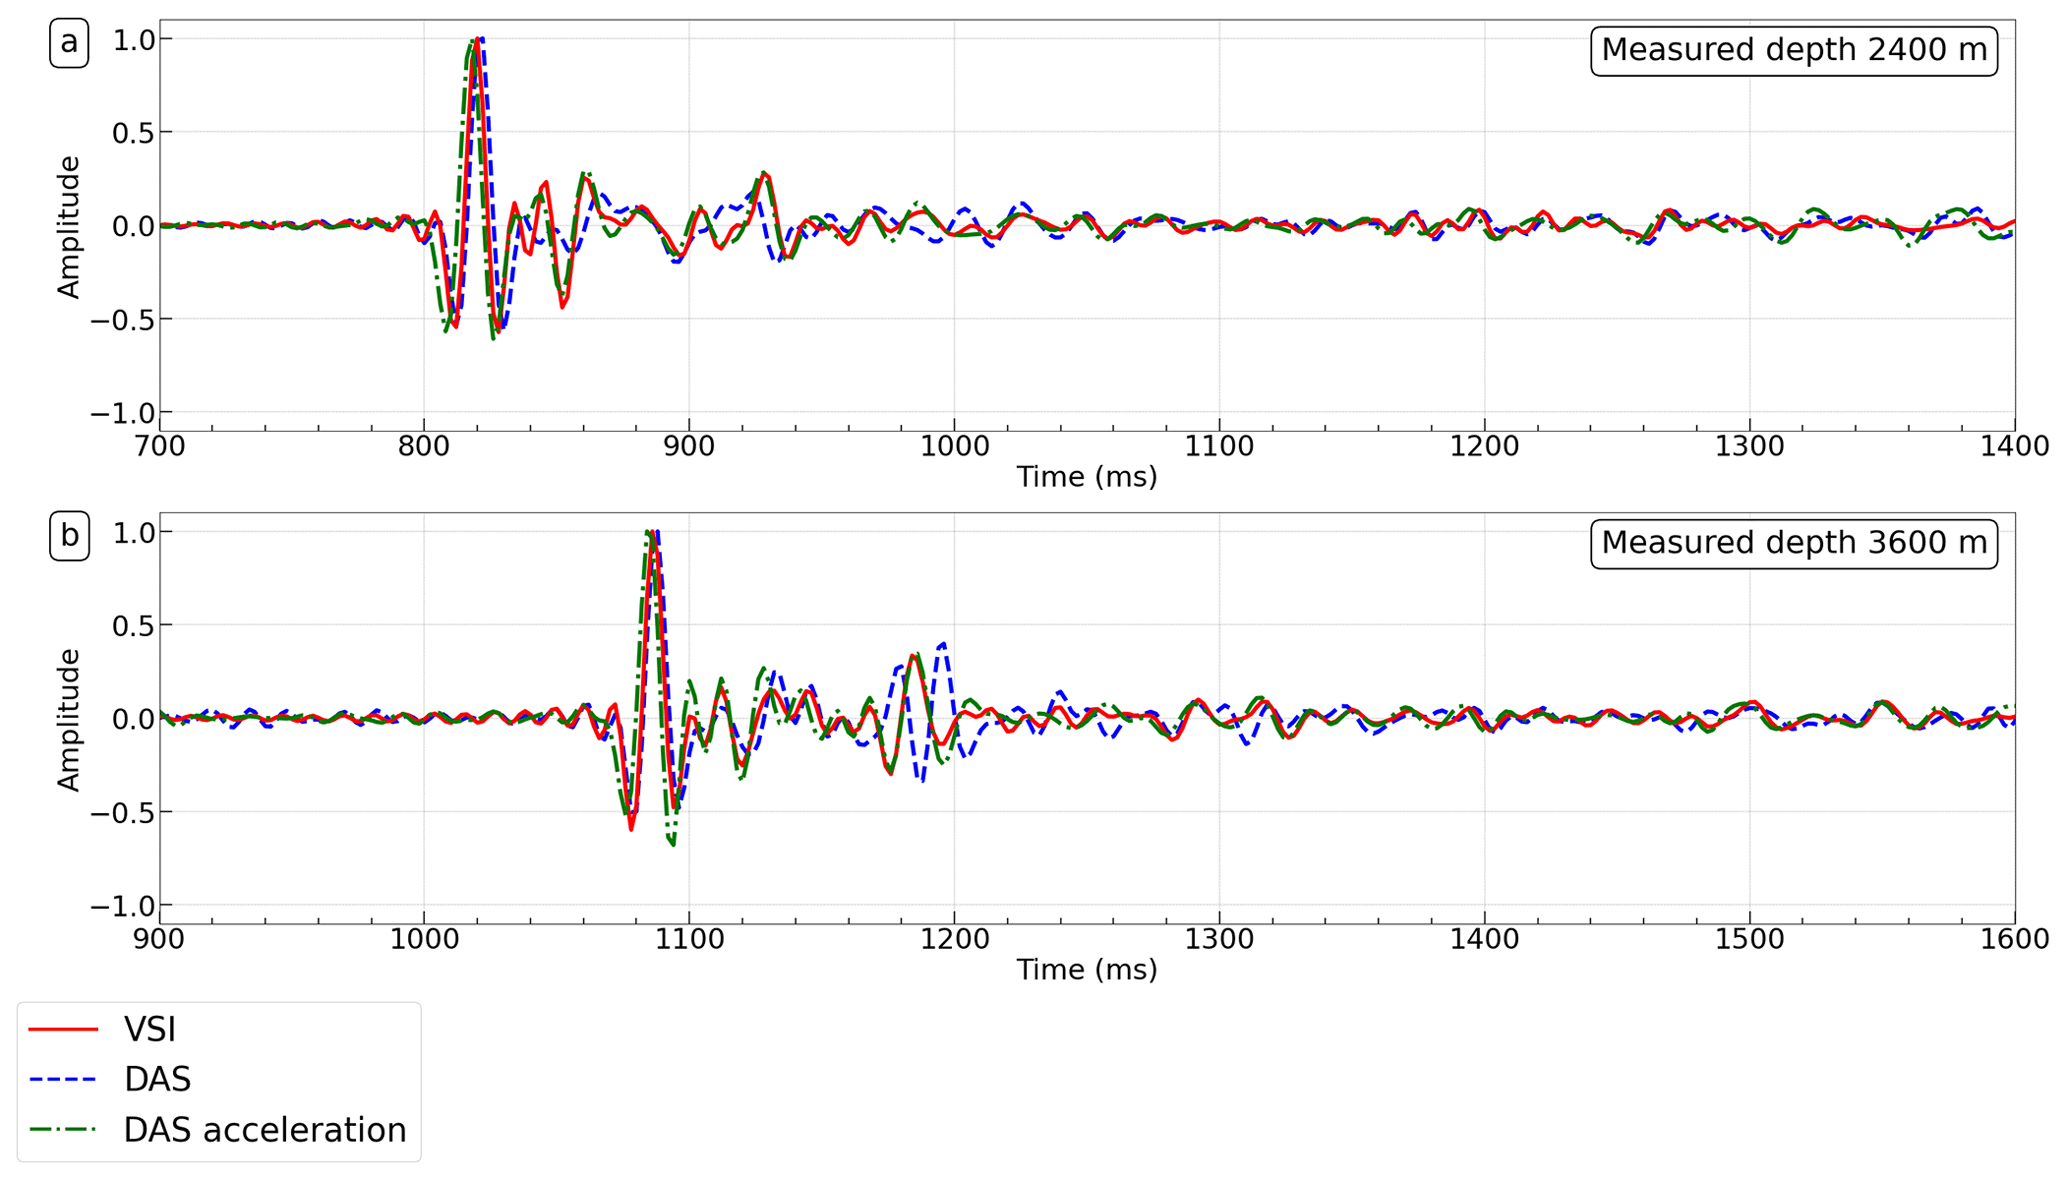
Figure 6Comparison of data from the borehole geophone (VSI, red, acceleration), DAS converted to strain rate (blue) and DAS converted to acceleration (green), recorded at measured depths of 2400 (a) and 3600 m (b) in well GrSk4. The recorded amplitudes have been normalized to the absolute maximum first-break amplitude of the individual traces.
As a test, we have also converted the DAS data to geophone-equivalent acceleration data using the method described by Egorov et al. (2018). For this, we performed a transformation of the original DAS strain data into acceleration via filter application in the vertical wavenumber domain (kz) and further double differentiation in the time domain. The results for the check-shot traces recorded at 2400 and 3600 m depth are shown in Fig. 6. After conversion to acceleration, the DAS data display the same polarity as the geophone data, also for the upgoing reflections. This is in line with previous results obtained by Correa et al. (2017).
4.2 Signal quality
Common-source gathers recorded with different amounts of cable slack in well GrSk3 are displayed in Fig. 7. There is a zone with decreased amplitude of the first-break signal at the bottom of the well, which increases in length with increasing amount of cable slack. While the random noise is similar, leading to an overall signal-to-noise ratio (SNR) drop within the affected zone, the coherent noise is changing. For the recordings with 1, 5, and 11 m cable slack, a zone with ringing noise is visible at a depth of approximately 2890 m MD. This zone almost disappears in the 20 m cable slack data set, where the zone of decreased first-break amplitudes is approximately approaching the same depth. So ringing noise seems to be reduced within the affected zone, likely because of improved mechanical coupling of the cable to the borehole wall. But at the same time, the signal amplitude is significantly reduced within the affected zone as well.
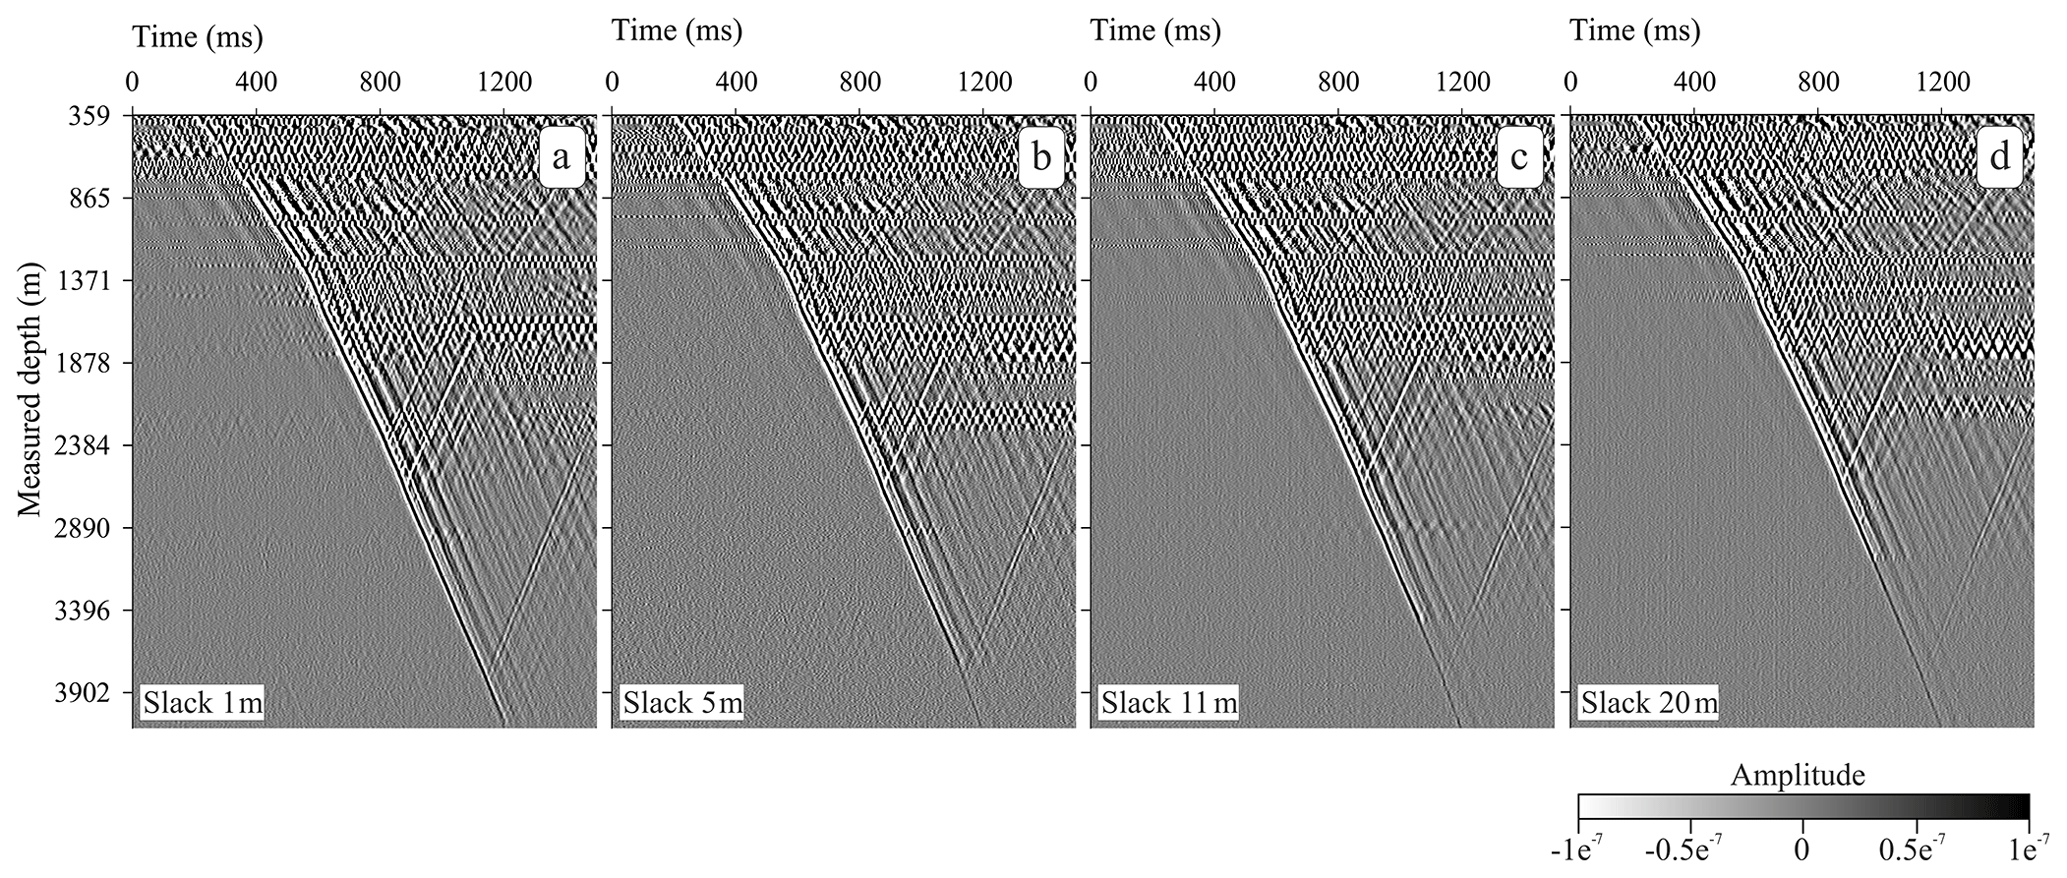
Figure 7Comparison of common-source gathers recorded with cable slack of 1 (a), 5 (b), 11 (c), and 20 m (d) for VP10 in well GrSk3. No additional amplitude normalization was applied.
Due to the higher first-break amplitudes, the best signal quality overall was assigned to the data set recorded with 1 m cable slack, i.e., under almost full cable tension, and further recording was performed like this. Notably, the best seismic record had been found to be recorded under the opposite conditions with released cable tension during the field trial reported by Frignet and Hartog (2014). Nevertheless, in their study, the optical wireline cable had been deployed in a relatively shallow well of 625 m depth, and the borehole conditions might not be representative of deep wells as in the current study for the Groß Schönebeck case. Constantinou et al. (2016) observed a behavior similar to the current study during a field trial in a well of 2580 m depth at the Rittershoffen site in France. Here, the zone of reduced signal amplitudes was found to coincide with a region where the cable was interpreted to form a spiral, gradually building up from the bottom of the well when additional cable slack had been introduced. Schilke et al. (2016) investigated the effect of cable slack on the mechanical coupling of a sensor cable deployed in a vertical well using numerical simulations.
For data quality evaluation, the SNR for each trace of the data set was calculated. The energies of signal and noise were computed as the root mean square (rms) amplitude (in arbitrary units) within time windows of −10 to +30 ms around the first arrival and 150 ms at the beginning of the trace before the first arrival, respectively. The signal-to-noise ratio was then calculated in dB using the following formula:
The calculated SNRs are displayed in Figs. 8 and 9. The data are sorted for the different acquisition days and with increasing source offset. Each vertical column represents a source location, and the calculated SNR for each trace is color coded. Altogether, the data have a good SNR, with average values of approximately 40 to 50 dB at a depth region around 1000 m for the smaller offset source locations, decreasing to approximately 4 to 10 dB at around 4200 m close to the final depth. There is an overall decrease of the SNR with increasing channel depth and source offset, which corresponds to the decay of signal amplitudes to be expected due to spherical divergence of the acoustic waves. The data for the first acquisition day have similar characteristics for both wells, with slightly larger SNRs for well GrSk4.
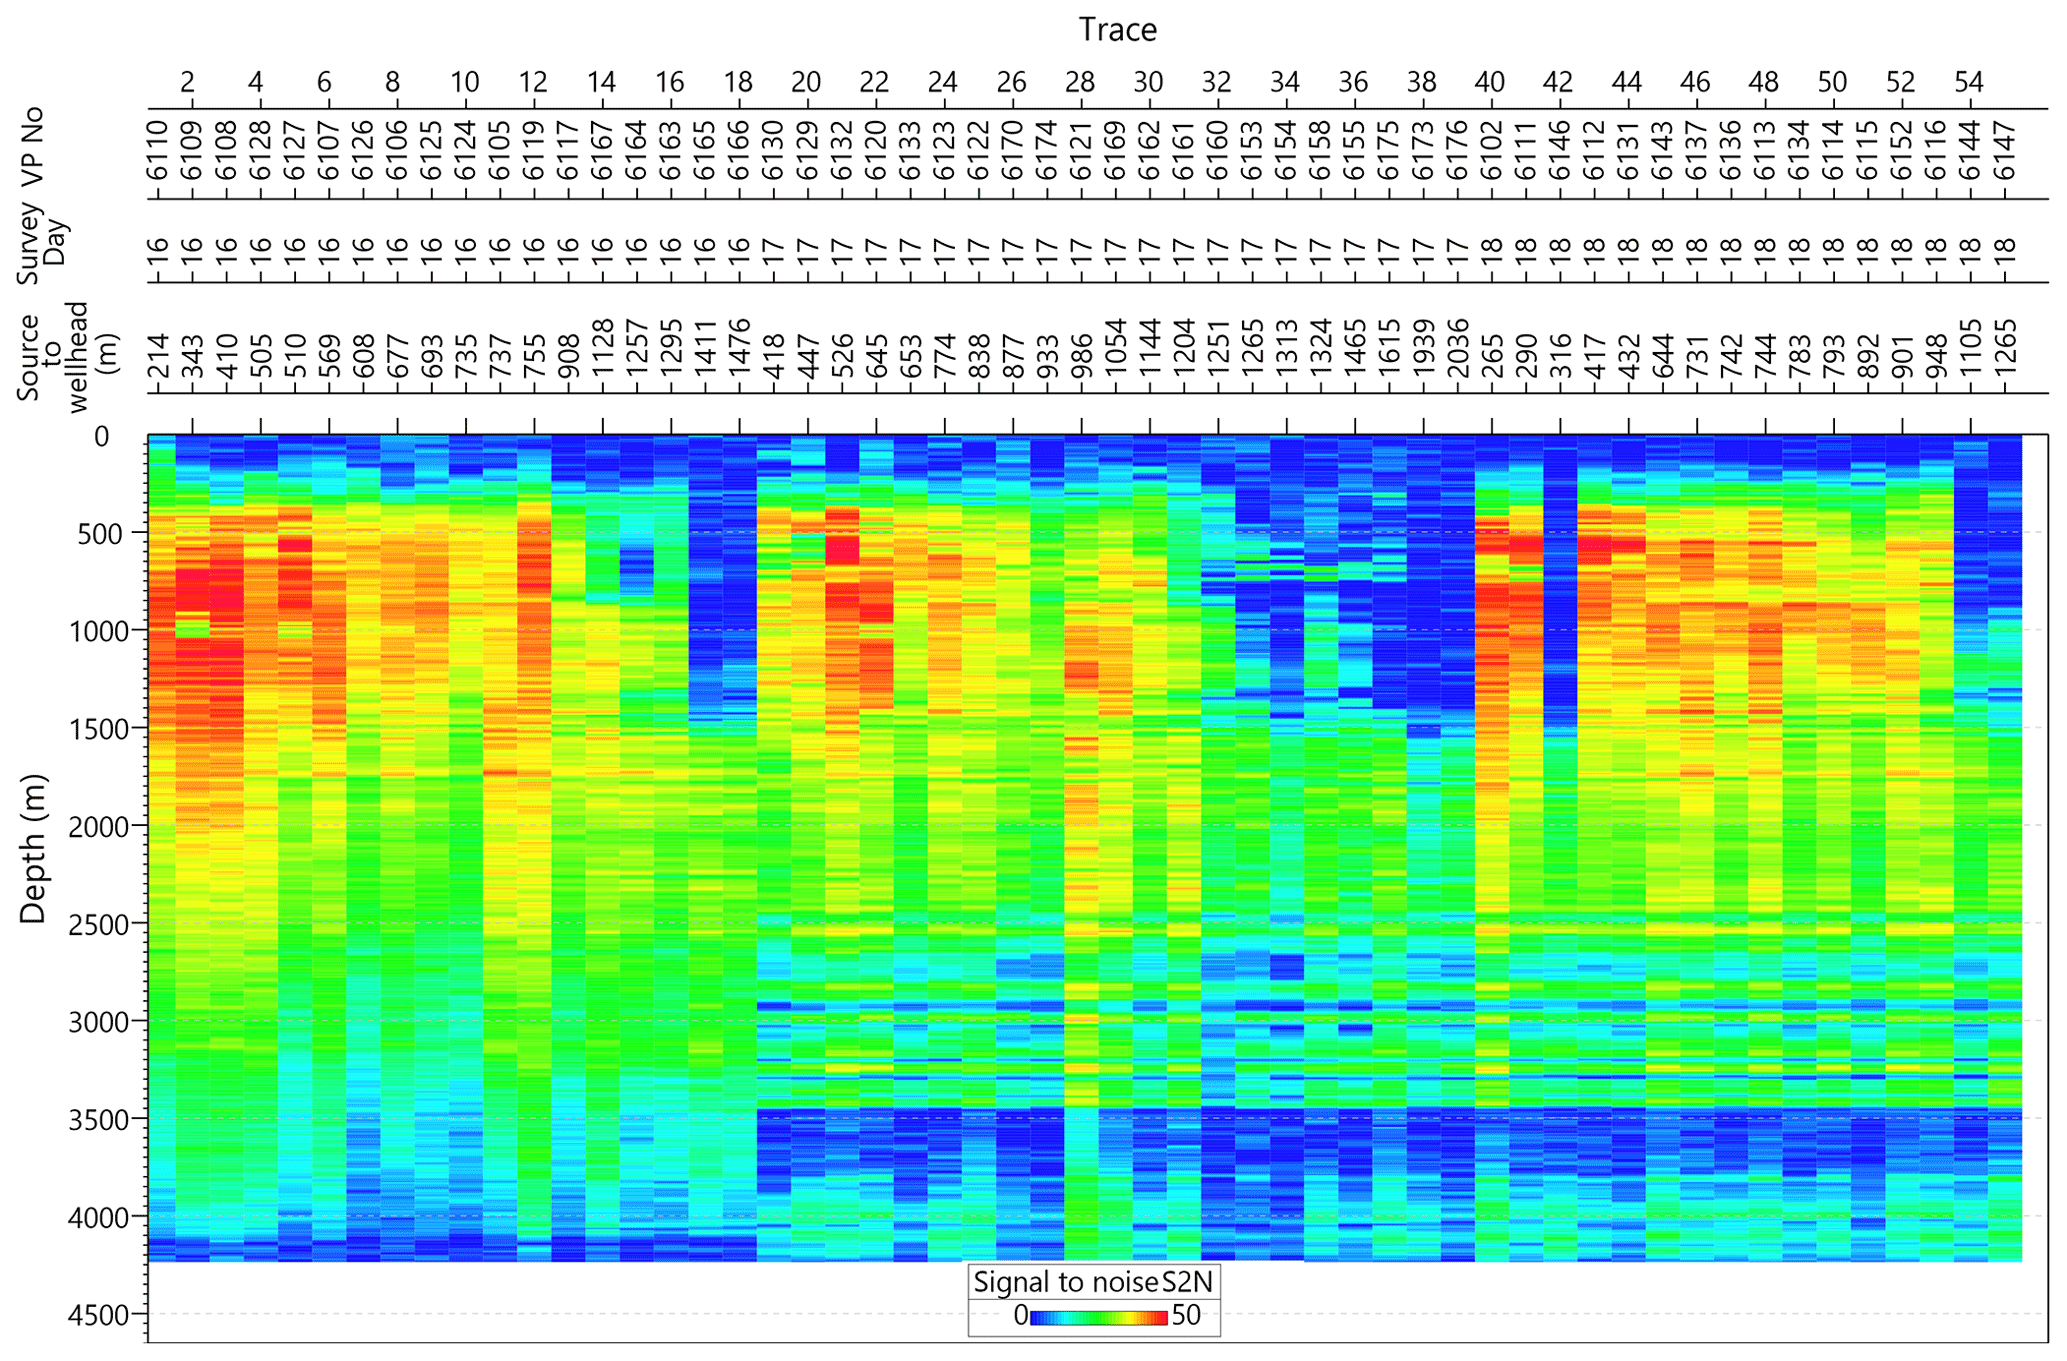
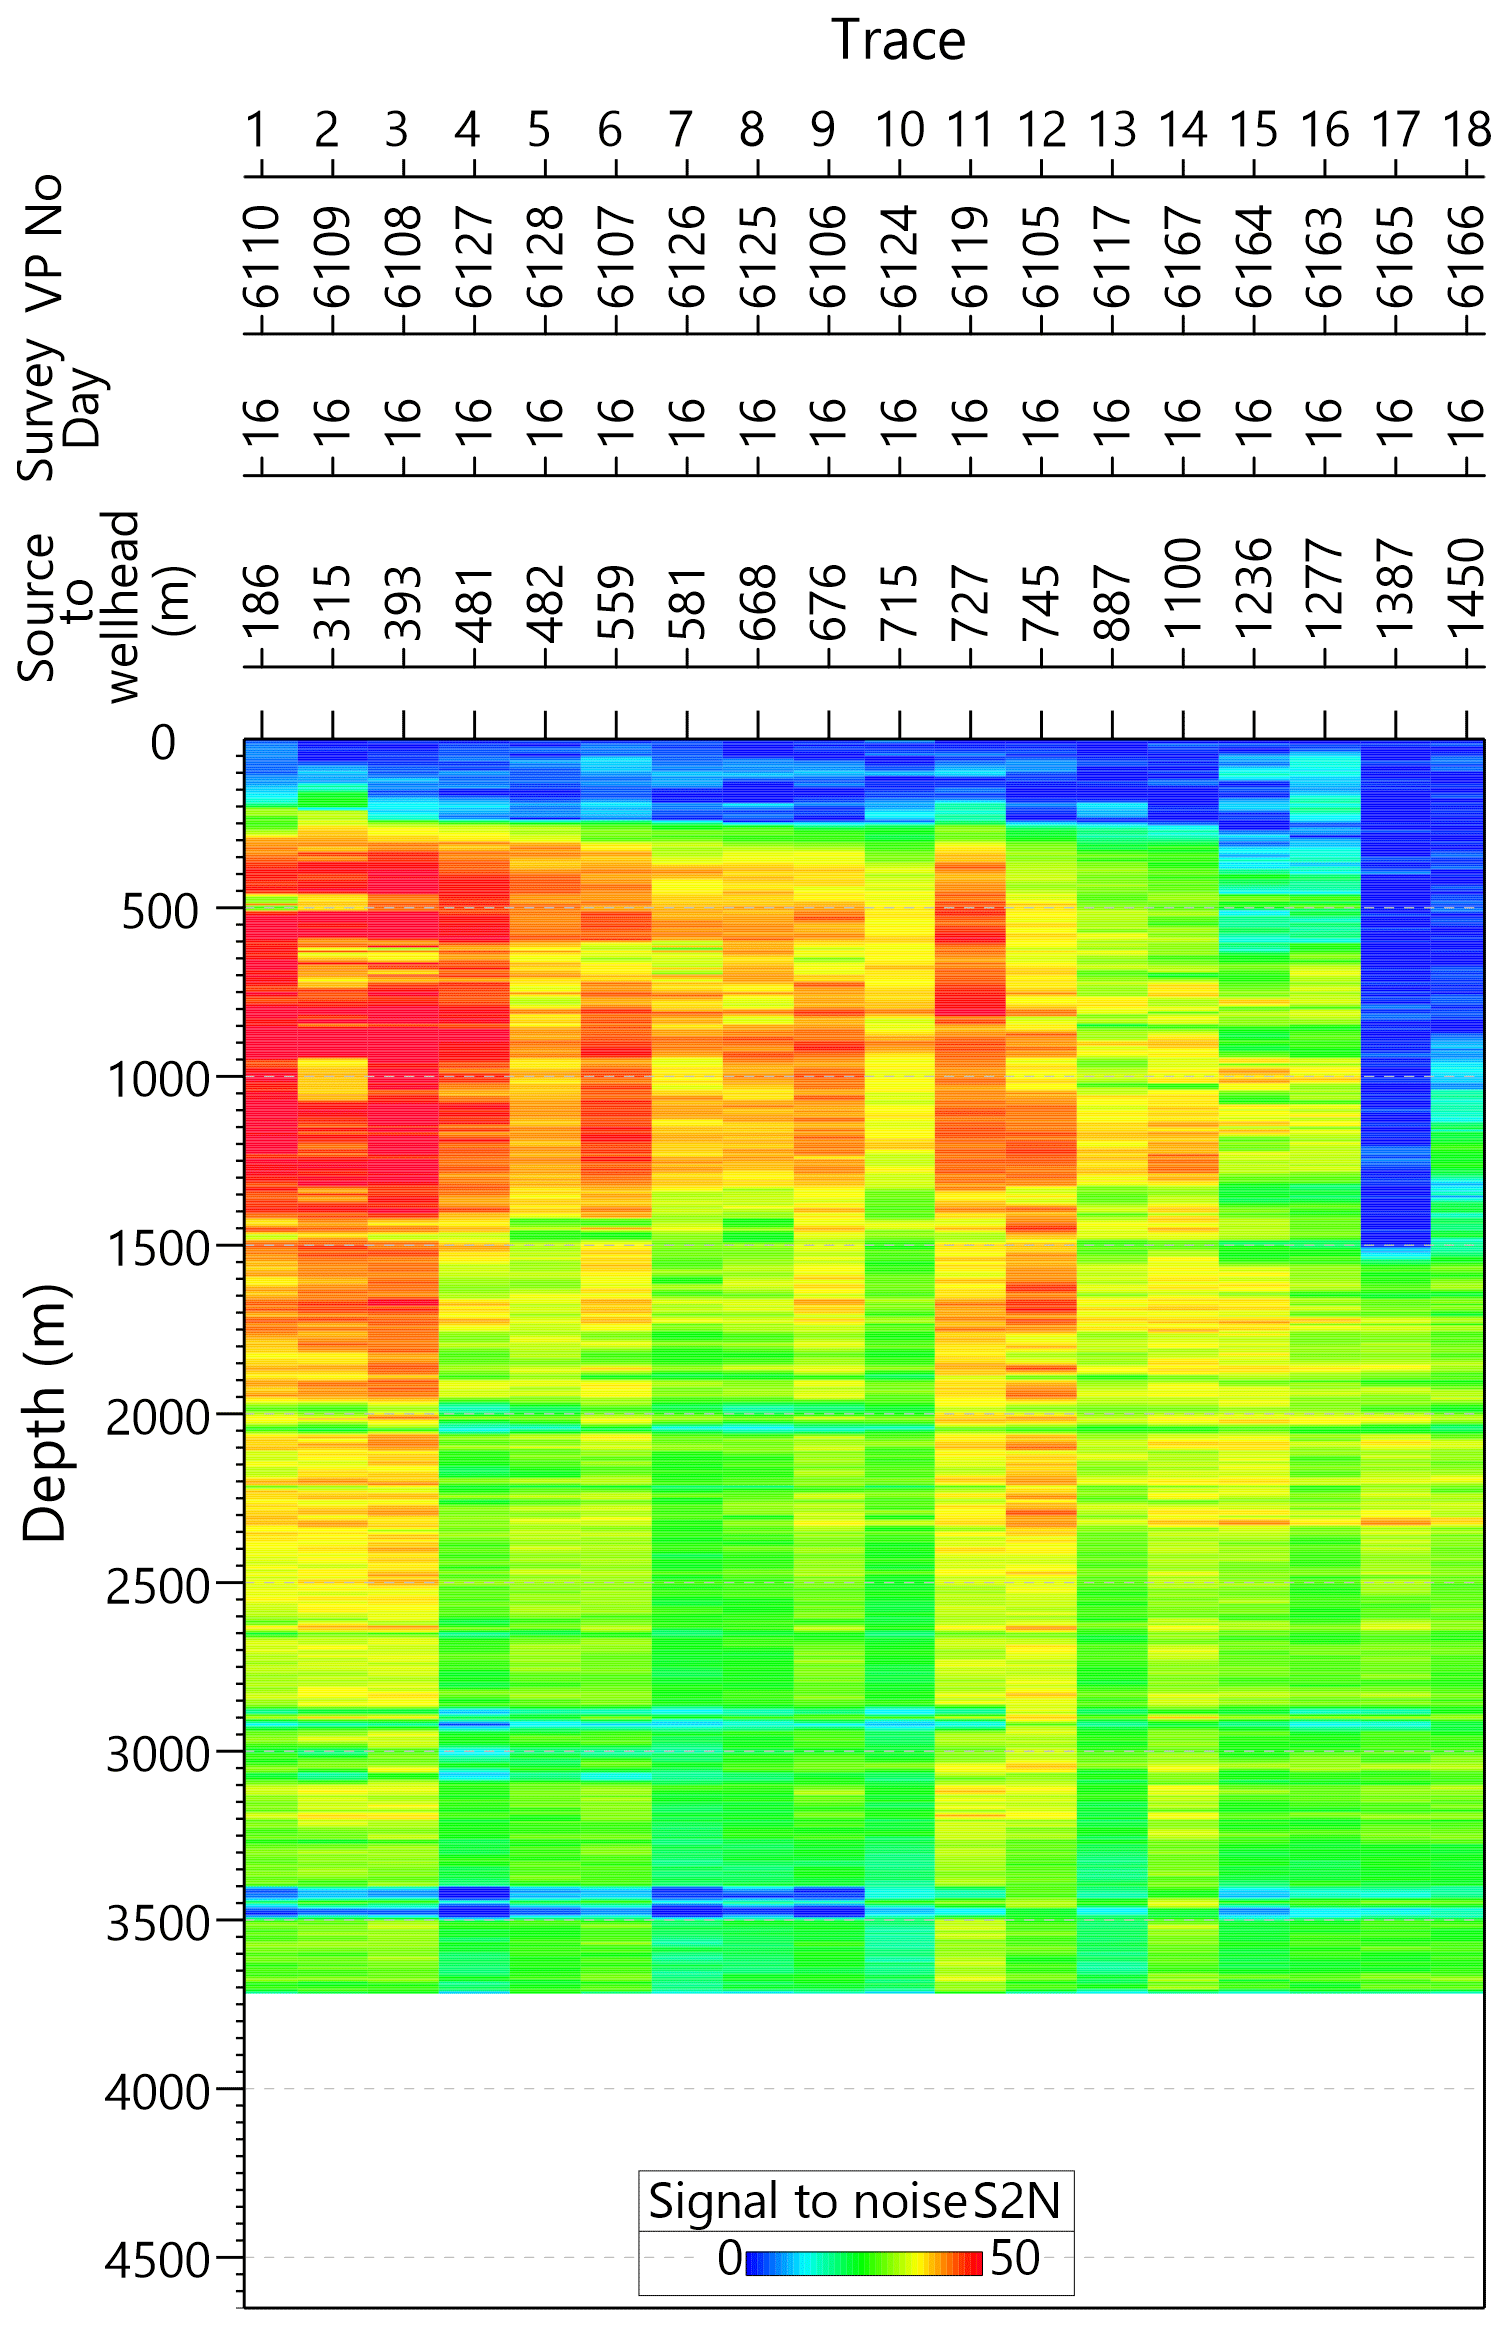
From the start of the second acquisition day, a sharp drop of the SNR is evident in the data recorded in GrSk3 at a depth of approximately 3400 m. In addition, there are further intervals with decreased SNR at depths of approximately 3100 and 2600–2800 m. Curiously, the SNR for the channels below 3400 m gradually recovers again with increasing depth, until even improved SNRs in comparison to the first acquisition day are reached in the bottom interval.
The observed signal drop at 3400 m after day 1 seems to be similar to the effect of reduced signal amplitudes observed during the slack test. Nevertheless, the configuration of the wireline cable remained unchanged between day 1 and day 2. Accidental introduction of additional cable slack during this time, e.g., by slipping of the wireline winch, or movement of the crane arm holding the cable sheave, can be excluded, as the position of the cables was carefully monitored by placing marks on them after running into the hole. Furthermore, no significant change of the wireline cable tension at surface has been registered between day 1 and day 2. Other causes must therefore be responsible for the observed effect.
Combined with the remaining coherent noise after filtering, there is a significant heterogeneity in the data, which requires to carefully select the data to be considered during evaluation and interpretation.
4.3 Time–depth relationships and interval velocities
For every source point, the travel times of the direct downgoing waves were determined by picking of the first-break times (Table 2). A velocity model has been set up based on the geometry of the existing geological model from Moeck et al. (2009) and by calibrating the model velocities with the picked travel times. Vertical travel times have then been determined by ray tracing through the calibrated model.
For the VP 10 zero-offset position, VSP interval velocities along the wells have been calculated from the travel times using the method of smooth inversion after Lizarralde and Swift (1999). Here, a damped least-squares inversion of VSP travel times is applied, which reduces the influence of arrival-time picking errors for closely spaced sampling points and seeks to result in a smooth velocity/depth profile. In our study, a 1.1 ms residual of the travel times has been allowed for. The calculated VSP interval velocities vary between about 2.8 and 5 km s−1 (Fig. 10). Variations within the VSP interval velocity profile show a good correlation to stratigraphy and the dominant lithologies. Taking into account the desired smoothing of the profiles resulting from the applied computation method, the VSP interval velocities agree well with the compressional velocities from the sonic log only recorded in the lower part of the GrSk3 well.
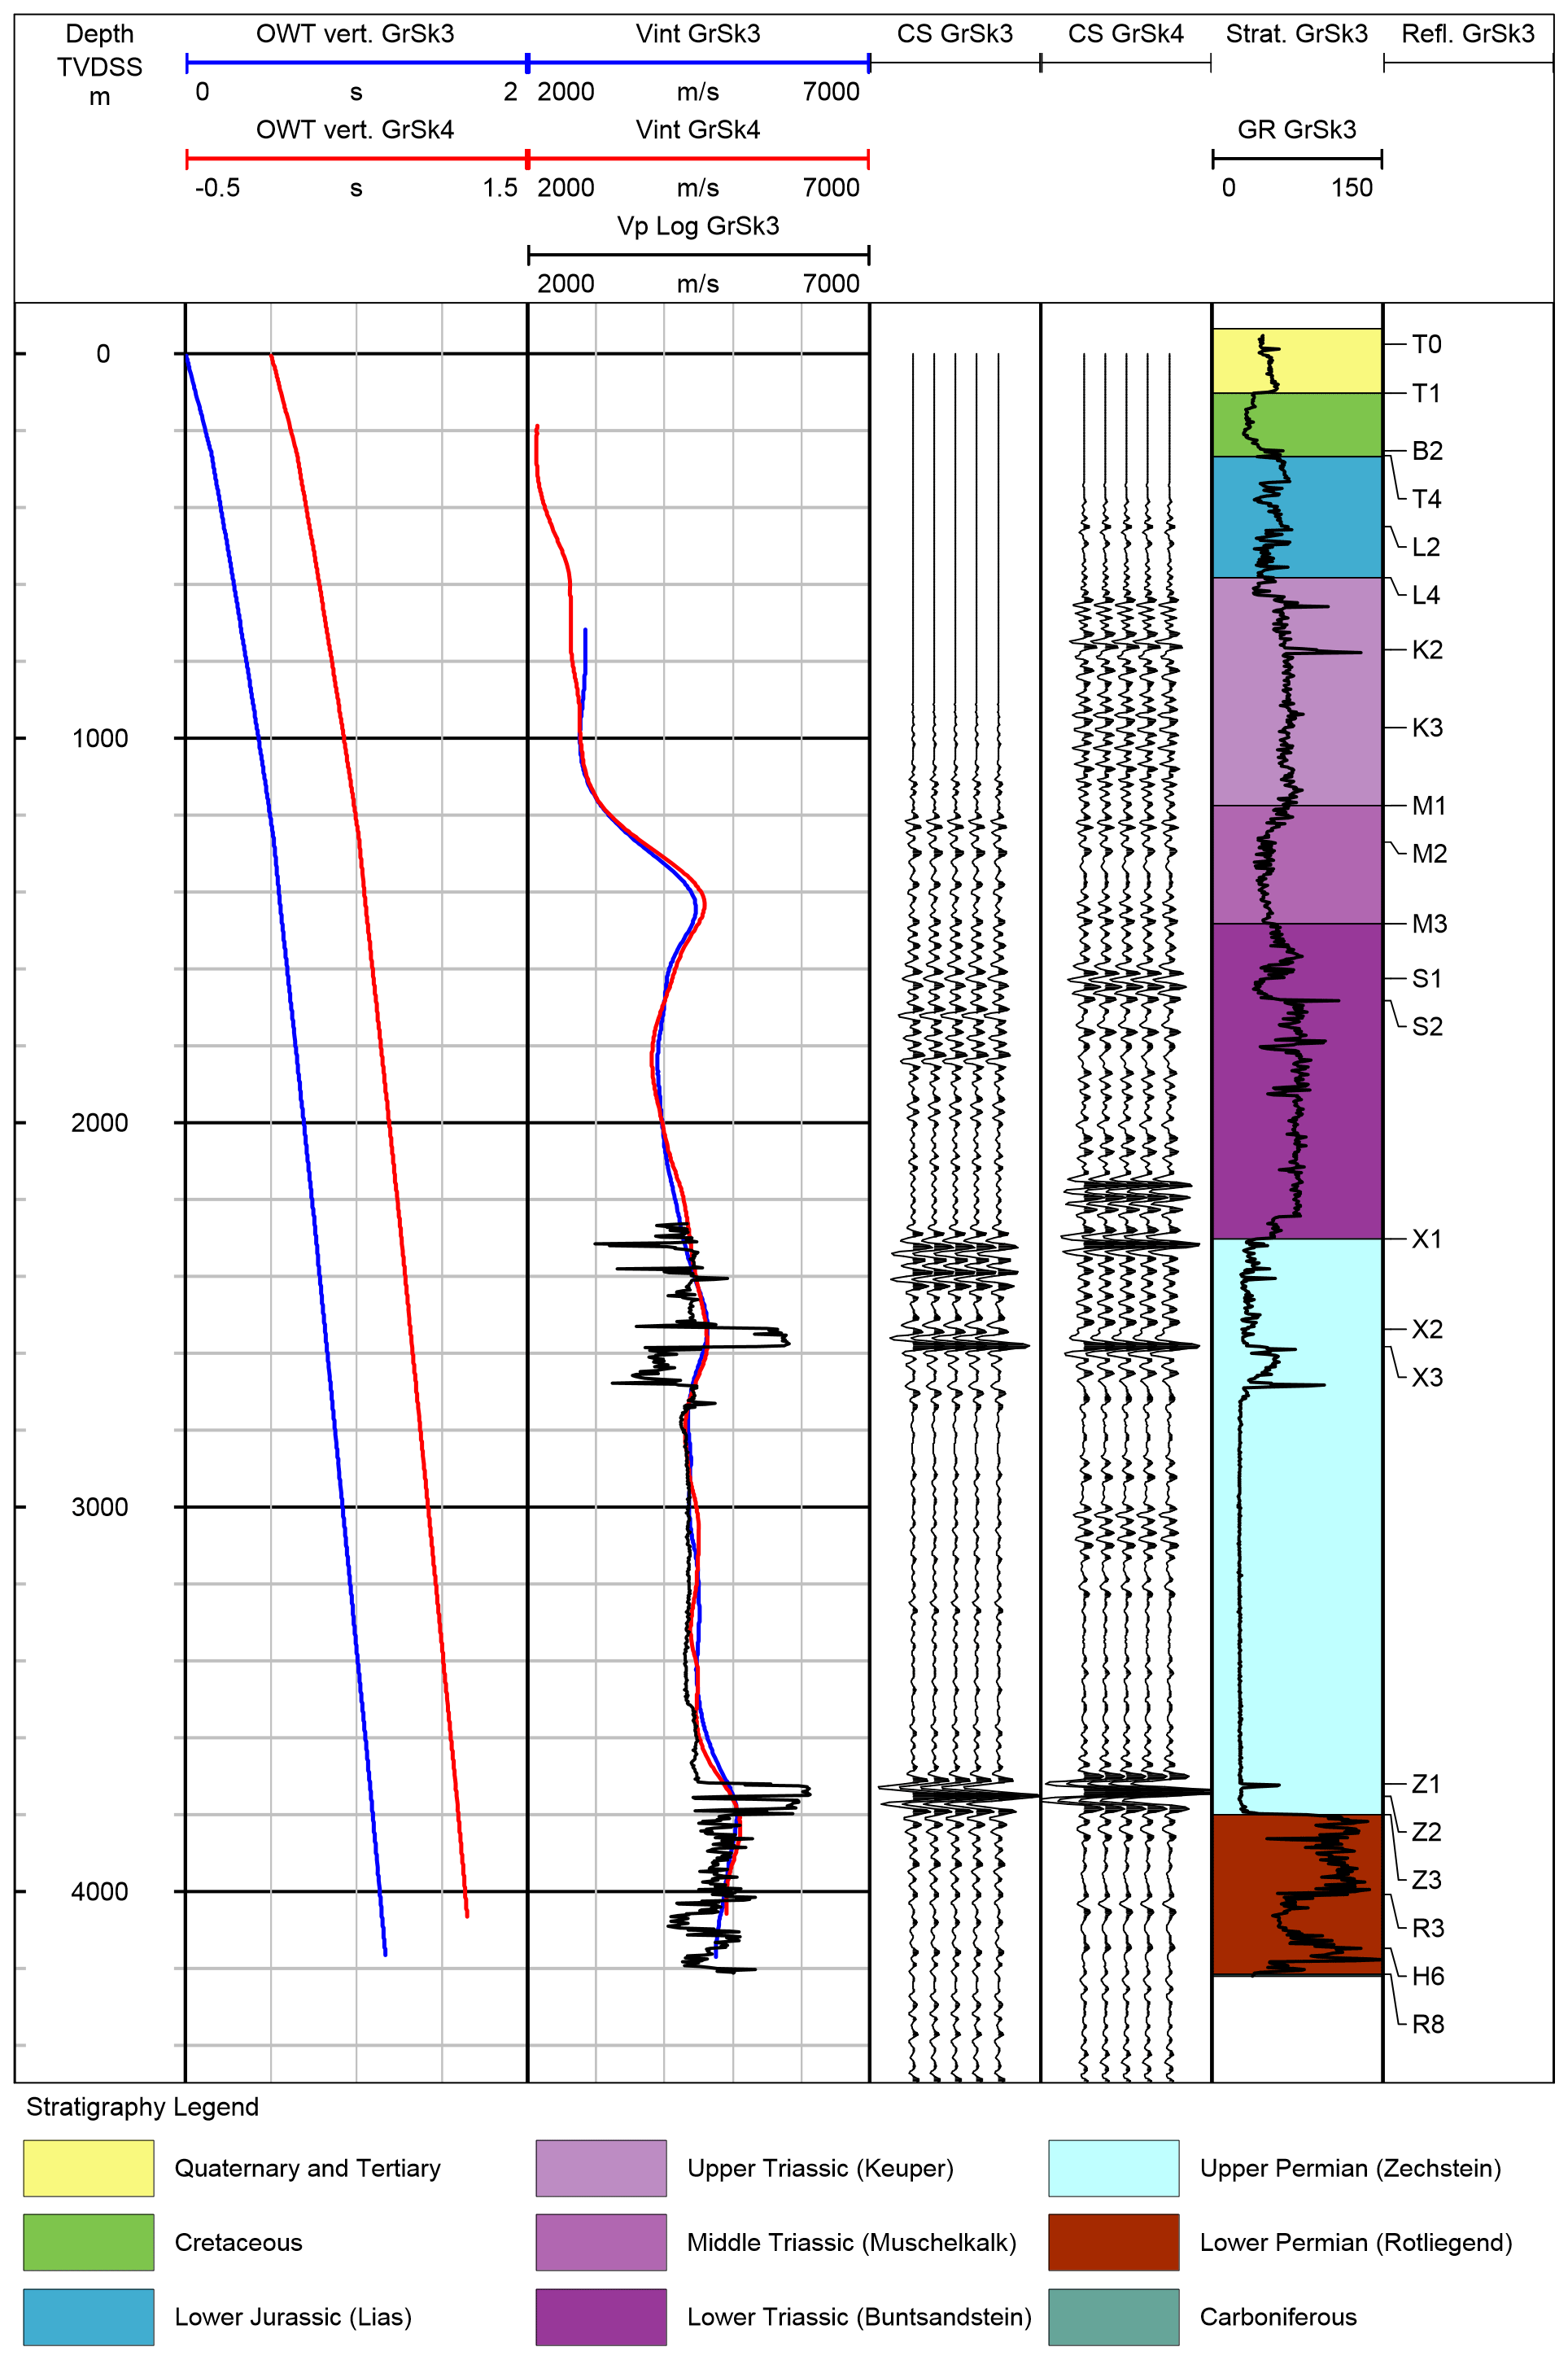
Figure 10Vertical one-way travel times (OWT vert), VSP interval velocities (Vint), acoustic log sonic velocities (Vp Log), and corridor stacks (CS), together with stratigraphic units, gamma-ray (GR) log, and seismic reflectors. TVDSS: true vertical depth below mean sea level.
4.4 Corridor stacks
Further processing steps applied to the data from the VP 10 zero-offset position included separation of up- and downgoing wavefields, deconvolution, and transformation to two-way travel time (Table 2). After this, reflections are aligned horizontally, and vertical reflection profiles were generated by stacking of the separated upgoing wavefield data over a defined time window after the first arrival (corridor stack). Because of the recording characteristics of the DAS data (see Sect. 4.1), the polarity of the upgoing wavefield data has been reversed (see Table 2) in order to match the polarity convention of conventional geophone data. The polarity convention of the data is European or European Association of Geoscientists and Engineers (EAGE) normal; i.e., a negative amplitude value (trough) corresponds to an increase in acoustic impedance downwards (Simm and White, 2002).
Corridor stacks for GrSk3 and GrSk4 are displayed in Fig. 10. The recorded reflections are accurately correlated to depth and can therefore directly be assigned to lithology and other borehole data. The most prominent reflection events within the corridor stacks occur at the base (reflectors Z1, Z2, Z3) and top (reflectors X1, X2, X3) of the Upper Permian (Zechstein) and within the Middle Triassic (Buntsandstein; reflectors S1, S2).
Larger differences between the corridor stacks are mostly related to intervals where the reflection data are disturbed by residual ringing noise. The slope of this residual noise in the common-source gathers is similar to the slope of reflected upgoing waves, leading to positive superpositions and enhancements in the corridor stack which cannot be distinguished from real reflection events.
In the eastern part of the North German Basin, the deepest seismic reflections that can be readily recognized and correlated are at or close to the base of the Zechstein. The reflecting interface Z1 is at the boundary between the Stassfurt salt and the underlying Stassfurt anhydrite (“Basalanhydrit”). This “base Zechstein” reflector is used as a marker horizon over the entire Southern Permian Basin area (Doornenbal et al., 2010).
At Groß Schönebeck, the base of the Zechstein is comprised of an 80–90 m thick sequence of anhydrite, salt, and carbonate layers, which is underlain by the sediments of the Rotliegend. This interlayered sequence of strata with high impedance contrasts gives rise to several strong and closely spaced reflection bands, which mark the base of the Zechstein in the corridor stacks (see Figs. 10 and 11).
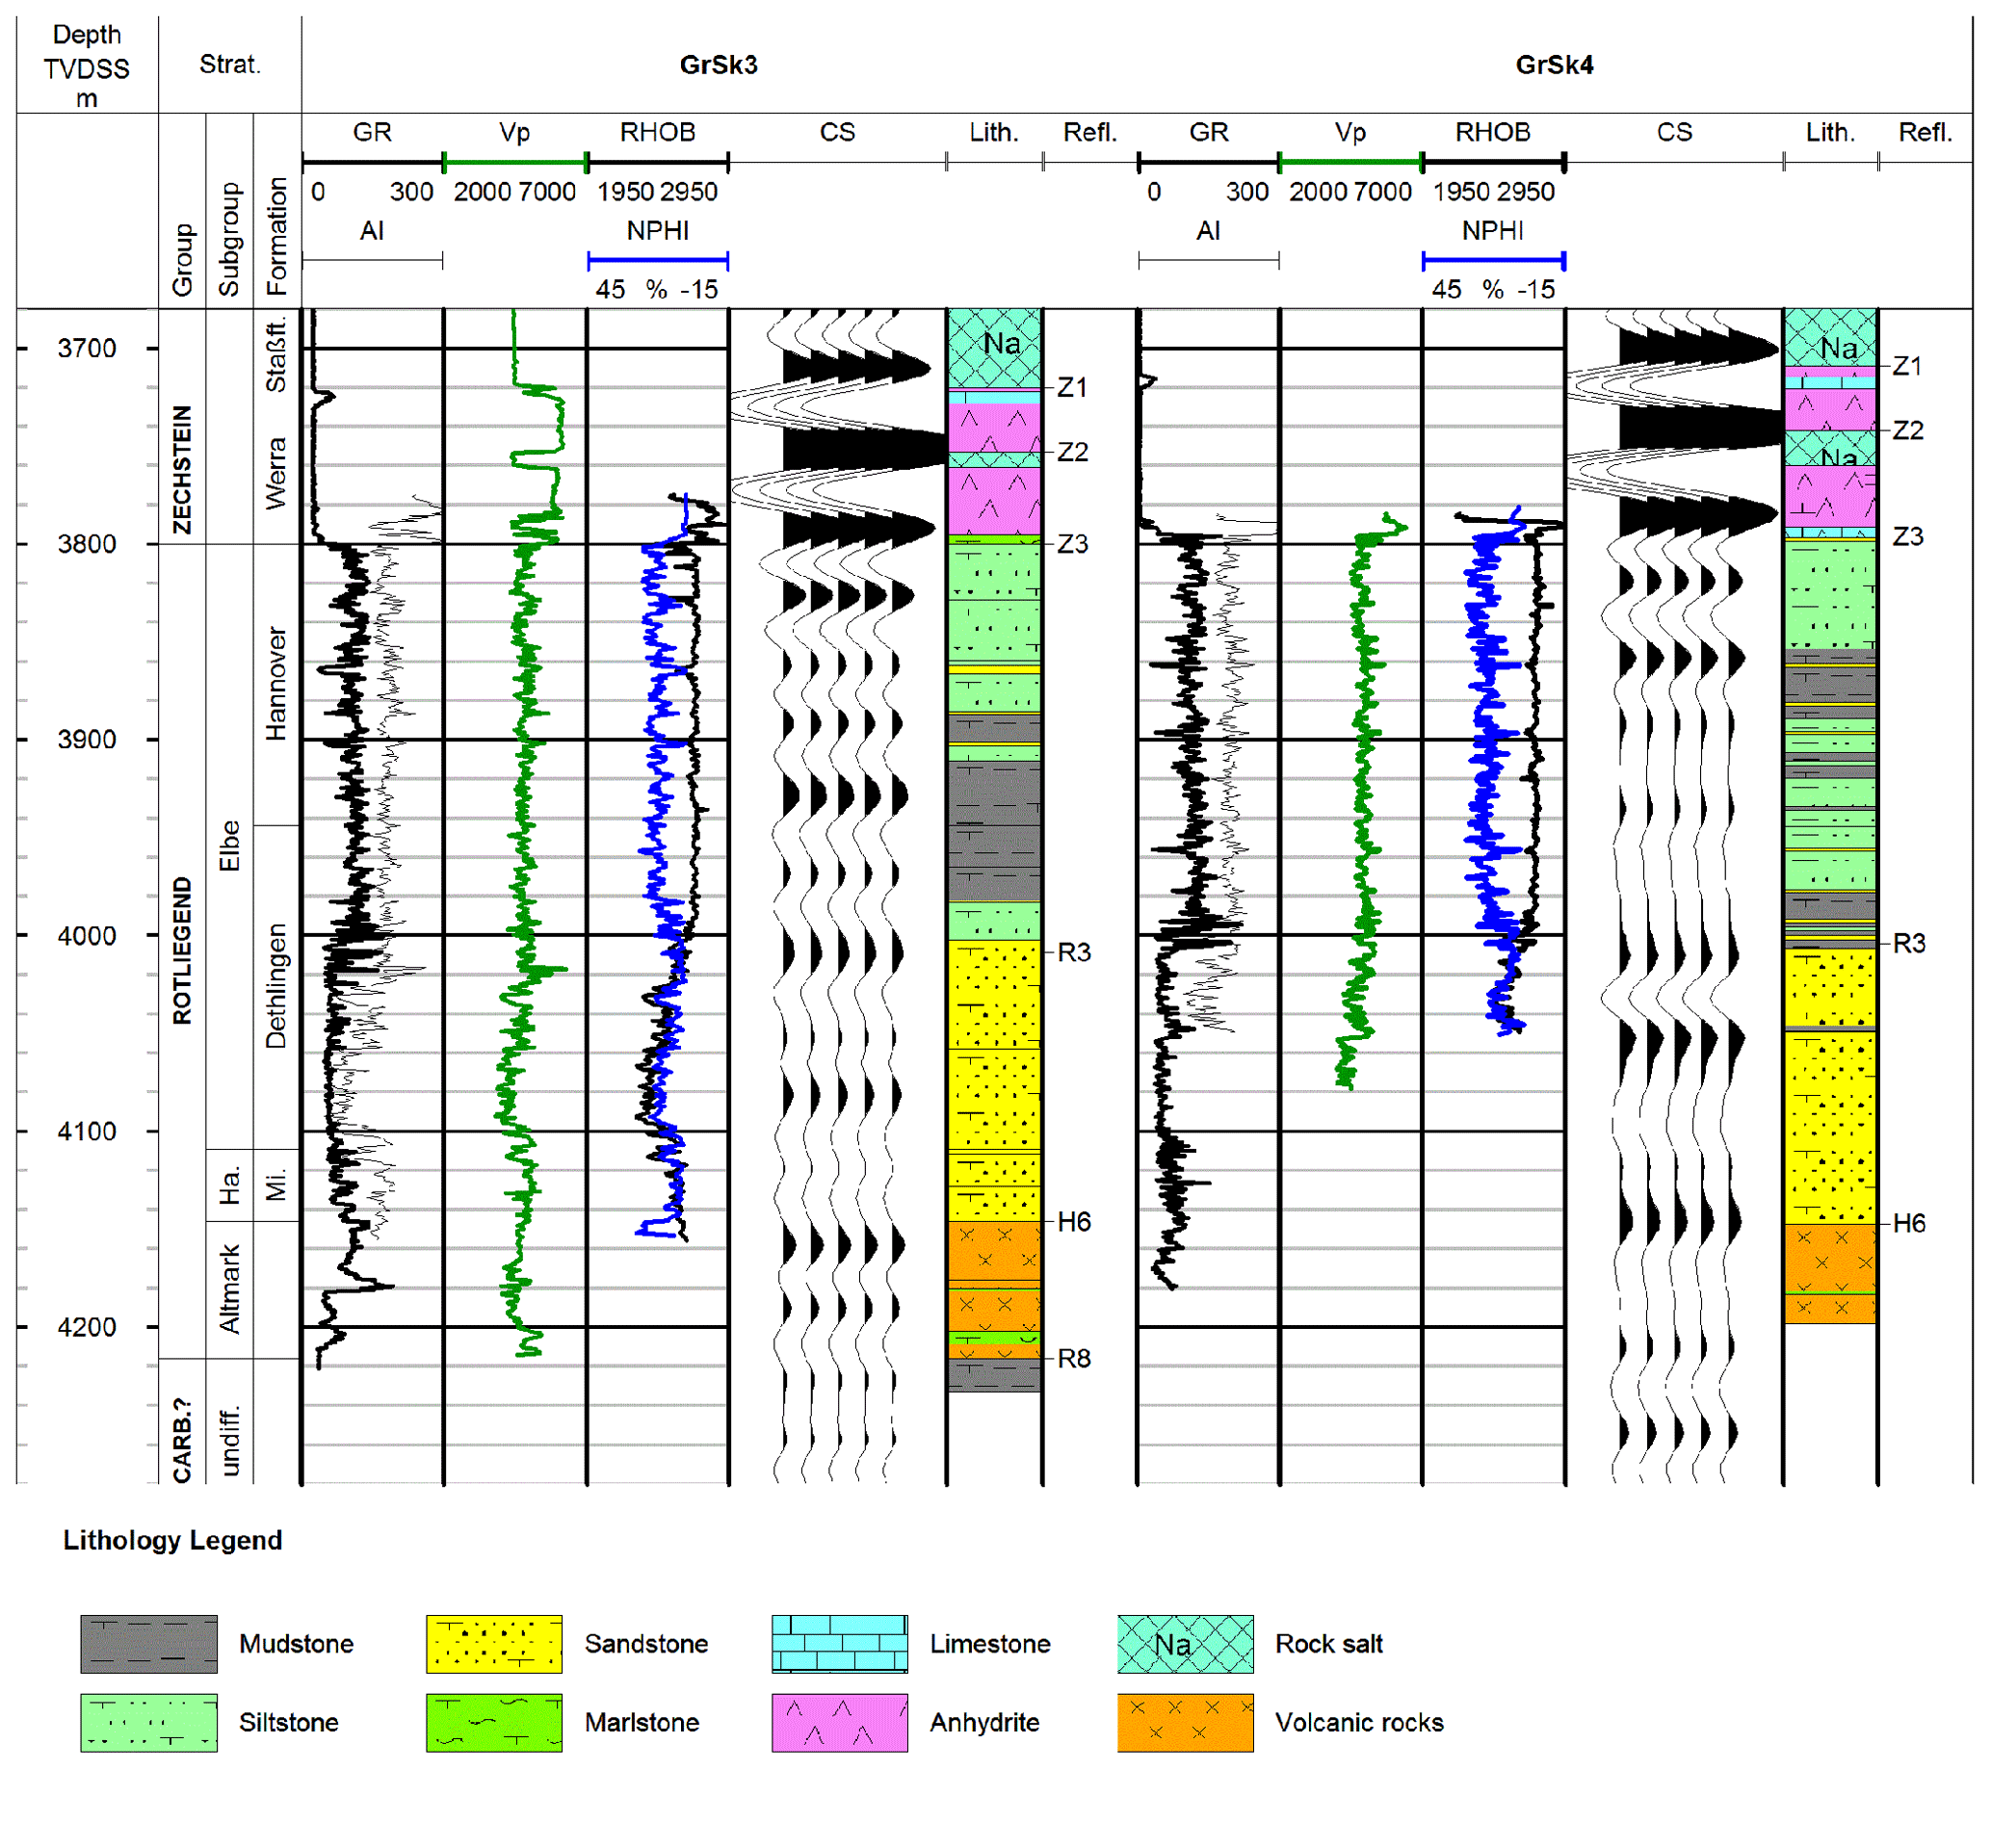
Figure 11Corridor stacks (CS) for reservoir interval of the GrSk3 and GrSk4 wells, together with well logs (GR: gamma ray, Vp: sonic velocity, RHOB: bulk density, NPHI: neutron porosity), lithology (Lith.), stratigraphy (Strat.), and seismic reflectors (Refl.). Acoustic impedance (AI) was calculated from bulk density and sonic velocity. TVDSS: true vertical depth below mean sea level.
Reflections within the underlying Rotliegend interval are evident as well, which can now be assigned to individual sections of the reservoir. The corridor stacks for the Rotliegend reservoir interval are shown in Fig. 11, together with well logs and lithology data for both wells. Some of the well logs are unfortunately not available for the lower parts of the wells, especially for GrSk4. Acoustic impedance has been calculated as the product of bulk density and sonic velocity.
The Lower Rotliegend is formed by andesitic volcanic rocks of the Altmark Formation. At the depth of the possible top of the Carboniferous (reflector R8), which was postulated at 4216 m TVDSS for the GrSk3 well, no distinct reflection event is evident in both wells. This is consistent with other regions in the North German Basin, where the base of the Rotliegend series is essentially non-reflective (Guterch et al., 2010). The transition to the overlying Upper Rotliegend sediments occurs at a depth of 4146 m TVDSS. The corridor stacks show a positive reflection around this depth (reflector H6), which nevertheless has a somewhat different character and a slight offset in depth of several meters for both wells.
The succession of the Upper Rotliegend sediments starts with the Mirow Formation, in which conglomerates are the dominant lithology. The clasts of the rock matrix are lithic fragments of the underlying volcanic rocks. The sediments of the overlying Elbe subgroup are of fluvial and eolian facies (Gast et al., 1998). Within the lower part, sandstones with good reservoir properties, i.e., high porosities and permeabilities, are occurring within the Dethlingen Formation. Within the wells, the Dethlingen sandstones, which are also known as the Elbe base sandstone, occur as a continuous interval with a thickness of about 100 m, approximately between a depth of about 4000 and 4100 m TVDSS. This interval is characterized by low gamma-ray values, bulk densities, and sonic velocities, which correspond to a low shale content and increased porosity. It is furthermore marked by a crossover of the bulk density and neutron porosity curves. Bauer et al. (2019) presented an approach to map the distribution and properties of this sandstone layer based on analysis of seismic attributes of the 3-D surface seismic volume.
Above the Dethlingen sandstones, a succession of siltstones and mudstones follows. The transition is marked by a change in the log response, with higher values for the gamma-ray, density, and sonic velocity readings, and a separation of the bulk density and neutron porosity curves. This change in density and velocity corresponds to an overall increase of acoustic impedance. The top of the sandstone interval correlates with a positive amplitude event at a depth of 4010 m TVDSS in both profiles (reflector R3). In GrSk4, another reflection (peak) occurs about 40 m below at a depth of 4051 m TVDSS, which correlates with a step-like decrease of both gamma-ray intensity and sonic velocity. This local change of the log response is not as evident in GrSk3, where only a very weak reflection event occurs at this depth.
The upper interval of the Rotliegend sediments is comprised of an interlayered sequence of siltstones and silty mudstones (Hannover Formation), with local occurrences of thin-bedded sandy layers. The succession of lithological units and interbeds differs between both wells, which is also reflected by the different character of the corridor stacks within this interval.
The different characteristics of the corridor stacks in the Upper Rotliegend are explained by lithological changes between the wells. Within the bottom part, the well trajectories have a horizontal distance of up to 475 m, and such lateral changes in lithology are typical for fluvial sediments. The observed character of the reflectors, with low reflectivity and lateral variability, is in line with other regions in the North German Basin, where deeper reflectors within the Rotliegend or Carboniferous commonly cannot be correlated over long distances, because they are of poor quality and often interrupted (Reinhardt, 1993).
Based on this survey, several important new experiences for DAS-VSP acquisition on wireline cable have been gathered. The presented results can be used in support of planning, execution, and evaluation of future surveys of this type.
Common-source gathers of the recorded data are dominated by arrivals of downgoing P waves, upgoing reflections, and tube waves. One characteristic of the recorded DAS-VSP data is that they are affected by a coherent noise, which is correlated among neighboring traces. This ringing noise is evident in common-source gathers as a conspicuous zigzag pattern confined to distinct depth intervals and is occurring in narrow frequency bands. It is influenced by the cable tension and how the cable is aligned with the inner surface of the borehole, depending on changes of the borehole trajectory.
Several tests to determine the influence of the wireline cable tension on the mechanical coupling of the cable to the borehole wall have been performed. The highest signal amplitudes and best overall data quality were found to be achieved under almost full cable tension, and the main part of the data was acquired under these conditions. The results of these tests nevertheless also indicate that a reduction of coherent ringing noise can be achieved by adding cable slack. The interrelation between cable tension and configuration inside the borehole, mechanical coupling to the borehole wall, and recorded signal amplitudes needs further investigation.
After conversion to strain rate, the waveforms and frequency content of the DAS data display a high similarity to vertical component data of a conventional borehole geophone. However, upgoing reflections are recorded with opposite polarity, which confirms the results of earlier studies. The polarity of the reflection data was reversed during later processing, in order to match the polarity of conventional geophone data.
Most of the data have a very good signal-to-noise ratio. Nevertheless, in the GrSk3 well, a sudden reduction of SNR along the deeper part of the profile after the first recording day has been observed. As a larger movement of the cable can be excluded during this time, the cause of this change of acquisition characteristics remains elusive. The ringing noise can be suppressed to a large extent by suitable filtering methods.
From the zero-offset data, accurate time–depth relationships and velocity profiles were derived. The reflectivity along the boreholes could be mapped with high resolution. The strongest reflections occur at the base and the top of the Zechstein salt complex and within the Buntsandstein. Nevertheless, in parts, the interpretation of the corridor stacks is hampered by residual ringing noise, which occurs within a short time window after the first-break arrivals and is difficult to be distinguished from true reflection events.
For the Rotliegend reservoir section, the sequence of reflection events in the corridor stacks shows a different character for both wells overall, which is explained by lateral changes in lithology. But it also displays local similarities: the top of the Dethlingen sandstone interval is marked by a positive reflection event in both wells. This information can be used to identify a related reflector and track the distribution of this reservoir layer in a 3-D seismic volume. Processing and interpretation of both 3-D VSP and 3-D surface seismic data are currently ongoing. The top of the volcanic rocks has a somewhat different response in both wells, and no stronger event is obvious at the postulated top of the Carboniferous. The thickness of the volcanic rocks therefore cannot be inferred from individual reflection events in the seismic data alone.
The DAS method has enabled measurements at elevated temperatures up to 150 ∘C and has led to significant time and cost savings compared to deployment of a conventional borehole geophone string. Such savings depend on the specific targets and conditions of an individual survey, as well as on the available technologies and performance of the equipment used. But for a VSP survey similar to this study, we would roughly estimate the operational effort to be reduced by around a factor of 5 to 10.
The seismic survey data presented in this study are available under https://doi.org/10.5880/GFZ.4.8.2021.001 (Henninges et al., 2021).
JH and CMK conceptualized the project. JH and MS planned and supervised fieldwork and data acquisition. EM, MS, CMK, and JH performed the seismic data processing and analysis. JH interpreted the data under discussion with all co-authors and with input from BN on geological well data. JH and EM prepared the manuscript with contributions from all co-authors.
The authors declare that they have no conflict of interest. Charlotte M. Krawczyk is chief executive editor of SE.
This article is part of the special issue “Fibre-optic sensing in Earth sciences”. It is not associated with a conference.
We gratefully acknowledge the contributions of Ernst Huenges, who led the efforts at the geothermal research platform Groß Schönebeck, and Klaus Bauer for providing major support during funding acquisition and project administration. We are thankful for the smooth cooperation with Schlumberger and DMT GmbH & Co KG during data acquisition, as well as GGL (Geophysik und Geotechnik Leipzig) GmbH during survey planning, and Schlumberger and VSProwess Ltd. during data processing. Jörg Schrötter, Christian Cunow, and Mathias Poser of GFZ supported fieldwork and acquisition of fiber-optic data. The paper has greatly benefitted from the constructive comments of Ariel Lellouch and an anonymous reviewer, which helped us to work out several important aspects of the paper more clearly.
This research has been supported by the German Federal Ministry for Economic Affairs and Energy (grant no. 0324065) and the European Commission, Horizon 2020 Framework Programme (grant nos. DESTRESS (691728) and EPOS IP (676564)).
The article processing charges for this open-access
publication were covered by a Research
Centre of the Helmholtz Association.
This paper was edited by Zack Spica and reviewed by Ariel Lellouch and one anonymous referee.
Barberan, C., Allanic, C., Avila, D., Hy-Billiot, J., Hartog, A., Frignet, B., and Lees, G.: Multi-offset seismic acquisition using optical fiber behind tubing, in: Conference Proceedings, 74th EAGE Conference and Exhibition, Copenhagen, Denmark, 4–7 June, Y003, 2012.
Bauer, K., Moeck, I., Norden, B., Schulze, A., Weber, M., and Wirth, H.: Tomographic P wave velocity and vertical velocity gradient structure across the geothermal site Groß Schönebeck (NE German Basin): Relationship to lithology, salt tectonics, and thermal regime, J. Geophys. Res., 115, B08312, https://doi.org/10.1029/2009jb006895, 2010.
Bauer, K., Norden, B., Ivanova, A., Stiller, M., and Krawczyk, C. M.: Wavelet transform-based seismic facies classification and modelling: application to a geothermal target horizon in the NE German Basin, Geophys. Prospect., 68, 466–482, https://doi.org/10.1111/1365-2478.12853, 2019.
Blöcher, G., Cacace, M., Reinsch, T., and Watanabe, N.: Evaluation of three exploitation concepts for a deep geothermal system in the North German Basin, Comput. Geosci., 82, 120–129, https://doi.org/10.1016/j.cageo.2015.06.005, 2015.
Cai, Z., Wang, Y., Liu, C., Zhang, Q., and Xu, X.: Cable noise analysis and suppression in DAS-VSP data, AAPG/SEG International Conference and Exhibition, Barcelona, Spain, 3–6 April 2016, 170, 2016.
Chen, J., Ning, J., Chen, W., Wang, X., Wang, W., and Zhang, G.: Distributed acoustic sensing coupling noise removal based on sparse optimization, Interpretation, 7, 373–382, https://doi.org/10.1190/int-2018-0080.1, 2019.
Constantinou, A., Farahani, A., Cuny, T., and Hartog, A.: Improving DAS acquisition by real-time monitoring of wireline cable coupling, in: SEG Technical Program Expanded Abstracts, 5603–5607, 2016.
Correa, J., Egorov, A., Tertyshnikov, K., Bona, A., Pevzner, R., Dean, T., Freifeld, B., and Marshall, S.: Analysis of signal to noise and directivity characteristics of das VSP at near and far offsets-A CO2CRC Otway Project data example, Leading Edge, 36, 991–997, https://doi.org/10.1190/tle36120994a1.1, 2017.
Daley, T. M., Freifeld, B. M., Ajo-Franklin, J., Dou, S., Pevzner, R., Shulakova, V., Kashikar, S., Miller, D. E., Goetz, J., Henninges, J., and Lueth, S.: Field testing of fiber-optic distributed acoustic sensing (DAS) for subsurface seismic monitoring, Leading Edge, 32, 699–706, https://doi.org/10.1190/tle32060699.1, 2013.
Daley, T. M., Miller, D. E., Dodds, K., Cook, P., and Freifeld, B. M.: Field testing of modular borehole monitoring with simultaneous distributed acoustic sensing and geophone vertical seismic profiles at Citronelle, Alabama, Geophys. Prospect., 64, 1318–1334, https://doi.org/10.1111/1365-2478.12324, 2016.
Dean, T., Cuny, T., and Hartog, A. H.: The effect of gauge length on axially incident P-waves measured using fibre optic distributed vibration sensing, Geophys. Prospect., 65, 184–193, https://doi.org/10.1111/1365-2478.12419, 2017.
Didraga, C.: DAS VSP Recorded Simultaneously in Cemented and Tubing Installed Fiber Optic Cables, in: Conference Proceedings, 77rd EAGE Conference and Exhibition, Madrid, Spain, 1–4 June, Tu N118 14, 2015.
Doornenbal, J. C., Abbink, O. A., Duin, E. J. T., Dusar, M., Hoth, P., Jasionowski, M., Lott, G. K., Mathiesen, A., Papiernik, B., Peryt, T. M., Veldkamp, J. G., and Wirth, H.: Introduction, stratigraphic framework and mapping, in: Petroleum Geological Atlas of the Southern Permian Basin Area, edited by: Doornenbal, J. C. and Stevenson, A. G., EAGE Publications b.v., Houten, The Netherlands, 1–9, 2010.
Egorov, A., Correa, J., Bóna, A., Pevzner, R., Tertyshnikov, K., Glubokovskikh, S., Puzyrev, V., and Gurevich, B.: Elastic full-waveform inversion of vertical seismic profile data acquired with distributed acoustic sensors, Geophysics, 83, 273–281, https://doi.org/10.1190/GEO2017-0718.1, 2018.
Elboth, T., Fugro Geoteam, Qaisrani, H. H., and Hertweck, T.: De-noising seismic data in the time-frequency domain, in: SEG Technical Program Expanded Abstracts, 2622–2626, 2008.
Frignet, B. G. and Hartog, A. H.: Optical vertical seismic profile on wireline cable, SPWLA 55th Annual Logging Symposium, Abu Dhabi, UAE, 18–22 May 2014, abstract no. SPWLA-2014-FFFF, 2014.
Gast, R., Pasternak, M., Piske, J., and Rasch, H.-J.: Rotliegend in Northeastern Germany: Regional Overview, Stratigraphy, Facies and Diagenesis, in: Results of hydrocarbon exploration in in Permian Rocks (Zechstein and Rotliegend) of the State of Brandenburg, Germany and in the Thuringian Basin between 1991 and 1996, edited by: Karnin, W.-D., Merkel, D., Piske, J., and Schretzenmayr, S., Geologisches Jahrbuch, Schweizerbart, Stuttgart, Germany, 59–79, 1998.
Götz, J., Lüth, S., Henninges, J., and Reinsch, T.: Vertical seismic profiling using a daisy-chained deployment of fibre-optic cables in four wells simultaneously – Case study at the Ketzin carbon dioxide storage site, Geophys. Prospect., 66, 1201–1214, https://doi.org/10.1111/1365-2478.12638, 2018.
Griffiths, L. J., Smolka, F. R., and Trembly, L. D.: Adaptive deconvolution, a new technique for processing time-varying seismic data, Geophysics, 42, 742–759, https://doi.org/10.1190/1.1440743, 1977.
Guterch, A., Wybraniec, S., Grad, M., Chadwick, R. A., Krawczyk, C. M., Ziegler, P. A., Thybo, H., and De Vos, W.: Crustal structure and structural framework, in: Petroleum Geological Atlas of the Southern Permian Basin Area, edited by: Doornenbal, J. C. and Stevenson, A. G., EAGE Publications b.v., Houten, The Netherlands, 11–23, 2010.
Hartog, A., Frignet, B., Mackie, D., and Clark, M.: Vertical seismic optical profiling on wireline logging cable, Geophys. Prospect., 62, 693–701, https://doi.org/10.1111/1365-2478.12141, 2014.
Henninges, J., Baumann, G., Brandt, W., Cunow, C., Poser, M., Schrötter, J., and Huenges, E.: A novel hybrid wireline logging system for downhole monitoring of fluid injection and production in deep reservoirs, 73rd EAGE Conference and Exhibition, Vienna, Austria, 23–26 May 2011, C043, 2011.
Henninges, J., Martuganova, E., Stiller, M., Norden, B., and Krawczyk, C. M.: DAS-VSP data from the Feb. 2017 survey at the Groß Schönebeck site, Germany, GFZ Data Services, https://doi.org/10.5880/GFZ.4.8.2021.001, in review, 2021.
Huenges, E., Trautwein, U., Legarth, B., and Zimmermann, G.: Fluid Pressure Variation in a Sedimentary Geothermal Reservoir in the North German Basin: Case Study Groß Schönebeck, in: Rock Damage and Fluid Transport, Part II, edited by: Zang, A., Stephansson, O., and Dresen, G., Pageoph Topical Volumes, Birkhäuser Basel, Switzerland, 2141–2152, 2006.
Karrenbach, M., Kahn, D., Cole, S., Ridge, A., Boone, K., Rich, J., Silver, K., and Langton, D.: Hydraulic-fracturing-induced strain and microseismic using in situ distributed fiber-optic sensing, Leading Edge, 36, 837–844, https://doi.org/10.1190/tle36100837.1, 2017.
Krawczyk, C. M., Stiller, M., Bauer, K., Norden, B., Henninges, J., and Ivanova, A.: 3-D seismic exploration across the deep geothermal research platform Groß Schönebeck north of Berlin/Germany, Geothermal Energy, 7, 18, https://doi.org/10.1186/s40517-019-0131-x, 2019.
Lellouch, A., Lindsey, N. J., Ellsworth, W. L., and Biondi, B. L.: Comparison between Distributed Acoustic Sensing and Geophones: Downhole Microseismic Monitoring of the FORGE Geothermal Experiment, Seismol. Res. Lett., 91, 3256–3268, https://doi.org/10.1785/0220200149, 2020.
Lizarralde, D. and Swift, S.: Smooth inversion of VSP traveltime data, Geophysics, 64, 659–661, https://doi.org/10.1190/1.1444574, 1999.
Martuganova, E., Stiller, M., Bauer, K., Henninges, J., and Krawczyk, C. M.: Cable reverberations during wireline distributed acoustic sensing measurements: their nature and methods for elimination, Geophys. Prospect., in review, 2021.
Mateeva, A., Lopez, J., Potters, H., Mestayer, J., Cox, B., Kiyashchenko, D., Wills, P., Grandi, S., Hornman, K., Kuvshinov, B., Berlang, W., Yang, Z., and Detomo, R.: Distributed acoustic sensing for reservoir monitoring with vertical seismic profiling, Geophys. Prospect., 62, 679–692, https://doi.org/10.1111/1365-2478.12116, 2014.
Mestayer, J., Cox, B., Wills, P., Kiyashchenko, D., Lopez, J., Costello, M., Bourne, S., Ugueto, G., Lupton, R., Solano, G., Hill, D., and Lewis, A.: Field trials of distributed acoustic sensing for geophysical monitoring, in: SEG Technical Program Expanded Abstracts 2011, Society of Exploration Geophysicists, 4253–4257, 2011.
Miller, D., Parker, T., Kashikar, S., Todorov, M., and Bostick, T.: Vertical seismic profiling using a fibre-optic cable as a distributed acoustic sensor, in: Conference Proceedings, 74th EAGE Conference and Exhibition, Copenhagen, Denmark, 4–7 June, Y004, 2012.
Moeck, I., Schandelmeier, H., and Holl, H.-G.: The stress regime in a Rotliegend reservoir of the northeast German Basin, Int. J. Earth Sci., 98, 1643–1654, 2009.
Molteni, D., Williams, M. J., and Wilson, C.: Detecting microseismicity using distributed vibration, First Break, 35, 51–55, 2017.
Parker, T., Shatalin, S., and Farhadiroushan, M.: Distributed Acoustic Sensing – a new tool for seismic applications, First Break, 32, 61–69, https://doi.org/10.3997/1365-2397.2013034, 2014.
Reinhardt, H.-G.: Structure of Northeast Germany: Regional Depth and Thickness Maps of Permian to Tertiary Intervals Compiled from Seismic Reflection Data, in: Generation, Accumulation and Production of Europe's Hydrocarbons III, Special Publication of the European Association of Petroleum Geoscientists No. 3, edited by: Spencer, A. M., Springer, Berlin and Heidelberg, Germany, 155–165, 1993.
Sallas, J. J.: Seismic vibrator control and the downgoing P-wave, Geophysics, 49, 732–740, 1984.
Schilke, S., Donno, D., Chauris, H., Hartog, A., Farahani, A., and Pico, Y.: Numerical evaluation of sensor coupling of distributed acoustic sensing systems in vertical seismic profiling, SEG Technical Program Expanded Abstracts, 677–681, 2016.
Simm, R. and White, R.: Phase, polarity and the interpreter's wavelet, First Break, 20, 277–281, https://doi.org/10.1046/j.1365-2397.2002.00277.x, 2002.
Willis, M. E., Wu, X., Palacios, W., and Ellmauthaler, A.: Understanding cable coupling artifacts in wireline-deployed DAS VSP data, SEG Technical Program Expanded Abstracts, 5310–5314, 2019.
Yu, G., Cai, Z., Chen, Y., Wang, X., Zhang, Q., Li, Y., Wang, Y., Liu, C., Zhao, B., and Greer, J.: Walkaway VSP using multimode optical fibers in a hybrid wireline, Leading Edge, 35, 615–619, https://doi.org/10.1190/tle35070615.1, 2016.
Zimmermann, G., Moeck, I., and Blöcher, G.: Cyclic waterfrac stimulation to develop an Enhanced Geothermal System (EGS) – Conceptual design and experimental results, Geothermics, 39, 59–69, 2010.
Here and in the following, the term “shot” is used to refer to a single vibroseis record.