the Creative Commons Attribution 4.0 License.
the Creative Commons Attribution 4.0 License.
 | 20 Jan 2021
Effects of basal drag on subduction dynamics from 2D numerical models
Saskia Goes
Benjamin Maunder
Fanny Garel
Rhodri Davies
Subducting slabs are an important driver of plate motions, yet the relative importance of different forces in governing subduction motions and styles remains incompletely understood. Basal drag has been proposed to be a minor contributor to subduction forcing because of the lack of correlation between plate size and velocity in observed and reconstructed plate motions. Furthermore, in single subduction system models, low basal drag leads to subduction behaviour most consistent with the observation that trench migration velocities are generally low compared to convergence velocities. By contrast, analytical calculations and global mantle flow models indicate basal drag can be substantial. In this study, we revisit this problem by examining the drag at the base of the lithosphere, for a single subduction system, in 2D models with a free trench and composite non-linear rheology. We compare the behaviour of short and long plates for a range of asthenospheric and lithospheric rheologies. We reproduce results from previous modelling studies, including low ratios of trench over plate motions. However, we also find that any combination of asthenosphere and lithosphere viscosity that produces Earth-like subduction behaviour leads to a correlation of velocities with plate size, due to the role of basal drag. By examining Cenozoic plate motion reconstructions, we find that slab age and plate size are positively correlated: higher slab pull for older plates tends to be offset by higher basal drag below these larger plates. This, in part, explains the lack of plate velocity–size correlation in observations, despite the important role of basal drag in the subduction force balance.
- Article
(4265 KB) - Full-text XML
-
Supplement
(4447 KB) - BibTeX
- EndNote


It is widely agreed that the negative buoyancy of subducting slabs provides the main driving force for subduction, as well as for plate motions in general (e.g. Forsyth and Uyeda, 1975; Becker and O'Connell, 2001; Conrad and Lithgow-Bertelloni, 2002; Coltice et al., 2019). This insight has led to first-order models where slabs are treated as Stokes sinkers through a viscous mantle, which successfully produce the main density structure of the mantle and the main patterns of plate motions, assuming that surface plate motions are driven by the resulting mantle flow (e.g. Lithgow-Bertelloni and Richards, 1998; Becker and O'Connell, 2001; Conrad and Lithgow-Bertelloni, 2002). Recent global or plate-scale studies show that in some cases additional forcing by mantle plumes and consequent mantle flow (leading to active drag) may also play a role (e.g. Becker and Faccenna, 2011; Coltice et al., 2019; Stotz et al., 2018). Nonetheless, such large-scale models cannot fully capture the regional force balance governing the dynamics of subduction at plate boundaries (i.e. the interplay between slab pull, plate bending, viscous forces between plates and mantle), in governing plate velocities and morphology. As a result, it is important to improve our understanding of the balance of forces in such a regional system to inform how these forces, or a parameterisation of them, would be best incorporated into larger-scale or global models (e.g. Conrad and Hager, 1999).
The main driving force in a regional subduction system is the pull of the sinking slab. Resistive forces include viscous drag on the slabs, frictional or viscous resistance at the contact between subducting and overriding plates, visco-plastic resistance of the subducting plates to bending into the trench and when they reach the upper–lower-mantle boundary (ULMB) at 660 km depth, and viscous drag on the base of the plate (e.g. Forsyth and Uyeda, 1975; Carlson et al., 1983; Conrad and Hager, 1999). For subducting plates, the latter force, basal drag, is assumed to be dominantly resistive, although we note that it can be a driving force (e.g. Becker and Faccenna, 2011; Stotz et al., 2018). A driving basal drag can occur where mantle flow, driven by the global system of sinking slabs and aided by rising plumes, provides additional forcing on a regional plate configuration (Coltice et al., 2019). We will not consider such external forces here. The regional subduction resistive forces counteract up to 90 % of slab pull, with the largest contribution from viscous resistance between the subducting slabs and the surrounding mantle (e.g. Schellart, 2004; Capitanio et al., 2007). It is debated what the relative importance of the resistive forces is and how their contributions vary between different subduction zones and how this might contribute to the variability in subduction zone behaviour (e.g. Conrad et al., 2004; Husson et al., 2012).
It has been noted that present-day plates with large subducting slabs attached do not display a correlation between plate size and plate velocity, as might be expected if basal drag played a significant role in the subduction force balance (e.g. Forsyth and Uyeda, 1975; Conrad and Hager, 1999; Fig. 1). Conrad and Hager (1999) suggested that high plate viscosity, which would lead to substantial loss of energy in the bending of the subducting plate at the trench (i.e. high bending resistance relative to basal drag), might be responsible for this lack of correlation. Their estimate of effective plate viscosity (about 2 orders of magnitude higher than the asthenosphere, i.e. an average effective lithospheric viscosity of about 1023 Pa s for a mantle viscosity of 1021 Pa s) has been confirmed by a range of subsequent studies (e.g. Zhong and Davies, 1999; Buffett and Rowley, 2006). However, dynamic subduction models with a mobile trench have shown that plates with such effective viscosities tend to adjust their dips and trench velocities to minimise energy lost in bending, thus limiting the effect on plate velocities (e.g. Bellahsen et al., 2005; Capitanio et al., 2007; Ribe, 2010).
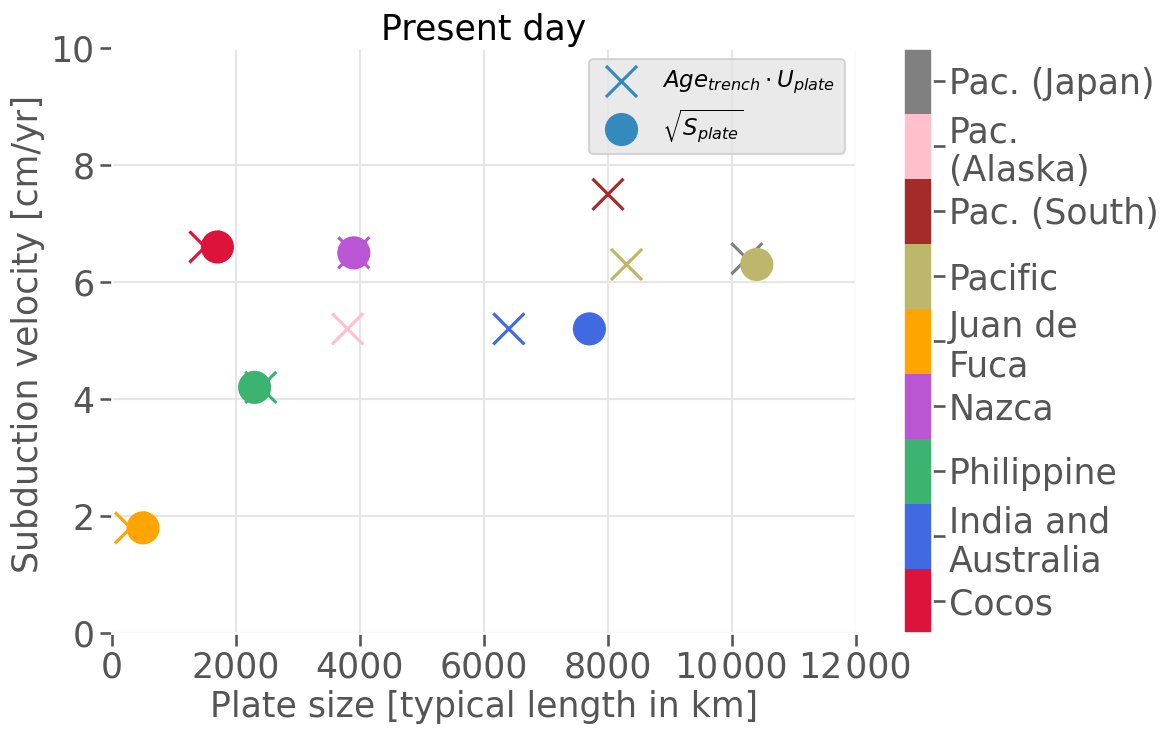
Figure 1Present-day subducting plate velocities, measured at the trench in a lower-mantle (plume) reference frame (O'Neill et al., 2005), as a function of plate size, in terms of a typical plate length. Typical plate length is a measure of plate size calculated as the age at the trench (Agetrench) multiplied by plate velocity (Uplate) (x markers) or as the square root of the plate surface area (Splate, circles). Velocity data from Sdrolias and Müller (2006) and Schellart et al. (2007) and plate size data from Conrad and Hager (1999).
Other work, using regional dynamic subduction models, has shown that low basal drag, resulting from low asthenospheric viscosities, may be important for understanding trench motions as observed on Earth (Billen and Arredondo, 2018). Trench motions tend to be only a small fraction of plate convergence velocity (on average, throughout the Cenozoic, about 10 %; Lallemand et al., 2005; Sdrolias and Müller, 2006; Goes et al., 2011). On the other hand, the type of free subduction models used to investigate the effects of plate bending can lead to trench motions that are up to 100 % of convergence (Capitanio et al., 2007), although models featuring an overriding plate result in smaller relative trench velocities (Garel et al., 2014). Furthermore, although most trenches retreat, 20 %–35 % of trench segments in the past 100 Myr advanced (Goes et al., 2011; Williams et al., 2015). Small variations in the balance between the forces affecting the upper and the subducting plates have been proposed to determine the direction of trench motion (Husson et al., 2012; Capitanio, 2013; Alsaif et al., 2020) and for such a mechanism to be effective, a low asthenospheric viscosity is likely required. Billen and Arredondo (2018) showed that a low-viscosity asthenosphere (with non-linear, strain-rate-dependent rheology leading to average asthenospheric viscosities of 1019–1020 Pa s and minimum viscosities as low as 1018–1019 Pa s, relative to maximum lithospheric viscosities of 1024 Pa s) facilitated small trench motions and periods of both trench advance and retreat.
Other 2D models of convection that approximate plate behaviour by a mechanical top boundary condition and strongly temperature-dependent rheology, albeit with an immobile trench, document how the ratio of lithosphere to asthenosphere viscosity governs to what extent basal drag is a resistive force (Höink and Lenardic, 2008, 2010). In such models, a low enough ratio even leads to a driving (Poiseuille) basal drag. From these results, one would expect that if the trench was free to move, resistive basal drag would lead to trench retreat and driving basal drag would be associated with trench advance; i.e. a viscosity ratio near this transition would lead to small trench motions, as found by Billen and Arredondo (2018). This indeed appears to be borne out by correlations found by Husson et al. (2012) between modelled mantle flow patterns and trench motions. Höink and Lenardic (2010) further showed that there is an influence of box size (which simulates plate size in their setup) on the viscosity ratio at which the transition from resisting to driving basal drag occurs. These studies indicate that a low ratio of average asthenosphere to average lithosphere viscosity (around 0.001), i.e. relatively low-magnitude basal drag, puts the system close to the transition from retreating to advancing trench motion and hence may be the most appropriate for understanding natural subduction dynamics.
On the other hand, analytical calculations and global-scale numerical models indicate that basal drag may not be such a negligible force. Basic analytical calculations (Turcotte and Schubert, 2002, Sect. 6.3) yield estimates of basal drag that are on the order of 5 %–10 % of slab pull. Observations of seismic anisotropy (Bokelmann and Silver, 2002) have been used to estimate that drag on the base of thick cratonic lithosphere is of a similar magnitude as ridge push, which is about 10 % of slab pull and of a similar magnitude as the net slab pull (i.e. the difference between slab pull and viscous resistance to slab sinking). Several other studies have also shown that basal drag can be high in areas of thick continental roots (e.g. Conrad and Lithgow-Bertelloni, 2006; Coltice et al., 2019) and tractions from global mantle flow models yield high cumulative values of basal drag on large plates like the Pacific (Conrad and Lithgow-Bertelloni, 2006). The magnitude of basal drag by global mantle flow has been shown to be important for explaining plate motions (e.g. Becker and O'Connell, 2001; Conrad and Lithgow-Bertelloni, 2002; Becker and Faccenna, 2011; Coltice et al., 2019) and can only be effective if asthenospheric viscosities are not too low.
To better understand the role that basal drag plays in controlling subduction and trench motions, we revisit these issues here using 2D dynamic subduction models with a composite stress- and temperature-dependent rheology and mobile trench and ridge. We test the effects of increased lithosphere viscosity, decreased asthenosphere viscosity and hence a variable lithospheric-to-asthenospheric-viscosity ratio. Finally, we re-evaluate relation between subducting plate velocity and plate size on Earth, by examining both present-day plate configurations and reconstructions through the Cenozoic era.
We use a thermo-mechanical model of a single subduction system comprising a subducting and overriding plate in a 2D rectangular box (Fig. 2). The finite-element, control-volume code Fluidity (Davies et al., 2011; Kramer et al., 2012; Garel et al., 2014; Le Voci et al., 2014) is used to solve the mass, momentum and energy conservation equations for Stokes flow under the Boussinesq approximation of incompressibility, for a viscous rheology. An irregular triangular adaptive mesh, with element sizes ranging from 0.4–200 km, yields high resolution in areas of dynamic significance (i.e. in areas of strong gradients of velocity, temperature, viscosity and material volume fraction) and lower resolution elsewhere (Fig. 2). Our models utilise the same numerical methodologies and physical properties as those of Garel et al. (2014). A summary of the model setup is given below, and further details, including all model parameters, are provided in Table S1-1 in the Supplement.
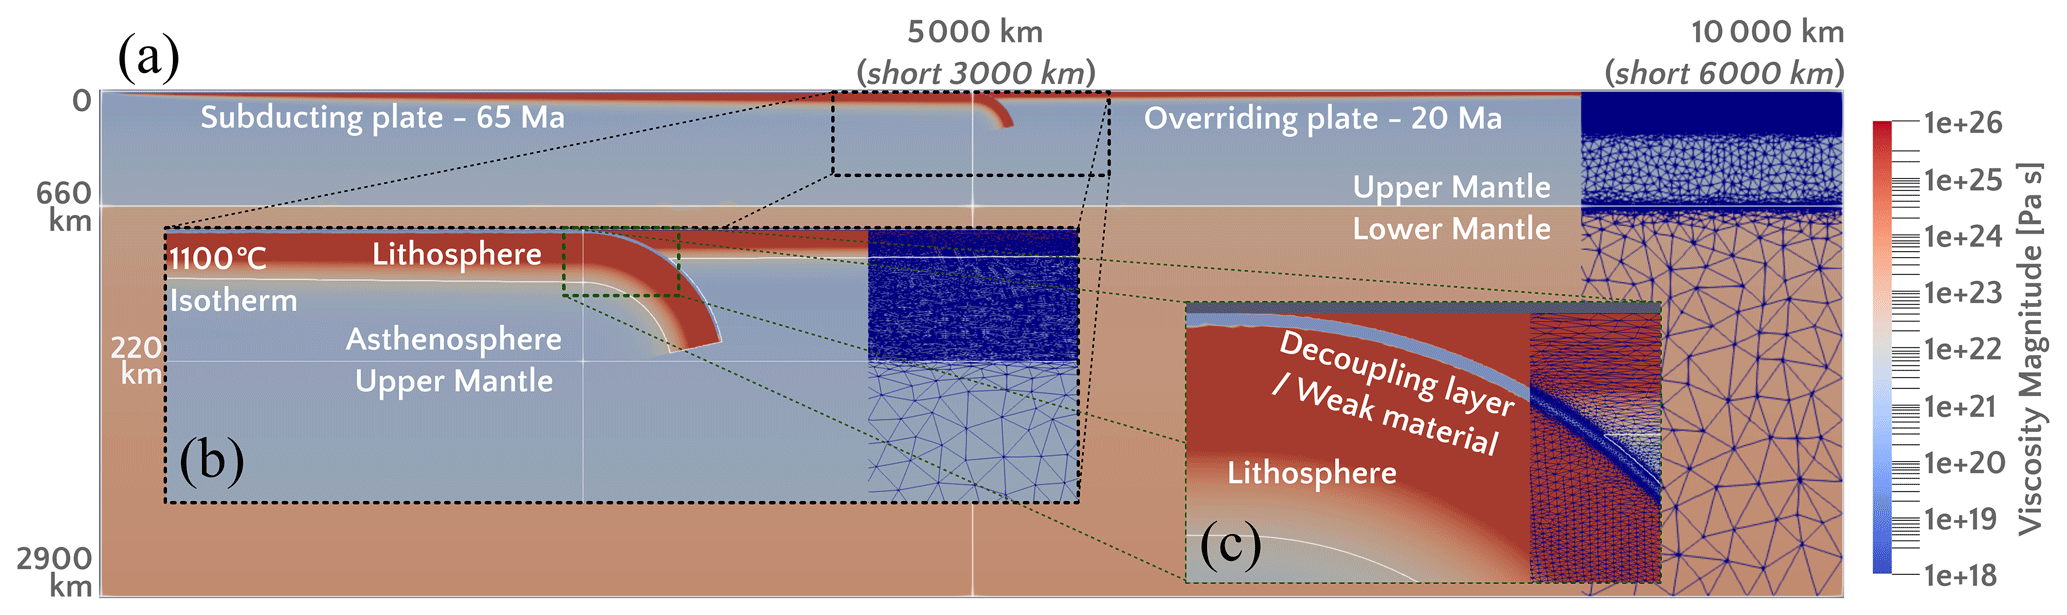
Figure 2Model setup illustrated with the initial viscosity field of the reference long-plate model, with text indicating parameters for the reference short-plate model. Initial trench ages are indicated for the overriding and subducting plates, which have linear age variations between the ridges and the trench. Initial plate temperature is set according to half-space cooling (Turcotte and Schubert, 2002). See text for boundary conditions and further information. (a) Full model view; (b) zoom of initial slab; (c) zoom of trench and decoupling layer. The irregular adaptive mesh is presented on the right side of each panel. White lines mark the initial location of the trench (vertical line), the ULMB at 660 km, the bottom of the asthenosphere (chosen at 220 km) and the bottom of the lithosphere (at the 1100 ∘C isotherm).
The initial temperature field includes a cold lithosphere, with temperatures calculated using half-space cooling (Turcotte and Schubert, 2002) with a linear age gradient from ridge to trench on both the overriding and subducting plate sides, and a prescribed bent slab down to 220 km depth. We examined both this setup with a prescribed initial slab in the upper 220 km of the box with no initial strain and a setup where we kinematically drive the slab to a comparable depth before continuing the calculations without kinematic constraints. No significant differences in the evolution with the two initial conditions were observed, and, accordingly, we present only the results from the former approach.
We use a subducting plate with an initial age of 65 Myr and overriding plate with initial age of 20 Myr, both with the same initial length (Fig. 2a). The young overriding plate exerts relatively low resistance to trench motion (Garel et al., 2014). In this study we do not vary initial subducting- and upper-plate ages to focus on varying lithospheric and asthenospheric strengths. The top surface is a free surface, which leads to a natural ridge push, and all other sides are free slip. Thermal boundary conditions are insulating on the left, a constant temperature at the top and bottom, and we apply mantle temperature to the right-hand side boundary to force a ridge at the edge of the overriding plate. The trench and the ridge on the subducting side are mobile.
We use a temperature-, pressure- and strain-rate-dependent composite rheology, which naturally results in a strong lithosphere and weaker asthenosphere. Other factors may contribute to the contrast between lithosphere and asthenosphere viscosity, e.g. hydration, partial melt and anisotropy (e.g. Hirth and Kohlstedt, 1995; Korenaga and Karato, 2008; Becker and Kawakatsu, 2011). Here, we consider diffusion and dislocation creep mechanisms, combined with a low-pressure yield-stress mechanism to approximate brittle failure and an approximation of Peierls low-temperature plasticity at high pressure (e.g. Čížková et al., 2002; Garel et al., 2014). The parameterisation of diffusion and dislocation creep mechanisms are consistent with the experimental range derived from olivine deformation (e.g. Hirth and Kohlstedt, 2003) and predict realistic bulk upper-mantle viscosities consistent with large-scale observations (Garel et al., 2020). The parameterisation of the Peierls creep is simplified (Garel et al., 2014) but is consistent with first-order approximation of the dependency on temperature and strain rate (e.g. Kameyama et al., 1999). The yield-stress mechanism is derived from Byerlee's law (Eq. S1.8) using rock-deformation experimental data (e.g. Burov, 2011). Such parameterisation of a low yield stress is common in geodynamical modelling (e.g. Mallard et al., 2016) to model surface plate deformation. Equations and parameters for the reference cases are as in Garel et al. (2014) and are given in Supplement Sect. S1. We vary parameters, as discussed below, to evaluate different relative lithosphere and asthenosphere viscosities. A 5 km thick weak, or decoupling, layer is included on top of the subducting plate and slab (Fig. 2c). The decoupling layer has a relatively low viscosity, which arises from modified rheological parameters (see Supplement Sect. S1 and Table S1-1 for further details) effective only at depths shallower than 200 km.
We examine the effect of basal drag by comparing long and short plates with initial lengths of 5000 and 3000 km from ridge to trench, respectively, adapting both plate size, through the initial thermal field, and box size. We examine the role of asthenospheric and lithospheric strength by adapting their rheology independently from the background rheology using a simple scaling factor. This method allows us to isolate the influence of changing lithosphere or asthenosphere strength without some of the additional feedbacks that arise in a fully dynamically controlled rheology. To do this, we use the 1100 ∘C isotherm to delineate the lithosphere–asthenosphere boundary (LAB) and use passive markers to track the outlines of the subducting lithosphere and differentiate it from the overriding plate. We set the base of the asthenosphere at 220 km depth, which is below the bulk of the modelled minimum in viscosity and consistent with the seismically imaged depth of the base of the asthenospheric low wave-speed zone (e.g. Dziewonski and Anderson, 1981; French et al., 2013). A 10 km linear transition is set across the boundaries of the lithosphere and the asthenosphere to prevent introducing sharp discontinuities in viscosity. Finally, we test the insights from these systematic models against a model where the relative lithosphere–asthenosphere viscosity contrast is modified self-consistently by changing the rheological parameters.
To model a system with weak asthenosphere we multiply its viscosity by 0.5, so that, with strain-rate feedbacks, it reaches minimum values of 1018–1019 Pa s. These values are consistent with current estimates of minimum asthenospheric viscosities based on postglacial rebound and laboratory experiments (e.g. Korenaga and Karato, 2008; Paulson and Richards, 2009; Billen and Arredondo, 2018). To simulate a strong lithosphere, we multiply its viscosity by factors of 2.0 or 10.0, limiting the strongest lithosphere to 1025 Pa s (reference and most other cases) and 1026 Pa s (strong lithosphere cases), which results in average lithospheric viscosity of 1024–1025 Pa s. These values are consistent with the highest estimates of effective lithospheric strength (Conrad and Hager, 1999; Billen and Hirth, 2007; Burov, 2011) where a maximum 1026 Pa s is an upper bound of viscosities for subductable plates. With this range of lithospheric and asthenospheric viscosities, we can generate continuous Earth-like oceanic style subduction while avoiding immediate slab detachments which result from to lithospheric weakening due to high strain rates or the stalling of subduction due to unattainable forces required for the bending of very strong lithosphere.
3.1 Reference model
The long- and short-plate reference models progress in stages, with their temporal evolution shown in Fig. 3. The initial stage is characterised by slab sinking through the upper mantle at relatively high subduction velocities. Asthenospheric viscosity and mantle viscosities around the slab are lowered due to high strain rates. This stage ends when the slab reaches the ULMB at 660 km depth. At this point, velocities and strain rates drop and viscosities rise.
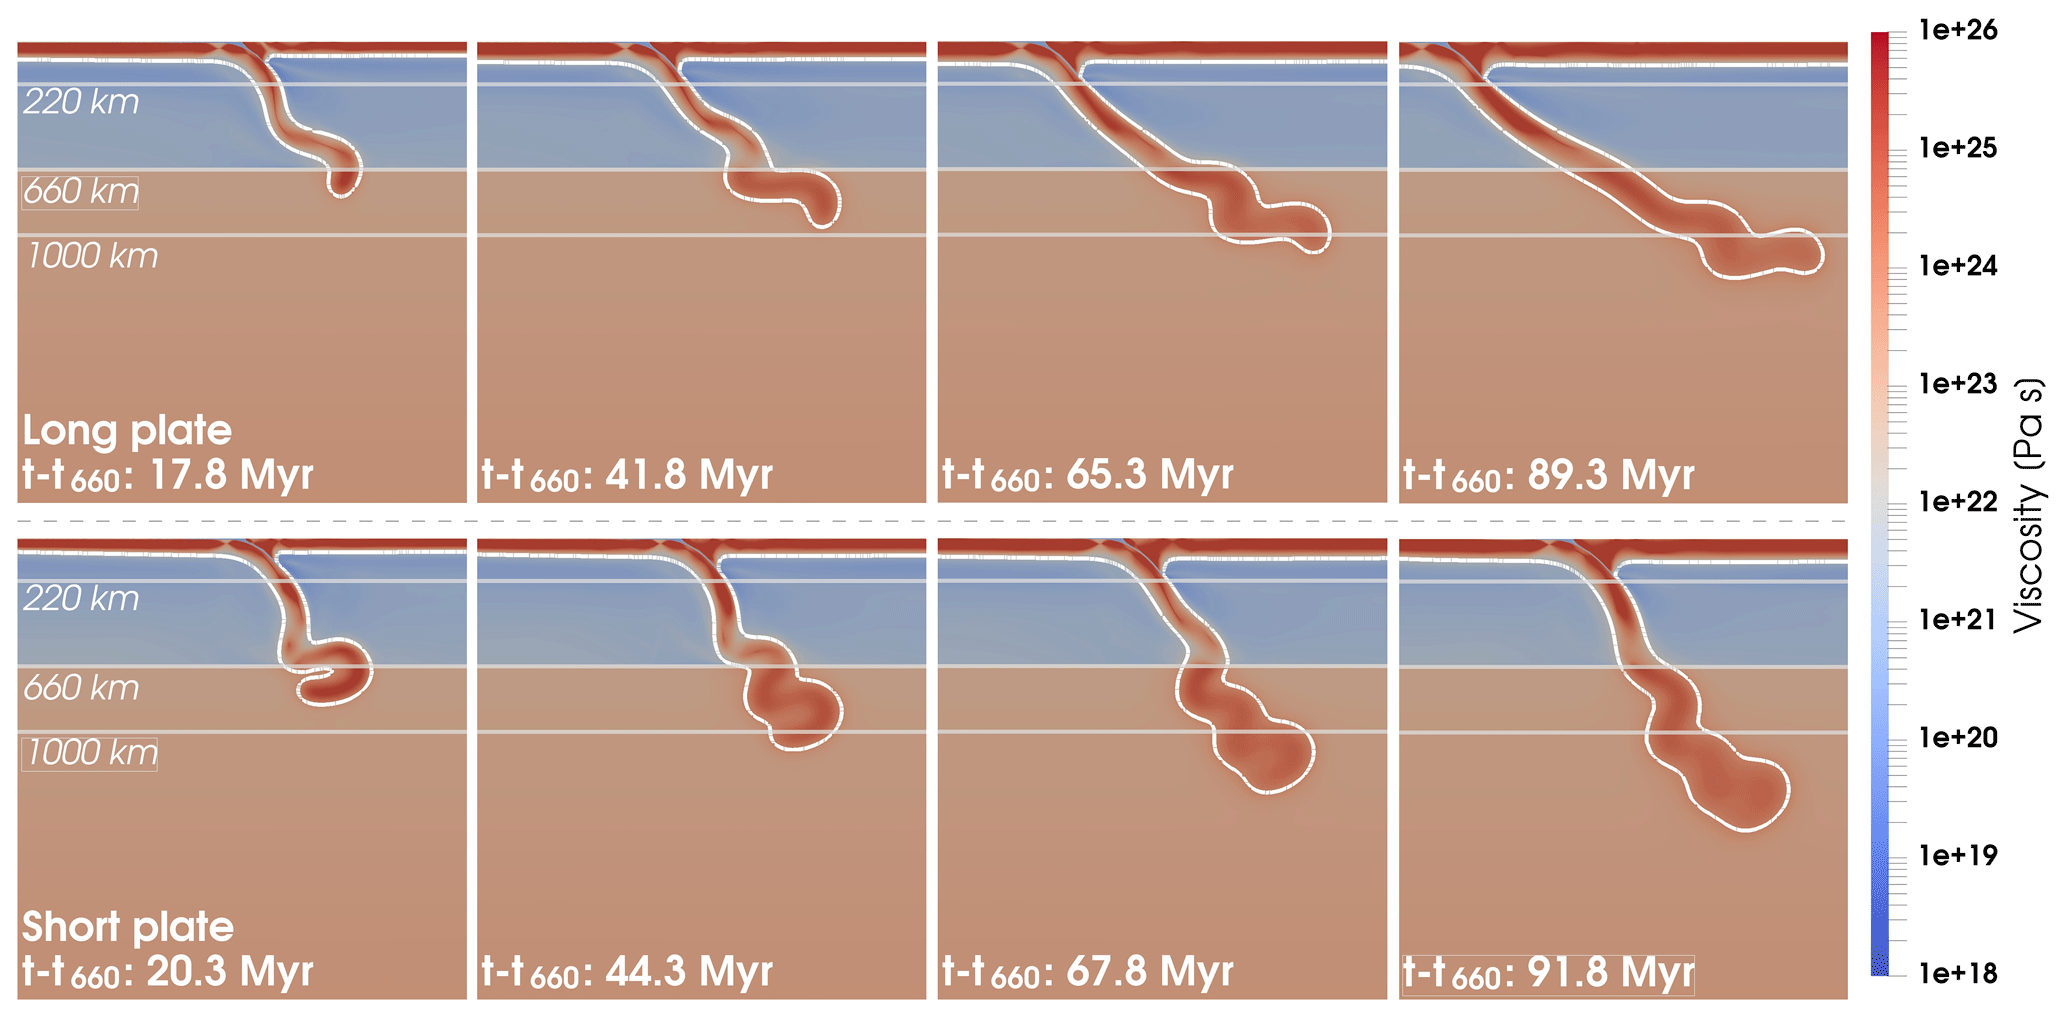
Figure 3Viscosity field evolution at various times for the reference long-plate model (top row) and reference short-plate model (bottom row). White contour marks the 1100 ∘C isotherm as the outline of the lithosphere. The vertical and horizontal spatial scales are identical and only part of the full model domain is shown. Note each model presents a distinct evolution of the slab and trench, which is the result of a difference in basal drag.
The second stage exhibits periodic oscillations in velocity between intermediate and low values (Fig. 4a). The oscillations are caused by episodes of flattening and steepening of the slab on the ULMB and may have a surface expression of oscillating trench motion (e.g. Clark et al., 2008; Lee and King, 2011). During this stage, the slab buckles, and the resulting folds are preserved during the descent of the slab into the lower mantle. The amplitude of the buckling decreases with time, such that if the models are run long enough (time is dependent on rheology), the subducting plates evolve to a final stage of more or less steady subduction. This is achieved in the long-plate reference model.
The shorter plate has higher subduction velocities than the long plate (Fig. 4a), whilst the longer plate exhibits enhanced trench retreat compared to the short-plate case (Fig. 4b). These results indicate a significant influence of basal drag. Higher basal-drag resistance leads to the slower subduction velocity of the long plate. In an additional feedback, less strain-rate weakening occurs in the asthenosphere under the long plate, as the asthenosphere moves with a similar velocity to the overlaying lithosphere in each model. This results in higher asthenospheric viscosity and resistance and makes subduction by trench retreat energetically preferable over subduction by plate advance over the asthenosphere. Trench advance does not occur at any stage in our reference models.
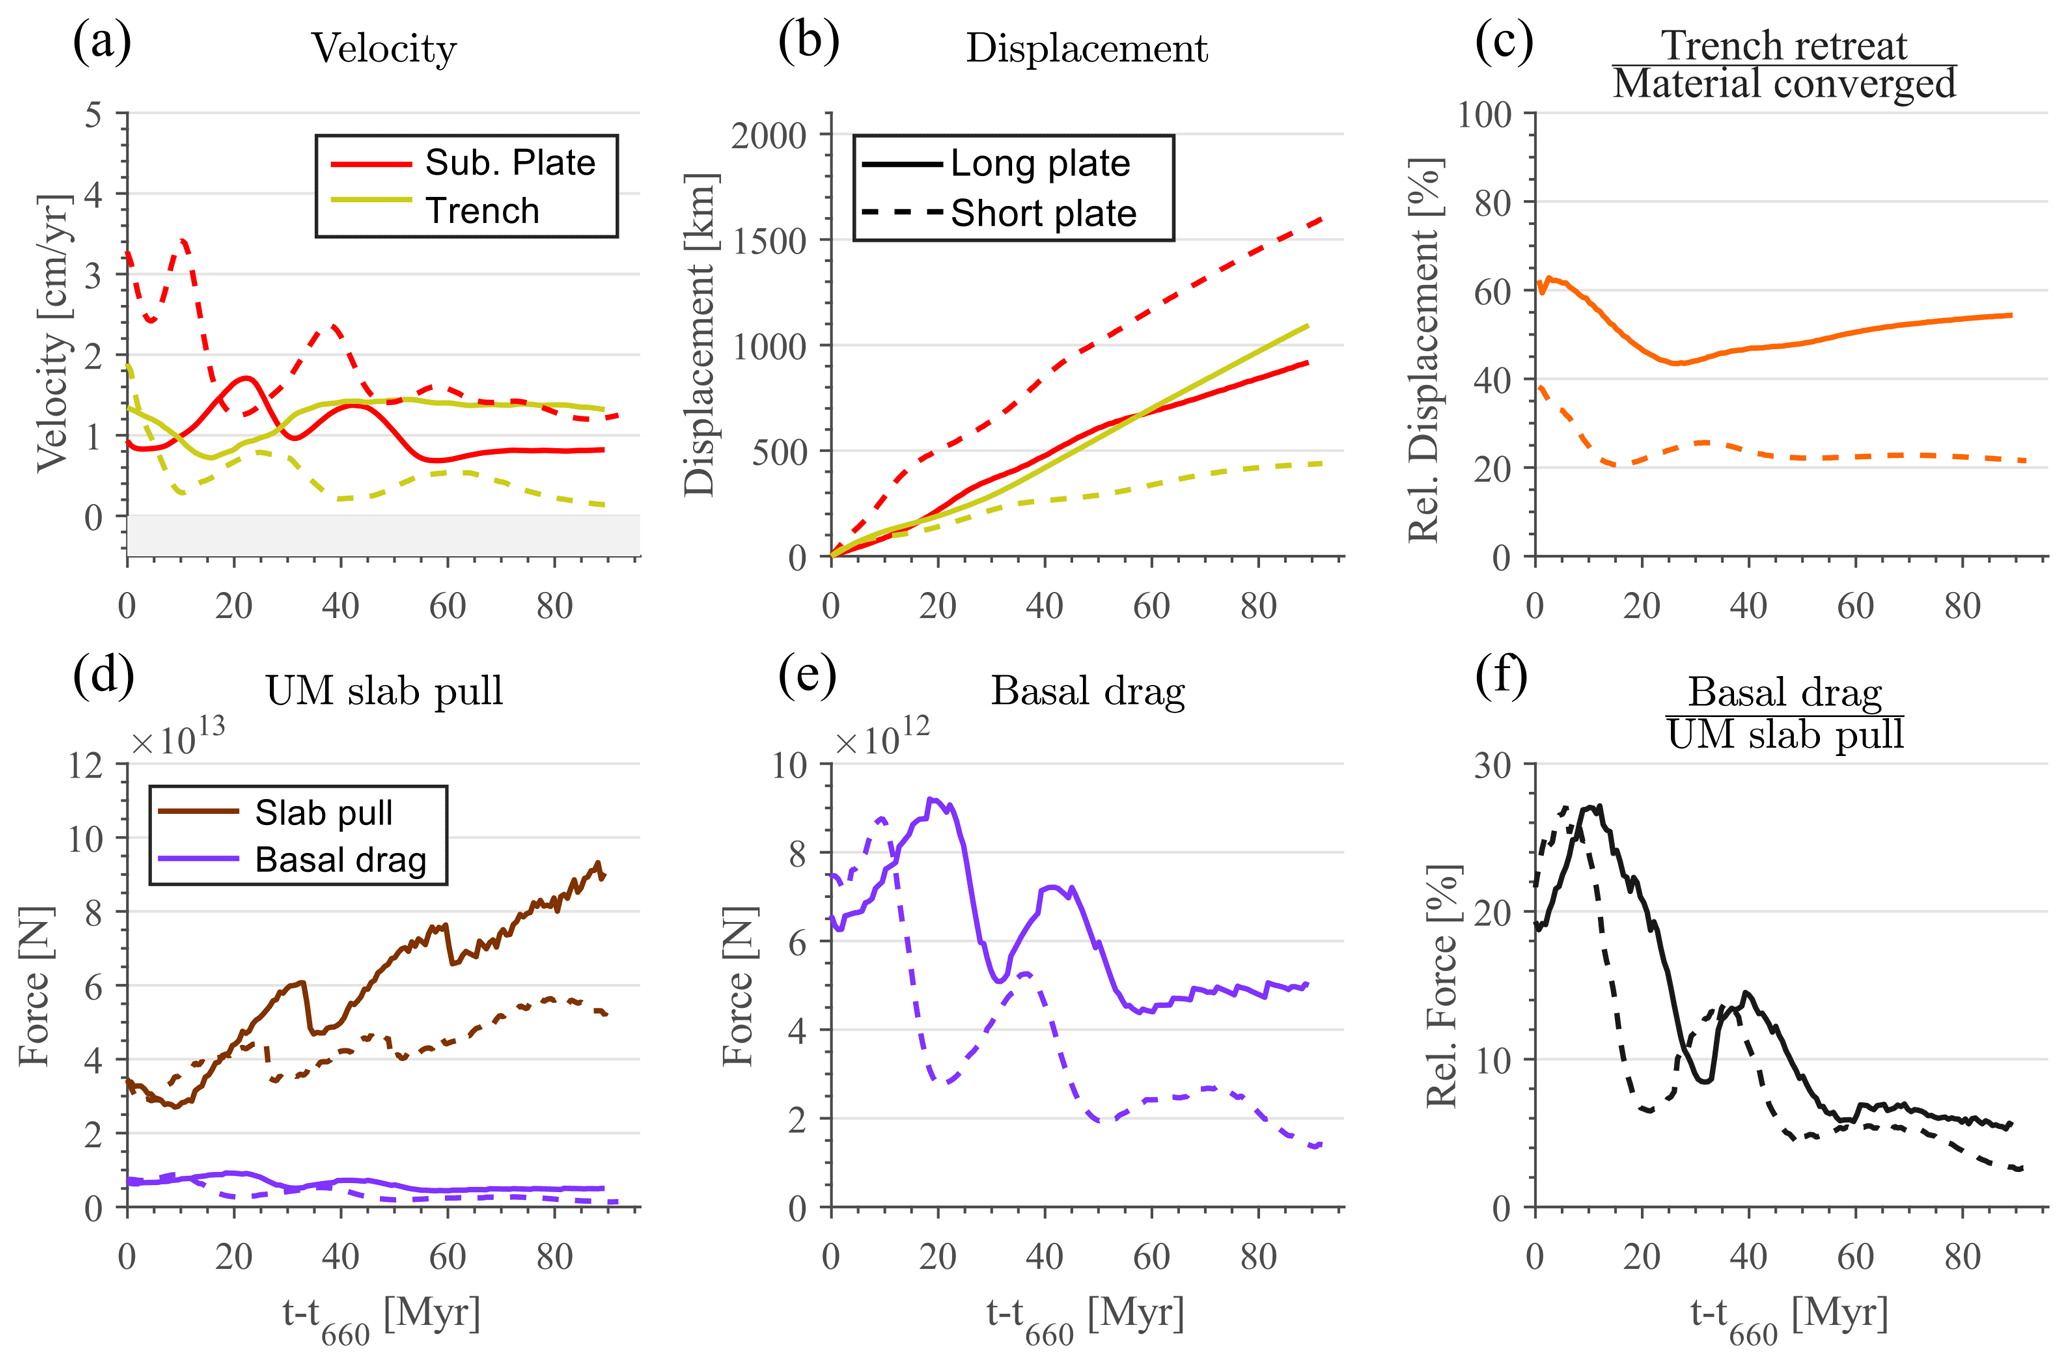
Figure 4Temporal evolution of the long-plate reference model (full lines) and the short-plate reference model (dashed lines). t-t660 indicates the time since the initial interaction of the slab with the ULMB. (a) Velocity of the subducting plate (positive towards the upper plate, red) and the trench (positive away from the upper plate, yellow), measured at 2000 km distance from the initial subducting plate ridge. (b) Displacement of the subducting plate (red) and the trench (yellow) relative to the initial condition. (c) Percent of plate convergence (calculated as the sum of trench retreat and plate displacement) achieved by trench retreat. (d) Upper-mantle slab pull and basal drag below the subducting plate, calculated as described in the main text. (e) Basal drag force from (d). (f) Ratio of basal drag to upper-mantle slab pull force. This shows that basal drag is of a similar magnitude as effective slab pull (i.e. the difference between gravitational pull and the viscous mantle resistance on the slab sides), which is ∼10 % of the upper-mantle slab pull force.
To evaluate the relative importance of basal drag in the overall force balance, we estimate basal drag below the subducting plate for each time step in the models and compare it to the main driving force, slab pull. We do this using the following approximate equations from Turcotte and Schubert (2002) (Sect. 6.3), yielding forces per unit length out of the model plane:
where FBD and FSP are the basal drag and slab pull forces, respectively, ηAst is the viscosity of the asthenosphere, ΔU is the velocity difference between the lithosphere and the asthenosphere, hAst and hLit are the thickness of the asthenosphere and the lithosphere, respectively, Lplate is the length of the unsubducted part of the plate, Δρ is the density difference between the slab and mantle, with a typical value of 40–50 kg/m3, g is the gravitational constant, and Sslab is the cross-sectional area of the slab. The parameters for basal drag, ηAst, ΔU, hAst and hLit, are measured at a representative vertical profile through the subducting plate (Fig. S2-3): provided that the profile is taken away from the trench and ridge, there is negligible sensitivity to the profile location. The 1100 ∘C isotherm is used as the LAB in determining hAst and hLit and to outline the edge of the slab, for Sslab, (see Fig. 2). Plate velocity is measured at 20 km and asthenosphere velocity and viscosity at 160 km depth. For the calculation of Sslab, the length of the slab is measured as the length of a straight line connecting the trench and the deepest point of the slab, or the coldest point of the slab at the ULMB, and the width of the slab is measured along a horizontal cross section at 220 km depth. These approximate expressions for FBD and FSP are sufficient to understand variations in subduction behaviour between models and through time. Note that the expression for FSP assumes stresses are effectively transmitted from the slab to the plate, which is appropriate because the adaptive grids of our models ensure we always resolve the strong slab core, even when it is quite thin (Garel et al., 2014). Both slab pull and basal drag evolve in our dynamic models (Fig. 4d and e). The cyclical nature of the buckling phases is associated with the evolution of the slab pull and basal-drag forces. As the slab slows and flattens on top of the ULMB as a result of the increased resistance to sinking at this depth, its dip decreases and slab pull increases. The higher pull increases the velocity and consequently the basal drag. The increased drag subsequently contributes to the slowing down the plate leading to steepening of the slab and a reduction in slab pull. The following decrease in subduction velocity leads to the lowering of drag. This reduction then allows for increase in slab pull and a new flattening episode.
For the reference models, we find that basal drag averages around 10 % of slab pull, ranging from just below 30 % in the fast, early stage of subduction to 3 %–5 % in the final stage (Fig. 4f). This is similar to the estimated magnitude of ridge push relative to slab pull (e.g. Turcotte and Schubert, 2002). Furthermore, the basal-drag ratio (of slab pull) for the short plate is systematically several percent lower than the basal-drag ratio for the long plate (Fig. 4e and f). Note that due to the non-linear feedbacks in the models, there are about 10 Myr right after the plates reach the ULMB (time t660) where the short plate experiences a higher drag than the long plate (Fig. 4). These relatively high drag values for the short plate are a consequence of the high velocities that the short plate attains in response to the initially significantly lower drag (Fig. S2-3). The difference in basal-drag ratio between the long- and short-plate models is apparently sufficient to change subduction velocity and influence the overall evolution of the morphology of the slab.
3.2 Weak asthenosphere
The most direct mechanism to reduce basal drag is to lower the asthenosphere viscosity. A lower basal drag allows for higher subduction velocity to develop, which in turn decreases the asthenospheric viscosity through the feedback effect of increased strain rate. The compound effect of applying the 0.5 reduction factor and consequent strain-rate weakening is an order of magnitude decrease in asthenospheric viscosity compared to the reference models.
Assigning a weak asthenosphere results in an increase in subduction velocity and a reduction in trench retreat, as shown in Figs. 5 and 6. However, the reduced basal drag does not remove the plate-length dependence of the subduction evolution; the difference between the displacement of the subducting plate for the long and short plates remains similar even if the total displacement has slightly increased due to the higher subduction velocities (Fig. 6a). The basal-drag ratios are lower than in the reference models and the difference between the long and short plates has increased, with the basal-drag ratio for the short plate ranging from about 20 % to less than 1 % over the evolution of the models (Fig. 6d). Although overall ratios of basal drag to slab pull are lower than in the reference model, basal drag still plays a significant role in these low-viscosity asthenosphere cases, as is clear from the difference in the final shapes of the long- and short-plate slabs (Fig. 5b and f). The overall contribution of trench retreat to plate convergence is reduced for both the long- and the short-plate models compared with the reference models (Fig. 6c).
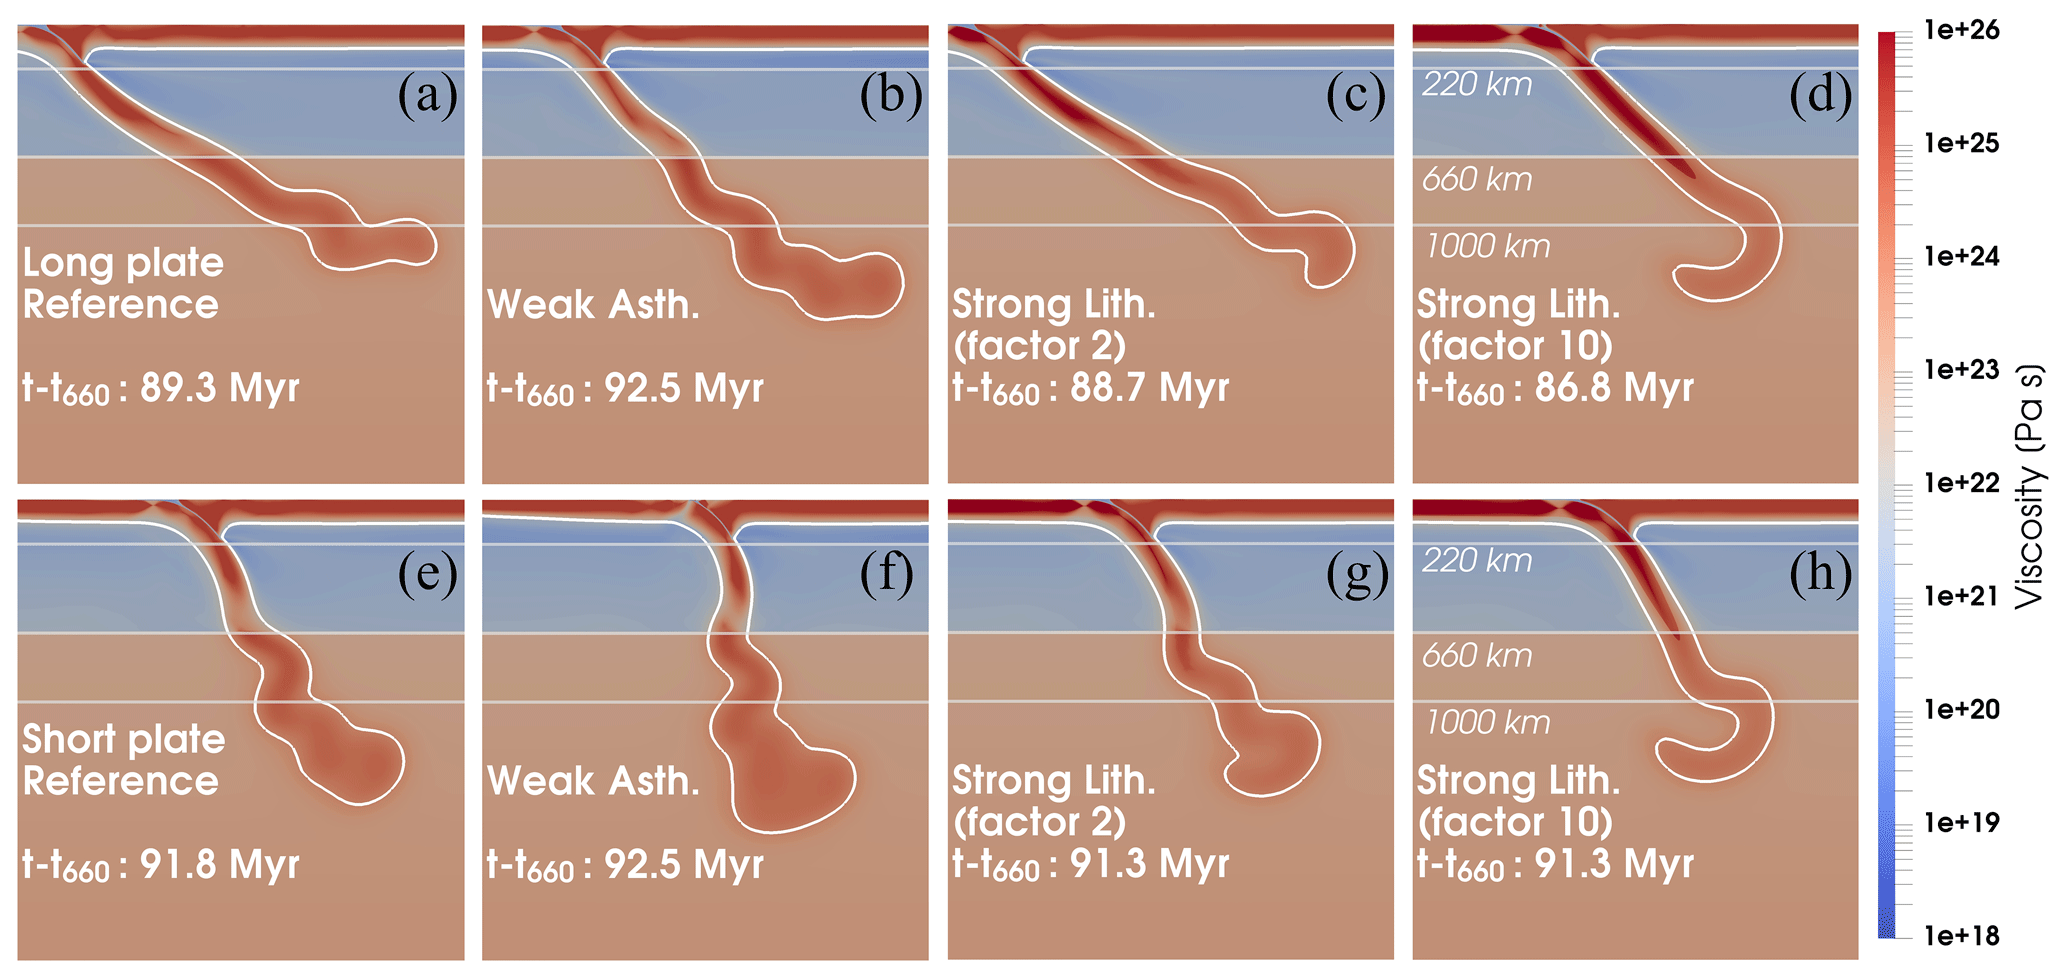
Figure 5Comparison of final slab shapes for different models shown as a snapshot of the viscosity field. Long-plate (top row, a–d) and short-plate (bottom row, e–h) cases of reference models (a, e), weak asthenosphere models (b, f), and strong lithosphere models with strength scaling factors of 2 (c, g) and 10 (d, h). White contour marks the 1100 ∘C isotherm as the outline of the lithosphere. The vertical and horizontal spatial scales are identical, with grey lines to mark depths of 220, 660 and 1000 km. For every type of model, the subducting slab in the short-plate model has more buckles and has undergone less trench retreat than in the long-plate model.

Figure 6Temporal evolution of the long-plate (full lines) and short-plate (dashed lines) models. Rows of graphs are for different types of models, where (a)–(d) are weak asthenosphere models, (e)–(h) are strong lithosphere (factor 2) models and (i)–(l) are strong lithosphere (factor 10) models. The first column, (a), (e) and (i), shows the displacement of the subducting plate from the initial state, the second column, (b), (f), and (j), the amount of trench retreat, the third column, (c), (g) and (k), shows trench retreat significance as percentage of the total material converged, and the fourth column, (d), (h) and (l), shows the ratio of basal drag to upper-mantle slab pull force. All models are compared with the reference models, shown in light red.
3.3 Strong lithosphere effect (factor 2 and 10)
A second mechanism to reduce the significance of basal drag as a resistive force is to increase the energy cost of bending through increased lithospheric viscosity (Conrad and Hager, 1999). This was implemented by applying the strengthening factor only in the subducting lithosphere and the slab. This process, unlike the reduction in asthenosphere viscosity, does not trigger any strong feedbacks between strain rate and effective viscosity. We therefore tested both factor 2 and factor 10 to compare the strengthening mechanism with the prescribed and the effective asthenosphere weakening. The resulting plate strength of the factor 10 experiments was at the upper bound of suggested realistic plate viscosity and at the upper bound of what is subductable in our models.
Increasing the strength of the lithosphere by a factor 2 reduces the amount of material subducted for the short-plate model, relative to the short-plate reference model, much more than it reduces the amount subducted for the long plate compared to the long-plate reference case (i.e. the behaviour of the long and the short plates becomes more similar). Trench retreat for both plates is similar to the reference models. The resulting basal-drag ratio is slightly reduced relative to the reference models (by 1 %–2 %), as shown in Fig. 6e–h. Slab shapes at the end of the simulation are similar to the reference models with somewhat less slab deformation and buckling at the ULMB interface because less material has subducted (Fig. 5c).
For the factor 10 increase in subducting-lithosphere viscosity, the long- and short-plate models achieve similar amounts of subducted material. The amount of material subducted by the long plate deviates substantially less from the reference than the short plate, while trench retreat is reduced more in the long- than the short-plate model (Fig. 6i and j). This is as expected following the work of Conrad and Hager (1999); the resistance to plate bending becomes a more important control on subduction velocity than basal drag if the plate is sufficiently strong. However, we consider this model as an endmember of plate strength, as it is close to what, in our models, is the limit of subductable plates. The basal-drag ratio for these strong-plate models is substantially lower than the reference models, with average values of around 5 % only and with a small systematic difference remaining between the long- and short-plate models (Fig. 6l). This amount of reduction in basal-drag ratio by about 3 %–5 % is sufficient to influence subduction dynamics, as can be observed at the final stages of the models (Fig. 5d) where the long- and short-plate models achieve different trench locations and slab shapes than the reference models.
In models where we combined a weaker asthenosphere with a stronger lithosphere (factor 2 and factor 10), the result was a joint effect of what we observed when we changed asthenosphere and lithospheric viscosity individually. The combined models subduct an increased amount of plate but there was less difference between the long- and short-plate models, and trench retreat was reduced. Thus, the models with strong lithosphere and weak asthenosphere exhibit the most Earth-like behaviour in terms of a low contribution of trench motion to convergence and limited sensitivity to plate length. However, this behaviour only appears for the upper bound of plate strength.
3.4 Self-consistent rheology
We tested how a model in which the flow law parameters were modified to produce a self-consistent rheology that yields a stronger lithosphere and weaker asthenosphere than the reference models compared to models with artificially prescribed regions of higher or lower viscosity. To do this, we used a simple optimisation algorithm to find a combination of flow law parameters that yielded an increase or reduction in viscosity in the lithosphere–asthenosphere (further detail in Maunder et al., 2016). We required that the modified composite rheology still satisfied the set of Earth-like conditions that Garel et al. (2014) imposed. These conditions include the following: (i) viscosities of the upper mantle and lower mantle will be in a range reasonable for postglacial rebound (Paulson and Richards, 2009); (ii) Peierls low-temperature plasticity is required to control deformation in the lower lithosphere and in the slab once subducted, to account for deep slab weakening; (iii) the transition from dislocation to diffusion creep as the dominant deformation mechanism is required to comply with the depth range inferred from seismic anisotropy (i.e. around 250 km depth in background mantle; Ranalli, 1995). We optimised the values of the activation energy and volume, the pre-factor and the stress exponent values of diffusion, dislocation, and Peierls creep to achieve a lower asthenospheric and higher lithospheric viscosity without significantly modifying the lithospheric thickness of the reference models. Table S1-1 lists the set of modified parameters that satisfies all constraints. We then tested that under the new rheology, subduction remained viable. We found that, in addition to adjusting the overall rheological parameters, we needed to increase the strength of the weak layer to limit subduction velocities (and avoid slab detachment) early in the evolution of the model.
All these conditions together strongly narrow the set of possible rheological parameters that allow strengthening of the lithosphere while weakening the asthenosphere, and we were not able to strengthen the lithosphere as much as in the artificially scaled rheology models without stalling subduction. This is due to the nature of self-consistent rheology, which couples the strength of the plate and its thickness. Any plates with 10 times higher strength were also thicker thus additionally increasing bending resistance and impeding subduction. Figure S2-2 shows how the evolution of subducting plate morphology and trench retreat are similar to our models where we artificially lower the viscosity of the asthenosphere and increase the viscosity of the lithosphere.
3.5 Models with extended domain
In the models discussed above, we changed the size of the model domain together with plate size, so that the models always contained the only two plates with their bounding spreading ridges at the box edge. To test whether box size affects the results, we also ran a set of models where we use an extended and fixed box size but vary the plate size inside the box. We tested both the long- and the short-plate reference cases in a box of 15 000 km length. Compared to the reference models, the box was extended by an additional 5000 and 9000 km, for the long- and short-plate models, respectively, to the left (trailing end) of the subducting plate. The initial condition in the extended section was set to mantle temperature throughout; i.e. the extended section contained no initial lithosphere. The upper plate was set to be the same length as the reference models (i.e. 5000 and 3000 km for the long-plate and short-plate models, respectively). The top thermal boundary condition allowed for lithosphere to develop in the extended section with time. Compared to the reference models, these cases display the same trends of plate advance and trench motion, with differences in diagnostic parameters of less than 5 % (Fig. 7). These differences are minor and indicate that box size does not bias the results.

Figure 7Temporal evolution of the long-plate (full lines) and short-plate (dashed lines) extended domain (grey) and reference (light red) models. (a) Displacement of the subducting plate from the initial state. (b) Amount of trench retreat. (c) Trench retreat significance as percentage of the total material converged. (d) Ratio of basal drag to upper-mantle slab pull force.
4.1 Trench motion
The trench always retreats in both the long- and short-plate reference models. Although strengthening the lithosphere and weakening the asthenosphere affect trench behaviour, only the short-plate model with the weak asthenosphere displays periods of trench advance. In this model, due to the lowered basal drag, subduction is able to occur through more plate advance, whilst limited periods of trench advance occur during the buckling interaction between the strong slab and lower mantle. These periods occur when increased subduction velocity brings colder and stronger slab to interact with the ULMB. The interaction between the steep strong slab and the upper mantle, which has lowered viscosity due to strain-rate weakening, does not allow the slab to unbend. Instead, the cold slab attains a rolled-over shape that upon interaction with the higher-viscosity lower mantle pushes the plate forward. These episodes end once subduction velocity reduces, as this gives the slab time to heat and weaken and to regain the ability to unbend. This type of trench advance mechanism can be observed in other models (Bellahsen et al., 2005; Di Giuseppe et al., 2009; Ribe, 2010; Billen and Arredondo, 2018), in particular models where slab strength does not decrease with increasing temperature (i.e. models without a Peierls type plasticity). This type of rolled-over slab is rare on Earth and has been imaged only below part of the Indian collision front (e.g. review by Goes et al., 2017); below other advancing trenches, slabs are steep but do not have the shape expected for trench advance resulting from the push of a strong slab at the ULMB. So, although the modelled trench advance episodes have magnitudes and rates in the range of observations, other mechanisms for trench advance, such as external forcing by background mantle flow and mantle plumes (as happens in the models from Höink and Lenardic, 2008) or an imbalance between ridge push and slab pull (e.g. Capitanio et al., 2009) may be more likely drivers of trench advance on Earth.
4.2 Model limitations
The models approximate subduction in a number of ways: we study only a single initial age for subducting and overriding plates and neglect the effect of upper-mantle phase transitions. Phase transitions exert a second-order effect on the difference between short and long plates, that would mainly enhance the slab buckling and flattening that happens in the models (see, e.g., Goes et al., 2017, for a review). The effect of plate age was studied by Garel et al. (2014) and Agrusta et al. (2017), who used a similar model setup as we use here but varied the age of subducting and upper plates without varying plate size. These models show that the initial ages of subducting and overriding plates affect the partitioning of plate convergence between trench retreat and subducting plate advance, with a lower contribution of trench retreat for initially younger subducting plates and initially older overriding plates, resulting in a steeper more buckled slab. The difference in motion partitioning and resulting slab morphology between our short- and long-plate reference models is similar to the difference between subduction of an initially 100 Myr old and an initially 30–50 Myr old plate (Garel et al., 2014). This further emphasises the importance of drag below the plate in the total force balance of our models.
However, one should also bear in mind the limitations of the 2D setup of the models. For 3D plates, there may be more convergent boundary length (and hence slab pull) relative to plate surface area than in the 2D cases. This influences the ratio of slab pull to basal drag, which we investigate with some basic analytical calculations for endmember natural subduction systems in the following section. Furthermore, in a 3D system mantle flow may be at an angle to the plate advance direction, which will affect the component of velocity used to calculate the drag. A more Earth-like 3D system will also include mantle upwelling as well as downwelling flows. Upwelling flow, together with the global system of subduction-driven flow can result in driving drag below some plates (e.g. Colli et al., 2014; Stotz et al., 2018; Coltice et al., 2019) and cannot occur in our model setup. These complications, as well as local phenomena (e.g. the presence of mantle plumes, lateral variations in slab properties, an imbalance between ridge push and slab pull; Capitanio et al., 2009; Capitanio, 2013) may result in more complex behaviour than presented in our models.
4.3 The role of basal drag on Earth
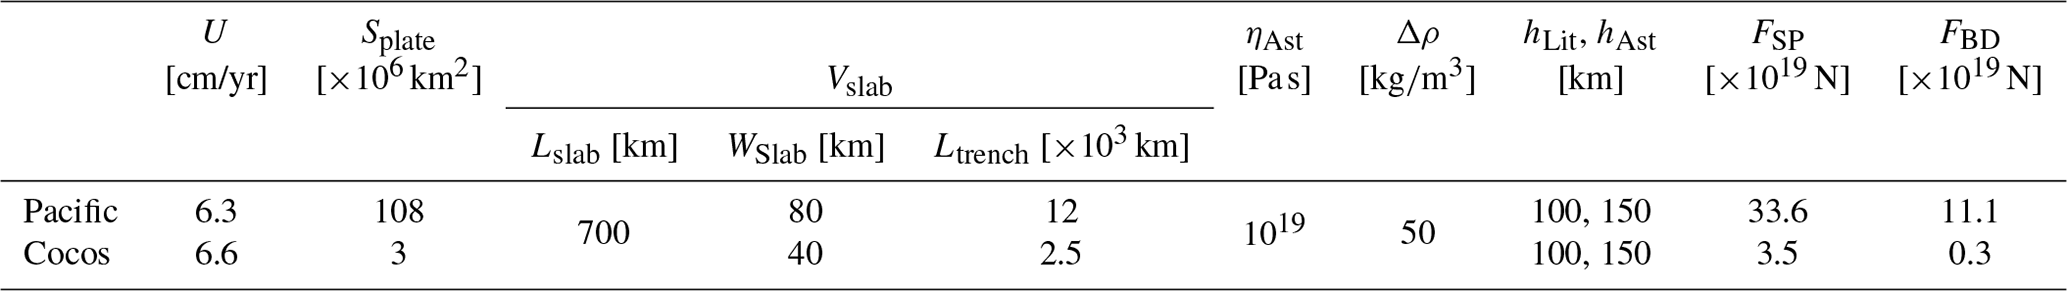
Our set of models clearly shows that basal drag is an important component of the force balance governing subduction dynamics, across the parameter space investigated. This is consistent with simple first-order analytical calculations of basal drag. We demonstrate this, by calculating basal drag and slab pull for the Pacific and Cocos plates as large and small plate endmembers. We use Eqs. (1) and (2) but for plate area Splate rather than length Lplate and slab volume rather than slab area . We consider only pull from the upper-mantle part of the slab. Lslab is the length of a slab extending through the whole upper mantle under an average dip of 70∘ (representative dip from the global compilation of Lallemand et al., 2005). We also assume the observed plate velocity U is a reasonable estimate of the difference in velocity between lithosphere and asthenosphere, ΔU. The properties used for the calculation and the forces calculated are summarised in Table 1. The relative basal drag, measured as the ratio of basal drag to slab pull, is around 30 % for the Pacific plate but only around 10 % for the Cocos plate. The analytical values of basal drag are somewhat larger than the values in the second stage of our models because the Pacific plate is about a factor of 2 larger than our subducting plate in the long-plate model, and our model velocities are on the low side compared to those observed around the Pacific. So, all evidence points to a role of basal drag that is significant, and the models would predict that unless other factors mask this trend, subduction velocities should vary with plate size.
Table 1Slab pull and basal-drag force calculations, with associated parameters, for the Pacific and Cocos plates. U is subduction velocity, Splate is subducting plate surface area, Vslab is the slab volume, Lslab is the length of the slab in the upper mantle, WSlab is the thickness of the slab, contributing to the difference in buoyancy due to slab age, Ltrench is the length of subduction trench, ηAst is the viscosity of the asthenosphere, Δρ is the density difference between the slab and surrounding mantle, and hLit and hAst are the thickness of the lithosphere and asthenosphere. FSP and FBD are the slab pull and basal-drag forces, calculated using Eqs. (1) and (2).
We re-examine the observations of velocity and plate size throughout the Cenozoic era, using GPlates (Müller et al., 2018) and the reconstruction of Müller et al. (2016). We include only plates mainly driven by their attached subducting slabs, consistent with Conrad and Hager (1999). The trenches considered are those where subduction occurs below North, Central and South America, Alaska–Aleutians, Kuriles–Japan, Izu–Bonin–Marianas, Ryukyu–Philipinnes, Tonga–Kermadec, and Sumatra–Java, with the Pacific, Philippine, Cocos, Nazca, Juan de Fuca, Farallon, Indo-Australia, Izanagi and Kula plates as subducting plates. At 10 Myr intervals between 0 and 60 Myr ago, we evaluate which of these subduction systems are active. Maps of the trenches considered at each time are included in Fig. S3-1. In our velocity and age estimates, we remove points at the trench ends to avoid biases by edge effects (e.g. highly oblique motions – see details in Supplement Sect. S3). We average age and velocity of the active subduction systems along each trench at each time step and calculate plate area for the plate polygons that make up the subducting plate at the corresponding time. Resulting trends are similar for the full velocity of the subducting plate and the trench-normal component of it.
The resulting size–velocity trend is shown in Fig. 8a. The recent reconstruction shows a similar present-day trend (bold symbols) as the older reconstructions (Figs. 1 and S3-2), with a hint of a trend of increasing subduction velocity with increasing plate size for small plates but a flat trend for plates larger than 30002 km2. When all subducting plates through the Cenozoic are considered, no significant trend of velocity with age is present. However, it is also observed (Fig. 8b) that, on average, subduction zones with older plates at the trench tend to be bigger, like the present-day Pacific and Indo-Australia plate, than those subducting younger material at the trench, such as the present-day Cocos, Nazca and Juan de Fuca.
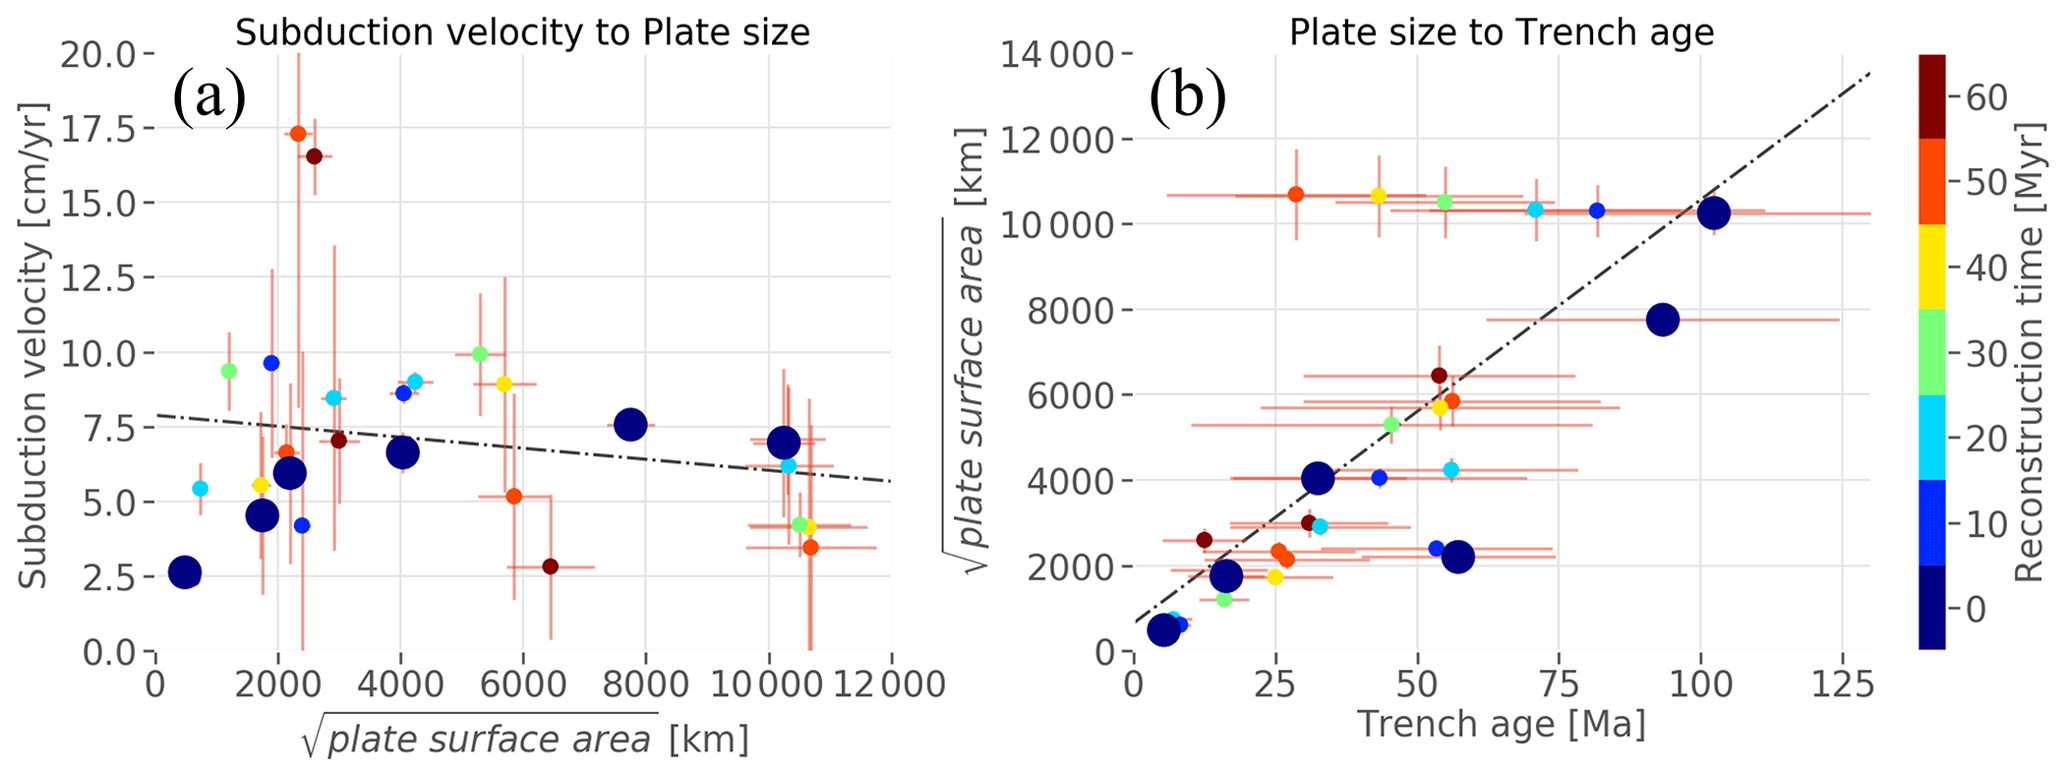
Figure 8(a) Velocity of subducting plates from Müller et al. (2016) in lower-mantle (plume) reference frame (O'Neill et al., 2005) throughout the Cenozoic, as a function of characteristic plate size (measured as the square root of plate surface area). (b) Plate size as a function of age at the trench for subducting plates throughout the Cenozoic. Maps showing the subduction zones included at each time can be found in Fig. S3-1. Blue bold circles represent data from present-day subducting plates. Linear regression fits (black lines) show that there is no resolvable trend of velocity with plate size (p value 0.351, R2 0.03), while there is a trend of size with age (p value < 0.05 and R2 of 0.52).
Previous (thermo-)mechanical models show that the age of the subducting plate strongly affects subduction dynamics. Older plates, i.e. those with older age at the trench, are colder and therefore denser and stronger. Consequently, they exert more pull force and are harder to bend, resulting in higher subduction velocities and higher trench retreat rates (Bellahsen et al., 2005; Capitanio et al., 2007; Stegman et al., 2010; Garel et al., 2014). A consequence of the observed correlation of average age at the trench and plate size is that plates with a stronger slab pull tend to also have a larger surface area and hence a stronger resisting basal drag. This provides a mechanism that offsets the velocity enhancing effect of larger driving forces of old plates and could explain the observation that velocities of subducting plates on Earth, today and throughout the Cenozoic, do not increase with age but tend to be mostly stable around 8–10 cm/yr (Fig. 8; Sdrolias and Müller, 2006; Goes et al., 2011).
Note that the relation between age and size is not a causal relationship but a feature of the plate configuration that has dominated most of the Cenozoic. Early in the Cenozoic, there are several cases that deviate from the buffered velocity trend. At the start of the Cenozoic, much of the subduction surrounding the Pacific plate consumed relatively young lithosphere, even though the Pacific plate itself was already large in size (horizontally aligned points at the top of the area–age trend in Fig. 8b). Other early Cenozoic deviations include very high velocities of the last remnants of the Izanagi and Kula plates (points with an area of about 25002 km2 and velocities around 17 cm/yr in Fig. 8a) and low velocities of the Farallon plate (an area of about 60002 km2 in Fig. 8a).
Previous models documented that older plates tend to drive more trench retreat due to both their larger bending strength and their larger negative buoyancy (e.g. Capitanio et al., 2007; Stegman et al., 2010; Garel et al., 2014). This has been suggested to help explain the difference between Cenozoic subduction styles along the western Pacific (subducting mainly older plate with significant trench retreat) and eastern Pacific (subducting younger plates with low trench retreat contributions) (Goes et al., 2017). Our results suggest that plate size may further enhance these differences, as the high basal drag exerted on the dominantly westward-subducting large Pacific plate would favour more trench retreat than for the smaller eastward-subducting Cocos, Nazca and Juan de Fuca plates.
We presented a set of 2D models to examine the role of basal drag in subduction dynamics. Previous studies have reached contradictory conclusions, with some proposing that drag between the subducting plate and the underlying asthenosphere plays only a small role in dictating the subduction force balance (e.g. Conrad and Hager, 1999; Billen and Arredondo, 2018; Wolf and Huismans, 2019), but others invoking a more significant role for basal drag in controlling subduction and plate motions on Earth (e.g. Conrad and Lithgow-Bertelloni, 2006). A low contribution of basal drag could explain the lack of a correlation between plate velocity and size (Conrad and Hager, 1999). Furthermore, the observation that trench migration velocities are mostly low compared to convergence velocities, can be either positive or negative in sign (Billen and Arredondo, 2018), and may be the result of a high ratio of lithosphere to asthenosphere viscosity drag (Conrad and Hager, 1999; Höink and Lenardic, 2008; Billen and Arredondo, 2018) is also suggestive of a low contribution from basal drag.
Our 2D numerical models comprise a single subduction system with a mobile trench and composite non-linear rheology. We consider long and short subducting plate models to evaluate the effect of plate length and the associated basal drag. The setup of these regional subduction models is similar to those of previous studies, which have been used to elucidate how slab buoyancy, slab strength, slab interaction with the upper–lower-mantle boundary or subduction–upper-plate interaction influence subduction dynamics (e.g. Bellahsen et al., 2005; Capitanio et al., 2007, 2009; Stegman et al., 2010; Čížková and Bina, 2013; Garel et al., 2014; Agrusta et al., 2017; Billen and Arredondo, 2018; Wolf and Huismans, 2019). We found that basal drag limits subduction velocities for our reference models and models with a lower asthenospheric viscosity (in a range consistent with likely viscosities on Earth and still allowing for steady subduction, without rapid slab detachment, leading to lithosphere–asthenosphere viscosity ratios of a factor 103 to 104). Models with a low-viscosity asthenosphere do reduce the contribution of trench motion to plate convergence to more Earth-like values, as observed in previous studies (e.g. Capitanio et al., 2007; Billen and Arredondo, 2018). They also allow for periods of trench retreat and advance (Billen and Arredondo, 2018), although we note that trench advance with reclining or vertical slab geometries as observed in nature probably requires additional forcing (e.g. by upwellings or other forces within the global plate system).
Strengthening the lithosphere can significantly lower the dependency of velocity on plate length but requires strengthening by as much as a factor of 10 (to maximum viscosity of 1026 Pa s), which is an upper bound: our models that incorporate lithospheric strengthening of this magnitude often preclude subduction. Although it has been shown that the relative strength of the lithosphere to asthenosphere is important in controlling the dynamics of subduction (Höink and Lenardic, 2008, 2010; Ribe, 2010), with non-linear rheologies, increasing lithosphere strength and decreasing asthenosphere strength have distinct effects.
Basal-drag values in our models range from a few percent of slab pull (in the strongest lithosphere cases) to up to 10 %–30 %. Similar values are estimated in analytical calculations of basal-drag-to-pull ratio assuming a reasonable set of parameters for the Pacific and Cocos plates. This, together with results from global flow models where basal drag by whole mantle flow has been shown to be important to reproduce patterns of plate motion (Lithgow-Bertelloni and Richards, 1998; Becker and O'Connell, 2001; Conrad and Lithgow-Bertelloni, 2006), indicates that basal drag is a substantial contributor towards the subduction force balance, of the same order as effective slab pull (i.e. slab pull minus the viscous resistance to sinking) and ridge push.
Based upon an analysis of a Cenozoic plate motion reconstruction (Müller et al., 2016), we suggest that the reason that most plates in the past 60 Myr moved at velocities of around 8–10 cm/yr is because the plate configuration during this era was such that plate size correlated with plate age at the trench, i.e. both driving and resisting forces increased together. Note however, that this correlation between size and age is not causal and may not have existed in other times of Earth history. As a result, during the Cenozoic, the increase in basal drag more or less balanced the increase in plate velocity induced by increased slab pull with increasing age. Such co-variations between plate velocity, age and size should be considered in regional models of subduction systems.
The numerical code, Fluidity (Davies et al., 2011), is open source and available from https://fluidityproject.github.io/ (last access: 18 January 2021). The dataset is available at the British Geological Survey National Geoscience Data Centre catalogue https://doi.org/10.5285/b3a75382-31db-428c-90bb-458fdf66d77a as item number 139485 (Suchoy and Goes, 2020).
The supplement related to this article is available online at: https://doi.org/10.5194/se-12-79-2021-supplement.
LS performed and analysed all models and led the writing of the paper. SG supported the model design, analysis and interpretation, and writing of the paper. BM assisted in designing and analysing the models and provided the code used for the self-consistent rheology model. FG built the original model used as the basis of the reference model and commented on the results and paper. RD provided assistance with running Fluidity, assisted in the design and setup of the reference model, and commented on the paper.
The authors declare that they have no conflict of interest.
We thank Ömer F. Bodur and an anonymous referee for their supportive and constructive reviews.
Lior Suchoy was supported by the Engineering and Physical Sciences Research Council (EPSRC) (grant no. EP/N509486/1). Ben Maunder and Saskia Goes were supported by the Natural Environment Research Council (NERC) (grant no. NE/K010743/1). Rhodri Davies was supported by the Australian Research Council (grant no. DP170100058).
This paper was edited by Susanne Buiter and reviewed by Ömer F. Bodur and one anonymous referee.
Agrusta, R., Goes, S., and van Hunen, J.: Subducting-slab transition-zone interaction: Stagnation, penetration and mode switches, Earth Planet. Sci. Lett., 464, 10–23, https://doi.org/10.1016/j.epsl.2017.02.005, 2017.
Alsaif, M., Garel, F., Gueydan, F., and Davies, D. R.: Upper plate deformation and trench retreat modulated by subduction-driven shallow asthenospheric flows, Earth Planet. Sci. Lett., 532, 116013, https://doi.org/10.1016/j.epsl.2019.116013, 2020.
Becker, T. W. and Faccenna, C.: Mantle conveyor beneath the Tethyan collisional belt, Earth Planet. Sci. Lett., 310, 453–461, https://doi.org/10.1016/j.epsl.2011.08.021, 2011.
Becker, T. W. and Kawakatsu, H.: On the role of anisotropic viscosity for plate-scale flow, Geophys. Res. Lett., 38, L17307, https://doi.org/10.1029/2011GL048584, 2011.
Becker, T. W. and O'Connell, R. J.: Predicting plate velocities with mantle circulation models, Geochem. Geophys. Geosys., 2, 1060, https://doi.org/10.1029/2001GC000171, 2001.
Bellahsen, N., Faccenna, C., and Funiciello, F.: Dynamics of subduction and plate motion in laboratory experiments: Insights into the “plate tectonics” behavior of the Earth, J. Geophys. Res.-Sol. Ea., 110, 1–15, https://doi.org/10.1029/2004JB002999, 2005.
Billen, M. I. and Arredondo, K. M.: Decoupling of plate-asthenosphere motion caused by non-linear viscosity during slab folding in the transition zone, Phys. Earth Planet. Inter., 281, 17–30, https://doi.org/10.1016/j.pepi.2018.04.011, 2018.
Billen, M. I. and Hirth, G.: Rheologic controls on slab dynamics, Geochem. Geophys. Geosys., 8, Q08012, https://doi.org/10.1029/2007GC001597, 2007.
Bokelmann, G. H. R. and Silver, P. G.: Shear stress at the base of shield lithosphere, Geophys. Res. Lett., 29, 6-1–6-4, https://doi.org/10.1029/2002GL015925, 2002.
Buffett, B. A. and Rowley, D. B.: Plate bending at subduction zones: Consequences for the direction of plate motions, Earth Planet. Sci. Lett., 245, 359–364, https://doi.org/10.1016/j.epsl.2006.03.011, 2006.
Burov, E. B.: Rheology and strength of the lithosphere, Mar. Pet. Geol., 28, 1402–1443, https://doi.org/10.1016/j.marpetgeo.2011.05.008, 2011.
Capitanio, F. A.: Lithospheric-age control on the migrations of oceanic convergent margins, Tectonophysics, 593, 193–200, https://doi.org/10.1016/j.tecto.2013.03.003, 2013.
Capitanio, F. A., Morra, G., and Goes, S.: Dynamic models of downgoing plate-buoyancy driven subduction: Subduction motions and energy dissipation, Earth Planet. Sci. Lett., 262, 284–297, https://doi.org/10.1016/j.epsl.2007.07.039, 2007.
Capitanio, F. A., Morra, G., and Goes, S.: Dynamics of plate bending at the trench and slab-plate coupling, Geochem. Geophys. Geosys., 10, Q04002, https://doi.org/10.1029/2008GC002348, 2009.
Carlson, R. L., Hilde, T. W. C., and Uyeda, S.: The driving mechanism of plate tectonics: Relation to age of the lithosphere at trenches, Geophys. Res. Lett., 10, 297–300, https://doi.org/10.1029/GL010i004p00297, 1983.
Čížková, H., and Bina, C. R.: Effects of mantle and subduction-interface rheologies on slab stagnation and trench rollback, Earth Planet. Sci. Lett., 379, 95–103, https://doi.org/10.1016/j.epsl.2013.08.011, 2013.
Čížková, H., Van Hunen, J., Van den Berg, A. P., and Vlaar, N. J.: The influence of rheological weakening and yield stress on the interaction of slabs with the 670 km discontinuity, Earth Planet. Sci. Lett., 199, 447–457, https://doi.org/10.1016/S0012-821X(02)00586-1, 2002.
Clark, S. R., Stegman, D., and Müller, R. D.: Episodicity in back-arc tectonic regimes, Phys. Earth Planet. Inter., 171, 265–279, https://doi.org/10.1016/j.pepi.2008.04.012, 2008.
Colli, L., Stotz, I., Bunge, H. P., Smethurst, M., Clark, S., Iaffaldano, G., Tassara, A., Guillocheau, F., and Bianchi, M. C.: Rapid South Atlantic spreading changes and coeval vertical motion in surrounding continents: Evidence for temporal changes of pressure-driven upper mantle flow, Tectonics, 33, 1304–1321, https://doi.org/10.1002/2014TC003612, 2014.
Coltice, N., Husson, L., Faccenna, C., and Arnould, M.: What drives tectonic plates?, Sci. Adv., 5, eaax4295, https://doi.org/10.1126/sciadv.aax4295, 2019.
Conrad, C. P. and Hager, B. H.: Effects of plate bending and fault strength at subduction zones on plate dynamics, J. Geophys. Res.-Sol. Ea., 104, 17551–17571, https://doi.org/10.1029/1999jb900149, 1999.
Conrad, C. P. and Lithgow-Bertelloni, C.: How mantle slabs drive plate tectonics, Science, 298, 207–209, https://doi.org/10.1126/science.1074161, 2002.
Conrad, C. P. and Lithgow-Bertelloni, C.: Influence of continental roots and asthenosphere on plate-mantle coupling, Geophys. Res. Lett., 33, L05312, https://doi.org/10.1029/2005GL025621, 2006.
Conrad, C. P., Bilek, S., and Lithgow-Bertelloni, C.: Great earthquakes and slab pull: Interaction between seismic coupling and plate-slab coupling, Earth Planet. Sci. Lett., 218, 109–122, https://doi.org/10.1016/S0012-821X(03)00643-5, 2004.
Davies, D. R., Wilson, C. R., and Kramer, S. C.: Fluidity: A fully unstructured anisotropic adaptive mesh computational modeling framework for geodynamics, Geochem. Geophys. Geosys., 12, Q06001, https://doi.org/10.1029/2011GC003551, 2011.
Dziewonski, A. M. and Anderson, D. L.: Preliminary reference Earth model, Phys. Earth Planet. Inter., 25, 297–356, https://doi.org/10.1016/0031-9201(81)90046-7, 1981.
Forsyth, D. and Uyeda, S.: On the Relative Importance of the Driving Forces of Plate Motion, Geophys. J. R. Astron. Soc., 43, 163–200, https://doi.org/10.1111/j.1365-246X.1975.tb00631.x, 1975.
French, S., Lekic, V., and Romanowicz, B.: Waveform tomography reveals channeled flow at the base of the oceanic asthenosphere, Science, 342, 227–230, https://doi.org/10.1126/science.1241514, 2013.
Garel, F., Goes, S., Davies, D. R., Davies, J. H., Kramer, S. C., and Wilson, C. R.: Interaction of subducted slabs with the mantle transition-zone: A regime diagram from 2-D thermo-mechanical models with a mobile trench and an overriding plate, Geochem. Geophys. Geosys., 15, 1739–1765, https://doi.org/10.1002/2014GC005257, 2014.
Garel, F., Thoraval, C., Tommasi, A., Demouchy, S., and Davies, D. R.: Using thermo-mechanical models of subduction to constrain effective mantle viscosity, Earth Planet. Sci. Lett., 539, 116243, https://doi.org/10.1016/j.epsl.2020.116243, 2020.
Di Giuseppe, E., Faccenna, C., Funiciello, F., van Hunen, J., and Giardini, D.: On the relation between trench migration, seafloor age, and the strength of the subducting lithosphere, Lithosphere, 1, 121–128, https://doi.org/10.1130/L26.1, 2009.
Goes, S., Capitanio, F. A., Morra, G., Seton, M. and Giardini, D.: Signatures of downgoing plate-buoyancy driven subduction in Cenozoic plate motions, Phys. Earth Planet. Inter., 184, 1–13, https://doi.org/10.1016/j.pepi.2010.10.007, 2011.
Goes, S., Agrusta, R., van Hunen, J., and Garel, F.: Subduction-transition zone interaction: A review, Geosphere, 13, 644–664, https://doi.org/10.1130/GES01476.1, 2017.
Hirth, G. and Kohlstedt, D. L.: Experimental constraints on the dynamics of the partially molten upper mantle: Deformation in the diffusion creep regime, J. Geophys. Res., 100, 1981–2001, https://doi.org/10.1029/94JB02128, 1995.
Hirth, G. and Kohlstedt, D. L.: Rheology of the Upper Mantle and the Mantle Wedge: A View from the Experimentalists, Geophys. Monogr. Ser., 138, 83–106, https://doi.org/10.1029/138GM06, 2003.
Höink, T. and Lenardic, A.: Three-dimensional mantle convection simulations with a low-viscosity asthenosphere and the relationship between heat flow and the horizontal length scale of convection, Geophys. Res. Lett., 35, L10304, https://doi.org/10.1029/2008GL033854, 2008.
Höink, T. and Lenardic, A.: Long wavelength convection, Poiseuille-Couette flow in the low-viscosity asthenosphere and the strength of plate margins, Geophys. J. Int., 180, 23–33, https://doi.org/10.1111/j.1365-246X.2009.04404.x, 2010.
Husson, L., Guillaume, B., Funiciello, F., Faccenna, C., and Royden, L. H.: Unraveling topography around subduction zones from laboratory models, Tectonophysics, 526–529, 5–15, https://doi.org/10.1016/j.tecto.2011.09.001, 2012.
Kameyama, M., Yuen, D. A., and Karato, S.-I.: Thermal-mechanical effects of low-temperature plasticity (the Peierls mechanism) on the deformation of a viscoelastic shear zone, Earth Planet. Sci. Lett., 168, 159–172, https://doi.org/10.1016/S0012-821X(99)00040-0, 1999.
Korenaga, J. and Karato, S. I.: A new analysis of experimental data on olivine rheology, J. Geophys. Res.-Sol. Ea., 113, B02403, https://doi.org/10.1029/2007JB005100, 2008.
Kramer, S. C., Wilson, C. R., and Davies, D. R.: An implicit free surface algorithm for geodynamical simulations, Phys. Earth Planet. Inter., 194–195, 25–37, https://doi.org/10.1016/j.pepi.2012.01.001, 2012.
Lallemand, S., Heuret, A., and Boutelier, D.: On the relationships between slab dip, back-arc stress, upper plate absolute motion, and crustal nature in subduction zones, Geochem. Geophys. Geosys., 6, Q09006, https://doi.org/10.1029/2005GC000917, 2005.
Lee, C. and King, S. D.: Dynamic buckling of subducting slabs reconciles geological and geophysical observations, Earth Planet. Sci. Lett., 312, 360–370, https://doi.org/10.1016/j.epsl.2011.10.033, 2011.
Lithgow-Bertelloni, C. and Richards, M. A.: The dynamics of cenozoic and mesozoic plate motions, Rev. Geophys., 36, 27–78, https://doi.org/10.1029/97RG02282, 1998.
Mallard, C., Coltice, N., Seton, M., Dietmar Müller, R., and Tackley, P. J.: Subduction controls the distribution and fragmentation of Earth's tectonic plates, Nature 535, 140–143, https://doi.org/10.1038/nature17992, 2016.
Maunder, B., van Hunen, J., Magni, V., and Bouilhol, P.: Relamination of mafic subducting crust throughout Earth's history, Earth Planet. Sci. Lett., 449, 206–216, https://doi.org/10.1016/j.epsl.2016.05.042, 2016.
Müller, R. D., Seton, M., Zahirovic, S., Williams, S. E., Matthews, K. J., Wright, N. M., Shephard, G. E., Maloney, K. T., Barnett-Moore, N., Hosseinpour, M., Bower, D. J., and Cannon, J.: Ocean Basin Evolution and Global-Scale Plate Reorganization Events Since Pangea Breakup, Annu. Rev. Earth Planet. Sci., 44, 107–138, https://doi.org/10.1146/annurev-earth-060115-012211, 2016.
Müller, R. D., Cannon, J., Qin, X., Watson, R. J., Gurnis, M., Williams, S., Pfaffelmoser, T., Seton, M., Russell, S. H. J.. and Zahirovic, S.: GPlates: Building a Virtual Earth Through Deep Time, Geochem. Geophys. Geosys., 19, 2243–2261, https://doi.org/10.1029/2018GC007584, 2018.
O'Neill, C., Müller, D., and Steinberger, B.: On the uncertainties in hot spot reconstructions and the significance of moving hot spot reference frames, Geochem. Geophys. Geosys., 6, Q04003, https://doi.org/10.1029/2004GC000784, 2005.
Paulson, A. and Richards, M. A.: On the resolution of radial viscosity structure in modelling long-wavelength postglacial rebound data, Geophys. J. Int., 179, 1516–1526, https://doi.org/10.1111/j.1365-246X.2009.04362.x, 2009.
Ranalli, G.: Rheology of the earth, Chapman and Hall, London, ISBN 0-412-54670-1, 1995.
Ribe, N. M.: Bending mechanics and mode selection in free subduction: A thin-sheet analysis, Geophys. J. Int., 180, 559–576, https://doi.org/10.1111/j.1365-246X.2009.04460.x, 2010.
Schellart, W. P.: Quantifying the net slab pull force as a driving mechanism for plate tectonics, Geophys. Res. Lett., 31, L07611, https://doi.org/10.1029/2004GL019528, 2004.
Schellart, W. P., Freeman, J., Stegman, D. R., Moresi, L., and May, D.: Evolution and diversity of subduction zones controlled by slab width, Nature, 446, 308–311, https://doi.org/10.1038/nature05615, 2007.
Sdrolias, M. and Müller, R. D.: Controls on back-arc basin formation, Geochem. Geophys. Geosys., 7, Q04016, https://doi.org/10.1029/2005GC001090, 2006.
Stegman, D. R., Farrington, R., Capitanio, F. A., and Schellart, W. P.: A regime diagram for subduction styles from 3-D numerical models of free subduction, Tectonophysics, 483, 29–45, https://doi.org/10.1016/j.tecto.2009.08.041, 2010.
Stotz, I. L., Iaffaldano, G., and Davies, D. R.: Pressure-Driven Poiseuille Flow: A Major Component of the Torque-Balance Governing Pacific Plate Motion, Geophys. Res. Lett., 45, 117–125, https://doi.org/10.1002/2017GL075697, 2018.
Suchoy, L. and Goes, S.: Initiation files for Fluidity numerical modelling code, used in the paper Suchoy et al., 2020, British Geological Survey (Dataset), https://doi.org/10.5285/b3a75382-31db-428c-90bb-458fdf66d77a, 2020.
Turcotte, D. L. and Schubert, G.: Geodynamics, Cambridge University Press, Cambridge, https://doi.org/10.1017/CBO9780511807442, 2002.
Le Voci, G., Davies, D. R., Goes, S., Kramer, S. C., and Wilson, C. R.: A systematic 2-D investigation into the mantle wedge's transient flow regime and thermal structure: Complexities arising from a hydrated rheology and thermal buoyancy, Geochem. Geophys. Geosys., 15, 28–51, https://doi.org/10.1002/2013GC005022, 2014.
Williams, S., Flament, N., Dietmar Müller, R., and Butterworth, N.: Absolute plate motions since 130 Ma constrained by subduction zone kinematics, Earth Planet. Sci. Lett., 418, 66–77, https://doi.org/10.1016/j.epsl.2015.02.026, 2015.
Wolf, S. G. and Huismans, R. S.: Mountain Building or Backarc Extension in Ocean-Continent Subduction Systems: A Function of Backarc Lithospheric Strength and Absolute Plate Velocities, J. Geophys. Res.-Sol. Ea., 124, 7461–7482, https://doi.org/10.1029/2018JB017171, 2019.
Zhong, S. and Davies, G. F.: Effects of plate and slab viscosities on the geoid, Earth Planet. Sci. Lett., 170, 487–496, https://doi.org/10.1016/S0012-821X(99)00124-7, 1999.