the Creative Commons Attribution 4.0 License.
the Creative Commons Attribution 4.0 License.
 | 22 Aug 2022
3D deep geothermal reservoir imaging with wireline distributed acoustic sensing in two boreholes
Evgeniia Martuganova
Manfred Stiller
Ben Norden
Jan Henninges
Charlotte M. Krawczyk
Geothermal exploration will help move towards a low-carbon economy and provide a basis for green and sustainable growth. The development of new practical, reliable methods for geophysical characterization of a reservoir has the potential to facilitate a broader application of deep geothermal energy. At the Groß Schönebeck in situ laboratory, a unique vertical seismic profiling (VSP) dataset was recorded in two 4.3 km deep geothermal boreholes using fibre-optic cables in early 2017. The experiment set-up consisted of 61 vibrator points organized in a spiral pattern around the well site to ensure a proper offset and azimuth distribution in the target reservoir section. Data were processed using a standard workflow for VSP. As a result, a detailed three-dimensional km image around the existing boreholes was created using the Kirchhoff migration algorithm with restricted aperture. The imaging resolved small-scale features in the reservoir essential for the future exploration of the geothermal research site. Borehole data with vertical resolution up to 16 m revealed the existing depth variations of the Elbe reservoir sandstone horizon at 4.08–4.10 km depth and indications of an unconformity in the area where we expect volcanic rocks. In addition, in the borehole data a complex interlaying with numerous pinch-outs in the Upper Rotliegend reservoir section (3.8 to 4 km depth) was discovered. Thereby, we demonstrate that wireline fibre-optic data can significantly contribute to exploration by providing an efficient and reliable method for deep geothermal reservoir imaging.
- Article
(10968 KB) - Full-text XML
- BibTeX
- EndNote


The EU aims to expand geothermal energy use and reach 2570 TWh by 2050 (The European Commission, 2021). Nevertheless, in Europe, easily accessible hydrothermal resources are limited. Consequently, the primary growth in geothermal power production is expected to come from projects associated with developing enhanced geothermal systems (EGSs) (Carrara et al., 2020). The development of geothermal plants which exploit EGS reservoirs is associated with increased developing costs, high risks associated with the drilling of deep wells, and the possible requirement of well stimulation (Carrara et al., 2020). For these reasons, EGS plants are quite rare within the EU (IEA Geothermal, 2020). To overcome the high upfront investment costs and to support the growing demand for the exploration of deep geothermal reservoirs (3.5–4 km), it is essential to develop modern, reliable technological solutions to reduce costs and risks related to deep geothermal well drilling and EGS plant installations. According to the geothermal energy technology development report 2020 (Carrara et al., 2020), geothermal exploration could be optimized by utilizing new methods, i.e. applying fibre-optic cables to measure strain.
Measurements with a fibre-optic cable installed in diverse environments are widely applied for seismic data acquisition for versatile research topics such as glacial studies (Booth et al., 2020; Brisbourne et al., 2021; Hudson et al., 2021), volcanology (Currenti et al., 2021; Klaasen et al., 2021; Nishimura et al., 2021; Jousset et al., 2022), underwater seismology (Spica et al., 2020a; Lior et al., 2021), and urban seismology (Dou et al., 2017; Spica et al., 2020b; Yuan et al., 2020). Perhaps one of the most well-studied distributed acoustic sensing (DAS) applications is cable deployment for data acquisition in boreholes. Measurements with a fibre-optic cable installed along the casing or behind the tubing are widely and successfully applied for borehole seismic data acquisition. 3D vertical seismic profiling (VSP) imaging results with permanent cable installation include applications for oil and gas exploration (Jiang et al., 2016; Shultz and Simmons, 2019; Zhan and Nahm, 2020), the monitoring of CO2 reservoirs (Humphries et al., 2015; Götz et al., 2018; Correa et al., 2019; Wilson et al., 2021), and mineral exploration and mining (Bellefleur et al., 2020). Nevertheless, in a vast number of already drilled and cased boreholes, only measurements with a wireline logging cable are feasible. Surveys with retrievable fibre-optic cable, such as the dataset collected for petroleum exploration in China near Tangshan, Hebei (Yu et al., 2016), are still quite unique and rarely found in the peer-reviewed literature.
Geothermal exploration sites pose additional challenges in terms of the requirements for the instrumentation. Fibre-optic cables have increased durability and are less subjected to corrosion compared to conventional sensors (Reinsch et al., 2015). Therefore, seismic data acquisition using DAS is becoming feasible for harsh conditions (elevated pressure, salinity, temperature, high acidity) for extended time periods. One of the essential aspects of EGS project development is microseismic monitoring during hydraulic fracturing. Lellouch et al. (2021) demonstrated that a vertical downhole DAS array could be successfully used in the subsurface with elevated temperatures up to 175 ∘C to detect low-magnitude earthquakes at a range of up to 10 km from the borehole location at the Frontier Observatory for Research in Geothermal Energy (FORGE) site in Utah. Fibre-optic cable buried at a depth of 0.5 m at Brady geothermal field allowed recording a substantial number of earthquakes and provided information on the evolution of the seismicity during geothermal plant operation (Li and Zhan, 2018). Using optical cables allows surveys with dense spacing, which are very expensive and often cost-prohibitive for geothermal applications in the case of data acquisition with conventional methods. A detailed image of the subsurface can be created using various seismic imaging techniques (Krawczyk, 2021). Nevertheless, DAS VSP surveys for geothermal are still rarely acquired (Miller et al., 2018; Trainor-Guitton et al., 2018). Miller et al. (2018) demonstrate limited results in the form of unmigrated seismograms with a maximum depth of 297 m. In the case of the 3D imaging results presented from the Brady geothermal field, the major difference is in depth, which is limited to 600 m in this case study (Trainor-Guitton et al., 2018).
Although there are a few examples of geothermal exploration applications, only one shallow geothermal VSP has thus far been reported in the literature with 3D imaging results. Constantinou et al. (2016) showed a test wireline DAS VSP dataset with a maximum surveyed depth of 2580 m MD acquired at the Rittershoffen geothermal site; however, there have not been any 3D imaging results reported from a deep geothermal well using wireline DAS VSP to the best of the authors' knowledge. Moreover, only a very limited number of publications on wireline DAS applications with active seismic sources can be found in the literature. Therefore, further thorough research on the evaluation of wireline DAS data in geothermal applications is needed.
This paper presents results from one of the first applications of DAS VSP for deep geothermal exploration at the Groß Schönebeck geothermal research site down to 4 km depth. First, we evaluate the acquired data and demonstrate the cable installation's influence on the data quality. Then, after a brief explanation of the processing flow, the 3D DAS VSP imaging results at Groß Schönebeck will be presented, followed by geological interpretation. In conclusion, we will focus on the deliverables of the 3D DAS VSP and how this can contribute to the characterization of the reservoir and geothermal exploration.
The in situ laboratory Groß Schönebeck is located in the Northern German Basin, one of Germany's main regions with deep hydrothermal resources. The joint research project RissDom-A (RissDominierte Erschließung in German: fracture-dominated exploitation) aims to gain expertise in sustainable energy production from low-permeability geothermal reservoirs by developing enhanced geothermal systems (EGSs). The Buntsandstein sandstone formation and volcanic rocks of Lower Permian (Rotliegend) (Fig. 1a) age are of interest for direct use in geothermal energy production (Blöcher et al., 2016). A successful geothermal exploration case study can lead to broader geothermal energy usage in the regions without hydrothermal potential. Moreover, the geological setting at the experiment site is typical for a broad part of northern Europe. Therefore, the acquired knowledge from this case study can be applied to geothermal exploration programmes in other areas with similar geological conditions.
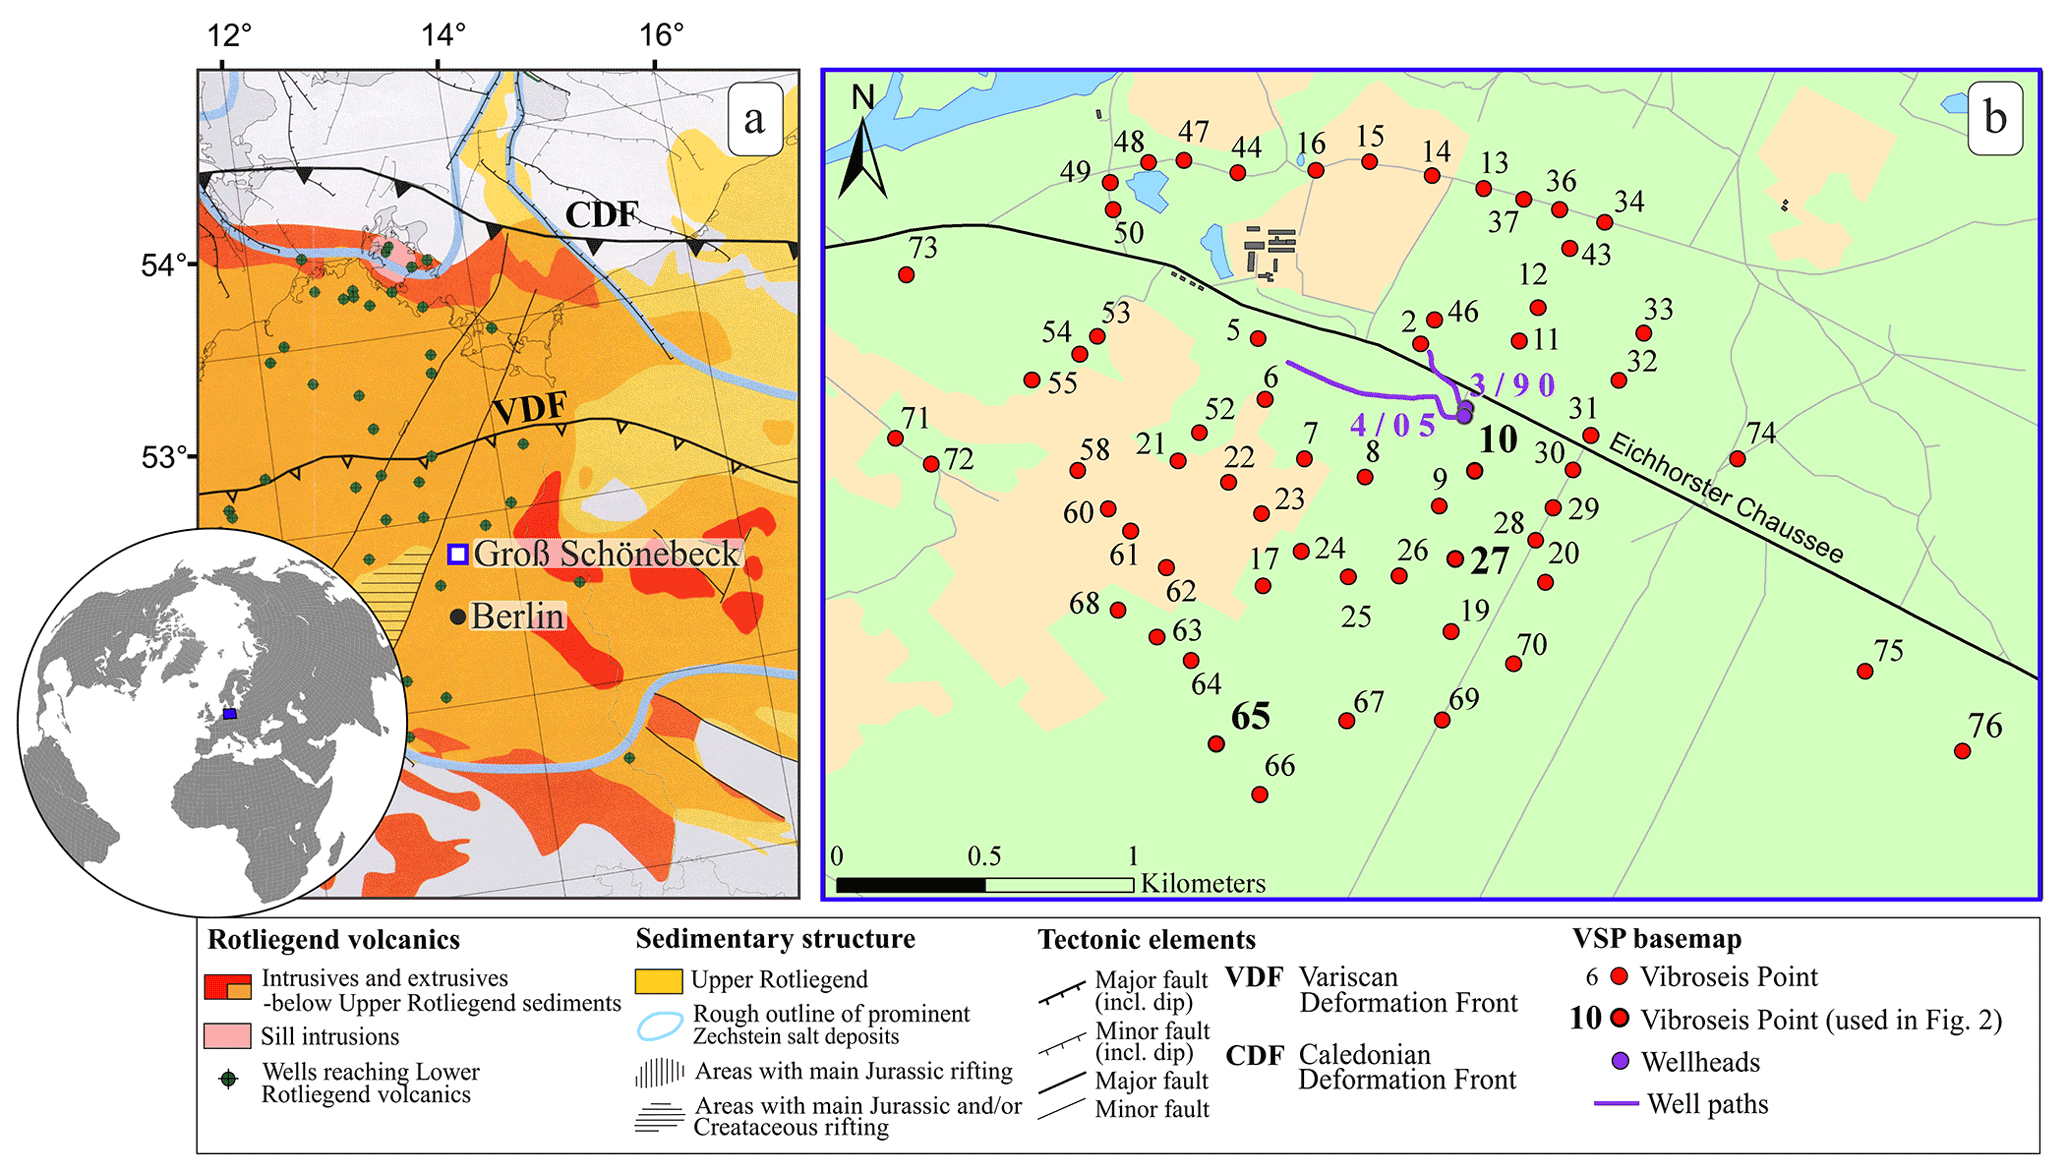
Figure 1Location of the Groß Schönebeck geothermal site. (a) Rotliegend volcanics and sedimentary distribution in the Southern Permian Basin (compilation from Krawczyk et al., 2019). (b) Base map of the Groß Schönebeck geothermal site with two boreholes (violet circles) in the centre and 61 VSP source points (red dots) arranged in a spiral pattern around the site.
To deepen the understanding of the geological structures interpreted on sparse vintage 2D seismic lines and locate possible faults within the area of interest, a high-resolution 3D reflection seismic acquisition campaign was carried out in February–March 2017 (Stiller et al., 2018; Krawczyk et al., 2019). The 3D surface seismic survey was designed to cover an area of 8 km by 8 km, focusing on target reservoir depth from 4 to 4.3 km. Since the studied geothermal reservoir zone is located at a depth greater than 4 km and overlaid by Zechstein salt, it is a challenging target for exploration with conventional seismic methods.
2.1 The distributed acoustic sensing vertical seismic profiling survey
In contrast to surface seismics, VSP has the advantage of shorter reflection travel paths. Therefore, the amplitudes are theoretically less subjected to attenuation. As a result, this provides a better signal-to-noise ratio and broader frequency content. Thus, to improve the resolution of seismic data, which is limited due to the thick salt layer (more than 1 km), and to provide detailed imaging around the existing boreholes, an extensive VSP experiment using wireline DAS technology was conducted prior to the main surface seismic experiment in February 2017. Two wireline hybrid cables (electrical and optical; Schlumberger – NOVA-F; GFZ – Rochester) (Henninges et al., 2011) were temporarily deployed and hanging freely with 1 m slack applied inside the casing of two deep water-filled boreholes. Nearly vertical well E GrSk 3/90 (maximum inclination 7.2∘), which was formerly used for oil and gas exploration, and Gt GrSk 4/05 (maximum inclination 49∘) form a geothermal doublet (Fig. 1b). Two heterodyne distributed vibration sensing (hDVS) interrogator units from Schlumberger were connected to single-mode fibres and used to record the strain along the boreholes with 5 m spatial sampling. A 20 m gauge length was used for data recordings in the field. Later, this value was adjusted to 40 m for E GrSk 3/90 according to the velocity profile in the reservoir section to get an optimal signal-to-noise ratio and preserve data resolution (Dean et al., 2017). Data recorded in Gt GrSk 4/05 were used with only 20 m gauge length due to the loss of the raw fibre optical data. Although the approach suggested by Dean et al. (2017) should help to optimize the data quality, a 40 m gauge length might be too high to detect small-scale features, such as fractures. Theoretically, a smaller gauge length is necessary for imaging small-scale details, such as fractures, but it comes at the expense of having a lower signal-to-noise ratio. More details on gauge length optimization for the dataset acquired at Groß Schönebeck can be found in Henninges et al. (2021).
The measuring campaign consisted of 1 start-up testing day and 3 data acquisition days in total. The 61 vibrator source points (VPs) had a spiral layout around the target area with varying offsets from 188 to 2036 m around the boreholes to ensure a good azimuth distribution (Fig. 1b). Due to budget limitations, the number of vibrator points had to be restricted and often positioned in such a way that they do not have overlapping ray-penetrating areas. As a seismic source, four heavy Mertz M12 Hemi 48 vibroseis trucks were used with a peak force of 200 kN (45100 Lbf) each. All source units vibrated simultaneously at each VP location and guaranteed an average vertical stacking fold of 16 per source location. A linear sweep of 10–112 Hz and 36 s length was used for data acquisition. Several VPs with larger offsets were recorded using a sweep from 10 to 96 Hz.
Due to the cable failure in Gt GrSk 4/05, the recording of the last 500 m in the reservoir section was lost, and the maximum surveyed depth is limited to 3716 m measured depth (MD). Moreover, we were only able to record 18 VPs from the originally planned 61 because the cable was retrieved from the borehole after only 1 d of acquisition. This event led to significantly reduced subsurface coverage of the survey design between the two wells. In E GrSk 3/90, we recorded the planned 61 VPs and the maximum surveyed depth is at 4251 m MD. Nevertheless, recorded datasets from the second borehole have inconsistent amplitudes. This behaviour could be related to the local repositioning of the cable inside the borehole since similar reduced-amplitude patterns were observed in the recordings with extra slack provided to the cable (see Henninges et al., 2021). Further research is required for a systematic understanding of the effects qualitatively explained here. Overall, all mentioned details make this dataset acquired at the Groß Schönebeck geothermal research site very challenging for data processing. We will focus on the processing flow in the next section of the paper, which we used to successfully identify reservoir details.
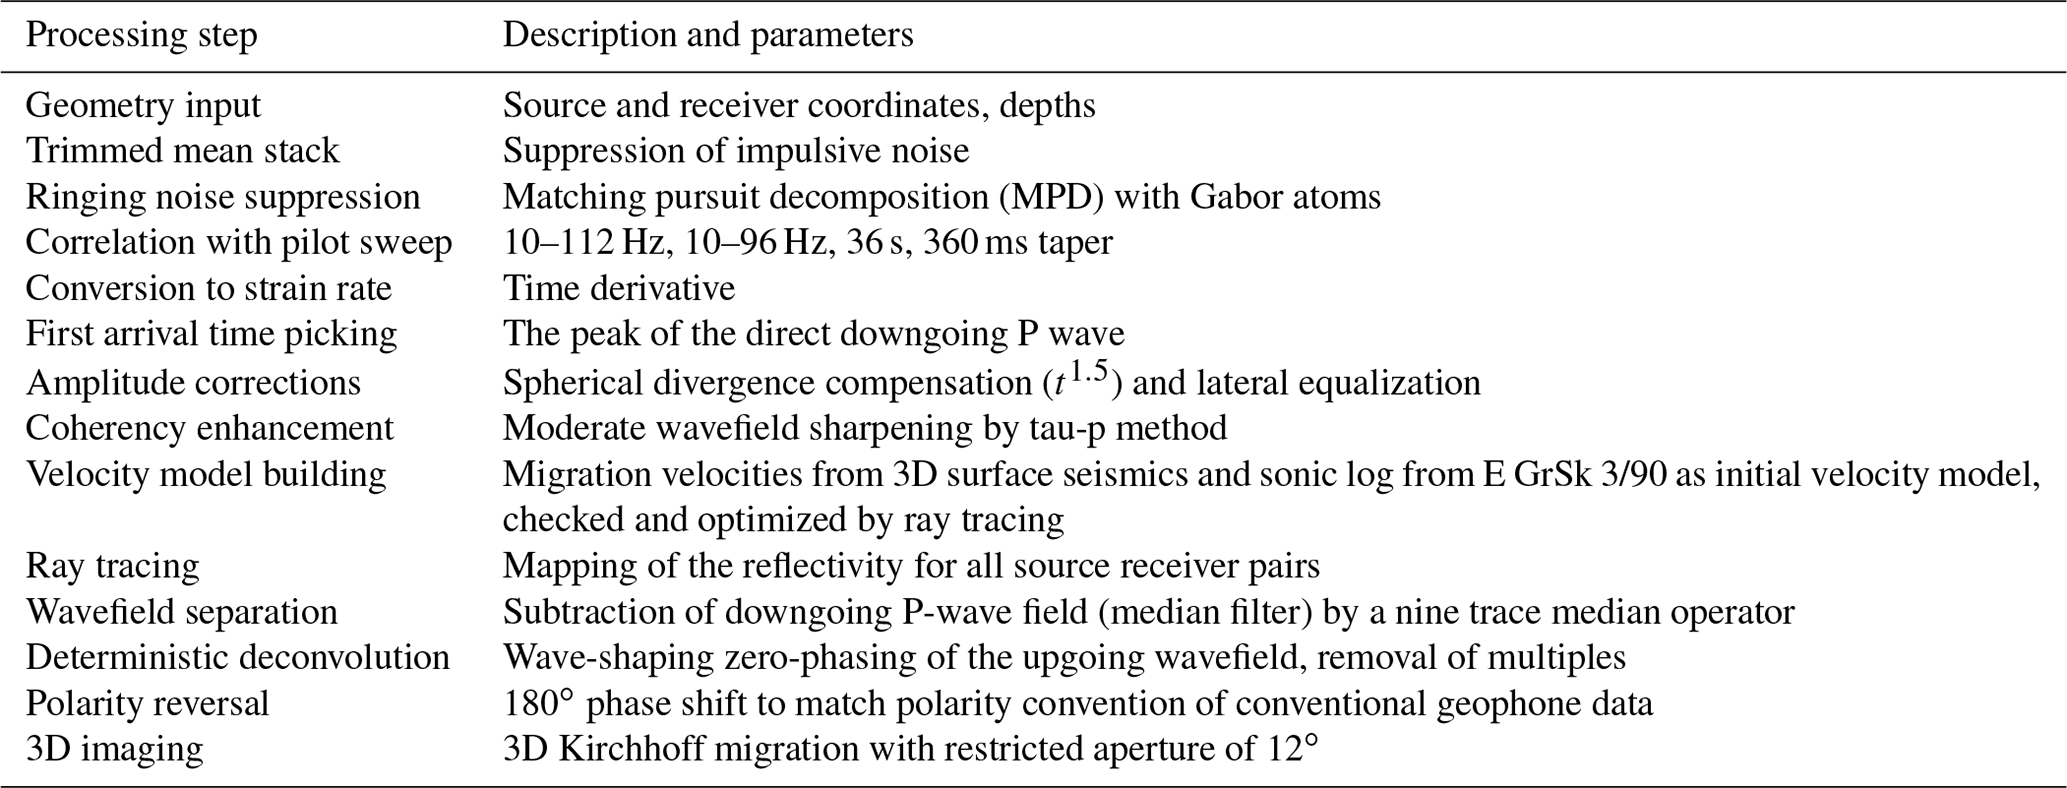
For the 3D DAS VSP dataset a processing flow containing typical elements was adapted to the Groß Schönebeck survey specifics and then applied to the data (see Table 1). The major steps and parameter details are discussed in the following subchapters.
Table 13D DAS VSP data processing flow for wells E GrSk 3/90 and Gt GrSk 4/05.
3.1 Data conditioning
As a first step the proper geometry was assigned to the raw uncorrelated data, which included source and receiver coordinates, elevations, and true vertical depths calculated using borehole trajectories. Each VP recording set contained a various number of recorded sweeps ranging from 12 to 37. Data within each VP were sorted on increasing MD and vertically stacked using a trimmed mean stack, which helped to exclude amplitude outliers. Wireline records are frequently suspected to ringing noise, which represents a standing wave phenomenon, occurring in depth intervals of the boreholes where the cable can move freely (Martuganova et al., 2021). This type of noise creates resonances with a fundamental frequency and higher overtones in the amplitude spectrum.
Figure 2 shows selected VPs with variable offsets such as 214, 510, and 1411 m for the borehole E GrSK 3/90 after pre-processing (vertical stacking, correlation with the pilot sweep, and subsequent differentiation) and denoising. All seismograms have a distinct P-wave arrival (Fig. 2, blue arrows); however, they are heavily dominated by coherent characteristic striped or zigzag noise. For instance, depth intervals 904–980, 1588–1816, and 2066–2372 m for VPs recorded in E GrSK 3/90 are contaminated by this type of noise (Fig. 2, red arrows panels a–c). It appears that the noise distribution does not change significantly from one VP to another and affects shallower depth regions more than the deeper ones. Also, it can be noted that borehole Gt GrSk 4/05 has more noisy intervals in comparison with E GrSK 3/90 and with higher amplitudes, for example for depth regions at 873–980, 1697–1848, 2025–2177, 2898–3017, and 3330–3409 m (Fig. 2, red arrows panels g–i).
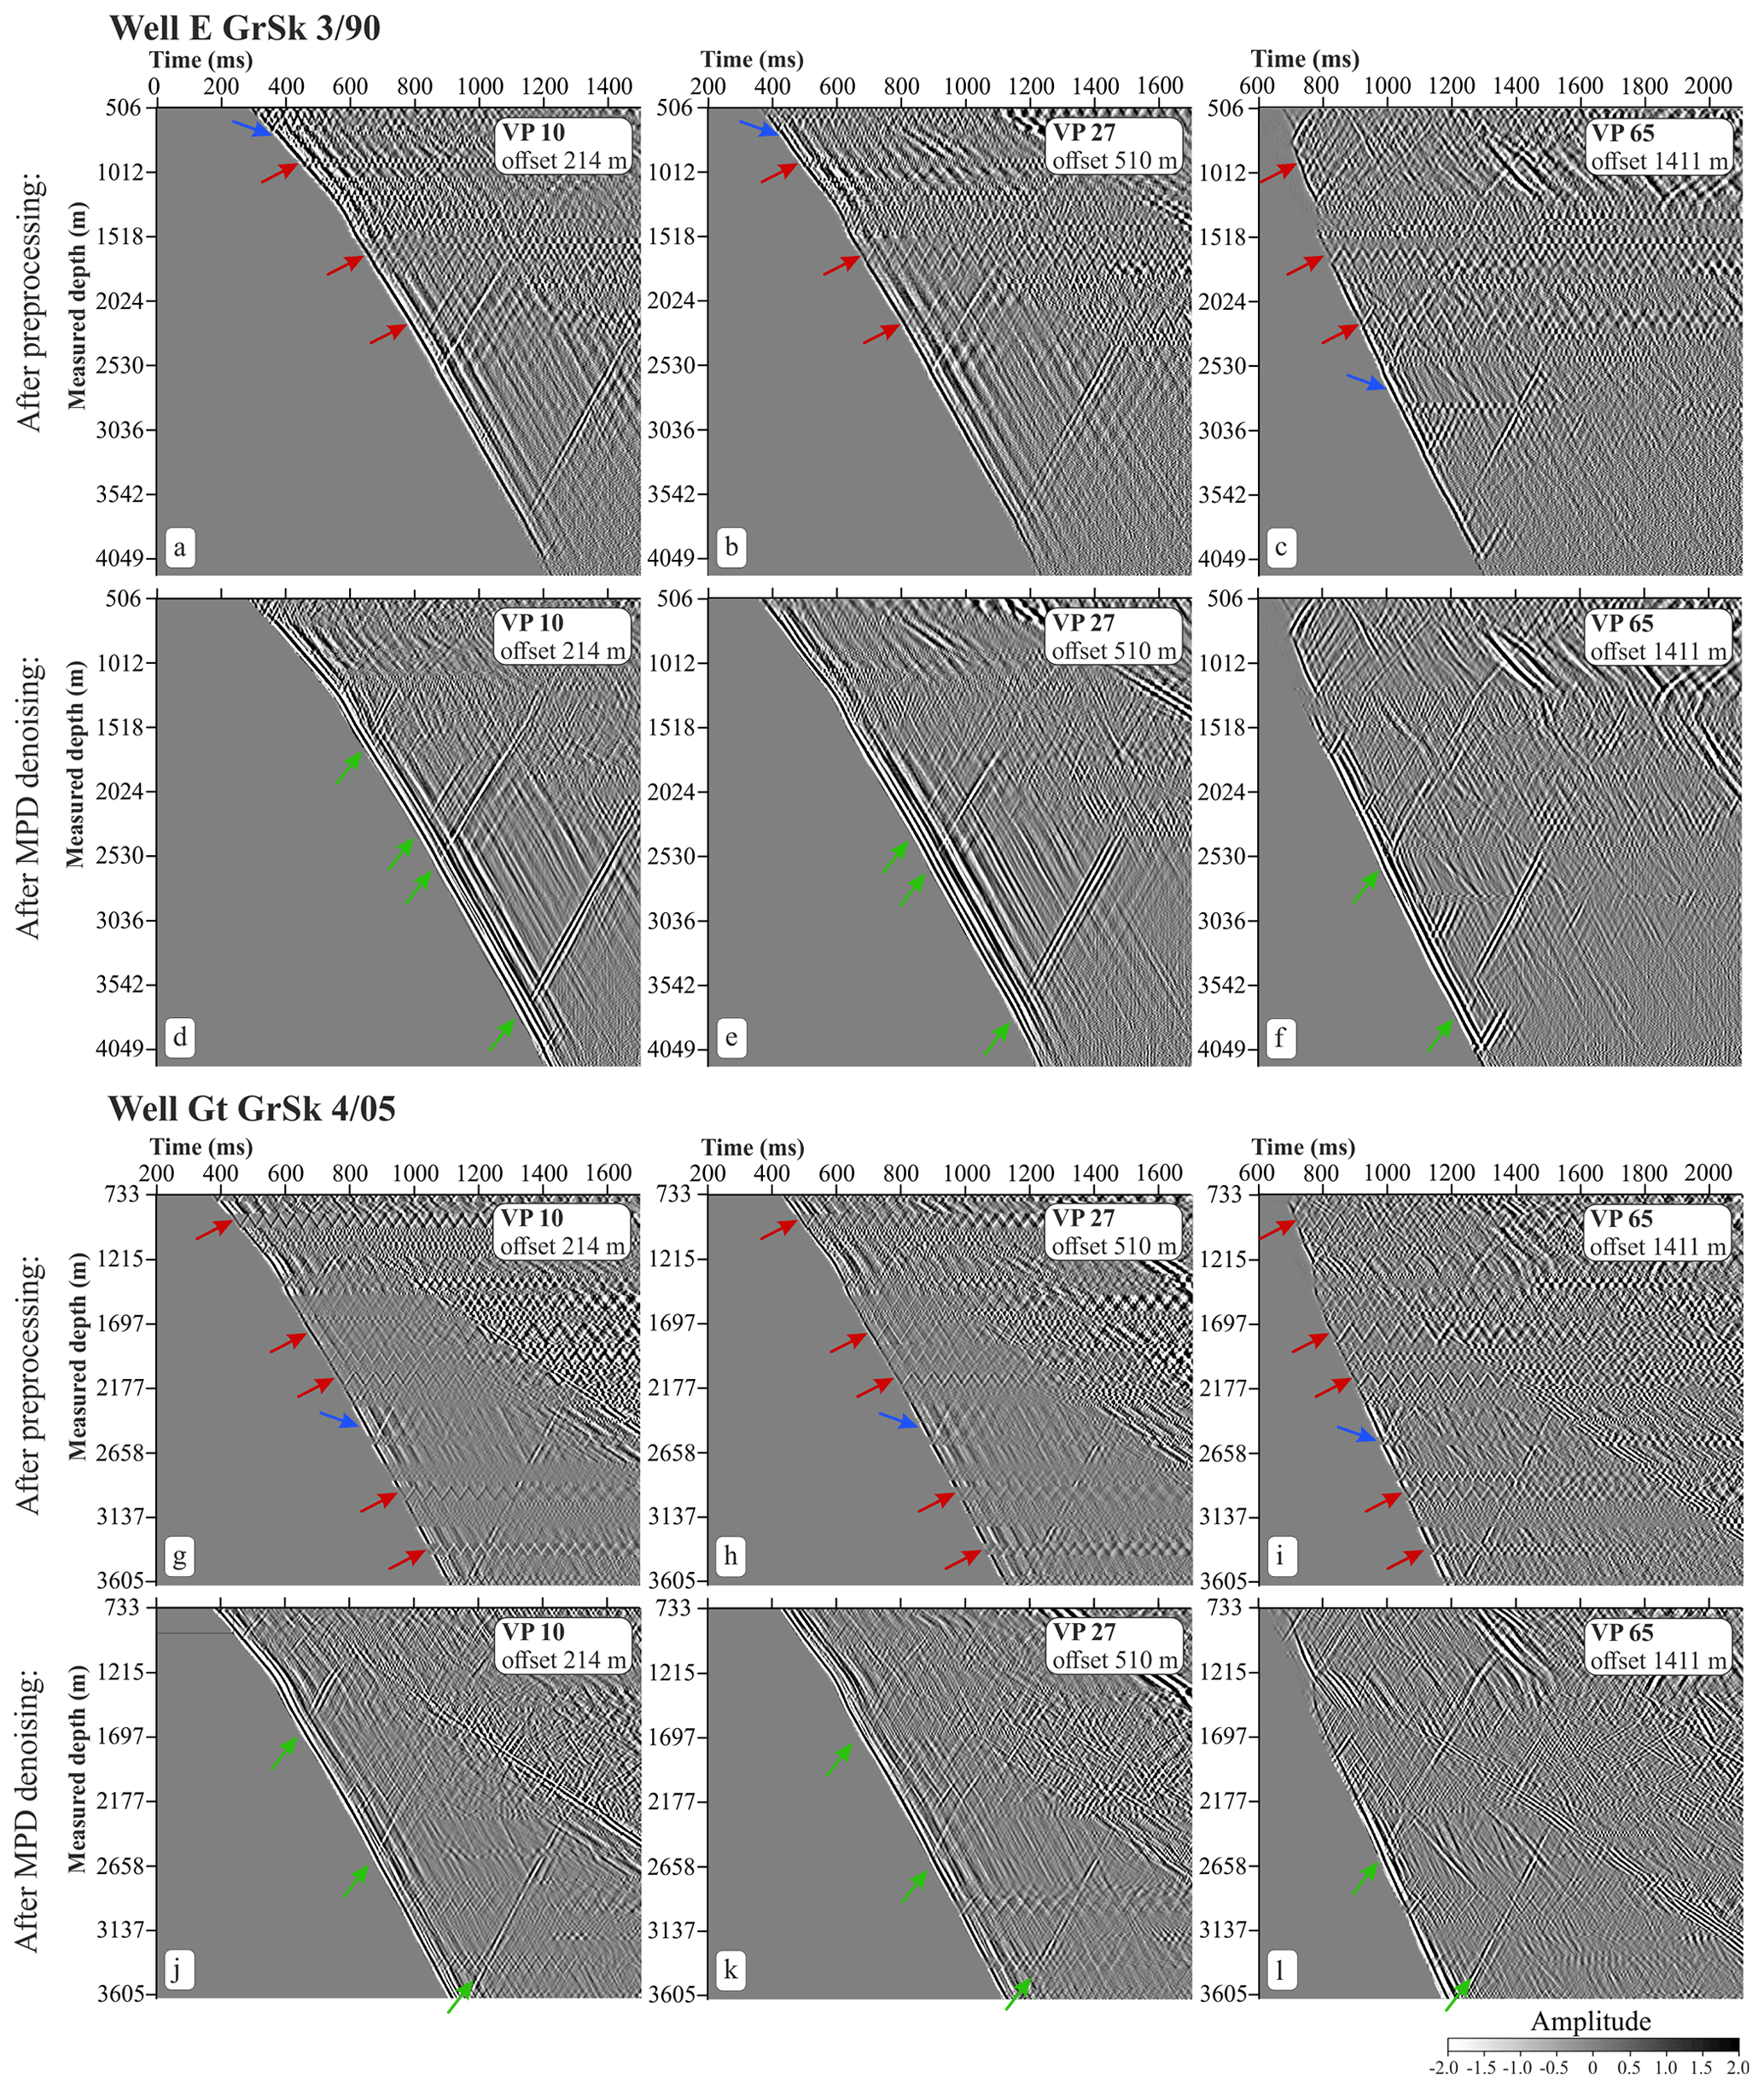
Figure 2Common-source gather displays for different source positions with offsets of 214, 510, and 1411 m after pre-processing (a–c) for well E GrSk 3/90 and (g–i) for well Gt GrSk 4/05; after noise subtraction using the MPD denoising method and a moderate coherency enhancement (d–f) for well E GrSk3/90 and (j–l) for well Gt GrSk 4/05. Arrows are colour-coded as follows: direct downgoing P wave (blue), upgoing reflected P–P waves (green), and intervals affected by ringing noise (red).
Ringing noise clearly represents a challenging problem and should be tackled by means of data processing. We did a few denoising tests using different denoising approaches, including Burg adaptive deconvolution (Burg, 1972, 1975) and time–frequency domain attenuation (Elboth et al., 2008). The optimal denoising result was achieved using a novel approach based on matching pursuit decomposition (MPD) using Gabor atoms, as described in Martuganova et al. (2021). According to this method we formed an overcomplete Gabor dictionary to decompose the original signal. Then using atomic parameters such as amplitude, frequency, and position in time we determined parts of the signal representing slapping of the cable and subtracted them from the data to perform the denoising. To improve the signal-to-noise ratio of the data we applied the MPD denoising method after stacking, but before correlation to avoid smearing the noise by the correlation process. The results of denoising for two boreholes are given in Fig. 2 in panels d–f and j–l for E GrSK 3/90 and Gt GrSk 4/05, respectively. MPD denoising eliminated almost all noise on the seismograms and significantly improved traceability of the reflections (Fig. 2, green arrows panels d–f and j–l), which are no longer obscured by the ringing noise.
After denoising, the correlation with the pilot sweep and time differentiation to convert data to the strain rate were applied to the data. This was followed by amplitude corrections (spherical divergence correction and lateral equalization) and moderate wavefield enhancement. Also, measured depths were converted to true vertical depth below seismic datum elevation (TVDSD), and later in the text, we refer to it as depth.
3.2 Velocity model building and ray tracing
Several independent data sources were used to determine the velocity function for main stratigraphic layers of the region and assign appropriate P-wave velocities (Fig. 3). First, velocity profiles recorded at a zero offset source position were calculated with the Lizarralde smooth inversion method (Lizarralde and Swift, 1999) to get the main trend (Fig. 3a black curve). Then, velocity values were updated according to calibrated sonic log data (Fig. 3a thin grey curve) and the surface seismic velocity cube (Fig. 3a, dark blue curve). The model was checked using the ray-tracing results calculated in commercial software VSProwess X (VSProwess Ltd.) and iteratively optimized to minimize the drift between the recorded and modelled arrival times for the rig shot at source position 10.
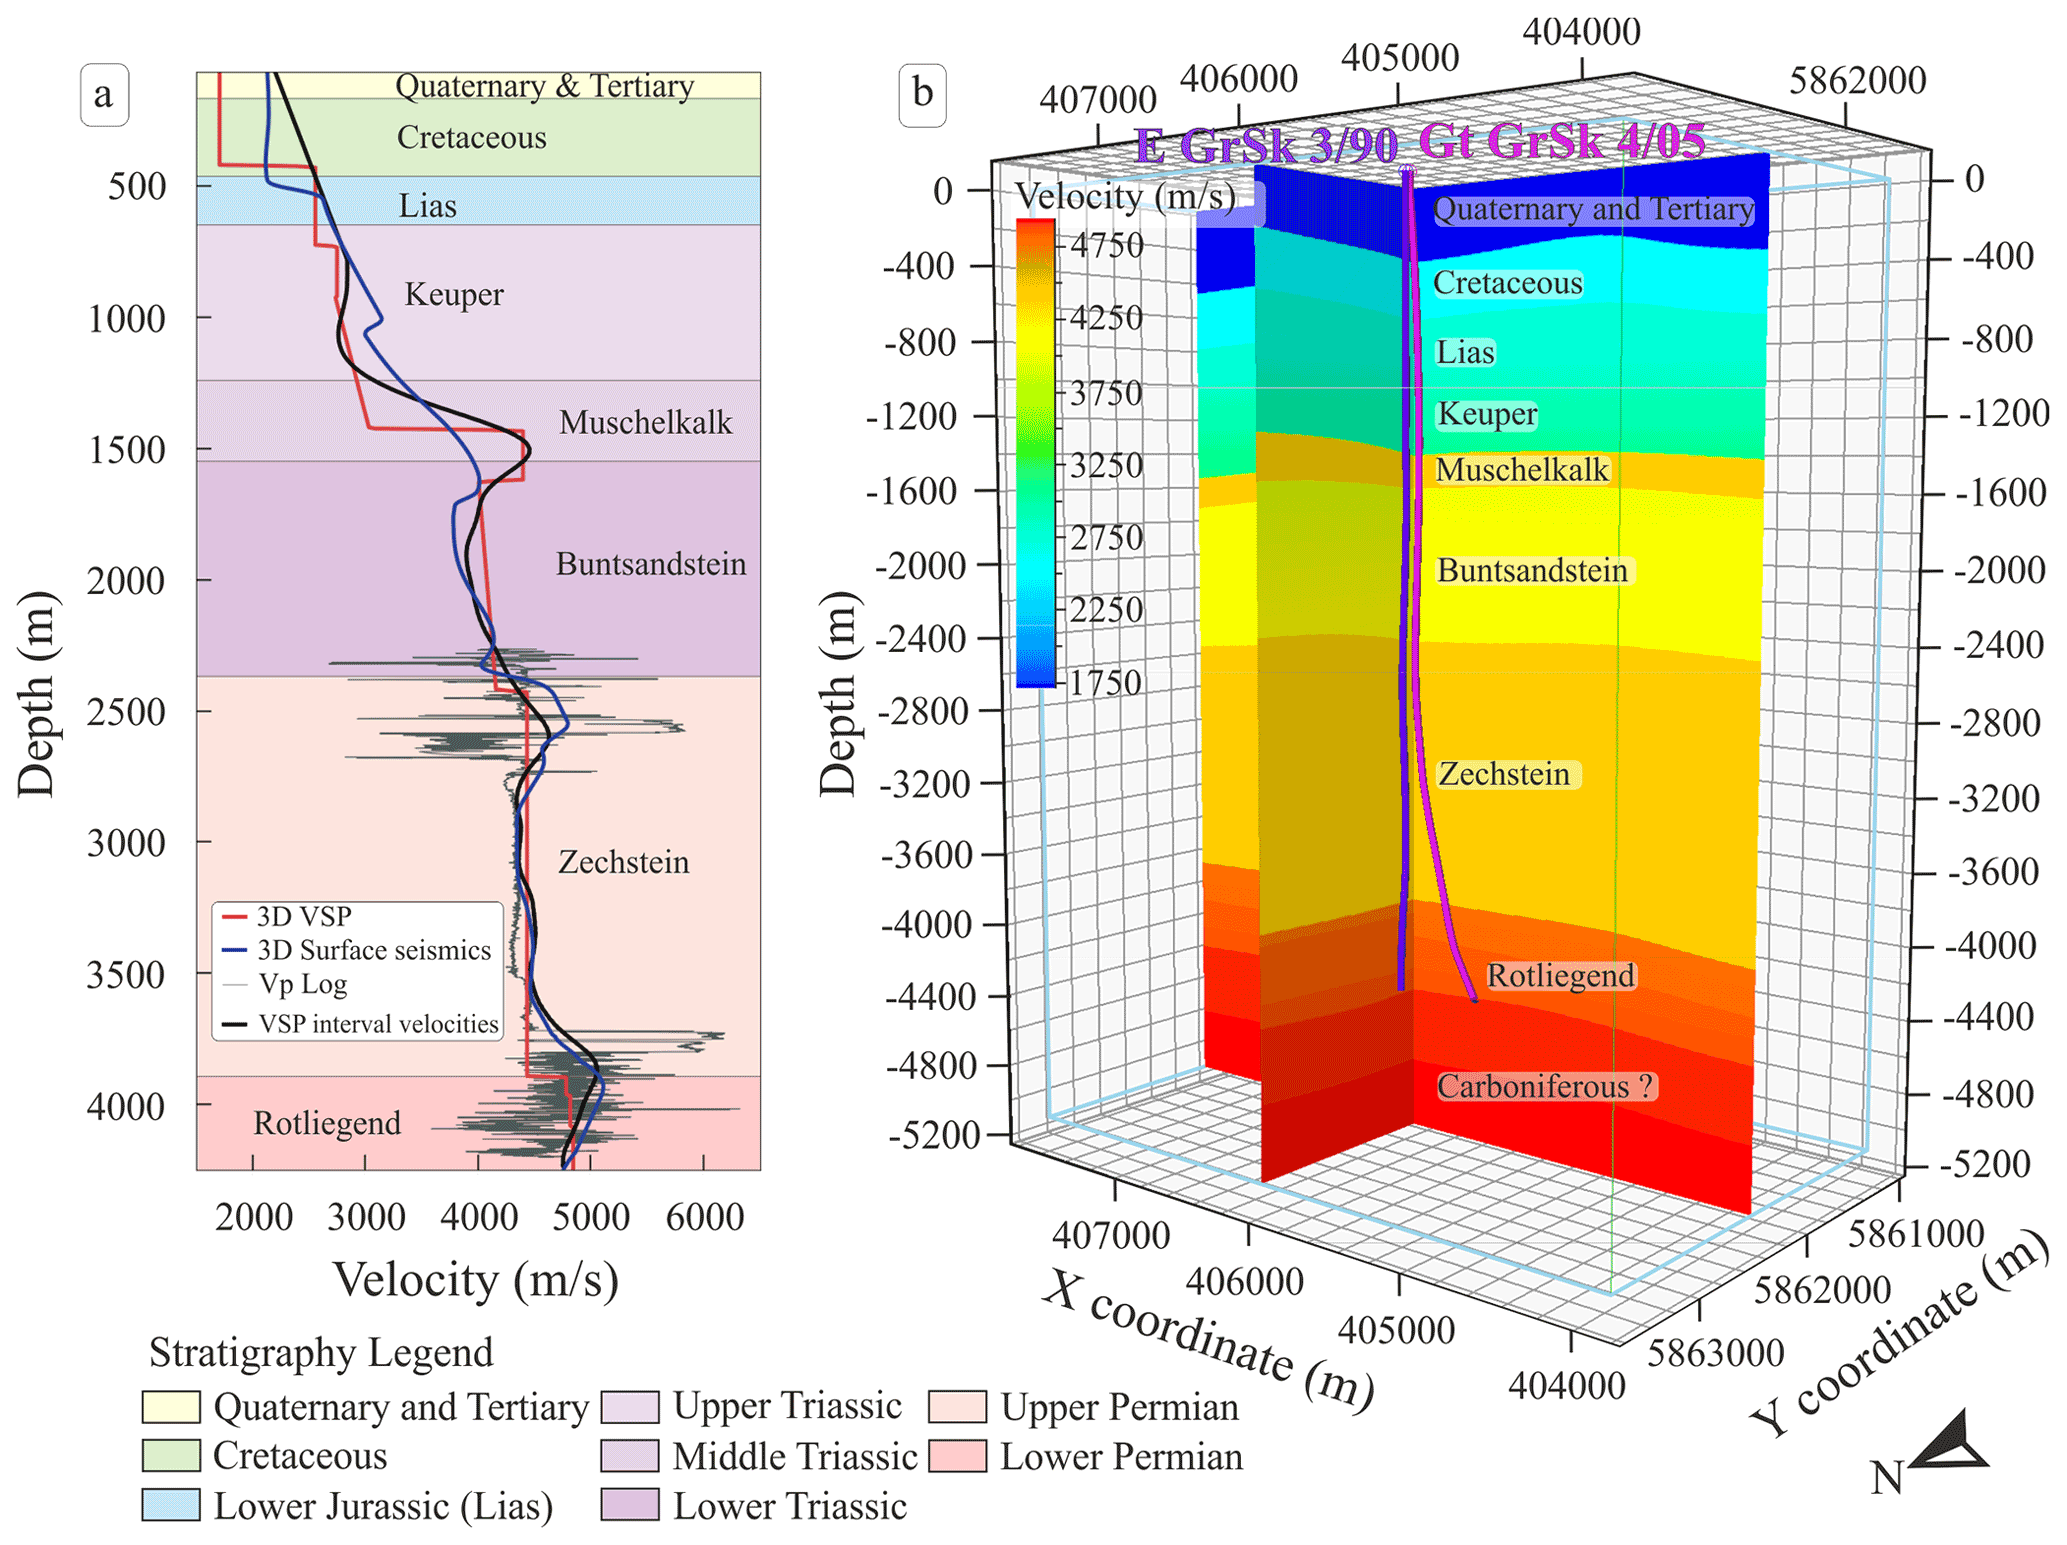
Figure 3Velocity information at the Groß Schönebeck research site. (a) Velocity functions at the borehole E GrSk 3/90 location. Red line – the curve extracted from the 3D DAS VSP velocity model shown in (b); dark blue line – the curve extracted from the 3D velocity model used for the 3D surface seismic prestack depth migration; thin grey line – sonic log measurement; thick black line – VSP interval velocities derived from the first break peaks using the method of smooth inversion after Lizarralde and Swift (1999). (b) 3D DAS VSP velocity model created using top formation surfaces to build an initial velocity model, which was then checked and optimized according to ray-tracing results.
To improve the fit for far offset VPs a small anisotropic drift was included in the model. Thomsen's P-wave anisotropy parameters (Thomsen, 1986), namely ϵ and δ for transversely isotropic (TI) media, of 4 % δ and 16 % ϵ were selected for all layers down to the top salt. These parameters were tested and optimized only using DAS VSP data, which allowed reducing the standard deviation of drift for the longer offset VPs. Finally, all VPs were ray-traced through the constructed model, and reflection points (loci) for each source–receiver pair were extracted. The picked arrival times were compared with the ray-traced times to check whether the smallest misfit for all available data was achieved. The average of the mean model drift for all VPs is 2.43 ms for the borehole E GrSk 3/90 and 7.7 ms for Gt GrSk 4/05.
The layered 3D DAS VSP velocity model follows the geological model (Moeck et al., 2009) and has constant layer velocities or vertical velocity gradients indicated by the sonic log data (Fig. 3a red curve; Fig. 3b). Potential lateral variations are not accounted for. The values vary from 1750 m s−1 in the Upper Quaternary and Tertiary layers to 5000 m s−1 in the Rotliegend (Permian) reservoir section.
3.3 Data preparation for migration
The next processing step includes wavefield separation and deconvolution. To separate the upgoing wavefield the downgoing P-wave field was subtracted using a median filter. We tested a few different wavefield separation techniques (FK transform, FP transform), and the cleanest result was obtained by applying the median filter. This filter delivered a cleaner residual upgoing response with less smearing of the amplitude artefacts and also preserves the resolution of data. Prior to deconvolution, the upgoing wavefields were scaled by −1, changing the polarity of DAS data to match the required European convention (increase AI = negative number on a trace.) The separated wavefield was deterministically deconvolved using individual downgoing responses as trace-by-trace operators, followed by a bandpass filter at 8, 12–70, and 80 Hz as well as a front mute.
To further prepare the data for imaging, source static corrections were applied. Additionally, data were moved to pre-migration depth using a model-based stretch to map points according to reflection-point loci. Due to significant data quality variations between shots caused by unknown changes in the response of the fibre, the amplitudes across all data points were normalized using root mean square (rms) amplitude values calculated in a depth window selected on the most prominent salt sequence reflection event. Each trace then was scaled by the inversed rms trace value. The resulting pre-migrated seismograms were used as input for 3D imaging.
3.4 3D imaging
For imaging, a commercial 3D Kirchhoff migration algorithm (VSProwess Ltd.) was used. Calculated via ray tracing, the reflection-point loci for each source–receiver pair are interpolated and used to map each processed sample to its modelled image point coordinate. This is routinely known as VSP common depth point (CDP) mapping (Dillon and Thomson, 1984). Once the reflectivity is mapped approximately to the correct location it can be binned. An efficient surface tracking algorithm is used to find all bins within the specified aperture angle intersected by the reflection ellipsoid.
For migration, we used a 12.5 m×12.5 m horizontal and 5 m depth bin size. After extensive testing, we chose a 12∘ aperture, which allowed summing the main reflections best and preserving image details. In addition, the migration operator removed some of the imaging artefacts. A scaled version of each mapped sample is summed into each of these bins (normally cos-squared window). A by-product of migration is a bin count cube. A 3D bin density image along two lines and the depth slice at 4100 m are shown in Fig. 4. This 3D visualization discloses holes in the seismic coverage at 4100 m depth. Gaps in coverage are particularly noticeable east of the observation well. To avoid imaging artefacts, bin density information was first used to normalize amplitudes in the 3D DAS VSP volume. Afterwards, the bin density information is utilized to identify high-uncertainty areas where the image fold is sparse and to clip the resulting cube in accordance with it. Furthermore, the bin density cube was employed to determine an area with a reasonable coverage (Fig. 4a, dark blue polygon) for further clipping of horizon maps.
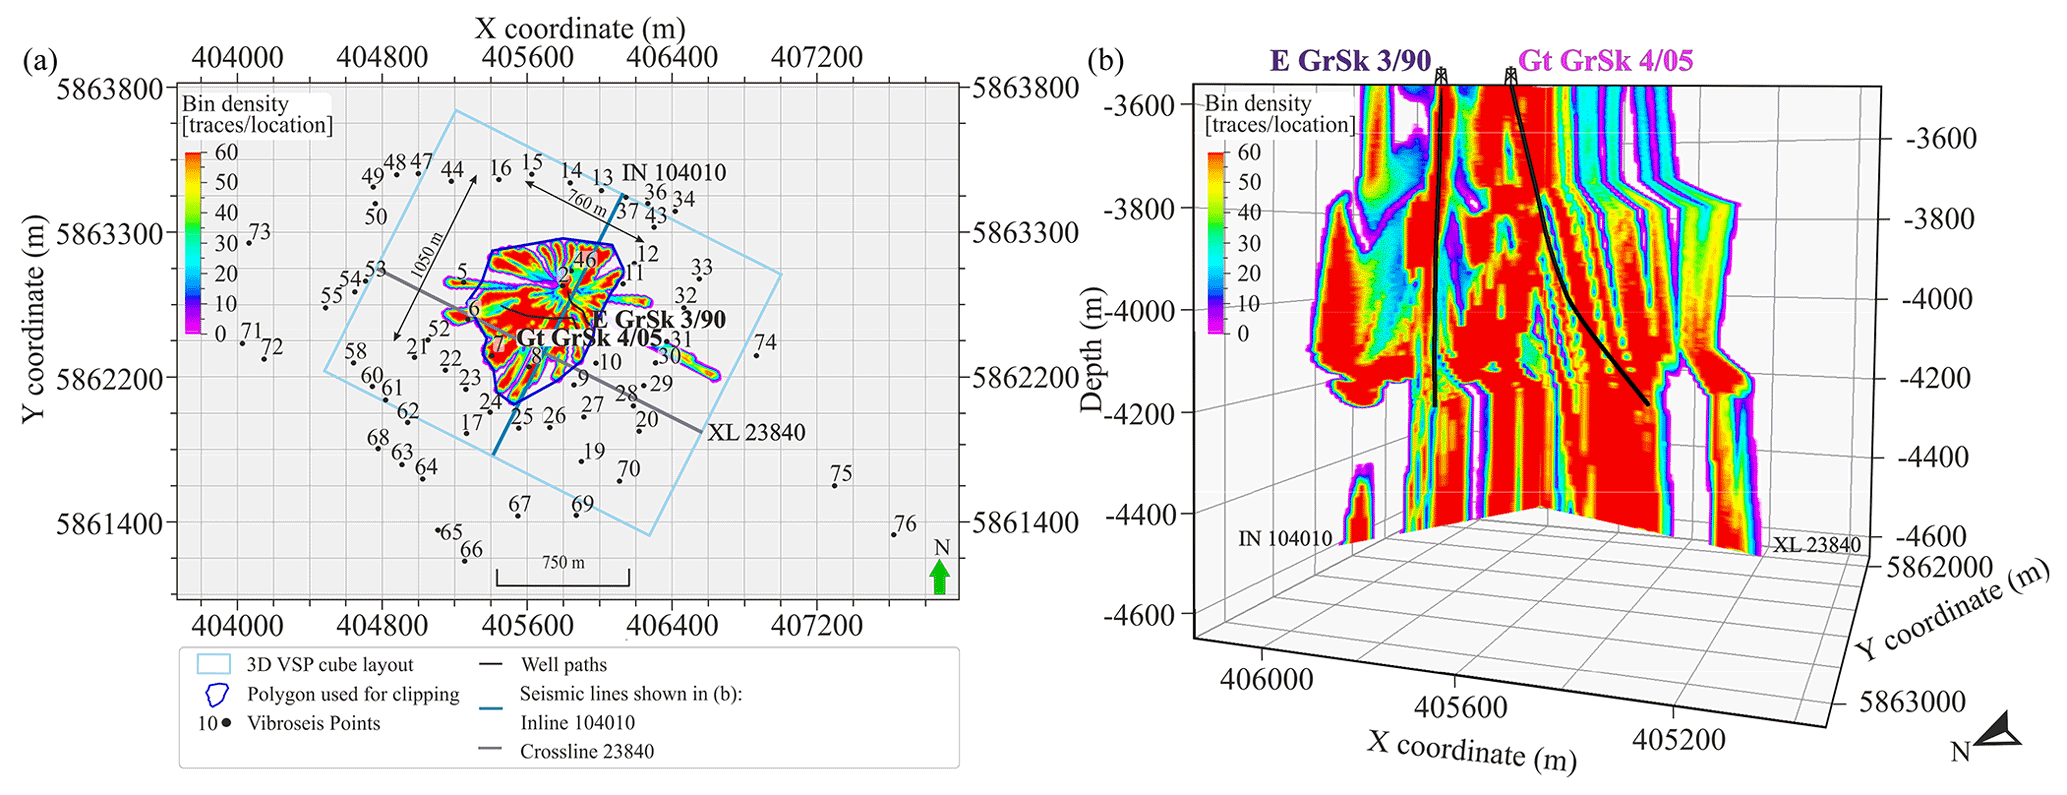
Figure 4Examples of the ray coverage for the study area. Depth slice of a 3D bin density volume at 4100 m depth (a). 3D visualization of two seismic lines in the 3D bin density cube (b) (for location see a).
The suppression of the ringing noise by means of MPD denoising and amplitude normalization techniques significantly improved the imaging results. Figure 5a shows the result of the migration, which excludes denoising from the processing flow. The first problem that can be noticed involves inconsistent significant amplitude anomalies, which is especially clearly visible around borehole Gt GrSk 4/05 (Fig. 5, blue ellipse) in the reservoir section from 4000 to 4500 m depth. Apart from that, the “noisy” cube has decreased resolution and horizon continuity in comparison with the “clean” cube (Fig. 5, orange arrows).
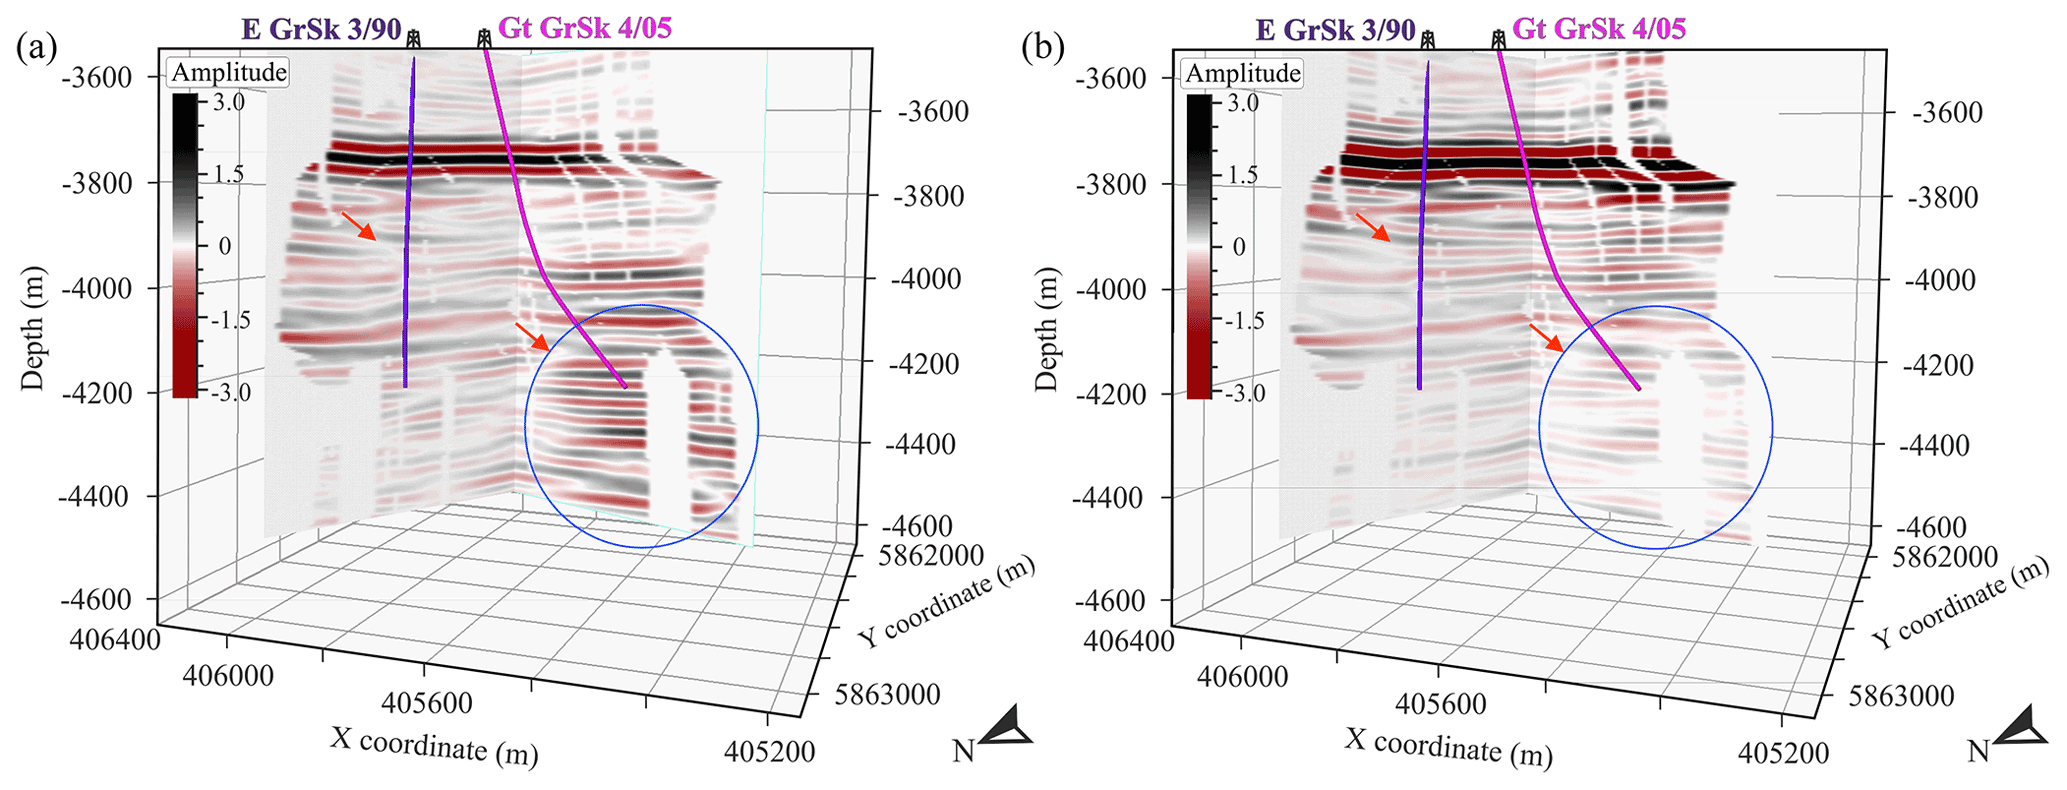
Figure 5A comparison of 3D DAS VSP cubes generated with a model-based Kirchhoff migration algorithm (a) without and (b) with MPD denoising.
The resulting 3D DAS VSP cube image is 1600 m×2000 m, which has a relatively limited illumination range with a maximum extent of 760 and 1050 m along the inline and crossline direction, respectively (extension estimated based on polygon for clipping; Fig. 4). The image of the subsurface is the most complete and best around the boreholes. Reflections in the vicinity of the wells reach up to 4500 m depth (Fig. 6). To interpret the 3D DAS VSP imaging results (Fig. 6a), we compare them with the 3D surface seismic cube (Krawczyk et al., 2019; Norden et al., 2022) after prestack depth migration (Fig. 6b). The polarity of the DAS data was changed to match the polarity of the geophones. The 3D surface seismics were restricted according to the 3D DAS VSP cube layout. Bin size for borehole volume is 12.5 m×12.5 m and for surface seismic volume is 25 m×25 m. This means that inlines and crosslines of the 3D DAS VSP cube are 2 times denser.

Figure 6A comparison of the 3D DAS VSP cube (a) and prestack depth-migrated 3D surface seismic cube (b). Arrows with numbers highlight major interpretation features in the 3D DAS VSP and 3D surface seismic cubes. Light green arrows (1) point out the difference in seismic resolution in the Upper Rotliegend; dark blue arrows (2) show the position of the Elbe reservoir sandstone horizon. Dark grey arrows (3) mark the location of unconformity in the Lower Rotliegend formation. Main seismic reflectors labelled on the figures: top Staßfurt–Basalanhydrit Fm. (Z1), top Rotliegend (Z3), within Mellin–Schlichten (R1), within Dethlingen Fm. (R3), top ESR – top of Elbe sandstone reservoir, base ESR – base of Elbe sandstone reservoir, R8 – base effusive Rotliegend.
The reservoir section is situated at a depth interval of 4–4.5 km and has an average velocity around 4700 m s−1; the dominant frequencies in 3D surface seismics are between 25 and 47 Hz. With wireline 3D DAS VSP the frequencies are from 34 to 73 Hz. Vertical seismic resolution can be estimated as a quarter of the wavelength (λ), which depends on velocity (V) and frequency (f) as follows:
This gives a vertical resolution estimation of 25–47 m for the conventional surface seismic cube and a more favourable 16–34 m for the borehole seismic dataset.
Several reflectors can be mapped with high confidence across both volumes. The main marker horizons of the typical stratigraphy in the Northern German Basin were successfully imaged (Fig. 6): top Staßfurt–Basalanhydrit Fm. (Z1), top Rotliegend (Z3), within Mellin–Schlichten (R1), within Dethlingen Fm. (R3), the top and the bottom of the Elbe sandstone reservoir (top ESR, base ESR), and possibly the top of the Carboniferous (R8). Although both cubes have similarities, there are distinct differences related to the higher vertical resolution of the VSP measurements. In the following chapters we will focus on each structural feature separately.
4.1 Upper Rotliegend horizons
The most prominent reflections in both seismic cubes are closely situated reflection bands from the transition from salt to anhydrite (Staßfurt–Basalanhydrit Fm. – Z1), followed by the reflection Z3 from the base of Zechstein. Together these closely situated seismic responses create a complex wavelet superimposition consisting of five phases (Fig. 6). Characteristic Zechstein reflections are most clearly visible in Fig. 7, which shows a seismic cross-section extracted between two boreholes with well logs (gamma ray – GR, bulk density – RHOB, and sonic velocity – Vp), lithology data, and stratigraphy. Salt layers are underlaid by Upper Rotliegend sediments.
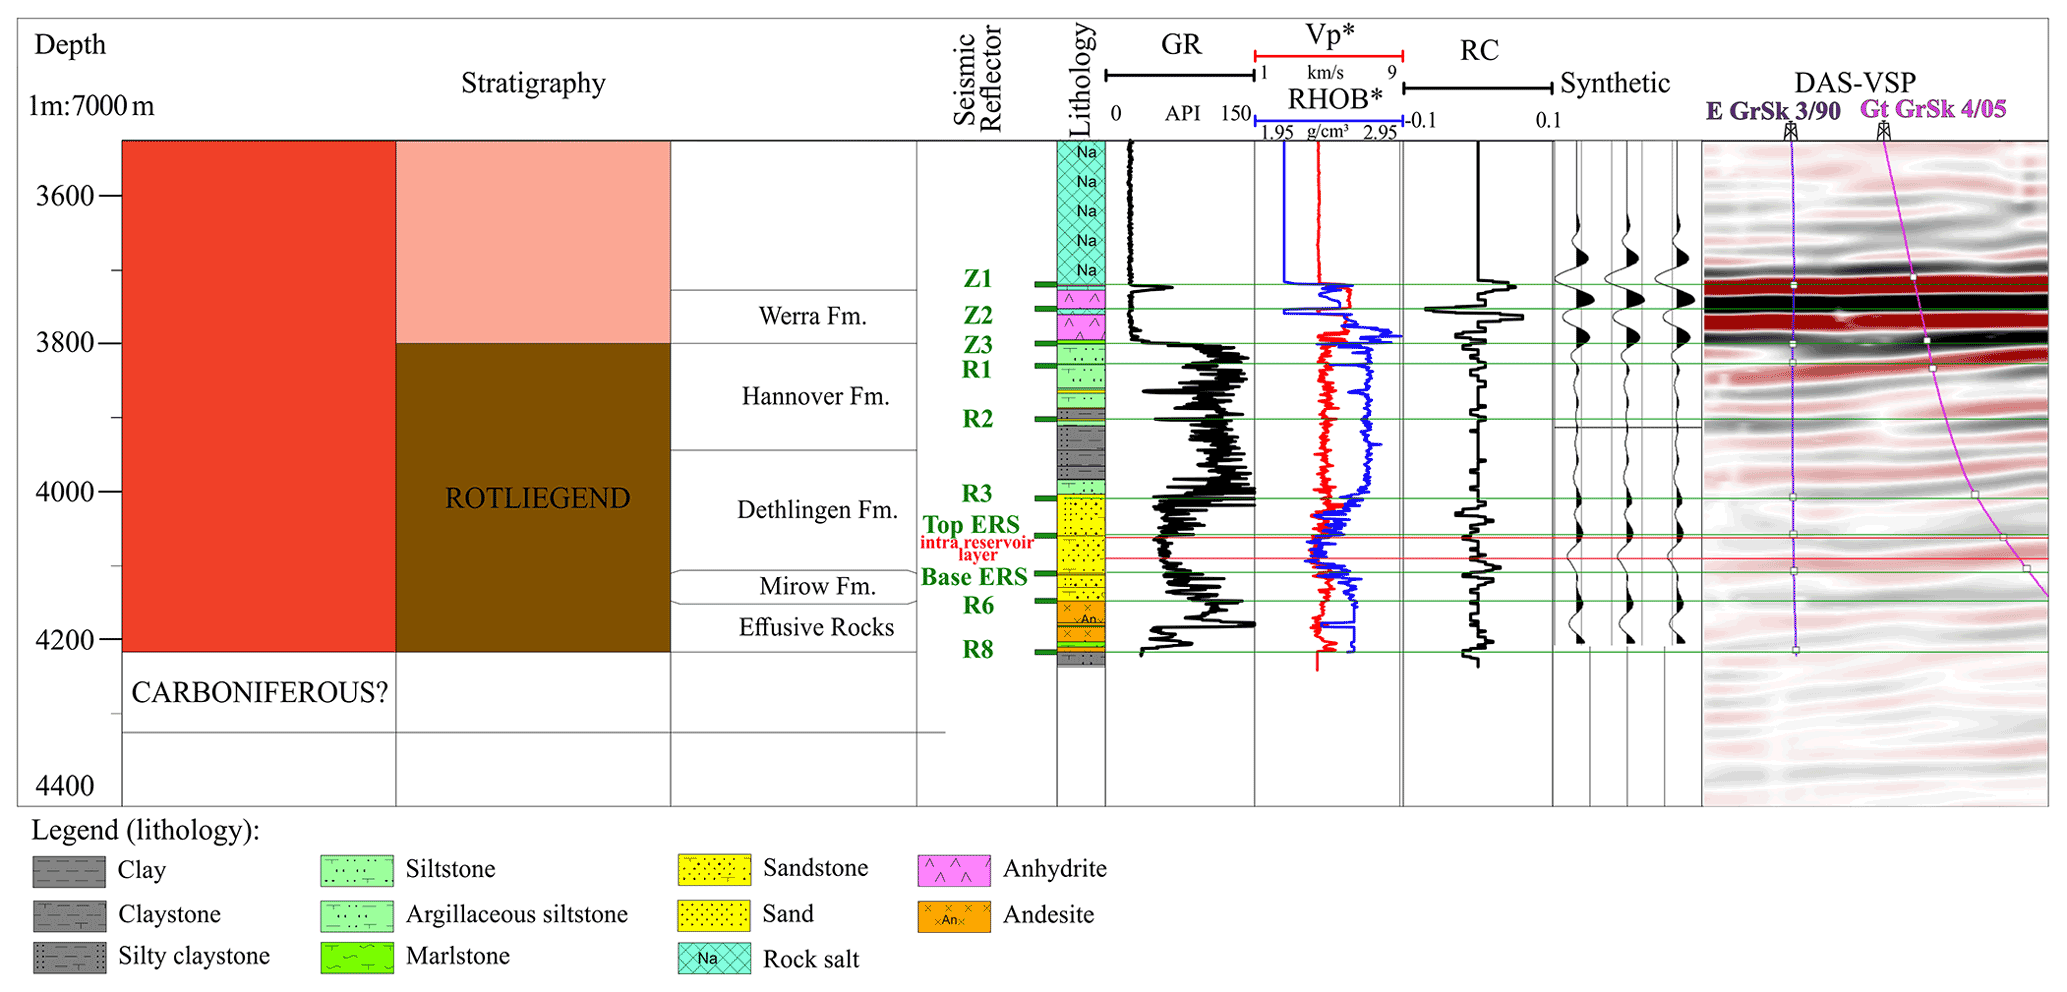
Figure 7DAS VSP seismic cross-section through the boreholes plotted together with well logs (GR: gamma ray, Vp: sonic velocity, RHOB: bulk density), lithology, stratigraphy, reflector coefficient (RC), and synthetics.
Göthel (2016) refer to seismic horizons in Rotliegend as “phantom horizons”, since they are highly variable in depending on regional geological settings and do not have a reliable definition. For the first time in the area of the research platform Groß Schönebeck, borehole seismics allow the separation of thin interlaying of siltstone and silty mudstone structures in the Upper Rotliegend sediments in the depth range from 3800 to 4000 m (Fig. 6a, light green arrow – 1). On the 3D surface seismics (Krawczyk et al., 2019; Norden et al., 2022) a thick unresolved high-amplitude continuous layer with visible thickness variations can be observed at approximately 3900 m (Fig. 6b, light green arrow – 1). In contrast to the 3D surface seismic cube, on the 3D DAS VSP cube, two closely situated thin layers can be traced with a relatively constant thicknesses (Fig. 6a, light green arrow – 1).
By comparing the depth sections between 3800 and 4000 m on both cubes, it can be noted that thin interlaying horizons in the 3D DAS VSP cube have various dipping characteristics, whereas the 3D surface seismic cube shows only thicker horizontal lines, sometimes even not continuous and with amplitude variations along them. This might be related to the difference in the frequency content of surface and borehole seismic surveys, as a result with the latter case having a higher resolution. The results of 3D DAS VSP imaging allow tracing a few thin horizons in the Upper Rotliegend interval.
Figure 8 demonstrates an inline and a crossline extracted from the central part of the seismic cube with interpreted horizons corresponding to reflections within Mellin–Schlichten (R1) and within Dethlingen Fm. (R3). A negative amplitude event associated with a sandstone interlayer inside siltstone sediments of Hannover Fm. around the depth of 3800 m could be followed throughout the DAS VSP volume and is interpreted as reflector R1 (Göthel, 2016; Moeck et al., 2009). There is a decrease in gamma-ray, neutron porosity, and Vp logs at this interval, resulting in decreased acoustic impedance values (Fig. 7). A positive amplitude event at a depth of 4010 m is mapped as the reflector R3 (Henninges et al., 2021; Norden et al., 2022). It marks the transition from the Dethlingen sandstones to a succession of siltstones, followed by mudstones. A change in lithology can be identified by increased gamma-ray, density, and sonic velocity values, which leads to the increase in acoustic impedance (Fig. 7). Depth variations of these horizons are already visible in a small volume around the boreholes. The indication of these variations in lithological sequences is also present in the corridor stacks within this interval (Henninges et al., 2021).
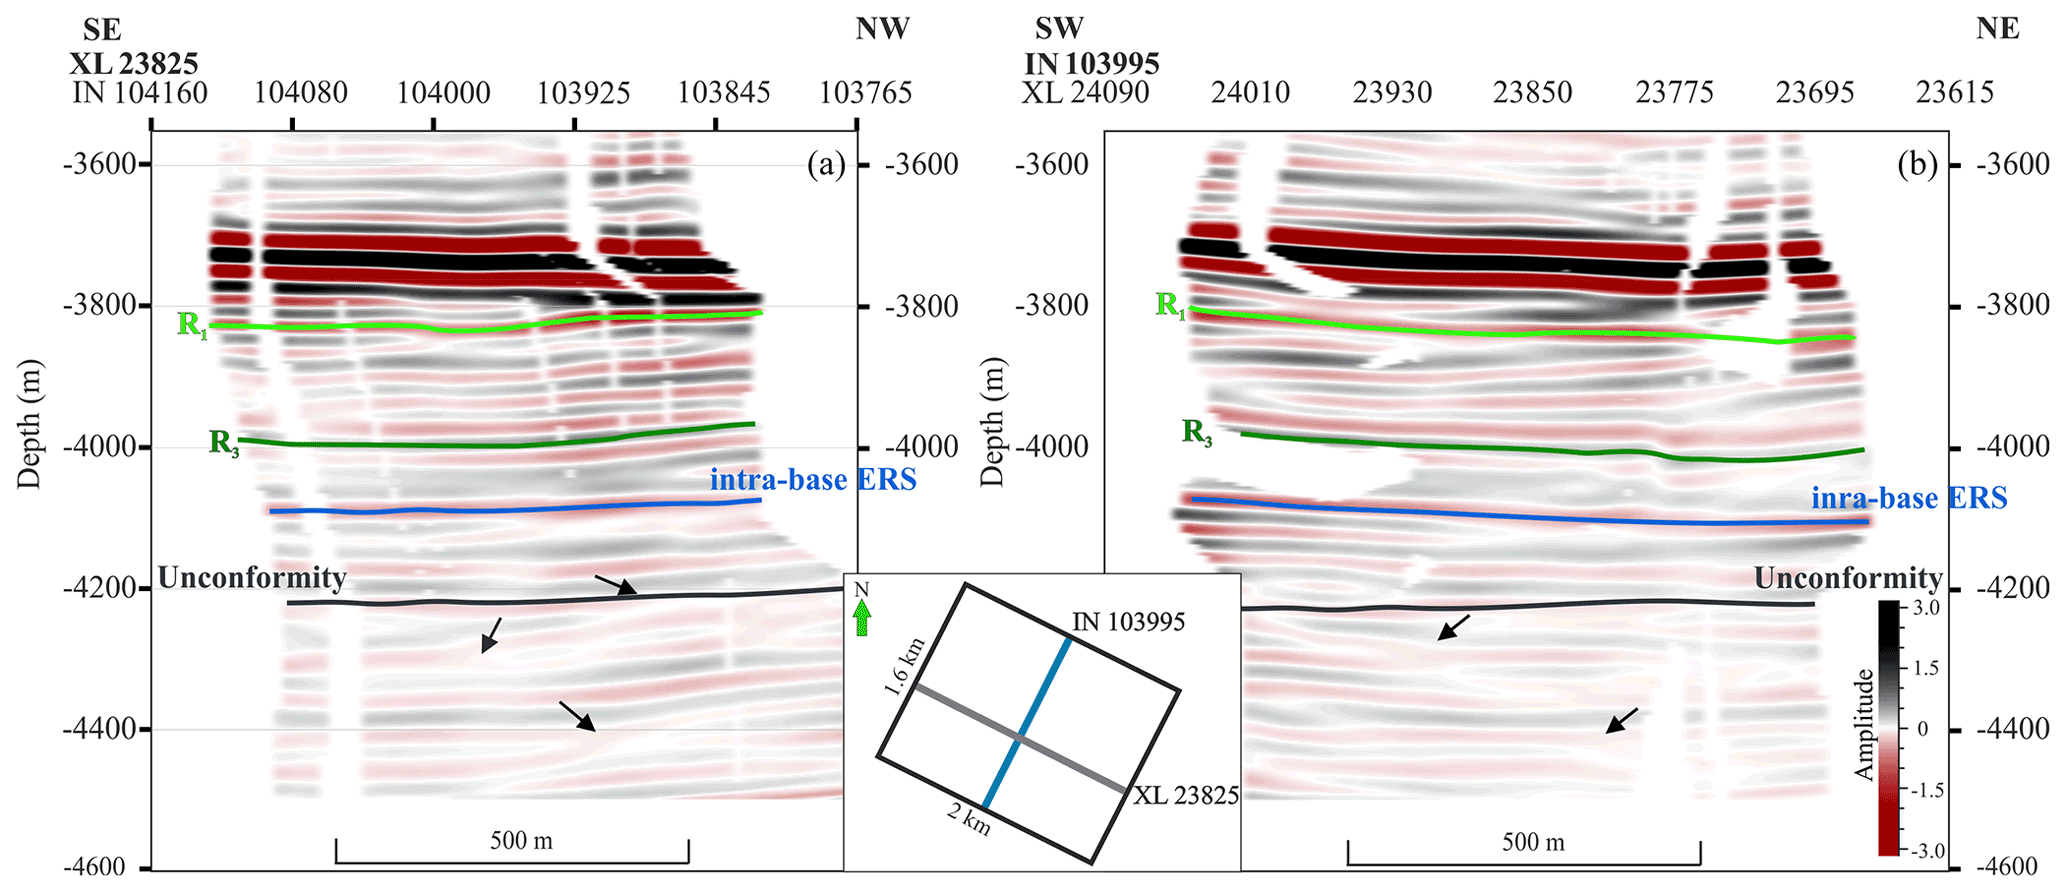
Figure 8Seismic lines extracted from the 3D DAS VSP cube with horizon interpretations. (a) Seismic crossline and (b) seismic inline, showing thin interlayered horizons in the Upper Rotliegend (light green and dark green lines), base of Elbe sandstone reservoir (dark blue line), and Lower Rotliegend unconformity (dark grey line). Small black arrows point out the locations of the numerous pinch-outs.
4.2 Elbe reservoir sandstone layer
One of the possible targets for geothermal exploration includes sandstones of the Dethlingen formation–Lower Elbe subgroup. In the Brandenburg area the lower part of the Dethlingen formation comprises fine- to coarse-grained sandstone with high-quality reservoir properties (porosity 8 %–10 % and permeability of 10–100 mD, Trautwein and Huenges, 2005). This layer was deposited in an aeolian setting and then reworked by aquatic processes. The Elbe reservoir sandstone (ERS) layer is located between 4060 and 4100 m depth within the sandy section of the Dethlingen formation in the E GrSk 3/90 well (Bauer et al., 2020) (Fig. 7). On well logs this interval is characterized by decreased P-wave velocity, caused by an increased porosity of this section (Trautwein and Huenges, 2005). This geological unit was successfully imaged on both 3D images (Fig. 6, dark blue arrows – 2).
In the conventional surface seismic image (Krawczyk et al., 2019; Norden et al., 2022), the base of the ERS horizon can be traced as a continuous negative phase at around 4080 m depth, with increasing thickness toward the southwest direction. Even the theoretical resolution should be 24–47 m. Bauer et al. (2020) showed via finite-difference forward modelling that this complex layer in the reservoir section still will not be adequately resolved since the theoretical resolution cannot be achieved due to challenging geological settings above and below the ERS.
Within the depth range from 4060 to 4100 m the depth section from 4070 to 4090 m shows a low variability in log values, indicating an even “cleaner” part of the ESR sandstone layer (Fig. 7). The high resolution of the 3D DAS VSP cube allows seeing an internal structure inside this interval and tracing depth variations of the base of the intra-reservoir horizon within the Elbe sandstone reservoir. It may represent porous parts of a stacked fluvial sandstone body within the sandy Dethlingen Fm. succession. Below in the text we will refer to this horizon as the intra-base of the Elbe reservoir sandstone layer (intra-base ERS). This interval's base is characterized by negative phases (decreased acoustic impedance) on the seismic 3D DAS VSP cube. We picked this horizon through the entire volume and created a depth contour map (Fig. 9a). The map was clipped using the dark blue polygon shown in Fig. 4a to avoid interpolation artefacts in the regions with low coverage. The intra-base ERS horizon lies at 4080 m on the southwest and at approximately 4100 m depth on the northeast. On the seismic section (Fig. 9b), it is clearly visible that there is a pinch-out on the southwest part of the profile, which was not distinguishable on the 3D surface seismic cube and is visible as a thickness variation.
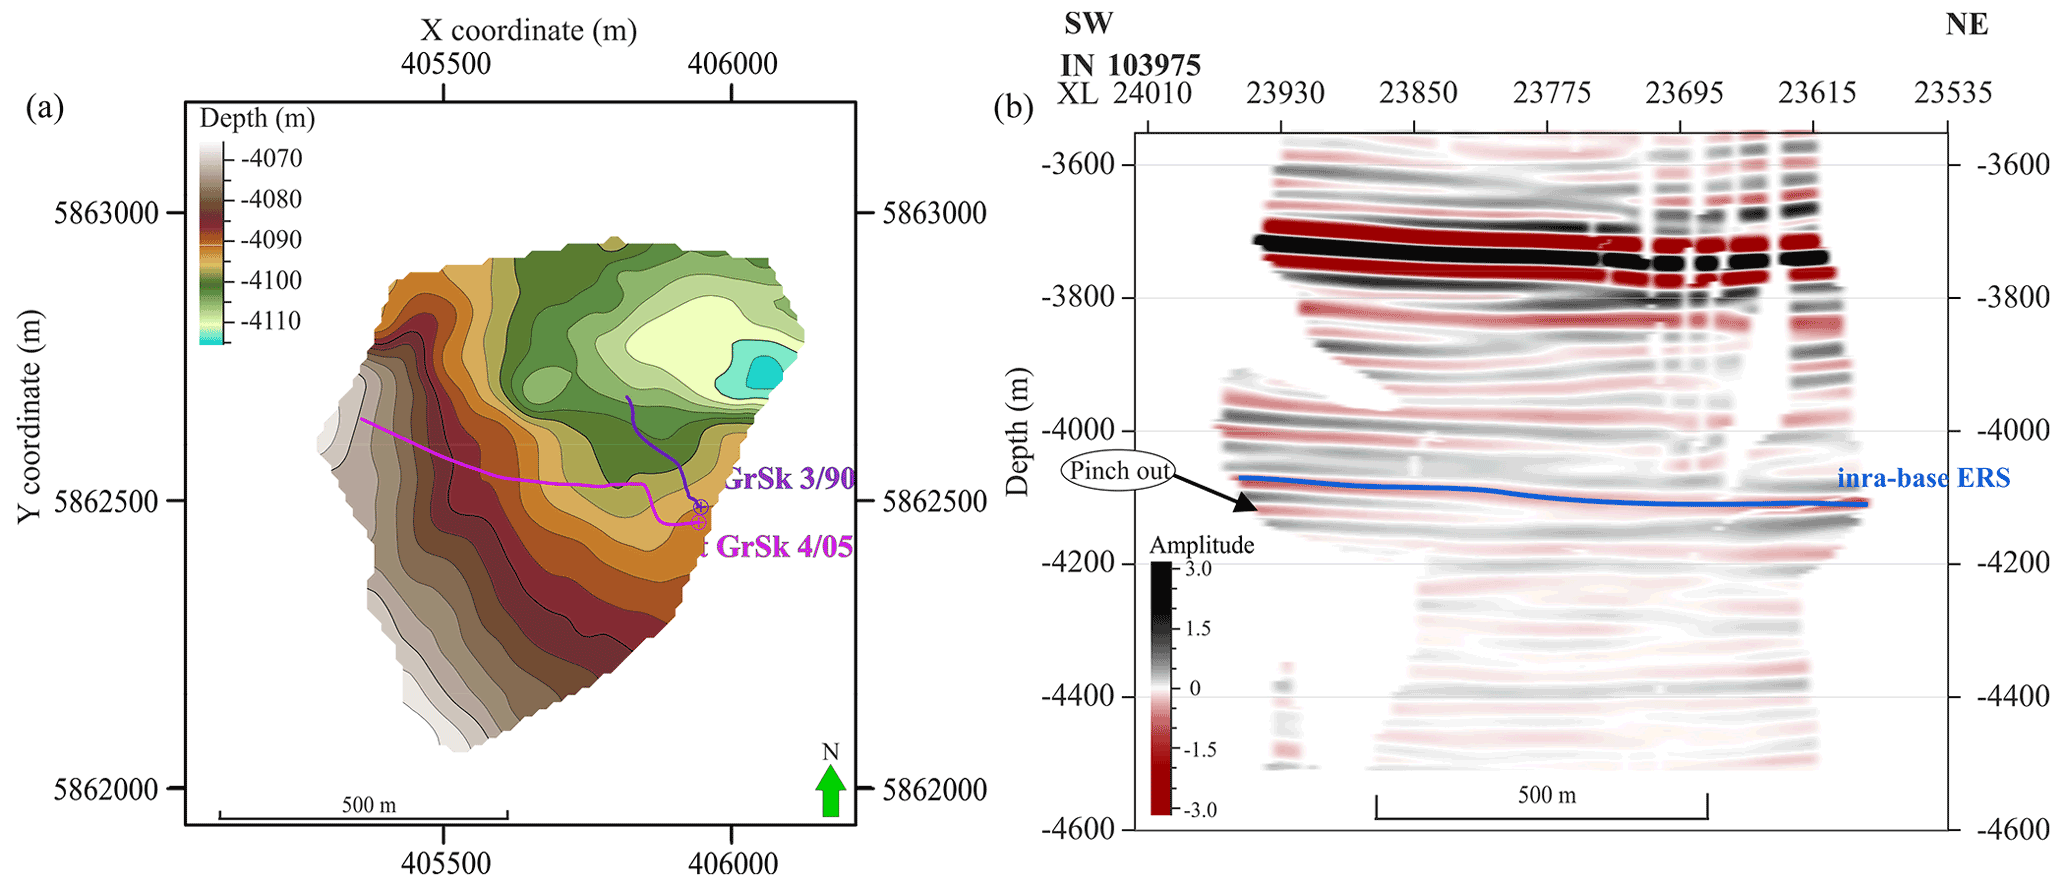
Figure 9(a) Spatial extent of the Elbe reservoir sandstone layer. Depth contour map of the Elbe sandstone reservoir intra-base horizon. The dark blue line marks the location of the inline shown in (b): seismic section from the 3D DAS VSP volume with the interpretation of the internal structure of the Elbe reservoir sandstone (ERS) horizon.
The top of the ERS horizon corresponds to a positive phase (increased acoustic impedance) on 3D DAS VSP cube. In general it follows similar paleo-relief as the intra-base ERS, with the deepest values around 4050 m in the southwest and 4080 m in the northeast (Fig. 10a). However, local depth variations are present, and therefore the thickness of the Elbe reservoir sandstone layer is highly variable in close proximity to the boreholes (Fig. 10b). It ranges from 20 to 35 m.
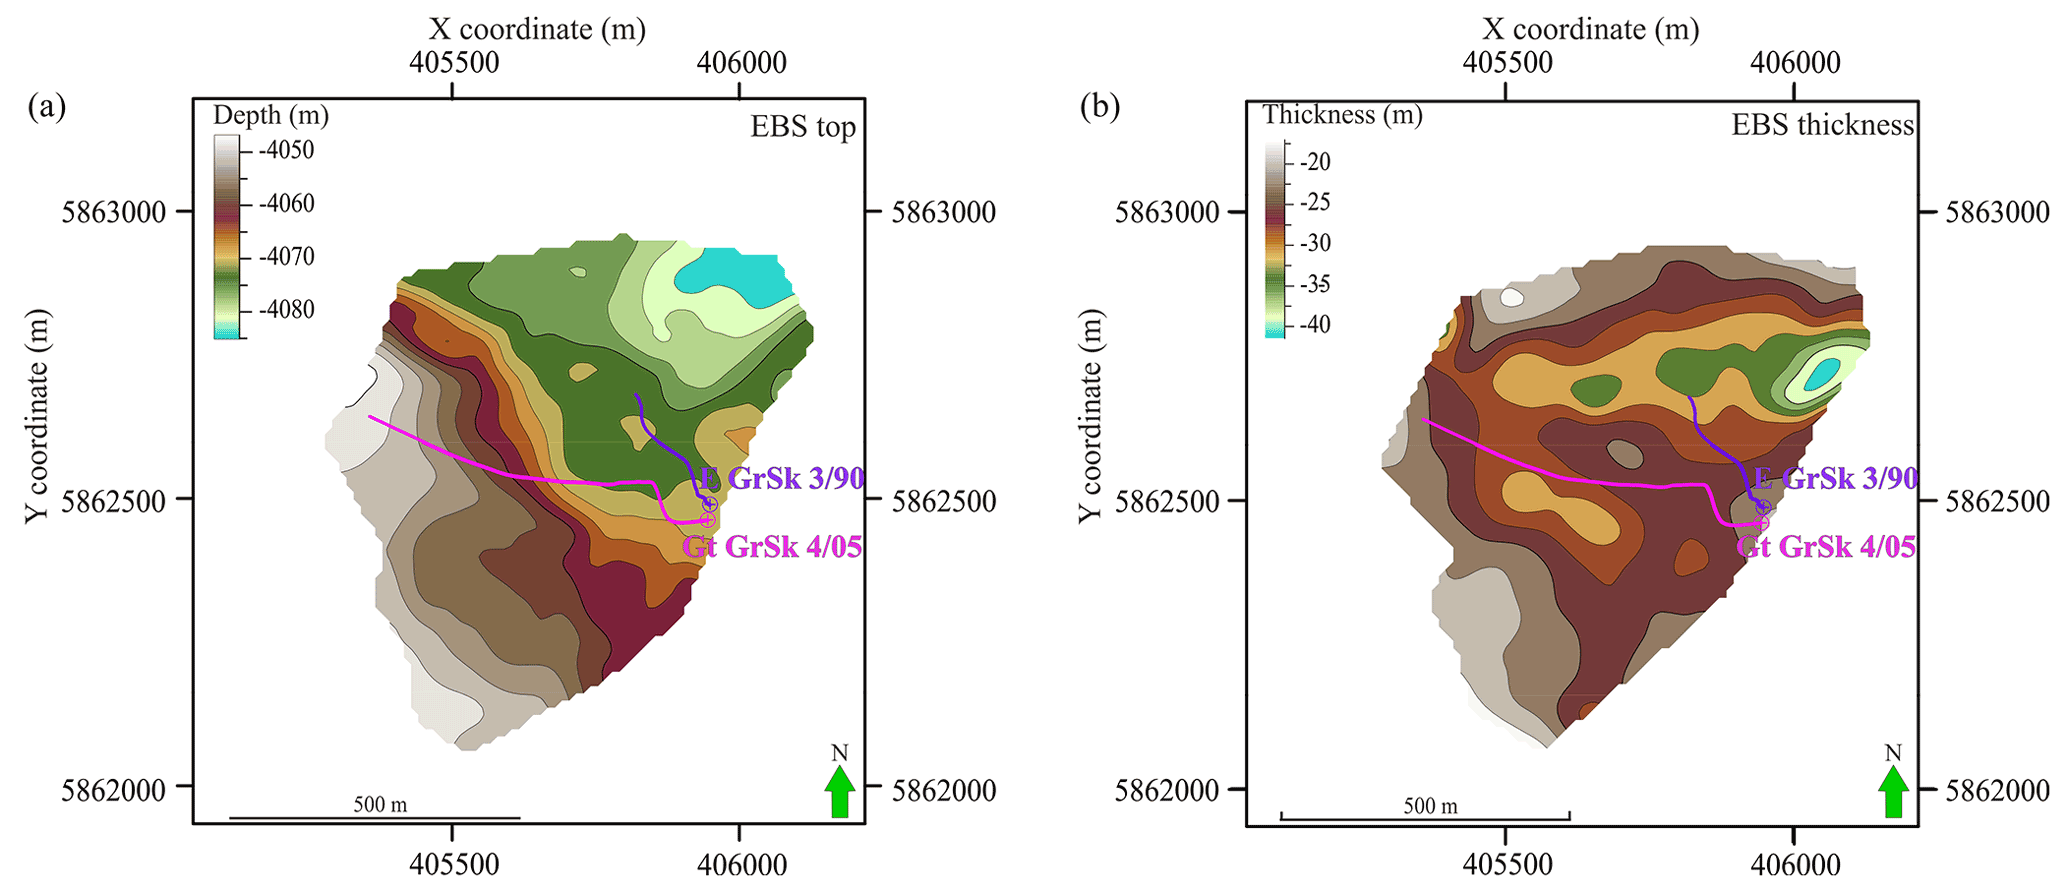
Figure 10Mapping results within the study area: depth contour map of the top Elbe reservoir sandstone layer (a) and the ERS thickness (b).
4.3 The Lower Rotliegend unconformity
Another essential feature of the seismic interpretation on the 3D DAS VSP and the 3D surface seismic (Krawczyk et al., 2019; Norden et al., 2022) cubes is the change in seismic reflection pattern (Fig. 6) at a depth around 4200 m. On the 3D surface seismics, this is visible as a change from horizontal continuous reflectors to layers with inconsistent amplitudes and a lower reflectivity in the Lower Rotliegend formation (Fig. 6b, the dark grey arrow – 3). On the 3D DAS VSP cube, a change from nearly horizontal to inclined reflectors can be detected (Fig. 6a, the dark grey arrow – 3). This change in the seismic facies evidences the existence of an unconformity in the area where we expect volcanic rocks. We will refer to it as the Lower Rotliegend unconformity.
On the seismic crossline and inline shown in Fig. 8a and b, the possible unconformity boundary is marked by a thick dark grey line. This reflection has weak, uncertain characteristics. Small black arrows indicate numerous exciting pinch-outs below this horizon, which were used as indicators of the type change in the layering. Due to reduced reflectivity and gaps in the cubes, tracing this horizon accurately is a pretty challenging task. Therefore, the resulting depth contour map might have errors, especially at the edges of the dataset. Nevertheless, in the area between the two boreholes where we have the best coverage, we can see that the depth variation of the Lower Rotliegend unconformity is relatively limited to the depth range of 4200–4230 m (Fig. 11).
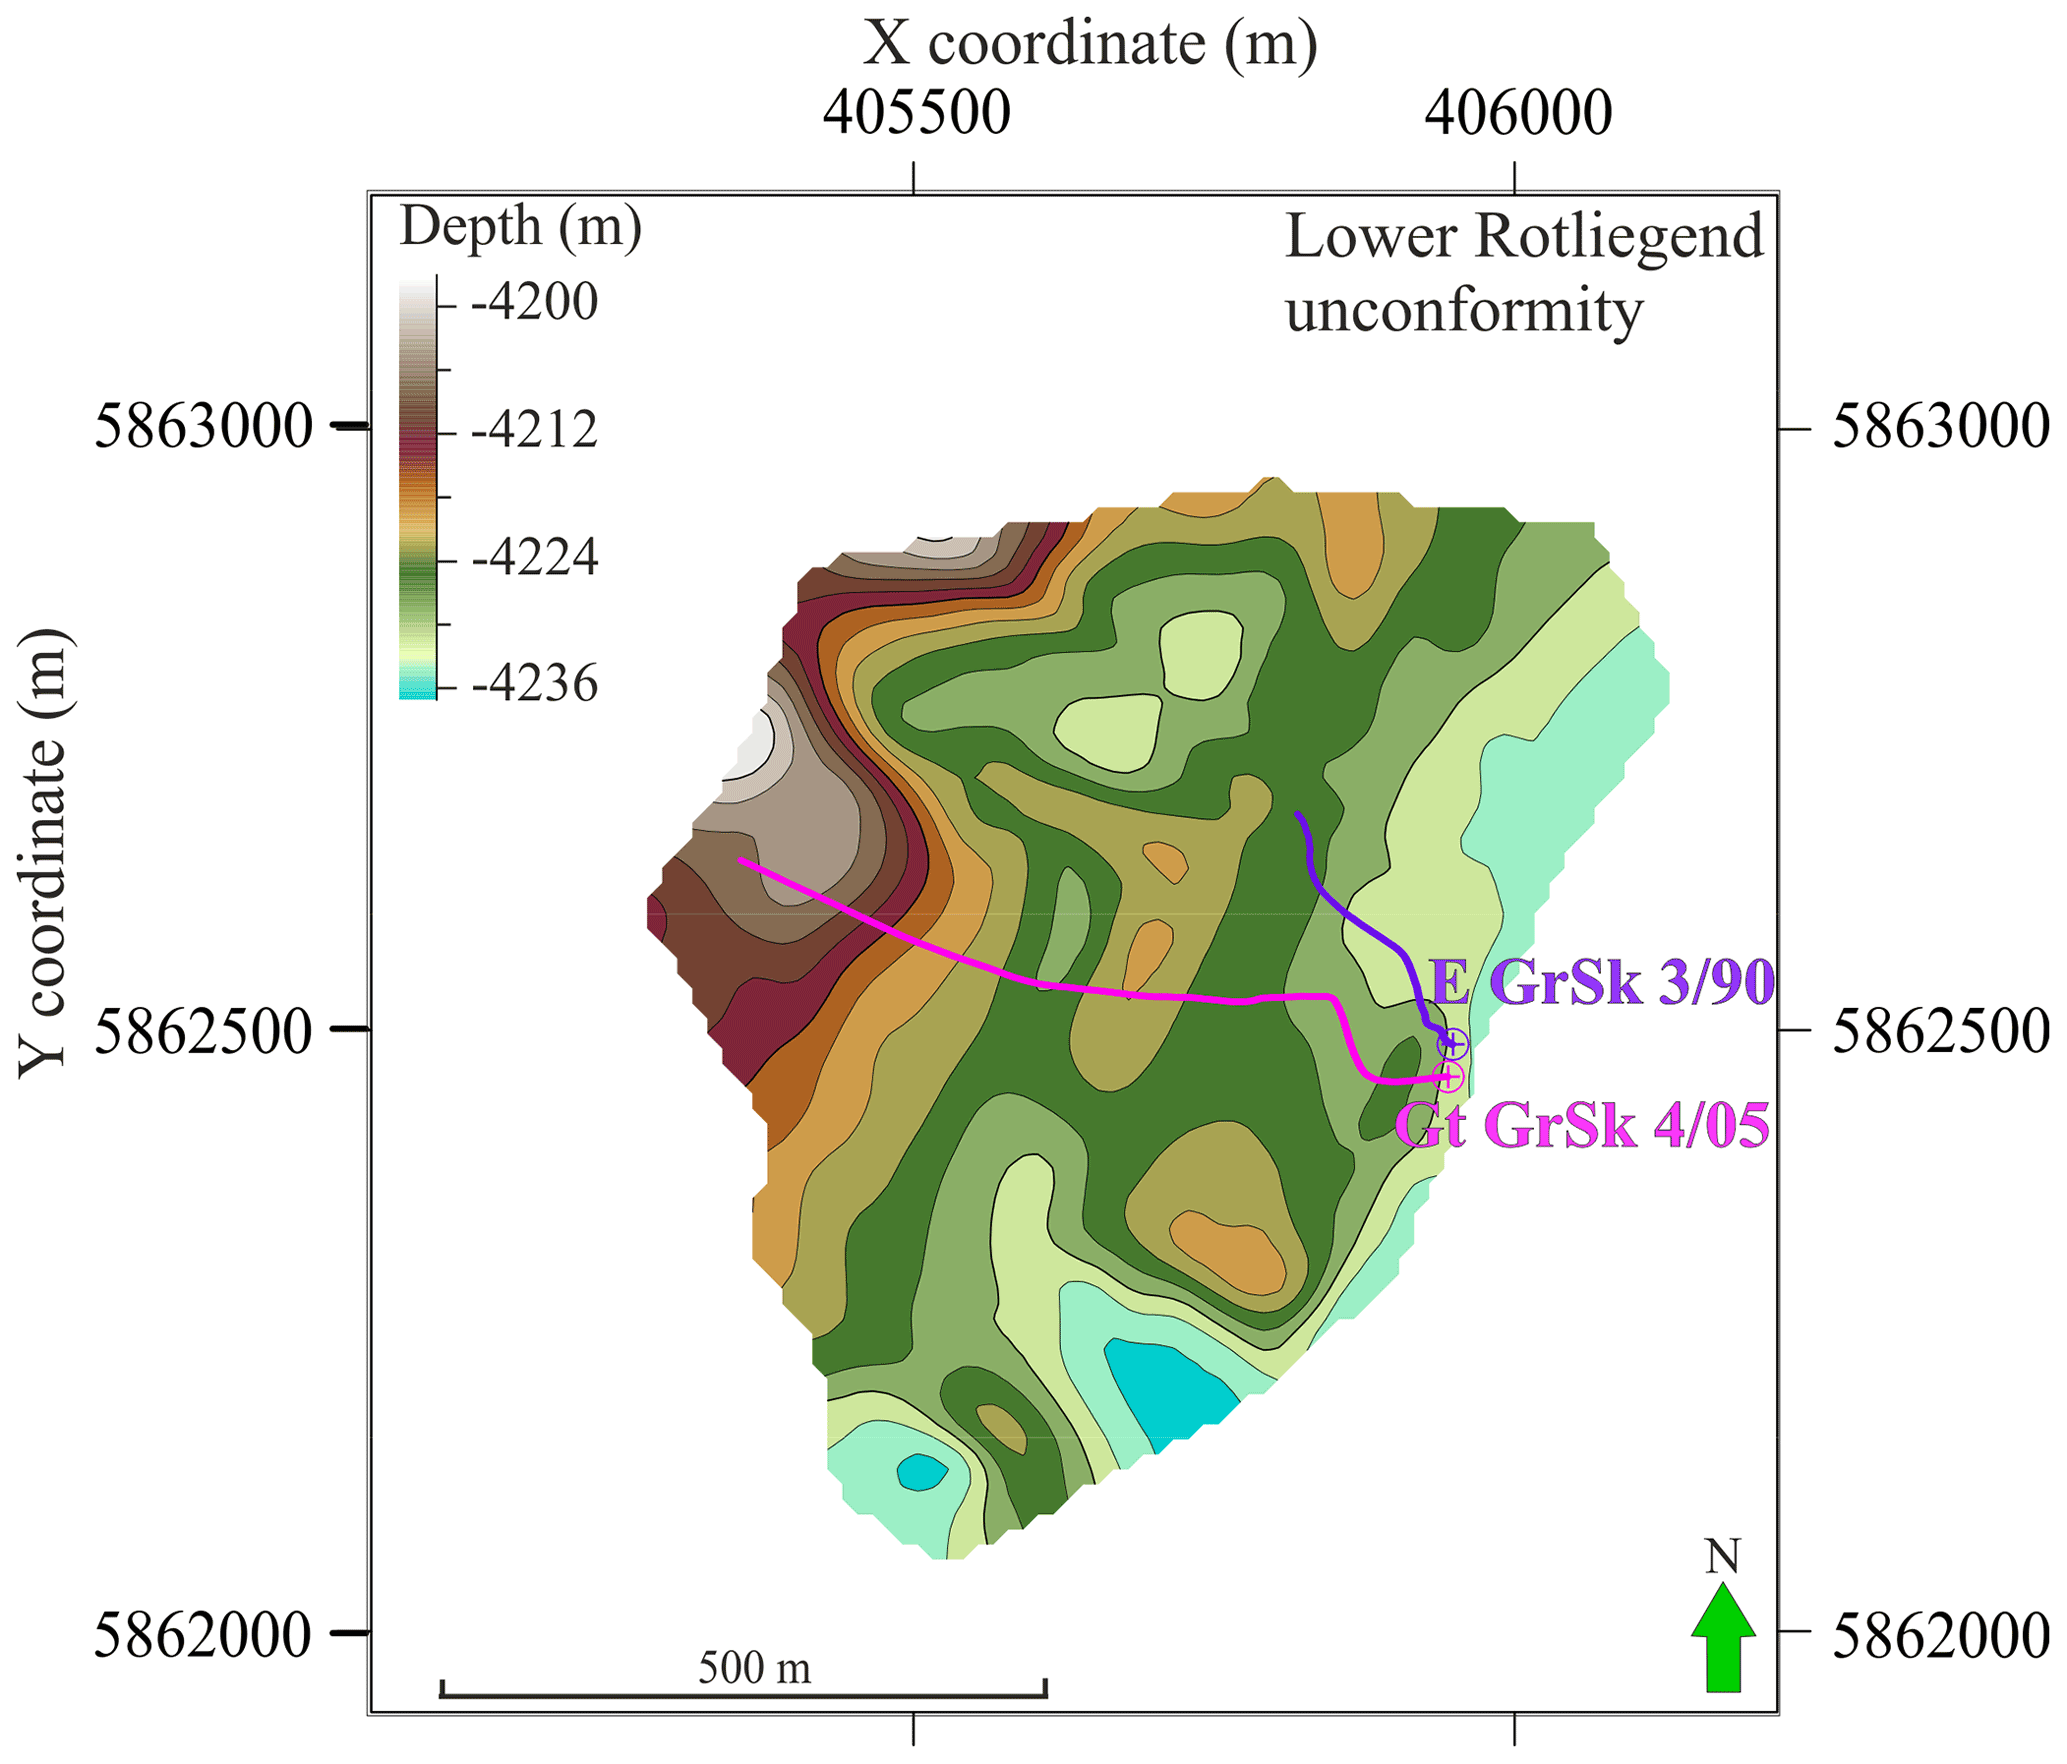
Figure 11Spatial distribution of the unconformity boundary. Depth of the Lower Rotliegend unconformity.
5.1 The Groß Schönebeck experiment
With this study, we investigated the applicability of the DAS wireline acquisition method for detailed deep geothermal reservoir imaging and the capability to bridge the gap between well logs and 3D surface seismics. 3D DAS VSP provides, on average, a 2 times better-resolved image than 3D surface seismics within this project and has significant potential in the geothermal sector. Data acquisition using engineered fibres or new interrogators with a higher signal-to-noise ratio can help notably improve the quality of the wireline DAS data recording and compensate for signal loses in the deep reservoir section. Nevertheless, more research on fibre coupling improvement and location control in the borehole is strongly advised, which could allow wireline DAS acquisition to become routine for numerous applications.
VSP surveys conducted with distributed sensors permanently installed behind casing or along the tubing provide the advantage of good coupling conditions and the possibility to perform time-lapse studies. Successfully reported case studies include applications for unconventional exploration in Texas (Shultz and Simmons, 2019) to create a detailed image of the formation around the well. Application of DAS for CO2 monitoring (Götz et al., 2018; Correa et al., 2019) is a well-known routine to provide a reliable method for targeted, detailed imaging and 4D monitoring of the site. 3D DAS VSP surveys in oil and gas exploration reduce exploration risks in regions with a challenging environment, for instance in the presence of strong production noise (Jiang et al., 2016) or in areas with complex salt tectonics (Bartels et al., 2015). In general, all the surveys with permanently installed fibre-optic cable have a better signal-to-noise ratio than data typically recorded with wireline DAS acquisition.
Wireline DAS, however, has a great advantage. It allows acquiring seismic data in already drilled and cased boreholes. This can be done at a low cost and in a small amount of time in comparison with VSP acquired using geophones. Even though wireline 3D DAS VSP at the Groß Schönebeck site has worse coupling conditions than conventional DAS cemented behind the casing, the resolution of the imaged seismic volume is still in the same range of 20 m (Götz et al., 2018; Correa et al., 2019).
To the best of the authors' knowledge, there are only limited examples of wireline DAS applications with active seismic sources for geothermal exploration. One known example was recorded in 2016 at the geothermal field at Brady Hot Springs, Nevada (Miller et al., 2018). A fibre optical cable was deployed into the accessible 363 m portion of the vertical well 56-1. This dataset has a limited depth range (up to 297 m only), and only two shot points were used for data acquisition. Trainor-Guitton et al. (2018) presented 3D imaging results from the same geothermal field, which are limited to the depth up to 600 m. Although some reflectors were imaged, hyperbola-shaped reflections often dominate these imaging results, making the interpretation challenging. Therefore, the experiments conducted at the Groß Schönebeck in situ laboratory and Brady Hot Springs are different and it is challenging to compare these two datasets. Thus, recorded data at the Groß Schönebeck are unique among the experiments conducted for geothermal exploration, with reflection information recorded down to 4.2 km deep.
A spiral survey design at the Groß Schönebeck site led to a ray focusing on the target reservoir area, yielding an equably distributed offset and azimuth coverage. A detailed imaging of the target reservoir interval (with vertical resolution up to 16 m) was achieved with only 61 VPs. Nevertheless, low to zero ray coverage in some regions of the 3D VSP survey resulted in a lack of data required for a successful migration process without excessive artefacts. A limited number of vibrator points resulted in petal-shaped footprints, with the highest coverage in the centre, that are prominent in bin density slices (Fig. 4a), revealing a partial illumination problem. Consequently, the resulting migrated depth slices have gaps and are challenging to utilize for classical attribute analysis. These limitations led to the usage of the 3D DAS VSP cube for structural interpretation only.
An experiment more similar to the Groß Schönebeck survey was conducted for hydrocarbon exploration in China's Heibei region (Yu et al., 2016). DAS walkaway and walk-around VSP with a wireline survey consisted of 386 successful shot points, which is 6 times more than the Groß Schönebeck experiment. The data acquisition for the in situ laboratory in the Brandenburg area was likely less time-consuming and cheaper than this experiment in China. However, densely regularly placed source positions allowed for a detailed, resolved 3D image for the area of interest in the Heibei region without gaps and prominent migration artefacts. Most recently, Lim et al. (2020) showed a remarkable dataset from a methane hydrate research test well in North Slope, Alaska, USA. A survey consisted of 1701 VPs arranged around the borehole and a permanently installed fibre-optic cable. Phenomenal dataset quality of the 3D DAS VSP data revealed indications of the sub-fault system that are not presented in the surface seismic data. The experiment in China and Alaska showed that with a larger number of source points better coverage can be achieved; however, one should always look for a trade-off between reasonable coverage and acquisition cost.
5.2 Data processing
The experiment at Groß Schönebeck allowed gaining valuable knowledge on survey planning and data processing. One of the biggest challenges for this dataset was a ringing noise problem. At the early stages of the data processing, an intermediate solution for denoising included Burg adaptive deconvolution combined with careful exclusion of depth intervals with a poor signal-to-noise ratio from the data processing. To further improve imaging results and limit migration artefacts due to sparse coverage, it was necessary to improve the signal-to-noise ratio of the data and include more data in migration calculations. Therefore, careful denoising using the MPD approach played an essential part in successful data imaging results.
Besides the quantity of the data, another important parameter, which will significantly influence the imaging results, is the migration aperture (Schleicher et al., 1997; Sun, 2000). After extensive testing we came to the conclusion that a strict restriction of 5∘ can lead to an ambiguous and inconsistent summation of the main horizons for our dataset. On the other hand, an aperture that is too broad can reduce the resolution of the horizons. Thus, a compromise between these parameters should be found. Additionally, due to its stacking nature, the migration operator will also attenuate the residual noise in the data to some extent.
5.3 Future geothermal exploration plans
The results of our 3D DAS VSP experiments prove that wireline DAS VSP measurements can significantly contribute to exploration campaigns. Wireline DAS VSP allows reducing risks and cost, and it can have a higher resolution compared to conventional 3D surface seismic interpretation, which does not provide enough information due to the limited resolution of the data. This case study can be of special interest for geothermal wells with complex structures or with thin reservoirs which are hard to image. Especially deep thin geothermal reservoirs or reservoirs that require stimulation with a low economical value may benefit from wireline DAS, for which a conventional VSP would otherwise have been cost-prohibitive. These deep reservoirs may require high-frequency content for high-resolution imaging, which is only preserved with a VSP due to the one-way travel path.
The Elbe reservoir sandstone layer currently represents one of potential targets for future geothermal exploration. The 3D VSP imaging results clarified the sandstone layer's effective thickness with good reservoir properties. According to our estimations, it varies between 25 and 40 m (Fig. 10b) near the borehole locations. The fluvial nature of these deposits is perhaps responsible for this high variability. Previously, the effective thickness of the Elbe reservoir layer was estimated at around 80 m (Zimmermann et al., 2010). The updated thicknesses from the 3D surface seismic experiment, calculated using wavelet-transform-based seismic facies classification, showed a predominant thickness of 40 m (Bauer et al., 2020; Norden et al., 2022). Our imaging results from the 3D DAS VSP further refine the reservoir geometry and reveal thickness estimations of the intra-reservoir layer.
The observed lower thicknesses may explain why a matrix-dominated exploration approach did not succeed at Groß Schönebeck as the reservoir volume able to contribute to the fluid flow is considerably lower than expected. However, the mapped variations of the more porous reservoir thickness, most likely representing the variability of facies-related petrophysical properties, should be considered for the design of fracture-dominated geothermal systems. Further investigations on fluid flow estimations should be conducted using independent temperature data, well logs, and hydraulic test data.
At the depth level around 4200 m, we mapped the Lower Rotliegend unconformity. There is a hypothesis that deposits of permo-carboniferous volcanic rocks lay below this border, which represent another possible target for future exploration (Norden et al., 2022). According to literature sources (Guterch et al., 2010), Lower Rotliegend volcanics have a significant time gap in sedimentation, and therefore the mapped unconformity horizon could indicate a difference in layering caused by erosion. The 3D DAS VSP imaging successfully contributed to the determination of this critical boundary since it was not well characterized on the 3D surface seismic cube. The bottom of permo-carboniferous volcanic rocks is not detectable on the 3D DAS VSP or on the 3D surface seismic cubes. This implies that the thickness of this deposit's sections can be greater than 300 m. Considering this information, the economic profitability is significantly higher for treated volcanic rocks than for the Elbe reservoir sandstone layer. Nevertheless, we believe it is crucial to determine the exact depth by drilling, performing core analysis, and using well logging methods to determine the precise composition of sediments below this border as well as essential parameters such as porosity and permeability before developing concepts for possible reservoir treatments in volcanites.
The exact development plans of the site are still under discussion. Possible scenarios include implementing a new stimulation concept and possibly drilling a new well (GrSk 5) or deepening the existing borehole E GrSk 3/90.
We analysed the 3D DAS VSP imaging results acquired with a wireline DAS installation at the Groß Schönebeck geothermal research site. Despite the numerous difficulties during the data acquisition campaign, the borehole seismics were able to image the target interval and substantially contribute to the detailed interpretation of the geothermal reservoir.
The three-dimensional image created using borehole yields
-
resolution of thin complex Upper Rotliegend geological structure,
-
mapping of the Elbe reservoir sandstone, and
-
detection of the Lower Rotliegend unconformity in the region with possible volcanic rocks.
The interpretation of the 3D DAS VSP cube evidenced the unexpected absence of faults with larger vertical offsets and fractures. Furthermore, no indications for free gas were found in the data. These findings are important for the further development of the Groß Schönebeck in situ geothermal laboratory. Wireline DAS allows for a significant increase in the number of sensors and a larger recording aperture, which results in imaging over a larger depth interval. Thus, it is cheaper and faster than the application of conventional borehole sensors. Nevertheless, careful survey planning and sophisticated data processing are vital for successful imaging results. This successful case study at the Groß Schönebeck site can play a crucial role in developing and applying modern, efficient geothermal exploration methods in the Northern German Basin and other regions with comparable lithology.
Data will be available after the embargo period at the end of the year via the GFZ repository (https://dataservices.gfz-potsdam.de/portal, last access: 17 August 2022).
JH, MS, and CMK planned the experiment. JH and MS supervised the fieldwork and data acquisition. EM performed the seismic data processing and analysis under the supervision of MS and CMK. EM interpreted the data under discussion with all co-authors. EM, MS, BN, JH, and CMK discussed the results and contributed to the final paper. JH and CMK supervised the project.
At least one of the (co-)authors is a member of the editorial board of Solid Earth. The peer-review process was guided by an independent editor, and the authors also have no other competing interests to declare.
Publisher's note: Copernicus Publications remains neutral with regard to jurisdictional claims in published maps and institutional affiliations.
This article is part of the special issue “Fibre-optic sensing in Earth sciences”. It is not associated with a conference.
We would like to thank all contractors involved in the acquisition and processing. The authors would like to sincerely acknowledge Ernst Huenges for establishing research activities at the Groß Schönebeck in situ geothermal laboratory and Klaus Bauer for constructive discussions on data processing. We also thank all our colleagues from the GFZ German Research Centre for Geosciences for their contribution to this work. The authors also acknowledge James Bailey, Mary Humphries, and Colin Humphries for providing VSProwess software and sharing their extensive VSP data processing knowledge. Additionally, the authors thank the editor Gilda Currenti and three anonymous reviewers for their comments and suggestions that helped to improve the paper.
Funding for the present work was provided by the German Federal Ministry of Economic Affairs and Energy (grant no. 0324065) as well as the European Commission Horizon 2020 Framework Programme (DESTRESS (grant no. 691728) and EPOS IP (grant no. 676564)). The publication of this work is supported within the funding programme “Open Access Publikationskosten” Deutsche Forschungsgemeinschaft (DFG, German Research Foundation) – project no. 491075472. The article processing charges for this open-access publication were covered by the Helmholtz Centre Potsdam – GFZ German Research Centre for Geosciences.
This paper was edited by Gilda Currenti and reviewed by three anonymous referees.
Bartels, T., Gelhaus, M., and Humphries, M.: VSP Measurements Used as a Tool for Sub Salt Near Field Development, in: Conference Proceedings, 77th EAGE Annual Meeting, Madrid, Spain, 1–4 June, We N104 15, https://doi.org/10.3997/2214-4609.201412918, 2015. a
Bauer, K., Norden, B., Ivanova, A., Stiller, M., and Krawczyk, C. M.: Wavelet transform-based seismic facies classification and modelling: application to a geothermal target horizon in the NE German Basin, Geophys. Prospect., 68, 466–482, https://doi.org/10.1111/1365-2478.12853, 2020. a, b, c
Bellefleur, G., Schetselaar, E., Wade, D., White, D., Enkin, R., and Schmitt, D. R.: Vertical seismic profiling using distributed acoustic sensing with scatter-enhanced fibre-optic cable at the Cu–Au New Afton porphyry deposit, British Columbia, Canada, Geophys. Prospect., 68, 313–333, https://doi.org/10.1111/1365-2478.12828, 2020. a
Blöcher, G., Reinsch, T., Henninges, J., Milsch, H., Regenspurg, S., Kummerow, J., Francke, H., Kranz, S., Saadat, A., Zimmermann, G., and Huenges, E.: Hydraulic history and current state of the deep geothermal reservoir Groß Schönebeck, Geothermics, 63, 27–43, https://doi.org/10.1016/j.geothermics.2015.07.008, 2016. a
Booth, A. D., Christoffersen, P., Schoonman, C., Clarke, A., Hubbard, B., Law, R., Doyle, S. H., Chudley, T. R., and Chalari, A.: Distributed Acoustic Sensing of Seismic Properties in a Borehole Drilled on a Fast-Flowing Greenlandic Outlet Glacier, Geophys. Res. Lett., 47, e2020GL088148, https://doi.org/10.1029/2020GL088148, 2020. a
Brisbourne, A. M., Kendall, M., Kufner, S.-K., Hudson, T. S., and Smith, A. M.: Downhole distributed acoustic seismic profiling at Skytrain Ice Rise, West Antarctica, The Cryosphere, 15, 3443–3458, https://doi.org/10.5194/tc-15-3443-2021, 2021. a
Burg, J.: Maximum Energy Spectral Analysis, PhD thesis, Stanford University, http://sepwww.stanford.edu/data/media/public/oldreports/sep06/06_01.pdf (last access: 1 May 2022), 1975. a
Burg, J. P.: The relationship between maximum entropy spectra and maximum likelihood spectra, Geophysics, 37, 375–376, https://doi.org/10.1190/1.1440265, 1972. a
Carrara, S., Shortall, R., and Uihlein, A.: Geothermal Energy – Technology Development Report 2020, https://doi.org/10.2760/16847, 2020. a, b, c
Constantinou, A., Farahani, A., Cuny, T., and Hartog, A.: Improving DAS acquisition by real-time monitoring of wireline cable coupling, in: Expanded Abstracts, 86th SEG Annual Meeting, Dallas, Texas, USA, 16–21 October 2016, 5603–5607, https://doi.org/10.1190/segam2016-13950092.1, 2016. a
Correa, J., Pevzner, R., Bona, A., Tertyshnikov, K., Freifeld, B., Robertson, M., and Daley, T.: 3D vertical seismic profile acquired with distributed acoustic sensing on tubing installation: A case study from the CO2CRC Otway Project, Interpretation, 7, SA11–SA19, https://doi.org/10.1190/INT-2018-0086.1, 2019. a, b, c
Currenti, G., Jousset, P., Napoli, R., Krawczyk, C., and Weber, M.: On the comparison of strain measurements from fibre optics with a dense seismometer array at Etna volcano (Italy), Solid Earth, 12, 993–1003, https://doi.org/10.5194/se-12-993-2021, 2021. a
Dean, T., Cuny, T., and Hartog, A. H.: The effect of gauge length on axially incident P-waves measured using fibre optic distributed vibration sensing, Geophys. Prospect., 65, 184–193, https://doi.org/10.1111/1365-2478.12419, 2017. a, b
Dillon, P. B. and Thomson, R. C.: Offset Source VSP Surveys and Their Image Reconstruction*, Geophys. Prospect., 32, 790–811, https://doi.org/10.1111/j.1365-2478.1984.tb00739.x, 1984. a
Dou, S., Lindsey, N., Wagner, A. M., Daley, T. M., Freifeld, B., Robertson, M., Peterson, J., Ulrich, C., Martin, E. R., and Ajo-Franklin, J. B.: Distributed Acoustic Sensing for Seismic Monitoring of The Near Surface: A Traffic-Noise Interferometry Case Study, Scientific Reports, 7, 11620, https://doi.org/10.1038/s41598-017-11986-4, 2017. a
Elboth, T., Fugro Geoteam, Qaisrani, H. H., and Hertweck, T.: De-noising seismic data in the time-frequency domain, in: Expanded Abstracts, 78th SEG Annual Meeting, Las Vegas, Nevada, USA, 9–14 November 2008, 2622–2626, https://doi.org/10.1190/1.3063887, 2008. a
Guterch, A., Wybraniec, S., Grad, M., Chadwick, A., Krawczyk, C., Ziegler, P., Thybo, H., and De Vos, W.: Crustal structure and structural framework, in: Petroleum Geological Atlas of the Southern Permian Basin Area, EAGE Publications b.v., Houten, the Netherlands, 11–23, ISBN: 978073781610, 2010. a
Göthel, M.: Lithologische Interpretation und stratigraphisches Niveau der reflexionsseismischen Horizonte im Untergrund Brandenburgs einschließlich Berlins, Brandenburgische Geowiss. Beiträge, 23, 85–90, 2016. a, b
Götz, J., Lüth, S., Henninges, J., and Reinsch, T.: Vertical seismic profiling using a daisy-chained deployment of fibre-optic cables in four wells simultaneously – Case study at the Ketzin carbon dioxide storage site, Geophys. Prospect., 66, 1201–1214, https://doi.org/10.1111/1365-2478.12638, 2018. a, b, c
Henninges, J., Baumann, G., Brandt, W., Cunow, C., Poser, M., Schrötter, J., and Huenges, E.: A Novel Hybrid Wireline Logging System for Downhole Monitoring of Fluid Injection and Production in Deep Reservoirs, in: Conference Proceedings, 73rd EAGE Conference & Exhibition, Vienna, Austria, 23–26 May 2011, C043, https://doi.org/10.3997/2214-4609.20149727, 2011. a
Henninges, J., Martuganova, E., Stiller, M., Norden, B., and Krawczyk, C. M.: Wireline distributed acoustic sensing allows 4.2 km deep vertical seismic profiling of the Rotliegend 150 ∘C geothermal reservoir in the North German Basin, Solid Earth, 12, 521–537, https://doi.org/10.5194/se-12-521-2021, 2021. a, b, c, d
Hudson, T., Baird, A., Kendall, J., Kufner, S., Brisbourne, A., Smith, A., Butcher, A., Chalari, A., and Clarke, A.: Distributed Acoustic Sensing in Antarctica: What we can learn for studying microseismicity elsewhere, in: Conference Proceedings, EAGE GeoTech 2021 Second EAGE Workshop on Distributed Fibre Optic Sensing, Online, 1–5 March 2021, 1–5, https://doi.org/10.3997/2214-4609.202131037, 2021. a
Humphries, M., Vidal, J., and de Dios, J.: VSP Monitoring for CO2 Migration Tracking in Fractured Rock Massifs, in: Conference Proceedings, 77th EAGE Conference and Exhibition no. 1, Madrid, Spain, 1–4 June 2015, 1–5, https://doi.org/10.3997/2214-4609.201412672, 2015. a
IEA Geothermal: The 2019 Annual Report, IEA Geothermal, https://iea-gia.org/publications-2/annual-reports/ (last access: 1 May 2022) 2020. a
Jiang, T., Zhan, G., Hance, T., Sugianto, S., Soulas, S., and Kjos, E.: Valhall dual-well 3D DAS VSP field trial and imaging for active wells, in: Expanded Abstracts, 86th SEG Annual Meeting, Dallas, Texas, USA, 16–21 October 2016, 5582–5586, https://doi.org/10.1190/segam2016-13871754.1, 2016. a, b
Jousset, P., Currenti, G., Schwarz, B., Chalari, A., Tilmann, F., Reinsch, T., Zuccarello, L., Privitera, E., and Krawczyk, C. M.: Fibre optic distributed acoustic sensing of volcanic events, Nat. Commun., 13, 1753, https://doi.org/10.1038/s41467-022-29184-w, 2022. a
Klaasen, S., Paitz, P., Lindner, N., Dettmer, J., and Fichtner, A.: Distributed Acoustic Sensing in Volcano-Glacial Environments – Mount Meager, British Columbia, J. Geophys. Res.-Sol. Ea., 126, e2021JB022358, https://doi.org/10.1029/2021JB022358, 2021. a
Krawczyk, C. M.: Wie Glasfaserkabel als Geosensoren zur Erkundung und Überwachung des Untergrunds genutzt werden können – Anwendungen und Potenzial von ortsverteilten faseroptischen Messungen (How fibre optic cables can be used as geosensors to explore and monitor the subsurface – Applications and Potential of distributed acoustic sensing), Brandenburgische Geowiss. Beiträge, 28, 15–28, 2021. a
Krawczyk, C. M., Stiller, M., Bauer, K., Norden, B., Henninges, J., Ivanova, A., and Huenges, E.: 3-D seismic exploration across the deep geothermal research platform Groß Schönebeck north of Berlin/Germany, Geothermal Energy, 7, 15, https://doi.org/10.1186/s40517-019-0131-x, 2019. a, b, c, d, e, f
Lellouch, A., Schultz, R., Lindsey, N., Biondi, B., and Ellsworth, W.: Low-Magnitude Seismicity With a Downhole Distributed Acoustic Sensing Array – Examples From the FORGE Geothermal Experiment, J. Geophys. Res.-Sol. Ea., 126, e2020JB020462, https://doi.org/10.1029/2020JB020462, 2021. a
Li, Z. and Zhan, Z.: Pushing the limit of earthquake detection with distributed acoustic sensing and template matching: a case study at the Brady geothermal field, Geophys. J. Int., 215, 1583–1593, https://doi.org/10.1093/gji/ggy359, 2018. a
Lim, T., Fujimoto, A., Kobayashi, T., and Mondanos, M.: DAS 3DVSP Data Acquisition for Methane Hydrate Research, in: Conference Proceedings, EAGE Workshop on Fiber Optic Sensing for Energy Applications in Asia Pacific, Kuala Lumpur, Malaysia, 9–11 November 2020, 1–5, https://doi.org/10.3997/2214-4609.202070014, 2020. a
Lior, I., Sladen, A., Rivet, D., Ampuero, J.-P., Hello, Y., Becerril, C., Martins, H. F., Lamare, P., Jestin, C., Tsagkli, S., and Markou, C.: On the Detection Capabilities of Underwater Distributed Acoustic Sensing, J. Geophys. Res.-Sol. Ea., 126, e2020JB020925, https://doi.org/10.1029/2020JB020925, 2021. a
Lizarralde, D. and Swift, S.: Smooth inversion of VSP traveltime data, Geophysics, 64, 659–661, https://doi.org/10.1190/1.1444574, 1999. a
Martuganova, E., Stiller, M., Bauer, K., Henninges, J., and Krawczyk, C. M.: Cable reverberations during wireline distributed acoustic sensing measurements: their nature and methods for elimination, Geophys. Prospect., 69, 1034–1054, https://doi.org/10.1111/1365-2478.13090, 2021. a, b
Miller, D., Coleman, T., Zeng, X., Patterson, J., Reinisch, E., Wang, H., Fratta, D., Trainor-Guitton, W., Thurber, C., Robertson, M., Feigl, K., and The PoroTomo Team: DAS and DTS at Brady Hot Springs: Observations about Coupling and Coupled Interpretations, in: Proceedings, 43rd Workshop on Geothermal Reservoir Engineering, Stanford, California, 12–14 February 2018, 1–13, https://pangea.stanford.edu/ERE/pdf/IGAstandard/SGW/2018/Miller.pdf (last access: 1 May 2022), 2018. a, b, c
Moeck, I., Schandelmeier, H., and Holl, H.-G.: The stress regime in a Rotliegend reservoir of the Northeast German Basin, Int. J. Earth Sci., 98, 1643–1654, https://doi.org/10.1007/s00531-008-0316-1, 2009. a, b
Nishimura, T., Emoto, K., Nakahara, H., Miura, S., Yamamoto, M., Sugimura, S., Ishikawa, A., and Kimura, T.: Source location of volcanic earthquakes and subsurface characterization using fiber-optic cable and distributed acoustic sensing system, Scientific Reports, 11, 6319, https://doi.org/10.1038/s41598-021-85621-8, 2021. a
Norden, B., Bauer, K., and Krawczyk, C. M.: From pilot site knowledge via integrated reservoir characterization to utilization perspectives of a deep geothermal reservoir: 3D geological model at the research platform Groß Schönebeck in the Northeast German Basin, Geothermal Energy [preprint], https://doi.org/10.21203/rs.3.rs-1660889/v1, 2022. a, b, c, d, e, f, g
Reinsch, T., Henninges, J., Götz, J., Jousset, P., Bruhn, D., and Lüth, S.: Distributed Acoustic Sensing Technology for Seismic Exploration in Magmatic Geothermal Areas, in: Proceedings, World Geothermal Congress, Melbourne, Australia, 16–24 April 2015, 1–5, https://gfzpublic.gfz-potsdam.de/rest/items/item_1182900_4/component/file_1182899/content (last access: 1 May 2022), 2015. a
Schleicher, J., Hubral, P., Tygel, M., and Jaya, M. S.: Minimum apertures and Fresnel zones in migration and demigration, Geophysics, 62, 183–194, https://doi.org/10.1190/1.1444118, 1997. a
Shultz, W. and Simmons, J.: 3D DAS VSP in unconventionals: A case study, in: 89th SEG Annual Meeting, Expanded Abstracts, Houston, Texas, USA, 15–20 September 2019, 979–983, https://doi.org/10.1190/segam2019-3214518.1, 2019. a, b
Spica, Z. J., Nishida, K., Akuhara, T., Pétrélis, F., Shinohara, M., and Yamada, T.: Marine Sediment Characterized by Ocean-Bottom Fiber-Optic Seismology, Geophys. Res. Lett., 47, e2020GL088360, https://doi.org/10.1029/2020GL088360, 2020a. a
Spica, Z. J., Perton, M., Martin, E. R., Beroza, G. C., and Biondi, B.: Urban Seismic Site Characterization by Fiber-Optic Seismology, J. Geophys. Res.-Sol. Ea., 125, e2019JB018656, https://doi.org/10.1029/2019JB018656, 2020b. a
Stiller, M., Krawczyk, C. M., Bauer, K., Henninges, J., Norden, B., Huenges, E., and Spalek, A.: 3D-Seismik am Geothermieforschungsstandort Groß Schönebeck, BBR – Fachmagazin für Brunnen- und Leitungsbau, 1, 84–91, 2018. a
Sun, J.: Limited-aperture migration, Geophysics, 65, 584, https://doi.org/10.1190/1.1444754, 2000. a
The European Commission: Report from the commission to the European parliament and the council. Progress on competitiveness of clean energy technologies. Part 4/5, Publications Office of the European Union, Brussels (Belgium), https://eur-lex.europa.eu/resource.html?uri=cellar:871975a1-0e05-11eb-bc07-01aa75ed71a1.0001.02/DOC_4&format=PDF (last access: 1 May 2022), 2021. a
Thomsen, L.: Weak elastic anisotropy, Geophysics, 51, 1954–1966, https://doi.org/10.1190/1.1442051, 1986. a
Trainor-Guitton, W., Guitton, A., Jreij, S., Powers, H., Sullivan, C. B., Simmons, J., and Porotomo Team: 3D Imaging from vertical DAS fiber at Brady’s Natural Laboratory, in: Proceedings, 43rd Workshop on Geothermal Reservoir Engineering, Stanford, California, 12–14 February 2018, 1–11, https://pangea.stanford.edu/ERE/pdf/IGAstandard/SGW/2018/Trainorguitton.pdf (last access: 1 May 2022), 2018. a, b, c
Trautwein, U. and Huenges, E.: Poroelastic behaviour of physical properties in Rotliegend sandstones under uniaxial strain, Int. J. Rock Mech. Min., 42, 924–932, https://doi.org/10.1016/j.ijrmms.2005.05.016, 2005. a, b
Wilson, G. A., Willis, M. E., and Ellmauthaler, A.: Evaluating 3D and 4D DAS VSP image quality of subsea carbon storage, The Leading Edge, 40, 261–266, https://doi.org/10.1190/tle40040261.1, 2021. a
Yu, G., Cai, Z., Chen, Y., Wang, X., Zhang, Q., Li, Y., Wang, Y., Liu, C., Zhao, B., and Greer, J.: Walkaway VSP using multimode optical fibers in a hybrid wireline, The Leading Edge, 35, 615–619, https://doi.org/10.1190/tle35070615.1, 2016. a, b
Yuan, S., Lellouch, A., Clapp, R. G., and Biondi, B.: Near-surface characterization using a roadside distributed acoustic sensing array, The Leading Edge, 39, 646–653, https://doi.org/10.1190/tle39090646.1, 2020. a
Zhan, G. and Nahm, J.: Multi-well 3D DAS VSPs: Illumination and imaging beyond the wellbores, in: Expanded Abstracts, 90th SEG Annual Meeting, Online, 11–16 October 2020, 3798–3802, https://doi.org/10.1190/segam2020-3426032.1, 2020. a
Zimmermann, G., Moeck, I., and Blöcher, G.: Cyclic waterfrac stimulation to develop an Enhanced Geothermal System (EGS) – Conceptual design and experimental results, Geothermics, 39, 59–69, https://doi.org/10.1016/j.geothermics.2009.10.003, 2010. a