the Creative Commons Attribution 4.0 License.
the Creative Commons Attribution 4.0 License.
 | 14 Jan 2022
Creep of CarbFix basalt: influence of rock–fluid interaction
Hamed O. Ghaffari
Ulrich Mok
Matej Pec
Geological carbon sequestration provides permanent CO2 storage to mitigate the current high concentration of CO2 in the atmosphere. CO2 mineralization in basalts has been proven to be one of the most secure storage options. For successful implementation and future improvements of this technology, the time-dependent deformation behavior of reservoir rocks in the presence of reactive fluids needs to be studied in detail. We conducted load-stepping creep experiments on basalts from the CarbFix site (Iceland) under several pore fluid conditions (dry, H2O saturated and H2O + CO2 saturated) at temperature, T≈80 ∘C and effective pressure, Peff=50 MPa, during which we collected mechanical, acoustic and pore fluid chemistry data. We observed transient creep at stresses as low as 11 % of the failure strength. Acoustic emissions (AEs) correlated strongly with strain accumulation, indicating that the creep deformation was a brittle process in agreement with microstructural observations. The rate and magnitude of AEs were higher in fluid-saturated experiments than in dry conditions. We infer that the predominant mechanism governing creep deformation is time- and stress-dependent subcritical dilatant cracking. Our results suggest that the presence of aqueous fluids exerts first-order control on creep deformation of basaltic rocks, while the composition of the fluids plays only a secondary role under the studied conditions.
- Article
(24122 KB) - Full-text XML
- BibTeX
- EndNote


The concentration of atmospheric CO2 has seen a significant increase over the last century, raising concerns about the more frequent occurrence of extreme weather, sea-level rise and the projected increase of average global temperature (Broecker, 1975). It is estimated that about 800 Gt CO2 will need to be stored by the end of the century to keep the global temperature increase below 1.5 ∘C compared to pre-industrial levels (National Academies of Sciences, Engineering, 2019). Such large volumes can practically be stored in the subsurface. Geological carbon sequestration (GCS) by in situ carbon mineralization is recognized as one of the most secure, long-term storage solutions (Gislason and Oelkers, 2014; Kelemen and Matter, 2008; Lackner et al., 1995; Mani et al., 2008; Seifritz, 1990; Snæbjörnsdóttir et al., 2020; Tutolo et al., 2021). To date, several pilot projects have been launched to study GCS in basalt reservoirs, including the CarbFix program in Iceland (Callow et al., 2018; Gislason et al., 2010; Oelkers et al., 2008; Snæbjörnsdóttir et al., 2018) and the Wallula basalt (part of Columbia River Basalt Group) sequestration project in Washington, USA (McGrail et al., 2006, 2011, 2017; Zakharova et al., 2012).
GCS involves the injection of fluids, either supercritical CO2 or CO2 in an aqueous solution, into the formations. Basalts are composed of mafic minerals such as pyroxene ((Mg,Fe)2Si2O6), plagioclase ((Ca,Na)Al1.70Si2.30O8) and olivine ((Mg,Fe)2SiO4) as well as mafic glass, which react with CO2 to form carbonate minerals (MgCO3, CaCO3, FeCO3, etc.), thus binding the injected CO2 in mineral structure (Gislason and Hans, 1987; Hangx and Spiers, 2009; Matter et al., 2007; Oelkers et al., 2008). Carbonation reactions appear to be rapid in natural conditions; more than 95 % of the CO2 injected into the CarbFix site in Iceland was converted to carbonate minerals in less than 2 years (Matter et al., 2016). Relevant fluid and mineral reactions can be formulated as follows (Hangx and Spiers, 2009; Hansen et al., 2005; Kelemen and Matter, 2008; Oelkers et al., 2008):
Dissociation:
Dissolution:
Precipitation:
CO2 is dissolved in water to form an acidic solution (Reactions R1–R2). The rocks dissolve to liberate divalent cations (Reactions R3–R5), which, upon saturation in the fluid, precipitate as carbonate minerals (Reaction R6) further downstream from the injection site.
The mechanical and transport behavior of rocks can be significantly affected during GCS by the interaction between rock and fluid, both from a mechanical as well as chemical perspective (Baud et al., 2000; Dunning and Miller, 1985; Heard, 1960; Helmons et al., 2016; Rutter and Hackston, 2017). The mechanical effect of pore fluid is readily accounted for by using the effective pressure law (Terzaghi, 1943). The pore fluid acts against the normal stresses acting on crack surfaces, hence reducing the shear stress necessary to overcome internal friction of the rocks. An increase in pore pressure during injection can trigger seismicity, and therefore pore pressure has to be carefully monitored (Atkinson et al., 2020; Guglielmi et al., 2015). In addition to this mechanical effect, a number of chemical processes can occur in the presence of reactive fluids, leading to complex coupling between processes. For example, the replacement of mafic minerals with carbonates can result in an up to ∼ 44 % increase in solid molar volume (Goff and Lackner, 1998; Hansen et al., 2005; Kelemen and Matter, 2008) potentially clogging pore space, reducing permeability and increasing pore pressure. Alternatively, this volume expansion can generate stresses causing reaction-induced fracturing, which provides additional fluid pathways and maintains porosity and permeability for the reaction to proceed (Iyer et al., 2008; Jamtveit et al., 2009; Kelemen and Matter, 2008; Lambart et al., 2018; Macdonald and Fyfe, 1985; Renard et al., 2020; Rudge et al., 2010; Skarbek et al., 2018; Xing et al., 2018; Zhu et al., 2016). The fracturing behavior itself is affected by the fluid chemistry via kinetic reduction of fracture energy due to fluid absorption on mineral surfaces and crack tip blunting (Baud et al., 2000; Orowan, 1944; Rutter, 1972; Scholz, 1968), and activation of fluid-promoted stress corrosion processes such as subcritical crack growth resulting in time-dependent deformation, which is the focus of this paper (Anderson and Grew, 1977; Atkinson, 1984; Atkinson and Meredith, 1987; Brantut et al., 2013; Nara et al., 2013; Rice, 1978).
This time-dependent deformation, often called “brittle creep” or “static fatigue”, has been observed in all types of rocks tested to date (Atkinson and Meredith, 1987; Brantut et al., 2012; Heap et al., 2011; Kranz et al., 1982; Robertson, 1960; Scholz, 1968; Zhang et al., 2012). During brittle creep, flaws such as microcracks contained in natural rocks are subcritically stressed and propagate slowly due to stress corrosion (a chemical weakening process) at crack tips in the presence of fluids. Sample-scale fracture then occurs after some time delay when the cracks coalesce and reach a critical length. As a result, the rocks lose their load-bearing capabilities and fail along a macroscopic fault plane at stresses well below their short-term strength (Scholz, 1972). For the sake of simplicity, we will use “creep” in the following text to refer to this brittle creep deformation.
It has been shown by experiments, observations and modeling that stress corrosion is the dominant mechanism of subcritical crack growth in rocks under upper crustal conditions (Brantut et al., 2012; Michalske and Freiman, 1983; Reber and Pec, 2018). Brittle creep deformation can be accelerated due to changes in the rate of stress corrosion induced by the chemistry of the injected fluids (Renard et al., 2005, 2020) or decelerated by crack tip blunting due to fluid interaction (Scholz, 1968). Overall, it is hypothesized that changes in stress corrosion crack growth rate due to a change in fluid chemistry will be reflected in similar changes of the macroscopic creep strain rate, either accelerating or decelerating based on the details of the ongoing dissolution–precipitation reactions (Brantut et al., 2013). Hence, the effect of CO2-rich fluids needs to be quantified for GCS applications.
To summarize, the influence of rock–fluid interaction on deformation is complicated and includes the coupled effects of mineral dissolution and precipitation, kinetics of fluid-assisted deformation and injection pressure buildup, finally resulting in time-dependent rock deformation. Carbonation changes the bulk composition of the basalts, alters their strength and pore structure, and affects the permeability of the rocks (Dunkel et al., 2017; Kanakiya et al., 2017; Kelemen et al., 2013; Kelemen and Hirth, 2012; Lisabeth et al., 2017; Xing et al., 2018; Zhu et al., 2016). Understanding of the effects of rock–fluid interaction on deformation requires dedicated laboratory studies with diverse fluid compositions at in situ pressure conditions and at elevated temperatures acting over extended timescales. The present study aims at elucidating the effect of rock–fluid interaction on the time-dependent rock deformation by investigating long-term creep of Icelandic basalt saturated with various fluid compositions.
2.1 Starting material and sample configuration
We used Icelandic basalt drill cores from the CarbFix site, collected at ∼ 350 m depth. The composition of Icelandic basalt has been identified as tholeiite and contains ∼ 25 wt % of calcium, magnesium and iron oxides (7 wt %–10 wt % Ca; 5 wt %–6 wt % Mg; 7 wt %–13 wt % Fe) with an average porosity of ∼ 8 % based on hydrological and tracer recovery modeling (Alfredsson et al., 2008, 2013; Aradóttir et al., 2012; Matter and Kelemen, 2009; Snæbjörnsdóttir and Gislason, 2016). The rock is formed by an aphanitic matrix that consists of crystals of feldspars, clinopyroxene, olivine, glass and secondary alteration minerals as shown in Figs. 1 and A1 in the Appendix. Our observations are consistent with previously reported petrographic analysis which shows that the primary minerals of the Icelandic basalt are predominantly plagioclase (An90−30), olivine (Fo90−80), clinopyroxene (augite), magnetite–ilmenite and interstitial glass, alteration of the basaltic lava flows commonly leads to smectite and zeolite precipitation (Alfredsson et al., 2013; Larsson et al., 2002). The fraction of crystal-to-glass ratio as well as crystal habitat is variable as documented in Fig. 1. Round pores with a mean diameter of ∼ 0.5 mm are randomly distributed throughout the matrix; some are filled with feldspar (primarily potassium feldspar) and some are voids with no filling (Fig. 1). Pore walls, as well as pre-existing crack walls, are coated by a thin layer of a phyllosilicate, as documented in Fig. 1d and e. The matrix is locally altered by dissolution of larger subhedral feldspar crystals and local replacement by phyllosilicate (see Fig. 1b and e). Cylindrical samples were ground to ∼ 40 mm in diameter and ∼ 80 mm in length (see Table 1). The samples were jacketed using copper foil of ∼ 0.05 mm thickness, joined to titanium end caps by Viton tubes and coated with Duralco 4538 epoxy. The end caps had a concentric hole which allows fluid access to the sample. Figure 2 shows the schematics of the sample configuration in this study. An internal force gauge was mounted below the sample inside the vessel, allowing direct measurement of the differential stress (). Displacement of the axial piston was measured externally using a linear variable differential transformer (LVDT). Variations of the sample length were measured using two internal LVDTs. Local axial (ϵa) and radial strains (ϵr) of the rock were measured using strain gauges affixed to the copper jacket around the sample. Piezoelectric sensors were installed around the sample for passive monitoring of acoustic emissions (AEs).
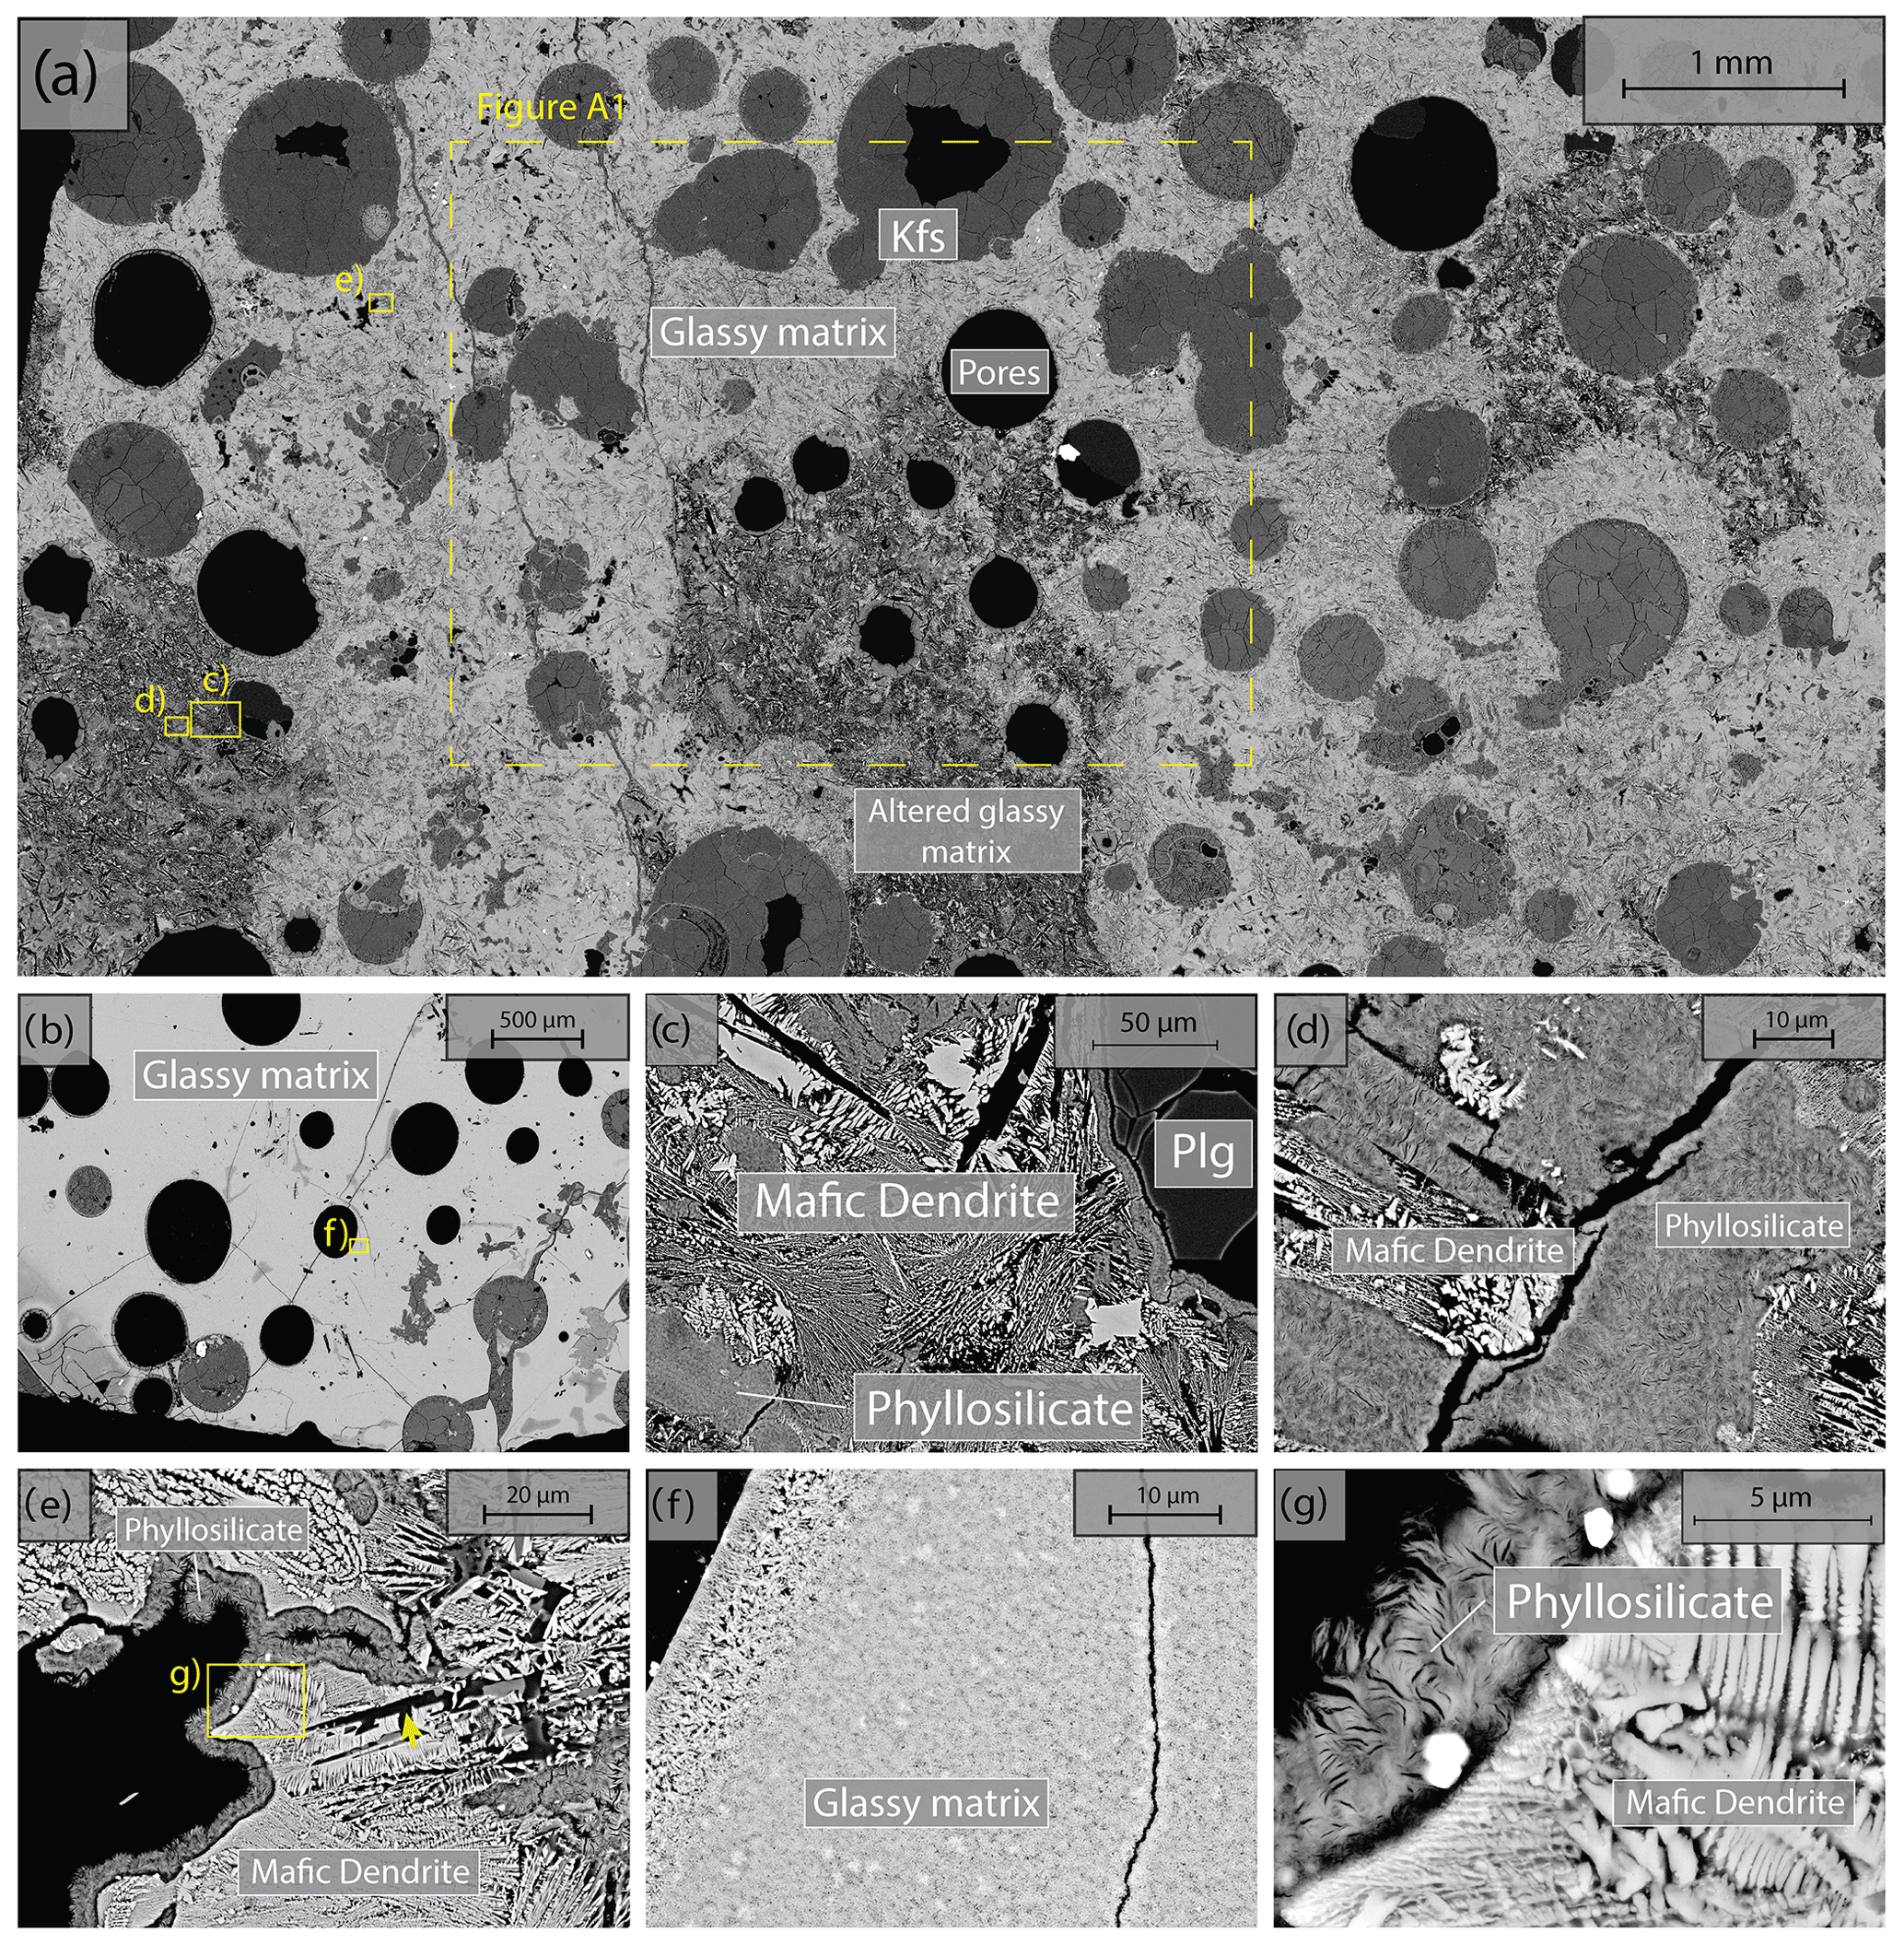
Figure 1Backscattered electron (BSE) images of the starting material. Location of higher-magnification images is shown by yellow rectangles. (a) Representative sample microstructure; the glassy matrix shows a range of crystal content and habitat and is locally altered; the area where energy dispersive spectroscopy (EDS) analysis is conducted (see details in Fig. A1) is marked by the dashed rectangle. (b) Another common glassy matrix microstructure with finer, more homogenous crystals. (c) Detail of altered matrix and pore wall. Note the black voids in the shape of subhedral feldspar laths in the matrix. (d) Detail of patchy phyllosilicate alteration and dendritic crystals in altered matrix. (e) High-magnification image of dendritic crystals forming the matrix and phyllosilicate coating of the pore wall. (f) High-magnification image of glassy matrix with homogenous small crystals. (g) High-magnification image of dendritic crystals forming the unaltered matrix and high-magnification image of the phyllosilicate alteration.
Because of the variation in structure and composition of the natural material and limited drill core material available, we adopted the “stress-stepping” experimental procedures to study creep deformation (Heap et al., 2009; Lockner, 1993). This method allows several creep experiments to be conducted on a single sample at different stress levels and minimizes the issue of intersample variability (see details in Sect. 2.2). Piezoelectric sensors allowing independent recording of compressional and shear waves were fabricated with PZT-5A ceramics with thickness of 3 to 5 mm and resonance frequency of ∼ 450 kHz to 1 MHz. The PZT-5A crystals were mounted on titanium spacers with one side concavely curved to match the sample surface, thus providing protection of the sensing crystals and optimal contact area. A backup element was epoxied to the back of the sensor to minimize ringing. We also used analogue low-pass filters (∼ 500 kHz) compatible with the frequency range of the employed PZT ceramics to reduce the electromagnetic interference (EMI) effect. Data were collected using two combined four-channel universal serial bus (USB) oscilloscopes, recording at 50 MS/s with a 12-bit resolution (TiePie HS4-50). Using low-noise amplifiers (ITASCA-60dB), we carefully selected the most sensitive sensor positions, preferably far from each other, as master channels. The data collection system was set such that, if the master channels detected a signal satisfying a sufficiently large signal noise ratio in a moving time window, the event would be recorded in all channels. We amplified the two master channels with a flat gain of 60 dB in a frequency range of 50 kHz to 1.5 MHz. Frequencies from 1.5 to 15 MHz were amplified nonlinearly, the gain decreasing exponentially from 52 to 37 dB with increasing frequency (Ghaffari et al., 2021; Ghaffari and Pec, 2020). Considering the above limitations, the main frequency range of the recording system was between ∼ 50 and 500 kHz, although other frequencies could be recorded due to the exponential nature of the amplification filters.
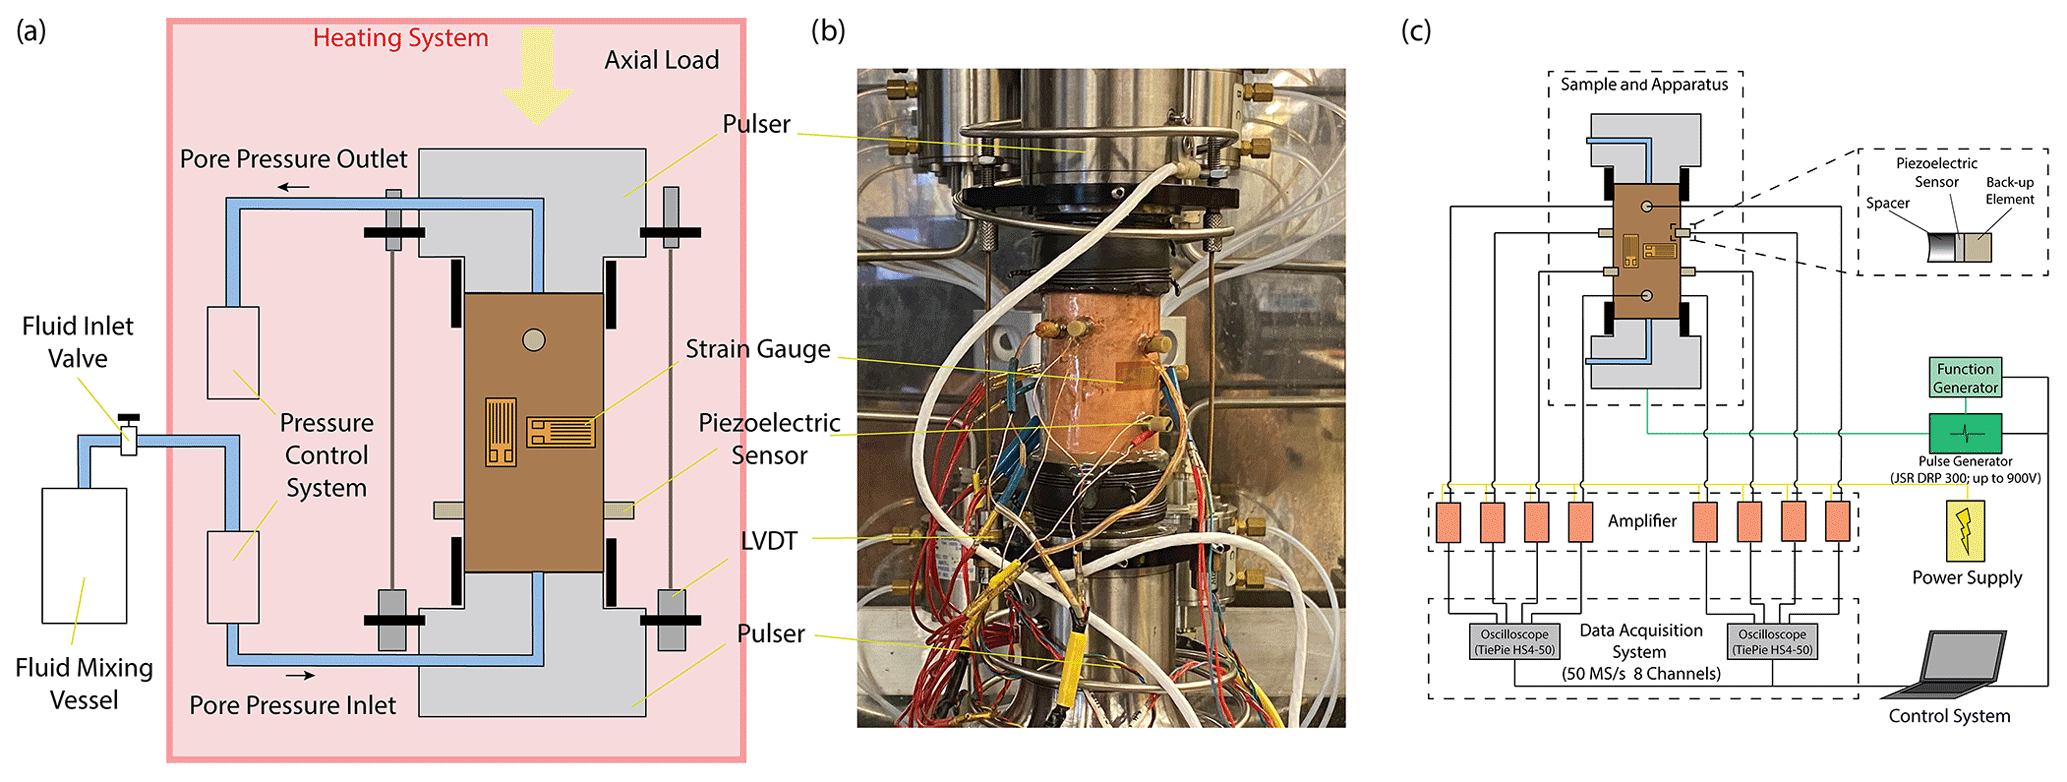
Figure 2(a) Schematics of sample configuration. The whole sample assembly and pore fluid actuators are enclosed in a servo-controlled heating system to ensure a uniform temperature condition. (b) Photo of the sample assembly. (c) Illustration of the acoustic emission recording system.
2.2 Experimental setup and analytical methods
All experiments were conducted at 50 MPa effective pressure, Peff, with pore fluid pressures, Pf, of either 0 or 5 MPa for dry and fluid-saturated experiments, respectively. The fluids used in this study were H2O and H2O + CO2. The H2O + CO2 fluid is prepared in the fluid mixing vessel (Fig. 2a) where deionized water is saturated with CO2 in the vessel under a gas pressure of 5 MPa. The fluid-saturated samples were first immersed in deionized water under vacuum for more than 30 d prior to the experiment. Details of the experimental conditions are listed in Table 1. The samples were inserted in the NER Autolab 3000 testing rig installed at Massachusetts Institute of Technology (MIT) and deformed under triaxial stress conditions, with the maximum principal stress (σ1) acting in the axial direction. The radial principal stresses (σ2 and σ3) were generated by the confining pressure, i.e., . The effective pressure is calculated as . During deformation, a constant pressure difference of 0.5 MPa was maintained between the inlet and outlet of the pore pressure system, while the mean pore pressure was kept at 5 MPa. We thus maintained fluid flow across the sample and measured the permeability evolution during deformation. In one H2O + CO2 experiment (OR2_M), we closed the fluid mixing vessel after the initial filling of the sample and thus formed a closed pore fluid loop (OR2_M was referred to as the H2O + CO2 closed experiment in the following discussion). In the other H2O + CO2 experiment (OR3_B), the pore fluid system was connected to the fluid mixing vessel during the entire experiment and therefore acted as a semi-open system since it was in constant communication with a large CO2 source (OR3_B was referred to as the H2O + CO2 open experiment in the following discussion).
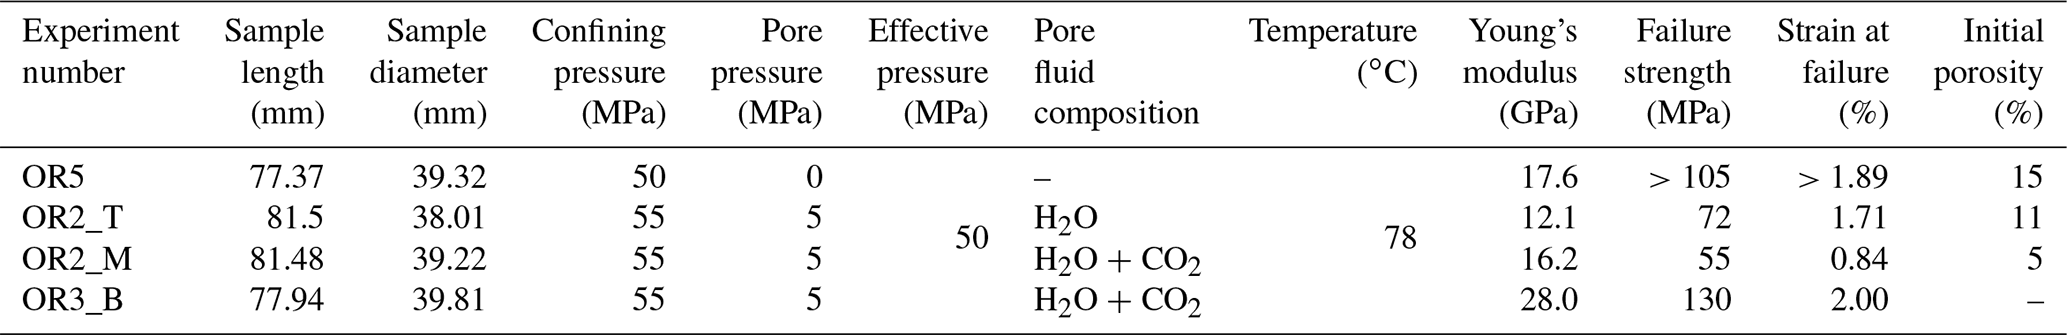
Table 1Details of the sample parameters and experimental conditions. Sample OR5 was not loaded to its failure strength due to early failure of the strain gauges and LVDTs. Porosity is estimated from the X-ray tomographic image of the sample. Initial porosity of the sample OR3_B is not available due to limited access to the X-ray tomography facility during the COVID-19 pandemic.
We started the experiments by bringing the sample to an effective pressure of 50 MPa and subsequently to a temperature of ∼ 80 ∘C while holding the pressure constant. Heating the sample took ∼ 12 h, which was long enough to allow thermal equilibrium to be reached. After reaching the desired P–T conditions, the samples were deformed using a step-loading procedure. During a step, the differential stress was increased at a rate of ∼ 2 MPa/min, which corresponds to an axial strain rate of ∼ 1.1 × 10⁻⁶ s−1. Once the desired stress level was reached, we kept the load constant for ∼ 24 h, while monitoring the sample deformation. This step sequence was repeated until failure of the sample occurred – typically during the increase of differential stress. We recorded the stress level at which the failure occurred as “failure strength” and use this parameter to quantify the strength of the tested material. We point out that the definition of “failure strength” used here presents a lower bound for the commonly presented “ultimate strength” which is measured in short-term, constant displacement rate deformation experiments. The dry experiment is halted earlier due to failure of the strain gauges and LVDTs and therefore the strength estimate is only a lower bound of the failure strength. The total duration of the experiments ranged between 5 and 12 d. Details of the load steps are summarized in the Appendix (Fig. A2).
In this study, we focus on the transient creep evolution and only creep steps where final failure is not observed are analyzed. We use the term “phase I” to refer to the creep immediately following a stress change, during which the creep strain evolves rapidly (i.e., relatively higher strain rate). We call “phase II” the portion of the creep curve with an approximately constant or very slowly varying strain rate over a ∼ 24 h window (i.e., ; see Figs. A3 and A4). For comparison with previous work on brittle creep, we calculate a characteristic creep strain rate using a least-squares fit to the slope of the creep strain vs. time curve during the identified phase II transient creep (Fig. A5; we will simply refer to it as “creep rate” in the following discussion).
To investigate the microstructural changes occurring during deformation, the rock samples were scanned before and after deformation using X-ray computed tomography with scan parameters set at ∼ 150 kV and ∼ 250 µA. The obtained X-ray images have a pixel size of ∼ 90 × 90 µm. Thin sections were prepared from selected samples and imaged using a field emission scanning electron microscope (SEM).
The evolution of fluid composition was evaluated by collecting fluid samples from the end of the pore fluid outlet (Fig. 2a) after each creep step. The concentrations of Mg2+ and Ca2+ in the fluid sample were analyzed using the inductively coupled plasma mass spectrometry (ICP-MS).
3.1 Creep deformation and creep strain rate
The creep deformation during each load step exhibited typical transient creep evolution (Brantut et al., 2013; Robertson, 1964; Scholz, 1968) with a transition from phase I, where rapid straining occurs, to a slowly varying phase II, which exhibits an approximately constant strain rate over our observation time (Fig. 3). This transition generally took place within the first 104 s (∼ 2.7 h) of the loading step. In the dry experiment, large variations in phase I creep strains were observed (Figs. 3a and 4c), and the creep rates measured during the slowly evolving phase II stages showed a neutral sensitivity to stress (Fig. 3e). In experiments where pore fluids were present (H2O and H2O + CO2), the strain accumulated during the phase I creep systematically increased with increasing stress, and the creep strain rate during the phase II creep displayed a clear exponential dependence on stress (Fig. 3e). This stress sensitivity of creep strain rate showed strong similarity in the different experiments irrespective of the pore fluid composition and can be adequately described by power-law (e.g., Atkinson, 1984; Meredith and Atkinson, 1983) as well as exponential functionals (Charles and Hillig, 1962; Hillig, 2006), but the exponential model seems to work slightly better with our data according to the R2 value (see Fig. A6).
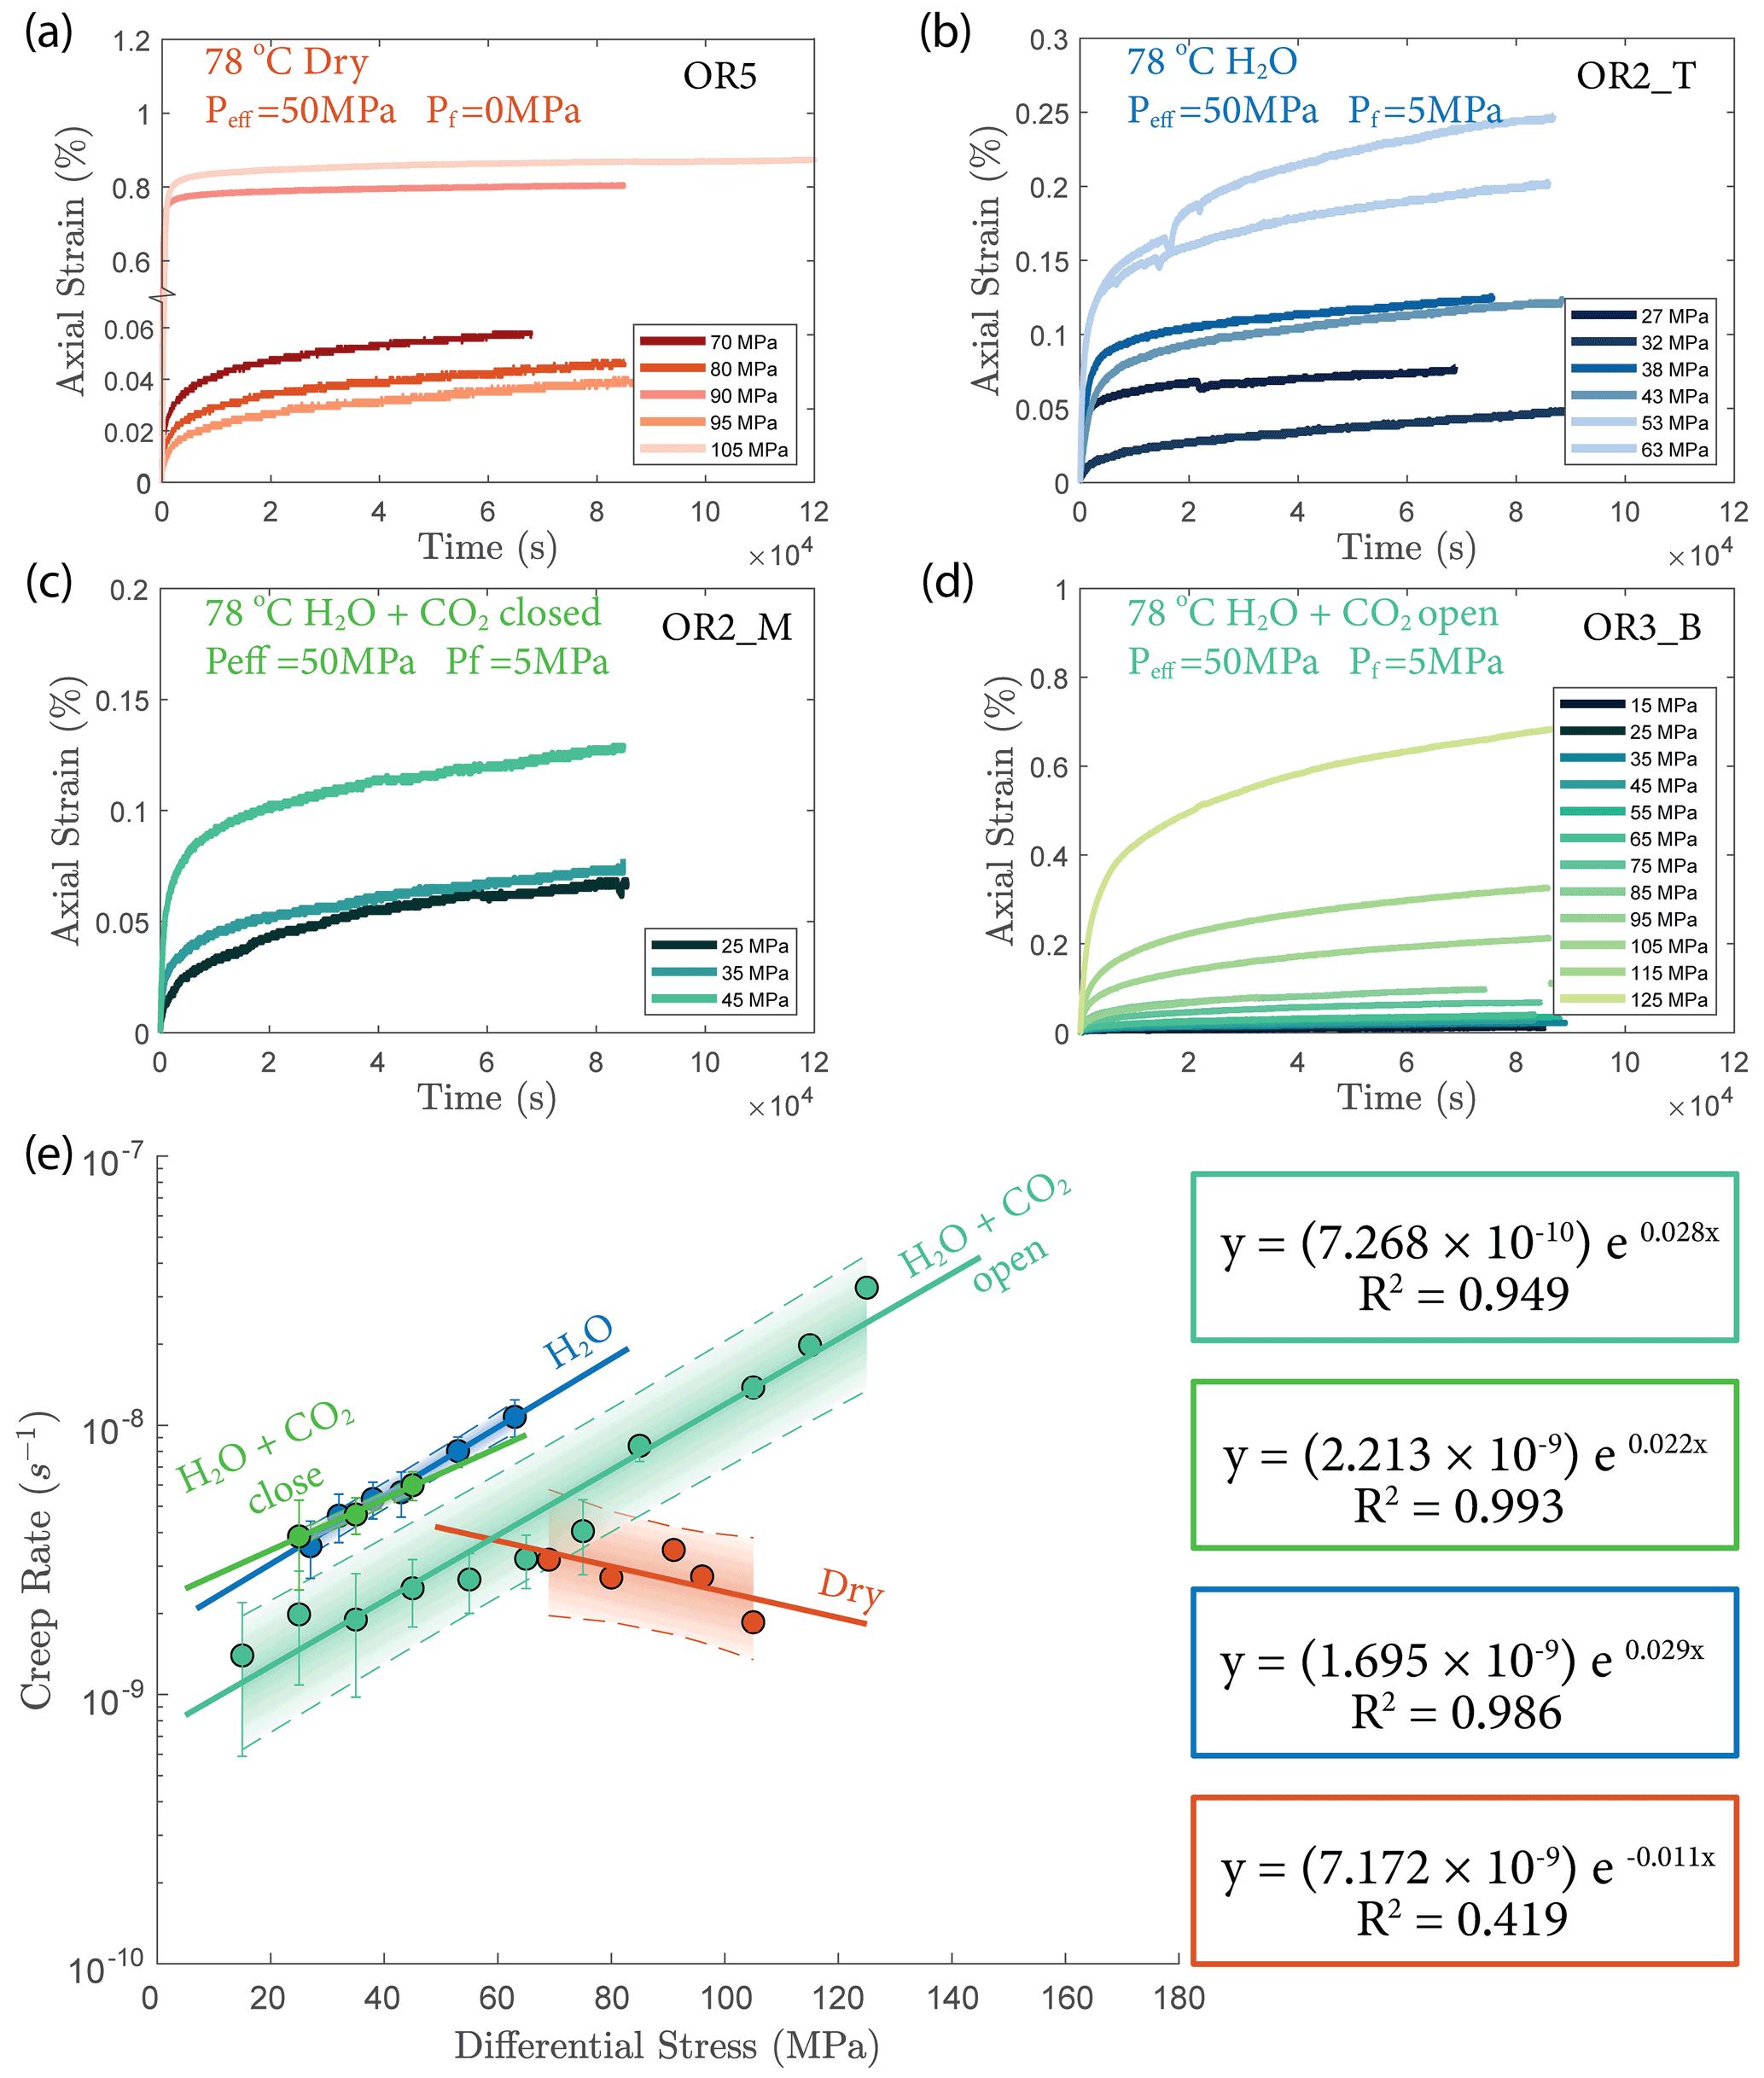
Figure 3(a–d) Axial strain evolution of each individual stress step for all experiments; (e) stress dependence of creep rate. The error bar marks the 95 % confidence interval of each calculated creep rate. The stress–creep rate relationship can be best modeled using an exponential law. The dashed line and shaded area mark the 95 % confidence interval of the fitted exponential relationship. The stress dependence of creep rate in the dry experiment is considered neutral as the R2 becomes low for the fitting with negative slope. Color code of the plot follows the same pattern as panels (a)–(d).
In Fig. 4, we compare the strain accumulation during phase I and II of the transient creep as illustrated in Fig. A4a. We observe a universal power-law relationship of the accumulated creep strain during phase I (εi) to creep stain accumulated during phase II (εii) in all experiments irrespective of fluid presence or the composition of the fluid (Fig. 4a); i.e., the ratio between log εi and log εii remains constant. The accumulated creep strains during both phase I and phase II were exponentially dependent on creep stress (Fig. 4c and d). In Fig. 4b, we show that regardless of the creep stress level, the ratio between the logarithmic accumulated phase I and logarithmic phase II creep strain after ∼ 24 h was approximately constant, except for two outliers associated with two stress steps in the dry experiment, during which anomalously large phase I creep strains occurred (Fig. 4a and c).
Overall, the fluid-saturated samples crept faster than the dry sample during phase II stages in similar stress conditions. In spite of variations in failure strength, the fluid-saturated samples consistently showed stronger stress dependence of the creep rate than the dry sample. Comparing the fluid-saturated experiments, we observe that the sample saturated with H2O had the same creep rate as the H2O + CO2 closed experiment and a higher creep rate than the H2O + CO2 open experiment under similar stress level (Fig. 3e). Analysis of the fluid chemistry demonstrates that the H2O + CO2 closed and H2O experiment show the same fluid composition which we will describe in more detail in Sect. 3.6.
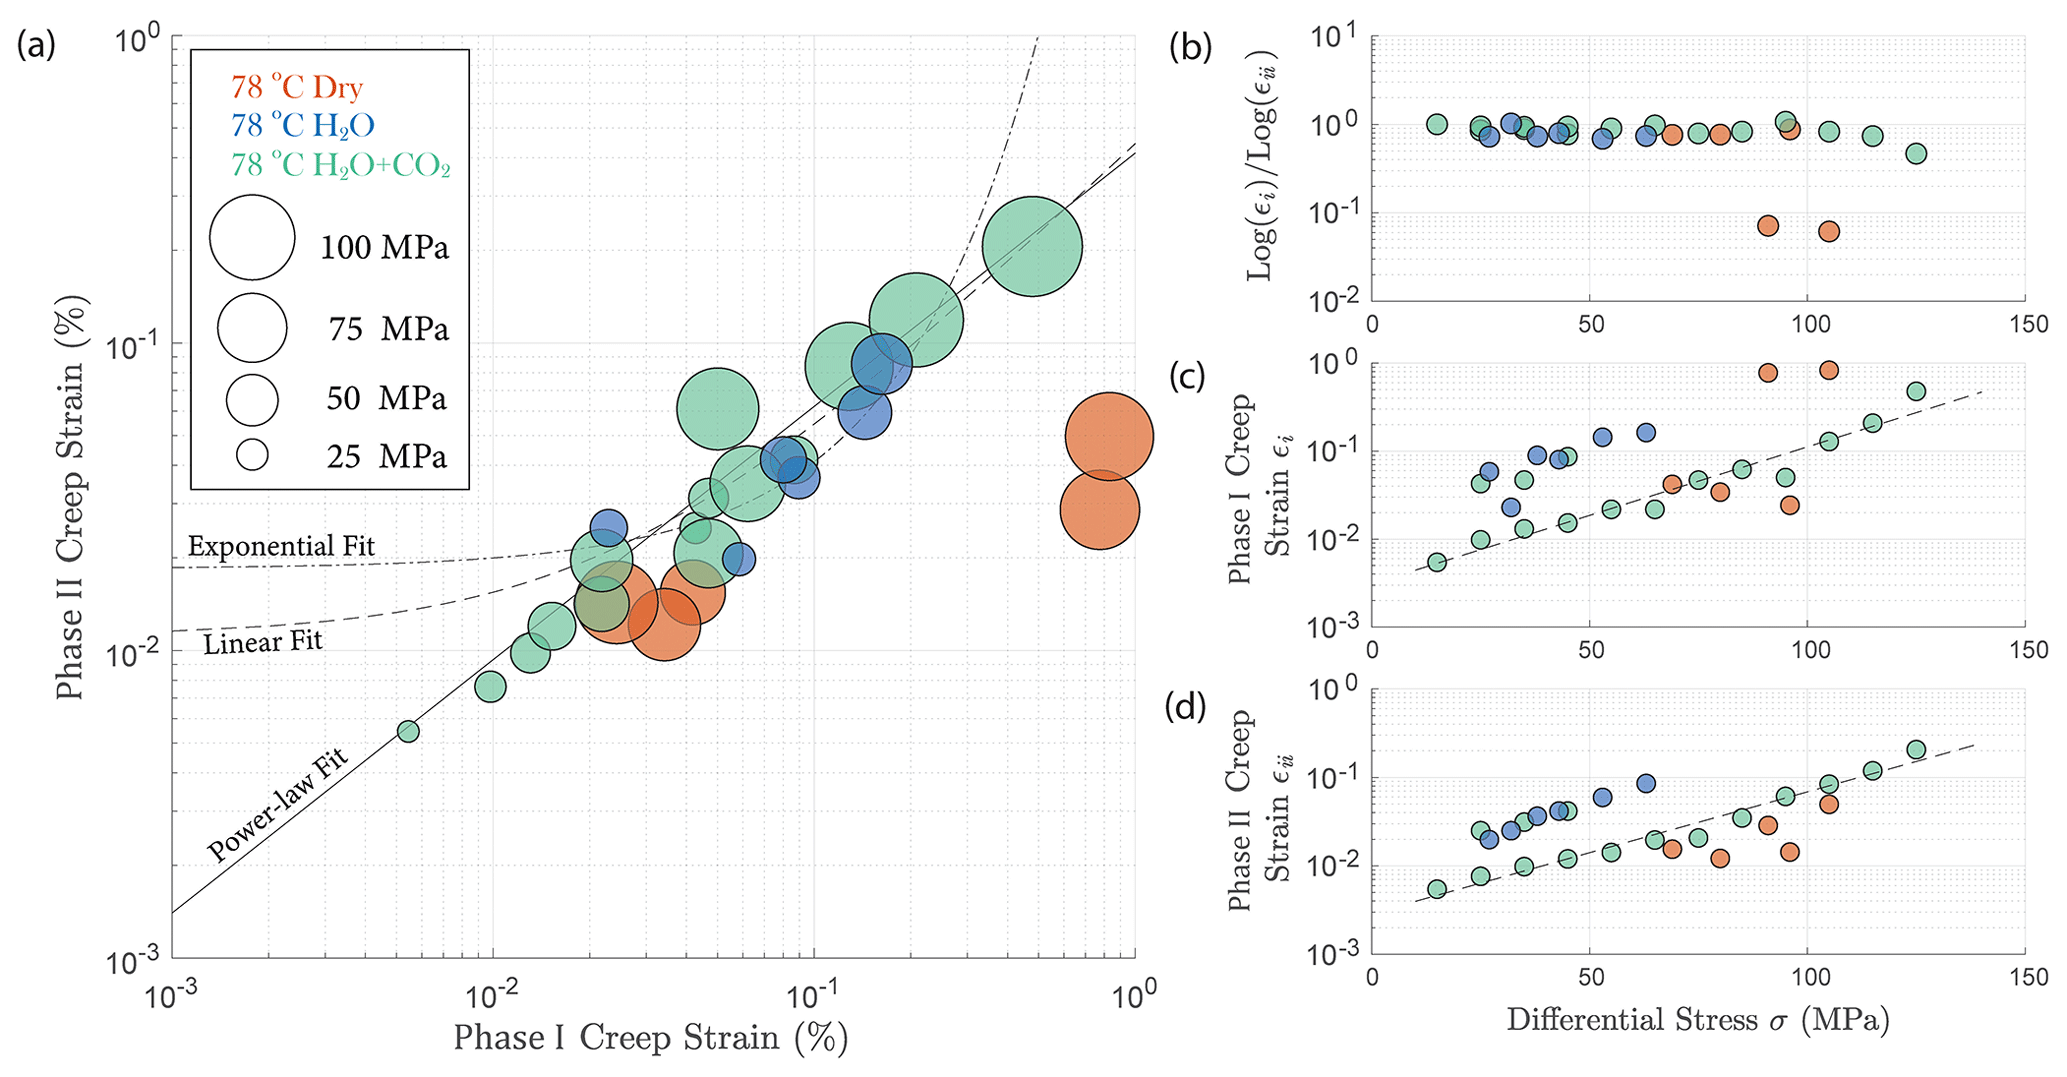
Figure 4(a) Relationship between total phase I creep strain and phase II creep strain ∼ 24 h after the stress step loading. The creep stress level is reflected by the size of the circles; (b) ratio between the logarithmic total phase I and logarithmic phase II creep strain remains constant and is independent of stress; the cumulated (c) phase I and (d) phase II creep strain is exponentially dependent on the creep stress. The fitted lines are calculated based on the data obtained from the H2O + CO2 open experiment (OR3_M).
3.2 Volumetric strain
In all experiments, creep deformation was initially compactive as indicated by a positive change in the volumetric strain, ϵv, calculated from the strain gauge measurements (). Shear-enhanced dilation (Brace et al., 1966) started 10–20 MPa before the failure strength of the sample was reached (highlighted by yellow arrowheads in Fig. 5). The onset of dilation generally occurred at a lower stress level in the fluid-saturated experiments than in dry conditions. The largest dilation was observed in H2O + CO2 open experiments, as shown in Fig. 5d. In the dry experiment, a large amount of dilation (ϵv>0.5 %) was also observed at creep stress of ∼ 90 and ∼ 105 MPa, which is significantly higher than in other steps (ϵv<0.1 %). Furthermore, the dilation at ∼ 90 MPa is also accompanied by a drop in stress (see Fig. 5). The strength of the tested samples seems to be correlated with the elastic modulus measurements; the stiffer the rock, the higher the strength (see Table 1).
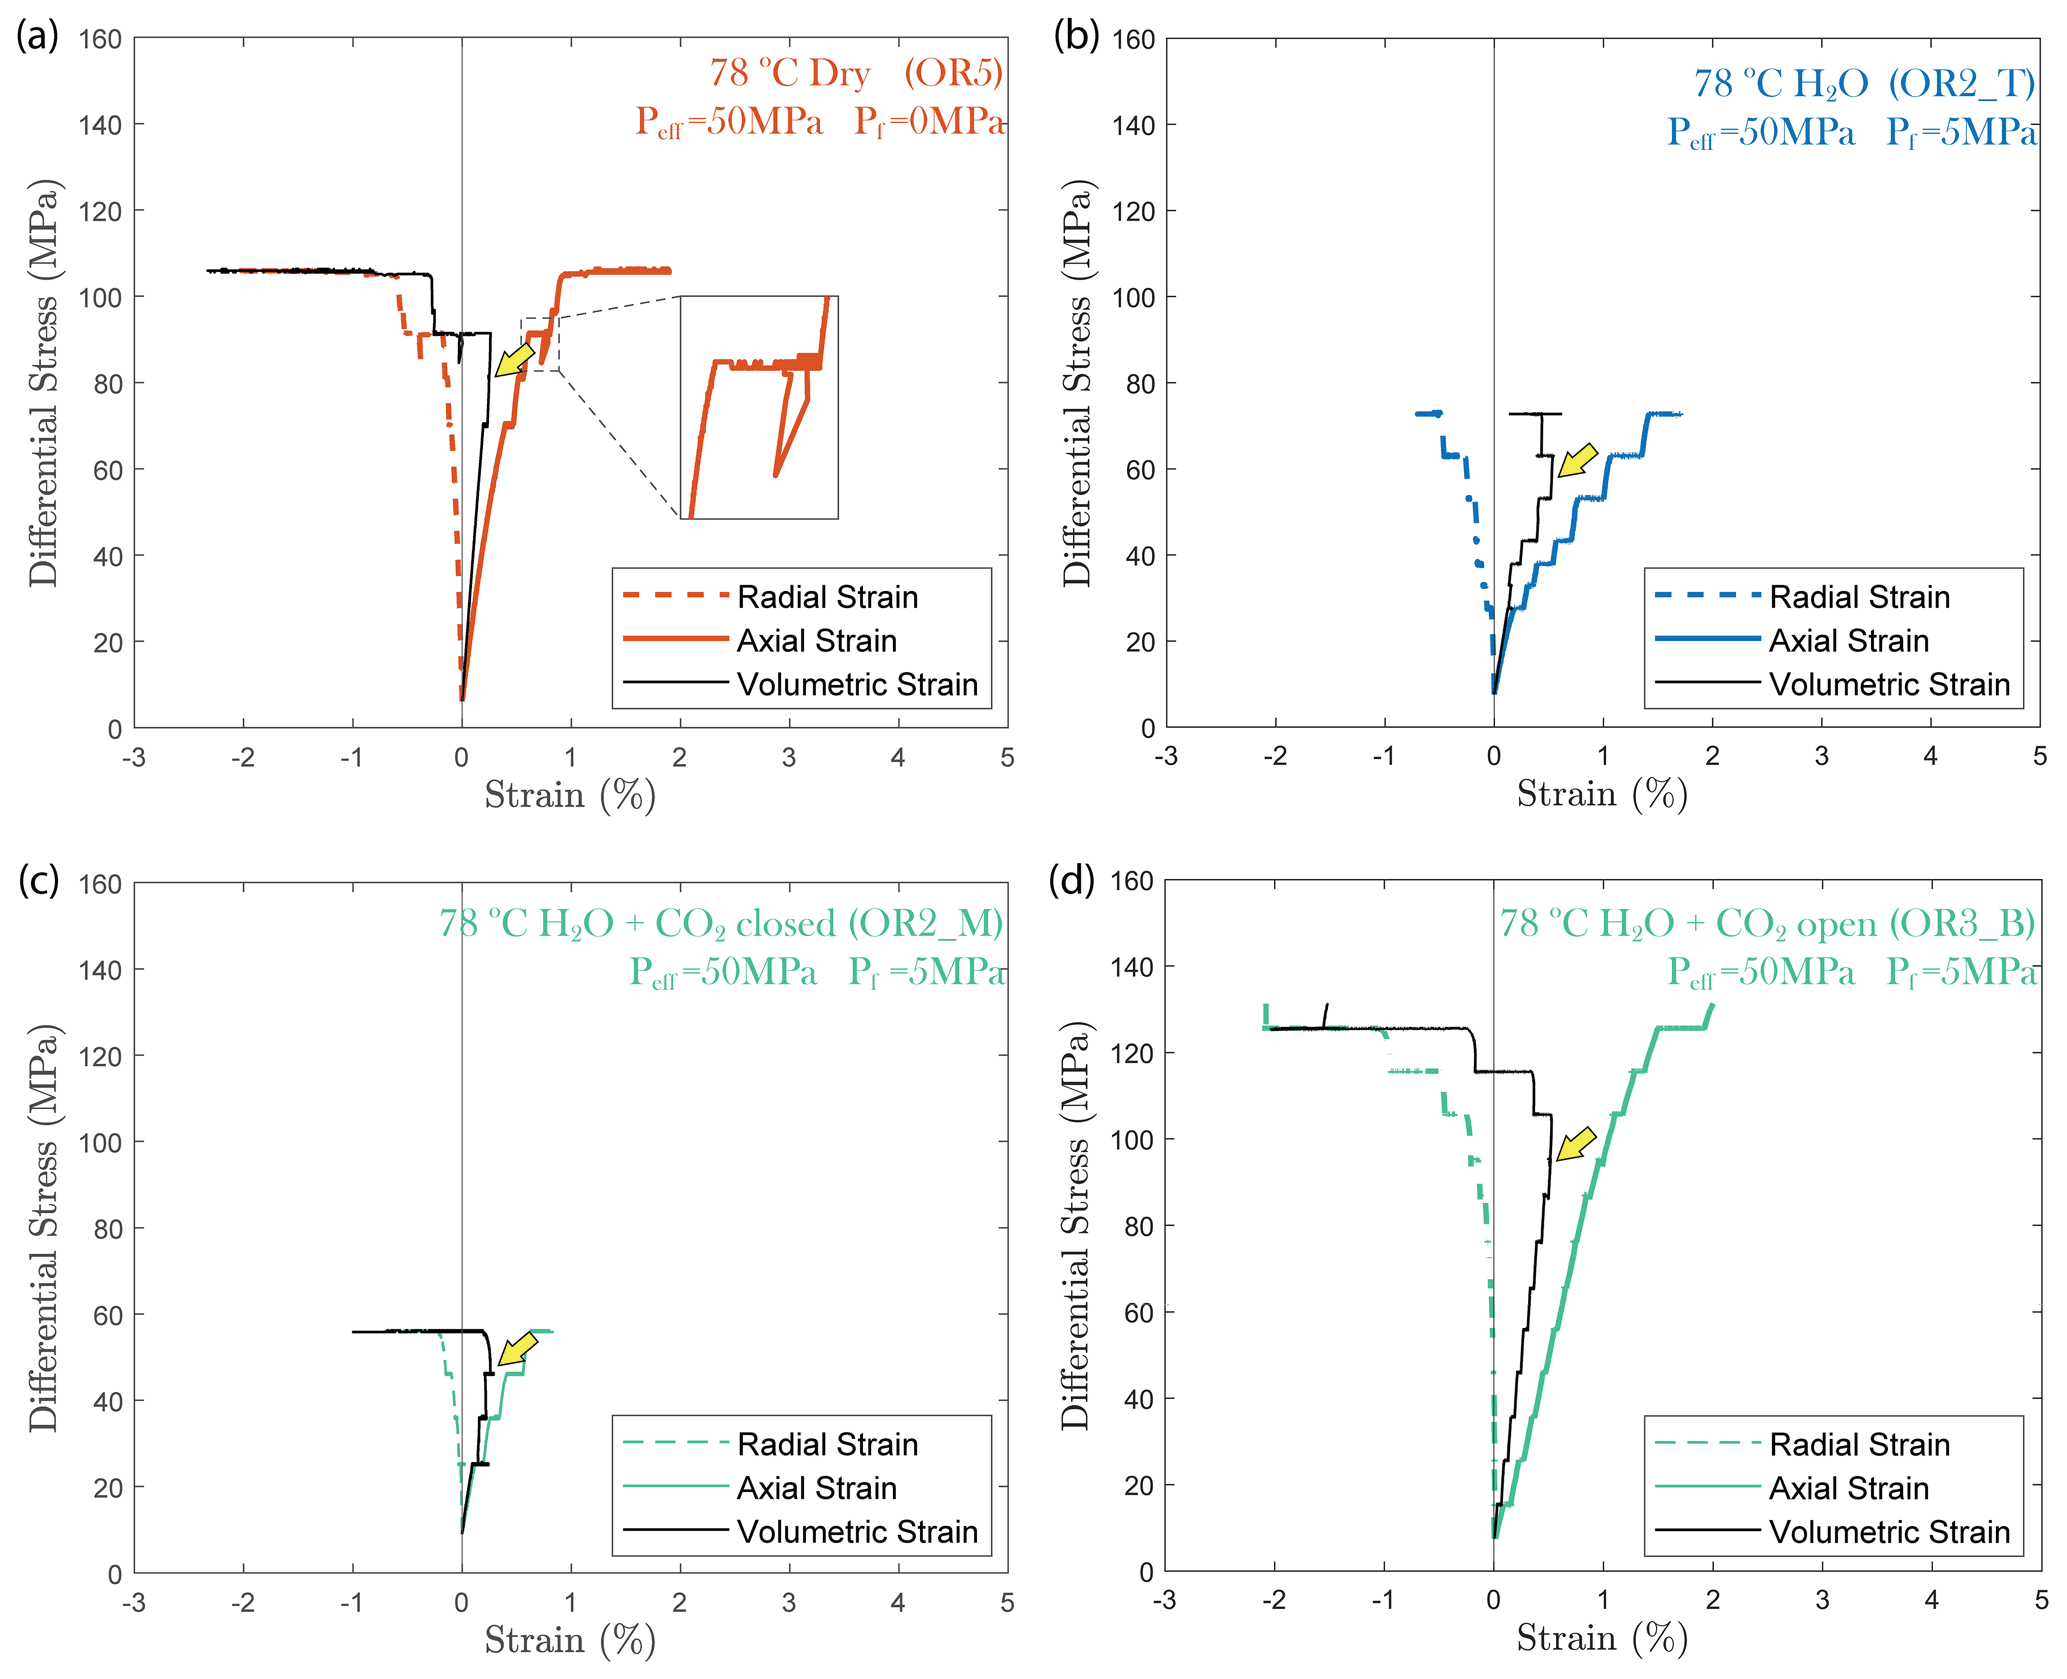
Figure 5Plots of volumetric strain for (a) dry, (b) H2O, (c) H2O + CO2 closed and (d) H2O + CO2 open experiments. The onset of transition from compaction to dilatancy () is marked by the yellow arrowhead. In the dry experiment, the differential stress exhibits temporary fluctuation at ∼ 90 MPa (highlighted by the dashed rectangle).
3.3 Permeability
In fluid-saturated experiments, permeability decreased with increasing effective pressure during hydrostatic loading (Fig. 6a, b and c). The largest decrease in permeability was observed in the water-saturated experiment, where permeability dropped by 3 orders of magnitude as effective pressure was raised from 15 to 50 MPa (Fig. 6a). Permeability reduction was much lower in both H2O + CO2 experiments, only ∼ 1 order of magnitude, over the same effective pressure range (Fig. 6b, c). Permeability variations after heating are shown in Fig. 6d, e and f, where the minimum permeability reached during hydrostatic loading is indicated for comparison (empty circles in Fig. 6d, e and f). The permeability change during heating was rather small in the H2O and H2O + CO2 closed experiment, while the H2O + CO2 open experiment exhibited more than an order of magnitude permeability reduction after heating.
During creep, permeability did not evolve much with time but did show a clear dependence with the stress level of the individual creep stages, first slightly decreasing with increasing differential stress and then substantially increasing when the onset of transition from compaction to dilatancy () was passed, shortly before failure (Fig. 6d and f).
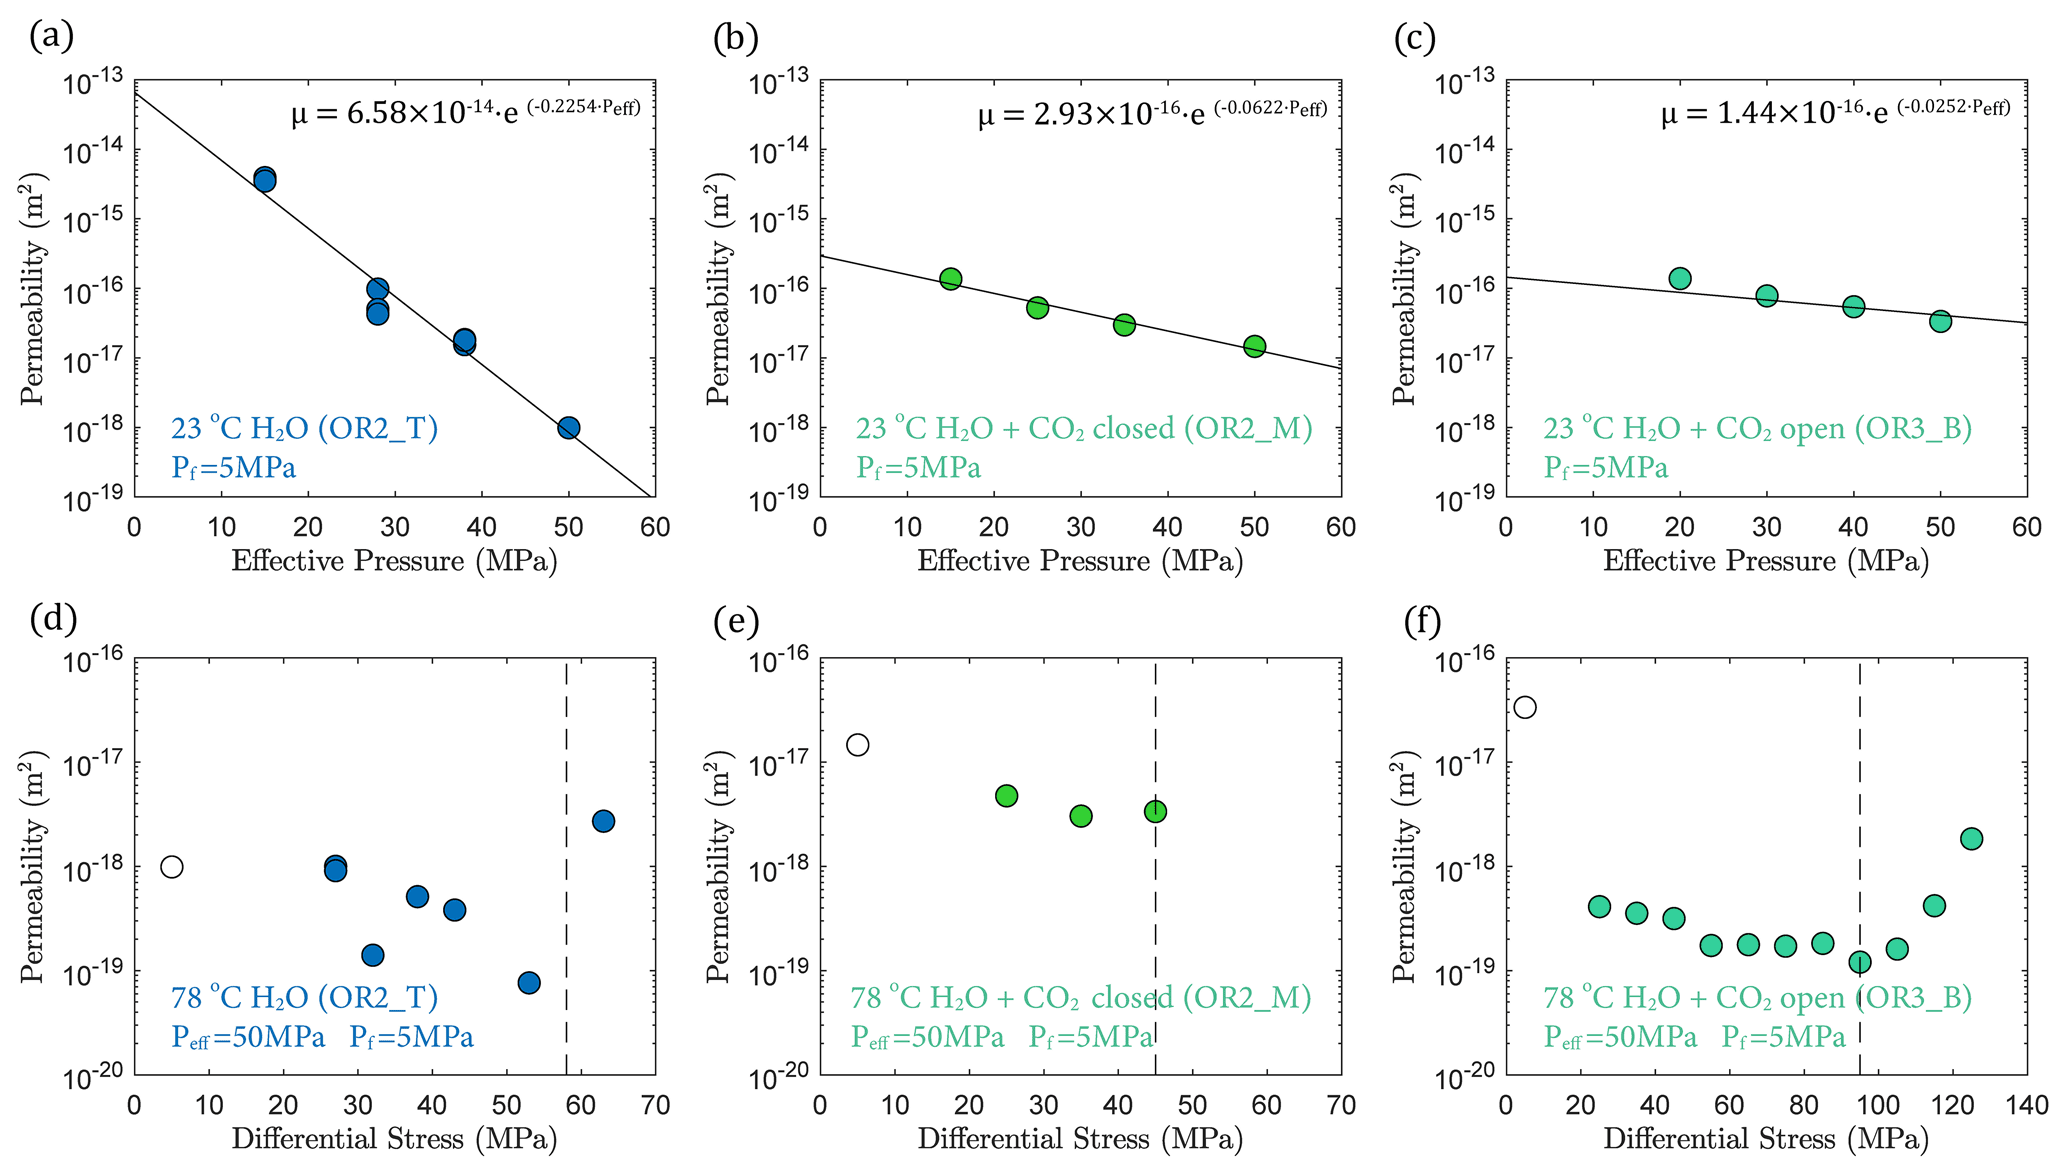
Figure 6Permeability evolution due to changes in effective pressure (a, b, c) and differential stress (d, e, f). The dashed line marks the onset of transition from compaction to dilatancy () as previously shown in Fig. 4. The empty circle indicates the permeability measurement before heating.
3.4 Characterization of the acoustic emissions
3.4.1 Passive recording and rate of AEs
We observed a strong correlation between acoustic emissions and mechanical data as documented in Fig. 7. The number and amplitude of AEs was substantially larger in the experiments with pore fluids than in the dry experiment, irrespective of fluid composition. The rate of AEs increased during primary creep; the greater the accommodated strain was, the higher the AE rate. The AE rate then decayed exponentially as the rock entered the later stage of the transient creep. This decay was slower in all fluid-saturated experiments where a significant amount of AE activity continued during the phase II creep stage. The AE rate increased as the stress was approaching the failure strength of the sample (Fig. 7). In Fig. 8, we plot the normalized cumulative AE counts against the normalized creep strain measured during each creep step. For all experiments with pore fluids, we see that the data points tended to cluster near the 0–1 diagonal (Fig. 8b, c and d), thus supporting a strong correlation between acoustic emissions and creep strain. In the dry experiment, most AEs occurred early in each load step (normalized strain ≤0.2) after which straining continued with little AE activity (Fig. 8a).
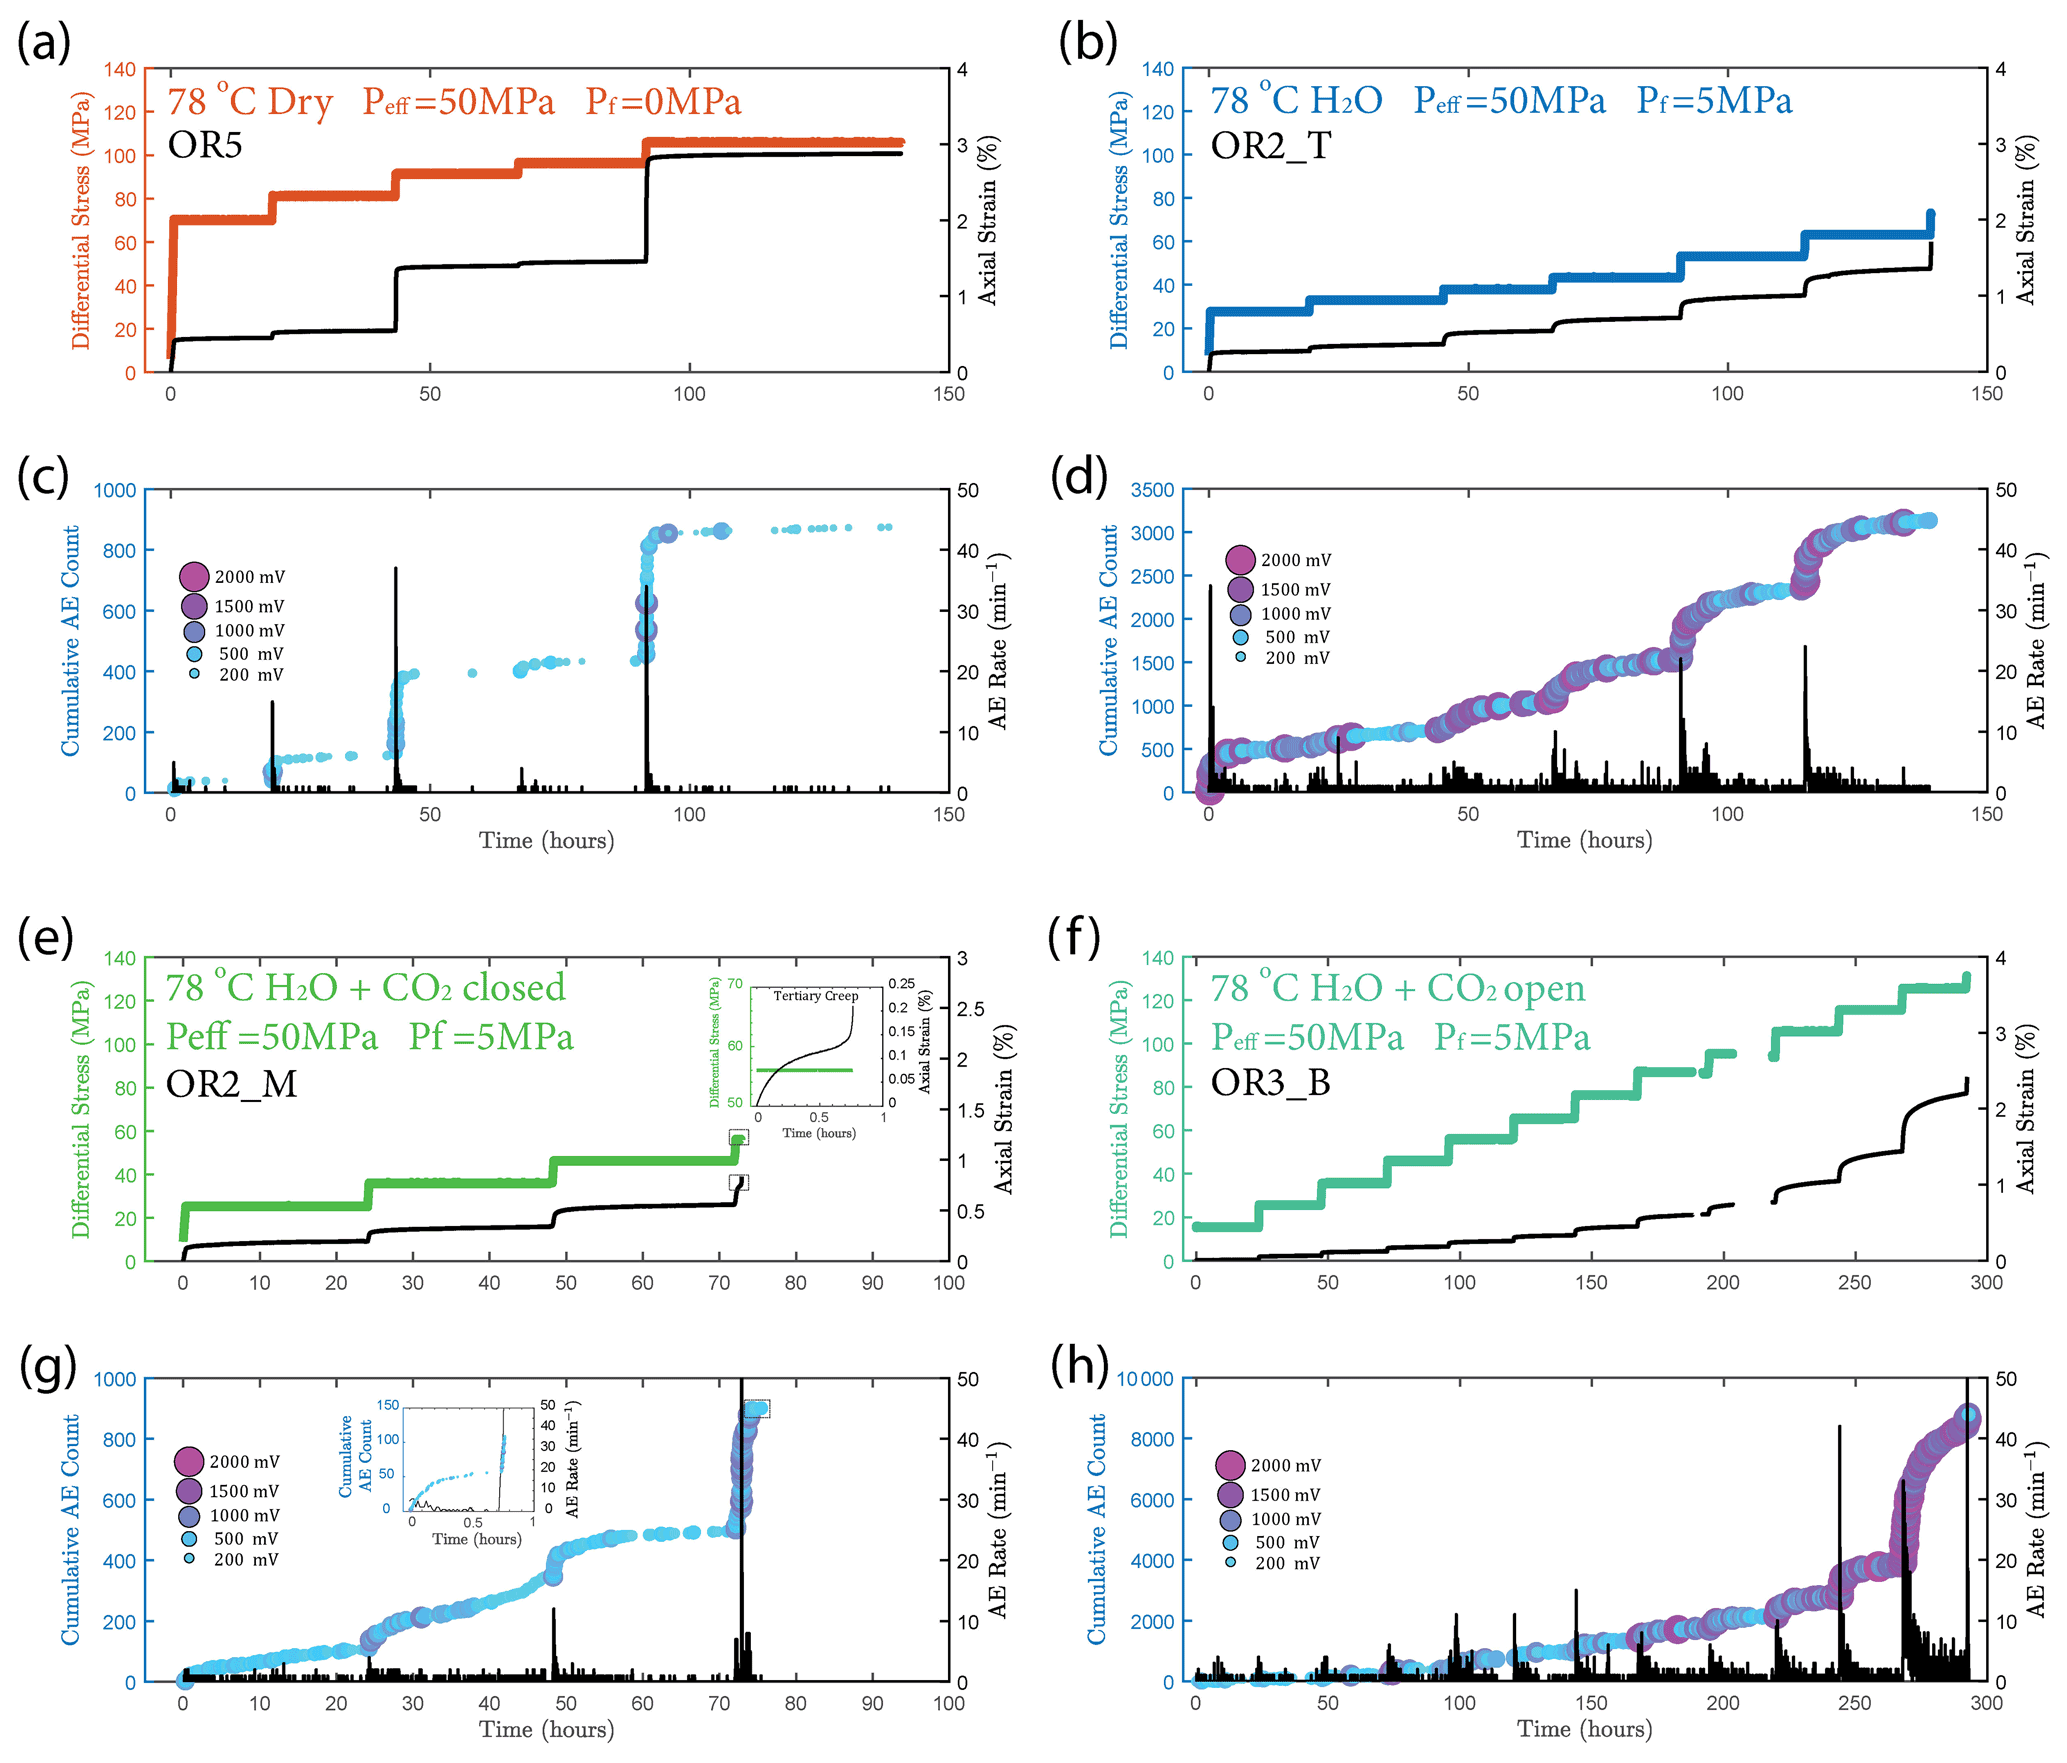
Figure 7(a, b, e, f) Plot of stress loading steps and strain (black) evolution. (c, d, g, h) Evolution of cumulative number of acoustic emission (AE) and AE rate evolution (black) over time for (a, c) dry, (b, d) H2O, e.g. H2O + CO2 closed (note the short tertiary creep stage accompanied by a burst of AE activities during the last stress step; see insets) and (f, h) H2O + CO2 open experiments.
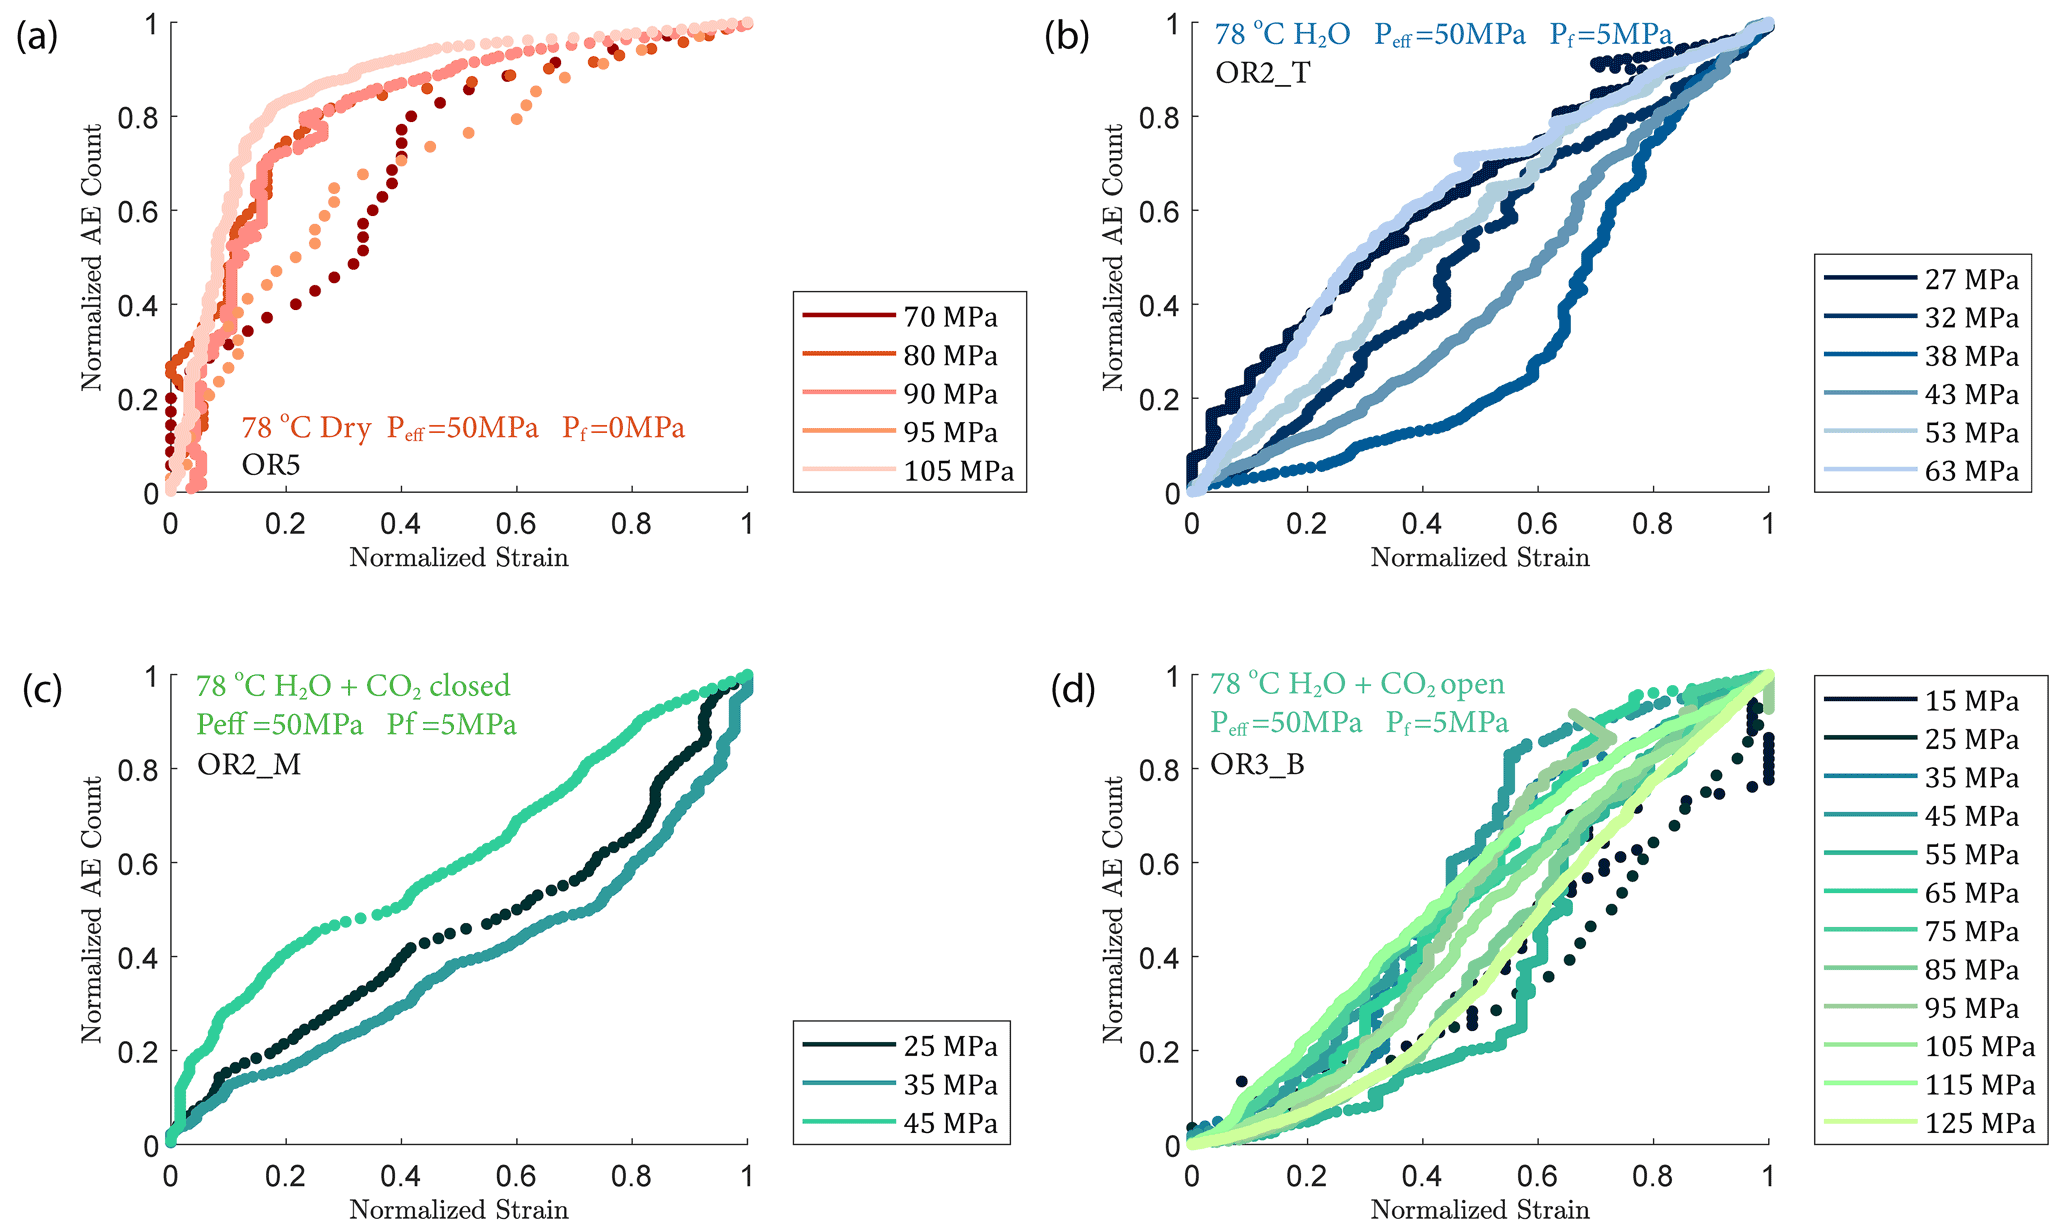
Figure 8Plot of normalized cumulative AE count vs. strain (a) dry, (b) H2O, (c) H2O + CO2 closed and (d) H2O + CO2 open experiments. The normalized cumulative AE counts and strain during each creep step show an approximately linear correlation in most cases, except in the dry experiment.
3.4.2 Gutenberg–Richter b value
The Gutenberg–Richter relationship provides a way to characterize the AE statistics for each creep step. The Gutenberg–Richter b value was calculated using the following equation:
where A is the maximal amplitude of individual acoustic events and N is the number of events with magnitude larger than A. Figure 9 shows that the b value increased with increasing stress in the fluid-saturated experiments but remained constant in the dry experiment. The observed increases of the b values indicate that low-amplitude AEs had a proportionally larger occurrence frequency with increasing stress.
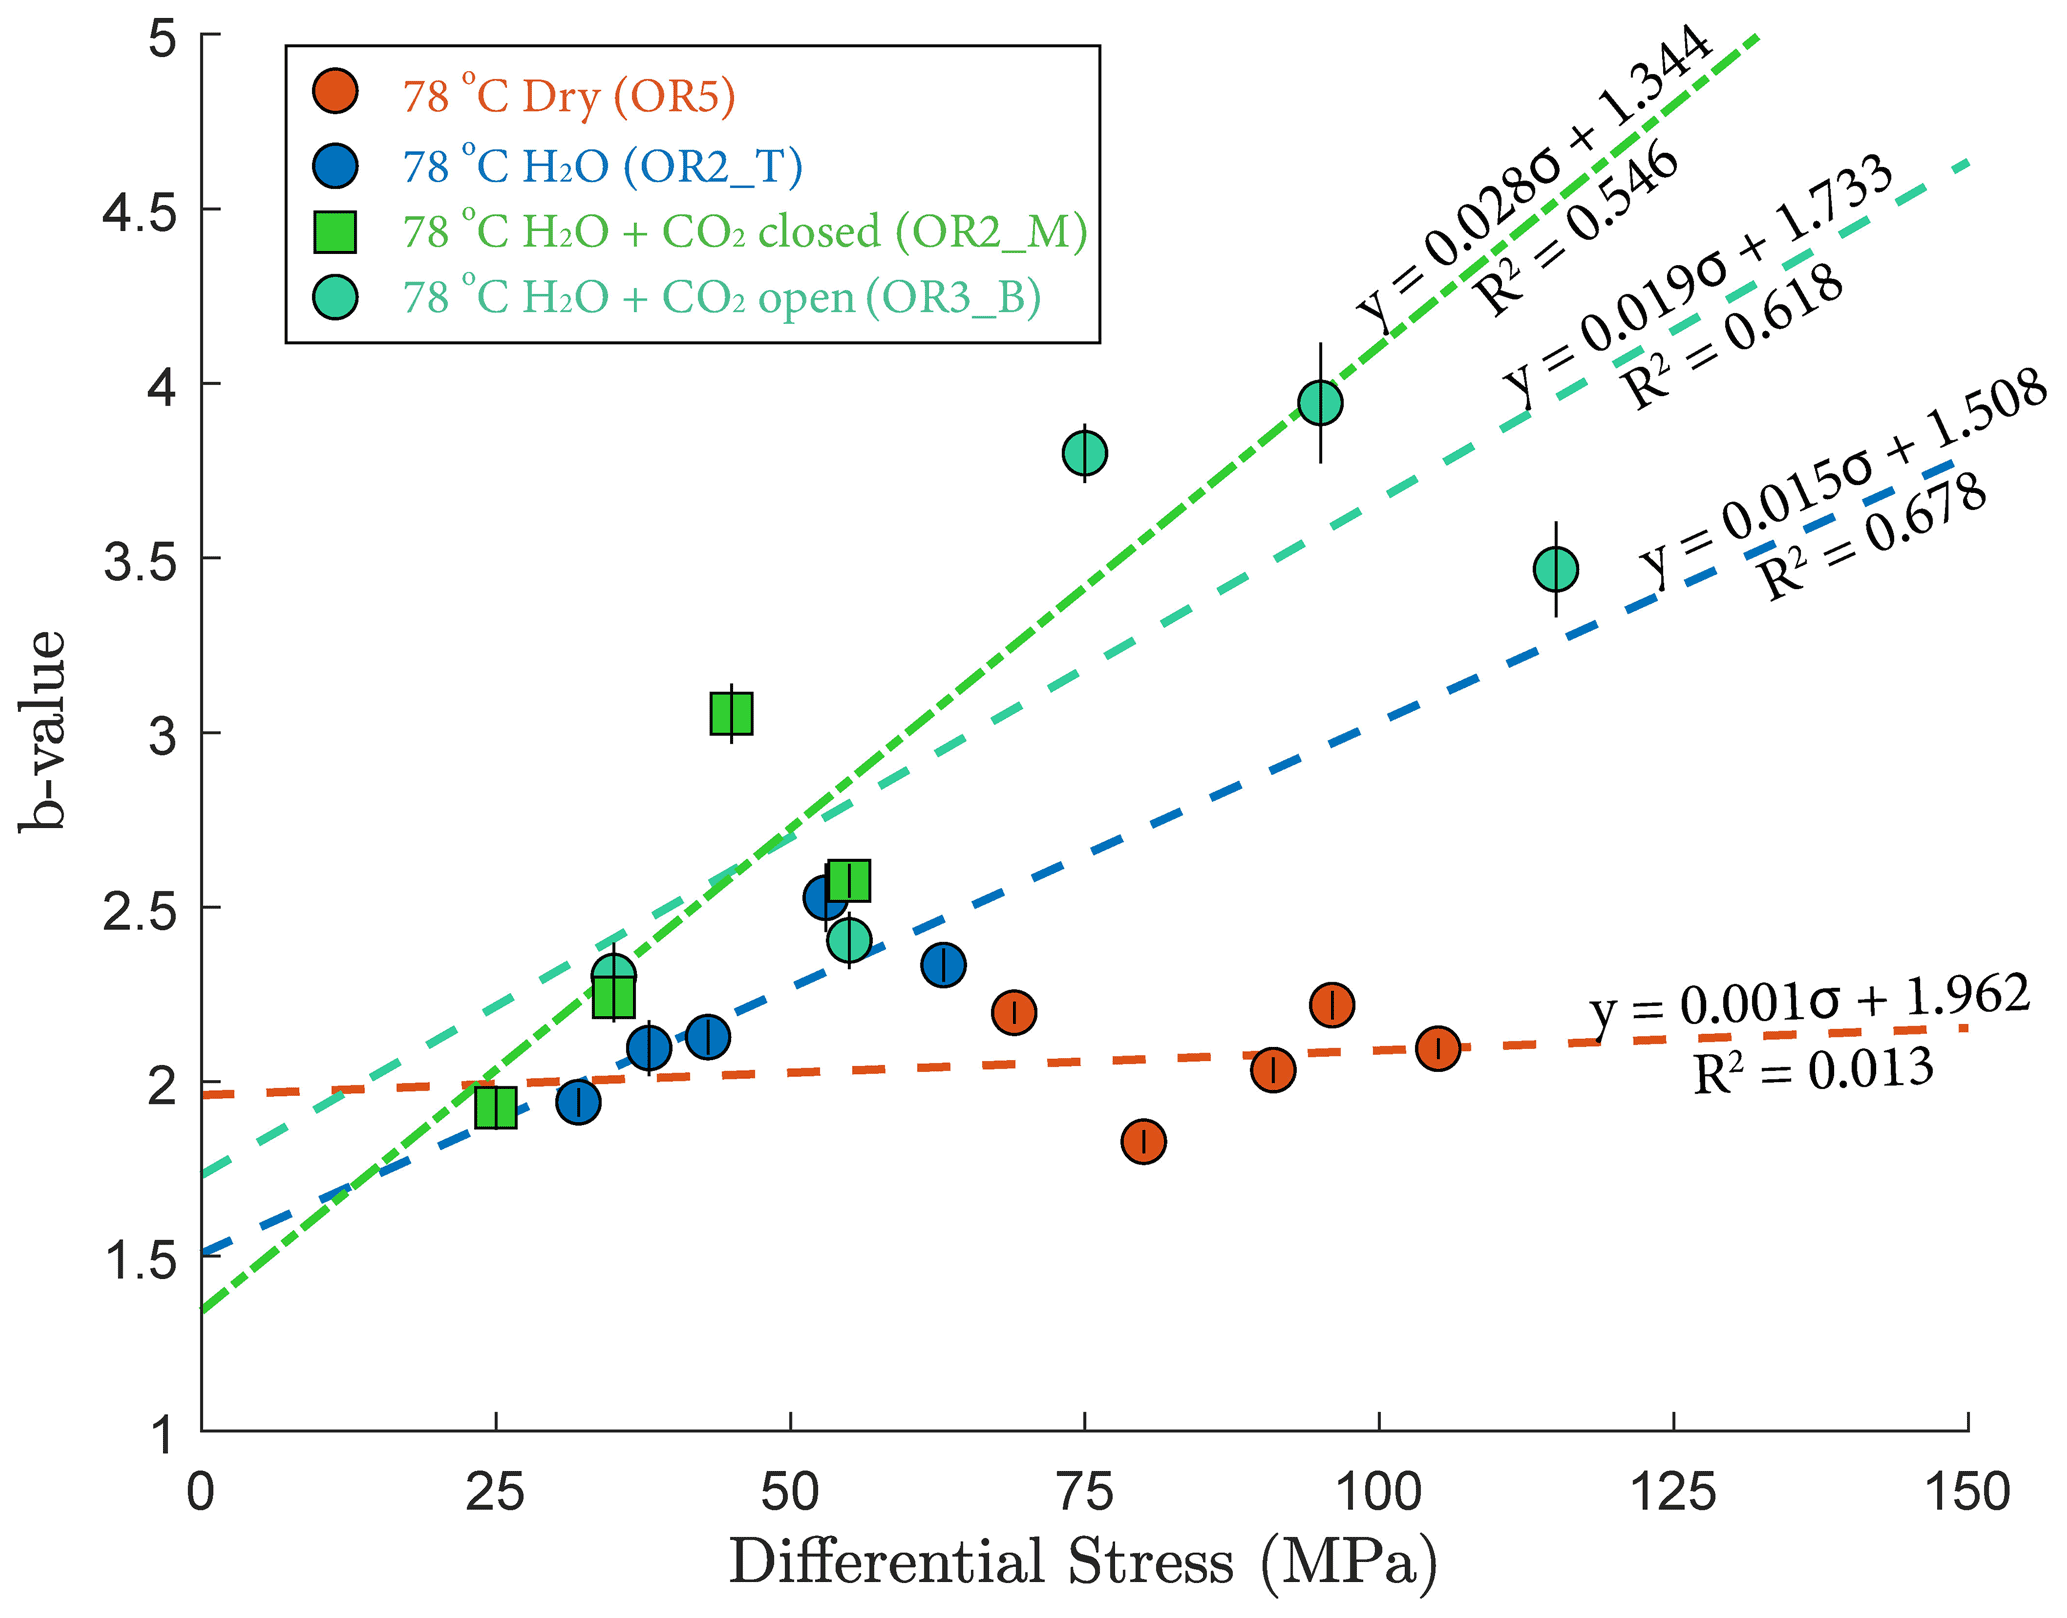
Figure 9Differential stress dependence of Gutenberg–Richter b values. See detailed b-value fitting in Fig. A7. The error bar marks the 95 % confidence interval of the calculated b value.
3.5 Microstructure
Post-mortem examination of the samples reveals that fractures inside the fluid-saturated samples form a complex, wide system rather than a clearly defined, distinct shear fault plane (Figs. 10 and A8). The fluid-saturated samples exhibit bulging on the surface. In contrast, the dry sample shows a weakly developed fault plane and less bulging; however, it should be noted that this sample did not, in fact, reach failure strength.
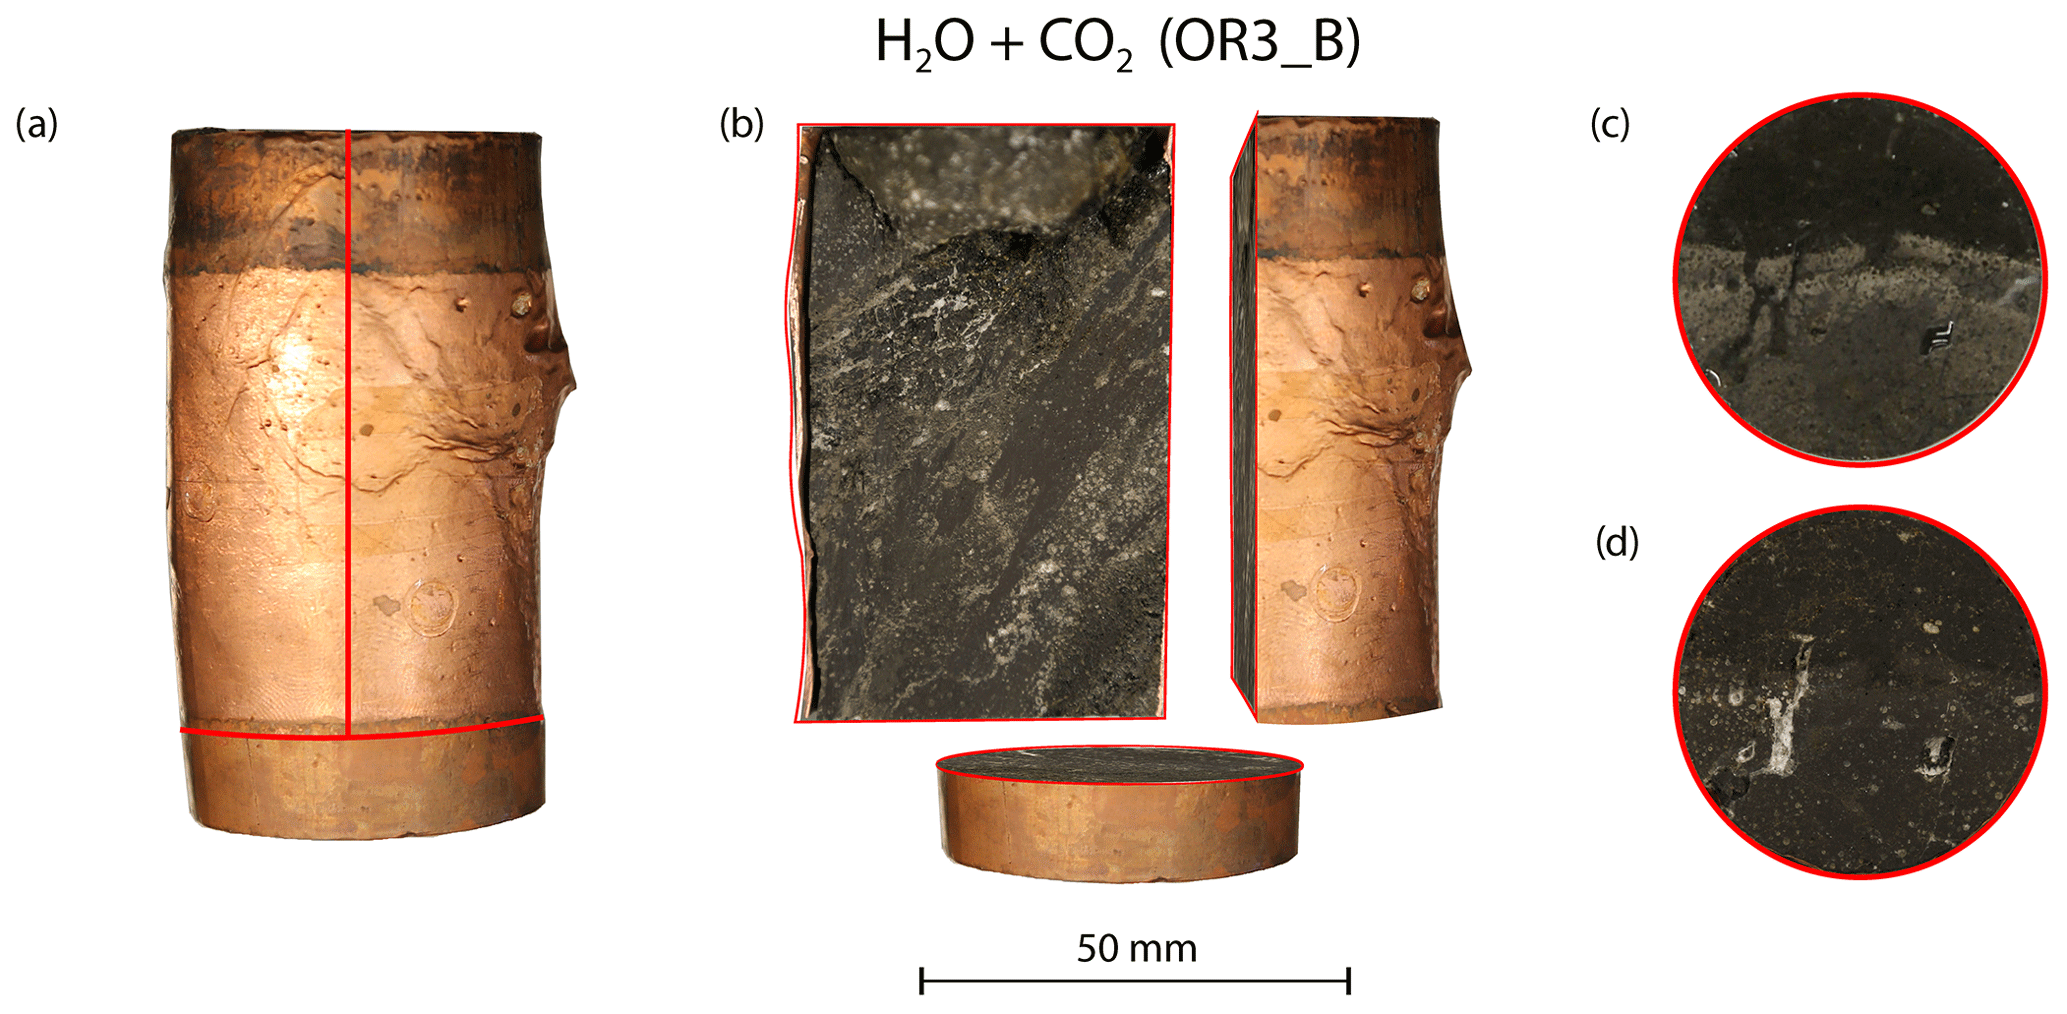
Figure 10(a) Deformed sample from the H2O + CO2 open experiment (OR3_B). (b) Cross-sectional view of the deformed sample. Top view of the sample (c) before and (d) after the experiment.
X-ray tomographic images (Fig. 11) and BSE images (Fig. 12) of the deformed samples display abundant fractures, whereas cracks are much more rare in the pre-deformation CT scans and the BSE images (Fig. 1). The amount of visible cracks in each sample tends to scale with the cumulative AE count; the dry experiment has a lower fracture density than the experiments with H2O and H2O + CO2 despite the fact that the dry sample experienced a higher stress and accumulated a larger total strain. To illustrate these observations, we selected representative pairs of 2-D tomographic slices oriented parallel and perpendicular to the loading direction and traced the observable microcracks (Fig. 11). We quantified both the orientation and anisotropy of the microcracks using the “surfor” method that relies on the projection of an outline (Heilbronner and Barrett, 2014; Panozzo, 1984). As documented in Fig. 11, cracks are strongly aligned in the axial sections. The cracks are mainly oriented parallel to the maximum principal stress in the H2O + CO2 experiment, indicating Mode I cracking, but are aligned 20–30∘ to the maximum principal stress in the dry and H2O experiments, suggesting mixed Mode I + Mode II cracking. A weaker alignment is generally observed in radial sections.
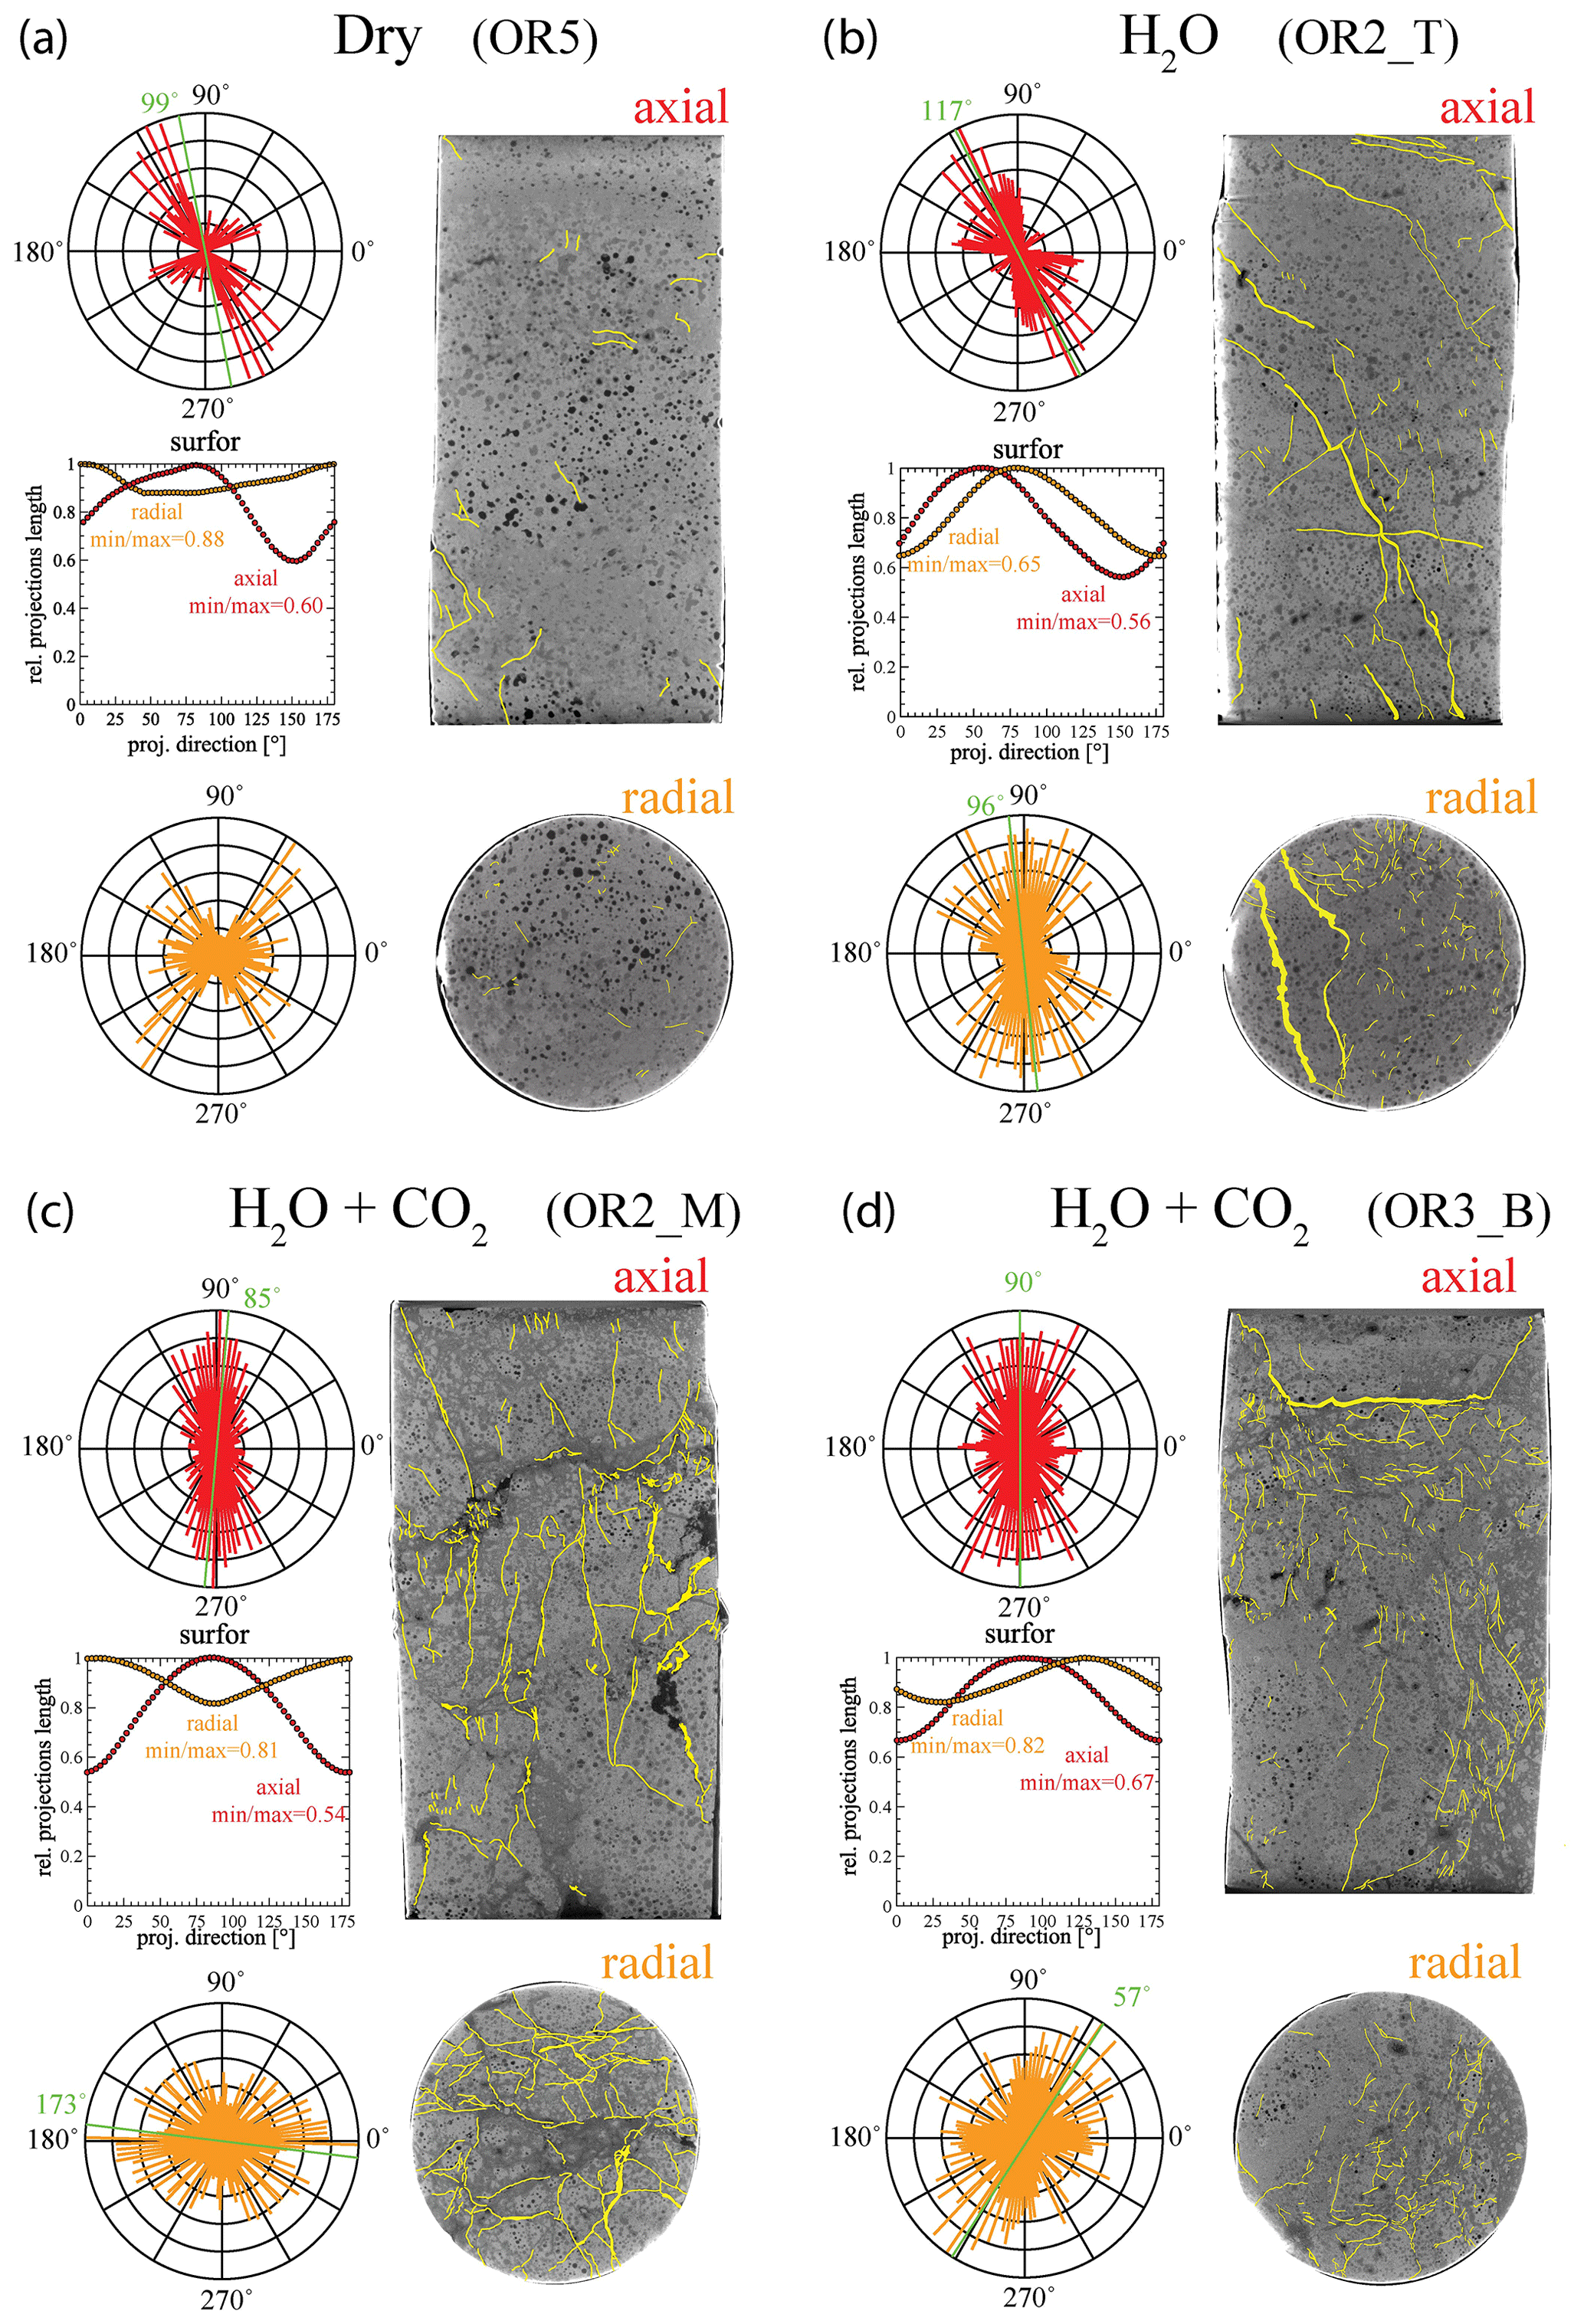
Figure 11Orientation analysis of cracks in axial and radial directions from X-ray tomographic images of the deformed sample from (a) dry, (b) H2O, (c) H2O + CO2 closed and (d) H2O + CO2 open experiments. The aspect ratio (min max), which is defined by the ratio between the minimum and maximum projection length of the cracks, is 1 when the orientation is random (isotropic) (Heilbronner and Barrett, 2014). Strong crack alignment is inferred in the axial sections with aspect ratio of 0.5–0.7 compared to the radial sections where the aspect ratio is 0.6–0.9.
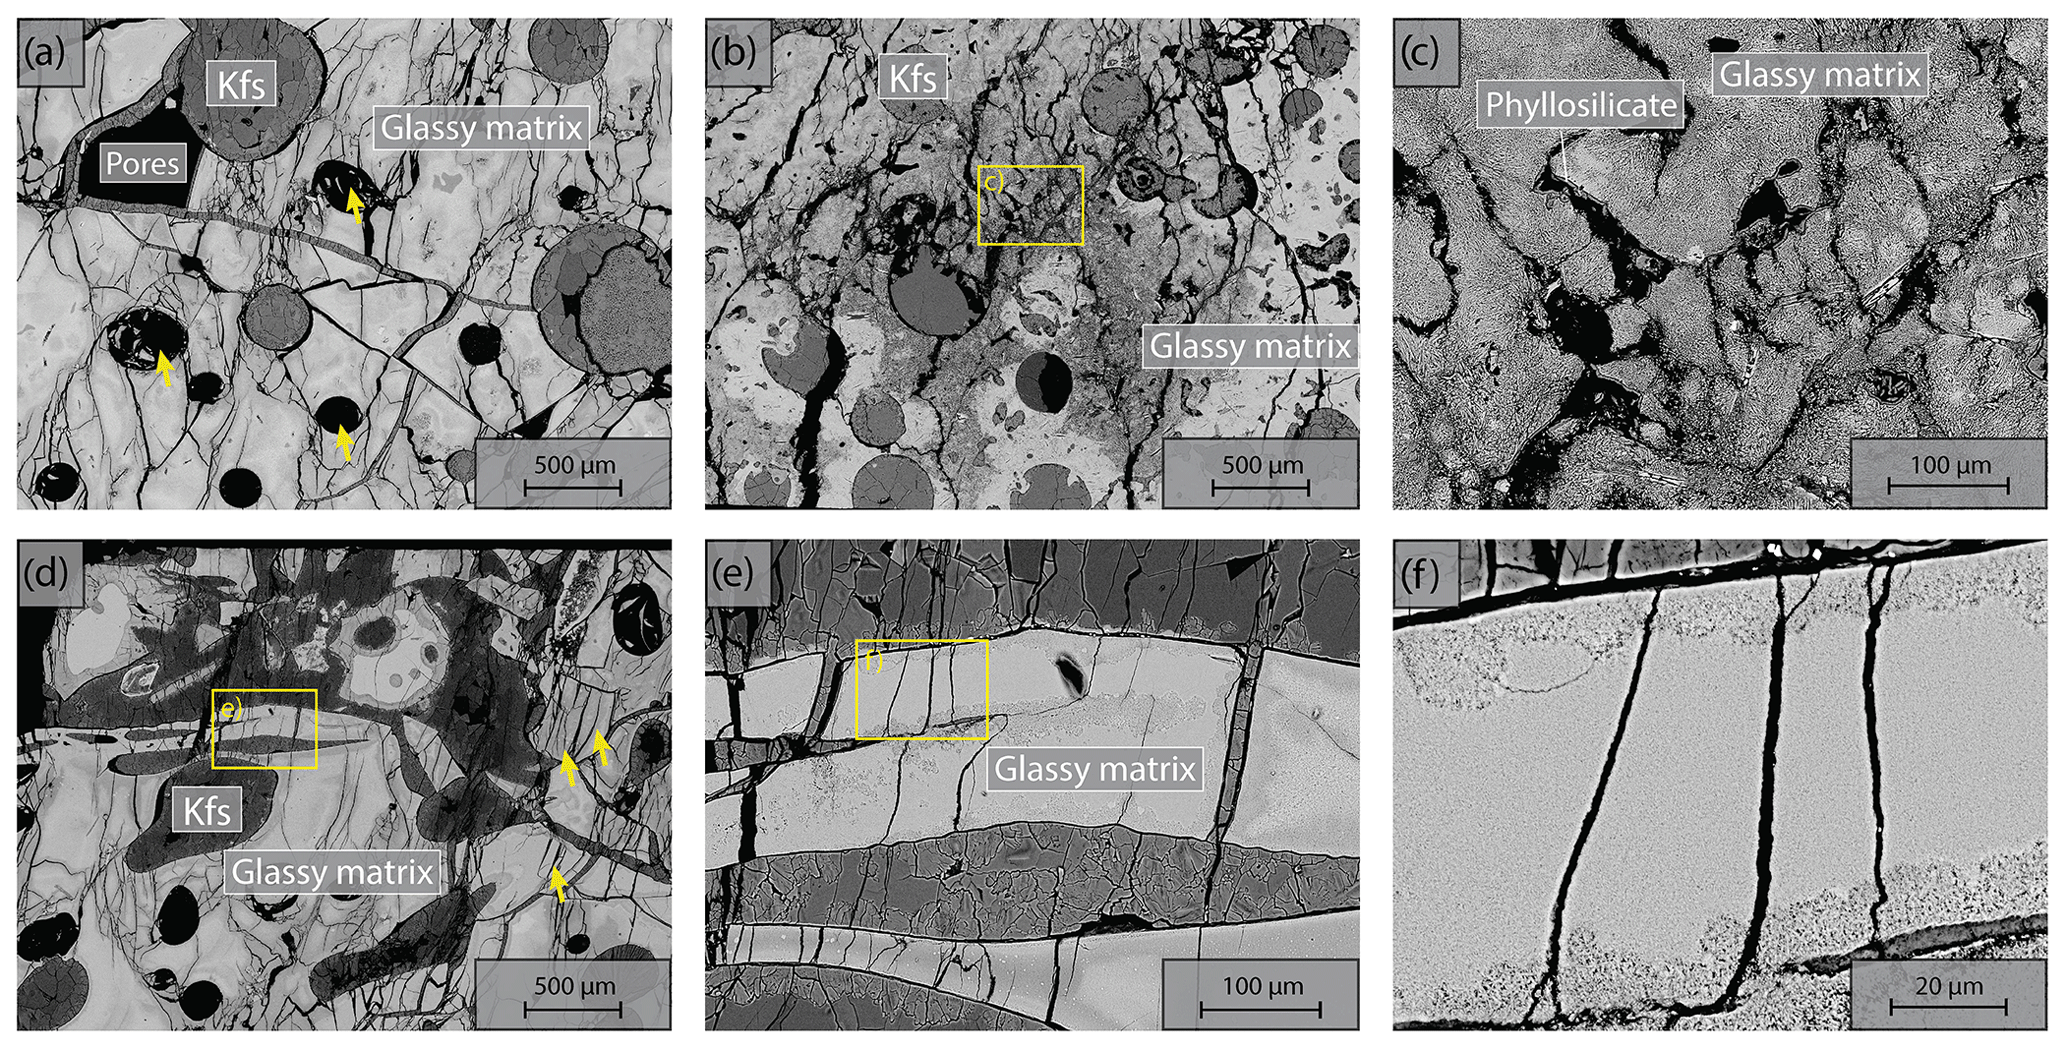
Figure 12Microstructures of deformed sample from the H2O + CO2 open experiment (OR3_B). Axial view, loading from top and bottom. (a) Pervasively fractured matrix; note the preferential N–S alignment of cracks indicating that most cracks are Mode I. Note the collapse of void pores with cracks emanating (arrows). (b) Crack pattern in altered glass matrix. (c) Close-up of (b). Note the phyllosilicate coating on the crack wall. (d–f) Magnification cascade illustrating the crack shape and morphology in the deformed sample.
3.6 Fluid chemistry
Concentration of the Mg2+ and Ca2+ cations increased once heating started (Fig. 13). This increase in the Mg2+ and Ca2+ concentration reflects the dissolution of Mg and Ca bearing minerals during the reaction. In the H2O + CO2 closed experiment (OR2_M), the supply of CO2 was limited and led to a dissolution-dominated system that resulted in the high concentration of Mg2+ and Ca2+, similar to the H2O experiment (OR2_T). In the H2O + CO2 open experiment (OR3_B), the cation concentration was significantly lower than in the OR2_M and OR2_T experiments. This was likely caused by the potential precipitation uptake due to the continuous supply of CO2 in the semi-open setting of the pore fluid system. This interpretation is also supported by the ∼ 2 orders of magnitude drop in permeability observed in the CO2 open experiment after heating started since precipitation could potentially clog the pore throats and lead to permeability decrease.

Figure 13Concentration of Mg2+ and Ca2+ in the sampled fluid from (a) H2O, (b) H2O + CO2 closed and (c) H2O + CO2 open experiments. Time 0 marks the start of the first creep stepping.
4.1 Active deformation mechanisms
Acoustic emission, microstructure analysis and mechanical data confirm that the observed deformation is a brittle process as is expected at the given P–T conditions. The strong similarity between the time evolution of cumulative AE counts and strain (Figs. 7 and 8) is consistent with observations from other creep deformation experiments using cemented and uncemented porous rocks (e.g., Brzesowsky et al., 2014; Heap et al., 2009). These considerations suggest that the creep deformation observed in this study is a result of a time-dependent brittle process such as subcritical cracking that can still generate AE activity (Chester et al., 2007, 2004).
Previous studies concluded that observable amount of brittle creep strain is unlikely to occur below 80 % of ultimate strength defined by the short-term, constant strain rate deformation experiments (Baud and Meredith, 1997; Heap et al., 2009). However, all our strain measurements (strain gauges, LVDTs, axial ram displacement) show that, in this study, creep did occur at stress levels of only ∼ 11 % of failure strength (and therefore even lower percentage of the ultimate strength). Similar creep deformation with measurable strain at low stress level has been previously observed in shale (e.g., Mighani et al., 2019). We also found that the strain rates measured during all creep steps could be fitted using the same exponential law derived from strain rate measurements. Furthermore, the amount of creep strain accumulated during phase I and phase II showed a consistent stress dependence across all stress conditions (Fig. 4c and d). Therefore, our experiments demonstrated that there does not seem to exist a threshold below which no creep strain will be observed. The creep deformation was likely governed by the same mechanism across our tested stress conditions, and the accumulated creep strain at a given time can be formulated as a function of stress.
Our AE statistics show that the b values were higher for the fluid-saturated experiments than the dry experiment, indicating a higher proportion of low-amplitude AEs (i.e., higher ratio of low- to high-amplitude events). This abundance of low-amplitude events in fluid-saturated rock is a direct evidence that aqueous fluids promoted creep deformation in basalt. As argued in previous studies, growth of small cracks and low-amplitude events are facilitated when stress corrosion is activated in the presence of aqueous fluids (Hatton et al., 1993). We also observed that the amplitude of the largest events increased with increasing stress. And this effect becomes more significant in the fluid-saturated experiments (H2O and H2O + CO2). This could be attributed to the increase in microcrack nucleation, consequently maximizing the likelihood of an “avalanche” of coalescing cracks, which, in turn, generates large-amplitude events. Overall, as more and more energy is dissipated through microcracking and the associated low-amplitude AEs, the macroscopic deformation becomes less dynamic, which is consistent with the increase in the Gutenberg–Richter b value with increasing stress.
Post-mortem examination of the fluid-saturated samples demonstrated the presence of a complicated network of fractures within the sample and absence of a well-defined major shear fracture plane. The samples also exhibited distributed deformation features such as bulging, likely caused by the bulk formation of dilation cracks in addition to the cataclastic shear during the final failure. These microstructural observations further support the idea that deformation during creep is diffuse and distributed rather than localized (Hatton et al., 1993; Heap et al., 2009), consistent with nucleation-controlled crack growth since the nucleation sites are normally randomly distributed in the sample.
Microstructure analysis of the deformed samples demonstrates that the presence of fluid resulted in more abundant Mode I cracks (Fig. 11). Larger amount of cracks oriented parallel to the maximum principal stress were observed in the H2O + CO2 samples, implying dominant Mode I cracking, while the dry experiment showed less cracking, with the cracks aligned 20–30∘ to the maximum principal stress, thus pointing to mixed Mode I + Mode II cracking. This observation is consistent with previous studies on strain localization, as they often proposed rock fracture models predicting that Mode II cracking takes place during the localization stage of fracture development (Lockner et al., 1992; Reches and Lockner, 1994; Wong and Einstein, 2009). Among the present experiments, the samples subjected to creep deformation under H2O + CO2 conditions exhibited the largest amount of Mode I cracks. The sample deformed under dry condition, despite having experienced similar differential stress and total accumulated strain, showed a lower amount of cracks. As stated in previous studies, Mode II cracks often propagate at velocities close to the Rayleigh velocity, which increases the probability of occurrence of high-amplitude events. On the other hand, Mode I cracks have significantly lower rupture velocities and tend to produce low-amplitude acoustic events (Broberg, 2006). Therefore, increased Mode I cracking should lead to an increase in the proportion of low-amplitude AEs, i.e., an increase in the Gutenberg–Richter b value.
We infer that the difference in creep rate of the dry and fluid-saturated experiments is a result of fluid-assisted subcritical crack growth. The fluid presence promotes stress corrosion, possibly related to hydrolytic weakening (Atkinson, 1984), accelerates crack growth, activates more crack nucleation sites and, consequently, leads to a distributed array of small microcracks. In contrast, crack growth under dry conditions is concentrated on fewer and larger cracks since activation of the nucleation sites is more difficult. Thus, it is easier to create localized deformation under dry condition.
Previous studies also suggested that intergranular pressure solution (IPS) could play a significant role as a deformation mechanism during creep (Liteanu et al., 2012; Zhang and Spiers, 2005; Zhang et al., 2010). The creep deformation by IPS involves dissolution and the presence of a fluid phase might be expected to affect creep deformation, generating additional strain accumulation apart from dilatant cracking. Importantly, because the driving process of IPS is not producing abrupt stress drops, it is not expected to produce acoustic emissions. Although we did see difference in creep strain between the dry and fluid-saturated experiments, it was likely caused by dynamic fracturing, as evidenced by the volumetric strain and AE observations (Figs. 5a and A1). We attribute the change in creep strain rate between dry and fluid-saturated experiments to fluid-assisted subcritical crack growth. We posit that under our experimental conditions, IPS was not a dominant creep mechanism; however, more detailed microstructural observations are needed.
4.2 Time- and stress-dependent deformation
Our experiments show that the time-dependent creep deformation was also strongly stress dependent. We observed that the creep strain accumulated during phase I was exponentially dependent on stress (Fig. 3c). Two exceptions are noted in the dry experiment. Both showed high strain accumulation during phase I transient creep and followed a sharp temporary stress drop during the creep step with a nominal differential stress of ∼ 90 MPa (Fig. 5). This temporary stress drop was accompanied by a swarm of large-amplitude AEs (Fig. A2), implying that the concurrent strong dilation was likely caused by local dynamic fracturing while the bulk of the sample remained mostly intact and still capable of supporting the applied load.
We also observed an exponential relationship between stress and creep rate. Interestingly, the fluid-saturated experiments yielded approximately equal stress sensitivities of the creep rates, e0.02 ∼ 0.03 σ, despite the variability in their absolute strengths (Fig. 3). The exponential stress dependence of strain rate in fluid-saturated experiments is consistent with brittle creep being the dominant deformation mechanism. Indeed, the values of the fitting constant (0.02–0.03) are comparable in order of magnitude to those reported in previous studies on other basaltic rocks (0.05 in Heap et al., 2011, from experiments using Etna basalt). Since the creep rate was exponentially dependent on stress, so should be the accumulated phase II creep strain. This inference is supported by our observation in Fig. 4d. Concerning the dry experiment, we attribute the slightly negative dependence of creep strain rate on stress (Fig. 3e) to statistical artifact due to large data fluctuations as suggested by the low R2 value of the exponential fitting (Fig. A6).
The fact that both cumulative phase I and phase II creep strains were exponentially dependent on stress (Fig. 4c and d) implies a power-law relationship between the accumulated phase I and phase II creep strain. This power-law relationship (i.e., the ratio between the logarithmic total phase I and logarithmic phase II creep strain), based on our experimental observation, is independent of the stress level and even the presence or absence of fluids. This empirical relationship can be formulated as
where εt is the total strain accumulated at the end of an individual creep stage (∼ 24 h), εi the creep strain accumulated during phase I and εii the strain accumulated during phase II (see Fig. A5). This phenomenological power-law relationship is supported by our observation that the ratios in Eq. (2) were indeed approximately constant ∼ 0.8 (Fig. 4a and b). This power-law relationship expressed in Eq. (2) implies that the strain evolution with time can be predicted; some fundamental link between strain accommodated in phase I creep and strain rate in phase II creep exists.
4.3 Fluid chemistry evolution and influence of fluid composition
The increase in concentration of both Mg2+ and Ca2+ occurring after heating in the H2O and H2O + CO2 closed experiment (Fig. 13) indicates that the system was dominated by dissolution of Mg- and Ca-bearing minerals. In the case of the H2O + CO2 open experiment, we observed a much smaller increase in cation concentration, implying that a significant amount of the released Mg2+ and Ca2+ cations reacted with the continuously supplied CO2 in the semi-open setting to form carbonate precipitates. These cation concentration trends appeared strongly correlated with the permeability evolution and creep strength of the rocks. The experiment with H2O + CO2 open showed a larger post-heating permeability decrease than the experiments with H2O and H2O + CO2 closed and was stronger (Figs. 3e and 6). The absolute creep rate was consistent for experiments with comparable fluid chemistry (H2O and H2O + CO2 closed) and about a factor of 3 faster than in the experiment where precipitation was dominant (H2O + CO2 open), indicating that dissolution associated with fluid presence weakens the rock, while precipitation reactions slightly strengthen the rock and partly compensate the effect of dissolution. This congruence of observations is a strong argument that precipitation occurred in the pore space of the CO2 open experiment. However, we could not directly resolve evidence of precipitation within the resolution of our microstructural observations and this requires further study. Interestingly, the strain rate sensitivity to stress was similar in all fluid-saturated experiments (Fig. 3), implying that creep rate sensitivity to stress was not significantly influenced by the fluid chemistry.
Our chemical data support the idea that carbonation of basalt is a kinetically favored reaction and are consistent with the fast rate of carbonation observed during the CarbFix field tests (Matter et al., 2016). We interpret the difference between the Mg2+ and Ca2+ concentrations measured in the H2O + CO2 open experiment and those in the H2O and H2O + CO2 closed experiments to be a result of the consumption of Mg2+ and Ca2+ in the formation of carbonate. This indicates that the supply of CO2 is more sufficient in the H2O + CO2 open experiment and the rate-limiting factor during carbonation under our experimental condition was the net supply of Mg2+ and Ca2+ cations, which is associated with dissolution.
4.4 Permeability and porosity evolution
Permeability was affected by both chemical and mechanical processes. The evolution of permeability during the experiments was generally consistent with previous observations of monotonic permeability decrease during hydrostatic loading of samples of limestone, sandstone and Etna basalt (Brantut, 2015; Fortin et al., 2011; Zhu and Wong, 1997). Comparison of the dissolution dominated experiments (H2O and H2O + CO2 closed) and the precipitation dominated experiment (H2O + CO2 open) shows that the carbonation reaction reduced permeability in our experiment. In low differential stress conditions, the samples compacted and this compaction was accompanied by a further permeability decrease, which was likely related to the pore volume reduction expected during compressive deformation. Shortly before failure strength was reached, volumetric dilation became dominant and coincided with permeability increase. Our observations of the permeability evolution demonstrate that, although the permeability might decrease due to compaction, formation and propagation of cracks can mitigate the permeability loss and even lead to an increase with further cracking. The effect of creep deformation on the long-term permeability evolution of reservoir rocks is therefore non-negligible. Increase in permeability, combined with other observations such as increasing volumetric strain and acoustic emissions, could potentially be used as a warning sign for impending failure during the long-term monitoring of reservoirs' integrity in GCS applications.
4.5 Effect of sample heterogeneity
As our samples are taken from drill cores collected at depth at the CarbFix carbon mineralization site, the heterogeneity is larger than in rocks typically used in rock mechanics experiments. The samples investigated in this study exhibit variations in their initial porosity (5 %–15 %; see Table 1), failure strength (55–130 MPa) and Young's modulus (12–28 GPa). We observed a correlation between the failure strength and the elastic modulus of the samples where stiffer samples reach higher peak strengths, consistent with previous reports of an empirical relationship between the unconfined compressive strength and the elastic modulus of sedimentary rocks (see review in Chang et al., 2006). The peak strength however varied inversely with porosity; the dry sample (OR5), which has the highest initial porosity (15 %), shows a higher failure strength (>105 MPa) and exhibits the lowest creep rate compared to the fluid-saturated experiments where porosity measurements were available (H2O and H2O + CO2 closed). Remarkably, the stress sensitivity of the creep strain rate shows consistency (e0.02−0.03 σ) in all the fluid-saturated experiments (H2O and H2O + CO2 open and closed) in spite of these variations in porosity, stiffness and failure strength. Moreover, the creep rate at individual stress steps is consistent for experiments with comparable fluid chemistry (H2O and H2O + CO2 closed) despite a variation in porosity by a factor of 2 in between the samples (Fig. 3 and Table 1). These results are a strong argument for the operation of chemical processes that contribute to creep. While variations in porosity resulted in variation in peak strength, they did not seem to affect the absolute creep rates or the sensitivity of creep rate to stress.
Through the experimental study of long-term creep deformation of Icelandic basalt, we have demonstrated the following:
-
Transient creep occurred at stress levels as low as 11 % of the failure strength.
-
Presence of an aqueous pore fluid exerted first-order control on the creep deformation of the basaltic rocks, while the fluid composition had only a secondary effect under our experimental conditions. At similar differential stress level, the creep rates in fluid-saturated experiments were much higher than the rates in the dry experiment.
-
A closed system tended to favor dissolution over precipitation during carbonation in our experimental setting, whereas precipitation played a more important role in an open system with continuous CO2 supply.
-
Larger amount of dilation was observed in fluid-saturated experiments than in the dry experiment, as evidenced by both volumetric strain data and microstructural observations.
-
Larger low- to high-amplitude ratios of the AE events and higher AE rates were observed during the phase II creep of the fluid-saturated experiments than the dry experiment, indicating that aqueous fluids promoted stress corrosion processes.
-
The mechanism governing the creep deformation was brittle, time and stress dependent, and could likely be identified as subcritical dilatant cracking.
Overall, our results emphasize the non-negligible role that the creep deformation can potentially play in the long-term deformation of rocks even under low-pressure and -temperature conditions and calls for more attention to time-dependent processes such as subcritical microcracking in GCS applications. Under our experimental conditions, the creep deformation and the associated fracture development were affected by the presence of aqueous fluids, implying that reactive fluids could potentially alter the fracture patterns and allow mineralization in a greater rock volume during GCS applications. Further detailed studies on the creep deformation under chemically active environment are required to better understand the long-term deformation of rocks in natural systems.
A1 Sample composition
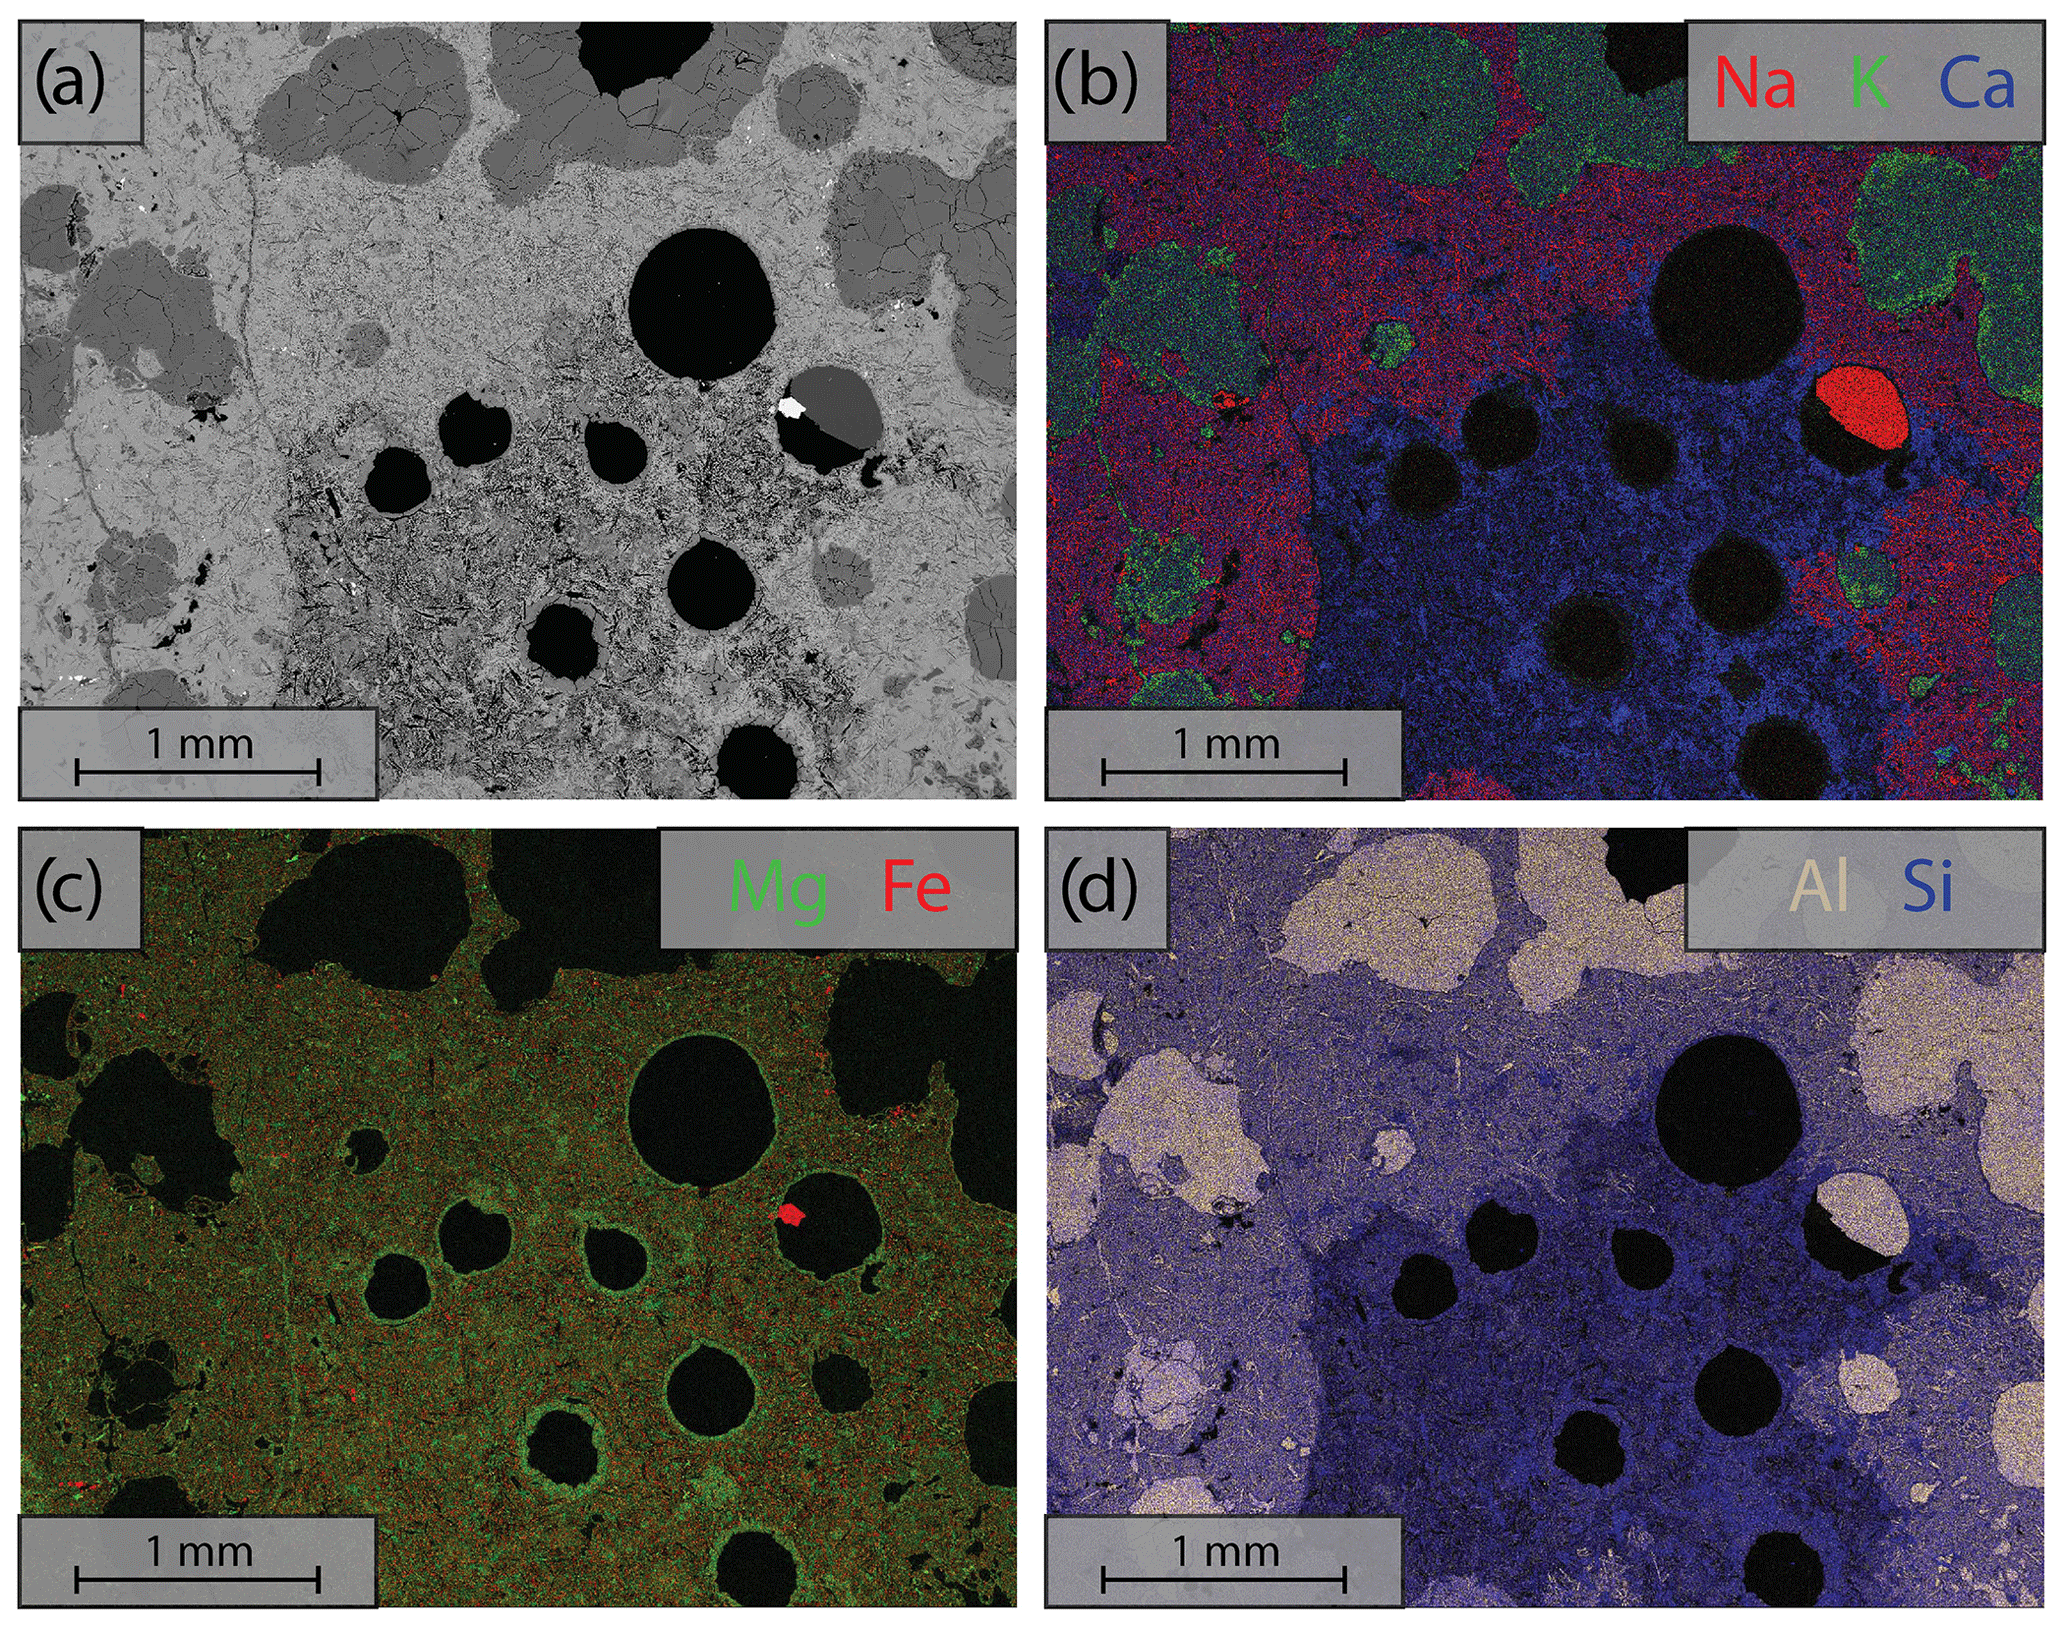
Figure A1Energy dispersive spectroscopy (EDS) analysis of the area marked in Fig. 1; color composite images are made by combining RGB channel where the individual channels contain element concentration. (a) Backscattered electron (BSE) images of the starting material; (b) elemental composition of Na, K and Ca; (c) elemental composition of Mg and Fe; (d) elemental composition of Al and Si.
A2 Experimental procedures
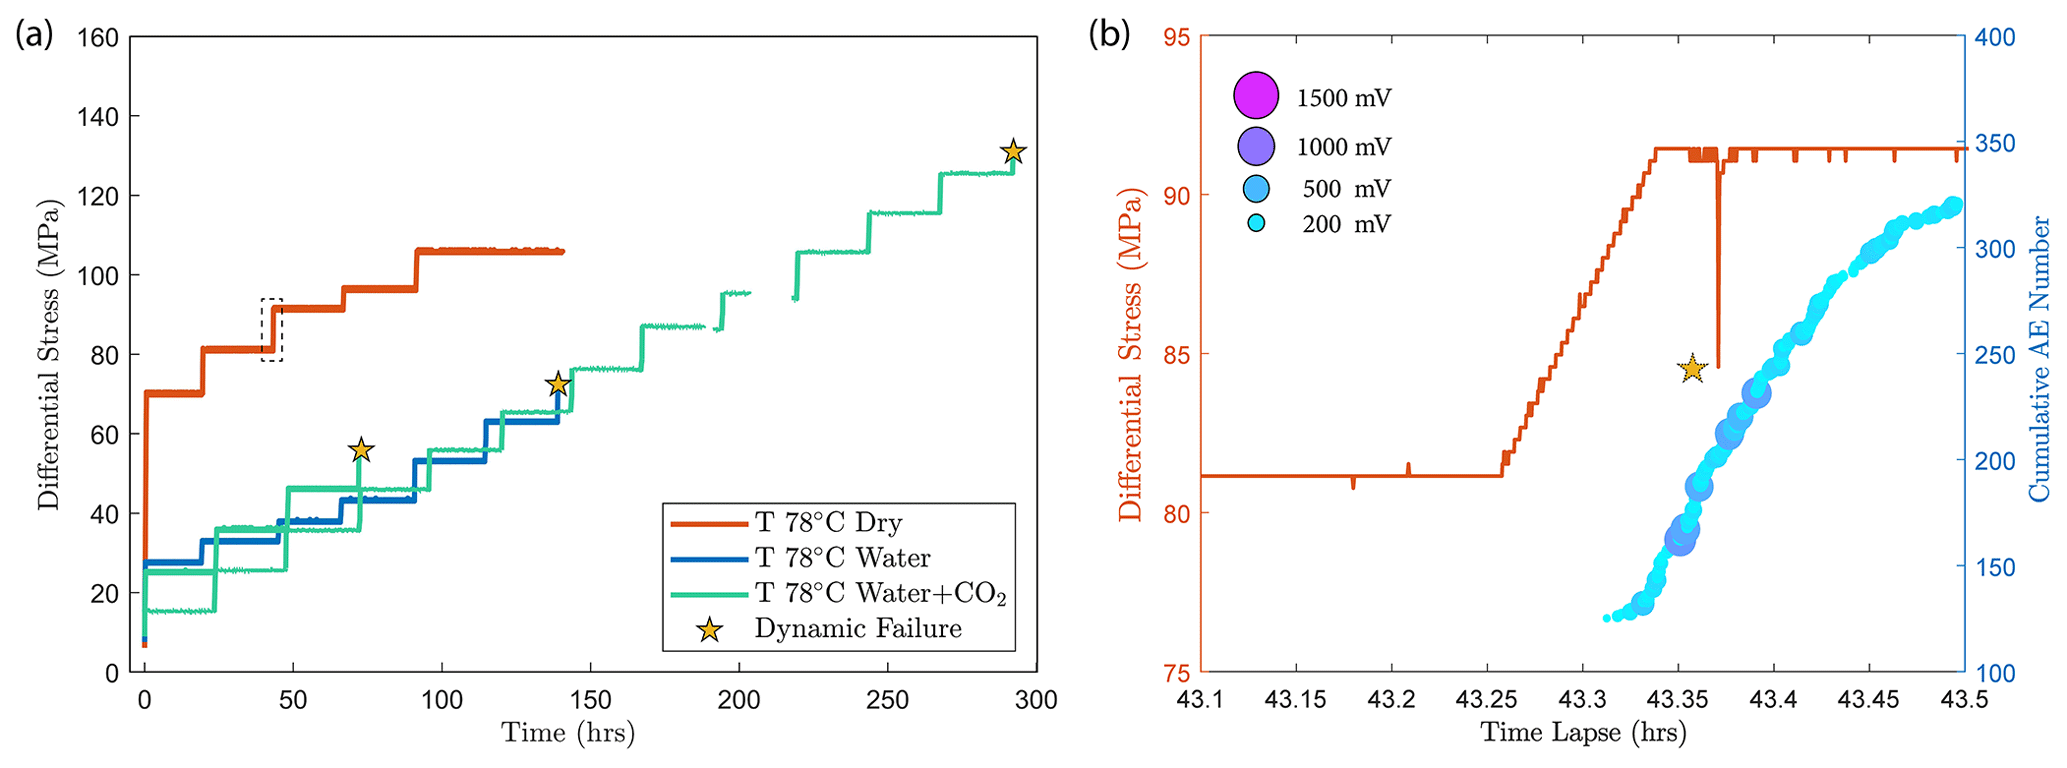
Figure A2(a) Differential stress vs. time plot of experiments conducted at temperature of 78 ∘C. The dry experiment (red) was ceased before dynamic failure occurred in the sample. (b) A temporary stress drop was observed (highlighted by the dashed rectangle in panel a) during the primary creep of the dry experiment at a creep stress of ∼ 90 MPa accompanied by the occurrence of high-amplitude AEs.
A3 Phase I to phase II transient creep transition
Selection of the phase II transient creep from the mechanical data is based on the calculated strain rate using first derivative of the strain curve vs. time at different stress levels (Fig. A2). The plot of strain rate vs. strain further supported that the strain rate evolution slows down during the identified phase II creep.
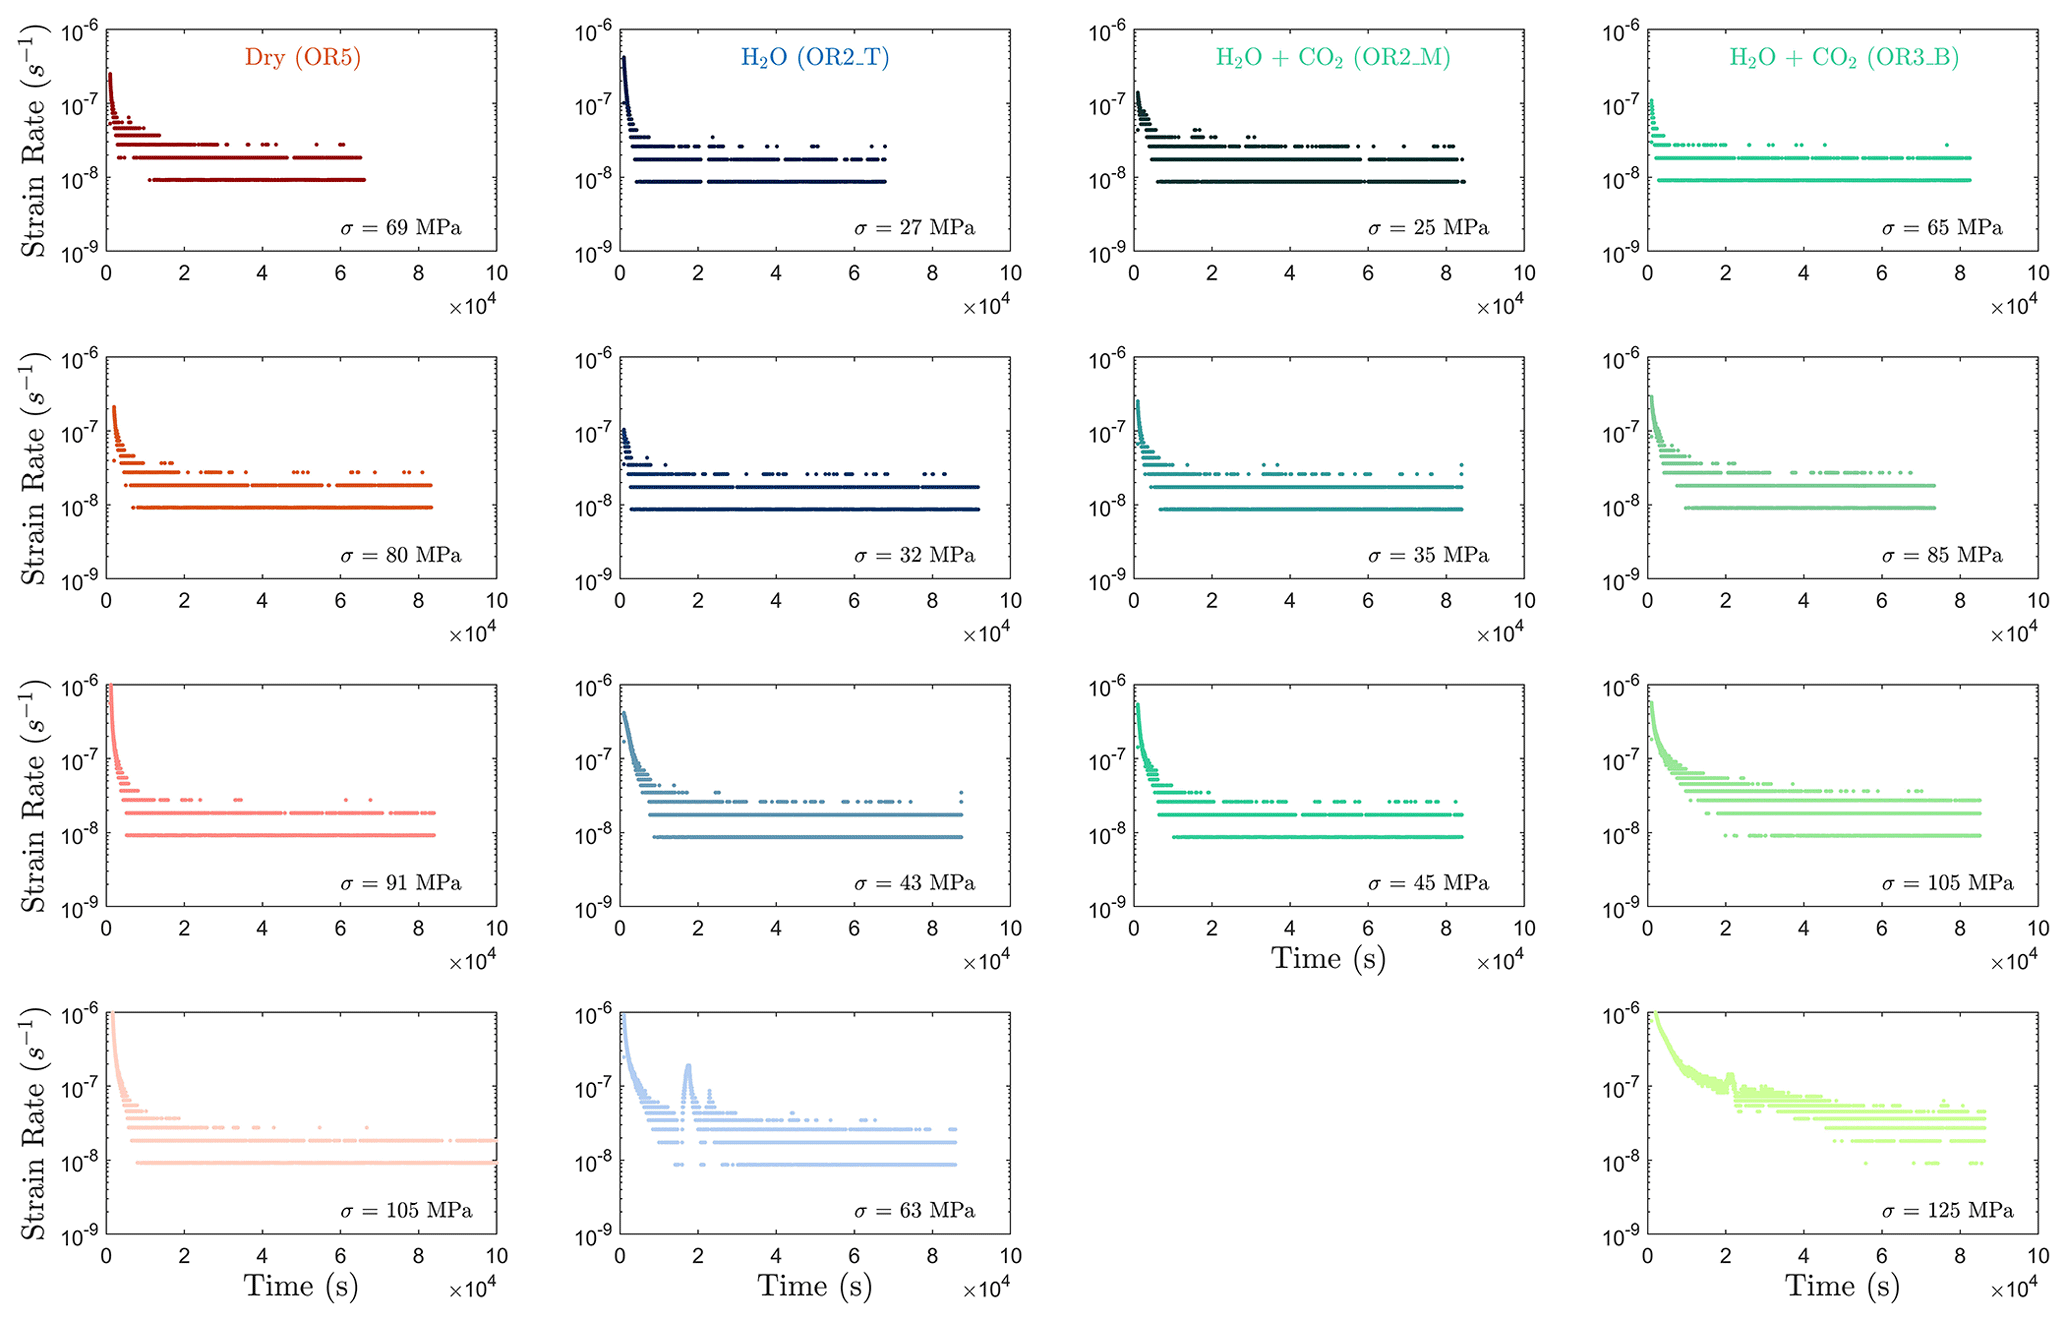
Figure A3Strain rate evolution calculated from the first derivative of the strain vs. time data. It can be observed that the strain rates generally become constant at 10 000 s (≈ 2.8 h) after the load stepping in most steps.
To consistently analyze the transition between phase I and phase II of the transient creep, we fit the evolution of phase I creep strain over time using a power-law function and the phase II creep strain as a linear function (Fig. A3a). The measured strain data point that is the closest to the intersection of the two fitting functions is selected as the inflection point, i.e., the transition from phase I to phase II transient creep deformation. Figure A3b and c show the logarithmic and power-law fitting methods used for the time evolution of creep strain (ε) within the 24 h observation window of our experiment.
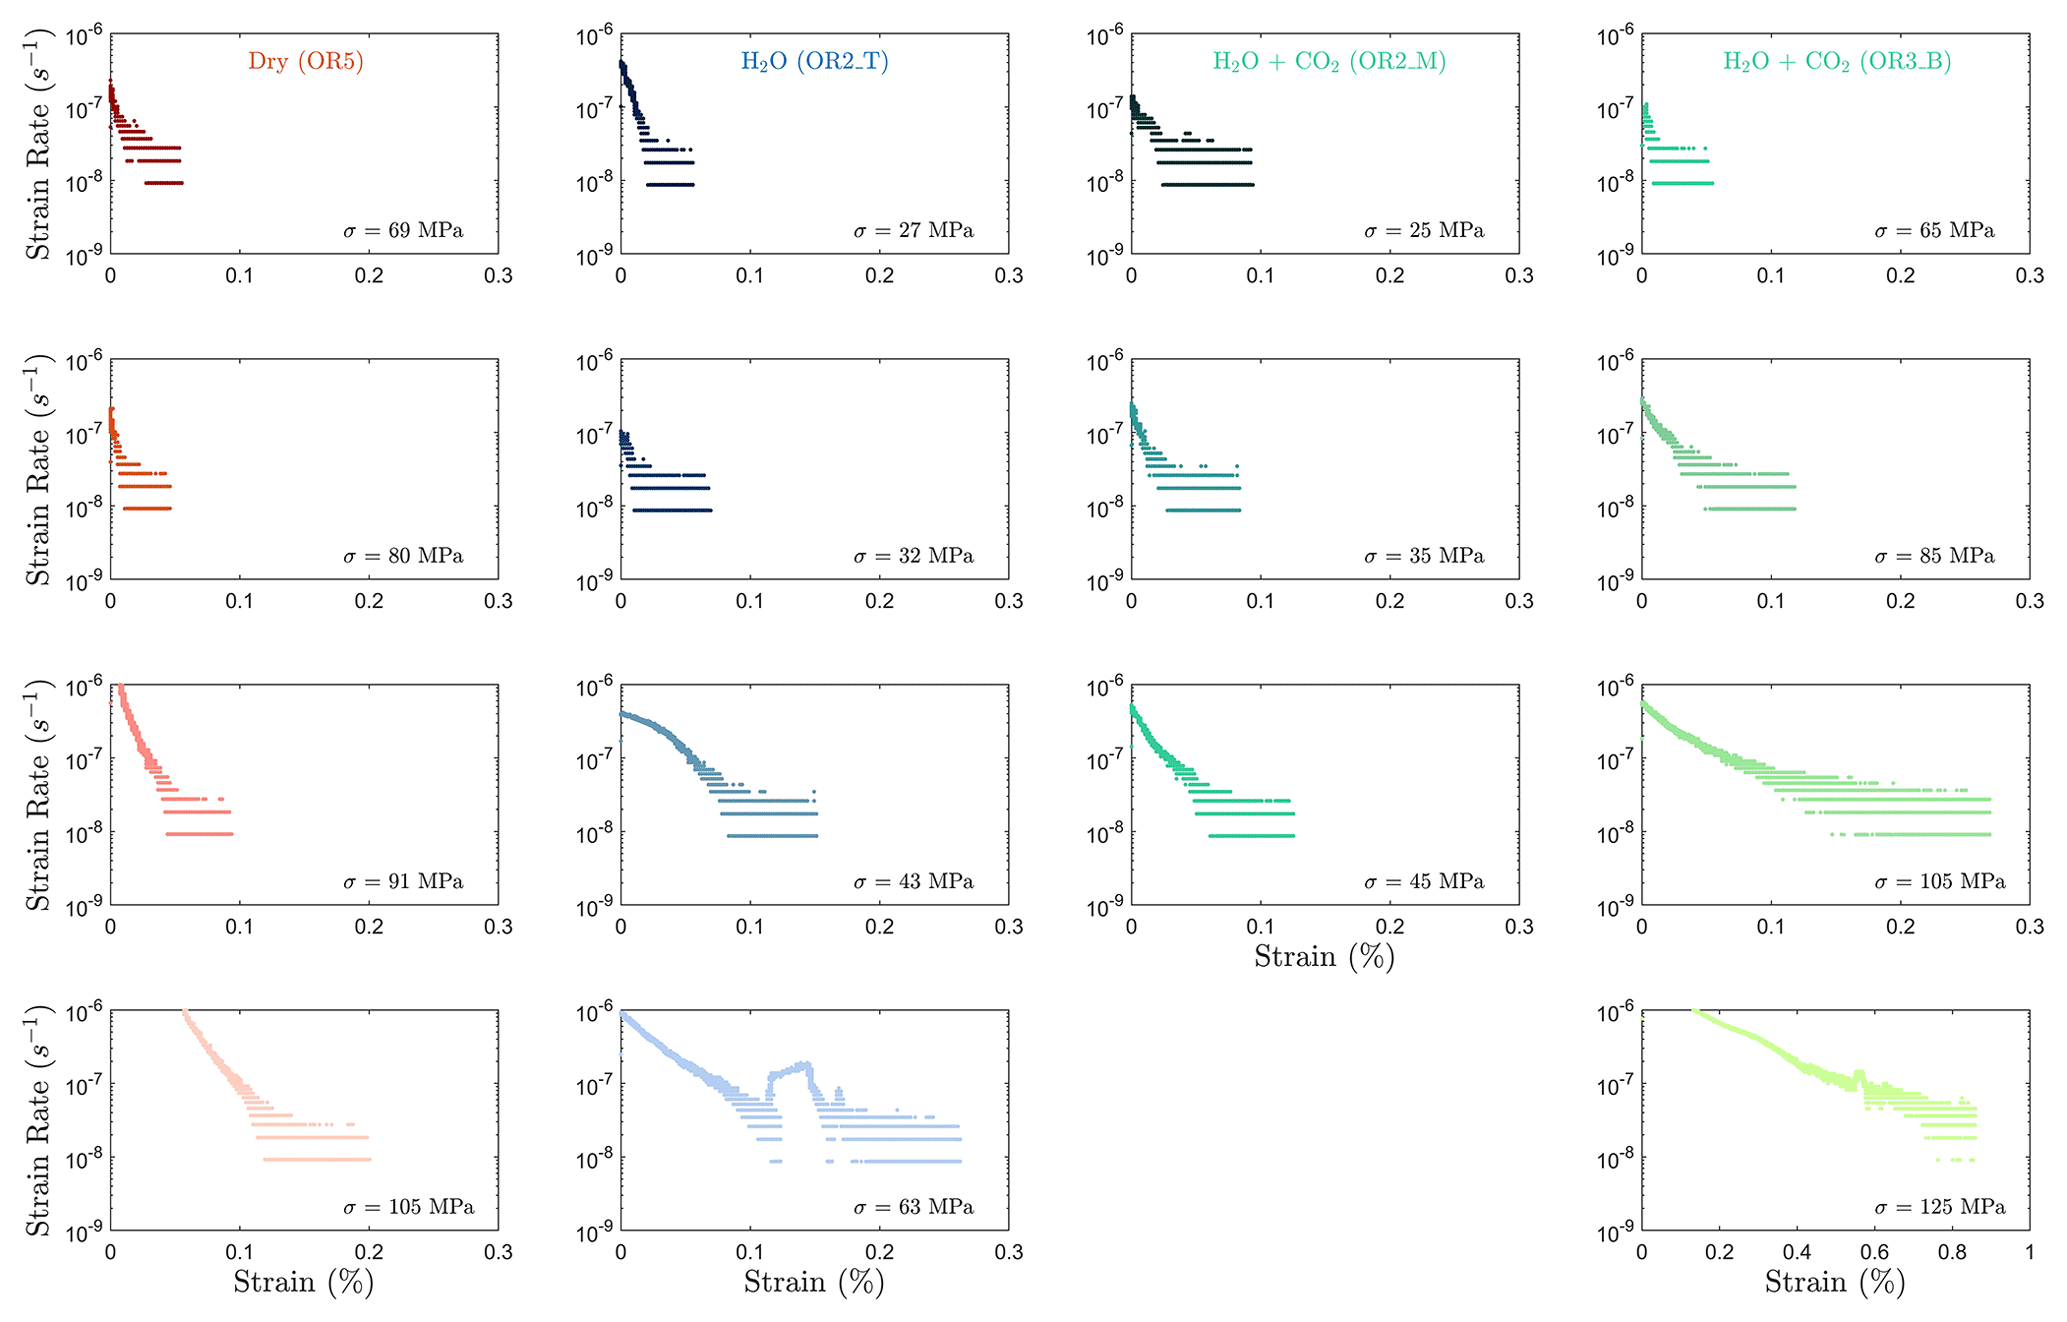
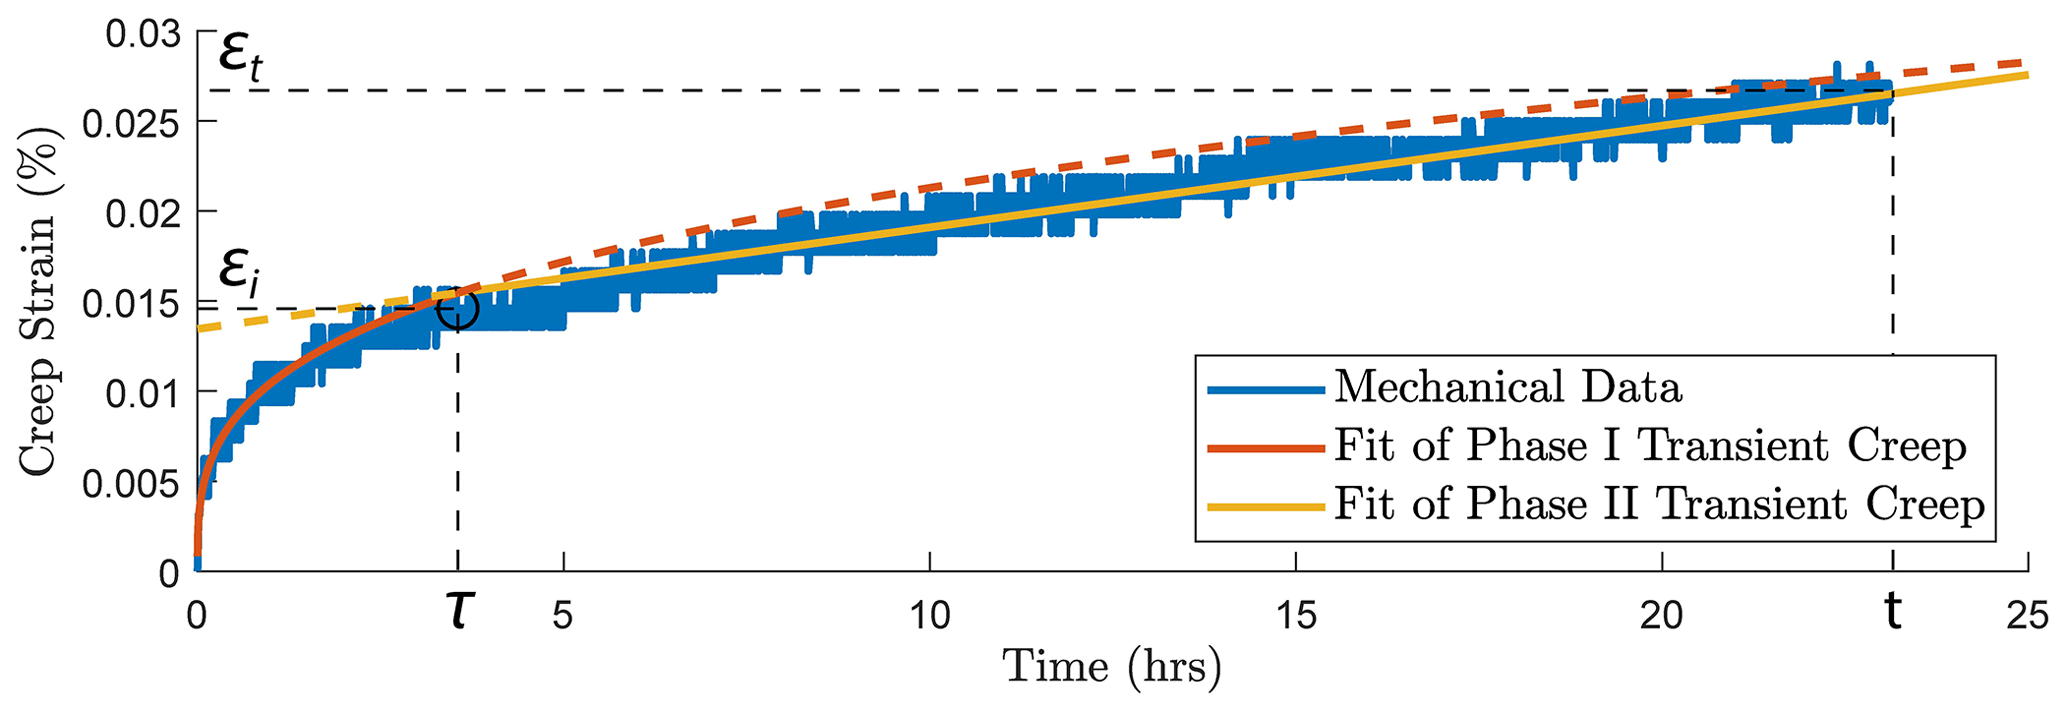
Figure A5Illustration of the method used to pick up the transition (circle) from phase I to phase II transient creep deformation. Two-phase model for the time evolution of creep strain. The transition (circle) from phase I to phase II creep deformation is selected based on the intersection of the power-law fit function of phase I creep (red) and linear fit function of the phase II creep (yellow).
A4 Creep strain–stress models
The strain rate during phase II creep deformation is generally described using the power-law form (e.g., Atkinson, 1984; Meredith and Atkinson, 1983):
or the exponential form (e.g., Charles and Hillig, 1962):
where ε is the creep strain and σ is the differential stress. A, B, n and η are constants. Both models have described our laboratory data well. The exponential model seems to be slightly better than the power-law model when comparing the R2 factors.
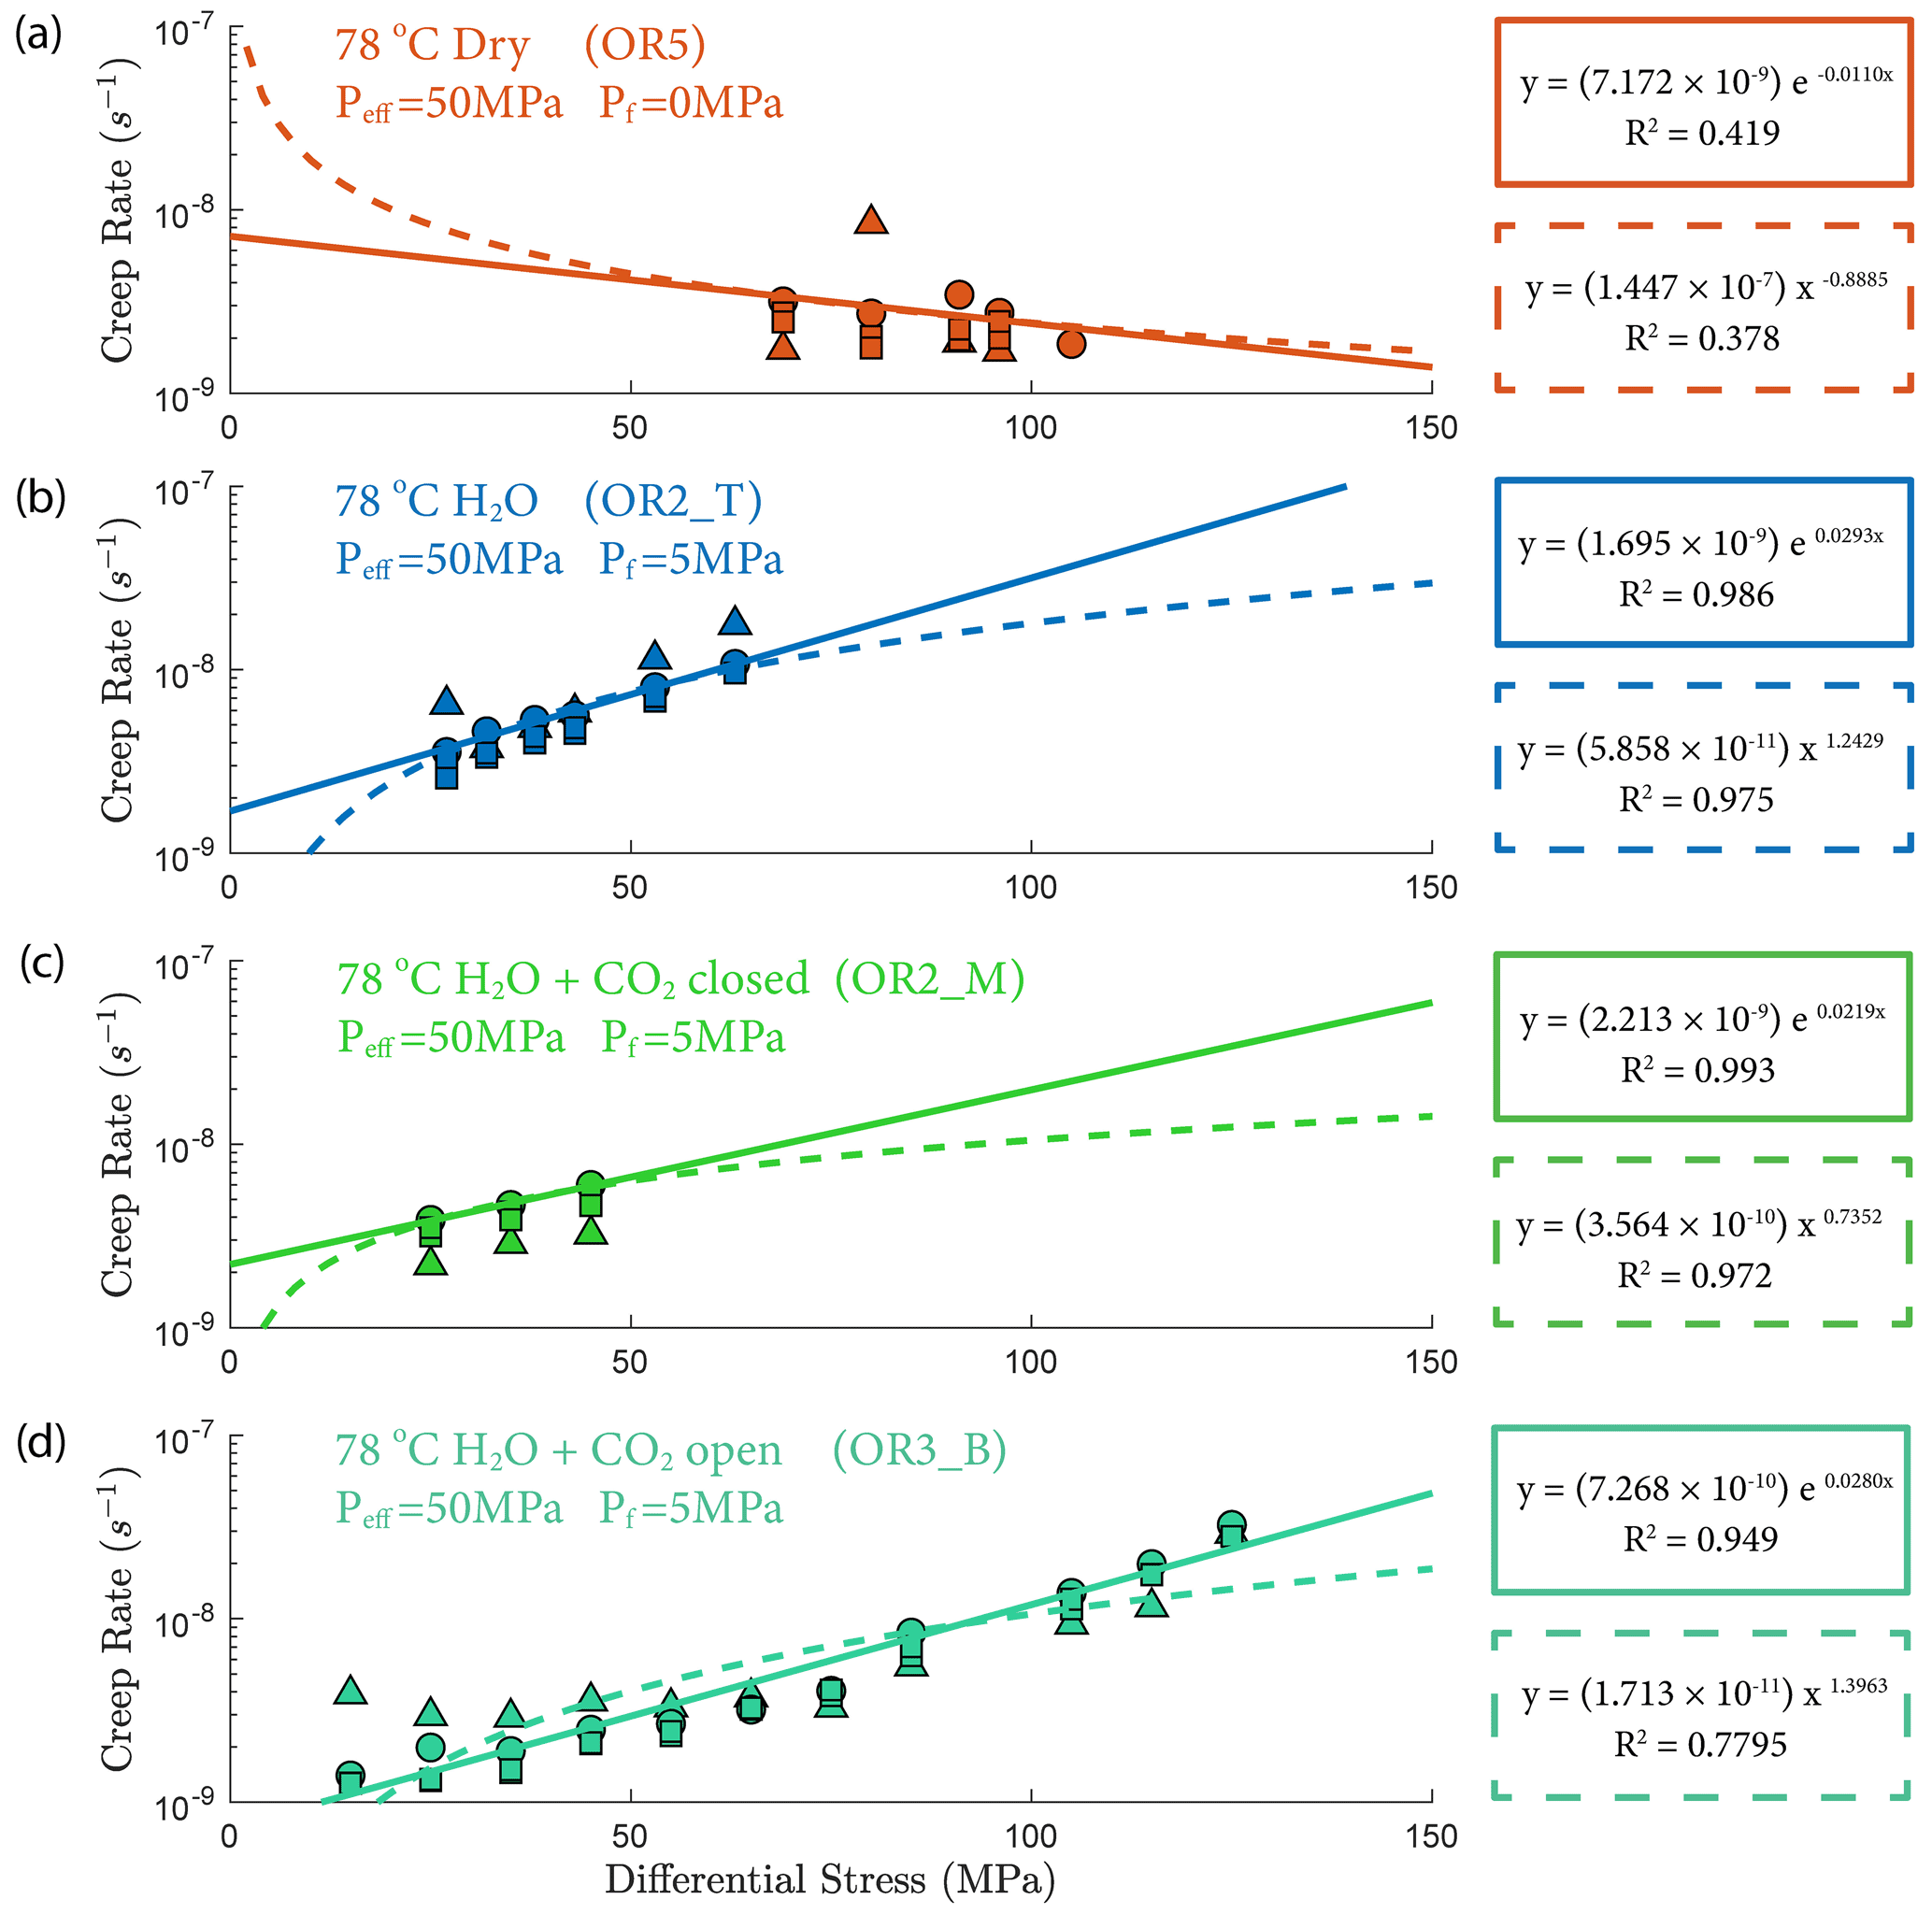
Figure A6Power-law (dashed line) and exponential (solid line) fit of creep rate–stress relationship. The strain rates are calculated from strain measurement from the main ram displacement (circle), strain gauge (triangle) and LVDTs (square).
A5 Gutenberg–Richter b value
Figure A7 shows the fitting of the Gutenberg–Richter b value from different experiments at various stress levels.
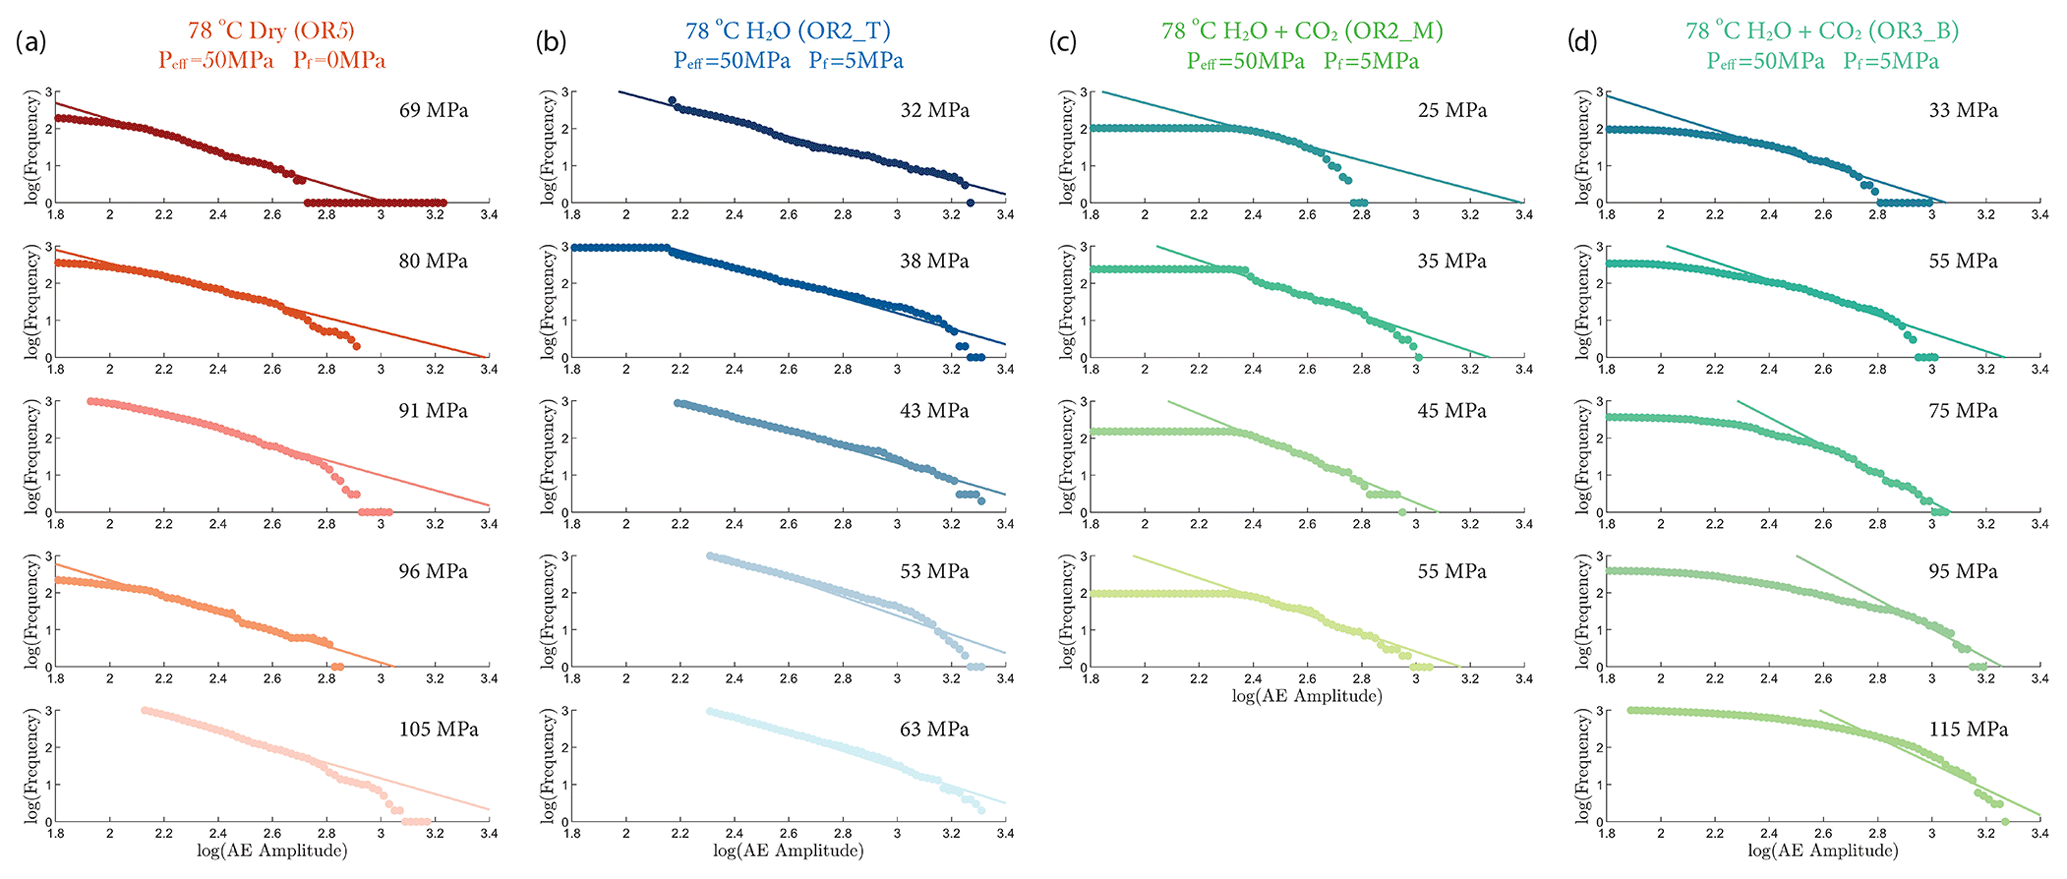
Figure A7Statistics of AE amplitudes for Gutenberg–Richter b value calculation from (a) dry, (b) H2O, (c) H2O + CO2 closed and (d) H2O + CO2 open experiments.
A6 Samples after deformation

Figure A8Photo of samples after deformation. The dry sample did not reach the final dynamic failure before the experiment was halted.
A7 Elastic modulus
The Young modulus (E) of the sample is calculated based on the strain measurement during the elastic loading using the following equation:
where Δσ is the differential stress, d is the displacement of main ram piston, and L is the length of the sample.
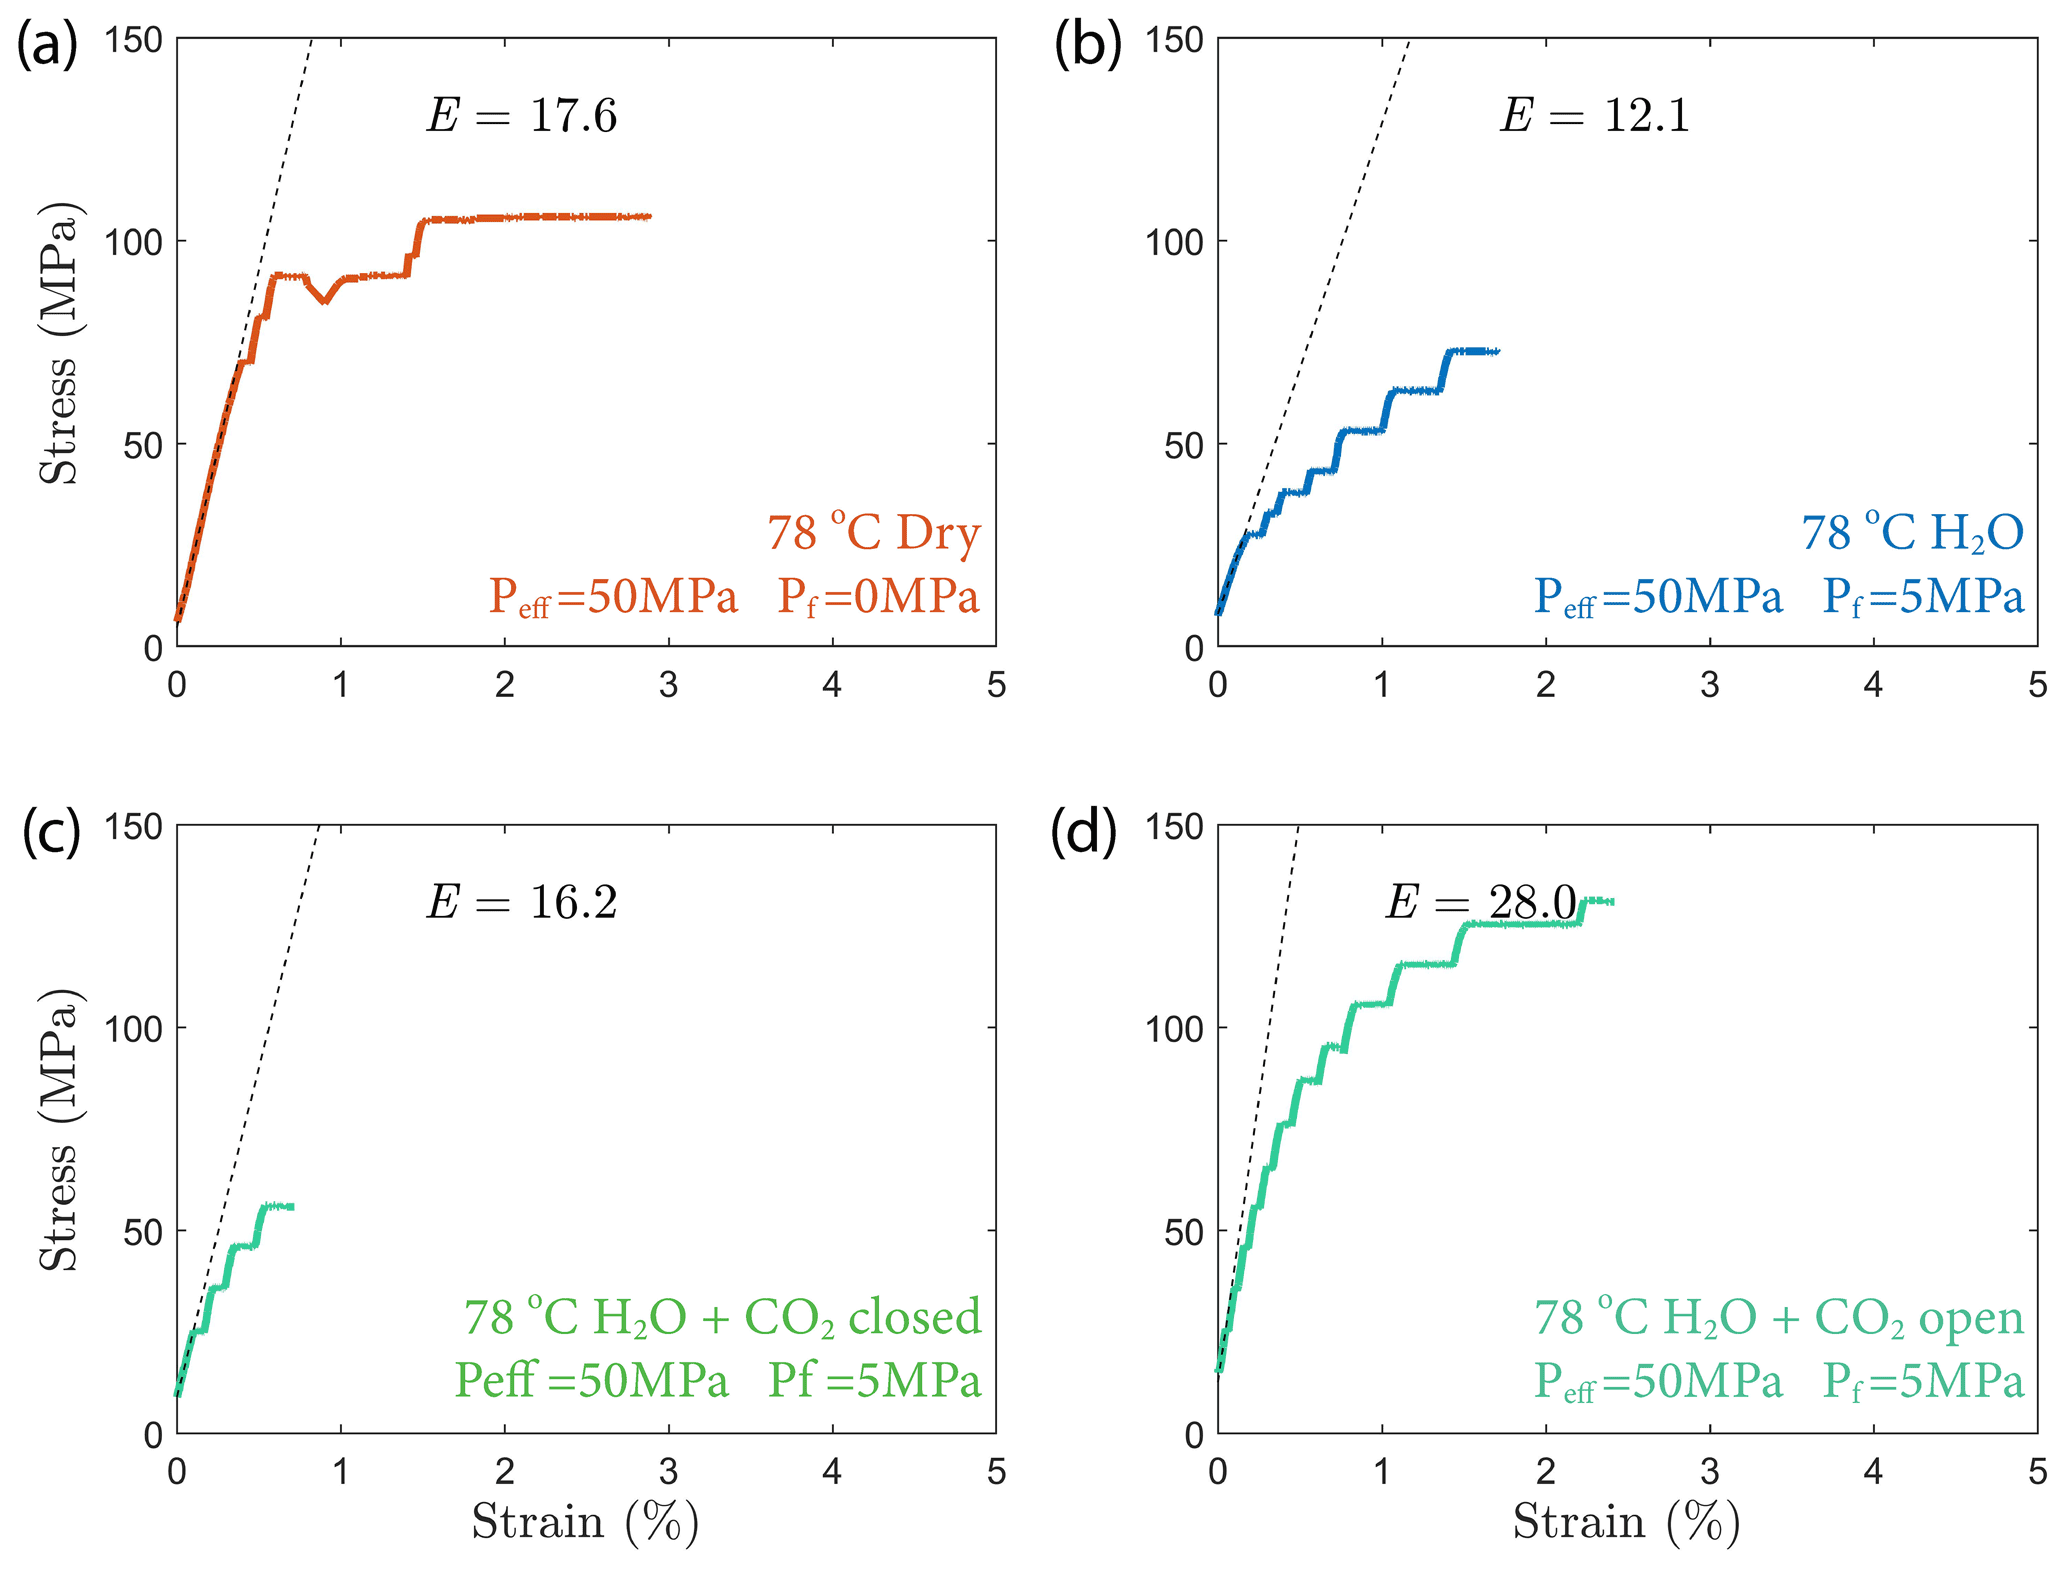
Figure A9Elastic modulus calculated from strain vs. stress plots from (a) dry, (b) H2O, (c) H2O + CO2 closed and (d) H2O + CO2 open experiments.
The underlying data are available at https://doi.org/10.5281/zenodo.4926587 (Xing et al., 2021).
TX and MP designed the study. TX, HG and UM performed the experiments. TX and HG performed the data analysis. TX wrote the paper with input from all authors. MP obtained the funding of this study.
The contact author has declared that neither they nor their co-authors have any competing interests.
Publisher's note: Copernicus Publications remains neutral with regard to jurisdictional claims in published maps and institutional affiliations.
The authors benefited from discussions with Ben Holtzman, Yves Bernabé, Brian Evans, Bradford Hager and Brent Minchew. The authors would like to thank Yves Bernabé for his copy-editing of this paper. The authors would also like to thank Edward Boyle and Richard Kayser for their help with the ICP-MS analysis. The X-ray tomographic images were obtained at the Center for Nanoscale Systems (CNS), a member of the National Nanotechnology Coordinated Infrastructure Network (NNCI), which is supported by the National Science Foundation under NSF award no. 1541959. CNS is part of Harvard University. The cores used in this study were generously provided by Sandra Snæbjörnsdóttir and Kári Helgaso. The authors would like to thank Philip Benson and the anonymous reviewer for their constructive and detailed reviews, as well as the editor, David Healy, and Federico Rossetti for the handling of this paper.
This research has been supported by the National Science Foundation (grant nos. EAR-1833478 and EAR-2054414), MITei's Carbon Capture, Utilization and Storage Center, and Scotiabank's Net Zero Research Fund.
This paper was edited by David Healy and reviewed by Philip Benson and one anonymous referee.
Alfredsson, H. A., Hardarson, B. S., Franzson, H., and Gislason, S. R.: CO2 sequestration in basaltic rock at the Hellisheidi site in SW Iceland: stratigraphy and chemical composition of the rocks at the injection site, Mineral. Mag., 72, 1–5, https://doi.org/10.1180/minmag.2008.072.1.1, 2008.
Alfredsson, H. A., Oelkers, E. H., Hardarsson, B. S., Franzson, H., Gunnlaugsson, E., and Gislason, S. R.: The geology and water chemistry of the Hellisheidi, SW-Iceland carbon storage site, Int. J. Greenh. Gas Con., 12, 399–418, https://doi.org/10.1016/j.ijggc.2012.11.019, 2013.
Anderson, O. L. and Grew, P. C.: Stress corrosion theory of crack propagation with applications to geophysics, Rev. Geophys., 15, 77–104 https://doi.org/10.1029/RG015i001p00077, 1977.
Aradóttir, E. S. P., Sonnenthal, E. L., Björnsson, G., and Jónsson, H.: Multidimensional reactive transport modeling of CO2 mineral sequestration in basalts at the Hellisheidi geothermal field, Iceland, Int. J. Greenh. Gas Con., 9, 24–40, https://doi.org/10.1016/J.IJGGC.2012.02.006, 2012.
Atkinson, B. K.: Subcritical crack growth in geological materials, J. Geophys. Res.-Sol. Ea., 89, 4077–4114, https://doi.org/10.1029/JB089iB06p04077, 1984.
Atkinson, B. K. and Meredith, P. G.: Fracture mechanics of rock- The Theory of Subcritical Crack Growth with Applications to Minerals and Rocks, in: Academic Press Geology Series, 111–166, ISBN 978-0-12-066265-4, 1987.
Atkinson, G. M., Eaton, D. W., and Igonin, N.: Developments in understanding seismicity triggered by hydraulic fracturing, Nat. Rev. Earth Environ., 1, 264–277, https://doi.org/10.1038/s43017-020-0049-7, 2020.
Baud, P. and Meredith, P. G.: Damage accumulation during triaxial creep of Darley Dale sandstone from pore volumometry and acoustic emission, Int. J. Rock Mech. Min., 34, 24.e1–24.e10, https://doi.org/10.1016/S1365-1609(97)00060-9, 1997.
Baud, P., Zhu, W., and Wong, T.: Failure mode and weakening effect of water on sandstone, J. Geophys. Res.-Sol. Ea., 105, 16371–16389, https://doi.org/10.1029/2000jb900087, 2000.
Brace, W. F., Paulding, B. W., and Scholz, C. H.: Dilatancy in the fracture of crystalline rocks, J. Geophys. Res., 71, 3939–3953, https://doi.org/10.1029/jz071i016p03939, 1966.
Brantut, N.: Time-dependent recovery of microcrack damage and seismic wave speeds in deformed limestone, J. Geophys. Res.-Sol. Ea., 120, 8088–8109, https://doi.org/10.1002/2015JB012324, 2015.
Brantut, N., Baud, P., Heap, M. J., and Meredith, P. G.: Micromechanics of brittle creep in rocks, J. Geophys. Res.-Sol. Ea., 117, https://doi.org/10.1029/2012JB009299, 2012.
Brantut, N., Heap, M. J., Meredith, P. G., and Baud, P.: Time-dependent cracking and brittle creep in crustal rocks: A review, J. Struct. Geol., 52, 17–43, https://doi.org/10.1016/j.jsg.2013.03.007, 2013.
Broberg, K. B.: Differences Between Mode I and Mode II Crack Propagation, Pure Appl. Geophys., 163, 1867–1879, https://doi.org/10.1007/s00024-006-0101-7, 2006.
Broecker, W. S.: Climatic change: Are we on the brink of a pronounced global warming?, Science, 189, 460–463, https://doi.org/10.1126/science.189.4201.460, 1975.
Brzesowsky, R. H., Hangx, S. J. T., Brantut, N., and Spiers, C. J.: Compaction creep of sands due to time-dependent grain failure: Effects of chemical environment, applied stress, and grain size, J. Geophys. Res.-Sol. Ea., 119, 7521–7541, https://doi.org/10.1002/2014JB011277, 2014.
Callow, B., Falcon-Suarez, I., Ahmed, S., and Matter, J. M.: Assessing the carbon sequestration potential of basalt using X-ray micro-CT and rock mechanics, Int. J. Greenh. Gas Con., 70, 146–156, https://doi.org/10.1016/j.ijggc.2017.12.008, 2018.
Chang, C., Zoback, M. D., and Khaksar, A.: Empirical relations between rock strength and physical properties in sedimentary rocks, J. Petrol. Sci. Eng., 51, 223–237, https://doi.org/10.1016/j.petrol.2006.01.003, 2006.
Charles, R. J. and Hillig, W. B.: The Kinetics of Glass Failure by Stress Corrosion, in: Symposium on Mechanical Strength of Glass and Ways of Improving It., Charleroi (Belgique), 1962.
Chester, F. M., Chester, J. S., Kronenberg, A. K., and Hajash, A.: Subcritical creep compaction of quartz sand at diagenetic conditions: Effects of water and grain size, J. Geophys. Res., 112, B06203, https://doi.org/10.1029/2006JB004317, 2007.
Chester, J., Lenz, S., Chester, F., and Lang, R.: Mechanisms of compaction of quartz sand at diagenetic conditions, Earth Planet. Sc. Lett., 220, 435–451, https://doi.org/10.1016/S0012-821X(04)00054-8, 2004.
Dunkel, K. G., Austrheim, H., Renard, F., Cordonnier, B., and Jamtveit, B.: Localized slip controlled by dehydration embrittlement of partly serpentinized dunites, Leka Ophiolite Complex, Norway, Earth Planet. Sc. Lett., 463, 277–285, https://doi.org/10.1016/j.epsl.2017.01.047, 2017.
Dunning, J. D. and Miller, M. E.: Effects of pore fluid chemistry on stable sliding of Berea sandstone, Pure Appl. Geophys., 122, 447–462, https://doi.org/10.1007/BF00874611, 1985.
Fortin, J., Stanchits, S., Vinciguerra, S., and Guéguen, Y.: Influence of thermal and mechanical cracks on permeability and elastic wave velocities in a basalt from Mt. Etna volcano subjected to elevated pressure, Tectonophysics, 503, 60–74, https://doi.org/10.1016/j.tecto.2010.09.028, 2011.
Ghaffari, H. O. and Pec, M.: An ultrasound probe array for a high-pressure, high-temperature solid medium deformation apparatus, Rev. Sci. Instrum., 91, 085117, https://doi.org/10.1063/5.0004035, 2020.
Ghaffari, H. O., Mok, U., and Pec, M.: On calibration of piezoelectric sensors with laser doppler vibrometer, J. Acoust. Soc. Am., 150, 2503, https://doi.org/10.1121/10.0006445, 2021.
Gislason, S. R. and Hans, P. E.: Meteoric water-basalt interactions. I: A laboratory study, Geochim. Cosmochim. Ac., 51, 2827–2840, https://doi.org/10.1016/0016-7037(87)90161-X, 1987.
Gislason, S. R. and Oelkers, E. H.: Carbon Storage in Basalt, Science, 344, 373–374, https://doi.org/10.1126/science.1250828, 2014.
Gislason, S. R., Wolff-Boenisch, D., Stefansson, A., Oelkers, E. H., Gunnlaugsson, E., Sigurdardottir, H., Sigfusson, B., Broecker, W. S., Matter, J. M., and Stute, M.: Mineral sequestration of carbon dioxide in basalt: A pre-injection overview of the CarbFix project, Int. J. Greenh. Gas Con., 4, 537–545, https://doi.org/10.1016/j.ijggc.2009.11.013, 2010.
Goff, F. and Lackner, K. S.: Carbon dioxide sequestering using ultramafic rocks, Environ. Geosci., 5, 89–101, https://doi.org/10.1046/j.1526-0984.1998.0a8014.x, 1998.
Guglielmi, Y., Cappa, F., Avouac, J. P., Henry, P., and Elsworth, D.: Seismicity triggered by fluid injection-induced aseismic slip, Science, 348, 1224–1226, https://doi.org/10.1126/science.aab0476, 2015.
Hangx, S. J. T. and Spiers, C. J.: Reaction of plagioclase feldspars with CO2 under hydrothermal conditions, Chem. Geol., 265, 88–98, https://doi.org/10.1016/j.chemgeo.2008.12.005, 2009.
Hansen, L. D., Dipple, G. M., Gordon, T. M., and Kellett, D. A.: CARBONATED SERPENTINITE (LISTWANITE) AT ATLIN, BRITISH COLUMBIA: A GEOLOGICAL ANALOGUE TO CARBON DIOXIDE SEQUESTRATION, Can. Mineral., 43, 225–239, https://doi.org/10.2113/gscanmin.43.1.225, 2005.
Hatton, C. G., Main, I. G., and Meredith, P. G.: A comparison of seismic and structural measurements of scaling exponents during tensile subcritical crack growth, J. Struct. Geol., 15, 1485–1495, https://doi.org/10.1016/0191-8141(93)90008-X, 1993.
Heap, M. J., Baud, P., Meredith, P. G., Bell, A. F., and Main, I. G.: Time-dependent brittle creep in darley dale sandstone, J. Geophys. Res.-Sol. Ea., 114, 1–22, https://doi.org/10.1029/2008JB006212, 2009.
Heap, M. J., Baud, P., Meredith, P. G., Vinciguerra, S., Bell, A. F., and Main, I. G.: Brittle creep in basalt and its application to time-dependent volcano deformation, Earth Planet. Sc. Lett., 307, 71–82, https://doi.org/10.1016/j.epsl.2011.04.035, 2011.
Heard, H. C.: Chapter 7: Transition from Brittle Fracture to Ductile Flow in Solenhofen Limestone as a Function of Temperature, Confining Pressure, and Interstitial Fluid Pressure, in: Rock Deformation (A Symposium), Vol. 79, Geological Society of America, https://doi.org/10.1130/MEM79-p193, ISBN 978-0-8137-1079-2, 1960.
Heilbronner, R. and Barrett, S.: Image Analysis in Earth Sciences, Springer Berlin Heidelberg, Berlin, Heidelberg, ISBN 978-3-642-10343-8, 2014.
Helmons, R. L. J., Miedema, S. A., and van Rhee, C.: Simulating hydro mechanical effects in rock deformation by combination of the discrete element method and the smoothed particle method, Int. J. Rock Mech. Min., 86, 224–234, https://doi.org/10.1016/j.ijrmms.2016.04.018, 2016.
Hillig, W. B.: The C-H delayed failure mechanism revisited, Int. J. Fract., 139, 197–211, https://doi.org/10.1007/s10704-006-0025-3, 2006.
Iyer, K., Jamtveit, B., Mathiesen, J., Malthe-Sørenssen, A., and Feder, J.: Reaction-assisted hierarchical fracturing during serpentinization, Earth Planet. Sc. Lett., 267, 503–516, https://doi.org/10.1016/j.epsl.2007.11.060, 2008.
Jamtveit, B., Putnis, C. V., and Malthe-Sørenssen, A.: Reaction induced fracturing during replacement processes, Contrib. Mineral. Petr., 157, 127–133, https://doi.org/10.1007/s00410-008-0324-y, 2009.
Kanakiya, S., Adam, L., Esteban, L., Rowe, M. C., and Shane, P.: Dissolution and secondary mineral precipitation in basalts due to reactions with carbonic acid, J. Geophys. Res.-Sol. Ea., 122, 4312–4327, https://doi.org/10.1002/2017JB014019, 2017.
Kelemen, P. B. and Hirth, G.: Reaction-driven cracking during retrograde metamorphism: Olivine hydration and carbonation, Earth Planet. Sc. Lett., 345–348, 81–89, https://doi.org/10.1016/j.epsl.2012.06.018, 2012.
Kelemen, P. B. and Matter, J. M.: In situ carbonation of peridotite for CO2 storage, P. Natl. Acad. Sci. USA, 105, 17295–17300, https://doi.org/10.1073/pnas.0805794105, 2008.
Kelemen, P. B., Savage, H. M., and Hirth, G.: Reaction-Driven Cracking During Mineral Hydration, Carbonation and Oxidation, in: Poromechanics V, Vol. c, 823–826, American Society of Civil Engineers, Reston, VA, 2013.
Kranz, R. L., Harris, W. J., and Carter, N. L.: Static fatigue of granite at 200 ∘C, Geophys. Res. Lett., https://doi.org/10.1029/GL009i001p00001, 9, 1–4, 1982.
Lackner, K. S., Wendt, C. H., Butt, D. P., Joyce, E. L., and Sharp, D. H.: Carbon dioxide disposal in carbonate minerals, Energy, 20, 1153–1170, https://doi.org/10.1016/0360-5442(95)00071-N, 1995.
Lambart, S., Savage, H. M., Robinson, B. G., and Kelemen, P. B.: Experimental Investigation of the Pressure of Crystallization of Ca(OH) 2: Implications for the Reactive Cracking Process, Geochem. Geophy. Geosy., 19, 3448–3458, https://doi.org/10.1029/2018GC007609, 2018.
Larsson, D., Grönvold, K., Oskarsson, N., and Gunnlaugsson, E.: Hydrothermal alteration of plagioclase and growth of secondary feldspar in the Hengill Volcanic Centre, SW Iceland, J. Volcanol. Geoth. Res., 114, 275–290, https://doi.org/10.1016/S0377-0273(01)00267-0, 2002.
Lisabeth, H. P., Zhu, W., Xing, T., and De Andrade, V.: Dissolution-Assisted Pattern Formation During Olivine Carbonation, Geophys. Res. Lett., 44, 9622–9631, https://doi.org/10.1002/2017GL074393, 2017.
Liteanu, E., Niemeijer, A. R., Spiers, C. J., Peach, C. J., and De Bresser, J. H. P.: The effect of CO2 on creep of wet calcite aggregates, J. Geophys. Res.-Sol. Ea., 117, https://doi.org/10.1029/2011JB008789, 2012.
Lockner, D. A.: The role of acoustic emission in the study of rock fracture, Int. J. Rock Mech. Min., 30, 883–899, https://doi.org/10.1016/0148-9062(93)90041-B, 1993.
Lockner, D. A., Byerlee, J. D., Kuksenko, V., Ponomarev, A., and Sidorin, A.: Observations of Quasistatic Fault Growth from Acoustic Emissions, Int. Geophys., 51, 3–31, https://doi.org/10.1016/S0074-6142(08)62813-2, 1992.
Macdonald, A. H. and Fyfe, W. S.: Rate of serpentinization in seafloor environments, Tectonophysics, 116, 123–135, https://doi.org/10.1016/0040-1951(85)90225-2, 1985.
Mani, D., Nirmal Charan, S., and Kumar, B.: Assessment of carbon dioxide sequestration potential of ultramafic rocks in the greenstone belts of southern India, Curr. Sci., 94, 53–60, 2008.
Matter, J. M. and Kelemen, P. B.: Permanent storage of carbon dioxide in geological reservoirs by mineral carbonation, Nat. Geosci., 2, 837–841, https://doi.org/10.1038/ngeo683, 2009.
Matter, J. M., Takahashi, T., and Goldberg, D. S.: Experimental evaluation of in situ CO2-water-rock reactions during CO2 injection in basaltic rocks: Implications for geological CO2 sequestration, Geochem. Geophy. Geosy., 8, https://doi.org/10.1029/2006GC001427, 2007.
Matter, J. M., Stute, M., Snaebjornsdottir, S. O., Oelkers, E. H., Gislason, S. R., Aradottir, E. S., Sigfusson, B., Gunnarsson, I., Sigurdardottir, H., Gunnlaugsson, E., Axelsson, G., Alfredsson, H. A., Wolff-Boenisch, D., Mesfin, K., Taya, D. F. d.l. R., Hall, J., Dideriksen, K., and Broecker, W. S.: Rapid carbon mineralization for permanent disposal of anthropogenic carbon dioxide emissions, Science, 352, 1312–1314, https://doi.org/10.1126/science.aad8132, 2016.
McGrail, B. P., Schaef, H. T., Ho, A. M., Chien, Y. J., Dooley, J. J., and Davidson, C. L.: Potential for carbon dioxide sequestration in flood basalts, J. Geophys. Res.-Sol. Ea., 111, https://doi.org/10.1029/2005JB004169, 2006.
McGrail, B. P., Spane, F. A. A., Sullivan, E. C., Bacon, D. H., and Hund, G.: The Wallula basalt sequestration pilot project, Enrgy. Proced., 4, 5653–5660, https://doi.org/10.1016/j.egypro.2011.02.557, 2011.
McGrail, B. P., Schaef, H. T., Spane, F. A., Horner, J. A., Owen, A. T., Cliff, J. B., Qafoku, O., Thompson, C. J., and Sullivan, E. C.: Wallula Basalt Pilot Demonstration Project: Post-injection Results and Conclusions, Enrgy. Proced., 114, 5783–5790, https://doi.org/10.1016/j.egypro.2017.03.1716, 2017.
Meredith, P. G. and Atkinson, B. K.: Stress corrosion and acoustic emission during tensile crack propagation in Whin Sill dolerite and other basic rocks, Geophys. J. Roy. Astr. S., 75, 1–21, https://doi.org/10.1111/j.1365-246X.1983.tb01911.x, 1983.
Michalske, T. A. and Freiman, S. W.: A Molecular Mechanism for Stress Corrosion in Vitreous Silica, J. Am. Ceram. Soc., 66, 284–288, https://doi.org/10.1111/j.1151-2916.1983.tb15715.x, 1983.
Mighani, S., Bernabé, Y., Boulenouar, A., Mok, U., and Evans, B.: Creep Deformation in Vaca Muerta Shale From Nanoindentation to Triaxial Experiments, J. Geophys. Res.-Sol. Ea., 124, 7842–7868, https://doi.org/10.1029/2019JB017524, 2019.
Nara, Y., Yamanaka, H., Oe, Y., and Kaneko, K.: Influence of temperature and water on subcritical crack growth parameters and long-term strength for igneous rocks, Geophys. J. Int., 193, 47–60, https://doi.org/10.1093/gji/ggs116, 2013.
National Academies of Sciences, Engineering, and Medicine: Negative Emissions Technologies and Reliable Sequestration: A Research Agenda, National Academies Press, Washington, D.C., https://doi.org/10.17226/25259, 2019.
Oelkers, E. H., Gislason, S. R., and Matter, J. M.: Mineral carbonation of CO2, Elements, 4, 333–337, https://doi.org/10.2113/gselements.4.5.333, 2008.
Orowan, E.: The fatigue of glass under stress, Nature, 154, 341–343, https://doi.org/10.1038/154341a0, 1944.
Panozzo, R. É.: Two-dimensional strain from the orientation of lines in a plane, J. Struct. Geol., 6, 215–221, https://doi.org/10.1016/0191-8141(84)90098-1, 1984.
Reber, J. E. and Pec, M.: Comparison of brittle- and viscous creep in quartzites: Implications for semi-brittle flow of rocks, J. Struct. Geol., 113, 90–99, https://doi.org/10.1016/j.jsg.2018.05.022, 2018.
Reches, Z. and Lockner, D. A.: Nucleation and growth of faults in brittle rocks, J. Geophys. Res.-Sol. Ea., 99, 18159–18173, https://doi.org/10.1029/94jb00115, 1994.
Renard, F., Gundersen, E., Hellmann, R., Collombet, M., and Le Guen, Y.: Numerical modeling of the effect of carbon dioxide sequestration on the rate of pressure solution creep in limestone: Preliminary results, Oil Gas Sci. Technol., 60, 381–399, https://doi.org/10.2516/ogst:2005023, 2005.
Renard, F., Kandula, N., McBeck, J., and Cordonnier, B.: Creep Burst Coincident With Faulting in Marble Observed in 4-D Synchrotron X-Ray Imaging Triaxial Compression Experiments, J. Geophys. Res.-Sol. Ea., 125, e2020JB020354, https://doi.org/10.1029/2020JB020354, 2020.
Rice, J. R.: Thermodynamics of the quasi-static growth of Griffith cracks, J. Mech. Phys. Solids, 26, 61–78, https://doi.org/10.1016/0022-5096(78)90014-5, 1978.
Robertson, E. C.: Creep of Solenhofen Limestone Under Moderate Hydrostatic Pressure, 227–244, 1960.
Robertson, E. C.: Viscoelasticity of rocks, State Stress Earth's Crust, 181–233, 1964.
Rudge, J. F., Kelemen, P. B., and Spiegelman, M.: A simple model of reaction-induced cracking applied to serpentinization and carbonation of peridotite, Earth Planet. Sc. Lett., 291, 215–227, https://doi.org/10.1016/j.epsl.2010.01.016, 2010.
Rutter, E. H.: The influence of interstitial water on the rheological behaviour of calcite rocks, Tectonophysics, 14, 13–33, https://doi.org/10.1016/0040-1951(72)90003-0, 1972.
Rutter, E. H. and Hackston, A.: On the effective stress law for rock-on-rock frictional sliding, and fault slip triggered by means of fluid injection, Philos. T. R. Soc. A, 375, 20160001, https://doi.org/10.1098/rsta.2016.0001, 2017.
Scholz, C. H.: Mechanism of creep in brittle rock, J. Geophys. Res., 73, 3295–3302, https://doi.org/10.1029/JB073i010p03295, 1968.
Scholz, C. H.: Static fatigue of quartz, J. Geophys. Res., 77, 2104–2114, https://doi.org/10.1029/JB077i011p02104, 1972.
Seifritz, W.: CO2 disposal by means of silicates, Nature, 345, 486–486, https://doi.org/10.1038/345486b0, 1990.
Skarbek, R. M., Savage, H. M., Kelemen, P. B., and Yancopoulos, D.: Competition Between Crystallization-Induced Expansion and Creep Compaction During Gypsum Formation, and Implications for Serpentinization, J. Geophys. Res.-Sol. Ea., 123, 5372–5393, https://doi.org/10.1029/2017JB015369, 2018.
Snæbjörnsdóttir, S. Ó. and Gislason, S. R.: CO2 Storage Potential of Basaltic Rocks Offshore Iceland, Enrgy. Proced., 86, 371–380, https://doi.org/10.1016/j.egypro.2016.01.038, 2016.
Snæbjörnsdóttir, S. Ó., Gislason, S. R., Galeczka, I. M., and Oelkers, E. H.: Reaction path modelling of in-situ mineralisation of CO2 at the CarbFix site at Hellisheidi, SW-Iceland, Geochim. Cosmochim. Ac., 220, 348–366, https://doi.org/10.1016/j.gca.2017.09.053, 2018.
Snæbjörnsdóttir, S. Ó., Sigfússon, B., Marieni, C., Goldberg, D., Gislason, S. R., and Oelkers, E. H.: Carbon dioxide storage through mineral carbonation, Nat. Rev. Earth Environ., 1, 90–102, https://doi.org/10.1038/s43017-019-0011-8, 2020.
Terzaghi, K.: Theoretical soil mechanics, Chapman And Hall, Limited, London, ISBN 0471853054 9780471853053, 1943.
Tutolo, B. M., Awolayo, A., and Brown, C.: Alkalinity Generation Constraints on Basalt Carbonation for Carbon Dioxide Removal at the Gigaton-per-Year Scale, Environ. Sci. Technol., 55, 11906–11915, https://doi.org/10.1021/acs.est.1c02733, 2021.
Wong, L. N. Y. and Einstein, H. H.: Systematic evaluation of cracking behavior in specimens containing single flaws under uniaxial compression, Int. J. Rock Mech. Min., 46, 239–249, https://doi.org/10.1016/j.ijrmms.2008.03.006, 2009.
Xing, T., Zhu, W., Fusseis, F., and Lisabeth, H.: Generating porosity during olivine carbonation via dissolution channels and expansion cracks, Solid Earth, 9, 879–896, https://doi.org/10.5194/se-9-879-2018, 2018.
Xing, T., Ghaffari, O. H., Mok, U., and Pec, M.: Creep of Basalts Undergoing Carbonation: Effect of Rock-Fluid Interaction, Zenodo [data set], https://doi.org/10.5281/zenodo.4926587, 2021.
Zakharova, N. V., Goldberg, D. S., Sullivan, E. C., Herron, M. M., and Grau, J. A.: Petrophysical and geochemical properties of Columbia River flood basalt: Implications for carbon sequestration, Geochem. Geophy. Geosy., 13, 1–22, https://doi.org/10.1029/2012GC004305, 2012.
Zhang, X. and Spiers, C. J.: Compaction of granular calcite by pressure solution at room temperature and effects of pore fluid chemistry, Int. J. Rock Mech. Min., 42, 950–960, https://doi.org/10.1016/j.ijrmms.2005.05.017, 2005.
Zhang, X., Spiers, C. J., and Peach, C. J.: Compaction creep of wet granular calcite by pressure solution at 28 ∘C to 150 ∘C, J. Geophys. Res.-Sol. Ea., 115, https://doi.org/10.1029/2008JB005853, 2010.
Zhang, Z. L., Xu, W. Y., Wang, W., and Wang, R. B.: Triaxial creep tests of rock from the compressive zone of dam foundation in Xiangjiaba Hydropower Station, Int. J. Rock Mech. Min., 50, 133–139, https://doi.org/10.1016/j.ijrmms.2012.01.003, 2012.
Zhu, W. and Wong, T.: The transition from brittle faulting to cataclastic flow: Permeability evolution, J. Geophys. Res.-Sol. Ea., 102, 3027–3041, https://doi.org/10.1029/96jb03282, 1997.
Zhu, W., Fusseis, F., Lisabeth, H. P., Xing, T., Xiao, X., De Andrade, V., and Karato, S.: Experimental evidence of reaction-induced fracturing during olivine carbonation, Geophys. Res. Lett., 43, 9535–9543, https://doi.org/10.1002/2016GL070834, 2016.