the Creative Commons Attribution 4.0 License.
the Creative Commons Attribution 4.0 License.
 | 31 Aug 2022
Numerical simulation of contemporary kinematics at the northeastern Tibetan Plateau and its implications for seismic hazard assessment
Xianrui Li
Fanyan Yang
Lili Pan
Jingxiong Tian
The slip rates of active faults in the northeastern Tibetan Plateau (NETP) require clarification to understand the lateral expansion of the Tibetan Plateau and assess the seismic hazards in this region. To obtain the continuous slip rates of active faults at the NETP, we constructed a three-dimensional (3D) numerical geomechanics model that includes a complex 3D fault system. The model also accounts for the physical rock properties, gravity fields, fault friction coefficients, initial stress, and boundary conditions. Following this, we present the long-term kinematics of NETP based on the horizontal and vertical velocities and fault slip rates acquired from the model. The fault kinematic characteristics indicate that the Laohushan, middle–southern Liupanshan, and Guguan–Baoji faults, as well as the junction area of the Maxianshan and Zhuanglanghe faults, are potential hazard areas for strong earthquakes. However, as these faults are currently in the stress accumulation stage, they are unlikely to cause a strong earthquake in the short term. In contrast, it is likely that the Jinqiangshan–Maomaoshan fault will generate a earthquake with a surface-wave magnitude (MS) of 7.1–7.3 in the coming decades. In addition, the velocity profiles across the NETP imply that the plate rotation is the primary deformation mechanism of the NETP even though the intra-block straining and faulting are non-negligible.
- Article
(37303 KB) - Full-text XML
- BibTeX
- EndNote


The northeastern Tibetan Plateau (NETP) is the growth front of the Tibetan Plateau (TP). Modern geomorphology and tectonic features of the NETP are thought to be formed by the expansion of the TP toward its periphery, which has been ongoing since the initial collision of the Indian and Eurasian plates (Achache et al., 1984; Patriat and Achache 1984; P. Zhang et al., 2013, 2014). Having experienced strong Cenozoic deformation, crust in this area has developed a complex fault system with several large and deep faults, such as the Haiyuan fault (F1), West Ordos fault (F2), West Qinling fault (F3), and East Kunlun fault (F4), that divide the NETP into the Alxa, Ordos, Qilian, Qaidam, and Bayan Har blocks (Zhang et al., 2003; Fig. 1). These faults are characterized by intense tectonic movements and seismic activity (Zhang, 1999; Zheng et al., 2016b). At least five earthquakes with magnitudes of ≥ M 8, such as the 1654 M 8.0 Tianshui, 1739 M 8.0 Pingluo, 1879 M 8.0 Wudu, 1920 M 8.0 Haiyuan, and 1927 M 8.0 Gulang earthquakes, have occurred in this area and caused huge losses of life and property (Fig. 1). Because the generation and magnitude of an earthquake are closely related to fault activity, long-term fault slip rate plays a key role in medium- and long-term seismic hazard assessment (Ding et al., 1993; Xu et al., 2018). For example, combined with coseismic displacements, long-term fault slip rates can be used to calculate the earthquake recurrence interval (Shen et al., 2009) and assess the magnitudes of potential earthquakes (Bai et al., 2018; Hergert and Heidbach, 2010). Moreover, the spatially continuous fault slip rates that NETP lacks can also be used to reconstruct the tectonic evolution of this area and provide important insights into the lateral expansion pattern and deformation mechanisms of the TP (Royden et al., 1997; Tapponnier et al., 1982; Zhang et al., 2004).
Although there has been extensive research on fault slip rates in the NETP using geologic (Chen et al., 2019; C. Li et al., 2009; X. Li et al., 2018; Matrau et al., 2019; Wang et al., 2021; X. Li et al., 2017) or geodetic (Hao et al., 2021; X. Li et al., 2019, 2021a) approaches, a systematic mismatch is typically found between the slip rates calculated from geological records and those obtained from geodetic inversion, owing to the limited assumptions behind these two methods. For example, the geological slip rates only represent the activities of one fault branch measured in a fault zone, which always consists of several branches. They are usually lower than the geodetic slip rates as a whole if a rigid block assumption is adopted in the geodetic inversion process (Shen et al., 2009). However, several crustal deformation studies conducted in TP have demonstrated that the internal block deformation in the NETP cannot be ignored (Royden et al., 1997; Zhang et al., 2004; Y. Li et al., 2017, 2021). Numerical modeling provides a powerful tool for studying large-scale crustal kinematics (Hergert and Heidbach, 2010; Hergert et al., 2011), as well as a comprehensive three-dimensional (3D) view of fault activities with a spatially continuous distribution. High efficiency and accuracy have made numerical modeling a widespread technology in the geosciences, especially for the study of kinematics and dynamics of the NETP (Pang et al., 2019a, b; Sun et al., 2018, 2019; Zhu et al., 2018; Xiao and He, 2015). However, these previous numerical models have been either two-dimensional (2D) or 3D with extremely simplified fault planes. To our knowledge, there is not currently a 3D geomechanical model that considers the complex 3D fault system in the NETP. Therefore, detailed kinematics of the crust and faults in the NETP remain unclear.
In this study, a comprehensive 3D geomechanical model of the NETP was constructed with detailed complex 3D fault geometries, heterogeneous rock properties, and reasonable initial crustal stress. After calibration with model-independent observations, the results of the geomechanical model, such as the horizontal crustal velocities and spatially continuous slip rates of major faults, were presented. Based on these results, we summarized the long-term crustal deformation characteristics in the NETP. Finally, we assessed the seismic hazards of major faults in the study area and suggested that the Jinqiangshan–Maomaoshan fault has the potential for an MS 7.1–7.3 earthquake in the coming decades.
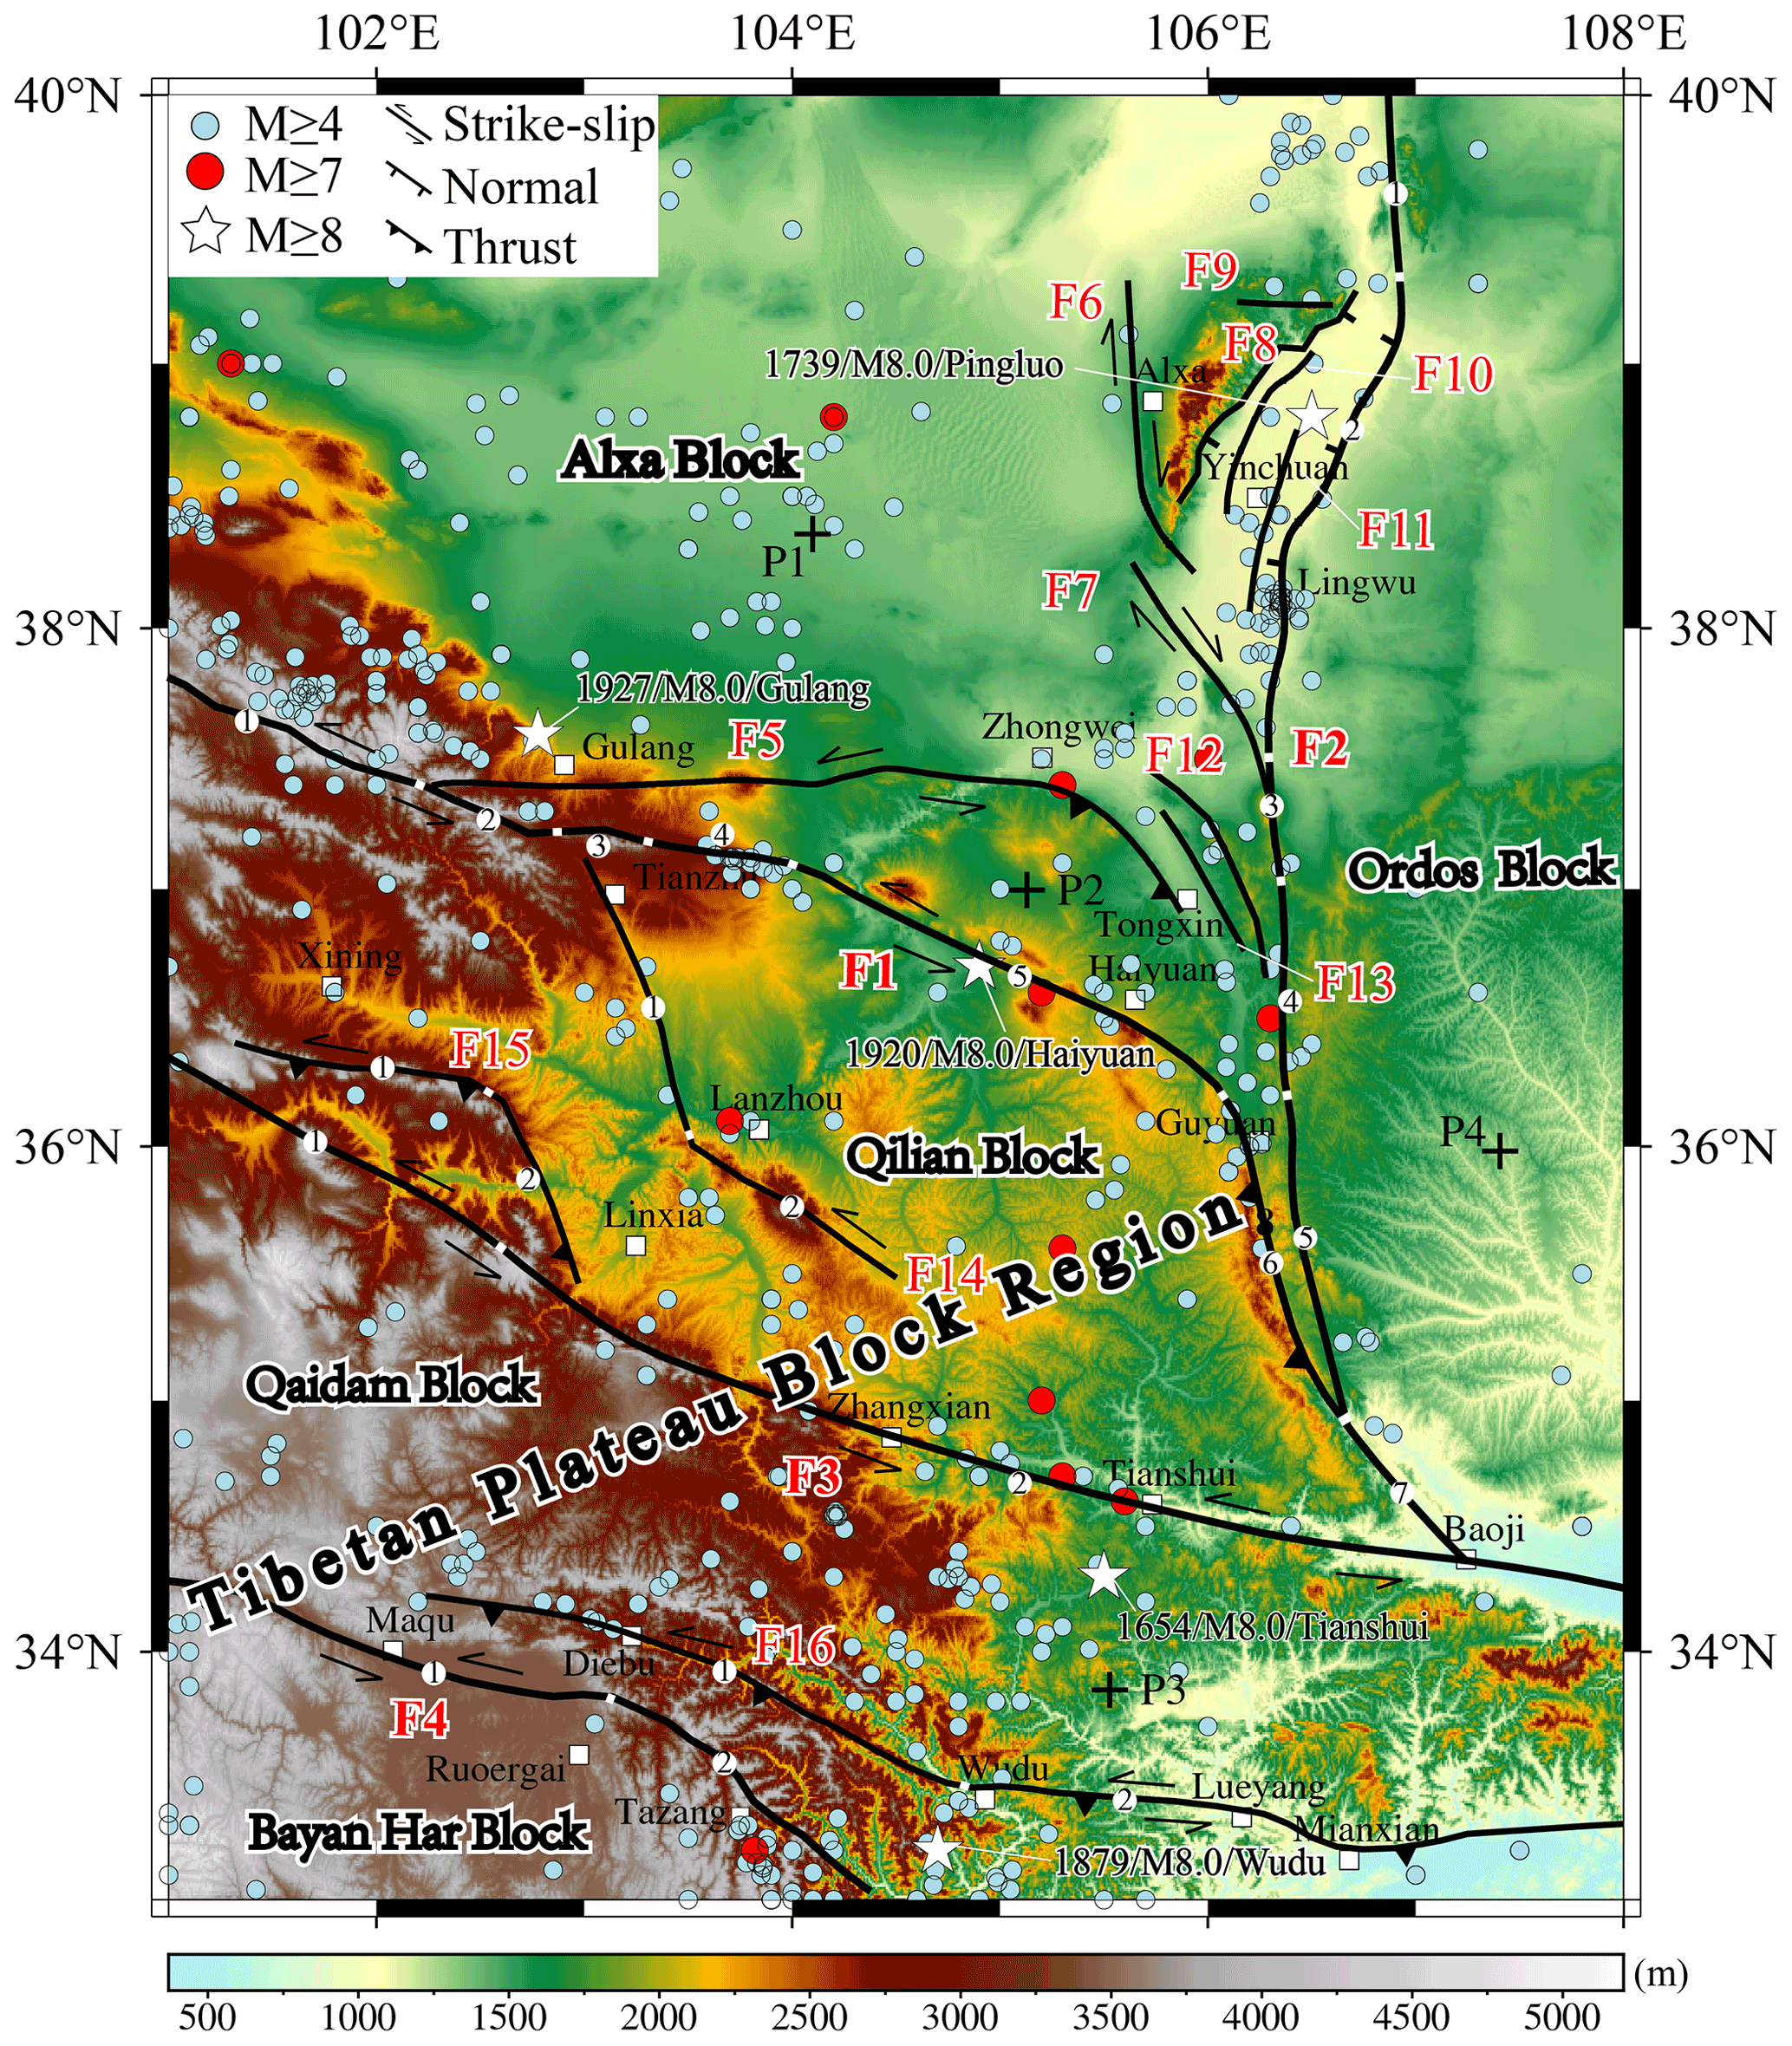
Figure 1Map of active faults and earthquakes in the NETP. Black lines represent the active faults. The light blue and red dots and white stars represent earthquakes from 1831 BCE to 2017 CE from the National Earthquake Data Center (http://data.earthquake.cn, last access: 25 August 2022). Black crosses (P1–P4) indicate the locations of four test sites for comparison with the numerical model shown in Fig. 3b. Faults discussed in the text are labeled as follows: F1-1 is the Lenglongling fault, LLLF; F1-2 is the Jinqinaghe fault, JQHF; F1-3 is the Maomaoshan fault, MMSF; F1-4 is the Laohushan fault, LHSF; F1-5 is the Haiyuan fault, HYF; F1-6 is the Liupanshan fault, LPSF; F1-7 is the Guguan–Baoji fault, GG-BJF; F2-1 is the Zhuozishan fault, ZZSF; F2-2 is the Huanghe fault, HHF; F2-3 is the Luoshan fault, LSF; F2-4 is the Yunwushan fault, YWSF; F2-5 is the Xiaoguanshan fault, XGSF; F3-1 is the Daotanghe–Linxia fault, DTH-LXF; F3-2 is the West Qinling fault, WQLF; F4-1 is the Eastern Kunlun fault, EKLF; F4-2 is the Tazang fault, TZF; F5 is the Tianjingshan fault, TJSF; F6 is the West Helanshan fault, WHLSF; F7 is the Niushoushan fault, NSSF; F8 is the East Helanshan fault, EHLSF; F9 is the Zhengyiguan fault, ZYGF; F10 is the Lvhuatai fault, LHTF; F11 is the Yinchuan fault, YCF; F12 is the Yantongshan fault, YTSF; F13 is the Qingshuihe fault, QSHF; F14-1 is the Zhuanglanghe fault, ZLSF; F14-2 is the Maxianshan fault, MXSF; F15-1 is the West Lajishan fault, WLJSF; F15-2 is the East Lajishan fault, ELJSF; F16-1 is the Diebu–Bailongjiang fault, DB-BLJF; and F16-2 is the Wudu–Kangxian fault, WD-KXF.
2.1 Model geometry
The proposed 3D geomechanical model is a rectangular Cartesian 3D block with an E–W length of 654 km (101–108∘ E), N–S length of 777 km (33–40∘ N), and thickness of ∼ 80 km. The topography of the model surface is based on GTOPO30 elevation data, which have a resolution of 30 arcsec (approximately 900 m). The model consists of four layers: (from top to bottom) the upper crust, middle crust, lower crust, and upper mantle. The geometric data of the layer interfaces were derived from CRUST1.0 (Laske et al., 2013).
Based on their depth, the faults of the model can be categorized into lithospheric and crustal faults. Lithospheric faults (i.e., F1, F2, F3, and F4) cut through the Moho and reach the bottom of the model (Zhan et al., 2005; B. Liu et al., 2017; Zhao et al., 2015; Fig. 2a, b; Table 1). All other faults are crustal faults that terminate in the upper, middle, or lower crust (Yuan et al., 2002b, 2003; Lease et al., 2012; Meng et al., 2012; B. Liu et al., 2017; Wu et al., 2020). The fault traces were modified from Xu et al. (2016), and the attitudes of these faults were summarized from previously published data, including surface fault surveys and deep seismic profiles (Table 1). In the NETP, many geophysical investigations found that low-velocity bodies exist in the middle–lower crust and deformations in the upper crust are not coupled to those in the middle–lower crust (Bao et al., 2013; Wang et al., 2018; Ye et al., 2016). Therefore, we introduced a contact surface between the upper and middle crusts into the model and treat it as a decollement layer that makes the upper crust decouple from the middle crust and allows the upper crust to slide freely along the contact surface based on the stress conditions.
The model was meshed using tetrahedron elements. The element size was 1–2 km near the faults and increased to ∼ 10 km at the model boundary. The model contained a total of 8 463 583 elements (Fig. 2a).
2.2 Rock properties
To obtain the time-independent contemporary background crustal stress of the NETP, we assumed that the rock rheology in the model was linear elasticity, consistent with the observations that the large-scale continental crust always exhibits elastic–brittle behavior rather than elastic–viscous behavior (Armijo et al., 2004; Hubert-Ferrari et al., 2003). The model was divided into three major tectonic units – the Alxa, Ordos, and TP block regions. The portion of the TP Block region located in the study area consisted of the Qilian, Qaidam, and Bayan Har blocks. The rock properties of each block included the elastic parameters (i.e., the Young's modulus, density, and Poisson's ratio) of the upper, middle, and lower crust, as well as those of the upper mantle (Fig. 2a). The density and Poisson's ratio were derived from CRUST1.0 (Laske et al., 2013). The adopted Young's modulus was static and converted from the dynamic elastic modulus using the empirical equation of Brotons et al. (2016), which was calculated based on the P-wave velocities, S-wave velocities, and densities derived from CRUST1.0. The elastic parameters used in the model are listed in Table 2.
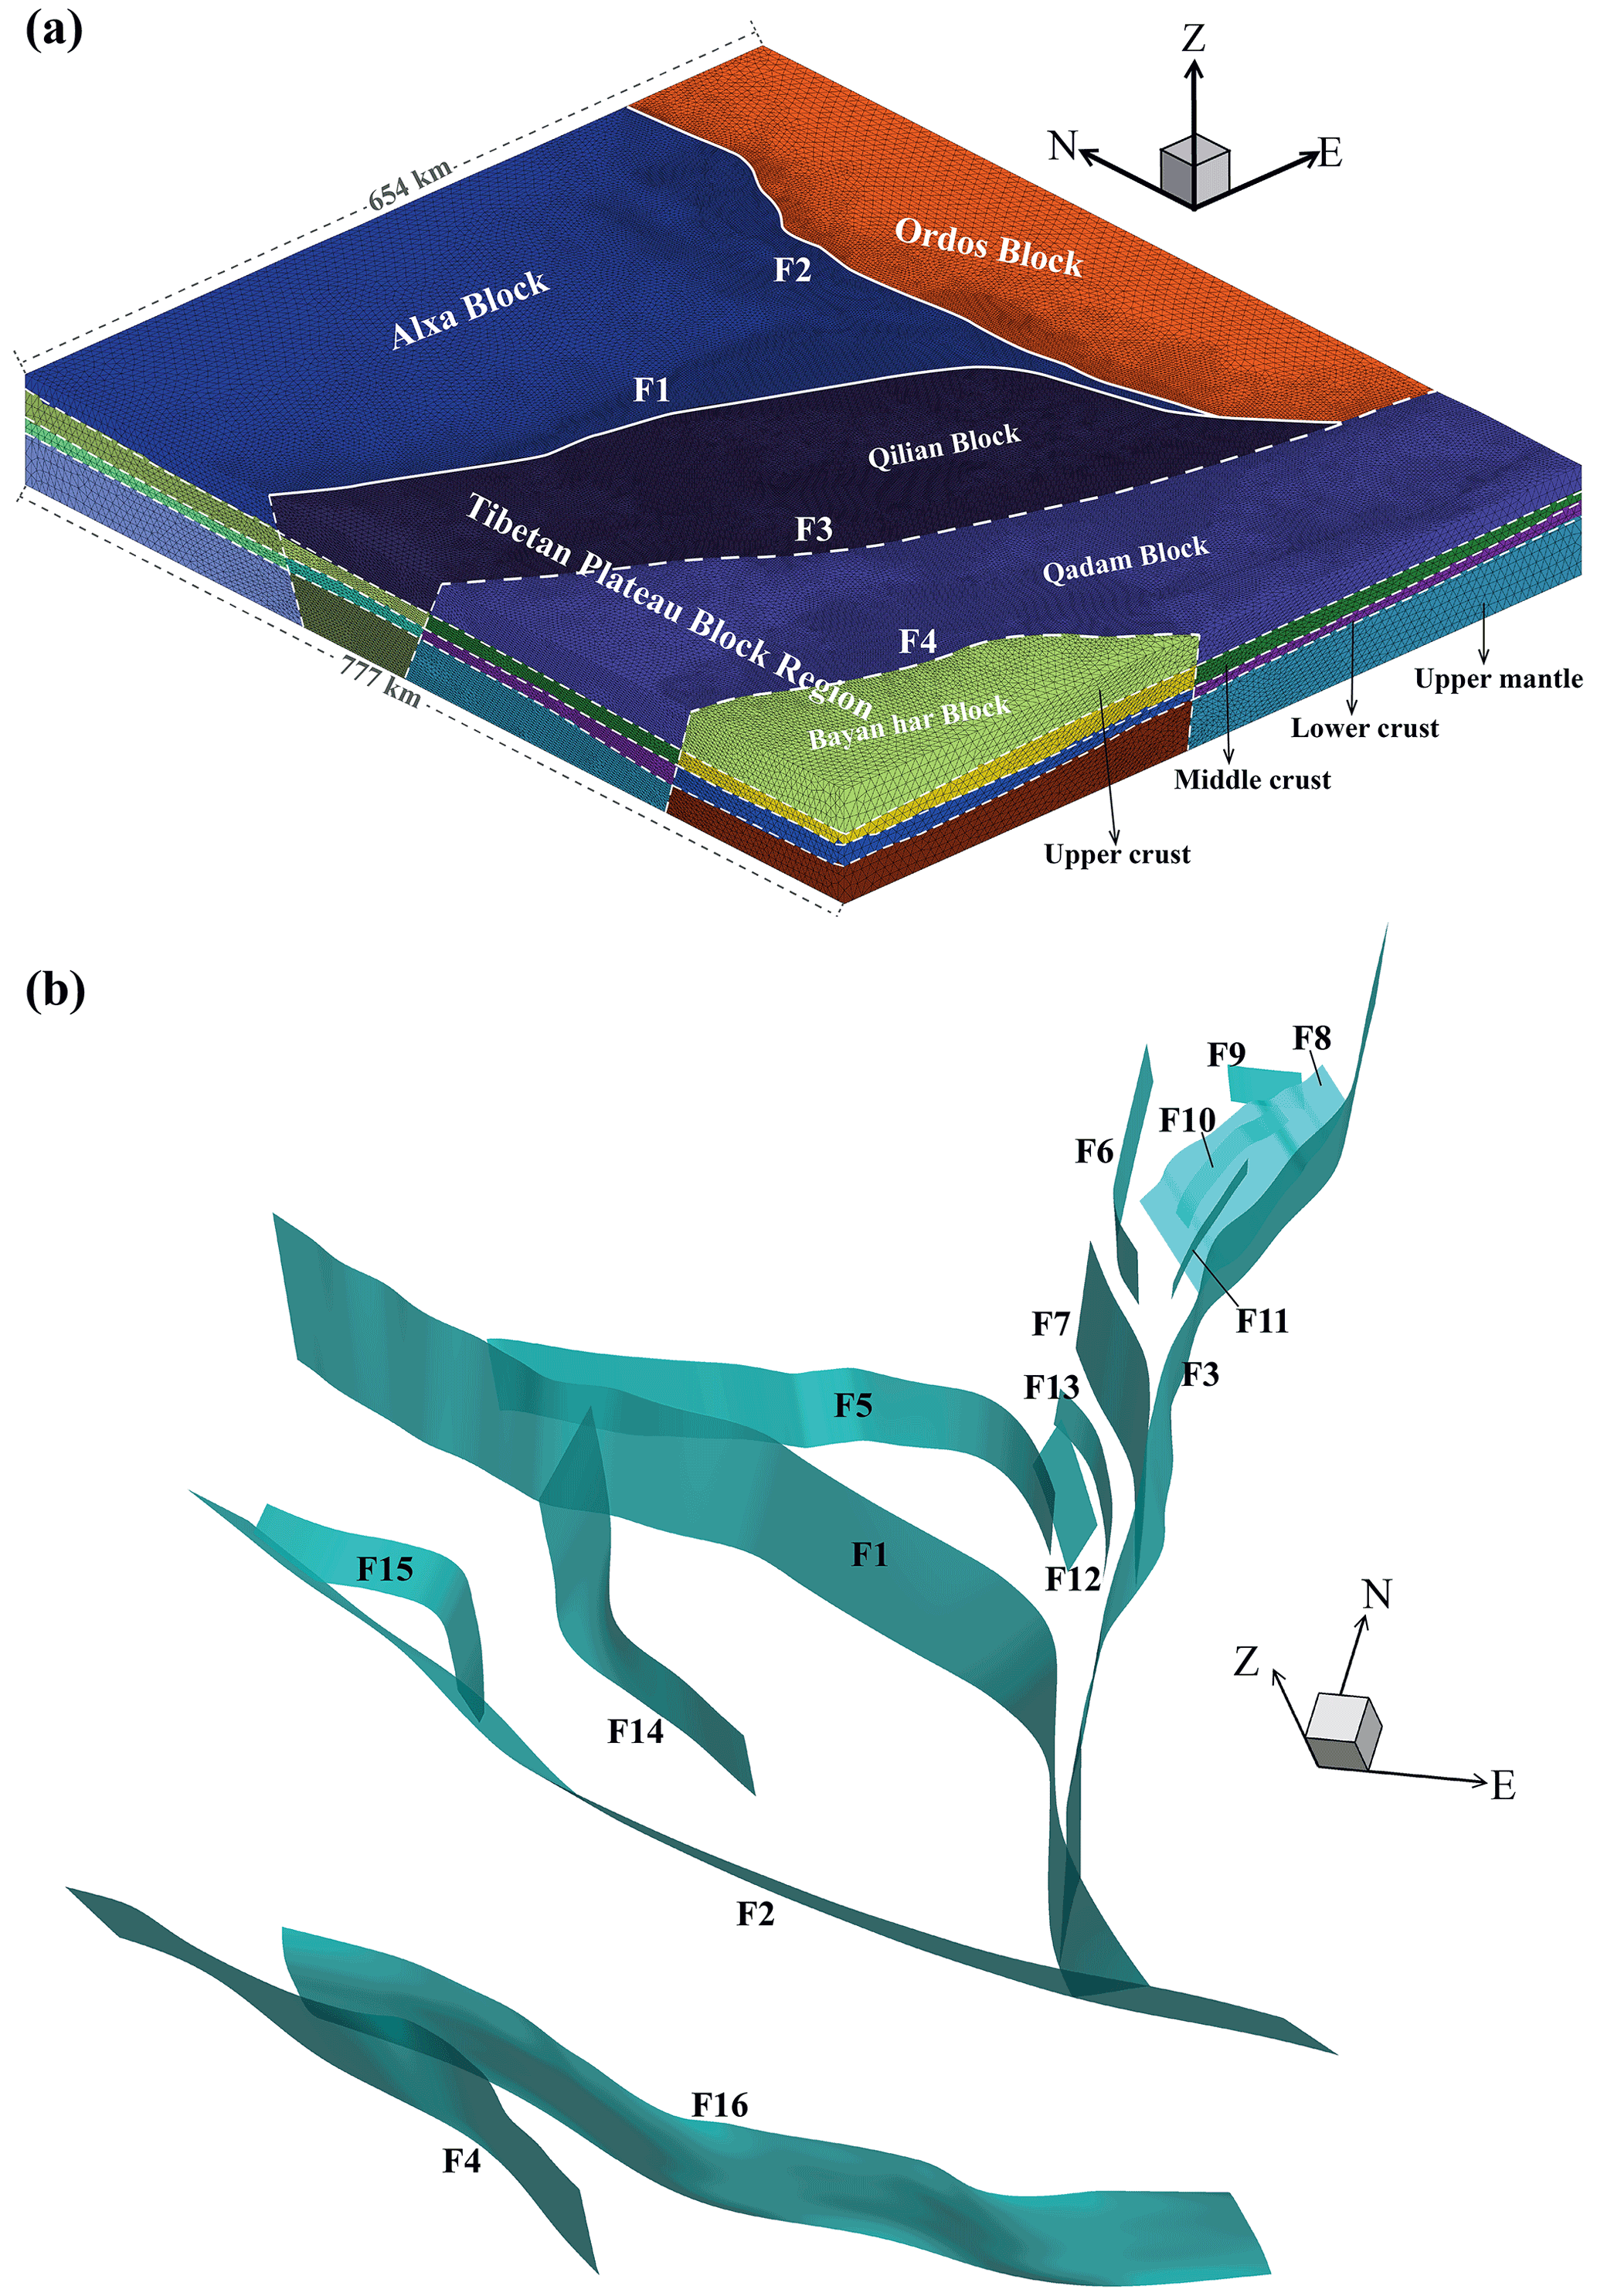
Figure 2Model geometry and fault system. (a) Distribution of the rock types employed in the model. (b) Cyan surfaces indicate the faults implemented in the model as frictional contact surfaces. Fault names can be found in Fig. 1.
Table 1Geometric parameters of faults in the model.
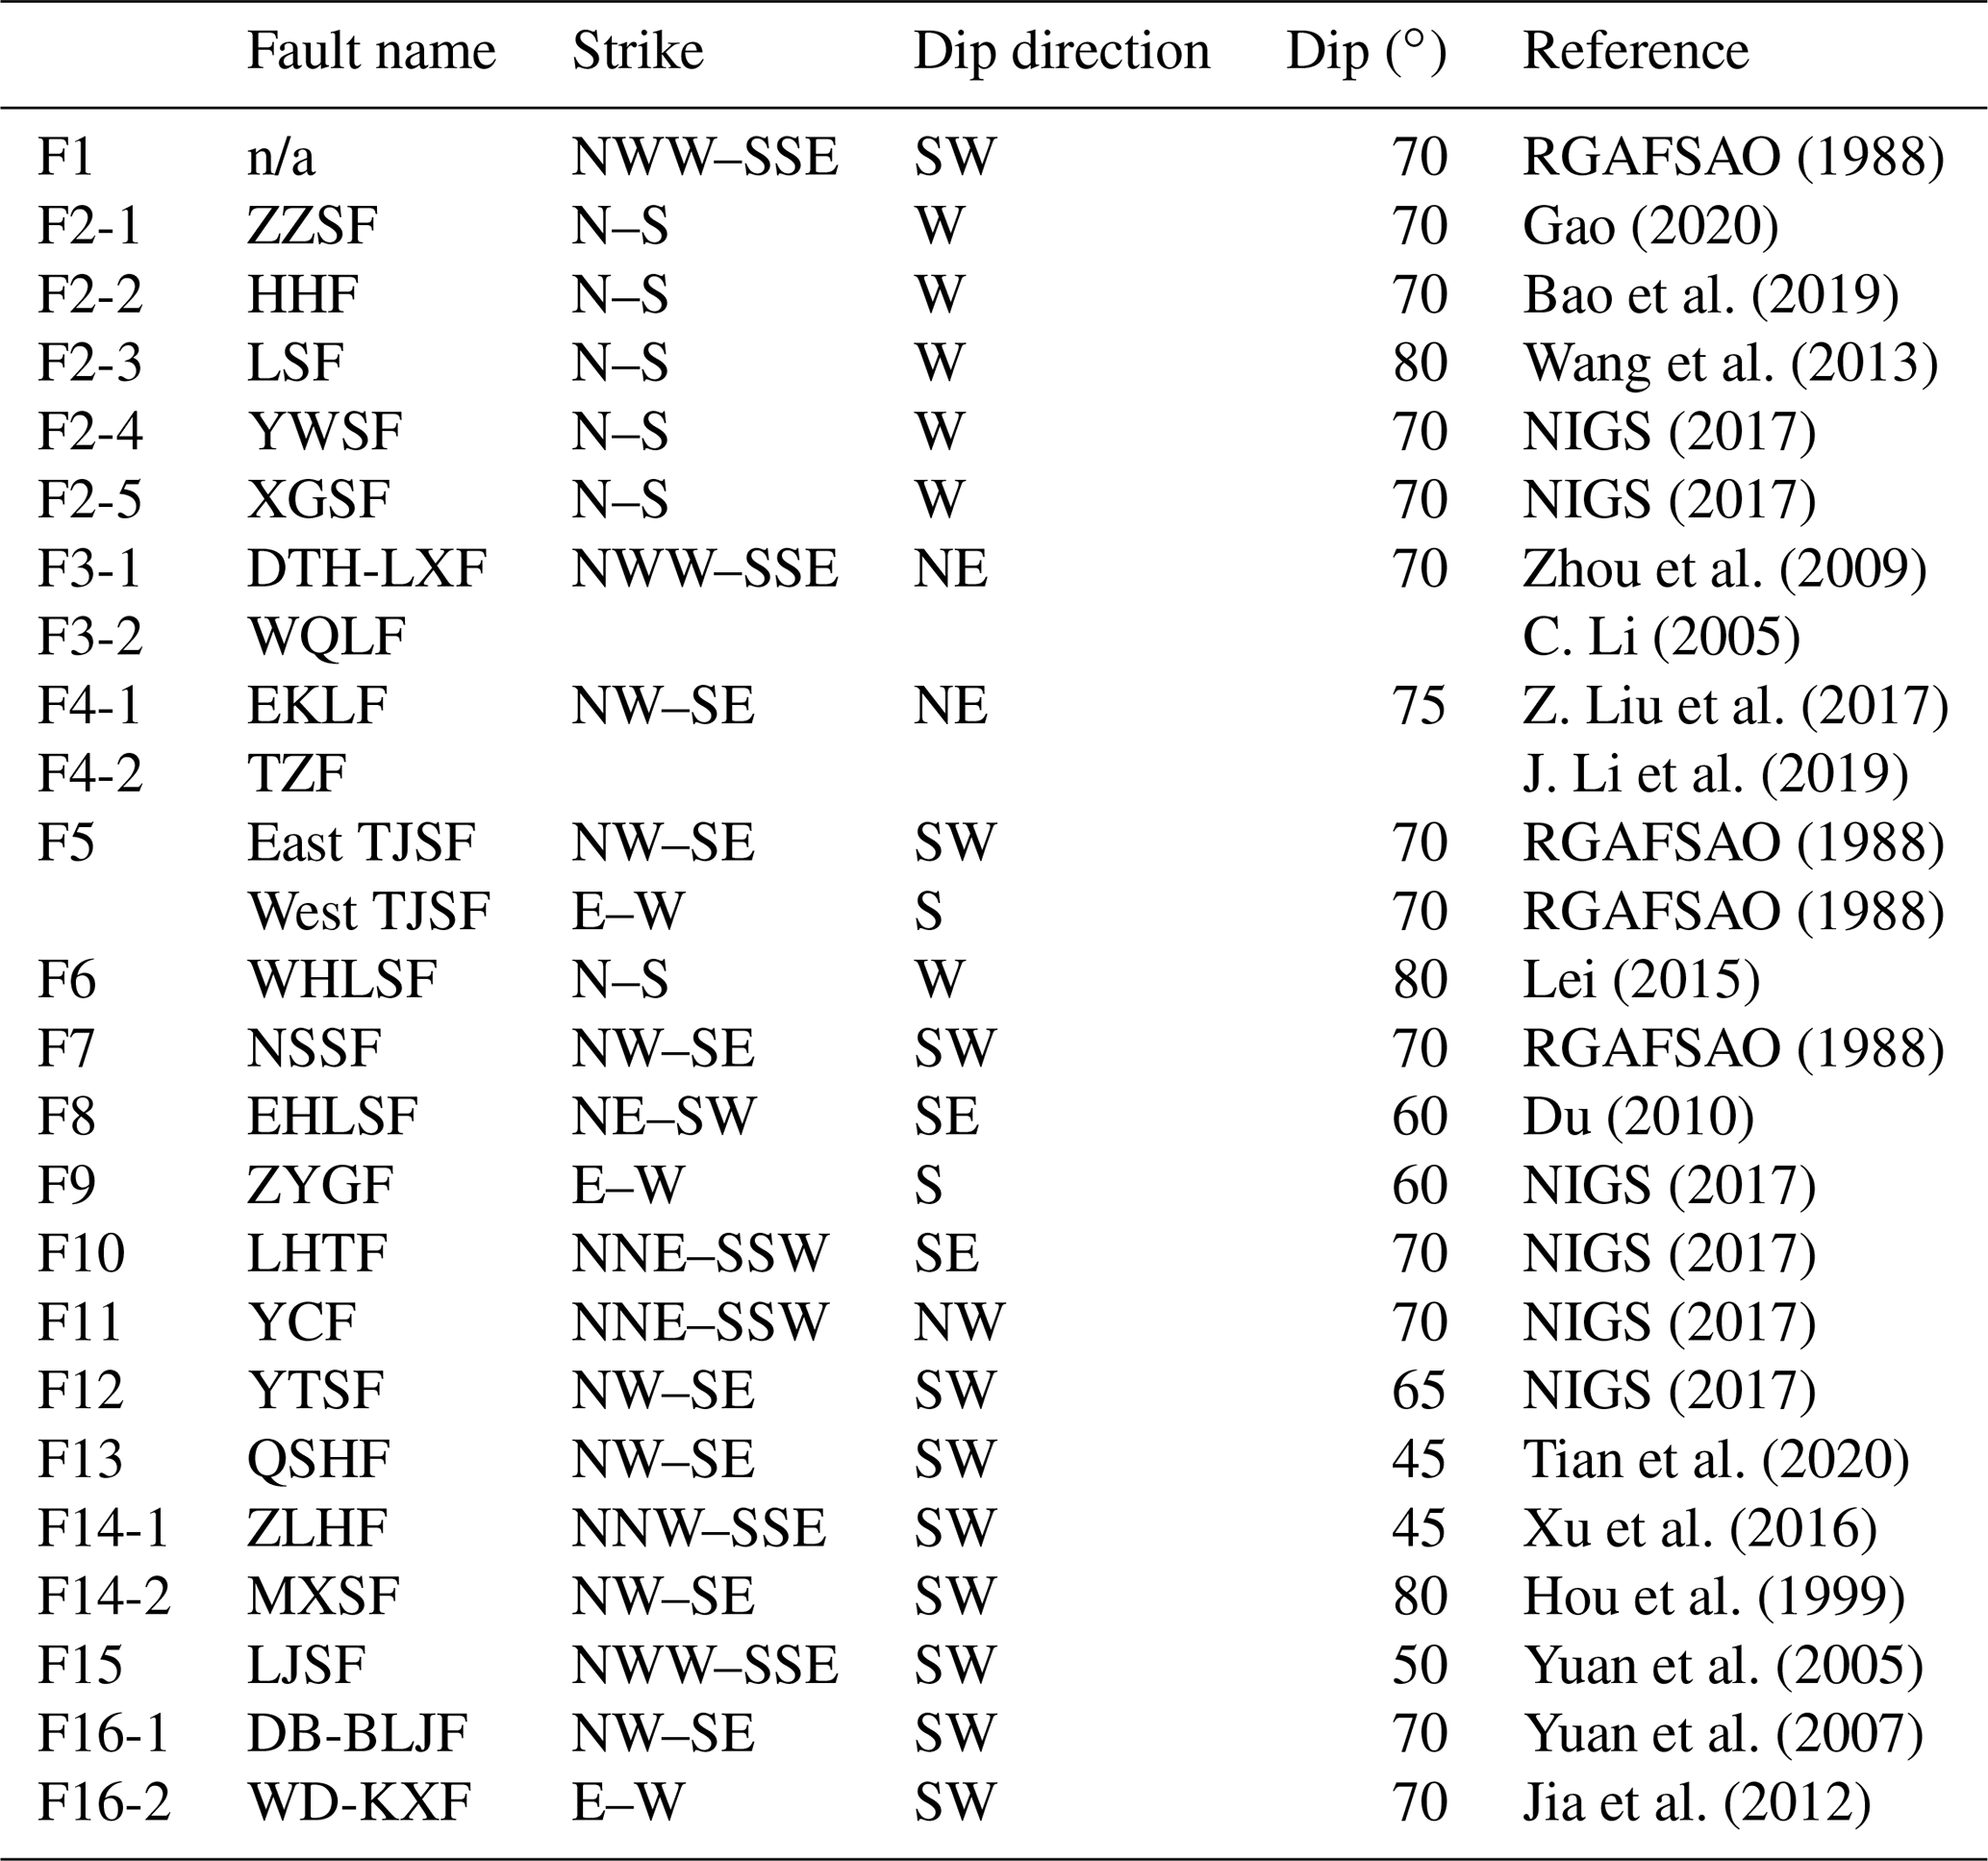
The detailed fault names are defined in Fig. 1.
Table 2Rock properties of the finite-element model.
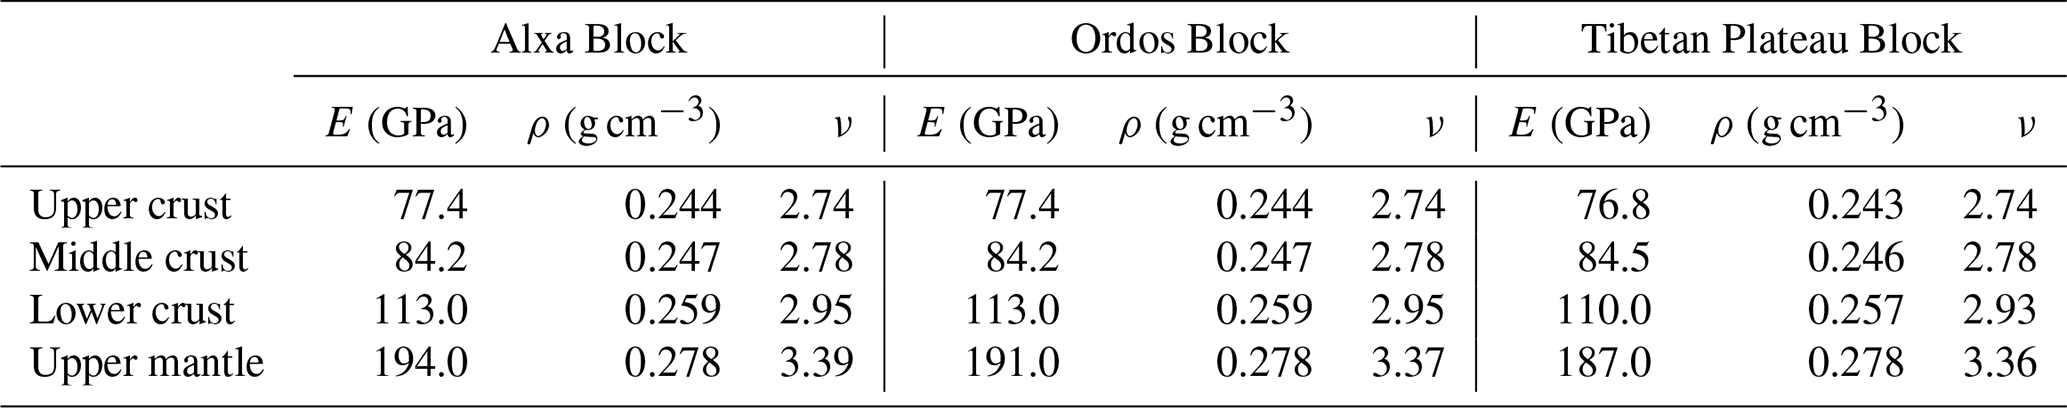
E, ρ, and ν are the Young's modulus, density, and Poison's ratio, respectively.
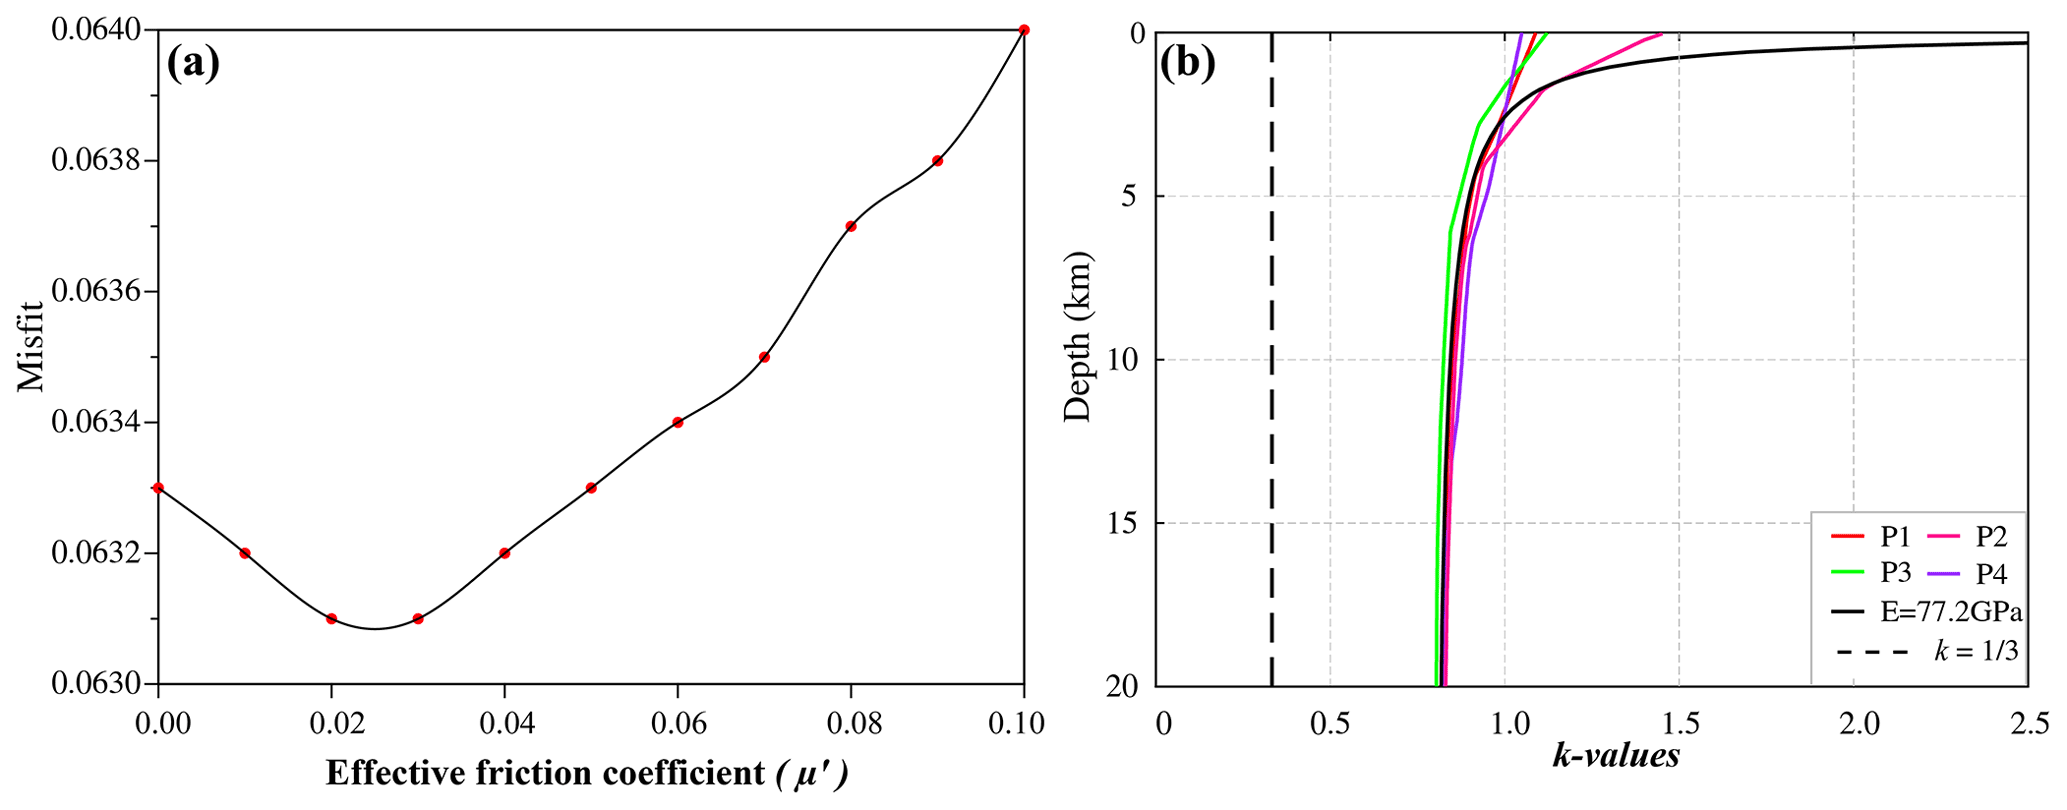
Figure 3(a) Velocity misfit of the crustal velocity between the modeled results and GPS measurements as a function of the effective friction coefficient. The optimal friction coefficient was determined to be 0.02. (b) Depth profiles of the initial k values at four test sites indicated in Fig. 1. The solid black line shows the stress state based on Eq. (3), which was used as a reference stress state. For comparison, the low k value based on the uniaxial strain state is also shown (dashed black line).
2.3 Friction coefficient
In our model, frictional faults obeyed the Mohr–Coulomb friction law:
where σs is the shear stress on the fault surface at time of rupture, C0 is the cohesion, μ is the coefficient of friction, σn is the normal stress on the fault surface, Pf is the pore pressure, and μ′ is the effective coefficient of friction of the fault surface when accounting for the pore pressure. The cohesion C0 of the rocks was assumed to be negligible (Jamison et al., 1980). The friction coefficient of the fault surface is important to the kinematics of a fault, but it is complex and varies in time and space. The exact magnitude of the friction coefficient can be affected by various external factors, including fluid, temperature, stress states, and fault slip rate (Zhu et al., 2009). Therefore, it is challenging to obtain the precise friction coefficient of a fault. However, the results of many studies showed that large faults generally have low effective friction coefficients (Wang, 2021). For instance, the Haiyuan Fault has friction coefficients as low as 0.05 (He et al., 2013), and faults on the eastern margin of the TP have friction coefficients as low as 0.02 (H. Li et al., 2015; X. Li et al., 2021b). Simulations were performed with a series of friction coefficients (0–0.1), and the results were compared with GPS observations (Cianetti et al., 2001). The results showed that setting a friction coefficient of 0.02 for all faults yields the smallest fitting error (Fig. 3a). To minimize the fitting error, localized adjustments were made for the friction coefficients of faults F1 and F3, which are large strike-slip faults. The final friction coefficients of F1, F3, and all other faults were 0.01, 0.1, and 0.02, respectively, with a fitting error of 0.0536.
2.4 Initial stress state
The initial crustal stress affects the state of stress acting on a fault, which further controls the kinematics of the fault via the Mohr–Coulomb friction law. Therefore, the selection of appropriate initial stress is important when studying fault slip rates based on geomechanical models. The initial stress state most commonly employed in previous numerical modeling studies of the NETP is the uniaxial strain reference state (Zhu et al., 2016), which is based on the boundary condition that no elongation occurs in the horizontal direction, and the strain only occurs in the vertical direction. In this stress state, the ratio (k) of mean horizontal stress to vertical stress is only dependent on the Poisson's ratio:
where SH, Sh, and SV are the maximum horizontal, minimum horizontal, and vertical stress, respectively, and v is Poisson's ratio. For the typical v-value of 0.25, Eq. (2) gives , which implies that the vertical stress acting on the rock mass far exceeds the horizontal stress, and the crust is always in a normal faulting or extensional stress regime. However, this assumption contradicts the thrust and strike-slip stress regimes common in the crust. Furthermore, k values obtained globally from in situ measurements greatly exceed one-third, even in extensional tectonic environments (Hergert and Heidbach, 2011).
Based on a spherical shell model, Sheorey (1994) proposed a method for estimating the initial crustal stress, which accounts for the curvature of the Earth, the properties of crustal and mantle materials, temperature fields, and other thermally dependent properties, as shown in Eq. (3):
where E is the Young's modulus (GPa) and z is the depth (m). Because the k values predicted by this method are consistent with those obtained from the Continental Deep Drilling Program (Hergert and Heidbach, 2011), Eq. (3) has been widely used in numerical modeling studies worldwide (Ahlers et al., 2021; Buchmann et al., 2007; Rajabi et al., 2017; Reiter et al., 2014; Hergert and Heidbach, 2011; X. Li et al., 2022). In this study, we used Eq. (3) to calculate the initial stress state for our model. The exact procedure for obtaining the initial stress proposed by Sheorey (1994) has been described previously by Hergert (2009) in detail. Figure 3b shows that the modeled initial stress is in agreement with the theoretical result given by Eq. (3).
2.5 Kinematic boundary conditions
The lateral boundary conditions of our model were constrained by the GPS velocity field data of Wang and Shen (2020) and assumed to be constant along depth (Wang et al., 2008). The top surface of the model was configured as a free boundary, whereas the bottom surface slid freely in the horizontal direction, with a vertical velocity of 0. The detailed boundary conditions are shown in Fig. 4. For the calculation, we used the finite-element software Abaqus™ because of its powerful nonlinear processing capabilities. The model time was set as 500 kyr, as required to generate a proper contemporary state of stress, and deformation was modeled until the accumulated displacements at the boundaries were propagated into the model.
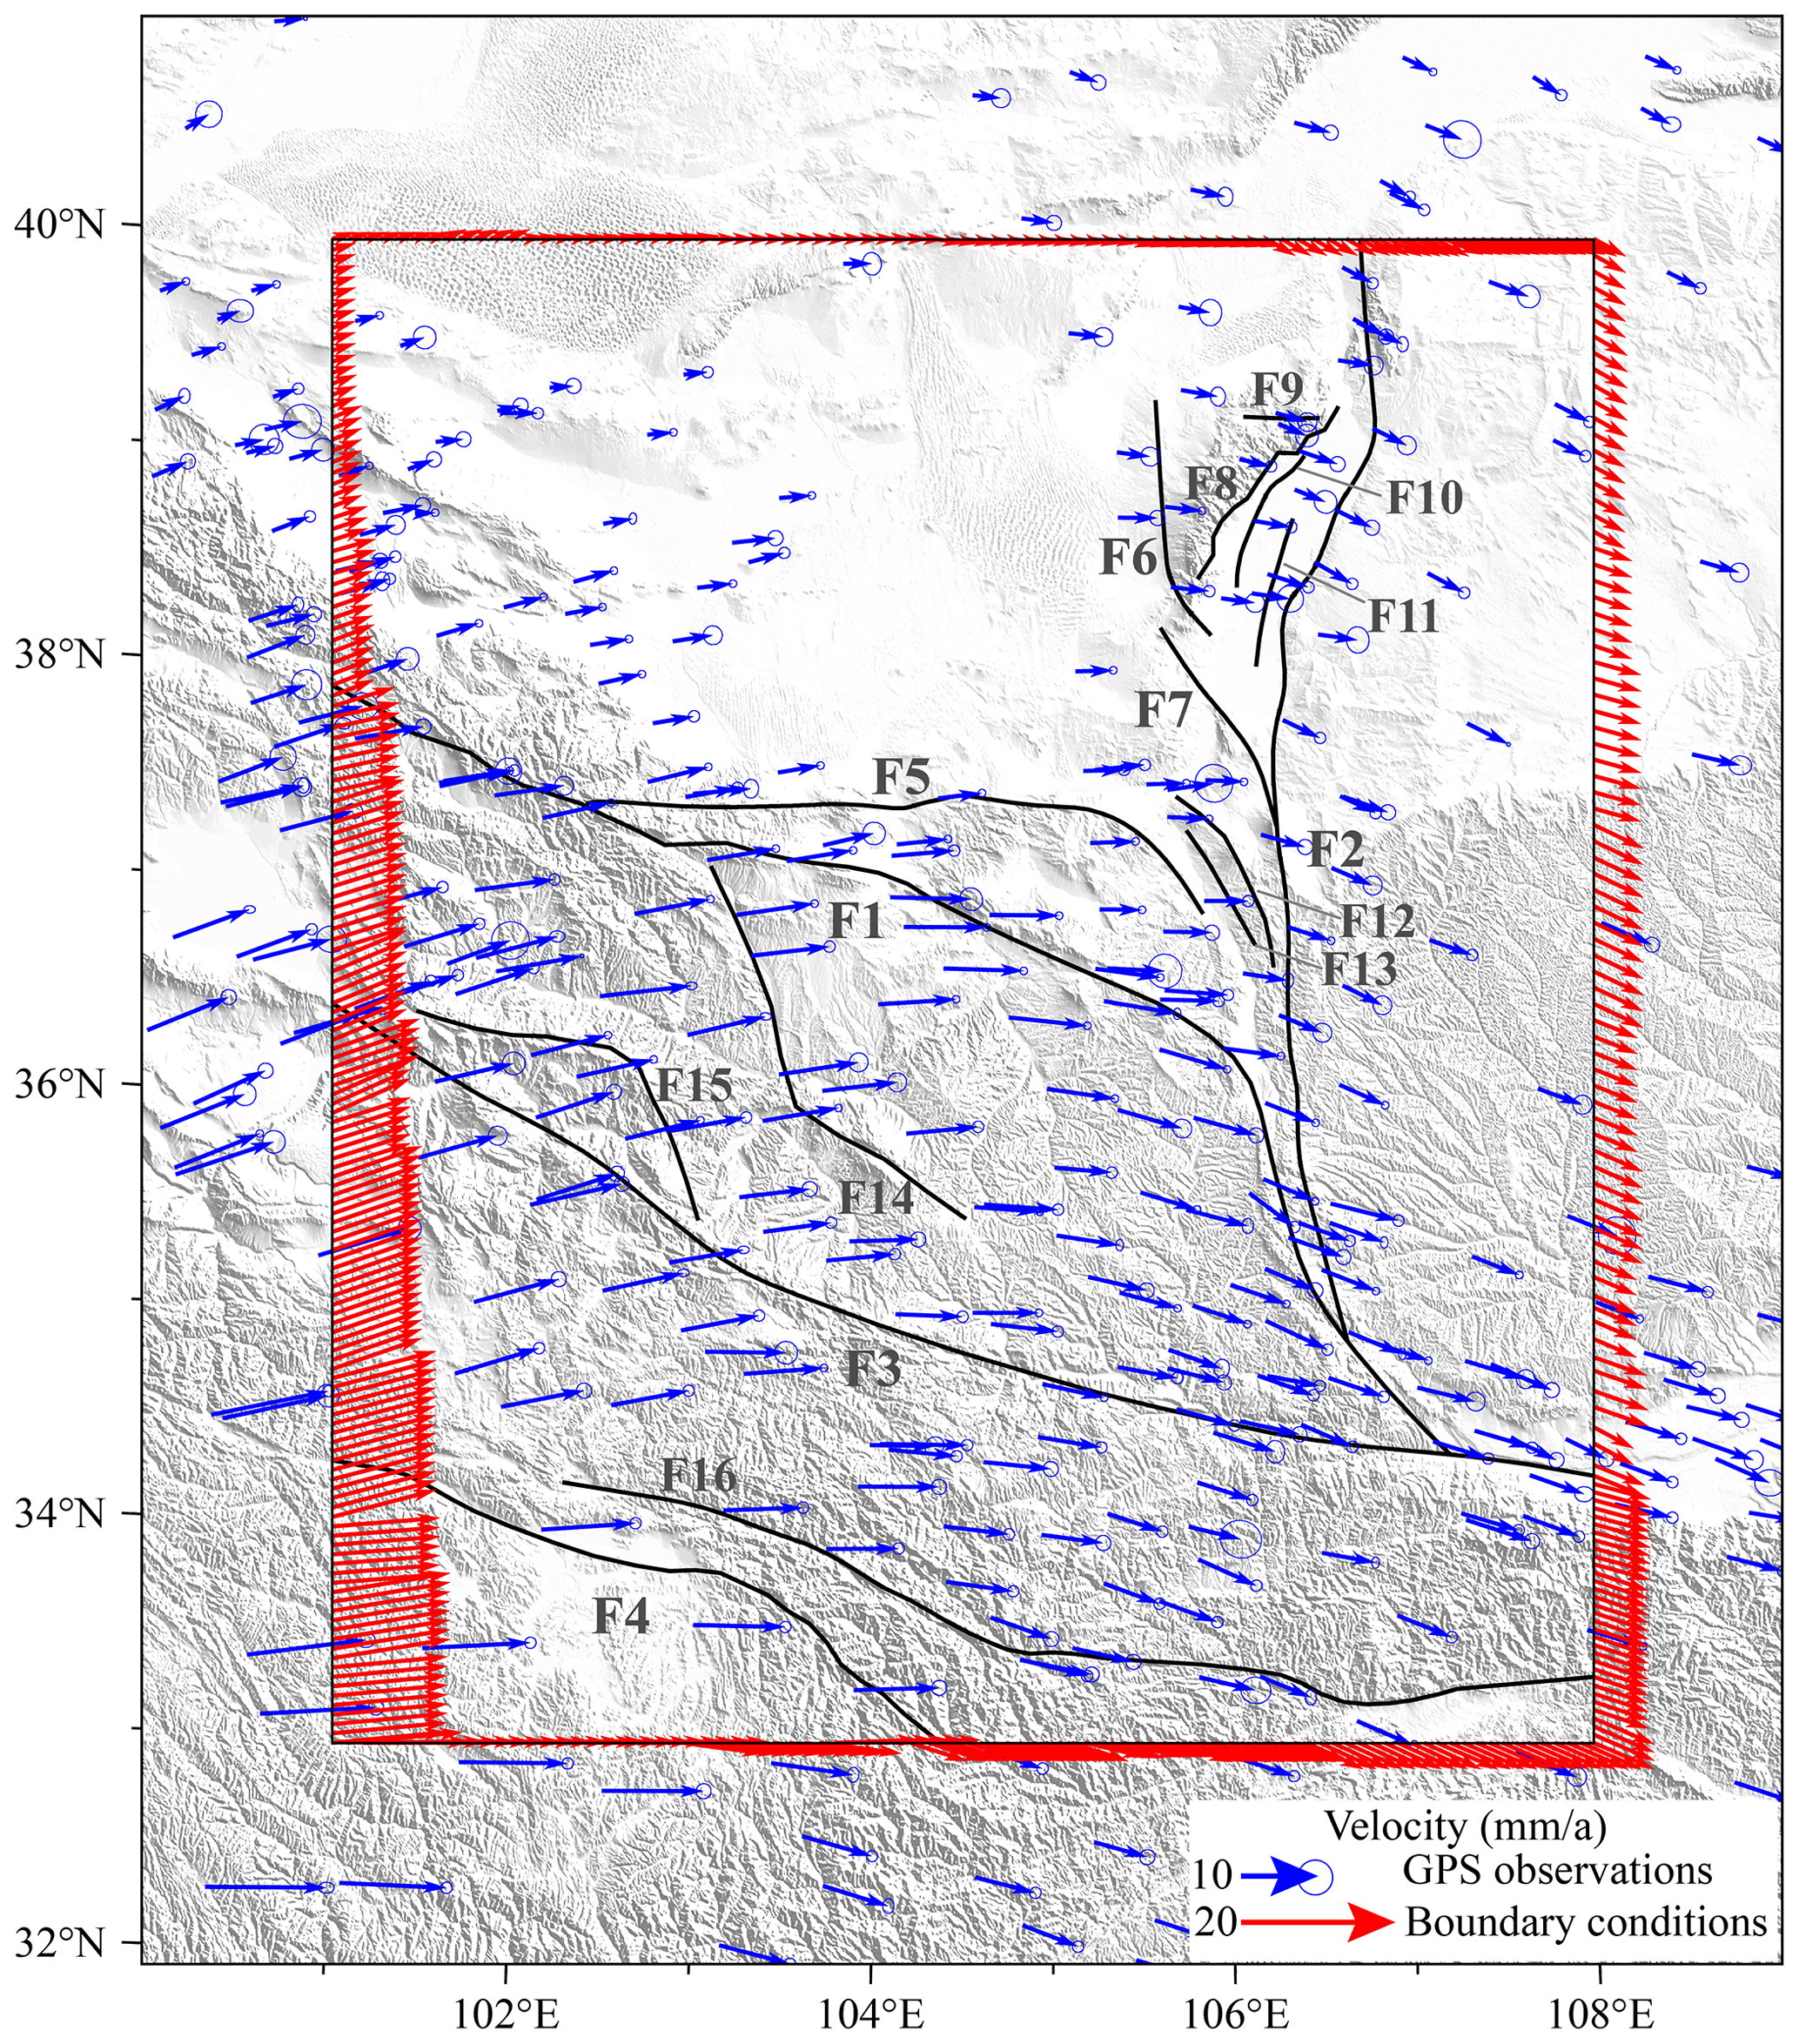
Figure 4Model boundary conditions. The blue arrows represent the GPS observation velocities from Wang and Shen (2020). The red arrows at the boundary represent the boundary velocities calculated by the interpolation of the GPS observations. Fault names can be found in Fig. 1.
3.1 Horizontal crustal velocities
The calculated horizontal crustal velocities in the study area are shown in Fig. 5. The western and central parts of the study area moved in the NE–E and near-E–W directions, respectively and the eastern part gradually changed in motion toward the SW or SE–E directions. Therefore, the study area was characterized by clockwise crustal motions. The model showed that the rates in the southwestern part of the study area were high, whereas they were low in the northeast. The movement rates of the Alxa Block in the north and Ordos Block in the east were as low as ∼ 4–6 mm yr−1. The Bayan Har Block in the south had the highest movement rate at 13–14 mm yr−1. Both the Qaidam Block and the Qilian Block exhibited a higher movement rate in the west than that in the east, decreasing from 12 to 9 mm yr−1 and from 10 to 8 mm yr−1, respectively.
In addition, Fig. 5 also shows that large strike-slip faults accommodate velocity gradients between adjacent blocks. For example, the modeled velocity map can be divided into several parts by the F1, F3, and F4 block boundary faults, across which the movement rates of the crust change remarkably, especially at fault F1. The movement rate on the southern side of the Qilian Block was 9–11 mm yr−1, whereas that on the northern side of the Alxa Block was 4–6 mm yr−1. A different rate of ≥ 3 mm yr−1 between the two blocks was accommodated by F1.
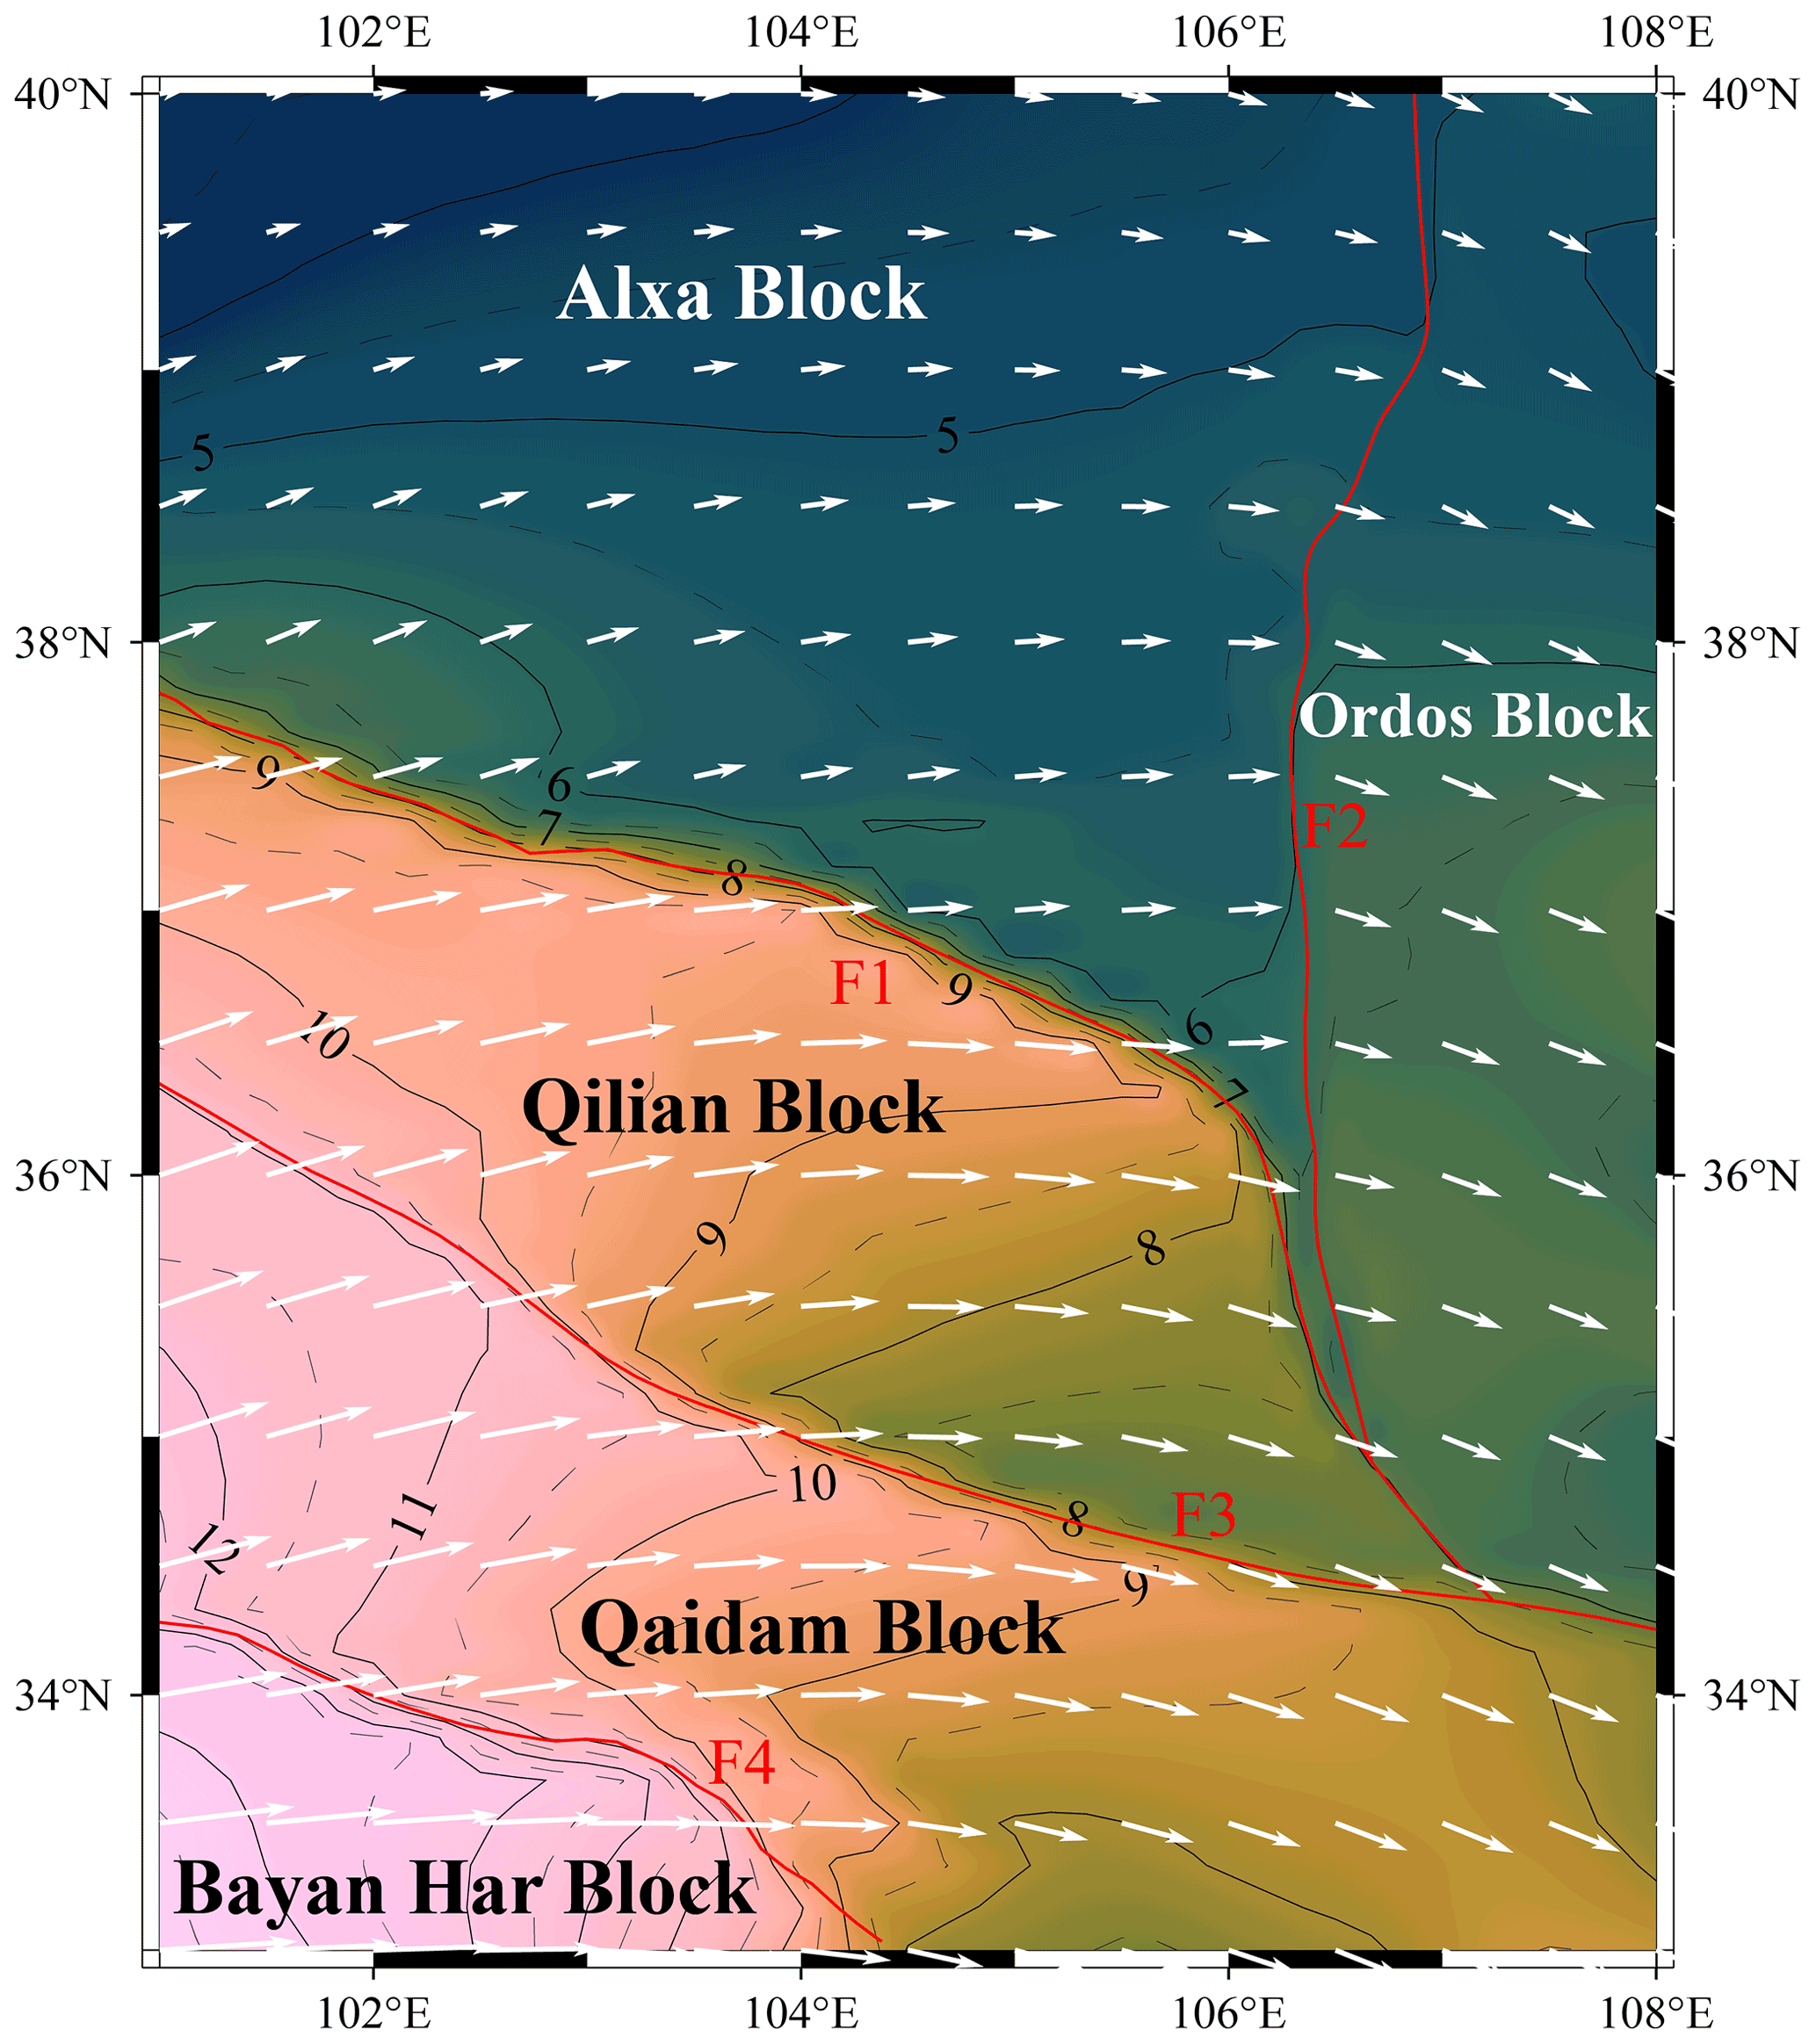
Figure 5Distribution of modeled crustal surface velocities of the NETP with a grid interval of 0.5∘ in both longitude and latitude. White arrows represent the crust movement direction. The background color contours represent the magnitude of the velocity (in mm yr−1). The red lines represent the faults implemented in the model. The names are defined in Fig. 1.
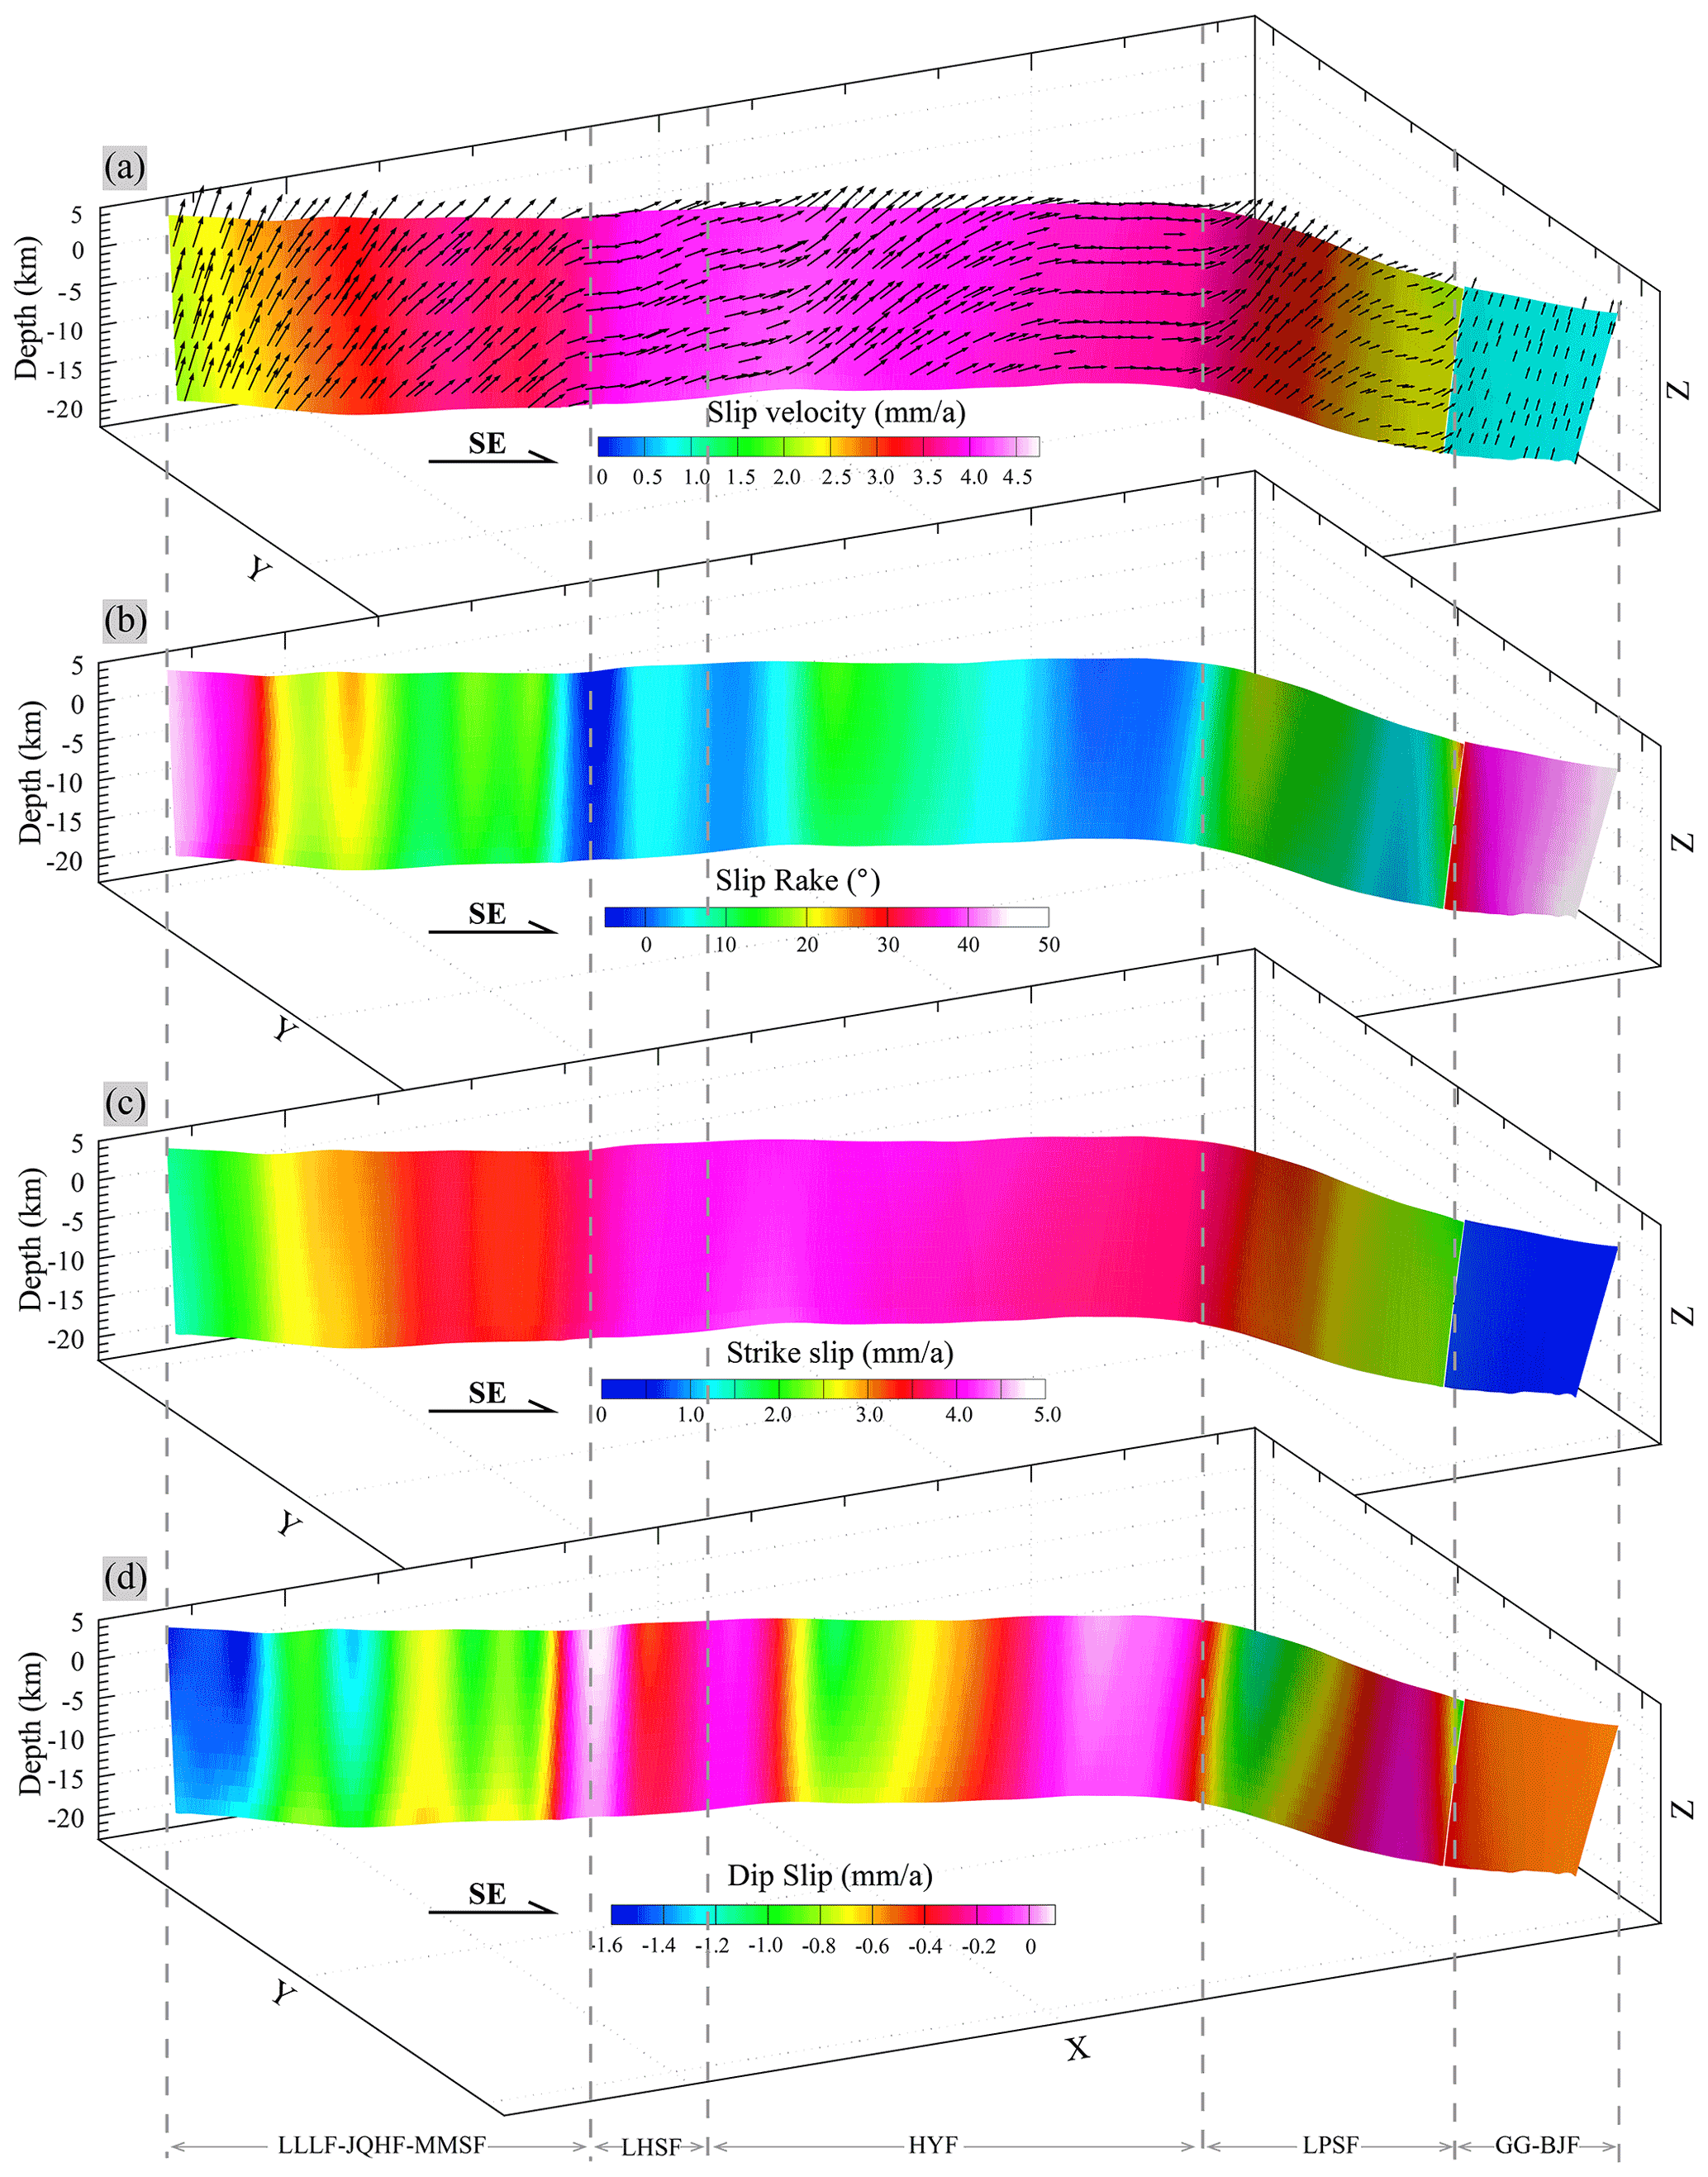
Figure 6Distribution of the modeled fault slip rates on fault F1. View from SW to NE. The ratio of the vertical to horizontal scale is 4:1. (a) Total slip rates with slip directions (black arrows), where parts of the fault have an oblique-slip component. (b) Slip rake, where positive values indicate that the fault movement has a thrust component. (c) Slip rates along strike, where positive values represent sinistral strike-slip. (d) Slip rates along the dip direction, where negative values represent thrust faulting.
3.2 Fault slip rates of the main faults
The dominant depth range of seismic activities in the study area is 5–15 km, with a few events at depths up to 20 km (L. Li et al., 2020; Y. Li et al., 2021). As mentioned in the introduction, seismic activities are closely related to fault activities. To assess the seismic hazard reasonably on the faults in the NETP, we focused on the fault kinematics in the brittle crust and extracted the kinematic characteristics up to a depth of 20 km for the main faults from our 3D geomechanical model. The extracted kinematic characteristics are described below.
3.2.1 Slip rate of F1
From west to east, F1 consists of the Lenglongling, Jinqianghe, Maomaoshan, Laohushan, Haiyuan, Liupanshan, and Guguan–Baoji faults (Fig. 1). Two earthquakes with magnitudes M ≥ 8.0 have occurred along this fault: the 1920 M 8.0 Haiyuan Earthquake and 1927 M 8.0 Gulang Earthquake, which formed 220 and 120 km long surface rupture zones, respectively (Guo et al., 2020; Liu-Zeng et al., 2015; Zhang et al., 1987). The kinematic state of F1 was extracted from the 3D geomechanical model, as shown in Fig. 6. On the western segment of F1 (Lenglongling, Jinqianghe, and Maomaoshan faults), the slip rates increased from 2.0 to 4.0 mm yr−1 from west to east and continued to increase further east (Laohushan Fault and western segment of the Haiyuan Fault), reaching a maximum of 4.5 mm yr−1. The slip rates of F1 decreased in the middle of the Haiyuan Fault. The eastern segment of the Haiyuan Fault had a slip rate of ∼ 3.5 mm yr−1. The slip rate of the Liupanshan Fault decreased in the SE direction, with a minimum of ∼ 2.0 mm yr−1; on the Guguan–Baoji Fault, the slip rate was lower than 1 mm yr−1 (Fig. 6a). The slip rates obtained by our 3D geomechanical model for the Haiyuan Fault were much lower than earlier estimates (8.0–12 mm yr−1; Burchfiel et al., 1991; Lasserre et al., 1999; Zhang et al., 1988) but similar to more recent estimates (3.2–4.5 mm yr−1; Li et al., 2009; Matrau et al., 2019; Y. Li et al., 2017). The disagreements with earlier geological estimates may be related to the timescale and the extent to which faults have been studied (C. Li et al., 2009).
Although F1 is predominantly a left-lateral strike-slip fault, it also has a thrust component (Fig. 6b). The Lenglongling, Jinqianghe, Maomaoshan, middle Haiyuan, and Liupanshan faults displayed rakes ranging from 10 to 20∘, whereas the Guguan–Baoji Fault had a rake varying from 40 to 50∘, indicating that they are oblique thrust faults. The Laohushan and western and eastern Haiyuan faults had rakes below 10∘, showing that left-lateral strike-slip faulting is dominant at these faults. Figure 6c and d show the continuous slip rates of F1 along its strike and dip, respectively. The slip rates along the strike (Fig. 6c) were similar to the total slip rates (Fig. 6a). The Laohushan and Haiyuan faults had the highest slip rates on F1. Conversely, the Lenglongling, Jinqianghe, Maomaoshan, and Liupanshan faults had high dip-slip rates.
3.2.2 Slip rate of F2
The F2 fault consists of the Zhuozishan, Huanghe, Luoshan, and Yunwushan–Xiaoguanshan faults (Fig. 1). Figure 7 shows that right-lateral strike-slip faulting is prevalent across the entire F2 fault. However, the magnitude of the dip-slip component varied from one location to another. The Zhuozishan Fault is an oblique-slip reverse fault with slip rates ranging from 0.8 to 1.6 mm yr−1. The Huanghe Fault had a slip rate of 1.6–2.6 mm yr−1. Its northern segment is an oblique-slip normal fault, whereas its southern segment displayed almost no dip-slip component. The Luoshan and Yunwushan faults had slip rates ranging from 2.6 to 3.0 mm yr−1 and are dominated by right-lateral strike-slip faulting. The Xiaoguanshan Fault is an oblique-slip reverse fault with slip rates ranging from 3.0 (northern end) to 1.4 mm yr−1 (southern end).
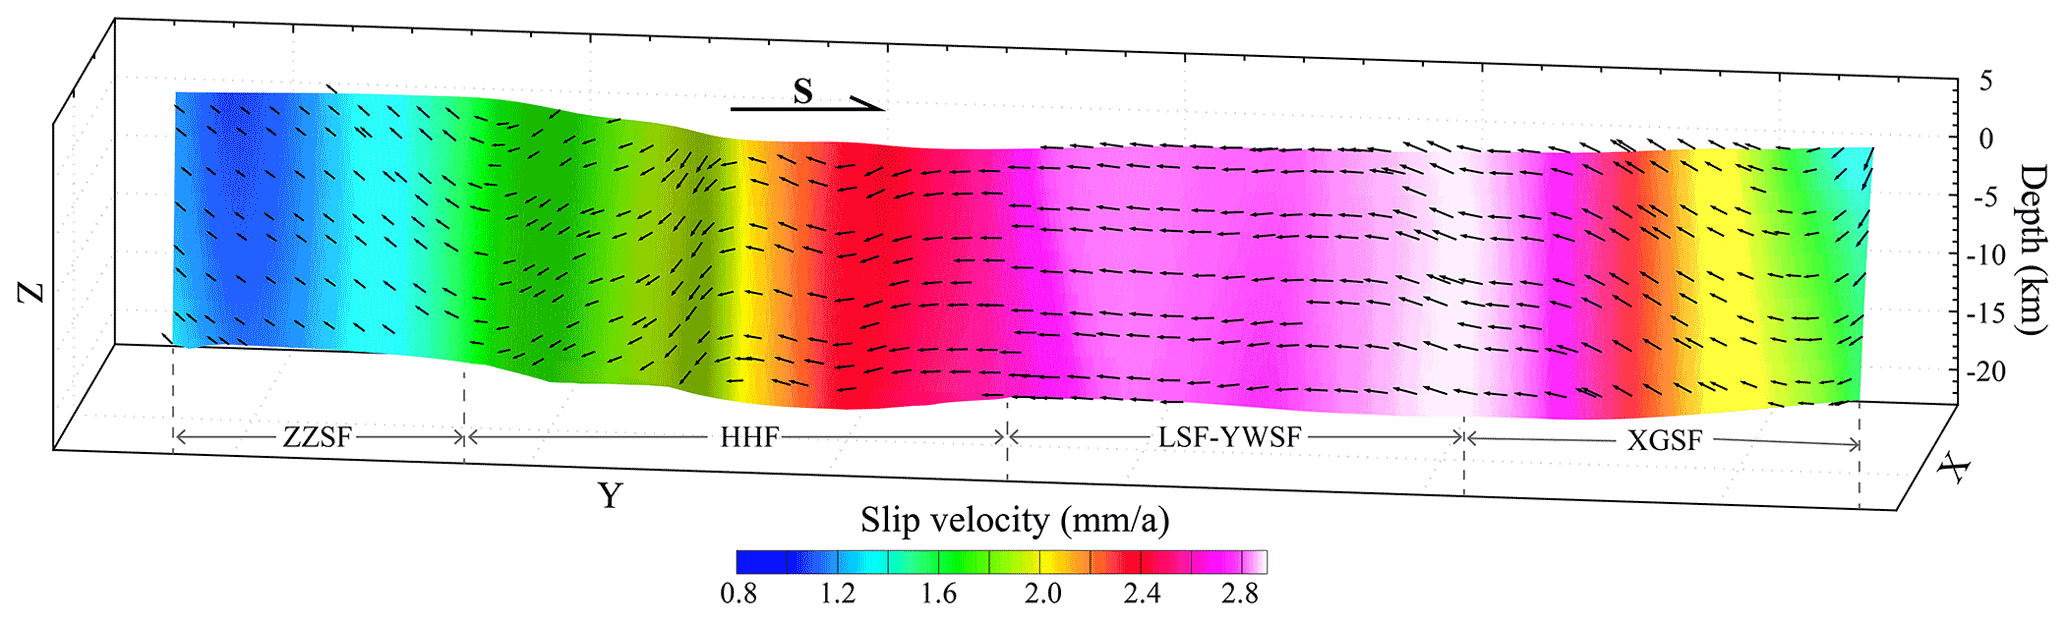
Figure 7Distribution of the modeled fault slip rates on F2. View from west to east. The black arrows represent the slip directions. The ratio of the vertical to horizontal scale is 4:1.
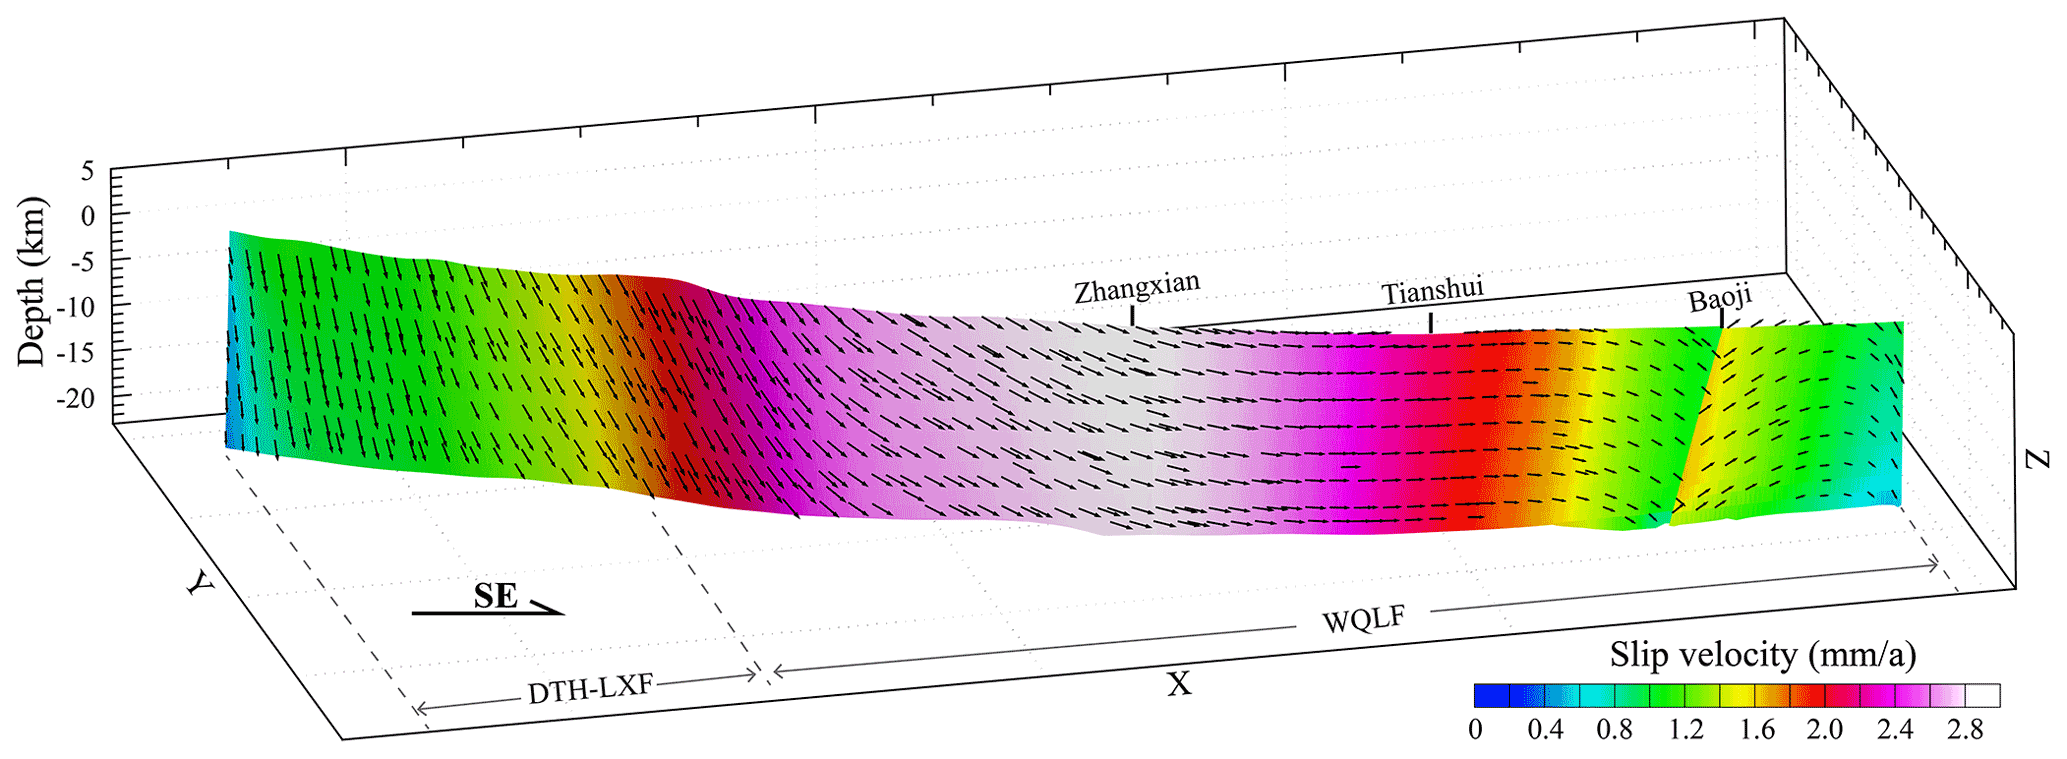
Figure 8Distribution of the modeled fault slip rates on F3. View from SW to NE. The black arrows represent the slip directions. The ratio of the vertical to horizontal scale is 4:1.
3.2.3 Slip rate of F3
F3 includes the Daotanghe–Linxia and West Qinling faults (Fig. 1) and is primarily a left-lateral strike-slip fault, as shown in Fig. 8. The western Daotanghe–Linxia Fault is an oblique-slip reverse fault, with slip rates ranging from 0.8 to 1.8 mm yr−1. The West Qinling Fault had slip rates varying from 1.8 to 2.8 mm yr−1, but each segment of this fault exhibited slightly different kinematics. The West Qinling Fault is an oblique-slip reverse fault west of Zhangxian but is dominated by left-lateral strike-slip faulting in the Zhangxian–Tianshui–Baoji region. The West Qinling Fault becomes an oblique-slip normal fault only near Baoji.
The kinematics of other faults in the study area are not described in this study. Their horizontal velocities are listed in Fig. 9.
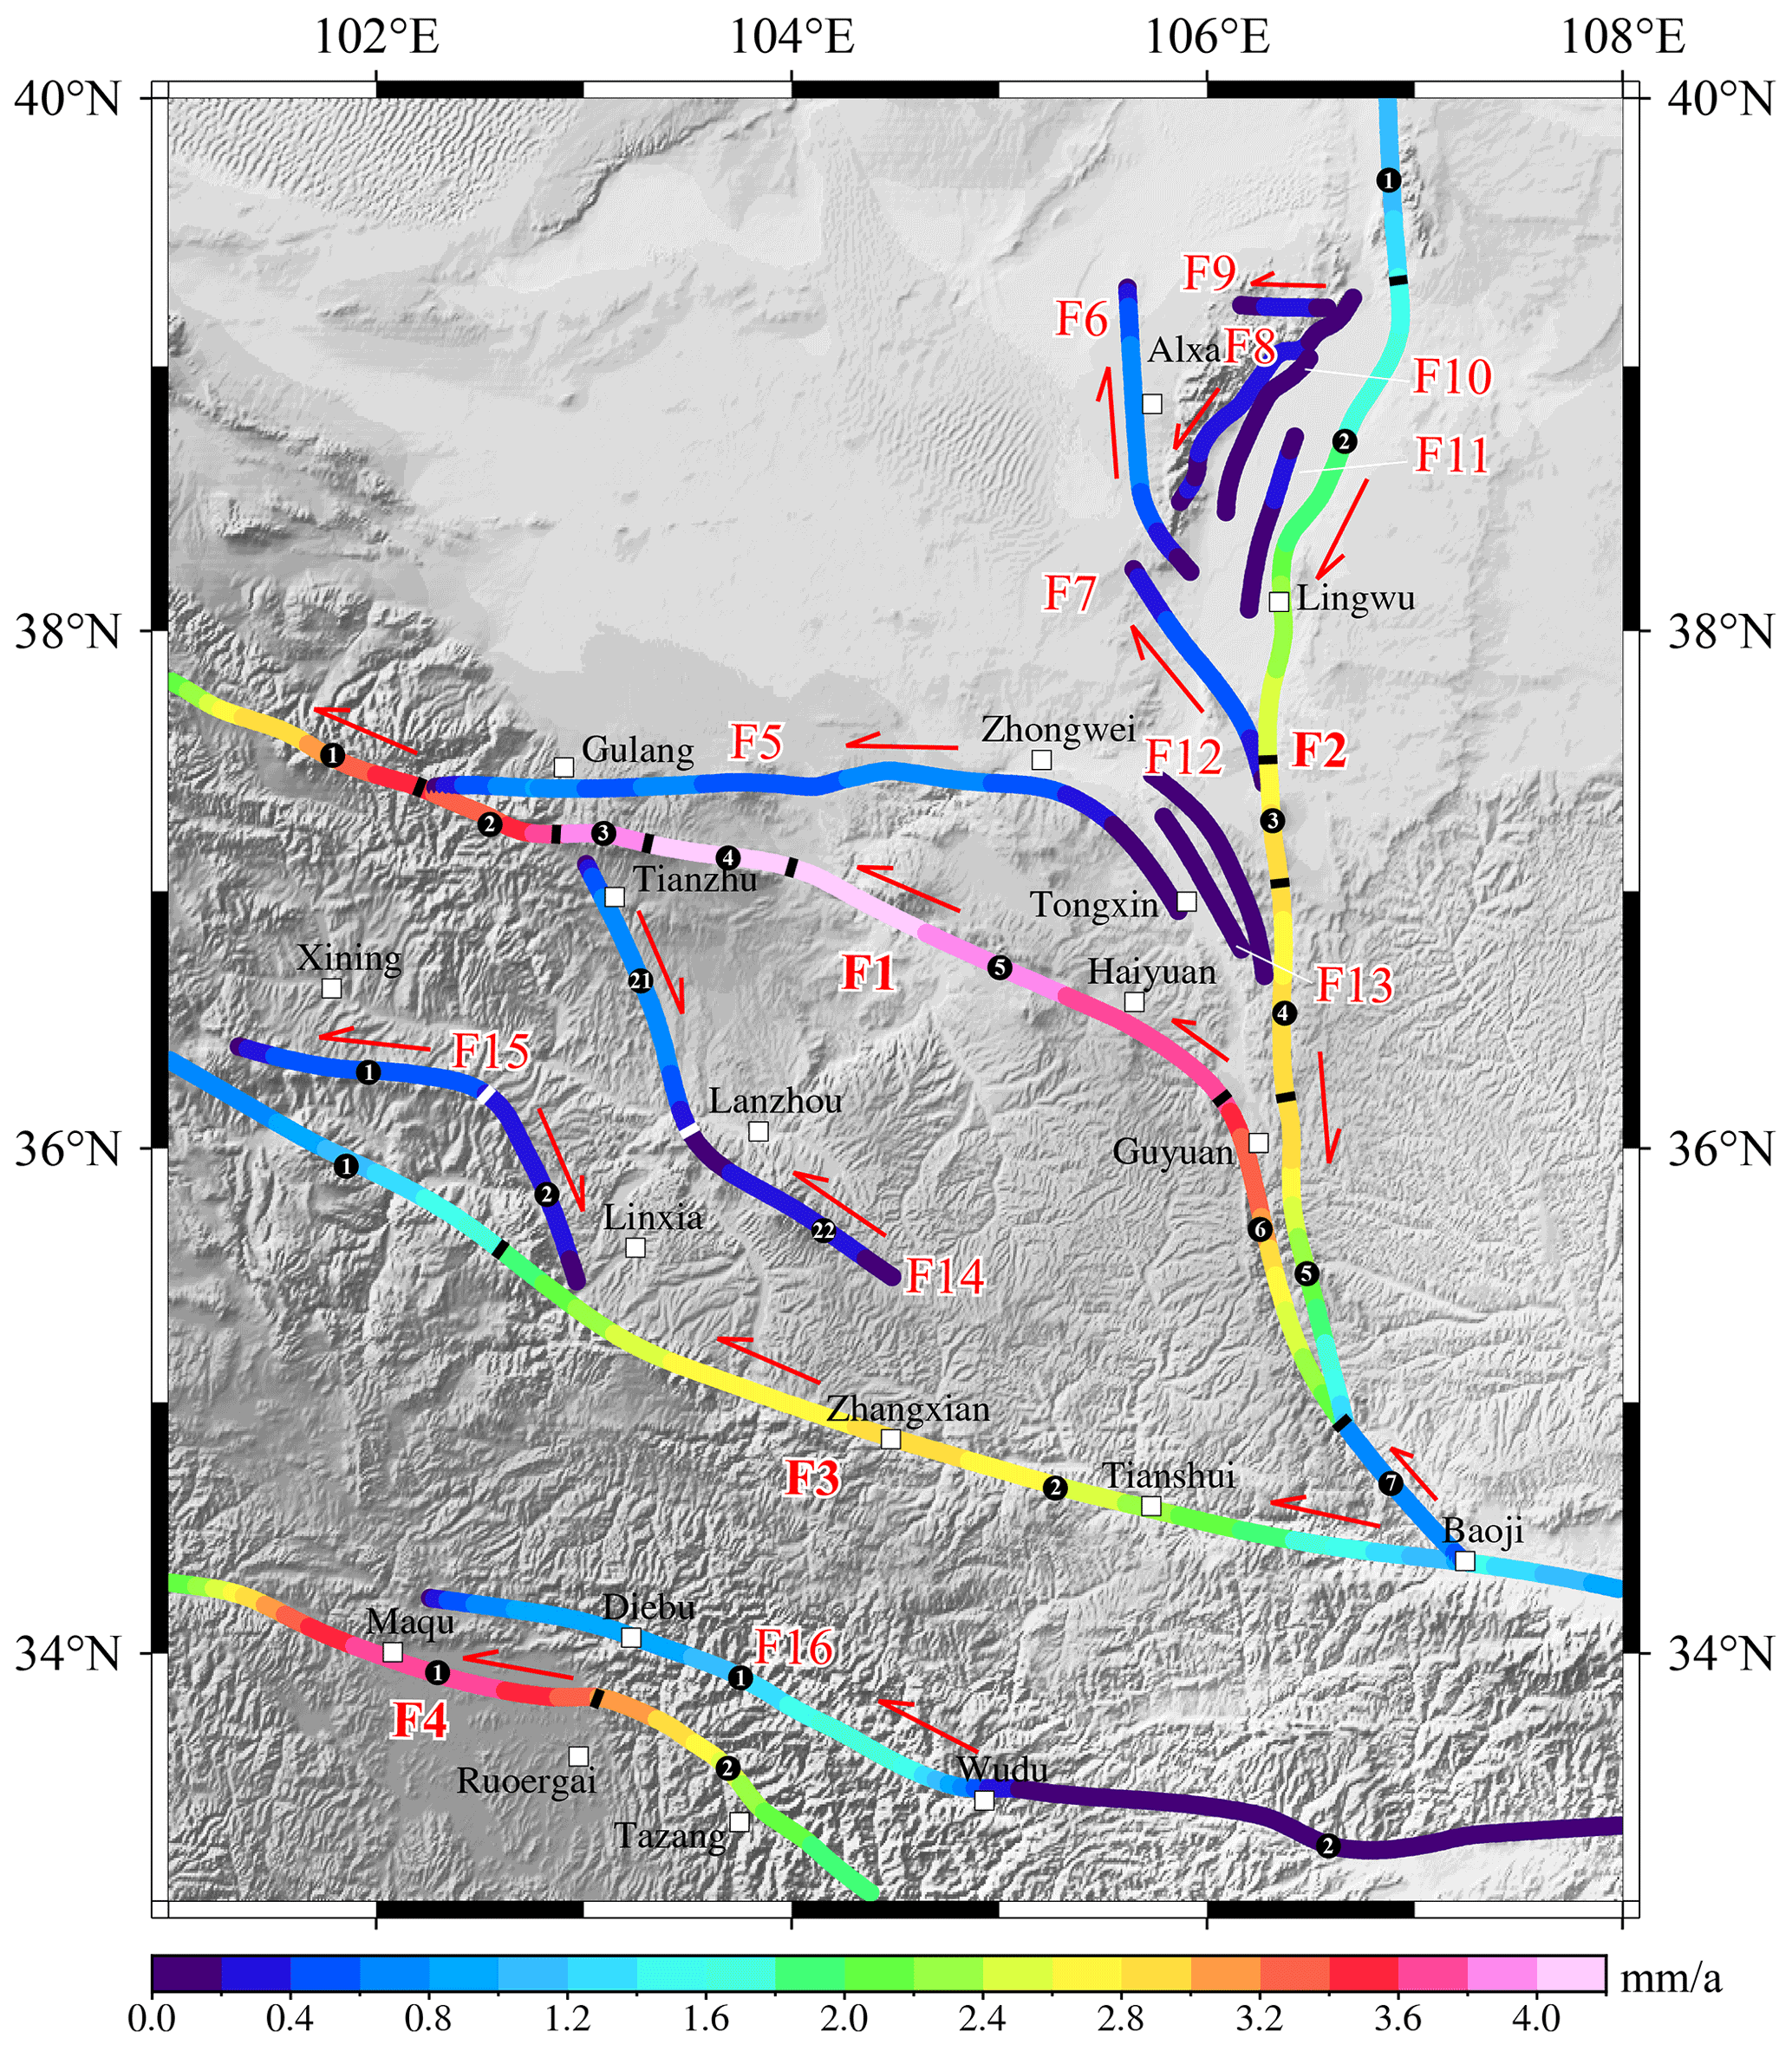
Figure 9Modeled horizontal fault slip rates and senses. The fault names are defined in Fig. 1.
Figure 10(a) Modeled vertical velocity at the surface. Negative values indicate subsidence, whereas positive values represent uplift. (b) Modeled vertical slip rates on faults at the surface. The fault names are defined in Fig. 1.
3.3 Vertical velocities
Figure 10a shows the distribution of vertical velocities in the study area. In our model, surface subsidence was observed only in the Yinchuan Basin west of Huanghe Fault, in the Ordos basin in the east, and in the Sikouzi Basin in the southern Ningxia arc tectonic belt. Most of the subsidence rates ranged between 0 and 0.2 mm yr−1, except in the center of the Yinchuan Basin, which exhibited subsidence rates varying from 0.2 to 0.4 mm yr−1. Based on paleomagnetic studies, the Sikouzi Basin had a subsidence rate of 0.22 mm yr−1 during the Pliocene (Wang et al., 2011), whereas the subsidence rate of the Yinchuan Basin has been 0.32 mm yr−1 since the Middle Pleistocene (Ma et al., 2021). Both values are consistent with those derived from our simulation.
Most other parts of the study area exhibited uplift, albeit at low rates (generally less than 0.2 mm yr−1). Most areas with high uplift rates (0.8–1.0 mm yr−1) were in the Qilian Block, such as the Lenglinglong and Jinqianghe faults, the southern side of the middle Haiyuan Fault, the western side of the Liupanshan segment, and the southern side of the Lajishan Fault (Fig. 10a). High vertical fault slip rates also appeared on the F1 and F3 thrust faults that form the north and south boundaries of the Qilian Block (Fig. 10b). These high vertical fault slip rates were thought to be caused by the compression from the NE expansion of the TP Block and SW subduction of the Alxa Block (Ye et al., 2015). Therefore, outward thrust stacking occurs on the southern and northern boundaries (F1 and F3) of the Qilian Block.
4.1 Comparison with previous results
The boundary conditions of our model were derived from the GPS data of Wang and Shen (2020). Figure 11 shows a comparison of the results of our model with the GPS data. The modeled velocity field is consistent in both direction and magnitude with the GPS-derived velocity field. To further examine the fit between the model results and GPS data, we selected a NE–SW profile that crosses through the study area (Fig. 11, C–C′) and projected all GPS-observed values within 50 km of both sides of the profile. Figure 12 shows that the modeled and observed values on either end of the profile (i.e., locations close to the model's boundaries) are almost identical. Although there were differences between the modeled and GPS-observed values, the differences were within the margin of error for the GPS data. Therefore, based on comparisons between the modeled and GPS-observed values in the map and profile, our modeled kinematics agree well with the GPS data.
Table 3 is a comparison of the modeled slip rates and model-independent geological slip rates compiled from previous studies. From the comparison, our modeled results were consistent with the slip rates obtained by geologic approaches. For example, the modeled horizontal slip rates on F1 (e.g., the Laohushan, Haiyuan, and Liupanshan faults) were similar to the geological slip rates obtained by previous pointwise measurements (Table 3). The modeled slip rates on the F2-3 Luoshan Fault (2.6–3.0 mm yr−1) agreed with the geological slip rate (2.2 mm yr−1). A good agreement between these two kinds of slip rates also existed on the West Qinling Fault in the Zhangxian and Tianshui regions (Table 3).
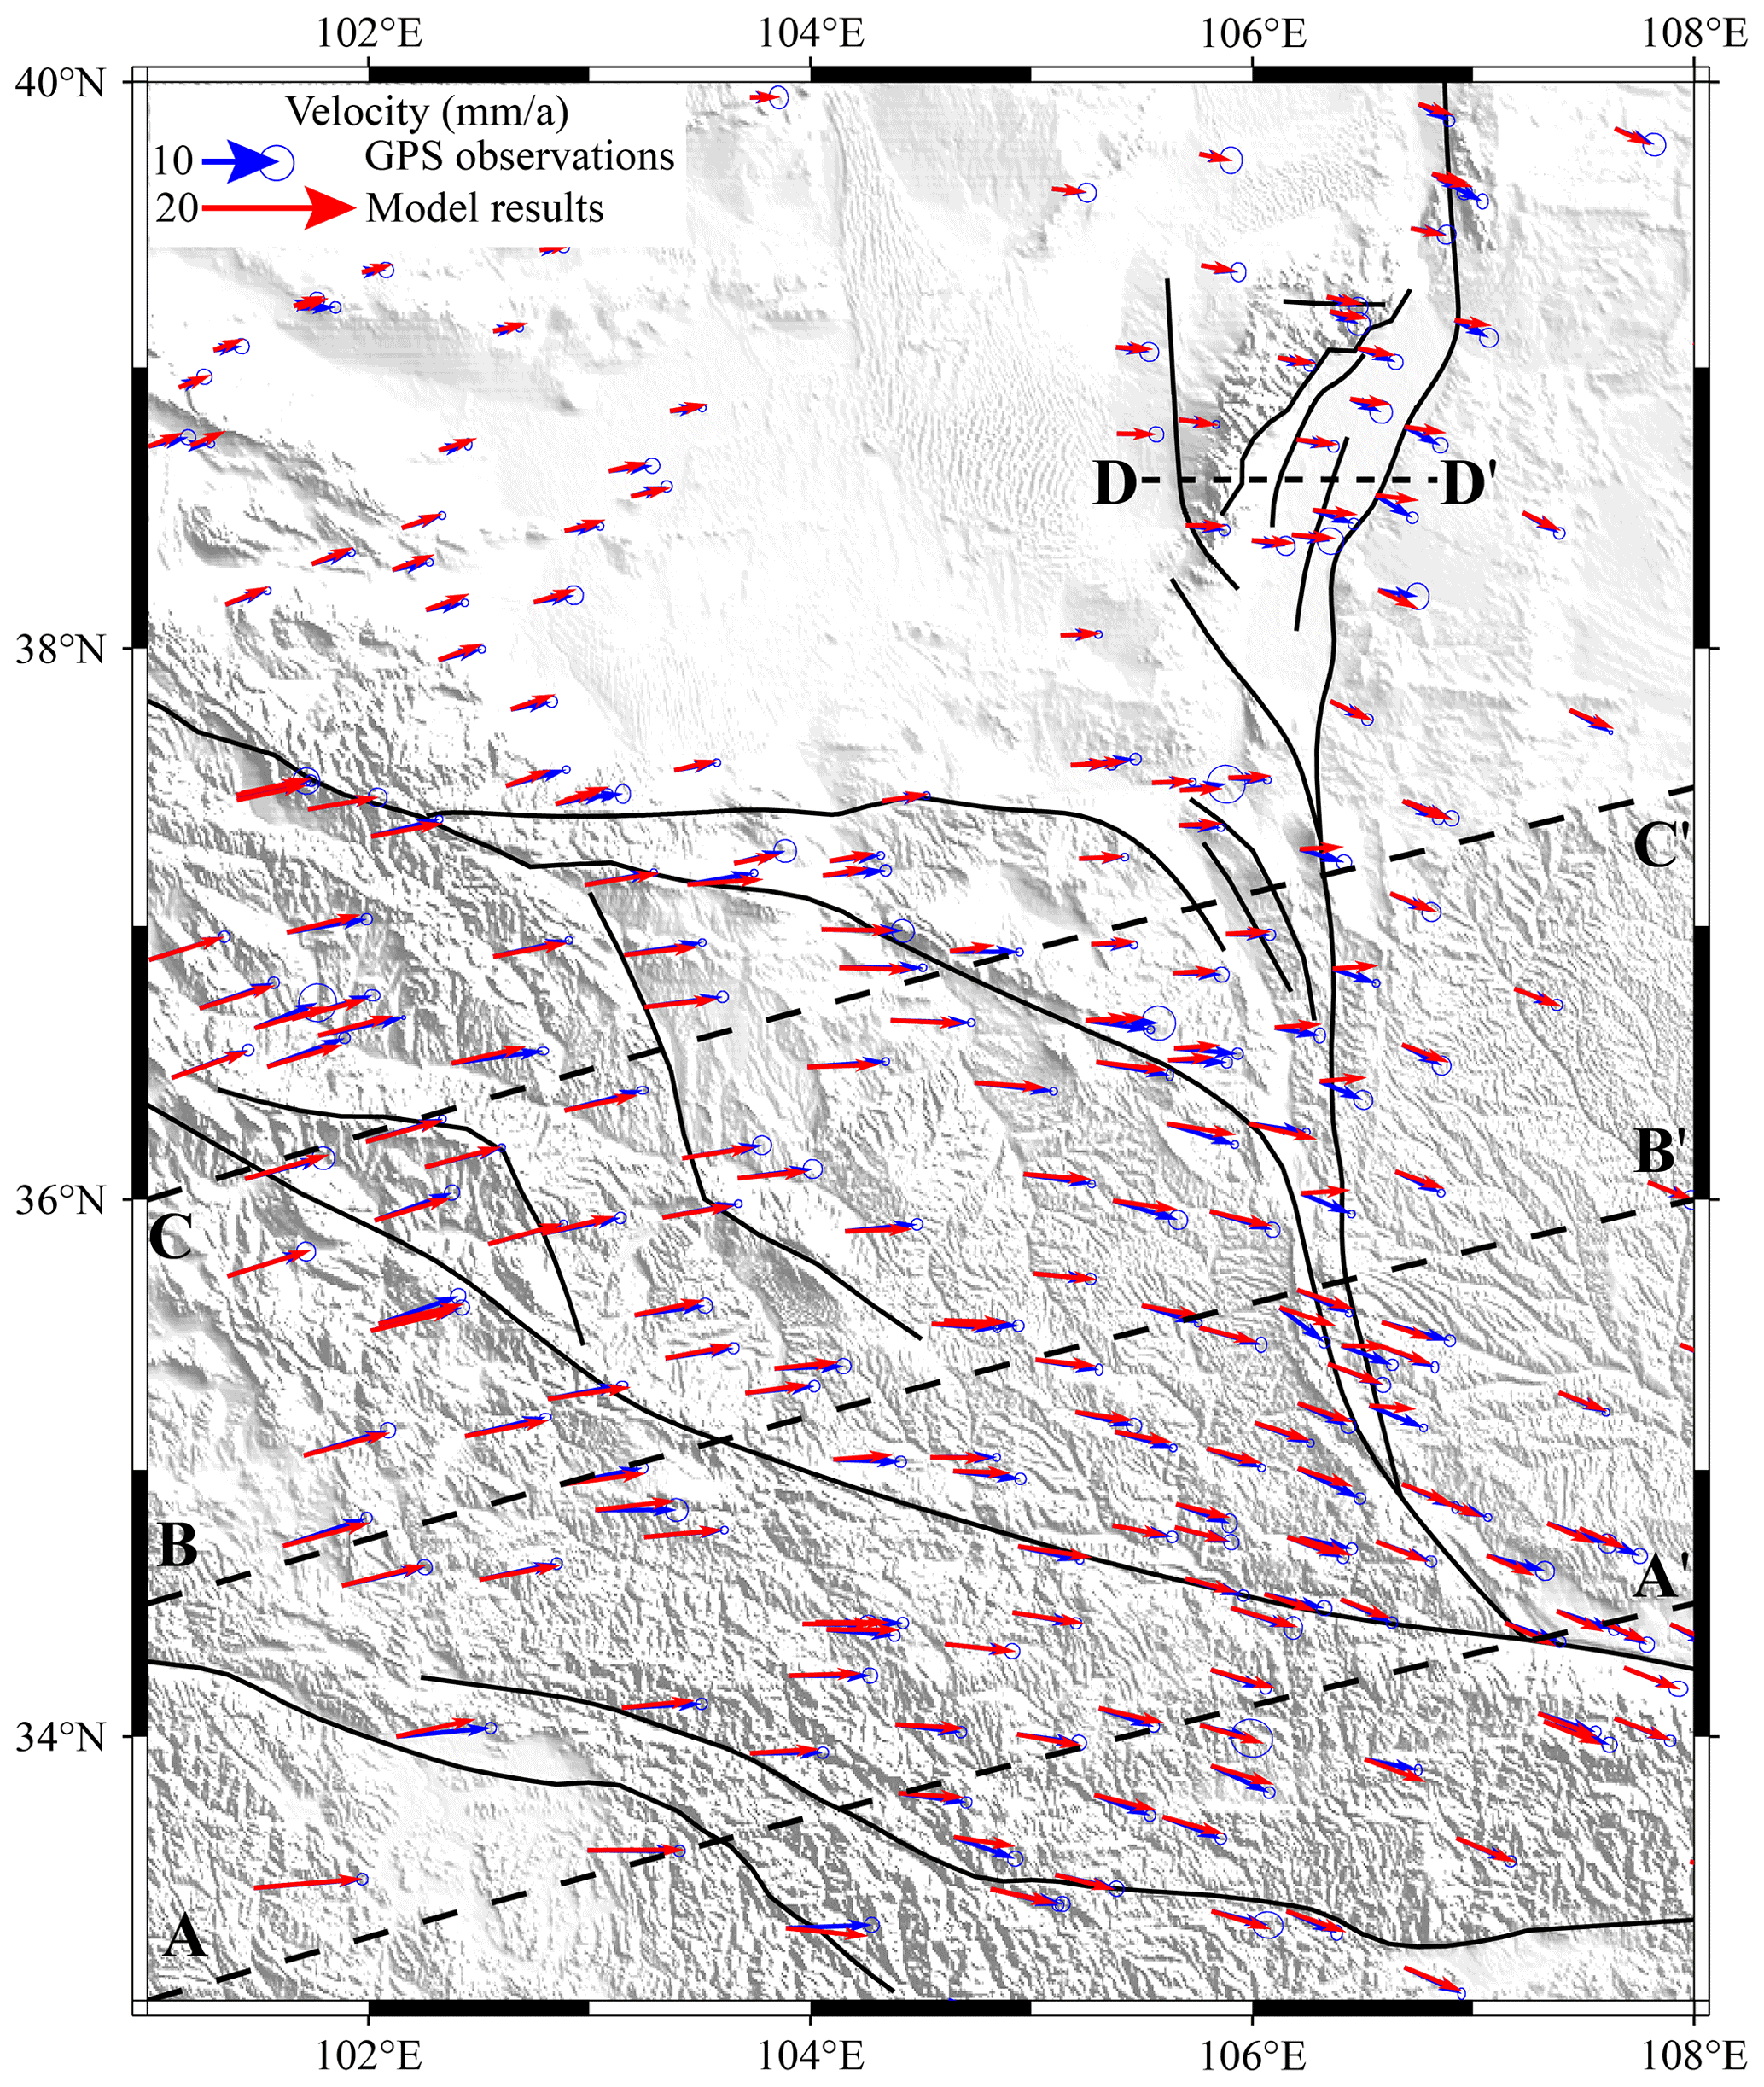
Figure 11Comparison of the modeled horizontal velocities and GPS velocities. The red arrows represent the modeled results, and the blue arrows are the GPS measurements (Wang and Shen, 2020). The dashed line is the location of the profile in Figs. 12 and 14.
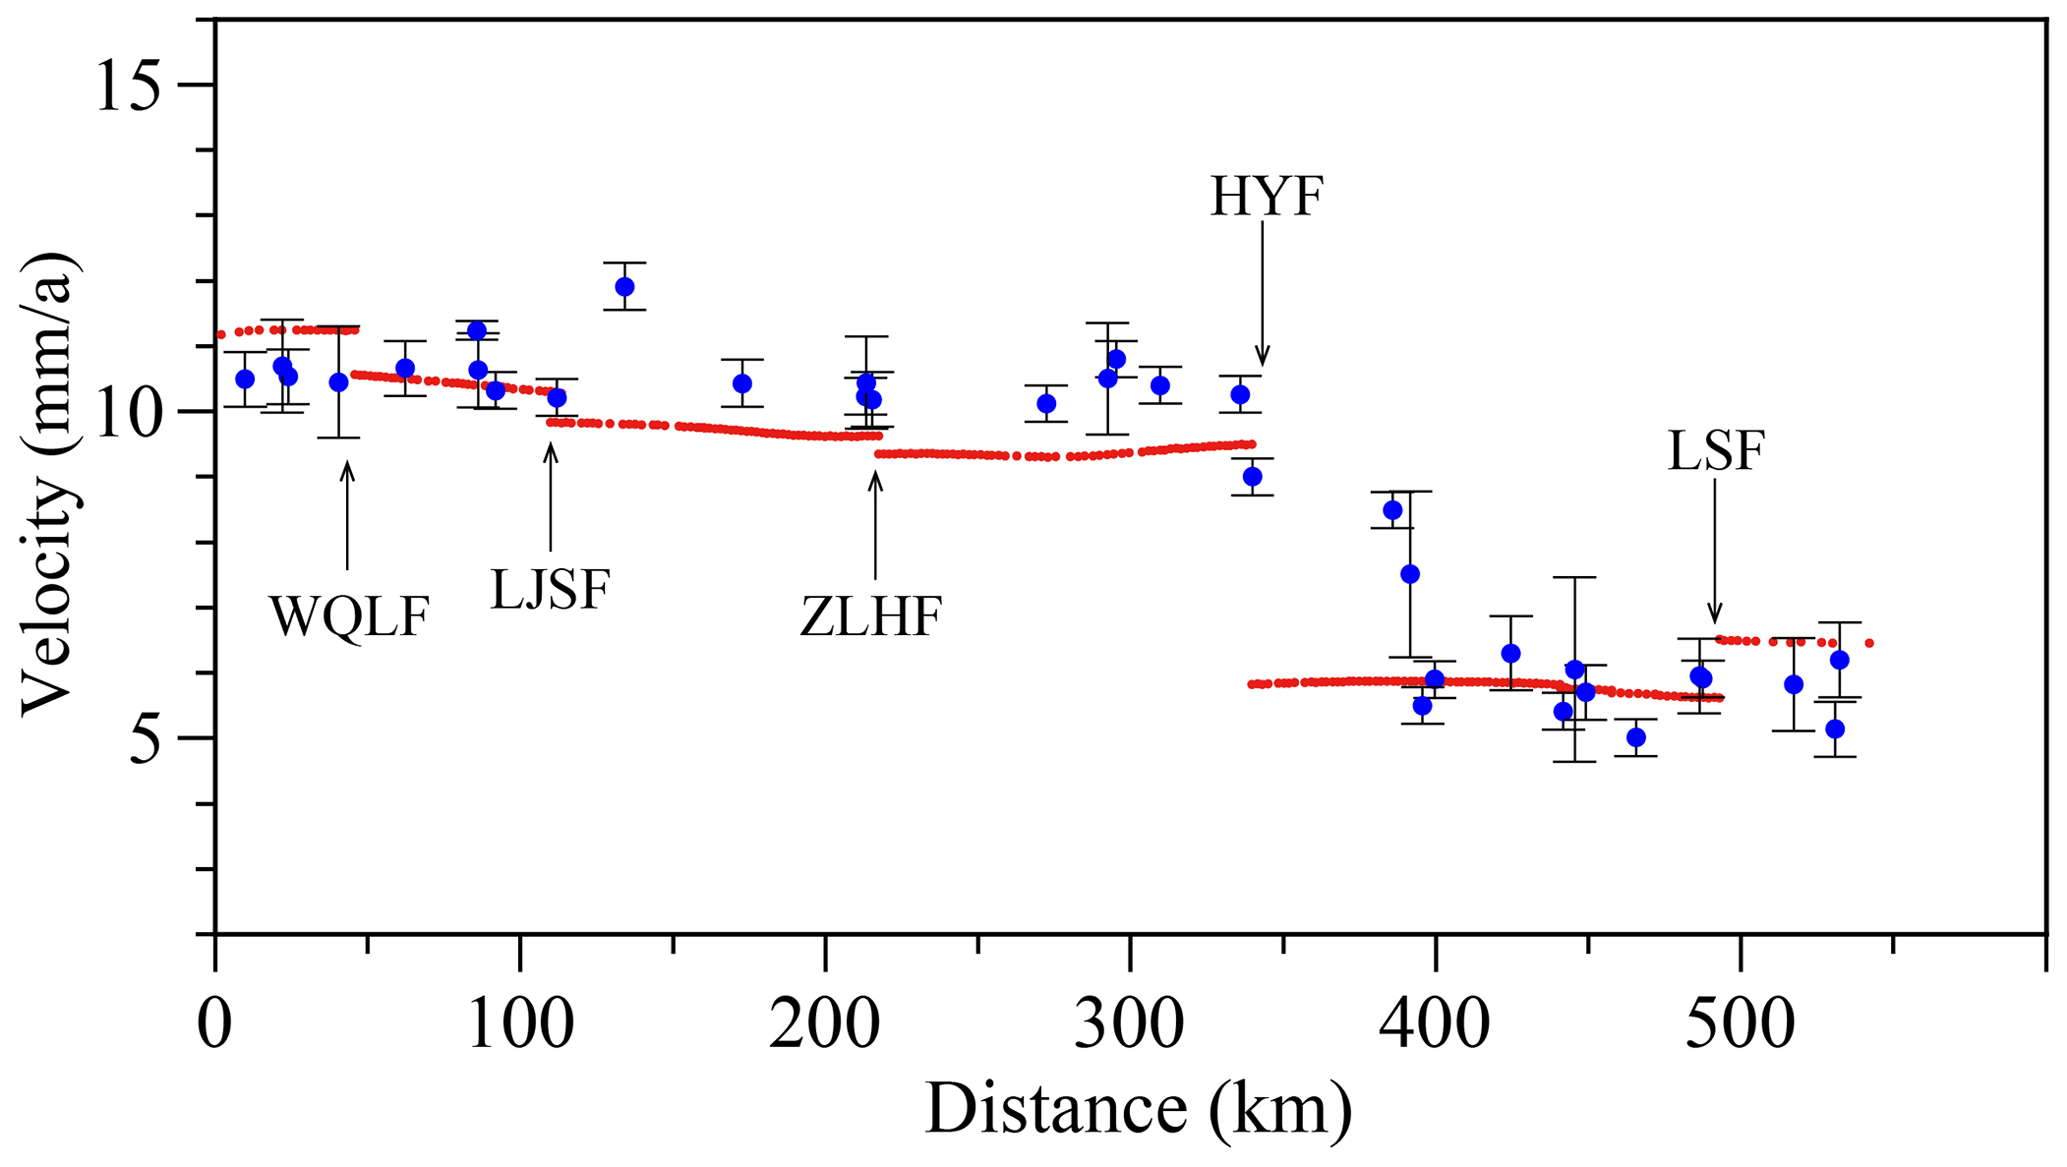
Figure 12Comparison of the modeled horizontal velocities and GPS velocities along the C–C′ profile in Fig. 11. The red points are model data, and blue circles indicate GPS measurements. The fault names are defined in Fig. 1.
Table 3Comparison of model slip rates with geological slip rates.
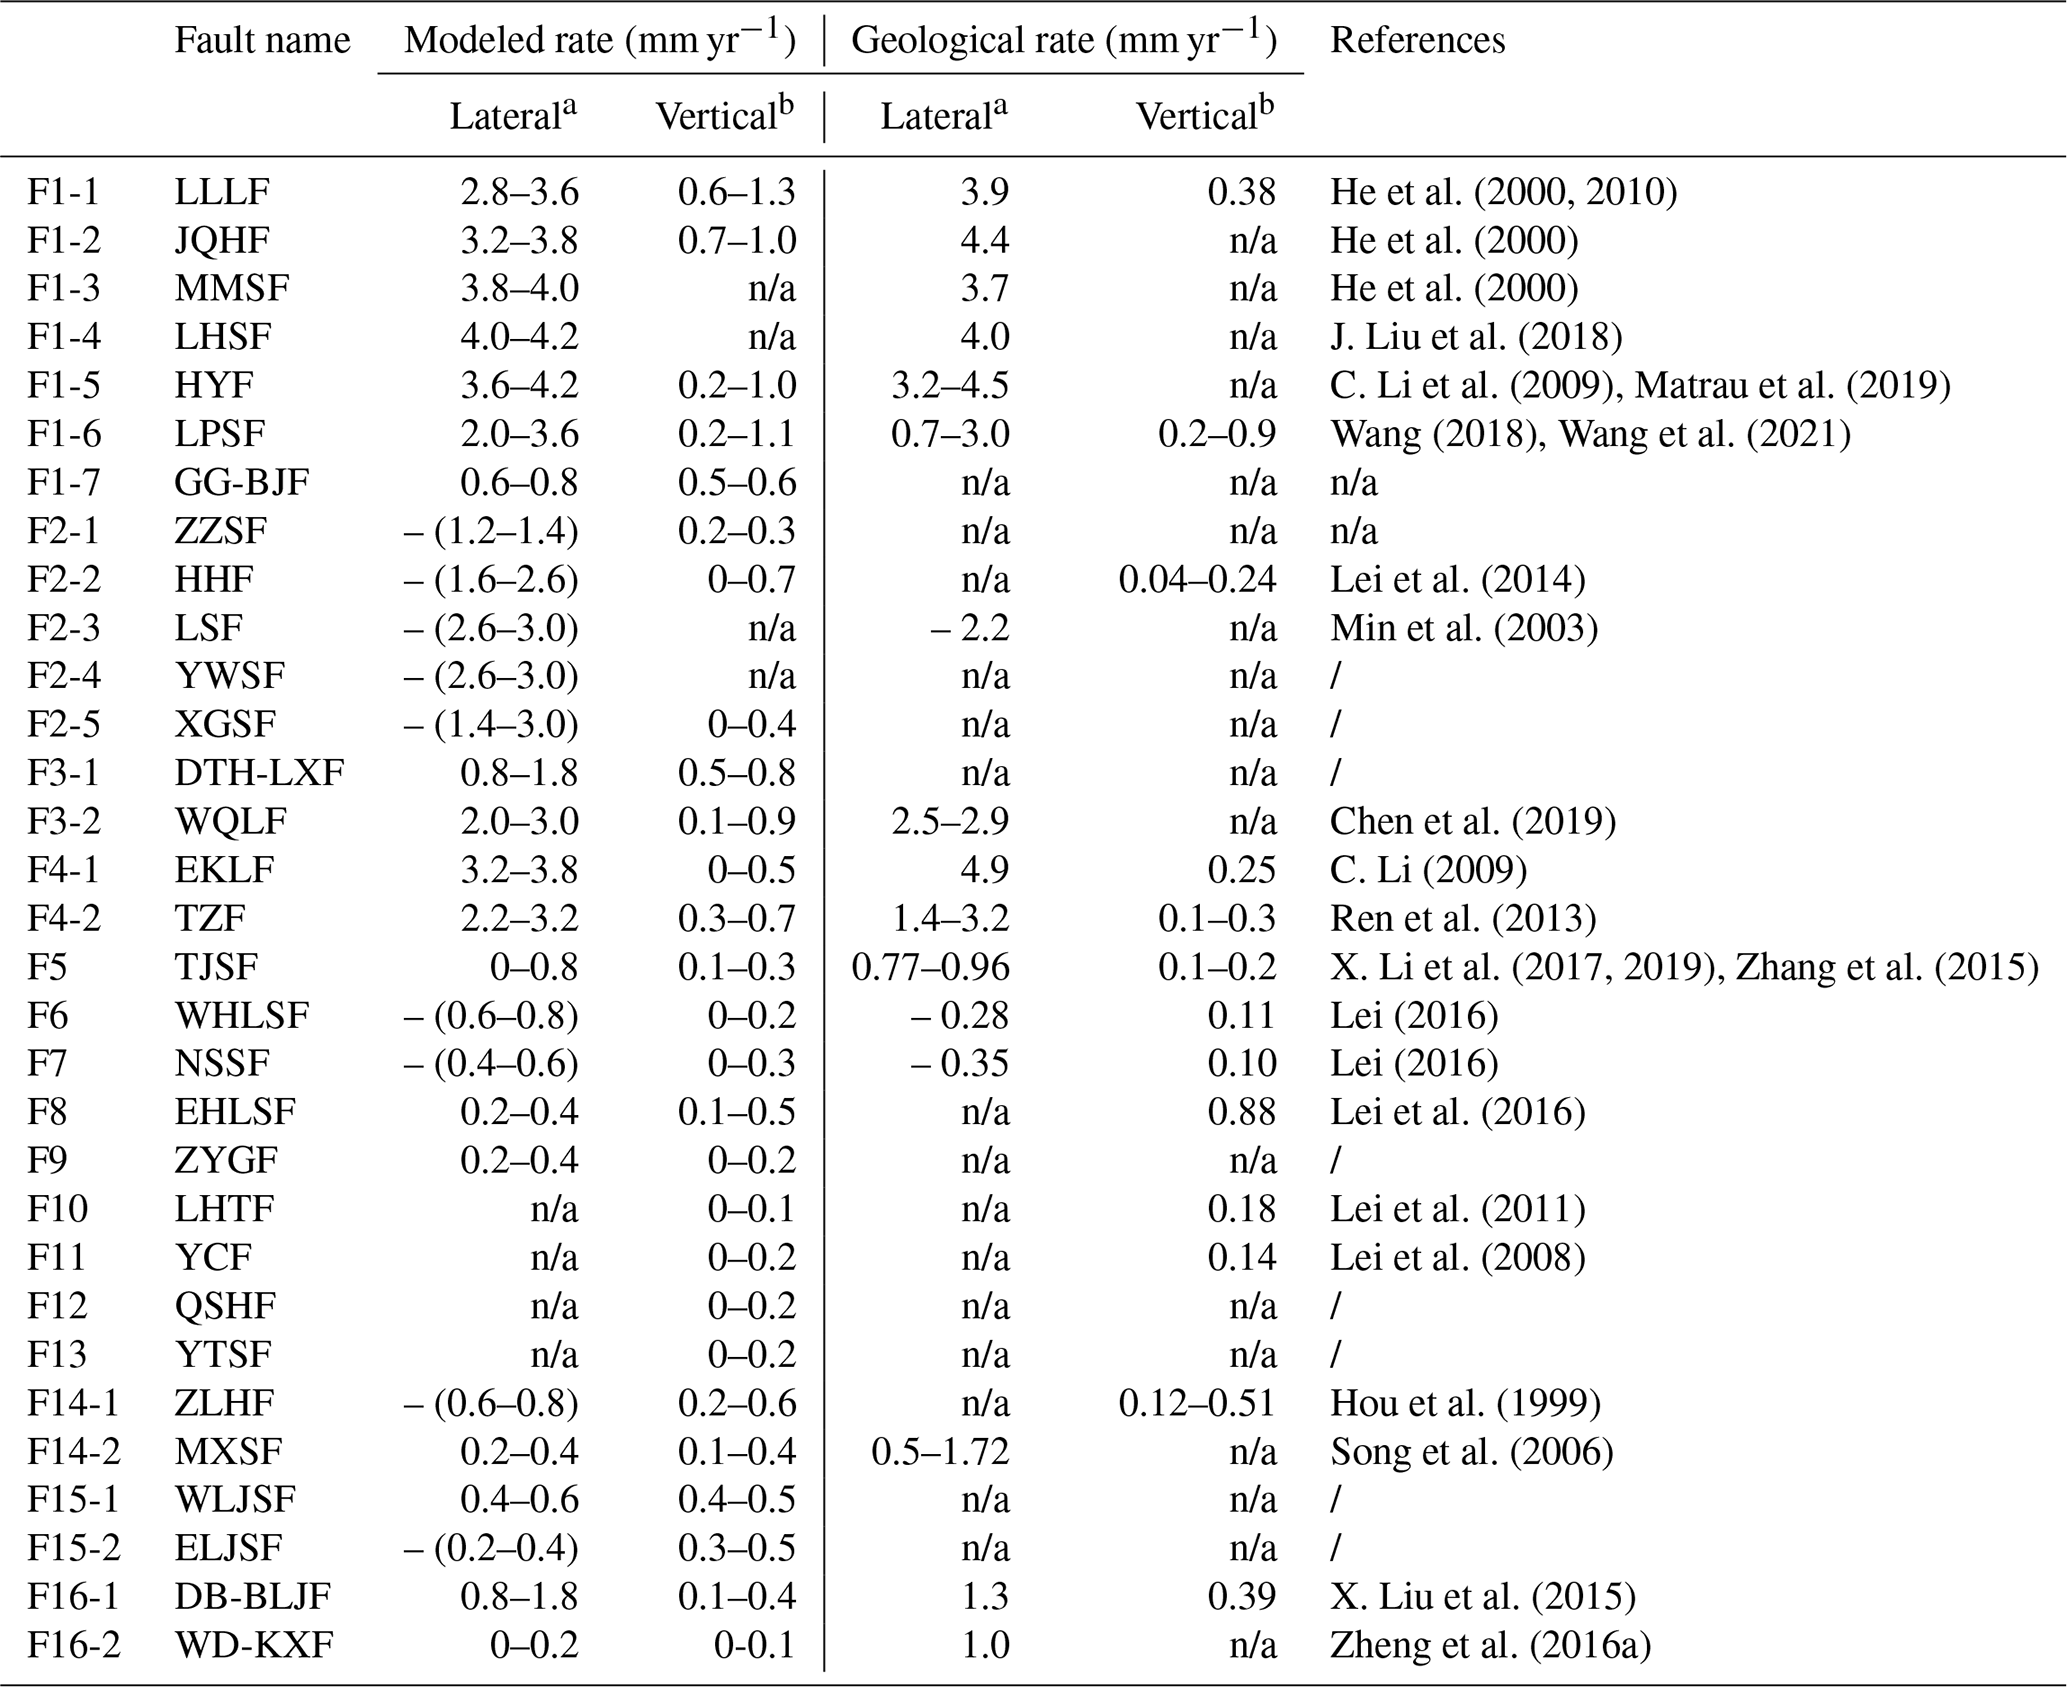
a Positive value indicates left-lateral slip rate. b Fault attributes are shown in Fig. 10b.
4.2 Fault slip rates and seismic hazards
4.2.1 Tianzhu seismic gap
The M 8.0 Gulang earthquake occurred in 1927 along the northwestern segment of F1, whereas the M 8.0 Haiyuan earthquake occurred in 1920 on the Haiyuan Fault (Fig. 1). The Jinqianghe, Maomaoshan, and Laohushan faults, which are in the region between the locations of these two strong earthquakes and remained unruptured during both events, are collectively known as the Tianzhu seismic gap (TSG, Guo et al., 2019; Y. Li et al., 2016; Fig. 13a). Based on the simulation, the left-lateral strike-slip rates of the Jinqianghe, Maomaoshan, and Laohushan faults were 3.2–3.8, 3.8–4.0, and 4.0–4.2 mm yr−1, respectively (Table 2, Fig. 13a). Therefore, all three faults have relatively high slip rates compared with the rest of the study area. Based on the slip rates and other fault data, we estimated the earthquake magnitude based on the energy accumulated during the time elapsed from the previous event (Purcaru et al., 1978) and recurrence intervals (Shen et al., 2009), as shown in Table 4. The Jinqianghe, Maomaoshan, and Laohushan faults can generate MS 7.1, 7.3, and 6.6 earthquakes, with recurrence intervals of 424, 571, and 1910 years, respectively. A total of 675 and 952 years have elapsed since the last rupture along the Jinqianghe and Maomaoshan faults (Gan et al., 2002; Table 4). Therefore, the likelihood of reactivation along these two faults is high. For the Laohushan Fault, the most recent earthquake with surface ruptures is thought to be the 1888 M 6.25 Jingtai earthquake. Because only 133 years have elapsed since this event, the seismic hazard of this fault in the near future is low. Although several researchers suggested that the TSG could be ruptured thoroughly by a M ≥ 8.0 earthquake with a recurrence interval of 1000 years (Chen, 2014), and the elapsed time from the last M 8.0 earthquake may be close to the recurrence interval (J. Liu et al., 2018), further work is needed to verify this assumption, especially on the stress state of the faults. Nevertheless, our results together with the previous studies suggest that the seismic hazard caused by a large earthquake in the TSG is high in the next few decades, and careful earthquake monitoring should be conducted in this area.
4.2.2 Seismic gap at the southern Liupanshan and Guguan–Baoji faults
The Liupanshan and Guguan–Baoji faults are jointly affected by three interacting blocks with contrasting velocity fields (Fig. 13b). First, the SE movement of the Qilian Block horizontally compresses this region against the stable Ordos Block to the east and causes strong thrusting motion (Fig. 6a). Second, the Liupanshan Fault zone, which is adjacent to the SE end of the Haiyuan Fault, accommodates the shortening caused by the left-lateral strike-slip motion of the Haiyuan Fault. Third, our modeled results showed that the Yunwushan–Xiaoguanshan Fault has a significant right-lateral strike-slip component (Fig. 7), which contributes to the accumulation of right-lateral shear strain in the Liupanshan and Guguan–Baoji fault zones (Du et al., 2018). Based on the analysis of the velocity field in the region, the Liupanshan and Guguan–Baoji faults are a prime location for elastic strain accumulation. The distribution of the velocities of the faults are also indicative of stress accumulation in this region (Fig. 7). The northern segment of the Liupanshan Fault had slip rates of 3.2–3.6 mm yr−1, which dramatically decreased to 2.5 mm yr−1 in the middle and southern segments of the fault. In addition, the slip rate of the Guguan–Baoji Fault was only 0.7 mm yr−1. The northern part of the Yunwushan–Xiaoguanshan Fault had slip rates of 2.8–3.0 mm yr−1, which decreased to 1.5 mm yr−1 in the southern segment (Fig. 13b). These changes in the slip rate indicate that the middle–southern segments of the Liupanshan and Guguan–Baoji faults have high slip rate deficits, implying this region accumulates strain. However, in terms of seismic activity, only the northern segment of the Liupanshan Fault has a history of major earthquakes, including an M 7 earthquake in 1219, M 6.5 earthquake in 1306, and M 6.5 earthquake in 1921 (Fig. 13b). Earthquakes stronger than M 6.0 have not been recorded in the middle–southern parts of Liupanshan Fault. Their seismic activity mainly manifests as small and sparse earthquakes, and the most recent significant activation was recorded ∼ 570 years ago (Shi et al., 2014). Minor earthquakes related to the Guguan–Baoji Fault are scarce, and the only notable earthquakes that have occurred near this fault were an M 6.0 earthquake in 1704 and the 600 CE Qinlong M 6.75 earthquake (Shi et al., 2013). Approximately 1400 years have elapsed since the last M ∼ 7 earthquake.
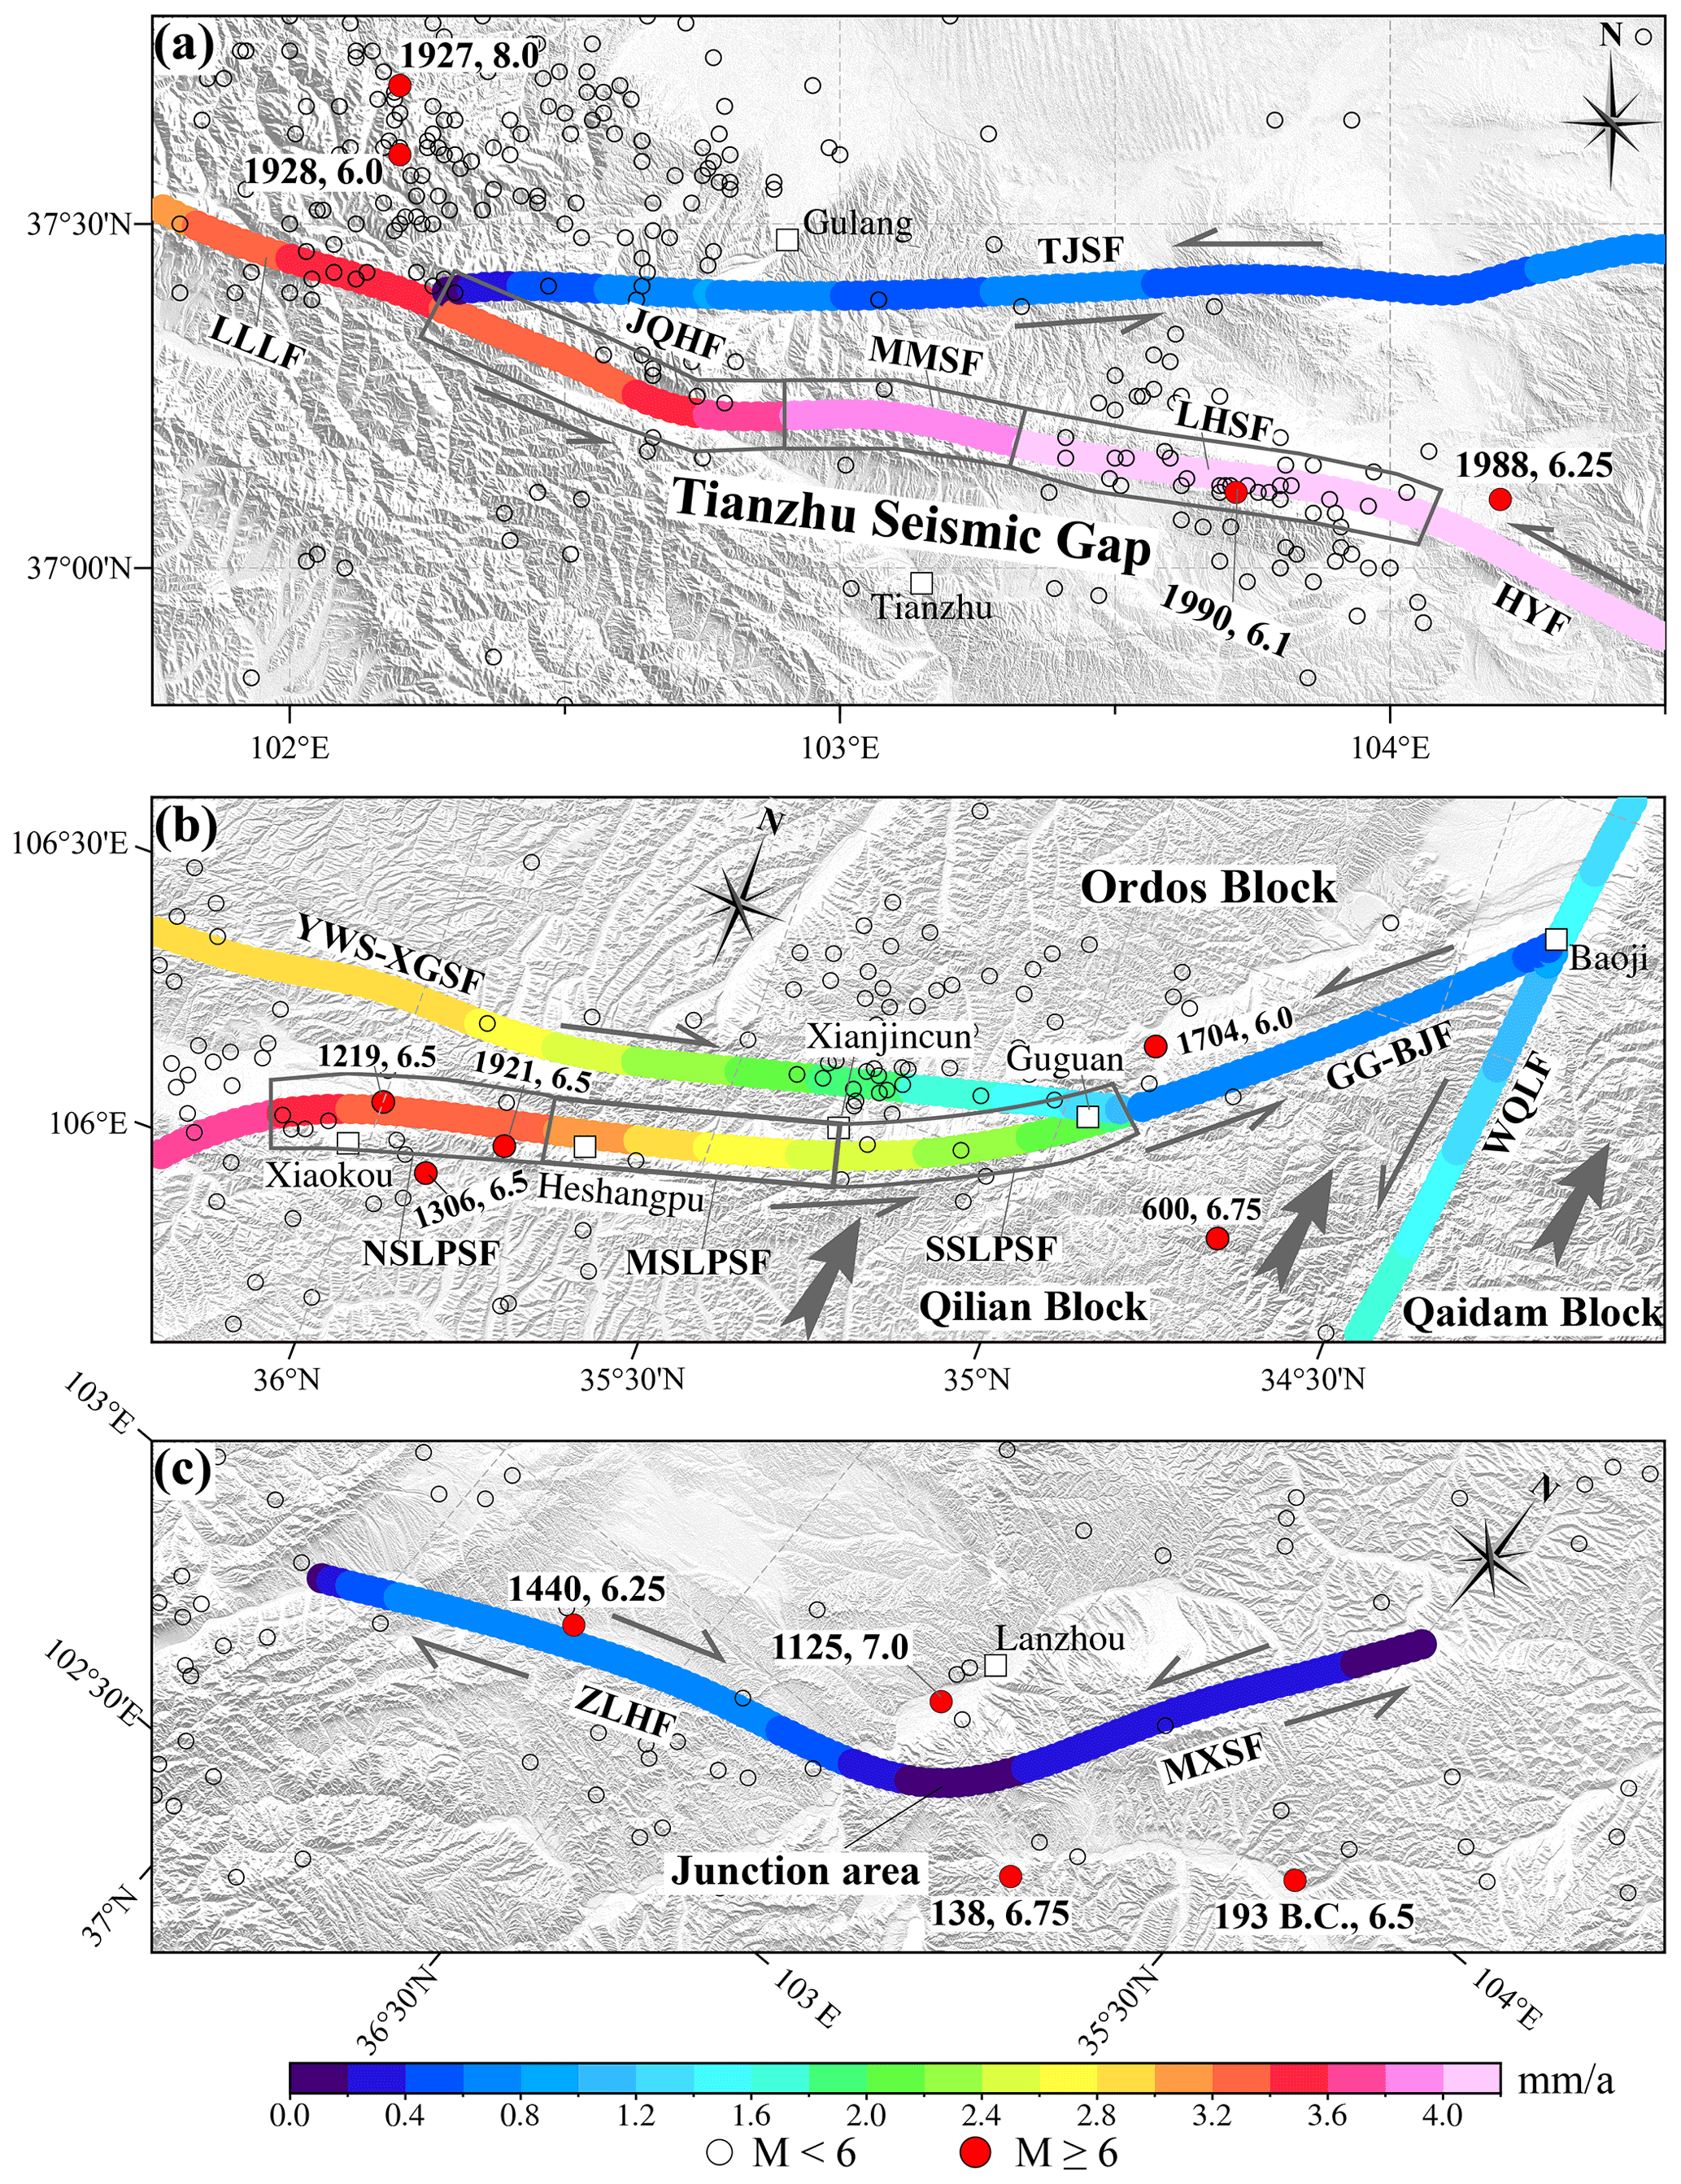
Figure 13Modeled horizontal fault slip rates and distribution of historical earthquakes in (a) the Tianzhu seismic gap; (b) the intersection of the Liupanshan, Guguan–Baoji, and Yunwushan–Xiaoguanshan faults; and (c) the junction of the Maxianshan and Zhuanglanghe faults. The gray arrows in (b) represent the movements of the Qilian and Qaidam blocks, and NSLPSF, MSLPSF, and SSLPSF are the northern, middle, and southern segments of the Liupanshan Fault, respectively.
Table 4Earthquake magnitude and recurrence interval of each fault based on the energy accumulated during the elapsed time since the last significant earthquake.
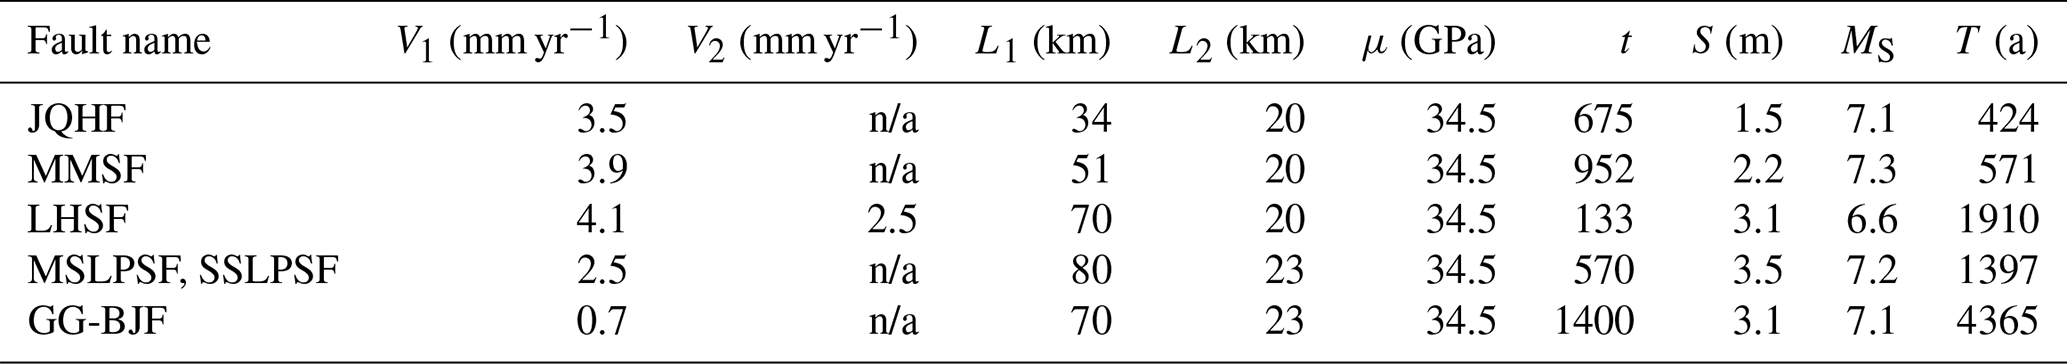
V1 is the modeled average slip rate of the fault in this study. V2 is the aseismic creep rate of the fault (Y. Li et al., 2021). L1 is the length of the fault (Xu et al., 2016). L2 is the depth of the seismogenic structure, which refers to the locking depth (Y. Li et al., 2017, 2021). μ is the shear modulus of the rocks (Aki et al., 2002). t is the time that has elapsed since the most recent remarkable earthquake (Gan et al., 2002; Shi et al., 2013, 2014; Wang and Liu, 2001). S is the largest maximum coseismic displacement, calculated using the method of Gan et al. (2002). MS is the earthquake magnitude, corresponding to the energy accumulated by the fault between recurrences (Purcaru et al., 1978). T is the recurrence interval of the fault, where T = (V1−V2) (Shen et al., 2009). The fault names are defined in Figs. 1 and 13. n/a: not applicable.
Based on the above analysis, we suggest that the southern segments of the Liupanshan and Guguan–Baoji faults are in prime locations for stress and strain accumulation and constitute a seismic gap at the end of the large-scale Haiyuan strike-slip fault zone. Because this region has a history of strong earthquakes, it is necessary to assess the seismic hazard and its urgency. Based on the fault slip rates obtained from our model and fault data in the literature, we estimated that the energy accumulated on the middle–southern Liupanshan and Guguan–Baoji faults during the elapsed time is sufficient to generate MS 7.2 and 7.1 earthquakes, with recurrence intervals of 1397 and 4365 years, respectively (Table 4). Obviously, the elapsed time on the middle–southern Liupanshan (570 years) and Guguan–Baoji faults (1400 years) (see the column “t” in Table 4) are much shorter than their typical recurrence intervals. Therefore, we inferred that the middle-southern Liupanshan fault and the Guguan–Baoji fault are most likely in a state of stress accumulation, and the likelihood of a large earthquake on these fault segments in the next few decades is low.
4.2.3 Maxianshan–Zhanglanghe fault zone
The Maxianshan Fault near Lanzhou city is a large Holocene strike-slip fault with a thrust component and acts as an important earthquake-controlling fault that affects and constrains the seismicity of this region (Yuan et al., 2003). Different left-lateral strike-slip rates have been reported for this fault: 3.73 (Yuan et al., 2002a), 0.5–1.72 (Song et al., 2006), and 0.93 mm yr−1 (Liang et al., 2008). These discrepancies in fault slip rate may be attributed to the loess that covers the extension of the fault, which obscures the fault traces in many segments and makes it difficult to track its activity. The modeled results in this study indicated that the left-lateral strike-slip rates of the Maxianshan Fault range from 0.2 to 0.4 mm yr−1, and the vertical slip rates vary from 0.1 to 0.4 mm yr−1 (Fig. 13c, Table 3). Therefore, the left-lateral strike-slip rates of the Maxianshan Fault may not be as large as previously thought, but they have a relatively large thrust component. The Zhanglanghe Fault is predominantly a right-lateral strike-slip fault with slip rates ranging from 0.6 to 0.8 mm yr−1 (Fig. 13c, Table 3). These slip rates are significantly greater than the left-lateral strike-slip rates of the Maxianshan Fault. Note that the slip rate on the junction between the Maxianshan and Zhuanglanghe faults is practically zero. Thus, the junction would accumulate high concentrations of stress under the continuous eastward movement of the Qilian Block. Previous studies have suggested that the 1125 CE Lanzhou M 7.0 earthquake occurred in such a tectonic setting (He et al., 1997; Fig. 13c). Given that the recurrence interval of this region is 2250–3590 years and the last event was only 896 years ago (Liang et al., 2008), the near-term risk of a large earthquake in this region is low. Therefore, we speculate that the junction of the Maxianshan and Zhuanglanghe faults is currently in a state of stress accumulation.
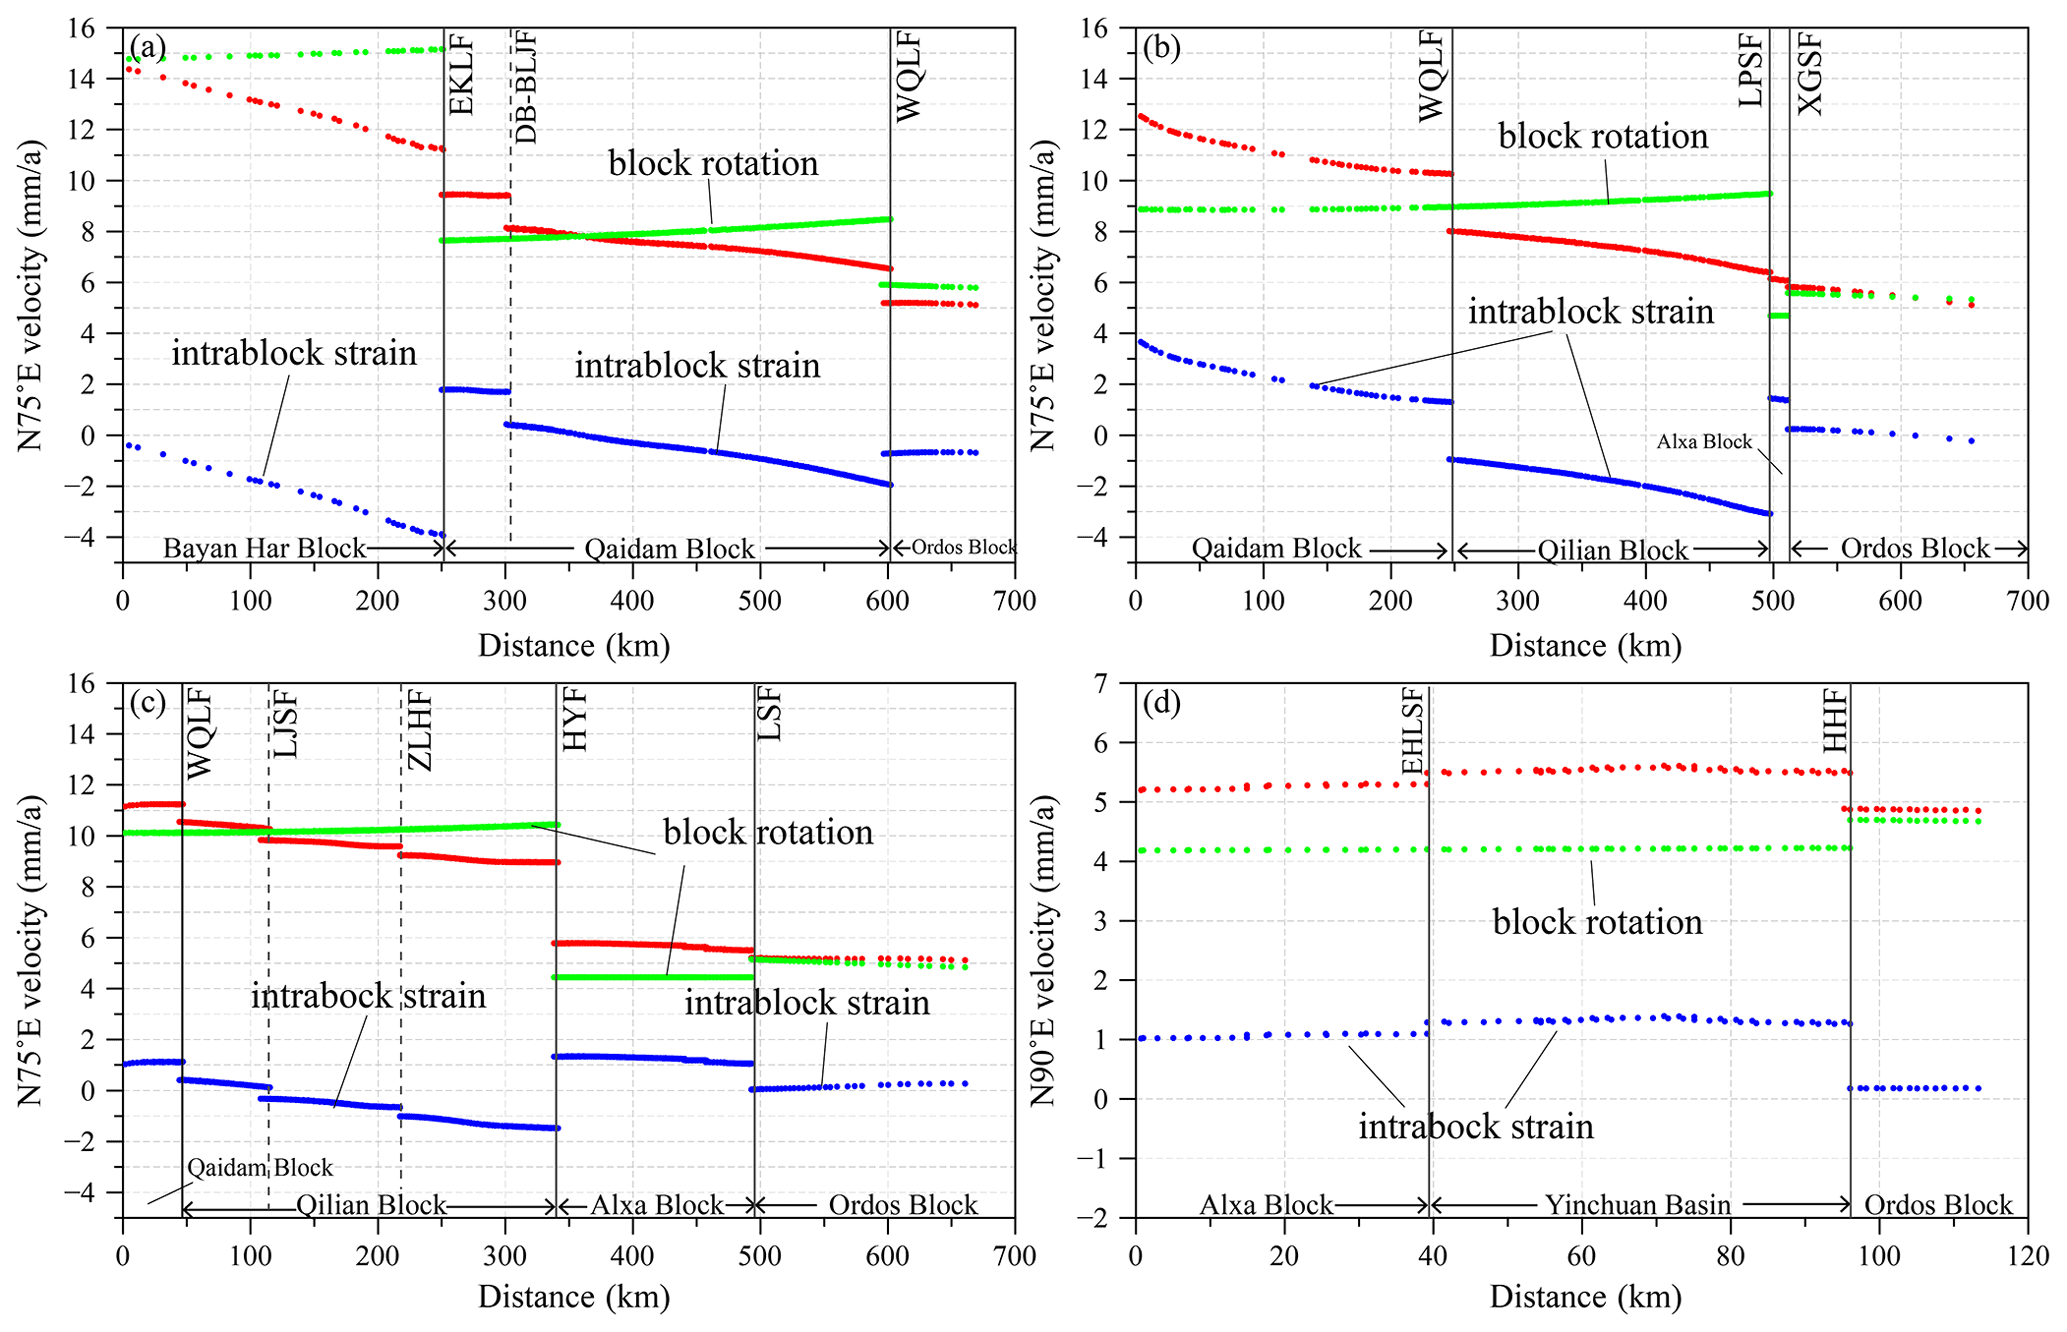
Figure 14Modeled velocity profiles across the study area with profile orientation. The profiles in (a)–(d) correspond to A–A′, B–B′, C–C′, and D–D′ in Fig. 11, respectively. The red dots indicate the components along the profiles of the node motion velocity within 2 km on both sides of the profile. The green dots represent the velocity component along the profiles due to plate rotation. The blue dots indicate the differences between the red and green dots. Fault names are defined in Fig. 1.
4.2.4 Isolated uplift areas and earthquakes
As mentioned above, we considered that earthquakes are less likely to occur on the Laohushan, Liupanshan, and Haiyuan faults in the short term owing to the earthquake recurrence cycle and the elapsed time from the previous earthquake. However, the Haiyuan, Liupanshan, Lajishan, and Daotanghe–Linxia faults are all located near the isolated rapid uplift areas of the Qilian block (Fig. 10a). Many studies have also found that low-velocity bodies are widely distributed in the middle–lower crust of the Qilian Block (Bao et al., 2013; Wang et al., 2018; Ye et al., 2016). The spatial coupling of active faults, isolated uplift areas, and low-velocity bodies is highly similar to the seismogenic conditions elaborated by the “seismic source cavity” model recently proposed by Zeng et al. (2021). That is, during the rapid uplift of the isolated areas (Fig. 10a), the low-velocity bodies in the middle–lower crust easily intruded into the weak space of the crust under differential pressure to form a seismic source cavity. If the isolated uplift areas continue to rise, the seismic source cavity may rise to the shallow part of the crust to intersect with brittle faults, causing strong earthquakes (Yang et al., 2009; Zeng et al., 2021). Therefore, in addition to the Jinqianghe and Maomaoshan faults mentioned above, the Haiyuan, Liupanshan, Lajishan, and the Daotanghe–Linxia faults also have favorable structural conditions for strong earthquakes, although a number of areas have not experienced events in recorded history.
4.3 Implication for deformation mechanism of NETP
The deformation of NETP is the result of the combined action of block rotation, faulting, and intra-block strain (Meade and Loveless, 2009). We analyzed four velocity profiles to compare the contributions of block rotation, faulting, and intra-block strain to determine the total deformation of NETP (Fig. 14). The rigid displacements caused by block rotation were calculated according to the Euler pole locations and rotation rates with respect to the Eurasian plate (Wang et al., 2017; Y. Li et al., 2022), as shown in Fig. 14a–d. The velocity gradient caused by block rotation accounted for more than 80 % of that on the profiles. Obviously, the block rotation should be the primary mechanism for the deformation of the NETP, which is similar to southeastern Tibet (Z. Zhang et al., 2013). However, the intra-block strain of the Bayan Har and Qaidam blocks contributed approximately 4 and 3 mm yr−1 shortening in profiles of A–A′ and B–B′ (Fig. 14a–b). The Qilian Block also exhibited a contribution of 2 mm yr−1 shortening in profile B–B′ but decreased to approximately 1 mm yr−1 in profile C–C′ (Fig. 14b–c). Therefore, the intra-block strain is still significant for regional deformation. The boundary faults of the blocks, such as the East Kunlun, Haiyuan, and West Qinling faults, also play an important role in regulating the deformation differences between blocks.
The D–D′ profile shows that the tectonic deformations of the Yinchuan Basin structural belt slightly differ from those in other profiles. The NE expansion of the TP leads to near-N–S compression on the Yinchuan Basin (Yang, 2018), which causes it to move eastwards faster than the Alxa Block. This manifests as an eastward extension in the Yinchuan Basin. The crustal deformations caused by this process are accommodated by the right-lateral strike-slip of Huanghe Fault (Fig. 14d).
In this study, a detailed 3D geomechanical model of the NETP was constructed based on geophysical, geodetic, and geological data. This model accounted for 3D fault geometries, variational rock properties, a reasonable initial crustal stress, and gravity. Special attention has been given to the evaluation of fault friction coefficients and initial stress to ensure that the model is consistent with the geological conditions as much as possible. In addition, we extracted particular data from the model and obtained the horizontal and vertical crustal velocities of the study area and the horizontal and vertical slip rates of the major faults. The results are consistent with the conclusions obtained by geodesy, geology, paleomagnetism, etc.
Based on the analysis of the kinematics of major faults, we suggest that the Jinqianghe–Maomaoshan Fault will likely experience a MS 7.1–7.3 earthquake in the following decades owing to its relatively high slip rates with an elapsed time close to the recurrence interval. In contrast, the Laohushan and middle–southern Liupanshan faults, as well as the Guguan–Baoji and the junction of the Maxianshan and Zhuanglanghe faults, are thought to have a low seismic hazard in the near future owing to the very short elapsed time since the last significant event, although stress is easily accumulated in these areas. The model also provided information on the deformation mechanism of the NETP. Because of velocity differences between the opposing sides of the Haiyuan, West Qinling, and East Kunlun faults, as well as the relative stability of the Alxa and Ordos blocks, the NE expansion of the TP has caused the fault-separated Qilian, Qaidam, and Bayan Har blocks to extrude in the SEE direction and rotate in the clockwise direction. The block rotation is the primary mechanism for the deformation of the NETP even though intra-block strain and faulting are non-negligible.
The GPS data displayed in Figs. 4 and 11 are available at https://doi.org/10.7910/DVN/C1WE3N (Wang and Shen, 2020). The fault traces were obtained at https://www.activefault-datacenter.cn/map_instruct (Xu et al., 2016). The CRUST1.0 data were obtained at https://igppweb.ucsd.edu/~gabi/crust1.html (Laske et al., 2013).
LL and XL contributed to the model building. LL conducted the analysis, wrote the paper, and prepared the figures. FY, LP, and JT reviewed and edited the paper.
The contact author has declared that none of the authors has any competing interests.
Publisher's note: Copernicus Publications remains neutral with regard to jurisdictional claims in published maps and institutional affiliations.
Several figures were plotted using The Generic Mapping Tools (https://www.generic-mapping-tools.org/, last access: 25 August 2022). Slip rates on fault surfaces were calculated by the software GeoStress (Stromeyer et al., 2020).
This research has been supported by the Ningxia Natural Science Foundation (grant nos. 2020AAC03445, 2021AAC05022 and 2021AAC03441).
This paper was edited by Patrice Rey and reviewed by Huizi Jian and one anonymous referee.
Achache, J., Courrillot, V., and Zhou, Y.: Paleogeographic and tectonic evolution of southern Tibet since Middle Cretaceous time: new paleomagnetic data and synthesis, J. Geophys. Res.-Sol. Ea., 89, 10311–10339, https://doi.org/10.1029/JB089iB12p10311, 1984.
Ahlers, S., Henk, A., Hergert, T., Reiter, K., Müller, B., Röckel, L., Heidbach, O., Morawietz, S., Scheck-Wenderoth, M., and Anikiev, D.: 3D crustal stress state of Germany according to a data-calibrated geomechanical model, Solid Earth, 12, 1777–1799, https://doi.org/10.5194/se-12-1777-2021, 2021.
Aki, K. and Richards, P. G.: Quantitative Seismology, second ed, University Science Books, California, USA, ISBN 978-1-891389-63-4, 2002.
Armijo, R., Flerit, F., King, G., and Meyer, B.: Linear elastic fracture mechanics explains the past and present evolution of the Aegean, Earth Planet Sc. Lett., 217, 85–95, https://doi.org/10.1016/S0012-821X(03)00590-9, 2004.
Bai, M., Chevalier, M., Pan, J., Replumaz, A., Leloup, P. H., Métois, M., and Li, H.: Southeastward increase of the late Quaternary slip-rate of the Xianshuihe fault, eastern Tibet. Geodynamic and seismic hazard implications, Earth Planet. Sc. Lett., 485, 19–31, https://doi.org/10.1016/j.epsl.2017.12.045, 2018.
Bao, G., Chen, H., Hu, J., and Zhu, G.: Quaternary Activity and Segmentation of the Yellow River Fault of the Eastern Margin of Yinchuan Graben, Acta Geosci. Sin., 40, 614–628, 2019.
Bao, X., Song, X., Xu, M., Wang, L., Sun, X., Mi, N., Yu, D., and Li, H.: Crust and upper mantle structure of the North China Craton and the NE Tibetan Plateau and its tectonic implications, Earth Planet. Sc. Lett., 369–370, 129–137, https://doi.org/10.1016/j.epsl.2013.03.015, 2013.
Brotons, V., Tomas, R., Ivorra, S., Grediaga, A., Martínez-Martínez, J., Benavente, D., and Goómez-Heras, M.: Improved correlation between the static and dynamic elastic modulus of different types of rocks, Mater. Struct., 49, 3021–3037, 2016.
Buchmann, T. J. and Connolly, P. T.: Contemporary kinematics of the Upper Rhine Graben: A 3D finite element approach, Glob. Planet. Change, 58, 287–309, https://doi.org/10.1016/j.gloplacha.2007.02.012, 2007.
Burchfiel, B. C., Zhang, P., Wang, Y., Zhang, W., Song, F., Deng, Q., Molnar, P., and Royden, L.: Geology of the Haiyuan Fault Zone, Ningxia-Hui Autonomous Region, China, and its relation to the evolution of the Northeastern Margin of the Tibetan Plateau, Tectonics, 10, 1091–1110, https://doi.org/10.1029/90TC02685,1991.
Chen, P. and Lin, A.: Tectonic topography and Late Pleistocene activity of the West Qinling Fault, northeastern Tibetan Plateau, J. Asian Earth Sci., 176, 68–78, https://doi.org/10.1016/j.jseaes.2019.02.007, 2019.
Chen, T.: Application of airborne LiDAR (light detection and ranging) for quantitative tectonic geomorphology, PH.D. thesis, Institute of Geology China Earthauake Administration, Beijing, PH.D. thesis, 2014.
Cianetti, S., Gasperini, P., Giunchi, C., and Boschi, E.: Numerical modelling of the Aegean-Anatolian region: geodynamical constraints from observed rheological heterogeneities, Geophys. J. Int., 146, 760–780, https://doi.org/10.1046/j.1365-246X.2001.00492.x, 2001.
Ding, G., Tian, Q., Kong, F., Xie, X., Zhang, L., and Wang, L.: Segmentation of active fault, Seismological Press, Beijing, ISBN 7-5028-1082-X, 1993.
Du, F., Wen, X., Feng, J., Liang, M., Long, F., and Wu, J.: Seismo-tectonics and seismic potential of the Liupanshan fault zone (LPSFZ), China, Chinese J. Geophys. Ch., 61, 545–559, 2018.
Du, P.: Studying on the active characteristics and paleoearthquake of the eastern piedmont fault of Helan Mountain in the late Quaternary, M.S. thesis, China University of Geosciences (Beijing), Beijing, M.S. thesis, 2010.
Gan, W. and Liu, B.: Probability of large earthquake recurrence along the Jingtai-Tianzhu active fault, Seismol. Geol., 24, 45–58, 2002.
Gao, Z.: Late Quaternary activity characteristics and risk analysis of large earthquakes of the Zhuozishan West Piedmont Fault, M.S. thesis, Lanzhou Institute of Seismology, China Earthauake Administration, Lanzhou, https://doi.org/10.27491/d.cnki.gzdls.2020.000004, 2020.
Guo, P., Han, Z., Mao, Z., Xie, Z., Dong, S, Gao, F., and Gai, H.: Paleoearthquakes and rupture behavior of the Lenglongling Fault: implications for seismic hazards of the northeastern margin of the Tibetan Plateau, J. Geophys. Res.-Sol. Ea., 124, 1520–1543, https://doi.org/10.1029/2018JB016586, 2019.
Guo, P., Han, Z., Gao, F., Zhu, C., and Gai, H.: A new tectonic model for the 1927 M 8.0 Gulang Earthquake on the NE Tibetan Plateau, Tectonics, 39, e2020TC006064, https://doi.org/10.1029/2020TC006064, 2020.
Hao, M., Li, Y., Wang, Q., Zhuang, W., and Qu, W.: Present-day crustal deformation within the Western Qinling mountains and its kinematic implications, Surv. Geophys., 42, 1–19, https://doi.org/10.1007/s10712-020-09621-5, 2021.
He, J., Lu, S., and Wang, W.: Three-dimensional mechanical modeling of the GPS velocity field around the northeastern Tibetan plateau and surrounding regions, Tectonophysics, 584, 257–266, https://doi.org/10.1016/j.tecto.2012.03.025, 2013.
He, W., Liu, B., Yuan, D., and Yang, M.: Research on slip rates of the Lenglongling active fault zone, NW Seismol. J., 22, 90–97, 2000.
He, W., Yuan, D., Ge, W., and Luo, H.: Determination of the slip rate of the Lenglongling fault in the middle and eastern segments of the Qilian mountain active fault zone, Earthquake, 30, 131–137, https://doi.org/10.3969/j.issn.1000-3274.2010.01.015, 2010.
He, X., Wang, D., and Wan, F.: Discussion on the characteristics of the fracture zone of the Lanzhou M 7.0 earthquake in 1125 and the problems concerned, North China Earth. Sci., 15, 37–44, 1997.
Hergert, T.: Numerical modelling of the absolute stress state in the Marmara Sea region – a contribution to seismic hazard assessment, PH.D thesis, Universität Karlsruhe, Karlsruhe, https://doi.org/10.5445/IR/1000012170, 2009.
Hergert, T. and Heidbach, O.: Slip-rate variability and distributed deformation in the Marmara Sea fault system, Nat. Geosci., 3, 132–135, https://doi.org/10.1038/ngeo739, 2010.
Hergert, T. and Heidbach, O.: Geomechanical model of the Marmara Sea region – II. 3-D contemporary background stress field, Geophys. J. Int., 185, 1090–1102, https://doi.org/10.1111/j.1365-246X.2011.04992.x, 2011.
Hergert, T., Heidbach, O., Bécel, A., and Laigle, M.: Geomechanical model of the Marmara Sea region – I. 3-D contemporary kinematics, Geophys. J. Int., 185, 1073–1089, https://doi.org/10.1111/j.1365-246X.2011.04991.x, 2011.
Hou, K., Yuan, D., and Li, S.: Segmentation and deformation characteristics of Wuwei-Tianzhu-Zhuanglanghe fault zone, Crust. Deform. Earth., 19, 55–63, 1999.
Hubert-Ferrari, A., King G., Manighetti I., Armijo R., Meyer B., and Tapponnier P.: Long-term elasticity in the continental lithosphere; modelling the Aden Ridge propagation and the Anatolian extrusion process, Geophys. J. Int., 153, 111–132, https://doi.org/10.1046/j.1365-246X.2003.01872.x, 2003.
Jamison, D. B. and Cook, N. G. W.: Note on measured values for the state of stress in the Earth's crust, J. Geophys. Res.-Sol. Ea., 85, 1833–1838, https://doi.org/10.1029/JB085iB04p01833, 1980.
Jia, W., Liu, H., Liu, Y., and Yuan, D.: Preliminary study on activity of the Wudu-Kangxian fault zone, NW Seismol. J., 34, 142–149, 2012.
Laske, G., Masters, G., Ma, Z., and Mike, P.: Update on CRUST1.0 – A 1-degree Global Model of Earth's Crust, Geophys. Res. Abstr., 15, 2658, Abstract EGU2013-2658 [data set], https://igppweb.ucsd.edu/~gabi/crust1.html (last access: 25 August 2022), 2013.
Lasserre, C., Morel, P. H., Gaudemer, Y., Tapponnier, P., Ryerson, F. J., King, G. C. P., Métivier, F., Kasser, M., Kashgarian, M., Liu, B., Lu, T., and Yuan, D.: Postglacial left slip rate and past occurrence of M ≥ 8 earthquakes on the Western Haiyuan Fault, Gansu, China, J. Geophys. Res.-Sol. Ea., 104, 17633–17651, https://doi.org/10.1029/1998JB900082, 1999.
Lease, R. O., Burbank, D. W., Zhang, H., Liu J., and Yuan, D.: Cenozoic shortening budget for the northeastern edge of the Tibetan Plateau: Is lower crustal flow necessary?, Tectonics, 31, TC3011, https://doi.org/10.1029/2011TC003066, 2012.
Lei, J.: Research on activity of the West Helanshan fault, M.S. thesis, The Institute of Crustal Dynamics, China Eearthquake Administration, Beijing, M.S. thesis, 2015.
Lei, Q.: The extension of the Arc Tectonic Belt in the Northeastern margin of the Tibet Plateau and the evolution of the Yinchuan Basin in the western margin of the North China, PH.D thesis, Institute of Geology, China Earthquake Administration, Beijing, PH.D. thesis, 2016.
Lei, Q., Chai, C., Meng, G., Du, P., Wang, Y., Xie, X., and Zhang, X.: Composite drilling section exploration of Yinchuan buried fault, Seismol. Geol., 30, 250–263, 2008.
Lei, Q., Chai, C., Du, P., Wang, Y., and Meng G.: Activity characteristics of Luhuatai buried fault since late quaternary revealed by drilling, Seismol. Geol., 33, 602–614, https://doi.org/10.3969/j.issn.0253-4967.2011.03.010, 2011.
Lei, Q., Chai, C., Zheng, W., Du, P., Xie, X., Wang, Y., Cui, J., and Meng, G.: Activity and slip rate of the northern section of Yellow River fault revealed by drilling, Seismol. Geol., 36, 464–477, https://doi.org/10.3969/j.issn.0253-4967.2014.02.015, 2014.
Lei, Q., Zhang, P., Zheng, W., Chai, C., Wang, W., Du, P., and Yu, J.: Dextral strike-slip of Sanguankou-Niushoushan fault zone and extension of arc tectonic belt in the northeastern margin of the Tibet Plateau, Sci. China Earth Sci., 59, 1025–1040, https://doi.org/10.1007/s11430-016-5272-1, 2016.
Li, C.: Quantitative studies on major active fault zones in Northeastern Qinghai-Tibet Plateau, PH.D. thesis, Institute of Geology, China Earthquake Administration, Beijing, PH.D. thesis, 2005.
Li, C.: The long-term faulting behavior of the eastern segment (Maqin-Maqu) of the east Kunlun fault since the late quaternary, PH.D. thesis, China Earthquake Administration, Beijing, PH.D. thesis, 2009.
Li, C., Zhang, P., Yin, J., and Min, W.: Late Quaternary left-lateral slip rate of the Haiyuan fault, northeastern margin of the Tibetan Plateau, Tectonics, 28, TC5010, https://doi.org/10.1029/2008TC002302, 2009.
Li, H., Xue, L., Brodsky, E. E., Mori, J. J., Fulton, P. M., Wang, H., Kano, Y., Yun, K., Harris, R. N., Gong, Z., Li, C., Si, J., Sun, Z., Pei, J., Zheng, Y., and Xu, Z.: Long-term temperature records following the Mw 7.9 Wenchuan (China) earthquake are consistent with low friction, Geology, 43, 163–166, https://doi.org/10.1130/G35515.1, 2015.
Li, J., Cai, Y., and Zhang, J.: Geometric structure and slip gradient model of the Tazang fault in the east Kunlun fault zone, Earthquake, 39, 20–28, 2019.
Li, L., Li, X., Li, M., Liang, Z., Tian, J., Zeng, Z., Zeng, X, Yan, G., Lu, M., Yang, F., and Tan, Z.: Spatial variability of modern tectonic stress fields in the north-eastern margin of Tibetan Plateau, Geol. J., 55, 7167–7192, https://doi.org/10.1002/gj.3818, 2020.
Li, X., Li, C., Wesnousky, S. G., Zhang, P., Zheng, W., Pierce, I. K. D., and Wang, X.: Paleoseismology and slip rate of the western Tianjingshan fault of NE Tibet, China, J. Asian Earth Sci., 146, 304–316, https://doi.org/10.1016/j.jseaes.2017.04.031, 2017.
Li, X., Zhang, P., Zheng, W., Feng, X., Li, C., Pierce, I. K. D., Xu, H., Li, X., Ai, M., Chen, G., Dong, J., Liu, J., and Ren, G.: Kinematics of late quaternary slip along the Qishan-Mazhao fault: implications for tectonic deformation on the southwestern Ordos, China, Tectonics, 37, 2983–3000, 2018.
Li, X., Li, C., Pierce, I. K. D., Zhang, P., Zheng, W., Dong, J., Chen, G., Ai, M., Ren, G., and Luo, Q.: New slip rates for the Tianjingshan fault using optically stimulated luminescence, GPS, and paleoseismic data, NE Tibet, China. Tectonophysics, 755, 64–74, https://doi.org/10.1016/j.tecto.2019.02.007, 2019.
Li, X., Pierce, I. K. D., Bormann, J. M., Hammond, W. C., Zhang, Z., Li, C., Zheng, W., and Zhang, P.: Tectonic deformation of the Northeastern Tibetan Plateau and its surroundings revealed with GPS block modeling, J. Geophys. Res.-Sol. Ea., 126, e2020JB020733, https://doi.org/10.1029/2020JB020733, 2021a.
Li, X., Hergert, T., Henk, A., and Zeng, Z.: Contemporary kinematics in the eastern Tibetan Plateau: Insights from 3D geomechanical modeling, Tectonophysics, 819, 229109, https://doi.org/10.1016/j.tecto.2021.229109, 2021b.
Li, X., Hergert, T., Henk, A., and Zeng, Z.: Contemporary background stress field in the eastern Tibetan Plateau: Insights from 3D geomechanical modeling, Tectonophysics, 822, 229177, https://doi.org/10.1016/j.tecto.2021.229177, 2022.
Li, Y., Ran, R., Wang, H., and Wu, F.: Paleoseismic records of large earthquakes on the cross-basin fault in the salt lake pull-apart basin and cascade rupture events on the Haiyuan fault, Seismol. Geol., 38, 830–843, https://doi.org/10.3969/j.issn.0253-4967.2016.04.003, 2016.
Li, Y., Shan, X., Qu, C., Zhang, Y., Song, X., Jiang, Y., Zhang, G., Nocquet, J. M., Gong, W., Gan, W., and Wang, C.: Elastic block and strain modeling of GPS data around the Haiyuan-Liupanshan fault, northeastern Tibetan Plateau, J. Asian Earth Sci., 150, 87–97, https://doi.org/10.1016/j.jseaes.2017.10.010, 2017.
Li, Y., Nocquet, J. M., Shan, X., and Song, X.: Geodetic observations of shallow creep on the Laohushan-Haiyuan Fault, Northeastern Tibet, J. Geophys. Res.-Sol. Ea., 126, e2020JB021576, https://doi.org/10.1029/2020JB021576, 2021.
Li, Y., Nocquet, J. M., and Shan, X.: Crustal deformation across the western Altyn Tagh fault (86∘ E) from GPS and InSAR, Geophys. J. Int., 228, 1361–1372, https://doi.org/10.1093/gji/ggab403, 2022.
Liang, M., Yuan, D., Liu, B., and Lei, Z.: Seismic risk estimates for the Maxianshan north-margin fault, NW Seismol. J., 30, 337–343, https://doi.org/10.3969/j.issn.1000-0844.2008.04.006, 2008.
Liu, B., Feng, S., Ji, J., Wang, S., Zhang, J., Yuan, H., and Yang, G.: Lithospheric structure and faulting characteristics of the Helan Mountains and Yinchuan Basin: Results of deep seismic reflection profiling, Sci. China Earth Sci., 60, 589–601, https://doi.org/10.1007/s11430-016-5069-4, 2017.
Liu, J., Ren, Z., Zhang, H., Li, C., Zhang, Z., Zheng, W., Li, X., and Liu, C.: Late quaternary slip rate of the Laohushan fault within the Haiyuan fault zone and its tectonic implications, Chinese J. Geophys. Ch., 61, 1281–1297, https://doi.org/10.6038/cjg2018L0364, 2018.
Liu, X., Yuan, D., Shao, Y., and Wu, Z.: Characteristics of late quaternary tectonic activity in the middle-eastern segment of the southern branch of Diebu-Bailongjiang fault, Gansu, J. Earth Sci. Environ., 37, 111–119, https://doi.org/10.3969/j.issn.1672-6561.2015.06.010, 2015.
Liu, Z., Tian, X., Gao, R., Wang, G., Wu, Z., Zhou, B., Tan, P., Nie, S., Yu, G., Zhu, G., and Xu, X.: New images of the crustal structure beneath eastern Tibet fromahigh-density seismic array, Earth Planet Sc. Lett., 480, 33–41, https://doi.org/10.1016/j.epsl.2017.09.048, 2017.
Liu-Zeng, J., Shao, Y., Klinger, Y., Xie, K., Yuan, D., and Lei, Z.: Variability in magnitude of paleoearthquakes revealed by trenching and historical records, along the Haiyuan Fault, China, J. Geophys. Res.-Sol. Ea., 120, 8304–8333, https://doi.org/10.1002/2015JB012163, 2015.
Ma, X., Yin, G., Wei, C., Qiang, X., Ma, Y., Liu, C., Zhao, Z., Gong, L., Wang, L., Ji, H., Bai, M., Mao, J., and Li, G.: High-resolution late Pliocene-quaternary magnetostratigraphy of the Yinchuan Basin, NE Tibetan Plateau, Quaternary Int., 607, 120–127, https://doi.org/10.1016/j.quaint.2021.09.009, 2021.
Matrau, R., Klinger, Y., Van der Woerd, J., Liu-Zeng, J., Li, Z., Xu, X., and Zheng, R.: Late Pleistocene-Holocene Slip Rate Along the Hasi Shan Restraining Bend of the Haiyuan Fault: Implication for Faulting Dynamics of a Complex Fault System, Tectonics, 38, 4127–4154, https://doi.org/10.1029/2019TC005488, 2019.
Meade, B. J. and Loveless, J. P.: Block modeling with connected fault-network geometries and a linear elastic coupling estimator in spherical coordinates, B. Seismol. Soc. Am., 99, 3124–3139, https://doi.org/10.1785/0120090088, 2009.
Meng, X., Shi, L., Guo, L., Tong, T., and Zhang, S.: Multi-scale analyses of transverse structures based on gravity anomalies in the northeastern margin of the Tibetan Plateau, Chinese J. Geophys., 55, 3933–3941, https://doi.org/10.6038/j.issn.0001-5733.2012.12.006, 2012.
Min, W., Jiao, D., Chai, C., Zhang, P., and Mao, F.: Characteristics of the active Luoshan Fault since Late Pleistocene, North Central China, Ann. Geophys., 46, 997–1013, https://doi.org/10.4401/ag-3442, 2003.
Pang, Y., Cheng, H., Zhang, H., and Shi, Y.: Numerical analysis of the influence of lithospheric structure on surface vertical movements in Eastern Tibet, Chinese J. Geophys. Ch., 62, 1256–1267, https://doi.org/10.6038/cjg2019M0555, 2019a
Pang, Y., Yang, S., Li, H., Cheng, H., and Shi, Y.: Numerical modeling of current crustal stress state in Haiyuan-Liupanshan fault system of NE Tibet, Acta Petrol. Sin., 35, 1848–1856, https://doi.org/10.18654/1000-0569/2019.06.13, 2019b.
Patriat, P. and Achache, J.: India-Eurasia collision chronology has implications for crustal shortening and driving mechanism of plates, Nature, 311, 615–621, https://doi.org/10.1038/311615a0, 1984.
Purcaru, G. and Berckhemer, H.: A magnitude scale for very large earthquakes, Tectonophysics, 49, 189–198, https://doi.org/10.1016/0040-1951(78)90177-4, 1978.
Rajabi, M., Heidbach, O., Tingay, M., and Reiter, K.: Prediction of the present-day stress field in the Australian continental crust using 3D geomechanical-numerical models, Aust. J. Earth Sci., 64, 435–454, https://doi.org/10.1080/08120099.2017.1294109, 2017.
Reiter, K. and Heidbach, O.: 3-D geomechanical–numerical model of the contemporary crustal stress state in the Alberta Basin (Canada), Solid Earth, 5, 1123–1149, https://doi.org/10.5194/se-5-1123-2014, 2014.
Ren, J., Xu, X., Yeats, R. S., and Zhang, S.: Millennial slip rates of the Tazang fault, the eastern termination of Kunlun fault: Implications for strain partitioning in eastern Tibet, Tectonophysics, 608, 1180–1200, https://doi.org/10.1016/j.tecto.2013.06.026, 2013.
Royden, L. H., Burchfiel, B. C., King, R. W., Wang, E., Chen, Z., Shen, F., and Liu, Y.: Surface Deformation and Lower Crustal Flow in Eastern Tibet, Science, 276, 788–790, https://doi.org/10.1126/science.276.5313.788, 1997.
Shen, Z., Sun, J., Zhang, P., Wan, Y., Wang, M., Bürgmann, R., Zeng, Y., Gan, W., Liao, H., and Wang, Q.: Slip maxima at fault junctions and rupturing of barriers during the 2008 Wenchuan earthquake, Nat. Geosci., 2, 718–724, https://doi.org/10.1038/ngeo636, 2009.
Sheorey, P. R.: A Theory for In Situ Stresses in Isotropic and Transversely Isotropic Rock, Int. J. Rock Mech. Min., 31, 23–34, 1994.
Shi, Z., Yuan, D., Li, T., Geng, S., Lei, Z., Liu, X., He, W., and Jin, Q.: Textual research of A.D. 600 Qin-Long earthquake and discussion on its seismogenic structure, Sci. Technol. Rev., 31, 48–52, https://doi.org/10.3981/j.issn.1000-7857.2013.12.008, 2013.
Shi, Z., Li, Y., Yuan, D., Liu, X., Ding, X., and Geng, S.: The recent active time of the south segment of the eastern Liupanshan piedmont fault: constraints from the characteristics of rhythmic deposits in the fault grooves, Acta Geosci. Sin., 35, 31–37, https://doi.org/10.3975/cagsb.2014.01.05, 2014.
Song, F., Yuan, D., Chen, G., Cheng, J., Zhang, L., He, W., Ge, W., Su, H., and Lu, B.: Geometric structures and recent activity along the northwest segment of north marginal fault of Maxianshan mountains, Gansu province, Seismol. Geol., 28, 547–560, https://doi.org/10.3969/j.issn.0253-4967.2006.04.003, 2006.
Stromeyer, D., Heidbach, O., and Ziegler, M.: Tecplot 360 Add-on GeoStress v2.0. V. 2.0. GFZ Data Services, https://doi.org/10.5880/wsm.2020.001, 2020.
Sun, Y. and Luo, G.: Spatial-temporal migration of earthquakes in the northeastern Tibetan Plateau: insights from a finite element model, Chinese J. Geophys. Ch., 61, 2246–2264, https://doi.org/10.6038/cjg2018L0401, 2018.
Sun, Y., Luo, G., Yin, L., and Shi, Y.: Migration probability of big earthquakes and segmentation of slip rates on the fault system in northeastern Tibetan Plateau, Chinese J. Geophys. Ch., 62, 1663–1679, 2019.
Tapponnier, P., Peltzer, G., Le Dain, A. Y., Armijo, R., and Cobbold, P.: Propagating extrusion tectonics in Asia: new insights from simple experiments with plasticine, Geology, 10, 611–616, https://doi.org/10.1130/0091-7613(1982)10<611:PETIAN>2.0.CO;2, 1982.
Tian, J., Li, M., Liang, Z., Li, L., Yan, G., Lu, M., and Tan, Z.: Tectonic evolution of the Qingshuihe Basin since the Late Miocene: Relationship with north-eastward expansion of the Tibetan Plateau, Geol. J., 55, 7148–7166, https://doi.org/10.1002/gj.3650, 2020.
Wang, C., Flesch, L. M., Silver, P. G., Chang, L., and Chan, W. W.: Evidence for mechanically coupled lithosphere in central Asia and resulting implications, Geology, 36, 363–366, https://doi.org/10.1130/G24450A.1, 2008.
Wang, K.: On the strength of subduction megathrusts, Chinese J. Geophys., 64, 3452–3465, https://doi.org/10.6038/cjg2021P0515, 2021.
Wang, M. and Shen, Z.: Present-Day Crustal Deformation of Continental China Derived From GPS and Its Tectonic Implications, J. Geophys. Res.-Sol. Ea., 125, e2019JB018774, https://doi.org/10.1029/2019JB018774, 2020.
Wang, S.: Tectonic deformation in late Cenozoic of Liupanshan-Baoji fault zone in the NE margin of Tibet Plateau, PH.D thesis, Northwest University, Xi'an, PH.D. thesis, 2018.
Wang, S., Liu, B., Tian, X., Liu, B., Song, X., Deng, X., Sun, Y., Ma, C., and Yang, Y.: Crustal P-wave velocity structure in the northeastern margin of the Qinghai-Tibetan Plateau and insights into crustal deformation, Sci. China Earth Sci., 61, 1221–1237, https://doi.org/10.1007/s11430-017-9227-7, 2018.
Wang, S., Shi, Y., Feng, X., and Tian, Z.: Late Quaternary sinistral strike-slipping of the Liupanshan-Baoji fault zone: Implications for the growth of the northeastern Tibetan Plateau, Geomorphology, 380, 107628, https://doi.org/10.1016/j.geomorph.2021.107628, 2021.
Wang, W., Zhang, P., Kirby, E., Wang, L., Zhang, G., Zheng, D., and Chai, C.: A revised chronology for Tertiary sedimentation in the Sikouzi basin: Implications for the tectonic evolution of the northeastern corner of the Tibetan Plateau, Tectonophysics, 505, 100–114, https://doi.org/10.1016/j.tecto.2011.04.006, 2011.
Wang, W., Zhang, P., and Lei, Q.: Deformational characteristics of the Niushoushan-Luoshan fault zone and its tectonic implications, Seismol. Geol., 35, 195–207, https://doi.org/10.3969/j.issn.0253-4967.2013.02.001, 2013.
Wang, W., Qiao, X., Yang, S., and Wang, D.: Present-day velocity field and block kinematics of Tibetan Plateau from GPS measurements, Geophys. J. Int., 208, 1088–1102, https://doi.org/10.1093/gji/ggw445, 2017.
Wang, Y. and Liu, B.: Analysis on seismic risk for faults in the mid-eastern Qilianshan area, NW Seismol. J., 23, 19–27, https://doi.org/10.3969/j.issn.1000-0844.2001.04.003, 2001.
Wu, G., Tan, H., Sun, K., Wang, J., Xi, Y., and Shen, C.: Characteristics and tectonic significance of gravity anomalies in the Helanshan-Yinchuan Graben and adjacent areas, Chinese J. Geophys., 63, 1002–1013, https://doi.org/10.6038/cjg2020N0233, 2020.
Xiao, J. and He, J.: 3D Finite-Element Modeling of Earthquake Interaction and Stress Accumulation on Main Active Faults around the Northeastern Tibetan Plateau Edge in the Past ∼ 100 Years, B. Seismol. Soc. Am., 105, 2724–2735, https://doi.org/10.1785/0120140342, 2015.
Xu, H., Wang, H., and Cao, J.: Slip rates of the major faults in the northeastern Tibetan Plateau and their geodynamic implications, Earthquake, 38, 13–23, 2018.
Xu, X., Han, Z., Yang, X., Zhang, S., Yu, G., Zhou, B., Li, F., Ma, B., Chen, G., and Ran, R.: Seismotectonic Map in China and its Adjacent Regions, Seismological Press [data set], Beijing, https://www.activefault-datacenter.cn/map (last access: 25 August2022), 2016.
Yang, W., Zeng, Z., Li, D., Xing, J., Wang, J., and Luo, W.: Three-level tectonic model for intraplate earthquakes, Earth Sci. Front., 16, 206–217, ISBN 9787502846411, 2009.
Yang, X.: The study of the deformation characteristic of the Helanshan Tectonic Belts, PH.D thesis, Northwest University, Xi'an, PH.D. thesis, 2018.
Ye, Z., Gao, R., Li, Q., Zhang, H., Shen, X., Liu, X., and Gong, C.: Seismic evidence for the North China plate underthrusting beneath northeastern Tibet and its implications for plateau growth, Earth Planet. Sc. Lett., 426, 109–117, https://doi.org/10.1016/j.epsl.2015.06.024, 2015.
Ye, Z., Li, Q., Gao, R., Zhang, H., Shen, X., Liu, X., and Gong, C.: Anisotropic regime across northeastern Tibet and its geodynamic implications, Tectonophysics, 671, 1–8, https://doi.org/10.1016/j.tecto.2016.01.011, 2016.
Yuan, D., Liu, B., Cai, S., Liu, X., and Wang, Y.: Principal features of recent activity of the active northern marginal fault zone of Maxianshan mountains, Lanzhou, Gansu province, Seismol. Geol., 24, 315–323, https://doi.org/10.3969/j.issn.0253-4967.2002.03.003, 2002a.
Yuan, D., Liu, B., Zhang, P., Liu, X., Cai, S., and Liu, X.: The neotectonic deformation and earthquake activity in Zhuanglang river active fault zone of Lanzhou, Acta Seismol. Sin., 24, 441–444, 2002b.
Yuan, D., Liu, X., Zheng, W., Liu, X., and Liu, B.: Tectonic deformation feature and mechanism of the Maxianshan-Xinglongshan active fault system in the Lanzhou area, Earth. Res. China, 19, 125–131, 2003.
Yuan, D., Zhang, P., Lei, Z., Liu, B., and Liu, X.: A preliminary study on the new activity features of the Lajishan mountain fault zone in Qinghai province, Earth. Res. China, 21, 93–102, 2005.
Yuan, D., Lei, Z., He, W., Xiong, Z., Ge, W., Liu, X., and Liu, B.: Textual research of Wudu earthquake in 186 B.C. in Gansu Province, China and discussion on its causative structure, Acta Seismol. Sin., 20, 696–707, 2007.
Zeng, Z., Chen, Z., Lu, C., Yang, Y., Chen, K., Xiang, S., Dai, Q., Zhang, J., Deng, Y., Fu, Y., Du, Q., Liu, L., and Yang, W.: Earth system science research on earthquake mechanisms: Theory and validation of a new model, Earth Sci. Front., 28, 263–282, https://doi.org/10.13745/j.esf.sf.2021.9.5, 2021.
Zhan, Y., Zhao, G., Wang, J., Tang, J., Chen, X., Deng, Q., Xuan, F., and Zhao, J.: Crustal electric structure of Haiyuan arcuate tectonic region in the northeastern margin of Qinghai-Xizang Plateau, China, Acta Seismol. Sini., 27, 431–440, 2005.
Zhang, P.: Late quaternary tectonic deformation and earthquake hazard in continental China, Quaternary Sci., 19, 404–413, https://doi.org/10.1088/0256-307X/15/11/025, 1999.
Zhang, P., Molnar, P., Burchfiel, B. C., Royden, L., Wang, Y., Deng, Q., Song, F., Zhang, W., and Jiao, D.: Bounds on the Holocene slip rate of the Haiyuan fault, North-Central China, Quaternary Res., 30, 151–164, https://doi.org/10.1016/0033-5894(88)90020-8, 1988.
Zhang, P., Deng, Q., Zhang, G., Ma, J., Gan, W., Min, W., Mao, F., and Wang, Q.: Active tectonic blocks and strong earthquakes in the continent of China, Sci. China Ser. D, 46, 13–24, 2003.
Zhang, P., Shen, Z., Wang, M., Gan, W., Bürgmann, R., Molnar, P., Wang, Q., Niu, Z., Sun, J., Wu, J., Sun, H., and You, X.: Continuous deformation of the Tibetan Plateau from global positioning system data, Geology, 32, 809–812, https://doi.org/10.1130/G20554.1, 2004.
Zhang, P., Deng, Q., Zhang, Z., and Li, H.: Active faults, earthquake hazards and associated geodynamic processes in continental China, Sci. Sin. Terr., 43, 1607–1620, 2013.
Zhang, P., Zhang, H., Zheng, W., Zheng, D., Wang, W., and Zhang, Z.: Cenozoic tectonic evolution of continental eastern Asia, Seismol. Geol., 36, 574–585, https://doi.org/10.3969/j.issn.0253-4967.2014.03.003, 2014.
Zhang, W., Jiao, D., Zhang, P. Molnar, P., Burchfield, B. C., Deng, Q., Wang, Y., and Song, F.: Displacement along the Haiyuan fault associated with the great 1920 Haiyuan, China, earthquake, B. Seismol. Soc. Am., 77, 117–131, 1987.
Zhang, W., Jiao, D., and Chai, C.: The Tianjingshan active fault zone, Seismological Press, Beijing, ISBN 9787502845735, 2015.
Zhang, Z., McCaffrey, R., and Zhang, P.: Relative motion across the eastern Tibetan plateau: Contributions from faulting, internal strain and rotation rates, Tectonophysics, 584, 240–256, https://doi.org/10.1016/j.tecto.2012.08.006, 2013.
Zhao, L., Zhan, Y., Chen, X., Yang, H., and Jiang, F.: Deep electrical structure of the central West Qinling orogenic belt and blocks on its either side, Chinese J. Geophys., 58, 2460–2472, https://doi.org/10.6038/cjg20150722, 2015.
Zheng, W., Liu, X., Yu, J., Yuan, D., Zhang, P., Ge, W., Pang, J., and Liu, B.: Geometry and late Pleistocene slip rates of the Liangdang-Jiangluo fault in the western Qinling mountains, NW China, Tectonophysics, 687, 1–13, https://doi.org/10.1016/j.tecto.2016.08.021, 2016a.
Zheng, W., Yuan, D., Zhang, P., Yu, J., Lei, Q., Wang, W., Zheng, D., Zhang, H., Li, X., Li, C., and Liu, X.: Tectonic geometry and kinematic dissipation of the active faults in the northeastern Tibetan Plateau and their implications for understanding northeastward growth of the plateau, Quaternary Sci., 36, 775–788, https://doi.org/10.11928/j.issn.1001-7410.2016.04.01, 2016b.
Zhou, B., Peng, J., and Zhang, J.: Development and distribution patterns of active fault zones in Qinghai province, J. Eng. Geol., 17, 612–618, 2009.
Zhu, A., Zhang, D., and Jiang, C.: Numerical simulation of the segmentation of the stress state of the Anninghe-Zemuhe-Xiaojiang faults, Sci. China Earth Sci., 59, 384–396, https://doi.org/10.1007/s11430-015-5157-8, 2016.
Zhu, A., Zhang, D., Zhu, T., and Guo, Y.: Influence of mantle convection to the crustal movement pattern in the northeastern margin of the Tibetan Plateau based on numerical simulation, Sci. China Earth Sci., 61, 1644–1658, https://doi.org/10.1007/s11430-017-9236-7, 2018.
Zhu, S. and Zhang, P.: A study on the dynamical mechanisms of the Wenchuan MS 8.0 earthquake, 2008, Chinese J. Geophys., 52, 418–427, 2009.