the Creative Commons Attribution 4.0 License.
the Creative Commons Attribution 4.0 License.
 | 02 Feb 2022
Application of lithogeochemical and pyrite trace element data for the determination of vectors to ore in the Raja Au–Co prospect, northern Finland
Sara Raič
Ferenc Molnár
Nick Cook
Hugh O'Brien
Yann Lahaye
Discovering ore deposits is becoming increasingly difficult, and this is particularly true in areas of glaciated terrains. As a potential exploration tool for such terrains, we test the vectoring capacities of trace element and sulfur isotope characteristics of pyrite, combined with quantitative statistical methods of whole-rock geochemical datasets. Our target is the Rajapalot gold–cobalt project in northern Finland, where metamorphosed Paleoproterozoic volcanic and sedimentary rocks of the Peräpohja belt host recently discovered gold prospects, which also have significant cobalt enrichment. The focus is particularly put on a single gold–cobalt prospect, known as Raja, an excellent example of this unusual cobalt-enriched gold deposit, common in the metamorphosed terranes of northern Finland. The major lithologies at Rajapalot comprise amphibolite facies metamorphosed and polydeformed calcsilicate rocks that alternate with albitic units, mafic volcanic rocks, mica schist and quartzite. Mineralization at Rajapalot prospects is characterized by an older Co-mineralizing event and a younger high-grade Au mineralization with re-mobilization and re-deposition of Co. Detailed in situ laser ablation inductively coupled plasma mass spectrometry (LA-ICP-MS) is a powerful technique that produces robust trace element and sulfur isotope databases from paragenetically and texturally well-characterized pyrite from the Raja prospect. The results are treated with appropriate log-ratio transformations and used for multivariate statistical data analysis, such as the computation of principal components. Application of these methods revealed that elements such as Co, Ni, Cu, Au, As, Ag, Mo, Bi, Te, Se, Sn, U, Tl and W have high vectoring capacities to discriminate between Co-only and Au–Co zones, as well as between mineralization stages. The systematic pyrite study suggests that homogenous sulfur isotopic characteristics (+1.3 ‰ to +5.9 ‰) and positive loadings of Co, Se, As, Te, Bi and Au onto PC1 are reflective of an early stage of Co mineralization, while the opposing negative loadings of Mo, Ni, W, Tl, Cu and Ag along PC1 are associated with pyrites from the Au-mineralizing event. The sulfur isotopic signature of the latter pyrite type is between −1.2 ‰ and +7.4 ‰. Subtle patterns recognized from the whole-rock geochemistry favor an As–Au–Se–Te–W–U signature along the positive axis of PC1 for the localization of high-grade Au–Co zones, whereas the element group Ni, Cu, Co, Te, Se and As, which has negative loadings onto PC2, will predict Co-only zones.
This study shows the efficiency of trace element geochemistry in mineral exploration targeting, which has the capacity to define future targets by characterizing the metallogenic potential of a host rock, as well as distinguishing various stages of mineralization.
- Article
(17014 KB) - Full-text XML
- BibTeX
- EndNote


Orogenic gold deposits in Paleoproterozoic belts in northern Finland are attractive exploration targets. Some have been explored not only for gold but because of the occurrences of economically important concentrations of base metals, especially cobalt. The latter style of epigenetic–hydrothermal gold deposits of metamorphic terranes are classified as “orogenic gold deposits with atypical metal associations” (Goldfarb et al., 2001; Eilu, 2015). An example of this kind of gold mineralization has recently been discovered in the Paleoproterozoic Peräpohja belt, within the Rajapalot project area owned by the Mawson Gold Ltd (centered at coordinates 408750.412294E by 7369184.18986N of the EUREF_FIN_TM35FIN coordinate system). Seven prospects make up the broader Rajapalot Au–Co project, and this study focuses on a single prospect, Raja. Similar Co-rich orogenic gold deposits also occur in the Central Lapland belt and in the Kuusamo belt in northern Finland, and some of them are also undergoing active mineral exploration. Therefore, better knowledge of formation conditions of this specific type of deposits, and, especially, establishment of geochemical vectors towards ore, supports the recognition of occurrences of these ores in greenfield exploration projects, as well as the recognition of new mineralized zones in already known deposits.
The orogenic gold deposits in northern Finland are characterized by intense hydrothermal alteration that is associated with the occurrence of significant amounts of sulfides. The main sulfides are pyrrhotite, pyrite, chalcopyrite and pentlandite, along with other minerals including cobaltite, arsenopyrite and ± uraninite. All of these minerals can concentrate trace elements in their crystal structure, which can be used to understand the controls on the partitioning behavior of elements, the stages of mineralization, as well as overprinting features and the characteristics of ore-forming fluids (Godel et al., 2007; Dare et al., 2012; Piña et al., 2013; King et al., 2014; Duran et al., 2015; Cook et al., 2016; Keith et al., 2018). Trace element distribution patterns of those sulfide minerals not only provide a proxy for ore-forming conditions but are becoming increasingly important as vectors to ore (Keith et al., 2018). Significant improvements in trace element analytical techniques by laser ablation inductively coupled plasma mass spectrometry (LA-ICP-MS) allow time and cost-effective in situ analysis of precious and base metals with low detection limits in various minerals including sulfides. Therefore, this method can be a routine tool even in the early stages of mineral exploration projects. In that regard, pyrite is particularly suitable for this type of analysis, considering its capability of hosting a variety of elements of economic interest (Au, Ag, Bi, Co, Cu, Mo, Ni, Sb, Se and Te) and its compositional adaption to changes in the physicochemical fluid parameters (Liu et al., 2018; Large et al., 2009; Ulrich et al., 2011; Deditius et al., 2014; Keith et al., 2018; Liu et al., 2018). In addition to trace element analysis, sulfur isotope data are of significant assistance during exploratory work. The well-established sulfur isotope fractionation in pyrite improves our understanding of ore deposits and serves as a valuable and supplemental vectoring technique to the trace elemental and lithogeochemical approach (Ohomoto and Rye, 1979; Barker et al., 2009; Voute et al., 2019). Several authors have shown that a combination of aforementioned analytical techniques also highly support refining of genetic models of ore deposits (Barker et al., 2009; Hodkiewicz et al., 2009; Ulrich et al., 2011; Liu et al., 2018; Mukherjee et al., 2019; Voute et al., 2019; Meng et al., 2020; Vasilopoulos et al., 2021).
In this study we show how lithogeochemical compositions and a robust database of paired multi-element and sulfur isotope in situ analyses in pyrite by LA-ICP-MS can be used for the identification of ore-related alteration zones and for the development of vectors towards the ore. By applying computational intelligence on these compositional datasets, we were able to develop multi-element associations as new efficient variables for specific metal associations. In order to investigate and identify the hidden trends and clusters in our geochemical data, we used multivariate statistical techniques that aim for dimension reduction but still capture the essential variability in the original dataset (Aitchison, 1984). Following the suggestions of Aitchison (1986), Reimann et al. (2012, 2017) and Hron et al. (2020), we discuss the problems of a proper pre-processing of compositional data for appropriate multivariate statistical analysis and show how to avoid severe misinterpretations when performing principal component analysis.
The bedrock of Finland is defined by an Archean basement (3.5–2.5 Ga), its Paleoproterozoic sedimentary–volcanic cover (2.5–1.9 Ga) and the Svecofennian orogenic domain (1.93–1.8 Ga; Hanski, 2015; see Fig. 1a). Archean crustal segments are attributed to the Kola and Karelian cratons and are separated by the Lapland Granulite Belt and the Belomorian terrain (Fig. 1a; Lahtinen et al., 2005). Throughout the Paleoproterozoic tectonic evolution (2.5–1.9 Ga), the Archean cratons underwent several stages of intracontinental extension and rifting, as well as continental margin rifting, which resulted in the formation of deep-scale structures and shallow water basins (Lahtinen et al., 2005). The depositional history of these Karelian basins coincides with the Great Oxygenation Event, which created favorable conditions for a pre-concentrations of metals (e.g., Co, Cu, Ni, Mo and Au) in sulfidic sediments, as well as the deposition of carbonaceous material (Melezhik et al., 2013; Lyons et al., 2014; Large et al., 2014, 2015, 2017; Gregory et al., 2017; Johnson et al., 2017; Armstrong et al., 2018). Köykkä et al. (2019) proposed five basin evolution stages (see Fig. 1c) and summarized the volcano–sedimentary successions and intrusions with the following generalized lithostratigraphy (from bottom to top): (i) mafic volcanics and minor conglomerates; (ii) clastic sedimentary rocks; (iii) subaerial mafic volcanics, komatiites and carbonate rocks; (iv) greywackes, carbonaceous-bearing rocks and sulfur-rich pelitic rocks; and (v) phyllites and greywackes. All these units were then deformed and metamorphosed during the Svecofennian Orogeny (Lahtinen et al., 2005; Fig. 1c). Such a depositional and orogenic evolution of Archean to Paleoproterozoic settings is referred to worldwide as Paleoproterozoic greenstone belts. Within the northern part of the Karelian domain, the Svecofennian orogenic gold deposits were formed in the early stages of the accretion of microcontinents between 1.92 and 1.86 Ga, which resulted in the formation of the Fennoscandia Plate, and the far-field effect of the collision of Fennoscandia and Sarmatia in the SE (Svecobaltic orogeny) and Amazonia in the west (Nordic orogeny) between 1.85 and 1.79 Ga (Weihed et al., 2005; Lahtinen et al., 2005; Molnár et al., 2017, 2018). The gold mineralization is mainly located in complexly folded thrust zones and hosted near the boundary between the oxidized and reduced strata, which have experienced several stages of deformation and alteration (Hanski, 2015).
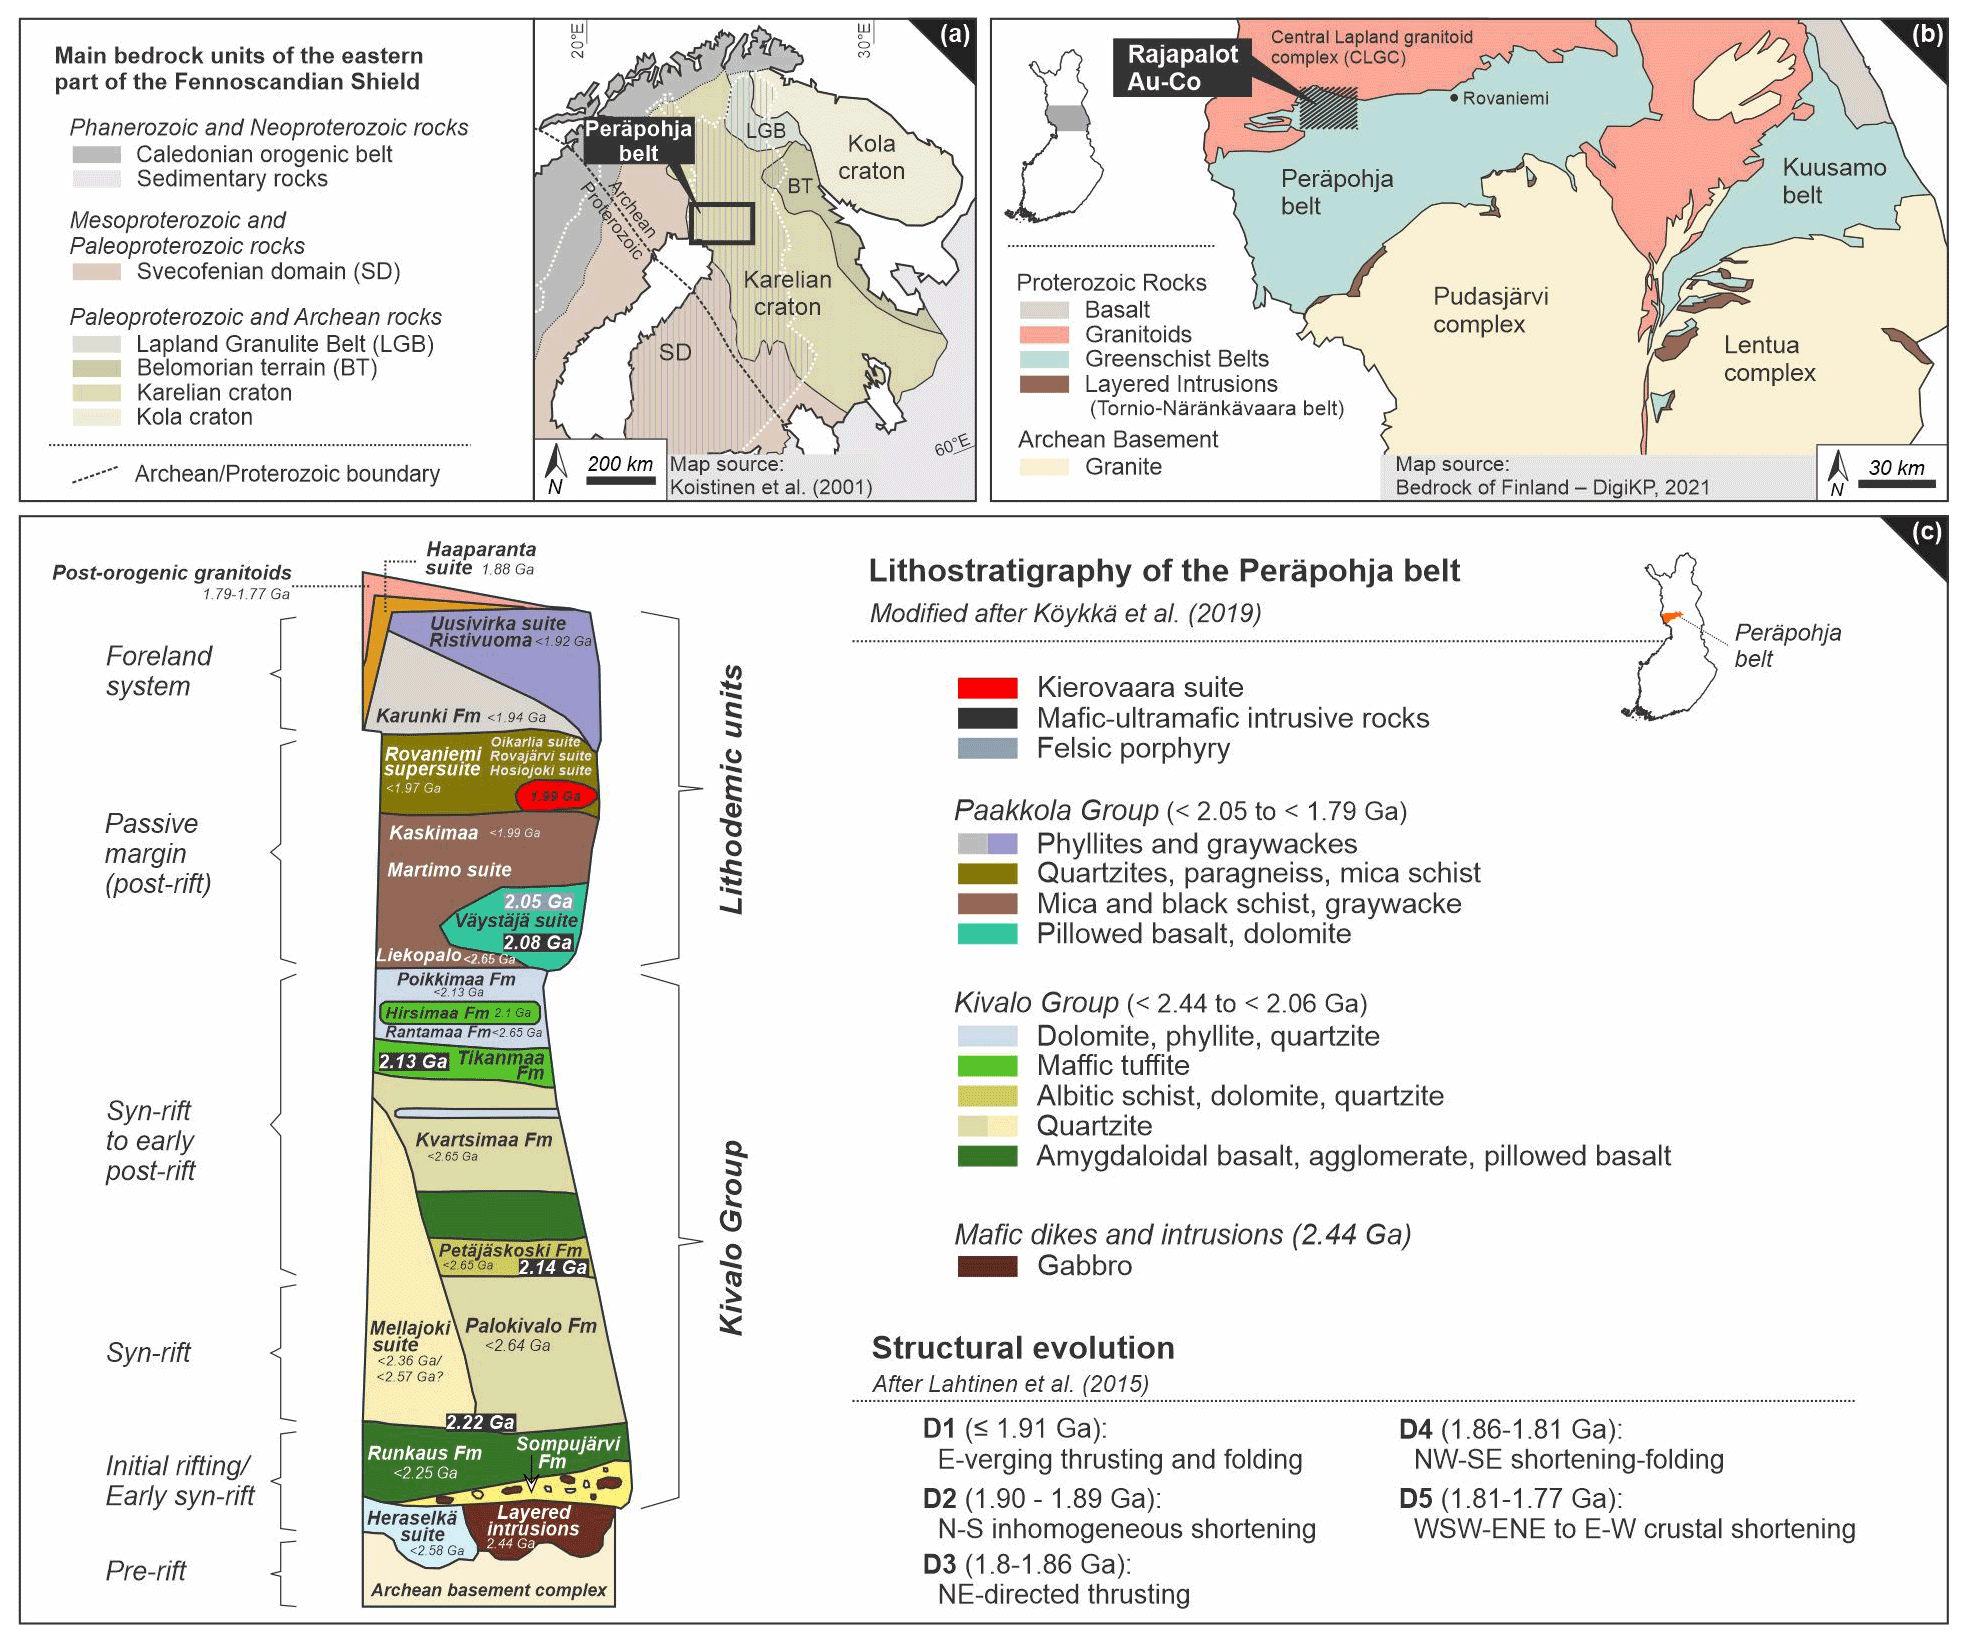
Figure 1(a) Geologic map of the main bedrock units of the eastern part of the Fennoscandian Shield and the Peräpohja belt as highlighted area (black rectangle). Simplified geological map is based on Koistinen et al. (2001). (b) Geologic map of northern Finland showing Archean and Proterozoic rocks. The Rajapalot Au–Co project is located within the shaded rectangle. Simplified map is modified from the Bedrock of Finland – DigiKP (2021; digital map database of the Geological Survey of Finland). (c) Lithostratigraphy and structural evolution of the Peräpohja belt modified after Köykkä et al. (2019) and Lahtinen et al. (2015), respectively.
One of these Paleoproterozoic rift-related basins is the Peräpohja belt (PB) in northern Finland, located between the Archean granitoid Pudasjärvi complex to the southeast and the Central Lapland granitoid complex (CLGC) to the north (Figs. 1b and 2a; Vanhanen et al., 2015; Nironen, 2017). The maximum depositional age for the PB is defined by the NE trending 2.44 Ga layered intrusions of the Torino-Näränkävaara belt (Iljina and Hanski, 2005), scattered along the northern boundaries of the Pudasjärvi and Lentua complexes (Fig. 1b; Ranta et al., 2015; Nironen, 2017). After emplacement, normal faulting of these intrusions led to partial erosion of igneous layers, onto which the lowermost and oldest units of the PB were deposited (Sompujärvi conglomerates and Runkaus volcanic sequence, Fig. 1c; Hanski et al., 2005; Nironen, 2017). In the western part of the belt, the youngest supracrustal metasediments are cut by 1879±3 Ma monzonite intrusions, which constrain the minimum age of the PB at 1.88 Ga (Lahtinen et al., 2015; Hanski et al., 2005; Ranta et al., 2015; Nironen, 2017).
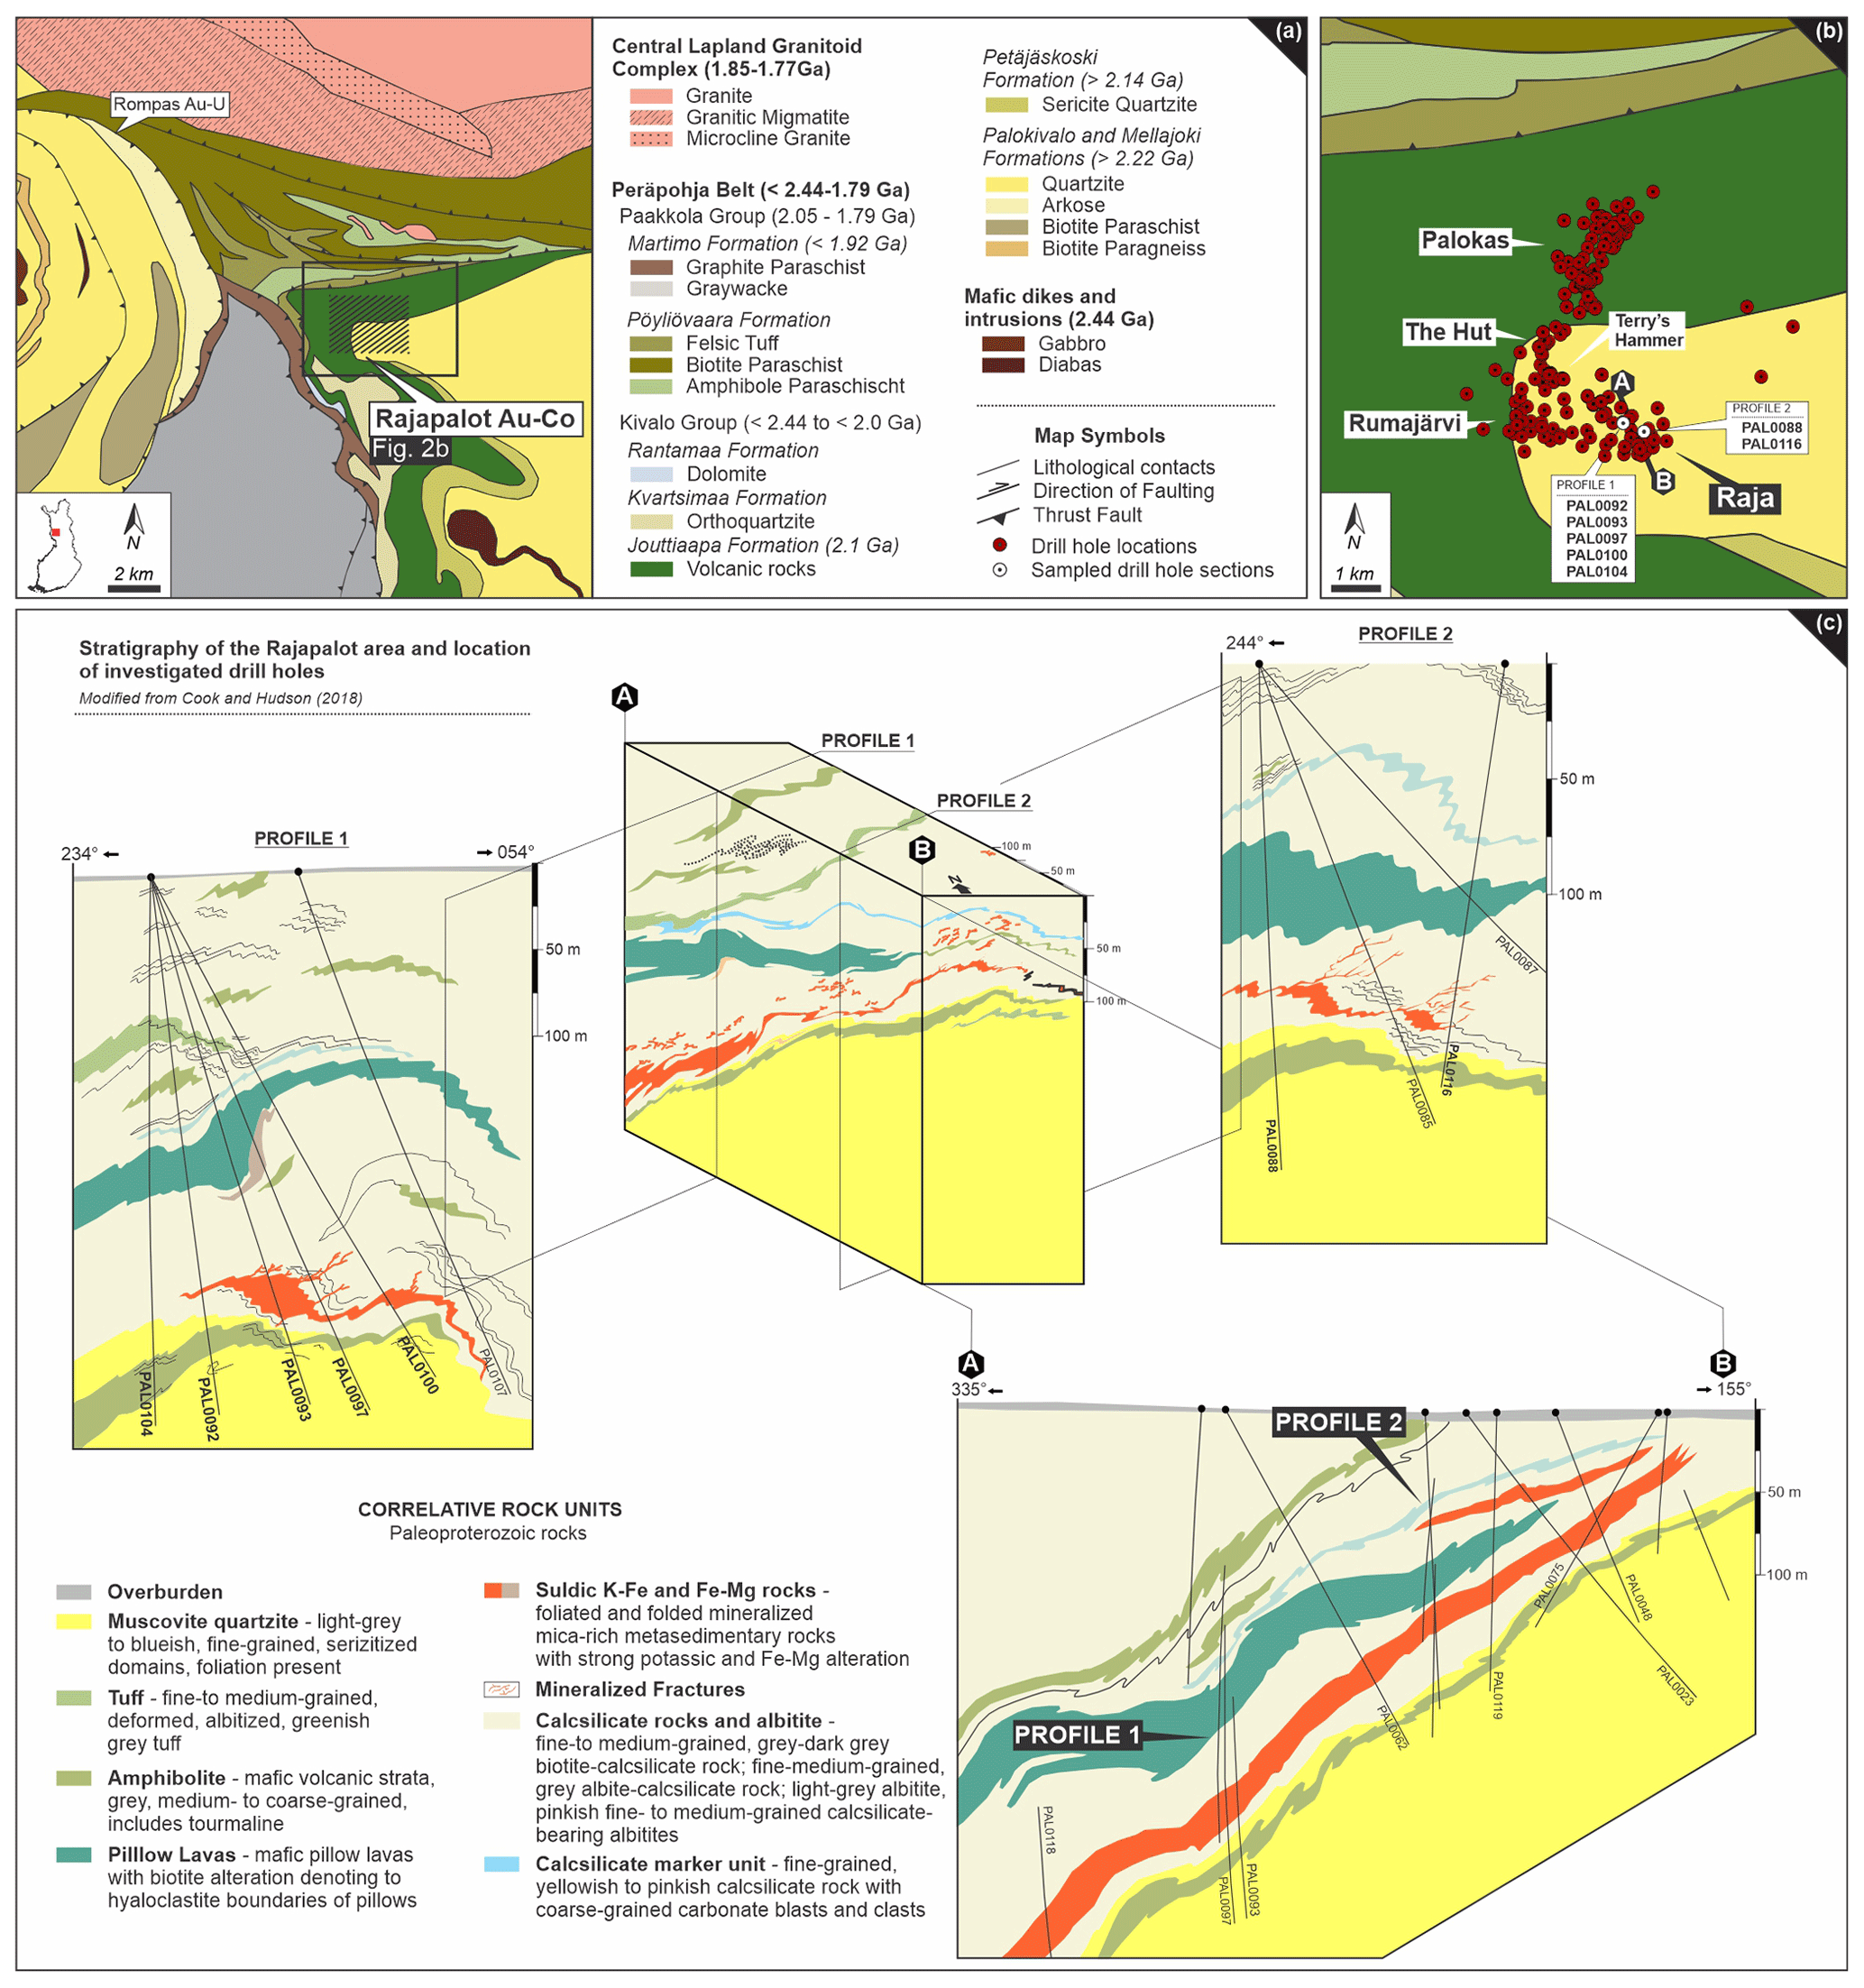
Figure 2(a) Detailed geologic map showing the location of the Rajapalot Au–Co area. (b) Drill hole location map of Rajapalot and its major prospects and location of investigated drill holes within the Raja area (indicated as white circles). Maps (a) and (b) are based on DigiKP, the digital map database of the Geological Survey of Finland. A–B cross section shown in (c). Block model of the corresponding A–B cross section from (b) showing the stratigraphy of the Raja prospect area and location of sampled drill holes included in profile 1 and profile 2. Corresponding NE–SW profiles from profile 1 and location of sampled drill holes: PAL0104, PAL0092, PAL0093, PAL0097 and PAL0100, as well as drill holes from profile 2 (PAL0088 and PAL0116). Block model and profile sections drawn by Jackson van den Hove (PGN Consulting) and are modified from Cook and Hudson (2018).
Following the classification of Perttunen et al. (1995), the Kivalo group and the Pakkola group are the two major lithostratigraphic units that characterize the supracrustal rocks of the PB (see Fig. 1c): (i) the base of the Kivalo group is defined by conglomerates (Sompujärvi Formation, 2.44 Ga), which are overlain by amygdaloidal basalts (Runkaus Formation, 2.25 Ga). Concordant mafic layered sills (2.22 Ga; Perttunen and Vaasjoki, 2001) cut the quartzites of the voluminous Palokivalo Formation, which is deposited on the Runkaus Formation (Ranta et al., 2015). Mica–albite schist and dolomite of the Petäjäskoski Formation are overlain by the 2.1 Ga continental flood basalts of the Jouttiaapa Formation (Huhma et al., 1990; Hölttä et al., 2007; Kyläkoski et al., 2012). Sericitic quartzites and dolomites of the Kvartsima Formation define the upper part of the Kivalo group, while the Tikanmaa, Poikkimaa, Hisimaa, Rantamaa and Lamulehto formations characterize intervening mafic tuffite, dolomite and phyllite (Ranta et al., 2015). (ii) Rocks of the Paakkola group comprise pillowed basalts (Väystäjä Formation, 2.05 Ga; Perttunen and Vaasjoki, 2001), mafic and felsic tuffs (Korkiavaara Formation, 1.97 Ga; Hanski et al., 2005), mica schists, black schists and metagreywackes (Martimo Formation; <1.92 Ga; Lahtinen et al., 2015).
The tectonic evolution of the PB is characterized by a polyphase deformation history (between ∼ 1.9 and 1.8 Ga) and increasing metamorphic conditions towards the northern parts from lower-greenschist to upper amphibolite facies and local migmatization along the northeastern marginal zone (Fig. 1c; Hanski et al., 2005; Lahtinen et al., 2005; Laajoki, 2005; Hölttä and Heilimo, 2017). A detailed description of the Svecofennian tectonic evolution of the PB and related emplacement periods of granitic intrusions is provided by Lahtinen et al. (2015) and Nironen (2017), where the authors discuss the five deformation stages that affected the PB in great detail (D1–D5; see Fig. 1c).
Several occurrences of gold mineralization are located within the northern domain of the PB near the contact with the Central Lapland Granitoid Complex (CLGC) and comprises a group of prospects, all owned by Mawson Gold Ltd. (Fig. 2a; Cook and Hudson, 2018). Intense exploration in this area started in the Rompas prospect where native gold-bearing pockets and veinlets were recognized in uraninite-bearing calc–silicate veins (Vanhanen et al., 2015; Molnár et al., 2016a). Geochemical anomalies in boulders and till also indicate the presence of gold-bearing mineralization in the Rajapalot area, about 8 km east of Rompas. At the current stage of the intense drilling program, six major mineralized zones have been recognized in this latter area and one of them is the Raja prospect (Fig. 2b). Inferred mineral resource estimates at Raja only are at 2.97×10⁶ t at 2.9 g/t gold and cover an average of 383 ppm cobalt, which form 46 % of the gold–cobalt resources at Rajapalot (Mawson Gold Ltd., 2021).
Rocks in the area of the Raja prospect are multiply deformed and metamorphosed to amphibolite facies, which makes the determination of protolithic features particularly difficult. According to Cook and Hudson (2018) the Au–Co mineralization is hosted by two isoclinally folded sequences (Fig. 2c): (i) Sequence 1 comprises siliciclastic, albitized and carbonatized, largely oxidized metasedimentary rocks from a continental margin setting; (ii) Sequence 2 represents a metamorphosed sedimentary sequence formed under reduced conditions consisting of pelitic turbidites, sandstones, carbonates and sulfidic carbonaceous rocks. Mafic rocks (lava flows, dikes and volcanoclastic sediments) are common within both sequences. In the mineralized zones, domains of retrograde alteration to chlorite or epidote occur.
The sampled drill cores are from two profiles (profile 1 and profile 2; Fig. 2b–c) from Sequence 2 of the Raja prospect. Major lithologies are mafic metavolcanic rocks (e.g., pillow basalt to amphibolite), albite–calcsilicate rocks, biotite–calcsilicate rocks, albitite, mica schist and muscovite-bearing quartzite (Fig. 2c).
The zones of high-grade Au–Co mineralization are characterized by sulfide disseminations adjacent to linear, or sub-linear near-vertical structures (Cook and Hudson, 2018). The Raja Au–Co resource extends 240 m parallel to strike, 950 m down plunge reaching a vertical depth of 560 m (Mawson Gold Ltd., 2020). The most significant host lithologies are (brecciated) albitite and foliated muscovite–biotite schist within the lower drill core intercepts (sulfidic K–Mg–Fe-rich rocks, see Fig. 2c). The best grades are detected at the boundary between these two units, indicating that rheological differences played an important role in focused fluid flow and metal precipitation within the system (Farajewicz and Cook, 2021).
Albitite-hosted mineralization is characterized by fracture-related or disseminated sulfides. Mineralized albitite is usually grey and consists of albite, quartz, ± chlorite, ± biotite, ± muscovite and ± Mg–Fe amphibole (anthophyllite–gedrite series). The most common metallic minerals are foliation-oriented pyrrhotite and cobaltite; chalcopyrite and pyrite are present in lesser amounts. Given the low K concentrations, this type of mineralization is also referred to as the sodic type (Farajewicz and Cook, 2021).
Mica schist-hosted mineralization in contrast is of the K ± Fe type and occurs in strongly deformed, medium- to coarse-grained metapelitic rocks, which consist of quartz and albite porphyroclasts enveloped by mica-rich bands (muscovite/sericite and biotite) that include chlorite as a replacement product of biotite (Farajewicz and Cook, 2021). The most common ore minerals are pyrrhotite, pyrite, chalcopyrite, Bi–Te-rich phases, molybdenite, native gold, cobaltite and scheelite.
The structurally controlled gold mineralization formed subsequent to the peak of amphibolite facies metamorphism (at around 1.78 Ga; Molnár et al., 2017) coinciding with the D5-deformation event of the Peräpohja belt (see Fig. 1c). This age was also confirmed by Ranta et al. (2017, 2018), who conducted a trace element, boron isotope and fluid inclusion study on tourmaline from quartz–tourmaline–sulfide-native gold veins at Rajapalot (Palokas prospect). By using tourmaline, the authors could evaluate the physico-chemical characteristics of the mineralizing fluid, which provide a genetic link to the 1.78 Ga granitoid magmatism and the fracture-related gold mineralization (Ranta et al., 2017). This is consistent with the results from Re–Os isotope dating on molybdenite (1.78±0.01 Ga) associated with gold in tourmaline-rich zones at Palokas prospect (Molnár et al., 2017).
4.1 Sampling
For the purpose of this study, 83 samples were collected from two profile sections of drill cores within the Raja Au–Co prospect. Sampling was oriented according to drill core logs and geochemical data (e.g., trace element concentrations) available in the Mawson Gold Ltd. database at the time of sampling. Sampled drill cores include PAL0104, PAL0092, PAL0093, PAL0097 and PAL0100, as well as PAL0088 and PAL0116 which intersected the zones of major mineralization and areas farther away from them (see Fig. 2c). The samples collected represent the major stratigraphic units present within the Raja prospect, as well as highly mineralized Co–Au zones and barren domains.
4.2 Analytical methods
Whole-rock geochemical analysis was performed by MSALABS on behalf of Mawson Gold Ltd using a four-acid digestion and ICP-AES finish. The methodology used is according to the official procedure published by the MSALABS analysis sheet: drill core samples are ground to meet the passing criteria of 85 % −75 µm and are then weighed and digested using a mixture of hydrofluoric acid, hydrochloric acid, nitric acid and perchloric acid. After the digestion process, samples were treated with deionized water and analyzed by inductively coupled plasma atomic emission spectroscopy and inductively coupled plasma mass spectrometry. The reporting units are in ppm. To ensure quality, reference materials, blanks and duplicates were used during analysis; spectral inter-element interferences were corrected. The dataset comprises major and minor trace elements.
Mineralogical and textural observations were performed on polished thin sections, using transmitted and reflected light polarizing microscopes, as well as back-scattered electron imaging with a high-resolution scanning electron microscope (JEOL JSM-5900LV) at the Geological Survey of Finland (Espoo, Finland). This process built the foundation for understanding the mineralization processes and was significant in establishing a systematic, time-efficient plan for trace element and sulfur isotopic analysis.
Trace element analyses in pyrite were performed by a laser ablation inductively coupled plasma mass spectrometry (LA-ICP-MS) at the Geological Survey of Finland (GTK), using a Nu AttoM single collector (SC)-ICPMS (Nu Instruments Ltd., Wrexham, UK) and an Analyte Excite 193 ArF laser ablation system (Photon Machines, San Diego, USA). The laser was run at a pulse frequency of 10 Hz and a pulse energy of 5 mJ at 30 % attenuation to produce an energy flux of 2.5 J/cm2 on the sample surface with a 50 µm spot size. Each analysis was initiated with a 20 s baseline measurement followed by switching on the laser for 40 s for signal acquisition. Analyses were made using time-resolved analysis (TRA) with continuous acquisition of data for each set of points (2 standards, 15 unknowns, 1 quality control standard). Synthetic pressed nanopellets of MASS-1 and FeS-1 standards (Savard et al., 2018) were used for external standardization and the isotope 57Fe as the internal standard. Measurements were performed over 68 isotopes and 36 elements at low resolution () using the fast scanning mode. Data reduction was handled using the software GLITTER™ (Van Achterbergh et al., 2001), which allows baseline subtraction, integration of the signal over a selected time window and quantification using known concentrations of the external and internal standards. Analyses with large inclusions were discarded, but in the cases where inclusions were ablated towards the end of the spot analysis, only mixed signal portions were excluded. For a closer estimation of the actual mean, analyses with certain elements below the minimum detection limit (MDL) were treated as MDL/2 (Winderbaum et al., 2012). The following suite of isotopes was measured during spot analysis: 27Al, 29Si, 33S, 34S, 45Sc, 48Ti, 49Ti, 51V, 52Cr, 53Cr, 55Mn, 57Fe, 59Co, 60Ni, 61Ni, 62Ni, 65Cu, 67Zn, 69Ga, 70Zn, 71Ga, 72Ge, 73Ge, 75As, 77Se, 78Se, 93Nb, 95Mo, 97Mo, 99Ru, 101Ru, 103Rh, 105Pd, 106Pd, 107Ag, 108Pd, 109Ag, 111Cd, 115In, 118Sn, 119Sn, 120Sn, 121Sb, 123Sb, 124Te, 125Te, 126Te, 137Ba, 181Ta, 182W, 183W, 194Pt, 195Pt, 197Au, 202Hg, 203Tl, 205Tl, 208Pb, 209Pb, 232Th and 238U.
Sulfur isotope analyses of pyrite were performed using a Nu Plasma HR multicollector (MC) ICPMS at the Geological Survey of Finland in Espoo together with a Photon Machine Analyte G2 laser system. Samples were ablated in He gas (gas flows = 0.4 and 0.1 L/min) within a HelEx ablation cell (Müller et al., 2009). S isotopes were analyzed at medium resolution. During the ablation the data were collected in static mode (32S, 34S). Single spot samples were ablated at a spatial resolution of 40 µm, using a fluence of 3.5 J/cm2 and at 3 Hz on thin sections. The total S signal obtained was between 0.5 and 3.0 V. Under these conditions, after a 20 s baseline, 50–60 s of ablation is needed to obtain an internal precision of 34S/32S ≤ ±0.000005 (1 SE). One pyrite standard was used for external standard bracketing (PPP-1; Gilbert et al., 2014), and the in-house standards Py1 and Py2 were used for quality control, both previously measured by gas mass spectrometry. For Py1, with a δ34SCDT (‰) reference value of ‰ (1 s) we measured an average value of ‰ (1 s, n=26). For Py2 with a δ34SCDT (‰) reference value of ‰ (1 s), we measured an average value of ‰ (1 s, n=26). One in-house chalcopyrite standard (Cpy1) was used for external bracketing, while another was used for quality control. The in-house chalcopyrite standard Cpy2, previously measured by gas mass spectrometry, has a δ34SCDT (‰) reference value of ‰ (1 s) for which we measured an average value of ‰ (1 s, n=18).
4.3 Data processing
Whole-rock geochemical and mineral trace element data are classical examples of compositional data, which consist of random vectors with components that are parts or percentages of a whole. These vectors only provide relative information and their components are constrained to sum to unity (Aitchison, 1983, 1986). Thus, when using geochemical data for multivariate analysis, one must be aware of the radical difference between the real Euclidean space associated with unconstrained data and the sample space for compositional data, as well as of the severe misinterpretations that can result from improper data pre-processing (Aitchison and Greenacre, 2002; Filzmoser et al., 2010). In order to filter out the relative and relevant information of analyzed elements, and to change the geometry of original data to real coordinates in the Euclidean space, compositional data are treated with the centered log-ratio (clr) methodology, which calculates the logarithm of the ratio between the element and the geometric mean of all other parts of the composition for each single sample (Aitchison and Greenacre, 2002; Reimann et al., 2008, 2017; Hron et al., 2020). Following this approach, we avoid using the log-normal transformation and are preferring the clr transformation as a data pre-processing method for statistical data analysis, such as principal component analysis.
4.3.1 Principal component analysis
The concept of principal component analysis (PCA) is based on the dimension reduction of a large number of possibly correlated variables to a significant set of linearly uncorrelated variables, which are used to obtain element associations of ores (Macheyeki et al., 2020). This correlation-based multivariate analysis technique models a complex set of variables in simplified patterns but still accounts for most of the data variance (Reimann et al., 2008). Choosing the number of variables from a log-ratio transformed compositional dataset is crucial when expecting stable results from a PCA (see Le Maitre, 1982). In general terms, the computation of principal component analysis (PCA) consists of the calculation of eigenvectors and the corresponding eigenvalues with respect to a covariance matrix (see Eq. 1):
with entries (see Eq. 2):
for a given n × p data matrix , where n equals the number of observations and p the number of variables. Mathematically speaking, each row of the data matrix X can be interpreted as the realization of a p-dimensional random vector , while the space that contains all possible realizations of this random vector is referred to as feature space. This p-dimensional space will be denoted as Xp.
By selecting a subset of the eigenvectors ak, , which result from the PCA procedure, one can define the axes of a subspace Xl⊆ Xp, where l<p. In other words, a PCA enables us to express the variability of our data in terms of a lower-dimensional subspace Xl. The axes of Xl are obtained by selecting a subset of eigenvectors from . In order to determine this subset, each eigenvalue of the corresponding eigenvectors needs to be taken into consideration. The objective is to achieve the maximum possible variance with respect to Xl. This is achieved by the eigenvectors which correspond to large eigenvalues.
In order to prevent a dominance of variables with a large absolute magnitude, a correlation matrix PCA, which is a PCA on the standardized data, was computed (Jolliffe and Cadima, 2016). In this context, the initial matrix is replaced with the standardized data matrix where and and (see Eq. 3):
Each data value xi,j is centered and then divided by the standard deviation sj of the n observations of variable j (Jolliffe and Cadima, 2006). After this standardization, the data matrix Z is used for the computation of the correlation matrix PCA. In order to assure that most of the data variability is preserved, only principal components with large eigenvalues (>1) are considered (see Kaiser, 1960; Jolliffe, 2002).
Biplots were produced as a graphical representation of the correlation matrix PCA. They describe the elements of the eigenvectors ak (PC loadings) and the values that each observation would score on a particular principal component (PC scores; see Jolliffe and Cadima, 2016). Computation of PC was performed using the software ioGAS™ 7.2. Before entering the PCA, the datasets were treated with the appropriate clr transformation. Out of the 50 elements analyzed within the whole-rock geochemical dataset, a subset of 12 elements was used (As, Au, Co, Cu, Mo, Ni, Se, Sn, Te, Tl, U and W). From the 61 elements analyzed in pyrites, a total of 12 were used to produce geochemical groupings with the PCA (Ag, As, Au, Bi, Co, Cu, Mo, Ni, Se, Te, Tl and W). Resulting geochemical patterns provide further insights into mineralization processes and have the capacity to differentiate between mineralized and barren zones.
4.3.2 Molar element ratio analysis
The geochemical data were further used to determine the effects of hydrothermal alteration on the rock types and the mineralization (Madeisky and Stanley, 1993; Stanley and Madeisky, 1996; Stanley, 1998, 2017). Molar element ratio (MER) analysis and corresponding plots of versus , and versus , are the variables and ratios that best describe the observed alteration assemblages. For this purpose, the reported concentration of major elements that is stated in weight percent must be recalculated to a 100 % volatile-free composition and converted to moles, in order to be used as ratios for the above-mentioned MER plots.
5.1 Description of major rock units
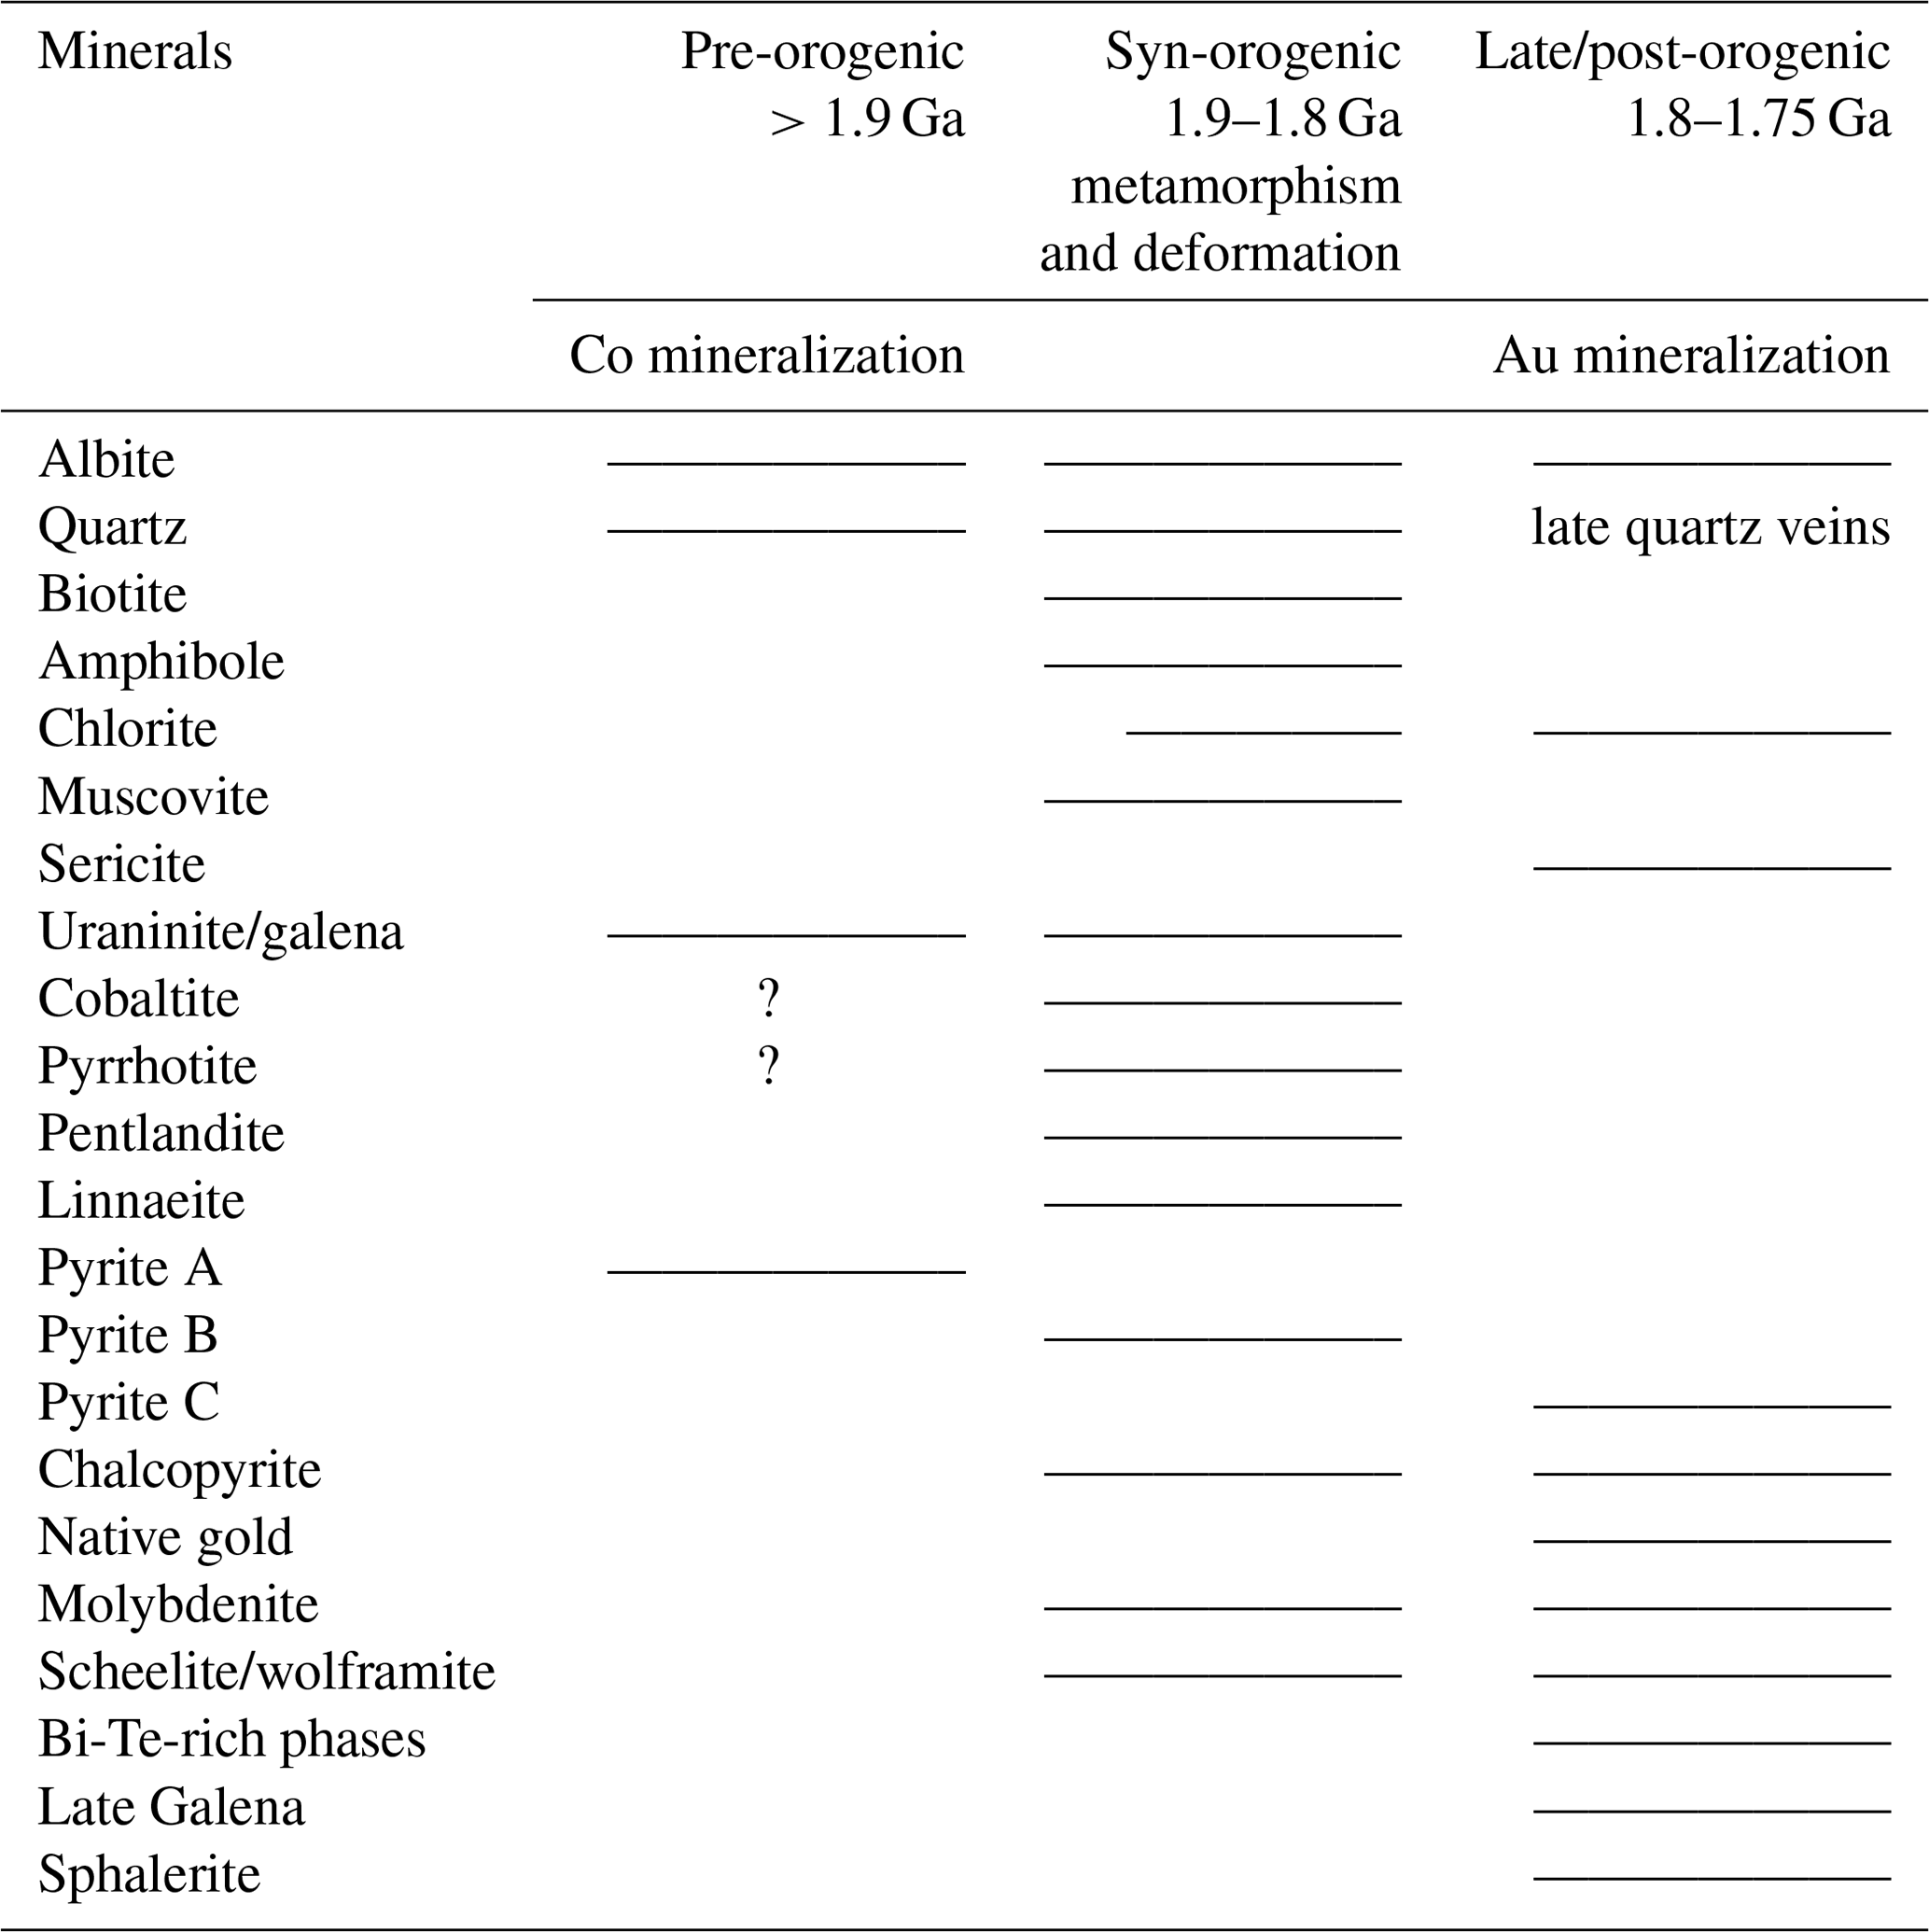
Given the intense metamorphism and multi-stage hydrothermal alteration history at Raja, determination of primary textures and mineral phases is quite complicated. The most common alteration types include albitization (pre-post-syn-orogenic), retrograde alteration assemblages of chloritized biotite, chlorite and Fe–Mg amphiboles (syn-orogenic), sulfidation-induced formation of massive pyrrhotite, and subordinate pyrite and chalcopyrite (syn-to post-orogenic). Sections where plagioclase is affected by the sericitic alteration characterize the latest alteration event (post-orogenic; see Table 1). Based on the abundance of rock-forming minerals, major rock types can be classified as albitite, albite–calcsilicate rocks, biotite–calcsilicate rock, metavolcanic rocks, mica schists and quartzites (see Fig. 3). The calcsilicate rocks define fine- to medium-grained, folded and crenulated lithologies that display a color range from grey to dark grey (biotite–calcsilicate rocks; Fig. 3a), and light grey to light pink (albite–calcsilicate rocks; Fig. 3b). They consist of albite, quartz, amphibole, biotite and pyroxene (± carbonates, ± chlorite; ± hematite, ± magnetite) and can exhibit alternating bands of felsic and mafic mineral phases. Disseminated pyrrhotite is the most common sulfide mineral in these rocks, followed by pyrite and chalcopyrite (Fig. 3a–b).
Table 1Succession of mineralization in association with alteration and the geological evolution of the Peräpohja belt.
Mafic metavolcanic units show either (i) pillow basalt fabrics (e.g., hyaloclastite breccia; Fig. 3c) in light to dark-green, fine- to medium-grained biotite–amphibole-rich rocks, where sheet silicates (biotite and retrograde chlorite) form partly folded seams and bands; or include (ii) dark green to light green, fine- to medium-grained amphibolite that can contain biotite bands, disseminated sulfides (pyrrhotite) and magnetite. Folding, foliation and alteration (retrograde chloritization) are common. Locally columnar, brown-bluish tourmaline is associated with long-prismatic, coarse-grained amphibole crystals (see Fig. 3d).
Fine- to medium-grained albitite is composed of an albite–quartz-rich matrix with a light-greyish appearance. The color, however, displays wide variations ranging from nearly white to pink. Sheet silicates such as biotite, muscovite/sericite and chlorite (retrograde phase) occur as interstitial phases or in veinlets and fractures (Fig. 3e). Brecciated and fractured albitite hosts the mineralization, commonly along the boundary with mica schist at lower stratigraphic positions. Pyrrhotite, pyrite and chalcopyrite are the most common sulfides; euhedral cobaltite is the dominant Co-bearing phase.
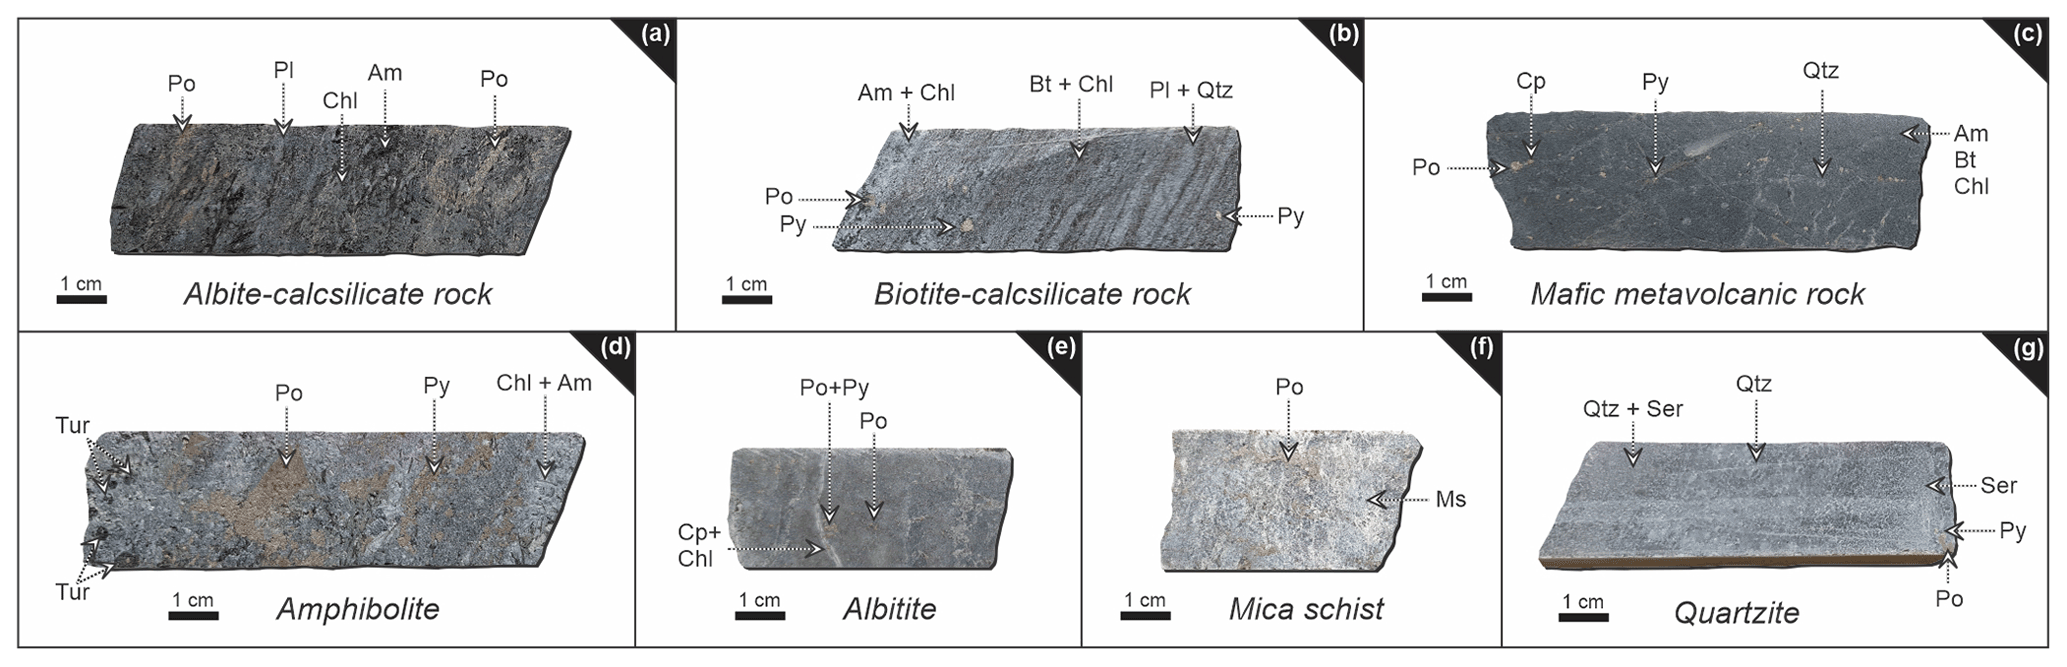
Figure 3Representative drill core samples from major rock units of the Raja prospect: (a) albite–calcsilicate rock with radial-growing crystals of amphibole and chlorite, as well as disseminated pyrrhotite. (b) Biotite–calcsilicate-rich rock with alternating mafic and felsic layers, significant foliation and rotated pyrite porphyroclasts. (c) Fine-grained mafic metavolcanic rock (hyaloclastite) with fracture-filling, as well as disseminated pyrrhotite and pyrite. (d) Mineralized amphibolite with euhedral crystals of tourmaline. (e) Fine-grained albitite with fracture-filling chlorite and chalcopyrite, as well as disseminated pyrrhotite and pyrite. (f) Muscovite-rich mica schist with disseminated pyrrhotite. (g) Fine-grained quartzite with sericitic alteration. Pl – plagioclase, Qtz – quartz, Bt – biotite, Am – amphibole, Chl – chlorite; Tur – tourmaline; Ser – sericite; Po – pyrrhotite, Py – pyrite, Cp – chalcopyrite.
The fine- to medium-grained mica schist is a light grey- to grey-colored, foliated to crenulated muscovite and biotite-rich metapelitic rock (sulfidic K–Fe–Mg-rich rock) that also hosts the Raja mineralization, along with albitite (Fig. 3e–f). This rock commonly contains quartz and albite porphyroclasts with enveloping muscovite and biotite, which often exhibit replacement of biotite by chlorite in sheared zones. Accessory phases are represented by magnetite, apatite, and rutile ± tourmaline. Sulfide mineralization is dominated by foliated pyrrhotite ± pyrite, while the most common ore minerals are cobaltite, native gold, molybdenite, scheelite and Bi–Te-rich phases.
Light-grey quartzites are usually fine to medium-grained and display weak bedding textures and contain muscovite bands, as well as sericitized domains (Fig. 3g).
5.2 Ore textures and mineralogy
Ore minerals either occur in foliation-related dissemination or in veins that cut across foliation. The most common sulfide minerals are pyrrhotite, pyrite, chalcopyrite, pentlandite, molybdenite, galena and sphalerite; oxides are mainly ilmenite, magnetite and rutile. As the most abundant sulfide, pyrrhotite is accumulated in biotite-rich bands that follow the rock fabric. In this textural setting pyrrhotite is associated with chalcopyrite, cobaltite and rare scheelite. Pyrrhotite also surrounds foliation-related pyrite crystals in a fringe-like habit. The second most abundant sulfide at Raja is pyrite. It displays three distinct textural types, all of which are locally present in some samples (Fig. 4). They show no restriction to certain lithologies or specific stratigraphic levels. Pyrite A occurs as irregularly deformed or elongated grains following the foliation of the host rock (Fig. 4a) and is often associated with pyrrhotite that grows in antitaxial fringe-like shapes around the crystals of pyrite (Fig. 4b–c). Pyrite B is also observed along the foliation fabric, however, in a porphyroclastic texture with up to 1 cm large grains. These grains often have magnetite–amphibole–chlorite fringes (Fig. 4a and d–e). Less commonly, pyrite B also forms idiomorphic, coarse-grained crystals (up to 1.5 cm) without visible pressure shadows in the plane of thin sections. Occasionally, pyrite B hosts rare remnants of colloform pyrite, which shows concentric banding with uni-directional growth as a gradual filling of cavities (Fig. 4d). The anhedral pyrite C is associated with pyrrhotite and chalcopyrite (Fig. 4f) within chlorite and quartz–carbonate veinlets which cut across the foliation.

Figure 4Textural setting of three distinct pyrite types. (a) Circled figures on the left show their occurrence in hand specimen. Reflected light photomicrographs show (b) and (c) pyrite A surrounded by fringe-shaped pyrrhotite following the foliation of the host rock; (d) and (e) show pyrite B porphyroclasts with magnetite (mag)–amphibole–chlorite fringes and (f) fracture-filling pyrite C associated with chalcopyrite (cp).
Pentlandite and molybdenite are accessory sulfide minerals. Pentlandite occurs as flame-like exsolution lamellae (<20 µm) or as anhedral inclusions in pyrrhotite. Molybdenite forms acicular crystals (50 to 250 µm) that are locally interlayered with Bi–Te-rich phases along rims of pyrrhotite (Fig. 5a). The Bi–Te-rich phases also occur along grain contacts with cobaltite (Fig. 5b). Given the small grain size of the Bi–Te-rich phases, no useful analyses could be produced to define their respective mineral names.
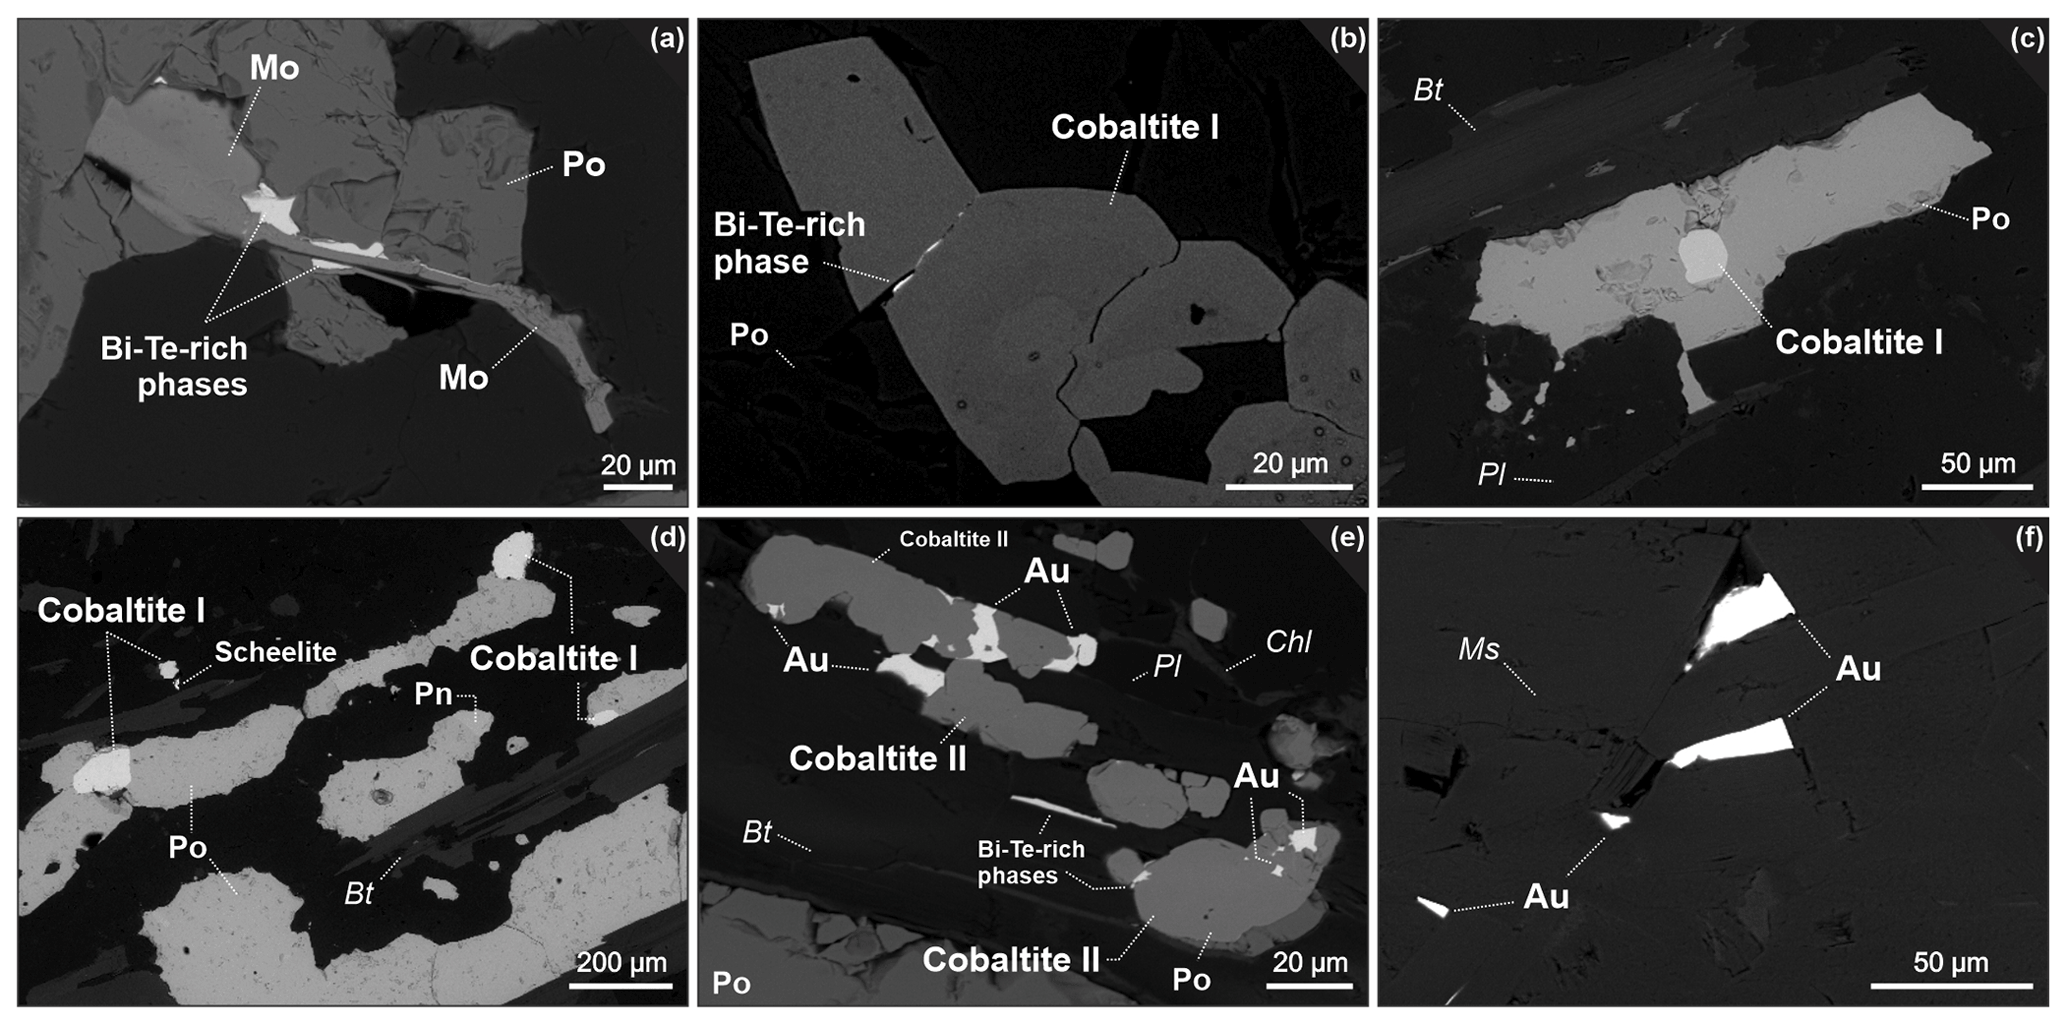
Figure 5Photomicrographs showing the textural occurrence of pyrrhotite, cobaltite, molybdenite (mo), Bi–Te-rich phases and native gold. (a) Sandwich-textured molybdenite–Bi–Te-rich phase assemblage at pyrrhotite rim; (b) cobaltite I accumulations with Bi–Te-rich phases between grain contacts. This whole assemblage is located along a pyrrhotite rim. (c) Cobaltite I inclusion in pyrrhotite that follows the foliation of the host rock. (d) Cobaltite I at pyrrhotite rim. Assemblage is associated with biotite following rock foliation. Pentlandite (Pn) forming flame-like inclusions in pyrrhotite. (e) Cobaltite II, native Au and Bi–Te-rich phases in mica-rich domains. (f) Void-filling native Au textures in domains of sericitization.
The major Co-bearing phases at Raja are cobaltite, linnaeite and (±) Co–pentlandite. While linnaeite and Co–pentlandite mostly form as exsolutions in pyrrhotite (Farajewicz and Cook, 2021), the more abundant cobaltite is observed in two principal textural settings: (i) cobaltite I occurs in biotite–amphibole-rich domains with retrograde chlorite alteration. The euhedral (Fig. 5b) to anhedral (Fig. 5c–d) crystals of cobaltite I cover a size range between 30 and 300 µm and are either enclosed in or occur along rims of rock-foliation-related pyrrhotite, suggesting cobaltite formation prior to deformation. Adding to this indication is the presence of foliation-related biotite, partially replaced by chlorite. (ii) Anhedral cobaltite II grains (with up to 200 µm sizes) are embedded in biotite or muscovite and hosted by mica schist (Fig. 5e). Frequently, native gold and Bi–Te-rich phases are observed along the rims of cobaltite II (Fig. 5e). Apart from the close association with cobaltite II (Fig. 5e), native gold is also found as an interstitial phase in mica-rich domains (Fig. 5f).
Considering that both cobaltite types follow the rock foliation within an anhedral shape, a formation prior to the Au-bearing stage is suggested. Whether the euhedral cobaltite I crystals (Fig. 5b) and the anhedral cobaltite II (Fig. 5e) are both representatives of the same Co-mineralization event or are attributed to two different Co stages is difficult to distinguish. Nevertheless, the overall textural relationships clearly suggest that native gold, Bi–Te-rich phases and molybdenite have grown after the formation of the Co-enriched phases. Table 1 puts the geological processes, alteration, as well as mineralization into context and provides a summary of the paragenetic succession of ore mineral precipitation at Raja.
5.3 Whole-rock geochemistry
5.3.1 Detection of ore zones
According to the whole-rock geochemical data from the sampled drill cores, two significant types of ore zones can be distinguished at the Raja prospect: (i) Co-only zones are characterized by horizons with Co enrichments of up to 1085 ppm and gold concentrations below the detection limit (b.d.l.); these horizons are primarily hosted by (biotite) calcsilicate rocks and amphibole-rich rocks in the stratigraphically high position in the profile defined by the drill cores (Figs. 6a and 7); (ii) Au–Co zones are preferentially located at greater depths and hosted by albite-rich rocks and mica schist (Figs. 6b and 7). The Au–Co zones have up to 115 ppm gold and 2340 ppm cobalt (Figs. 6 and 7). Above the main mineralized position, a second type of Au–Co zone occurs (up to 2.67 ppm Au and 160 ppm Co; Fig. 6b) within metavolcanic rocks and albite–calcsilicate rocks (Figs. 6b and 7). The remaining barren areas have Co concentrations below the estimated rock average for bedrock units of the Karelian domain (see Rasilainen et al., 2008) and gold below the limit of detection.
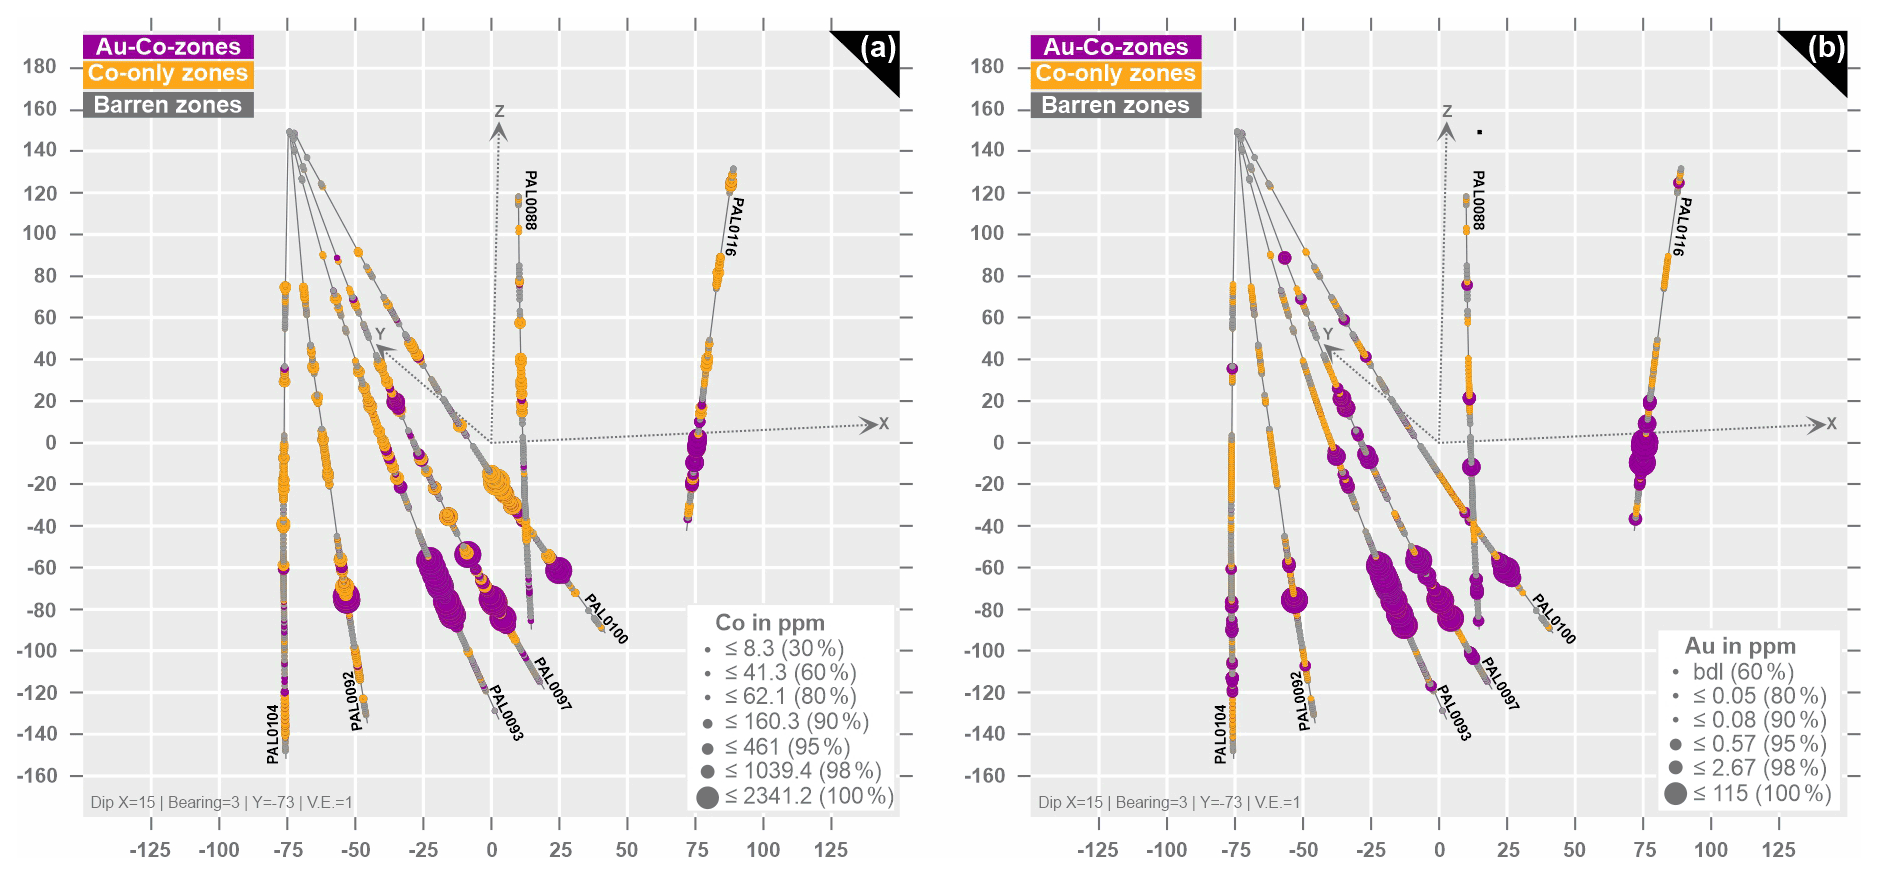
Figure 63D model of sampled drill cores showing the distribution of gold and cobalt. Ore zones are characterized as (a) Co-only zones (orange), where Au is b.d.l. and as (b) Au–Co zones (purple), with Au up to 115 ppm and Co up to 2341 ppm. Barren zones are indicated in grey colors.
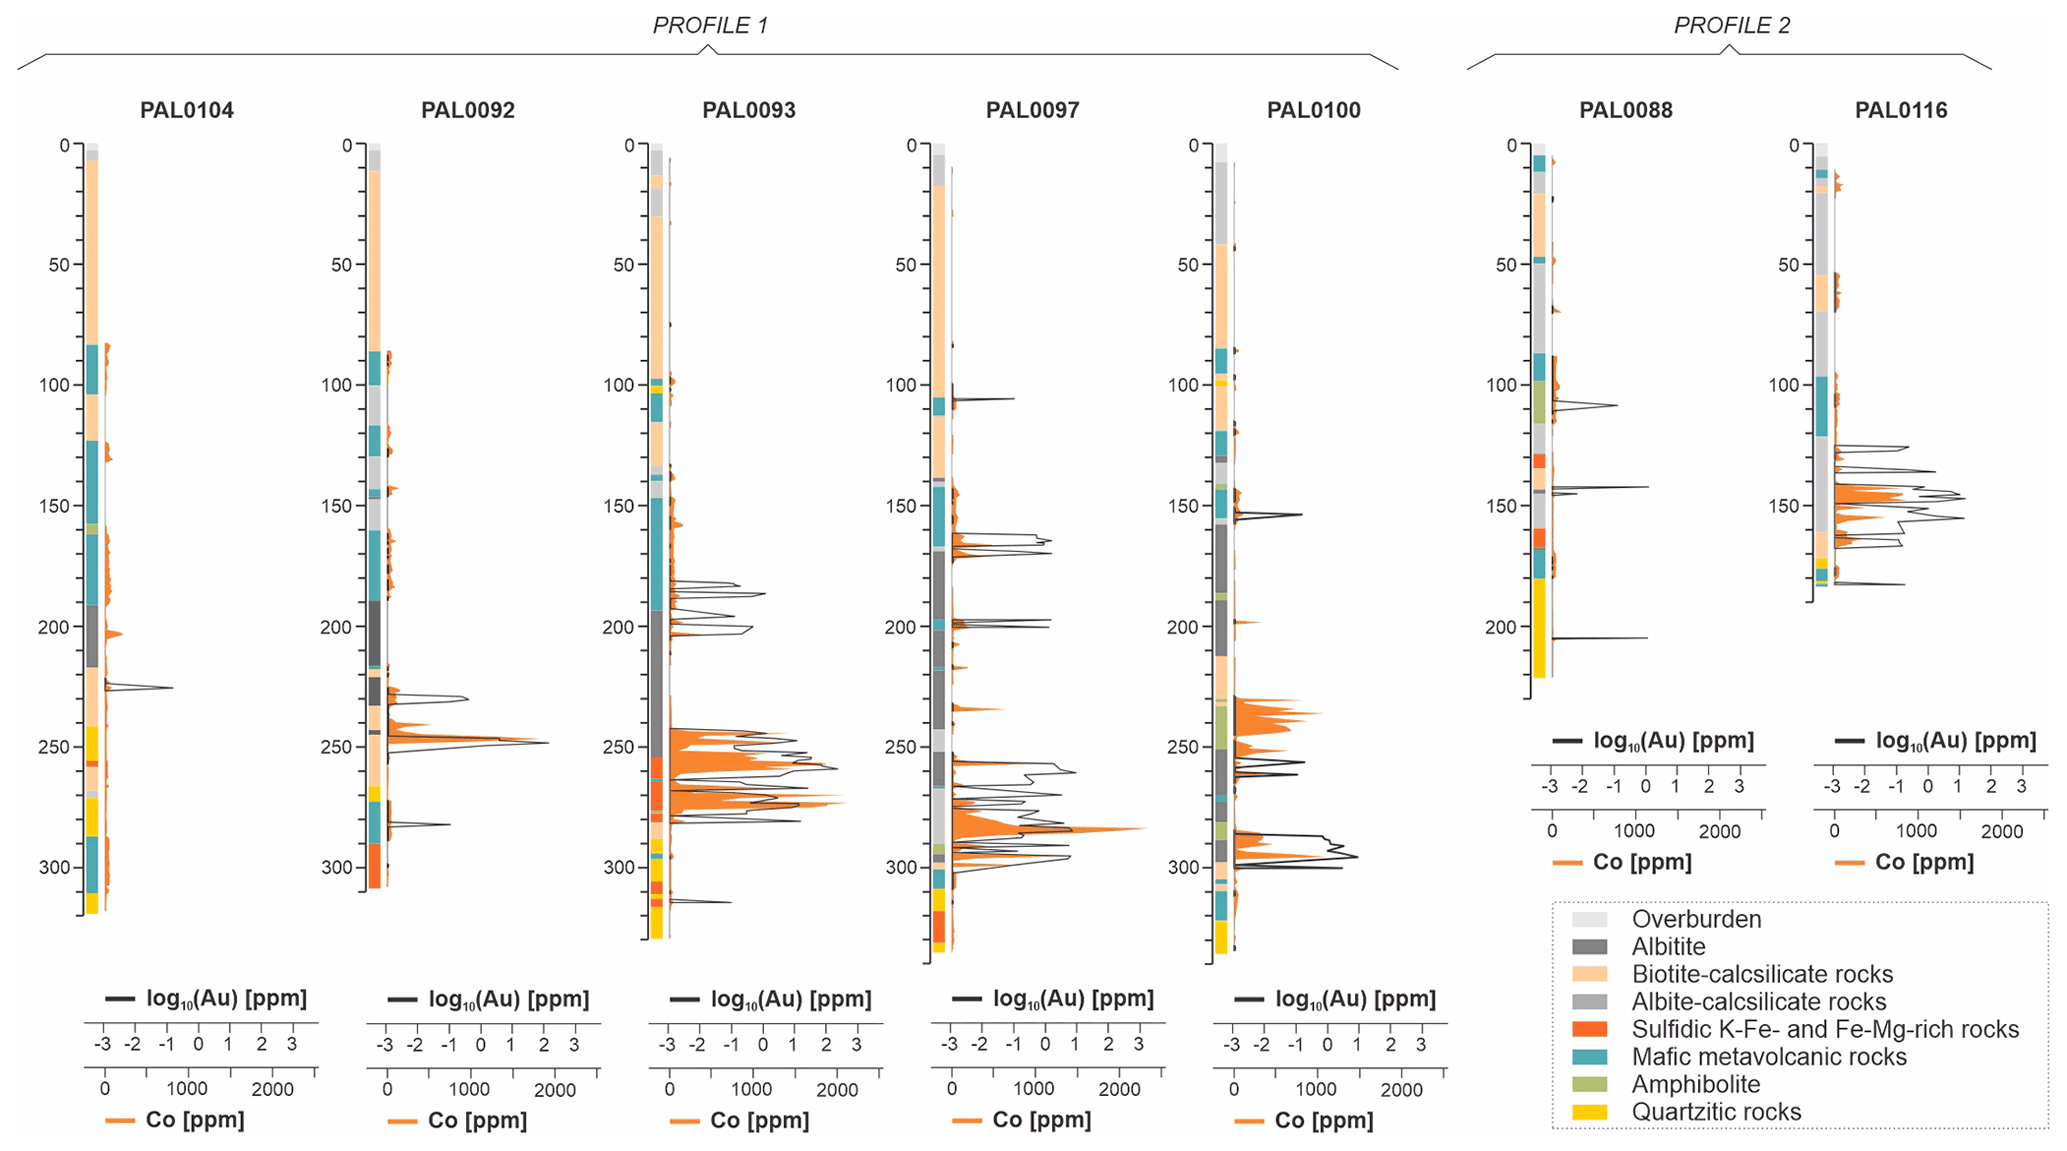
Figure 7Downhole plots illustrating the distribution of Au (in log ppm) and Co (in ppm) along the stratigraphic column of sampled drill cores.
5.3.2 Principal component analysis of whole-rock trace element data – recognition of ore-related and barren element associations
In order to substantiate meaningful geochemical patterns within mineralized and barren zones, multivariate statistical analyses, such as principal component analysis, are applied to our large multi-element dataset (see next section). To achieve stable results, it is recommended to enter the principal component analysis with variables selected based on geochemical reasoning, and not with the full set of analyzed elements (see Le Maitre, 1982; Reimann et al., 2008). For this purpose, metals, pathfinder elements and elements of economic interest that cover broad compositional fields within Co-Only, Au–Co and barren zones are particularly suitable. The boxplot in Fig. 8 shows the visual distributions for the log-transformed concentrations of the key elements (As, Au, Co, Cu, Mo, Ni, Se, Sn, Te, Tl, U and W), which will enter the principal component analysis as clr-transformed variables (see next section).

Figure 8Logarithmic-scaled boxplot illustrating the range in concentration of metals and pathfinder elements in Co-only zones, Au–Co zones and barren zones.
Within this set of variables, elements of economic interest (such as Au) and elements with a long-term recovery potential (such as Co, Se and W) are included to better understand their behavior and establish element associations. The selected variables for the n=1084 dataset are displayed in biplots that illustrate the new coordinate system of principal components (see Fig. 9). How much each observation scores on a particular principal component is described by PC scores, while the elements of an eigenvector define the PC loadings (or weights; Reimann et al., 2008; Jolliffe and Cadima, 2016; Holland, 2019). Positive loadings indicate a positive correlation with the principal component, while negative loadings point to a negative correlation. The vector length is proportional to the variability of the two presented principal components, while the direction and angle of the vectors defines the correlation between the variables.
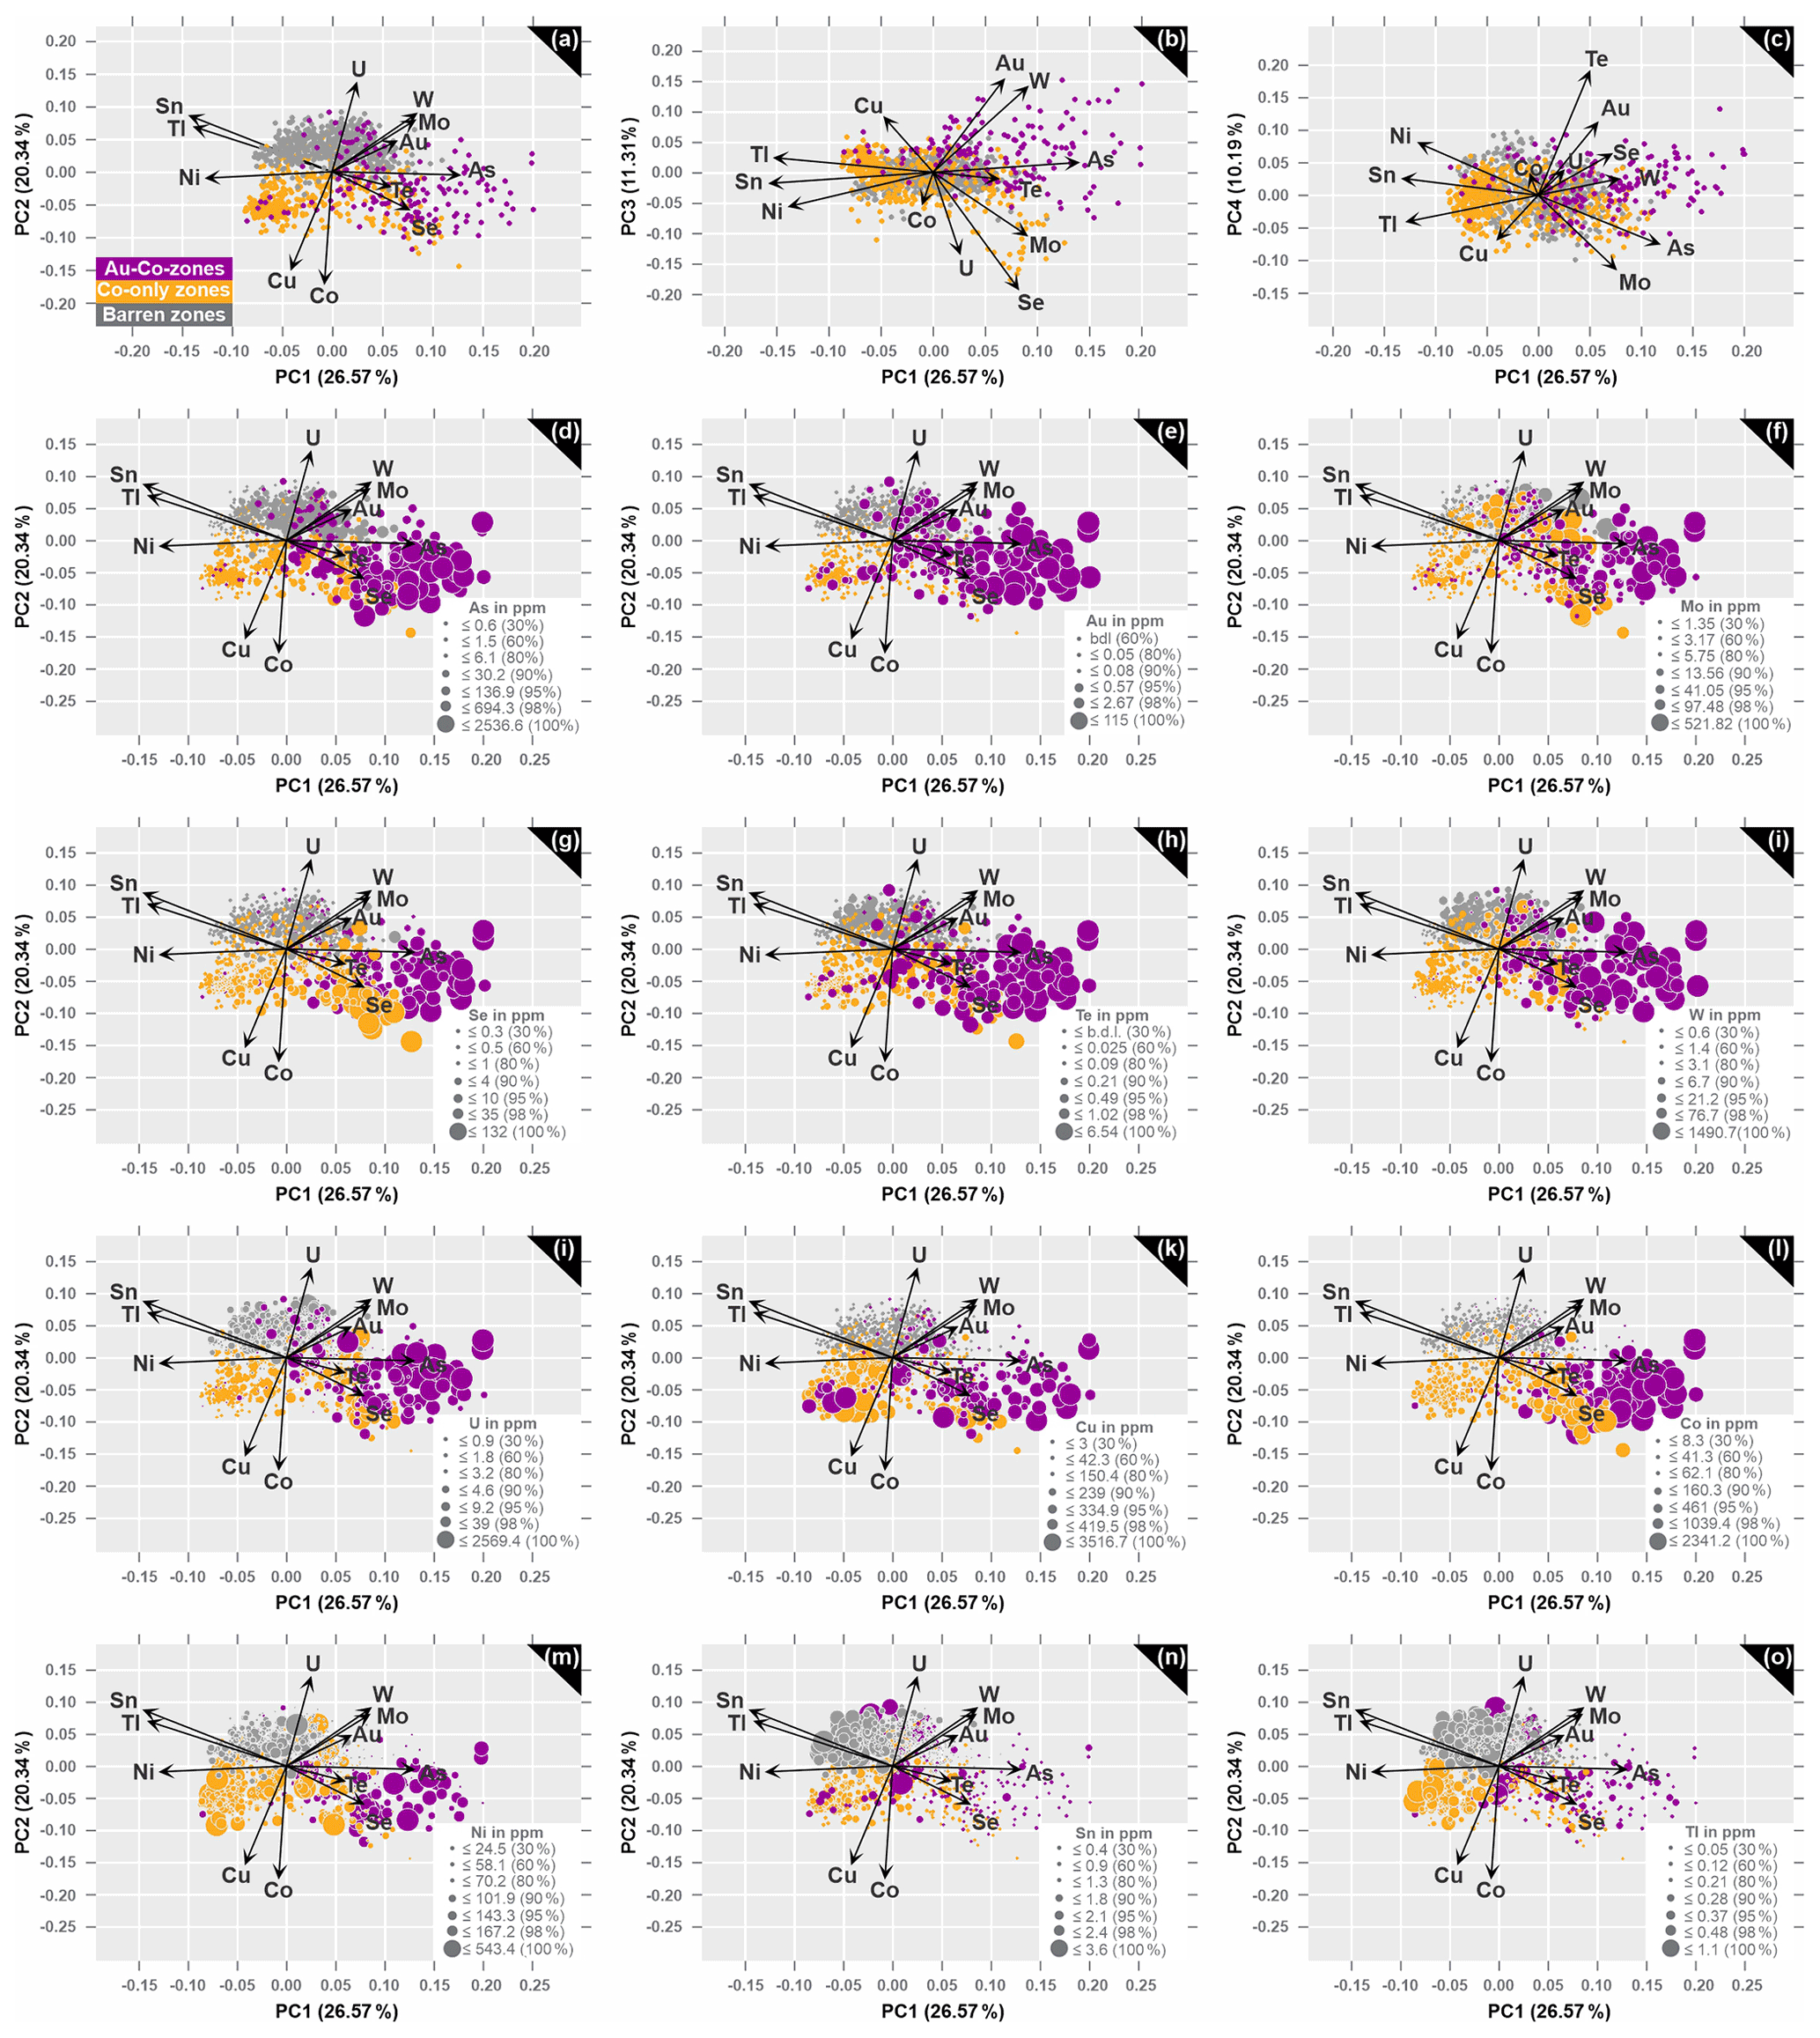
Figure 9Principal component loadings (arrows) and scores (observations) of clr transformed n=1084 data. Biplots illustrate the projections of the first four principal components: (a) PC1 versus PC2 (48.6 % of the data variability), (b) PC1 versus PC3 (37.9 % of the data variability) and (c) PC1 versus PC4 (36.8 % of the data variability). PC1–PC2 projection in correlation with concentrations of (d) As, (e) Au, (f) Mo, (g) Se, (h) Te, (i) W, (j) U, (k) Cu, (l) Co, (m) Ni, (n) Sn, and (o) Tl.
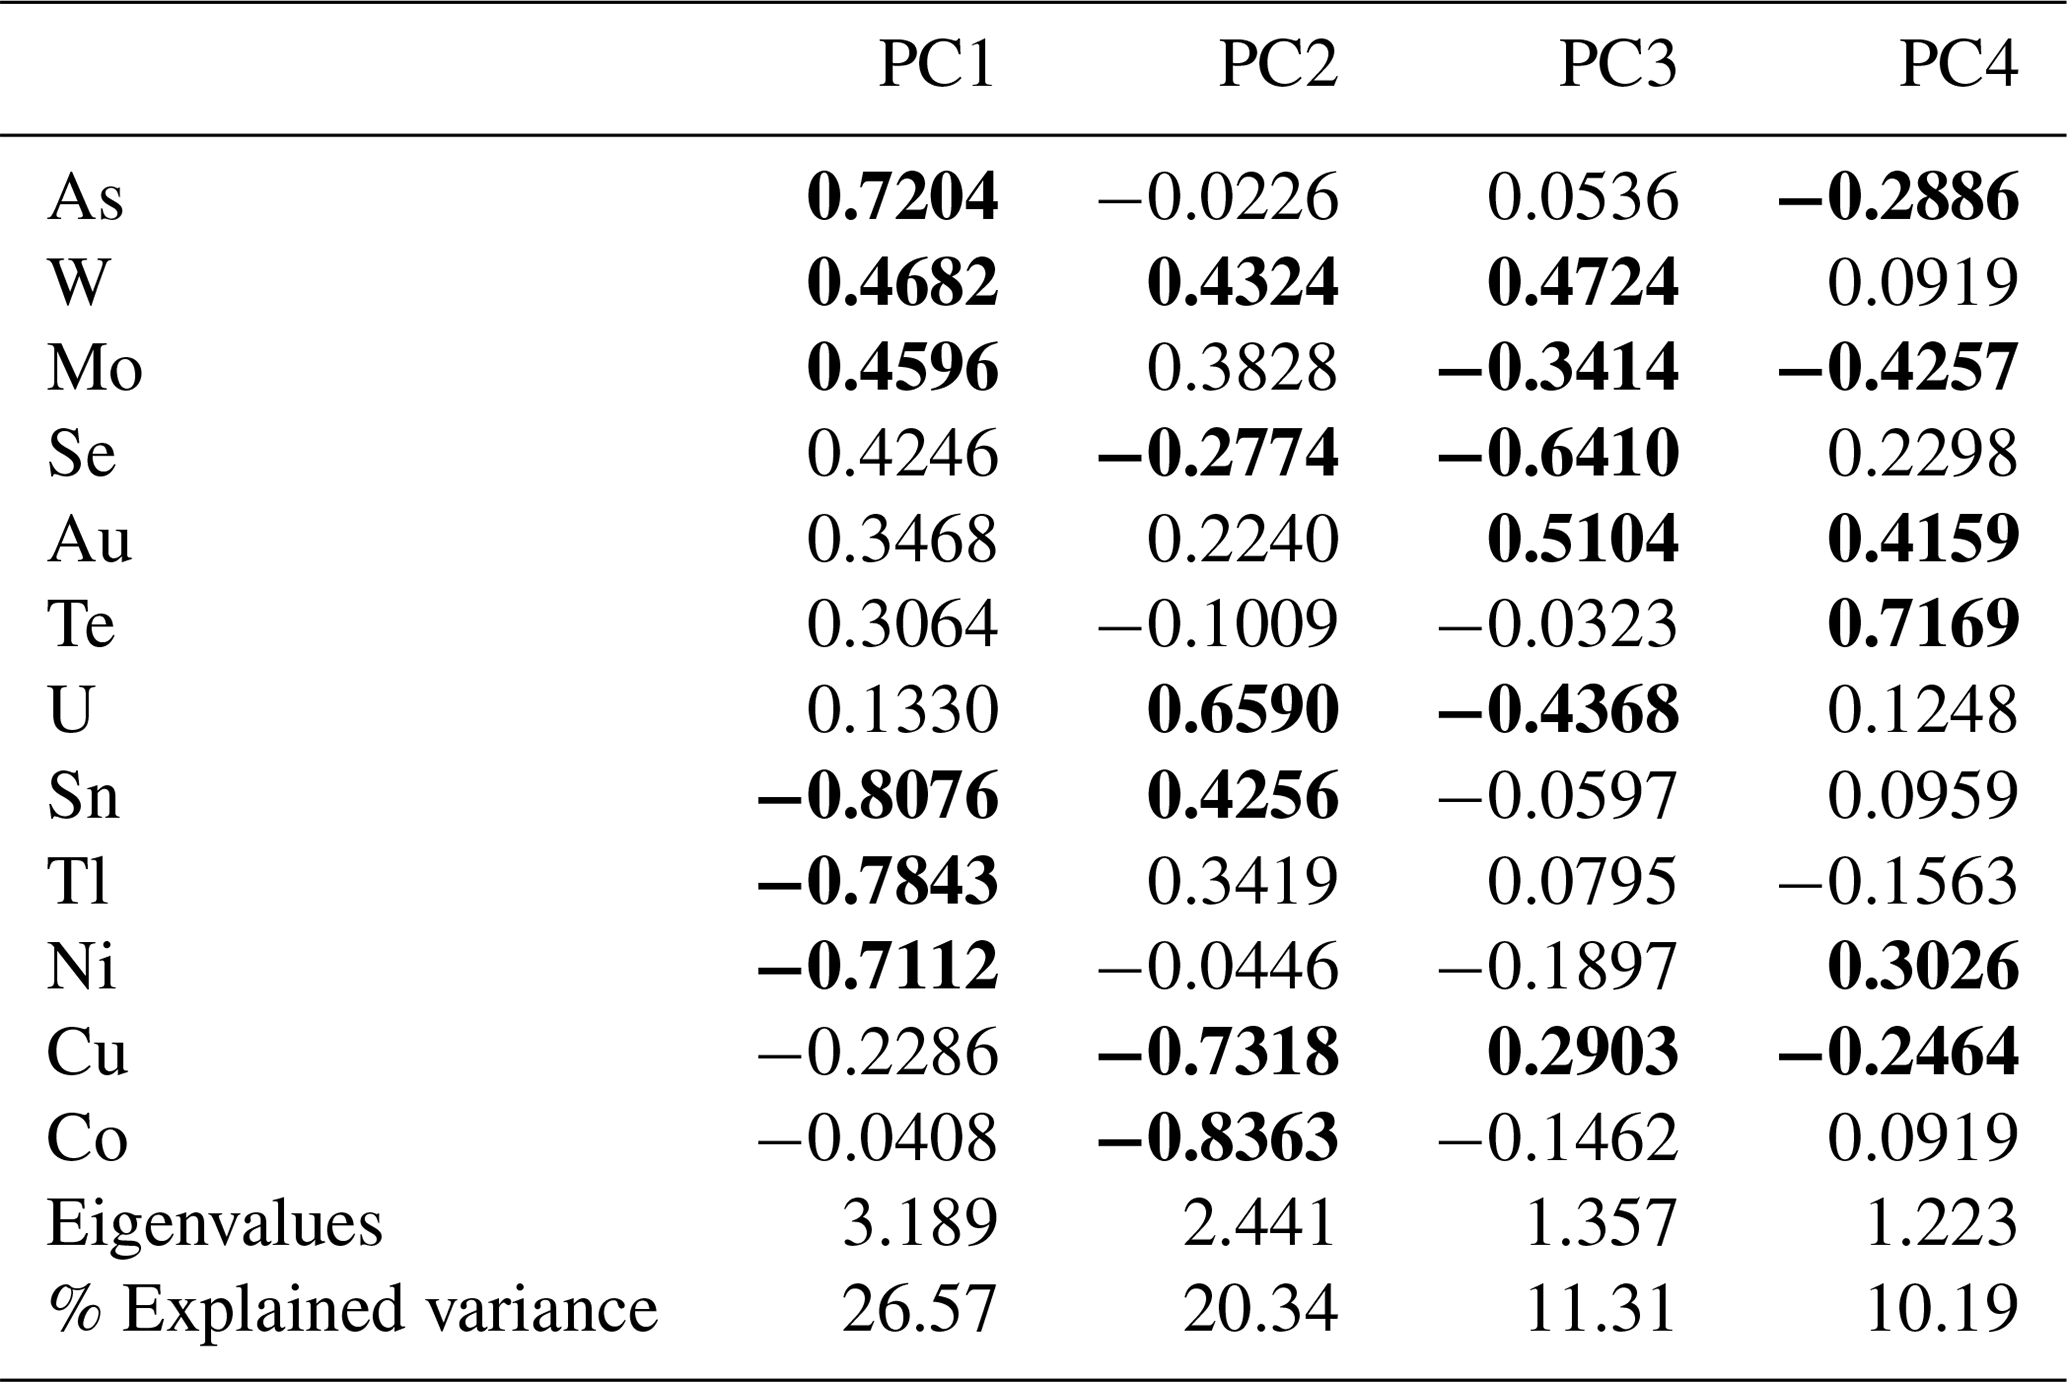
Table 2 summarizes the contribution of each variable to the first four principal components, whose explained variation is above 1 (see eigenvalues), which accounts for almost 70 % of the total variance (see % explained variance). This is sufficient to extract the following relevant information contained in the correlation matrix PCA (see Table 2): the largest positive loadings onto PC1 have As, followed by Mo, W, Se, Au and Te. Elements such as Sn, Tl and Ni on the contrary display the largest negative loadings on PC1, indicating lower concentrations of these elements on the positive axis 1. Uranium contributes to the PC2 with large positive loadings, along with Sn, W, Tl, Mo and Au, whereas Co and Cu display large negative loadings, which corresponds well with the negative to almost no correlation between the Co–Cu group and the Au–Mo–W–U group and the Sn–Tl association, respectively (see Fig. 9a). PC3 is dominated by large positive loadings for Au, W and Cu, as well as large negative loadings for Se and U, as well as negative loadings for Mo, Co and Ni (Fig. 9b). Variables that strongly contribute to PC4 with positive loadings are Te, Au, Ni and Se; the largest negative loadings are displayed by Mo (Fig. 9c).
Table 2Results from principal component analysis from the n=1084 whole-rock geochemical data, including the 12 variables in relation to the first four principal components, which contain most of the data variance (see corresponding eigenvalues). The proportion of the variance in each eigenvector is displayed as the percentage of the explained variance. The first three elements with the largest positive and negative loadings along the positive and negative axis of each PC are marked in bold print.
The biplots in Fig. 9 capture the loadings of the 12 variables in relation to the first four principal components and show the separation of samples in Au–Co zones, Co-only zones and barren zones within the new coordinate system. In the PC1–PC2 projection (46.9 % of the total variance; Table 2) the majority of data points from Au–Co zones is concentrated in the positive domain of PC1 and distributed between the loadings of U, W, Mo, Au, As, Te and Se, where it shows overlapping features with data points from barren zones and Co-only zones within the positive and negative PC2 space, respectively (Fig. 9a). Along the negative axis of PC1, between the negative loadings of Ni, Sn and Tl, overlapping features are observed for samples from Co-only and barren zones (Fig. 9a). A separation between these two zones, however, is better visualized with the PC2, considering that almost all samples from barren zones are distributed along the positive axis of PC2, where the large positive loading for U in the barren zones is opposing the large negative loadings for the Co–Cu group in the negative PC2 space of the Co-only zones. Given this observation, PC2 appears to be the principal component that is particularly suitable to distinguish between mineralized and barren zones.
Although the first two principal components account for most of the data variability (46.9 %) and provide by far the largest capacities to differentiate between Co-only zones, Au–Co zones and barren sections, it is worth discussing the geochemical associations within the PC1–PC3 projection, which represents a total of 37.9 % of the variance (Table 2; Fig. 9b). The dominant characteristic in this projection is that the PC3 is also capable to separate the Au–Co zones, which are distributed along the positive axis of PC3 (and PC1), in the domain of the positive loadings of Au, W, Cu and As, from the Co-only zones, which dominate the negative axis of both PC3 and PC1 (Fig. 9b).
In the PC1–PC4 projection (36.8 % of the variance; Table 2) the dominant positive loadings on PC4 are Te and Au, which are opposing the negative loadings of Mo, As, Cu and Tl along PC4 (Fig. 9c). While the majority of observations from Au–Co zones are constrained within the positive PC1 and along the positive and negative axis of PC4, samples from Co-only and barren zones show overlapping features along the positive and negative axis of both principal components (see Fig. 9c).
Considering that the PC1–PC2 projection has the largest capacity to distinguish between mineralized and barren zones, it is used to unravel underlying geochemical patterns by correlating the concentrations of elements with the distribution of samples in the loadings plot (see Fig. 9d–o). By doing so, the following observations are made:
- i.
Along the positive axis of PC1, a group of seven elements (As, Au, Mo, Se, Te, U and W; Fig. 9d–j) describes the high-grade fracture-related Au–Co zones from albite-rich rocks and mica schists, while the few data points along the negative axes of PC1 (and PC2), between the loadings of Ni, Cu and Co, are reflective of the stratigraphically higher positioned Au–Co zones from metavolcanic units with lower Au and Co contents (Fig. 9k–m).
- ii.
The majority of Co-only observations is concentrated within the negative PC2 space and along the negative and positive axis of PC1, where two groups can be distinguished: (a) high-grade Co-only systems, positioned stratigraphically above the high-grade Au–Co zones, are distributed between the positive loadings of As, Te and Se on PC1 (Fig. 9d, g–h, l) and (b) Co-only zone from stratigraphically higher positioned metavolcanic rocks with lower Co concentrations within the negative PC1–PC2 space (Fig. 9k–m). Lower concentrations of Co are also detected in the few samples from Co-only zones that plot along the positive axes of PC2, hosted by metavolcanic rocks well above and well below the high-grade Au mineralization (Fig. 9l).
- iii.
The positive association of Sn and Tl (Fig. 9n–o), as well as Sn and U (Fig. 9i), in the positive PC2 space best applies to barren rocks, which usually show an inverse positioning of most base metals.
5.4 Relationships between whole-rock major element geochemistry and mineralization
The evaluation of whole-rock major oxide data together with the trace element data reveals useful and important information about the lithological control on the mineralization, the mechanisms of ore mineral precipitation, as well as the effect of hydrothermal alteration on the rock composition (Madeisky and Stanley, 1993; Stanley and Madeisky, 1996; Stanley, 1998, 2017). For this purpose, we are using molar element ratio analysis and corresponding plots to graphically represent mass transfer processes responsible for hydrothermal alteration. The data presented in Fig. 10 show the major element geochemistry of collected drill core samples, plotted in molar element ratio diagrams of versus , and versus , which correspond to mineral compositions of the observed alteration minerals. The illustration of multiple hydrothermal alteration events is facilitated by labeling specific mineralogical assemblages according to different molar values from the whole-rock chemistry (Fig. 10). Geochemical gradients recognized from the correlation of alteration mineralogy with Au and Co grades in MER dimensions exhibit distinct trends (Fig. 10a–b, d–e): mica schist samples record the highest Au grades (up to 33 ppm Au) and are connected to sericitization by showing a clear trend towards the muscovite node. Significant concentrations of Au are also detected in albitites (up to 4.96 ppm) and albite–calcsilicate rocks (up to 3.22 ppm) that plot close to the albite node or between the albite–muscovite nodes. The biotite–calcsilicates that plot between the albite–chlorite domain (Fig. 10a), in addition to a pronounced retrograde chlorite alteration (see petrography section), exhibit a trend towards the muscovite node with up to 1.91 ppm Au. Samples that are trending towards the albite and sericite end member generally display higher Au concentrations (Fig. 10a–b, d–e).
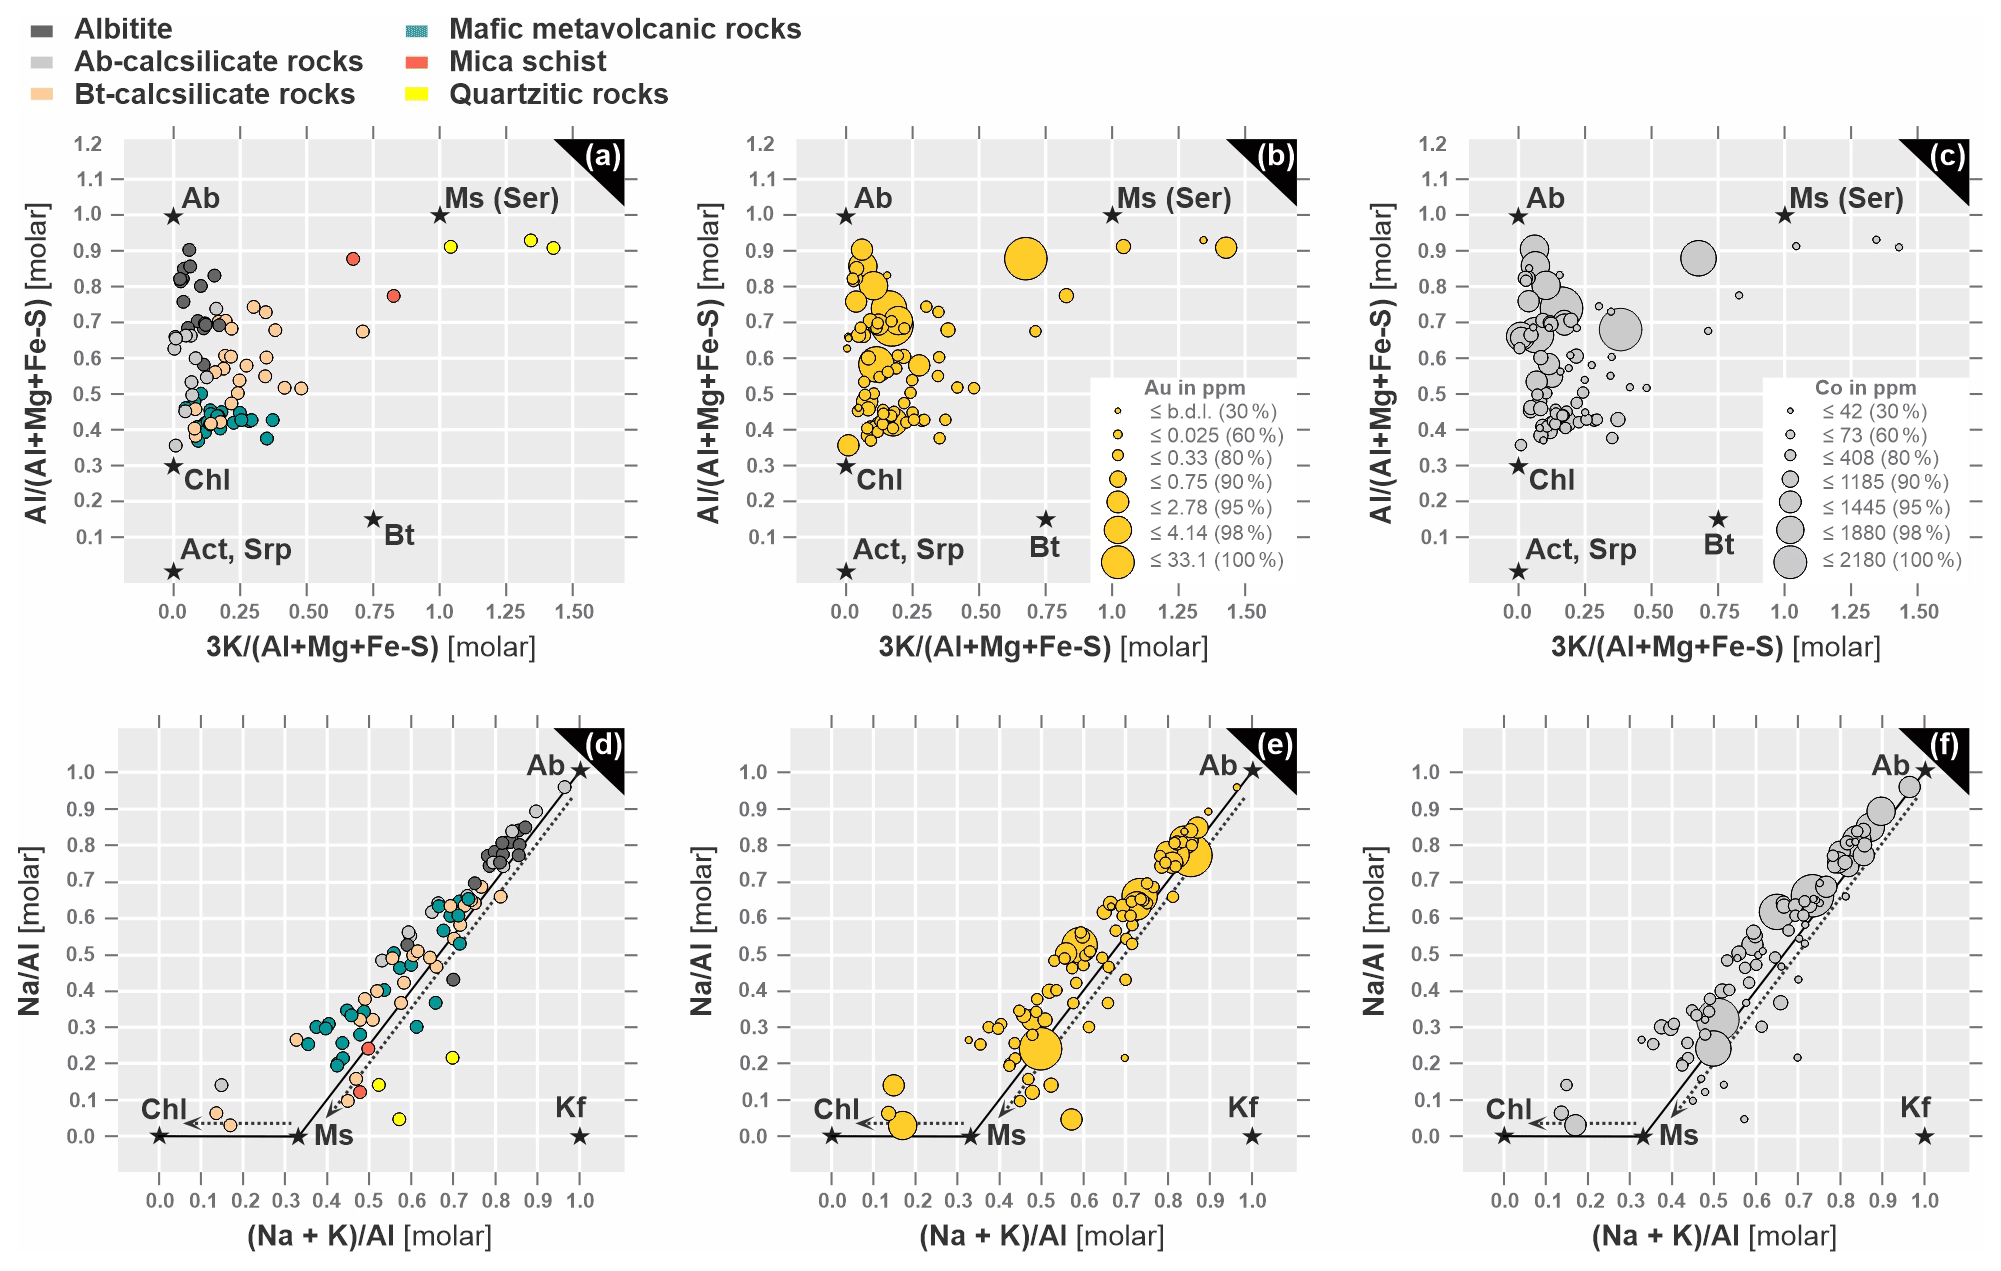
Figure 10Graphical presentation of mass transfer processes at Raja in molar element ratio diagrams in correlation with Au and Co grades. Axes are molar ratios. Diagrams are taken from Stanley (2017). Molar ratio plots of versus classified according to (a) lithologies, (b) Au concentrations (in ppm) and (c) Co concentrations (in ppm). General element ratio diagrams using versus and classified according to (d) lithologies, (e) Au concentrations (in ppm) and (f) Co concentrations (in ppm). Lithology and concentration legends from (a), (b) and (c) are also used in (d), (e) and (f). Ab – albite, Act – actinolite, Bt – biotite, Chl – chlorite, Kf – K-feldspar, Ser – sericite.
The lowest Au grades are detected in quartzite (up to 0.57 ppm) and mafic metavolcanic rocks (up to 0.6 ppm). Petrographic analysis suggests the latter underwent retrograde chlorite alteration, consistent with the concentration of data towards the chlorite node (Fig. 10a, d).
The highest concentrations of Co are detected in albite–calcsilicate rocks (up to 2190 ppm) and albitite (up to 1445 ppm) between the albite–chlorite end members, as well as in biotite–calcsilicate rocks (up to 2150 ppm) and mineralized mica schists (up to 1880 ppm) when close to the muscovite node (Fig. 10c, f). When considering that albitization is a pre-mineralization event, lithologies that experienced this type of alteration most likely generated a nano-scale porosity that provided potential pathways for the early Co- and late Au-transporting fluids. This scenario could explain the enrichments of Co, as well as Au in the competent albite-bearing rocks (Fig. 10b–c, e–f). Important to note is that the rocks that experienced the late sericitization (e.g., mica schists) not only record the highest Au, but also have high Co concentrations.
5.5 Trace elements and sulfur isotopes in pyrite
5.5.1 Trace elements
The three categories of texturally distinct pyrite types (A, B and C) are further distinguished by their respective trace element compositions. The descriptive statistics of trace element concentrations from each pyrite type are reported in Table 3 and provide an overview of minimum, median, geometric mean and maximum values of elements recorded within the pyrite structure.
Table 3Summary of the trace element composition of pyrite A, B and C (in ppm), as well as results of the sulfur isotopic analyses (in ‰).
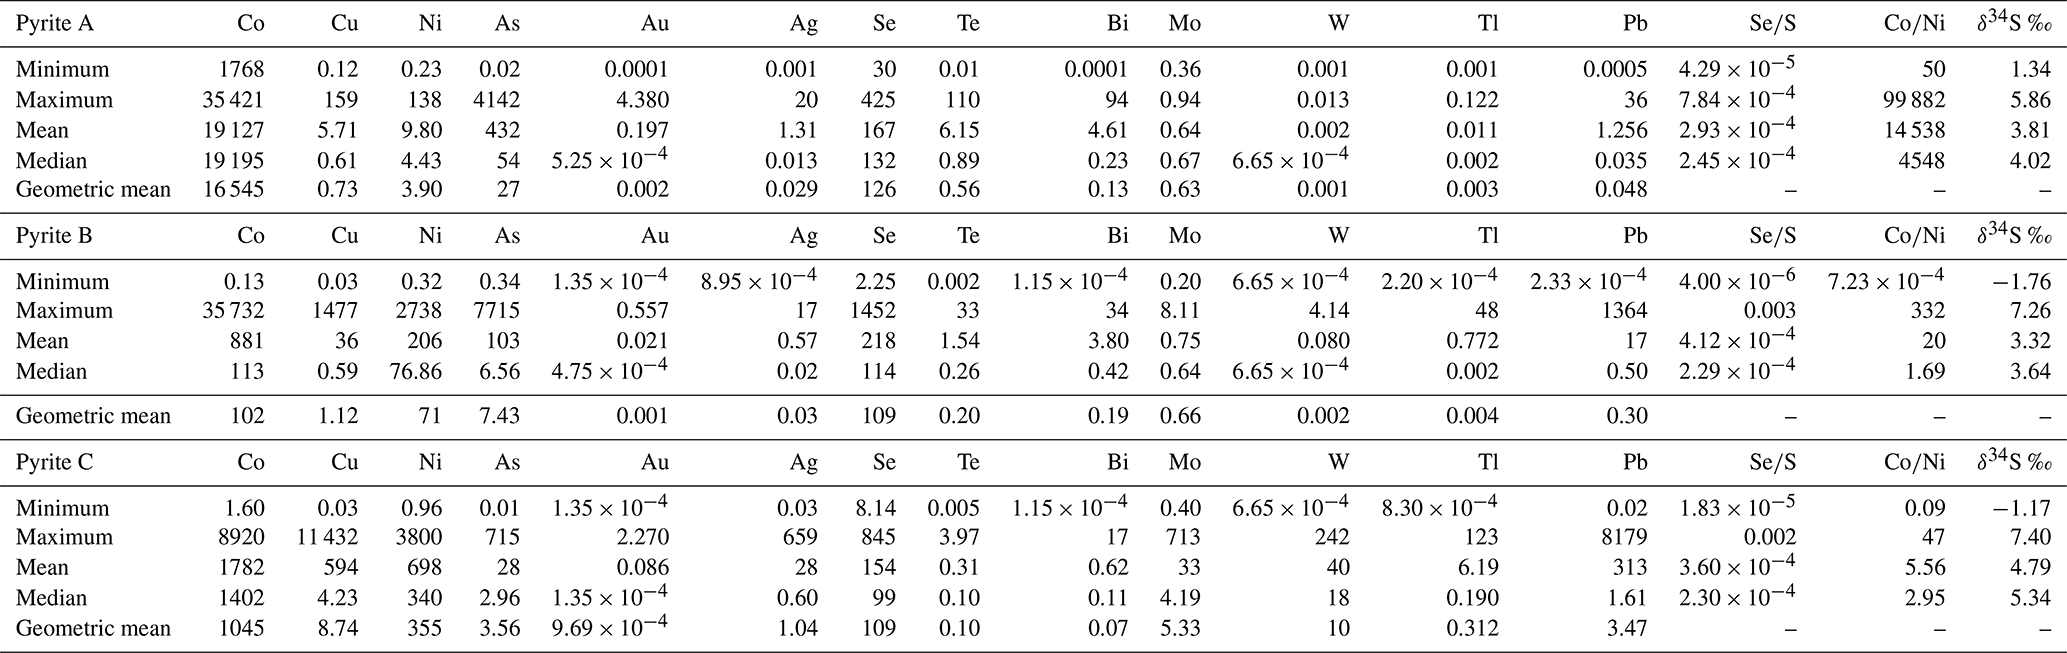
Accordingly, rock-foliation-related pyrite A is enriched in Co (up to 3.5 %) and contains up to 4142 ppm As (Fig. 11). Further compositional characteristics are significant concentrations of Au (up to 4.38 ppm), Bi (up to 94.45 ppm), Se (up to 425.4 ppm) and Te (up to 110.4 ppm), but low concentrations of Ni (up to 138 ppm), Cu (up to 158 ppm), Mo (up to 0.94 ppm) and W (up to 0.01 ppm; see Table 3 and Fig. 11). Trace element concentrations of recrystallized pyrite B are irregular and cover a broad compositional field. The majority of cobalt data are distributed between 20.6 ppm and 3.5 %. As an effect of core to rim zoning, wide variations of cobalt, ranging between 2 and 5900 ppm, are predominately detected in pyrite porphyroclasts. The porphyroclasts also show wide ranges in Ni (4 to 2738 ppm), As (0.34–346.3 ppm), Se (19.5–1453 ppm) and Pb (0.01–1365 ppm). Noteworthy are traces of Mo (up to 1.8 ppm), W (up to 0.4 ppm), Te (up to 33 ppm) and Au (up to 0.6 ppm). No compositional zoning is reported from the late fracture-related pyrite C, which is also distinct from other types of pyrite due to elevated Ni contents (up to 3800 ppm). Apart from nickel, this pyrite type is characterized by enrichments in Co (up to 8920 ppm) and the highest concentrations of Mo (up to 713 ppm), Au (up to 2.27 ppm), Cu (up to 1.14 %), Pb (up to 8179 ppm), Tl (up to 123 ppm) and W (up to 242 ppm; Fig. 11). Regarding ratios, pyrite A covers a relatively narrow range with the lowest mean value of , while pyrite B displays a much wider scattering of (from to 0.003) and a mean value of ; the ratio in pyrite C has an overall mean value of (see Table 3).
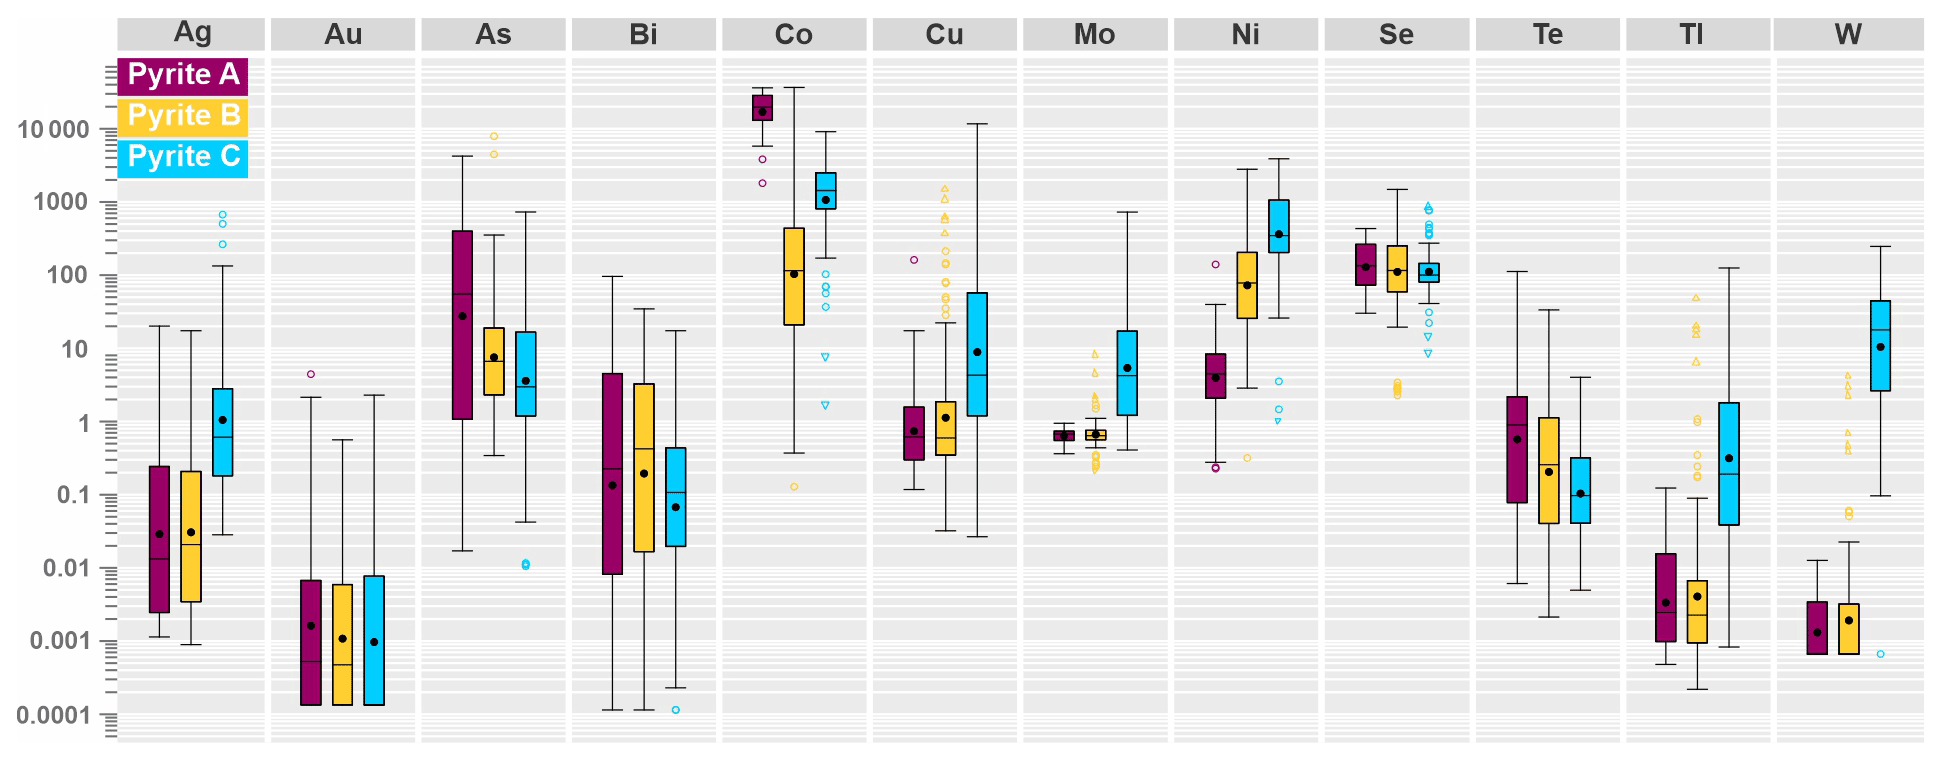
Figure 11Logarithmic-scaled boxplot illustrating the range in concentration of metals and pathfinder elements in analyzed pyrite A, B and C by LA-ICP-MS.
In order to avoid unstable results or misinterpretations for the subsequent multivariate analysis, a set of variables that includes metals and pathfinder elements with distinct compositional differences between all three pyrite types is used. The boxplot in Fig. 11 shows the 12 elements that will be entered into the PCA as clr-transformed variables (As, Co, Cu, Ni, Mo, Tl and W, Ag, Au, Se, Bi and Te). After performing the PCA from the n=260 dataset, certain element groupings are observed in the biplots of Fig. 12, which only include principal components with eigenvalues >1 (see Table 4).
Table 4Results from principal component analysis from the n=260 trace element data from pyrite, including the 12 variables in relation to the first three principal components, which contain most of the data variance (see corresponding eigenvalues). The proportion of the variance in each eigenvector is displayed as the percentage of the explained variance. The first three elements with the largest positive and negative loadings along the positive and negative axis of each PC are marked in bold print.
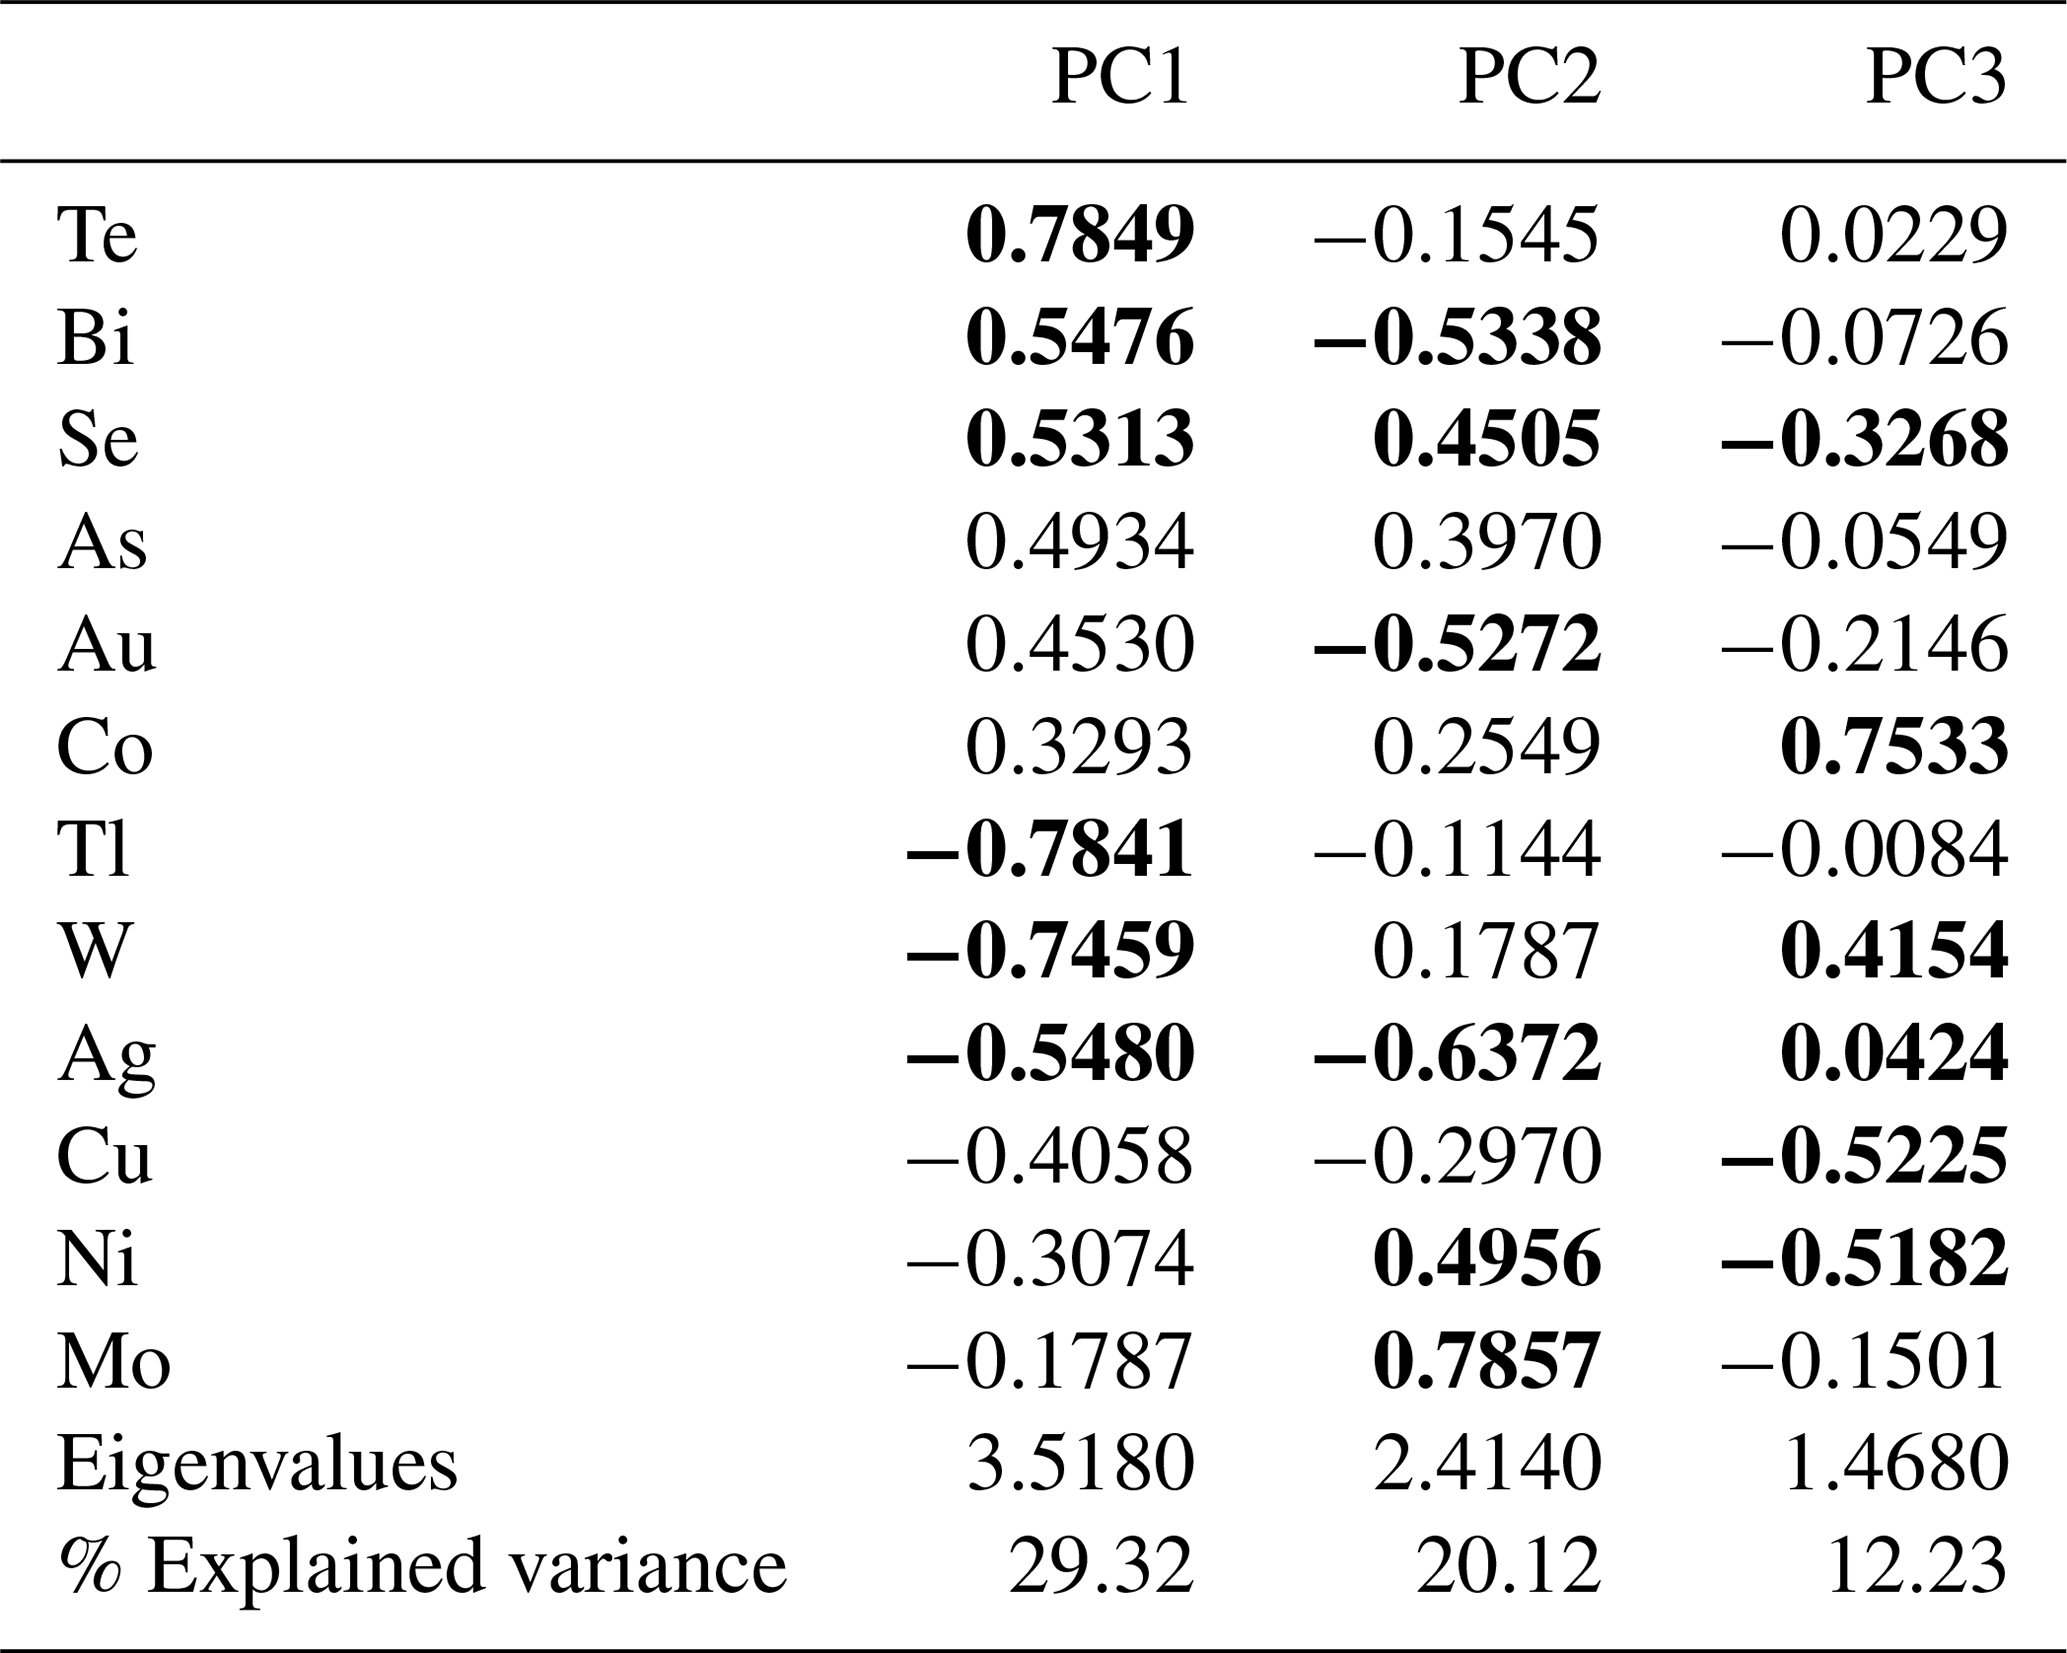
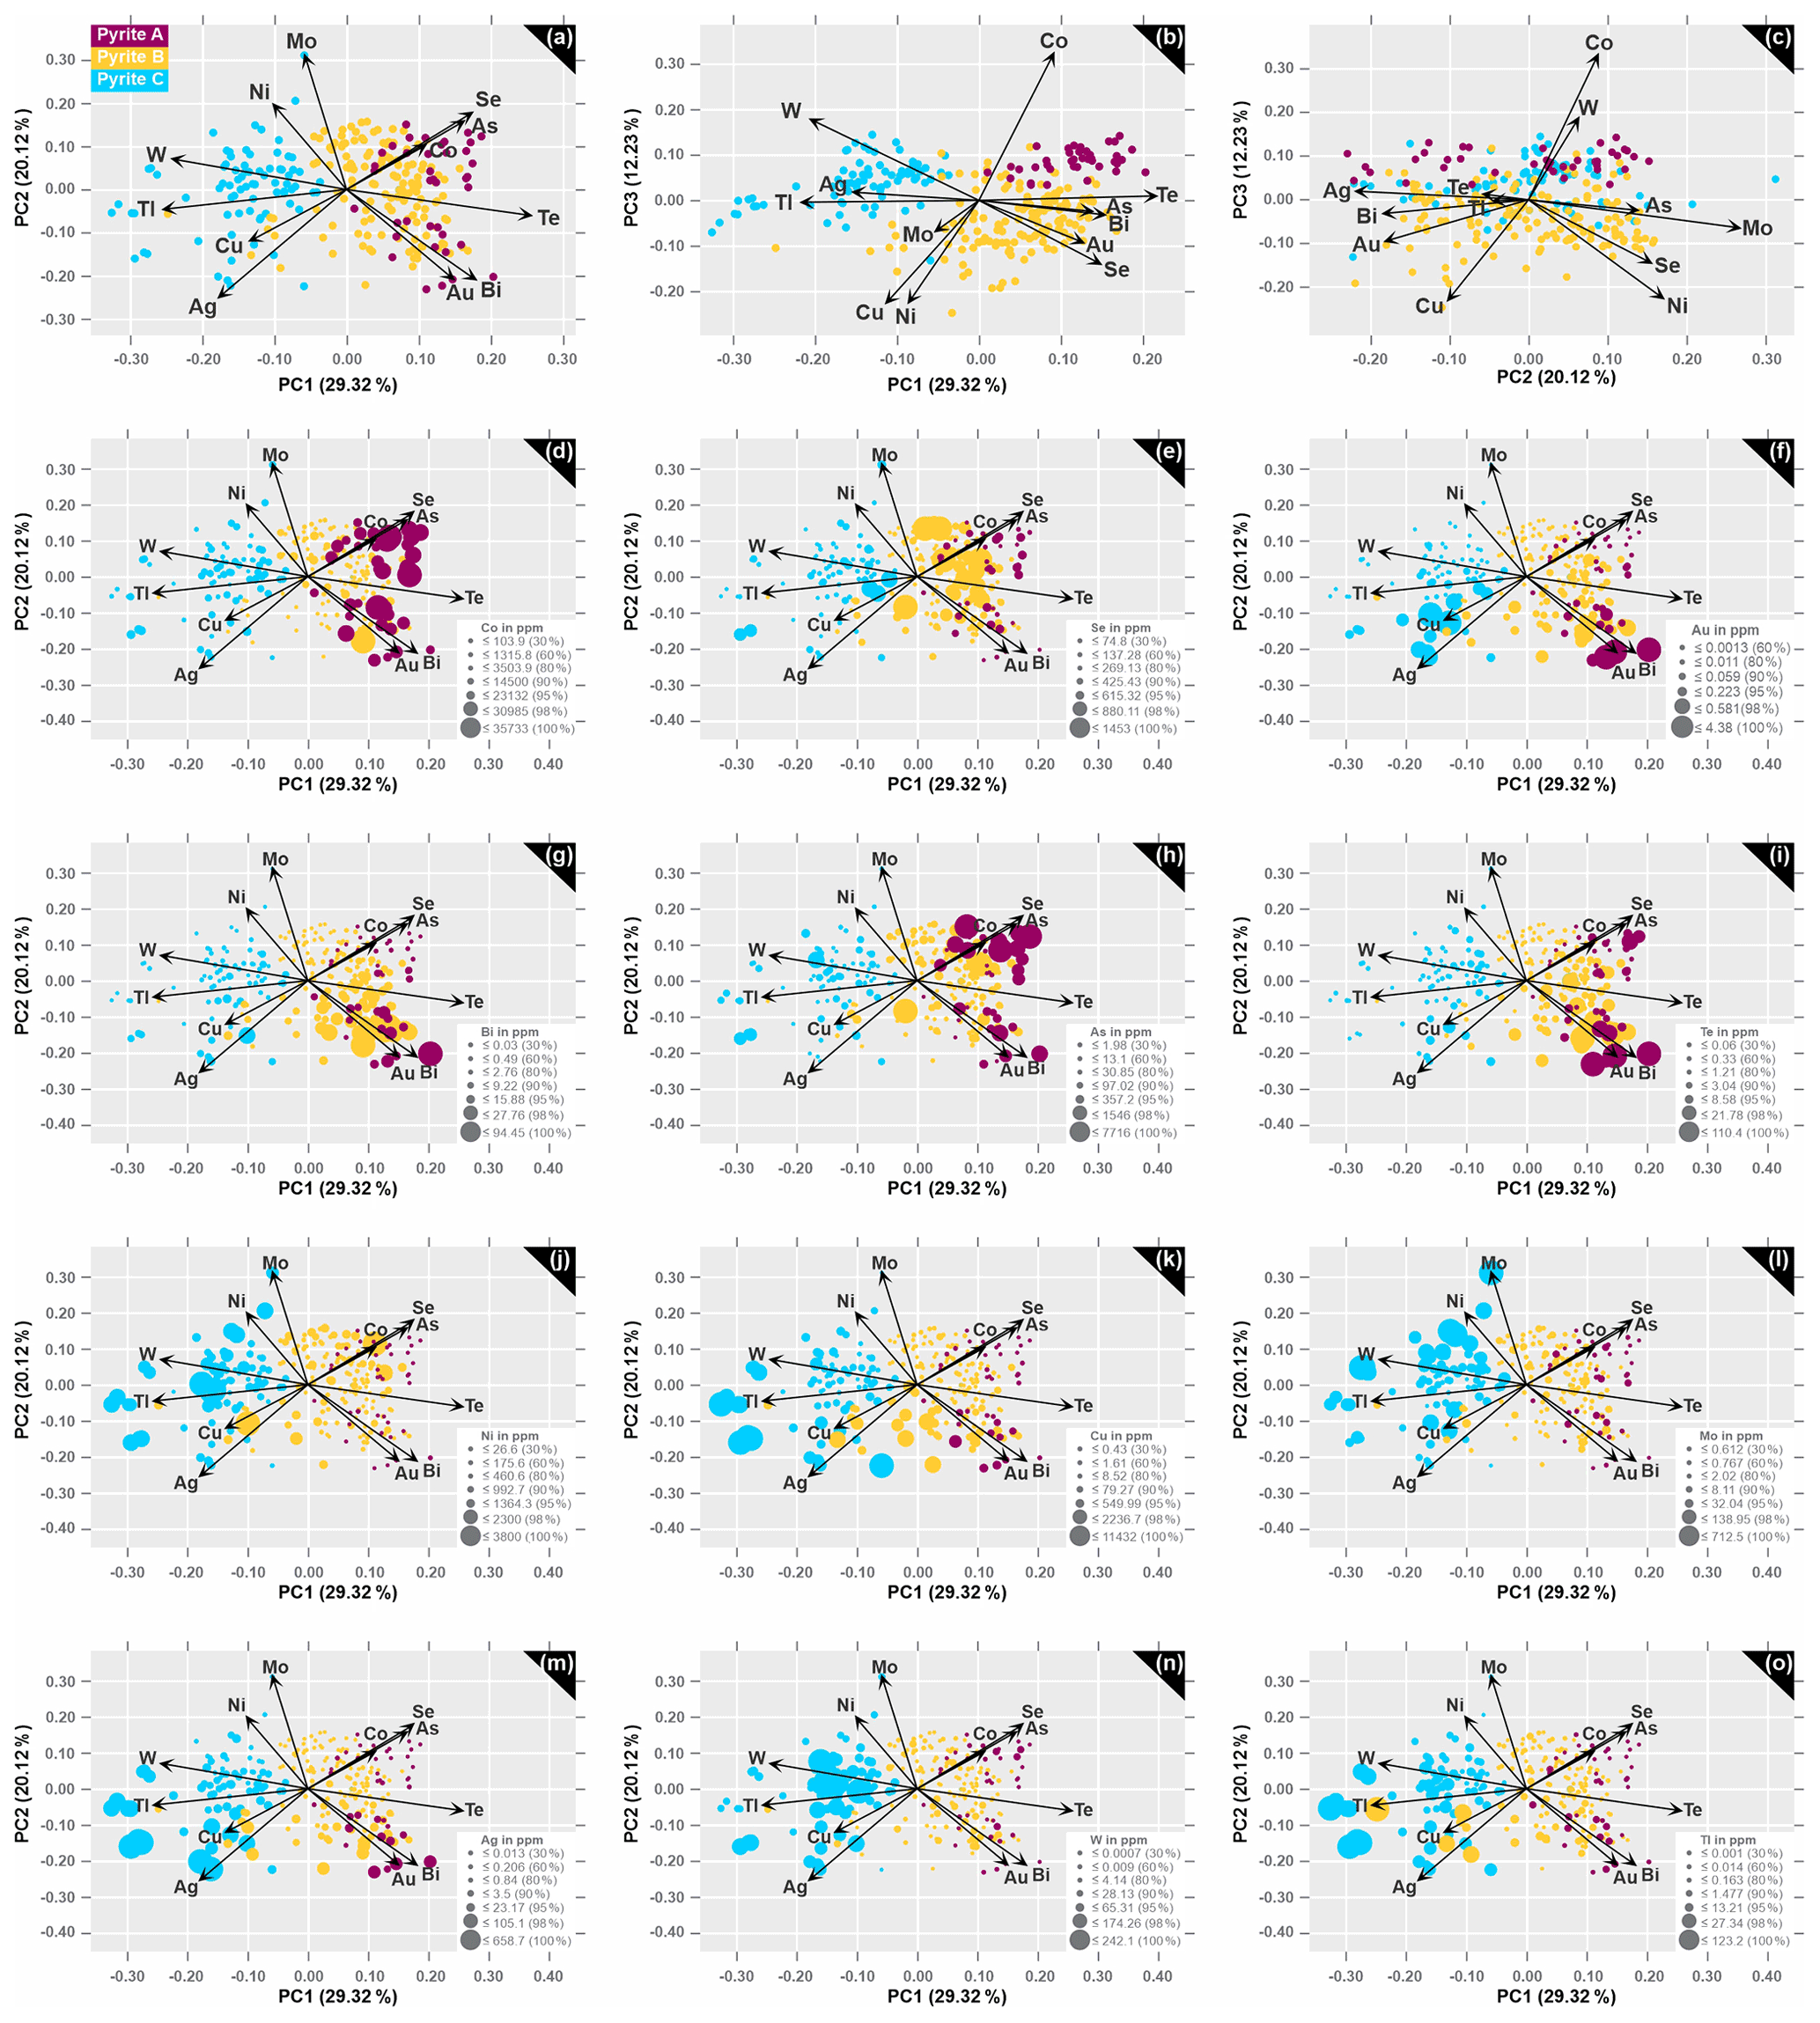
Figure 12Principal component loadings (arrows) and scores (observations) of clr transformed n=260 data. Original data are the analysis of pyrite A, B and C by LA-ICP-MS. Biplots illustrate the projections of the first three principal components: (a) PC1 versus PC2 (49.44 % of the data variability), (b) PC1 versus PC3 (41.55 % of the data variability) and (c) PC2 versus PC3 (32.35 % of the data variability. PC1–PC2 projection in correlation with concentrations of (d) Co, (e) Se, (f) Au, (g) Bi, (h) As, (i) Te, (j) Ni, (k) Cu, (l) Mo, (m) Ag, (n) W, and (o) Tl.
The foliation-related generations of pyrite A and B are chiefly concentrated in the right part of the PC1–PC2 projection, which represents a total of 49.44 % of the data variability. This domain is characterized by positive loadings of Te, Bi, Se, As, Au and Co onto PC1 (Fig. 12a; Table 4). In contrast, the late fracture-related pyrite C is scattered along the negative axis of PC1 on the left part of the plot, which highlights the loadings of Tl, W, Ag, Cu and Mo (Fig. 12a; Table 4). The disassociation between these two element groups builds the basis to distinguish between the early (A and B) and late generation pyrites (C) and is expressed as the new variable PC1. Regarding PC2, it is particularly noticeable that the observations from pyrite A form two distinct groups along the positive and negative axes, which correspond to the positive loadings of As, Se and Co and to negative loadings of Au, Bi and ± Te, respectively (Fig. 12a). Additional elements with positive loadings onto PC2 are Mo, Ni and W, while Ag, Tl and Cu are restricted to the negative space of PC2. Although most of the variance is captured by the first two principal components, the PC1–PC3 projection still accounts for a total of 41.55 % of the data variability and carries information which is worth being presented (Fig. 12b). Particularly notable in this plot is the clear distinction between pyrite A and B along the positive and negative axis of PC3, respectively. The high positive loadings of Co and the large negative loading of Ni onto PC3 correspond well with the chemistry of Co-rich but Ni-poor pyrite A. Most of the observations from pyrite B are essentially distributed within the positive PC1 and negative PC3 space, corresponding to the loadings of As, Bi, Au and Se; pyrite C observations are scattered between the loadings of Tl, Ag and W along the negative axis of PC1. The two opposing groups of Au–Bi–Te–Co–As–Se and Ag–Cu–Tl–W–Ni–Mo remain consistent in this projection (Fig. 12a–b). While the PC2–PC3 projection only accounts for 32.35 % of the data variability, it is still capable of differentiating between pyrite A and B, as well as pyrite B and C, along the PC3 axis, with the large positive loadings of Co and W that are essentially opposing the negative loadings of the remaining elements (Fig. 12c; Table 4).
Focusing on the PC1–PC2 projection, which accounts for most of the data variability, it appears that the chemistry of pyrite A reveals much more than just being enriched in Co. Pyrite A is distributed within the Co–As–Se group and the Au–Bi group, which are separated by the loading of Te (Fig. 12d–l). By correlating the concentrations of variables with projected element associations in the loadings plots, it shown that Co and Se concentrations are evenly distributed within the two aforementioned domains (Fig. 12d–e), whereas Au and Bi are only enriched in grains within the Au–Bi group (Fig. 12f–g). Concentrations of As and Te are higher within the positive and negative PC2 space, respectively (Fig. 12h–i). Additional characteristics of pyrite A are the negative correlations between Co–Ni, Co–W, and Au–Tl and almost no correlation between Co–Mo.
In the case of pyrite B, where trace element concentrations fall within a broad range, an interpretation of results may be a difficult task. The PCA, however, helps in this regard and shows the real data structure and clustering. Pyrite B is a major host for Se (Fig. 12e) and contains significant concentrations of As (Fig. 12h), Te (Fig. 12i), Ni (Fig. 12j) and Cu (Fig. 12k). Another noteworthy observation is that high concentrations of Au, Bi, Te and Cu are only valid for observations that plot along the negative axis of PC2.
The fracture-related pyrite C essentially occupies the entire left domain of the PC1–PC2 projection, where observations are scattered between the loadings of Mo, Ni, W, Tl, Cu and Ag. Pyrite C is further enriched in all these redox sensitive elements (Fig. 12j–o) and has a significant Au concentrations when close to the loadings of Cu, Ag, as well as Tl and W (Fig. 12f).
5.5.2 Sulfur isotope data
For most of the pyrite grains both trace element and sulfur isotopes were analyzed by placing the analysis spots next to each other, separated by <30 µm, in order to determine possible correlations. Unfortunately, no significant trends are observed between the trace element and sulfur isotope data. The range of δ34SVCDT data from pyrite is between −1.8 ‰ and +7.4 ‰ (Fig. 13a; Table 3). Pyrite A, which has the highest ratios, displays positive only δ34S signatures (+1.3 ‰ to +5.9 ‰), contrasting with pyrite B (−1.8 ‰ to +7.3 ‰) and pyrite C (−1.2 ‰ to +7.4 ‰; Fig. 13b; Table 3). The standard deviation of δ34SVCDT data for pyrite A is generally smaller (1.3 ‰), compared to pyrite B (2.0 ‰) and pyrite C (2.3 ‰). Pyrite B records diffuse within-grain and within-sample variations of the sulfur isotope compositions, while the heterogeneity of δ34S values from pyrite C seems to be more lithology-dependent. Mafic metavolcanic and biotite–calcsilicate units cover a range of −1.2 ‰ and +5.4 ‰, whereas pyrite C from albitite and albite–calcsilicate rock records measured δ34SVCDT data from +5.3 ‰ to 7.4 ‰.
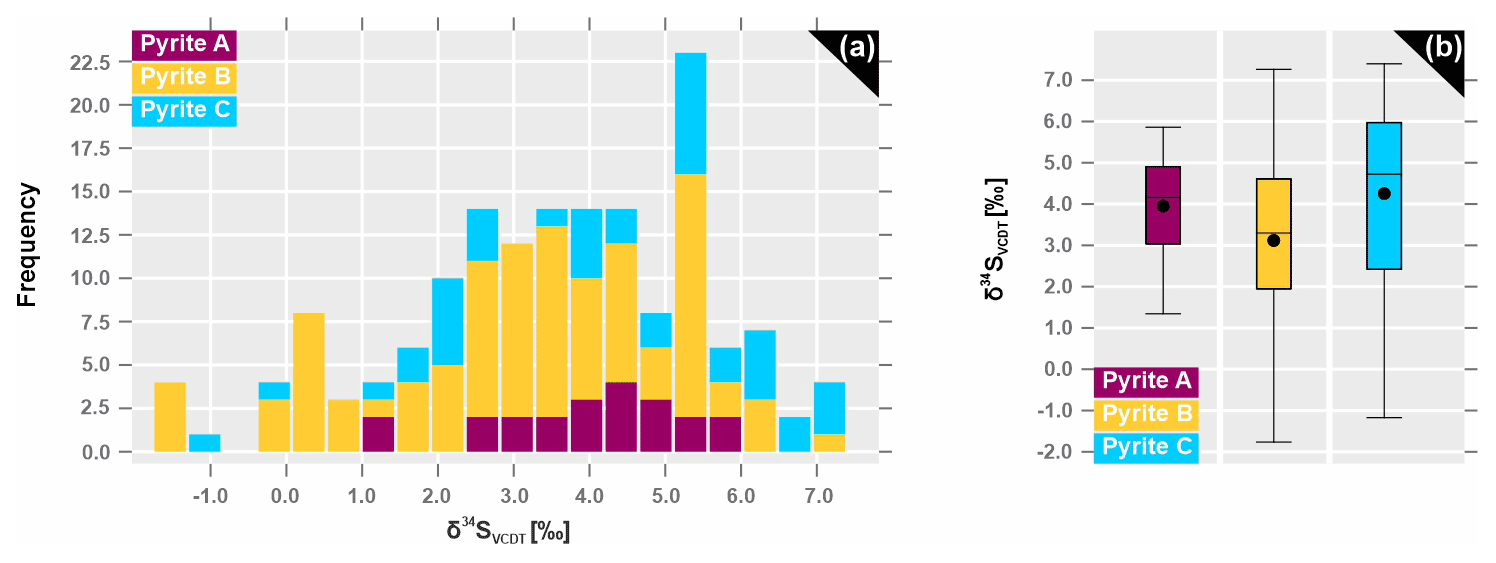
Figure 13Frequency δ34S histograms for (a) analyzed pyrite. (b) Comparison of analyzed δ34S values from pyrite A, B and C.
6.1 Relationship between alteration and concentration of elements in the host rocks
The area of the Rajapalot Au–Co project hosts an epigenetic hydrothermal Au–Co system that has properties comparable to an orogenic gold deposit with atypical metal association. Considering that the supracrustal sequences of the PB formed in an old intracratonic basin, multiple hydrothermal events could have invoked metal precipitation during pre-, syn- and post-orogenic processes (Lahtinen, 2012; Eilu, 2015; Molnár et al., 2016a, 2017; Ranta et al., 2018). There is even the possibility that prior to regional metamorphism the episodic intrusion of felsic and mafic magmas locally altered the supracrustal sequences and thus enabled a pre-metamorphic (uneconomic) enrichment of base metals (Eilu, 2015; Molnár et al., 2017; Ranta et al., 2020). Referring to the PB, rocks at Rajapalot were affected by extensive alteration summarized in three events:
- i.
Regional pre-orogenic or early-metamorphic albitization, which predates the peak deformation and gold mineralization, was caused by greenstone belt-scale hydrothermal circulation of magmatic and/or basinal brines (see Eilu et al., 2003), which prepared the country rocks for a possible pre-enrichment of metals and for later Au-mineralizing processes (Pankka and Vanhanen, 1992; Vanhanen, 2001). In order to discuss the pre-enrichment possibility of metals, we should consider the MER diagrams (Fig. 10), which correlate mineralization with different styles of hydrothermal alteration that have affected the rocks. What stands out immediately is the positive correlation of high Co grades with albitization. This observation either indicates that these rocks were already enriched in cobalt during the basin stage (pre-Svecofennian orogeny) of structural evolution or suggests that extensive albitization had a major control on the Co mineralization (e.g., metal transportation by saline basinal fluids), or else points to an overprint of albitized rocks by the later Co mineralization, unrelated to the albitization event. However, it should be considered that albitization is a process that generates nano-scale porosity, which can provide pathways for early Co-transporting fluids. A further alteration that could have played a role in the Co enrichment is the retrograde chloritization, which affected biotite-rich rocks, such as mafic metavolcanic or biotite–calcsilicate rocks. However, if retrograde chlorite alteration was the event the contributed to Co enrichment, significant amounts of cobalt should be recorded by these rocks, which is not observed from the MER diagrams (<206 ppm).
- ii.
The late Au mineralization is observed in albite-rich rocks, as well as mica schists, some of which are also enriched in Co. These rocks underwent several stages of alteration, such as albitization, chloritization and sericitization producing widely varying rheological hosts to mineralization (Farajawicz and Cook, 2021). These contrasting host rheologies will play a significant part in the design of suitable crushing circuits capable of releasing gold and cobalt into chemical or flotation treatment cells. More specifically, the albite-rich strata are more enriched in Co, while the muscovite-rich units have higher Au concentrations (see Fig. 10). To clarify the succession of mineralizing events, the results from the PCA should be considered, which show the negative correlation of Au and Co, as well as their opposing loadings onto the first three PCs (see Fig. 9 and Table 2). These features suggest that different processes could have generated the Co-only mineralization, which was later overprinted by the Au mineralization, resulting in Co-only and Au–Co zones, respectively.
Nevertheless, the crucial questions in the viewpoint of mineral exploration are whether there is an explanation for the significantly lower Co concentrations in Co-only zones (up to 1085 ppm) compared to the Au–Co zones (up to 2340 ppm), and what could be the reason for the compositional differences within the two distinct Au–Co domains that either give up to 115 ppm Au and 2340 ppm Co when hosted by albitite and mica schists and their contact zones at lower stratigraphic levels or noticeably lower concentrations in gold (up to 2.67 ppm) and cobalt (up to Au and 160 ppm), when distributed within mafic metavolcanic units and underlying by albite–calcsilicate rocks at higher stratigraphic levels. The following scenarios could provide clarification:
- i.
During pre-metamorphic albitization the mobilization of basinal fluids that were moderately enriched in cobalt resulted in the formation of the initial Co-only zones. At a later Svecofennian deformation stage, Au-transporting fluids loaded with Co were deposited during fracturing of the most competent units that now host the highest Au and Co grades (fractured albitite and mica schist), compared to the less competent units (mafic metavolcanics) with Au–Co concentrations.
- ii.
Albitization and the resulting generation of varying porosity properties in host rocks could enable the circulation and precipitation of Co-rich fluids along potential pathways. These units had varying concentrations of Co and were overprinted by late-orogenic Au-only fluids, which preferred the most reactive rock for precipitation.
6.2 Sources and precipitation of cobalt and gold
Here we discuss the possible sources of metals enriched in the two types of ore zones that have been discovered at Raja: (i) the Co-only zones hosted by albitite, amphibolite and biotite–calcsilicate-rich rocks above the main ore body and (ii) the Au–Co zones hosted by fractured albitite and foliated mica schist.
The presence of Co-only zones, as well as the abundance of Co-rich but Ni-poor pyrite (A) and cobaltite, both following the rock foliation, further supports the model of an early cobalt mineralization that was later overprinted by the orogenic gold mineralization. In order to mobilize cobalt, a hydrothermal tetrahedral chloride complex is required, since tetrahedral complexes display a higher affinity for chlorine than octahedral complexes (Brugger et al., 2016). Contrasting to NiCl2(aq) species, which favor higher temperature and higher salinity when transitioning from the octahedral to the tetrahedral forms, tetrahedral CoCl2(aq) species are the overall dominant species at high temperature in solutions with low to moderate salinity (Brugger et al., 2016). Brugger et al. (2016) thus conclude that the solubility of cobalt is more sensitive to salinity than nickel, which is why the mobility of cobalt in chlorine-rich hydrothermal fluids is higher than that of nickel. Considering the intratectonic basinal setting at Rajapalot, the source rocks for the Co-transporting high-salinity fluids could have been the evaporitic Petäjäskoski Formation (see Fig. 2; Ranta et al., 2018). This is in good agreement with the extensive pre-orogenic albitization event, which is widespread in the PB and is typically initiated during sedimentation and diagenetic processes in evaporitic environments (Eilu et al., 2003; Eilu, 2015; Ranta et al., 2018). This pre-orogenic Na metasomatism mechanically prepared the rocks for the Co-rich mineralization within the Co-Only zones. Postdating the albitization, retrograde chloritization resulted in the replacement of biotite, which is why chlorite is locally accompanying the earlier precipitated, foliation-related cobaltite, as well as Co-rich pyrite A. In addition, chlorite–amphibole–magnetite fringes commonly surround the porphyroclastic pyrite B, suggesting that chloritization postdated the Co mineralization, rather than heavily influencing it.
The gold–cobalt mineralization at Raja is hosted by mafic metavolcanic units and underlying albite–calcsilicate rocks and by the stratigraphically lower positioned fractured albitite and foliated mica schists. Deformation promoted the re-activation of major shear zones, along which circulation of metal-rich and Au-bearing hydrothermal fluids was possible (1.84–1.77 Ga). The potential sources for a large-scale fluid mobilization, capable of transporting metals to form an orogenic gold deposit, however, are the subject of discussion. In general, orogenic gold deposits, as defined by Groves et al. (1998), are vertically extensive deposits at crustal depths from 2 to 20 km in accretionary or collisional fore-arc or back-arc settings. The Au-transporting agent is a low-salinity, near-neutral H2O–CO2–(± CH4 ± N2 ± H2S) fluid that possibly formed from metamorphic devolatilization of supracrustal rocks at mid-upper greenschist- to amphibolite-facies conditions (Powell et al., 1991; Phillips and Groves, 1983; Goldfarb et al., 1986, 1988, 1989; Groves et al., 1987; Bierlein and Crowe, 2000; Goldfarb et al., 2001, 2005; Eilu, 2015; Goldfarb and Groves, 2015; Groves et al., 2019; Patten et al., 2020). According to Phillips and Powell (2010), the volume of fluids released from these rocks is enough for the formation of giant deposits. The genetic concept of the supracrustal metamorphic model supported by aforementioned authors emphasizes upwards advection of mineralizing low salinity fluids along fault networks. The migrating reductive fluids that carry gold as thiobisulfide or other sulfuric complexes then deposit the gold into zones of low tensile strength, where it is precipitated from solution by reducing fluid–rock interaction processes, as well as sulfidation reactions (Phillips and Powell, 2010; Garofalo et al., 2014).
Another process that may have influenced the hydrothermal activity that led to a high-grade gold accumulation at Raja is the emplacement of post-orogenic granitic intrusions. However, genetically linking the post-tectonic intrusions with fracture-related gold does not fit the supracrustal metamorphic model. In association with the tectonic evolution of the PB, three emplacement periods of granitic intrusions are distinguished: (i) pre-orogenic Kierovaara granite (1.99 Ga; Ranta et al, 2018), (ii) the syn-orogenic Haparanda series monzonitic intrusions (1.89–1.86 Ga; Perttunen and Vaasjoki, 2001) and (iii) the emplacement of late- to post-orogenic pegmatitic (tourmaline-rich) granites between the 1.79 and 1.77 Ga (Ranta et al., 2015, 2018). The age of the latest, post-tectonic intrusive event falls within the age of gold mineralization, which was estimated by Molnár et al. (2017) to be around 1.78 Ga. Other studies from the Rompas-Rajapalot area (Molnár et al., 2016a; Ranta et al., 2017, 2018) also emphasize that the circulation of gold-bearing fluids along fracture systems could be connected with the post-Svecofennian thermal event (1.79–1.75 Ga) indicated by the post-orogenic granitoid magmatism (1.79–1.77 Ga).
6.3 Signatures and evolution of trace elements in pyrite
The results of the LA-ICP-MS analyses provide an insight into the trace element geochemistry of texturally different pyrite types that show systematic compositional variations which are not reflected in the bulk rock chemistry (Large et al., 2009; Duran et al., 2015; Cook et al., 2016; Reich et al., 2017). The most abundant trace elements in analyzed pyrites are Co (up to 3.6 %), Cu (up to 1.1 %), As (up to 0.77 %), Ni (up to 0.38 %), Se (up to 0.15 %), Mo (up to 713 ppm), Ag (up to 659 ppm), W (up to 242 ppm), Tl (up to 123 ppm), Te (up to 110 ppm), Bi (up to 94 ppm) and Au (up to 4.38 ppm). Considering that divalent cations such as Cu2+ (0.54 Å), Co2+ (0.65 Å) and Ni2+ (0.69 Å) are involved in isovalent substitution with Fe2+ (0.61 Å), their anomalous concentrations within the pyrite structure are less surprising (George et al., 2018). Cations involved in coupled heterovalent substitution of 2Fe2+ are Cu+, As3+, Mo4+, Ag+, W6+ and Au+, Au3+, Tl+, Bi3+ (George et al., 2018; Deditius et al., 2009). Elements involved in the anion substitution of S are As, Sb, Se and Te, as they can play the role of cations and anions (George et al., 2018).
At Raja, the PC1 carries enough information about the pyrite trace element chemistry, to distinguish between the early Co mineralization (pyrite A and B) with positive loadings of Se, As, Co, Te, Bi and Au and the late Au mineralization (pyrite C) with negative loadings of Mo, Ni, W, Tl, Cu and Ag (see Fig. 12, and Table 4).
The dominant characteristics between Co and Ni in the PC1–PC2 projection are their opposing loadings onto PC1 and their negative correlation (see Fig. 12 and Table 4). The pyrite data cluster very well in this plot, and concentrations of both elements are always present above their respective detection limits. Such a behavior is not observed from the whole-rock data, in which Co and Ni have a positive correlation in Au–Co zones, as well as in Co-only zones. At the scale of pyrite crystals however, a somewhat positive correlation of Ni and Co is chiefly observed in pyrite C, while a negative correlation characterizes the pyrite A type (high ratio) and no correlation in the pyrite B type (Table 3). This wide range of is further reflected in the PC1–PC3 projection, where PC3 is dominated by the Co and Ni loadings, which however have an inverse positioning. Such observations indicate a non-uniform evolution of Co and Ni in pyrite during pre-, syn-, and late-orogenic processes (Table 1).
Another important feature of Raja pyrites is the behavior of arsenic, which shows a positive correlation with Co, Te and Se. The Co–As association is in good agreement with the presence of foliation-related cobaltite and Co-enriched pyrite A, while the As, Te and Se association can be interpreted as an anion substitution for S, considering that all three elements can play the role of anions in pyrites (George et al., 2008). Despite the high concentrations of As (up to 7715 ppm), only a minority of pyrite grains at Raja contain Au concentrations above the detection limit with a maximum of 4.38 ppm. Deditius et al. (2014) have demonstrated that invisible Au and As generally correlate positively in pyrite when As contents are above 0.01–0.1 wt %, and that both elements favor precipitation at decreasing temperatures (between 500 and 200 ∘C) in various type of gold deposits. According to the trace element compositions of pyrite in our study, however, Au concentrations are independent of the As content: this is in agreement with presence of free gold in the Au–Co ore at Raja. In addition, the PC1–PC2 projection displays opposing As and Au loadings along the axis of PC2 (see Fig. 12a and Table 4). The PC3, however, points out that some grains could show an association between Au and As, when considering their negative loadings (see Fig. 12b). Particularly noteworthy is the positive correlation of Au and the Bi–Te association in all PC projections. Referring to petrography, this observation is consistent with the overall association of native Au with Bi–Te-rich phases in mineralized sections. The Au and Bi signature could further indicate the coupled substitution 2Fe2+ ↔ Au+ + Bi3+ (George et al., 2008). A geochemical affinity between Au and Bi is common and has been reported from different deposits (Nurmi and Sorjonen-Ward, 1993; Skirrow and Walshe, 2002; George et al., 2008).
Additional significant geochemical patterns observed from the pyrite chemistries are the negative loadings of Mo, Ni, W, Tl, Cu and Ag that are opposing the positive loadings of Co, As, Se, Te, Bi and Au along the axis of PC1. All elements within the negative space of PC1 are enriched in the fracture-related pyrite C, which is part of the late molybdenite–scheelite-native gold–Bi–Te-rich phases and fracture-related chalcopyrite assemblage. In addition, Mo, Ni and W have positive loadings onto PC2, opposing the negative loadings of Tl, Ag and Cu. According to Dmitrijeva et al. (2020), the significant W and Mo signals in pyrite represent newly precipitated sub-micron-scale scheelite and molybdenite phases that are the products of a coupled dissolution–reprecipitation reaction of a parent W–Mo-bearing hematite. Regarding the divalent cations in pyrite C, their presence is likely due to the replacement of Fe2+ ↔ Ni2+ (or Cu2+). Additionally, the noteworthy concentrations of Cu, Tl and Ag could be explained by the two following coupled substitutions: (i) 2Fe2+ ↔ Tl+ + Sb3+ (D'Orazio et al., 2017) and (ii) 2Fe2+ ↔ (Cu, Ag)+ + Sb3+. Considering the remarkable positive correlations among these elements, their incorporation in the pyrite structure via substitution for Fe2+ is likely. Alternatively, Tl, Ag and Cu could be incorporated into nanoparticles within pyrite, commonly observed in hydrothermal ore systems that host pyrites with a wide range of trace elements (Deditius et al., 2011). Scenarios that could facilitate the formation of nanoparticles include a direct precipitation from hydrothermal fluids or exsolution from the pyrite matrix (Palenik et al., 2004; Deditius et al., 2011). Although a careful data checking of LA-ICP-MS ablation profiles for possible ablated inclusions was carried out, the presence of nanoparticles containing portions of trace elements should not be excluded (Cook et al., 2009). In order to determine whether the relatively high concentration of all analyzed trace elements in Raja pyrites is due to nanoparticles would require detailed high-resolution transmission electron microscopic measurements, which however is beyond the scope of this study.
6.4 Signatures of sulfur isotopes in pyrite and ore-forming processes
The overall δ34SVCDT data of pyrite grains at Raja are between −1.8 ‰ and +7.4 ‰, covering a common range of sulfur isotope composition for orogenic gold deposits (Molnár et al., 2016a). Considering the similarities of δ34SVCDT values in each pyrite type, these signatures are not diagnostic, but rather indicative of anomalous Co or Au zones. However, the combined use of trace element geochemistry and S-isotopic signatures in pyrite can help to interpret the behavior of S, hydrothermal processes, fluid–rock interactions and accumulation of metals during the formation of the Raja Au–Co prospect.
Formation of foliation-related pyrite A was facilitated by Co-transporting hydrothermal fluids in a reduced environment. More specifically, the δ34SVCDT values of the early Co-enriched pyrite A type only record positive results between +1.3 ‰ and +5.9 ‰. This range indicates a largely homogenous reduced source of sulfur, which is either related to a reduced magmatic and sedimentary environment or to a reducing fluid that was released during prograde metamorphic devolatilization of metasedimentary rocks (Seal, 2006; Molnár et al., 2016a). This is probably also reflected in the relatively homogenous trace element characteristics of the majority of pyrite A, as well as in the homogenous ratios (see Table 3). Eventually these fluids could have originated from the evaporitic Petäsjäskoski Formation and caused extensive albitization, as well as a significant pre-enrichment of cobalt. Considering that significant concentrations of Au are detected in this pyrite type, we further propose an early, local deposition of gold.
The significant changes in ratios in pyrite B, and the wider range in sulfur isotopic values (−1.8 ‰ to +7.3 ‰), as well as the erratic within-grain variations of δ34SVCDT (up to 4 ‰), may be caused by the variation in the redox conditions in the fluid system (Ohmoto, 1972; Hodkiewicz et al., 2009; Molnár et al., 2016b). Such a variation is not uncommon in magmatic hydrothermal systems with predominantly magmatic origin of sulfur. However, mixing of sulfur from different sources (e.g., from magmatic fluids and from metasediment-related fluids) cannot be excluded and in this latter case the elevated δ34SVCDT values may indicate influx of sedimentary sulfur produced by sulfate-reducing bacteria. It appears that pyrite B characterizes a stage between the older Co-rich pyrite A and the younger Ni-rich pyrite C endmember, during which the wide compositional ranges of trace elements and sulfur isotopes indicate either the changing redox conditions of the system or a mixing of reduced and oxidized fluids from the pyrite A and pyrite C stages, respectively.
The documented wider range δ34SVCDT values for pyrite C (−1.2 ‰ to +7.4 ‰), as well as the elevated concentrations of redox sensitive elements (Ni, Cu, W, Ag, Hg, Mo and Zn), may also indicate the occasional shift of conditions to a more oxidizing state. The Ni-rich nature of the fracture-related pyrite C, its close relation to the gold mineralization, and the fluctuations in sulfur isotopic data could provide a link to the latest, post-tectonic intrusive event at PB that not only falls within the age of gold mineralization (1.78 Ga; Molnár et al., 2017; Ranta et al., 2018), but also could have induced magmatic fluid circulation that was potentially involved in the formation of some of orogenic gold deposits (Dubé and Gosselin, 2007; Duuring et al., 2007; Kitney et al., 2011; Molnár et al., 2016a, b, 2017).
The purpose of this study was to establish new synthetic geochemical variables by combining the whole-rock geochemistry with a robust database on trace element measurements of different pyrite types in an orogenic gold-base metal setting. We conclude that these results not only have the capacity to define the metallogenic potential of the host rock but also are capable of distinguishing various stages of mineralization. Even though this method requires a sophisticated laboratory background with a LA-ICP-MS analytical infrastructure, sampling, as well as petrographic observation prior to analysis, acquiring the laser-based analytical data is a relatively quick process that generates data significantly faster than the whole-rock geochemical approach. By compiling a large geochemical database for pyrite and other sulfides from different orogenic Au systems in northern Finland (Raič et al., 2022), discrimination patterns can be established, which will help to define the metallogenic context for target areas with more accuracy. Pairing of these results with the sulfur isotopic signatures of measured pyrites allows detection of varying redox conditions, which is crucial when trying to delineate future target areas. This study further shows that with appropriate log-ratio transformations, principal components can be computed, which provide an insight into the true structure and unravel subtle geochemical patterns associated with ore-forming processes. Results from these multivariate statistical data analyses may help to define future targets in the Rajapalot project, and potentially elsewhere in hydrothermal zones with Au–Co (base metals) in northern Finland, and are summarized as follows.
Geochemical variables identified from the whole-rock geochemical dataset suggest that host lithologies of Au–Co zones are in favor of an As–Au–Se–Te–W–U signature along the positive axis of PC1. The negative PC2 represents the group of elements Ni, Cu, Co, Te, Se and As, which are a characteristic association in Co-only zones, whereas the Sn–Tl group along the positive axis of PC2 will point to barren zones.
The systematic study of trace element geochemistry in pyrite indicates that a foliation-related pyrite (A), enriched in Co and As with homogenous sulfur isotopic characteristics (+1.3 ‰ to +5.9 ‰) and positive loadings of Co, Se, As, Te, Bi and Au onto PC1, is reflective of an early stage of Co mineralization. However, a fracture-related pyrite (C) with low ratios, a wider range in S-isotopic values (−1.2 ‰ and +7.4 ‰), and negative loadings of Mo, Ni, W, Tl, Cu and Ag along PC1 serves as the indicator sulfide for the Au-mineralizing event. These results are particularly useful for predicting high-grade ore zones. Unlike traditional bulk sample data, the trace element content of pyrite has the capacity to reflect the availability of trace elements throughout the evolution of an orogenic gold deposits. These properties have the potential to be incorporated as standard analytical techniques in the early stages of mineral exploration.
In the current work we used the software GLITTER™ (http://www.glitter-gemoc.com/GLITTER-45_p_12.html, GLITTER Team, 2021) and ioGAS™ 7.2 (https://reflexnow.com/product/iogas/, IMDEX Limited August 2019, 2021).
The geochemical data are owned by Mawson Gold Ltd and are available on request.
FM was the project leader, who was responsible for the conceptualization, theoretical framework and methodology, the planning, coordination, scientific input, and review of this paper. FM and SR sampled the drill cores. SR is responsible for the petrography, data generation, application of analytical methods described, as well as the implementation of software. SR wrote the article. NC provided the samples, the whole-rock geochemical data, geophysical data, geological maps and drilling updates. NC contributed, with his expertise, constructive comments, discussion and suggestions to this paper. HO is the laboratory manager for the LA-SC-ICP-MS at the Geological Survey of Finland, who contributed, with his scientific and analytical expertise, constructive comments, suggestions and proofreading of this paper. YL is the laboratory manager for the LA-MC-ICP-MS at the Geological Survey of Finland, who contributed with his scientific and analytical expertise to this project.
The contact author has declared that neither they nor their co-authors have any competing interests.
Publisher’s note: Copernicus Publications remains neutral with regard to jurisdictional claims in published maps and institutional affiliations.
This article is part of the special issue “State of the art in mineral exploration”. It is a result of the EGU General Assembly 2020, 3–8 May 2020.
The access to the drill core storage facility owned by Mawson Gold Ltd in Rovaniemi, the logistic support in sampling, as well as the cutting of drill core pieces is gratefully acknowledged. We further thank Janne Kinnunen and Milena Farajewicz for providing geochemical and geophysical datasets, as well as their constructive comments and suggestions in scientific discussions. The authors would like to thank Fernando Tornos and the anonymous reviewer for their constructive comments and detailed review, as well as Liam Bullock for his editorial work.
This project has received funding from the European Union's Horizon 2020 research and innovation program under grant agreement no. 776804 – H2020-SC5-2017.
This paper was edited by Liam Bullock and reviewed by Fernando Tornos and one anonymous referee.
Aitchison, J.: Principal component analysis of compositional data, Biometrika, 70, 57–65, https://doi.org/10.1093/biomet/70.1.57, 1983.
Aitchison, J.: The statistical analysis of geochemical compositions, Math. Geol., 16, 531–564, https://doi.org/10.1007/BF01029316, 1984.
Aitchison, J.: The Statistical Analysis of Compositional Data, J. Roy. Stat. Soc. B Met., 44, 139–160, https://doi.org/10.1111/j.2517-6161.1982.tb01195.x, 1986.
Aitchison, J. and Greenacre, M.: Biplots of compositional data, J. Roy. Stat. Soc. C App., 51, 375–392, https://doi.org/10.1111/1467-9876.00275, 2002.
Armstrong, J. G. T., Parnell, J., Bullock, L. A., Perez, M., Boyce, A. J., and Feldmann, J.: Tellurium, selenium and cobalt enrichment in Neoproterozoic black shales, Gwna Group, UK: Deep marine trace element enrichment during the Second Great Oxygenation Event, Terra Nova, 30, 244–253, https://doi.org/10.1111/ter.12331, 2018.
Barker, S. L. L., Hickey, K. A., Cline, J. S., Dipple, G. M., Kilburn, M. R., Vaughan, J. R., and Longo, A. A.: Uncloaking invisible gold: Use of NanoSIMS to evaluate gold, trace elements, and sulfur isotopes in pyrite from Carlin-type gold deposits, Econ. Geol., 104, 897–904, https://doi.org/10.2113/econgeo.104.7.897, 2009.
Bedrock of Finland – DigiKP: Digital Map Database, Geological Survey of Finland (GTK), available at: https://gtkdata.gtk.fi/kalliopera/index.html#, last access: 6 December 2021.
Bierlein, F. P. and Crowe, D. E.: Phanerozoic orogenic lode gold deposits, Rev. Econ. Geol., 13, 103–139, https://doi.org/10.5382/Rev.13.03, 2000.
Brugger, J., Liu, W., Etschmann, B., Mei, Y., Sherman, D. M., and Testemale, D.: A review of the coordination chemistry of hydrothermal systems, or do coordination changes make ore deposits?, Chem. Geol., 447, 219–253, https://doi.org/10.1016/j.chemgeo.2016.10.021, 2016.
Cook, N. D. and Hudson, M.: Progress Report On The Geology, Mineralization And Exploration Activities On The Rompas-Rajapalot Gold – Cobalt Project, Peräpohja belt, Mawson Resources Ltd, 97 pp., 2018.
Cook, N. J., Ciobanu, C. L., and Mao, J.: Textural control on gold distribution in As-free pyrite from Dongping, Huangtuliang and Hougou gold deposits, North China Craton (Hebei Province, China), Chem. Geol., 264, 101–121, https://doi.org/10.1016/j.chemgeo.2009.02.020, 2009.
Cook, N. J., Ciobanu, C. L., George, L., Zhu, Z.-Y., Wade, B., and Ehrig, K.: Trace Element Analysis of Minerals in Magmatic-Hydrothermal Ores by Laser Ablation Inductively-Coupled Plasma Mass Spectrometry: Approaches and Opportunities, Minerals, 6, 111, https://doi.org/10.3390/min6040111, 2016.
Dare, S. A. S., Barnes, S. J., and Beaudoin, G.: Variation in trace element content of magnetite crystallized from fractionating sulfide liquid, Sudbury, Canada: Implications for provenance discrimination, Geochim. Cosmochim. Ac., 88, 27–50, https://doi.org/10.1016/j.gca.2012.04.032, 2012.
Deditius, A., Utsunomiya, S., Ewing, R. C., Chryssoulis, S. L., Venter, D., and Kesler, S. E.: Decoupled geochemical behavior of As and Cu in hydrothermal systems, Geology, 37, 707–710, https://doi.org/10.1130/G25781A.1, 2009.
Deditius, A. P., Utsunomiya, S., Reich, M., Kesler, S. E., Ewing, R. C., Hough, R., and Walshe, J.: Trace metal nanoparticles in pyrite, Ore Geol. Rev., 42, 32–46, https://doi.org/10.1016/j.oregeorev.2011.03.003, 2011.
Deditius, A. P., Reich, M., Kesler, S. E., Utsunomiya, S., Chryssoulis, S. L., Walshe, J., and Ewing, R. C.: The coupled geochemistry of Au and As in pyrite from hydrothermal ore deposits, Geochim. Cosmochim. Ac., 140, 644–670, https://doi.org/10.1016/j.gca.2014.05.045, 2014.
Dmitrijeva, M., Cook, N. J., Ehrig, K., Ciobanu, C. L., Metcalfe, A. V., Kamenetsky, M., Kamenetsky, V. S., and Gilber, S.: Multivariate Statistical Analysis of Trace Elements in Pyrite: Prediciton, Bias and Artefacts in Defining Minerals Signatures, Minerals, 10, 61, https://doi.org/10.3390/min10010061, 2020.
D'Orazio, M., Biagioni, C., Dini, A., and Vezzoni, S.: Thallium-rich pyrite ores from the Apuan Alps, Tuscany, Italy: constraints for their origin and environmental concerns, Miner. Deposita, 52, 687–707, https://doi.org/10.1007/s00126-016-0697-1, 2017.
Dubé, B. and Gosselin, P.: Greenstone-hosted quartz-carbonate vein deposits, in: Mineral deposits of Canada: a synthesis of major deposit-types, district metallogeny, the evolution of geological provinces, and exploration methods, edited by: Goodfellow, W. D., Geological Association of Canada, Mineral Deposits Division, Special Publication 5, 49–73, 2007.
Duran, C. J., Barnes, S. J., and Corkery, J. T.: Chalcophile and platinum-group element distribution in pyrites from the sulfide-rich pods of the Lac des Iles Pd deposits, Western Ontario, Canada: Implications for post-cumulus re-equilibration of the ore and the use of pyrite compositions in exploration, J. Geochem. Explor., 158, 223–242, https://doi.org/10.1016/j.gexplo.2015.08.002, 2015.
Duuring, P., Cassidy, K. F., and Hagemann, S. G.: Granitoid-associated orogenic, intrusion related, and porphyry style metal deposits in the Archaean Yilgarn Craton, Western Australia, Ore Geol. Rev., 32, 157–186, https://doi.org/10.1016/j.oregeorev.2006.11.001, 2007.
Eilu, P.: Overview on gold deposits in Finland, in: Mineral Deposits of Finland, edited by: Maier, W. D., O'Brien, H., and Lahtinen, R., Elsevier, Amsterdam, 377–403, https://doi.org/10.1016/C2012-0-02750-0, 2015.
Eilu, O., Sorjonen-Ward, P., Nurmi, P., and Niiranen, T.: A Review of Gold Mineralization Styles in Finland, Econ. Geol., 98, 1329–1353, https://doi.org/10.2113/gsecongeo.98.7.1329, 2003.
Farajewicz, M. and Cook, N. D.: Sample Selection for Geometallurgical Characterization in the Rajapalot Deposit. BATCircle Project Report 02 – WP1 Task 1.2, Geol. S. Finl., Rep. of Inves., 9/2021, 29 pp., 2021.
Filzmoser, P., Hron, K., and Reimann, C.: The bivariate statistical analysis of environmental (compositional) data, Sci. Total Environ., 408, 4230–4238, https://doi.org/10.1016/j.scitotenv.2010.05.011, 2010.
Garofalo, P. S., Fricker, M. B., Günther, D., Bersani, D., and Lottici, P. P.: Physical–chemical properties and metal budget of Au-transporting hydrothermal fluids in orogenic deposits, Geol. Soc. Lond. Spec. Publ., 402, 71–102, https://doi.org/10.1144/SP402.8, 2014.
George, L. L., Biagioni, C., D'Orazio, M., and Cook, N. J.: Textural and trace element evolution of pyrite during greenschist facies metamorphic recrystallization in the southern Apuan Alps (Tuscany, Italy): Influence on the formation of Tl-rich sulfosalt melt, Ore Geol. Rev.,102, 59–105, https://doi.org/10.1016/j.oregeorev.2018.08.032, 2008.
George, L. L., Biagioni, C., D'Orazio, M., and Cook, N. J.: Textural and trace element evolution of pyrite during greenschist facies metamorphic recrystallization in the southern Apuan Alps (Tuscany, Italy): Influence on the formation of Tl-rich sulfosalt melt, Ore Geol. Rev., 102, 59–105, https://doi.org/10.1016/j.oregeorev.2018.08.032, 2018.
Gilbert, S. E., Danyushevsky, L. V., Rodermann, T., Shimizu, A., Gurenko, A., Meffre, S., Thomas, H., Larger, R. R., and Death, D.: Optimisation of laser parameters for the analysis of sulphur isotopes in sulphide minerals by laser ablation ICP-MS, J. Anal. Atom. Spectrom., 29, 1042–1051, https://doi.org/10.1039/C4JA00011K, 2014.
GLITTER Team: Data reduction software for the laser ablation microprobe, GLITTER™ [code], available at: http://www.glitter-gemoc.com/GLITTER-45_p_12.html, last access: 3 September 2021.
Godel, B., Barnes, S. J., and Maier, W. D.: Platinum-group elements in sulphide minerals, platinum-group minerals, and whole-rocks of the Merensky Reef (Bushveld Complex, South Africa): Implications for the formation of the reef, J. Petrol., 48, 1569–1604, https://doi.org/10.1093/petrology/egm030, 2007.
Goldfarb, R. J. and Groves, D. I.: Orogenic gold: Common or evolving fluid and metal sources through time, Lithos, 223, 2–26, https://doi.org/10.1016/j.lithos.2015.07.011, 2015.
Goldfarb, R. J., Leach, D. L., Miller, M. L., and Pickthorn, W. J.: Geology, metamorphic setting, and genetic constraints of epigenetic lode-gold mineralization within the Cretaceous Valdez Group, south-central Alaska, Geological Association of Canada, Special Paper, 32, 87–105, 1986.
Goldfarb, R. J., Leach, D. L., Pickthorn, W. J., and Paterson, C. J.: Origin of lode-gold deposits of the Juneau gold deposit, southeastern Alaska, Geology, 16, 440–443, https://doi.org/10.1130/0091-7613(1988)016<0440:OOLGDO>2.3.CO;2, 1988.
Goldfarb, R. J., Leach, D. L., Rose, S. C., and Landis, G. P.: Fluid inclusion geochemistry of gold-bearing quartz veins of the Juneau Gold Belt, southeastern Alaska; implications for ore genesis, Econ. Geol. Monogr., 6, 363–375, https://doi.org/10.5382/Mono.06.28, 1989.
Goldfarb, R. J., Groves, D. I., and Gardoll, S.: Orogenic gold and geologic time: a global synthesis, Ore Geol. Rev., 18, 1–75, https://doi.org/10.1016/S0169-1368(01)00016-6, 2001.
Goldfarb, R. J., Baker T., Dubé, B., Groves, D. I., Hart, C. J. R., and Gosselin, P.: Distribution, character, and genesis of gold deposits in metamorphic terranes, Econ. Geol., 100th Anniv. Vol., 407–450, https://doi.org/10.5382/AV100.14, 2005.
Gregory, D. D., Lyons, T. W., Large, R. R., Jiang, G., Stepanov, A. S., Diamond, C. W., Figueroa, M. C., and Olin, P.: Whole rock and discrete pyrite geochemistry as complementary tracers of ancient ocean chemistry: An example from the Neoproterozoic Doushantuo Formation, China, Geochim. Cosmochim. Ac., 216, 201–220, https://doi.org/10.1016/j.gca.2017.05.042, 2017.
Groves, D. I., Phillips, G. N., Ho, S. E., Houstoun, S. M., and Standing, C. A.: Craton-scale distribution of Archean greenstone gold deposits; predictive capacity of the metamorphic model, Econ. Geol., 82, 2045–2058, https://doi.org/10.2113/gsecongeo.82.8.2045, 1987.
Groves, D. I., Goldfarb, R. J., Gebre-Mariam, M., Hagemann, S. G., and Robert, F.: Orogenic gold deposits. A proposed classification in the context of their crustal distribution and relationship to other gold deposit types, Ore Geol. Rev., 13, 7–27, https://doi.org/10.1016/S0169-1368(97)00012-7, 1998.
Groves, D. I., Santosh, M., Deng, J., Wang, Q., Yang, L., and Zhang, L.: A holistic model for the origin of orogenic gold deposits and its implications for exploration, Miner. Deposita, 55, 275–292, https://doi.org/10.1007/s00126-019-00877-5, 2019.
Hanski, E.: Synthesis of the geological evolution and metallogeny of Finland, in: Mineral Deposits of Finland, edited by: Maier, W. D., O'Brien, H., Lahtinen, R., Elsevier, Amsterdam, 39–71, https://doi.org/10.1016/B978-0-12-410438-9.00002-9, 2015.
Hanski, E., Huhma, H., and Perttunen, V.: SIMS U-Pb, Sm-Nd isotope and geochemical study of an arkosite-amphibolite suite, Peräpohja Schist Belt: evidence for ca. 1.98 Ga A-type felsic magmatism in northern Finland, B. Geol. Soc. Finland, 77, 5–29, https://doi.org/10.17741/BGSF/77.1.001, 2005.
Hodkiewicz, P. F., Groves, D. I., Davidson, G. J., Weinberg, R. F., and Hagemann, S. G.: Influence of structural setting on sulphur isotopes in Archean orogenic gold deposits, Eastern Goldfields Province, Yilgarn, Western Australia, Miner. Deposita, 44, 129–150, https://doi.org/10.1007/s00126-008-0211-5, 2009.
Holland, S. M.: Principal Components Analysis (PCA), in: Encyclopedia of Environmental Change, edited by: Matthews, J. A., SAGE Publications, Ltd., 1–12, https://doi.org/10.4135/9781446247501.n3114, 2019.
Hölttä, P., Väisänen, M., Väänänen, J., and Manninen, T.: Paleoproterozoic metamorphism and deformation in Central Lapland, Geol. S. Finl., 44, 109–120, 2007.
Hölttä, P. and Heilimo, E.: Metamorphic map of Finland, in: Bedrock of Finland at the scale 1 : 1 000 000 – Major stratigraphic units, metamorphism and tectonic evolution, edited by: Nironen, M., Geol. S. Finl., 60, 77–128, 2017.
Hron, K., Engle, M., Filzmoser, P., and Fišerová, E.: Weighted Symmetric Pivot Coordinates for Compositional Data with Geochemical Applications, Math. Geosci., 53, 655–674, https://doi.org/10.1007/s11004-020-09862-5, 2020.
Huhma, H., Cliff, R. A., Perttunen, V., and Sakko, M.: Sm–Nd and Pb isotopic study of mafic rocks associated with early Proterozoic continental rifting: the Peräpohjaschist belt in northern Finland, Contrib. Mineral. Petr., 104, 369–379, https://doi.org/10.1007/BF00321491, 1990.
Iljina, M. and Hanski, E.: Layered mafic intrusions of the Tornio-Näränkävaara belt, in: Precambrian Geology of Finland: Key to the Evolution of the Fennoscandian Shield, edited by: Lehtinen, M., Nurmi, P. A., and Rämö, O. T., Developments in Precambrian Geology, 14, Elsevier, Amsterdam, 101–138, ISBN 044451421X (hd.bd.), 2005.
IMDEX ioGAS™: Exploratory data analysis software application, Version 7.2, ioGAS™ [code], available at: https://reflexnow.com/product/iogas/, last access: 3 September 2021.
Johnson, S. C., Large, R. R., Coveney, R. M., Kelley, K. D., Slack, J. F., Steadman, J. A., Gregory, D. D., Sack, P. J., and Meffre, S.: Secular distribution of highly metalliferous black shales correspond with peaks in past atmosphere oxygenation, Miner. Deposita, 52, 791–798, https://doi.org/10.1007/s00126-017-0735-7, 2017.
Jolliffe, I. T.: Principal Component Analysis, 2nd Edn., in: Springer Series in Statistics, edited by: Bickel, P., Diggle, S., Fienberg, Krickerberg, K., Olkin, I., Wermuth, N., and Zeger, S., Springer, New York, USA, 487 pp., ISBN 0-387-95442-2, 2002.
Jolliffe, I. T. and Cadima, J.: Principal component analysis: a review and recent developments, Philos. T. Roy. Soc. A., 374, 20150202, https://doi.org/10.1098/rsta.2015.0202, 2016.
Kaiser, H. F.: The application of electronic computers to factor analysis, Educ. Psychol. Meas., 20, 141–151, https://doi.org/10.1177/001316446002000116, 1960.
Keith, M., Smith, D. J., Jenkin, G. R. T., Holwell, D. A., and Dye, M. D.: A review of Te and Se systematics in hydrothermal pyrite from precious metal deposits: Insights into ore-forming processes, Ore Geol. Rev., 96, 269–282, https://doi.org/10.1016/j.oregeorev.2017.07.023, 2018.
King, K., Williams-Jones, A. E., van Hinsberg, V., and Williams-Jones, G.: High-Sulfidation Epithermal Pyrite-Hosted Au (Ag-Cu) Ore Formation by Condensed Magmatic Vapors on Sangihe Island, Indonesia, Econ. Geol., 109, 1705–1733, https://doi.org/10.2113/econgeo.109.6.1705, 2014.
Kitney, K. E., Olivo, G. R., Davis, D. W., Desrochers, J.-P., and Tessier, A.: The Barry gold deposit, Abitibi Subprovince, Canada: A greenstone belt-hosted gold deposit coeval with Late Archaean deformation and magmatism, Econ. Geol., 106, 1129–1154, https://doi.org/10.2113/econgeo.106.7.1129, 2011.
Köykkä, J., Lahtinen, R., and Huhma, H.: Provenance evolution of the Paleoproterozoic metasedimentary cover sequences in northern Fennoscandia: Age distribution, geochemistry, and zircon morphology, Precambrian Res., 331, 105364, https://doi.org/10.1016/j.precamres.2019.105364, 2019.
Koistinen, T., Stephens, M. B., Bogatchev, V., Nordgulen, Ø., Wennerström, M., and Korhonen, J.: Geological map of the Fennoscandian Shield, scale 1 : 2 000 000, Trondheim: Geological Survey of Norway, Uppsala: Geological Survey of Sweden, Moscow: Ministry of Natural Resources of Russia, Espoo: Geological Survey of Finland, available at: https://gtkdata.gtk.fi/kalliopera/index.html# (last access: 3 September 2021), 2001.
Kyläkoski, M., Hanski, E., and Huhma, H.: The Petäjäskoski Formation, a new lithostratigraphic unit in the Paleoproterozoic Peräpohja belt, northern Finland, B. Geol. Soc. Finland, 84, 85–120, https://doi.org/10.17741/bgsf/84.2.001, 2012.
Laajoki, K.: Karelian supracrustal rocks, in: Precambrian geology of Finland, Chap. 7, in: Key to the evolution of the Fennoscandian shield, edited by: Lehtinen, M., Nurmi, P. A., and Rämö, O. T., Developments in Precambrian Geology, Elsevier, Vol. 14, Amsterdam, 279–341, https://doi.org/10.1016/S0166-2635(05)80008-8, 2005.
Lahtinen, R.: Main geological features of Fennoscandia, in: Mineral deposits and metallogeny of Fennoscandia, edited by: Eilu, P., Geol. S. Finl., Special Paper, 53, 13–18, 2012.
Lahtinen, R., Korja, A., and Nironen, M.: Paleoproterozoic tectonic evolution, Chap. 11, in: Precambrian geology of Finland: Key to the evolution of the Fennoscandian shield, edited by: Lehtinen, M., Nurmi, P. A., and Rämö, O. T., Developments in Precambrian Geology, Elsevier, Vol. 14, Amsterdam, 481–531, https://doi.org/10.1016/S0166-2635(05)80012-X, 2005.
Lahtinen, R., Huhma, H., Lahaye, Y., Jonsson, E., Manninen, T., Lauri, L., Bergman, S., Hellström, F., Niiranen, T., and Nironen, M.: New geochronological and Sm–Nd constraints across the Pajala shear zone of northern Fennoscandia: Reactivation of a Paleoproterozoic suture, Precambrian Res., 256, 102–119, https://doi.org/10.1016/j.precamres.2014.11.006, 2015.
Large, R. R., Danyushevsky, L. V., Hollit, C., Maslennikov, V., Meffre, S., Gilbert, S. E., Bull, S., Scott, R. J., Emsbo, P., Thomas, H., Singh, B., and Foster, J.: Gold and trace element zonation in pyrite using a laser imaging technique: implications of the timing of gold in orogenic and Carlin-style sediment-hosted deposits, Econ. Geol., 104, 635–668, https://doi.org/10.2113/gsecongeo.104.5.635, 2009.
Large, R. R., Halpin, J. A., Danyushevsky, L. V., Maslennikov, V. V., Bull, S. W., Long, J. A., Gregory, D. G., Lounejeva, E., Lyons, T. W., Sack, P. J., McGoldrick, P. J., and Calver, C. R.: Trace element content of sedimentary pyrite as a new proxy for deep-time ocean-atmosphere evolution, Earth Planet. Sc. Lett., 389, 209–220, https://doi.org/10.1016/j.epsl.2013.12.020, 2014.
Large, R. R., Gregory, D. D., Steadman, J. A., Tomkins, A. G., Lounejeva, A., Danyushevsky, L. V., Halpin, J. A., Maslennikov, V., Sack, P. J., Mukherjee, I., Berry, R., and Hickman, A.: Gold in the oceans through time, Earth Planet. Sc. Lett., 428, 139–150, https://doi.org/10.1016/j.epsl.2015.07.026, 2015.
Large, R. R., Mukherjee, I., Gregory, D. D., Steadman, J. A., Maslennikov, V., and Meffre, S.: Ocean and Atmosphere Geochemical Proxies Derived from Trace Elements in Marine Pyrite: Implications for Ore Genesis in Sedimentary Basins, Econ. Geol., 112, 423–450, https://doi.org/10.2113/econgeo.112.2.423, 2017.
Le Maitre, R. W. (Ed.): Numerical Petrology, Elsevier Scientific Publishing Company, Amsterdam, the Netherlands, 281 pp., ISBN 978-0-444-42098-5, 1982.
Liu, A.-L., Jiang, M.-R., Ulrich, T., Zhang, J., and Zhang, X.-J.: Ore genesis of the Bake gold deposit, southeastern Guizhou province, China: Constraints from mineralogy, in-situ trace element and sulfur isotope analysis of pyrite, Ore Geol. Rev., 102, 740–756, https://doi.org/10.1016/j.oregeorev.2018.09.018, 2018.
Macheyeki, A., Li, X., Kafumu, D., and Yuan, F. (Eds.): Applied Geochemistry, Advances in Mineral Exploration Techniques, Elsevier, 196 pp., https://doi.org/10.1016/C2019-0-00202-6, 2020.
Lyons, T. W., Reinhard, C. T., and Planavsky, N. J.: The rise of oxygen in Earth's early ocean and atmosphere, Nature, 506, 307–315, https://doi.org/10.1038/nature13068, 2014.
Madeisky, H. E. and Stanley, C. R.: Lithogeochemical exploration for metasomatic zones associated with hydrothermal mineral deposits using molar element ratio analysis, Int. Geol. Rev., 35, 1121–1148, https://doi.org/10.1080/00206819309465580, 1993.
Mawson Gold Limited: Mawson doubles gold-cobalt resource at Rajapalot, Finland 9.0 million tonnes @ 2.5 g/t for 716,000 oz gold equivalent, News Release, available at: https://www.mawsongold.com/news/news-releases/2020/mawson-doubles-gold-cobalt-resource-at-rajapalot-finland (last access: 6 December 2021), 2020.
Mawson Gold Limited: Mawson announces over 1 million ounces gold equivalent at Rajapalot, Finland gold ounces up 47 %, gold grade up 19 %, available at: https://www.mawsongold.com/news/news-releases/2021/mawson-announces-over-1-million-ounces-gold-equivalent-at-rajapalot-finland-gold-ounces-up-47-gold-grade-up-19 (last access: 6 December 2021), 2021.
Melezhik, V. A., Kump, L. R., Hanski, E. J., Fallick, A. E., and Prave, A. R.: Tectonic evolution and major global Earth-surface palaeoenvironmental events in the Palaeoproterozoic, in: Reading the archive of Earth's oxygenation Vol. 1: The Palaeoproterozoic of Fennoscandia as context for the Fennoscandian Arctic Russia – Drilling Early Earth Project, edited by: Melezhik, V. A., Prave, A. R., Hanski, E. J., Fallick, A. E., Lepland, A., Kump, L. R., and Strauss, H., Front. Earth. Sci., Springer, Berlin, Heidelberg, 3–24, https://doi.org/10.1007/978-3-642-29682-6_1, 2013.
Meng, X., Li, X., Chu, F., Zhu, J., Lei, J., Li, Z., Wang, H., Chen, L., and Zhu, Z.: Trace element and sulfur isotope compositions for pyrite across the mineralization zones of a sulfide chimney from the East Pacific Rise (1–2∘ S), Ore Geol. Rev., 116, 103209, https://doi.org/10.1016/j.oregeorev.2019.103209, 2020.
Molnár, F., Oduro, H., Cook, N. D., Pohjolainen, E., Takacs, A., O'Brien, H., Pakkanen, L., Johanson, B., and Wirth, R.: Association of gold with uraninite and pyrobitumen in the metavolcanic rock hosted hydrothermal Au-U mineralisation at Rompas, Peräpohja Schist Belt, northern Finland, Miner. Deposita, 51, 681–702, https://doi.org/10.1007/s00126-015-0636-6, 2016a.
Molnár, F., Mänttäri, I., O'Brien, H., Lahaye, Y., Pakkanen, L., Johanson, B., Käpyaho, A., Sorjonen-Ward, P., Whitehouse, M., and Sakellaris, G.: Boron, sulphur and copper isotope systematics in the orogenic gold deposits of the Archean Hattu schist belt, eastern Finland, Ore Geol. Rev., 77, 133–162, https://doi.org/10.1016/j.oregeorev.2016.02.012, 2016b.
Molnár, F., O'Brien, H., Stein, H., and Cook, N. D.: Geochronology of hydrothermal processes leading to the formation of the Au-U mineralization at the Rompas prospect, Perapohja belt, northern Finland: Application of paired U-Pb dating of uraninite and Re-Os dating of molybdenite to the identification of multiple hydrothermal events in a metamorphic terrane, Minerals, 7, 171, https://doi.org/10.3390/min7090171, 2017.
Molnár, F., Middleton, A., Stein, H., O'Brien, H., Lahaye, Y., Huhma, H., Pakkanen, L., and Johanson, B.: Repeated syn- and post-orogenic gold mineralization events between 1.92 and 1.76 Ga along the Kiistala Shear Zone in the Central Lapland Greenstone Belt, northern Finland, Ore Geol. Rev., 101, 936–959, https://doi.org/10.1016/j.oregeorev.2018.08.015, 2018.
Müller, W., Shelley, M., Miller, P., and Broude, S.: Initial performance metrics of a new custom-designed ArF excimer LA-ICPMS system coupled to a two-volume laser-ablation cell, J. Anal. Atom. Spectrom., 24, 209–214, https://doi.org/10.1039/B805995K, 2009.
Mukherjee, I., Large, R. R., Bull, S., Gregory, D. G., Stepanov, A. S., Ávila, J., Ireland, T. R., and Corkrey, R.: Pyrite trace-element and sulfur isotope geochemistry of paleo-mesoproterozoic McArthur Basin: Proxy for oxidative weathering, Am. Mineral., 104, 1256–1272, https://doi.org/10.2138/am-2019-6873, 2019.
Nironen, M.: Structural interpretation of the Peräpohja und Kuusamo belts and Central Lapland, and a tectonic model for northern Finland, Geol. S. Finl., Rep. of Inves., 234, 54 pp., 2017.
Nurmi, P. A., Sorjonen-Ward, P., and Damstén, M.: Geological setting, characteristics and exploration history of mesothermal gold occurrences in the late Archaean Hattu schist belt, Ilomantsi, eastern Finland, in: Geological development, gold mineralization and exploration methods in the Late Archean Hattu schist belt, Ilomantsi, eastern Finland, edited by: Nurmi, P. A. and Sorjonen-Ward, P., Geol. S. Finl., Special Paper 17, 193–231, 1993.
Ohmoto, H.: Systematics of Sulfur and Carbon Isotopes in Hydrothermal Ore Deposits, Econ. Geol., 67, 551–578, 1972.
Ohmoto, H. and Rye, R. O.: Isotopes of Sulfur and Carbon, in: Geochemistry of Hydrothermal Ore Deposits, 2nd Edn., edited by: Barnes, H. L., John Wiley and Sons, New York, 509–567, 1979.
Palenik, C. S., Ustunomiya, S., Reich, M., Kesler, S. E., Wang, L., and Ewing, R. C.: “Invisible” gold revealed: Direct imagining of gold nanoparticles in a Carlin-type deposit, Am. Mineral., 89, 1359–1366, https://doi.org/10.2138/am-2004-1002, 2004.
Pankka, H. S. and Vanhanen, E. J.: Early Proterozoic Au-Co-U mineralization in the Kuusamo district, northeastern Finland, Precambrian Res., 58, 387–400, https://doi.org/10.1016/0301-9268(92)90126-9, 1992.
Patten, C. G. C, Pitcairn, I. K., Molnár, F., Kolb, J., Beaudoin, G., Guilmette, C., and Peillod, A.: Gold mobilization during metamorphic devolatilization of Archean and Paleoproterozoic metavolcanic rocks, Geology, 48, 1110–1114, https://doi.org/10.1130/G47658.1, 2020.
Perttunen, V. and Vaasjoki, M.: U–Pb geochronology of the Peräpohja Schist Belt, northwestern Finland, in: Radiometric age determinations from Finnish Lapland and their bearing on the timing of Precambrian volcano-sedimentary sequences, edited by: Vaasjoki, M., Geol. S. Finl., Special Paper 33, 45–84, 2001.
Perttunen, V., Hanski, E., and Väänänen, J.: Stratigraphical map of the Peräpohja schist belt, northern Finland, in: Abstracts of oral and poster sessions, the 22nd Nordic Geological Winter meeting, Turku-Åbo, Finland, 8–11 January 1996, edited by: Kohonen, T. and Lindberg, B., 12 pp., 1995.
Phillips, G. N., and Groves, D. I.: The nature of Archean gold-bearing fluids as deduced from gold deposits of Western Australia, J. Geol. Soc. Aust., 30, 25–39, https://doi.org/10.1080/00167618308729234, 1983.
Phillips, G. N. and Powell, R.: Formation of gold deposits-a metamorphic devolatilization model, J. Metamorph. Geol., 28, 689–718, https://doi.org/10.1111/j.1525-1314.2010.00887.x, 2010.
Piña, R., Gervilla, F., Barnes, S. J., Ortega, L., and Lunar, R.: Partition coefficients of platinum group and chalcophile elements between arsenide and sulfide phases as determined in the Beni Bousera Cr–Ni mineralization (North Morocco), Econ. Geol., 108, 935–951, https://doi.org/10.2113/econgeo.108.5.935, 2013.
Powell, R., Will, T. M., and Phillips, G. N.: Metamorphism in Archaean greenstone belts; calculated fluid compositions and implications for gold mineralization, J. Metamorph. Geol., 9, 141–150, https://doi.org/10.1111/j.1525-1314.1991.tb00510.x, 1991.
Ranta, J. P., Lauri, L. S., Hanski, E., Huhma, H., Lahaye, Y., and Vanhanen, E.: U–Pb and Sm–Nd isotopic constraints on the evolution of the Paleoproterozoic Peräpohja Belt, northern Finland, Precambrian Res., 266, 246–259, https://doi.org/10.1016/j.precamres.2015.05.018, 2015.
Ranta, J. P., Hanski, E., Cook, N., and Lahaye, Y.: Source of boron in the Palokas gold deposit, northern Finland: evidence from boron isotopes and major element composition of tourmaline, Miner. Deposita, 52, 733–746, https://doi.org/10.1007/s00126-016-0700-x, 2017.
Ranta, J. P., Molnár, F., Hanski, E., and Cook, N. D.: Epigenetic gold occurrence in a Paleoproterozoic meta-evaporitic sequence in the Rompas-Rajapalot Au system, Peräpohja belt, northern Finland, B. Geol. Soc. Finland, 90, 69–108, https://doi.org/10.17741/bgsf/90.1.004, 2018.
Ranta, J. P., Hanski, E., Stein, H., Goode, M., Mäki, T., and Taivalkoski, A.: Kivilompolo Mo mineralization in the Peräpohja belt revisited: Trace element geochemistry and Re-Os dating of molybdenite, B. Geol. Soc. Finland, 92, 131–150, https://doi.org/10.17741/bgsf/92.2.004, 2020.
Raič, S., Molnár, F., Cook, N. D., Vasilopoulos, M., O'Brien, H., and Lahaye, Y.: The powerful vectoring capacities of sulfide trace element signatures in orogenic Au-deposits in northern Finland, in preparation, 2022.
Rasilainen, K., Lahtinen, R., and Bornhorst, T. J. (Eds.): Chemical Characteristics of Finnish Bedrock – 1 : 1 000 000 Scale Bedrock Map Units, Geol. S. Finl., Report of Investigation, 171, 96 pp., 2008.
Reich, M., Large, R., and Deditius, A. P.: New advances in trace element geochemistry of ore minerals and accessory phases, Ore Geol. Rev., 81, 1215–1217, https://doi.org/10.1016/j.oregeorev.2016.10.020, 2017.
Reimann, C., Filzmoser, P., Garrett, R., and Dutter, R. (Eds.): Statistical Data Analysis Explained: Applied Environmental Statistics with R, John Wiley & Sons, Ltd., West Sussex, England, 343 pp., https://doi.org/10.1002/9780470987605, 2008.
Reimann, C., Filzmoser, P., Fabian, K., Hron, K., Birke, M., Demetriades, A., Dinelli, E., Ladenberger, A., and The GEMAS Project Team: The concept of compositional data analysis in practice – Total major element concentrations in agricultural and grazing land soils of Europe, Sci. Total Environ., 426, 196–210, https://doi.org/10.1016/j.scitotenv.2012.02.032, 2012.
Reimann, C., Filzmoser, P., Hron, K., Kynčlová, P., and Garrett, R. G.: A new method for correlation analysis of compositional data – a worked example, Sci. Total Environ., 607–608, 965–971, https://doi.org/10.1016/j.scitotenv.2017.06.063, 2017.
Savard, D., Bouchard-Boivin, B., Barnes, S. J., and Garbe-Schönberg, D.: UQAC-FeS: A new series of base metal sulfide quality control reference material for LA-ICP-MS analysis, in: Proceedings of the 10th International Conference on the Analysis of Geological and Environmental Materials, Sydney, Australia, 8–13 July 2018, Sydney, Australia, 2018.
Seal, R. R.: Sulfur isotope geochemistry of sulfide minerals, Rev. Mineral. Geochem., 61, 633–677, https://doi.org/10.2138/rmg.2006.61.12, 2006.
Skirrow, R. G. and Walshe, J. L.: Reduced and oxidized Au-Cu-Bi iron oxide deposits of the Tennant Creek inlier, Australia: an integrated geologic and chemical model, Econ. Geol., 97, 1167–1202, https://doi.org/10.2113/gsecongeo.97.6.1167, 2002.
Stanley, C. R. (Ed.): Lithogeochemical exploration for metasomatic zones associated with hydrothermal mineral deposits using molar element ratio analysis: Advanced topics, Lithogeochemical Exploration Research Project, Mineral Deposit Research Unit, University of British Columbia, Short Course Notes, 180 pp., 1998.
Stanley, C. R.: Molar Element Ratio Analysis of Lithogeochemical Data: A Toolbox for Use in Mineral Exploration and Mining, Geochemistry, Paper 33, in: Proceedings of Exploration 17: Sixth Decennial International Conference on Mineral Exploration, edited by: Tschirhart, V. and Thomas, M. D., 471–494, https://doi.org/10.1144/geochem2019-033, 2017.
Stanley, C. R. and Madeisky, H. E. (Eds.): Lithogeochemical exploration for metasomatic zones associated with hydrothermal mineral deposits using molar element ratio analysis: Introduction, Lithogeochemical Exploration Research Project, Mineral Deposit Research Unit, University of British Columbia, Short Course Notes, 200 pp., 1996.
Ulrich, T., Long, D. G. F., Kamber, B. S., and Whitehouse, M. J.: In situ trace element and sulfur isotope analysis of pyrite in a Paleoproterozoic gold placer deposit, Pardo and Clement Townships, Ontario, Canada, Econ. Geol., 106, 667–686, https://doi.org/10.2113/econgeo.106.4.667, 2011.
Van Achterbergh, E., Ryan, C. G., Jackson, S. E., and Griffin, W.: Appendix 3, Data reduction software for LA-ICP-MS, in: Laser-Ablation–ICP-Mass Spectrometry in the Earth Sciences: Principles and Applications, Mineralogical Association of Canada Short Course Series, edited by: https://doi.org/10.1016/S0277-3791(02)00016-1, 2001.
Vanhanen, E.: Geology, mineralogy and geochemistry of the Fe-Co-Au-(U) deposits in the Paleoproterozoic Kuusamo schist belt, northeastern Finland, Geol. S. Finl., 399, 229 pp., 2001.
Vanhanen, E., Cook, N. D., Hudson, M. R., Dahlenborg, L., Ranta, J.-P., Havela, T., Kinnunen, J., Molnár, F., Prave, A. R., and Oliver, N. H. S.: Chapter 5.4 – The Rompas prospect, Peräpohja schist belt, northern Finland, in: Mineral Deposits of Finland, edited by: Maier, W. D., Lahtinen, R., and O'Brien, H, Elsevier, 467–484, https://doi.org/10.1016/B978-0-12-410438-9.00018-2, 2015.
Vasilopoulos, M., Molnár, F., O'Brien, H., Lahaye, Y., Lefèbvre, M., Richard, A., André-Mayer, A. S., Ranta, J.-P., and Talikka, M.: Geochemical signatures of mineralizing events in the Juomasuo Au–Co deposit, Kuusamo belt, northeastern Finland, Miner. Deposita, 56, 1195–1222, https://doi.org/10.1007/s00126-020-01039-8, 2021.
Voute, F., Hagemann, S. G., Evans N. J., and Villanes, C.: Sulfur isotopes, trace element, and textural analyses of pyrite, arsenopyrite and base metal sulfides associated with gold mineralization in the Pataz-Parcoy district, Peru: implication for paragenesis, fluid source, and gold deposition mechanisms, Miner. Deposita, 54, 1077–1100, https://doi.org/10.1007/s00126-018-0857-6, 2019.
Weihed, P., Arndt, N., Billström, K., Duchesne, J.-C., Eilu, P., Martinsson, O., Papunen, H., and Lahtinen, R.: 8: Precambrian geodynamics and ore formation: The Fennoscandian Shield, Ore Geol. Rev., 27, 273–322, https://doi.org/10.1016/j.oregeorev.2005.07.008, 2005.
Winderbaum, L., Ciobanu, C. L., Cook, N. J., Paul, M., Metcalfe, A., and Gilbert, S.: Multivariate Analysis of an LA-ICP-MS Trace Element Dataset for Pyrite, Math. Geosci., 44, 823–842, https://doi.org/10.1007/s11004-012-9418-1, 2012.
- Abstract
- Introduction
- Regional geology
- Geology, stratigraphy and mineralization of the Rajapalot Au–Co project
- Analytical methods and data processing
- Results
- Discussion
- Conclusion and implications for mineral exploration
- Code availability
- Data availability
- Author contributions
- Competing interests
- Disclaimer
- Special issue statement
- Acknowledgements
- Financial support
- Review statement
- References