the Creative Commons Attribution 4.0 License.
the Creative Commons Attribution 4.0 License.
 | 09 Mar 2022
The damaging character of shallow 20th century earthquakes in the Hainaut coal area (Belgium)
Thierry Camelbeeck
Koen Van Noten
Thomas Lecocq
Marc Hendrickx
The present study analyses the impact and damage of shallow seismic activity that occurred from the end of the 19th century until the late 20th century in the coal area of the Hainaut province in Belgium. This seismicity is the second-largest source of seismic hazard in north-western Europe after the Lower Rhine Embayment. During this period, five earthquakes with moment magnitudes (Mw) around 4.0 locally caused moderate damage to buildings corresponding to maximum intensity VII on the European Macroseismic Scale 1998 (EMS-98). Reviewing intensity data from the official macroseismic surveys held by the Royal Observatory of Belgium (ROB), press reports and contemporary scientific studies resulted in a comprehensive macroseismic intensity dataset. Using this dataset, we created macroseismic maps for 28 earthquakes, established a new Hainaut intensity attenuation model and a relationship linking magnitude, epicentral intensity and focal depth. Using these relationships, we estimated the location and magnitude of pre-1985 earthquakes that occurred prior to deployment of the modern digital Belgian seismic network. This resulted in a new updated earthquake catalogue for the Hainaut area for the 1887–1985 period, including 124 events. A comparison with other areas worldwide where currently similar shallow earthquake activity occurs suggests that intensity attenuation is strong in Hainaut. This high attenuation and our analysis of the cumulative effect of the Hainaut seismicity indicate that current hazard maps overestimate ground motions in the Hainaut area. This reveals the need to use more appropriate ground motion models in hazard issues. Another strong implication for earthquake hazard comes from the reliability of the computed focal depths that helps clarifying the hypotheses about the origin of this seismicity. Some events were very shallow and occurred near the surface up to a depth not exceeding 1 km, suggesting a close link to mining activities. Many events, including the largest shallow events in the coal area before 1970, occurred at depths greater than 2 km, which would exclude a direct relationship with mining, but still might imply a triggering causality. A similar causality can also be questioned for other events that occurred just outside of the coal area since the end of the mining works.
- Article
(14966 KB) - Full-text XML
-
Supplement
(26709 KB) - BibTeX
- EndNote


Moderate shallow earthquakes with moment magnitudes in the range of 4.0 to 6.0 have real potential for destruction when they occur in populated areas. This is particularly the case in regions where the building stock is old and vulnerable, and contains few earthquake-resistant buildings. In seismically active regions, even though Mw=4.0 earthquakes can be locally damaging (Nappi et al., 2021), current hazard is associated with the upper part of this magnitude range. In western Europe, Mw=4.0 to 5.0 shallow earthquakes represent the most probable current source of seismic risks, which is currently enhanced by the increase of induced seismicity by underground energetic resources (Grigoli et al., 2017; Nievas et al., 2020). In western Europe, the potential for destruction of shallow earthquakes is exemplified by the damaging impact of the 11 May 2011 Lorca (Spain, Mw=5.1; Association Française de génie Parasismique, 2011), 16 August 2012 Huizinge (The Netherlands, Mw=3.6; Dost and Kraaijpoel, 2013) and 11 November 2019 Le Teil (France, Mw=4.9; Schlupp et al., 2021) earthquakes.
In southern Belgium, Namurian to Westphalian (Upper Carboniferous) coal seams were intensively exploited in the 19th and 20th century in la bande Houillère, i.e. a narrow, 10 to 15 km wide geological region located between the Belgian cities of Mons in the west and Liège in the east (Fig. 1). This coal mining area is bordered in the south by the Midi fault, which manifests the overthrusting of the Ardenne allochthon (including the Dinant fold-and-thrust belt and the High-Ardenne slate belt) over the Brabant parautochthon. In the north, the coal mining area is limited up to the northern occurrence of the Westphalian (Fig. 2), which overlies the Lower Palaeozoic Brabant Massif. Mining in the coal area in the province of Hainaut (further referred to as the Hainaut coal area) was focused on three basins: Borinage-Mons, Centre-La Louvière and Charleroi. In the Centre-La Louvière and Charleroi basins, the sedimentary cover thickness is minor. In the Borinage-Mons basin, Cretaceous deposits up to 300 m thick cover the Westphalian. While no earthquakes were reported in the Hainaut coal area in the first part of the 19th century, during which intense coal mining began, seismicity began in 1887 (Table 1, Fig. 2) and has continued up to the present. This seismicity is unique in Belgium and neighbouring regions as five events with Mw=4.0 caused locally widespread, moderate to extensive damage to buildings. Before this study, the origin of this earthquake activity was considered to be natural.
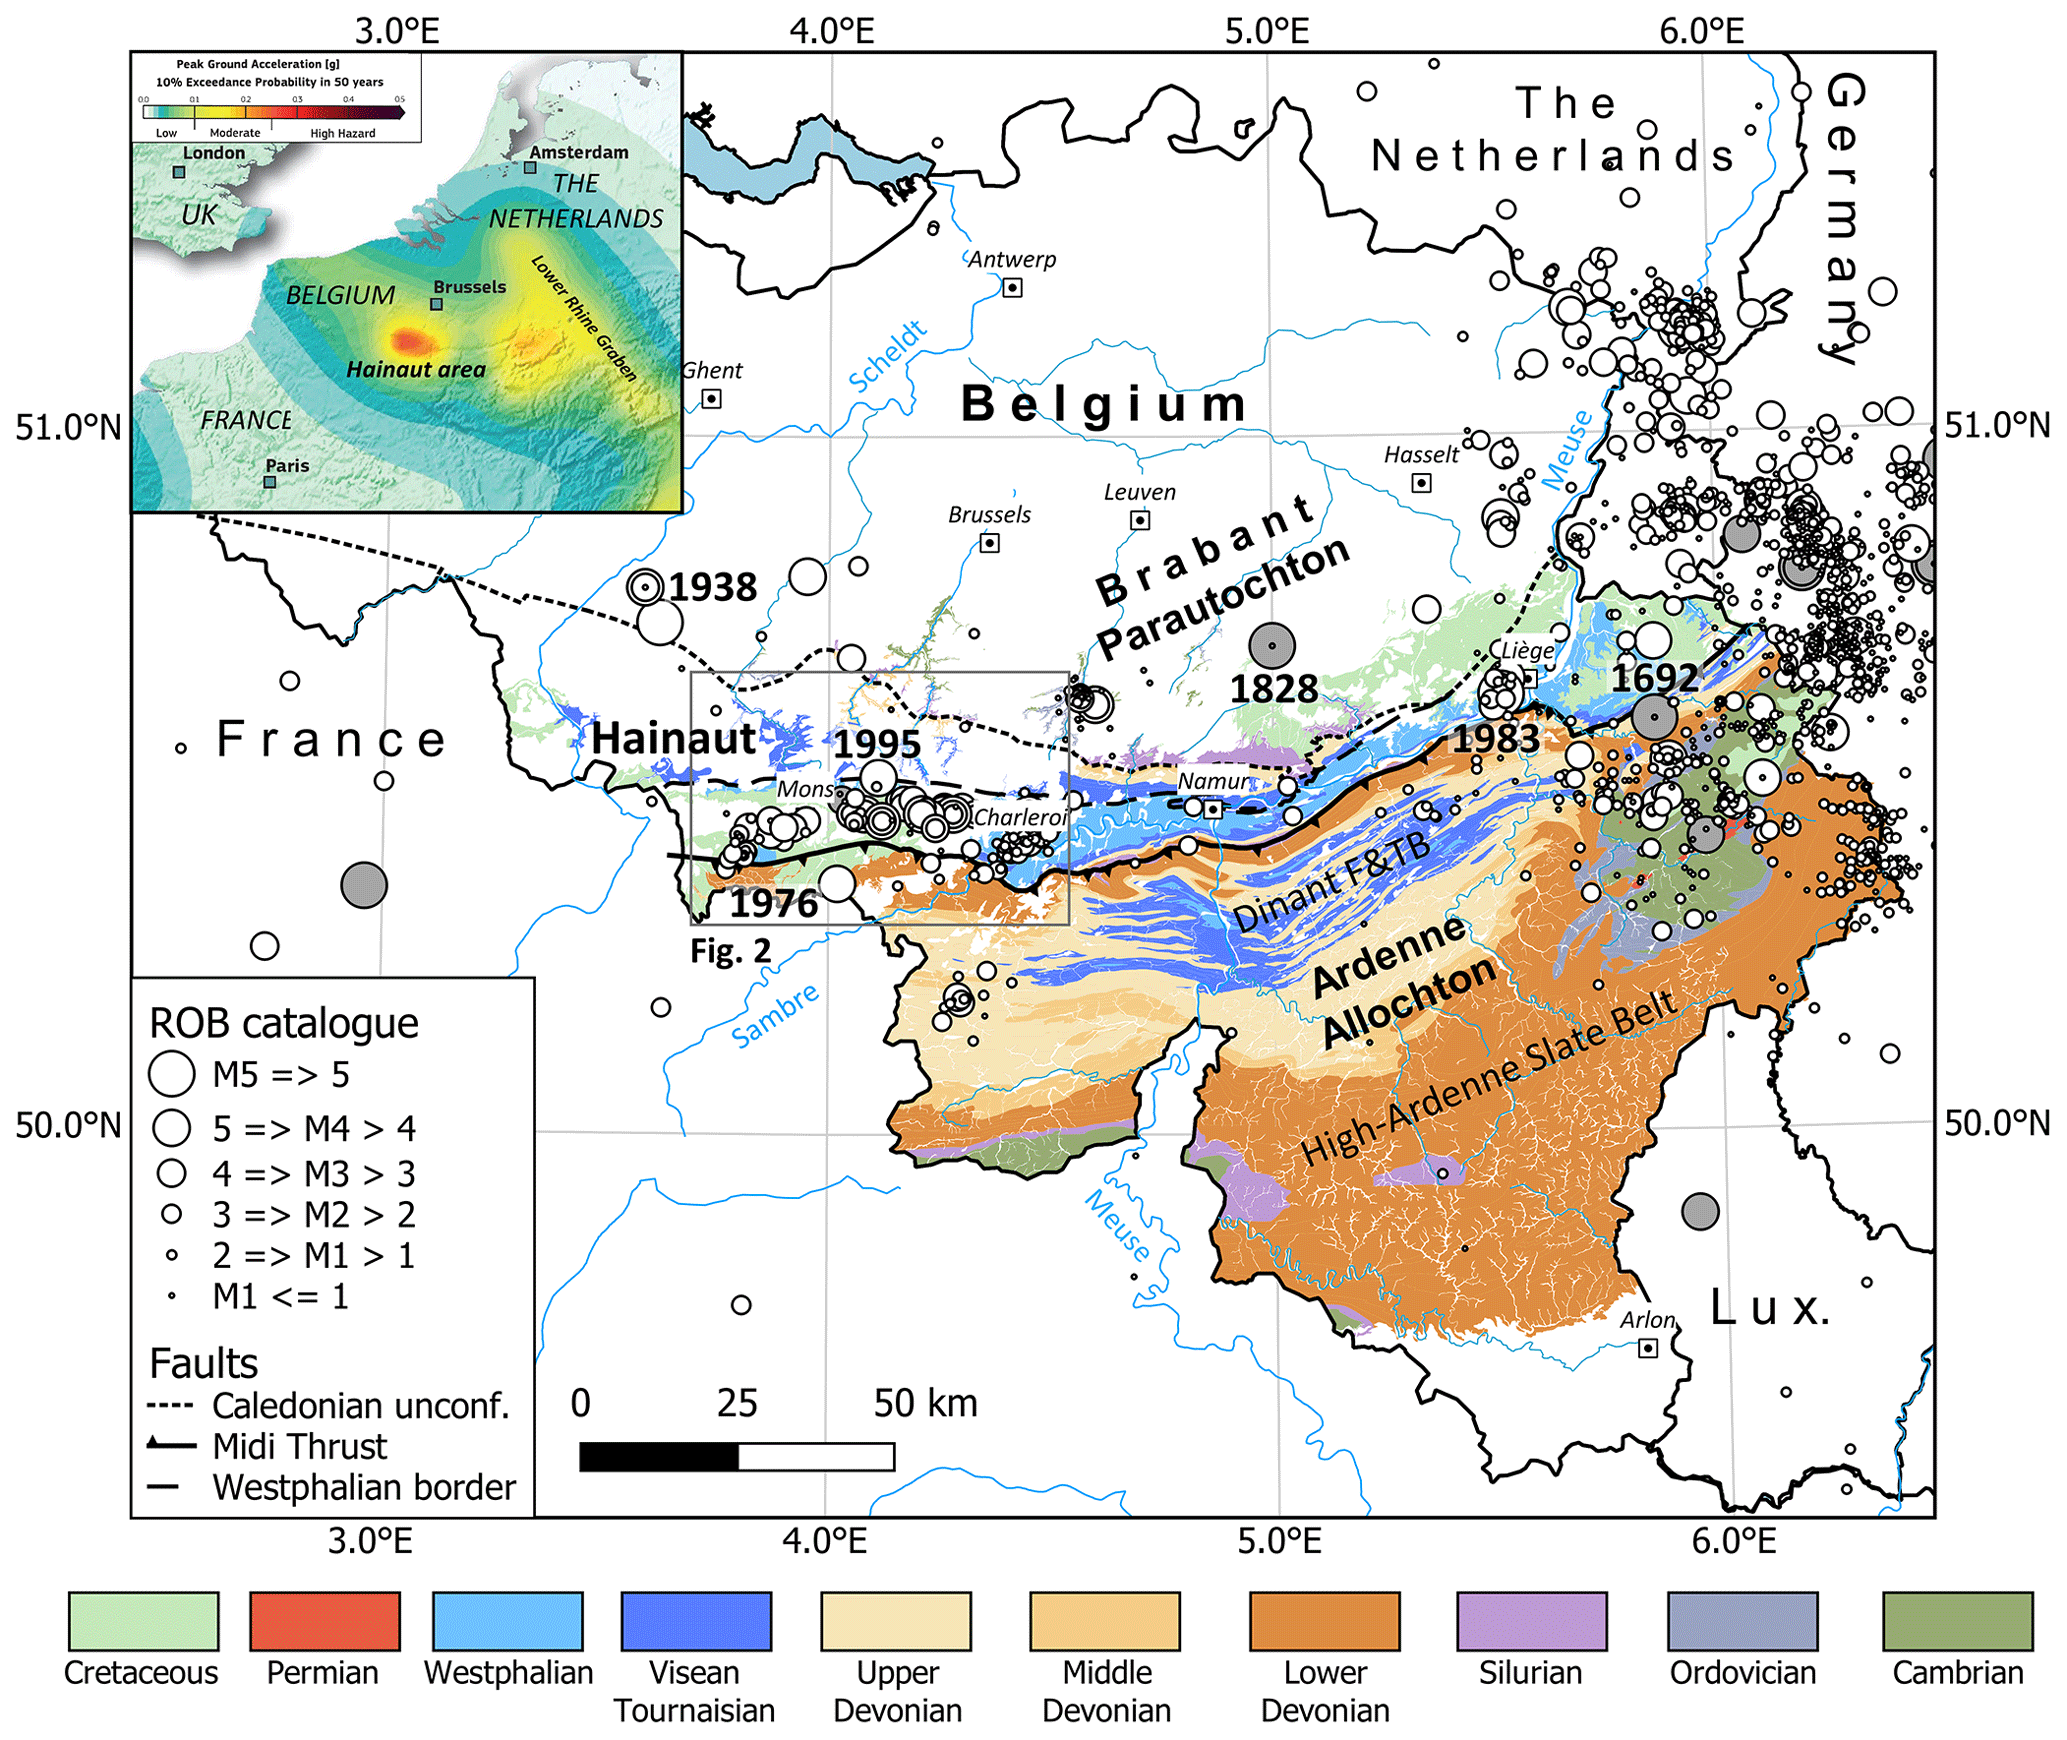
Figure 1Regional seismicity and geological setting of the Hainaut coal area. The seismicity shown is the full seismic catalogue of the Royal Observatory of Belgium (ROB). Grey dots are historical earthquakes prior to the first event in Belgium recorded by a seismic station in 1911. The inset shows details of the SHARE hazard map (Woessner et al., 2015) for the area around Belgium. Note the pronounced higher peak ground acceleration exceedance in the Hainaut area based on the seismicity discussed in this paper. Geology in the background based upon http://www.onegeology.org/, last access: 1 May 2020. Reproduced with the permission of © OneGeology. All rights reserved.
The main characteristics of seismic events in the Hainaut coal area are the high epicentral intensity and the rapid intensity decay with distance, suggesting shallow focal depths (Charlier, 1949; Van Gils, 1966; Ahorner, 1972; Van Gils and Zaczek, 1978). Despite the consequences of this “past” seismic activity there is no published synthesis and specific analysis about its impact and the damage it caused. Providing an inventory of these effects and damage would be of great interest in order to identify the consequences of possible similar future activity, not only in the Hainaut area but also elsewhere in western Europe in areas with a similar geological configuration. Such an investigation is required for the analysis of the possible impact of deep geothermal projects that are currently in the test phase in the Hainaut coal area (https://geothermiemons.be, last access: 1 May 2020).
The Hainaut seismic activity is of great concern for seismic hazard assessment in the border area between France and Belgium. This is particularly of interest for the Eurocode-8 norm application in Belgian and French building regulations because the contribution of Hainaut seismic activity to these hazard maps is significant (Fig. 1; Leynaud et al., 2001; Martin et al., 2002; Vanneste et al., 2014; Drouet et al., 2020). For the current hazard maps, two different aspects of this seismicity deserve specific research. First, the origin of this seismicity continues to be unresolved and controversial (Descamps, 2009; Troch, 2018a). In hazard computations, natural seismicity is a long-term stationary process, whereas seismicity induced by mining works are only a past sporadic phenomenon. Hence, a reinterpretation on the origin would strongly modify its contribution to the seismic hazard. Second, in contrast to the observed strong intensity decay of these earthquakes, partly caused by the shallowness of the earthquake hypocentres, the influence area of the Hainaut seismicity seems to be overextended in the hazard maps. This inconsistency resulted from the use of inappropriate ground motion prediction equations (GMPEs) in hazard assessment.
Most of the earthquake activity in the Hainaut coal area occurred before the implantation of a modern digital seismic network in Belgium, which started in 1985 (Camelbeeck et al., 1990). Before the establishment of the modern network, only the largest earthquakes were recorded by seismic stations, starting in 1909. Smaller events are only known about because they were reported by people and/or caused slight damage. Camelbeeck (1985a, b, 1993) and Camelbeeck et al. (1990) evaluated the magnitude of the largest events from seismic recordings. These studies underline the large uncertainties of earthquake locations from seismic phase measurements and conclude that for most events, the centre of the area with the largest observed intensity better corresponds to the real epicentre than the location obtained from arrival time measurements. Because of the uncertainty of focal depths, instrumental evaluations were only able to suggest that Hainaut events would certainly not exceed 7–8 km (Camelbeeck, 1990) and, to date, more accurate depth estimations have been lacking. Macroseismic data are, however, a good (and the only) alternative to determine earthquake source parameters and tackle the context of this seismicity and related seismic hazard issues.
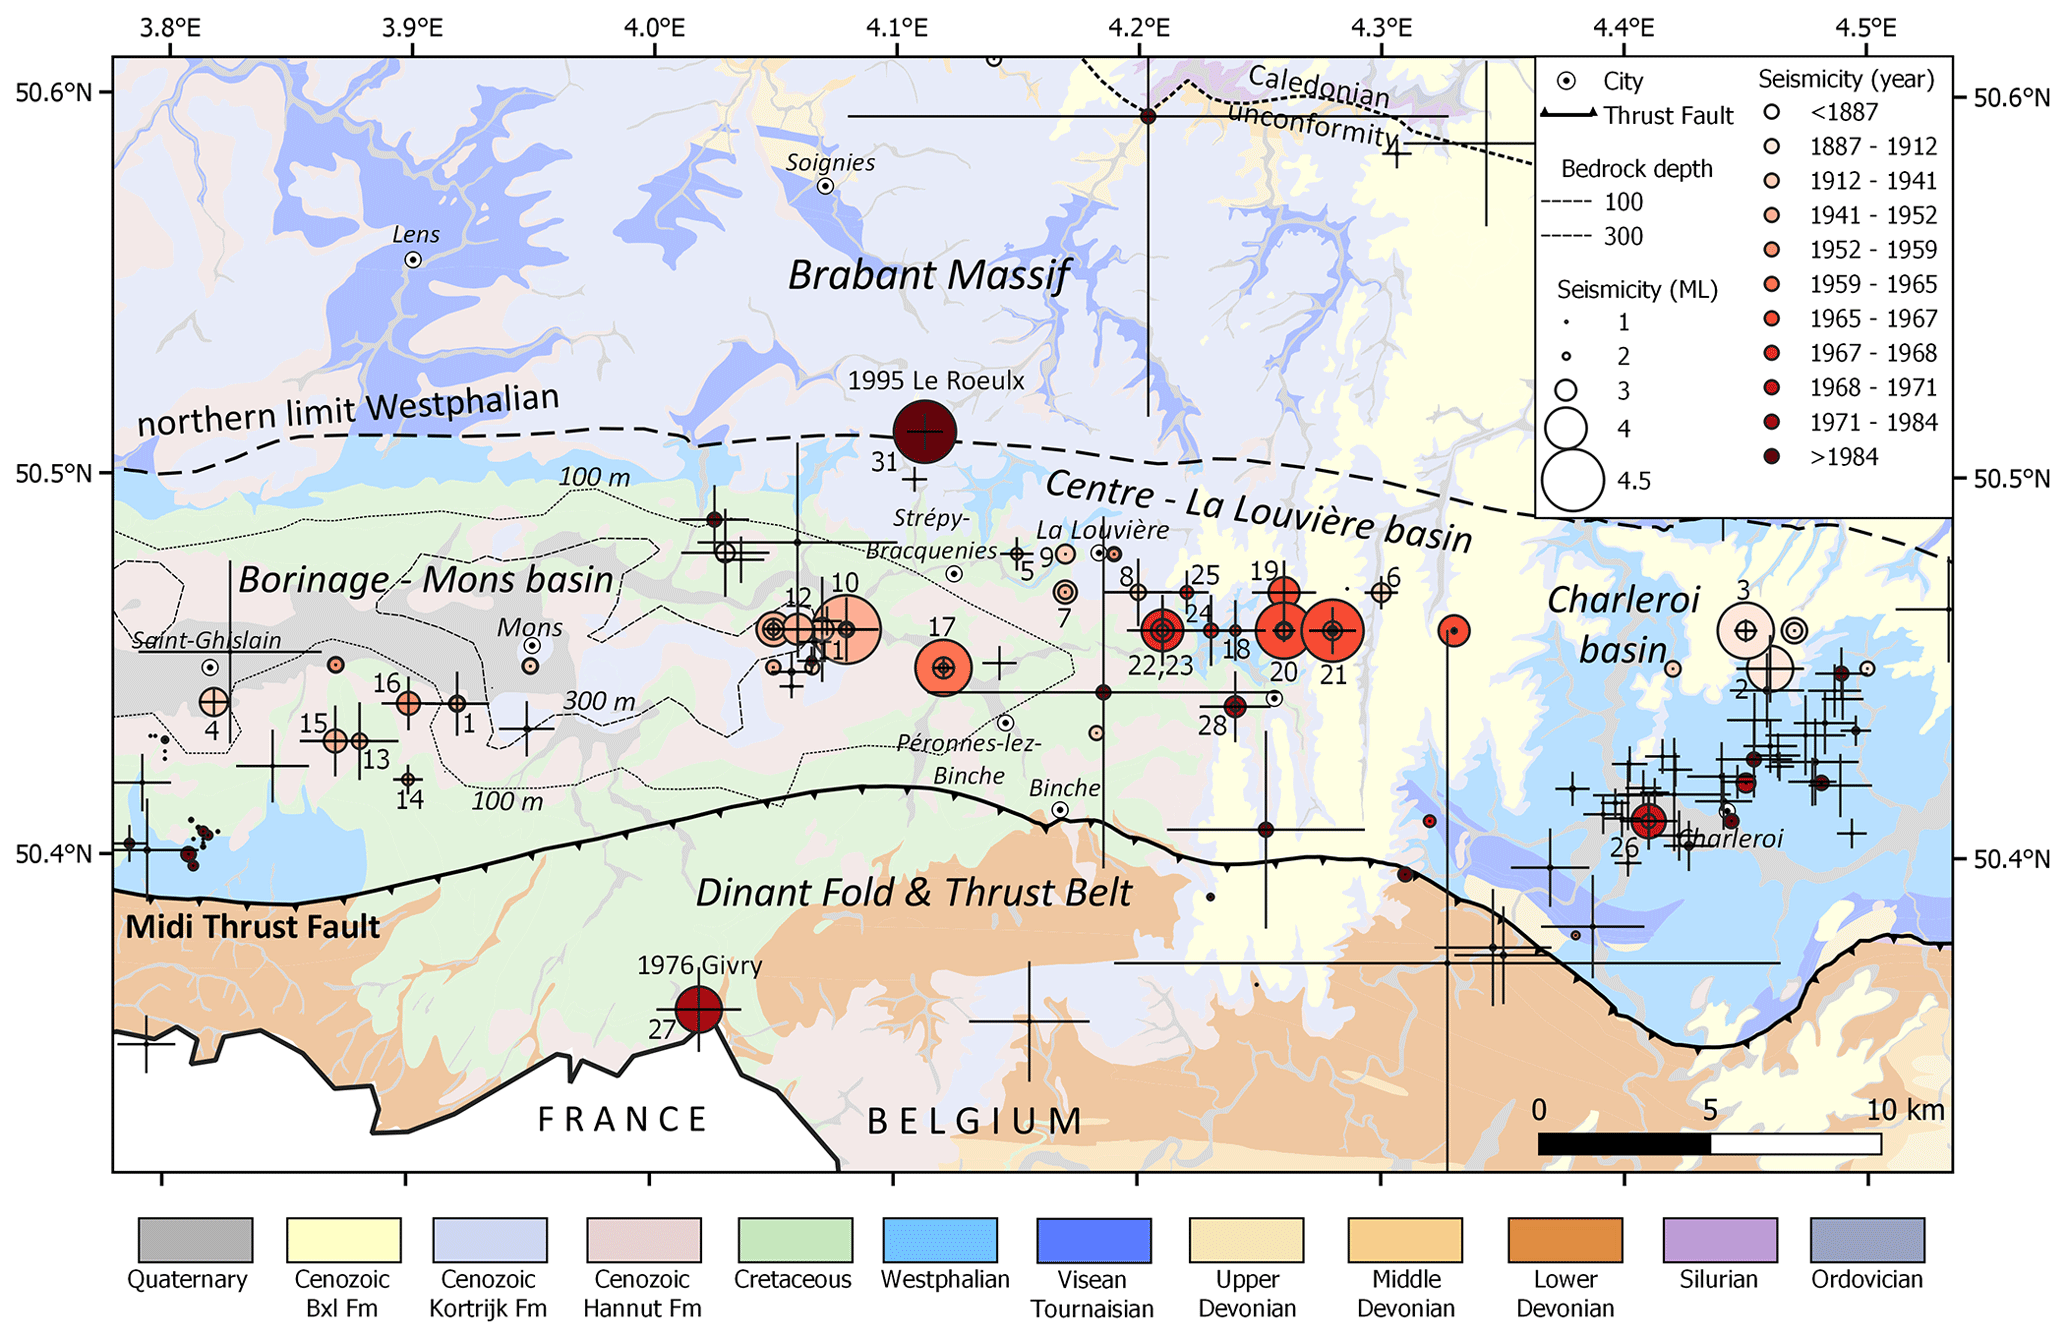
Figure 2Geological setting of the 1887–2020 seismicity in the Hainaut province with local geological map as background. The Borinage-Mons, Centre-La Louvière and Charleroi basins are the main coal regions in the Hainaut province. Seismicity (up to 2020) coloured as a function of time and sized to magnitude. Black error bars show location uncertainty. Numbers next to the largest earthquakes refer to events in Table 1 and to macroseismic maps in the Atlas in the Supplement. Geology in the background based upon http://www.onegeology.org/. Reproduced with the permission of © OneGeology. All rights reserved.
In this paper, we collected all available macroseismic data of this unique seismicity and searched for additional information, providing a complete macroseismic intensity dataset of sufficient quality to estimate the impact and to answer the questions that Hainaut seismicity have raised. First, we explain how we established the full earthquake catalogue and the corresponding intensity dataset from the available (historical) sources of information and we provide a new earthquake catalogue of Hainaut seismicity from 1887 to 1985. Second, we used the intensity dataset to develop a regional intensity attenuation relationship valid for the Hainaut coal area, which allows better estimation of the earthquake focal depth, magnitude and epicentre location. We also compare the new Hainaut attenuation model with intensity datasets of other shallow, induced or triggered earthquakes worldwide. Finally, we discuss how our results should be incorporated in current seismic hazard studies. Appendix A presents the way we evaluated intensity from the available information sources. In Appendix B, a chronological description of the Hainaut seismicity is given. The macroseismic maps and a description of the sources of information concerning these earthquakes are presented in detail in an Atlas in the Supplement (further referred to as the Atlas). Communal intensity data points (IDPs) are provided for each earthquake in the Supplement.
The Hainaut earthquakes are included in the earthquake catalogue maintained by the Royal Observatory of Belgium (ROB; see Data availability section). The first earthquakes reported in the Hainaut coal area occurred in 1887 in the locality of Havré, a few kilometres east of the city of Mons (Fig. 2), and were studied by de Munck (1887). The absence of scientific documentation before these events does not mean that small earthquakes could not have occurred prior to these events in the Hainaut coal area. However, at least since the beginning of the 19th century, it is doubtful that felt or damaging earthquakes would have escaped the attention of local authorities and the press because historical sources do report other 19th century earthquakes in neighbouring regions and describe their impact on Hainaut. An example is the 23 February 1828 Mw=5.1 earthquake in central Belgium (Fig. 1) that was felt in underground mines in the Borinage-Mons basin and caused damage to chimneys in Gosselies (Camelbeeck et al., 2021).
To create the earthquake catalogue, Camelbeeck (1993) initially reviewed all the recordings of seismic stations in Belgium and neighbouring countries that could have reported phase arrival times and amplitude measurements for earthquakes in Belgium. Between 1898 and 1958, the only seismic station in Belgium was Uccle (Brussels). Its capability to record local earthquakes was operational from 1909 onwards. However, the station was only sensitive enough to detect the largest earthquakes, and numerous felt earthquakes were too small to leave a trace on the black smoked or photo paper recordings. Hence, the ROB catalogue was extended by including felt Hainaut earthquakes that were not recorded by seismic instruments before 1958. However, their reporting is not homogeneous during this period. For the period between 1896 and 1936, Somville (1936) established a list including some events that were not recorded in Uccle but that were reported in press reports, in communications from local mining companies or by local correspondents. The catalogue also contains non-instrumentally recorded aftershocks of the April 1949 Havré earthquakes reported in the press, and 12 earthquakes that occurred in the 1950s and that were listed in the Belgian activity reports of the International Union of Geodesy and Geophysics (IUGG).
After 1958 and up to 1985, adding a few additional stations slightly improved seismic monitoring in Belgium (Camelbeeck, 1985a). The higher sensitivity of the seismometers at the permanent stations in Dourbes and Membach, operating respectively since 1958 and 1977, allowed for the detection of smaller, even not felt, seismic events. Hence, from 1958, the bulletin of Belgian seismic stations has included all the potentially felt events. The installation of a modern digital seismic network in 1985 has allowed for the detection and precise location of ML>1.0 earthquakes in the Hainaut area (Lecocq et al., 2013) and in the southern part of the Brabant Massif (Van Noten et al., 2015). With the exception of weakly felt earthquakes in 1987 in the Dour area (Camelbeeck, 1988), no more events were sufficiently strong to be felt and the seismicity stayed at a very low level in Hainaut. Let us note that the Mw=4.1 earthquake, which occurred on 20 June 1995 had its epicentre near Le Rœulx, just north of the coal area (Figs. 1 and 2). With a focal depth of 25 km, the hypocentre was located in the lower crust of the Brabant Massif. It was felt over a large part of the Belgian territory and in northern France, with an epicentral intensity of V (Fig. S31 in the Supplement).
Initially, we started our study using the list of Hainaut earthquakes reported in the ROB catalogue, but the new knowledge acquired in this study allowed us to complete this list and improve the location reliability and to evaluate the magnitude for all events. This resulted in an updated catalogue of 124 Hainaut earthquakes between 1887 and 1985 (see full catalogue in the Supplement) that is now fully integrated in the ROB catalogue. Since 1985, the largest events that have occurred in Hainaut are three ML=2.5 earthquakes, which were only weakly felt. Earthquakes of magnitude below 2.0 have occurred from time to time (31 earthquakes during the last 20 years), meaning that very little seismic energy has been released in the coal area since mining activity ceased.
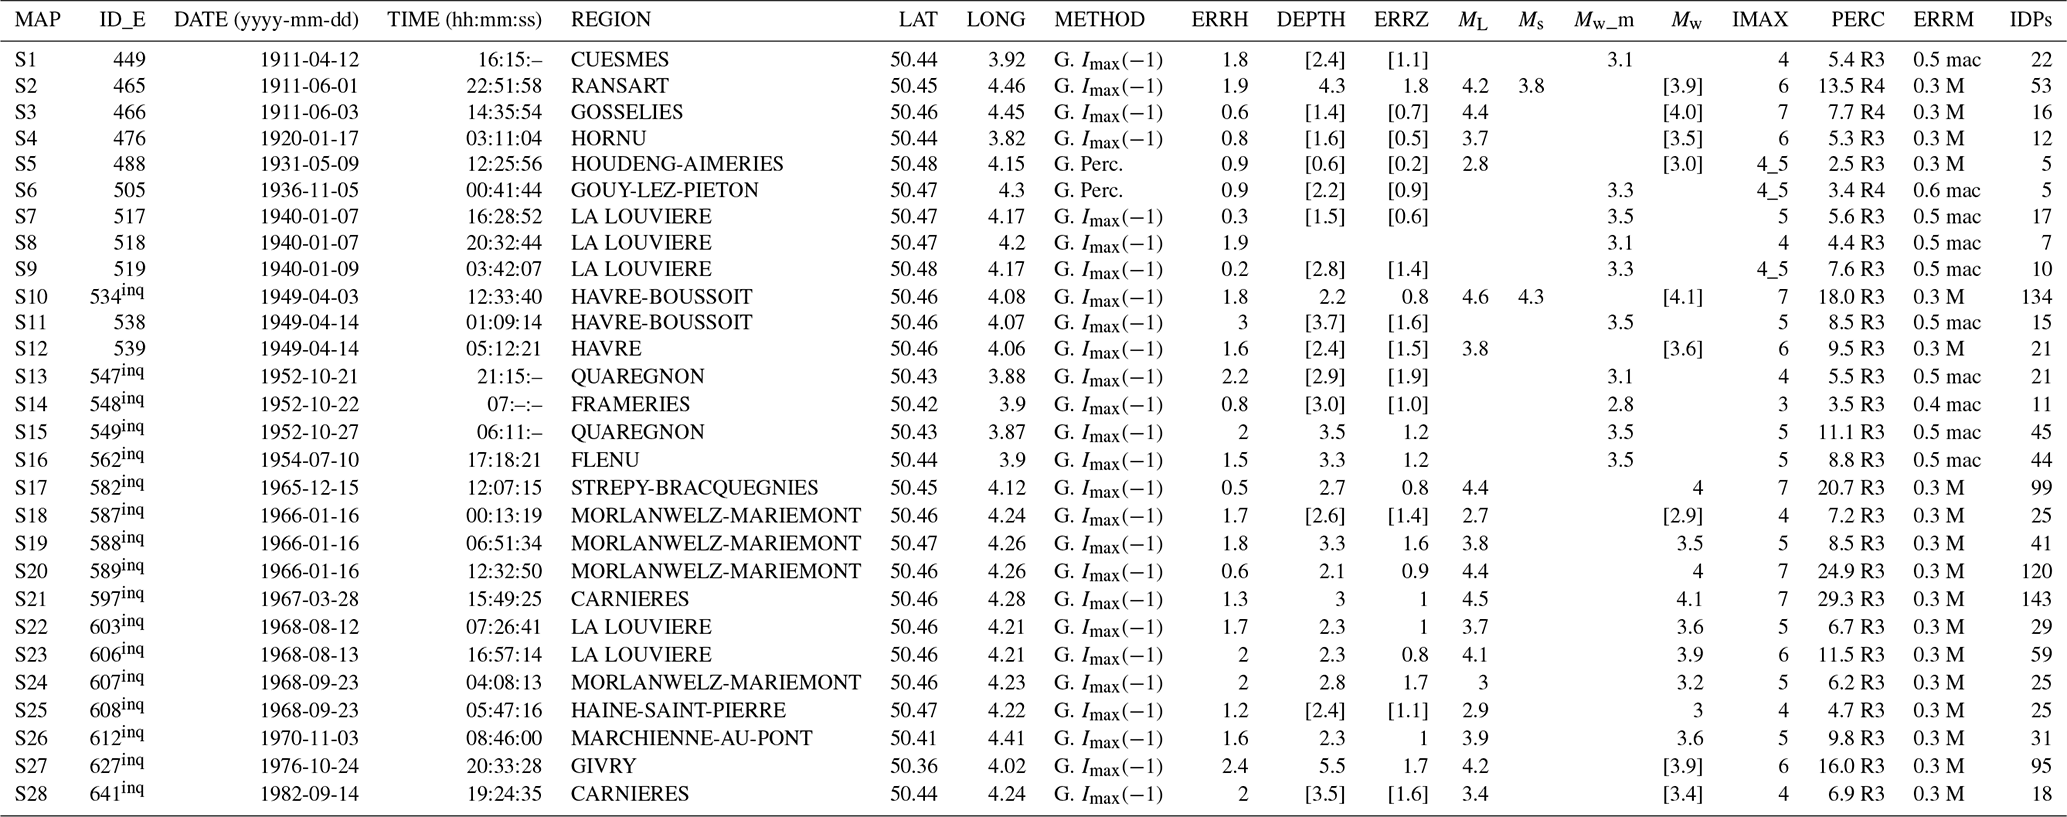
Table 1Parameter information of 28 Hainaut coal area earthquakes that have sufficient macroseismic data to be mapped (see Atlas). See Supplement for complete explanation of all catalogue parameters. MAP: Atlas map number; ID_E: ROB catalogue number. inq: event with official ROB macroseismic inquiry; METHOD: method to compute macroseismic epicentre; (G. Imax(−1): barycentre of the IDPs with Imax and Imax−1 intensities; G. Perc.: barycentre of all the IDPs); ERRH: uncertainty of the reported epicentre in kilometres; DEPTH: focal depth (km) estimated from the intensity attenuation modelling. Depths in brackets are estimated from Imax; ERRZ: focal depths (km) using the Hainaut intensity attenuation relationship. Errors inside the brackets are estimated from Imax; ML: local magnitude determined from Belgian station recordings; Ms: surface-wave magnitude determined from European station recordings using the Prague formula (Kárník, 1971); MW_m: equivalent Mw determined from macroseismic data using the empirical relationships developed in this study; Mw: moment magnitudes determined from Camelbeeck (1985). Magnitudes in brackets are converted from ML; IMAX: maximum observed intensity; PERC: radius of perceptibility of the seismic event in kilometres. R3: radius of intensity III, R4: radius of intensity IV; ERRM: uncertainty of estimated magnitude; IDPs: number of IDPs. All times shown are UTC.
3.1 Sources of information
Our study is based on macroseismic information that is derived from various sources, including published scientific works contemporaneous with the earthquakes, the official macroseismic survey of the ROB, press reports, letters to the ROB, as well as ROB, coal mining company and administration reports. A detailed overview of these sources is provided in the Atlas in the Supplement.
Scientific studies have described the effects and/or damage caused by some Hainaut earthquakes in large detail (de Munck, 1887; Cornet, 1911; Cambier, 1911; Capiau, 1920; Charlier, 1949; Marlière, 1951; Van Gils, 1966). Some works contain the first-hand observations of the author(s), complemented by testimonies collected by interviewing local people, similar to what today's Macroseismic Intervention Group (Sira, 2015) would do.
Macroseismic surveys are indispensable to mapping earthquakes' impact. They serve to evaluate earthquakes' magnitude and focal depth, intensity–distance decay and the impact of the local geology on the macroseismic field (Cecić and Musson, 2004). Since 1932, the ROB organises a macroseismic survey whenever an earthquake is felt in Belgium. For the Hainaut earthquakes, the surveys consisted of sending a dedicated questionnaire to the burgomasters of Belgian communes up to 50 km from the epicentres asking them to carefully report earthquake observations. Between 3 April 1949 and 9 August 1983, 19 official ROB surveys were organised in Hainaut. 17 of them were usable for evaluating the intensity for each locality (indicated with inq in Table 1) on the European Macroseismic Scale 1998 (EMS-98; Grünthal et al., 1998) and to compose a macroseismic map (see Atlas). Intensities gathered from official surveys provided convincing results because municipalities in Belgium were small (mean area size of only 19 km2) and numerous (2359 communes). After the large fusion of communes in 1977, in which Belgium changed from 2359 to 596 communes (with a mean area size of 82 km2), macroseismic surveys of more recent earthquakes lost the quality and resolution they once had because the new communes cover too large an area to be represented by only one intensity value.
At the end of the 19th century and beginning of the 20th century, local and regional press reports were very beneficial documents for seismologists in summarising earthquakes' impact (Alexandre et al., 2007; Camelbeeck et al., 2021). In addition to the press information already present in the ROB database, we consulted the La Louvière record office collections and scanned the press archives of the State Archives of Belgium (2021) to extend our knowledge on the Hainaut earthquakes. The list of consulted newspapers is presented in the Atlas.
Additional information comes from letters of individuals or small reports addressed by the coal mining companies to the ROB at the time of mining exploitation (Somville, 1936). The ROB also organised field missions after the 3 April 1949 [id 534] and 10 July 1954 [id 562] earthquakes to provide epicentral damage reports.
3.2 Intensity evaluation
Based on the sources mentioned above, we re-evaluated local intensities for each earthquake at each locality. Intensity is determined according to the EMS-98 scale, the current standard in Europe. Its great advantage is the use of building vulnerability classes, allowing for integration of the current state of the building stock in the intensity determination (Grünthal et al., 1998). The background to how we evaluated building vulnerability and assessed intensity is explained in Appendix A. As it was not always possible to precisely evaluate intensity as a single integer value, we provide for each IDP two intensity values, i.e. minimum (Imin) and maximum (Imax) intensity, corresponding to the possible range of the intensity evaluation.
3.3 The Hainaut intensity dataset
Based on the intensity evaluation, we created individual files that contain the communal intensity data points (IDPs) for each earthquake. For each of the 17 earthquakes for which the ROB official survey is usable to evaluate local intensities, we composed an inquiry book presenting the English translation of the communal replies to the ROB questionnaire. Using these books, the reader can examine the effects of each earthquake at each location. The IDP files and the inquiry books are included in the Supplement.
In Table 1, we give a chronological overview of 28 earthquakes that were widely felt or caused damage in the Hainaut coal area. For each of these 28 events, the impact and magnitude estimation are described in Appendix B. We also summarise the intensity information, the intensity barycenter and the epicentral population density of these events in a macroseismic map and provide these in Appendix B and in the Atlas. An example of these maps is shown in Fig. 3. Because newspapers often report precise addresses or places in cities where some specific damage occurred, we geocoded this information and report the type of damage on the macroseismic maps.
All this information composes a significant intensity dataset that is summarised in Table 2. This table presents the number of IDPs for each intensity unit computed by taking the mean of Imin and Imax values for the different localities.
Table 2Summary of intensity (EMS-98) data for the largest earthquakes in the Hainaut coal area and which are mapped in the Atlas. MAP: map number in Supplement. inq: earthquake with an official ROB intensity survey; *: earthquake used for Hainaut intensity attenuation modelling. Total: amount of IDPs with mean intensity of Imin and Imax.
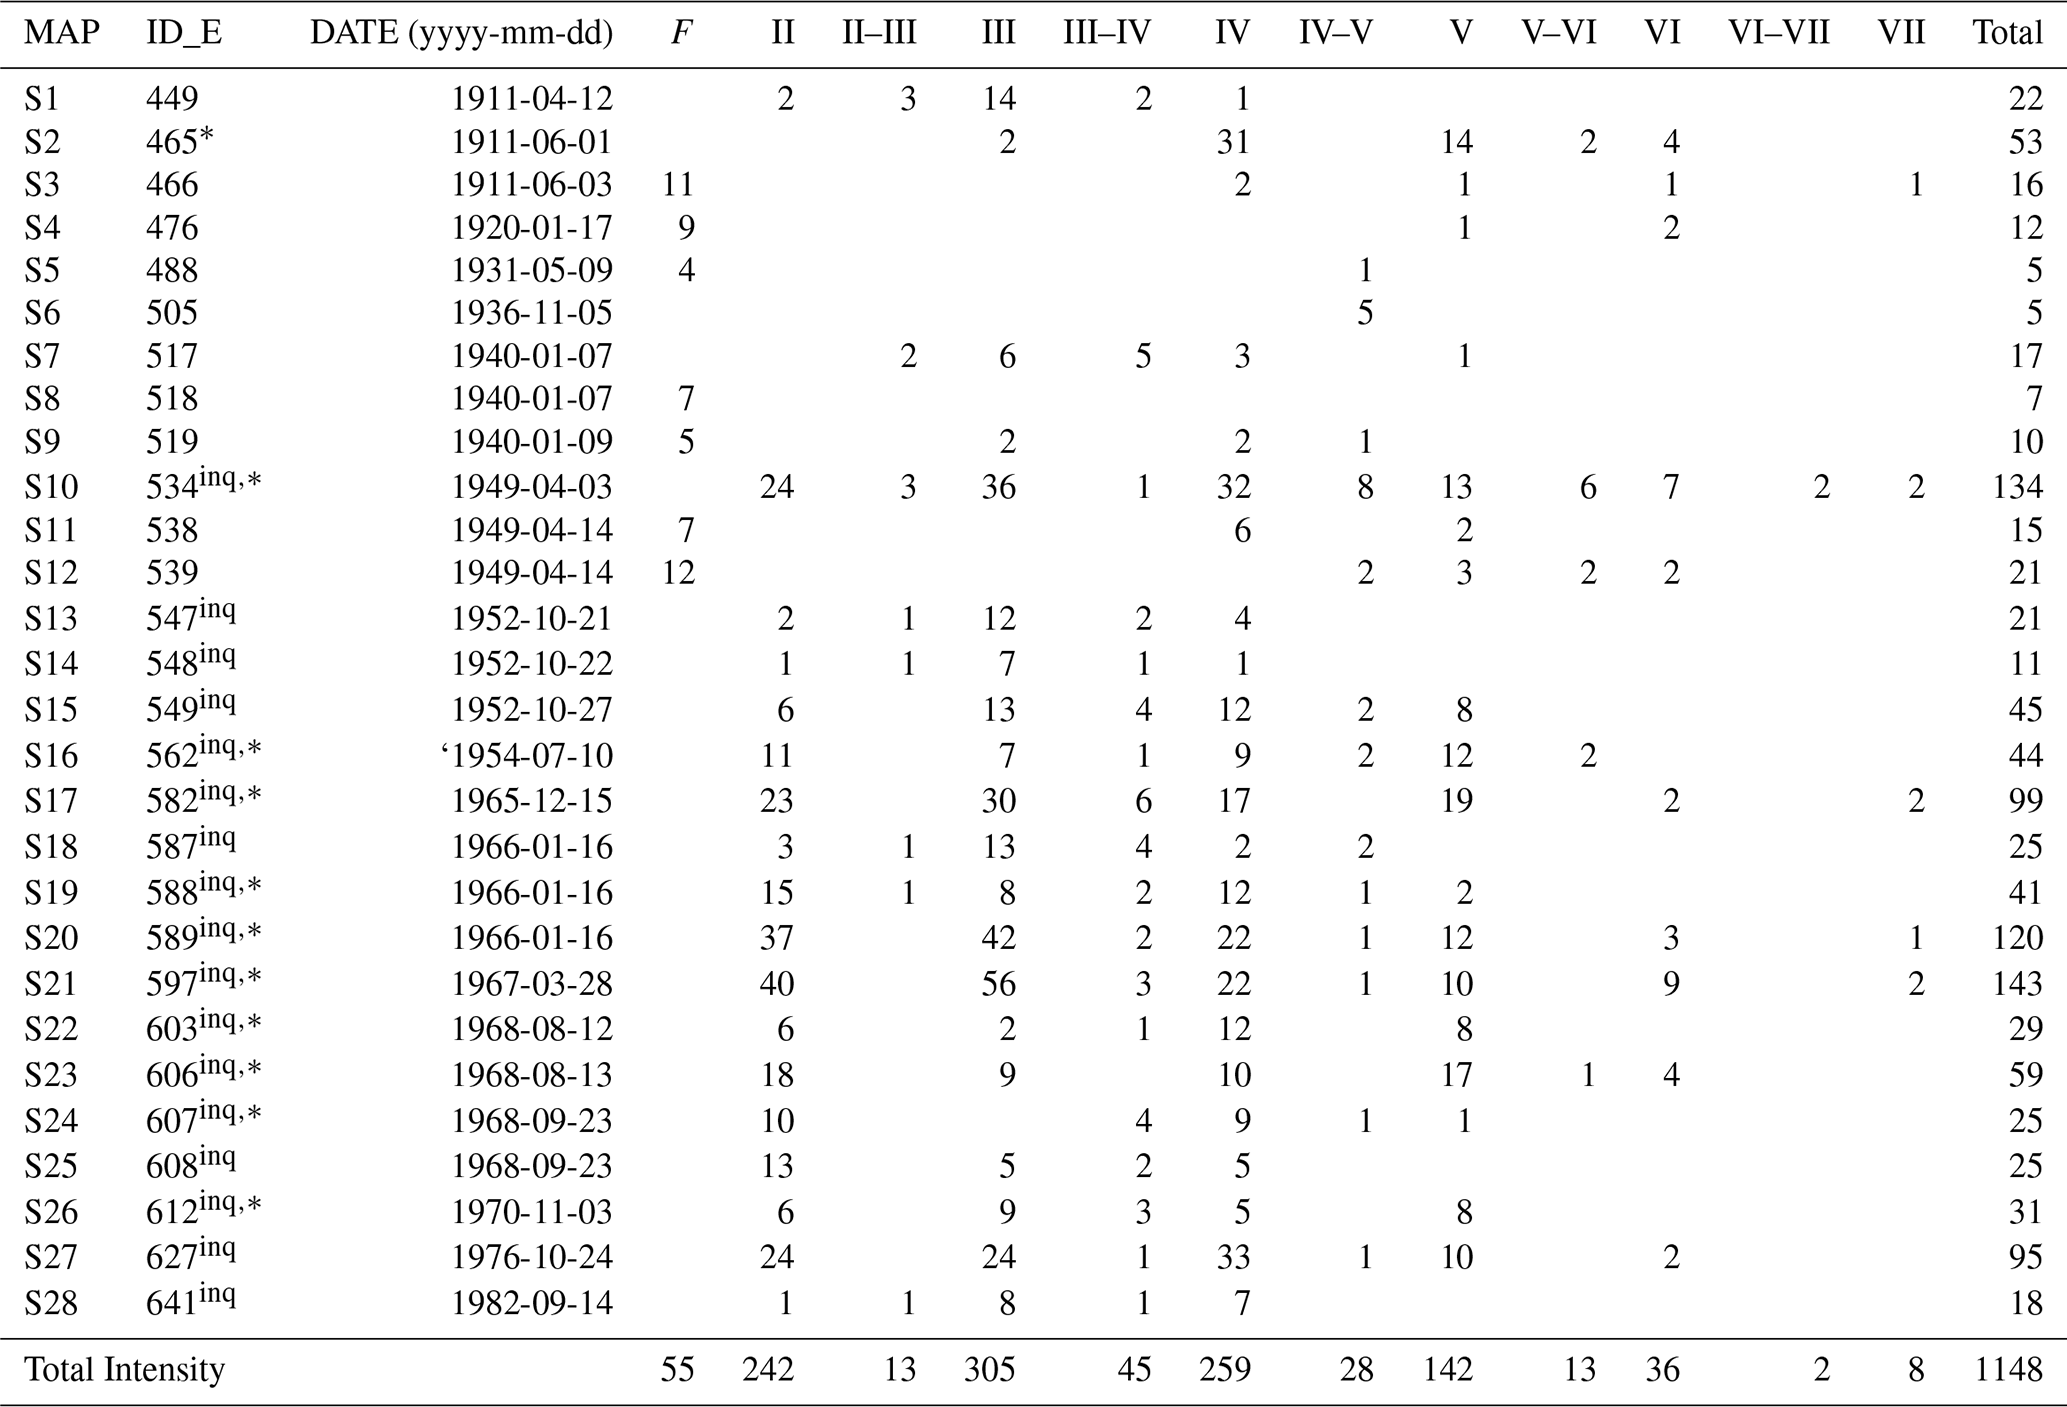
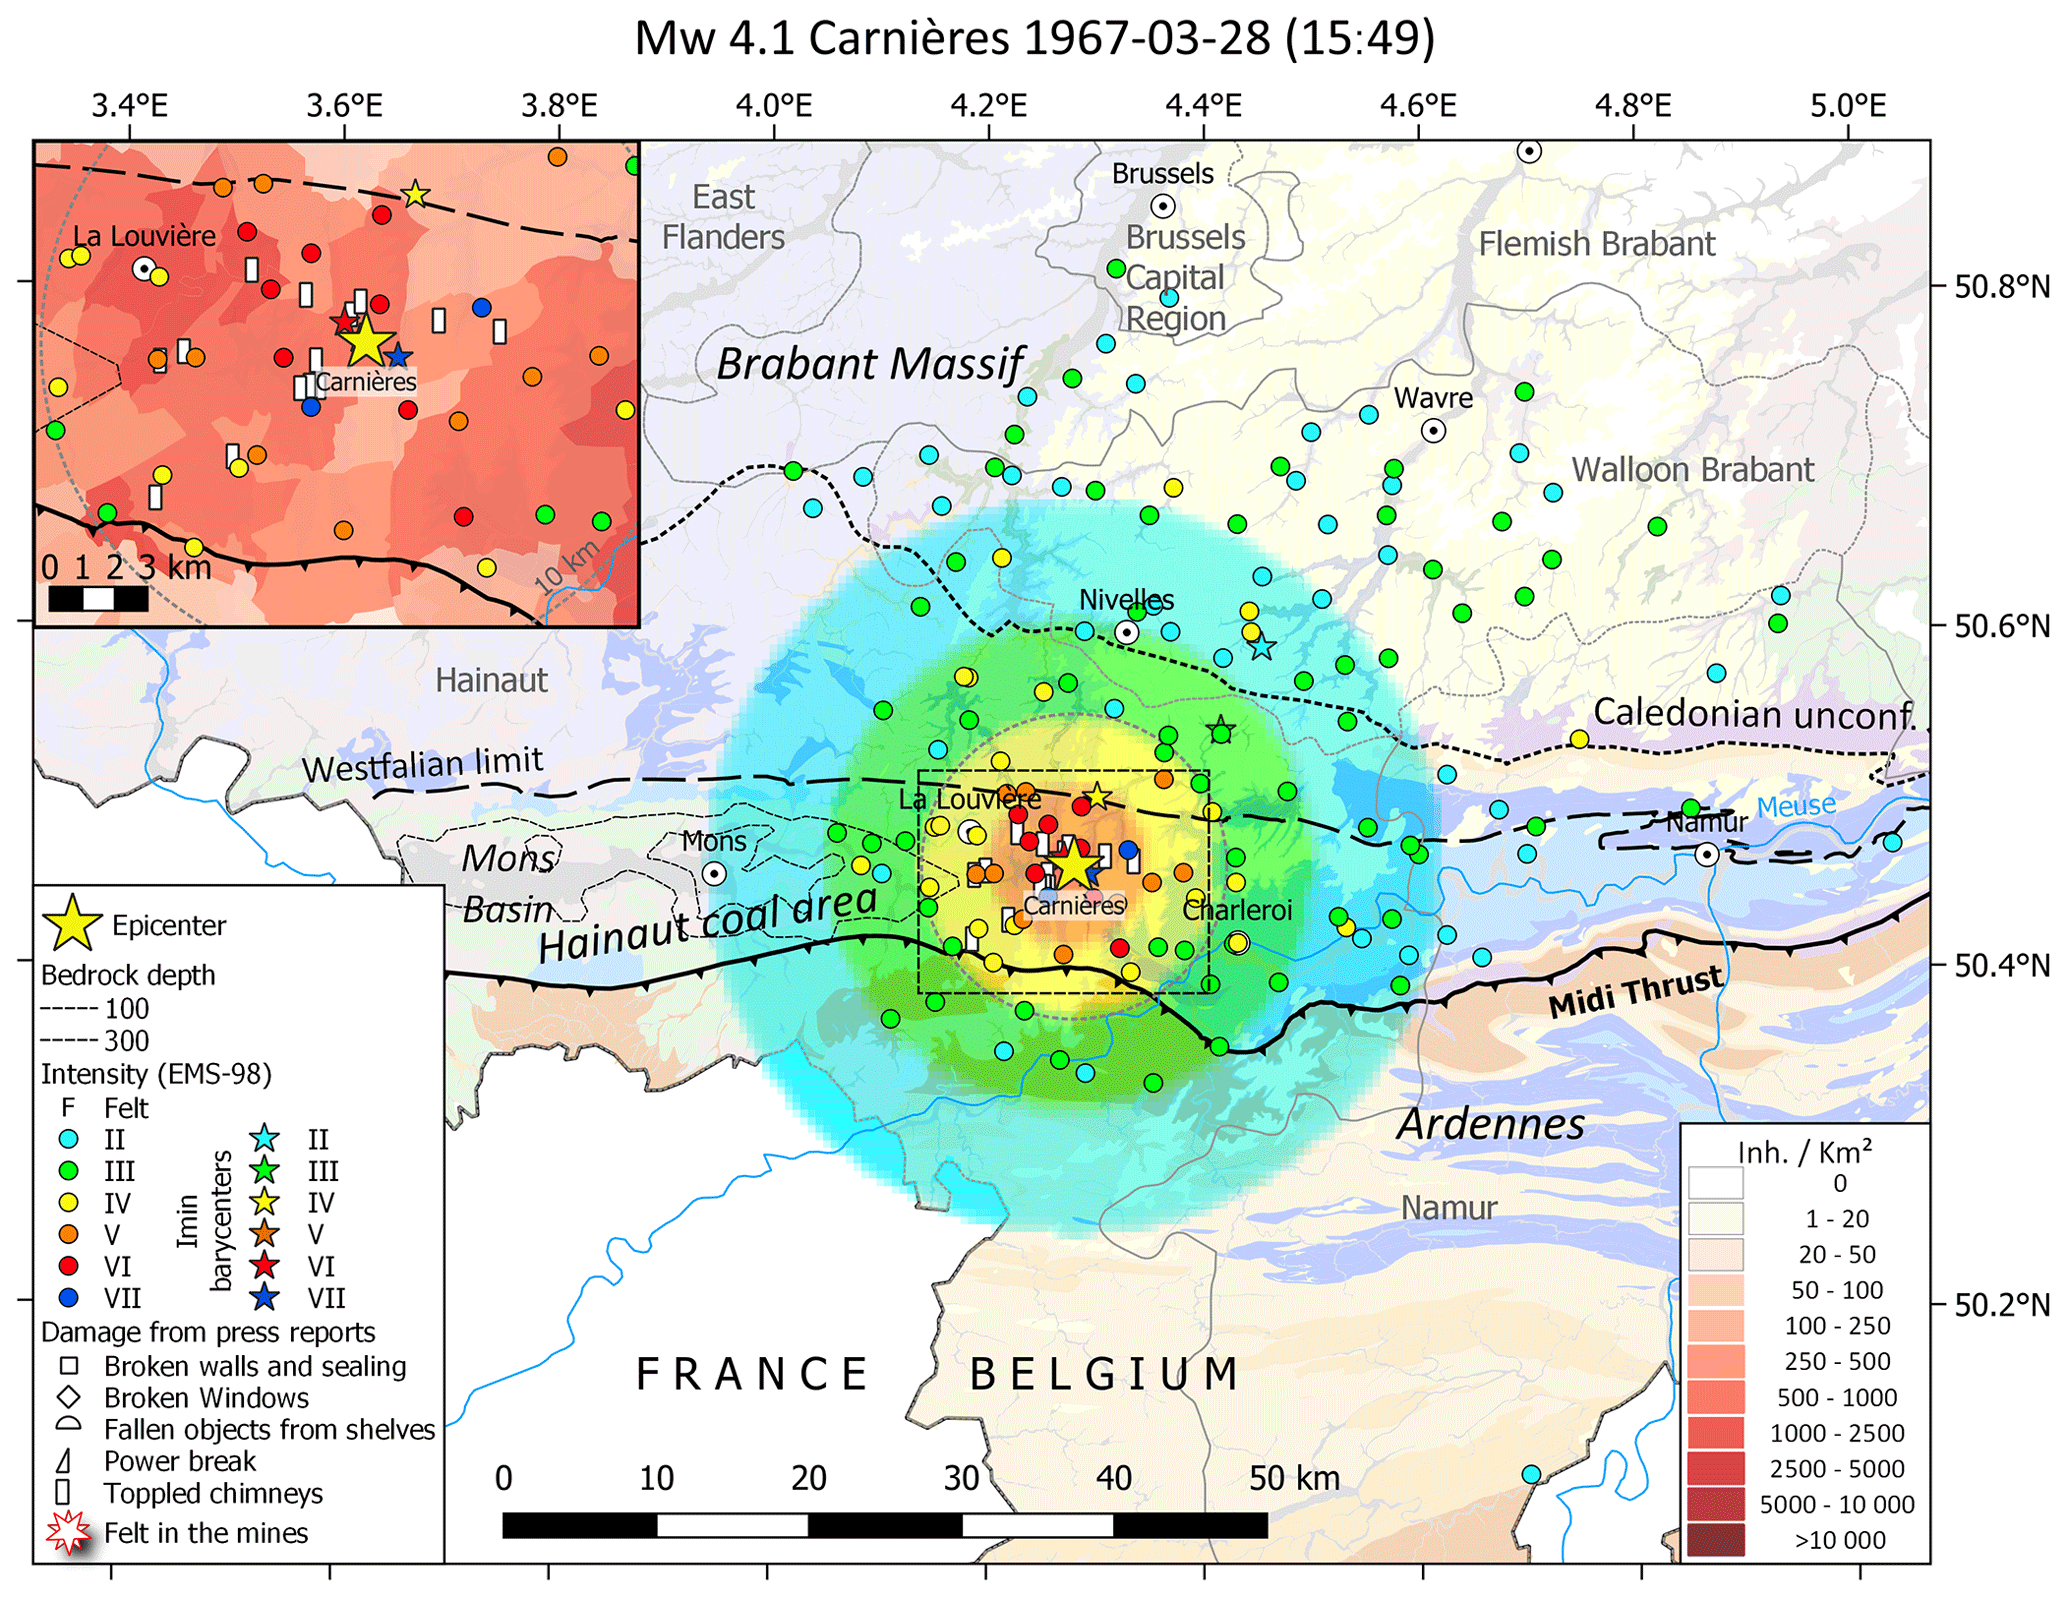
Figure 3Intensity information of Hainaut events is represented in macroseismic maps such as for the 1967 Mw=4.1 (ML=4.5) Carnières earthquake (no. 21 in Table 1). The inset shows localities where specific damage was reported in press reports. Note the asymmetric macroseismic field: this event was felt more northwards within the borders of the Brabant Massif than southwards in the Ardenne, which results in a northwards shift of the lower Imin intensity (IV, III and II) barycentres. In the background, the Hainaut intensity attenuation model developed in this study (see Sect. 4.2) is applied to the parameters of this event. Note that this attenuation model only can be applied within the coal area (between the Midi Thrust and Westphalian limit). Modelled Imax = VI, but locally intensity of VII was observed. See the Atlas in the Supplement for other events. Geology in the background based upon http://www.onegeology.org/. Reproduced with the permission of © OneGeology. All rights reserved. Times in all figures are given in UTC.
Seismic intensity is an empirical measure of the severity of ground motions generated by earthquakes. Determining intensity inside the radius of an earthquake's perceptibility allows for mapping of the ground motion strength and its spatial variability. The macroseismic field directly relates to earthquake epicentre location, focal depth and magnitude and the near-field energy absorption coefficient (Ambraseys, 1985). Hence, determining the parameters controlling seismic energy absorption offers the possibility to evaluate the location and magnitude of past earthquakes from their intensity spatial distribution (Sbarra et al., 2019; Provost and Scotti, 2020). Creating an attenuation model also gives the possibility to predict intensities for a specific earthquake with given focal depth and magnitude.
4.1 Methodology
Ambraseys (1985), Hinzen and Oemisch (2001), Bakun and Scotti (2006), and Stromeyer and Grünthal (2009) developed regional intensity attenuation models using earthquake datasets from western and central Europe. Except for Ambraseys (1985), who used isoseismal radii, these authors all based their models on IDP distributions. Knuts et al. (2016) and Camelbeeck et al. (2021) successfully applied these models to determine epicentral locations and magnitudes of historical earthquakes in Belgium. Even though these datasets include information on very shallow earthquakes, the small number of shallow events with respect to deep ones makes these models less suitable for simulation of the macroseismic field of shallow earthquakes. Seismic attenuation characteristics are more variable in the fractured upper layers of the crust because of large lateral variations of mechanical characteristics of rocks and sediments near the surface. Hence, for shallow earthquakes, it would be more appropriate to develop a new local intensity attenuation model than to use these western and central European models. Moreover, given the large available intensity dataset for the Hainaut coal area, it would be even more realistic (Table 2).
To develop a local Hainaut intensity attenuation model, we used the classical formulation developed by Kövesligethy (1907) and still widely used today (e.g. Ambraseys, 1985; Stromeyer and Grünthal, 2009):
where I is the intensity at epicentral distance R from an earthquake source at focal depth Z and I0 is the epicentral intensity. a and b are parameters that respectively correspond to the multiplication of the geometric spreading and energy absorption factors by the proportionality factor between intensity and ground motion acceleration (Ambraseys, 1985; Stromeyer and Grünthal, 2009). a and b can be derived by fitting Eq. (1) to the IDPs of calibration earthquakes with a well-determined location and focal depth. Solving the parameters of Eq. (1) using intensity datasets can performed by three different approaches: (1) using intensities and epicentral distances of all individual observations; (2) using the mean distance and its standard deviation by intensity binning; and (3) using the mean intensity and its standard deviation by distance binning (used in this work).
4.2 Intensity attenuation in the Hainaut coal area
Figure 4 presents an example for the 15 December 1965 earthquake (macroseismic map in Appendix B) and shows how IDP epicentral distance binning is applied. For each distance bin of 2.5 km, the diagram reports the mean intensity minus I0 (determined from the IDP distribution – see further below in this section) and its standard deviation, representing the intensity variability inside the distance bins. The number of IDPs in each bin progressively increases up to a distance of 15 km from the epicentre and then abruptly decreases. Beyond this distance, there are only a few IDPs, which are of low intensities, indicating that the earthquake was likely not felt in many localities contributing to these bins. This suggests that the mean values computed from these IDPs would overestimate the mean intensity of the bins because “not felt” localities are not included in the computation. This example also shows the rapid intensity decrease with increasing distance in the coal area (Fig. 4), which for the 15 December 1965 earthquake corresponds to a decrease of three intensity grades over a distance range of 15 km. North of the Hainaut coal area, inside the borders of the Brabant Massif (see e.g. Figs. 3, B2 and B4), the largest earthquakes are weakly felt with intensity II to III up to a distance exceeding 40–50 km, suggesting a slower intensity attenuation than in the coal area. South of the Hainaut coal area, the Midi fault (Fig. 2) seems to play the role of a seismic barrier and intensity decays more rapidly in the Ardenne Massif than in the Brabant Massif, agreeing with the observation of Charlier (1951).
IDPs at distances larger than 15 km should hence not be used to analyse intensity attenuation in the coal area because (1) IDPs beyond these distances bias the mean intensity values in the bins, and (2) the intensity attenuation of the coal area differs from attenuation in the Brabant Massif and in the Ardenne. Hence, applying a distance range larger than 15 km would not properly model the attenuation in the coal area, but would provide an intermediate attenuation including crustal characteristics from these three areas. We prefer distance binning of intensity with small bins of 2.5 to 3 km over intensity binning as it provides more data points, which is more appropriate to invert parameters a and b of Eq. (1). For example, for the 15 December 1965 earthquake (Fig. 4), the mean intensities of six distance bins within 15 km provide a more robust fit with Eq. (1) than the mean distances of four intensity bins, covering three intensity units, would do.
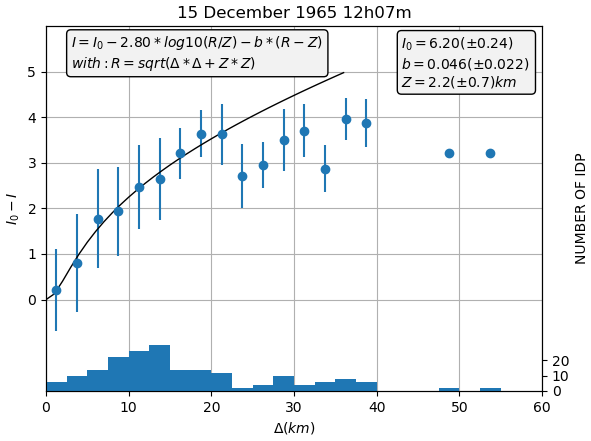
Figure 4Intensity attenuation of the 15 December 1965 Strépy-Bracquegnies earthquake expressed as mean intensity change relative to I0 (blue dots) calculated for bins of 2.5 km (histogram). Vertical blue bars show the intensity standard deviations for each distance bin that expresses the intensity variability in the bin. The legend reports local parameters fitting the intensity attenuation of Eq. (1), with the a parameter fixed to 2.80.
The dataset used for the attenuation modelling is relatively small, with 76 mean intensity values obtained by distance binning 12 key earthquakes. In our computation we also included two additional events (identified by an * symbol in Table 3) because, although they occurred outside the Hainaut coal area, the geological context of the felt observations is similar to the earthquakes that occurred inside the Hainaut coal area. These two events are the 24 October 1976 earthquake (Fig. S27), which occurred a few kilometres south of the Hainaut coal area, and the 8 November 1983 Liège earthquake (Fig. S29; Camelbeeck, 1993; Camelbeeck et al., 2021), which occurred in the Liège coal area, in a similar geological context as Hainaut.
The main hypothesis in our fitting analysis is that intensity attenuation is homogeneous in the Hainaut coal area, which means that the parameters a and b have the same values for all seismic events in the area. Hence, regarding the uncertainty of the attenuation model and the data, the observed variations in the intensity decay with increasing distance between the different calibration earthquakes are only associated with a difference in focal depth. We determine parameters a and b in two steps.
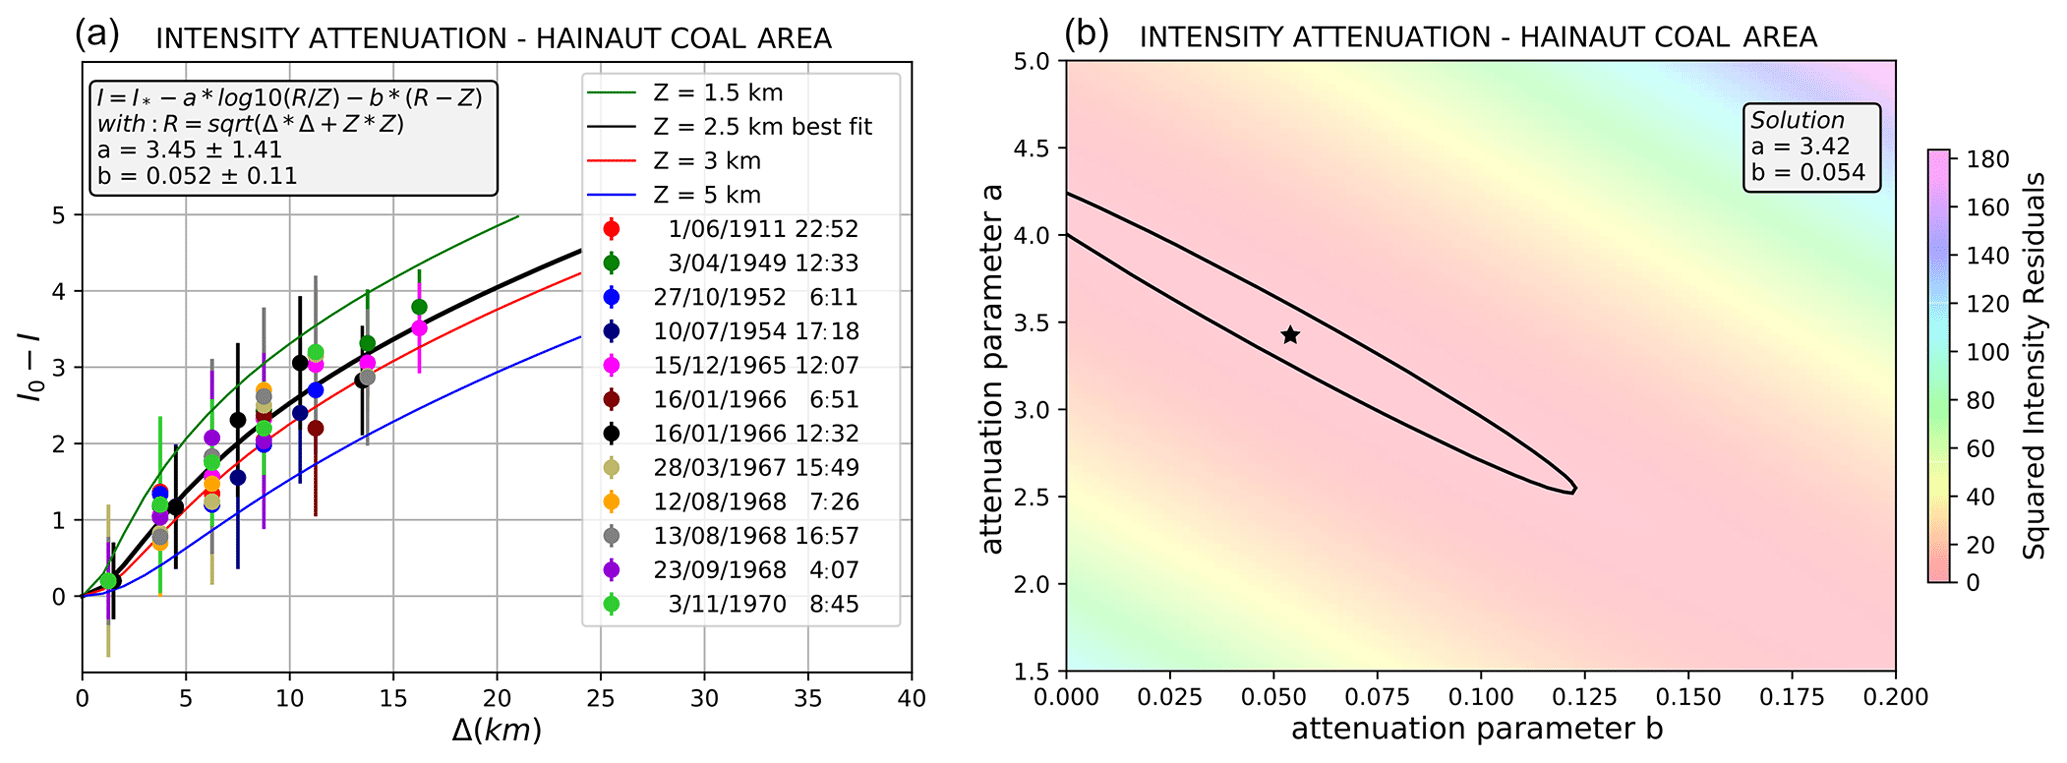
Figure 5(a) Fitting the intensity dataset of 12 calibration earthquakes to Eq. (1) to determine a and b attenuation parameters and the focal depth considering a uniform depth for all events. (b) Least-squares fitting by sampling the a and b intensity parameters space: the solution is represented by the star, and the black ellipse shows the limits of the 0.95 confidence region.
-
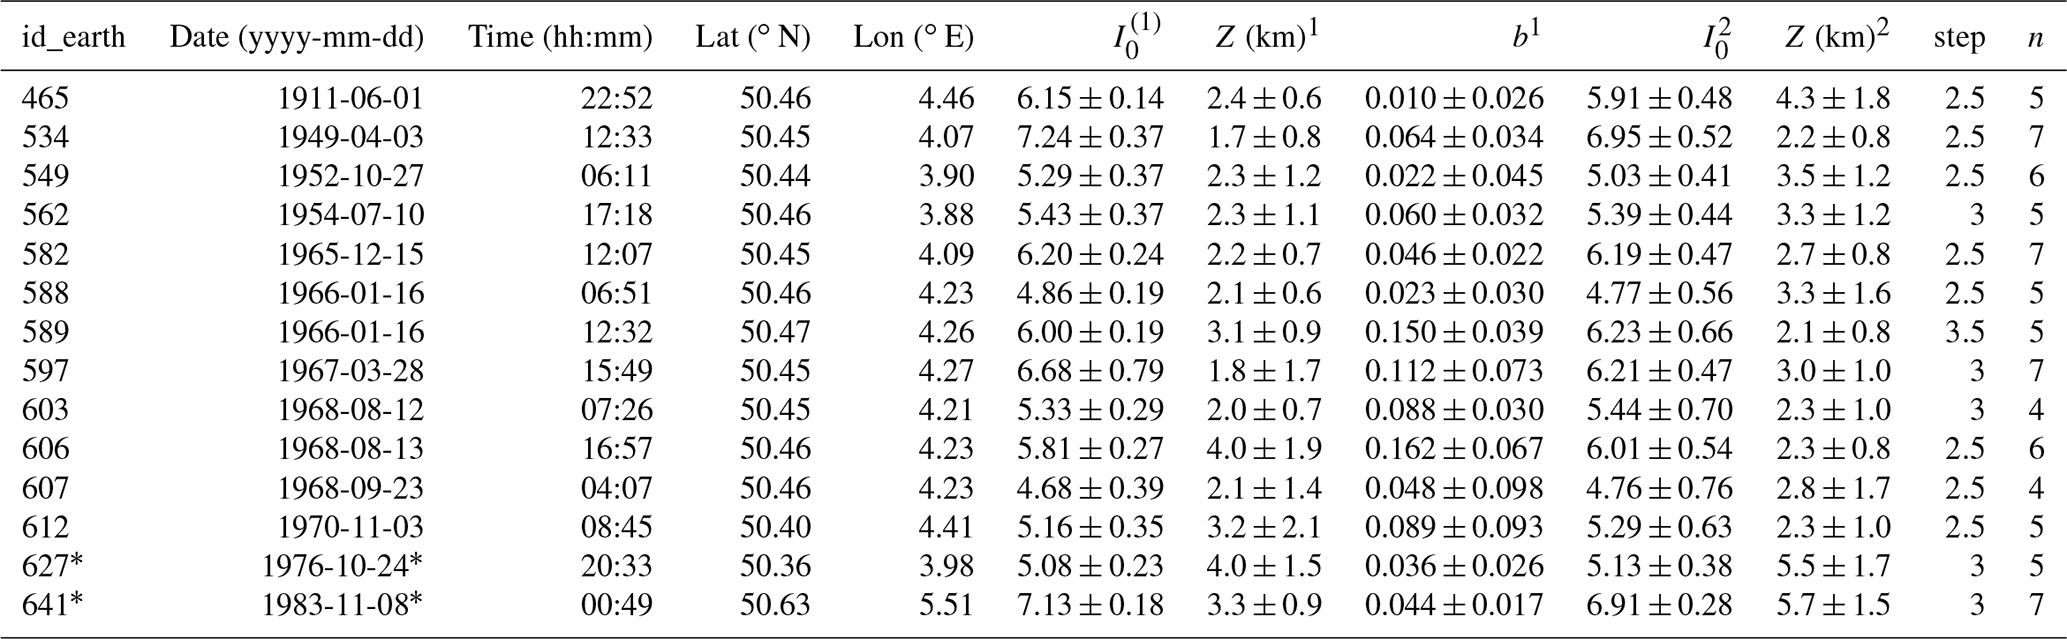
As focal depth is unknown for the calibration earthquakes, the first step in the analysis was to evaluate their depth by fitting each earthquake dataset to Eq. (1) (see macroseismic maps in the Atlas). As Eq. (1) has four unknowns and the number of distance bins for each earthquake does not exceed seven, we fixed the value of the parameter a, and inverted the equation to evaluate the attenuation parameter b, the earthquake focal depth Z and epicentral intensity strength I0. We considered that b is more dependent on the highly variable material properties near the Earth's surface than a, which should be relatively similar in Hainaut than elsewhere in Europe. We adopted the value a=2.80 of the WLQ model of Stromeyer and Grünthal (2009). Table 3 reports the results of this analysis. Our main conclusion is that all the studied Hainaut earthquakes have similar focal depths, ranging between 1.6 and 4.0 km, with uncertainties of around 1.5 km.
-
In the second step, we considered that the 12 calibration Hainaut earthquakes have the same focal depth, which is supported by the results of the first step of the analysis. Based on the results of the first step, we fixed the value of I0 by considering that the mean intensity of the first distance bin of each earthquake equals I0–0.3. We represent this estimation of I0 with I*. Then, we inverted the complete dataset to evaluate a, b and the focal depth, i.e. identical for all the earthquakes, which minimised the residuals by using least-squares modelling. Figure 5a presents the results of this inversion, in which and , while the focal depth that best fits the data is 2.5 km.
Table 3Depth evaluation of calibration earthquakes used for attenuation modelling. I0: epicentral intensity; Z: depth; b: attenuation parameter b; step: length of distance bin in kilometres; n: number of distance bins. 1 First step of the analysis in which parameter a is held constant at a value of 2.80; 2 second step of the analysis. * Earthquake not included in the attenuation modelling but used for verifying the model.
The relatively small number of data and the lack of information at distances larger than 20 km cause the large uncertainties of a and b. However, these uncertainties rely on their relative dependence, which is well illustrated by their joint confidence region in Fig. 5b. Figure 6 presents the intensity attenuation curves corresponding to the best solution and the two extreme solutions at the 0.95 confidence region for focal depths ranging from 1 to 6 km. The difference between these models for a given focal depth is very small for distances of less than 15 km, i.e. 0.3 intensity units for a distance of 20 km, but becomes more important at larger distances. The uncertainty of the two parameters reflects the fact that a controls the short distance behaviour and is better determined, while b characterises the curves at a large distance.
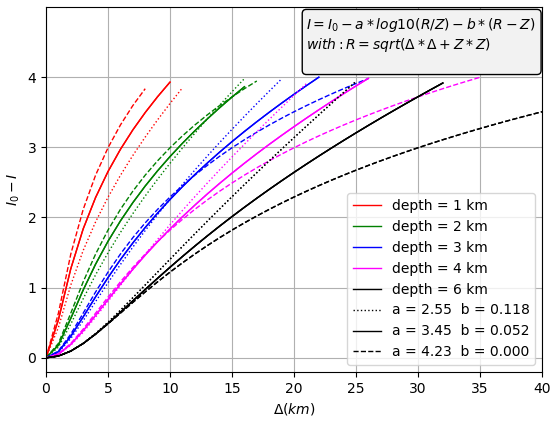
Figure 6Variation of I0−I as a function of epicentral distance corresponding to the intensity attenuation models of Fig. 5. The curves correspond to the best fitting solution (full lines) and the two extreme solutions (dotted and dashed lines) at the 0.95 confidence region for focal depths ranging from 1 to 6 km.
4.3 Earthquake focal depth
Figure 6 reports the influence of focal depth from 1.0 to 6.0 km on the intensity attenuation curves. Changing the focal depth has a stronger effect on the attenuation function than the uncertainties of the attenuation parameters. This observation indicates that focal depth can be evaluated with a good accuracy using IDPs and that the differences in attenuation observed between the different earthquakes in the modelling (Fig. 5a) reflect the small differences in their respective focal depths. Subsequently, we used the new Hainaut attenuation model to estimate the focal depth and the epicentral intensity of the 12 reference earthquakes in the Hainaut coal area and the 1976 and 1983 Liège earthquakes. Figure 7 presents the results of this modelling for the 15 December 1965 earthquake. In the Atlas, the same diagram is provided for the 13 other earthquakes. For earthquakes other than the 12 calibration events in Table 1, macroseismic datasets are less complete and the full modelling cannot be applied. Nevertheless, the available information is sufficient to correctly evaluate focal depth for most of them. For each event, the input data for focal depth determination are Imax, the maximal observed intensity, and the intensity I and epicentral distance Δ for each observed IDP. For each of these events, we created 250 different datasets by adding random noise with possible values of −0.5, 0 or +0.5 to the intensity I of the IDPs, which represents the uncertainty of each intensity evaluation. For each of the modelled IDPs, we searched the focal depth Z minimising by testing focal depths in steps of 0.1 km over a range from 0 to 10 km. The computed mean focal depths and the sigma value of the distribution from the 250 different models for each earthquake are indicated in Table 1 inside the brackets. For some other earthquakes, like the 1887 Havré and 1904 Fleurus events, or events that occurred between 1950 and 1960, only slight damage was reported and too few IDPs are available to compute their depth. However, from the estimations of Imax and the published perceptibility radius, we can still evaluate their focal depth by directly plotting the perceptibility radius as a function of the observed intensity decrease, as represented in Fig. 6. Results show that most of these events are very shallow. For these events, we indicate the estimated focal depth inside the brackets in the full catalogue in the Supplement, but without any uncertainty.
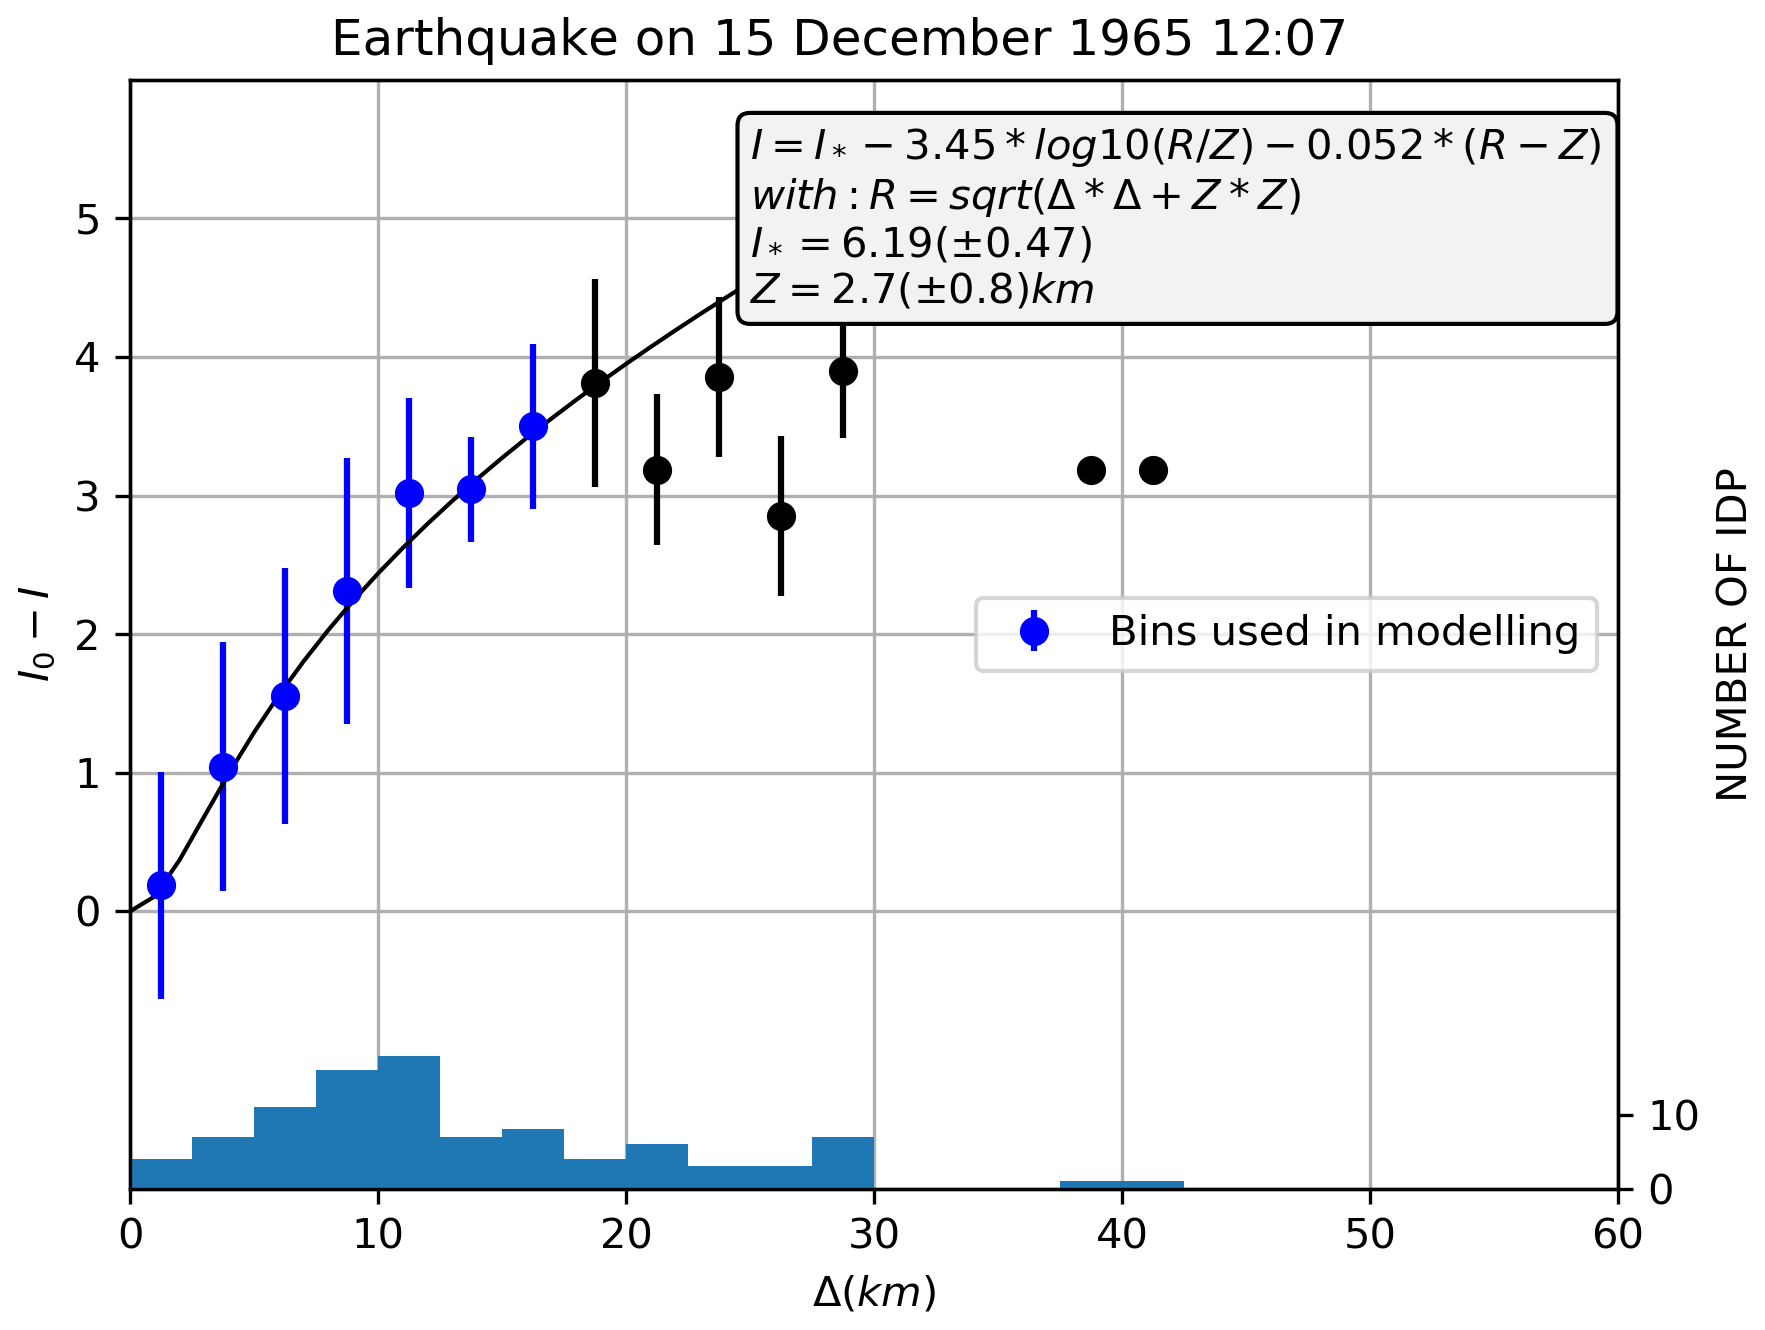
Figure 7Evaluation of focal depth and epicentral intensity for the 15 December 1965 Strépy-Bracquegnies earthquake. The first seven distance bins (blue) are used in the modelling. Similar diagrams are provided in the Atlas for the 13 other earthquakes for which this method was used.
Camelbeeck (1985a, 1993) determined the local magnitude ML of the Hainaut earthquakes between 1911 and 1985 when the seismic measurements from at least one seismic station were available. For some events, it was also possible to determine the surface-wave magnitude Ms using the Prague formula of Kárník (1971). Camelbeeck (1985b) estimated the seismic moments and Mw for 17 earthquakes that occurred between 1965 and 1970 in the Hainaut coal area based on the coda-wave envelope measured in the paper recordings from the Belgian seismic station of Dourbes. Even if the absolute value of these seismic moments was dependent on the approximate parameterisation of the scattering properties of the crust between the coal area and the town of Dourbes, the used method furnishes a reliable ratio of the seismic moment values between the different earthquakes. Denieul (2014) used the recordings of the CEA-LDG (Commissariat à l'Energie Atomique, Laboratoire de Détection et de Géophysique, France) seismic network to determine moment magnitudes of significant earthquakes in France and surrounding regions that occurred from 1963 to 2013. This study determined Mw for the three earthquakes in Hainaut that occurred on 15 December 1965 at 12:07 UTC, 16 January 1966 at 12:32 UTC and 28 March 1967 at 15:49 UTC as respectively 4.0, 4.0 and 4.1, with a 1σ uncertainty of 0.2. These results suggest that the moment magnitude determined from Camelbeeck (1985b) should be diminished by a constant factor of 0.3 magnitude units. This result also allows for re-evaluation of the relationship between ML and Mw for the Hainaut earthquakes furnished by Camelbeeck (1985b) as
which is valid between ML=2.6 and ML=4.6.
We reported in Table 1 the instrumental magnitude values that were determined for earthquakes in the Hainaut coal area. In addition, we used Eq. (2) to estimate Mw for the earthquakes for which only ML was determined. For those events, the Mw value and its uncertainty are indicated inside the brackets, while Mw determined from Camelbeeck (1985b) modified by Denieul (2014) are reported with their uncertainty without brackets. Thanks to the fact that instrumental magnitudes were determined for a part of the earthquakes for which macroseismic data are available, we were able to establish relationships between earthquake magnitude and macroseismic parameters. This allows for determination of a formula for the robust evaluation of earthquake magnitude Mw directly from macroseismic information for events that were not recorded by seismic stations.
We used the classical model (Sponheuer, 1962; Van Gils and Zaczek, 1978; Ambraseys, 1985; Stromeyer et al., 2004):
which determines the magnitude with knowledge of the epicentral intensity I0 and focal depth h. As the range of focal depth in our calibration dataset of 12 earthquakes is limited around 2.5 km (Fig. 6), it was not possible to find a reliable relationship with focal depth. However, I0 is a parameter resulting from the fitting of IDPs with Eq. (1) and hence cannot be determined for earthquakes with only few IDPs (e.g. for earthquakes of the 19th or first half of 20th century or the aftershocks of strong earthquakes). In this case, the only available parameter is the maximal observed intensity Imax (see Table 1). For this reason, we established a relationship between Mw and Imax (Fig. 8) rather than I0 so that a specific model can be used for earthquakes with few macroseismic observations:
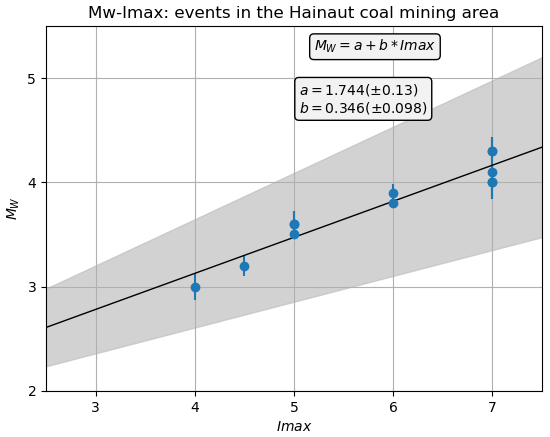
Figure 8Relationship between Mw and Imax (approximation for I0) determined for 12 calibration earthquakes in the Hainaut coal area (three data points are not visible because they are superimposed).
This relationship is certainly valid for earthquakes with focal depths in the range 1.5 to 4.0 km as the ones in our calibration dataset and their associated seismic sequences, but it would overestimate the magnitude for earthquakes closer to the surface. Considering that geometrical spreading would play a more significant role in seismic waves energy attenuation from the hypocentre to the surface and that body waves are a major part of the radiated energy to the surface, b is fixed to 2.0 in Eq. (3).
Hence, for earthquakes shallower than 1.5 km, we determined Mw using the following relationship:
In Table 1, all the earthquakes for which Mw was determined using macroseismic information and Eq. (4) or Eq. (5) are reported in column Mw_m.
In this discussion, we emphasise four aspects of the seismicity that occurred in the Hainaut coal area between the end of the 19th century and 1985. First, we compare the impact and intensity attenuation of the Hainaut earthquakes with the ones of shallow earthquakes with similar magnitudes in other regions of the world. Second, we describe the cumulative impact of the Hainaut coal area seismicity and compare it to the effects of a few larger magnitude 20th century earthquakes on the Hainaut area, suggesting that the Hainaut seismicity could be overestimated in current seismic hazard maps. Third, we discuss the pertinence of our new Hainaut intensity attenuation relationship in the light of the spatial resolution of our intensity dataset and the local and regional geological configuration. Last, we underline the importance of our focal depth determinations to discuss the causality of seismicity in and around the Hainaut coal area.
6.1 How fast is the Hainaut attenuation?
Our study determines that the Hainaut events were locally damaging when Mw was greater than 3.5, and that damage stayed spatially limited because intensity decreased fast, by two grades in a range of distances from a few to a maximum of 7–8 km from the epicentre (Fig. 6). From the perspective of seismic hazard issues, it is relevant to evaluate whether or not this attenuation and the spatial extension of damage are similar in other regions worldwide where shallow seismicity occurs. To tackle this question, we compare in Fig. 9a and b the intensity datasets of Mw=3.5 and Mw=4.0 earthquakes in Hainaut with shallow earthquakes of similar magnitude induced or triggered by gas extraction (Groningen gasfield, NL; Dost and Kraaijpoel, 2013) or wastewater injection (Oklahoma, USA; Atkinson, 2020). We also provide the Hainaut intensity attenuation curve in these two diagrams. In Fig. 9c, we compare the Hainaut attenuation curve with Mw=5.0 earthquakes induced or triggered by potash and salt mining (Völkerhausen, DE; Leydecker et al., 1998) or rock removal above a pre-stressed fault (Le Teil, FR; Schlupp et al., 2021).
In this analysis, we compute the mean intensity decay and its standard deviation for hypocentral distance bins of 3 km through the individual Hainaut datasets. The main result is that, regardless of the magnitude, the mean intensity and the mean plus one standard deviation of the bins for events elsewhere in the world are larger than the Hainaut attenuation relationship and most of the Hainaut bins. This is clearly visible at a large distance (Fig. 9) and is very likely associated with the location of the Hainaut coal deposits in the frontal zone of the Variscan tectonic belt. In this region, strong attenuation can be associated with the combined effect of a high fracturing degree of the subsurface and a low Q factor associated with the slow propagation velocity of coal deposits.
At short distance, it is difficult to differentiate a real difference in the mean value and the mean value plus 1σ of the intensity bins for magnitudes Mw=3.5 and Mw=4.0. Nevertheless, despite their greater focal depth, the bins of the Huizinge earthquake (depth = 3 km) and Oklahoma events (depth = 5 km) show similar or slightly greater values than the ones for Hainaut events (mean depth of 2.5 km), suggesting a slightly more damaging impact than in Hainaut. Moreover, if an earthquake of magnitude Mw=5.0 would have occurred in Hainaut, our analysis shows that its impact would have been smaller than the impact of the very shallow Le Teil 2019 and Völkershausen 1989 seismic events. For these two events, the radius in which the mean intensity is larger than V is twice as large as the intensity V radius of the Hainaut earthquakes.
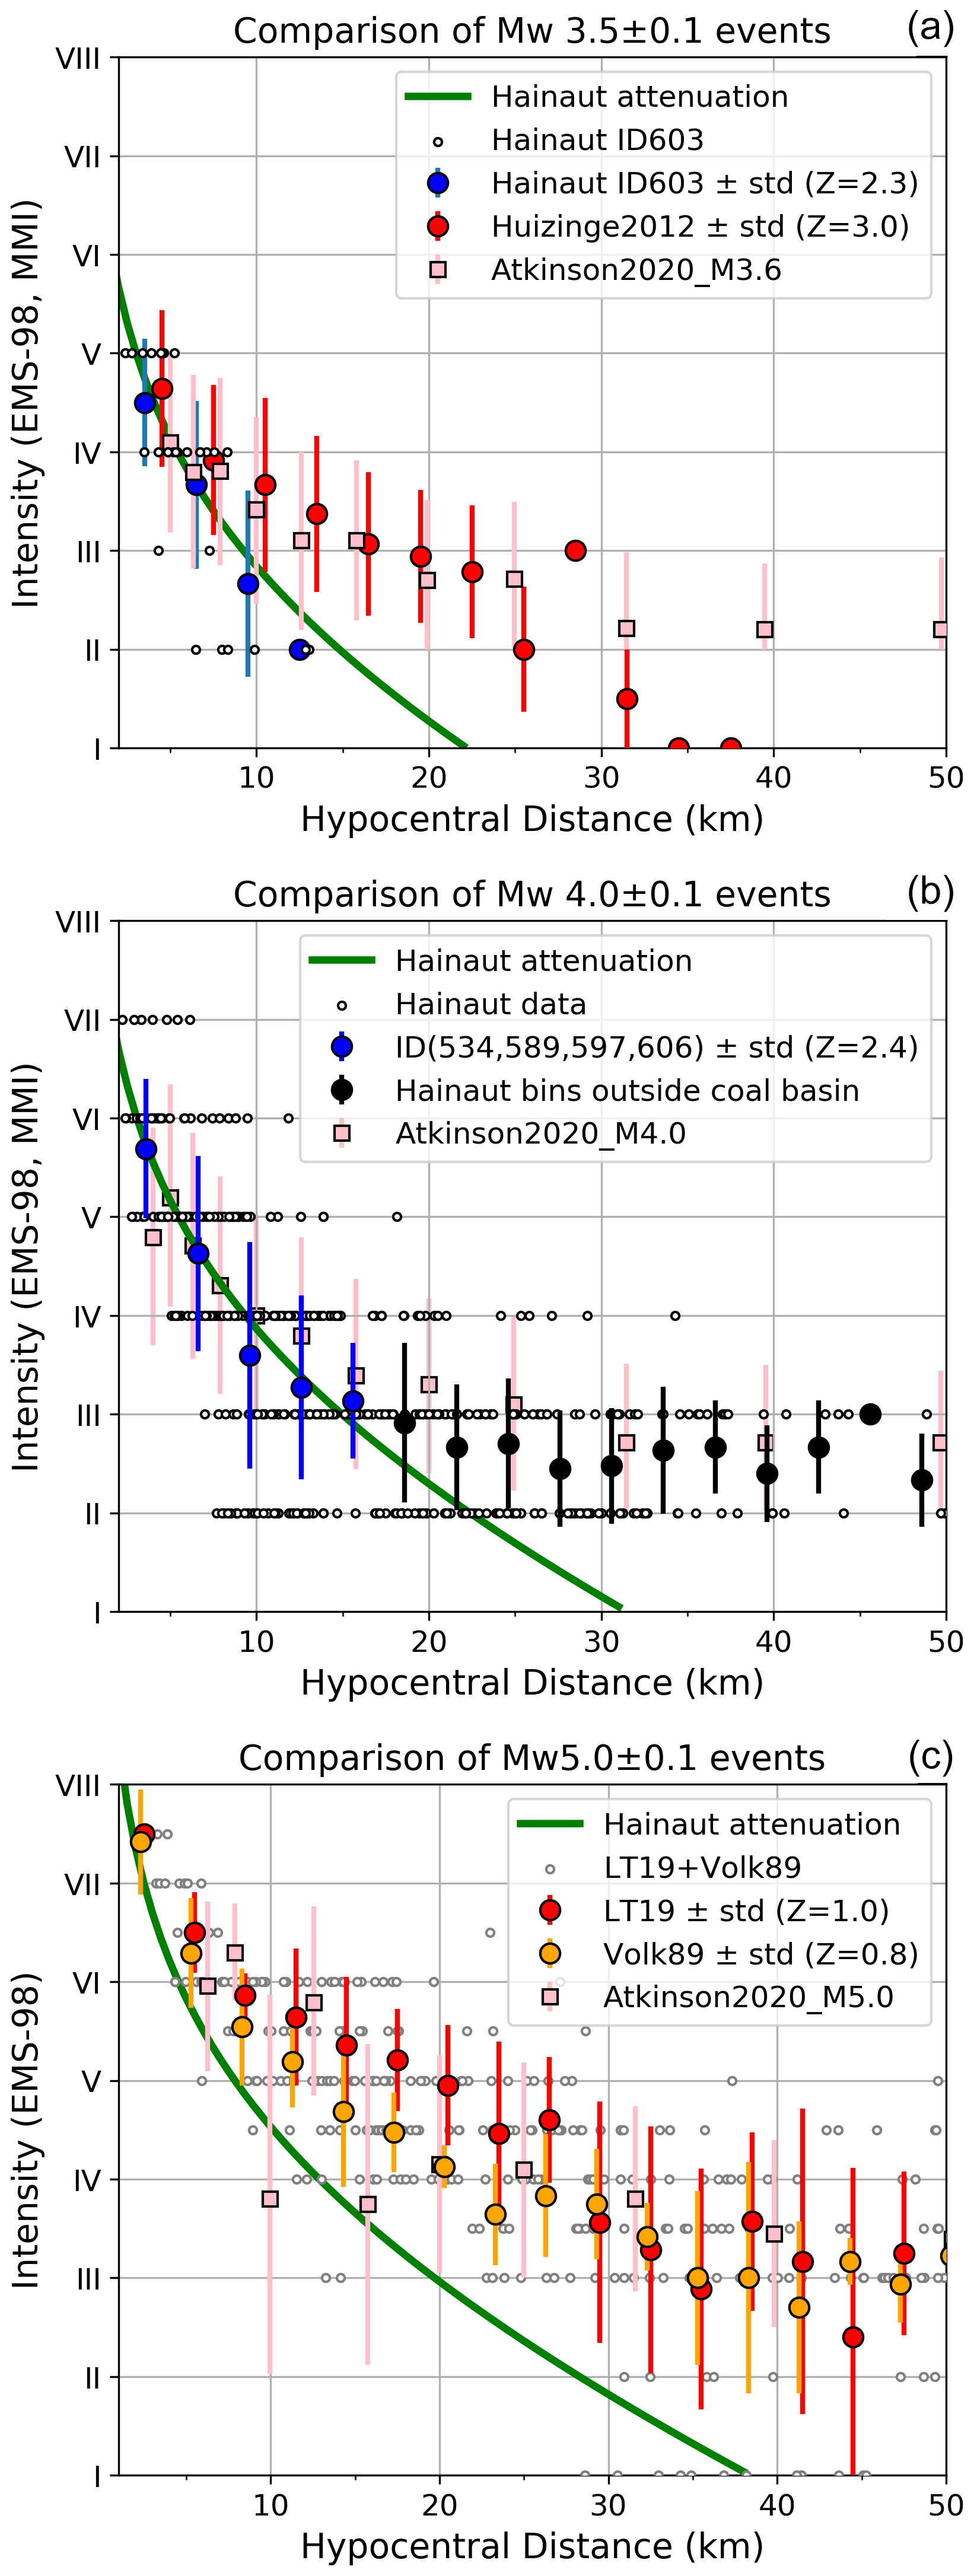
Figure 9Comparison of binned (3 km) intensity–distance observations for (a) Mw=3.5 earthquakes in Hainaut, in Huizinge (Groningen gasfield, NL; Dost and Kraaijpoel, 2013), and in Oklahoma (USA; Atkinson, 2020), (b) Mw=4.0 earthquakes in Hainaut and in Oklahoma (US), and (c) Mw=5.0 earthquakes in Le Teil (FR; Schlupp et al., 2021), Völkershausen (DE; Leydecker et al., 1998) and Oklahoma (USA). IDPs (small grey dots), mean intensity (coloured dots or squares) and standard deviation (bars) of the different intensity datasets are shown in comparison with the fast decay of the Hainaut intensity attenuation relationship (green line). Z= depth in kilometres.
6.2 The impact of the Hainaut seismic activity
The macroseismic maps in the Supplement present the impact and the importance of damage caused by the different earthquakes that stroke the Hainaut area between 1887 and 1985. The analysis presented in Fig. 9, in which the intensity distribution from, among others, one and four Hainaut earthquakes of magnitudes Mw3.5 (panel a) and Mw 4.0 (panel b) respectively are shown, demonstrates the average impact of these Hainaut events. By computing the median and 84th percentile (84 pct) distance for each damaging intensity unit, we conclude that for a Mw=3.5 event at 2.3 km depth in Hainaut, negligible to slight damage (starting from I= V) can be expected up to an epicentral distance of 3 km (84 pct: 4 km). For Mw=4.0 events, substantial damage (I=7) can occur up to a median epicentral distance of 2 km (84 pct: 4 km); moderate damage (starting from I= VI) up to 3 km (84 pct: 7 km); negligible to slight damage up to 5 km (84 pct: 8 km).
To obtain a global view of the damaging character of the Hainaut seismicity, we report in Fig. 10 the maximum intensity observed within each commune in the Hainaut coal area for all 124 events of the Hainaut seismic catalogue. Maximum intensity equal to or greater than V was observed in all the localities in a 60 km long and 15–20 km wide range of the coal area, which extends from 10 km east of the French border to 15 km west of the city of Charleroi. Outside the coal area, this seismicity had no damaging impact, and only in a few communes was intensity V observed. The area between Mons and Charleroi centred on La Louvière was the most affected part, with widespread repartition of maximal intensity VI, including some localities where intensity VII was observed. In the Borinage-Mons basin, intensity VI was only observed locally in a few communes in its western part. However, this maximal intensity may have been observed more than one time in some localities.
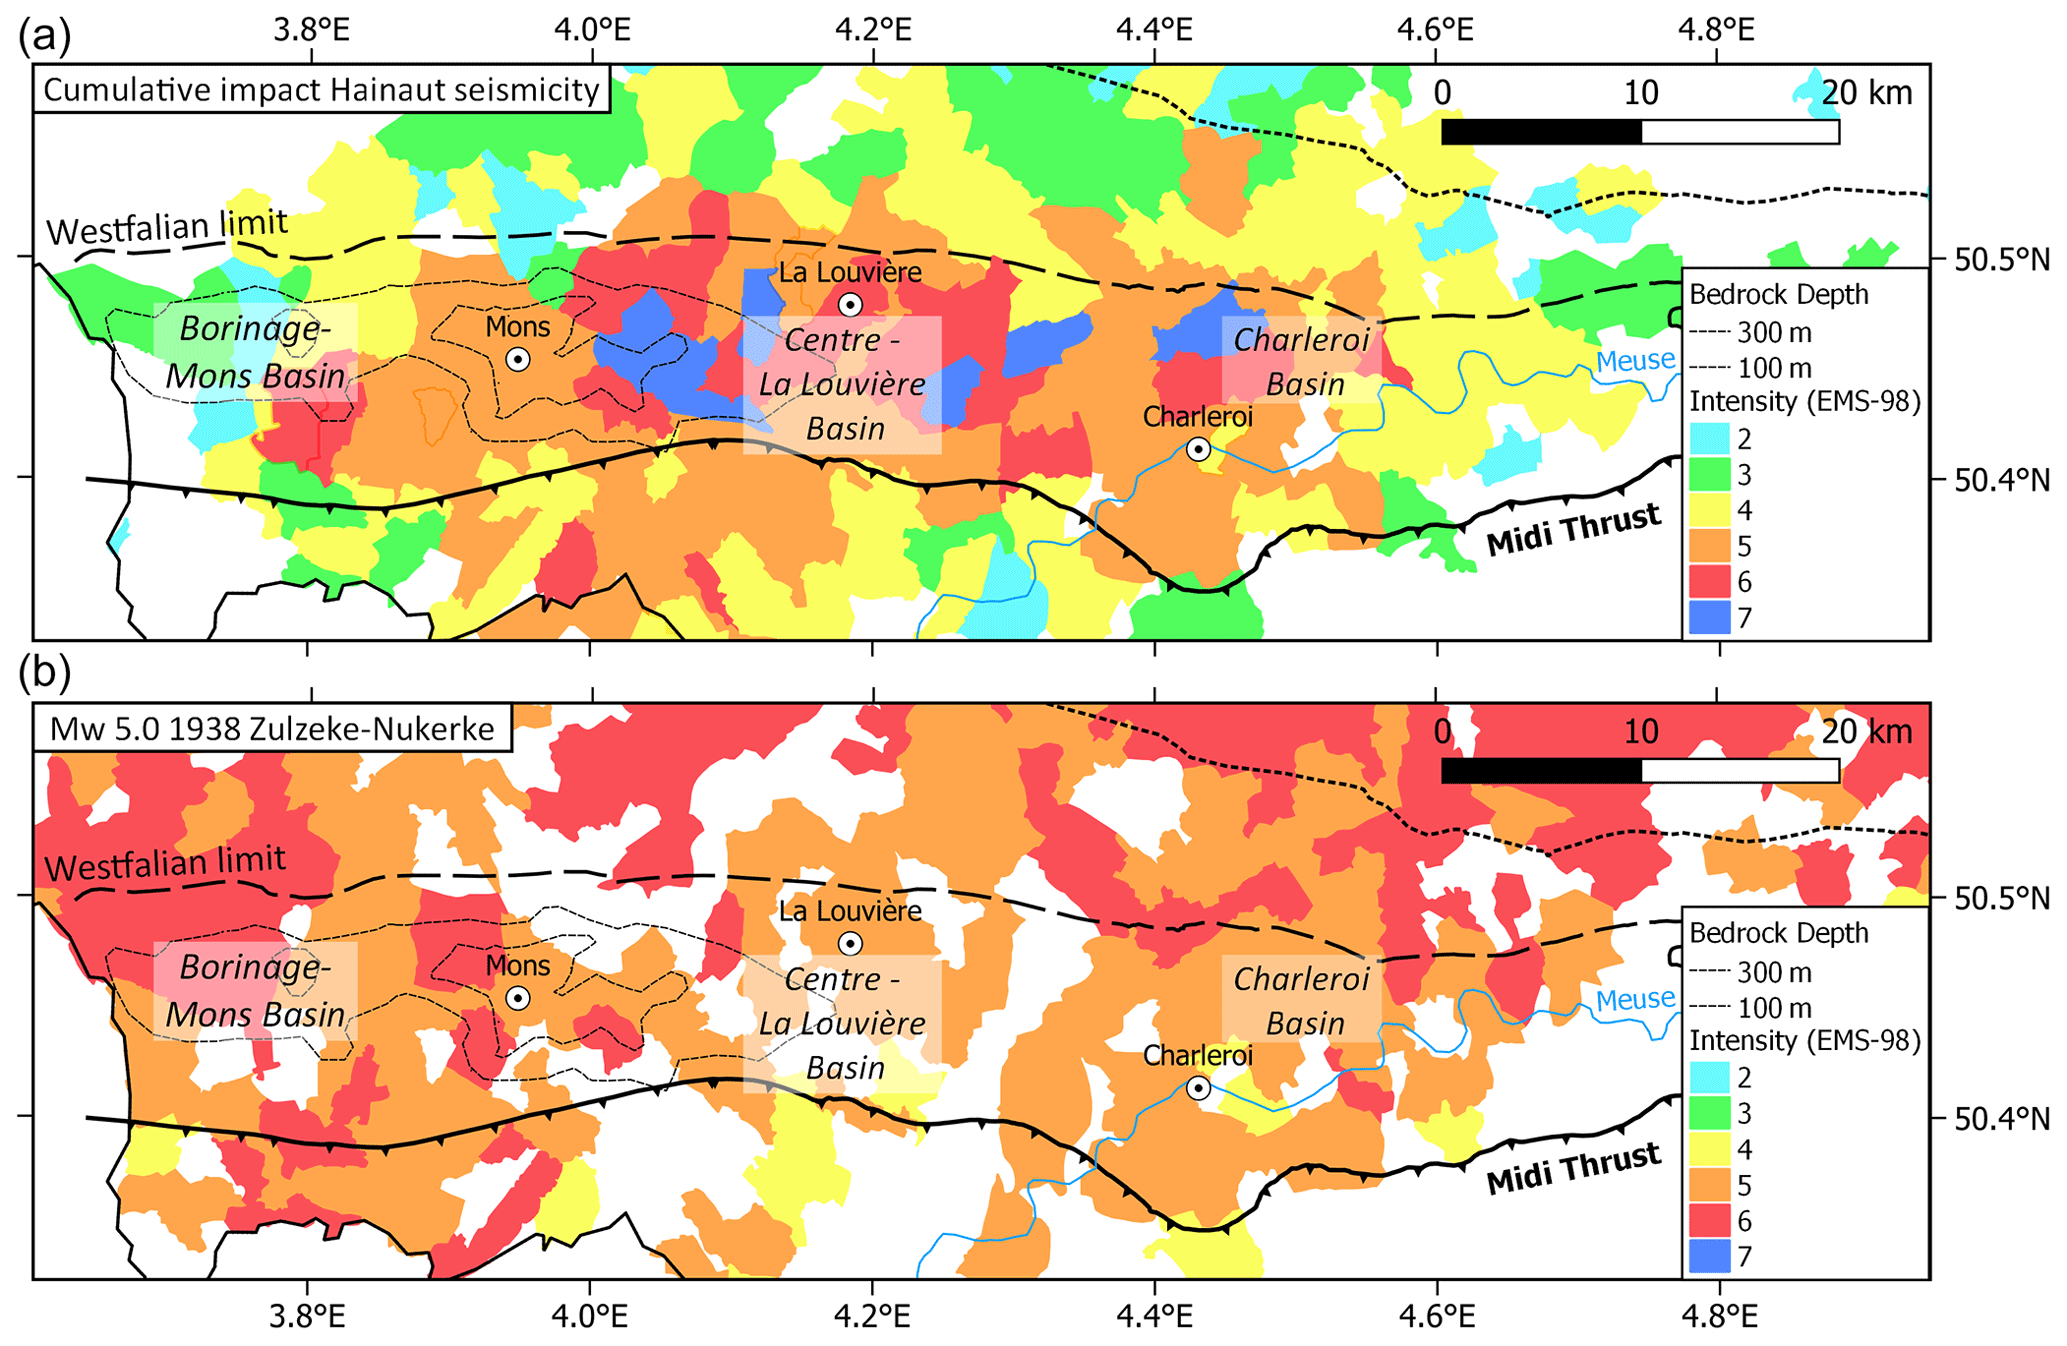
Figure 10(a) Communal map of the Hainaut coal area showing the maximum intensities that were reached by the 124 earthquakes. (b) For comparison, the impact of the 1938 earthquake on the Hainaut coal area is shown. This earthquake had a larger impact on the Brabant Massif and in the western part of the Mons basin but not on the Centre-La Louvière or Charleroi basins.
Apart from the Hainaut seismicity, also two other 20th century earthquakes had a strong local impact on the Hainaut coal area: the strongly damaging 11 June 1938 Zulzeke-Nukerke Mw=5.0 (S30) and the 20 June 1995 Mw=4.1 Le Rœulx (S31) earthquakes in the Brabant Massif (Fig. 1). Both events occurred much deeper (20 and 25 km respectively) and had a totally different effect than the Hainaut earthquakes because they were widely felt. In many localities in the coal area, intensity V was reported. Intensity VI was observed mostly in the western part. Despite that the 1938 earthquake occurred 40 to 45 km north-west of the western extremity of the Hainaut coal area, this event caused more local slight damage in the Borinage-Mons basin than the maximal cumulative impact of the Hainaut seismicity (Fig. 10b). Outside the coal area, the impact of the 1938 earthquake is even larger everywhere. Similar conclusions arise from the few original documents concerning the effects of historical earthquakes. Some of them had a larger impact in the coal area than the individual 19th or 20th century Hainaut earthquakes. Apart from the 23 February 1828 earthquake (see Sect. 2), the earthquake that had the largest impact in the area is the 18 September 1692 Mw=6.0 earthquake, which occurred in the Belgian Ardenne (Fig. 1). This large earthquake caused significant damage in the city of Mons where many houses, churches and other buildings were damaged and half ruined and more than 80 people were either killed or injured (Alexandre et al., 2008). These differences in impacts between the Hainaut coal area events and seismic sources outside the Hainaut area indicate that the contribution of the Hainaut coal area seismicity to the impact of earthquake activity in southern Belgium and northern France during the last 300 years (Fig. 1) is overestimated. However, inside the coal area, we have to keep in mind that the maximal intensity was reported in some localities more than one time.
Seismic events in the Hainaut coal area often occurred in seismic sequences that sometimes lasted several weeks. The repetition of shaking and waking up during the night, and the increasing damage that sometimes led to the ruin of some houses aggravated the way this seismicity was experienced by people. This was particularly true during the Havré seismic sequence of April–May 1949. Moreover, as the population associated this seismic activity with the mining industry, it was at the origin of many complaints against this industry. To date, no study has analysed the impact of these earthquakes on the population living on the Hainaut coalfield in comparison with the numerous other nuisances created by mining. Indeed, many buildings in the Hainaut coal area were damaged due to underground progression of coal exploitation and the progressive settling that followed. Troch (2018a, b) present the example of the locality of Gosselies near Charleroi, which was completely devastated between the two world wars because of extensive coal production. In some areas, mine subsidence led to surfacing groundwater and increased the risk of flooding. It was necessary to evacuate the water by using pumping systems; in other cases, wetlands, marshes, swamps, ponds and lakes appeared in the affected area (Troch, 2016). The subsidence and the permanency of humidity in some areas caused by mining activities are also factors affecting the resistance of buildings.
6.3 Intensity attenuation modelling
We assume in Sect. 4.2 that the spatial distribution of intensity observations is adequate in number and is spatially unbiased, which allowed for correctly quantifying the rapid intensity decay with epicentral distance in the coal areas. For the 12 earthquakes included in the attenuation analysis, 813 IDPs are available (Table 2). These IDPs are mainly derived from the information provided by the ROB official survey since 1949. The high population density in the coal area explains why, within a radius of 15–20 km, most of the local authorities answered the inquiry (see Fig. B1 or the Atlas). For earthquakes older than 50 years, such a density of information provides a real opportunity to study earthquake impacts because there are very few biases in azimuth and distance. Outside the coal area, the population density is lower and the areas are more rural, which could explain why local authorities took less care in answering the official inquiry and why information mainly came from the larger localities. Of course, the largest Hainaut earthquakes were only weakly felt (intensity II to III) in these areas and the answers to the inquiries may provide an unrepresentative view of earthquake effects. This under-representation not only occurs in historical earthquake records but is also present in online “Did You Feel It?” (DYFI) records for some parts of the world where online data collections are not broadly accessible (Hough and Martin, 2021).
Hence, the most limiting factor in the information is the resolution of the distance between the IDPs. Before the community fusion in 1977, the size of the communes ranged between 3 and 15 km2, with a mean equivalent circular radius ranging between 1.0 and 2.0 km. Since 1977, community size and radius have increased and range respectively from 17 to 65 km2 and from 2.3 to 4.5 km. The small dimension of the communes explain why the steps considered in the intensity distance binning is 2.5 or 3 km, which are just at the limit of undersampling a range of two intensity values from the epicentre for events with a focal depth of 1 km (Fig. 6). The intensity averaging process in the communes induced by this inquiry also leads to underestimation of peaks of intensity at local places, an unfortunate effect that is even larger for the larger communes after the fusion. For some larger earthquakes, we could rely on press reports and letter testimonies to highlight some of these locally increased intensities and to identify where they are located. For Belgian earthquakes between 1977 and 2002, this communal resolution problem complicates intensity modelling. Fortunately, the availability of the online ROB DYFI inquiry since 2002 (Camelbeeck et al., 2003; Lecocq et al., 2009) can resolve this granularity in the future as street addresses of testimonies can now be geocoded and intensity data can be aggregated in size-adaptable grid cells (Van Noten et al., 2017). For potential future events, this strategy might allow oversampling of the macroseismic field and modelling of the intensity variability in each commune, except in localities with extensive damage (cf. the Doughnut Effect in Bossu et al., 2017), where field surveys would then be needed (as done by Sira, 2015).
Van Noten et al. (2017) and Camelbeeck et al. (2021) illustrated how regional geological structures and bedrock depth in Belgium and surrounding regions have an effect on intensity attenuation. Our gathered intensity dataset suggests that outside the Hainaut coal area, intensity attenuates similarly as indicated by these authors, i.e. a slow intensity attenuation to the north and south, within the borders of the Brabant Massif basement and the Ardenne respectively. As our intensity evaluation is mainly based on the ROB inquiry, IDPs represent a mean intensity in each locality, which hampers sub-sampling below communal dimensions. Hence, the dataset does not allow us to differentiate among intensity variations linked to local differences in thickness and composition of sedimentary near-surface deposits within the Hainaut coal region. The dataset certainly can be used to evidence the role of large-dimensional geological structures in Belgium in intensity attenuation (e.g. Neefs et al., 2021), but this is beyond the scope of this paper.
We now can model the attenuation of intensity in the coal mining area of Hainaut as follows:
with I0 determined from the magnitude (see Eqs. 3 and 5) or I0=Imax for earthquakes with only few IDPs, but with a clearly determined epicentral intensity. For these events, Imax scaled to the magnitude (Eqs. 4 and 5) can be used for intensity modelling. Applying this attenuation formula (Fig. 3) shows that the intensity prediction works well inside the Hainaut coal area. However, the formula is not meant to predict intensities outside the coal area. For example, within the border of the Brabant Massif, the 1967 Carnières event (Fig. 3) is felt farther than the intensity attenuation model predicts and a different attenuation model should be constructed.
6.4 Focal depth determination
Inferring focal depths from macroseismic data provides a robust and alternative method when instrumental data are lacking (Sbarra et al., 2019). Previous authors used intensity data to determine the focal depth of some of the largest earthquakes in Hainaut. Charlier (1949) determined the focal depth of the 3 April 1949 earthquake to be 3.4 km, while Van Gils (1966) provided values of 6.5, 4.3 and 5.0 km respectively for the earthquakes of 15 December 1965, 16 January 1966 at 06:51 and 12:33. Ahorner (1972) estimated the focal depth of the 15 December 1965, 16 January 1966 and 28 March 1967 earthquakes respectively to be 2.4, 1.9 and 3.0 km. Even if these determinations indicate that these earthquakes occurred at shallow depth, the difference by a factor of 2 in the evaluated focal depths between Ahorner (1972) and Van Gils (1966) is difficult to interpret because neither of these authors provide the uncertainty of their determination or explain how they choose the attenuation parameters they used. The approach developed in this study solves these two issues by (i) evaluating attenuation parameters directly from the Hainaut intensity dataset and (ii) providing a way to evaluate uncertainties linked to the attenuation model and the intensity determination in a systematic way for all the events. Our results show that focal depth estimated by Charlier (1949) and Ahorner (1972) are inside our error bars.
The ideal test of the robustness of the macroseismic method to evaluate the focal depth of shallow earthquakes would be to compare focal depths determined by this method with the ones estimated by the classic microseismic method based on seismic phase arrival time measurements. In our dataset, the only earthquake for which focal depth was determined from arrival phase measurements in seismic stations is the 8 November 1983 Liège earthquake. In their comprehensive study of the earthquake, Ahorner and Pelzing (1985) determined the focal depth to be 6±2 km. Faber and Bonjer (1985) interpreted depth phases recorded by the Gräfenberg network in Germany and concluded that a depth of 4 km would fit better the seismograms. If we use the new Hainaut attenuation model, which would be similar in the Liège area, the focal depth of the Liège earthquake is 5.7±1.5 km (see Table 3), which agrees well with instrumental evaluations.
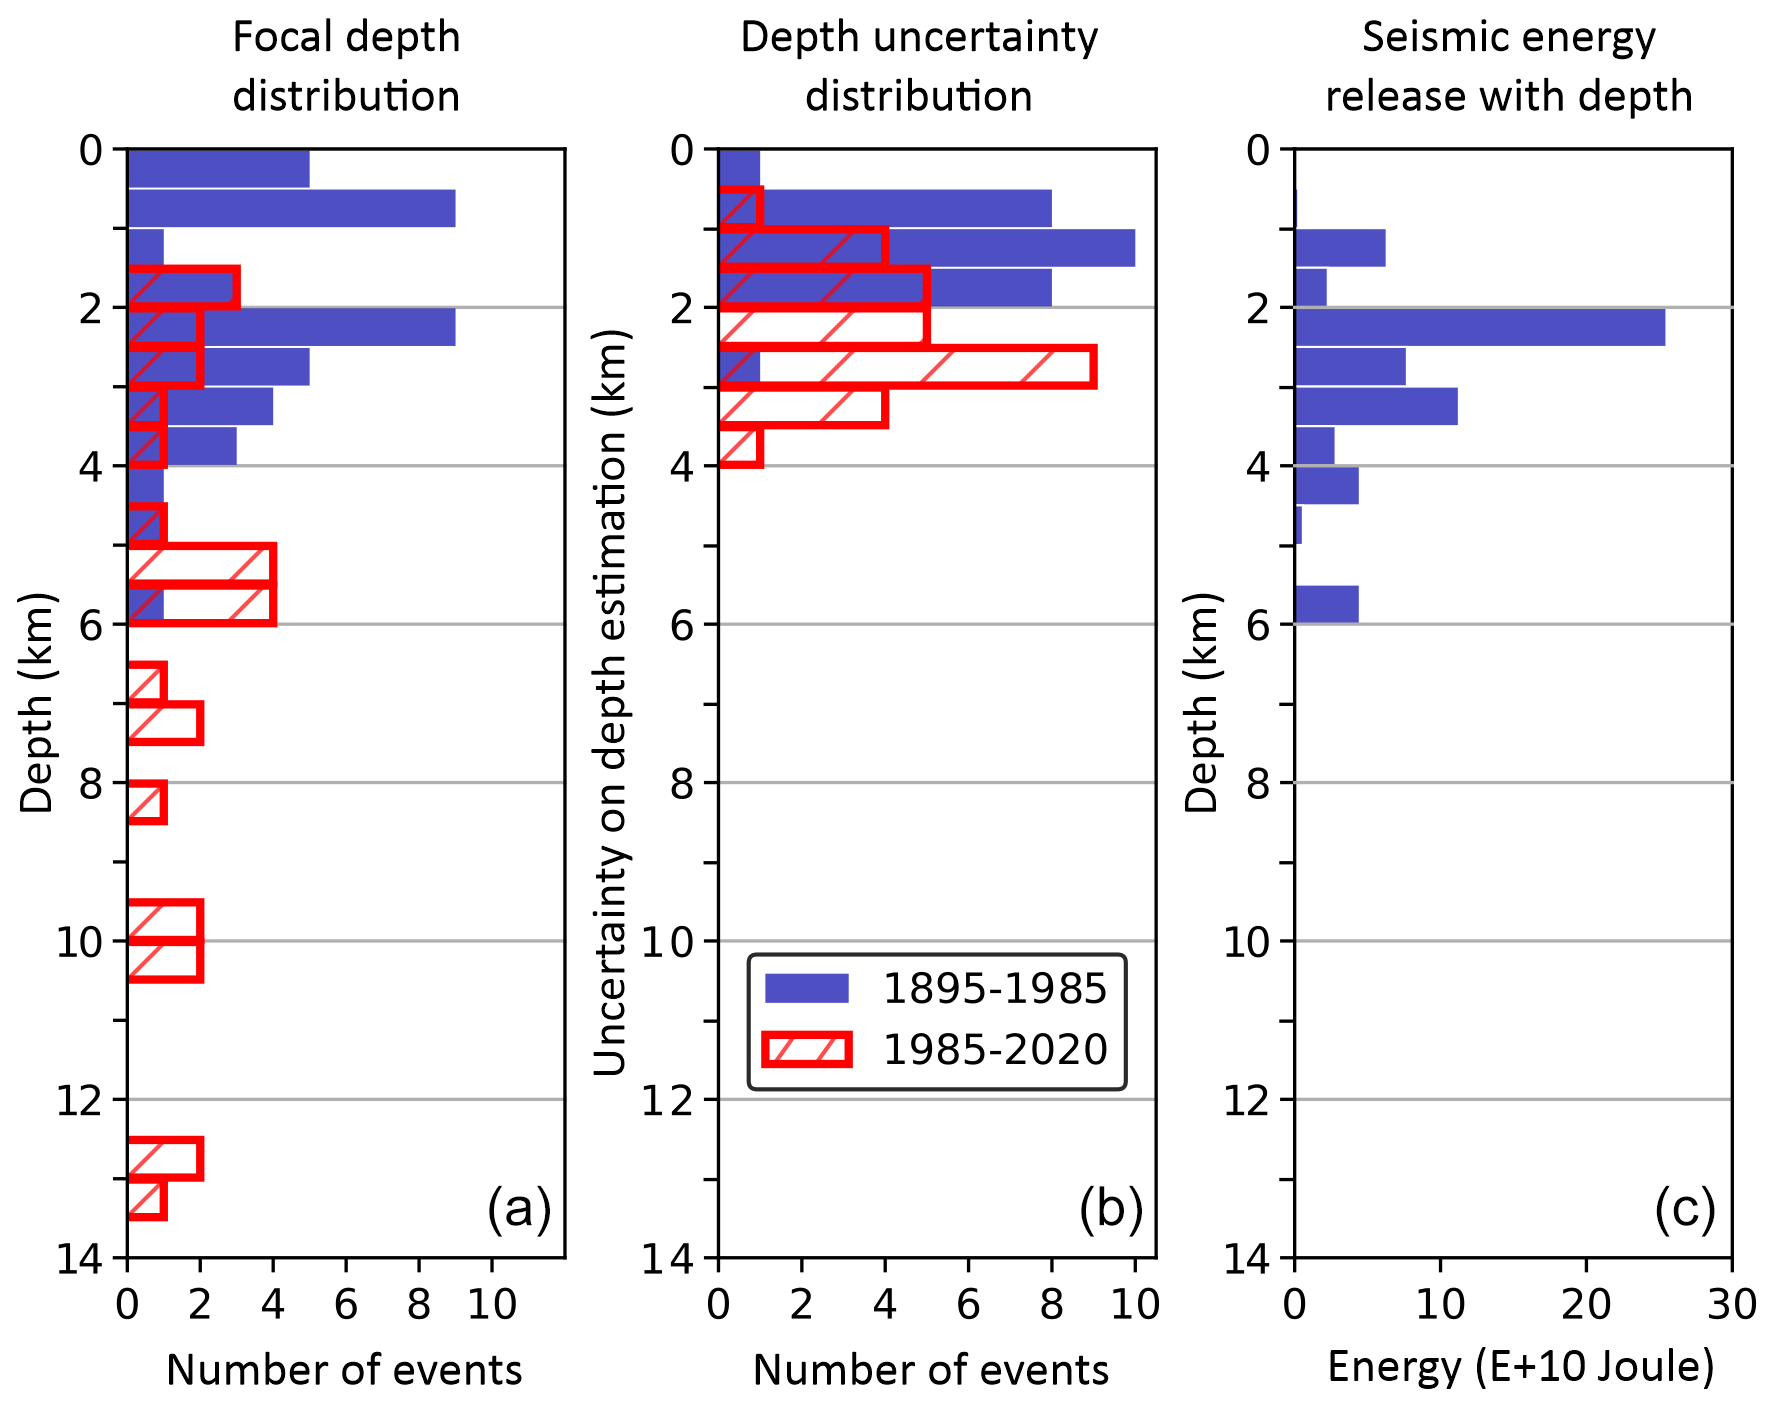
Figure 11(a) Focal depth distribution of earthquakes in Hainaut before and after 1985. For earthquakes before 1985, the estimations come from macroseismic data as explained in Sect. 4, while after 1985, depth comes from microseismic location (source: ROB earthquake catalogue). (b) Distribution of the uncertainties of these focal depth determinations. (c) Seismic energy release with depth.
Since 1985, it has been possible to determine the focal depth of earthquakes occurring in the Hainaut coal area by using phase arrival times of the Belgian seismic network. In Fig. 11, we compare the depth distribution of the earthquakes that occurred before and after this date to analyse and explain their similarities and/or differences. Since 1985, 29 earthquakes have been located within the Hainaut coal area (Fig. 11a) with a depth uncertainty of less than 4 km (Fig. 11b). The largest observed magnitude between 1985 and 2020 is Mw=2.6. Despite a dense seismic network in or near the Hainaut coal area, the focal depth uncertainty still remains significant, with a mean value around 2 km, while our estimate of the uncertainties for earthquakes before 1985 using macroseismic data is less than 2 km (Fig. 11b). The main reason for this difference is that the distance between earthquake epicentres and the closest seismic station is often greater than 10 km, which is not sufficient to determine focal depths of less than 4–5 km with high precision (Gomberg et al., 1990).
The two depth distributions coincide for focal depths between 1.75 and 4 km, with 24 of a total of 41 events before 1985 and 9 of a total of 29 events after 1985. The two distributions also present two main differences: before 1985, many events occurred at very shallow depths of less than 1.75 km (21 of a total of 41 events) versus none after 1985. Moreover, most (20 of 29) of the events after 1985 occurred at depths greater than 4.0 km, up to 13 km, while only three earthquakes before 1985 occurred at more than 4 km but still less than 6 km depth. All the very shallow events at less than 1 km depth occurred before 1960, which precedes the end of the mining activities at the end of the 1970s. These events contributed only little to the seismic energy release in the Hainaut coal area (Fig. 11c) because even if most of them were strongly felt or caused slight damage, they were of small magnitude. This is confirmed by the fact that they were not recorded by the seismic station in Uccle (at 35 km for the most northern Hainaut event). Their location inside the coal mining area, their period of occurrence, their very shallow depth and their weak radiated seismic energy could be indicators of a very close link to mining activities.
The seismic activity between 2 and 4 km depth, which is below the deepest mining excavations, at a little more than 1 km, cannot be directly associated with mining. Nevertheless, the seismic activity strongly diminished after the progressive closure of the mining industry during the 1970s, after the high level of activity observed between 1965 and 1970. This led to the hypothesis that this part of the Hainaut seismicity could be triggered by mining activity. However, the origin of this seismicity should be interpreted in the light of recent studies on earthquake activity in stable continental regions, suggesting that it can be explained by transient disturbances of the local crustal stress or changes in fault strength (Camelbeeck et al., 2013; Calais et al., 2016).
Similar questions also arise for seismic activity deeper than 5 km that has only been observed since 1985. However, the small magnitude of these events could explain that similar earthquakes may have occurred before 1985 but were not detected because they were not felt, nor recorded by any seismic station. These earthquakes could reflect a background of natural seismicity, but also a seismicity indirectly triggered by the past mining industry. These issues will need to be studied using more quantitative data on stress modifications caused by mining exploitation in the upper crust, time and spatial evolution of the observed seismicity, earthquake fault-plane solutions and better interpretation of the surrounding seismotectonic context.
Our study provides a comprehensive overview of the earthquake activity in the Hainaut coal area and discusses its impact from the end of the 19th century up to 1985, when the implementation of a modern digital seismic network began in Belgium. We updated the ROB earthquake catalogue for magnitude, depth and maximal observed intensity. We also present a digital archive describing the effects of these earthquakes. We re-evaluated the local intensities of well-documented earthquakes from these records. They are all included in the Supplement attached to this paper. Our earthquake analysis and impact estimation underline the severity of the damage locally caused by the strongest earthquakes in Hainaut. For earthquakes in the Mw magnitude range between 3.5 and 4.0, maximal observed intensity reaches VI or VII on the EMS-98 macroseismic scale.
Our analysis suggests that the contribution of the Hainaut coal area seismicity on current seismic hazard maps in Belgium and northern France (Fig. 1) is overestimated and needs re-evaluation, on the one hand because the magnitude of the largest events have been downsized in our new catalogue and, on the other hand, because the seismic energy is rapidly absorbed within the fractured Hainaut coal basin due to the strong attenuation. This conclusion provides new perspectives on seismic hazard issues in Hainaut. First, it demonstrates the importance of using more appropriate GMPEs for the Hainaut area that are in line with the observed rapid intensity decay with distance than the currently used GMPEs. The presented intensity dataset will help to identify the most appropriate GMPE. Second, the potential causality between the coal mining extraction that ended in the 1970s and the Hainaut seismicity can now be studied using the new reliable focal depths estimated from the IDP distributions. Finally, the damaging character and the fast intensity attenuation of shallow Hainaut events should be included in the impact and ground motion modelling of potential induced seismicity related to current and future deep geothermal projects in the area.
A1 Background to evaluate intensity
An optimal dataset to evaluate intensity would be one describing the way many people in each locality felt an earthquake inside its perceptibility area and furnishing the specific degree of damage for each building hit by the event. This can be obtained when a specific inquiry is dedicated to collect such a large amount of information. This level of quality has been obtained by the online ROB DYFI inquiry since 2002 (Camelbeeck et al., 2003; Lecocq et al., 2009), but up to now, it has concerned earthquakes where mean maximal intensity did not reach intensity V in any locality. For intensities equal to or larger than V, such an extensive dataset only exists for the destructive 8 November 1983 Mw=4.6 Liège earthquake in east Belgium, but this is an exceptional case in NW Europe. This precise damage information came from the owners of 17 000 buildings that sent detailed damage reports of their property, which was evaluated by the Belgian Federal Calamity Centre in order to reimburse the repair costs. These data were at the base of seismic risk studies on the Liège area (Jongmans and Plumier, 2000; Garcia Moreno and Camelbeeck, 2013; Camelbeeck et al., 2014).
The ROB survey and some of the scientific studies described in Sect. 3.1 are not so detailed, but they furnish information used to evaluate intensity at the scale of each locality and have the advantage of sampling the complete macroseismic field of the studied earthquakes. Information in the press does not sample the whole area of perceptibility and is often concentrated on the most visible effects of the earthquakes. We determine intensity in the following way: when the answers to the questions in the ROB questionnaire and/or information from other sources fulfil and exceed the EMS-98 description of the earthquake effects at a given intensity degree I, but are not compatible to the description corresponding to a higher intensity value I+1, the intensity is fixed to the single integer value I. When the observations do not allow for differentiating between two intensity values, a range of corresponding intensity values is given. Information coming from some localities for earthquakes that were not the object of an official survey is sometimes insufficient for assessing intensity although the seismic event was reported as felt. We indicated these places with an “F” on the macroseismic maps. When the answers to the ROB official survey in one locality were all negative (see inquiry books in the Supplement), we considered the earthquake as not felt there, but we do not report this information on the macroseismic maps as the consulted sources are insufficient to establish the limit of perceptibility.
A2 Building vulnerability
For intensity greater or equal to V, a significant part of our evaluations comes from damage observations. To assess intensity, it is necessary to know the building stock and vulnerability class distribution in the studied area from the beginning of the 20th century to around 1970. With the exception of Barszez (2005), who studied the seismic vulnerability of historical houses in the centre of Mons, there is no study analysing the seismic resistance of buildings in the Hainaut coal area. Fortunately, the building stock is relatively similar to the one in the Liège region, which was well studied after the 1983 Liège earthquake (Garcia Moreno and Camelbeeck, 2013; Phillips, 1985; Plumier, 1985, 2007). The main reason for this resemblance is that the two regions experienced a similar rapid population expansion due to strong industrial development that accompanied the extensive exploitation of coal and development of a significant steel industry. Unreinforced masonry houses formed an important part of the building stock, which was common in this part of Europe during the 20th century. This type of building is associated with vulnerability class B on the EMS-98 scale, but it can range between class A for the most vulnerable and class C for the least vulnerable buildings according to the quality of their foundation, construction and maintenance. During the 1983 Liège earthquake, part of these masonry buildings showed deficiencies which were at the origin of serious structural damage. The most affected structures were unreinforced low-rise masonry dwellings for which the links of the floors and the load-bearing walls were weak or even missing. Many of those buildings shared walls with neighbouring houses (Phillips, 1985; Plumier, 1985, 2007). The importance of the damage to these buildings compared to the better behaviour of well-constructed brick buildings clearly suggest that they belong to class A in the EMS-98 classification. In the Hainaut coal area, the same type of buildings are represented in many suburban dwellings, where families of workers in the mining and iron and steel industries were living. However, many buildings also suffered from damage directly associated with mining activities including the underground progression of coal exploitation and the progressive settling that follows (see discussion). Increased humidity due to surfacing groundwater and pre-existing structural weaknesses associated with mining activities increased the vulnerability of buildings. These aggravating circumstances suggest that a significant part, which is unfortunately undetermined, of the building stock are to be classified as class A vulnerability as defined on the EMS-98 macroseismic scale.
A3 Intensity from damage
In the ROB questionnaire, questions concerning damage to buildings allow us to fix the intensity equal to or greater than V (see inquiry books). The observation of small fragments of plaster that fell from ceilings and of broken or cracked windows appear at intensity V. EMS-98 considers brick chimney behaviour as representative of the damage grade for masonry buildings because it is the most visible manifestation of seismic action during moderate earthquakes. Indeed, fireplaces are slender objects, not very resistant to bending, especially since the corrosion of the mortar transforms them into a pile of bricks, stacked without much connection (Plumier, 1985). Their partial collapse is an indicator of damage grade 2 (moderate), while fractures at roof junctions correspond to grade 3 (substation to heavy damage). The last question in the form asks the local authorities about the number of damaged and overturned chimneys, which theoretically allows the seismologist to evaluate the percentage of grades 2 and 3 damage in the locality. Considering that the most significant damage occurred at the most vulnerable parts of the masonry buildings, the quantity of fallen/damaged chimneys provides a way to either confirm intensity V (very few damaged chimneys) or help differentiating between intensity VI and VII if respectively few or many chimneys were overturned. The EMS-98 scale defines the limit between the quantities “few” and “many” as being between 10 % and 20 % of the number of considered buildings in a specific vulnerability class. Then, the percentage of buildings of vulnerability class A in a locality is an important factor in the intensity evaluation process. Unfortunately, this information is lacking, and we are forced to make simplistic assumptions about it. Here, we considered that half of the buildings are in class A and that only these most vulnerable structures suffered the highest observed damage grade. This means that the observation of 5 % or more of overturned chimneys in a locality would correspond to 10 % or more of grade 3 damage to vulnerability class A buildings, which corresponds to intensity VII. Of course, grade 2 damage should also be observed in many buildings of class B and class A. We considered that simultaneous observation of 5 % grade 3 and 5 % grade 2 damage to be associated with intensity VII. When both of these percentages of damage are smaller than 5 %, we assign intensity VI if they are more than 1 % and V if they are less. The official survey also asks for the observation of large and extensive cracks in walls. A positive answer to this question indicates damage grade 3, but as the question does not ask for any quantification, it is not possible to fix the intensity to VI or VII based on this information.
At intensity VII, reports should mention serious failure of walls and partial structural failure of roofs and floors, corresponding to grade 4 damage, in a few buildings of class A. Unfortunately, the ROB questionnaire does not allow us to identify the importance of cracks in walls and building structural damage. Assessing this kind of damage would require specific building inspections by a specialised engineer. Nevertheless, press articles provided local observations that we interpreted as grade 4 damage and can be used to confirm the estimated intensity of VII in some localities.
In this appendix, we chronologically present information on the earthquakes that were widely felt or caused damage in the Hainaut coal area (reported in Table 1).
B1 The March–June 1911 Ransart–Gosselies seismic sequence
The first known earthquake that caused damage in the Hainaut coal area occurred at 00:05 on 29 March 1911 north of the city of Charleroi. A violent tremor accompanied by a tremendous noise awakened the population of the communes of Ransart, Gosselies, Heppignies and Wayaux. It shook houses for a few seconds, enough to knock over furniture, break dishes, open unlocked doors and frighten people. However, because the earthquake occurred at night, there were no testimonies for the newspapers to report from which intensities II to IV could be evaluated. Hence, newspapers only reported information for a radius of 3 to 4 km, where people were woken by earthquake effects. In Ransart, many cracks in houses were reported and the school chimney was knocked over. The magnitude of this seismic event is estimated to be Mw=3.5 from the seismic recordings at the Uccle seismic station located nearly 40 km north of the assumed epicentre. After this earthquake, a light tremor occurred on 12 April 1911 (Fig. S1) in the region of Mons and Cuesmes on the other side of the coal mining area.
Two months later, the Earth shook again north of Charleroi, but more strongly with a Mw=3.9 event on 1 June at 22:51 (Figs. B1 and S2) and a Mw=4.0 event on 3 June at 14:35 (Fig. S3). The epicentral area of the 1 June 1911 earthquake includes the localities of Gosselies, Lambusart and Ransart, where the shaking was violent enough to awaken most of the inhabitants, knocking down many chimneys and causing cracks in the least resistant buildings (Cambier, 1911). According to the newspapers Le courrier de l'Escaut – 4 June 1911 and La Meuse – 3 June 1911 the most affected locality was Ransart, where approximately 50 chimneys collapsed and a parked mine train was derailed from the tracks. A wire-drawing factory collapsed in Gosselies, killing one person and injuring three others. We assessed intensity as being VI in Ransart, Gosselies and Lambusart. In the neighbouring localities of Roux and Courcelles, visible damage was limited to a few smokestacks that were knocked down (intensity V–VI).
Curiously, Cambier (1911) did not provide any information on the 3 June 1911 earthquake, which was more damaging than the 1 June 1911 earthquake, as reported by the newspapers. In Gosselies, there were entire streets where almost all the chimneys were knocked over, damaging roofs and skylights. In houses, objects hanging from the walls were thrown to the ground (Journal de Bruxelles – 5 June 1911). La Gazette de Charleroi – 4 June 1911 mentions that many cracks in the walls of houses were found and that windows broke, and the damage was more concentrated near the Gosselies railway station. The importance of the damage led us to estimate the intensity as being VII in Gosselies. Newspapers also describe damage in Ransart, but they are less significant than during the 1 June 1911 earthquake. The damage repartition clearly suggests that the earthquake of 3 June was located in Gosselies, 2–3 km to the north-west of the epicentre of the 1 June seismic event in Ransart.

Figure B1Macroseismic map of the 1 June 1911 Mw=3.9 (ML=4.2) Ransart earthquake (no. 2 in Table 1). Maximal intensity = VI. Geology in the background based upon http://www.onegeology.org/. Reproduced with the permission of © OneGeology. All rights reserved. The inset shows the population density.
B2 The 17 January 1920 earthquake in Borinage
This Mw=3.5 earthquake (Fig. S4) recorded by the seismic station of Uccle occurred at 03:11. The newspapers reported that falling chimneys tore off roof tiles in Boussu and Hornu. In the miners' houses, objects collided with each other, were moved or were knocked over. Capiau (1920) published a brief notice of his observations on the earthquake effects. Maximum intensity is set to VI based on these newspaper reports.
B3 The 9 May 1931 earthquake east of La Louvière
This Mw=3.0 event was smaller than the previous ones. In the epicentral area, many residents rushed outside, while in some neighbourhoods the doors of the houses opened. A chimney collapsed in Houdeng-Aimeries (Fig. S5).
B4 The 5 November 1936 Trazegnies–Chapelle earthquake
This Mw=3.3 earthquake (Fig. S6) did not cause any damage but many inhabitants of the communes of Trazegnies, Piéton, Gouy-Lez-Piéton, Godarville and Chapelle were awakened by the shaking. The main observations are that windows vibrated while small objects were knocked over from shelves and fireplaces (L'Indépendance Belge – 7 November 1936).
B5 The 7 and 9 January 1940 earthquakes east of La Louvière
Three small events recorded by the Uccle seismic station occurred in January 1940 near La Louvière (Figs. S7, S8, S9). The first of Mw=3.5 on 7 January at 16:28 was best recorded in Uccle and was the most violent of the sequence. In La Louvière, furniture was moved while vases placed on the marble above fireplaces, as well as doors and windows, shook. The newspaper La Gazette de Charleroi shows a photo of a damaged fireplace in Saint-Vaast, indicating that slight damage was observed. The two earthquakes that followed were more weakly felt. The 9 January 1940 earthquake (Mw=3.1), which occurred early in the morning, woke up a few people but was locally felt by workers in the coal mines near La Louvière (Fig. S9).
B6 The 3 and 14 April 1949 Havré–Boussoit earthquakes
One of the strongest earthquakes in the Hainaut coal area occurred on 3 April 1949 at 12:33 in the region of Havré, 8 km to the east of Mons. This Mw=4.1 earthquake was preceded at 12:27 by a Mw=3.7 event, which was also strongly felt. The ROB conducted a detailed survey about the damage and effects caused by the 12:33 earthquake (Charlier, 1951). This earthquake is the first one for which the ROB organised an official survey of a large part of the Belgian territory. The macroseismic map based on our reassessment of intensities on the EMS-98 macroseismic scale are reported in Figs. 4 and S10. The most affected localities are Boussoit, Havré and Maurage, where we estimate intensity as being VII. In Havré, panic broke out after the 12:33 tremor, which was so violent that more than 80 % of the chimneys of 1400 dwellings were disrupted, of which 50 % needed to be completely rebuilt and 150 were completely overturned. In Boussoit, at least 70 % of the chimneys were damaged or collapsed, while in Maurage about 200 and 25 chimneys were respectively damaged and overturned. In Maurage, the vault of the church choir was damaged by a crack while in Trivières, a slag heap collapsed, endangering the neighbouring dwellings. The earthquake was followed by a number of aftershocks that were felt in the epicentral area. Only few of them were recorded at the Uccle seismic station and/or reported in newspapers with sufficient precision to be classified in a list. Eleven days after the mainshock, on 14 April 1949 at 01:09 (Fig. S11) and 05:12 (Fig. S12), the Earth shook again in Havré with magnitudes of Mw=3.5 and Mw=3.6. The macroseismic data coverage for these events is poor, but still a maximum intensity of respectively V and VI was reported.
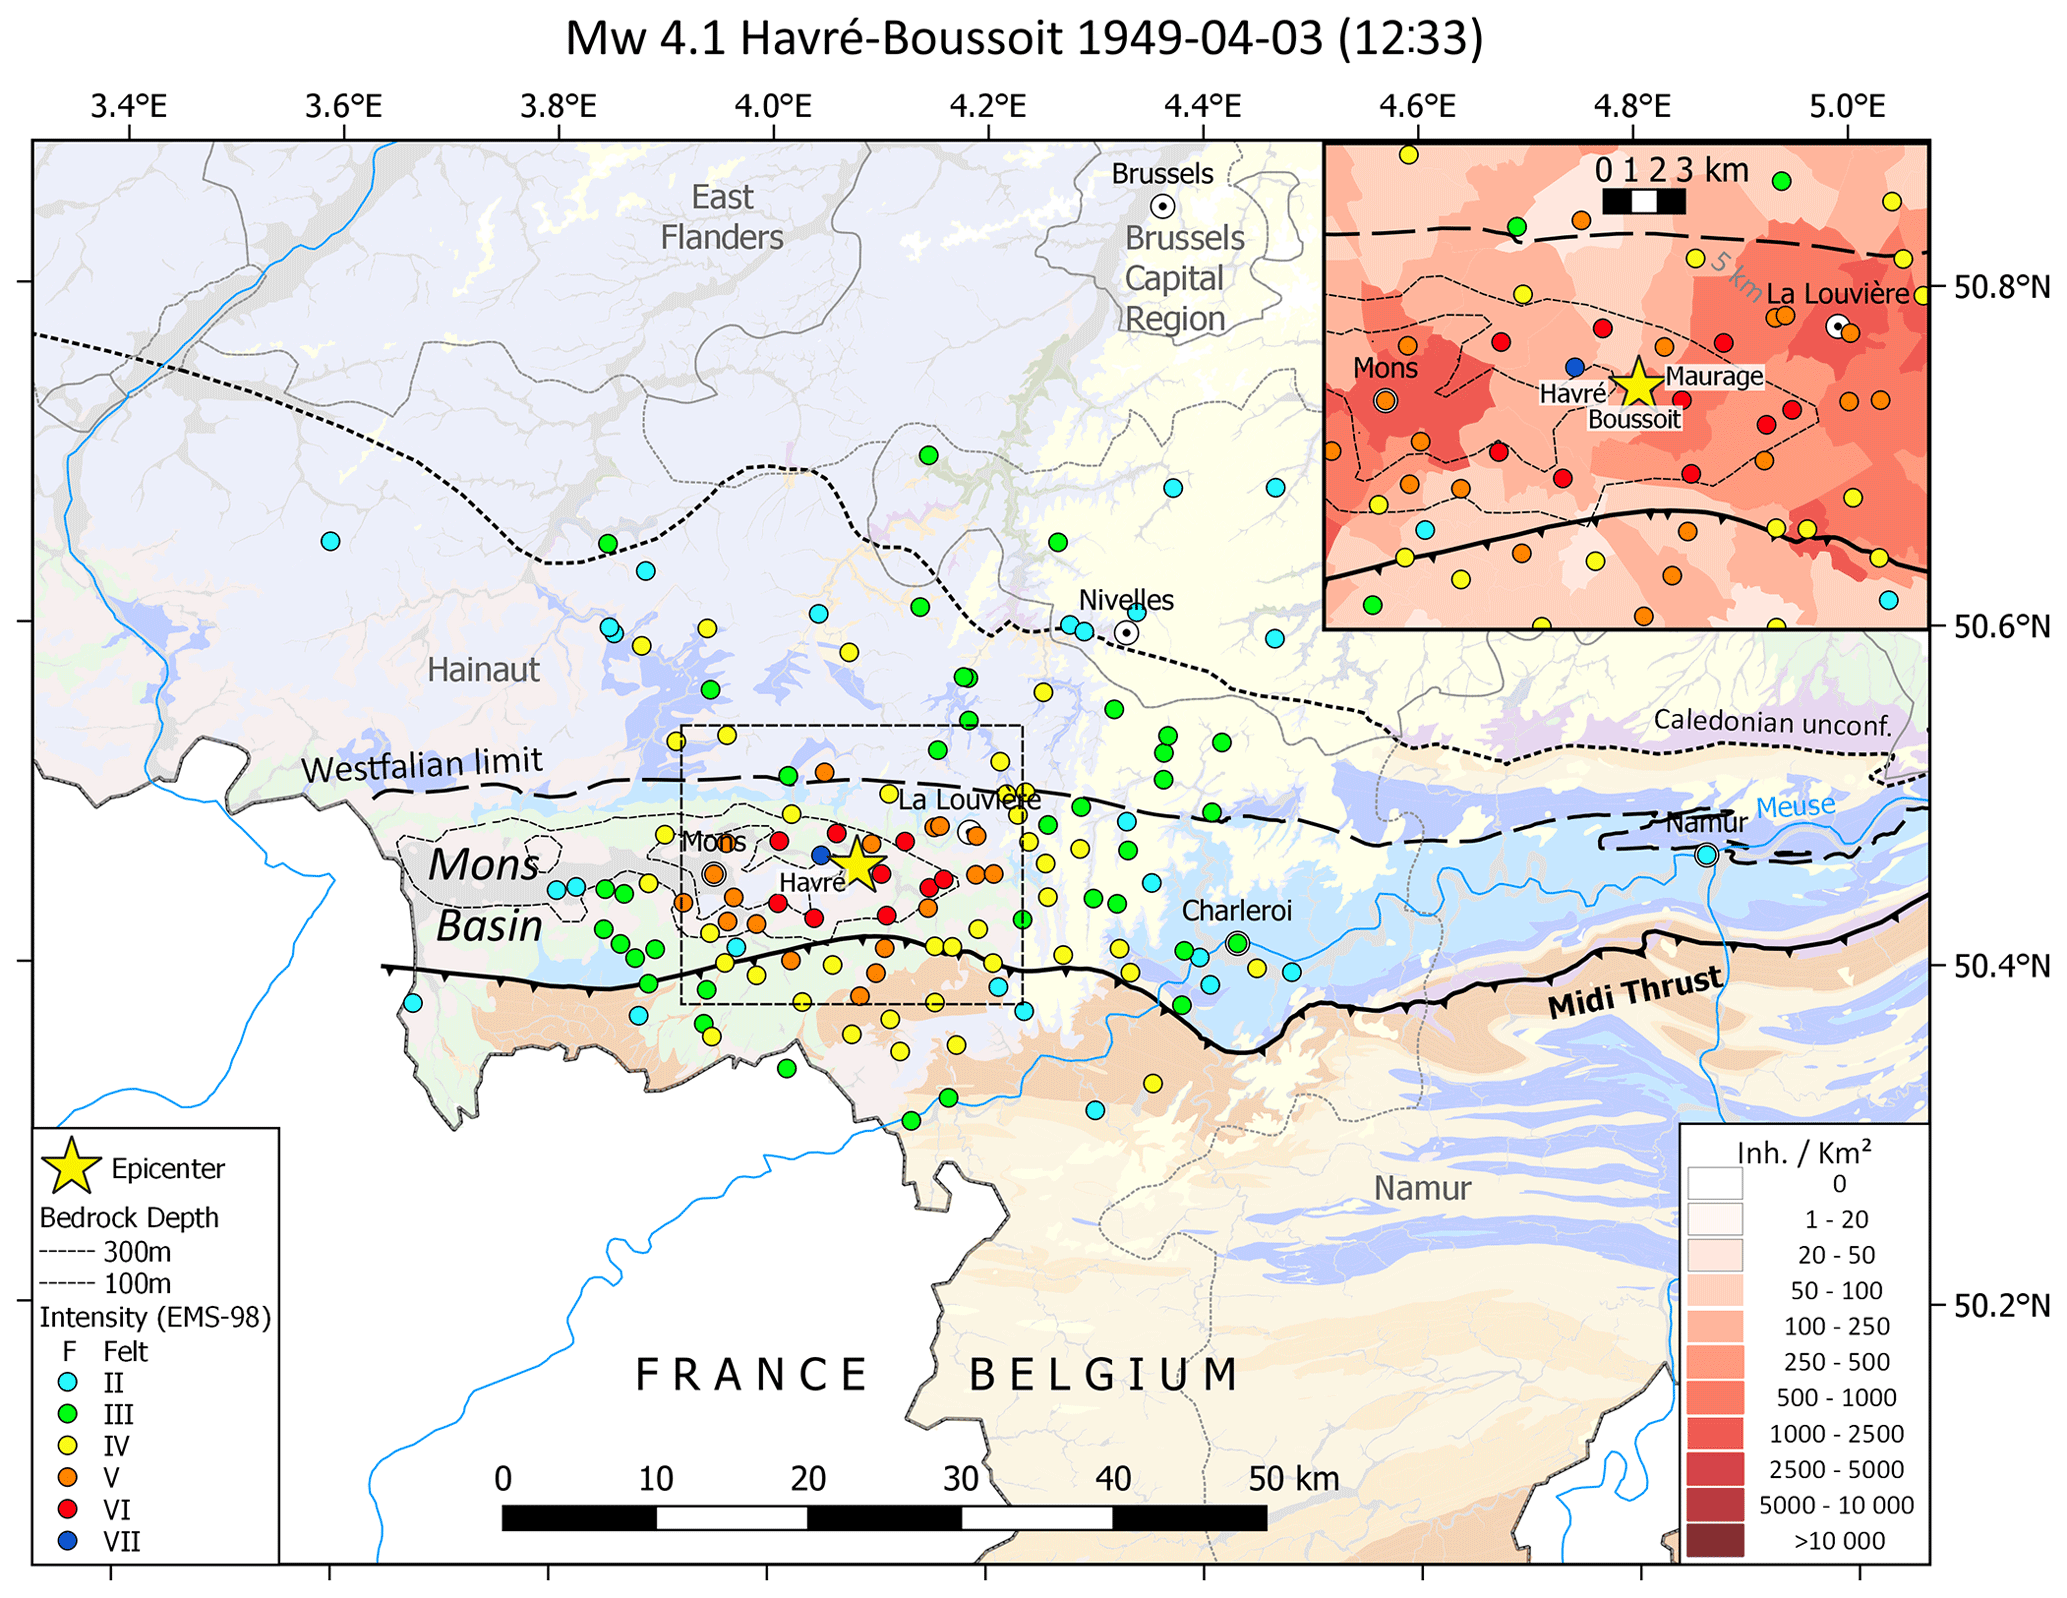
Figure B2Macroseismic map of the 3 April 1949 Mw=4.1 (ML=4.6) earthquake in Borinage (no. 10 in Table 1). Maximal intensity = VII. Geology in the background based upon http://www.onegeology.org/. Reproduced with the permission of © OneGeology. All rights reserved. The inset shows the population density.
B7 The October 1952 earthquake sequence in Borinage
In October 1952, three earthquakes shook the Borinage area west of Mons. The first two occurred on 21 and 22 October (Mw=3.1 and Mw=2.8; Figs. S13 and S14), respectively at 21:15 and around 07:00, and were moderately felt by the people. The third earthquake, on 27 October 1952 at 06:11 (Mw=3.5; Fig. S15), was stronger and caused uproar among a part of the population, who rushed out of their dwellings in the localities of Cuesmes, Flénu, Hornu, Jemappes, Quaregnon and Wasmes. The damage was limited to pieces of plaster falling from ceilings, falling bricks and falling pieces of chimneys in poor condition (intensity V).
B8 The 10 July 1954 earthquake in Borinage
On 10 July 1954 at 17:18, another earthquake (Mw=3.5; Figs. B3 and S16) shook the same area as the 1952 events, with consequences relatively similar to those observed during the 27 October 1952 event. The local authorities paid much attention to properly filling the ROB official survey and indicated precise numbers regarding the damage to chimneys, indicating slightly greater damage. We estimated intensity as being V–VI in the localities of Quaregnon and Ghlin, where the earthquake damaged 25 and 7 chimneys respectively.
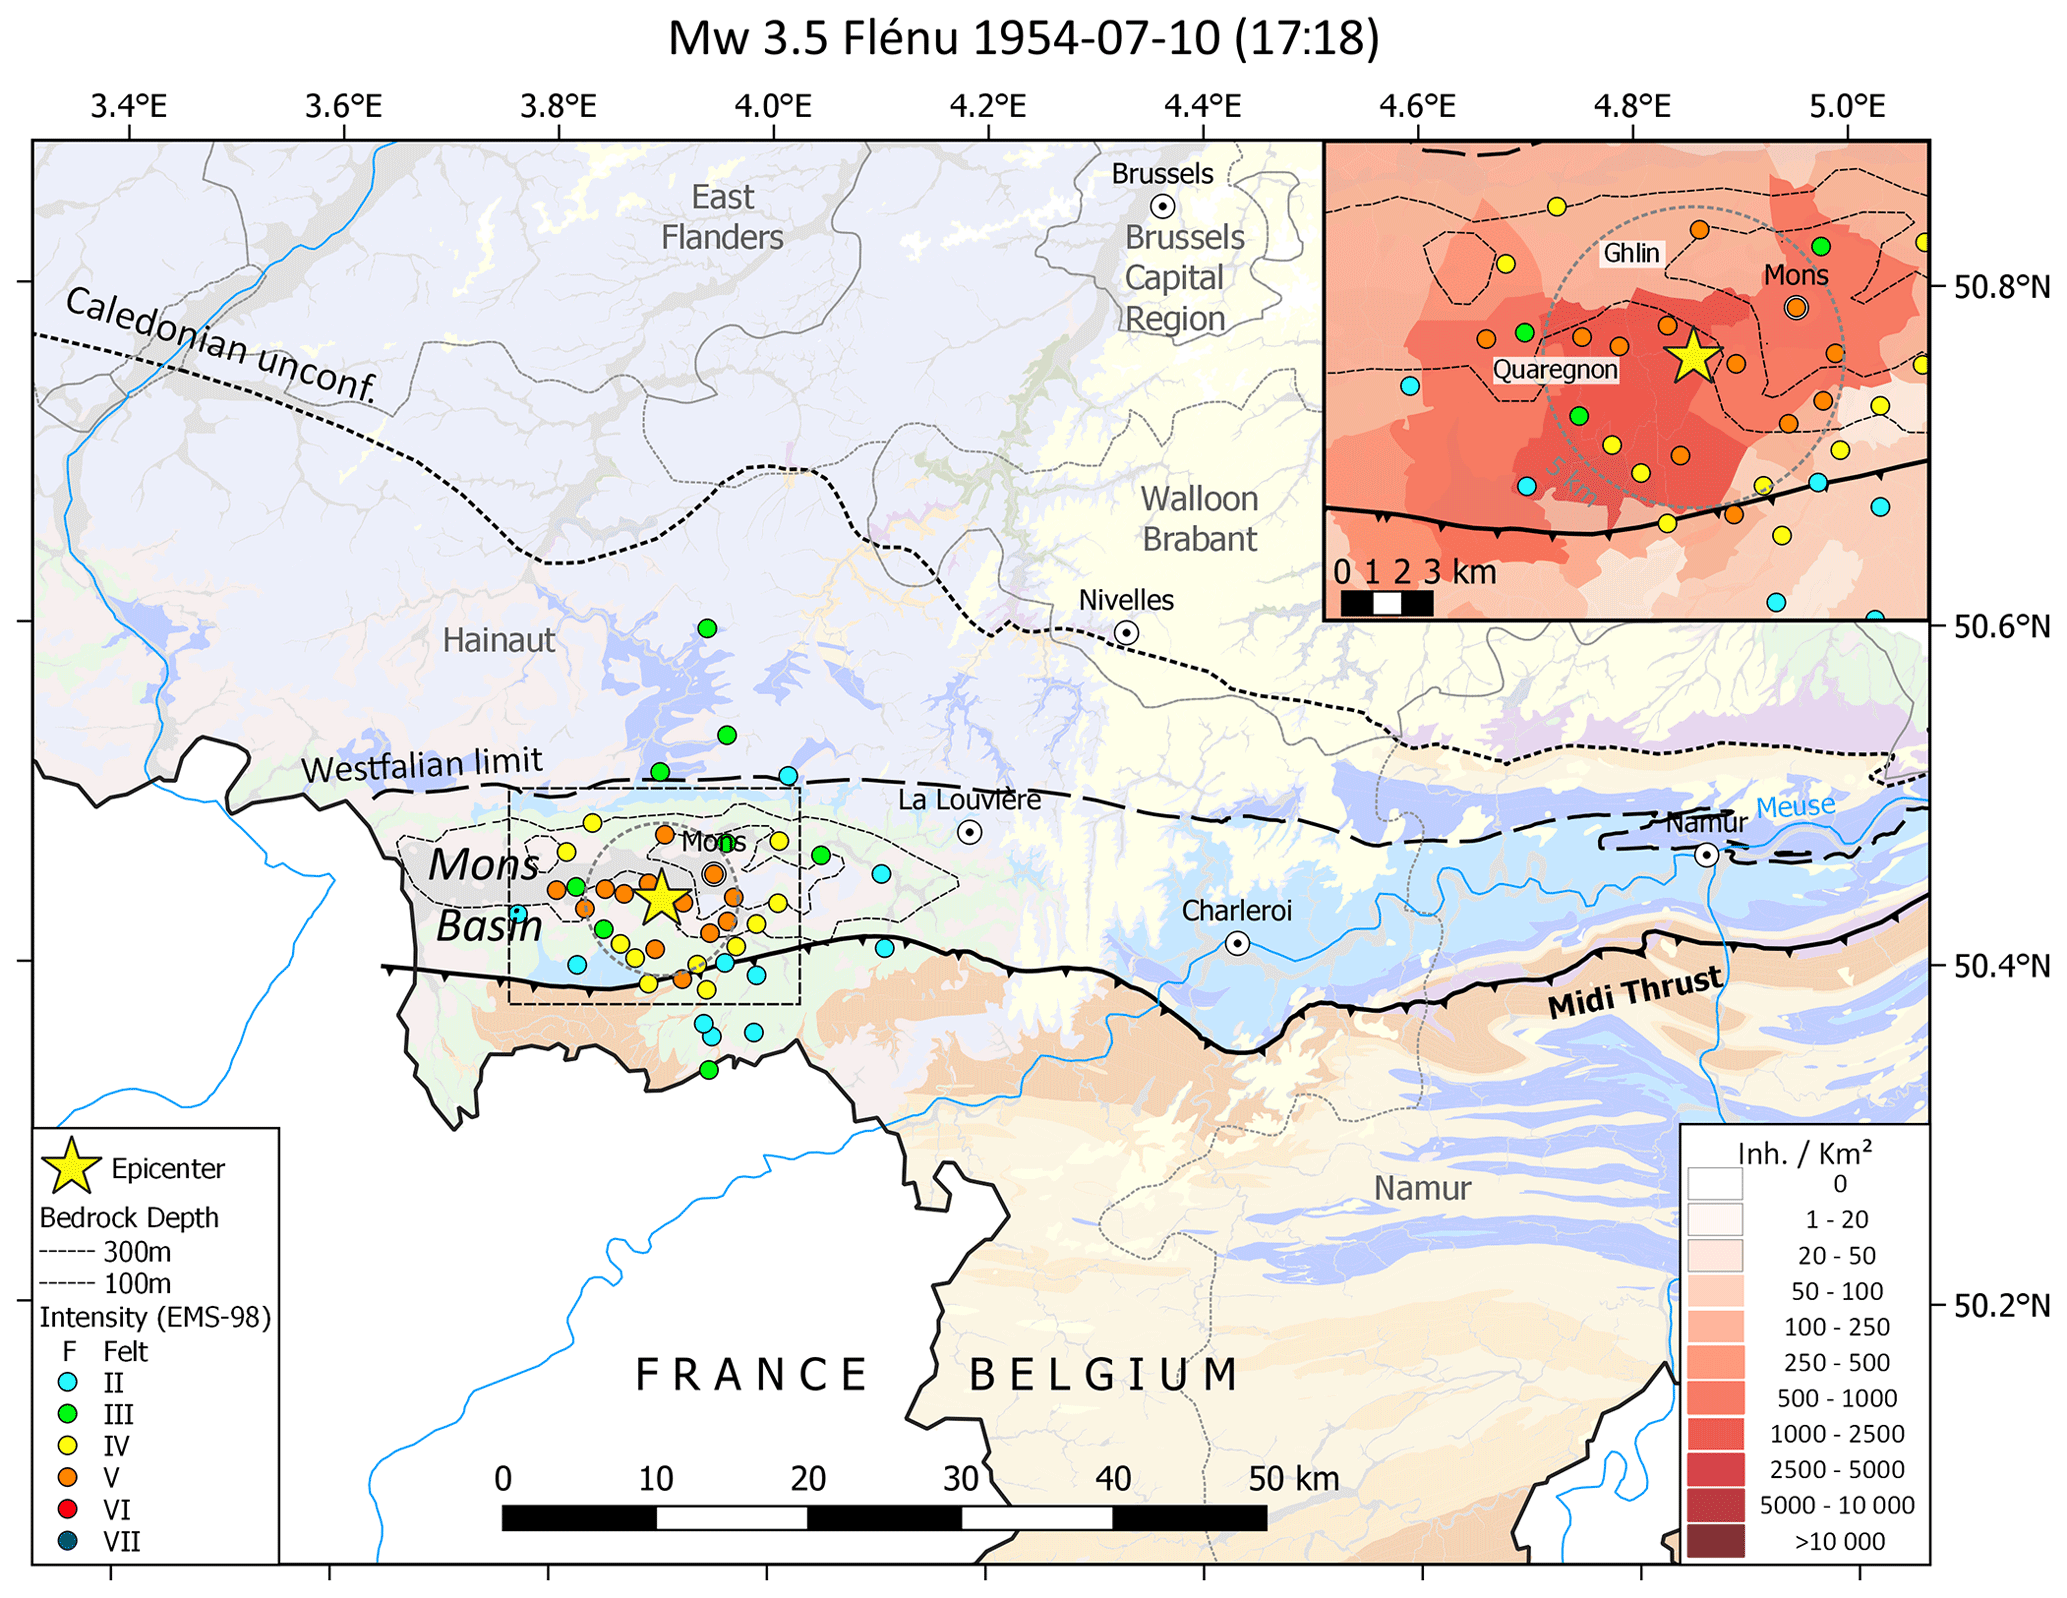
Figure B3Macroseismic map of the 1954 Mw=3.5 earthquake in Borinage (no. 16 in Table 1). Maximal intensity = V. Geology in the background based upon http://www.onegeology.org/. Reproduced with the permission of © OneGeology. All rights reserved. The inset shows the population density.
B9 The 15 December 1965 earthquake near Strépy-Bracquegnies
On 15 December 1965 at 12:07, a violent Mw=4.0 earthquake (Figs. B4 and S17) that lasted several seconds shook the region west of La Louvière and caused considerable commotion throughout the region (L'Indépendance (Edition du Centre) – 16 December 1965). There was quite some damage, especially to chimneys and roofs, but also to verandas damaged by falling chimneys. A few casualties occurred as people were hit by pieces of glass from shattered windows or skylights. The damage was the most significant in Strépy-Bracquegnies. In this locality, there were overturned chimneys on practically every street, cracks in several buildings and many broken windows. Fallen stones and bricks damaged several cars. The ROB official questionnaire mentions 230 damaged and 122 overturned chimneys, which corresponds to 10 % of the dwellings in the locality. The reported percentage is similar for the neighbouring commune of Bray. For these two localities, we assessed intensity as being VII in EMS-98. We evaluated intensity as being VI in Maurage and Trivières, where the earthquake caused deep cracks in bricks and concrete walls in some houses, and damaged or overturned the chimneys of 2 % and 3 % respectively of the total number of residential buildings. In Trivières, vials fell off the shelves in a pharmacy, while someone had to hold the bottles of wine that were falling from the shelves in a store. Minor damage was observed in the surrounding localities of Binche, Boussoit, Estinnes-au-Mont, Haine-Saint-Paul, Haine-Saint-Pierre, Houdeng-Aimeries, Houdeng-Goegnies, La Louvière, Leval-Trahegnies, Le Rœulx, Mont-sainte-Aldegonde, Morlanwelz-Mariemont, Péronnes-lez-Binche, Ressaix, Thieu, Vellereille-les-Brayeux, Villers-Saint-Ghislain and Waudrez.
Miners working in the region's collieries also noticed the earthquake. This was the case at the Quesnoy collieries in Trivières and at floors 872 and 1025 of the St-Marguerite coal mine in Péronnes-lez-Binche (see inset in Fig. S17). The farthest locations from the epicentre where the ROB found mentions of the earthquake were Wauthier-Braine (29 km) to the north, Viesville (21 km) to the east, Forge-Philippe (55 km) to the south and Grandmetz (40 km) to the north-west. Remarkably, even authorities from the city of Ghent replied to the survey (73 km). The earthquake was followed the same day by three felt aftershocks.
B10 The 16 January 1966 earthquakes in the La Louvière-Centre basin
One month after the earthquakes in Strépy-Bracquegnies, the Earth shook the region a few kilometres farther to the east. On 16 January 1966, two earthquakes occurred in the morning, the first one with Mw=2.9 at 00:13 UTC (01:13 LT; Fig. S18) and the second one of Mw=3.5 at 06:51 UTC (07:51 LT; Fig. S19) near Morlanwelz-Mariemont. The first seismic event woke up part of the population in La Louvière and nearby localities. The second earthquake was stronger and caused damage to a few chimneys and falling plaster inside a few houses in the locality of Haine-Saint-Pierre (intensity V), while it was largely felt in the localities of La Louvière, Chapelle-lez-Herlaimont, La Hestre, Jolimont, Haine-Saint-Paul and Manage.
These two events preceded a Mw=4.0 earthquake (Fig. S20), which occurred at 12:32 and caused a great deal of emotion and, in some places, even panic among the population. Indeed, in addition to minor incidents, such as falling frames, untimely clattering of glasses, vases and broken dishes, there were other, more serious accidents. In Chapelle-lez-Herlaimont, Carnières and Morlanwelz, the material damage was quite considerable, although not very spectacular but, fortunately, there were no injuries. Throughout the affected region, the tremor also caused a power failure and electricity was only restored after 10 m to 1 h (Le Rappel – 17 January 1966). The official ROB inquiry indicates that the shock damaged or overturned approximately 400 chimneys in Carnières, which corresponds to 14 % of their total number in the locality. In Morlanwelz-Mariemont this percentage is smaller, around 7 %–8 %. We assessed intensity as being VII in these two localities. In Chapelle-lez-Herlaimont and Bellecourt, we evaluated intensity as being VI based on the percentage of damaged and overturned chimneys, which is nearly 3 %. Minor damage was reported in La Louvière, Haine-Saint-Pierre, La Hestre, Fayt-Lez-Manage, Manage, Piéton, Souvret and Trazegnies (intensity V).
The earthquake was felt farther to the north (up to 52 km), than to the south (up to 17 km). The northwards shift of the intensity II barycentre with respect to the epicentre shows that this event was felt farther within the borders of the Brabant Massif than in the coal mining area east and west or in the Ardenne to the south.

Figure B4Macroseismic map of the 1965 Mw=4.0 (ML=4.4) Strépy-Bracquegnies earthquake (no. 17 in Table 1). Maximal intensity = VII. Geology in the background based upon http://www.onegeology.org/. Reproduced with the permission of © OneGeology. All rights reserved. The inset shows localities where damage was reported in press reports with population density as background.
B11 The 28 March 1967 15:49 earthquake in the Centre-La Louvière basin
This Mw=4.1 earthquake (Figs. 3 and S21) is the strongest earthquake that occurred in the Hainaut coal area, with a similar magnitude to the 1949 Havré earthquake. The shaking was of particular violence in the region between La Louvière and Charleroi. The paper La Nouvelle gazette of 29 March 1967 reports: “the earthquake lasted about ten seconds, which was very frightening for a large part of the population of this region; the ground was in fact tilting underfoot and inside the buildings it seemed that the walls would not be able to resist the telluric movement. In some places, the power was cut off abruptly. Frightened, some inhabitants rushed out of their homes, while others sought refuge in their cellars”.
The most affected localities were Carnières, Morlanwelz-Mariemont and Trazegnies, where the percentage of damaged or completely destroyed chimneys ranged from 8 % to 10 % (intensity VII). Inside many houses, ceilings and walls were also cracked. Fortunately, there were no injuries. However, emotion was very strong everywhere. In Fontaine-l'Evêque, Piéton, Chapelle-lez-Herlaimont, La Hestre and Godarville, where damage was less, we evaluated intensity as being VI.
The farthest locations from the epicentre where we retrieve mentions of the earthquake are Forest (39 km) to the north, Bonneville (54 km) to the east, Gozée (15 km) to the south and Ville-sur-Haine (16 km) to the west. The barycentres of intensities IV, III and II are shifted northwards, showing the low attenuation properties of the Brabant Massif (Fig. 3). The earthquake was followed by many aftershocks recorded at the seismic station of Dourbes (Camelbeeck, 1985, 1993). One of these events of magnitude ML=3.3 occurred on 4 April at 18:04. It was felt by the inhabitants of La Louvière, Carnières and Morlanwelz but did not cause any damage.
B12 The August and September 1968 earthquakes near La Louvière
Another series of (damaging) earthquakes occurred in the summer and fall of 1968 near La Louvière. The sequence began at 07:26 on 12 August 1968 (Fig. S22) with a Mw=3.6 earthquake causing panic and people rushed to the thresholds of their houses. The ROB official survey mentions a few damaged chimneys in La Louvière, Haine-Saint-Pierre, Haine-Saint-Paul and Morlanwelz-Mariemont, which suggests that intensity could have reached V in these localities.
On 13 August, a first quite violent shock of Mw=3.6 occurred at 16:17 and shook the locality of La Louvière, with a slight extension in Haine-Saint-Pierre and Haine-Saint-Paul. The rumble was brief and the reaction of the population was limited. This event was followed by a lighter, barely perceptible tremor of Mw=3.0 at 16:40.
The Mw=3.9 earthquake of 16:57 (Fig. S23) was stronger and damaging. In La Louvière, there was a brief moment of panic at the time of the tremor. The facades of houses shook, chimneys collapsed and in the workbenches of some shops, there was chaos. The localities of Haine-Saint-Pierre and Haine-Saint-Paul also suffered from the earthquake. Chimneys fell down everywhere, but fortunately, there were no injuries. Another consequence was that all telephone switchboards in the fire departments of La Louvière and Morlanwelz were overwhelmed (L'Indépendance (Edition du Centre) – 14–15 August 1968). Even if the number of damaged and overturned chimneys exceeded a few hundred in La Louvière, Haine-Saint-Pierre and Morlanwelz-Mariemont, this damage concerns the most inhabited part of the area and only corresponds to a few percent of the dwellings. Hence, we estimated intensity as being VI in those localities.
During the next period, of approximately 2 months, the seismic station in Dourbes recorded a series of earthquakes. Two of them were felt in the La Louvière area, occurring on 23 September at 04:08 (Mw=3.2; Fig. S24) and 05:47 (Mw=3.0: Fig. S25).
B13 The 3 November 1970 earthquake near Charleroi
This Mw=3.6 earthquake (Fig. S26) was strongly felt and caused slight damage in the cities of Dampremy, Marchienne-au-Pont, Marcinelle, Monceau-sur-Sambre and Mont-sur-Marchienne, located south of Charleroi. Many people left their homes. Damage was limited to cracks in plastered walls, small plaster fragments falling from the ceilings, cracked or broken windows, bricks falling and a few falling chimneys that were in bad condition. We assessed intensity as being V in those localities.
B14 The 24 October 1976 earthquake south of the coal area
This Mw=3.9 earthquake (Fig. S27) occurred a few kilometres south of the coal area. It strongly shook villages near the Belgium–France border. No damage was reported. The BCSF (Bureau Central Sismologique Français) conducted an inquiry into the effects of this event in France (BCSF, 1983). We used their intensity evaluations to extend macroseismic information onto the French territory.
B15 The 14 September 1982 and 4 and 9 August 1983 earthquakes south of the coal area
The last earthquake in the Hainaut coal area for which it was possible to provide a macroseismic map occurred near Carnières on 14 September 1982 at 19:24 (Mw=3.4; Fig. S28). Two earthquakes were also widely felt in the region of Charleroi on 4 and 9 August 1983, but only few testimonies as to their effects and very few positive answers to the ROB surveys were collected.
Codes are available from the authors upon request.
Earthquakes that occurred in Hainaut are included in the entire earthquake catalogue maintained by the Royal Observatory of Belgium (ROB) and can be consulted online at http://seismologie.be/en/seismology/seismicity-in-belgium/online-database, last access: 28 February 2022.
The supplement includes the following.
-
Table S1: the Hainaut earthquake catalogue provided as csv file (124 events)
-
The Hainaut Intensity Atlas:
-
the Hainaut seismicity catalogue (124 events);
-
thirty-one intensity maps of 28 Hainaut events and three additional earthquakes that had a large impact on the Hainaut coal area;
-
twelve intensity–distance modelling graphs;
-
sources and references for the entire catalogue.
-
-
Twenty-eight csv files containing intensity data of the earthquakes mapped in the Atlas
-
Forms of each municipality that replied to the official surveys of the Royal Observatory of Belgium. For 17 earthquakes, an intensity inquiry book has been made available in pdf.
The supplement related to this article is available online at: https://doi.org/10.5194/se-13-469-2022-supplement.
TC conceptualised the research, constructed the earthquake catalogue, evaluated local intensities and executed the intensity attenuation, focal depth and magnitude modelling. TC and MH searched for historical texts in press reports. KVN produced the (intensity) maps and the Atlas. TL computed and summarised the official ROB intensity surveys. TL and KVN calculated the cumulative Hainaut impact. TC, KVN and TL wrote the paper. All authors approved of the final paper.
The contact author has declared that neither they nor their co-authors have any competing interests.
Publisher’s note: Copernicus Publications remains neutral with regard to jurisdictional claims in published maps and institutional affiliations.
We thank Pierre Alexandre, David Kusman and Rita Leroy for their search of documents concerning earthquake activity in the Hainaut coal area. Also, thanks to Diethelm Kaiser for providing us information on mining-induced seismic events in Germany. We greatly acknowledge Gianluca Valensise and two anonymous reviewers and editor Tarje Nissen-Meyer for valuable review discussions on earlier drafts. Data analysis and modelling were performed using Python with the Scipy (Virtanen et al., 2020), Numpy (Oliphant, 2006), Geocoder (Carriere, 2021) and Pandas (McKinney, 2017) modules. Graphs were created using MatPlotLib (Hunter, 2007). Maps and attenuation modelling were constructed using QGIS (QGIS Development Team, 2021). Population density statistics for Belgium were kindly provided by Anne Joris of Statbel (Algemene Directie Statistiek – Statistics Belgium: https://statbel.fgov.be/en, last access: 15 February 2022). The geological background in Figs. 1, 2 and 3 and in all macroseismic maps in the Supplement originate from http://www.onegeology.org/, last access: 1 May 2020. Reproduced with the permission of OneGeology. All rights reserved. Newspaper images shown in the supplement are free of copyright according to https://www.kbr.be/en/digitisation/digital-collections-what-about-copyrights/, last access: 12 July 2021.
This research was supported by funding of the Royal Observatory of Belgium.
This paper was edited by Tarje Nissen-Meyer and reviewed by Gianluca Valensise and two anonymous referees.
Ahorner, L.: Erdbebenchronik für die Rheinlande 1964–70, Decheniana, 125, 259–283, 1972. a, b, c, d
Ahorner, L. and Pelzing, R.: The Source Characteristics of the Liège Earthquake on November 8, 1983, From Digital Recordings in West Germany, in: Seismic activity in western Europe, edited by: Reidel, D., Publishing Company 1985, 263–289, https://doi.org/10.1007/978-94-009-5273-7_21, 1985. a
Alexandre, P., Kusman, D., and Camelbeeck, T.: La presse périodique, une source pour l'histoire des tremblements de terre dans l'espace belge, Arch. Bibl. Belg., 78, 257–278, 2007. a
Alexandre, P., Kusman, D., Petermans, T., and Camelbeeck, T.: The 18 September 1692 Earthquake in the Belgian Ardenne and Its Aftershocks, in: Historical Seismology. Modern Approaches in Solid Earth Sciences, edited by Fréchet J., Meghraoui M., Stucchi M., Vol 2, Springer, Dordrecht, https://doi.org/10.1007/978-1-4020-8222-1_10, 2008. a
Ambraseys, N.: Intensity-attenuation and magnitude-intensity relationships for northwest european earthquakes, Earthq. Eng. Struct. D., 13, 733–778, https://doi.org/10.1002/eqe.4290130604, 1985. a, b, c, d, e, f
Association Française de génie Parasismique: Lorca earthquake (Spain), 11 May, Spain, AFPS, http://www.afps-seisme.org/eng/EARTHQUAKES/Major-earthquakes/Lorca-earthquake-2011 ( last access: 12 July 2021), 2011. a
Atkinson, G. M.: The Intensity of Ground Motions from Induced Earthquakes with Implications for Damage Potential, Bull. Seismol. Soc. Am., 110, 2366–2379, https://doi.org/10.1785/0120190166, 2020. a, b
Bakun, W. and Scotti, O.: Regional intensity attenuation models for France and the estimation of magnitude and location of historical earthquakes, Geophys. J. Int., 164, 596–610, https://doi.org/10.1111/j.1365-246X.2005.02808.x, 2006. a
Barszez, A.-M.: Aléa sismique du Bassin de Mons et vulnérabilité des bâtiments anciens – Analyse du risque sismique pour un quartier du centre historique de Mons, MSc-thesis, Faculté Polytechnique de Mons, Service d'Architecture et de Mines, 2005. a
Bossu, R., Landès, M., Roussel, F., and Steed, R.: Felt Reports for Rapid Mapping of Global Earthquake Damage: The Doughnut Effect?, Seismol. Res. Lett., 89, 138–144, https://doi.org/10.1785/0220170129, 2017. a
Calais, E., Camelbeeck, T., Stein, S., Liu, M., and Craig, T.: A New Paradigm for Large Earthquakes in Stable Continental Plate Interiors, Geophys. Res. Lett., 43, 10621–10637, https://doi.org/10.1002/2016GL070815, 2016. a
Cambier, R.: Les tremblements de terre de Ransart (mars, juin, juillet, 1911), Ann. Soc. Roy. Zool. Bel., 39, 97–101, 1911. a, b, c
Camelbeeck, T.: Some Notes Concerning the Seismicity in Belgium – Magnitude Scale – Detection Capability of the Belgian Seismological Stations, in: Seismic Activity in Western Europe: with Particular Consideration to the Liège Earthquake of 8 November 1983, edited by: Melchior, P. J., NATO ASI Series, Vol. 144, Springer, Dordrecht, 99–108, https://doi.org/10.1007/978-94-009-5273-7_8, 1985a. a, b, c
Camelbeeck, T.: Recent Seismicity in Hainaut – Scaling Laws from the Seismological Stations in Belgium and Luxemburg, in: Seismic activity in western Europe, edited by: Melchior, P. J., NATO ASI Series, Vol. 144, Springer, Dordrecht, 109–126, https://doi.org/10.1007/978-94-009-5273-7_9, 1985b. a, b, c, d, e
Camelbeeck, T.: La séquence sismique dans la région de Dour de février à mai 1987, Ann. Soc. Roy. Zool. Bel., 74, 96–116, https://doi.org/10.3406/barb.1988.57756, 1988. a
Camelbeeck, T.: L'activité séismique actuelle (1985–1988) en Belgique, Comparaison avec les données de séismicité historique et instrumentale, Analyse séismotectonique, Ann. Soc. Roy. Zool. Bel., 112, 347–365, 1990. a
Camelbeeck, T.: Mécanisme au foyer des tremblements de terre et contraintes tectoniques: le cas de la zone intraplaque belge, unpublished, PhD Thesis, Université Catholique de Louvain, http://publi2-as.oma.be/record/1627/usage (last access: 22 February 2016), 1993. a, b, c, d
Camelbeeck, T., Snissaert, M., and Verbeiren, R.: The Belgian seismic network: present and future, Cahiers du centre européen de Géodynamique et de Séismologie, 1, 93–102, 1990. a, b
Camelbeeck, T., van camp, M., Martin, H., Van de Putte, W., Bukasa, B., Castelein, S., Collin, F., Hendrickx, M., El Bouch, A., Petermans, T., Snissaert, M., Vanneste, K., and Verbeiren, R.: Les Effets en Belgique du Tremblement de Terre du 12 Juillet 2002 dans le Graben de la Roer, Ciel et Terre, 119, p. 13, 2003. a, b
Camelbeeck, T., de Viron, O., Van Camp, M., and Kusters, D.: Local stress sources in Western Europe lithosphere from geoid anomalies, Lithosphere, 5, 235–246, https://doi.org/10.1130/L238.1, 2013. a
Camelbeeck, T., Alexandre, P., Sabbe, A., Knuts, E., Garcia Moreno, D., and Lecocq, T.: The impact of earthquake activity in Western Europe from the historical and architectural heritage records, in: Intraplate Earthquakes, Solid Earth Geophysics, Cambridge University Press, 198–230, https://doi.org/10.1017/CBO9781139628921.009, 2014. a
Camelbeeck, T., Knuts, E., Alexandre, P., Lecocq, T., and Van Noten, K.: The 23 February 1828 Belgian earthquake: a destructive moderate event typical of the seismic activity in Western Europe, J. Seismol., 25, 369–391, https://doi.org/10.1007/s10950-020-09977-6, 2021. a, b, c, d, e
Capiau, H.: Secousse sismique ressentie le 15 janvier 1920 dans le Borinage, Ann. Soc. Roy. Zool. Bel., 43, 173–174, 1920. a, b
Carriere, D.: Geocoder, Github, https://github.com/DenisCarriere/geocoder, last access: 12 July 2021. a
Cecić, I. and Musson, R.: Macroseismic Surveys in Theory and Practice, Nat. Hazards, 31, 39–61, https://doi.org/10.1023/B:NHAZ.0000020255.00986.37, 2004. a
Charlier, C.: Les séismes de la vallée de la Haine, Tech. Rep., Publication provisoire, série S, Observatoire Royal de Belgique, 1949. a, b, c, d
Charlier, C.: L'Effet d'écran du houiller dans la propagation des ondes séismiques et ses conséquences sur la forme des isoséistes, Académie royale de Belgique, Bulletin de la classe des Sciences, série S, 640–649, 1951. a, b
Cornet, J.: Le tremblement de terre de Mons (12 avril 1911), Annales de la Société géologique de Belgique, 39, 39–97, 1911. a
de Munck, E.: Les tremblements de terre d'Havré, Bulletin de la Société Belge de Géologie, de Paléontologie et d'Hydrologie, 1, 184–185, 1887. a, b
Denieul, M.: Moment sismique et coda d'ondes crustales, PhD Thesis, Ecole Doctorale des Sciences de la Terre et de l'Environnement, EOST-IPGS de l'Université de Strasbourg, NNT 2014STRAH015f, 2014. a, b
Descamps, L.: Relations entre l'activité sismique dans le Hainaut et l’activité minière, Master's thesis, Faculté Polytechnique de Mons, University of Mons, 2009. a
Dost, B. and Kraaijpoel, D.: The August 16, 2012 earthquake near Huizinge (Groningen), Internal report of the KNMI, Roy. Meteorol. Inst. Netherl., p. 26, 2013. a, b, c
Drouet, S., Ameri, G., Le Dortz, K., Secanell, R., and Senfaute, G.: A probabilistic seismic hazard map for the metropolitan France, Bull. Earthq. Eng., 18, 1865–1898, https://doi.org/10.1007/s10518-020-00790-7, 2020. a
Faber, S. and Bonjer, K.-P.: Phase Recognition and Interpretation at Regional Distances from the Liege Event of November 8, 1983, in: Seismic Activity in Western Europe: with Particular Consideration to the Liège Earthquake of 8 November 1983, edited by: Melchior, P. J., NATO ASI Series, Springer Netherlands, Dordrecht, 249–262, https://doi.org/10.1007/978-94-009-5273-7_20, 1985. a
García Moreno, D. and Camelbeeck, T.: Comparison of ground motions estimated from prediction equations and from observed damage during the M=4.6 1983 Liège earthquake (Belgium), Nat. Hazards Earth Syst. Sci., 13, 1983–1997, https://doi.org/10.5194/nhess-13-1983-2013, 2013. a, b
Gomberg, J. S., Shedlock, K. M., and Roecker, S. W.: The effect of S-wave arrival times on the accuracy of hypocenter estimation, Bull. Seismol. Soc. Am., 80, 1605–1628, 1990. a
Grigoli, F., Cesca, S., Priolo, E., Rinaldi, A. P., Clinton, J. F., Stabile, T. A., Dost, B., Fernandez, M. G., Wiemer, S., and Dahm, T.: Current challenges in monitoring, discrimination, and management of induced seismicity related to underground industrial activities: A European perspective, Rev. Geophys., 55, 310–340, https://doi.org/10.1002/2016RG000542, 2017. a
Grünthal, G., Musson, R., Schartz, J., and Stucchi, M.: European Macroseismic Scale 1998, Cahiers du Centre Européen de Géodynamique et de Séismologie, Conseil de l'Europe, Luxembourg, Vol. 15, 1998. a, b
Hinzen, K.-G. and Oemisch, M.: Location and Magnitude from Seismic Intensity Data of Recent and Historic Earthquakes in the Northern Rhine Area, Central Europe, Bull. Seismol. Soc. Am., 91, 40–56, https://doi.org/10.1785/0120000036, 2001. a
Hough, S. E. and Martin, S. S.: Which Earthquake Accounts Matter?, Seismol. Res. Lett., 92, 1069–1084, https://doi.org/10.1785/0220200366, 2021. a
Hunter, J. D.: Matplotlib: A 2D Graphics Environment, Comput. Sci. Eng., 9, 90–95, https://doi.org/10.1109/MCSE.2007.55, 2007. a
Jongmans, D. and Plumier, A.: Etude pilote du risque sismique sur une partie de la ville de Liège (4 km2), Internal report, Faculté des Sciences Appliquées, Université de Liège, 2000. a
Knuts, E., Camelbeeck, T., and Alexandre, P.: The 3 December 1828 moderate earthquake at the border between Belgium and Germany, J. Seismol., 20, 419–437, https://doi.org/10.1007/s10950-015-9535-7, 2016. a
Kárník, V.: Seismicity of the European Area: Part 2, Springer Netherlands, https://doi.org/10.1007/978-94-010-3078-6, 1971. a, b
Kövesligethy, R.: Seismischer Stärkegrad und Intensität der Beben, Gerl. Beitr. Geophys., 8, 1907. a
Lecocq, T., Rapagnani, G., Martin, H., Vos, F., Hendrickx, M., Van Camp, M., Vanneste, K., and Camelbeeck, T.: B-FEARS: The Belgian Felt Earthquake Alert and Report System, Cahiers du Centre Européen de Géodynamique et de Séismologie, 28, 37–45, 2009. a, b
Lecocq, T., Camelbeeck, T., Rapagnani, G., Bukasa, B., Castelein, S., Collin, F., Hendrickx, M., Martin, H., Vandercoilden, L., Van Camp, M., and Vanneste, K.: Trente ans de surveillance sismique en Belgique, Ciel et terre, 129, 105–109, 2013. a
Leydecker, G., Grünthal, G., and Ahorner, L.: Der Gebirgsschlag vom 13. März 1989 bei Völkershausen in Thüringen im Kalibergbaugebiet des Werratals – Makroseismische Beobachtungen und Analysen, Geologisches Jahrbuch: Reihe E, Geophysik, 55, 5–24, 1998. a, b
Leynaud, D., Jongmans, D., Teerlynck, H., and Camelbeeck, T.: Seismic hazard assessment in Belgium, Geol. Belg., 3, 67–86, https://doi.org/10.20341/gb.2014.024, 2001. a
Marlière, R.: Les tremblements de terre d'avril-mai 1949 dans la région de Mons, Bulletin de la Société belge de Géologie, de Paléontologie et d'Hydrologie, 60, 17–27, 1951. a
Martin, C., Secanell, R., Combes, R., and Lignon, G.: Preliminary probabilistic seismic hazard assessement of France, London, 9–13 September, 2002. a
McKinney, W.: Python for Data Analysis: Data Wrangling with Pandas, NumPy, and IPython, O'Reilly Media, Sebastopol, California, 2nd Edn., ISBN 13 978-1491957660, 2017. a
Nappi, R., Porfido, S., Paganini, E., Vezzoli, L., Ferrario, M. F., Gaudiosi, G., Alessio, G., and Michetti, A. M.: The 2017, MD = 4.0, Casamicciola Earthquake: ESI-07 Scale Evaluation and Implications for the Source Model, Geosciences, 11, 44, https://doi.org/10.3390/geosciences11020044, 2021. a
Neefs, B., Van Noten, K., and Camelbeeck, T.: The complexity of modelling anisotropic intensity attenuation in Belgium, 37th General Assembly of the European Seismological Commission, Corfu, 19–24 September, 2021. a
Nievas, C. I., Bommer, J. J., Crowley, H., van Elk, J., Ntinalexis, M., and Sangirardi, M.: A database of damaging small-to-medium magnitude earthquakes, J. Seismol., 24, 263–292, https://doi.org/10.1007/s10950-019-09897-0, 2020. a
Oliphant, T. E.: A Guide to NumPy, Trelgol Publishing, ISBN 13 978-1517300074, 2006. a
Phillips, D. W.: Macroseismic Effects of the Liège Earthquake with Particular Reference to Industrial Installations, in: Seismic Activity in Western Europe: with Particular Consideration to the Liège Earthquake of 8 November 1983, edited by: Melchior, P. J., NATO ASI Series, Springer Netherlands, Dordrecht, 369–384, https://doi.org/10.1007/978-94-009-5273-7_30, 1985. a, b
Plumier, A.: Les effets sur les constructions, Les réparations., in: Le séisme de Liège et ses implications pratiques, Vol. 4, Annales des travaux publics de Belgique, edited by: Breesch, L., Camelbeeck, T., De Becker, M., Gurpinar, A., Monjoie, A., Plumier, A., and Van Gils, J. M., 346–353, 1985. a, b, c
Plumier, A.: Risque sismique sur une partie de la ville de Liège, in: Proceedings du colloque « Evaluation et prévention du risque sismique en Wallonie » organisé par la Région Wallonne les 16 et 17 Octobre 2007, Namur, Belgique, 47–56, 2007. a, b
Provost, L. and Scotti, O.: QUake‐MD: Open‐Source Code to Quantify Uncertainties in Magnitude–Depth Estimates of Earthquakes from Macroseismic Intensities, Seismol. Res. Lett., 91, 2520–2530, https://doi.org/10.1785/0220200064, 2020. a
QGIS Development Team: QGIS Geographic Information System, Open Source Geospatial Foundation, http://qgis.osgeo.org, last access: 10 March 2021. a
Sbarra, P., Burrato, P., Tosi, P., Vannoli, P., De Rubeis, V., and Valensise, G.: Inferring the depth of pre-instrumental earthquakes from macroseismic intensity data: a case-history from Northern Italy, Sci. Rep., 9, 15583, https://doi.org/10.1038/s41598-019-51966-4, 2019. a, b
Schlupp, A., Sira, C., Maufroy, E., Provost, L., Dretzen, R., Bertrand, E., Beck, E., and Schaming, M.: EMS98 intensities distribution of the “Le Teil” earthquake, France, 11 November 2019 (Mw 4.9) based on macroseismic surveys and field investigations, Compt. Rendus. Géosci., 353, 465–492, https://doi.org/10.5802/crgeos.88,2021. a, b, c
Sira, C.: Macroseismic Intervention Group: The Necessary Field Observation, Springer International Publishing, Cham, 395–408, https://doi.org/10.1007/978-3-319-16964-4_16, 2015. a, b
Somville, O.: Les tremblements de terre en Belgique, Edt Imprimerie Duculot (Gembloux), Observatoire royal de Belgique, p. 24, 1936. a, b
Sponheuer, W.: Untersuchungen Zur Seismizität von Deutschland, Veröffentlichungen des Instituts für Bodenmechanik und Erdbebenforschung in Jena, 72, 23–52, 1962. a
State Archives of Belgium: http://arch.arch.be, last access: 10 March 2021. a
Stromeyer, D. and Grünthal, G.: Attenuation Relationship of Macroseismic Intensities in Central Europe, Bull. Seismol. Soc. Am., 99, 554–565, https://doi.org/10.1785/0120080011, 2009. a, b, c, d
Stromeyer, D., Grünthal, G., and Wahlström, R.: Chi-square regression for seismic strength parameter relations, and their uncertainties, with applications to an Mw based earthquake catalogue for central, northern and northwestern Europe, J. Seismol., 8, 143–153, https://doi.org/10.1023/B:JOSE.0000009503.80673.51, 2004. a
Troch, K.: Une vulnérabilité délibérément acceptée par les pouvoirs publics? Extraction du charbon et inondations dans la vallée de la Haine, 1880–1940, VertigO – la revue électronique en sciences de l'environnement, 3, 16, https://doi.org/10.4000/vertigo.17998, 2016. a
Troch, K.: Ne pas grever l'avenir au bénéfice du présent: Une histoire environnementale de l'extraction du charbon de la fin du 18e siècle à l'Entre-deux-guerres: un développement non soutenable: L’exemple du Couchant de Mons et du Valenciennois, PhD Thesis, Université Charles de Gaulle – Lille III; Université de Namur, https://tel.archives-ouvertes.fr/tel-02918115 (last access: 10 March 2021), 2018a. a, b
Troch, K.: Reforming Mineral Ownership and Ensuring Surface Owners' Rights: The Gosselies Disaster, Global Environ., 11, 319–345, https://doi.org/10.3197/ge.2018.110206, 2018b. a
Van Gils, J.-M.: Les séismes des 15 et 21 décembre 1965 et du 16 janvier 1966, Ciel et Terre, 82, 243–267, 1966. a, b, c, d
Van Gils, J.-M. and Zaczek, Y.: La séismicité de la Belgique et son application en génie parasismique, Annales des Travaux Publics de Belgique, 6, 502–539, 1978. a, b
Van Noten, K., Lecocq, T., Shah, A. K., and Camelbeeck, T.: Seismotectonic significance of the 2008–2010 Walloon Brabant seismic swarm in the Brabant Massif, Belgium, Tectonophysics, 656, 20–38, https://doi.org/10.1016/j.tecto.2015.05.026, 2015. a
Van Noten, K., Lecocq, T., Sira, C., Hinzen, K.-G., and Camelbeeck, T.: Path and site effects deduced from merged transfrontier internet macroseismic data of two recent M4 earthquakes in northwest Europe using a grid cell approach, Solid Earth, 8, 453–477, https://doi.org/10.5194/se-8-453-2017, 2017. a, b
Vanneste, K., Vleminckx, B., Verbeeck, K., and Camelbeeck, T.: Development of seismic hazard maps for Belgium, Seismic Hazard Harmonization in Europe (SHARE): DGEB-Workshop, Print Office Schumacher, Herzogenrath, Vol. 16, 61–68, ISBN 9783930108121, 2014. a
Virtanen, P., Gommers, R., Oliphant, T. E., Haberland, M., Reddy, T., Cournapeau, D., Burovski, E., Peterson, P., Weckesser, W., Bright, J., van der Walt, S. J., Brett, M., Wilson, J., Millman, K. J., Mayorov, N., Nelson, A. R. J., Jones, E., Kern, R., Larson, E., Carey, C. J., Polat, I., Feng, Y., Moore, E. W., VanderPlas, J., Laxalde, D., Perktold, J., Cimrman, R., Henriksen, I., Quintero, E. A., Harris, C. R., Archibald, A. M., Ribeiro, A. H., Pedregosa, F., and van Mulbregt, P.: SciPy 1.0: fundamental algorithms for scientific computing in Python, Nat. Methods, 17, 261–272, https://doi.org/10.1038/s41592-019-0686-2, 2020. a
Woessner, J., Laurentiu, D., Giardini, D., Crowley, H., Cotton, F., Grünthal, G., Valensise, G., Arvidsson, R., Basili, R., Demircioglu, M. B., Hiemer, S., Meletti, C., Musson, R. W., Rovida, A. N., Sesetyan, K., Stucchi, M., and The SHARE Consortium: The 2013 European Seismic Hazard Model: key components and results, Bull. Earthq. Eng., 13, 3553–3596, https://doi.org/10.1007/s10518-015-9795-1, 2015. a
- Abstract
- Introduction
- Earthquake catalogue
- Macroseismic information and intensity evaluation
- Intensity attenuation and focal depth estimation
- Instrumental magnitudes and magnitude determined from macroseismic data
- Discussion
- Conclusions
- Appendix A: Intensity evaluation
- Appendix B: Description of the strongest, often damaging, Hainaut earthquakes
- Code availability
- Data availability
- Author contributions
- Competing interests
- Disclaimer
- Acknowledgements
- Financial support
- Review statement
- References
- Supplement