the Creative Commons Attribution 4.0 License.
the Creative Commons Attribution 4.0 License.
 | 15 Mar 2022
The topographic signature of temperature-controlled rheological transitions in an accretionary prism
Sepideh Pajang
Laetitia Le Pourhiet
Nadaya Cubas
The local topographic slope of the accretionary prism is often used together with the critical taper theory to determine the effective friction on subduction megathrust. In this context, extremely small topographic slopes associated with extremely low effective basal friction (μ≤0.05) can be interpreted either as seismically locked portions of megathrust, which deforms episodically at dynamic slip rates or as a viscously creeping décollement. Existing mechanical models of the long-term evolution of accretionary prism, sandbox models, and numerical simulations alike, generally do not account for heat conservation nor for temperature-dependent rheological transitions. Here, we solve for advection–diffusion of heat with imposed constant heat flow at the base of the model domain. This allows the temperature to increase with burial and therefore to capture how the brittle–ductile transition and dehydration reactions within the décollement affect the dynamic of the accretionary prism and its topography. We investigate the effect of basal heat flow, shear heating, thermal blanketing by sediments, and the thickness of the incoming sediments. We find that while reduction of the friction during dewatering reactions results as expected in a flat segment often in the forearc, the brittle–ductile transition results unexpectedly in a local increase of topographic slope by decreasing internal friction. We show that this counterintuitive backproduct of the numerical simulation can be explained by the onset of internal ductile deformation in between the active thrusts. Our models, therefore, imply significant viscous deformation of sediments above a brittle décollement, at geological rates, and we discuss its consequences in terms of interpretation of coupling ratios at subduction megathrust. We also find that, with increasing burial and ductile deformation, the internal brittle deformation tends to be accommodated by backthrusts until the basal temperature becomes sufficient to form a viscous channel, parallel to the décollement, which serves as the root to a major splay fault and its backthrust and delimits a region with a small topographic slope. Morphologic resemblances of the brittle–ductile and ductile segments with forearc high and forearc basins of accretionary active margins, respectively, allow us to propose an alternative metamorphic origin of the forearc crust in this context.
- Article
(11988 KB) - Full-text XML
- BibTeX
- EndNote


Several studies have suggested a link between the morphology of forearc wedges and the seismic behavior of megathrusts, showing a correlation between large subduction earthquakes and forearc basins or deep-sea terraces (Wells et al., 2003) or with negative free-air gravity anomalies (Song and Simons, 2003; Wells et al., 2003).
Forearc wedges are to the first order well described by the critical taper theory (CTT) (Davis et al., 1983; Dahlen et al., 1984). This theory assumes that wedges are built by accretion of material equivalent to sand pushed by a moving bulldozer over a frictional basal décollement. This theory has been very successful in describing the equilibrium morphology of wedges in response to accretion and as a function of its effective internal and basal frictional strength (Davis et al., 1983; Dahlen et al., 1984).
The relationship between the forearc wedge morphology and the seismogenic behavior has been attributed to spatial variations of basal shear strength (Song and Simons, 2003) and forearc basins are generally associated with an extremely low effective friction within the seismogenic zone (μ≤0.05) (Cubas et al., 2013; Pajang et al., 2021a), which is also supported by heat flow measurements and thermal modeling (Gao and Wang, 2014).
The effective friction is the ratio of the effective shear stress τ* to the normal stress σn acting on a specific plane. Effective shear stress is the shear stress τ corrected from isotropic fluid pressure contribution Pf following (Terzaghi, 1925). Effective friction differs from the internal friction of rocks , which is constant for most geological material except mineralogical clays (Byerlee, 1978). Clay minerals are phyllosilicate hydrated and their stability field is mainly controlled by temperature. Prograde metamorphic reactions that affect clay minerals release water in the system, which is suspected to raise fluid pressure and diminish effective friction. Clay contents, their nature, and their evolution during accretion may therefore affect the effective friction of the décollement as a function of temperature history.
Several studies have related the depth dependence of subduction megathrust seismicity to the diagenetic transformation of smectite to illite, two clay minerals (Vrolijk, 1990; Hyndman et al., 1995; Oleskevich et al., 1999; Moore and Saffer, 2001).
This transition appears at ∼ 2.5–5 km depth or 100–150 ∘C temperature threshold in clay-rich accretionary complexes (Pytte and Reynolds, 1988; Hyndman et al., 1995; Oleskevich et al., 1999) and could account for up to 80 % of the excess in pore fluid pressure (Bekins et al., 1994; Lanson et al., 2009) necessary to explain the low topographic slope of forearc basins according to CTT. This transition is found to roughly correlate with the up-dip limit of the seismogenic zone (Oleskevich et al., 1999). Yet, the relationships between forearc basins and seismogenic zones do not work along all subduction zones (Song and Simons, 2003; Wells et al., 2003).
An alternative explanation for the flat slope of forearc basins could be the presence of a weak viscous décollement. This hypothesis is supported by rock records in exhumed large accretionary complexes (Raimbourg et al., 2014; Chen et al., 2018), which show that the increase in temperature with burial permits to reach the brittle–ductile transition. Yet, this transition from solid (rate-independent or rate-weakening) versus fluid (rate-hardening) friction is hard to parametrize within the CTT as it produces rate-dependent effective friction and rate dependence is absent of CTT. Long-term models which include the tectonic and thermal structure inherited from building the forearc wedge are thus needed to explore alternative or reconciling explanations.
The evolution and distribution of long-term internal deformation of forearc wedges has been intensively studied by numerical models in two (Burbidge and Braun, 2002; Strayer et al., 2001; Buiter et al., 2016; Stockmal et al., 2007; Miyakawa et al., 2010; Simpson, 2011; Ruh et al., 2012; Ruh, 2020) and three dimensions (Braun and Yamato, 2010; Ruh et al., 2013; Ruh, 2016) complementing analogue models (see Graveleau et al., 2012, for a review). These models have covered the influence of many parameters such as the geometry (e.g., Dahlen et al., 1984; Davis et al., 1983; Smit et al., 2003; Ruh et al., 2016), basal friction (e.g., Colletta et al., 1991; Nieuwland et al., 2000; Burbidge and Braun, 2002; Ruh et al., 2012; Cubas et al., 2008), surface processes (e.g., Storti and McClay, 1995; Mary et al., 2013; Willett, 1999; Bonnet et al., 2007; Fillon et al., 2013; Simpson, 2006), and the presence of viscous material along the décollement (e.g., Costa and Vendeville, 2002; Smit et al., 2003; Pichot and Nalpas, 2009; Simpson et al., 2010; Ruh et al., 2012; Borderie et al., 2018). Despite the large number of published studies, none of them included the dependence of effective basal friction on temperature due to metamorphic reaction or brittle–ductile transition.
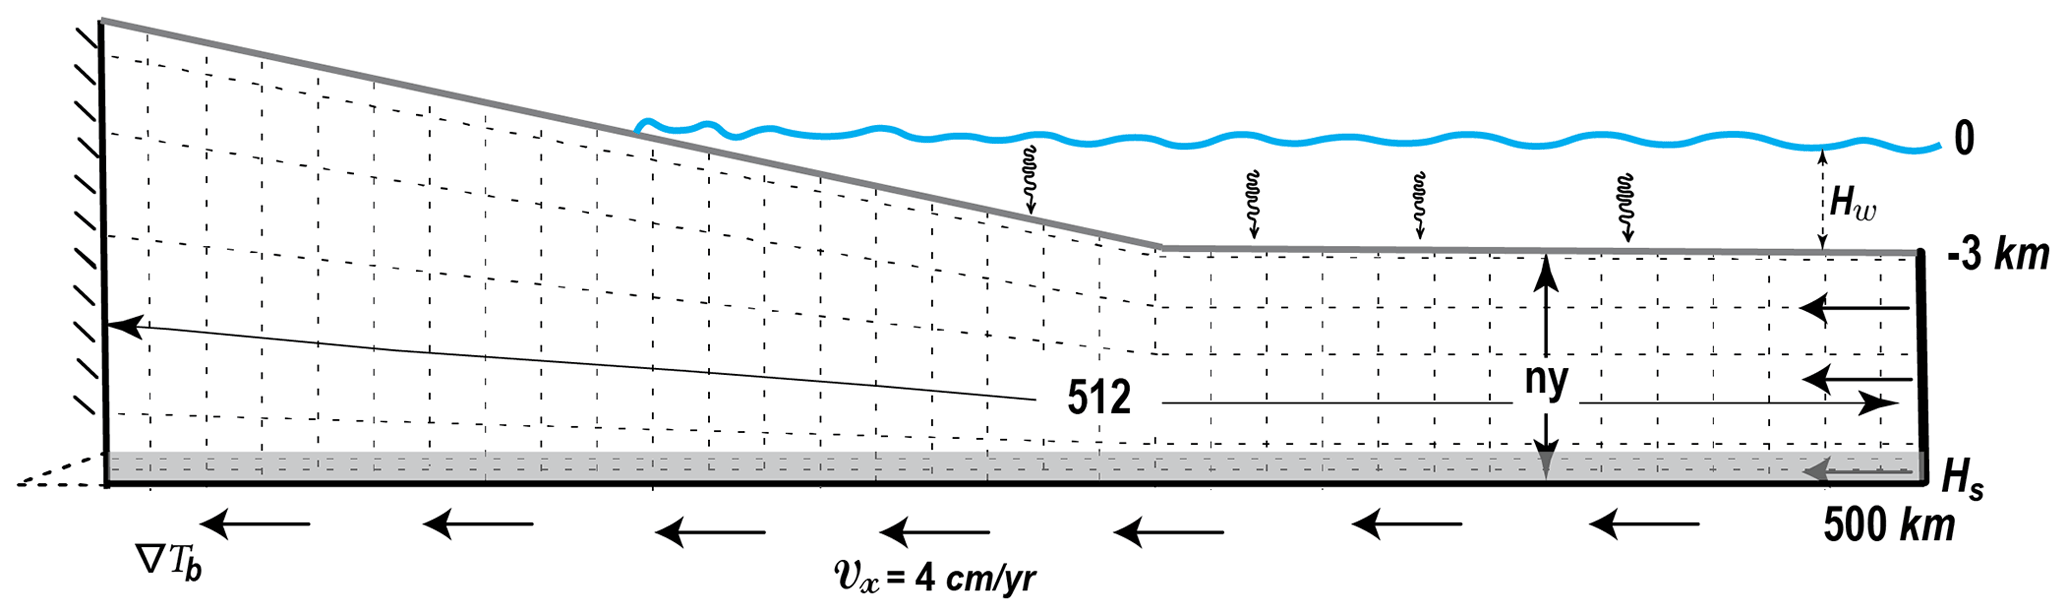
Figure 1Model setup. Mechanical boundary conditions are a non-deformable backstop on the left side, a constant velocity in the horizontal direction of 4 cm yr−1; the top boundary behaves as a free surface above sea level, while the weight of the water column is prescribed as stress normal to the deformed boundary below sea level. Temperature is fixed at the surface; the thermal gradient is prescribed across all other boundaries with the value of zero on vertical ones and value of ∇Tb at the bottom boundary. The mesh consists of 512 × ny Q2P1 elements which deform to adapt to the deforming top boundary. Parameters are defined in Table 1.
Here, we study how the introduction of temperature evolution and its feedback on rock rheology generates deviations from CTT. For that purpose, we use a typical CTT setup (Fig. 1), and we solve for the heat equation on the same domain with a constant heat flow boundary condition at the base, which corresponds to plate age, to allow the temperature to increase with burial. As this contribution focuses on the thermal effect, we also include shear heating and thermal blanketing of sediments. We present different series of 2-D thermomechanical simulations which assess how the brittle–ductile and the smectite–illite transitions affect the topographic slope of an accretionary prism and its internal deformation. We briefly discuss the internal deformation and the morphology of the wedge and also its potential seismic behavior. We therefore retrieve the spatial and temporal variation of the morphologies and deformation patterns and discuss their implications in terms of the forearc basin and forearc high genesis and nature.
2.1 Method
In order to model the long-term behavior of the accretionary prism, we use pTatin2d (May et al., 2014, 2015), a code based on finite element method that employs an arbitrary Lagrangian–Eulerian (ALE) discretization together with the material point method to solve the conservation of momentum (Eq. 1), mass (Eq. 2), and energy (Eq. 3) for an incompressible fluid. It allows solving thermomechanical problems. It has been widely used to model lithospheric-scale long-term tectonic problems coupled to surface processes (Jourdon et al., 2018; Perron et al., 2021) and benchmarked with sandbox experiments (Buiter et al., 2016).
The code solves for velocity v and pressure P assuming conservation of momentum:
in an incompressible fluid assuming
of nonlinear effective viscosity η and constant density ρ. is the strain rate tensor and g the gravity acceleration. Evolution of temperature T is obtained by solving the time-dependent, t, conservation of heat:
The coefficients of Eq. (3) are κ the thermal diffusivity, Cp the heat capacity, and H the heat production. We do not include radiogenic heat production in our simulation, and
corresponds to the sole shear heating. The Stokes problem (Eqs. 1 and 2) is solved using high-order stable elements (Q2−P1), while the heat equation (Eq. 3) is discretized on Q1 elements. Physical properties of rocks are computed on Lagrangian markers and projected to gauss points using constant value per element. Averaging of marker-defined coefficients within element is geometric for viscosity and algebraic for other properties. At every time step, the surface of the models, h, is smoothed according to the Culling diffusive erosion law:
with a diffusion coefficient k. Details on implementation of the surface process model in pTatin2d are to be found in Jourdon et al. (2018).
2.2 Rheological model
We use temperature- and pressure-dependent nonlinear rheologies. Effective viscosity is evaluated on material points using first the Arrhenius flow law for dislocation creep:
written in term of the second invariant of the strain rate tensor . The activation volume is set to m3 mol−1 for all the lithologies; the other constants (A, n, Q) are listed for each lithology in Table 1. If the prediction of the second invariant of stress for a viscous rheology
exceeds the Drucker–Prager frictional plastic yield criterion,
which depends on ϕ the internal friction angle and C the cohesion, the effective viscosity of the marker is corrected in order to return to the yield envelop with
Finally, the friction angle ϕ and cohesion C decrease linearly with accumulation of strain in the brittle regime εp from an initial friction ϕ0 to a final friction ϕ∞ (C0 and C∞ for cohesion, respectively):
over a range of accumulated plastic strain varying from to . This drop of friction and cohesion permits former faults to remain brittle where undeformed rocks creep viscously. The décollement is exempt from softening both to facilitate the comparison with CTT and because it is considered originally frictionally weak. Frictional parameters are listed together with viscous parameters, density, and thermal diffusivity in Table 1. As all Stokes solvers, pTatin2d also applies cut-off values on effective viscosity in order to maintain a reasonably well-conditioned system of equations. These are set to a minimum value Pa s and a maximum value Pa s. We made sure that the minimum is never reached to ensure that the frictional properties of the décollement reflect its extremely low friction.
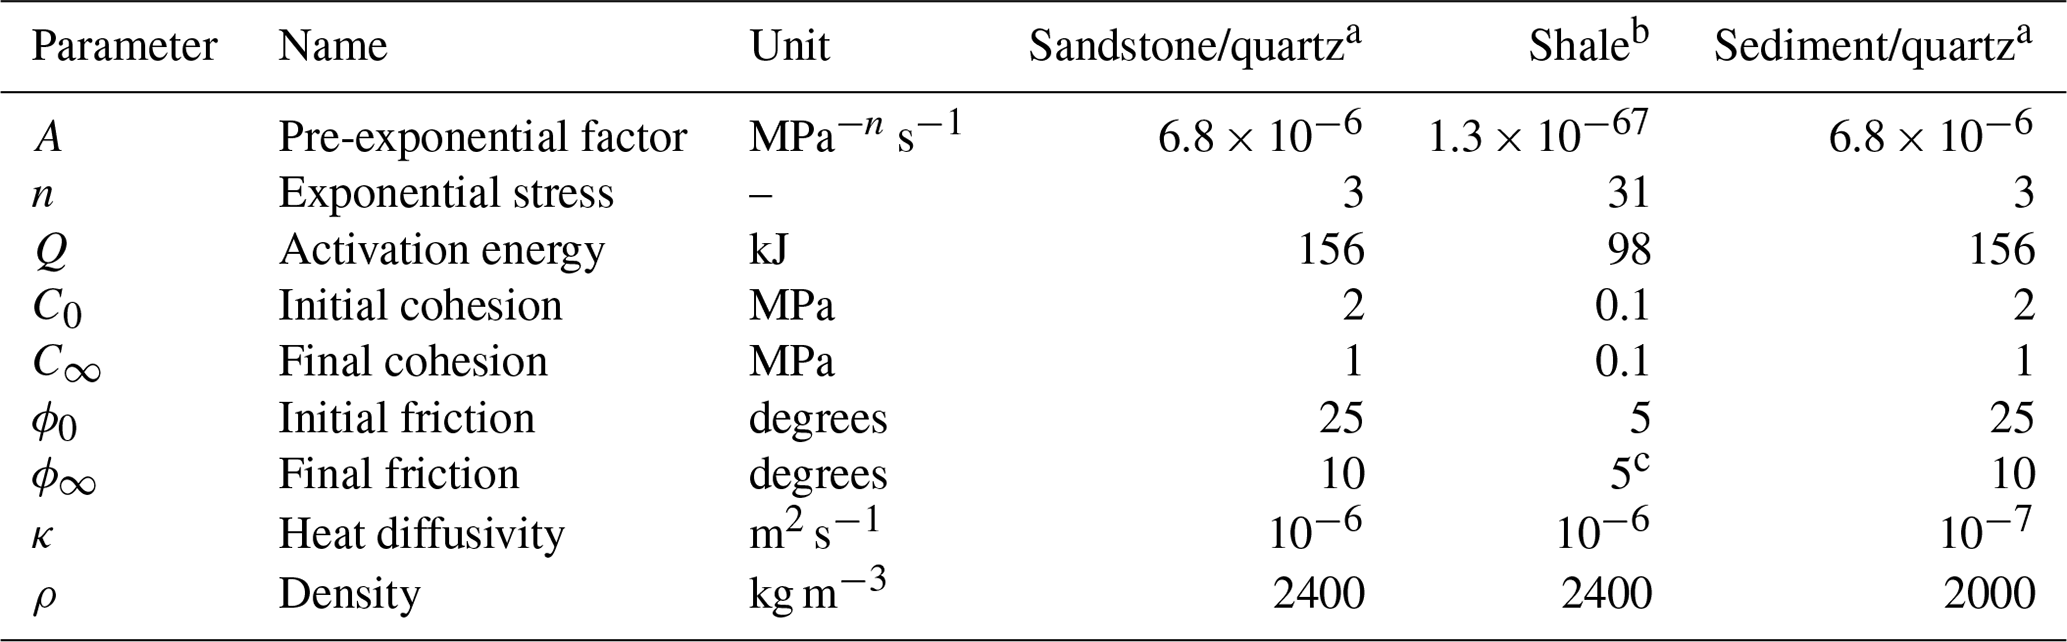
Table 1Variable rheological parameters and coefficients for the different lithologies; creep parameters a from Ranalli and Murphy (1987) and b from Shea and Kronenberg (1992). c In models M13 to M15 the friction in the shale is temperature dependent.
2.3 Initial and boundary conditions
The model domain is 500 km long and its initial thickness is either 4 or 7.5 km (Fig. 1). It is constituted of two layers, a 500 m thick décollement modeled by shale, while the rest is modeled by sandstone/quartz. The domain is discretized with a mesh of 512 × 16 and 512 × 24 Q2 elements, for 4 and 7.5 km thickness, respectively. In the y direction, two mesh elements are aligned with the initial décollement layer to better capture its interface and friction at small strain. The décollement material is considered as part of the domain, as such, we allow shale to be dragged in the rest of the model domain contrarily to frictional boundary conditions adopted to benchmark the code with sandbox experiments (Buiter et al., 2016). The shortening of the model is driven by a constant horizontal velocity vx=4 cm yr−1, applied both at the right and bottom boundaries. Above the décollement level, the left side of the domain is rigid. Within the two mesh elements of the left boundary which belongs to the décollement, a vertical velocity gradient is applied to ensure the continuity with the bottom boundary. The surface of the domain is modeled with a free surface above sea level (located 3 km above the top of the mechanical model, Fig. 1); below sea level, additional normal stress:
is applied on the deformed surface to mimic the weight of water, yet shear stress is zero like above sea level.
The thermal boundary conditions assign the temperature T0=0 ∘C at the surface, a constant thermal gradient at the base and no horizontal gradient (insulating boundary) on the vertical walls of the domain. As we assume no radiogenic heat production, the initial temperature in the domain is fixed to
consistently with the boundary conditions.
2.4 Post-processing
Models are named by a number within a bullet on the right of the panels. This number refers to Table 2 which contains all the specific parameters used for this realization of the model. For each simulation, we show the finite brittle strain in the rocks and the strain rate of the current state. The total strain (brittle and viscous) can be deduced from the geometry of the incoming sediments (gray and black originally horizontal).
The finite strain figure displays the lithologies of rocks and the accumulated plastic strain on markers with a linear color map. Markers with values of plastic strain εp larger than 2 or 3 can be interpreted as being part of a fault. In order to better show the deformation, sandstone sequences have been colored with thin layers that have no physical existence. Sediment markers deposited by surface processes are colored by the time of deposition from brown to yellow colors. As the color palette for brittle strain would not show well in the sediments produced by the surface process model (SPM), we actually do not plot the brittle strain on top of erosional products. However, they do deform in a brittle manner from the strain rate and as for incoming sedimentary rocks. The brittle/localized deformation in the sediments is outlined by the deformation of their bedding.
The current state figure displays whether the material is yielding plastically (blue) or deforms viscously (red). It is overlaid by green shades of the second invariant of strain rate to outline structures that are currently active by comparison to finite strain. A cut-off range from s−1 to s−1 is used for the post-processing. The actual values span a larger range. We also represent three isotherms (180, 300, and 450 ∘C) which have been chosen to correspond to the onset of viscous deformation in low strain islands, brittle–ductile transition for quartz at average strain rate and completely ductile behavior. In the simulation with dehydration reactions, the 120 ∘C isotherm is added to locate the onset of the dehydration reaction. Finally, we represent the local slope with a color code at the top of the slice.
2.5 Experimental plan
Our aim is to provide the community with a first assessment of the topographic expression of the change in thermorheological regime with burial in an accretionary prism. We, therefore, have chosen a simple reference model which produces well defined thrust and backthrust, with a moderate amount of sedimentation. The effects of softening, basal friction, and basal slope on accretion have already been thoroughly studied (e.g., Graveleau et al., 2012; Buiter et al., 2016; Ruh et al., 2012, 2014).
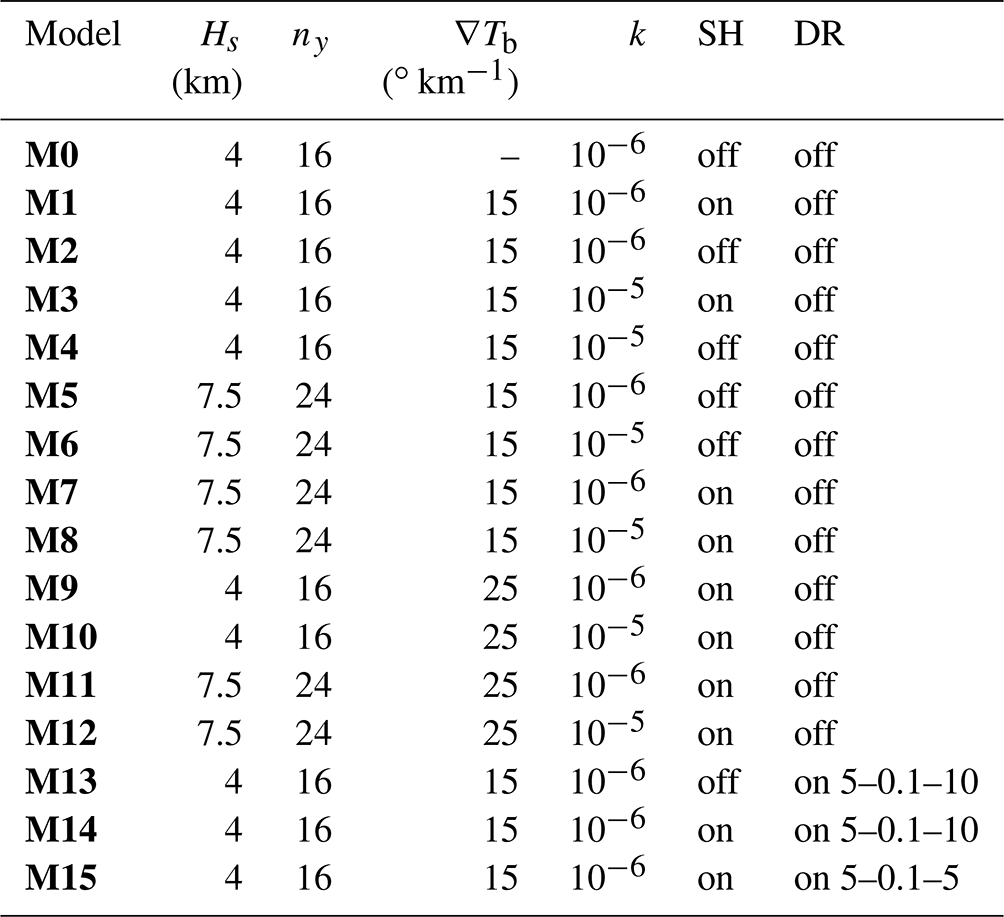
Table 2Variable parameters. Hs indicates domain thickness, ny indicates the number of vertical element, ∇Tb indicates the basal thermal gradient, k indicates coefficient of diffusion for surface process model, SH indicates shear heating, DR indicates dehydration reaction followed by values for temperature-dependent internal friction angle in degrees.
Hence, we here concentrate on parameters that are known to affect the geotherm: basal heat flow (represented by basal thermal gradient ∇Tb), initial burial (Hs), coefficient of diffusion of the topography (erosion and sedimentation) (κ), and shear heating (SH) following the plan listed in Table 2. In all the experiments, thermal blanketing (Jeffreys, 1931; Wangen, 1994) is very roughly simulated by using a lower thermal diffusivity for sediments produced by the surface process model (see Table 1). As we do not simulate the compaction of sediments with burial, thermal insulation is probably overestimated but it allows testing potential effects of sedimentation on the thermal state of the accretionary wedges.
3.1 Effect of brittle–ductile transition at one glance
In Fig. 2, we first compare the results of our reference model (M1), with a 4 km thick pile of sediments affected by moderate erosion sedimentation, shear heating, and a thermal gradient of 15∘ km−1 which corresponds to a plate age of 65 Ma, with the same model run without thermal coupling (M0).
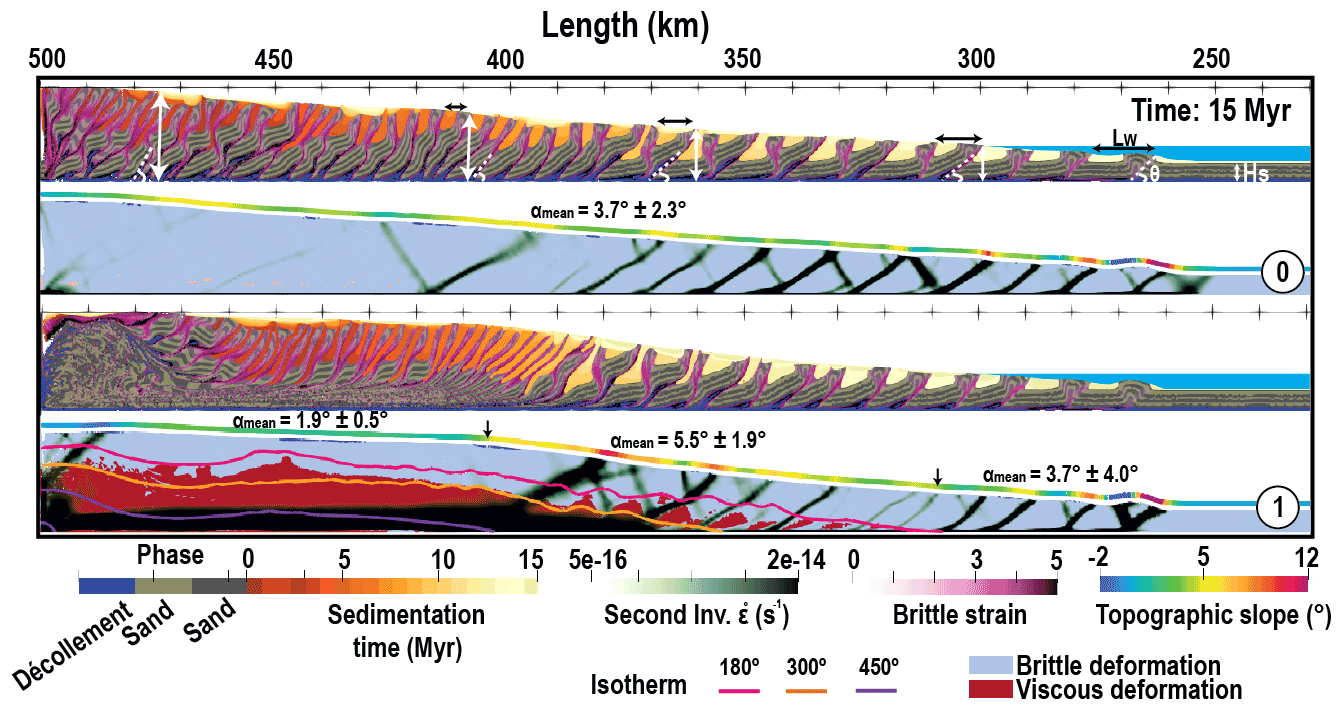
Figure 2Model M0: without temperature compared to model M1: the same experiment with temperature-dependent rheologies, both after 15 Myr evolution. The finite strain and the current state and strain rate are shown for basal frictional angle (ϕb=5∘) and internal friction angle dropping from 25 to 10∘ with strain. The yellowish-brown color illustrates syn-tectonic sedimentation in the form of piggyback basins which represent a given age that corresponds to the time of deposition. Where the material is yielding plastically is in blue or where it deforms viscously is in red with the onset of 180, 300, and 450 ∘C isotherms. Black arrows display decreasing thrust space towards the backstop and white arrows show increasing sequence thickness and inclination angle θ. The local topographic slope with a color code shown at the top of the slice is affected by temperature and frictional properties, 1 : 1 scale.
While the frontal parts are not significantly different, with similar tapers and ramp spacing, as soon as the thickness of the wedge doubles (close to sea level at x of approximately 300 km), the backthrusts are more active in the purely brittle wedge than in the thermally controlled wedge for these brittle parameters. This results in the deactivation of one ramp over two, which leads to the formation of the distinct twinned-slice patterns observed between x=430 km and x=300 km in M0. In M1, the twinning of slice by backthrust occurs only once the temperature at the base of the model reaches 300 ∘C.
Looking at the internal part of the two accretionary prisms, the differences become of course more striking. In the case without thermal coupling (M0), deformation continues by pairing together more and more slices within sequences of thrust and backthrust which root deeper and deeper as the accretionary prism thickens. The prolonged activity of these out-of-sequence thrusts and backthrust is best measured by the small out-of-sequence basins that form at their top, discordant on the older sediments. Very little exhumation occurs close to the backstop. In the case of thermal coupling, as soon as the 450 ∘C isotherm is reached, deformation becomes highly partitioned vertically. A thick layer at the base accommodates the simple shear and branches on main frontal thrusts which root at the brittle–ductile transition. The ductile material is exhumed along a normal fault that roots on the backstop. In between, the deformation in the brittle part is either very distributed or almost nonexistent as the strain rate remains below our visualization threshold.
In the end, zooming out of these details and looking at the topographic slope, we can see that a brittle accretionary wedge displays a rather constant 4∘ slope, as predicted by the CTT taking into account the softening parameter (Ruh et al., 2014). A mature brittle–ductile wedge forms three distinct segments that can be distinguished based on topographic slope. The back segment, close to the backstop where the décollement is viscous displays a rather low but non-zero topographic slope. The third segment, at the toe where the wedge is purely brittle, displays a CTT predicted slope. In between, where both brittle and ductile deformation co-exist within the wedge, while the décollement is still brittle, a central segment displays a distinctively larger topographic slope than predicted by CTT. We refer to that segment as the brittle–ductile transition segment of the wedge.
3.2 Time evolution of reference model
Figure 3 shows the structural evolution of the reference simulation M1 through time. The wedge grows horizontally by in-sequence thrusting and vertically by reactivation of thrusts within the wedge. Most of the horizontal shortening is accommodated by the active frontal thrust. As the wedge evolves, the surface slope also changes and we detail here its evolution in time.
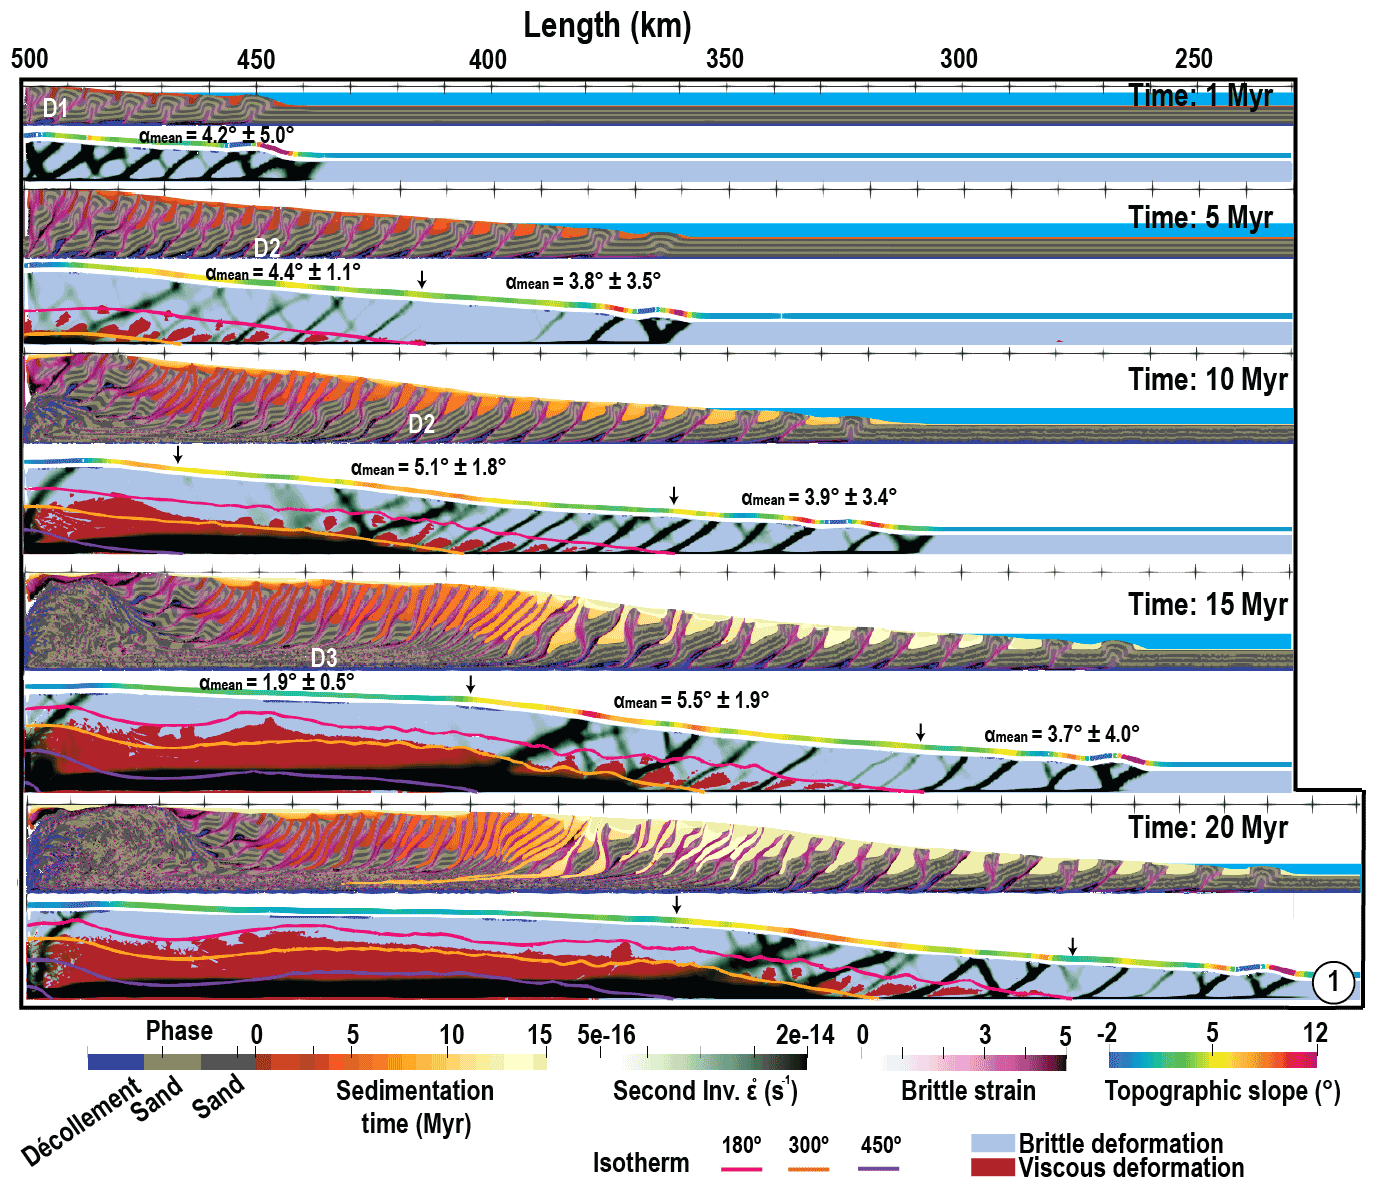
Figure 3Temporal evolution of the reference model (M1) from beginning to 20 Myr of shortening, 1 : 1 scale.
After 1 Ma, accumulated plastic strain shows that the deformation is strongly localized along the frontal part and on the décollement. Brittle shear bands initially occurred in conjugate sets; with ongoing shortening, landward dipping brittle shear bands are preferred and backthrusts are almost abandoned. The wedge is trying to reach a critical state by creating a topographic slope. Due to internal frictional softening, the brittle wedge present a slope , which corresponds to the slope predicted by CTT for basal friction ϕb and internal friction of 17∘, i.e., the average of ϕ∞=10∘ and ϕ0=25∘.
At 5 Ma, some patches of viscous deformation appear in between the main faults at x=413 km once the base of the model reaches 180 ∘C. From that point, landward plastic strain and the second invariant of the strain rate indicate the activity of out-of-sequence thrusts and steep backthrusts which dissect the former slices and tend to flatten horizontally the sequences as the former ramps become more and more vertical. This phenomena induces vertical thickening that correlates with the occurrence of internal viscous deformation at depth and with an increase in local slope independently of basal friction which remains constant. This increase in slope causes an increase in sedimentation rate at the front where piggyback basins tend to be more starved than in the initial phase favoring the activity of thrusts, and a lengthening of the slices as predicted by other studies like Storti and McClay (1995) using sandbox experiments or Simpson et al. (2010) using numerical simulations.
As the shortening goes on, the temperature continues increasing at the back of the wedge due to burial. Between 5 and 10 Ma, the strain rate shows that the thickness of the décollement increases to reach 2 km. A normal fault forms near the backstop (which could be probably an inevitable boundary effect) and starts accommodating the exhumation of high metamorphic grade rocks, which deforms in a ductile manner. At the front of this wide ductile horizontal shear zone, which terminates right at the 300 ∘C isotherm, roots a system of low-angle thrusts and high-angle backthrusts which separates the warm distributed part of the wedge from the thrust dominated section of the wedge.
From 10 to 15 Ma, the warm part of the wedge grows in length and its topography flattens. The vertical partitioning between simple shear at the base and pure shear at the top becomes evident. At the front of this ductile wedge, the transition zone, where thrusts and their backthrust roots directly in the ductile décollement near the 300 ∘C isotherm, develops giving rise to a distinctively larger slope than predicted by CTT. At the toe of the wedge, the slope remains constant and CTT compatible.
At 20 Ma, the overall architecture of the accretionary prism has not changed; the whole wedge is just shifted towards the right as the ductile part of the wedge has grown wider. One could state that the brittle–ductile wedge has reached some sort of steady state between 15 and 20 Ma. Rocks that are incorporated in the wedge start by rotating along with brittle thrust and maybe deforming in a pure brittle manner within the slice. In a second semi-brittle phase, internal viscous–ductile deformation affects the whole tectonic slices separated by brittle thrusts. This phase of deformation corresponds to the moment at which the incoming sediments are incorporated to the second segment of the wedge where the topographic slope is larger than CTT predictions. Finally, depending on whether rocks were incorporated in the ramp or not, they go through passive rotation by distributed pure shear thickening associated with low temperature or intense ductile simple shear before being exhumed by the higher temperature.
In conclusion, the large slope segment which corresponds to the brittle–ductile transition is acquired as soon as some viscous internal deformation occurs in between faults. The brittle–ductile wedge reaches a steady state when ductile deformation becomes predominant on the décollement that is for temperature greater than 450 ∘C.
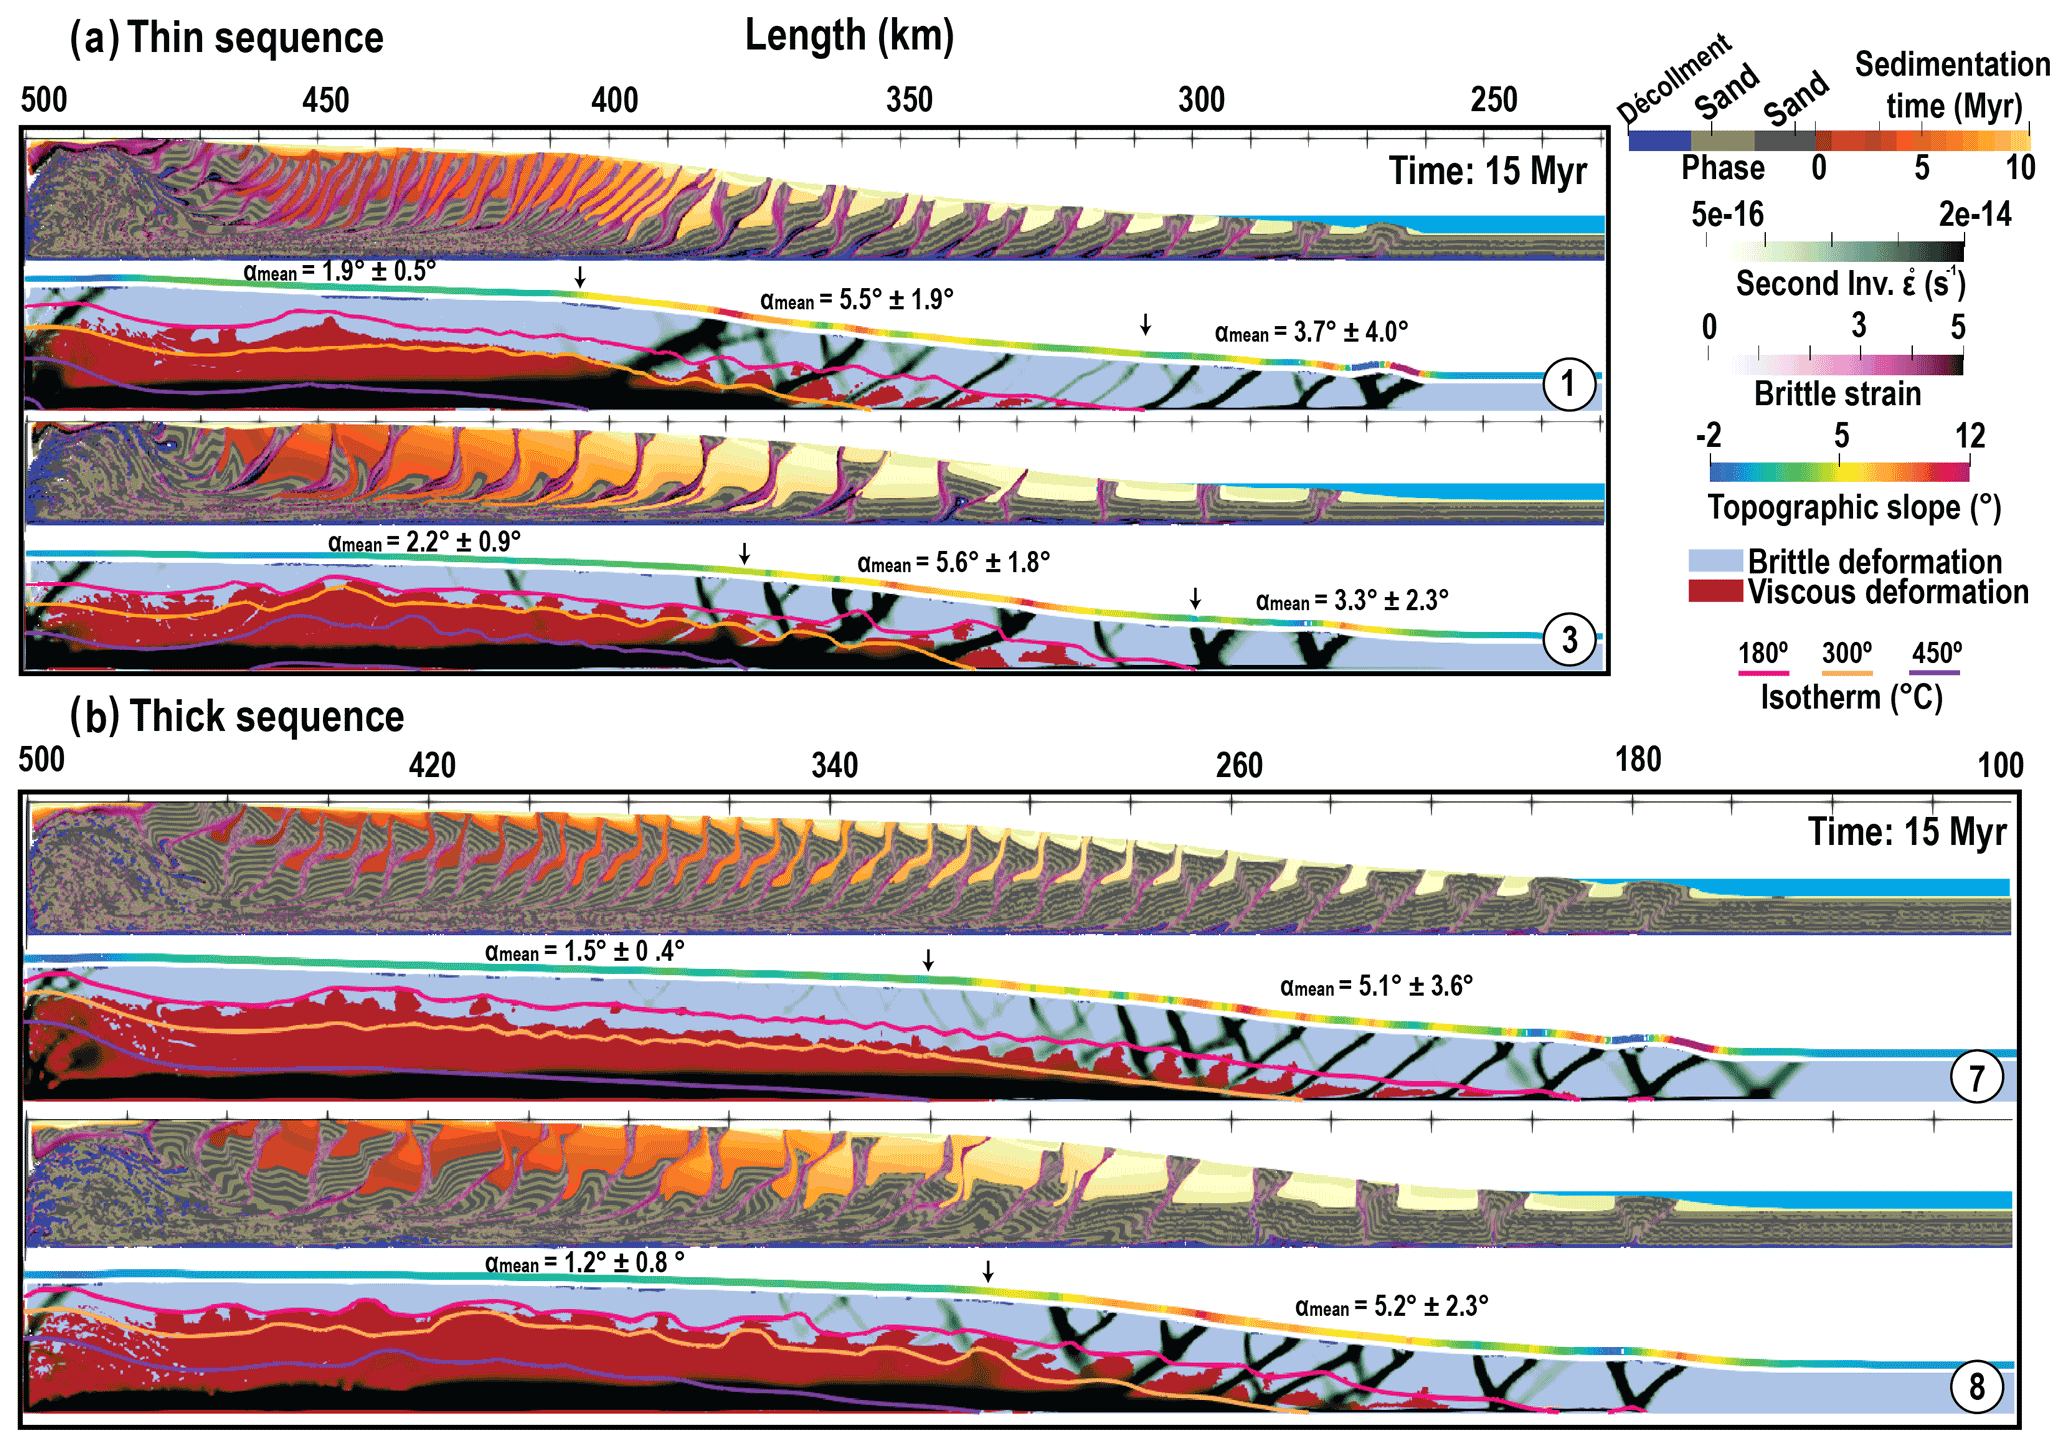
Figure 4Models with shear heating on after 15 Myr of shortening. (a) Thin and (b) thick sequence pile models. M1, M3 and M7, M8 are the same experiment with normal and high surface diffusion rates, respectively. Experiment parameters are given in Tables 1 and 2, and color code for markers is given in Fig. 2, 1 : 1 scale.
3.3 Sensitivity to shear heating, erosion, and thickness of incoming sediments
Depending on the chosen thermal parameters, the three segments described above are more or less developed in our simulations. A major player in the development of the ductile flat part of the wedge associated with high-grade metamorphic rock exhumation and formation of a forearc basin is the occurrence of shear heating.
Shear heating might be largely reduced by several factors and noteworthy enough the presence of water which reduces the ductile strength of the material or by thermal pressurization during earthquakes (Sibson, 1973; Lachenbruch and Sass, 1980; Mase and Smith, 1984, 1987; Segall and Rice, 2006). Gao and Wang (2014) actually showed that megathrusts that produce great earthquakes tend to dissipate less heat than megathrusts that slip mainly by creep. Hence, our shear heating models give a maximum bound for the heat that could be produced in the system. In order to study the other bound, we run some model with shear heating off which would correspond to a system where most slip is accommodated by earthquakes.
Results are clear; all models with shear heating (Fig. 4) develop a large flat area because the shear at depth helps the temperature to rise above the 450 ∘C isotherm, which correlates with the formation of the topographic plateau where high-grade metamorphic rocks are exhumed. Models with no shear heating hardly develop a plateau and a normal fault to exhume high-grade material at the back (Fig. 5).
Actually, exhumation is reached under two conditions in our models, with large erosion coefficients, i.e., M4 and M6, and in presence of shear heating. The peak metamorphic temperature of rocks exhumed at the backstop is compatible with thermochronometry studies in stationary accretionary prism like Taiwan (Suppe, 1981; Willett and Brandon, 2002). Its samples are exhumed to the surface by rock uplift to compensate for the mass lost via erosion (Fuller et al., 2006) and they have experienced temperatures in excess of 300–365 ∘C but below 440 ∘C (e.g., Lo and Onstott, 1995; Fuller et al., 2006).

Figure 5Models with no shear heating after 15 Myr of shortening for (a) thin and (b) thick sequence pile models. Normal sedimentation rate use in M2 and M5, and high erosion rate in M4 and M6. Refer to Fig. 2 for color codes and Tables 1 and 2 for experiment parameters, 1 : 1 scale.
Models with larger sedimentation rate (models M3, M4, M6, M8, M10, M12) produce, as expected from former studies (Storti and McClay, 1995; Simpson et al., 2010), a smaller number of thrusts and a larger spacing between them. Erosion and sedimentation also participate at reducing the slope at every step, thus favoring out-of-sequence activity (Fig. 5 M2 from x=260 to 380 km and M4 from x=290 to 320 km). In our models, sediments also affect the thermal regime because they are attributed a lower thermal diffusivity; thick sediment sequences act therefore as a blanket isolating the heat flux coming from below. As a result, temperature rises faster at depth when a large sedimentary basin forms. This explains why, in absence of shear heating (Fig. 5), only models with large sedimentation rate develop a ductile flat at the back (Fig. 5 M4 and M6).
Thermal blanketing also affects the geotherm at a smaller scale as shown by the distinctive wiggles in the isotherms. For small basins, these wiggles are limited to the 180 ∘C isotherm (Fig. 5 M2 and M5), but for large basins the 300 ∘C isotherm is affected at larger wavelength and potentially feeds back on the rheology (Fig. 5 M4 and M6).
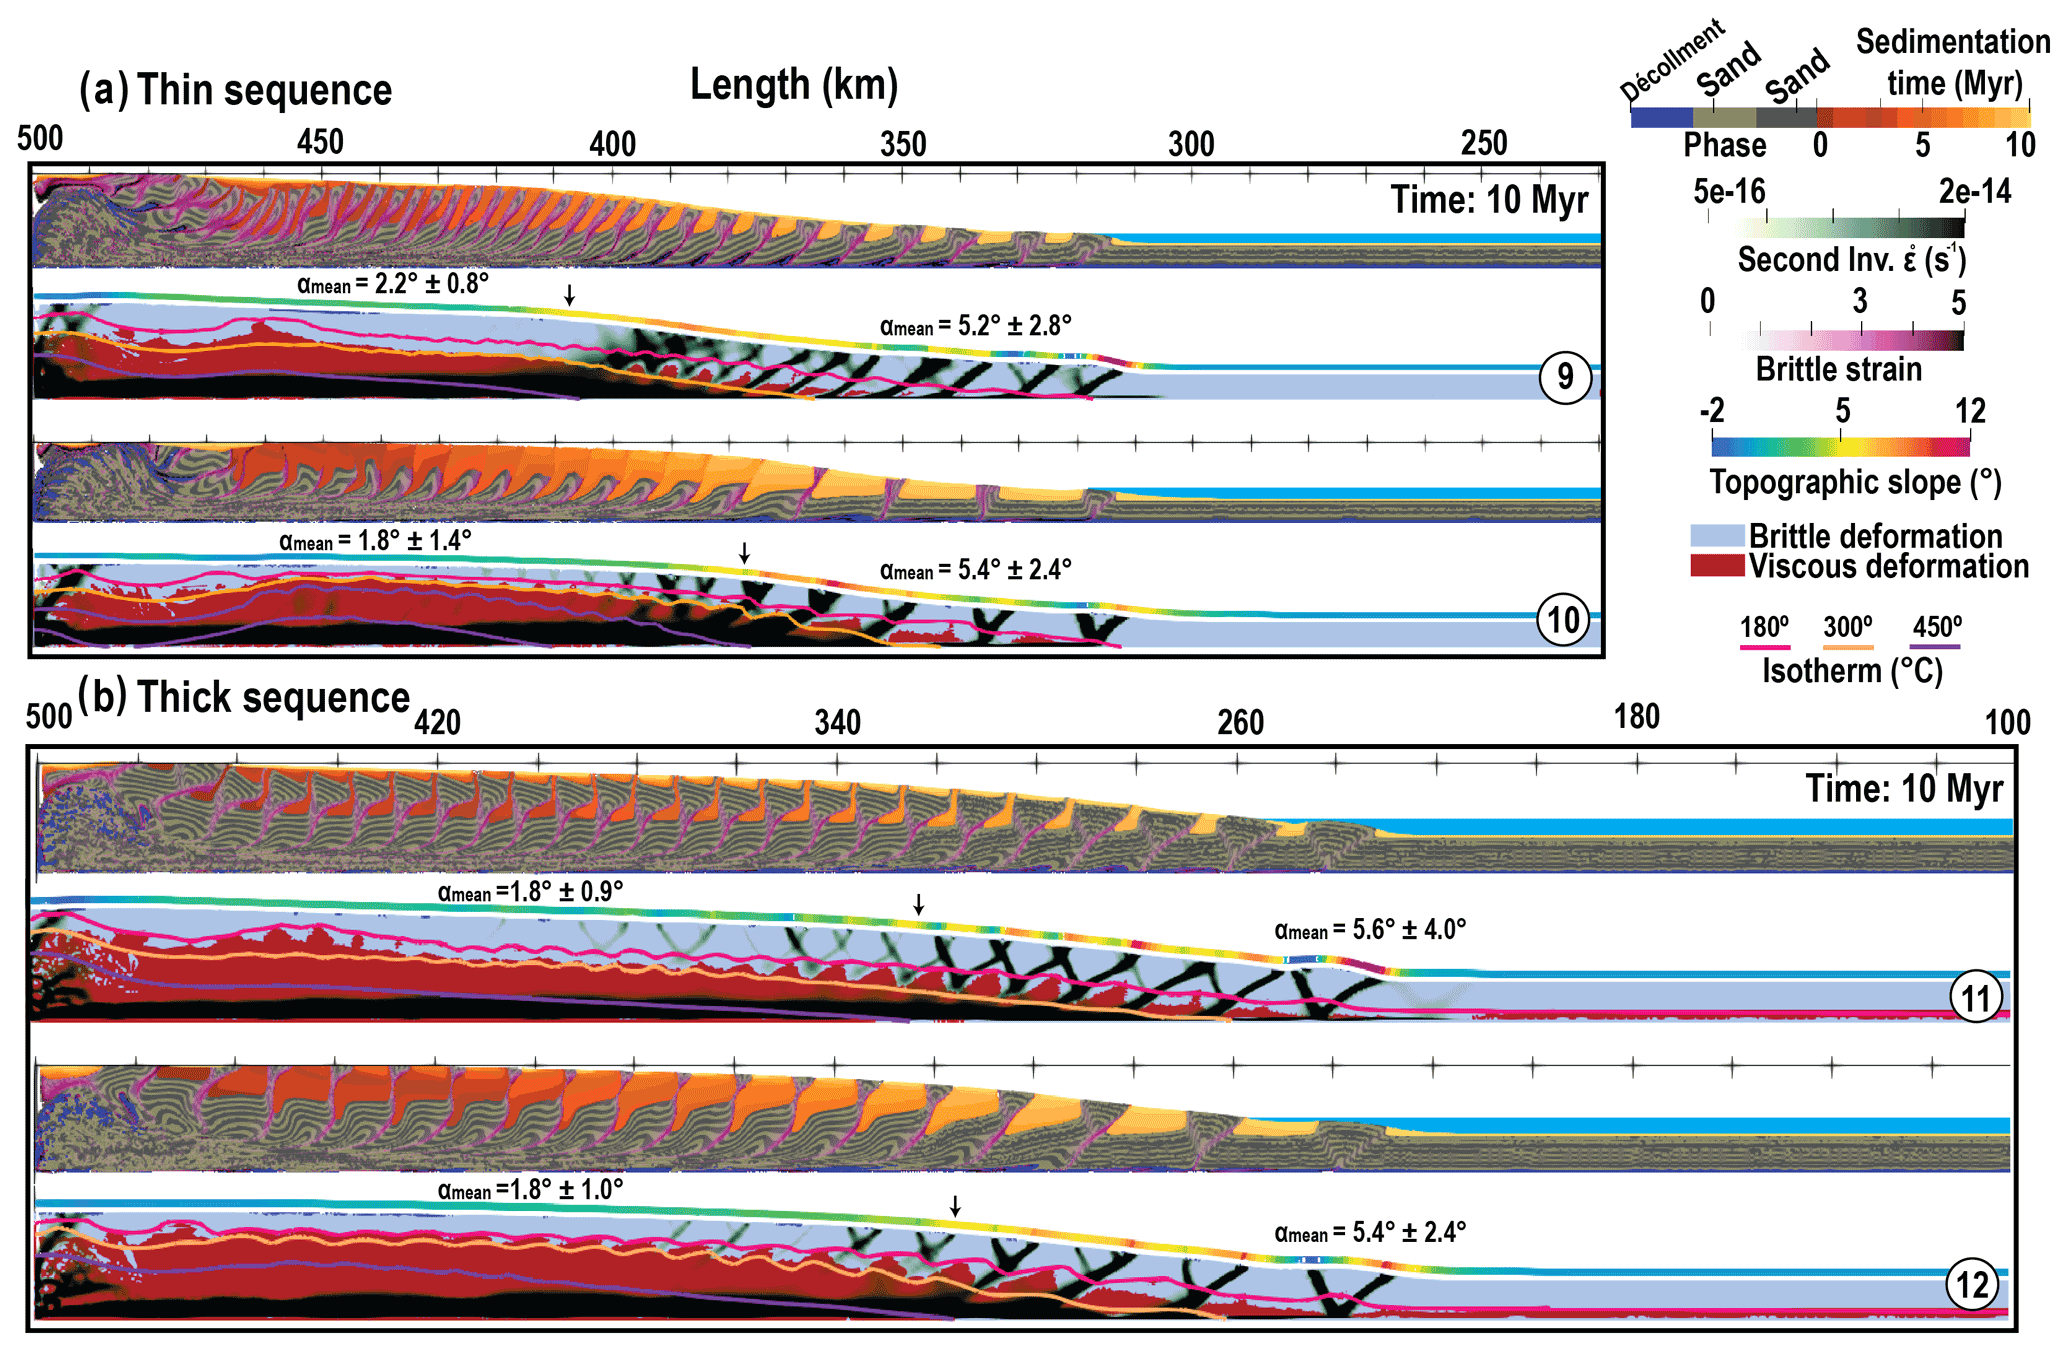
Figure 6High temperature gradient (25 ∘C km−1) after 10 Myr for (a) thin sequence and (b) thick sequence. M9 and M11 are with normal erosion and sedimentation rate whereas M10 and M12 indicate high sedimentation rate. Color codes and experiment parameters are given in Fig. 2 and Tables 1 and 2, 1 : 1 scale.
In absence of heat production and large vertical advective terms, the temperature is more or less proportional to the depth and thermal gradient in the models. Therefore, in experiments with thick sequences (M5 and M6 in Fig. 5 and M7 and M8 in Fig. 4) or in models with larger imposed basal gradient (M9, M10, M11, M12 in Fig. 6), the brittle–ductile transition is reached earlier. As a result, the completely brittle part of the accretionary prism, located at the toe of the wedge, is less developed in models with a larger pile of incoming sediments and in models with a larger thermal gradient. The local slope in these models is always larger than the CTT-predicted one and backthrust appear earlier in the history of deformation.
3.4 Effect of dehydration reactions
We now report some models which intend to tackle the effect of fluid over pressure due to dehydration of shale materials which potentially corresponds to smectite–illite transition. In clay-rich accretionary complexes, this transition appears at ∼ 2.5–5 km depth corresponding approximately to 100–150 ∘C (Pytte and Reynolds, 1988; Hyndman et al., 1995; Oleskevich et al., 1999). Smectite and illite clays are frictionally weak but illite is slightly stronger (Morrow et al., 1982; Saffer and Marone, 2003). We therefore consider that our clay-rich décollement is initially smectite rich with an internal friction angle of 5∘. Once dehydration reaction is terminated the same décollement is considered illite rich and affected a friction angle of 10∘. We do not have a kinetic reaction included in the code but we assume that the reaction is occurring at fast rate in the 120–140 ∘C window. This is slightly smaller than the 100–150 ∘C reported in the literature and it is aimed at roughly accounting for a slow kinetic at lower temperatures and the lack of reactant (smectite) left at higher temperatures. During this phase of fast reaction, fluids are released in the clay-rich décollement of low permeability permitting to build strong local fluid over pressure (Bekins et al., 1994; Lanson et al., 2009). The code does not explicitly include fluids, but these overpressures are reflected by an effective friction angle of 0.1∘ within the reaction temperature window. The evolution of friction with temperature in the décollement layer is reported in Fig. 7.
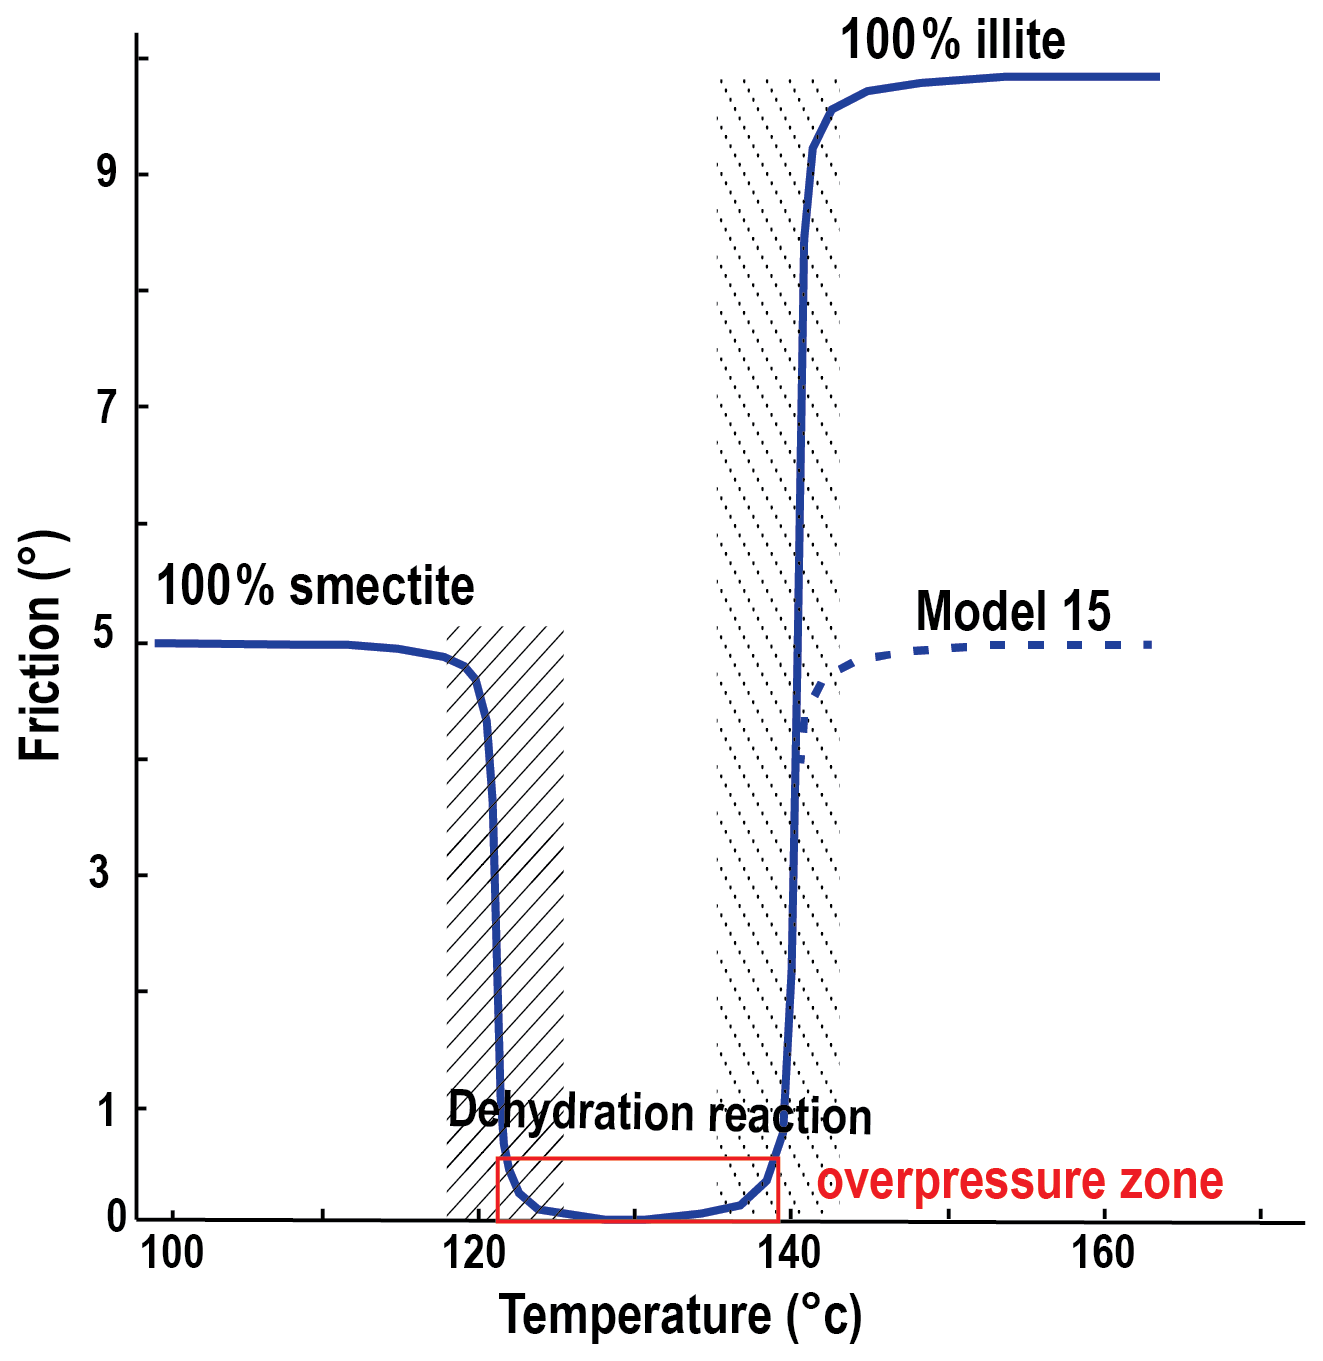
Figure 7Evolution of friction with temperature with our parameterization of smectite–illite transition. The dashed line is for the evolution of friction in simulation M15 which serves as comparison with M1 at the brittle–ductile transition zone.
Figure 8 shows the structural evolution of simulation M14, identical to the reference model M1 but accounting for the smectite–illite transition.
After 1 Ma, by the formation of conjugate shear bands, the wedge tries to reach its critical state in accordance with basal friction of ϕb=5∘. Since the base quickly reaches 120 ∘C, the frontal wedge is extremely narrow and followed by a flat area induced by the drop of friction (ϕb=0.1∘), as expected from CTT.
At 3.8 Ma, the flat area is highly extended (x = 380–470 km). The onset of this transition serves as the root to a shallow splay fault accompanied by a backthrust.
At 6.3 Ma, as the shortening goes on, the temperature rises due to burial. Once the décollement reaches 140 ∘C, the basal friction increases to 10∘, leading to the onset of a larger topographic slope. Once the décollement reaches 180 ∘C, some patches of viscous deformation appear in between active thrusts (at x=440 km). As observed in model M1, a segment of the high topographic slope, formed by a low-angle thrust and its backthrusts, separates the flat segment from the warmer distributed part of the wedge.
At 10 Ma, the wedge is characterized by four distinct segments: a narrow frontal critical taper, a weakly deformed zone with a flat topographic slope associated with the smectite–illite transition (120 to 140 ∘C), a high topographic slope corresponding to the brittle–ductile transition formed by a low-angle thrust and its backthrusts rooting on the ductile décollement, and, finally, a second flat segment corresponding to the ductile wedge once the décollement reaches a temperature of 450 ∘C. The brittle–ductile transition segment shows a larger topographic slope than the reference model M1 (Fig. 3), because of the higher basal friction reached once the dehydration reaction finishes (ϕb=10∘). From 10 to 15 Ma, the warm and flat part of the ductile wedge grows in length like in model M1.
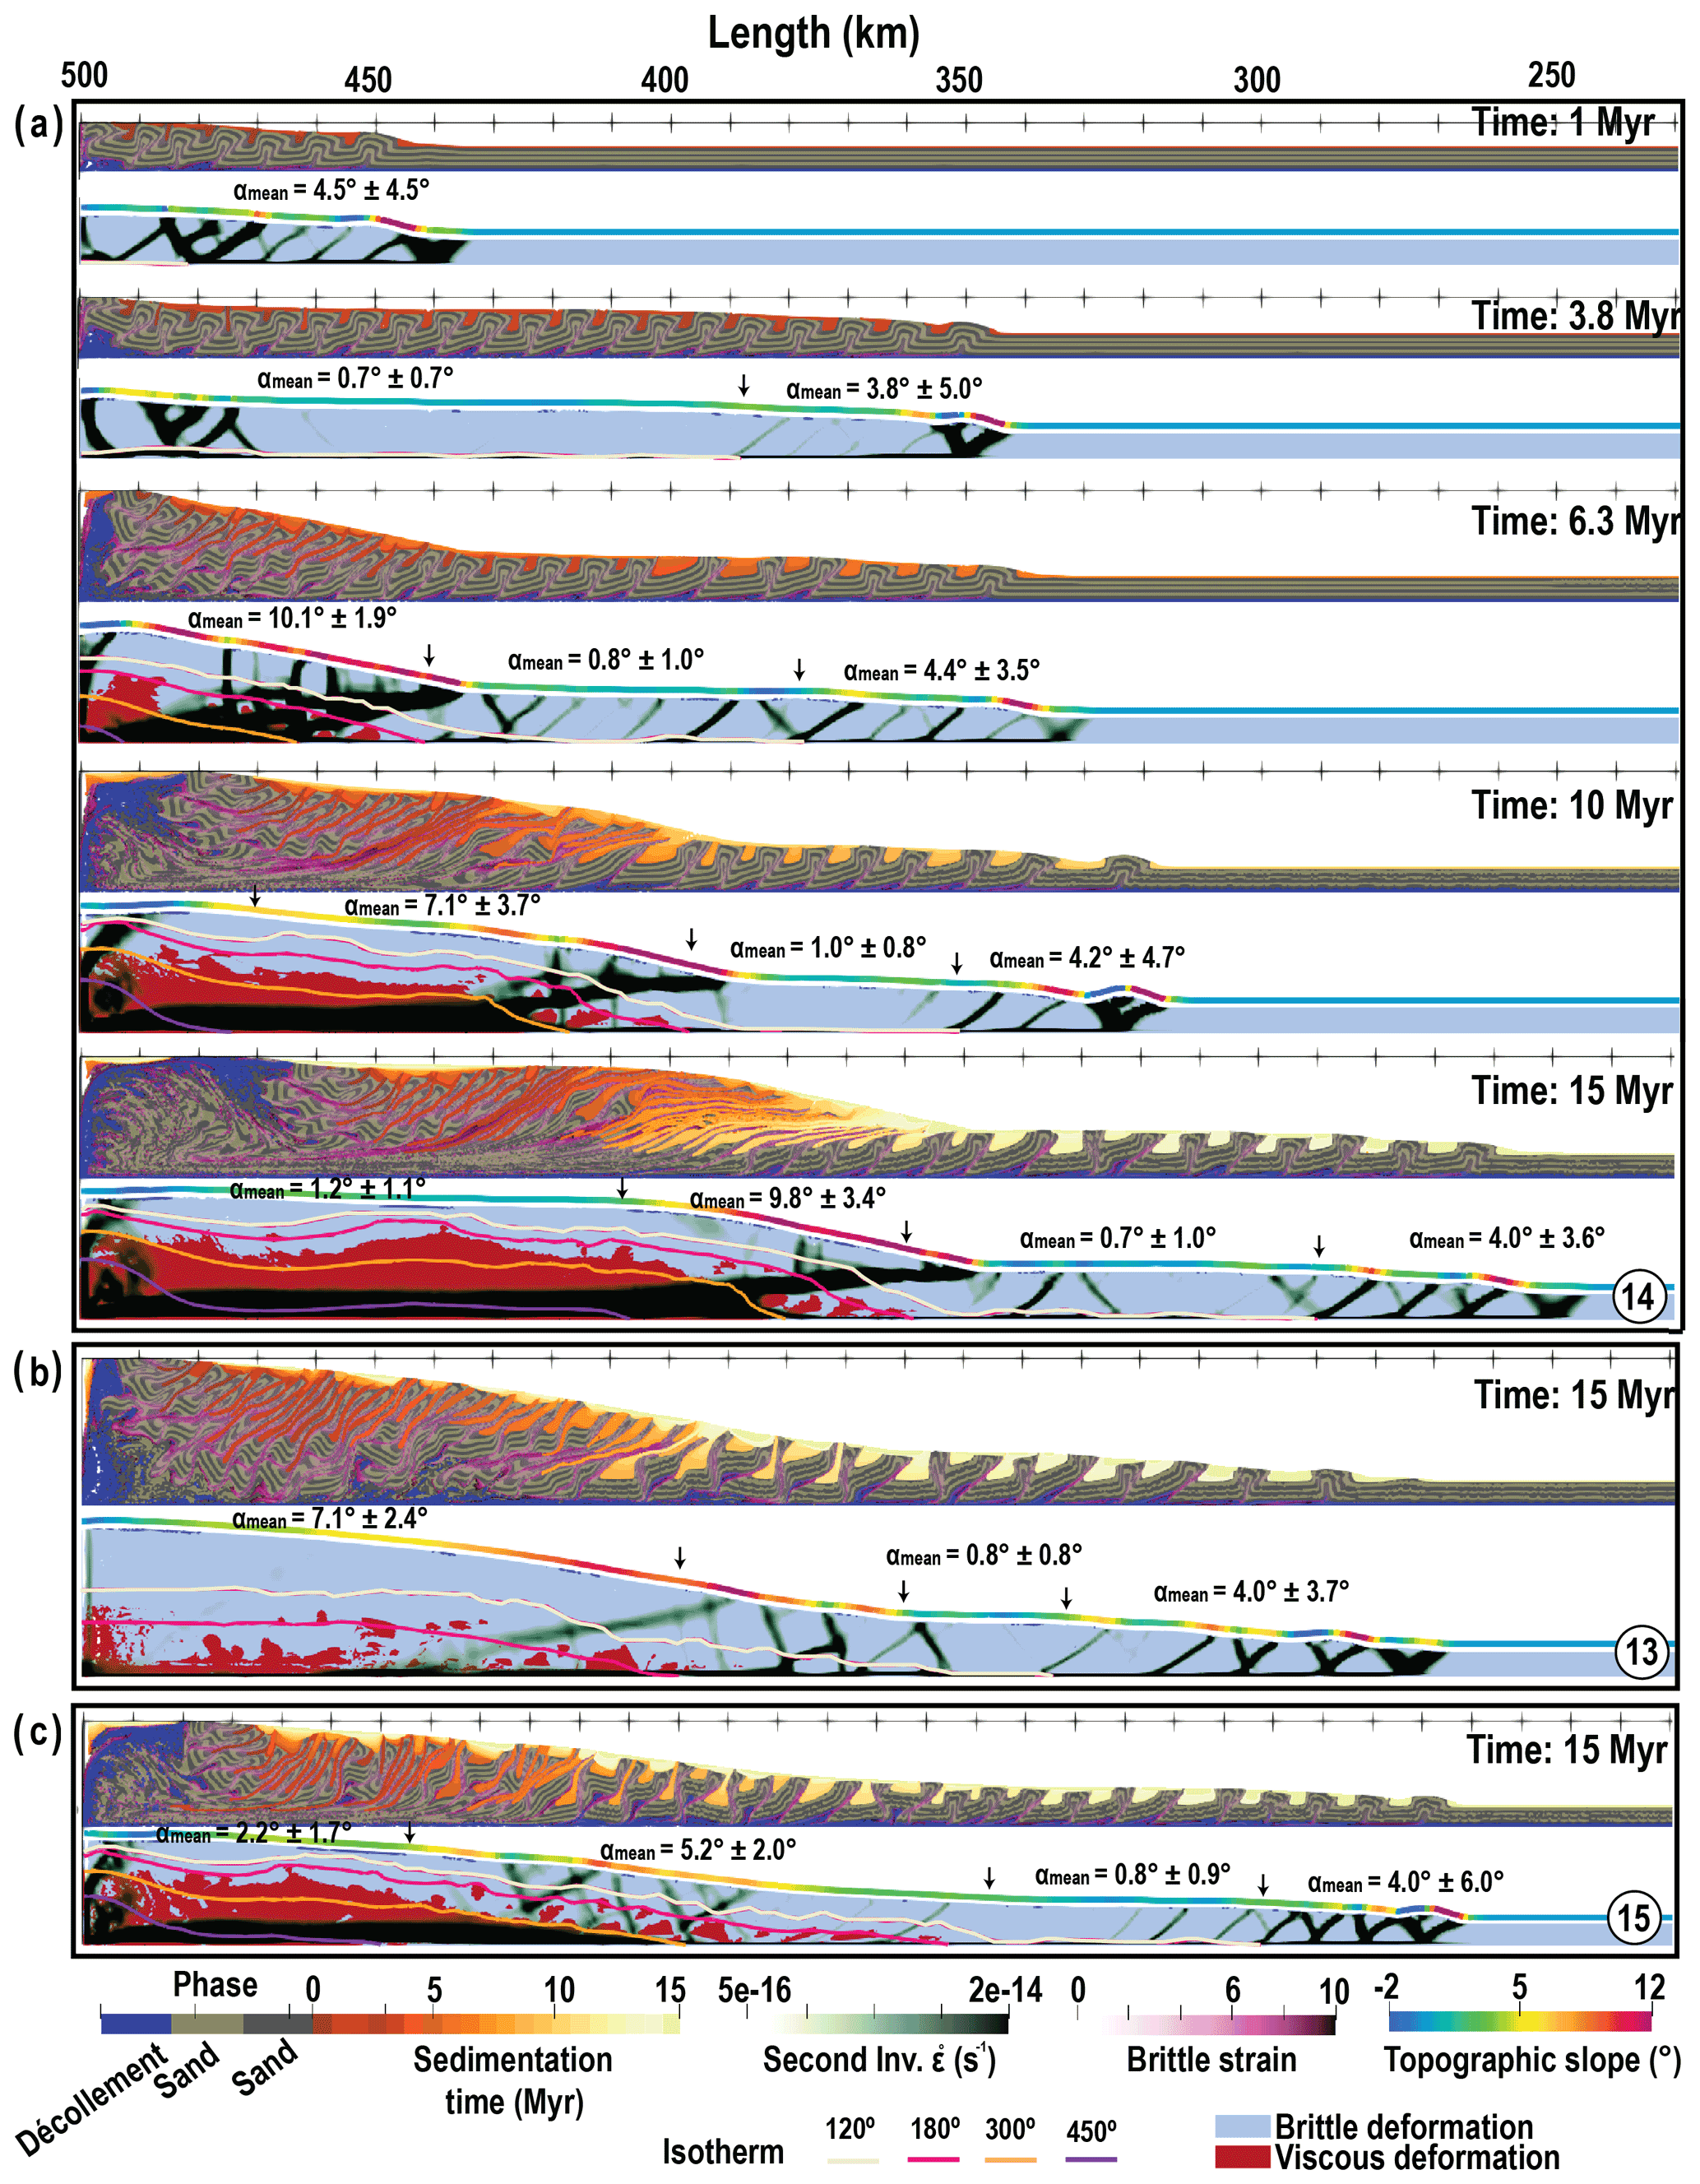
Figure 8(a) 15 Myr of time evolution of simulation M14 with dehydration reaction and shear heating. (b) Model at 15 Ma for similar simulation without shear heating M13. (c) Model at 15 Ma for similar simulation M15 with 5∘ friction instead of 10∘ friction after the end of dehydration reaction, 1 : 1 scale.
Figure 8b illustrates that shear heating tends to increase the extent of the flat dehydration segment by reducing both the size of the critical taper corresponding to the smectite décollement located at the toe of the wedge and the lateral extent of the steep segment located at the brittle–ductile transition. Figure 8c demonstrates that the increase of slope of the brittle–ductile segment in model M14 as compared to model M1 is indeed related to the increase in basal friction up to 10∘ after the dehydration reaction. As described above, without shear heating, the flat plateau above the viscous décollement hardly develops.
4.1 Slopes and modes of deformation
The thermomechanical model provides an opportunity to investigate the specific variations of topographic slope of an accretionary prism, supported by the CTT analysis (Davis et al., 1983). Our results show that very simple models of accretionary prism lead to the formation of four different structural zones which corresponds to three different type phases of deformation related to transitions in the rheology.
The frontal brittle part of the wedge is characterized by an imbricated zone and active in-sequence thrusts faults ahead. The décollement and the above sequence behave plastically (Fig. 9a). The topographic slope created in this section is controlled by the basal and average internal friction and is consistent with the CTT predictions (Fig. 9b and c, blue star).
The presence of a smectite–illite transition (dehydration reaction) leads to a segment characterized by a flat topographic slope and little internal deformation, in between the frontal brittle wedge and the brittle–ductile transition (Fig. 9a). This flat segment appears during the early stage of the accretionary prism formation.
The brittle–viscous transition zone is characterized by out-of-sequence thrusts and backthrusts with high internal deformation (Fig. 9a). This part forms a steeper topography slope than the brittle-only part. A careful examination of the behavior of this segment reveals that the décollement remains brittle, but the above sequence has entered the viscous phase (Fig. 9a). By plotting the surface slope on the critical taper diagram, we notice that this part is consistent with a critical taper of a lower internal friction angle (Fig. 9b, red star).
The viscous part presents an approximate flat zone without effective internal deformation. Décollement and above sequence deform viscously. The topographic slope is again consistent with the critical taper theory, considering that a viscous décollement is equivalent to a brittle décollement of extremely low friction. Therefore, the increase of the topographic slope between the brittle and viscous segments results from an equivalent decrease of internal friction rather than an increase of basal friction. Since we run simulations with basal slope β=0, according to CTT the simulated topographic slope might be overestimated compared with natural examples. We thus run the reference simulation with a basal slope of 2∘. We found the same segmentation but with slightly lower topographic slopes as expected from the CTT (Movie M16, please see Sect. “Video supplement” for further information).
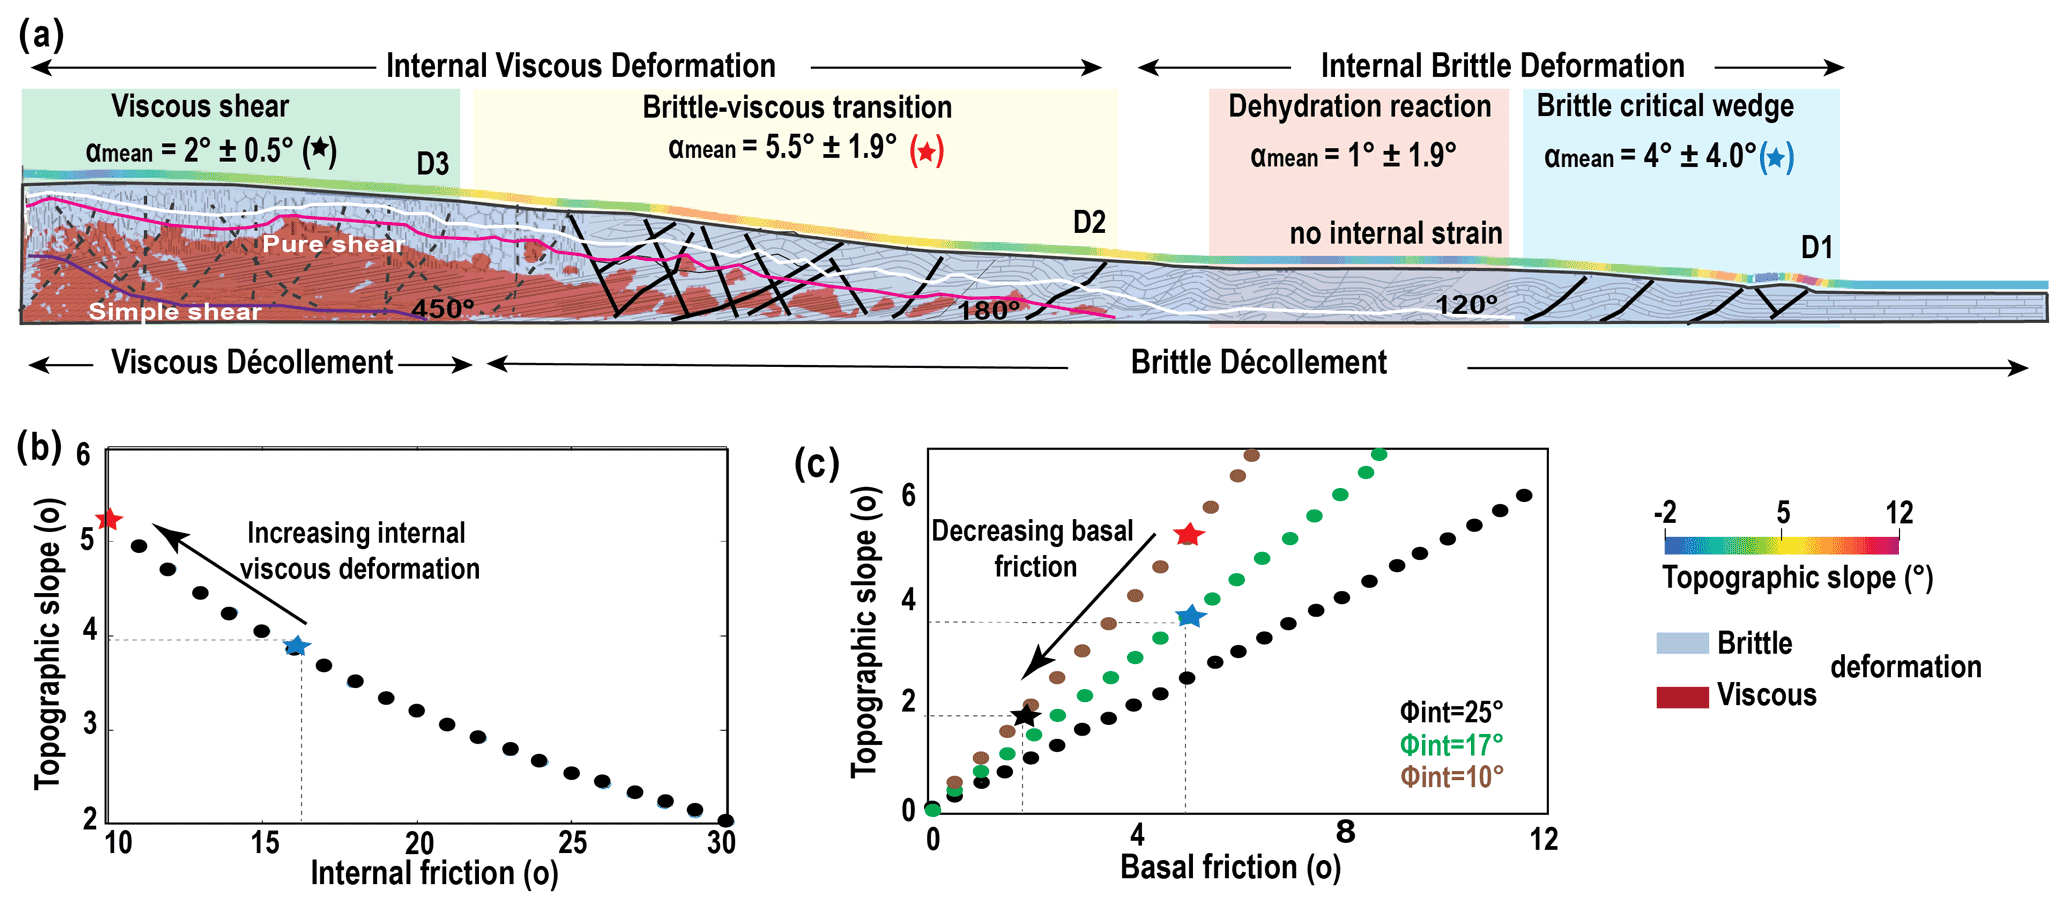
Figure 9(a) Proposed model for the mature brittle–ductile wedge which forms three distinct segments; pure brittle wedge with a rather constant slope predicted by the CTT at the front (blue star), low but non-zero topographic slope close to the backstop corresponds to viscous deformation (black star), and larger topographic slope in between these segments as a result of the brittle–ductile transition (red star and yellow rectangle). (b) Topographic slope versus internal friction for ϕbasal=5∘. (c) Basal friction versus topographic slope for ϕint of 10, 17, and 25∘.
4.2 Comparison with exhumed accretionary prism
Based on the models, we can interpret that the rocks exhumed at the back of the models have been through three main phases of deformation through time. The first phase (D1) is purely brittle and corresponds to the onset of accretion at the toe of the accretionary prism. The passive transport through the dehydration flat segment does not cause important deformation. The D1 is therefore overprinted by the phase D2, which is the start of a low grade metamorphic foliation as a result of penetrative horizontal shortening. As temperature increases with burial, material behavior in between faults which deforms with lower strain rates changes from brittle to ductile decreasing the effective friction coefficient of the bulk. This in turns causes the steepening of the slope which favors the activation of brittle backthrusts, that scrap off the frontal wedge rather than forethrusts that would have to uplift a lot of material. In an accretionary prism with large basal heat flow, or thick incoming sediments, sequence D2 appears closer to the toe of the prism and might replace D1. Warmer models then develop a phase in which deformation is partitioned between ductile simple shear at depth (D3) and distributed shortening at the surface (more penetrative version of D2). Once the horizontal ductile shear zone corresponding to D3 has formed, it branches on a shallow dipping splay fault accompanied by a vertical backthrust. The three phases of deformation recorded by the rocks exhumed at the back of the models along a normal fault correspond to the different phases recorded in exhumed accretionary prism like the Shimanto belt (Raimbourg et al., 2014), although this paper would classify our D1 and D2 as more or less localized deformation related to frontal accretion and in our case the high-grade ductile foliation D3 would show a more marked asymmetry. In the Lesser Antilles arc, Verati et al. (2018) have documented distributed deformation by pressure solution occurring at 300 ∘C/4–5 km depth conditions, in volcanics reworked within the brittle accretionary prism which could correspond to exhumed remnants of D2, although our models are too simplistic to account for incorporation of arc material into the tectonic wedge.
4.3 Forearc basins
Every phase of deformation is accompanied by different types of sedimentary basins. Indeed, while phase D1 is accompanied by piggyback basins which length depends on the sedimentation rate (e.g., Fig. 4), D2 is accompanied with the formation of trench slope basins discordant on the early piggyback basins, and the onset of D3 pinpoints the start of activity of the splay fault and its backthrust. These structures isolate the ductile part of the prism, where forearc sediments can accumulate within small basins in discordance on the sediments accreted during D1 and D2, from the brittle part of the prism. The splay fault and its conjugate high-angle backthrust serve as a current backstop for the brittle part before being incorporated into the ductile forearc part of the prism as accretion continues.
Backthrusting between the imbricated segment and forearc basins has been described along various accretionary margins of high sedimentation rate (Silver and Reed, 1988). Along the Sumatra subduction zone, well known for its high sedimentation rate and high thermal gradient (Chlieh et al., 2008), the slope break predicted by our model is visible on seismic images of northern (Chauhan et al., 2009) and southwestern (Singh et al., 2010) Sumatra, and a clear backthrust has been imaged down to 7 s (TWT) (15 km) (Chauhan et al., 2009). Backthrusts have also been imaged along the Antilles subduction zone, in particular along the Barbados region, again known for its high sedimentation rate (Silver and Reed, 1988; Laigle et al., 2013). A backthrust is also well documented in New Zealand (Barnes and Nicol, 2004) but has been interpreted as resulting from a change in basal friction. Noda (2016) reviews a number of other compressive accretionary margins which all seem to develop an active backthrust at the edge of the forearc basin like in our models.
However, most of these seismic studies place the splay fault and its backthrust at the limit of the continental crust which posits, in a way, a stable position through time, at least relative to the upper plate. In our simulations, the splay fault roots at the location of the 450 ∘C isotherm along the décollement (Fig. 10a). This isotherm at 15 km depth corresponds to greenschist facies metamorphic conditions. Using typical sediments composition, perplex software yields typical continental crust seismic attributes with km s−1 and Vs∼2.5 km s−1. With volcanoclastic sediments, larger velocities are expected for similar metamorphic conditions. As a result, seismic refraction investigation of active margin would definitely identify this part of the models as a continental crust or former arc crust. Using the location of the splay fault in warm, compressional accretionary contexts like South Sumatra (Fig. 10b) and Lesser Antilles (Fig. 10c), we propose that what is typically interpreted as attenuated continental or arc crust with Vp>=5 could also well mark the location of the brittle–ductile transition According to our models, along with accretionary prisms of little seismic activity, the forearc basin should correlate with the fully viscous domain at least along high sedimentation rate and high thermal gradient compressive accretionary margins (Fig. 9a).
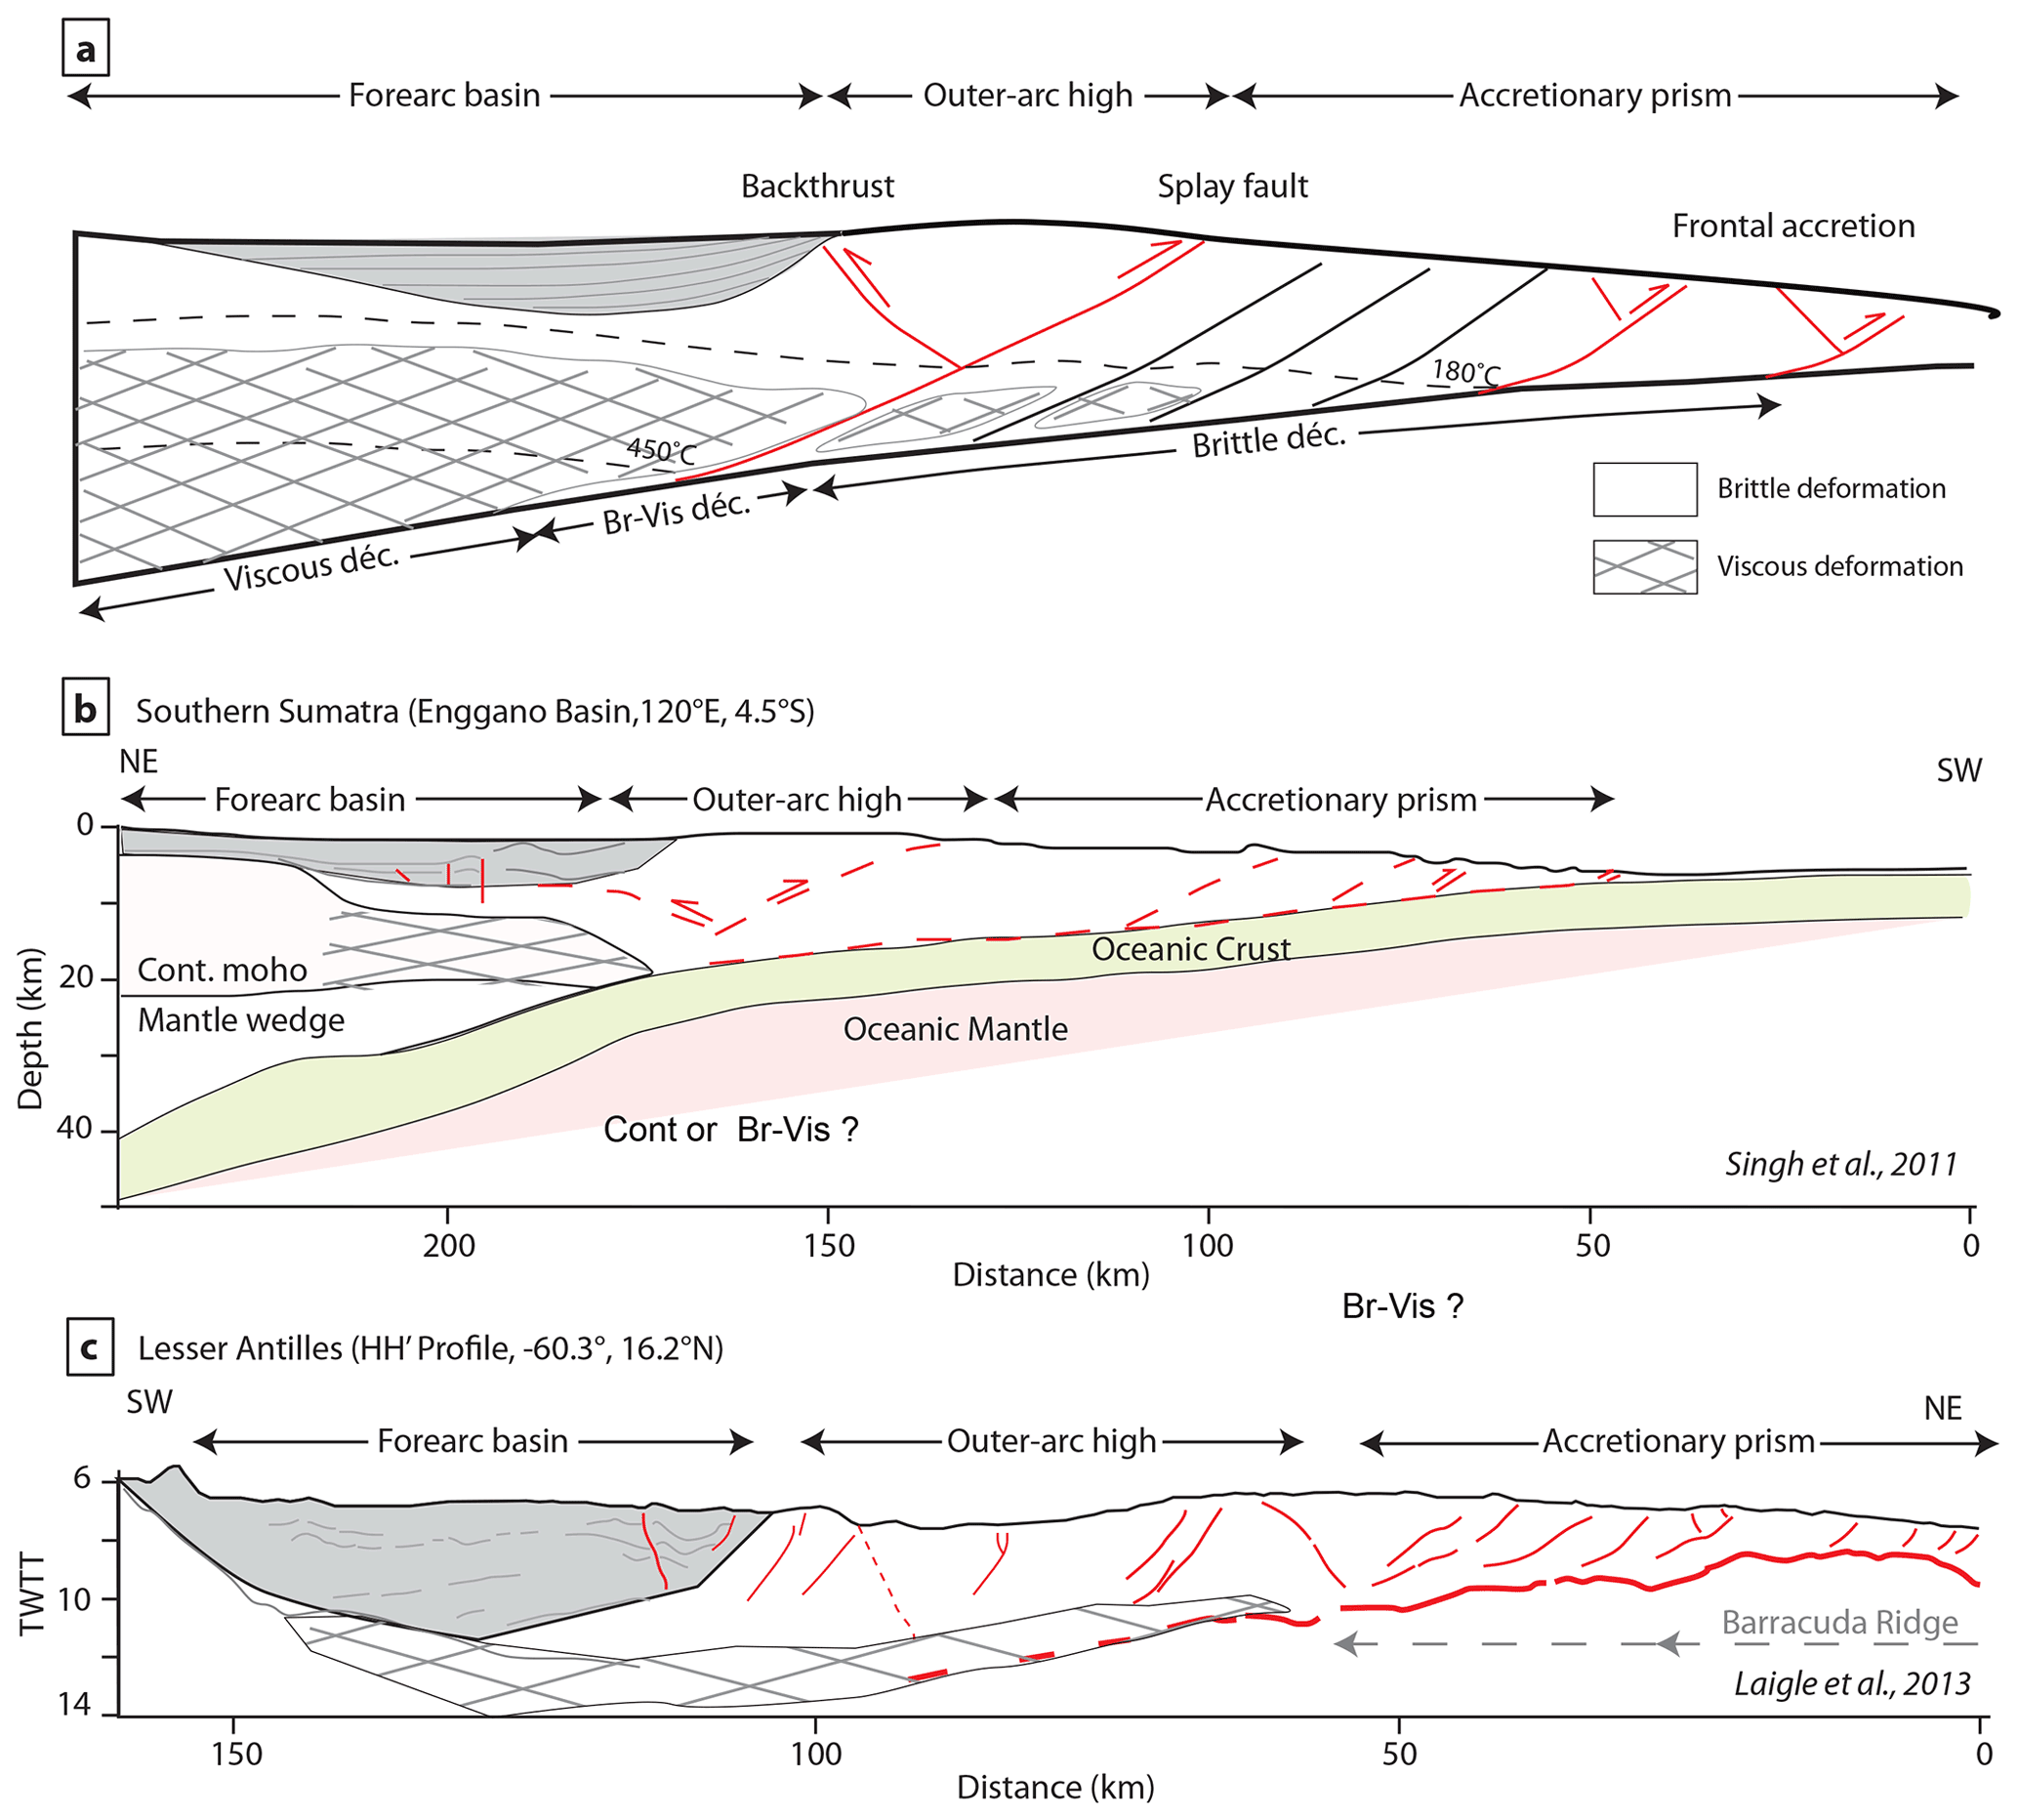
Figure 10(a) Structure of accretionary wedge and forearc basin modified from Noda (2016) based on our modeling results for the geometry of isotherms and the distribution of brittle and viscous strain. Schematic cross sections of (b) South Sumatra based on Singh et al. (2011). (c) Lesser Antilles based on Laigle et al. (2013) with indication of the possible location of the brittle–ductile transition based on our model and the observed geometry of faults.
4.4 Up- and down-dip end of the seismogenic zone
We here confirm that the smectite–illite transition produces a flat segment that can explain, for young or cold accretionary complexes, the observed correlation between deep-sea terraces or forearc basins with large subduction earthquakes (Song and Simons, 2003; Wells et al., 2003). In such specific contexts, the flat segment would thus underline the up-dip limit of the seismogenic zone (part of the megathrust geodetically coupled, i.e., locked during the interseismic period). Along seismically active accretionary prisms, an increase of topographic slope and decrease in apparent geodetic coupling are interpreted as the down-dip limit of the seismogenic zone (Cubas et al., 2013). In the first case, the rise in topographic slope indicates an increase of effective basal friction which corresponds to the down-dip end of dominant seismic slip (Cubas et al., 2013; Pajang et al., 2021a). In the second case, geodetic deformation at velocities that differs from subducting plate velocities is generally interpreted as a lack of coupling on the plate interface based on elastic models (Perfettini et al., 2010; Chlieh et al., 2008). Here, we show that the brittle–ductile transition corresponds to the onset of internal distributed viscous deformation in between brittle structures in the accretionary prism above a brittle décollement. Internal deformation causes a decreased geodetic coupling and an increased apparent basal friction but does not imply any modification in the interface frictional properties or deformation mode. This questions both the search for field analogs of the down-dip end of the seismogenic zone and the interpretation of seismic coupling in terms of locked/creeping décollement.
4.5 Limitations and perspectives
Our simple models permit us to understand first-order mechanisms in forearc formation, but improvements are still needed to better understand how the brittle–ductile transition affects the formation of splay faults providing an alternative model to the formation of forearc basins as well as an alternative origin for the forearc crust. We find that the drop in friction between the ductile and brittle part of the accretionary prism and smectite to illite dehydration reaction is not sufficient to explain the normal faults observed along some accretionary margins like Chile or Makran Cubas et al. (2013); Pajang et al. (2021a). This result leads us to conclude that the normal faults arise from phenomena we neglected in our simplified approach. This includes
-
the effect of heterogeneities in the subducting plate,
-
the effect of elastic deformation during the seismic cycle, and/or
-
the oversimplification of the bottom boundary conditions which does not allow an increase in taper angle with burial like in Beaumont et al. (1992) and Ruh (2020).
We plan on testing these other hypotheses in the future and posit that improving the bottom mechanical boundary conditions will also permit performing more accurate simulations of the sedimentation in the forearc basins by keeping them below sea level.
Despite the simplicity and limitations of our simulations, their results are sufficient to propose a new model for the interpretation of changes in topographic slope at compressive accretionary margins, at least, warm margins with large sedimentary supply. Using only the topographic gradient, our model distinguished four segments, which correspond to three modes of deformations observed in exhumed accretionary complexes:
-
brittle décollement and internal deformation at the toe where the topographic slope respects the CTT;
-
a flat area with little internal deformation in young accretionary prisms, if a dehydration reaction is considered;
-
brittle décollement and viscous internal deformation of fault-bounded blocks, where the topographic slope is in excess compared to the CTT and these large slopes should not be interpreted as the down-dip limit of the seismogenic zone;
-
viscous décollement and backthrust-bounded blocks in the most internal part where the topographic slope is close to zero.
The most important finding is that the onset of internal viscous deformation in fault-bounded blocks increases the topographic slope of the accretionary complex independently of the basal friction.
Comparing the simulations results with natural cases, we show that this anomalous topography related to the brittle–ductile transition is analogue to the forearc high in a compressional accretionary prism. It is indeed the location of an active backthrust and splay fault system rooting on the viscous channel that forms in the internal part where the basal temperature reaches 450 ∘C. The location of this viscous channel, which is active in greenschist facies conditions, corresponds to portions of seismic sections that are often interpreted as an attenuated continental crust or former arc crust. Our model provides, we believe, a valid alternative interpretation which has the advantage to explain why the forearc crust is always thinner than the continental crust on seismic sections but also why the warm subduction segments are representative of our mature stage simulation, such as South Sumatra or the Lesser Antilles are considered aseismic.
The version of pTatin2d and the input files used in this contribution are archived following the FAIR principle at https://doi.org/10.5281/zenodo.4911354 (May and Le Pourhiet, 2021). Input files are located in published_inputs/Pajang2021_SE.
Data are available at https://zenodo.org/record/4911354/preview/ptatin2d.zip#tree_item354 (May and Le Pourhiet, 2021).
All simulations are available as movies archived at https://doi.org/10.5281/zenodo.5599365 (Pajang et al., 2021b).
SP designed the simulation, ran the simulation prepared the figure and wrote the paper, LLP implemented the heat flow boundary condition, LLP and NC participated in the interpretation of the simulation, application to natural cases and writing of the paper.
The contact author has declared that neither they nor their co-authors have any competing interests.
Publisher’s note: Copernicus Publications remains neutral with regard to jurisdictional claims in published maps and institutional affiliations.
The authors thank Tiphaine Larvet for computing seismic velocity with PerpleX.
This research has been supported by the Centre National de la Recherche Scientifique (IRN trigger).
This paper was edited by Patrice Rey and reviewed by Guillaume Duclaux and one anonymous referee.
Barnes, P. M. and Nicol, A.: Formation of an active thrust triangle zone associated with structural inversion in a subduction setting, eastern New Zealand, Tectonics, 23, TC1015, https://doi.org/10.1029/2002TC001449, 2004. a
Beaumont, C., Fullsack, P., and Hamilton, J.: Erosional control of active compressional orogens, in: Thrust tectonics, edited by: McClay, K. R., 1–18, Chapman and Hall, New York, Springer, Dordrecht, https://doi.org/10.1007/978-94-011-3066-0_1, 1992. a
Bekins, B., McCaffrey, A. M., and Dreiss, S. J.: Influence of kinetics on the smectite to illite transition in the Barbados accretionary prism, J. Geophys. Res.-Sol. Ea., 99, 18147–18158, 1994. a, b
Bonnet, C., Malavieille, J., and Mosar, J.: Interactions between tectonics, erosion, and sedimentation during the recent evolution of the Alpine orogen: Analogue modeling insights, Tectonics, 26, TC6016, https://doi.org/10.1029/2006TC002048, 2007. a
Borderie, S., Graveleau, F., Witt, C., and Vendeville, B. C.: Impact of an interbedded viscous décollement on the structural and kinematic coupling in fold-and-thrust belts: Insights from analogue modeling, Tectonophysics, 722, 118–137, 2018. a
Braun, J. and Yamato, P.: Structural evolution of a three-dimensional, finite-width crustal wedge, Tectonophysics, 484, 181–192, 2010. a
Buiter, S. J., Schreurs, G., Albertz, M., Gerya, T. V., Kaus, B., Landry, W., Le Pourhiet, L., Mishin, Y., Egholm, D. L., Cooke, M., Maillot B., Thieulot, C., Crook, T., May, D., Souloumiac, P., and Beaumont, C.: Benchmarking numerical models of brittle thrust wedges, J. Struct. Geol., 92, 140–177, 2016. a, b, c, d
Burbidge, D. R. and Braun, J.: Numerical models of the evolution of accretionary wedges and fold-and-thrust belts using the distinct-element method, Geophys. J. Int., 148, 542–561, 2002. a, b
Byerlee, J.: Friction of rocks, in: Rock friction and earthquake prediction, 615–626, Springer, 1978. a
Chauhan, A. P., Singh, S. C., Hananto, N. D., Carton, H., Klingelhoefer, F., Dessa, J.-X., Permana, H., White, N., Graindorge, D., and SumatraOBS Scientific Team: Seismic imaging of forearc backthrusts at northern Sumatra subduction zone, Geophys. J. Int., 179, 1772–1780, 2009. a, b
Chen, C.-T., Chan, Y.-C., Lo, C.-H., Malavieille, J., Lu, C.-Y., Tang, J.-T., and Lee, Y.-H.: Basal accretion, a major mechanism for mountain building in Taiwan revealed in rock thermal history, J. Asian Earth Sci., 152, 80–90, 2018. a
Chlieh, M., Avouac, J.-P., Sieh, K., Natawidjaja, D. H., and Galetzka, J.: Heterogeneous coupling of the Sumatran megathrust constrained by geodetic and paleogeodetic measurements, J. Geophys. Res.-Sol. Ea., 113, B05305, https://doi.org/10.1029/2007JB004981, 2008. a, b
Colletta, B., Letouzey, J., Pinedo, R., Ballard, J. F., and Balé, P.: Computerized X-ray tomography analysis of sandbox models: Examples of thin-skinned thrust systems, Geology, 19, 1063–1067, 1991. a
Costa, E. and Vendeville, B.: Experimental insights on the geometry and kinematics of fold-and-thrust belts above weak, viscous evaporitic décollement, J. Struct. Geol., 24, 1729–1739, 2002. a
Cubas, N., Leroy, Y., and Maillot, B.: Prediction of thrusting sequences in accretionary wedges, J. Geophys. Res.-Sol. Ea., 113, B12412, https://doi.org/10.1029/2008JB005717, 2008. a
Cubas, N., Avouac, J.-P., Souloumiac, P., and Leroy, Y.: Megathrust friction determined from mechanical analysis of the forearc in the Maule earthquake area, Earth Planet. Sc. Lett., 381, 92–103, 2013. a, b, c, d
Dahlen, F., Suppe, J., and Davis, D.: Mechanics of fold-and-thrust belts and accretionary wedges: Cohesive Coulomb theory, J. Geophys. Res.-Sol. Ea., 89, 10087–10101, 1984. a, b, c
Davis, D., Suppe, J., and Dahlen, F.: Mechanics of fold-and-thrust belts and accretionary wedges, J. Geophys. Res.-Sol. Ea., 88, 1153–1172, 1983. a, b, c, d
Fillon, C., Huismans, R. S., and van der Beek, P.: Syntectonic sedimentation effects on the growth of fold-and-thrust belts, Geology, 41, 83–86, 2013. a
Fuller, C., Willett, S., Fisher, D., and Lu, C.: A thermomechanical wedge model of Taiwan constrained by fission-track thermochronometry, Tectonophysics, 425, 1–24, 2006. a, b
Gao, X. and Wang, K.: Strength of stick-slip and creeping subduction megathrusts from heat flow observations, Science, 345, 1038–1041, 2014. a, b
Graveleau, F., Malavieille, J., and Dominguez, S.: Experimental modelling of orogenic wedges: A review, Tectonophysics, 538, 1–66, 2012. a, b
Hyndman, R., Wang, K., and Yamano, M.: Thermal constraints on the seismogenic portion of the southwestern Japan subduction thrust, J. Geophys. Res.-Sol. Ea., 100, 15373–15392, 1995. a, b, c
Jeffreys, H.: The Thermal Effects of Blanketing by Sediments, Geophys. J. Int., 2, 323–329, 1931. a
Jourdon, A., Le Pourhiet, L., Petit, C., and Rolland, Y.: Impact of range-parallel sediment transport on 2D thermo-mechanical models of mountain belts: Application to the Kyrgyz Tien Shan, Terra Nova, 30, 279–288, 2018. a, b
Lachenbruch, A. H. and Sass, J.: Heat flow and energetics of the San Andreas fault zone, J. Geophys. Res.-Sol. Ea., 85, 6185–6222, 1980. a
Laigle, M., Becel, A., De Voogd, B., Sachpazi, M., Bayrakci, G., Lebrun, J.-F., Evain, M., Daignières, M., Gailler, A., Gesret, A., Hirn, A., Klaeschen, D., Kopp, H., Marthelot, J.-M., Mazabraux, Y., Roux, E., and Weinzierl, W.: Along-arc segmentation and interaction of subducting ridges with the Lesser Antilles Subduction forearc crust revealed by MCS imaging, Tectonophysics, 603, 32–54, 2013. a, b
Lanson, B., Sakharov, B. A., Claret, F., and Drits, V. A.: Diagenetic smectite-to-illite transition in clay-rich sediments: A reappraisal of X-ray diffraction results using the multi-specimen method, Am. J. Sci., 309, 476–516, 2009. a, b
Lo, C.-H. and Onstott, T. C.: Rejuvenation of KAr systems for minerals in the Taiwan Mountain Belt, Earth Planet. Sc. Lett., 131, 71–98, 1995. a
Mary, B. C., Maillot, B., and Leroy, Y. M.: Predicting orogenic wedge styles as a function of analogue erosion law and material softening, Geochem. Geophy. Geosy., 14, 4523–4543, 2013. a
Mase, C. W. and Smith, L.: Pore-fluid pressures and frictional heating on a fault surface, Pure Appl. Geophys., 122, 583–607, 1984. a
Mase, C. W. and Smith, L.: Effects of frictional heating on the thermal, hydrologic, and mechanical response of a fault, J. Geophys. Res.-Sol. Ea., 92, 6249–6272, 1987. a
May, D. A. and Le Pourhiet, L.: pTatin2d (https://bitbucket.org/ptatin/ptatin2d/commits/991118fb4cdae93cf75859a9b1b96ba43e9bc999?at=restart, last access: 8 June 2021), Zenodo [code, data set], https://doi.org/10.5281/zenodo.4911354, 2021. a, b
May, D. A., Brown, J., and Le Pourhiet, L.: pTatin3D: High-performance methods for long-term lithospheric dynamics, in: SC'14: Proceedings of the International Conference for High Performance Computing, Networking, Storage and Analysis, 274–284, IEEE, 2014. a
May, D. A., Brown, J., and Le Pourhiet, L.: A scalable, matrix-free multigrid preconditioner for finite element discretizations of heterogeneous Stokes flow, Comput. Method. Appl. M., 290, 496–523, 2015. a
Miyakawa, A., Yamada, Y., and Matsuoka, T.: Effect of increased shear stress along a plate boundary fault on the formation of an out-of-sequence thrust and a break in surface slope within an accretionary wedge, based on numerical simulations, Tectonophysics, 484, 127–138, 2010. a
Moore, J. C. and Saffer, D.: Updip limit of the seismogenic zone beneath the accretionary prism of southwest Japan: An effect of diagenetic to low-grade metamorphic processes and increasing effective stress, Geology, 29, 183–186, 2001. a
Morrow, C., Shi, L., and Byerlee, J.: Strain hardening and strength of clay-rich fault gouges, J. Geophys. Res.-Sol. Ea., 87, 6771–6780, 1982. a
Nieuwland, D., Leutscher, J., and Gast, J.: Wedge equilibrium in fold-and-thrust belts: prediction of out-of-sequence thrusting based on sandbox experiments and natural examples, Neth. J. Geosci., 79, 81–91, 2000. a
Noda, A.: Forearc basins: Types, geometries, and relationships to subduction zone dynamics, Bulletin, 128, 879–895, 2016. a, b
Oleskevich, D., Hyndman, R., and Wang, K.: The updip and downdip limits to great subduction earthquakes: Thermal and structural models of Cascadia, south Alaska, SW Japan, and Chile, J. Geophys. Res.-Sol. Ea., 104, 14965–14991, 1999. a, b, c, d
Pajang, S., Cubas, N., Letouzey, J., Le Pourhiet, L., Seyedali, S., Fournier, M., Agard, P., Khatib, M. M., Heyhat, M., and Mokhtari, M.: Seismic hazard of the western Makran subduction zone: insight from mechanical modelling and inferred frictional properties, Earth Planet. Sc. Lett., 562, 116789, https://doi.org/10.1016/j.epsl.2021.116789, 2021a. a, b, c
Pajang, S., Le Pourhiet, L., and Cubas, N.: The topographic signature of temperature controlled rheological transitions in accretionary prism, Zenodo [video], https://doi.org/10.5281/zenodo.5599365, 2021b. a
Perfettini, H., Avouac, J.-P., Tavera, H., Kositsky, A., Nocquet, J.-M., Bondoux, F., Chlieh, M., Sladen, A., Audin, L., Farber, D. L., and Soler, P.: Seismic and aseismic slip on the Central Peru megathrust, Nature, 465, 78–81, 2010. a
Perron, P., Le Pourhiet, L., Guiraud, M., Vennin, E., Moretti, I., Portier, É., and Konaté, M.: Control of inherited accreted lithospheric heterogeneity on the architecture and the low, long-term subsidence rate of intracratonic basins, BSGF-Earth Sciences Bulletin, 192, 15, https://doi.org/10.1051/bsgf/2020038, 2021. a
Pichot, T. and Nalpas, T.: Influence of synkinematic sedimentation in a thrust system with two decollement levels; analogue modelling, Tectonophysics, 473, 466–475, 2009. a
Pytte, A. and Reynolds, R.: The thermal transformation of smectite to illite, in: Thermal History of Sedimentary Basins, edited by: Naeser, N. D. and McCulloh, T. H., Springer, 133–140, https://doi.org/10.1007/978-1-4612-3492-0_8, 1988. a, b
Raimbourg, H., Augier, R., Famin, V., Gadenne, L., Palazzin, G., Yamaguchi, A., and Kimura, G.: Long-term evolution of an accretionary prism: The case study of the Shimanto Belt, Kyushu, Japan, Tectonics, 33, 936–959, 2014. a, b
Ranalli, G. and Murphy, D. C.: Rheological stratification of the lithosphere, Tectonophysics, 132, 281–295, 1987. a
Ruh, J. B.: Submarine landslides caused by seamounts entering accretionary wedge systems, Terra Nova, 28, 163–170, 2016. a
Ruh, J. B.: Numerical modeling of tectonic underplating in accretionary wedge systems, Geosphere, 16, 1385–1407, 2020. a, b
Ruh, J. B., Kaus, B. J., and Burg, J.-P.: Numerical investigation of deformation mechanics in fold-and-thrust belts: Influence of rheology of single and multiple décollements, Tectonics, 31, TC3005, https://doi.org/10.1029/2011TC003047, 2012. a, b, c, d
Ruh, J. B., Gerya, T., and Burg, J.-P.: High-resolution 3D numerical modeling of thrust wedges: Influence of décollement strength on transfer zones, Geochem. Geophy. Geosy., 14, 1131–1155, 2013. a
Ruh, J. B., Gerya, T., and Burg, J.-P.: 3D effects of strain vs. velocity weakening on deformation patterns in accretionary wedges, Tectonophysics, 615, 122–141, 2014. a, b
Ruh, J. B., Sallarès, V., Ranero, C. R., and Gerya, T.: Crustal deformation dynamics and stress evolution during seamount subduction: High-resolution 3-D numerical modeling, J. Geophys. Res.-Sol. Ea., 121, 6880–6902, 2016. a
Saffer, D. M. and Marone, C.: Comparison of smectite-and illite-rich gouge frictional properties: application to the updip limit of the seismogenic zone along subduction megathrusts, Earth Planet. Sc. Lett., 215, 219–235, 2003. a
Segall, P. and Rice, J. R.: Does shear heating of pore fluid contribute to earthquake nucleation?, J. Geophys. Res.-Sol. Ea., 111, B09316, https://doi.org/10.1029/2005JB004129, 2006. a
Shea, W. T. and Kronenberg, A. K.: Rheology and deformation mechanisms of an isotropic mica schist, J. Geophys. Res.-Sol. Ea., 97, 15201–15237, 1992. a
Sibson, R.: Interactions between temperature and pore-fluid pressure during earthquake faulting and a mechanism for partial or total stress relief, Nature Physical Science, 243, 66–68, 1973. a
Silver, E. A. and Reed, D. L.: Backthrusting in accretionary wedges, J. Geophys. Res.-Sol. Ea., 93, 3116–3126, 1988. a, b
Simpson, G.: Mechanics of non-critical fold–thrust belts based on finite element models, Tectonophysics, 499, 142–155, 2011. a
Simpson, G.: Modelling interactions between fold–thrust belt deformation, foreland flexure and surface mass transport, Basin Res., 18, 125–143, 2006. a
Simpson, M. J., Landman, K. A., and Hughes, B. D.: Cell invasion with proliferation mechanisms motivated by time-lapse data, Physica A, 389, 3779–3790, 2010. a, b, c
Singh, S. C., Hananto, N. D., Chauhan, A. P., Permana, H., Denolle, M., Hendriyana, A., and Natawidjaja, D.: Evidence of active backthrusting at the NE Margin of Mentawai Islands, SW Sumatra, Geophys. J. Int., 180, 703–714, 2010. a
Singh, S. C., Hananto, N., Mukti, M., Robinson, D. P., Das, S., Chauhan, A., Carton, H., Gratacos, B., Midnet, S., Djajadihardja, Y., and Harjono, H.: Aseismic zone and earthquake segmentation associated with a deep subducted seamount in Sumatra, Nat. Geosci., 4, 308–311, 2011. a
Smit, J., Brun, J., and Sokoutis, D.: Deformation of brittle-ductile thrust wedges in experiments and nature, J. Geophys. Res.-Sol. Ea., 108, 2480, https://doi.org/10.1029/2002JB002190, 2003. a, b
Song, T.-R. A. and Simons, M.: Large trench-parallel gravity variations predict seismogenic behavior in subduction zones, Science, 301, 630–633, 2003. a, b, c, d
Stockmal, G. S., Beaumont, C., Nguyen, M., Lee, B., and Sears, J.: Mechanics of thin-skinned fold-and-thrust belts: Insights from numerical models, Geol. S. Am. S., 433, 63, https://doi.org/10.1130/2007.2433(04), 2007. a
Storti, F. and McClay, K.: Influence of syntectonic sedimentation on thrust wedges in analogue models, Geology, 23, 999–1002, 1995. a, b, c
Strayer, L. M., Hudleston, P. J., and Lorig, L. J.: A numerical model of deformation and fluid-flow in an evolving thrust wedge, Tectonophysics, 335, 121–145, 2001. a
Suppe, J.: Mechanics of mountain building and metamorphism in Taiwan, Mem. Geol. Soc. China, 4, 67–89, 1981. a
Terzaghi, K.: Erdbaumechanik auf bodenphysikalischer Grundlage, Leipzig u. Wien, Franz Deuticke, 399 pp., 1925. a
Verati, C., Lardeaux, J.-M., Favier, A., Corsini, M., Philippon, M., and Legendre, L.: Arc-related metamorphism in the Guadeloupe archipelago (Lesser Antilles active island arc): First report and consequences, Lithos, 320, 592–598, 2018. a
Vrolijk, P.: On the mechanical role of smectite in subduction zones, Geology, 18, 703–707, 1990. a
Wangen, M.: The blanketing effect in sedimentary basins, Basin Res., 7, 283–298, 1994. a
Wells, R. E., Blakely, R. J., Sugiyama, Y., Scholl, D. W., and Dinterman, P. A.: Basin-centered asperities in great subduction zone earthquakes: A link between slip, subsidence, and subduction erosion?, J. Geophys. Res.-Sol. Ea., 108, 2507, https://doi.org/10.1029/2002JB002072, 2003. a, b, c, d
Willett, S. D.: Rheological dependence of extension in wedge models of convergent orogens, Tectonophysics, 305, 419–435, 1999. a
Willett, S. D. and Brandon, M. T.: On steady states in mountain belts, Geology, 30, 175–178, 2002. a