the Creative Commons Attribution 4.0 License.
the Creative Commons Attribution 4.0 License.
 | 21 Mar 2022
Radial anisotropy and S-wave velocity depict the internal to external zone transition within the Variscan orogen (NW Iberia)
Jorge Acevedo
Gabriela Fernández-Viejo
Sergio Llana-Fúnez
Carlos López-Fernández
Javier Olona
Diego Pérez-Millán
The cross-correlation of ambient noise records registered by seismic networks has proven to be a valuable tool to obtain new insights into the crustal structure at different scales. Based on 2 to 14 s period Rayleigh and Love dispersion data extracted from the seismic ambient noise recorded by 20 three-component broadband stations belonging to two different temporary experiments, we present the first (i) upper-crustal (1–12 km) high-resolution shear wave velocity and (ii) radial anisotropy variation models of the continental crust in NW Iberia. The area of study represents one of the best-exposed cross sections along the Variscan orogen of western Europe, showing the transition between the external eastern zones towards the internal areas in the west. Both the 2-D maps and an E–W transect reveal a close correspondence with the main geological domains of the Variscan orogen. The foreland fold-and-thrust belt of the orogen, the Cantabrian Zone, is revealed by a zone of relatively low shear wave velocities (2.3–3.0 km s−1), while the internal zones generally display higher homogeneous velocities (> 3.1 km s−1). The boundary between the two zones is clearly delineated in the models, depicting the arcuate shape of the orogenic belt. The velocity patterns also reveal variations of the elastic properties of the upper crust that can be linked to major Variscan structures, such as the basal detachment of the Cantabrian Zone, the stack of nappes involving pre-Variscan basement, or sedimentary features such as the presence of thick syn-orogenic siliciclastic wedges. Overall, the radial anisotropy magnitude varies between −5 % and 15 % and increases with depth. The depth pattern suggests that the alignment of cracks is the main source of anisotropy at < 8 km depths, although the intrinsic anisotropy seems to be significant in the West Asturian–Leonese Zone, the low-grade slate belt adjacent to the Cantabrian Zone. At depths > 8 km, widespread high and positive radial anisotropies are observed, which we attribute to the presence of subhorizontal alignments of grains and minerals in relation to the pre- or syn-orogenic deformation associated with the Variscan orogenesis.
- Article
(18921 KB) - Full-text XML
-
Supplement
(1203 KB) - BibTeX
- EndNote


Seismic anisotropy is a ubiquitous feature within the Earth's interior that provides valuable information about the fabric of the geological materials and the tectonic and geodynamic processes causing it (e.g., Silver, 1996). It is usually investigated through laboratory tests on rock samples (e.g., Mainprice et al., 2000; Godfrey et al., 2000; Ji et al., 2015) or estimated indirectly from the direction-dependent velocity variation of the seismic waves traveling across a rock formation (e.g., Luo et al., 2013; Moschetti et al., 2010). Vertically (Vsv) and horizontally (Vsh) polarized shear wave velocities can be extracted from Rayleigh and Love dispersion measurements, respectively. When Vsh > Vsv, the anisotropy is considered to be positive, whereas when Vsv > Vsh the anisotropy is negative. Within an isotropic medium, Vsv and Vsh are equal. However, numerous studies in several locations worldwide have observed the so-called “Rayleigh–Love discrepancy” (Anderson, 1961), which implies that the Rayleigh- and Love-wave dispersion curves cannot be simultaneously fitted under the assumption of isotropic wave velocities. Following Anderson (1961), this mismatch indicates that the medium is radially anisotropic.
Crustal radial anisotropy (RA) is originated by a variety of source mechanisms that dominate at different depth levels. In the shallow crust (< 5–10 km) the RA is believed to be caused by networks of cracks and fractures linked to the regional stress field (e.g., Crampin et al., 2015). The presence of structure-oriented cracks, bedding planes, or grain boundary alignments within the rock mass (e.g., Almqvist and Mainprice, 2017; Boness and Zoback, 2006; Zinke and Zoback, 2000) can also play an important role in the anisotropy from shape-preferred orientation or mineral grains. At pressures higher than 150–200 MPa, equivalent to 6–8 km depths, the increasing lithostatic pressure forces the closure of the cracks and texture-related anisotropy becomes dominant (e.g., Ji et al., 2015; Kern, 1990; Christensen 1985). This type of anisotropy arises from the alignment of minerals with a crystallographic-preferred orientation due to deformation associated with faults and shear zones (Barruol and Kern, 1996). Thus, the effect of this progressive shift in the anisotropy-governing features is expected to be observed by geophysical methods targeting the upper 10 km of the crust, considering that the shallowest part is sensitive to the properties of the fractures within the rock massif, while the deepest sectors are more susceptible to mineral orientation in the rocks. The strongest crustal shear wave anisotropies of up to 20 % have been reported in recent orogenic belts, such as the Himalayas (e.g., Xie et al., 2013) or the Andean Cordillera (Lynner et al., 2018). Nonetheless, high RAs (10 %–16 %) have also been identified in many other parts of the world with very different tectonic histories, even in sedimentary basins (Dreiling et al., 2018), orogenic belts (Wang et al., 2020), or areas with intraplate volcanism (Ojo et al., 2017). Also, lateral variations in the crustal anisotropy have been related to a wide catalog of geological features: microcracks and metamorphic foliations (Guo et al. 2012), fault systems (e.g., Shirzad and Shomali, 2014; Shirzad et al., 2017), geological boundaries (e.g., Naghavi et al., 2019; Wang et al., 2020), or lateral crustal flow (e.g., Lynner et al., 2018).
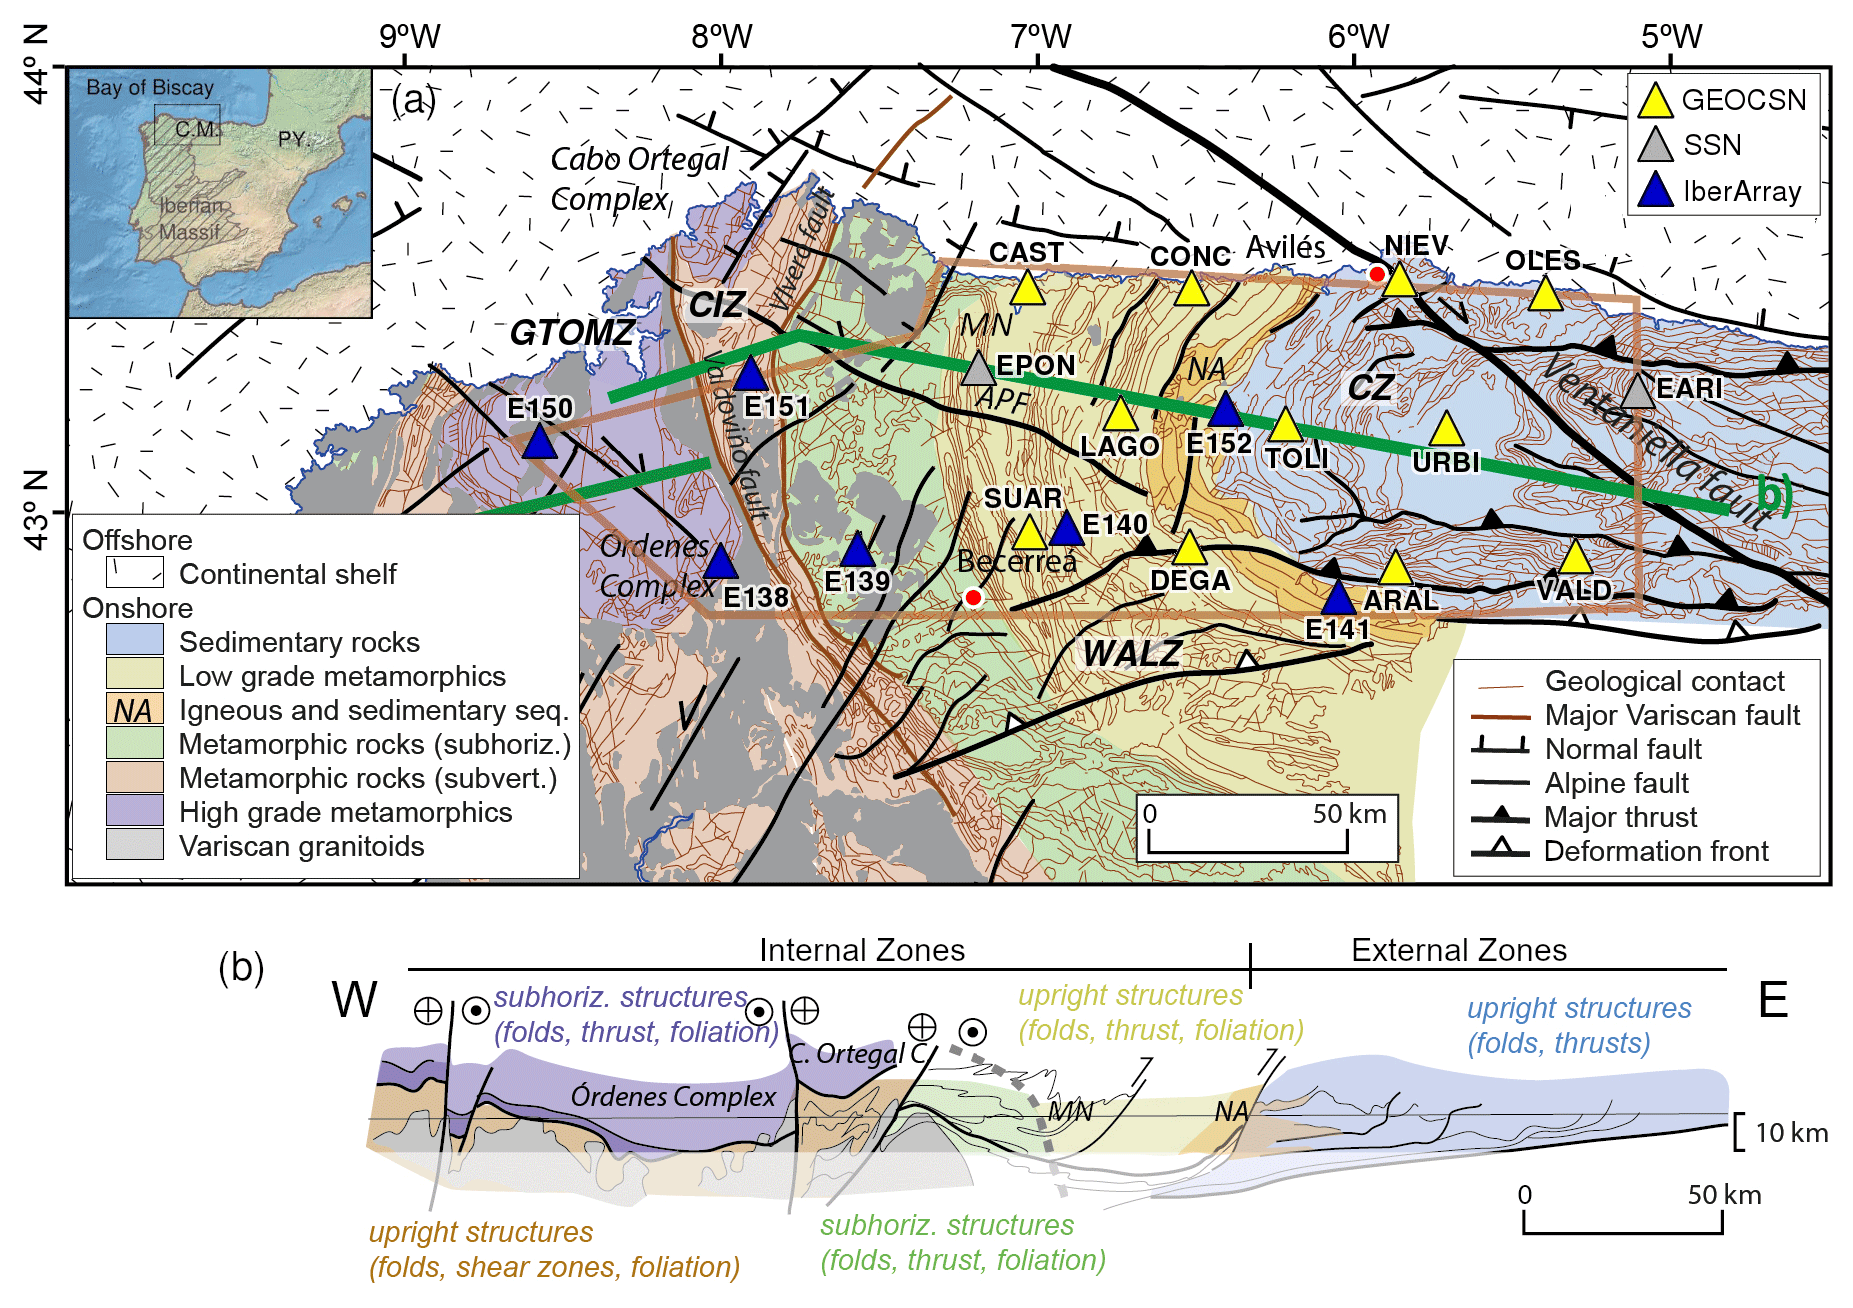
Figure 1(a) Simplified geological map of the study area showing a lithological zonation of the Iberian Variscan orogen in NW Spain. The green line marks the position of the cross sections in panel (b) and Figs. 8 and 10, while the brown polygon represents the limits of the maps in Figs. 4, 6, and 7. Triangles depict the location of the seismic stations that were used in this study. Their colors indicate the seismic network to which they belong. Location of the investigated area (inset) within the Iberian Peninsula and the Variscan Iberian Massif. CZ: Cantabrian Zone, WALZ: West Asturian–Leonese Zone, CIZ: Central Iberian Zone, GTOMZ: Galicia-Trás-os-Montes Zone. APF: As Pontes fault, MN: Mondoñedo nappe, NA: Narcea antiform, VF: Ventaniella fault, PY: Pyrenees, CM: Cantabrian Mountains. Background geology onshore is taken from the continuous geological map of Spain at 1:1 000 000 (IGME). (b) General cross section across the northwestern Iberian Variscan Belt (based on Pérez-Estaún et al., 1991). The opaque part of the profile highlights the sampled depth in this study.
In this work, the first 3-D crustal radial anisotropy model of NW Iberia is derived from the inversion of surface wave group velocities obtained from ambient noise interferometry (ANI) (e.g., Wapenaar, 2003, 2004; Shapiro and Campillo, 2004; Shapiro et al., 2005; Snieder, 2004). This area (Fig. 1a) is a geologically complex region with a long and well-established tectonic history that comprises the overlapping structural imprint of two major compressional events: the Variscan orogeny in the late Paleozoic and the Alpine orogeny in Cenozoic times, separated by several rifting episodes in the Mesozoic. The structure of the study area was mainly configured during the Variscan orogeny, although the Alpine compression reworked some of the structures and originated a widespread pervasive fracturing, particularly in the upper crust. Overall, the part of the Variscan Belt that crops out in the Cantabrian Mountains (CM) represents one of the most complete sections of this orogen in Europe (Martínez-Catalán et al., 2009a), illustrating the transition from the internal (west) to the external (east) zones of an orogenic system (Fig. 1b). From the early 90s, extensive deep seismic reflection and refraction as well as wide angle surveys were carried out in this area. These programs focused on the unveiling of the deep crustal structure of the CM (Pérez-Estaún et al., 1994; Pulgar et al., 1995, 1996; Álvarez-Marrón et al., 1996, 1997; Gallastegui et al., 1997, 2002; Ayarza et al., 1998; Fernández-Viejo et al., 1998, 2000; Fernández-Viejo and Gallastegui, 2005; Fernández-Viejo et al., 2011, 2012) and broadened the knowledge about the multiorogenic crustal architecture. To improve imaging resolution at crustal depths, several temporary seismic arrays with different specifications and dimensions were deployed in the CM (e.g., López-Fernández et al., 2012, 2018), the most recent of which is featured for the first time in this study.
Similarly to other passive seismic imaging techniques, the ANI reflects the variation of the seismic velocities of the bulk rock. In orogenic belts, where lithologies with different properties are placed in contact by structural features, ANI can also help to indirectly infer the presence of structures at depth and thus it can be valuable for unraveling the upper-crustal structure at regional or even local scale in a cost-effective manner (e.g., Zigone et al., 2015; Sammarco et al., 2017; Acevedo et al., 2019; Gu et al., 2019; Olivar-Castaño et al., 2020). In any case, the main advantage of ANI is that, unlike earthquake-based tomography, it can be applied in seismically quiet regions due to the ubiquitous presence of noise sources. Currently, there is limited knowledge on the seismic anisotropy signature of NW Iberia. Díaz et al. (2002, 2006, 2015) studied the upper mantle and lower crust anisotropy from distant earthquake shear wave splitting measurements, and Acevedo et al. (2020) used local earthquake shear wave splitting and ANI analysis to infer the anisotropic properties of the upper crust in the central part of the CM. Both studies consistently reported an average E–W fast direction, but the rotation of the fast orientations in the vicinity of major Alpine structures suggests that the contribution of the Alpine deformation to the anisotropy in the upper crust can be significant (Acevedo et al., 2020).
Here we make use of the ambient noise recordings from a new temporary seismic network in NW Iberia to extend to the north and the west an earlier tomographic S-wave velocity model of the eastern sector of the CM (Acevedo et al., 2019), which was mostly affected by the Alpine deformation, and to further determine the 3-D distribution of the crustal radial anisotropy. From a subsequent work (Acevedo et al., 2020), we learned that the crustal fabric controlled the orientation of the fastest seismic velocities, sometimes in accordance with Variscan structures and other times with Alpine structures. However, there was also local coincidence in the orientation of Variscan and Alpine structures, mostly by reworking during the youngest convergence. The aim of the new seismic array, building on our previous experience, was twofold. The first was to apply the ANI method to learn differences in architecture in relation to two orogenic events with contrasting kinematics (therefore orientation of structures). For this reason, we extended the area of observations to include parts of the Iberian crust with stronger Variscan imprint, incorporating domains with strong tectonic fabric susceptible to producing seismic anisotropy (Cárdenes et al., 2021) and with contrasting orientation to Alpine structures (Fig. 1a and b). The second was to constrain in the upper crust the contribution to seismic anisotropy by internally deformed rocks versus tectonically fractured rocks.
2.1 Tectonic history
The crustal architecture of the study area is mainly defined by the Variscan orogeny, which affected the continental crust of western Europe and the northwest of Africa between the late Devonian and the early Permian (e.g., Matte, 1986; Ribeiro et al., 2007; Martínez-Catalán et al., 2009b; Pastor-Galán et al., 2013). Subsequently to the denudation of the Variscan orogen, several rifting episodes affected the crust in NW Iberia: first in the Permian–Triassic, then in the Mesozoic when the crust was completely dismembered with the final opening of the Atlantic. The most important extensional episode occurred between the Late Jurassic and the Early Cretaceous and was related to the opening of the Bay of Biscay (e.g., Cadenas et al., 2018; Tugend et al., 2015). This event configured the crustal structure of the eastern part of the study area beyond the Ventaniella fault (Fig. 1a).
In Cenozoic times, the dominant geodynamic regime of the region shifted again and caused the north–south convergence between Europe and Africa, producing the onset of the Alpine orogeny. The compression started along the northern edge of the Iberian Peninsula in the Pyrenees and migrated to the west to form the CM (e.g., Teixell et al., 2018). During the convergence, the transitional crust of the Bay of Biscay was underthrusted southwards beneath the Iberian continental crust (e.g., Boillot et al., 1979; Fernández-Viejo et al., 2012; Cadenas and Fernández-Viejo, 2017). The bulk of the deformation was mainly accommodated by east–west-oriented reverse faults and thrusts, but there are numerous examples of the reworking and retightening of favorably oriented earlier Variscan thrusts and folds, with a different degree of development across the study area (e.g., Alonso et al., 1996). Currently, in the northern Iberian crust, Alpine structures are dominant in the eastern half of the Variscan foreland fold-and-thrust belt, but they decrease their importance towards the west (Alonso et al., 1996; Martín-González et al., 2012; Llana-Fúnez and López-Fernández, 2015).
2.2 Crustal structure
Numerous works have contributed to broadening knowledge about the Variscan imprint in the crust prior to the rise of the CM (e.g., Julivert, 1971; Pérez-Estaún et al., 1988; Alonso et al., 2009) and, more recently, its evolution during the Alpine convergence (Alonso et al., 1996; Pulgar et al., 1996, 1999; Gallastegui et al., 2002; Martín-González et al., 2012; Pedreira et al., 2015). From the early 90s, extensive seismic surveys were carried out in the area. These programs focused on the unveiling of the deep crustal structure of the CM from deep seismic reflection and refraction as well as wide angle data (Pérez-Estaún et al., 1994; Pulgar et al., 1995, 1996; Álvarez-Marrón et al., 1996, 1997; Gallastegui et al., 1997, 2002; Ayarza et al., 1998; Fernández-Viejo et al., 1998, 2000, 2011, 2012; Fernández-Viejo and Gallastegui, 2005) and led to significant findings that decisively improved the geological and geodynamical models of the area. For example, the E–W-oriented profiles ESCIN-1 and ESCIN-3 imaged the Variscan structures of the crust under the CM for the first time and their progressive loss of importance compared to the Alpine structures towards the east. Later, the ESCIN-2 profile was performed with the goal of sampling the Alpine features in the transition between the eastern sector of the CM and the Cenozoic Duero Basin. Both profiles revealed the presence of an important crustal root beneath the CM. In order to complement the active geophysical surveys, several temporary seismic arrays with different specifications and coverage were deployed in the CM. Besides the seismotectonic characterization of the region (e.g., López-Fernández et al., 2012, 2018; Llana-Fúnez and López-Fernández, 2015) the recorded passive seismic data allowed the study of the crustal configuration of northern Iberia using receiver function analysis (Díaz et al., 2003, 2009a; Mancilla and Díaz, 2015) and validated many of the ESCIN observations. The use of ambient noise interferometry is also beginning to provide additional knowledge about the internal structure of the upper crust in the study area (e.g., Acevedo et al., 2019, 2020; Olivar-Castaño et al., 2020).
2.3 Upper-crustal domains in the study area
In the central sector of the CM the erosion of the Mesozoic sedimentary cover during mountain building led to the exposure of the underlying Paleozoic basement. The physical properties of large parts of the upper crust targeted in this study with ambient noise tomography can be predefined according to the nature of the rocks and the structures based on surface geology. As already mentioned, a major part of the crustal architecture was shaped during the development of the Variscan orogeny, and for that reason, the crustal domains that will be defined below partially follow the subdivision established for the Variscan orogeny (Julivert, 1971). However, subsequent tectonic events, although they did not produce a significant change in the nature of rocks, did have an impact on their structure. In most cases, they produced a tendency to upright structures by increasing the dip of cartographic units and structures (e.g., Alonso, 1989).
The first crustal domain to the east of the study area is the foreland fold-and-thrust belt of the Variscan orogen, the external part of the orogenic belt corresponding to the Cantabrian Zone (CZ) in the literature (e.g., Alonso et al., 2009). It is composed of sedimentary rocks that bear no tectonic or any other type of fabric orienting rock-forming minerals. However, the arrangement of tectonic units during the Variscan orogeny led in the final stages of the orogeny to the upright attitude of thrust sheets (e.g., Merino-Tomé et al., 2009). Folding of syn-orogenic sediments not involved in earlier Variscan thrusting also led to the upright position of lithostratigraphic units (e.g., Alonso et al., 1989; Aller and Gallastegui, 1995).
To the west of the Variscan foreland fold-and-thrust belt in the basement lies the hinterland of the orogen, showing an approximate N–S arrangement in the study area (Fig. 1a). In terms of the rock types, their fabric, and their attitude we could distinguish four domains: a linear slate belt wrapping around the external part of the Variscan orogen, a subhorizontal slate belt partly coinciding with the Mondoñedo nappe, a subvertical high-grade metamorphic domain intruded by Variscan granitoids, and the allochthonous nappes of high-grade rocks sitting on top of the previous domain.
The linear slate belt is a domain that can be defined ahead of the Mondoñedo nappe, over the Navia-Alto Sil domain (Marcos, 1973). From a structural point of view, most of the structures are steeply dipping (Marcos, 1973) and they coincide with an area with a N–S lineation fabric (Matte, 1968). The rocks present a tectonic fabric developed at low-grade metamorphic conditions, which imposes a strong mostly planar mechanical anisotropy to the propagation of seismic waves (Cárdenes et al., 2021). To the west, the subhorizontal slate belt coincides with the middle and rear part of the Mondoñedo nappe (Fig. 1), and its structure is dominated by large recumbent folds (Matte, 1968; Bastida et al., 1986). This isoclinal folding is accompanied by a tectonic fabric equilibrated in medium- to high-grade conditions that strengthens the subhorizontal anisotropy imposed by the orientation of the layers. Altogether, the linear and subhorizontal slate belts constitute the West Asturian–Leonese Zone (WALZ).
The high-grade domain west of the Vivero fault (Fig. 1a) corresponds to the Central Iberian Zone (CIZ). It is constituted by a rock sequence similar to that of the WALZ, but at higher grade given the pervasive intrusion of Variscan granitoids throughout the history of the orogenic belt. The recognition of large recumbent folds is hindered by the large number of granitoids and by the development of upright folds and subvertical shear zones in the late stages of the Variscan orogen (e.g., Llana-Fúnez and Marcos, 2007). The folding is locally accompanied by the development of a strong crenulation fabric (e.g., Bastida et al., 2010). Subvertical corridors of foliated rocks in relation to large shear zones are common and often affect several kilometers on either side of the crustal-scale structures (e.g., Llana-Fúnez and Marcos, 2001).
The last domain corresponds to the allochthonous nappes, which are thrust sheets of exotic provenance thrusted over the CIZ (e.g., Martínez-Catalán et al., 1997). The presence of these allochthonous complexes defines the Galicia-Trás-os-Montes Zone (GTOMZ). Their essential features are that they are mostly made of high-grade high-pressure rocks, bearing a strong tectonic fabric and showing a subhorizontal attitude (see, e.g., Marcos et al., 2002, for the Cabo Ortegal complex and Martínez Catalán et al., 2012, for the Órdenes complex).
The upper-crustal domains presented have been defined by the types of rocks and structures formed during the Variscan orogeny. Subsequent tectonic events in the study area lack the intensity and pervasive character shown during the Variscan orogeny. No tectonic fabric at regional scale has been reported in relation to either the several extensional episodes leading to the opening of the Atlantic or during the more recent Alpine convergence. Faults are also more spaced in between.
Earlier studies have reported a somehow widespread effect of Alpine deformation over previous rocks and structures in the CZ domain, dominated by the tightening of previously steep Variscan structures (e.g., Alonso et al., 1989). Locally in this domain, there are reports of evidence of post-Variscan fracturing. No systematic study of Alpine fracturing has been carried out in the study area; however, separate observations in post-Permian rocks in the confines of the CZ show the development of a subvertical N–S set of joints (e.g., Lepvrier and Martínez García, 1990; Pastor-Galán et al., 2011; Uzkeda et al., 2013).

Figure 2(a) Location of the displayed interstation paths over a simplified map of geological domains. Triangles represent the position of the seismic stations using color codes in Fig. 1. (b) Examples of stacked vertical and (c) transverse component symmetric EGFs. Rayleigh and Love waves are the dominant phases, respectively. (d) Example of MFA surface for the CONC-URBI (vertical component) station pair, showing the fundamental mode Rayleigh-wave group velocity dispersion curve. (e) Rayleigh- and (f) Love-wave group velocity dispersion curves showing the number of velocity estimations used in the inversion as a function of the period. Dispersion curves obtained for paths fully contained within the main geological domains are highlighted using the colors in Fig. 2a, except for paths crossing the CIZ, GTOMZ, or both, which are marked in pink. Grey dispersion curves represent mixed paths that span through more than one region. Red circles illustrate the average dispersion values used in the computation of the initial regional S-wave velocity models. U: group velocity.
3.1 Seismic data
This study used continuous broadband seismic data from two experiments with non-simultaneous recording periods: (1) between June 2019 and February 2020, a seismic network (Geocantábrica-Costa Seismic Network, GEOCSN) composed of 11 portable stations was deployed in the western CM. The dataset from this network was complemented with data from two permanent seismic stations belonging to the Spanish Seismological Network (SSN) of the Spanish Geographical Institute (Fig. 2a). The seismic array served the dual purpose of enhancing the location of the intraplate seismicity in the west of the CM and the close continental shelf and acquiring new passive data for ambient noise analysis. The experiment covered an area of ∼ 12 500 km2 with interstation distances of ∼ 40 km. Seismic stations were equipped with Nanometrics Taurus data loggers and broadband Trillium 120 s sensors recording three-component seismic data at a sample rate of 100 Hz. Most of the stations were installed in isolated chapels and sheds with connection to the electricity network, although solar power supply was required in some locations. A few stations were also mounted directly in the field, buried in ∼ 0.5 m pits. The average data recovery reached 96 %, with minimum data loss due to occasional power cuts caused by thunderstorms. (2) To extend our observations to the west, we also processed 12 months (January–December 2012) of continuous seismic data registered by seven temporary stations of the northern IberArray seismic network (Díaz et al., 2009b) plus the station EPON of the SSN (Fig. 2a). The seismic recording equipment and technical configurations were the same as in the GEOCSN, except that all the seismic stations were mounted outdoors. The station spacing was also larger at around 60 km, covering an area of ∼ 10 000 km2 with a 26 % overlap with the GEOCSN.
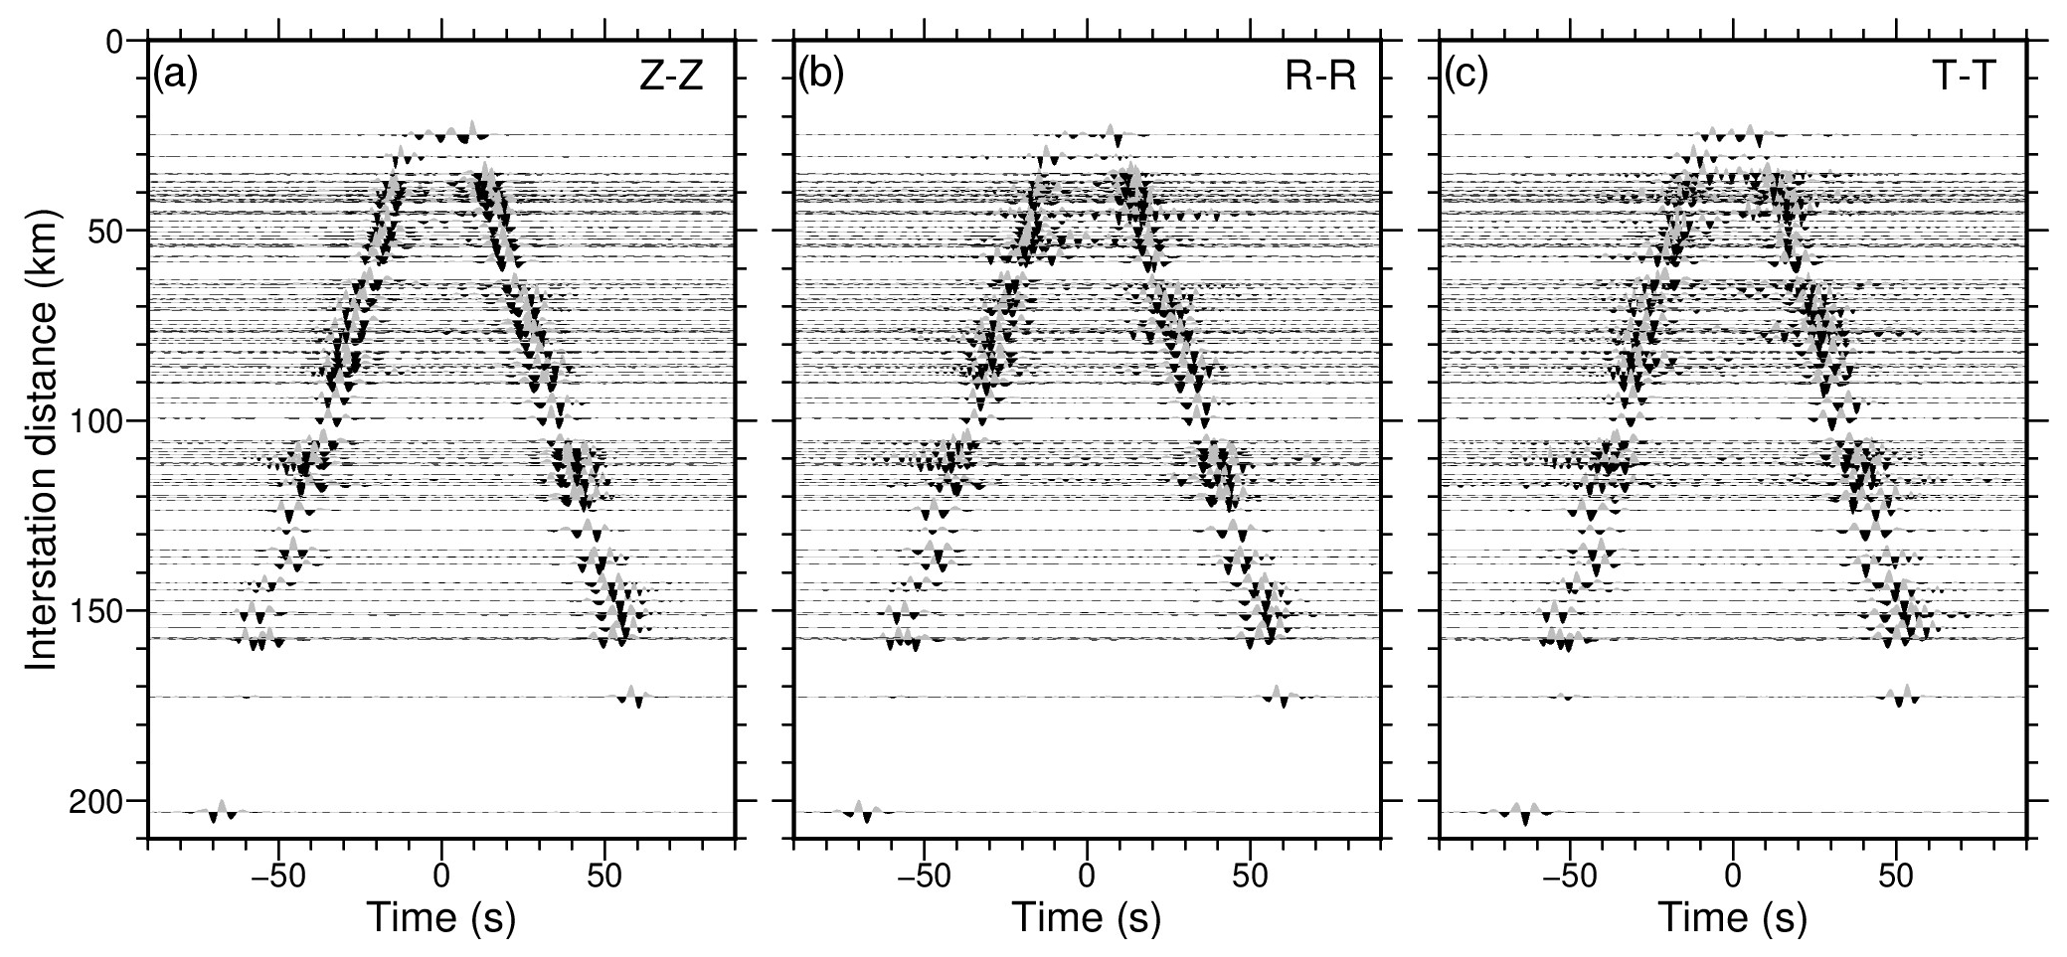
Figure 3Record sections showing the EGFs of all the available station pairs obtained from the cross-correlation of the (a) vertical (Z-Z), (b) radial (R-R), and (c) transverse (T-T) components.
3.2 Ambient noise interferometry
The treatment of the seismic ambient noise data to obtain Rayleigh- and Love-wave dispersion velocities was based on the widely used processing scheme described by Bensen et al. (2007), with a few modifications. Our processing began with the splitting of the continuous dataset in 24 h long segments and the removal of all the traces with gaps. The records were downsampled to 25 Hz and the instrument responses were removed. Next, the mean and the trend were also removed from the traces, and a bandpass filter with corner frequencies of 0.01 and 2.0 Hz was applied. The described pre-processing benefited from the use of the phase cross-correlation technique (PCC, Schimmel, 1999) for the calculation of the cross-correlations. Given that PCC is amplitude-unbiased (Schimmel et al., 2011), we did not perform any temporal or spectral normalization, thus avoiding the potential introduction of artifacts and shortening the processing time. The next step consisted of the cross-correlation of the 24 h traces recorded simultaneously by each pair of stations with the aforementioned PCC procedure. In this way, we obtained the daily cross-correlation functions (DCCFs) for lag times of 100 s. The observation of the cross-correlograms revealed a noticeable asymmetry between the causal and acausal parts of the signal. Since we ignore which of these parts contain more useful information, the causal and time-reversed acausal parts of each station-pair DCCF were stacked using the time–frequency domain phase-weighted (tf-PWS) procedure of Schimmel and Gallart (2007). This stacking method enhances the coherent signal and cancels incoherent noise, allowing the extraction of the symmetrical empirical Green's functions (EGFs) of the medium between each station pair. In this study, we processed the vertical (Z) and horizontal components (E, N) to obtain the Z–Z (Fig. 3a), E–E, and N–N EGFs. Then, the horizontal components were rotated along the azimuth of the interstation path to provide the radial (R-R, Fig. 3b) and transverse (T–T, Fig. 3c) correlation functions. The vertical and radial components are dominated by Rayleigh waves (Fig. 2a and b), whereas Love waves emerged from the transverse component (Fig. 2a and c).
The measurement of the Rayleigh and Love group velocity dispersion curves was performed by using the multiple-filter analysis (MFA) method of Dziewonski et al. (1969). In this technique, a narrowband Gaussian filter is applied over different periods to isolate the wave package around the central period of each filter (Figs. 2d and S1 in the Supplement). The group velocities in their fundamental mode were then manually picked to construct dispersion curves. According to Bensen et al. (2007), dispersion curves are limited at the longer periods by the fact that velocity measurements are only reliable for interstation distances greater than three wavelengths. Given the dimensions of our network, strict compliance with this criterion results in a loss of measurements that affects the resolution of the group velocity maps at periods > 10 s. However, Luo et al. (2015) demonstrated that consistent measurements can also be obtained using a cut-off of one wavelength.
In order to avoid discarding useful data without relaxing the constraints to a point at which the velocity determinations become unreliable, we adopted a two-wavelength criterion in this work. This cut-off has been proven to be a suitable compromise solution in other studies (e.g., Sammarco et al., 2017; Brandmayr et al., 2016; Shapiro et al., 2005). To ensure the quality of the results, our analysis was limited to velocity measurements within 2 standard deviations from the mean and with more than 60 measurements at each period. The stability of the dispersion curves was also investigated by stacking sets of 60, 90, and the available DCCFs for all the interstation paths (Fig. S2 in the Supplement). Overall, Love-wave dispersion curves are slightly less stable than Rayleigh-wave dispersion measurements. Waveforms and dispersion curves for the GEOCSN paths stabilize at a lower number of days (∼ 60 d) than IberArray paths (∼ 90 d), but in both cases, the stabilization is reached at a much lower number of days than available for each interstation path (Fig. S2).
We decided not to extract phase velocities due to the difficulty of resolving the 2π phase ambiguity without long-period data due to the small aperture of our seismic network and the complexity of the CM crust. The estimation of the velocity uncertainties is vital to warrant the trustworthiness of the results. For this task, we have checked the group velocity mismatch between the dispersion curves obtained from 10 stacks made with the randomly selected 75 % of all the available DCCFs (Fig. S2). The results show, in general, uncertainties well below 1 % for the Rayleigh- and Love-wave group velocity determinations from vertical and transversal components, respectively. In relative terms, Love waves display higher velocity uncertainties than Rayleigh waves, like the IberArray dataset when compared with the GEOCSN measurements. Compared to vertical-component observations, Rayleigh-wave velocities from radial-component EGFs display higher uncertainties of up to ∼ 4 % at the longest periods (Fig. S2) and a lower signal-to-noise ratio. These facts, combined with the loss of some interstation paths due to dubious radial MFA surfaces, drove us to exclusively use Rayleigh group velocities obtained from the high-quality vertical EGFs in further calculations.
On the other hand, the stacking of noise correlations over long time spans ensures that the results are not affected by a seasonal distribution of the seismic sources. Moreover, the directionality analysis of noise sources in N Iberia performed by Olivar-Castaño et al. (2020) showed that, although the most intense noise comes from the N–NW directions (Bay of Biscay and Atlantic Ocean), a sufficient level of noise emerges from all azimuths. Therefore, the effect of the spatial variation of noise sources is small and does not compromise the reliability of the dispersion measurements.
3.3 Group velocity tomography and depth inversion
Reliable dispersion measurements of Rayleigh and Love waves were obtained at periods of 2–14 s (Fig. 2e and f). The transformation of the dispersion velocities between the stations into continuous Rayleigh and Love group velocity surfaces was performed with the fast-marching surface tomography (FMST) scheme (Rawlinson, 2005). FMST is an iterative nonlinear method that is implemented in two steps: (a) the forward prediction of travel times with the fast-marching method (Sethian, 1996; Rawlinson and Sambridge, 2004a, b) and (b) the modification of the model parameters to explain the data observations, for which a subspace inversion scheme is used (Kennett et al., 1988). The resulting models are controlled by a grid of nodes with cubic B-spline interpolation that generates a smooth and continuous velocity medium. We selected a grid size of 0.1∘ × 0.1∘ for the inversion of a homogeneous starting model that was created from the average velocity measured for a certain period (Nicolson et al., 2014). After extensive tests, the smoothing and damping parameters were set to 0.001 and 0.1, respectively, but their change only had a minor influence in the resulting models.
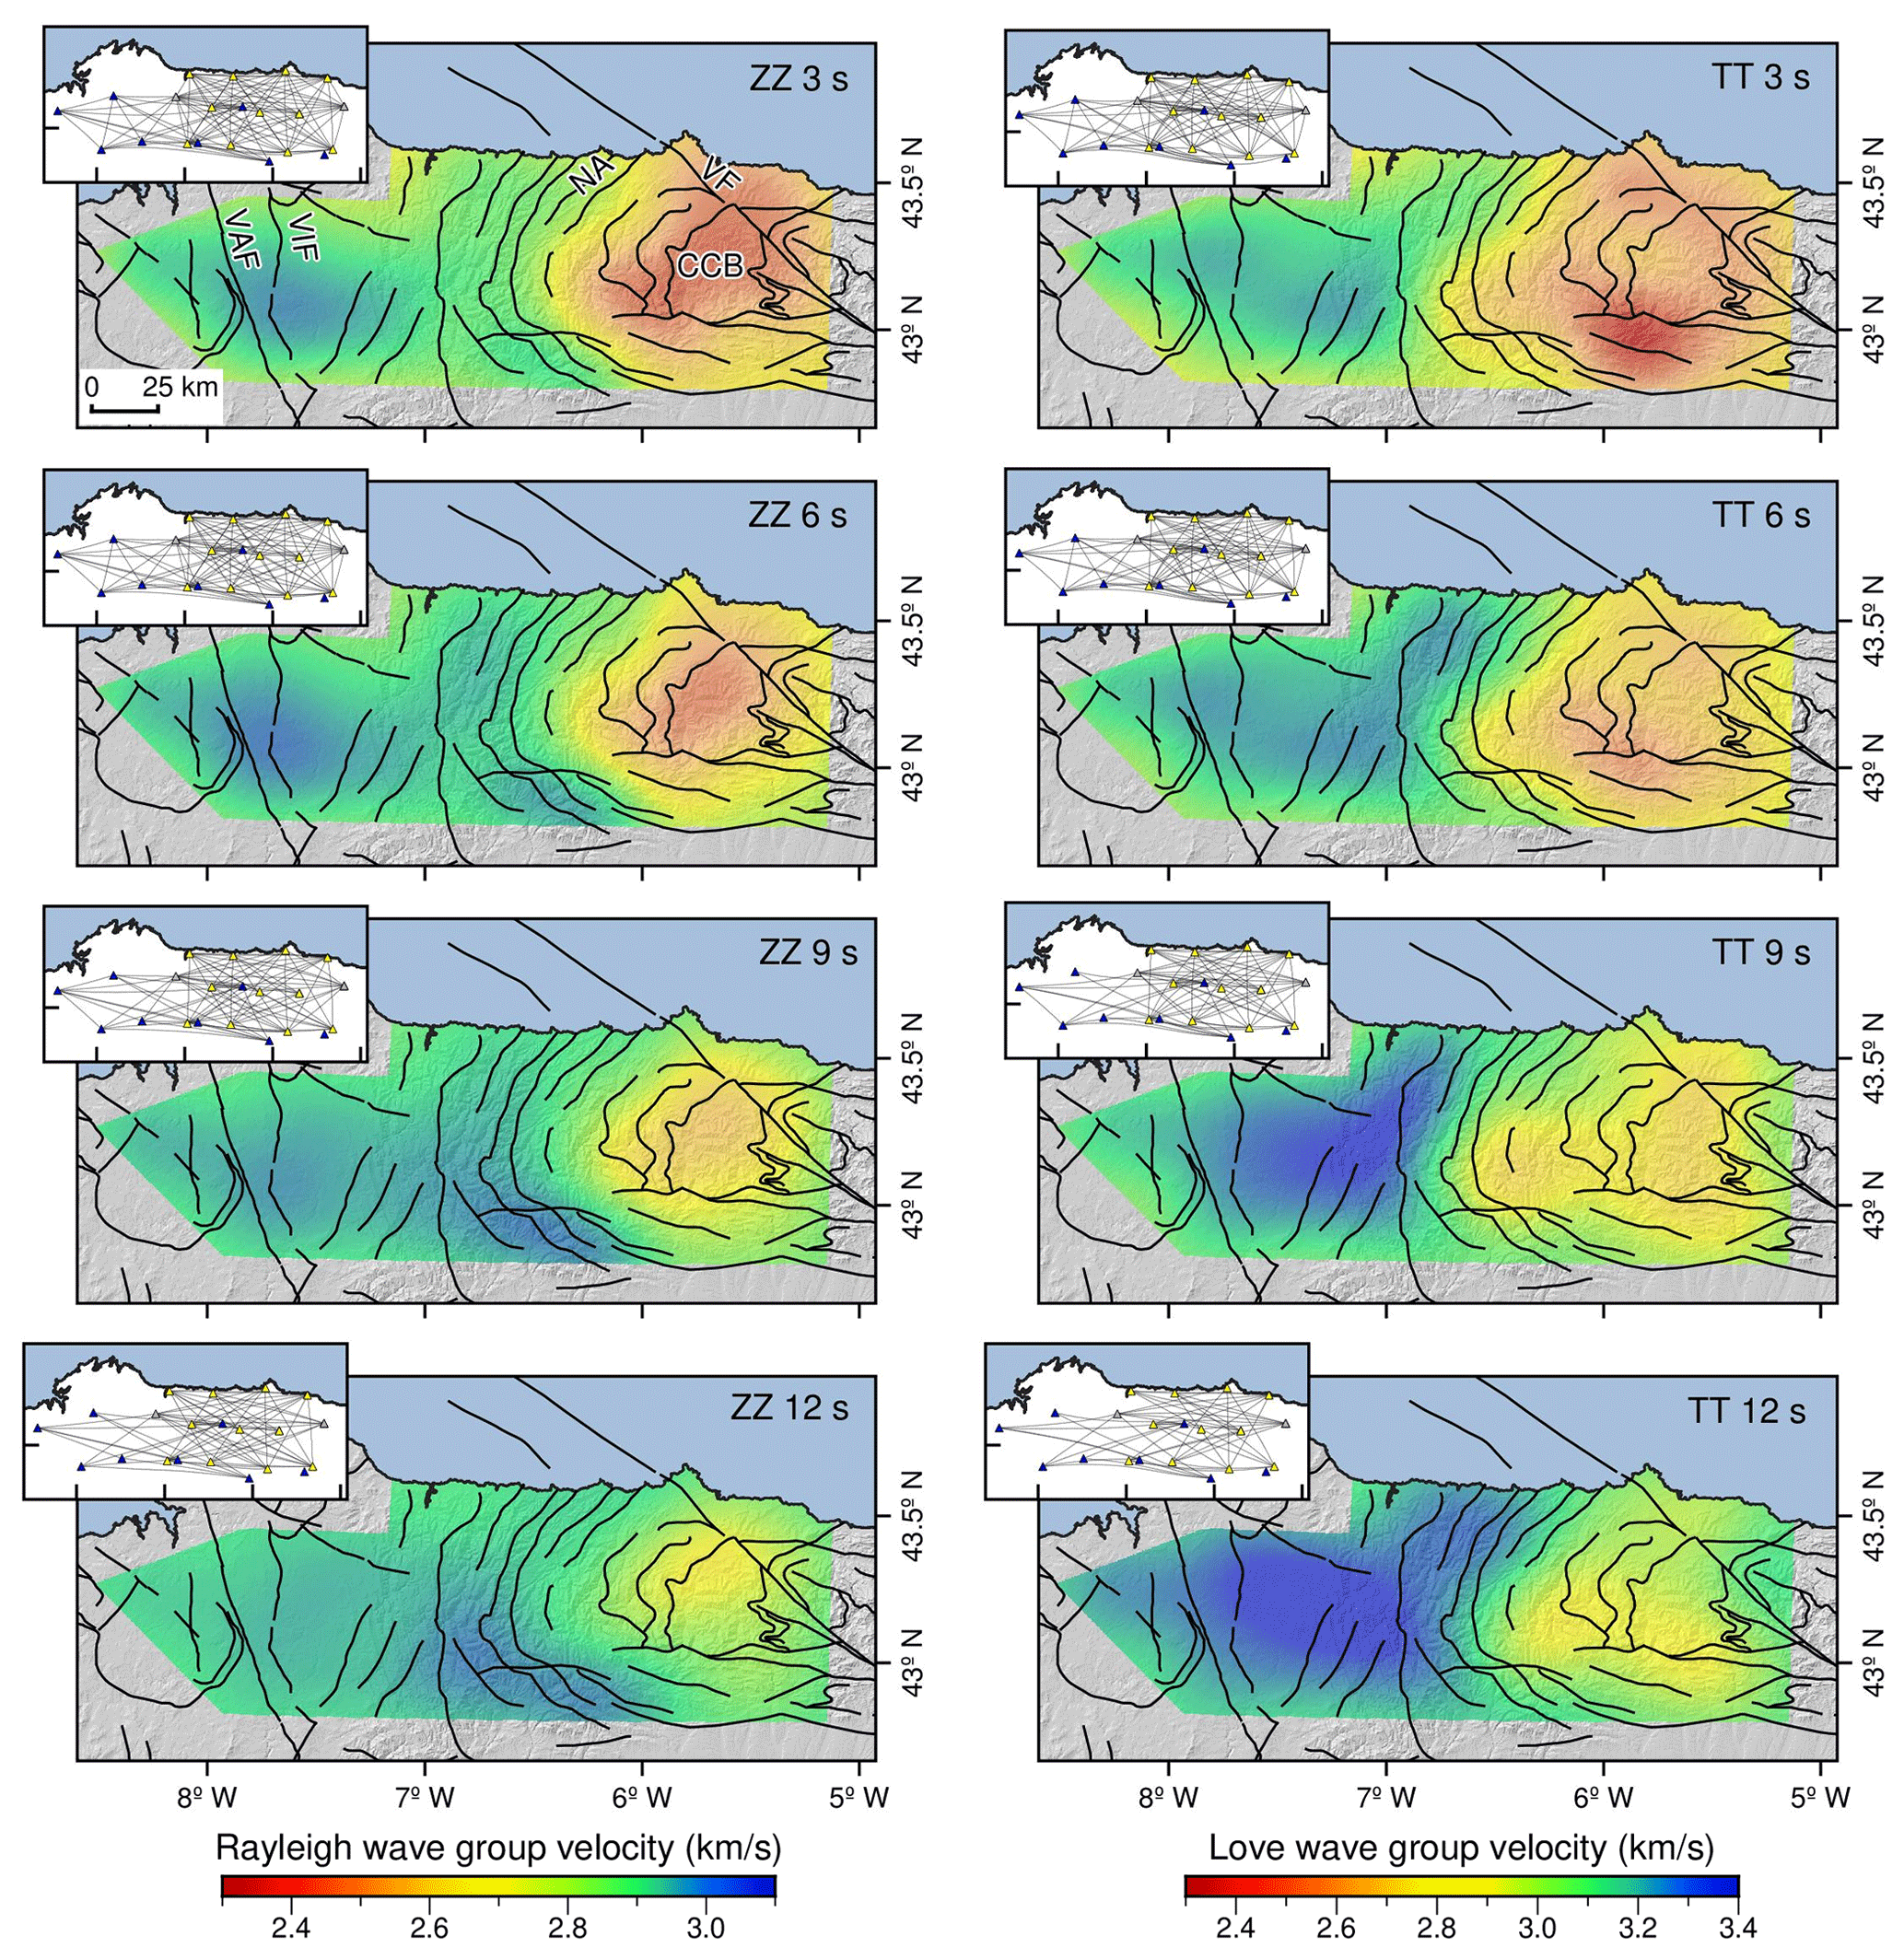
Figure 4Rayleigh (left panels) and Love (right panels) group velocity tomographic maps for 3, 6, 9, and 12 s periods. Black lines represent the main Alpine and Variscan faults. Insets depict the interstation paths used in each inversion. CCB: Central Coal Basin, NA: Narcea antiform, VF: Ventaniella fault, VIF: Vivero fault, VAF: Valdoviño fault.
Based on the set of tomographic group velocity maps, we created new pseudo-dispersion curves by extracting the Rayleigh and Love velocity values for each point of a 0.1∘ × 0.1∘ grid. The independent inversion of these curves with the Computer Programs in Seismology (CPS) surface inversion codes (Herrmann, 2013) allowed us to reconstruct the variation of Vsv and Vsh with depth in each grid node. In order to address the non-uniqueness of the inversions, we calculated two initial regional S-wave velocity models to be used as input in each of the subsequent computations. These models were obtained in a previous step from the separate inversion of the average Rayleigh and Love dispersion curves in the whole study area (Fig. 2e and f). We started in all cases from a homogeneous 22-layer model, the first 4 layers with a thickness of 0.5 km and the rest with a thickness of 1 km. Based on published studies in the area (Fernández-Viejo et al., 2000), we set a S-wave velocity of 3.35 km s−1 for each layer, with a fixed ratio of 1.74 and a density of 2600 kg m−3. The mismatch between the S-wave estimations from Rayleigh and Love waves allowed us to assess the intensity and distribution of the RA following Eq. (1):
(Yanovskaya et al., 1998; Savage, 1998; Ojo et al., 2017). All the inversions were performed with a damping factor of 10 in the first iterations to avoid an excessive shift from the initial model, whereas a value of 0.5 was used for the remaining iterations.
4.1 Rayleigh- and Love-wave group velocities
In total, we extracted Rayleigh and Love dispersion measurements of 78 station pairs from the GEOCSN network and 28 additional station pairs from the IberArray network. The 2-D tomographic maps displaying examples at selected periods of Rayleigh and Love group velocity variations can be observed in Fig. 4. Considering the Rayleigh waves (Fig. 4, left panels), the absolute group velocities range between 2.3 and 3.1 km s−1. On the other hand, Love waves (Fig. 4, right panels) show slightly faster velocities, varying between 2.3 and 3.4 km s−1. At all periods, both Rayleigh- and Love-derived maps image two clear blocks: a high-velocity zone occupying the western half of the study area and a relatively low-velocity zone in the eastern half. Both anomalies are separated by a narrow C-shaped transition sector, which follows the boundary between the CZ–WALZ and the surface trace of the main structures. The western anomaly presents high and moderately stable group velocities in the entire period range. On the contrary, group velocities in the eastern anomaly zone rise constantly as the period increases. The most noticeable difference between Rayleigh and Love maps lies in the shape of the western anomaly at the highest periods. At those periods, Rayleigh group velocities display a light decrease, and the high velocities tend to concentrate in the south. However, Love group velocities delineate a consistent large high-velocity surface in the western sector, while the low-velocity anomaly migrates towards the south.
The resolution of the final velocity slices was investigated by performing synthetic checkerboard tests (Figs. S3 and S4 in the Supplement). We used three models as a reference with small (20 km × 20 km), medium (30 km × 30 km), and large (40 km × 40 km) anomaly sizes and velocity perturbations of ± 0.4 km s−1. Then, we evaluated the performance of our array for recovering this previously known velocity structure at periods of 4, 8, and 12 s. For both Rayleigh and Love waves, at periods up to 8 s, the resolution is sufficient to resolve anomalies of ∼ 20 km in the central and eastern sectors of the study area and ∼ 30 km in the westernmost zone. At periods longer than 8 s, the resolution decays due to the progressive decrease in the number of interstation paths, and signs of smearing arise in the models. The average size of the recovered features increases to ∼ 30 km. At those long periods, the Rayleigh paths recovered more accurate models than the Love paths. The root mean square (rms) misfit between observed and predicted travel times ranged between 0.3 and 0.8 and between 0.7 and 1.2 s for the Rayleigh and Love waves, respectively, which indicates that the inverted models fit the observations, and they are not affected by the selection of the regularization parameters (Nicolson et al., 2012).

Figure 5Depth inversion results in three nodes of the grid located in different geological domains of the Iberian Variscan orogen. Left panels display the observed group velocity data (triangles) and the inverted model fit to the dispersion (dashed red line). Central panels show the initial and final S-wave velocity models from Rayleigh (left) and Love (right) waves, respectively. Panels to the right depict the radial anisotropy magnitude calculated with Eq. (1). (a) Example of inversion result in the Cantabrian Zone. (b) Example of inversion result in the West Asturian–Leonese Zone. (c) Example of inversion result in the Central Iberian and Galicia Tras-Ós-Montes zones. U: group velocity.
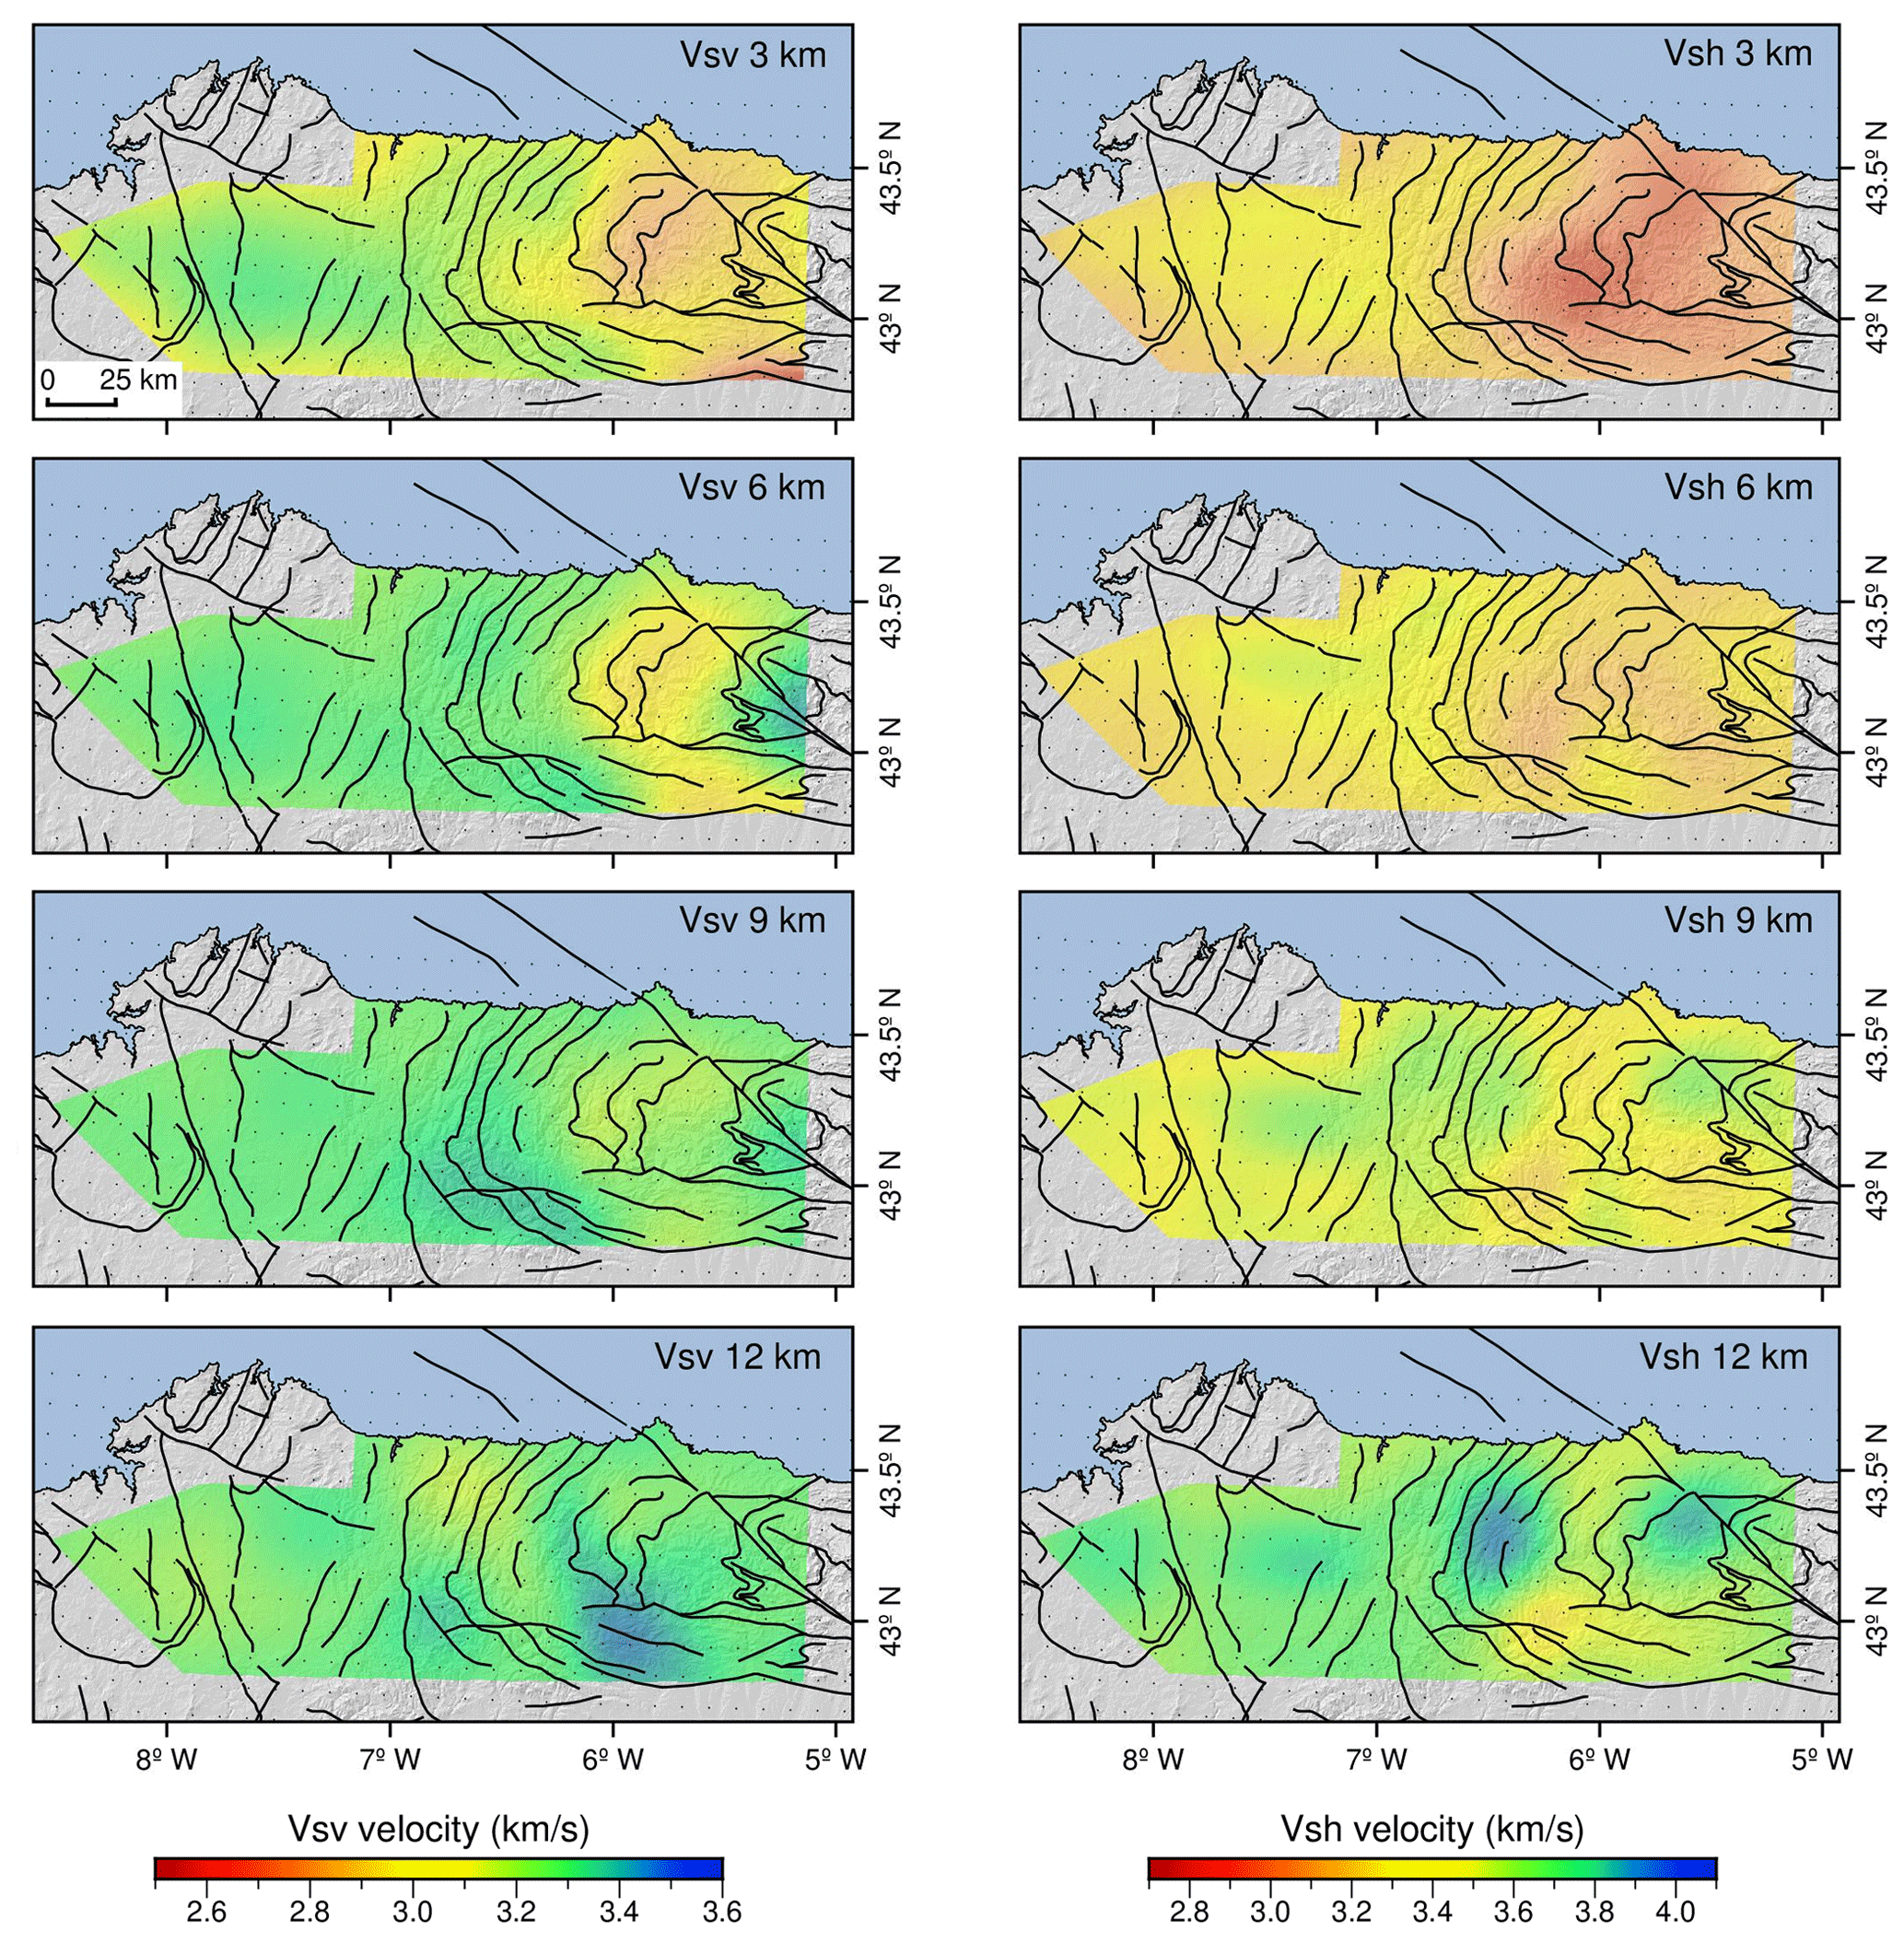
Figure 6Inverted Vsv (left panels) and Vsh (right panels) velocity tomographic maps for depths of 3, 6, 9, and 12 km. Black lines represent the main Alpine and Variscan faults. The point grid marks the position of each inverted Vs depth model.
4.2 Shear wave velocities
Figure 5 shows examples of the S-wave inversion results in specific grid points located in the CZ (Fig. 5a), the WALZ (Fig. 5b), and the CIZ+GTOMZ (Fig. 5c), featuring a good fit between the observed and inverted data. The models and the anisotropy characteristics from the WALZ and the CIZ+GTOMZ show similar patterns, whereas the CZ presents some peculiarities, such as a constantly increasing Vsv and Vsh velocity with depth and a pronounced negative radial anisotropy anomaly near the surface. Figure 6 shows examples of the variation of Vsv (Fig. 6, left panels) and Vsh (Fig. 6, right panels) at depths of 3, 6, 9, and 12 km. Within that depth range, the average Vsv increases from 3.0 to 3.4 km s−1, while average Vsh oscillates between 3.1 and 3.5 km s−1. Similarly to the group velocity maps, the presence of a low-velocity anomaly to the east of the study area stands out both in Vsv and Vsh maps, and its limit runs parallel to the curved boundary between the external and internal zones between the CZ and the WALZ. However, this anomaly attenuates at depth and finally disappears below ∼ 6 km. At greater depths (> 9 km) the correspondence between the features depicted in the Vsv and Vsh maps begins to fade away. In the Vsv surfaces, two new high-velocity anomalies emerge in the south. However, the Vsh maps depict high velocities in the western–central sector and in the northeastern corner.
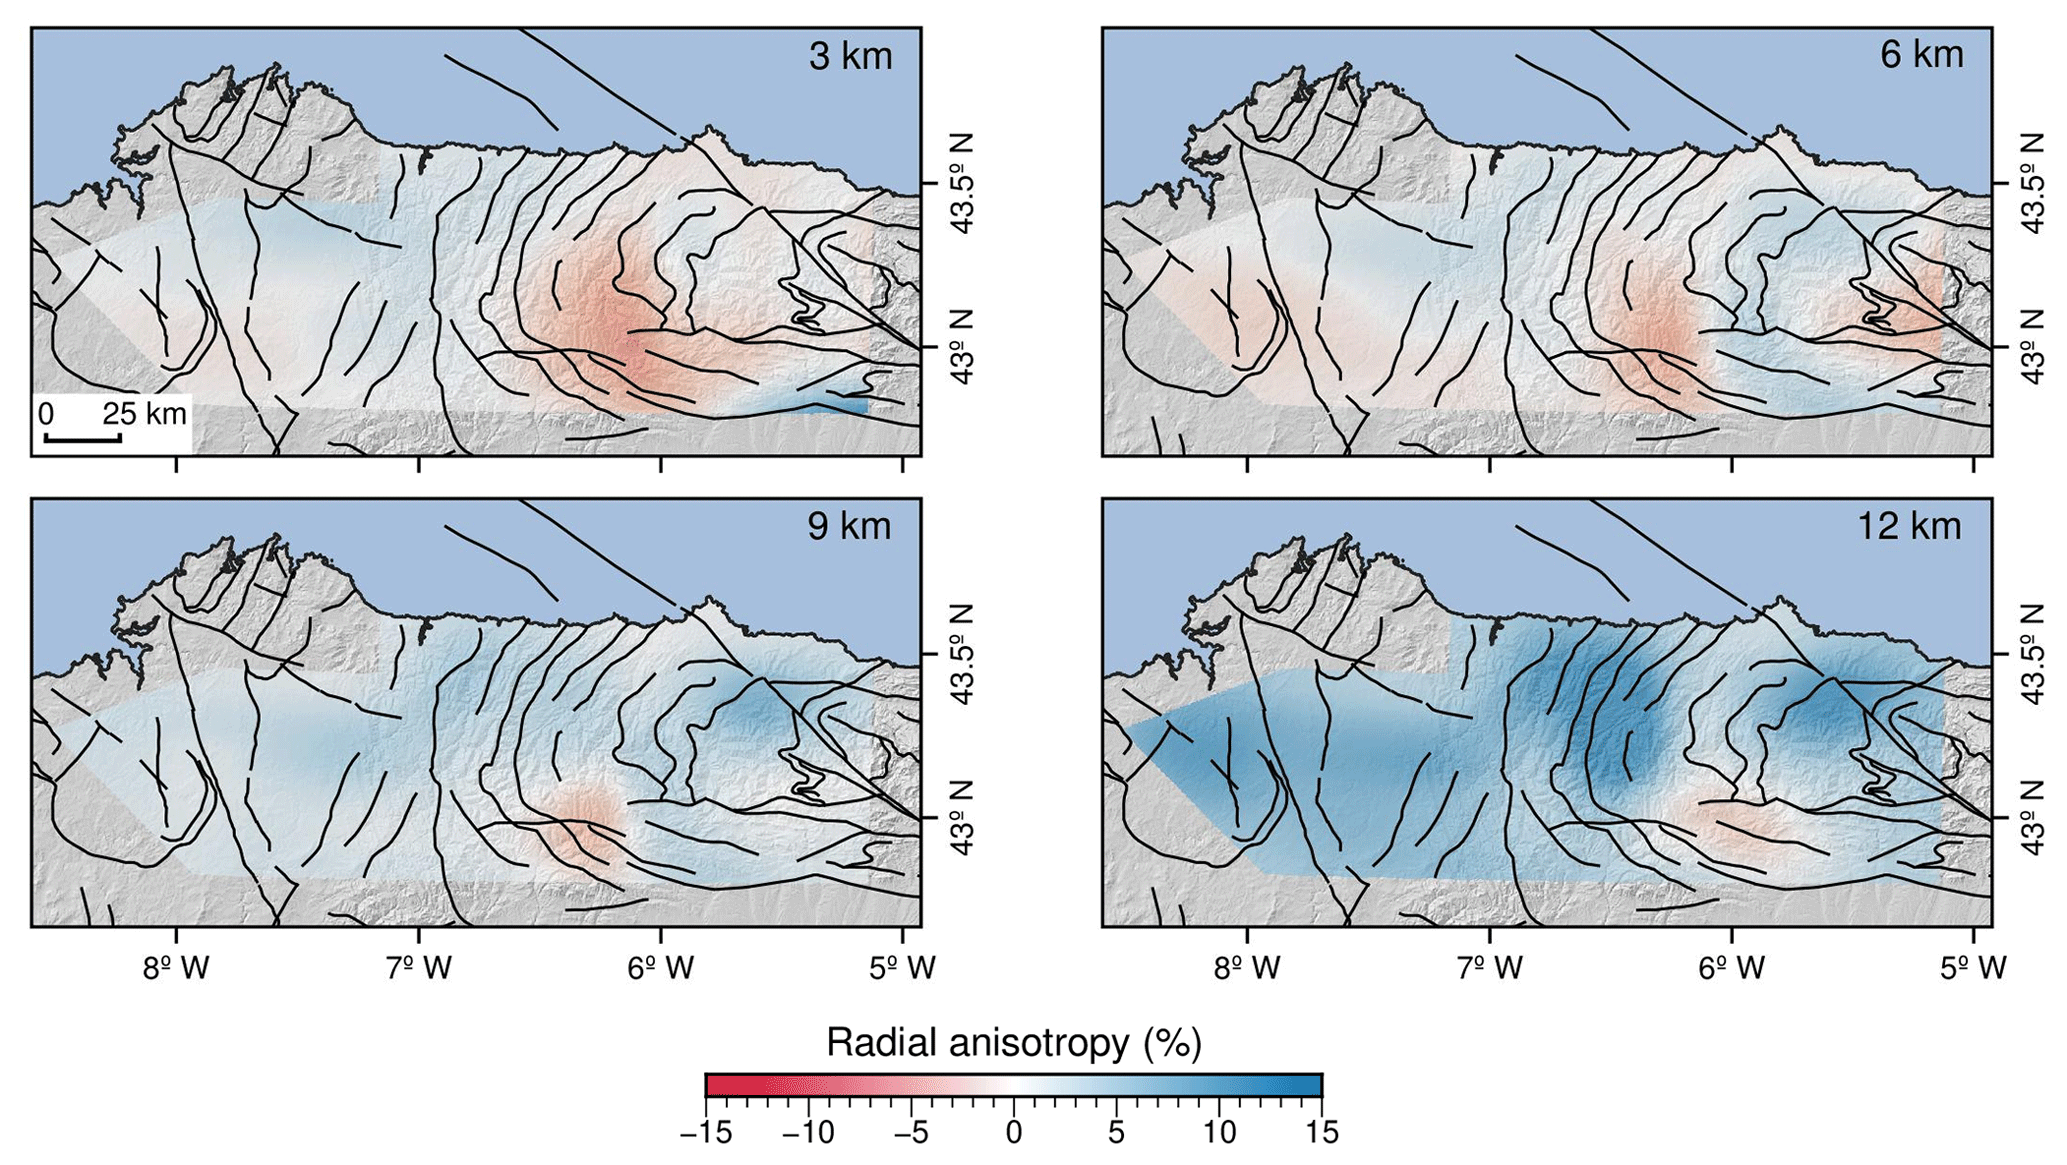
Figure 7Radial anisotropy maps for depths of 3, 6, 9, and 12 km. Black lines represent the main Alpine and Variscan faults.
4.3 Radial anisotropy
The spatial distribution of the radial anisotropy (Fig. 7) was calculated from the discrepancies between Vsv and Vsh in each node of the tomographic grid (Fig. 5a–c). In absolute values, the whole study area shows a significant anisotropy that reaches 10 %–15 % in certain areas. Nevertheless, there is a clear differentiation with depth. At depths shallower than ∼ 8 km the anisotropy strength keeps within the ± 6 % range. Beneath those depths, the anisotropy starts to rise up to ∼ 15 %. Negative anomalies (Vsv > Vsh) are dominant at shallow depths in the eastern half and the southwestern limit of the study area, with a weak positive corridor separating them. These negative anomalies become positive (Vsv < Vsh) at ∼ 6 and ∼ 8 km depths, respectively.
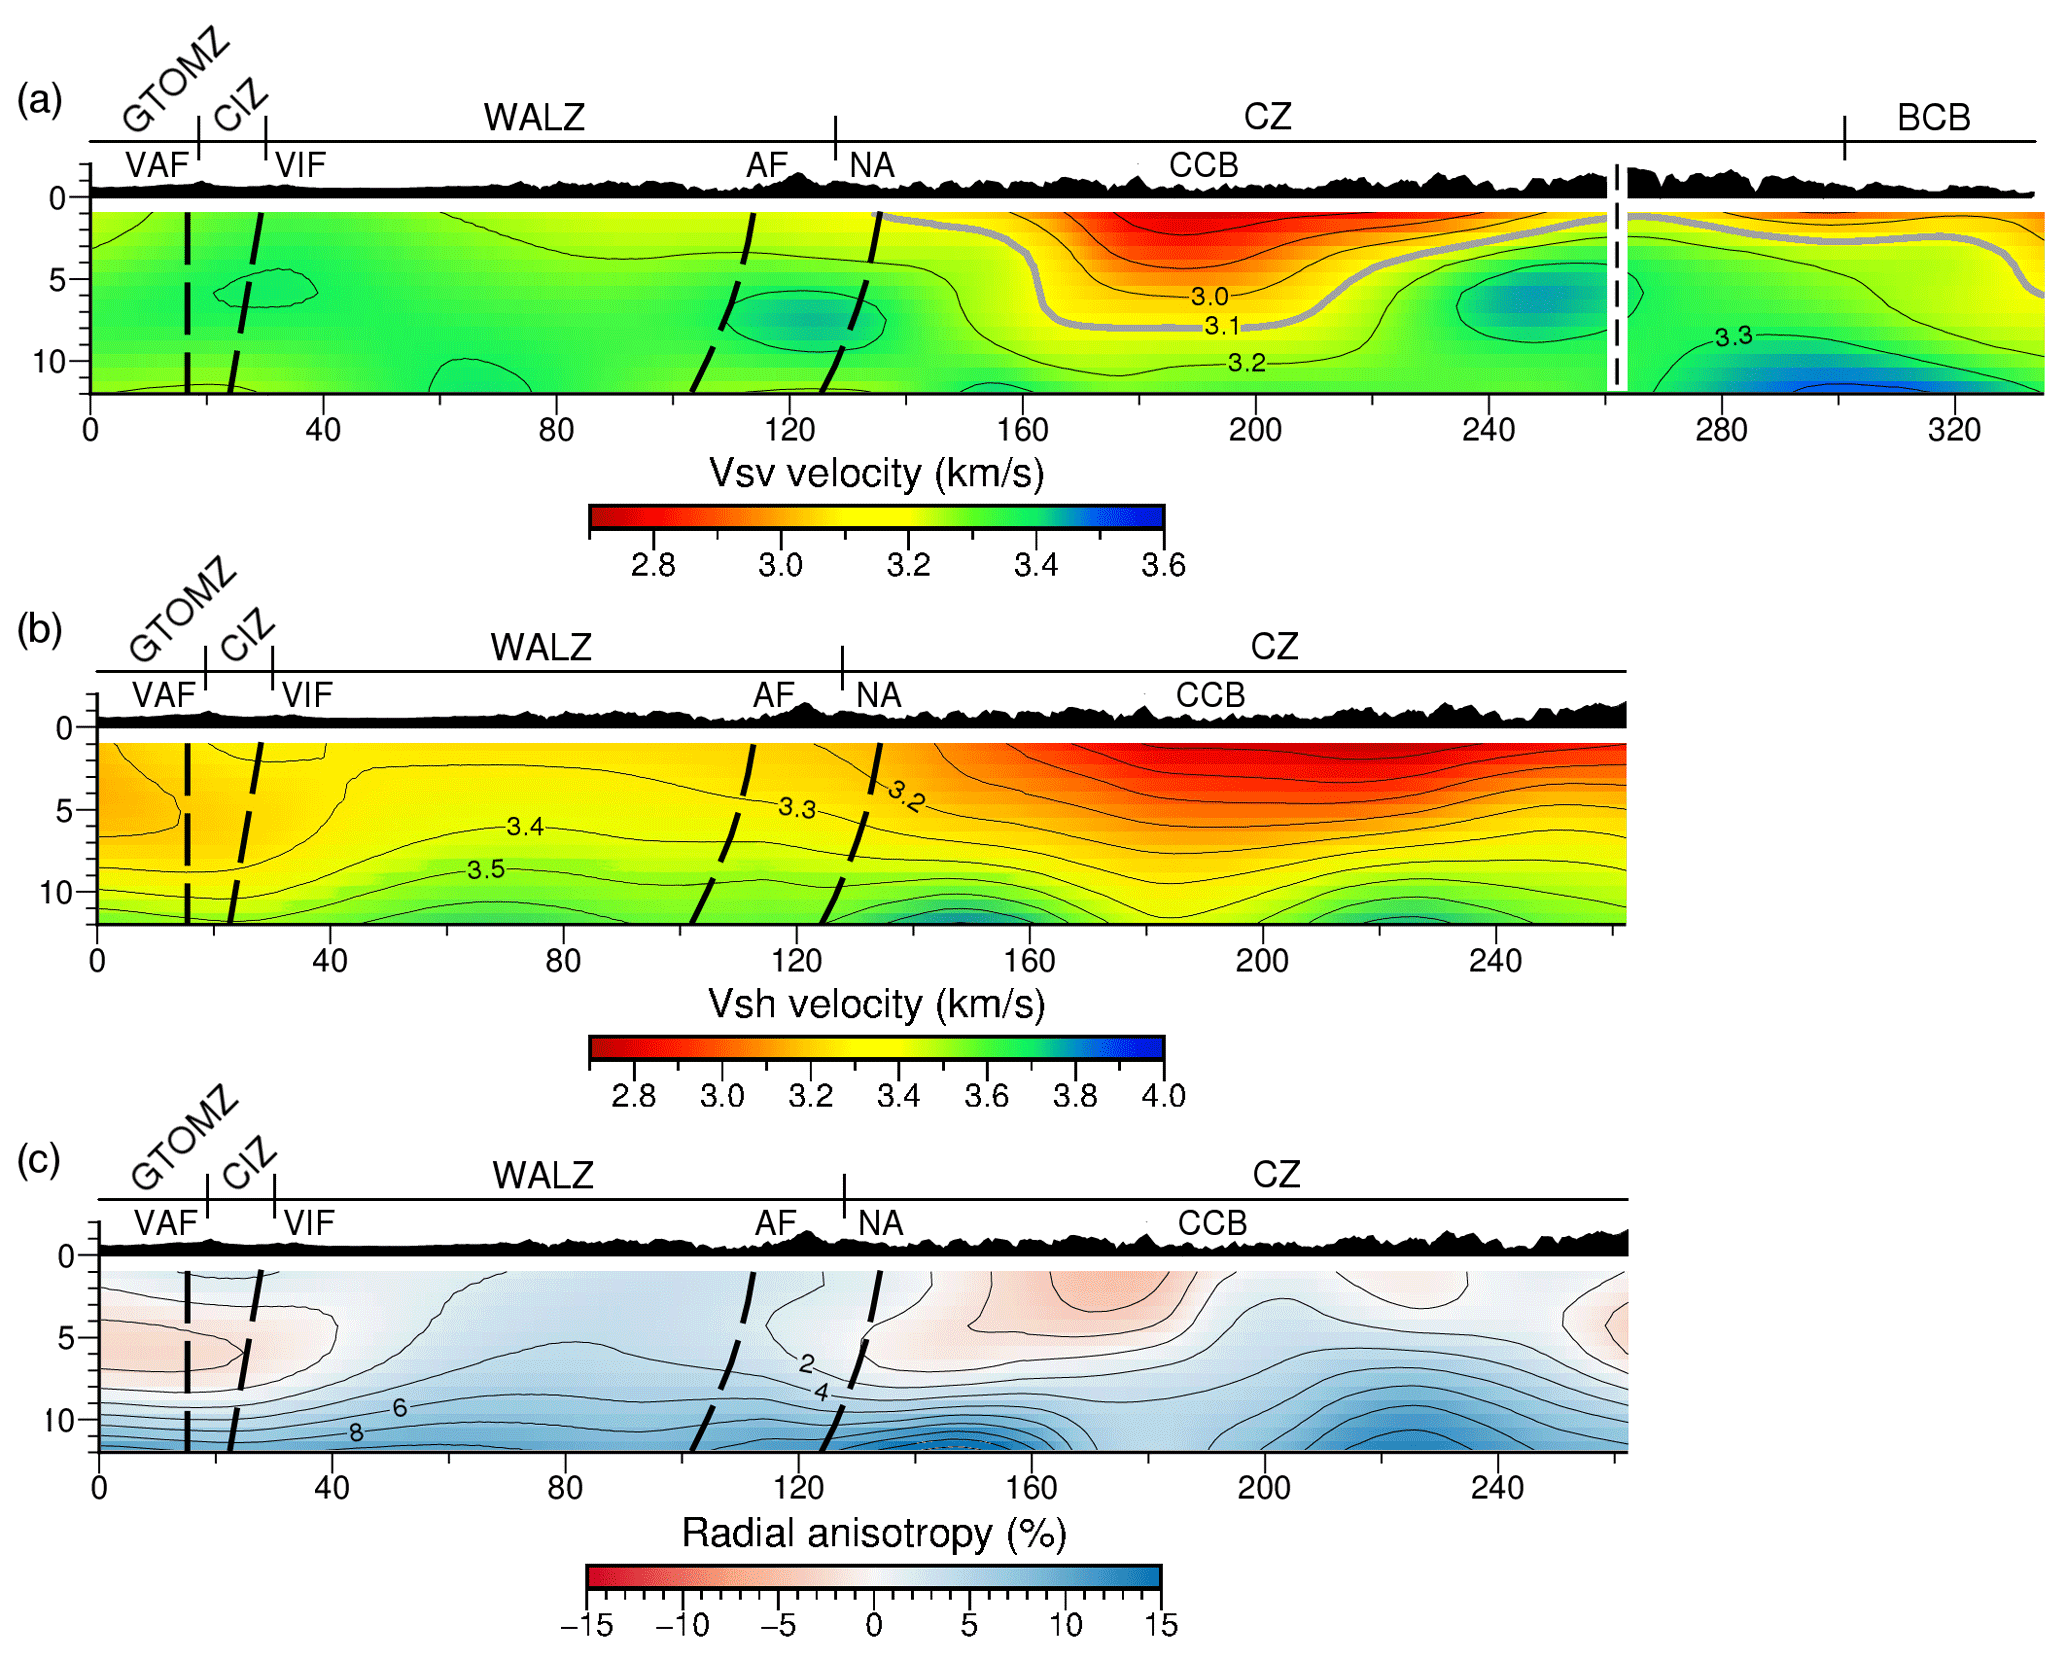
Figure 8Cross sections through the (a) Vsv, (b) Vsh, and (c) radial anisotropy models (location in Fig. 1), showing the topographic relief and the trace at depth of the structures that constitute the limits of the main geological domains. The Vsv cross section has been extended to the east using the model in Acevedo et al. (2019). The 3.1 km s−1 Vsv velocity contour, which marks the depth of the cover–pre-Variscan basement boundary, is highlighted in grey. CCB: Central Coal Basin, NA: Narcea antiform, AF: Allande fault, VIF: Vivero fault, VAF: Valdoviño fault.
In order to represent the velocity variations within the context of the Variscan structure of the CM, we constructed an E–W cross section that runs perpendicular to the main Variscan elements (Fig. 8). The most striking feature of the Vsv (Fig. 8a) and Vsh (Fig. 8b) cross sections is the low-velocity anomaly located in the east. The Vsh section shows a more extensive anomaly that coincides with the CZ. In the case of the Vsv section, the anomaly is more localized towards the sector where the syn-orogenic deposits of the Central Coal Basin (CCB) are present. The previous S-wave tomography in Acevedo et al. (2019) allowed us to extend the Vsv section to the transition between the CZ and the Basque Cantabrian Basin (BCB). The higher velocities in both sections show a good correlation with the expected distribution of the Precambrian basement. In general, the internal zones show a more homogeneous velocity pattern, although Vsv is quite constant and Vsh depicts a velocity increase with depth. The latter type of waves also register a slight reduction of velocity in the GTOMZ and CIZ domains in comparison with the WALZ. The distribution of anisotropy in the E–W section (Figs. 8c and 9) also shows a strong correlation with the main geological domains (Figs. 1 and 8c). The mentioned positive corridor roughly coincides with the WALZ, while the negative patches are limited by the Vivero fault, which marks the beginning of the CIZ, and the Narcea antiform. To the east of the latter structure, the negative anisotropy is only observed in the part of the CZ where syn-orogenic deposits are absent. On the other hand, the high positive anisotropies are roughly consistent with the presence of the lower Paleozoic and Precambrian basement rocks at depth.
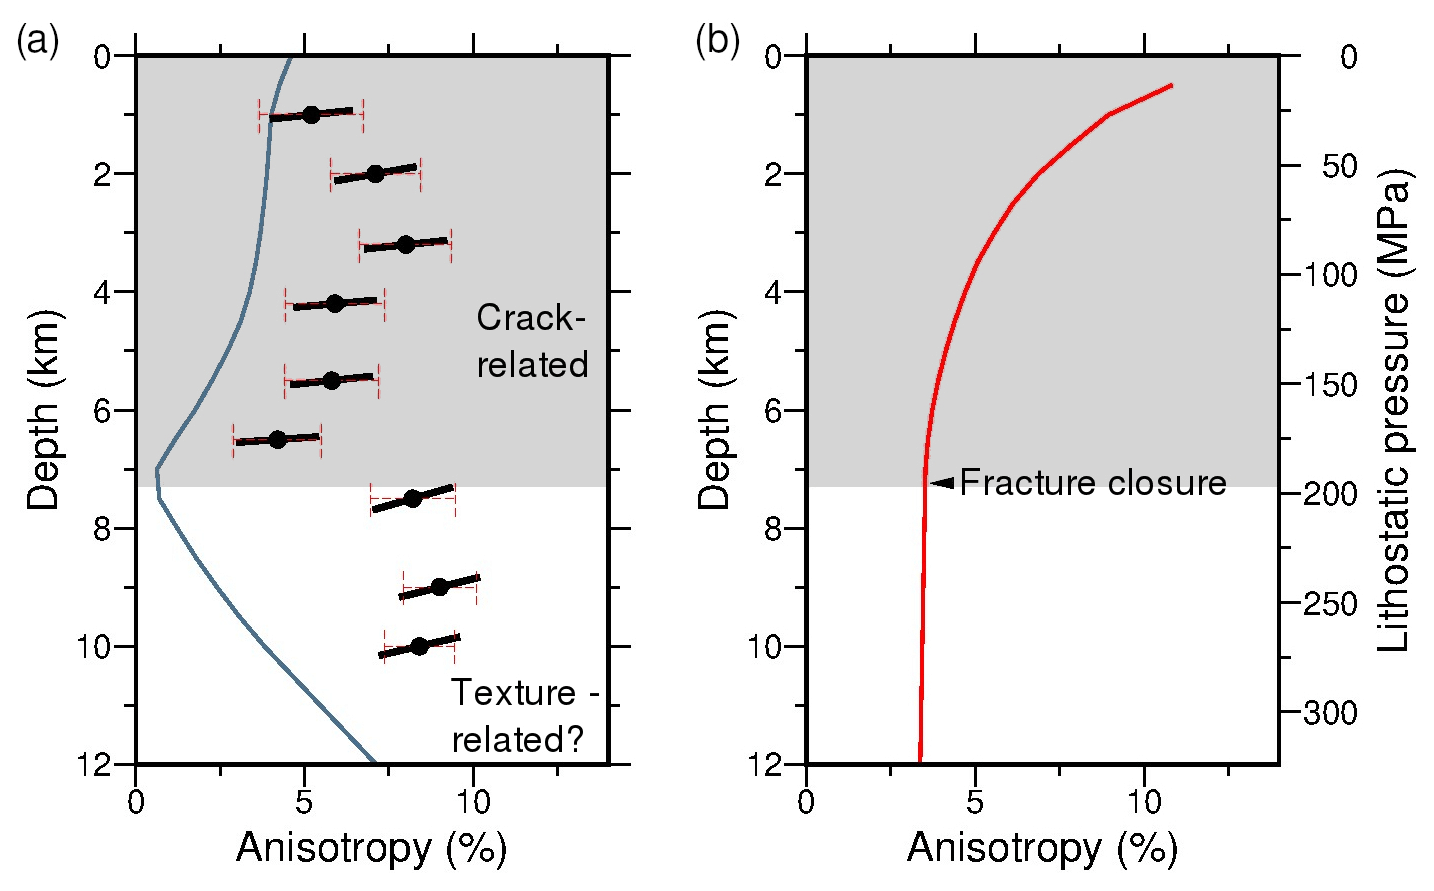
Figure 9(a) Comparison between the absolute value of the radial anisotropy magnitude measured in a representative node of the CZ (blue continuous line) and the azimuthal anisotropy estimations (black dots) from Acevedo et al. (2020). The orientation of the black bars depicts the azimuthal fast directions. Error bars (red dashed lines) represent 2 standard deviations of the anisotropy magnitude. The period–depth conversion of the azimuthal anisotropy determinations is based on the sensitivity kernels in Acevedo et al. (2019). (b) General dependence of seismic anisotropy in rocks with respect to lithostatic pressure (based on laboratory measurements of S-wave velocities obtained in high-grade metamorphic rocks from NW Spain in Brown et al., 2009). The grey area in both panels indicates the depths at which seismic anisotropy is controlled by the existence of open cracks.
Tomographic maps in Fig. 6 depict the first high-resolution S-wave models of the transition between the internal and external parts of the Variscan orogen in NW Iberia. Considering the sensitivity of the method (Fig. S5 in the Supplement), the discussion of the results is restricted to the first 12 km of the crust. In addition, at the investigated periods (< 14 s) Love waves are primarily sensitive to the uppermost crust, while the sensitivity peak of Rayleigh waves deepens as the period increases. The following discussions are only focused on well-resolved areas from the checkerboard tests (Figs. S3 and S4).
5.1 Velocity structure in the upper crust
In previous ambient noise regional studies on the Iberian Peninsula, Macquet et al. (2014) and Palomeras et al. (2017) reported S-wave velocity values at 5 km depths ranging between 2.5 and 3.5 km s−1 in the study area. Likewise, a recent work centered in the BCB also obtained this velocity range for the upper crust in the eastern termination of the CZ (Olivar-Castaño et al., 2020). Silveira (2013) and Palomeras et al. (2017) identified a first-order anomaly, which corresponds with the Iberian Massif, and recognized some of the tectonic units that constitute it. However, due to resolution limitations, the transition between the internal and external zones was poorly constrained. In contrast, the most striking element in both surface wave group and shear velocity models presented here is the precise delineation of the boundary between these domains by a sharp velocity change (Figs. 4 and 6).
The contour of this limit depicts a clear convex-to-the-west shape with the CZ located at its core. The contact between the high-velocity anomaly to the west and the low-velocity anomaly to the east is parallel to the Narcea antiform (NA), which is the structure that marks the boundary between the hinterland and the external zones of the Variscan orogen (Fig. 1) (Gutiérrez-Alonso, 1992; Pérez-Estaún et al., 1994). The presence of rocks with completely different physical properties at both sides of the eastern boundary of the NA justifies the observed velocity contrast. The CZ represents the foreland fold-and-thrust belt of the Variscan orogen, constituted by a pre-orogenic sedimentary sequence deformed in a thin-skinned deformation context, and a syn-orogenic clastic sequence that was deposited during the formation of the orogen. On the other hand, the slate belt to the west is a relatively homogeneous domain mainly composed of siliciclastic rocks affected by regional deformation fabric formed at low-grade metamorphic conditions. In summary, the upper crust in the CZ is essentially made of sedimentary rocks without metamorphism, while the upper crust in the NA and the WALZ slate belt is composed of igneous and volcanic rocks in the NA and low-grade metamorphics towards the west, generating a clear contrast in the intrinsic physical properties of the rocks reflected in the crustal velocity patterns observed.
The sedimentary rocks of the CZ display relatively low S-wave velocities typically under 3.0 km s−1 in the Vsv models or 3.2 km s−1 in the Vsh estimations. The profile in Fig. 8a displays a good correspondence between the lower velocities and the location of the siliciclastic wedges of syn-orogenic sediments. In fact, the low-velocity anomaly reaches its greater thickness of around 5 km in the CCB, the largest of these wedges. The depth estimation in the CCB is consistent with previous interpretations (Aller and Gallastegui, 1995). Towards the west, both the Vsv and Vsh models depict high velocities. Vsv remains constant at about 3.3 km s−1, while Vsh increases steadily with depth (Fig. 6). The rock sequences in the WALZ are quite homogeneous, although in the cross section in Fig. 8a some high-velocity patches can be identified at depths of 5–9 km. The anomaly located close to the orogenic boundary is related to the stack and thrusting of rigid lower Paleozoic and pre-Variscan basement rocks from the NA (Pérez-Estaún et al., 1994) and the exhumation of basement rocks, gneiss, and pre-Variscan igneous rocks between the NA and the Allande fault (Marcos and Pulgar, 1982; Rubio-Ordóñez et al., 2015). A smaller high-velocity anomaly, in the west, is located near the Vivero fault (Fig. 8a) (López-Sánchez et al., 2015). High velocities were expected in this area due to the presence of mafic rocks and Variscan granitoids. However, the Vsh profile (Fig. 8b) registers a velocity reduction in this domain, maybe caused by the fact that the resolution in the edges of the models decays and velocities are less well constrained. The basement rocks at the surface also show pervasive fracturing and weathering, strongly affecting velocities.
5.2 Thickness of the sedimentary layer and basement depth
A significant result from S-wave models is the estimation of the thickness of the sedimentary layer. In Macquet et al. (2014), an S-wave velocity value of 2.9 km s−1 is proposed to indicate the limit between the basement and the sedimentary cover. In our case, this velocity defines the position of the syn-orogenic sequence in the CZ, the presence of small Permo-Triassic basins in the CZ–BCB transition, and the presence of Mesozoic sediments in the BCB quite well but fails to recover the depth of the basement. The main detachment of the CZ is believed to be located near the Precambrian–Cambrian boundary (Pérez-Estaún et al., 1988). Taking into account that the pre-Variscan basement rocks are exposed in the NA and show velocities around 3.1 km s−1 in Fig. 8a, we considered this to be a more appropriate value to estimate the depth of the basement-cover surface in our study area to infer the position of the detachment. The 3.1 km s−1 iso-velocity line initiates in the NA area. It stretches towards the east for 20 km at shallow depths, and then it sinks almost vertically until reaching 8 km. This deepening coincides with the maximum eastern extension of the pre-Variscan rocks at depth. Continuing to the east, the surface dips smoothly to the west and alternates ramps and flats until reaching depths of 1 km to the west of the Ventaniella fault. In the extension in Fig. 8a, based on the Vsv model of Acevedo et al. (2019), the iso-velocity line deepens again, showing an apparent dip towards the east. This change is related to the different structure of the CZ–BCB transition, which was mainly configured by the Alpine inversion of Mesozoic extensional faults (e.g., Espina, 1997; Tavani et al., 2011). If we consider that the 3.1 km s−1 surface depicts the location of the base detachment of the CZ, its greatest depth ranges around 8–9 km. This observation agrees with the studies of Pérez-Estaún et al. (1988, 1991, 1994), although it is slightly shallower than the estimations of Gallastegui et al. (1997) and Gallastegui (2000).
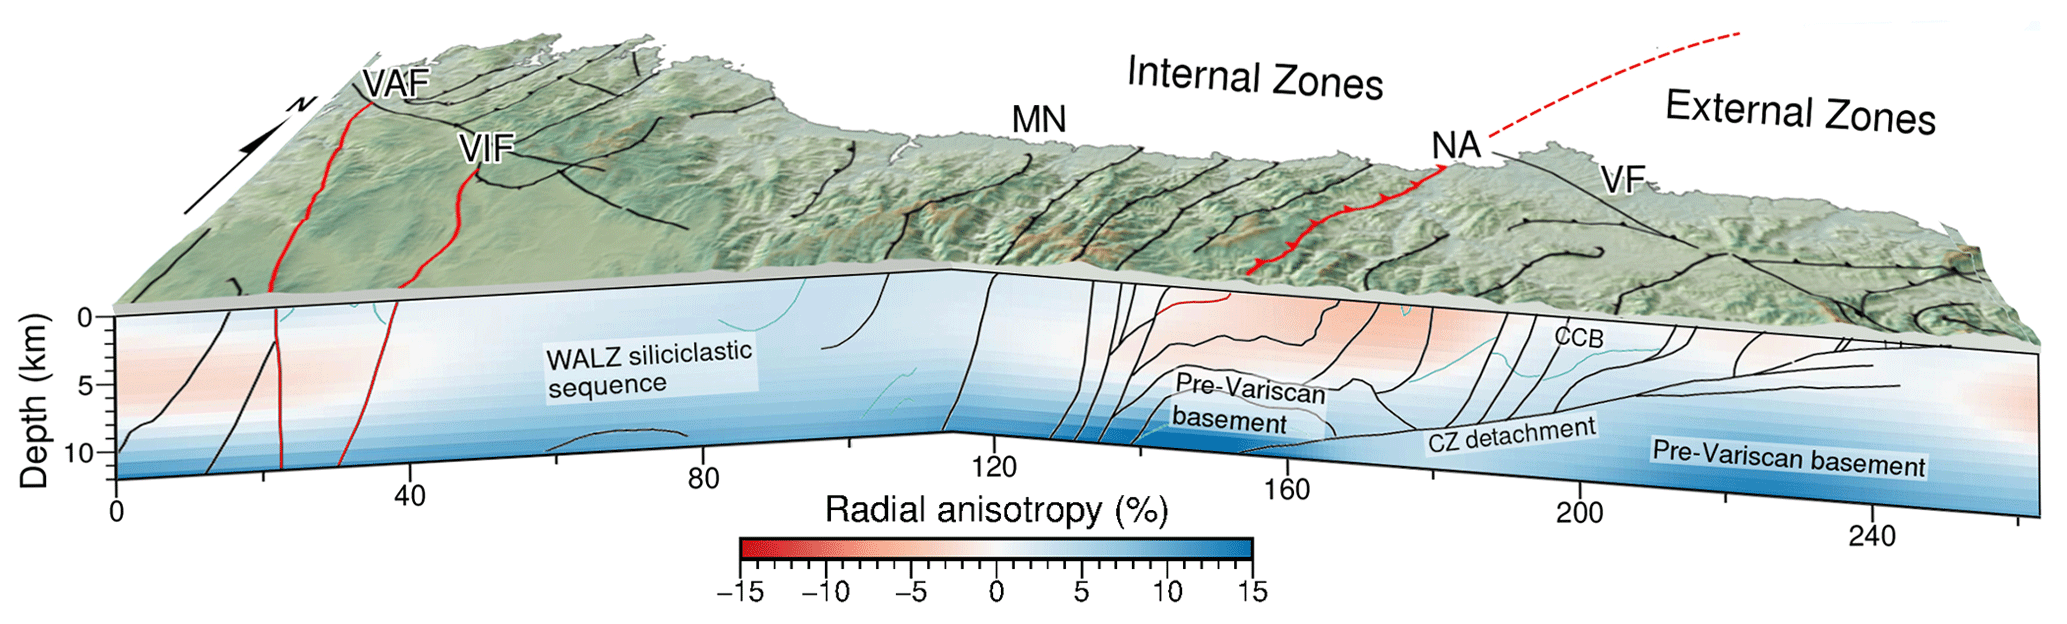
Figure 10Schematic 3-D block showing the upper-crustal radial anisotropy variation across an E–W transect of the upper crust in NW Iberia. The main structural features are superimposed based on Pérez-Estaún et al. (1991). Red lines indicate the structures that bound the main Variscan domains displayed in Fig. 1. The location of the cross section is highlighted in Fig. 1a. CCB: Central Coal Basin, VF: Ventaniella fault, MN: Mondoñedo nappe, VIF: Vivero fault, VAF: Valdoviño fault.
5.3 Radial anisotropy
From the relation between Vsv and Vsh in Eq. (1) we have obtained the first model of RA in the continental upper crust in NW Iberia (Figs. 7, 8c, 9, and 10). Overall, the RA patterns display a fair correspondence with the main Variscan tectonic units, at least in the shallowest crust (< 7 km). At those depths, the distribution of the RA negative anomalies bound the GTOMZ–CIZ and the CZ, whereas in the WALZ a constant positive anisotropy is observed (Fig. 8c). The sign of the RA is related to the inclination of the anisotropic features. Thereby, a negative RA implies the presence of steeply dipping to subvertical structures (60–90∘), while a positive RA suggest gently dipping to horizontal features (0–30∘, Dreiling et al., 2018; Xie et al., 2013). Thus, in the CZ, the negative anomaly can be explained by the verticalization of Variscan nappes and other structures, as well as the retightening of folds caused by the Alpine convergence, which was more intense in this domain than in any other. Moreover, the presence of a N–S-oriented pervasive Alpine fracture system with subvertical dip has been recognized in the area and may play a significant role in the development of the anisotropy.
As the depth increases, the thrusts reduce their dip as they approach their imbrication with the CZ basal detachment (Pérez-Estaún et al., 1991), which is reflected in the progressive shift to a positive anomaly (Fig. 8c). There are two factors that suggest that this change can be provoked by the presence of a basal detachment at those depths. First, the positive RA points towards the presence of smoothly dipping anisotropic features. Second, the RA sign inversion occurs at greater depths beneath the western CZ than the eastern CZ, where the positive anomaly gets close to the surface. This point implies the presence of a possible structure with a general dip towards the west. Laterally, RA sign variations are also present, as in the transition between the CZ and the WALZ. From the Narcea antiform to the Mondoñedo thrust, subvertical structures are dominant, but the existence of a Variscan subhorizontal foliation parallel to the fold axis may compensate for their effect and explain the slightly positive anomaly instead of the expected negative anisotropy. To the west of the Mondoñedo thrust (MT), in the CIZ and the GTOMZ, the structures and foliation are mainly gently dipping, contrasting with the presence of a negative RA anomaly that spreads from the surface to a depth of 8 km. Strong subvertical deformation fabric related to late Variscan shear zones and folds (Llana-Fúnez and Marcos, 2007) as well as N–S fracture systems associated with the Alpine convergence have been reported in the area, but the resolution of the models at their edges is not optimal and further studies should be carried out to verify the existence of such a negative anomaly.
In general, the magnitude of the RA is low, around 4 %, at shallow depths (< 8 km). Considering the entire range of investigated depths, except for the WALZ, where the RA magnitude increases almost steadily, a progressive decrease followed by a rapid increment of the RA anisotropy magnitude is observed in the CIZ–GTOMZ and the CZ (Fig. 8c). The latter domain was also targeted by a previous ambient-noise-based study that estimated the azimuthal anisotropy in the area (Acevedo et al., 2020). A comparison between the RA measured in a representative CZ node and the azimuthal anisotropy determinations is displayed in Fig. 9a. Despite some discrepancies in their magnitude at shallow depths (< 3 km), both azimuthal and radial anisotropy depict a decline at depths ranging from ∼ 3 to ∼ 7 km. At greater depths, the RA rises gradually until it reaches magnitudes around 9 % at 12 km, while azimuthal anisotropy increases abruptly at a depth of 7.5 km and stabilizes at 9 %. The progressive closure of the open cracks due to the increment of the lithostatic pressure can explain the observed radial and azimuthal anisotropy magnitude reduction at shallow depths (Fig. 9a and b). In crystalline low-porosity rocks, the complete closure of microcracks at grain boundaries is observed in laboratory experiments at about ∼ 200 MPa, which is equivalent to depths around 7 km (e.g., Christensen, 1985; Brown et al., 2009; Guo et al., 2014) and coincides with both the radial and the azimuthal anisotropy minimums (Fig. 9b).
At shallow depths (< 5–10 km), the RA is believed to be caused by the alignment of stress- (Crampin, 1978; Crampin and Peacock, 2005) or structure-induced fluid-saturated cracks (Zinke and Zoback, 2000). The fast anisotropic directions obtained from shear wave splitting in Acevedo et al. (2020), which tend to align parallel to major structures, favor a structure-controlled anisotropy model for the CZ. What is more, although the Alpine deformation did not produce pervasive deformation in NW Iberia, it generated shallow fracture systems that can decisively affect the physical properties of the rocks near the surface, especially in the CZ and the CIZ–GTOMZ. On the other hand, in the case of slates from the WALZ, recent laboratory data have shown that the magnitude of the anisotropy increases with the decrease in confining pressure, as the orientation of the microcracks is strongly controlled by the shape fabric in very well-foliated slates (Cárdenes et al., 2021). However, this means that another origin must be invoked to produce the RA magnitude increment at higher depths (Fig. 9a). As depicted in Fig. 1, the crystalline basement rock outcrops in the WALZ, showing an anisotropy that increases from 2 % to 15 % in depth. These Precambrian rocks, as well as the lower Paleozoic pre-Variscan siliciclastic sequences that form the WALZ and constitute the basement of the CZ, are affected by low-grade metamorphism and the development of a widespread tectonic foliation. Anisotropic minerals, such as phyllosilicates, are common in these rocks, so the alignment of minerals and grains (Wenk et al., 2020; Cárdenes et al., 2021) seems to be the most likely mechanism controlling the anisotropy in the study area and at depths > 7.5–8 km. In the CZ, this change in the deformation and tectonic history of the rocks controlling the anisotropy is also reflected in the fast azimuthal directions. At depths < 7.5 km, they remain steady at around 84∘, whereas at depths at which the pre-Variscan basement gains influence in the results (> 7.5 km) a progressive NE rotation (∼ 70∘) can be noticed (Fig. 9a).
Many studies have tried to establish the linkage between tectonic regimes and RA patterns (e.g., Luo et al., 2013; Dreilling et al., 2018; Wang et al., 2020). Generally, compressional and extensional regimes are associated with the vertical and horizontal alignment of cracks and minerals, respectively. However, the specific geodynamic setting of each location must be considered, given that both regimes can produce very different anisotropy signatures. The presence of negative RA at shallow depths in foreland fold-and-thrust belts has been observed in orogens worldwide. For example, Chen et al. (2009) and Guo et al. (2012) reported negative RAs in the Himalayan fold–thrust belt. Recently, Wang et al. (2020) described a widespread negative anomaly of ∼ 5 % below the foreland belt of the Canadian Cordillera that turns into a positive anomaly in the Omineca Belt, the hinterland of the orogen. These authors suggest that the RA in the foreland fold-and-thrust belts is caused by the horizontal contraction of the upper crust, which creates subvertical faults and/or preferential alignments of minerals under convergent regimes. The continuity of the negative anomaly at depths up to 20 km allowed them to infer a “thick-skinned” cordillera–craton transition. Contrarily, in our model, the negative anomaly in the CZ is distinctly limited at depth (Fig. 10), pointing to a “thin-skinned” style of deformation, in accordance with previous studies (e.g., Pérez-Estaún et al., 1994). On the other hand, positive anisotropy in the hinterland is usually associated with horizontally sheared fabrics, which in the case of the Variscan orogen could have either been caused during pervasive deformation associated with plate duplication in convergence (e.g., Martínez-Catalán et al., 1997) or by syn- or post-collisional localized crustal extension, as reported for the Mondoñedo thrust (Marcos, 2013). Ductile crustal flow has also been invoked as the origin of positive RA anomalies, mostly in the middle and lower crust (Lynner et al., 2018), and this has also been suggested to occur at the late stages of the Variscan orogeny for a significant part of the hinterland of the Variscan orogeny in NW Iberia (Llana-Fúnez and Marcos, 2007).
In this study, we used group velocity measurements from Rayleigh and Love waves to derive the first S-wave velocity model of the continental crust in NW Iberia. An independent inversion of the Rayleigh and Love group velocity estimations was done to create a vertically polarized S-wave model and a horizontally polarized S-wave model, respectively. The first model displayed velocities between 2.3 and 3.6 km s−1, while the velocities of the latter ranged between 2.6 and 4.2 km s−1. Both models clearly depict the contrast in physical properties between the rocks located in the external (CZ) and internal (WALZ, CIZ, and GTOMZ) zones of the Iberian Variscan orogen, delineating the core of the large western European Variscan Belt: the core of the Ibero-Armorican arc at the Cantabrian Zone. Moreover, the high resolution of the models and the good existing geological knowledge of the area allowed us to associate the observed velocity changes with the variation of the bulk properties of the rocks caused by other first-order orogenic structures (such as the basal detachment of the CZ or the presence of a pre-Variscan basement in the NA) or sedimentary features such as the presence of syn-orogenic wedges in the CZ.
The crustal radial anisotropy 3-D model has proven useful to identify and characterize the different sectors and units that form an orogenic belt and show good correspondence with the dip of the main structures. The anisotropy pattern can also be associated with the deformation history of the orogen. A negative anomaly is found in the foreland fold-and-thrust belt, which can be related to the stack of thrusts and vertical fabrics caused by compression. In the internal areas, widespread positive anisotropy is accounted. The radial anisotropy magnitude oscillates between −4 % and 15 % and increases with depth. Analyzing the depth pattern, we concluded that, at < 8 km depths, the alignment of Alpine fracture systems controls the anisotropy. At depths > 8 km, high and positive radial anisotropies are observed, caused by the presence of subhorizontal alignments of grains and minerals, possibly in relation to shearing in the basal detachment of the CZ and/or other shear zones formed during the development of the Variscan orogeny.
The datasets presented and used in this study were collected using a seismic network funded by project GEOCANTABRICA-COSTA (https://doi.org/10.7914/SN/YR_2019, Fernández Viejo et al., 2019), and it can be released to the public on demand at GEOCANTABRICA@ftp.geol.uniovi.es. The deployment of the IberArray broadband seismic network (https://doi.org/10.7914/SN/IB, Institute Earth Sciences “Jaume Almera” CSIC, 2007) was part of the CONSOLIDER CSD2006-00041 (Geosciences in Iberia: Integrated studies on Topography and 4-D Evolution) grant from the Spanish Ministry of Science and Innovation. This dataset is available online at the ORFEUS Data Center (http://www.orfeus-eu.org/Royal Netherlands Meteorological Institute, 2021). Data processing used the code Corr_stack_v04.1 (Schimmel et al., 2011) and Computer Programs in Seismology v3.30 (Herrmann, 2013). Figures were drafted using Generic Mapping Tools (Wessel and Smith, 1998) and QGIS 3.10.
The supplement related to this article is available online at: https://doi.org/10.5194/se-13-659-2022-supplement.
JA was responsible for the deployment of the YR network, the processing of the seismic data, and the editing of the paper. GFV, SLF, CLF, and JO provided critical feedback and helped shape the research, analysis, and paper. GFV and DPM participated in the deployment and maintenance of the temporary experiment and the control of the data acquisition.
The contact author has declared that neither they nor their co-authors have any competing interests.
Publisher's note: Copernicus Publications remains neutral with regard to jurisdictional claims in published maps and institutional affiliations.
The authors wish to thank Ehsan Qorbani and an anonymous reviewer for their valuable comments and suggestions, which helped us to improve the quality of the paper. We thank the local people and institutions that helped to install the seismic networks in Asturias, Galicia, and León as well as the ICTJA-CSIC Seismic Laboratory (https://labsis.geo3bcn.csic.es/, last access: 15 December 2021) for sharing their seismic stations. We also thank the Instituto Geográfico Nacional (IGN, Spain) for providing seismic data from the EARI and EPON permanent stations.
This research has been supported by the research grants GEOCANTABRICA (GRUPIN14-044) and GEOCANTABRICA-COSTA (GRUPIN18-000184), the Gobierno del Principado de Asturias (grant no. PA-17-PF-BP16139), and the Ministerio de Ciencia e Innovación (grant no. MINECO-18-CGL2017-86487-P).
This paper was edited by Michal Malinowski and reviewed by Ehsan Qorbani and one anonymous referee.
Acevedo J., Fernández-Viejo, G., Llana-Fúnez, S., López-Fernández, C., and Olona, J.: Ambient noise tomography of the southern sector of the Cantabrian Mountains, NW Spain, Geophys. J. Int., 219, 479–495, https://doi.org/10.1093/gji/ggz308, 2019.
Acevedo, J., Fernández-Viejo, G., Llana-Fúnez, S., López-Fernández, C., and Olona, J.: Upper crustal seismic anisotropy in the Cantabrian Mountains (North Spain) from shear-wave splitting and ambient noise interferometry analysis, Seismol. Res. Lett., 92, 421–436, https://doi.org/10.1785/0220200103, 2020.
Aller, J. and Gallastegui, J.: Analysis of kilometric-scale superposed folding in the Central Coal Basin (Cantabrian zone, NW Spain), J. Struct. Geol., 17, 961–969, https://doi.org/10.1016/0191-8141(94)00115-G, 1995.
Almqvist, B. S. and Mainprice, D.: Seismic properties and anisotropy of the continental crust: Predictions based on mineral texture and rock microstructure, Rev. Geophys., 55, 367–433, https://doi.org/10.1002/2016RG000552, 2017.
Alonso, J. L.: Fold reactivation involving angular unconformable sequences: theoretical analysis and natural examples from the Cantabrian Zone (Northwest Spain), Tectonophysics, 170, 57–77, https://doi.org/10.1016/0040-1951(89)90103-0, 1989.
Alonso, J. L., Álvarez-Marrón, J., and Pulgar, J. A.: Síntesis cartográfica de la parte sudoccidental de la Zona Cantábrica, Trabajos Geol., 18, 145–155, 1989.
Alonso, J. L., Pulgar, J. A., García-Ramos, J. C., and Barba, P.: Tertiary basins and Alpine tectonics in the Cantabrian 5 Mountains (NW Spain), in: Tertiary basins of Spain: the stratigraphic record of crustal kinematics, edited by: Friend, P. F. and Dabrio, C. J., Cambridge University Press, Cambridge, UK, 214–227, https://doi.org/10.1017/CBO9780511524851.031, 1996.
Alonso, J. L., Marcos, A., and Suárez, A.: Paleogeographic inversion resulting from large out of sequence breaching thrusts: The León Fault (Cantabrian Zone, NW Iberia). A new picture of the external Variscan Thrust Belt in the Ibero-Armorican Arc, Geol. Acta, 7, 0451–473, https://doi.org/10.1344/105.000001449, 2009.
Álvarez-Marrón, J., Pérez-Estaún, A., Danñobeitia, J. J., Pulgar, J. A., Martínez, J. R., Marcos, A., Bastida, F., Ayarza, P., Aller, J., González-Lodeiro, F., Banda, E., Comas, D., and Córdoba, D.: Seismic structure of the northern continental margin of Spain from ESCIN deep seismic profiles, Tectonophysics, 264, 153–174, https://doi.org/10.1016/S0040-1951(96)00124-2, 1996.
Álvarez-Marron, J., Rubio, E., and Torné, M.: Subduction-related structures in the North Iberian margin, J. Geophys. Res.-Sol. Ea., 102, 22497–22511, https://doi.org/10.1029/97JB01425, 1997.
Anderson, D. L.: Elastic wave propagation in layered anisotropic media, J. Geophys. Res., 66, 2953–2963, https://doi.org/10.1029/JZ066i009p02953, 1961.
Ayarza, P., Catalán, J. R. M., Gallart, J., Pulgar, J. A., and Dañobeitia, J. J.: Estudio Sísmico de la Corteza Ibérica Norte 3.3: A seismic image of the Variscan crust in the hinterland of the NW Iberian Massif, Tectonics, 17, 171–186, https://doi.org/10.1029/97TC03411, 1998.
Barruol, G. and Kern, H.: Seismic anisotropy and shear-wave splitting in lower-crustal and upper-mantle rocks from the Ivrea Zone—experimental and calculated data, Phys. Earth Planet In., 95, 175–194, https://doi.org/10.1016/0031-9201(95)03124-3, 1996.
Bastida, F., Martínez-Catalán, J. R., and Pulgar, J. A.: Structural, metamorphic and magmatic history of the Mondoñedo nappe (Hercynian belt, NW Spain), J. Struct. Geol., 8, 415–430, https://doi.org/10.1016/0191-8141(86)90060-X, 1986.
Bastida, F., Aller, J., Pulgar, J. A., Toimil, N. C., Fernández, F. J., Bobillo-Ares, N. C., and Menéndez, C. O.: Folding in orogens: a case study in the northern Iberian Variscan Belt, Geol. J., 45, 597–622, https://doi.org/10.1002/gj.1199, 2010.
Bensen, G. D., Ritzwoller, M. H., Barmin, M. P., Levshin, A. L., Lin, F., Moschetti, M. P., Shapiro, N. M., and Yang, Y.: Processing seismic ambient noise data to obtain reliable broad-band surface wave dispersion measurements, Geophys. J. Int., 169, 1239–1260, https://doi.org/10.1111/j.1365-246X.2007.03374.x, 2007.
Boillot, G., Dupeuble, P. A., and Malod, J.: Subduction and tectonics on the continental margin off northern Spain, Mar. Geol., 32, 53–70, https://doi.org/10.1016/0025-3227(79)90146-4, 1979.
Boness, N. L. and Zoback, M. D.: Mapping stress and structurally controlled crustal shear velocity anisotropy in California, Geology, 34, 825–828, https://doi.org/10.1130/G22309.1, 2006.
Brandmayr, E., Kuponiyi, A. P., Arroucau, P., and Vlahovic, G.: Group velocity tomography of the upper crust in the eastern Tennessee seismic zone from ambient noise data, Tectonophysics, 688, 148–156, https://doi.org/10.1016/j.tecto.2016.09.035, 2016.
Brown, D., Llana-Fúnez, S., Carbonell, R., Álvarez-Marrón, J., Martí, D., and Salisbury, M.: Laboratory measurements of P-wave and S-wave velocities across a surface analog of the continental crust–mantle boundary: Cabo Ortegal, Spain, Earth Planet. Sc. Lett., 285, 27–38, https://doi.org/10.1016/j.epsl.2009.05.032, 2009.
Cadenas, P. and Fernández-Viejo, G.: The Asturian Basin within the North Iberian margin (Bay of Biscay): seismic characterisation of its geometry and its Mesozoic and Cenozoic cover, Basin Res., 29, 521–541, https://doi.org/10.1111/bre.12187, 2017.
Cadenas, P., Fernández-Viejo, G., Pulgar, J. A., Tugend, J., Manatschal, G., and Minshull, T. A.: Constraints imposed by rift inheritance on the compressional reactivation of a hyperextended margin: Mapping rift domains in the North Iberian margin and in the Cantabrian Mountains, Tectonics, 37, 758–785, https://doi.org/10.1002/2016TC004454, 2018.
Cárdenes, V., Lopez-Sanchez, M. A., Barou, F., Olona, J., and Llana-Fúnez, S.: Crystallographic preferred orientation, seismic velocity and anisotropy in roofing slates, Tectonophysics, 808, 228815, https://doi.org/10.1016/j.tecto.2021.228815, 2021.
Chen, Y., Badal, J., and Zhang, Z.: Radial anisotropy in the crust and upper mantle beneath the Qinghai-Tibet Plateau and surrounding regions, J. Asian Earth Sci., 36, 289–302, https://doi.org/10.1016/j.jseaes.2009.06.011, 2009.
Christensen, N. I.: Measurement of dynamic properties of rock at elevated temperatures and pressures, American Society of Testing and Materials (ASTM), 869, 93–107, https://doi.org/10.1520/STP32832S, 1985.
Crampin, S.: Seismic-wave propagation through a cracked solid: polarization as a possible dilatancy diagnostic, Geophys. J. Int., 53, 467–496, https://doi.org/10.1111/j.1365-246X.1978.tb03754.x, 1978.
Crampin, S. and Peacock, S.: A review of shear-wave splitting in the compliant crack-critical anisotropic Earth, Wave Motion, 41, 59–77, https://doi.org/10.1016/j.wavemoti.2004.05.006v, 2005.
Crampin, S., Gao, Y., and Bukits, J.: A review of retrospective stress-forecasts of earthquakes and eruptions, Phys. Earth Planet In., 245, 76–87, https://doi.org/10.1016/j.pepi.2015.05.008, 2015.
Díaz, J., Gallart, J., Ruiz, M., Pulgar, J. A., and López-Fernández, C.: Anisotropic features of the Alpine lithosphere in Northern Spain, Geophys. Res. Lett., 29, 2225, https://doi.org/10.1029/2002GL015997, 2002.
Díaz, J., Gallart, J., Pedreira, D., Pulgar, J. A., Ruiz, M., López, C., and González-Cortina, J. M.: Teleseismic imaging of alpine crustal underthrusting beneath N Iberia, Geophy. Res. Lett., 30, 1554, https://doi.org/10.1029/2003GL017073, 2003.
Díaz, J., Gallart, J., Ruiz, M., Pulgar, J. A., López-Fernández, C., and González-Cortina, J. M.: Probing seismic anisotropy in North Iberia from shear wave splitting, Phys. Earth Planet In., 158, 210–225, https://doi.org/10.1016/j.pepi.2005.12.011, 2006.
Díaz, J., Gallart, J., Pulgar, J. A., Ruiz, M., and Pedreira, D.: Crustal structure beneath North-West Iberia imaged using receiver functions, Tectonophysics, 478, 175–183, https://doi.org/10.1016/j.tecto.2009.08.003, 2009a.
Díaz, J., Villaseñor, A., Gallart, J., Morales, J., Pazos, A., Cordoba, D., Pulgar, J. A., Garcia-Lobon, J. L., Harnafi, M., and Topoiberia Seismic Working Group: The IBERARRAY broadband seismic network: A new tool to investigate the deep structure beneath Iberia, Orfeus Newslett., 8, 1–6, 2009b.
Díaz, J., Gallart, J., Morais, I., Silveira, G., Pedreira, D., Pulgar, J. A., Días, N. A., Ruiz, M., and González-Cortina, J. M.: From the Bay of Biscay to the High Atlas: Completing the anisotropic characterization of the upper mantle beneath the westernmost Mediterranean region, Tectonophysics, 663, 192–202, https://doi.org/10.1016/j.tecto.2015.03.007, 2015.
Dreiling, J., Tilmann, F., Yuan, X., Giese, J., Rindraharisaona, E. J., Rümpker, G., and Wysession, M. E.: Crustal radial anisotropy and linkage to geodynamic processes: a study based on seismic ambient noise in southern Madagascar, J. Geophys. Res.-Sol. Ea., 123, 5130–5146, https://doi.org/10.1029/2017JB015273, 2018.
Dziewonski, A., Bloch, S., and Landisman, M.: A technique for the analysis of transient seismic signals, B. Seismol. Soc. Am., 59, 427–444, https://doi.org/10.1785/BSSA0590010427, 1969.
Espina, R.: La estructura y evolución tectonoestratigráfica del borde occidental de la Cuenca Vasco-Cantábrica (Cordillera Cantábrica, NO de España), PhD thesis, University of Oviedo, Oviedo, Spain, 1997.
Fernández-Viejo, G. and Gallastegui, J.: The ESCI-N Project after a decade: a synthesis of the results and open questions, Trabajos Geol., 25, 9–27, 2005.
Fernandez-Viejo, G., Gallart, J., Pulgar, J. A., Gallastegui, J., Dañobeitia, J. J., and Córdoba, D.: Crustal transition between continental and oceanic domains along the North Iberian margin from wide angle seismic and gravity data, Geophys. Res. Lett., 25, 4249–4252, https://doi.org/10.1029/1998GL900149, 1998.
Fernández-Viejo, G., Gallart, J., Pulgar, J. A., Córdoba, D., and Dañobeitia, J. J.: Seismic signature of Variscan and Alpine tectonics in NW Iberia: Crustal structure of the Cantabrian Mountains and Duero basin, J. Geophys. Res.-Sol. Ea., 105, 3001–3018, https://doi.org/10.1029/1999JB900321, 2000.
Fernández-Viejo, G., Gallastegui, J., Pulgar, J. A., and Gallart, J.: The MARCONI project: a seismic view into the eastern part of the Bay of Biscay, Tectonophysics, 508, 342–356, https://doi.org/10.1016/j.tecto.2010.06.020, 2011.
Fernández-Viejo, G., Pulgar, J. A., Gallastegui, J., and Quintana, L.: The fossil accretionary wedge of the Bay of Biscay: critical wedge analysis on depth-migrated seismic sections and geodynamical implications, J. Geol., 120, 315–331, https://doi.org/10.1086/664789, 2012.
Fernández Viejo, G., Acevedo Sánchez, J., Llana Fúnez, S., López Fernández, C., Pérez Millán, D., and Pando González, L. A.: GEOCANTABRICA-COSTA, International Federation of Digital Seismograph Networks [data set], https://doi.org/10.7914/SN/YR_2019, 2019.
Gallastegui, J.: Estructura cortical de la cordillera y margen continental cantábricos: perfiles ESCI-N, Trabajos Geol., 22, 3–234, 2000.
Gallastegui, J., Pulgar, J. A., and Álvarez-Marrón, J.: 2-D seismic modeling of the Variscan foreland thrust and fold belt crust in NW Spain from ESCIN-1 deep seismic reflection data, Tectonophysics, 269, 21–32, https://doi.org/10.1016/S0040-1951(96)00166-7, 1997.
Gallastegui, J., Pulgar, J. A., and Gallart, J.: Initiation of an active margin at the North Iberian continent-ocean transition, Tectonics, 21, 1–15, https://doi.org/10.1029/2001TC901046, 2002.
Godfrey, N. J., Christensen, N. I., and Okaya, D. A.: Anisotropy of schists: Contribution of crustal anisotropy to active source seismic experiments and shear wave splitting observations, J. Geophys. Res., 105, 27991–28007, https://doi.org/10.1029/2000JB900286, 2000.
Guo, Z., Gao, X., Wang, W., and Yao, Z.: Upper-and mid-crustal radial anisotropy beneath the central Himalaya and southern Tibet from seismic ambient noise tomography, Geophys. J. Int., 189, 1169–1182, https://doi.org/10.1111/j.1365-246X.2012.05425.x, 2012.
Guo, B. B., Wang, H. C., Zhao, W. H., Ji, S. C., Sun, D. S., Li, A. W., and Long, C. X.: Analysis of Seismic Anisotropy of the Typical Slate from the Gaoligong Mountains, Yunnan Province, China, Chinese J. G., 57, 154–165, https://doi.org/10.1002/cjg2.20093, 2014.
Gu, N., Wang, K., Gao, J., Ding, N., Yao, H., and Zhang, H.: Shallow crustal structure of the Tanlu Fault Zone near Chao Lake in eastern China by direct surface wave tomography from local dense array ambient noise analysis, Pure Appl. Geophys., 176, 1193–1206, https://doi.org/10.1007/s00024-018-2041-4, 2019.
Gutiérrez-Alonso, G.: El Antiforme del Narcea y su relación con los mantos occidentales de la Zona Cantábrica, PhD thesis, University of Oviedo, Oviedo, Spain, 1992.
Herrmann, R. B.: Computer programs in seismology: An evolving tool for instruction and research, Seismol. Res. Lett., 84, 1081–1088, https://doi.org/10.1785/0220110096, 2013.
Institute Earth Sciences “Jaume Almera” CSIC (ICTJA Spain): IberArray, International Federation of Digital Seismograph Networks [data set], https://doi.org/10.7914/SN/IB, 2007.
Ji, S., Shao, T., Michibayashi, K., Oya, S., Satsukawa, T., Wang, Q., Zhao, W., and Salisbury, M. H.: Magnitude and symmetry of seismic anisotropy in mica-and amphibole-bearing metamorphic rocks and implications for tectonic interpretation of seismic data from the southeast Tibetan Plateau, J. Geophys. Res., 120, 6404–6430, https://doi.org/10.1002/2015JB012209, 2015.
Julivert, M.: Décollement tectonics in the Hercynian Cordillera of northwest Spain, Am. J. Sci., 270, 1–29, https://doi.org/10.2475/ajs.270.1.1, 1971.
Kennett, B. L. N., Sambridge, M. S., and Williamson, P. R.: Subspace methods for large inverse problems with multiple parameter classes, Geophys. J. Int., 94, 237–247, https://doi.org/10.1111/j.1365-246X.1988.tb05898.x, 1988.
Kern, H.: Laboratory seismic measurements: an aid in the interpretation of seismic field data, Terra Nova, 2, 617–628, https://doi.org/10.1111/j.1365-3121.1990.tb00127.x, 1990.
Lepvrier, C. and Martínez-García, E.: Fault development and stress evolution of the post-Hercynian Asturian Basin (Asturias and Cantabria, northwestern Spain), Tectonophysics, 184, 345–356, https://doi.org/10.1016/0040-1951(90)90447-G, 1990.
Llana-Fúnez, S. and López-Fernández, C.: The seismogenic zone of the continental crust in Northwest Iberia and its relation to crustal structure, Tectonics, 34, 1751–1767, https://doi.org/10.1002/2015TC003877, 2015.
Llana-Fúnez, S. and Marcos, A.: The Malpica–Lamego Line: a major crustal-scale shear zone in the Variscan belt of Iberia, J. Struct. Geol., 23, 1015–1030, https://doi.org/10.1016/S0191-8141(00)00173-5, 2001.
Llana-Fúnez, S. and Marcos, A.: Convergence in a thermally softened thick crust: Variscan intracontinental tectonics in Iberian plate rocks, Terra Nova, 19, 393–400, https://doi.org/10.1111/j.1365-3121.2007.00763.x, 2007.
López-Fernández, C., Pulgar, J. A., Díaz, J., Gallart, J., González-Cortina J. M., and Ruiz, M.: Seismotectonic characterization of the Becerreá area (NW Spain), Geol. Acta, 10, 71–80, https://doi.org/10.1344/105.000001750, 2012.
López-Fernández, C., Fernández-Viejo, G., Olona, J., and Llana-Fúnez, S.: Intraplate Seismicity in Northwest Iberia along the Trace of the Ventaniella Fault: A Case for Fault Intersection at Depth, B. Seismol. Soc. Am., 108, 604–618, https://doi.org/10.1785/0120170215, 2018.
López-Sánchez, M. A., Marcos, A., Martínez, F. J., Iriondo, A., and Llana-Fúnez, S.: Setting new constrains on the age of crustal-scale extensional shear zone (Vivero fault): implications for the evolution of Variscan orogeny in the Iberian massif, Int. J. Earth Sci., 104, 927–962, https://doi.org/10.1007/s00531-014-1119-1, 2015.
Luo, Y., Xu, Y., and Yang, Y.: Crustal radial anisotropy beneath the Dabie orogenic belt from ambient noise tomography, Geophys. J. Int., 195, 1149–1164, https://doi.org/10.1093/gji/ggt281, 2013.
Luo, Y., Yang, Y., Xu, Y., Xu, H., Zhao, K., and Wang, K.: On the limitations of interstation distances in ambient noise tomography, Geophys. J. Int., 201, 652–661, https://doi.org/10.1093/gji/ggv043, 2015.
Lynner, C., Beck, S. L., Zandt, G., Porritt, R. W., Lin, F. C., and Eilon, Z. C.: Midcrustal deformation in the Central Andes constrained by radial anisotropy, J. Geophys. Res.-Sol. Ea., 123, 4798–4813, https://doi.org/10.1029/2017JB014936, 2018.
Macquet, M., Paul, A., Pedersen, H. A., Villaseñor, A., Chevrot, S., Sylvander, M., Wolyniec, D., and PYROPE Working Group.: Ambient noise tomography of the Pyrenees and the surrounding regions: inversion for a 3-D Vs model in the presence of a very heterogeneous crust, Geophys. J. Int., 199, 402–415, https://doi.org/10.1093/gji/ggu270, 2014.
Mainprice, D., Barruol, G., and Ismaïl, W. B.: The seismic anisotropy of the Earth's mantle: from single crystal to polycrystal, in: Earth's deep interior: mineral physics and tomography from the atomic to the global scale, edited by: Karato, S. I., Forte, A., Liebermann, R., Masters, G., and Stixrude, L., American Geophysical Union, Washington, USA, 237–264, 2000.
Mancilla, F. and Diaz, J.: High resolution Moho topography map beneath Iberia and Northern Morocco from receiver function analysis, Tectonophysics, 663, 203–211, https://doi.org/10.1016/j.tecto.2015.06.017, 2015.
Marcos, A.: Las series del Paleozoico Inferior y la estructura herciniana del Occidente de Asturias (NW de España), Trabajos Geol., 6, 3–113, 1973.
Marcos, A.: Un nuevo mapa geológico de la parte septentrional del Domo de Lugo (Galicia oriental, NO de España): Implicaciones sobre la estratigrafía, estructura y evolución tectónica del Manto de Mondoñedo, Trabajos Geol., 33, 171–200, 2013.
Marcos, A. and Pulgar, J. A.: An approach to the tectonostratigraphic evolution of the Cantabrian foreland thrust and fold belt, Hercynian Cordillera of NW Spain, Neues Jahrb. Geol. P.-A., 163, 256–260, 1982.
Marcos, A., Farias, P., Galán, G., Fernández, F. J., and Llana-Fúnez, S.: Tectonic framework of the Cabo Ortegal Complex: A slab of lower crust exhumed in the Variscan orogen (northwestern Iberian Peninsula), Geol. S. Am. S., 364, 143–162, https://doi.org/10.1130/0-8137-2364-7.143, 2002.
Martínez-Catalán, J. R., Arenas, R., Díaz García, F., and Abati, J.: Variscan accretionary complex of northwest Iberia: Terrane correlation and succession of tectonothermal events, Geology, 25, 1103–1106, https://doi.org/10.1130/0091-7613(1997)025{%}3C1103:VACONI{%}3E2.3.CO;2, 1997.
Martínez-Catalán, J. R., Aller, J., Alonso, J. L., and Bastida, F.: The Iberian Variscan Orogen, in: Spanish Geological Frameworks and Geosites: An approach to Spanish Geological Heritage of International Relevance, edited by: García-Cortés, A., IGME, Madrid, Spain, 13–30, 2009a.
Martínez-Catalán, J. R., Arenas, R., Abati, J., Sánchez Martínez, S., Díaz-García,F., Fernández-Suárez, J., González-Cuadra, P., Castiñeiras, P., Gómez-Barreiro, J., Díez-Montes, A., González-Clavijo, E., Rubio-Pascual, F. J., Andonaegui P., Jeffries, T. E., Alcock, J. E., Díez-Fernández, R., and López-Carmona, A.: A rootless suture and the loss of the roots of a mountain chain: the Variscan belt of NW Iberia, C. R. Geosci., 341, 114–126, https://doi.org/10.1016/j.crte.2008.11.004, 2009b.
Martínez-Catalán, J. R., Álvarez-Lobato, F., Pinto, V., Gómez-Barreiro, J., Ayarza, P., Villalaín, J. J., and Casas, A.: Gravity and magnetic anomalies in the allochthonous Órdenes Complex (Variscan belt, northwest Spain): Assessing its internal structure and thickness, Tectonics, 31, TC5007, https://doi.org/10.1029/2011TC003093, 2012.
Martín-González, F., Barbero, L., Capote, R., Heredia, N., and Gallastegui, G.: Interaction of two successive Alpine deformation fronts: constraints from low temperature thermochronology and structural mapping (NW Iberian Peninsula), Int. J. Earth Sci., 101, 1331–1342, https://doi.org/10.1007/s00531-011-0712-9, 2012.
Matte, P.: La structure de la virgation hercynienne de Galice (Espagne), Allier, Grenoble, France, 1968.
Matte, P.: Tectonics and plate tectonics model for the Variscan belt of Europe, Tectonophysics, 126, 329–374, https://doi.org/10.1016/0040-1951(86)90237-4, 1986.
Merino-Tomé, O. A., Bahamonde, J. R., Colmenero, J. R., Heredia, N., Villa, E., and Farias, P.: Emplacement of the Cuera and Picos de Europa imbricate system at the core of the Iberian-Armorican arc (Cantabrian zone, north Spain): New precisions concerning the timing of arc closure, Emplacement of the Cuera Unit and the Picos de Europa, GSA Bull., 121, 729–751, https://doi.org/10.1130/B26366.1, 2009.
Moschetti, M. P., Ritzwoller, M. H., Lin, F., and Yang, Y.: Seismic evidence for widespread western-US deep-crustal deformation caused by extension, Nature, 464, 885–889, https://doi.org/10.1038/nature08951, 2010.
Naghavi, M., Hatami, M., Shirzad, T., and Rahimi, H.: Radial anisotropy in the Upper Crust beneath the Tehran Basin and surrounding regions, Pure Appl. Geophys., 176, 787–800, https://doi.org/10.1007/s00024-018-1986-7, 2019.
Nicolson, H., Curtis, A., Baptie, B., and Galetti, E.: Seismic interferometry and ambient noise tomography in the British Isles, P. Geologist. Assoc., 123, 74–86, https://doi.org/10.1016/j.pgeola.2011.04.002, 2012.
Nicolson, H., Curtis, A., and Baptie, B.: Rayleigh wave tomography of the British Isles from ambient seismic noise, Geophys. J. Int., 198, 637–655, https://doi.org/10.1093/gji/ggu071, 2014.
Ojo, A. O., Ni, S., and Li, Z.: Crustal radial anisotropy beneath Cameroon from ambient noise tomography, Tectonophysics, 696, 37–51, https://doi.org/10.1016/j.tecto.2016.12.018, 2017.
Olivar-Castaño, A., Pilz, M., Pedreira, D., Pulgar, J. A., Díaz-González, A., and González-Cortina, J. M.: Regional Crustal Imaging by Inversion of Multimode Rayleigh Wave Dispersion Curves Measured from Seismic Noise: Application to the Basque-Cantabrian Zone (N Spain), J. Geophys. Res.-Sol. Ea., 125, e2020JB019559, https://doi.org/10.1029/2020JB019559, 2020.
Palomeras, I., Villaseñor, A., Thurner, S., Levander, A., Gallart, J., and Harnafi, M.: Lithospheric structure of Iberia and Morocco using finite-frequency Rayleigh wave tomography from earthquakes and seismic ambient noise, Geochem. Geophy. Geosy., 18, 1824–1840, https://doi.org/10.1002/2016GC006657, 2017.
Pastor-Galán, D., Gutiérrez-Alonso, G., and Weil, A. B.: Orocline timing through joint analysis: Insights from the Ibero-Armorican Arc, Tectonophysics, 507, 31–46, https://doi.org/10.1016/j.tecto.2011.05.005, 2011.
Pastor-Galán, D., Gutiérrez-Alonso, G., Murphy, J. B., Fernández-Suárez, J., Hofmann, M., and Linnemann, U.: Provenance analysis of the Paleozoic sequences of the northern Gondwana margin in NW Iberia: Passive margin to Variscan collision and orocline development, Gondwana Res., 23, 1089–1103, https://doi.org/10.1016/j.gr.2012.06.015, 2013.
Pedreira, D., Afonso, J. C., Pulgar, J. A., Gallastegui, J., Carballo, A., Fernandez, M., García-Castellanos, D., Jiménez-Munt, I., Semprich, J., and Garcia-Moreno, O.: Geophysical–petrological modelling of the lithosphere beneath the Cantabrian Mountains and the North-Iberian margin: Geodynamic implications, Lithos, 230, 46–68, https://doi.org/10.1016/j.lithos.2015.04.018, 2015.
Pérez-Estaún, A., Bastida, F., Alonso, J. L., Marquínez, J., Aller, J., Alvarez-Marrón, J., Marcos, A., and Pulgar, J. A.: A thin-skinned tectonics model for an arcuate fold and thrust belt: the Cantabrian Zone (Variscan Ibero-Armorican Arc), Tectonics, 7, 517–537, https://doi.org/10.1029/TC007i003p00517, 1988.
Pérez-Estaún, A., Martínez Catalán, J. R., and Bastida, F.: Crustal thickening and deformation sequence in the footwall to the suture of the Variscan belt of northwest Spain, Tectonophysics, 191, 243–253, https://doi.org/10.1016/0040-1951(91)90060-6, 1991.
Pérez-Estaún, A., Pulgar, J. A., Banda, E., Álvarez-Marrón, J., and Esci-N Research Group.: Crustal structure of the external variscides in northwest Spain from deep seismic reflection profiling, Tectonophysics, 232, 91–118, https://doi.org/10.1016/0040-1951(94)90078-7, 1994.
Pulgar, J. A., Pérez-Estaún, A., Gallart, J., Álvarez-Marrón, J., and Gallastegui, J.: The ESCI-N2 deep seismic reflection profile: a traverse across the Cantabrian Mountains and adjacent Duero basin, Rev. Soc. Geol. España, 8, 383–394, 1995.
Pulgar, J. A., Gallart, J., Fernández-Viejo, G., Pérez-Estaún, A., Álvarez-Marrón, J., and Escin Group: Seismic image of the Cantabrian Mountains in the western extension of the Pyrenees from integrated ESCIN reflection and refraction data, Tectonophysics, 264, 1–19, https://doi.org/10.1016/S0040-1951(96)00114-X, 1996.
Pulgar, J. A., Alonso, J. L., Espina, R. G., and Marín, J. A.: La deformación alpina en el basamento varisco de la Zona Cantábrica, Trabajos Geol., 21, 283–294, 1999.
Rawlinson, N.: FMST: fast marching surface tomography package–Instructions, Research School of Earth Sciences, Australian National University, Canberra, Australia, 2005.
Rawlinson, N. and Sambridge, M.: Wave front evolution in strongly heterogeneous layered media using the fast-marching method, Geophys. J. Int., 156, 631–647, https://doi.org/10.1111/j.1365-246X.2004.02153.x, 2004a.
Rawlinson, N. and Sambridge, M.: Multiple reflection and transmission phases in complex layered media using a multistage fast marching method, Geophysics, 69, 1338–1350, https://doi.org/10.1190/1.1801950, 2004b.
Ribeiro, A., Munhá, J., Dias, R., Mateus, A., Pereire, E., Ribeiro, L., Fonseca, P., Araújo, A., Oliveira, T., Romāo, J, Chaminé, H., Coke, C., and Pedro, J.: Geodynamic evolution of the SW Europe Variscides, Tectonics, 26, TC6009, https://doi.org/10.1029/2006TC002058, 2007.
Royal Netherlands Meteorological Institute: ORFEUS Data Centre, http://www.orfeus-eu.org/, last access: 15 December 2021.
Rubio-Ordóñez, A., Gutiérrez-Alonso, G., Valverde-Vaquero, P., Cuesta, A., Gallastegui, G., Gerdes, A., and Cárdenes, V.: Arc-related Ediacaran magmatism along the northern margin of Gondwana: Geochronology and isotopic geochemistry from northern Iberia, Gondwana Res., 27, 216–227, https://doi.org/10.1016/j.gr.2013.09.016, 2015.
Sammarco, C., Cornwell, D. G., and Rawlinson, N.: Ambient noise tomography reveals basalt and sub-basalt velocity structure beneath the Faroe Islands, North Atlantic, Tectonophysics, 721, 1–11, https://doi.org/10.17863/CAM.20927, 2017.
Savage, M. K.: Lower crustal anisotropy or dipping boundaries? Effects on receiver functions and a case study in New Zealand, J. Geophys. Res.-Sol. Ea., 103, 15069–15087, https://doi.org/10.1029/98JB00795, 1998.
Schimmel, M.: Phase cross-correlations: Design, comparisons, and applications, B. Seismol. Soc. Am., 89, 1366–1378, https://doi.org/10.1785/BSSA0890051366, 1999.
Schimmel, M. and Gallart, J.: Frequency-dependent phase coherence for noise suppression in seismic array data, J. Geophys. Res.-Sol. Ea., 112, B04303, https://doi.org/10.1029/2006JB004680, 2007.
Schimmel, M., Stutzmann, E., and Gallart, J.: Using instantaneous phase coherence for signal extraction from ambient noise data at a local to a global scale, Geophys. J. Int., 184, 494–506, https://doi.org/10.1111/j.1365-246X.2010.04861.x, 2011.
Sethian, J. A.: A fast-marching level set method for monotonically advancing fronts, P. Natl. Acad. Sci. USA, 93, 1591–1595, https://doi.org/10.1073/pnas.93.4.1591, 1996.
Shapiro, N. M. and Campillo, M.: Emergence of broadband Rayleigh waves from correlations of the ambient seismic noise, Geophys. Res. Lett., 31, L07614, https://doi.org/10.1029/2004GL019491, 2004.
Shapiro, N. M., Campillo, M., Stehly, L., and Ritzwoller, M. H.: High-resolution surface-wave tomography from ambient seismic noise, Science, 307, 1615–1618, https://doi.org/10.1126/science.1108339, 2005.
Shirzad, T. and Shomali, Z. H.: Shallow crustal radial anisotropy beneath the Tehran basin of Iran from seismic ambient noise tomography, Phys. Earth Planet In., 231, 16–29, https://doi.org/10.1016/j.pepi.2014.04.001, 2014.
Shirzad, T., Shomali, Z. H., Riahi, M. A., and Jarrahi, M.: Near surface radial anisotropy in the Rigan area/SE Iran, Tectonophysics, 694, 23–34, https://doi.org/10.1016/j.tecto.2016.11.036, 2017.
Silveira, G., Dias, N. A., and Villaseñor, A.: Seismic imaging of the western Iberian crust using ambient noise: Boundaries and internal structure of the Iberian Massif, Tectonophysics, 589, 186–194, https://doi.org/10.1016/j.tecto.2012.12.025, 2013.
Silver, P.: Seismic anisotropy beneath the continents: probing the depths of geology, Annu. Rev. Earth Pl. Sc., 24, 385–432, https://doi.org/10.1146/annurev.earth.24.1.385, 1996.
Snieder, R.: Extracting the Green's function from the correlation of coda waves: A derivation based on stationary phase, Phys. Rev. E, 69, 046610, https://doi.org/10.1103/PhysRevE.69.046610, 2004.
Tavani, S., Quintà, A., and Granado, P.: Cenozoic right-lateral wrench tectonics in the Western Pyrenees (Spain): the Ubierna Fault System, Tectonophysics, 509, 238–253, https://doi.org/10.1016/j.tecto.2011.06.013, 2011.
Teixell, A., Labaume, P., Ayarza, P., Espurt, N., de Saint Blanquat, M., and Lagabrielle, Y.: Crustal structure and evolution of the Pyrenean-Cantabrian belt: A review and new interpretations from recent concepts and data, Tectonophysics, 724, 146–170, https://doi.org/10.1016/j.tecto.2018.01.009, 2018.
Tugend, J., Manatschal, G., and Kusznir, N. J.: Spatial and temporal evolution of hyperextended rift systems: Implication for the nature, kinematics, and timing of the Iberian–European plate boundary, Geology, 43, 15–18, https://doi.org/10.1130/G36072.1, 2015.
Uzkeda, H., Bulnes, M., Poblet, J., García-Ramos, J. C., and Piñuela, L.: Buttressing and reverse reactivation of a normal fault in the Jurassic rocks of the Asturian Basin, NW Iberian Peninsula, Tectonophysics, 599, 117–134, https://doi.org/10.1016/j.tecto.2013.04.012, 2013.
Wang, J., Gu, Y. J., and Chen, Y.: Shear velocity and radial anisotropy beneath southwestern Canada: Evidence for crustal extension and thick-skinned tectonics, J. Geophys. Res.-Sol. Ea., 125, e2019JB018310, https://doi.org/10.1029/2019JB018310, 2020.
Wapenaar, K.: Synthesis of an inhomogeneous medium from its acoustic transmission response, Geophysics, 68, 1756–1759, https://doi.org/10.1190/1.1620649, 2003.
Wapenaar, K.: Retrieving the elastodynamic Green's function of an arbitrary inhomogeneous medium by cross correlation, Phys. Rev. Lett., 93, 254301, https://doi.org/10.1103/PhysRevLett.93.254301, 2004.
Wenk, H. R., Yu, R., Cárdenes, V., Lopez-Sanchez, M. A., and Sintubin, M.: Fabric and anisotropy of slates: From classical studies to new results, J. Struct. Geol., 138, 104066, https://doi.org/10.1016/j.jsg.2020.104066, 2020.
Wessel, P. and Smith, W. H.: New, improved version of Generic Mapping Tools released, Eos T. Am. Geophys. Un., 79, 579–579, https://doi.org/10.1029/98EO00426, 1998.
Xie, J., Ritzwoller, M. H., Shen, W., Yang, Y., Zheng, Y., and Zhou, L.: Crustal radial anisotropy across eastern Tibet and the western Yangtze craton, J. Geophys. Res.-Sol. Ea., 118, 4226–4252, https://doi.org/10.1002/jgrb.50296, 2013.
Yanovskaya, T. B., Kizima, E. S., and Antonova, L. M.: Structure of the crust in the Black Sea and adjoining regions from surface wave data, J. Seismol., 2, 303–316, https://doi.org/10.1023/A:1009716017960, 1998.
Zigone D., Ben-Zion, Y., Campillo, M., and Roux, P.: Seismic Tomography of the Southern California Plate Boundary Region from Noise-Based Rayleigh and Love Waves, Pure Appl. Geophys, 172, 1007–1032, https://doi.org/10.1007/s00024-014-0872-1, 2015.
Zinke, J. C. and Zoback, M. D.: Structure-related and stress-induced shear-wave velocity anisotropy: observations from microearthquakes near the Calaveras Fault in Central California, B. Seismol. Soc. Am., 90, 1305–1312, https://doi.org/10.1785/0119990099, 2000.