the Creative Commons Attribution 4.0 License.
the Creative Commons Attribution 4.0 License.
 | 12 Sep 2023
Natural fracture patterns at Swift Reservoir anticline, NW Montana: the influence of structural position and lithology from multiple observation scales
Hannah Watkins
Clare E. Bond
Marian J. Warren
Mark A. Cooper
Subsurface datasets typically lack the resolution or coverage to adequately sample fracture networks in 3D, and fracture properties are typically extrapolated from available data (e.g. seismic data or wellbore image logs). Here we assess the applicability of extrapolating fracture properties (orientation, length, and intensity) across observation scales in deformed, mechanically layered carbonate rocks. Data derived from high-resolution field images, medium-resolution digital outcrop data, and relatively low-resolution satellite imagery at Swift Reservoir anticline, NW Montana are leveraged to (i) assess interacting structural and stratigraphic controls on fracture development, and (ii) compare estimated fracture properties derived from multiple observation scales. We show that hinge-parallel and hinge-perpendicular fractures (i) make up the majority of fractures at the site; (ii) are consistently oriented with respect to the fold hinge, despite along-strike variability in the fold hinge orientation; and (iii) exhibit systematic increases in intensity towards the anticline hinge. These fractures are interpreted as having formed during folding. Other fractures recorded at the site exhibit inconsistent orientations, show no systematic trends in fracture intensity, and are interpreted as being unrelated to fold formation. Fracture orientation data exhibit the greatest agreement across observation scales at hinge and forelimb positions, where hinge-parallel and hinge-perpendicular fracture sets are well developed, and little agreement on the anticline backlimb, where fracture orientations are less predictable and more dispersed. This indicates that the scaling of fracture properties at Swift Reservoir anticline is spatially variable and partly dependent on structural position. Our results suggest that accurate prediction and extrapolation of natural fracture properties in contractional settings requires the assessment of structural position, lithologic variability, and spatially variable fracture scaling relationships, as well as consideration of the deformation history before and after folding.
- Article
(18387 KB) - Full-text XML
- BibTeX
- EndNote


The ability to accurately predict natural fracture attributes (e.g. length and orientation) and patterns (e.g. intensity) has implications for resource management and waste disposal in the subsurface. Natural fractures typically enhance the porosity and permeability of subsurface rock volumes, and predicting fracture attributes is therefore important for a range of activities related to subsurface fluid flow regimes. Specific applications include CO2 sequestration (e.g. Iding and Ringrose, 2010; Bond et al., 2013, 2017; Gholami et al., 2021; Kou et al., 2021), hazardous waste disposal (e.g. Green and Mair, 1983; Gautschi, 2001; Morris et al., 2004; Yu et al., 2021; Ishii, 2022), groundwater management (e.g. Streltsova, 1976; Bachu, 1995; Ferrill et al., 1999; Medici et al., 2021; Moore and Walsh, 2021), hydrocarbon extraction (e.g. Thomas et al., 1983; Mäkel, 2007; Rawnsley et al., 2007; Li and Lee, 2008; Spence et al., 2014; Gong et al., 2021), and geothermal energy production (e.g. Bödvarsson and Tsang, 1982; Watanabe and Takajashi, 1995; Shaik et al., 2011; Fox et al., 2013; Glaas et al., 2021; Chabani et al., 2021). Despite the range of applications that rely on knowledge of subsurface fracture properties, accurate fracture prediction remains challenging due to (i) the spatial variability and complexity of natural fracture networks and (ii) difficulties related to sampling fracture populations in subsurface datasets.
Subsurface data (e.g. wellbore information and seismic imaging) provide constraints on fracture properties, but the limits of the coverage and resolution of these datasets often result in highly uncertain predictions of fracture properties at depth. Wellbore data can provide direct, in situ fracture measurements (e.g. orientation data from image logs) which can be used for generating predictive fracture models (e.g. Cooper, 1991; Aliverti et al., 2003; Nadimi et al., 2020). Wellbores are generally widely spaced in the subsurface, however, and predictions from well data typically suffer from sampling biases (e.g. Sun et al., 2016; Yin and Chen, 2020). Extrapolating fracture properties (e.g. length, orientation, and abundance) away from wells or interpolating between wells is therefore not straightforward, with predictions being prone to substantial uncertainties (e.g. De Marsily, 2005; Ma et al., 2007). Remote sensing (e.g. seismic reflection) data provide a potential alternative for sampling subsurface fracture populations, but these data typically lack the resolution to image all but the largest fractures or discontinuities in the subsurface (e.g. Marrett and Allmendinger, 1992; Yielding et al., 1996; Rawnsley et al., 2007; Worthington and Lubbe, 2007; Dimmen et al., 2023). As such, seismic data are generally more useful for providing contextual information (e.g. structural position and distance to major faults) than for directly imaging fracture networks in detail.
Faced with limited information about subsurface fracture properties, geoscientists may supplement subsurface datasets with information derived from appropriate outcrop analogues (e.g. Inks et al., 2015; Becker et al., 2018; Ukar et al., 2019). Recent advances in digital photogrammetry and digital mapping approaches (e.g. James and Robson, 2012; Cawood et al., 2017, 2022; Corradetti et al., 2018; Bowness et al., 2022) provide the opportunity to map and measure fractures at outcrop across a range of spatial scales (e.g. Strijker et al., 2012; Seers and Hodgetts, 2014; Hardebol et al., 2015). By integrating traditional fieldwork with modern digital approaches, fracture characterization at outcrop can potentially (i) address sampling gaps in subsurface datasets (Fig. 1) and (ii) be leveraged to generate multi-scale predictions of inherently heterogeneous fracture populations (e.g. Vollgger and Cruden, 2016; Smeraglia et al., 2021).
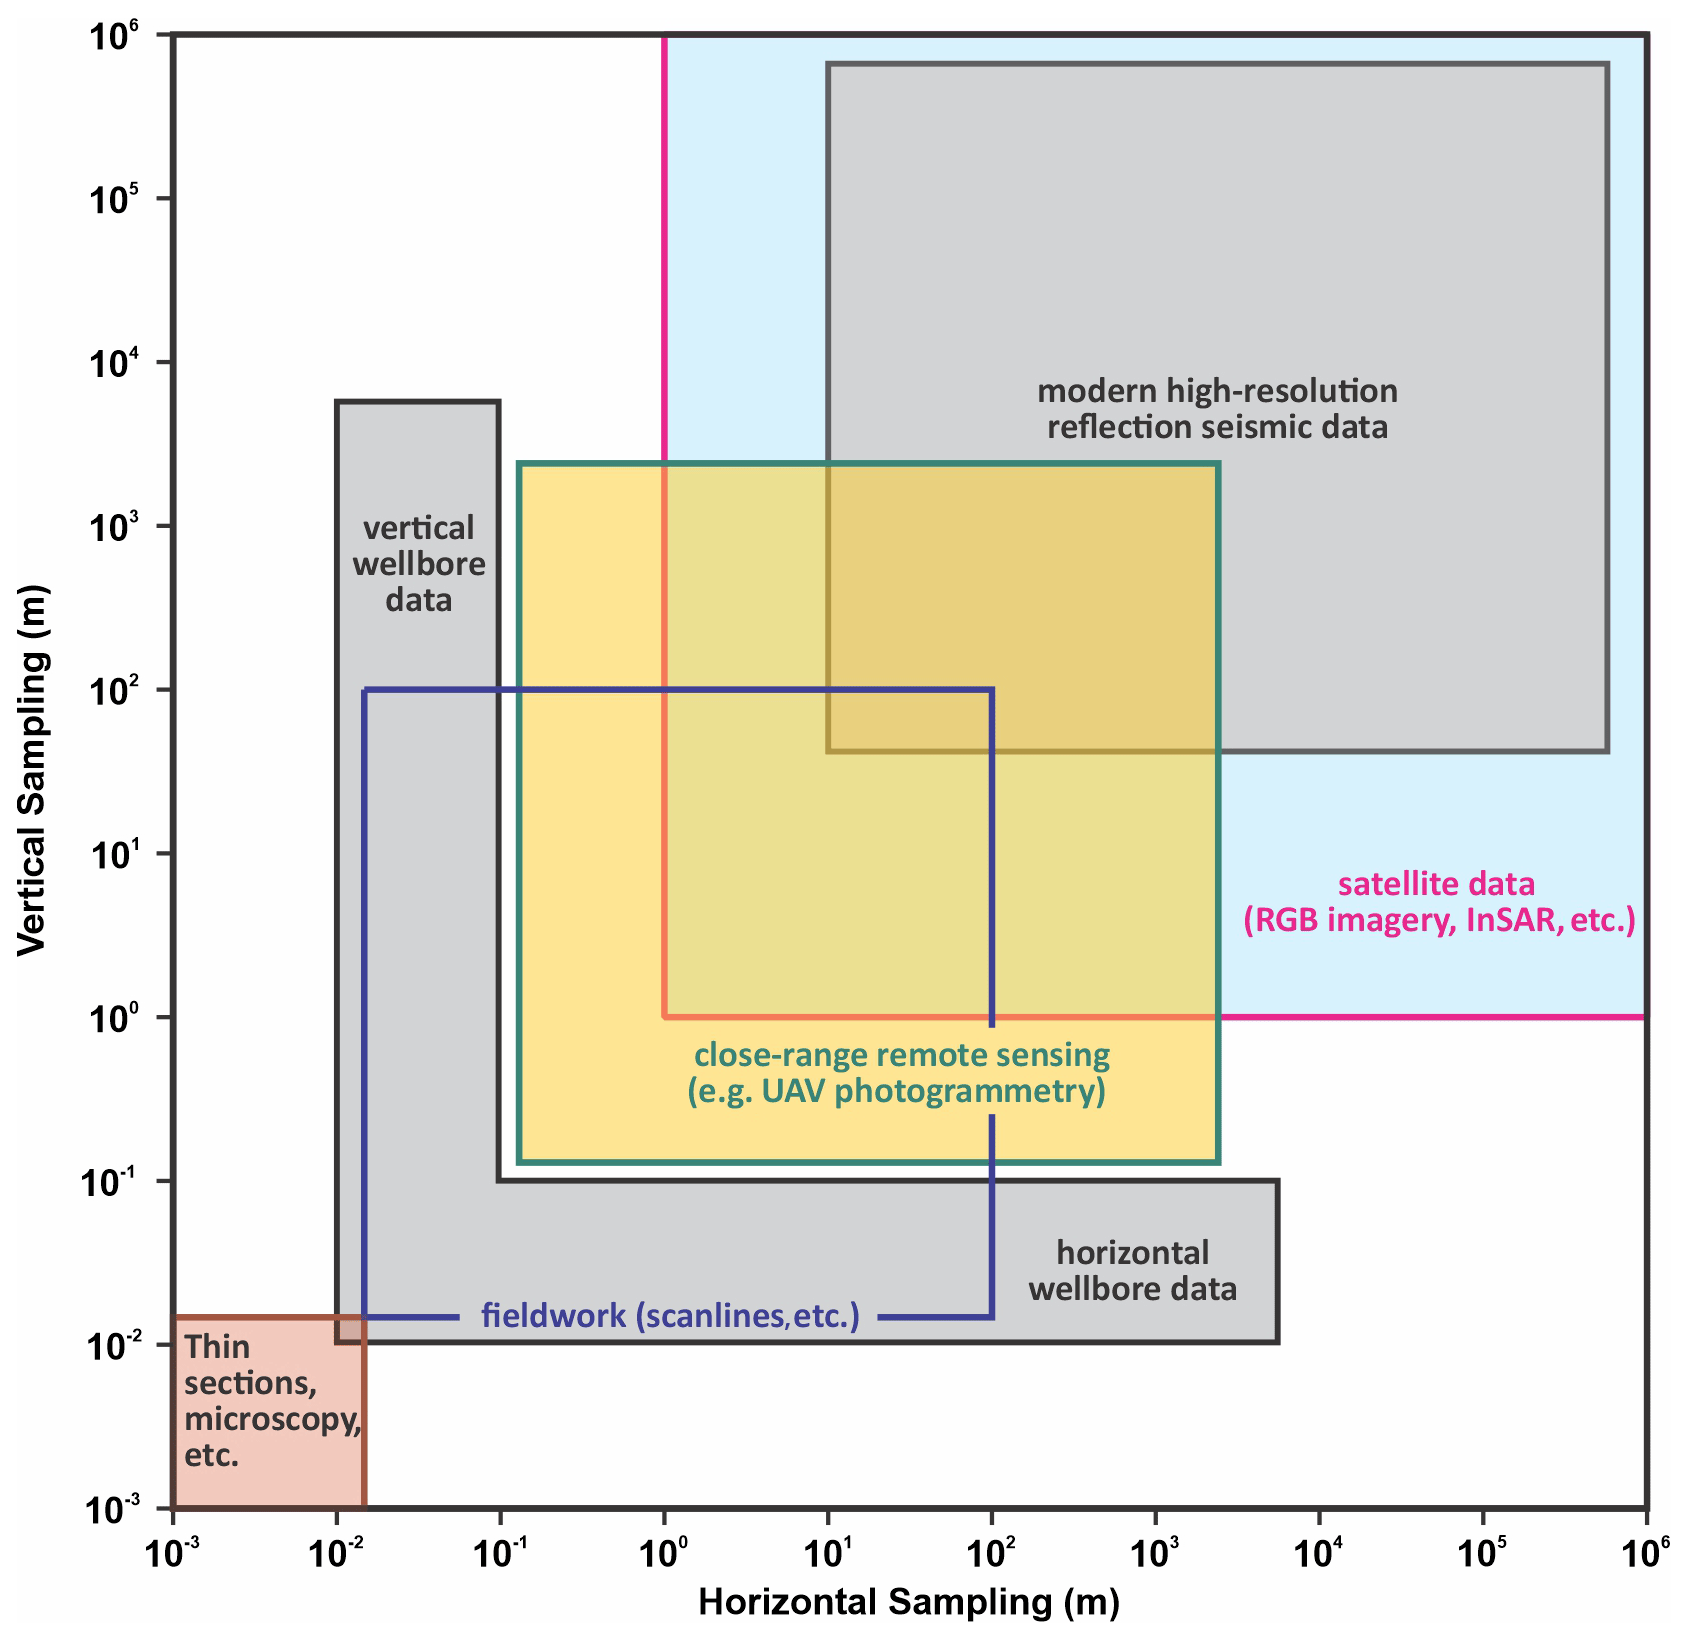
Figure 1Scale of the geological datasets at which natural fracture networks are typically characterized. Filled grey boxes represent subsurface datasets; unfilled boxes are other data types. The approximate sampling scale for fieldwork refers to the scale at which the fracture patterns can be comprehensively sampled using traditional field methods such as fracture scanlines or sampling windows.
While these represent major improvements in our ability to map fractures, it should be noted that not all fractures at outcrop are not necessarily representative of those in the subsurface. Fracture formation can be driven by various surface and subsurface processes such as weathering, topographic stresses, and pore fluid pressure changes (e.g. Ukar et al., 2019, and references therein), and therefore, outcrops may exhibit higher fracture abundances than equivalent subsurface rocks. Conversely, sampling of fracture networks at outcrop may be hampered by imperfect exposure. Swift Reservoir anticline, like many outcrops, is partially vegetated, and parts of the exposure have been removed by erosion; we acknowledge that this may impact our results but leverage all available exposures at the site for this study. Finally, improved sampling of fracture networks does not necessarily lead to a better understanding of fracture mechanisms and timing (see Laubach et al., 2019, for a detailed review of this topic). By leveraging field measurements, close-range remote sensing data, and satellite imagery to characterize fracture patterns at a range of scales, in multiple lithologies, and at different structural positions, the aim of this study is to overcome some of the non-uniqueness of outcrop-based fracture interpretation studies.
The controls on fracture properties in folded sedimentary rocks have been investigated by numerous workers. Early conceptual models of fracture development predict the presence of discrete, systematic fracture sets on contractional anticlines (Fig. 2), where fracture orientations are kinematically consistent with the orientation of the fold on which they occur (e.g. Price, 1966; Stearns, 1964, 1969; Stearns and Friedman, 1972; Hancock, 1985). Subsequent studies have shown that these relatively simple conceptual relationships may be modified by a range of lithological, mechanical, and structural factors (e.g. Cosgrove and Ameen, 1999; Cooper et al., 2006; Wennberg et al., 2007; Bergbauer and Pollard, 2004; Watkins et al., 2015, 2018; Awdal et al., 2016). Documented lithological influences on fracture formation include rock competence (e.g. McGinnis et al., 2017; Bowness et al., 2022), grain size or porosity within units (e.g. Hanks et al., 1997; Wennberg et al., 2006), mechanical layer thickness (e.g. Ladeira and Price, 1981; Narr and Suppe, 1991; Wu and Pollard, 1995), and bed interface characteristics (e.g. Cooke and Underwood, 2001; Cooke et al., 2006; McGinnis et al., 2017), among other factors.
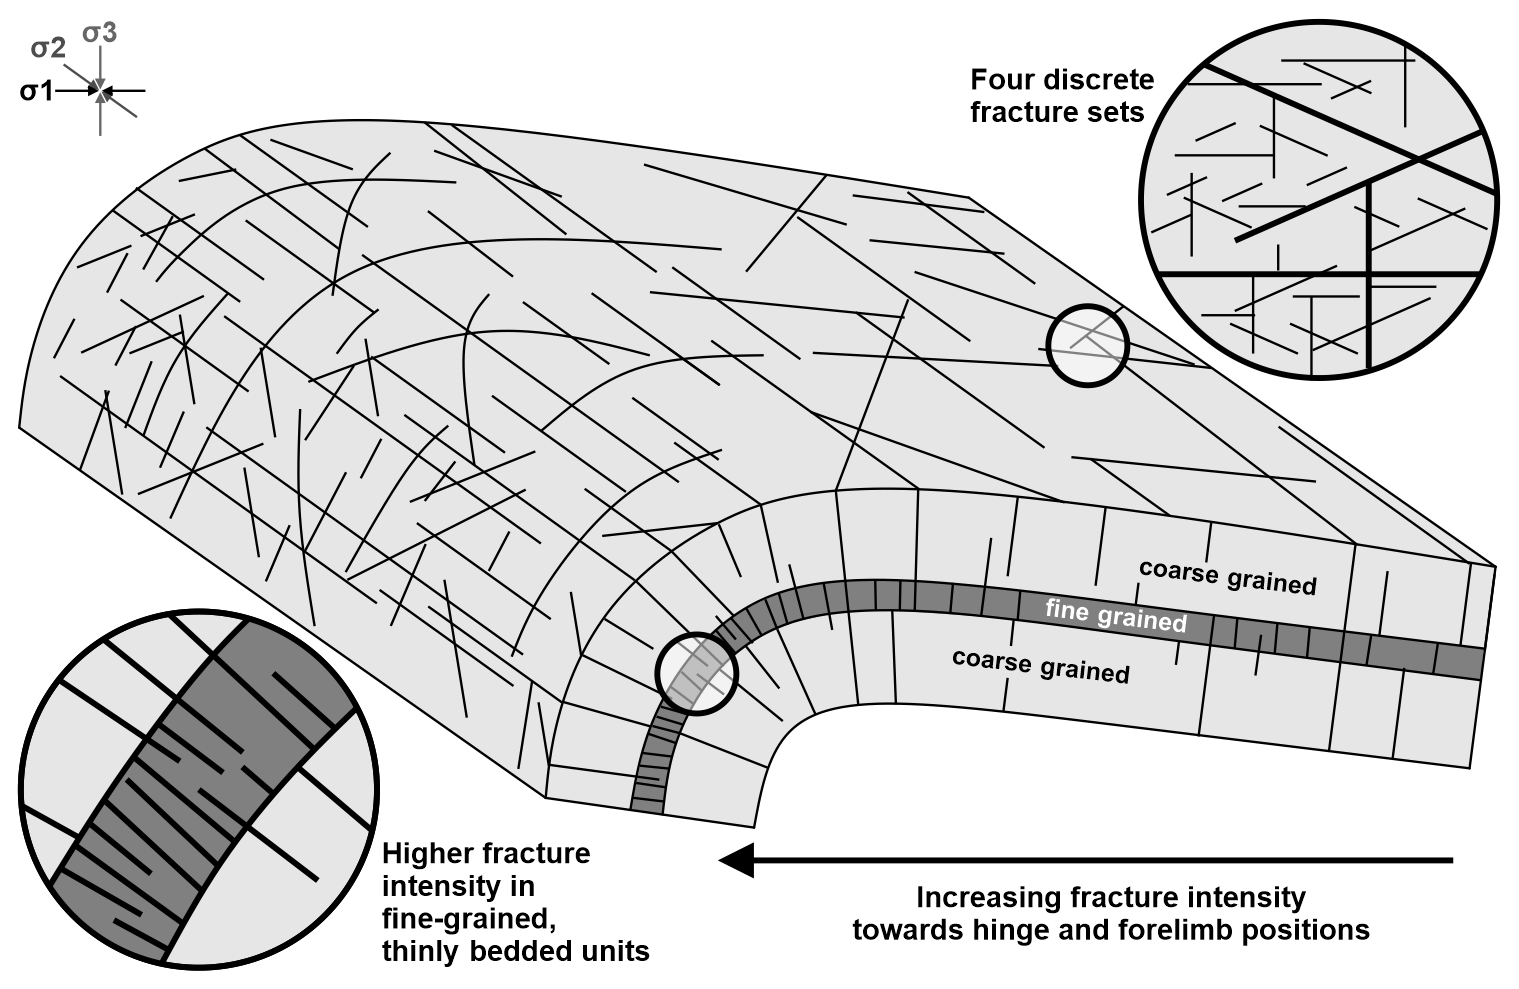
Figure 2Conceptual diagram showing established relationships between geological properties and fracture attributes in folded sedimentary rocks. The depicted relationships are (i) increased fracture intensities at hinge-proximal or high-curvature zones, (ii) higher fracture intensities in fine-grained or thinly bedded carbonate lithologies, and (iii) the presence of four discrete fracture sets on contractional anticlines. The figure is based on the conceptual models by several authors (e.g. Price, 1966; Stearns, 1964, 1969; Stearns and Friedman, 1972; Hancock, 1985; Watkins et al., 2015, 2019).
Structural controls on fracture attributes include proximity to faults (e.g. Caine et al., 1996; Tamagawa and Pollard, 2008; McGinnis et al., 2015), structural position on folds (e.g. Harris et al., 1960; Hennings et al., 2000; Watkins et al., 2015, 2018), and fold curvature in both dip and strike directions (e.g. Lisle, 1992, 1994; Fischer and Wilkerson, 2000). Regional or local stresses and stress perturbations (e.g. Hancock, 1985; Tamagawa and Pollard, 2008; Ferrill et al., 1999), burial history and progressive diagenesis (e.g. Laubach et al., 2009; Hooker et al., 2013), and previous episodes of deformation (e.g. Agosta et al., 2010; Casini et al., 2011; Ferrill et al., 2021) are among some of the other factors that may influence fracture network properties. Each of the relationships outlined above may impart spatial variability to natural fracture networks, and as a result, the fracture properties may vary both in 3D and across spatial scales (e.g. Gillespie et al., 1993, 2001; Castaing et al., 1996; Odling, 1997; Bonnet et al., 2001; Bossennec et al., 2021).
Here we combine 3D photogrammetric reconstruction techniques with field-based measurements and Google Earth imagery to perform a multiscale assessment of fracture properties at Swift Reservoir anticline, NW Montana. We assess (i) the link between lithology (grain size and rock texture) and fracture intensity; (ii) the influence of structural position vs. fracture orientations and fracture intensity; and (iii) the effects of the observation scale on estimated fracture properties. We show that the stratigraphic exposure level influences the fracture intensity irrespective of structural position but that only fracture sets oriented parallel and perpendicular to the fold exhibit increases in the fracture intensity towards the fold hinge. By characterizing structural and stratigraphic controls on fracture development at multiple observation scales, we provide insights into the scale dependence of fracture formation in deformed multilayer systems.
The Sawtooth Range is a NNW–SSE trending fold–thrust belt that marks the eastern edge of the Rocky Mountains in NW Montana (Fig. 3a and b). Cambrian through Cretaceous stratigraphy is deformed and exposed in the Sawtooth Range (Fig. 3c and d). This belt of exposed thrusts and related folds is bound to the west by the Lewis–Eldorado thrust system and to the east by Jurassic–Paleogene foreland basin deposits associated with the Cordilleran orogeny (Fuentes et al., 2012). The main phase of fold–thrust deformation in the Sawtooth Range is interpreted to have occurred during late Cretaceous to Palaeocene (Fuentes et al., 2012). Thrusts within the Sawtooth Range are generally closely spaced, laterally continuous, and westward dipping and exhibit a general trend for increased dips westwards, towards the hinterland (Fig. 3c and d). The Sawtooth Range is interpreted as being a thin-skinned deformation belt (Mudge, 1982; Mitra, 1986; Holl and Anastasio, 1992; Fuentes et al., 2012), and the stacked thrust sheets of the Sawtooth Range have been interpreted as being an exhumed and eroded thrust duplex that formed below the overlying Lewis–Eldorado thrust (Ward and Sears, 2007).
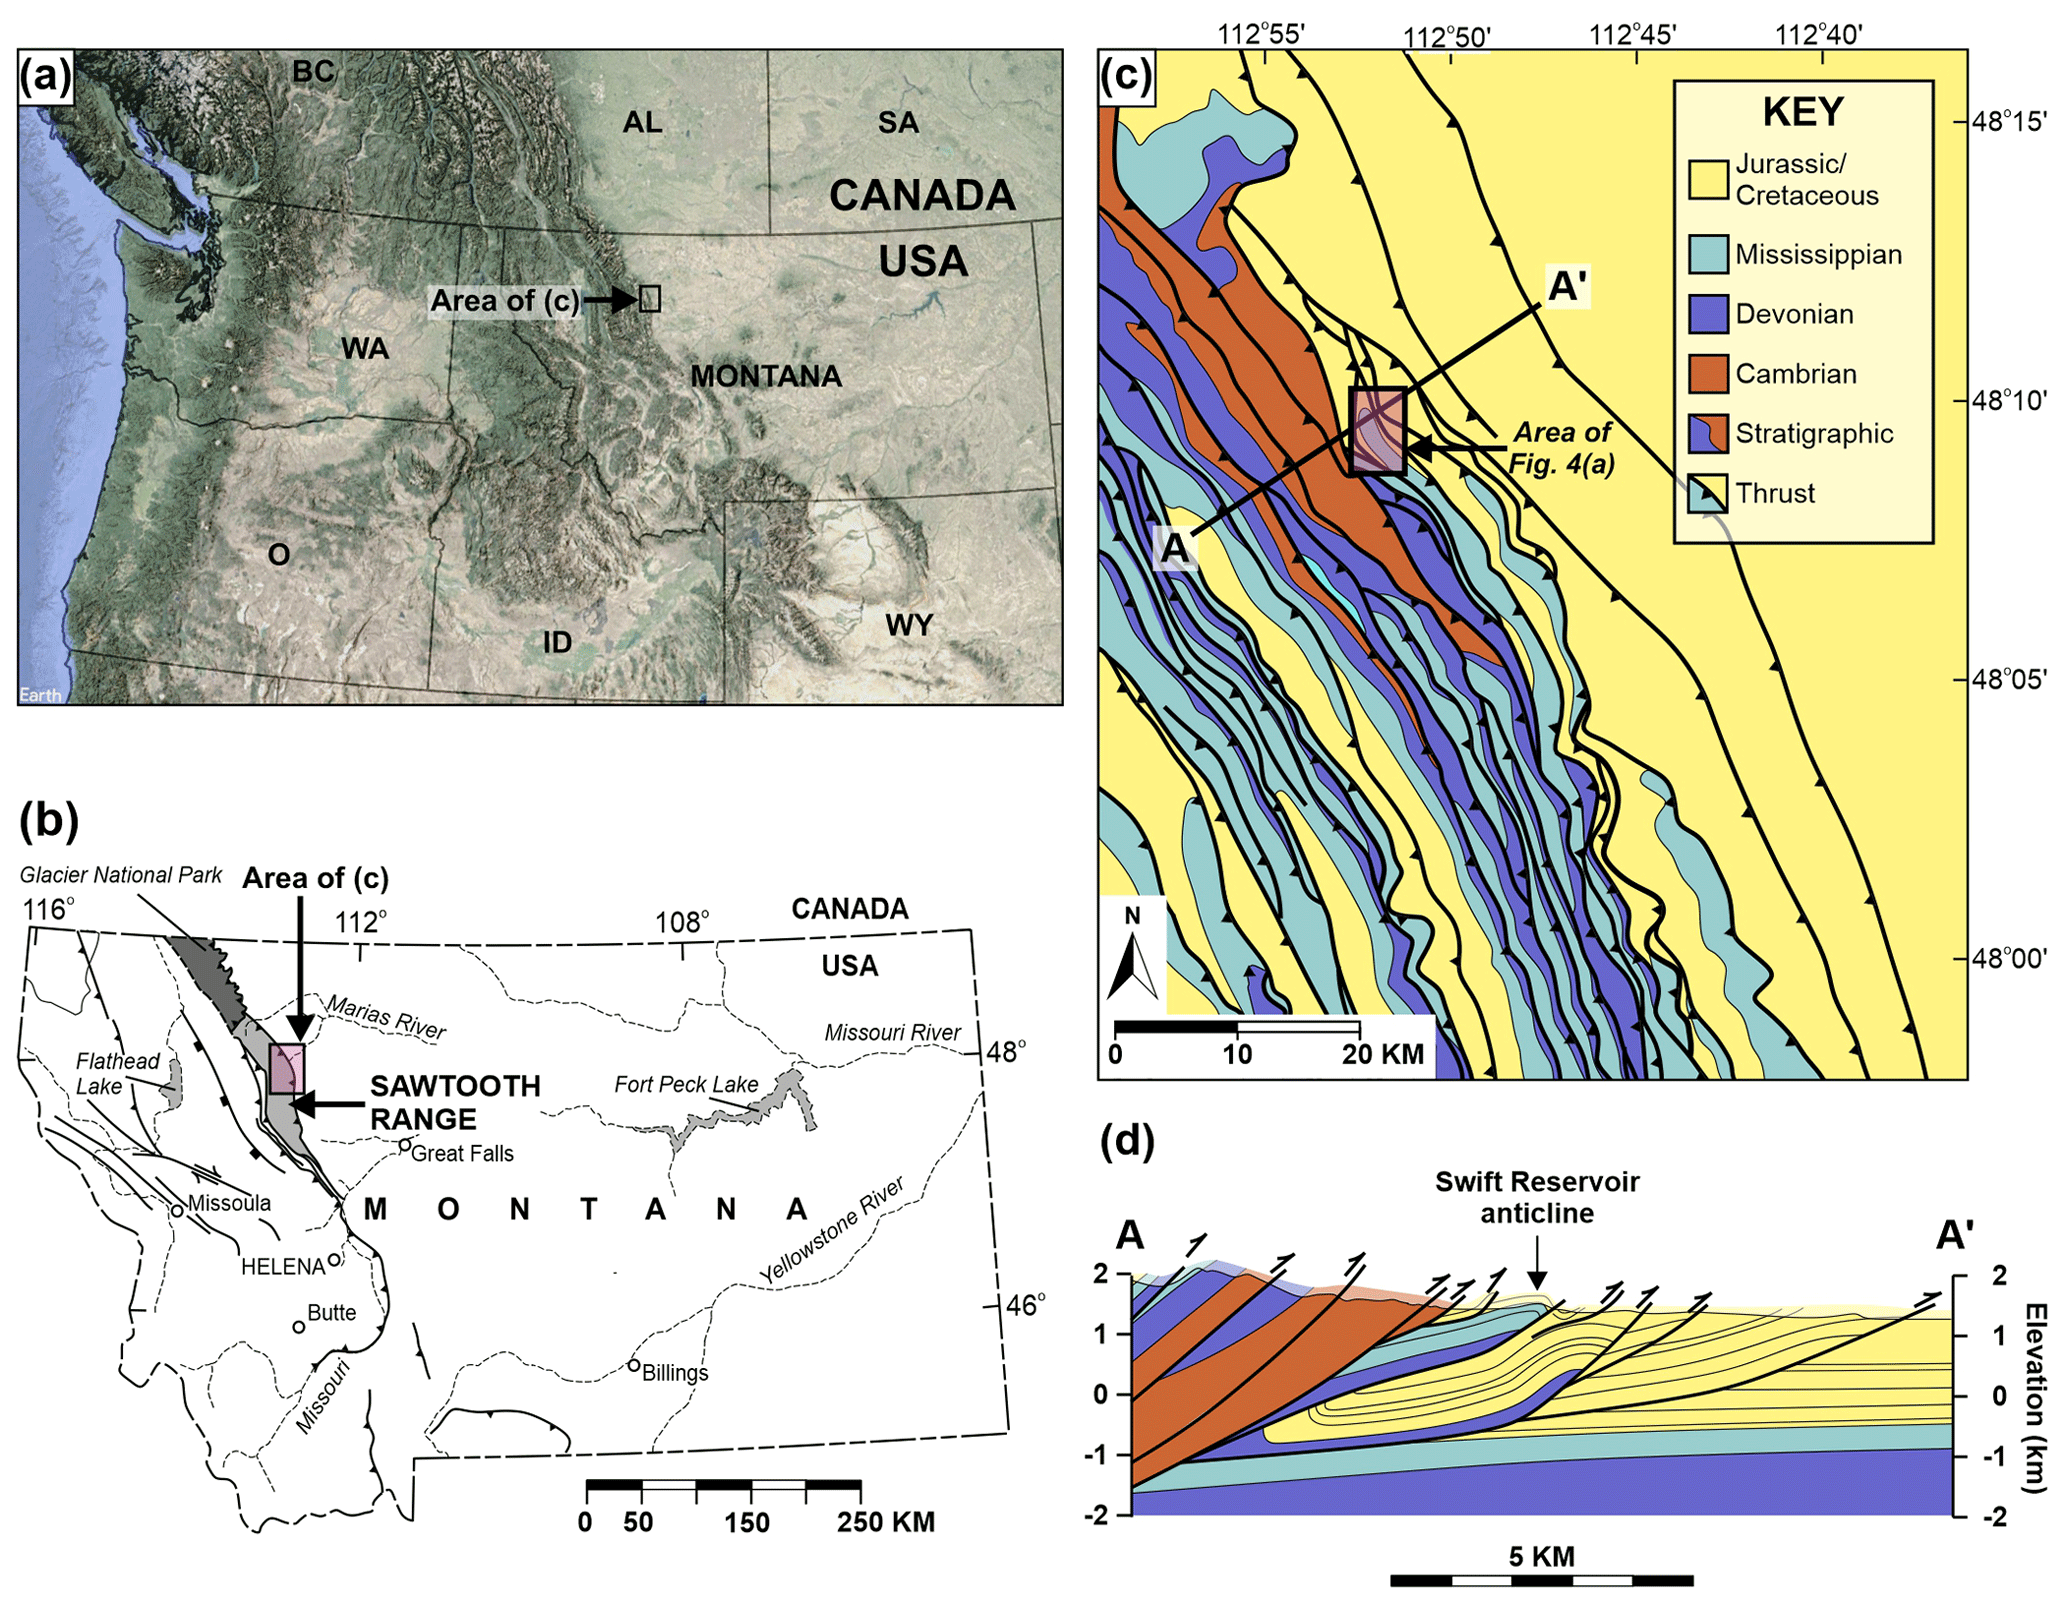
Figure 3Regional and geological context for Swift Reservoir anticline. (a) Regional overview map showing the location of the Sawtooth Range in NW Montana. The image is generated from satellite imagery (© Google Earth, Landsat, and Copernicus) and regional elevation data (ASTER Global Digital Elevation Map, GDEM). (b) Enlarged map of Montana showing the location of the Sawtooth Range and a simplified structural configuration of the area, as modified from Mudge (1982). (c) Simplified geological map for the central part of the Sawtooth Range, as modified from Mudge (1982), Mudge and Earhart (1983), and Watkins et al. (2019). (d) Cross section across Swift Reservoir anticline and surrounding area showing general structural geometries, as modified from Watkins et al. (2019).
Several studies have focused on fracture patterns within Mississippian carbonate rocks at localities in the Sawtooth Range. Early work by Stearns (1964, 1969) and by Stearns and Friedman (1972) focused on fracture orientations at the Teton anticline (ca. 35 km to the south of Swift Reservoir anticline). This work led to the development of strategies for differentiating between shear vs. extension fractures on anticlines, based on their orientations with respect to the fold hinge. The results of these studies led to the widespread use of general models for predicting fracture orientations on and around open folds (e.g. McQuillan, 1973; Fisher and Wilkerson, 2000; Cooper et al., 2006). Later work at the Teton anticline focused on fracture spacing (Sinclair, 1980) and the effects of curvature (Spooner, 1984) and structural evolution (Ghosh and Mitra, 2009; Burberry et al., 2019) on fracture attributes. Studies at Swift Reservoir anticline have related fracture properties at the site to a range of geological factors, including extension driven by flexural loading (Ward and Sears, 2007), variable lithological properties in exposed units (Watkins et al., 2019), and regional stress rotations (Singdahlsen, 1986). Swift Reservoir anticline has also been used as a direct surface analogue for subsurface gas fields in the eastern Rockies at Waterton, southern Alberta, Canada (Rawnsley et al., 2007).
Swift Reservoir anticline lies at the eastern edge of Swift Reservoir, NW Montana (Fig. 4a). The present-day erosion level across the anticline exposes carbonates of the Dupuyer Creek unit (Nichols, 1984, 1986) of the upper part of the Mississippian Castle Reef Formation (Madison Group). At isolated localities, unconformably overlying fine-grained clastic rocks of the Jurassic Ellis Group are preserved (e.g. Fig. 4b). The Mississippian to Jurassic unconformity is widespread across NW Montana and SW Alberta and records non-deposition and/or erosion on a possible forebulge before the initial deposition in the Cordilleran foreland basin (Ward and Sears, 2007; Fuentes et al., 2012). The Dupuyer Creek unit makes up most of the exposed strata at Swift Reservoir anticline and records multiple cycles of carbonate deposition in a shallow-water environment, from high-energy, open-marine conditions to a tidally influenced interior ramp setting (Mudge, 1982). Strata within the Dupuyer Creek unit display significant variability in both composition and texture (Watkins et al., 2019), as defined by cyclical variations in the depositional environment (e.g. Nichols, 1984).
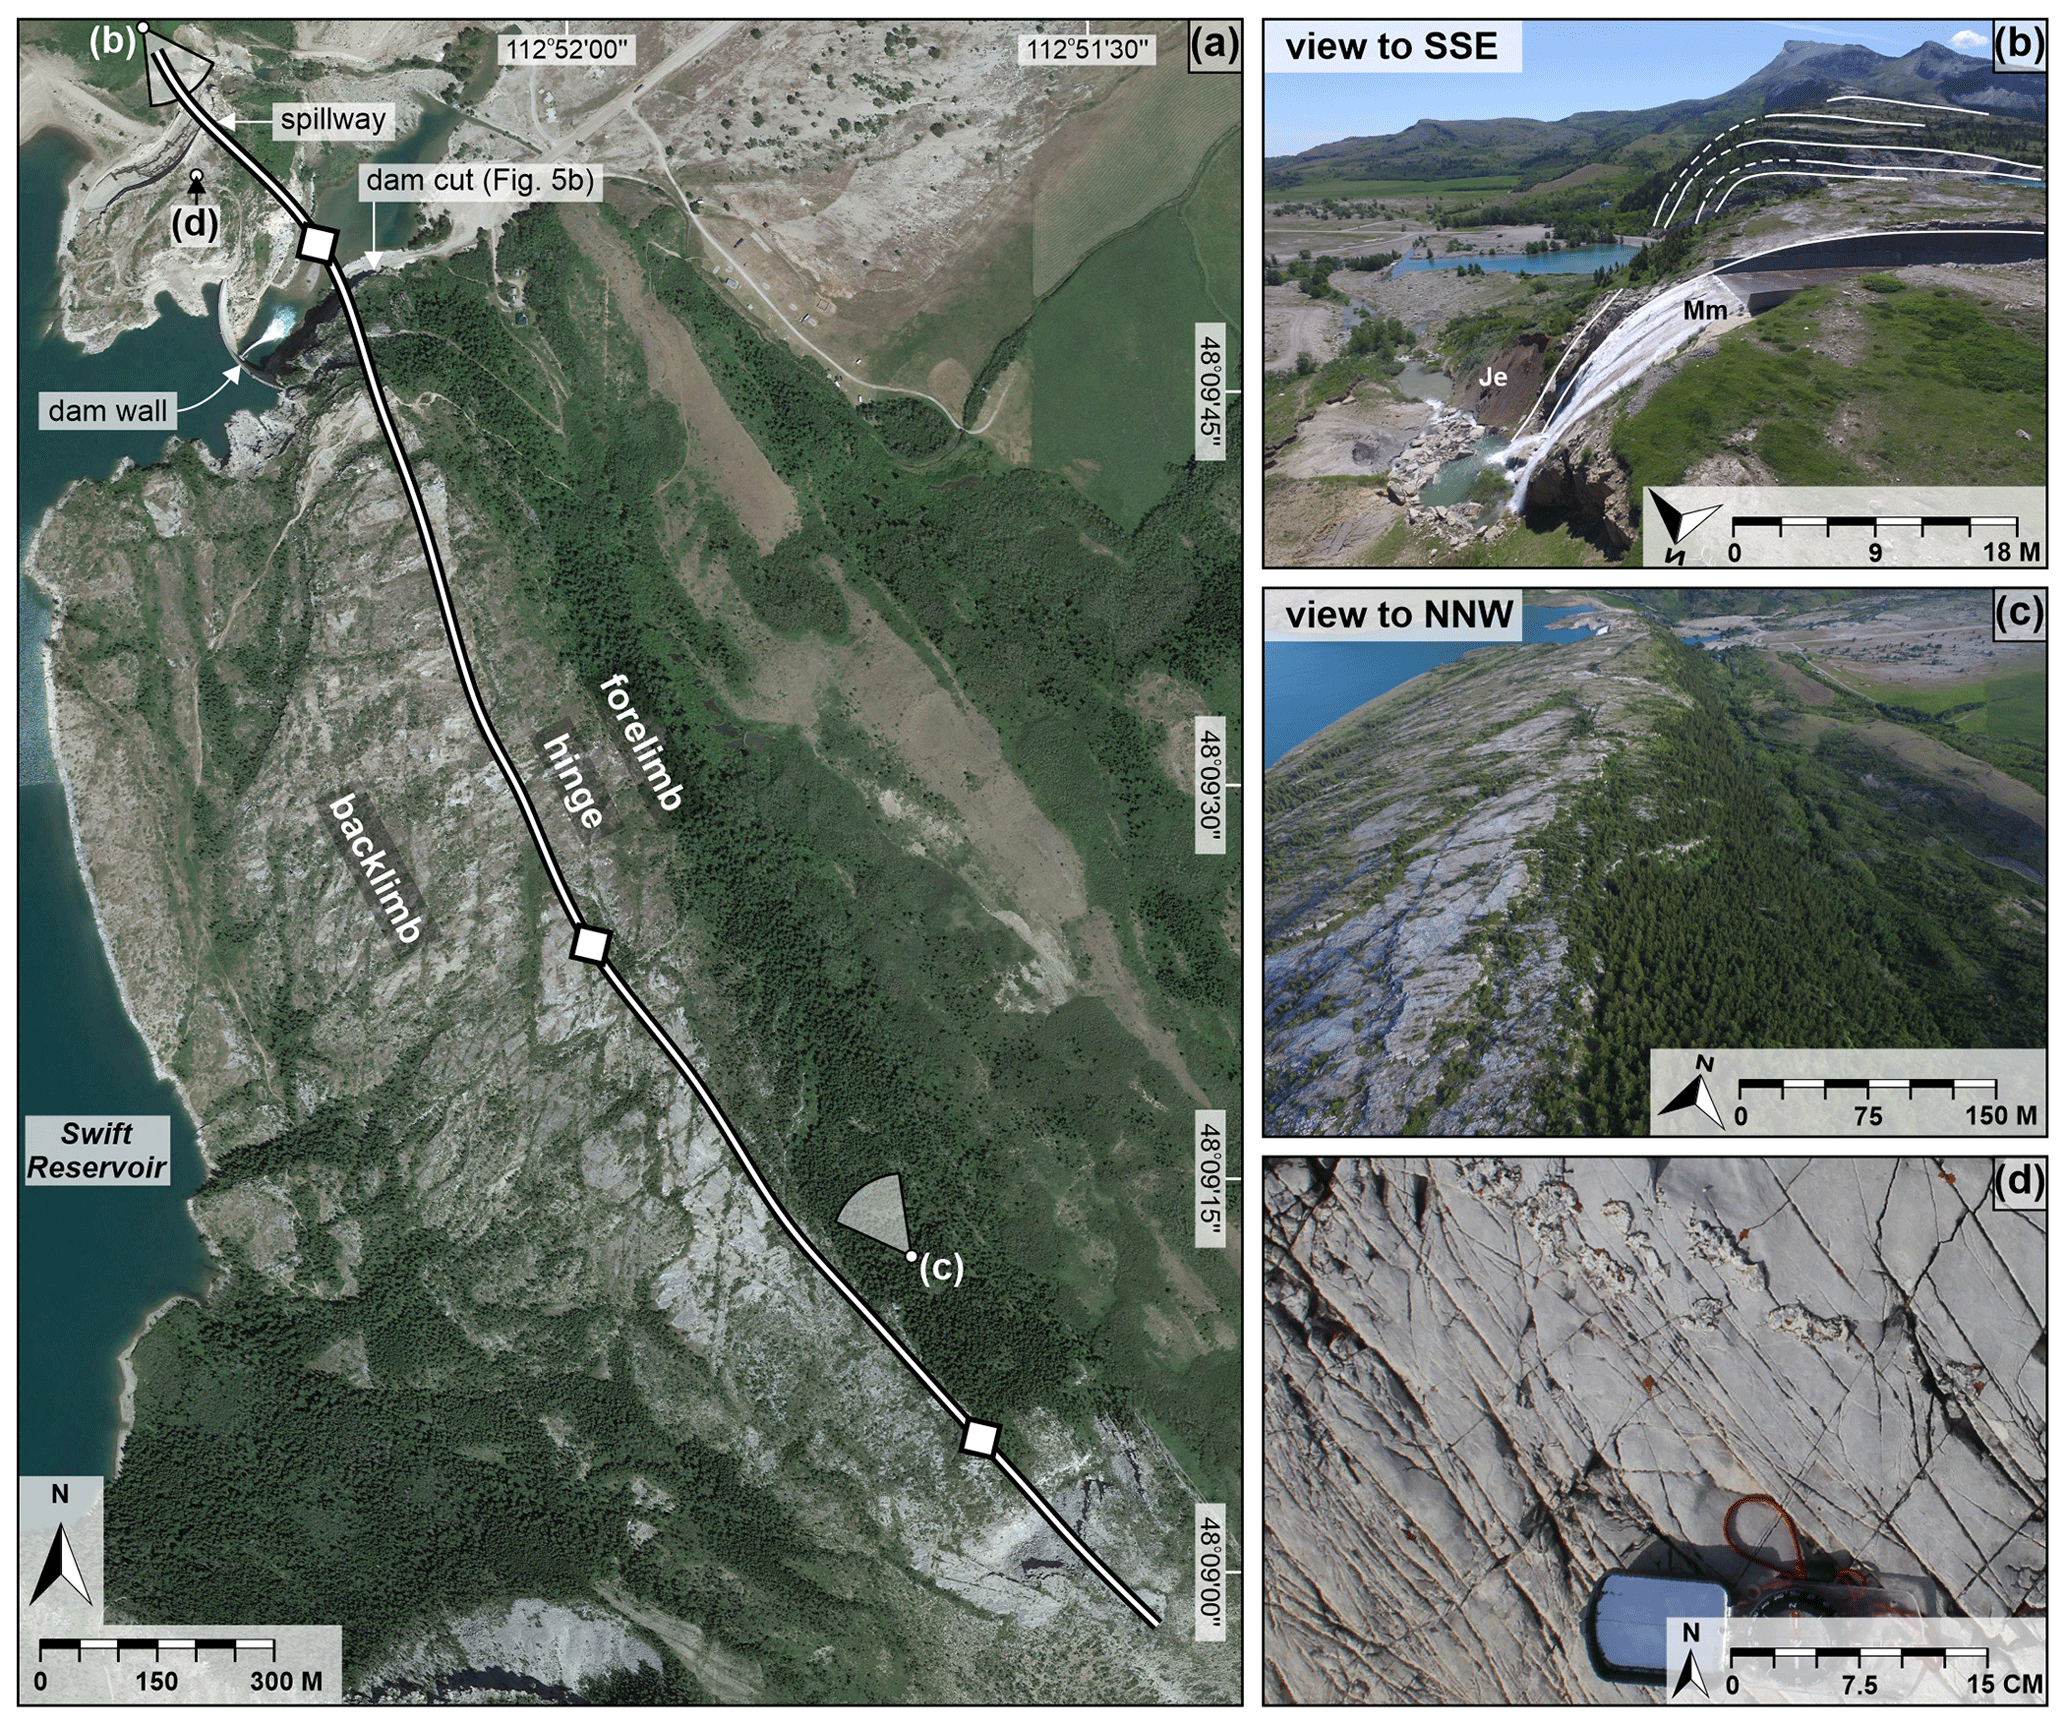
Figure 4Multi-scale imagery of Swift Reservoir anticline. (a) The satellite image (© Google Earth, Landsat, and Copernicus) shows large-scale vegetated fractures on the crest of the structure. The ground pixel resolution is ca. 0.35 m. Annotations show the locations and look directions for panels (b)–(d) and approximate structural positions on the fold. (b) UAV-acquired aerial image of Swift Reservoir anticline looking to the SSE along the crest of the structure. Swift Reservoir spillway, exposed fold forelimb, and sub-Jurassic unconformity can be seen in the foreground of the image. Mm is for the Mississippian Madison Group; Je is for the Jurassic Ellis Group. (c) UAV-acquired aerial image of the anticline looking to the NNW along the crest of the structure. The stepped erosional profile along the anticline crest allows lithological boundaries to be mapped across the structure. (d) Field image of a highly fractured coral boundstone unit exposed near the dam spillway.
Swift Reservoir anticline is situated in the footwall of an imbricate stack of thrust sheets involving primarily Cambrian to Devonian strata at outcrop (Fig. 3c). The fold is interpreted as a hanging-wall anticline above an ENE-verging thrust fault (Watkins et al., 2019), is marked by a tight fold hinge with a narrow hinge zone (Watkins et al., 2019), and is steeply dipping to overturned beds in the forelimb of the structure (Fig. 4b). The anticline trends NNW–SSE and is characterized by an arcuate axial trace, which records some variation in its orientation along the crest of the structure (Fig. 4a). The stepped erosional profile across the crest of the structure (Fig. 4c) exposes several stratigraphic levels within the Dupuyer Creek unit; the current erosion surface also includes a number of well-exposed, areally extensive fractured bedding surfaces (e.g. Fig. 4d) at multiple along-strike locations and the forelimb, hinge, and backlimb positions. This extensive exposure of the fractured bedding surfaces makes Swift Reservoir anticline a suitable site to examine, at a range of scales, the potential links and feedbacks between folding and fracturing in multi-layered carbonate stratigraphy.
Bedding, fault, and fracture orientation measurements were collected at the study site using handheld analogue (Silva) and digital (FieldMove on Apple iPad) compass clinometers. These data were used to characterize general structural geometries at the site (e.g. bedding and fracture orientations) to ground-truth digitally derived fracture orientations, and to supplement remotely acquired data. Sedimentary logging was carried out to capture the variations in grain size and rock texture through the exposed section. In addition to field-based measurements and observations, digital imagery was acquired at multiple scales at the site to assess scale-dependent variations in fracture attributes. The position of the fold hinge is reproduced here using the results of Watkins et al. (2019), who conducted a curvature analysis and estimated the fold hinge position from bedding orientation data and a constructed 3D model of the top Castle Reef Formation.
Digital imagery and associated data at three observation scales were used for fracture characterization as follows:
-
Satellite imagery (Google Earth, 2018) provided a large-scale, lower-resolution dataset, with an estimated ground pixel resolution of 0.35 m over the study area. This imagery was used for preliminary digital mapping and the generation of a large-scale, low-resolution fracture map.
-
A 3D photogrammetric reconstruction of the study site was achieved through the acquisition of low-altitude aerial imagery across the structure from 22 manually piloted UAV flights. These flights yielded 2987 aerial images, which were acquired at a range of altitudes (5–97 m) above the outcrop surface. The digital photogrammetric processing was carried out using Agisoft PhotoScan Professional Edition 1.6 software, according to established protocols (e.g. Bemis et al., 2014; Cawood et al., 2017), with the 3D reconstructions oriented and scaled with GPS ground control points and calibrated against Google Earth imagery. This yielded a final photorealistic 3D mesh (digital outcrop) comprised of 2.9 million mesh triangle faces, with an average ground pixel resolution of 0.24 m and total coverage of ∼1.5 km2.
-
A total of 244 ground-based digital images, of sub-millimetre (0.1–0.3 mm) ground pixel resolution, were collected at outcrop using a handheld digital single-lens reflex (DSLR) camera during fieldwork. The handheld camera images used in this study for fracture orientation characterization were collected by Watkins et al. (2019) for fracture intensity analysis. Photographs of the fractured bedding surfaces were acquired at a distance of 0.5–1.5 m from the outcrop, along a series of transects across the crest of the structure. The imagery were acquired along with GPS coordinates and camera orientation data at each photo location, which allowed the images to be georeferenced and re-oriented prior to the manual digitization of fracture traces.
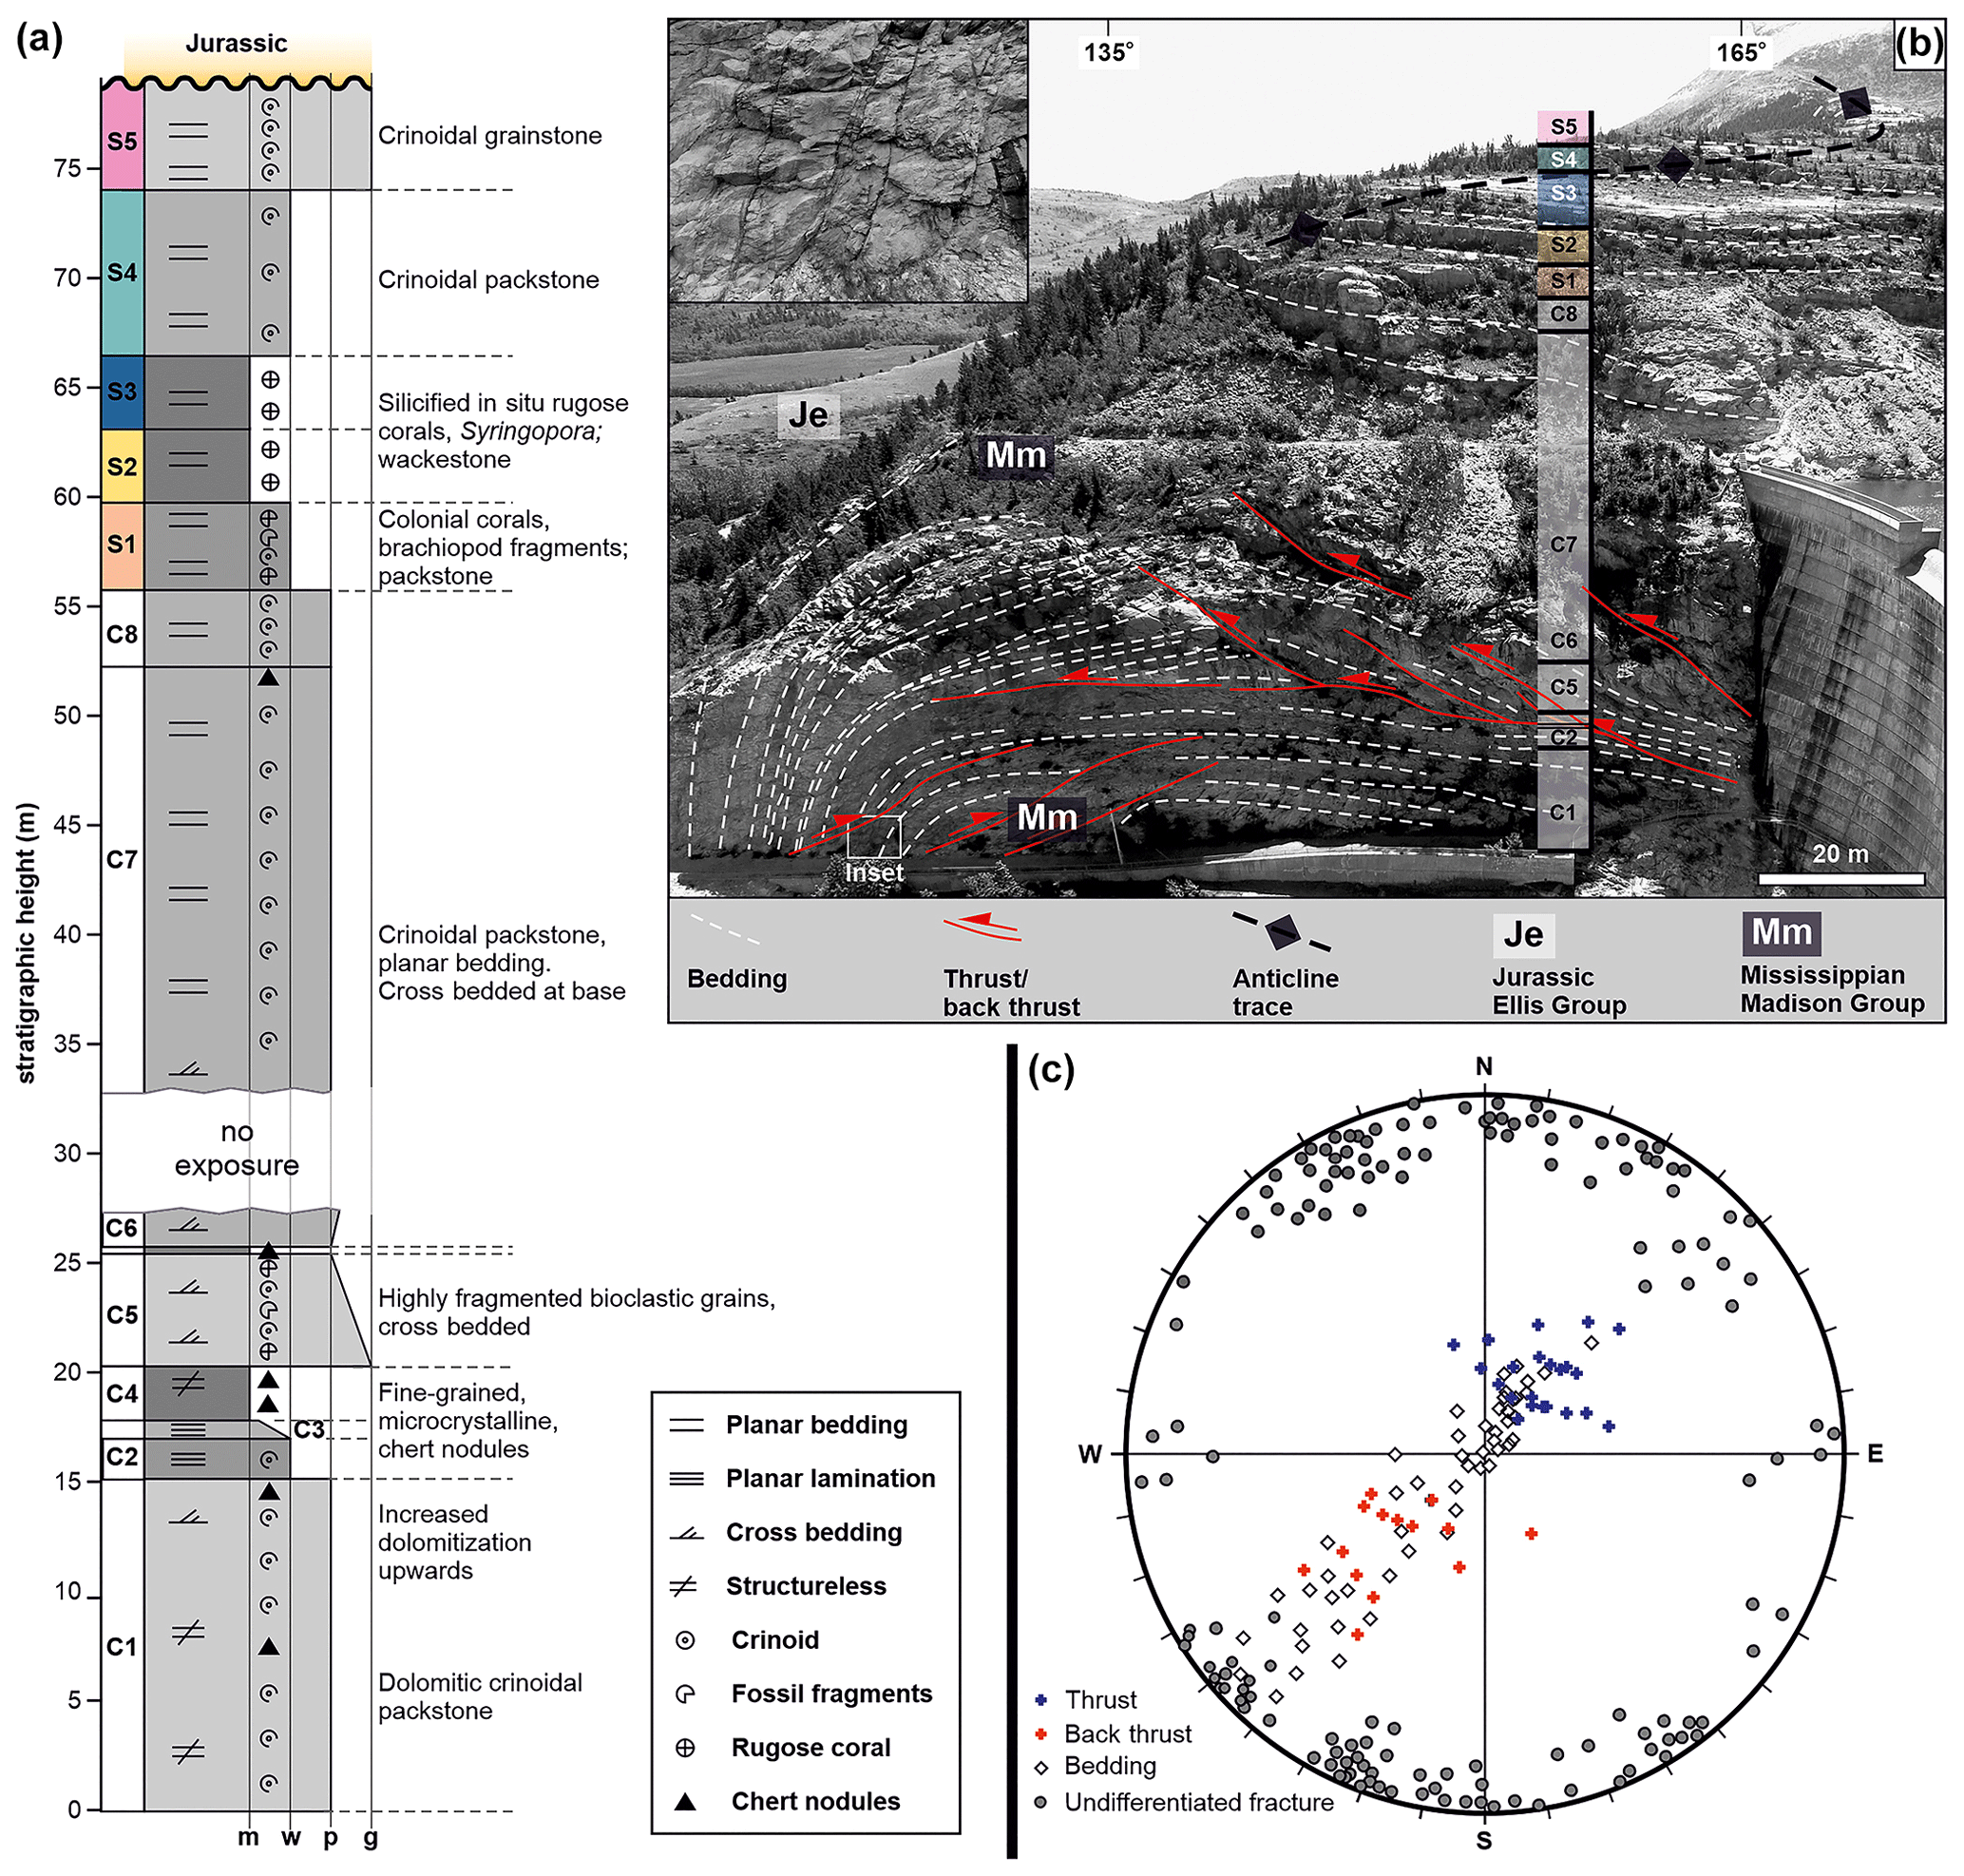
Figure 5(a) Stratigraphic log through exposed units at the southern side of Swift Reservoir dam cut. (b) Cross-sectional field image of the dam cut showing the general fold geometry, interpreted thrusts and back thrusts, and the approximate position of the structural and stratigraphic log in set A. Note that units S1 to S5 are defined as those that are exposed on the crest of the structure (see Fig. 10). The C1 to C8 units exposed only in cross-sectional view in panel (b). Mm is for the Mississippian Madison Group; Je is for the Jurassic Ellis Group. (c) Orientation data from field and digital outcrop measurements showing the NW-striking bedding planes, thrusts, back thrusts, and undifferentiated fractures. The fracture classifications in panel (c) are based on field observations and fracture orientations.
The manual digitization of fracture traces in 2D (satellite and ground-based images) and 3D (via digital outcrop) was performed in Move 2016.1 software (formerly Midland Valley; now Petroleum Experts). The orientations of digitized fracture traces were extracted using FracPaQ 2.3 (Healy et al., 2017) and Move 2016.1 software. The 2D fracture intensity was calculated from digitized fracture traces by calculating total fracture length per unit area in 2D (m m−2). Fracture intensity calculations were carried out in Move 2016.1 for handheld camera images and in ArcMap 10.5.1 (Esri) for satellite and digital outcrop data. The 3D polylines from digital outcrop mapping were projected onto a horizontal plane for orientation and intensity analysis. While this approach does not correct for bed dip and the effects of orientation and intensity distortion, it allows 2D satellite and 3D digital outcrop interpretations to be directly compared within equivalent reference frames. There is no straightforward way to account for geometric artefacts in satellite imagery (e.g. steeper beds may appear to have more closely spaced fractures in the dip direction than is real), and therefore, we elected to treat all fracture maps as essentially horizontal. While this may lead to overestimates of the fracture intensity in fractures oriented perpendicular to the dip direction, we consider this effect to be relatively minor at the scale of the analysis area. Note that most of the pavements exposed on the crest of Swift Reservoir anticline have dips around 20∘ or lower (Watkins et al., 2019), and therefore, we expect the effects of intensity distortions to be relatively minor. We do not account for orientation distortions because we do not have a reliable method (using the remote sensing approach) for estimating the 3D orientation of fracture traces from polyline interpretations (either from satellite imagery or the 3D digital outcrop). Field images were interpreted in 2D, with the images oriented according to the bed dip at each field station (i.e. images were rotated and scaled so that they had the same orientation as bedding). Fracture interpretations from field images were projected to a horizontal plane for intensity and orientation analysis. Again, while this may have introduced some minor geometric artefacts, this approach was taken so that consistency between datasets could be maintained.
The primary focus of this study is the extraction and analysis of fracture attributes from remote sensing data, with implications for extrapolating fracture properties across observation scales. As such, detailed observations of fracture morphology (e.g. fracture cements and kinematic indicators) are beyond the scope of this work. We refer the reader to Watkins et al. (2019) for detailed petrological analysis and descriptions of rock texture and mineralogy at Swift Reservoir anticline.
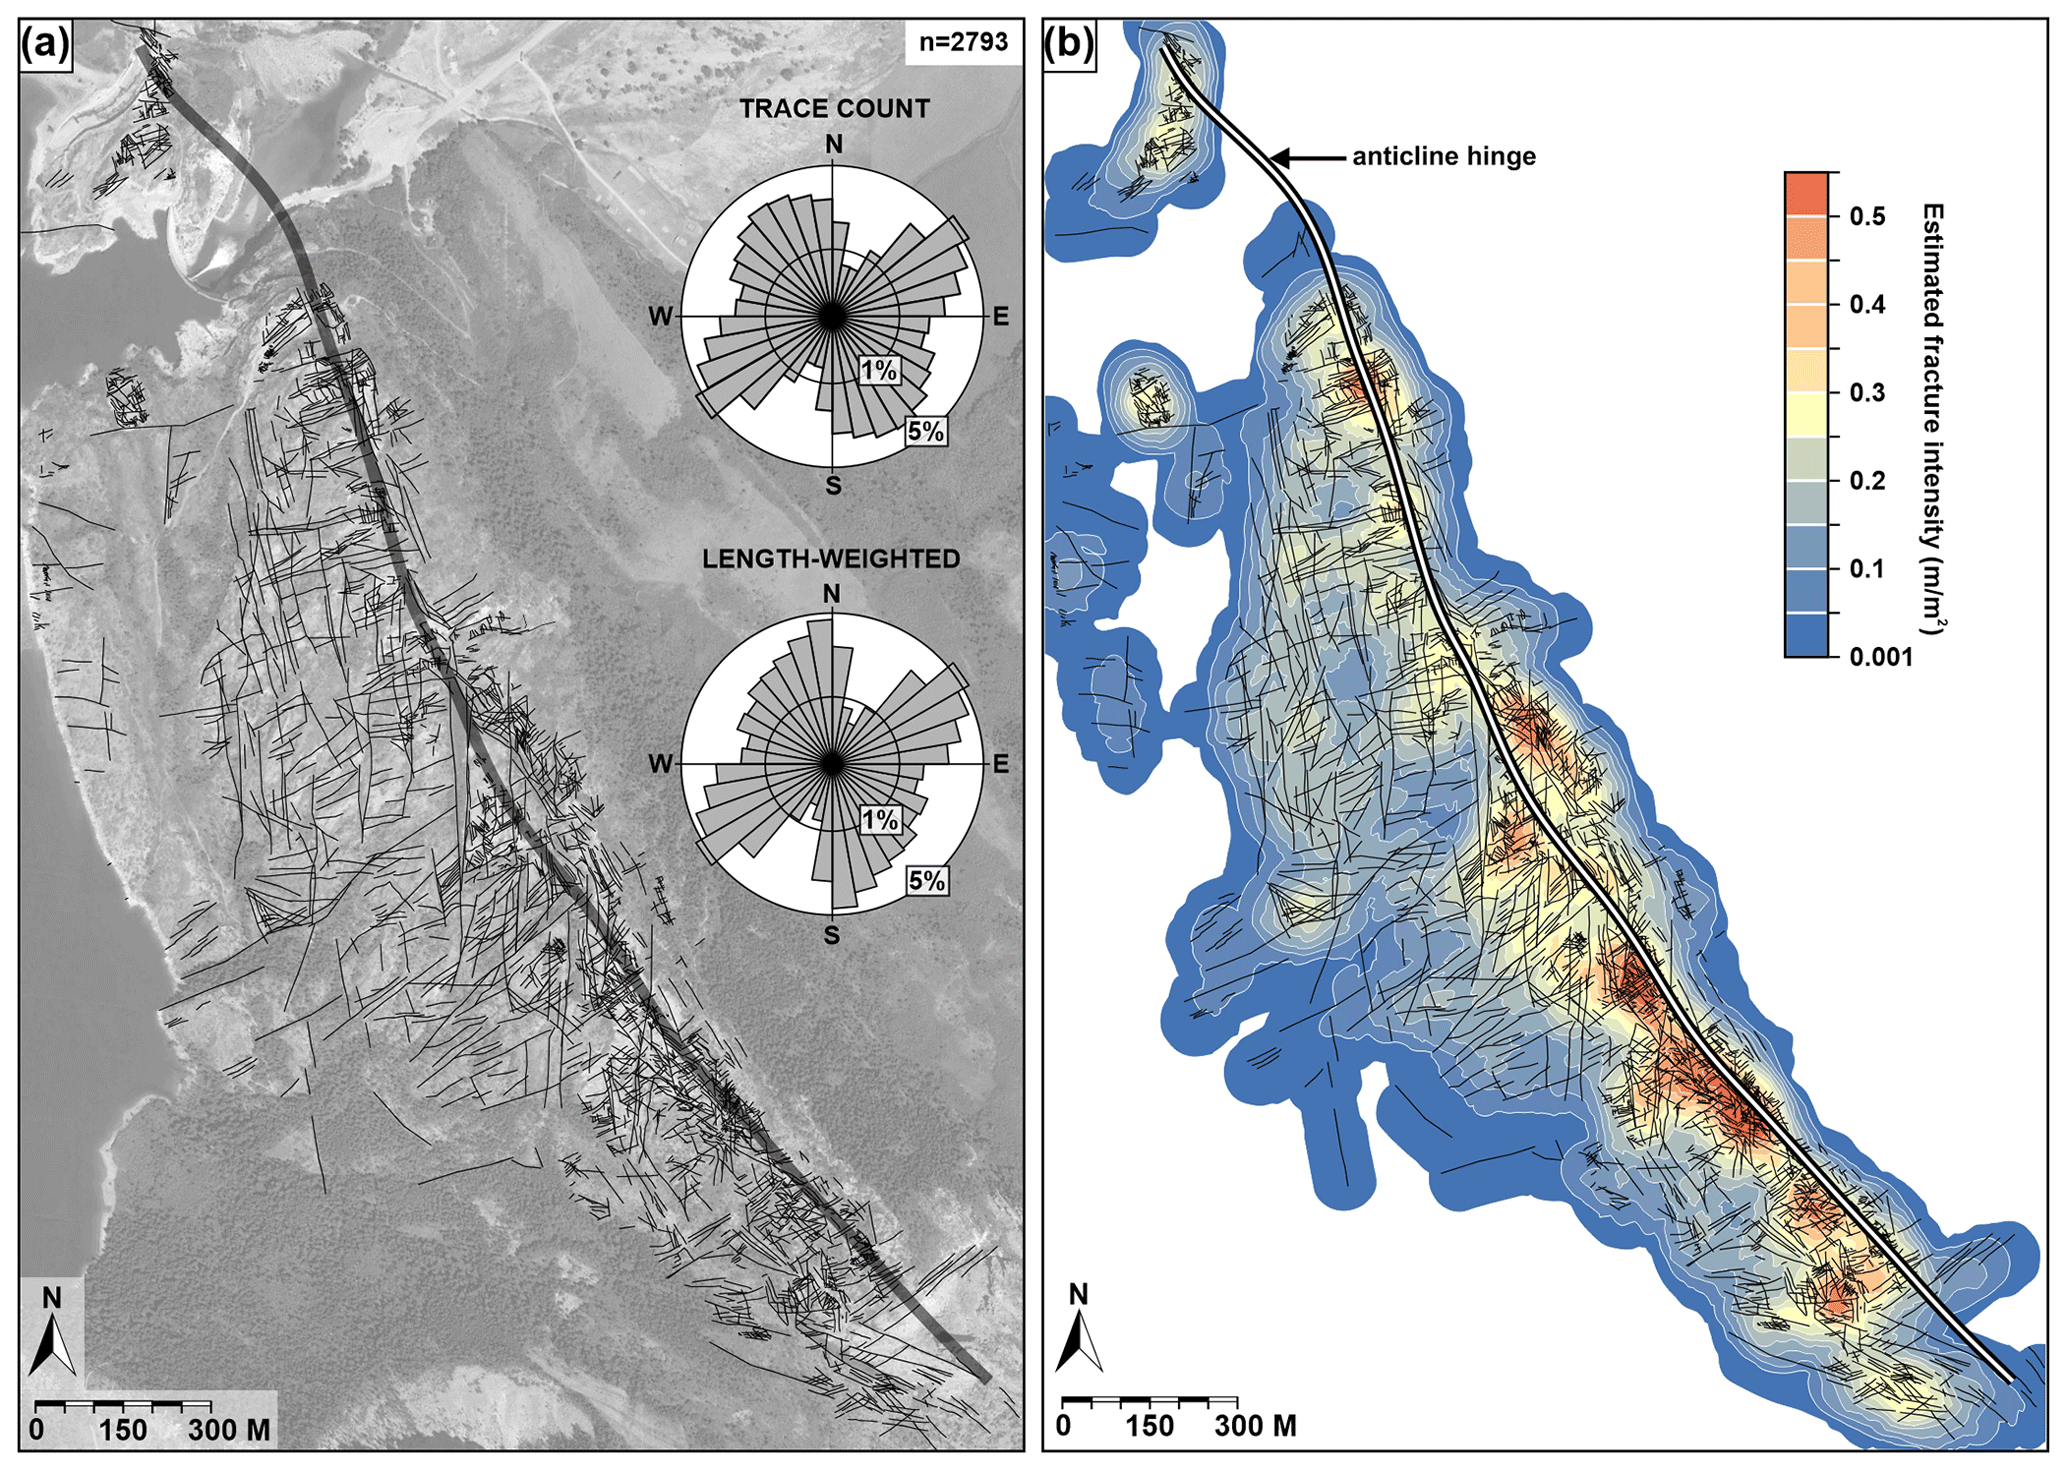
Figure 6(a) Manually interpreted fracture trace map from satellite imagery (© Google Earth, Landsat, and Copernicus; pixel resolution is ca. 0.35 m). Rose plots show the orientation distributions for all fractures mapped at this scale by fracture count (upper rose plot) and by cumulative length (lower rose plot). (b) The estimated 2D intensity (m m−2) of fractures is mapped from satellite imagery. The 2D fracture intensity is calculated using the Line Density tool in ArcMap 10.5.1 software, with 5 m grid cells and 50 m sampling window radii.
5.1 Lithostratigraphy
Approximately 78 m of distinctly bedded, partially dolomitized bioclastic limestones of the Dupuyer Creek unit (Castle Reef Formation) is exposed in the dam cut at Swift Reservoir anticline (Fig. 5a and b). The exposed interval has been subdivided into several informal lithological units based on carbonate lithology and facies. Units C1–C8 are exposed in the cross-sectional view only, and the overlying units S1–S5 are exposed across the crest of the structure (Fig. 5a). Compositional and textural variations, described by Watkins et al. (2019), in the exposed interval mainly reflect cyclical variations in depositional facies (e.g. Nichols, 1984). Bioclasts within coarse-grained units (grainstones and packstones) are dominated by dolomitized crinoid fragments. These grainstones and packstones are commonly structureless or marked by distinct planar cross bedding (e.g. unit C5; Fig. 5a). Fine-grained units (e.g. units S2 and S3) are generally characterized by planar lamination, the presence of chert nodules, and microcrystalline textures. These mudstones or wackestones are generally mud-supported and commonly include large (several cm) isolated colonial corals, particularly in the upper part of the exposed section (Fig. 5a). Coarser-grained packstones and grainstones at Swift Reservoir anticline generally record greater bed thicknesses (1.4–18 m) than fine-grained wackestone lithologies (0.7–2.6 m).
5.2 Fold geometry and field observations
A cross-sectional view of the anticline at Swift Reservoir dam (Fig. 5b) provides an overview of the fold geometry, where the shallowly dipping to horizontal backlimb transitions abruptly through a relatively narrow hinge zone to a steeply dipping to vertical forelimb. Thrusts and back thrusts, with relatively low offsets (>0.5 m), are common through the exposed section (Fig. 5b). The cross-sectional view records a general trend for back-thrust dominance in the hinge and forelimb of the anticline, with thrusts being better developed in the backlimb of the structure. The fold geometry and thrust patterns may vary significantly through the structure; the dam cut cross section, however, provides the best available cross-sectional view of Swift Reservoir anticline.
The 3D fracture orientations collected at the dam cut cross section during fieldwork, and subsequently from a high-resolution digital outcrop of the same locality, record a range of fracture orientations (Fig. 5c). Most easily identified and measured at the dam cut cross section are the thrusts and back thrusts, which typically have a strike orientation parallel to that of bedding, with dips that range from sub-horizontal to ca. 50∘.
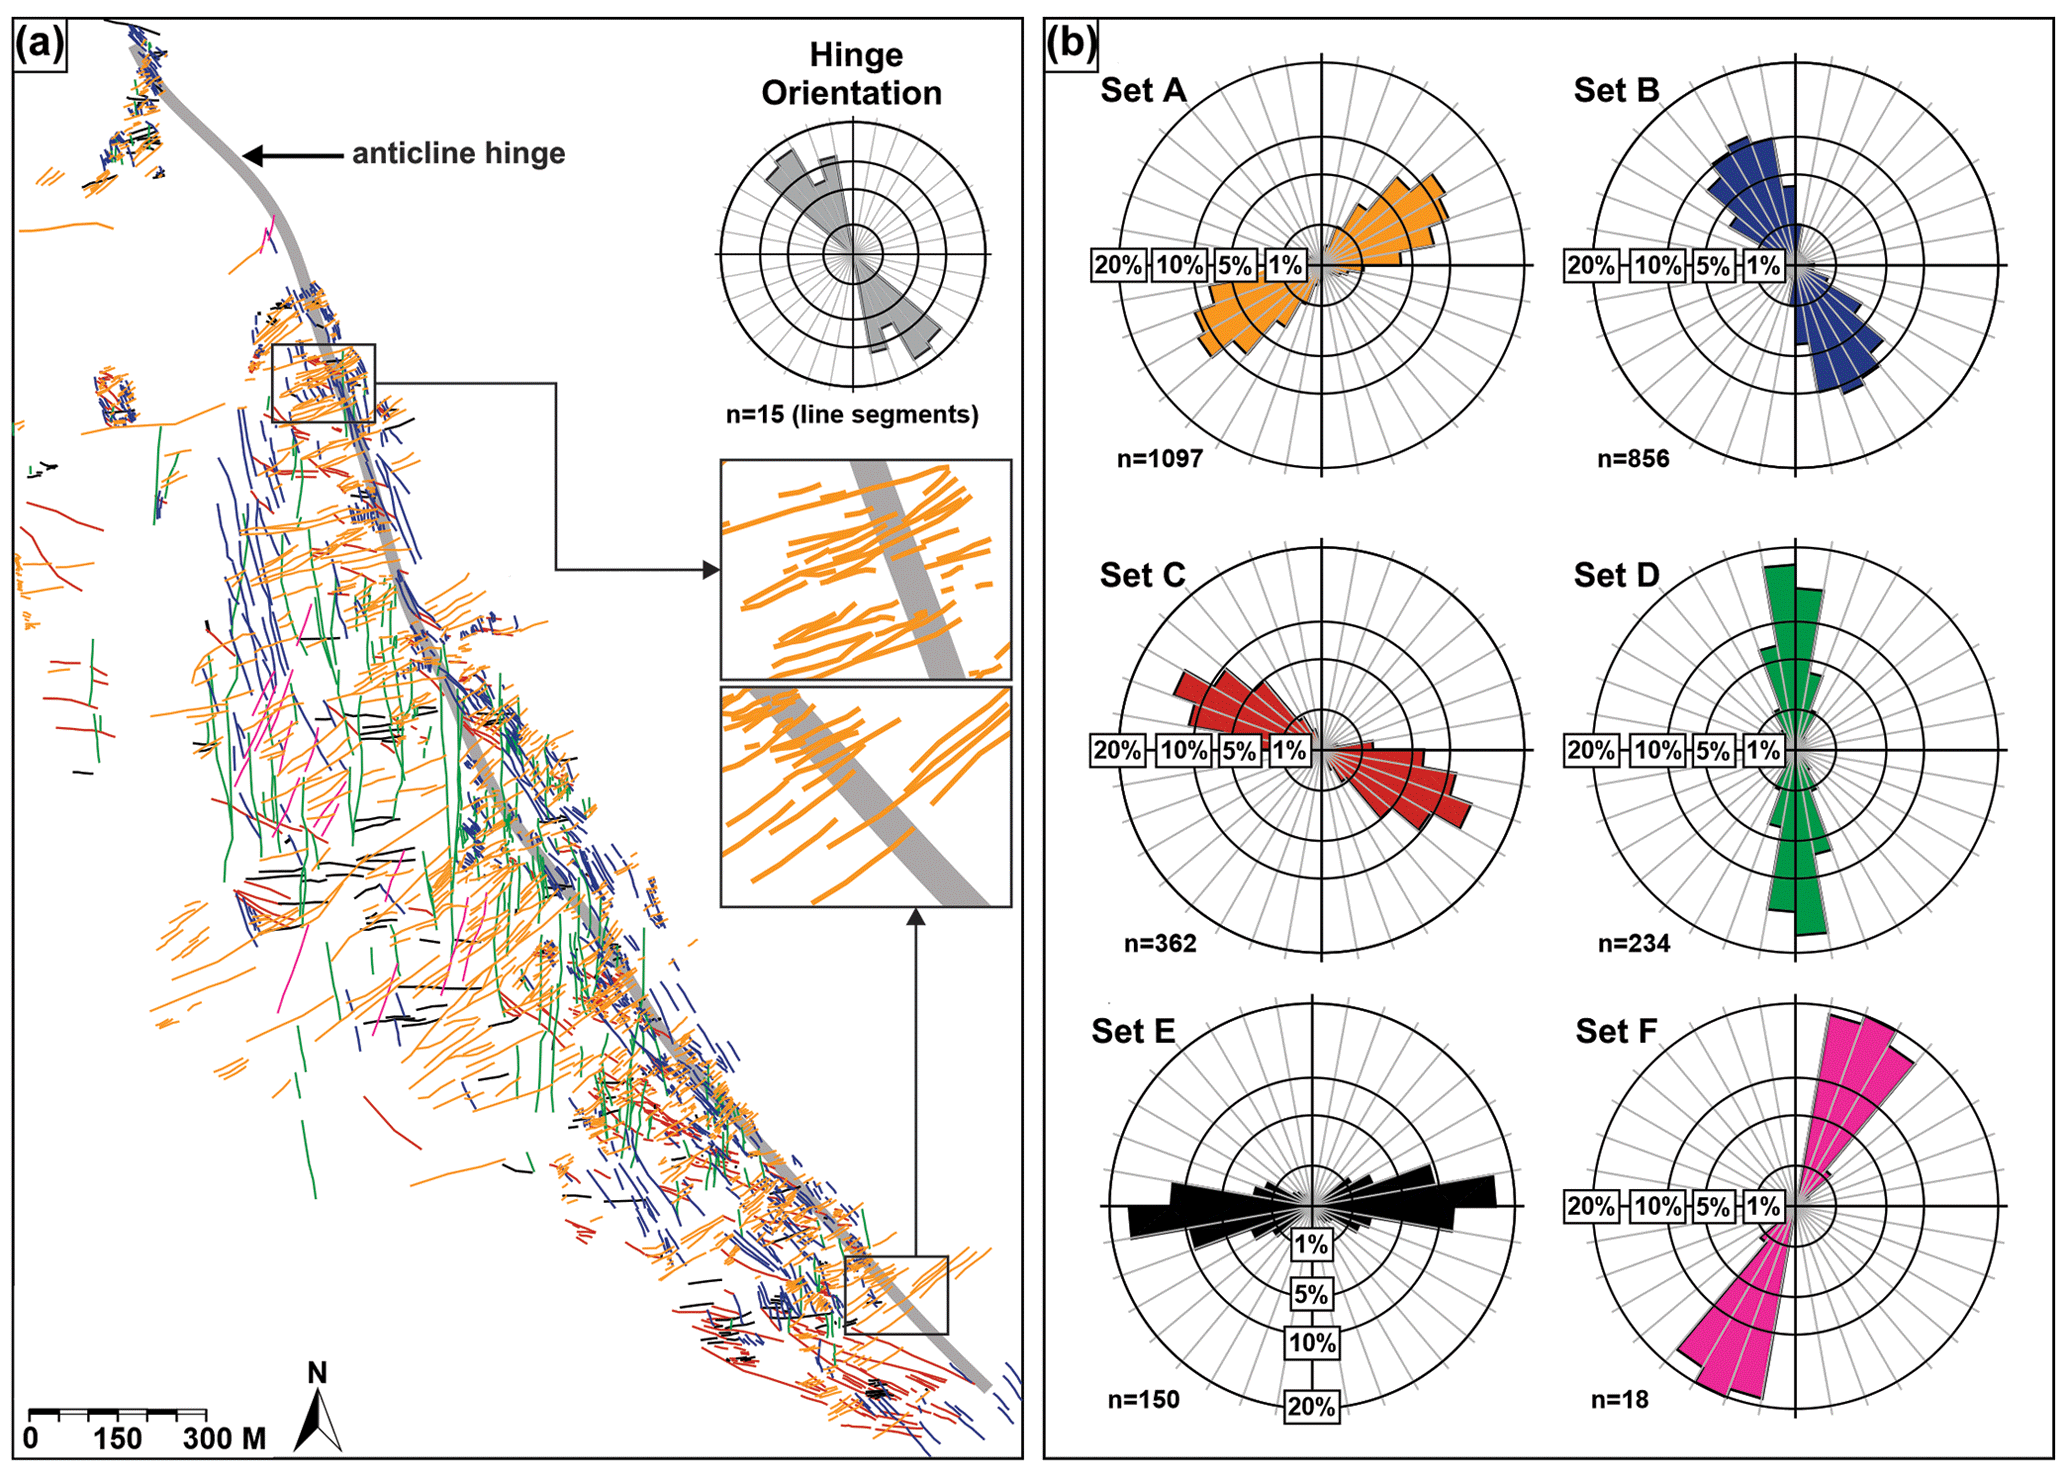
Figure 7(a) Fracture traces separated into six discrete sets, based on orientations of individual fracture traces with respect to the fold hinge orientation. The rose plot in panel (a) shows the fold hinge orientation variability along the crest of the structure, based on 15 line segments of the interpreted fold hinge. The insets in panel (a) show the along-strike variability in the fold hinge and hinge-perpendicular fracture orientations. Despite this variability in the absolute orientations of hinge-perpendicular fractures, these were assigned to the same fracture set (set A). (b) Equal-area, length-weighted rose plots showing orientations of interpreted fracture sets. The orientation variability and overlap between the fracture set orientations is attributed to the fold hinge orientation variability (see insets in panel a).
5.3 Fracture attributes from Google Earth imagery
Fracture mapping of satellite imagery (0.3–0.4 m ground pixel resolution) was carried out using images downloaded from Google Earth. In total, 2717 linear features were identified as fractures and digitized from satellite imagery (Fig. 6a). A rose plot of the 2D fracture orientations by trace count (number of mapped fractures) record an approximately bimodal directional distribution, with two dominant fracture sets oriented approximately parallel (NNW–SSE) and perpendicular (ENE–WSW) to the fold axial trace (Fig. 6a). A similar trend was reported from field-based measurements by Watkins et al. (2019).
The length-weighted rose plot (histogram of summed lengths) of the same fracture traces (Fig. 6a) shows the greater lengths of N–S-oriented fractures. Although the N–S fractures do not appear to make up a significant component of the fracture population by count, length-weighting the data shows the importance of these features as a contributor to the overall population. Bulk fracture intensities (total fracture length per unit area for all mapped fractures) from satellite image data show a general increase in fracture abundance towards the hinge zone of the anticline, particularly in the central and southern domains (Fig. 6b). Increased fracture intensity values (e.g. >0.4 m m−2) cluster along and around the fold axial trace, forming discontinuous patches of high-intensity fracture zones along the strike that are not exactly coincident with the axial trace of the anticline.
Fractures mapped in satellite imagery were assigned to one of six discrete fracture sets (A–F), based on their orientations, with respect to the orientation of the interpreted fold hinge line (from Watkins et al., 2019) proximal to the interpreted fracture (see the insets in Fig. 7a). Because the fold hinge exhibits some orientation variability along its length (Fig. 7a), some overlap exists between the orientations of the assigned fracture sets due to the variability in the orientation of the fold hinge (Fig. 7b). Set A fractures are oriented ENE–WSW (mean strike is 59∘), approximately perpendicular to the axial trace of the anticline, and typically exhibit opening-mode kinematics from field-based observations. Set B fractures strike approximately parallel to the fold hinge (NNW–SSE; mean strike is 154∘), and sets C, D, E, and F are oriented approximately WNW–ESE, N–S, E–W, and NNE–SSW, with mean strikes of 111, 178, 86, and 24∘, respectively (Fig. 7b). Fold-perpendicular (set A) and fold-parallel (set B) fractures make up the majority (ca. 40 % and 31.5 %, respectively) of the total number of fractures mapped in the satellite imagery. This dominance of sets A and B accounts for the approximately bimodal orientation distribution for all combined fractures (Fig. 6a) and the overall trend for increased bulk fracture intensity towards the fold hinge. The remaining fracture sets make up 28.5 % (by count) of the mapped fractures from satellite imagery, with sets C, D, E, and F representing 13 %, 9 %, 5.5 %, and 1 % of the total number of mapped fractures, respectively.
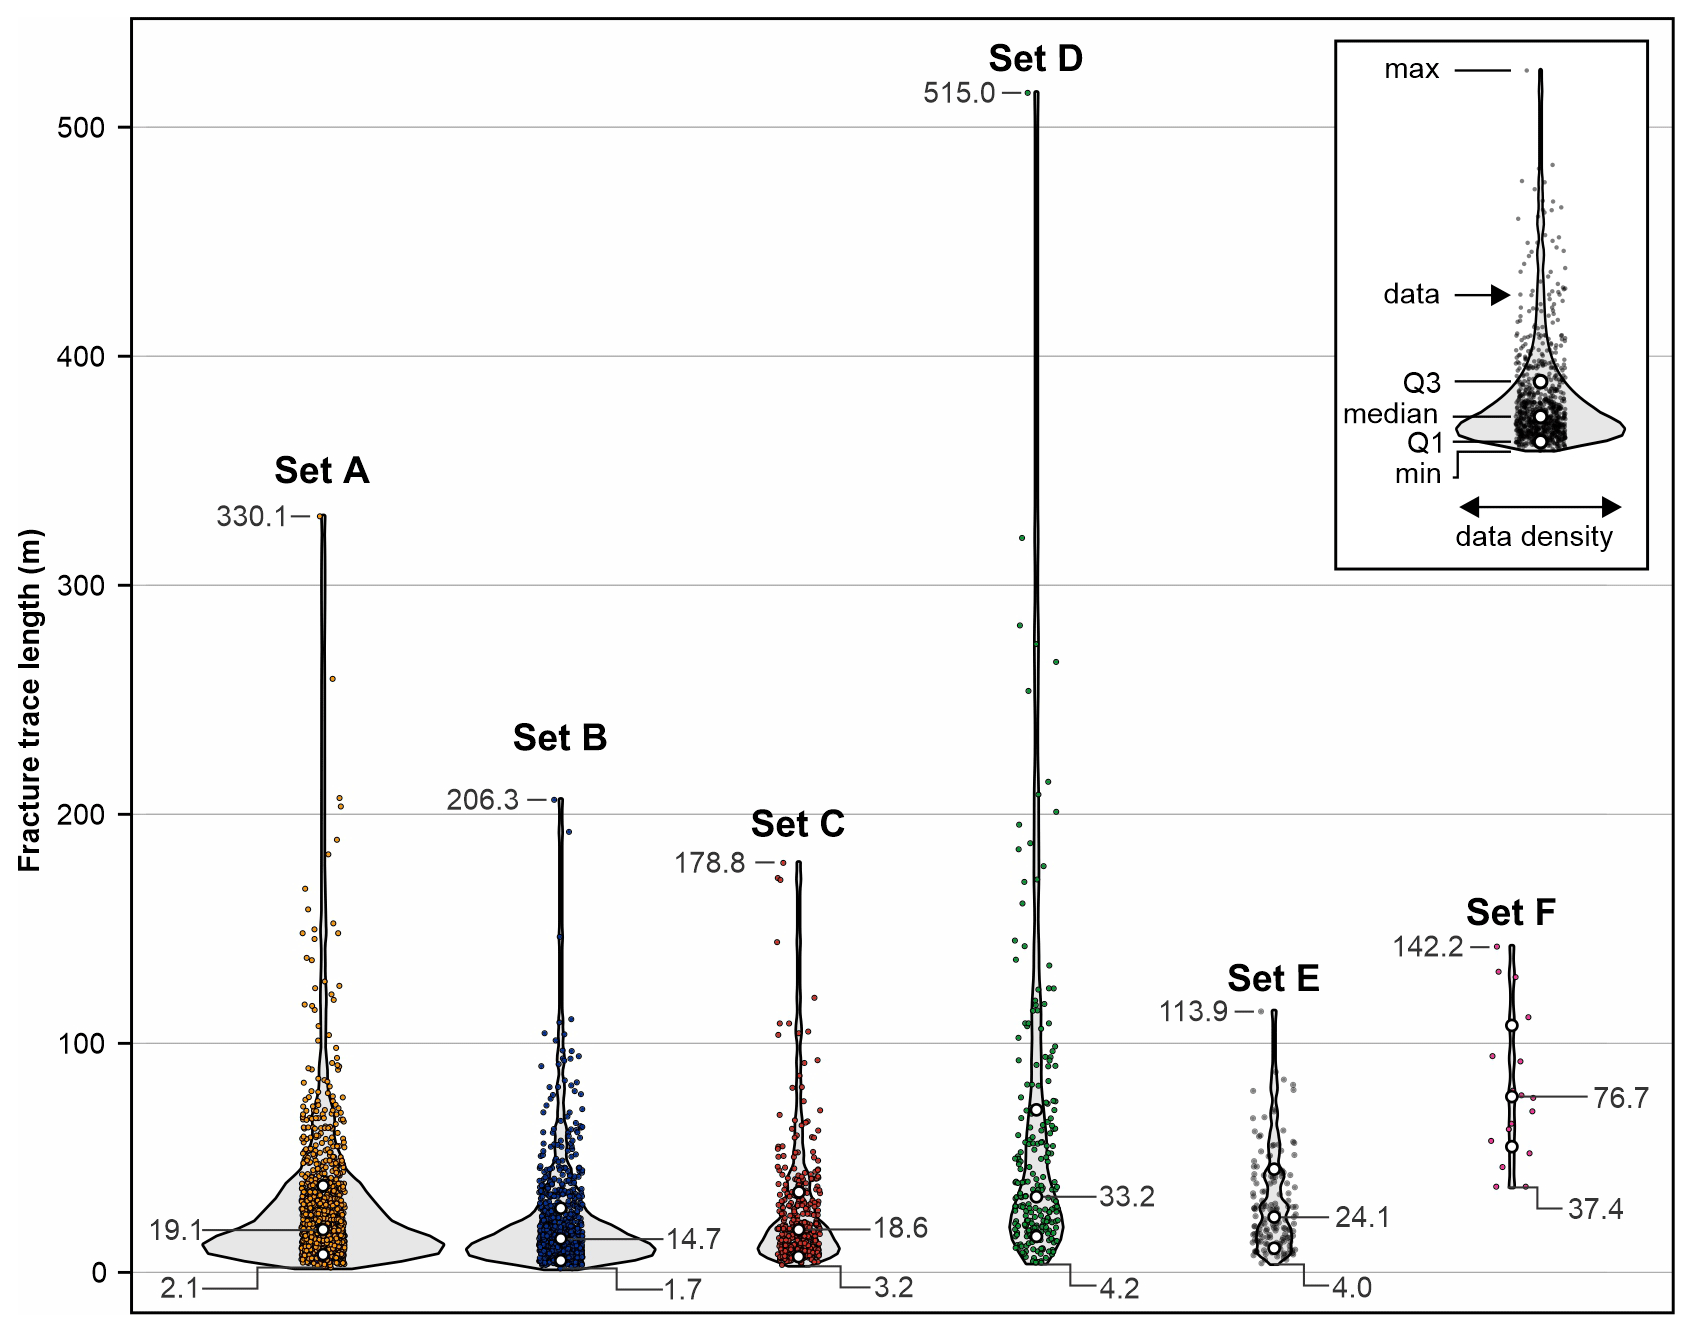
Figure 8Violin plots showing the length distributions of the fracture sets interpreted from satellite imagery. The numbers refer to the maximum, median, and minimum lengths for each fracture set (in metres). The fracture sets and orientations are shown in Fig. 7.
Length distribution data show that, with the exception of set F, fractures in all sets exhibit relative increases in fracture abundance at shorter length scales (see the downward-widening violin plots in Fig. 8). The predominance of relatively short fractures as a proportion of the total is most pronounced in sets A and B, as evidenced by the width of the violin plots at lower length scales. Set B has the lowest minimum (1.7 m) and median (14.7 m) fracture length values, and set D (oriented N–S) contains the longest fractures, with a maximum fracture length within this set of 515 m. Note that the estimated fracture lengths in Fig. 8 may be overestimated because fracture segmentation not visible in lower-resolution imagery (e.g. Odling, 1997).
Estimated fracture intensities for the separated fracture sets provide an overview of how fracture abundance within each set varies spatially (Fig. 9). Set A fracture intensity data show some evidence for increased intensity towards the fold hinge, but this increase is not uniform across the fold, and increased intensities are not exactly coincident with the interpreted fold hinge position (Fig. 9a). This suggests that the proximity to the fold hinge only partially controls the abundance of this hinge-perpendicular fracture set. Fractures of set B (NNW–SSE) appear to be strongly developed along the hinge of the anticline, and the increases in set B intensity appear to be closely related to the position of the fold hinge (Fig. 9b). Backlimb positions exhibit low to moderate intensities of this hinge-parallel fracture set, with only isolated patches on the backlimb showing elevated intensity values (up to 0.07 m m−2). Sets C and D show evidence for isolated zones of increased fracture intensity, but in both cases, increased intensities do not appear to be systematically related to the fold hinge position (Fig. 9c and d). Fractures of sets E and F were only identified and mapped in isolated parts of the structure. These sets show no systematic increase in abundance at hinge or forelimb positions, and therefore, changes in the abundance of these fractures are not easily related to the fold geometry or structural position (Fig. 9e and f).
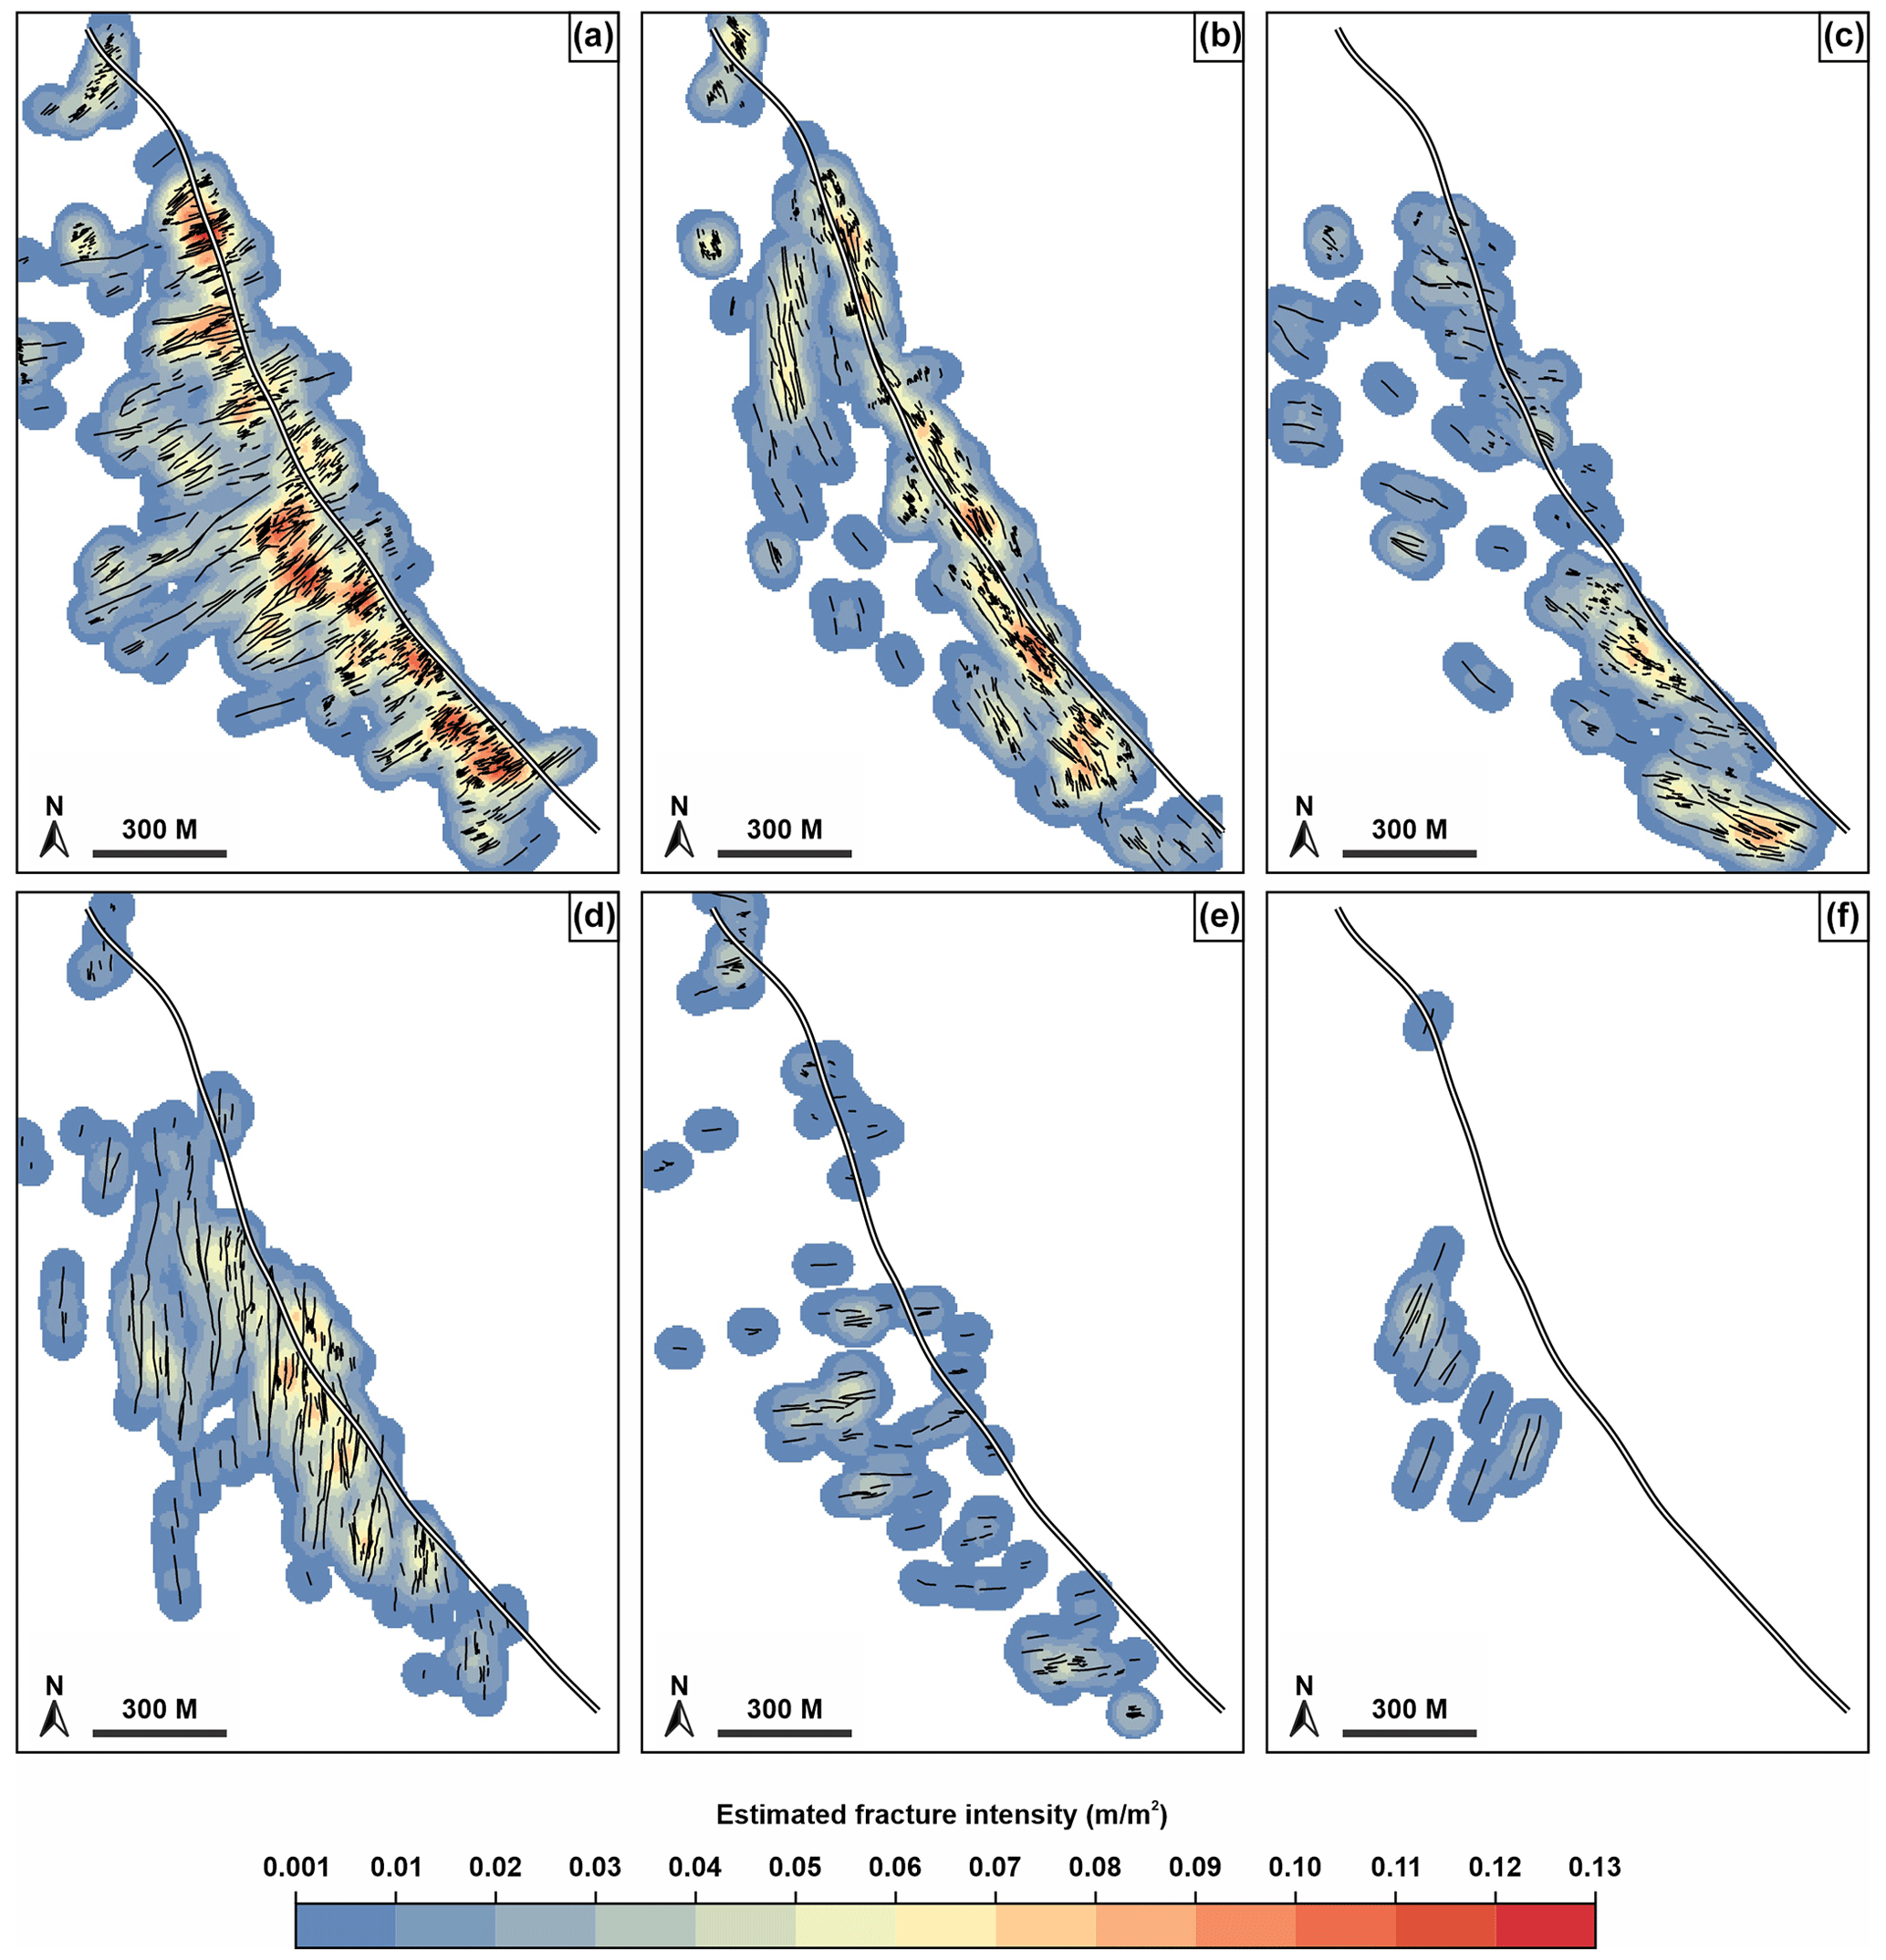
Figure 9(a–f) Estimated fracture intensity for fracture sets. See Fig. 7 for the fracture set orientations. Fracture intensity maps are generated using the Line Density tool in ArcMap 10.5.1 software, with 5 m cell sizes and 50 m search radii. The approximate position of the anticline hinge is shown by thick black-and-white lines.
5.4 Digital outcrop analyses
Subsequent to the initial mapping of fractures in satellite imagery, a second stage of fracture mapping was carried out using the digital outcrop of Swift Reservoir anticline. Analysis of the UAV-imagery-derived photogrammetric reconstruction (digital outcrop) focused on (i) identifying stratigraphic exposure levels and boundaries across the crest of the structure, (ii) remapping fracture traces at a higher resolution in order to refine the fracture map and compare results with fractures mapped from Google Earth satellite imagery, and (iii) assessing the relationship between structural position, mapped lithologies, and fracture attributes.
5.4.1 Digital-outcrop-derived lithology maps
The 3D digital outcrop allows lithological boundaries that are not clearly visible in satellite imagery (e.g. Fig. 4a) to be identified in 3D and to be mapped across the outcrop (see https://sketchfab.com/3d-models, last access: 22 August 2023, for a low-resolution, web version of the photogrammetric reconstruction). Lithological boundary maps were generated by interrogating the digital outcrop in 3D and identifying lithological boundaries based on variations in texture, colour, and topography across the structure.
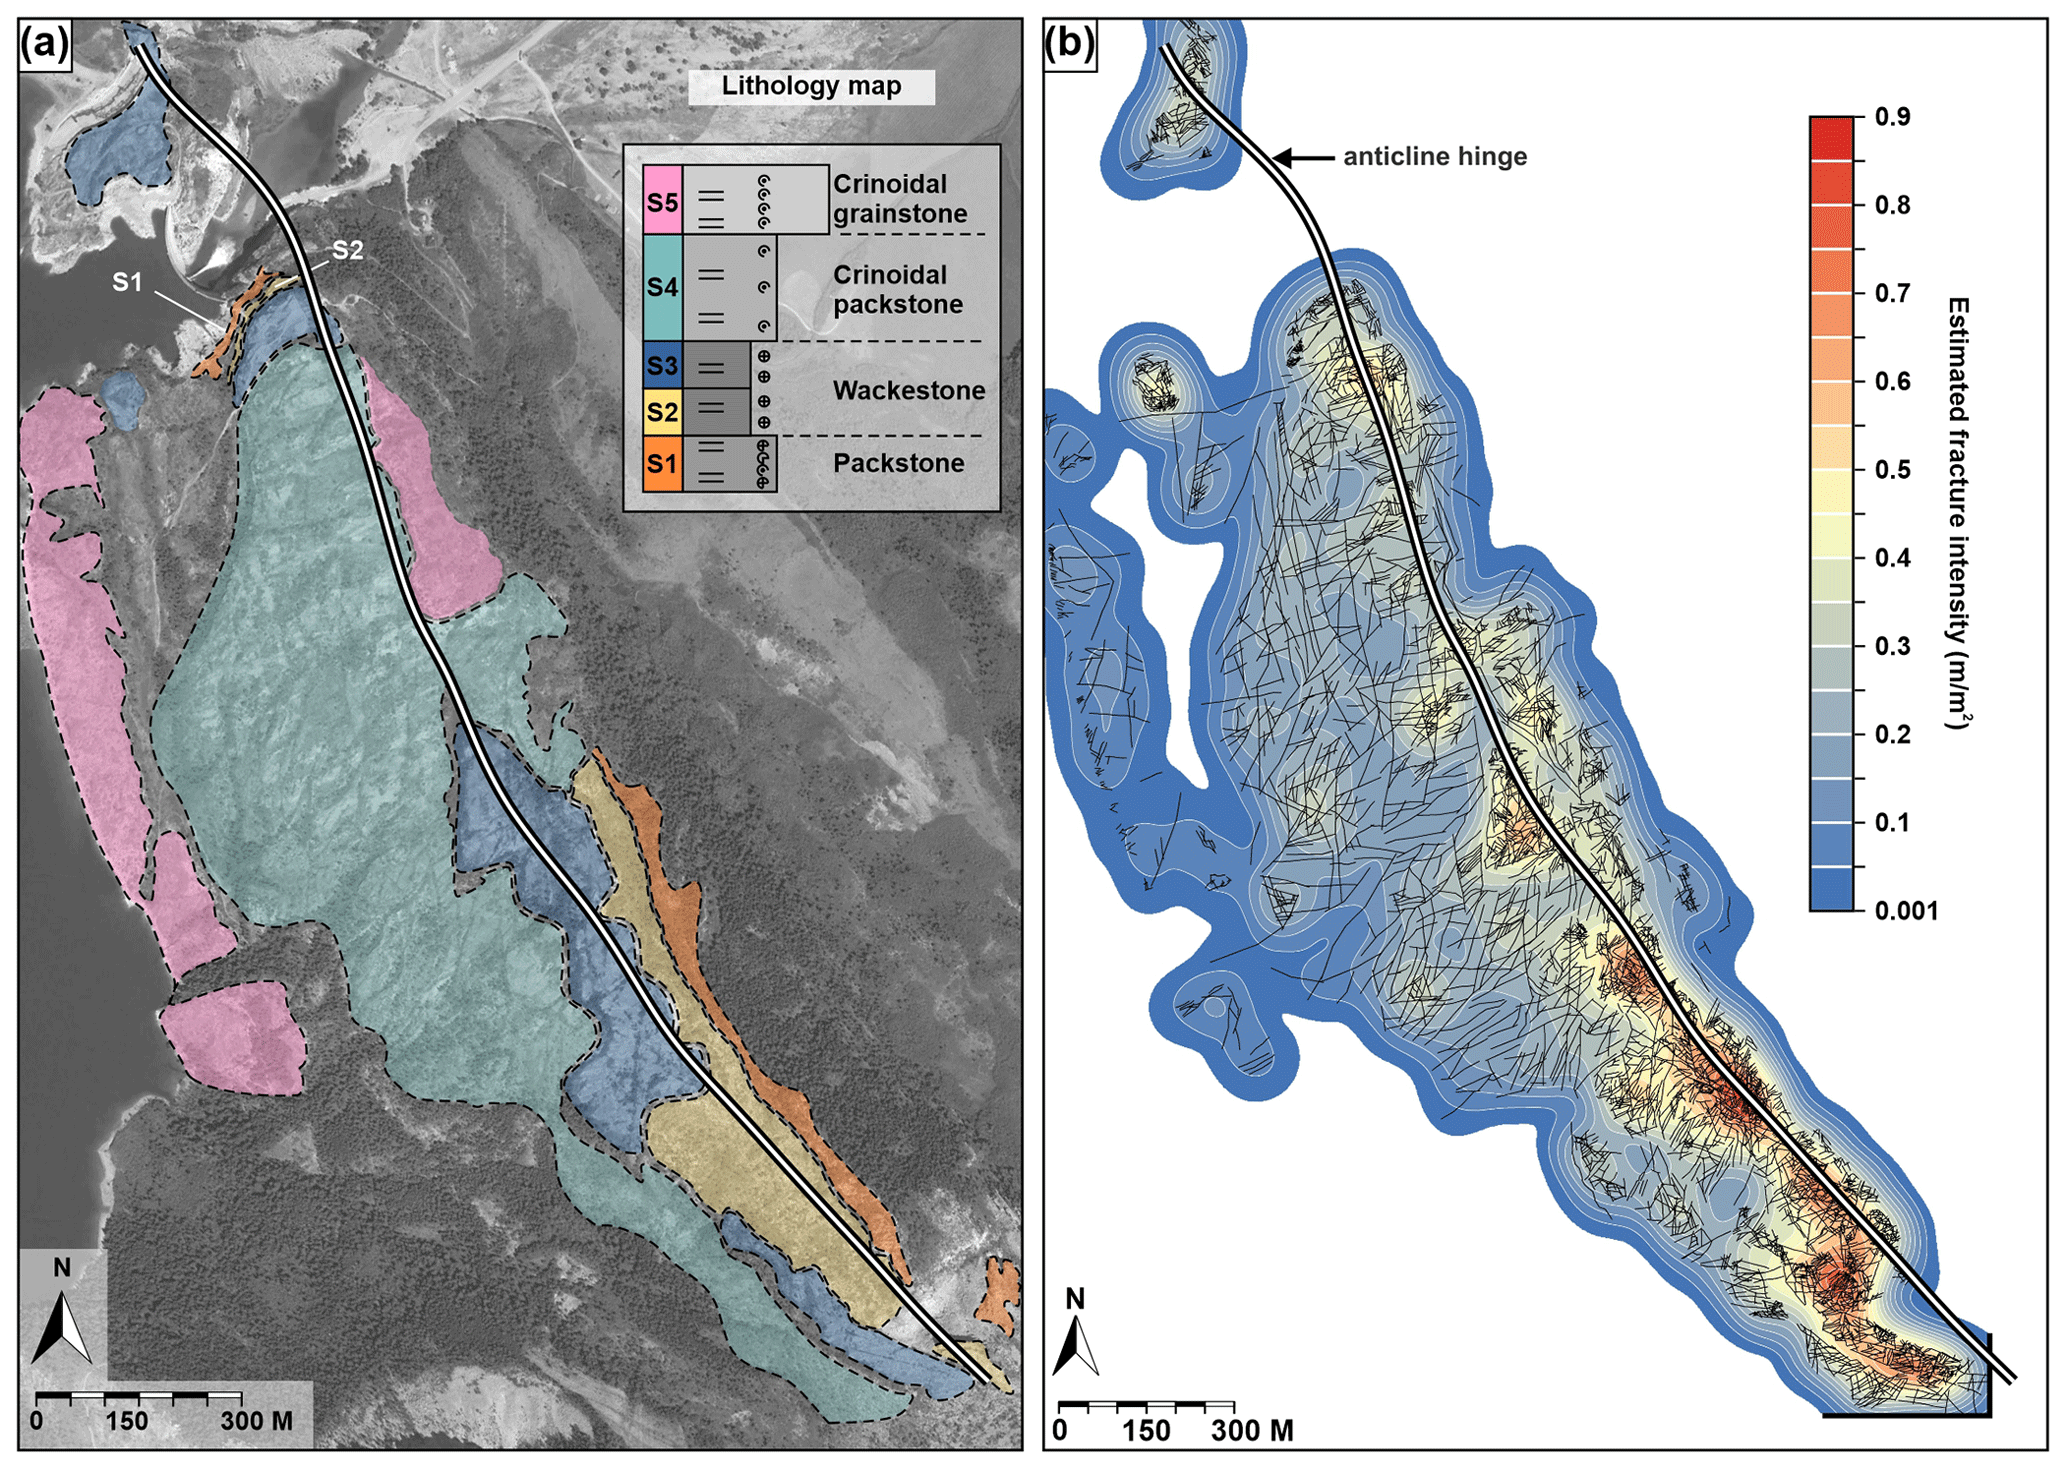
Figure 10(a) Lithology map of Swift Reservoir anticline (see Fig. 5a and b for the stratigraphic log) overlain on satellite imagery (© Google Earth, Landsat, and Copernicus). Lithological mapping was performed using the digital outcrop of the anticline and projected onto satellite imagery for clarity. (b) Estimated 2D intensity (m m−2) of fractures mapped from digital outcrop (photogrammetry) data. The 2D fracture intensity was calculated using the Line Density tool in ArcMap 10.5.1 software, with 5 m grid cells and 50 m sampling window radii.
Units S1–S5, defined in the physically measured stratigraphic section in the upper part of the dam cut section (Fig. 5), are exposed in fractured bedding pavements on the crest of Swift Reservoir anticline and were mapped digitally, using the methodology outlined above, across the exposed parts of the structure (Fig. 10a). Unit S4 makes up the majority of the exposure surface across the crest, particularly at backlimb structural positions (Fig. 10a). Units S1, S2, S3, and S5 are discontinuously exposed across the structure and, in some cases, are only sufficiently exposed for fracture mapping in a single structural position (e.g. unit S1 in the forelimb position; Fig. 10a). It should be noted that lithology mapping away from the measured section at the dam was undertaken using a digital approach only, with no ground-truth data collected to confirm the digital lithology mapping results. As such, the lithology map in Fig. 10 likely represents an oversimplification of the exposed bedding surface map. Patches of the mapped outcrop exposure may represent thinly bedded layers between our assigned units (S1–S5), but nevertheless, our detailed digital mapping and interrogation of the digital outcrop in 3D is interpreted to have resulted in a lithology map that provides a good approximation of the lithologies exposed in the dam cut (Fig. 5) and on the crest of the structure.
5.4.2 Estimated fracture intensities from digital outcrop mapping
Digital mapping of the fractures on the digital outcrop was performed in 3D using a medium-resolution digital outcrop that covered the entire outcrop exposure at 0.24 m ground pixel resolution (compared to 0.3–0.4 m for Google Earth imagery). This second stage of fracture mapping resulted in the identification and mapping of 4608 fractures (Fig. 10b), compared to 2717 fractures mapped in satellite imagery. Estimated fracture intensities for digital-outcrop-derived data are higher (up to ca. 0.86 m m−2; Fig. 10b) than for equivalent Google-Earth-derived data (up to ca. 0.54 m m−2; Fig. 6b), but general trends in the fracture intensity for the two datasets are similar. Both intensity maps (Figs. 6b and 10b) exhibit discontinuous patches of relatively high fracture intensity around the fold hinge line but with variations in both strike and dip directions. Neither of the fracture intensity maps show a perfect match between the position of the interpreted fold hinge position (reproduced from Watkins et al., 2019) and highest fracture intensities; in both cases, the highest fracture intensities appear to be proximal to the interpreted hinge position but a short distance (20–50 m) towards the backlimb of the structure.
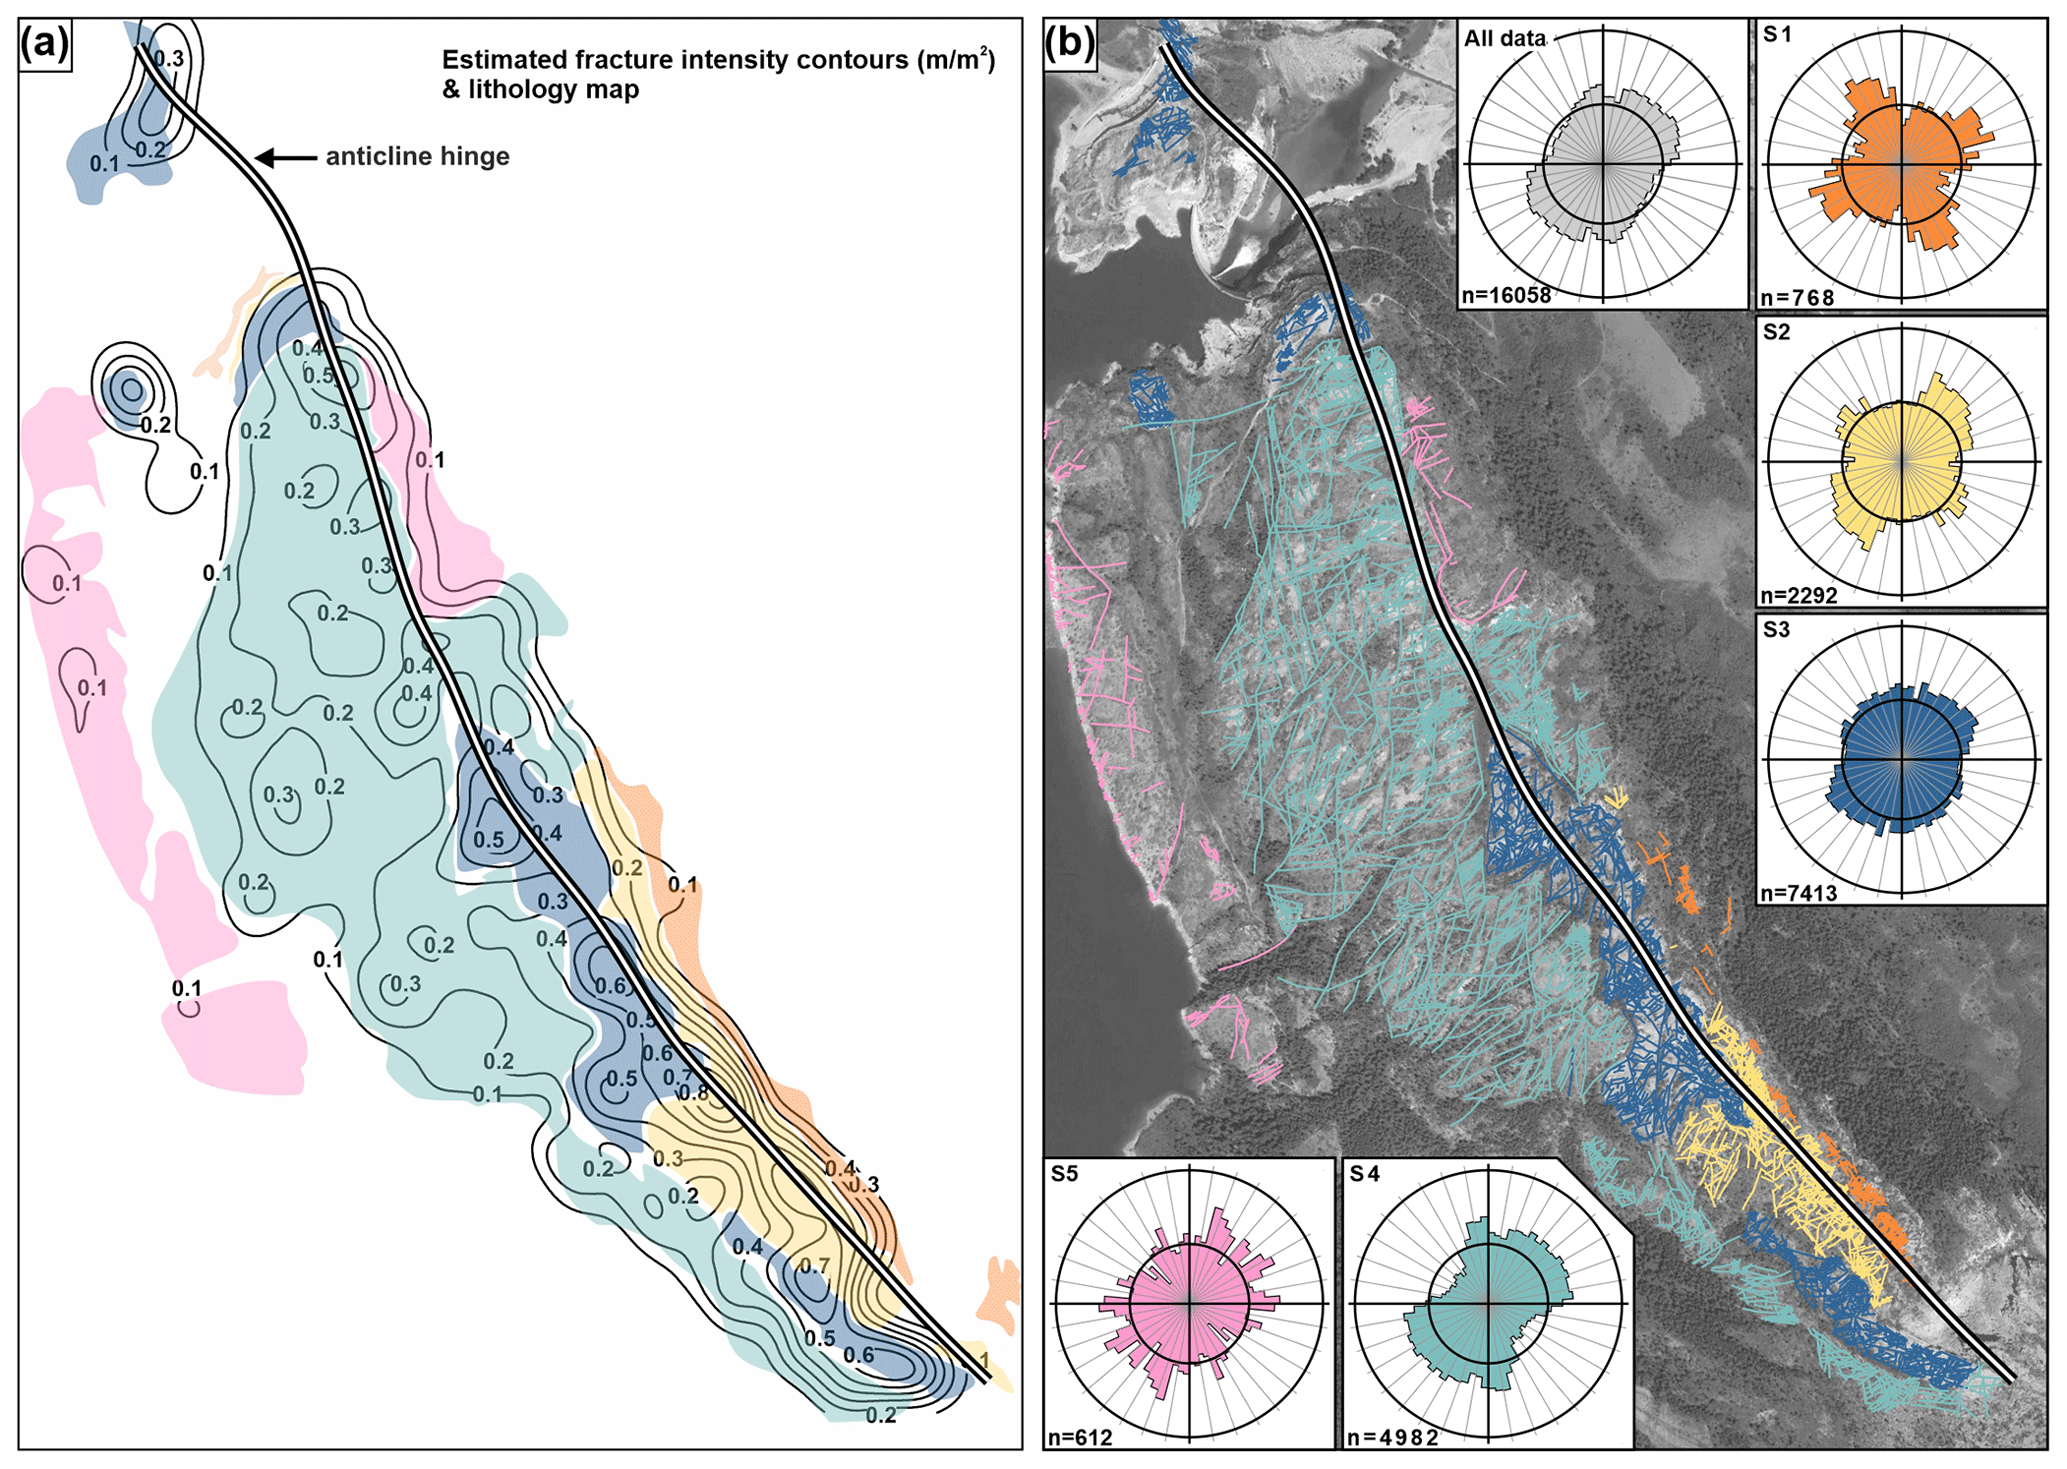
Figure 11(a) Digital-outcrop-derived lithology map overlain onto the estimated fracture intensity contours derived from the digital outcrop. (b) Digital-outcrop-derived fracture traces (n=4608) are coloured according to unit in which they were mapped and overlain on satellite imagery (© Google Earth, Landsat, and Copernicus). Orientations of the fracture traces by lithology are shown in the rose diagrams. Note that the n values shown for rose plots are for the fracture trace segments (i.e. straight segments between polyline nodes) rather than for entire fracture traces. Satellite imagery are from © Google Earth, Landsat, and Copernicus.
A compiled lithology and fracture intensity map for the digital-outcrop-derived data (Fig. 11a) shows that variations in the fracture intensity at Swift Reservoir anticline are at least partially related to the stratigraphic exposure level. There is a general trend for an increased fracture intensity in the finer-grained, mud-supported units S2 and S3, as documented by fracture intensity values of 0.4 to >0.8 m m−2, where these units are exposed. Patterns of fracture intensity contours appear to closely correspond to the mapped extents of units S2 and S3, with the highest fracture intensities present towards the geographic centres of these exposed units (Fig. 11a). It should be noted that there is likely an edge effect in the calculated fracture intensity towards the edges of the exposure (Fig. 11), but nevertheless, units S2 and S3 exhibit the highest fracture intensities on the crest of the structure. Fracture intensity values generally decrease from unit S3 to units S4 and S5, irrespective of structural position. This is apparent where these units are exposed on the backlimb of the structure. Units S3, S4, and S5 are associated with fracture intensities greater than 0.4 m m−2, greater than 0.3 m m−2, and less than 0.2 m m−2, respectively (Fig. 11a). Unit S4 is the only unit that is well exposed at a number of structural (backlimb, hinge, and forelimb) positions. Fracture intensities in this unit increase towards the hinge of the structure (Fig. 11a), suggesting that structural position influences the fracture intensity. In other units, only the isolated parts of the outcrop allow for comparison of fracture intensities in similar structural positions. The relative importance of structural position vs. lithological variations with respect to the fracture intensity is therefore difficult to assess, but nevertheless, it appears, from the data provided in Figs. 10 and 11, that both of these factors play a role in the observed fracture intensities at Swift Reservoir anticline.
5.4.3 Stratigraphic exposure vs. fracture orientations
Length-weighted orientations for digital-outcrop-derived fracture traces record a weakly preferred orientation of the fracture population of NE–SW (Fig. 11b), which is perpendicular to the fold hinge. This dataset records a greater overall dispersion of the fracture trace orientations than data derived from satellite imagery (Fig. 6a), which is indicative of greater variability in fracture orientations at smaller scales. Separation of fracture orientation data into stratigraphic units records changes in the dominant fracture orientations with exposure level (Fig. 11b). Fracture traces within units S1 and S2 show dominantly bimodal distributions, with well-defined peaks in the length-weighted fracture orientations that trend roughly NE–SW and NW–SE. Orientations within units S3–S5 record greater variability, with no clearly defined, dominant orientations. The approximately bimodal distributions recorded within units S1 and S2 (Fig. 11b) show the apparent dominance of hinge-parallel and hinge-perpendicular fractures in these lithologies. Units S1 and S2 are exposed only in the hinge and forelimb zones of the structure, in which overall fracture patterns from aerial imagery show an increasing abundance of fractures oriented perpendicular and parallel to the axial trace of the fold (Fig. 9a and b). It is therefore likely that the observed changes in the fracture orientations by stratigraphic exposure level (Fig. 11b) reflect structural rather than stratigraphic controls.
5.5 Fracture orientations from high-resolution (handheld camera) imagery
Watkins et al. (2019) assessed the influence of stratigraphic and structural factors on fracture intensity at Swift Reservoir anticline. The same fracture stations used by Watkins et al. (2019) are used here to assess the fracture orientation variability in high-resolution (0.2 mm pixel size) imagery.
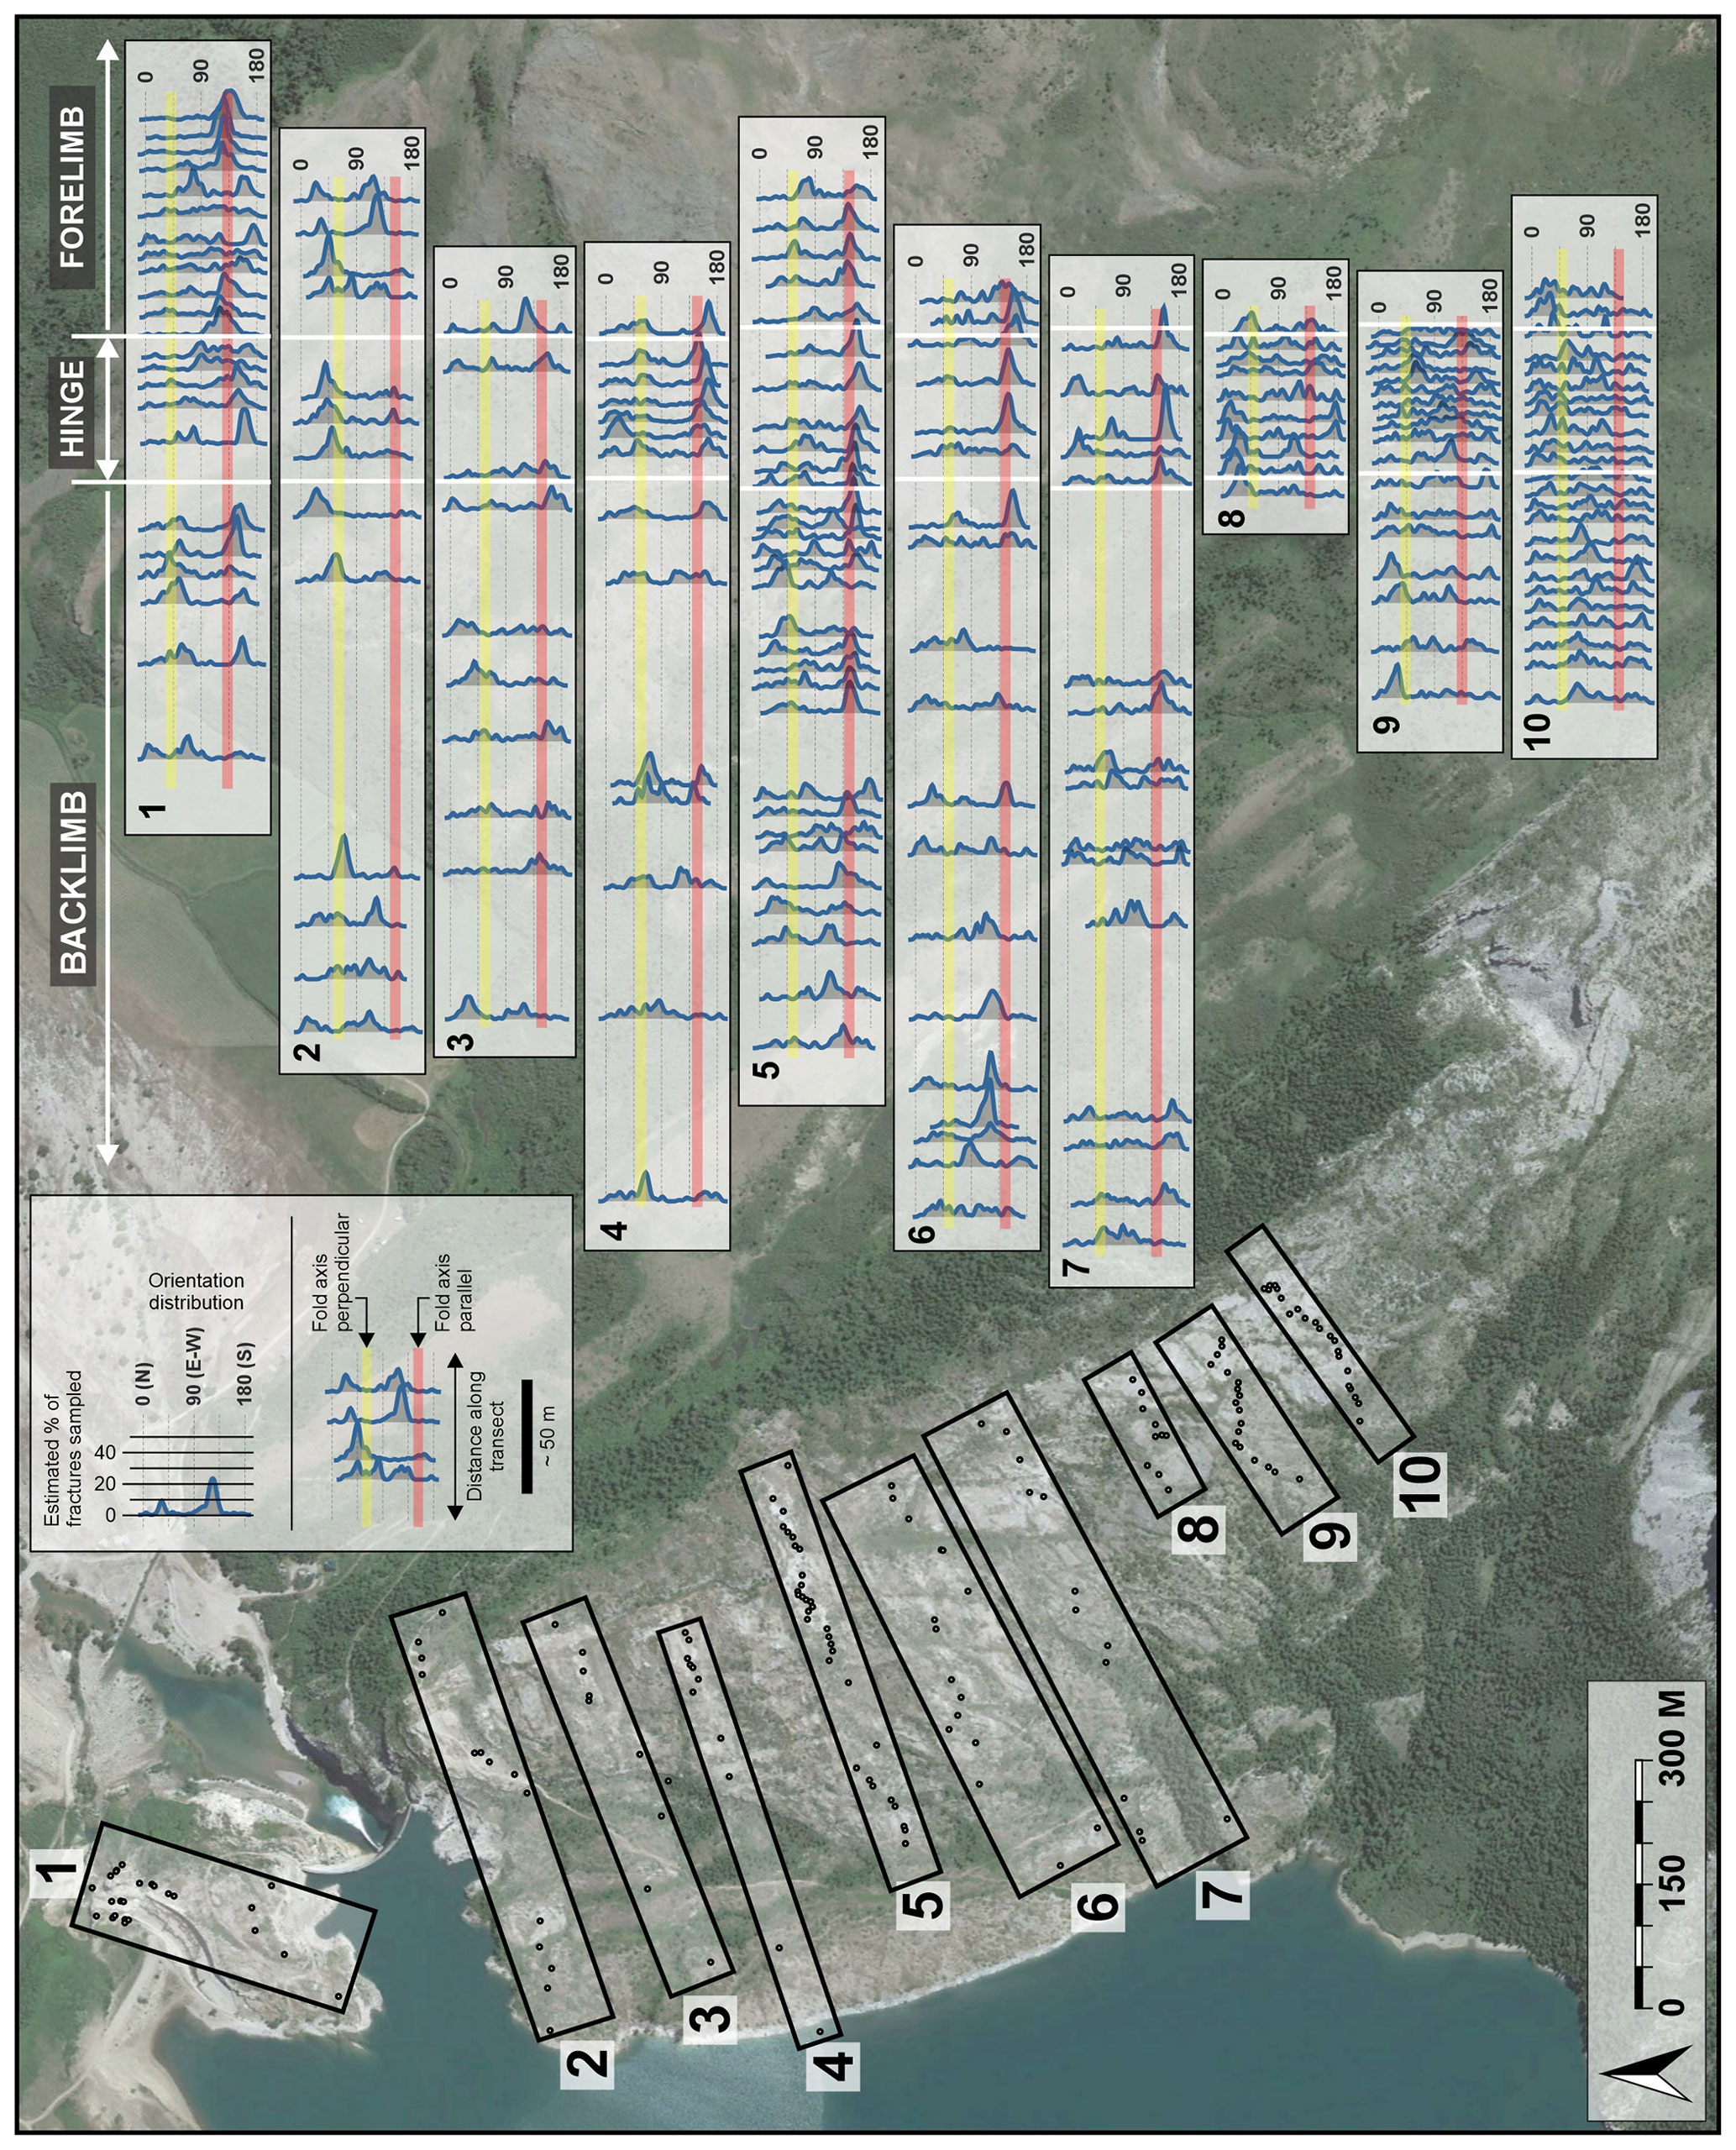
Figure 12Stacked orientation histograms, from field-based measurements, along a series of structural transects across the anticline. Interpreted structural positions are marked along the upper horizontal axes of the transects. Yellow and red bars show the approximate fold-perpendicular and fold-parallel orientations, respectively, for structural transects. Approximate orientations of yellow and red bars at each transect are derived from the interpreted fold axis in Fig. 6b. Black dots and boxes on the map show the sample locations and data used for each transect, respectively. Satellite imagery are from © Google Earth, Landsat, and Copernicus.
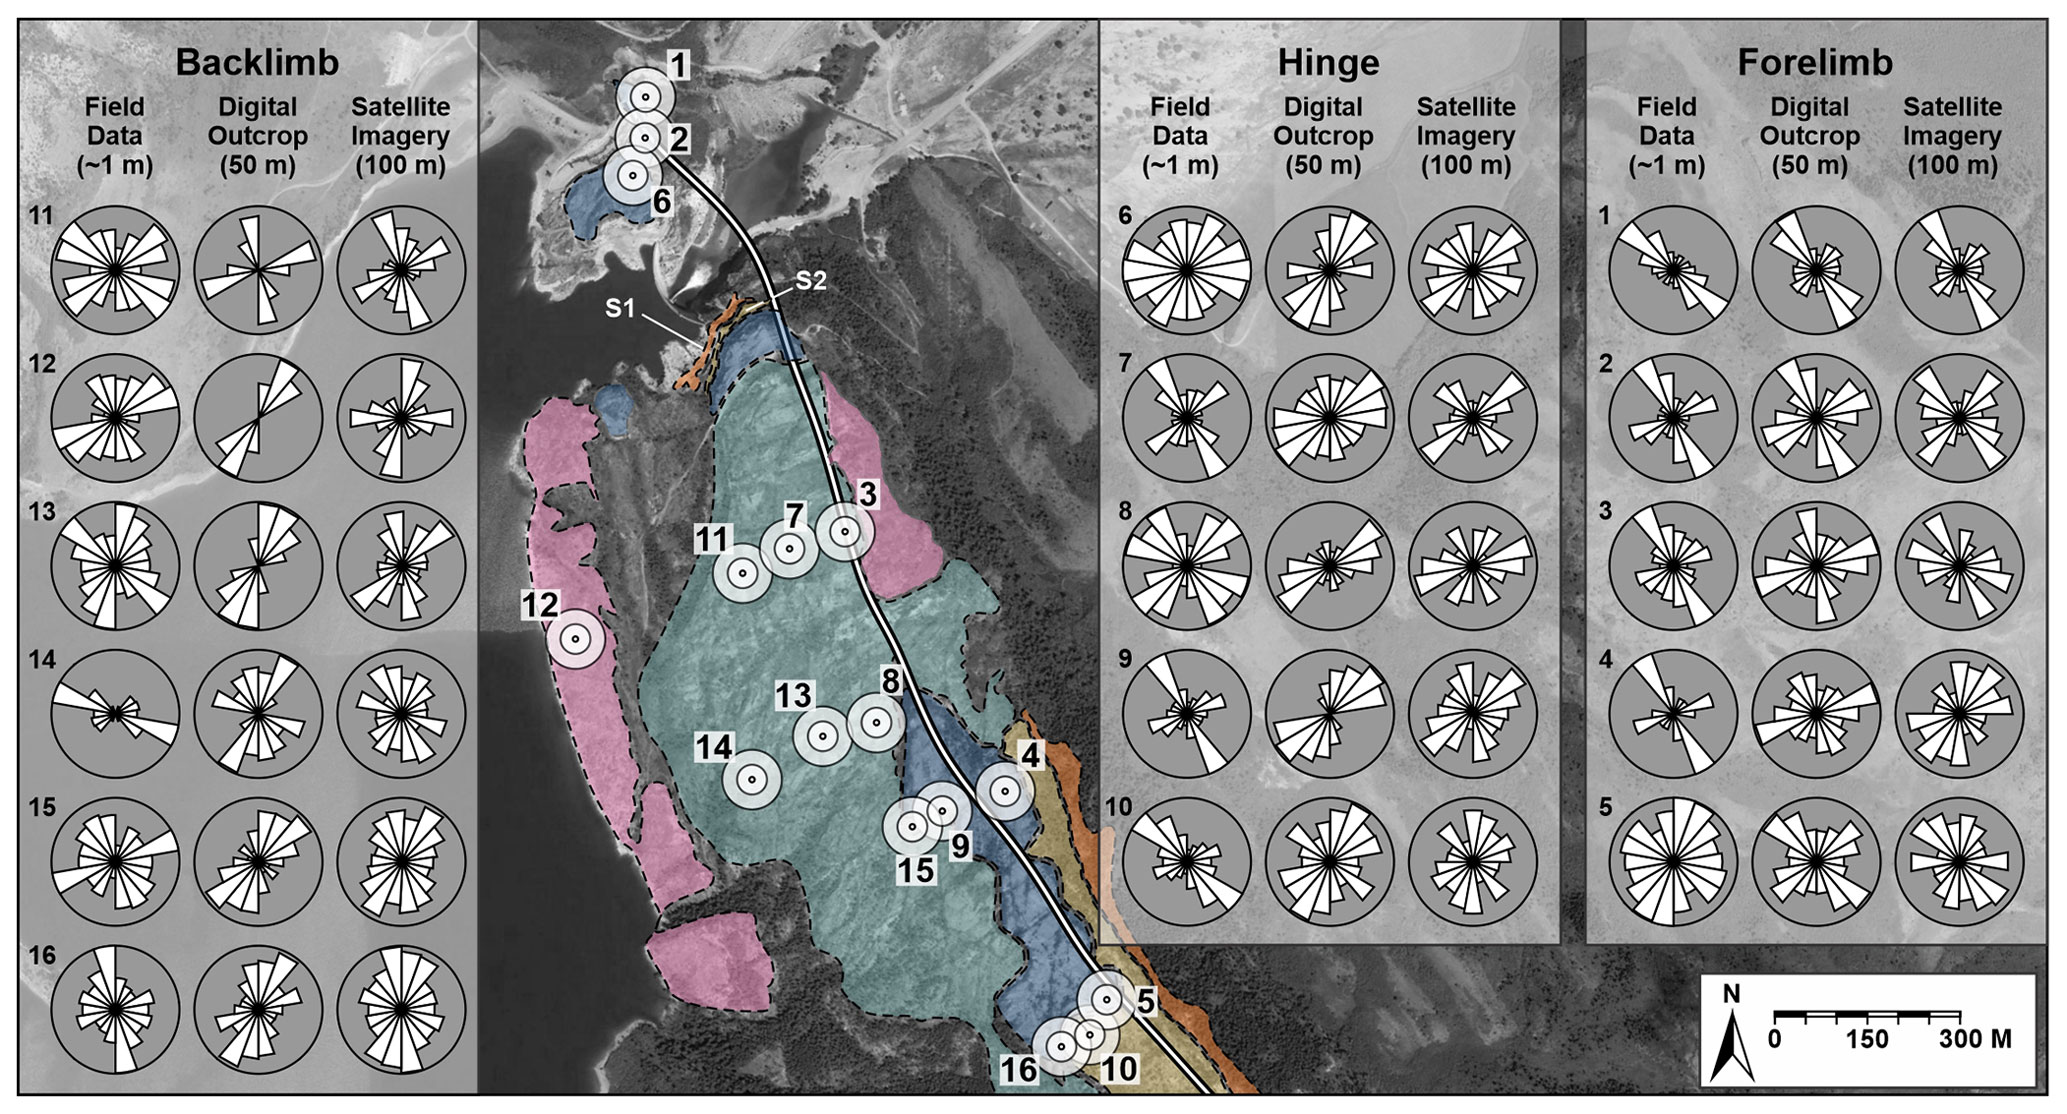
Figure 13Comparison of the fracture orientations at multiple observation scales. Bull's eye circles on the satellite image represent the approximate sampling areas for the field, digital outcrop, and satellite data from smallest to largest, respectively. Rose plots show the variation in the average fracture orientation with changes in observation scale at each site. Numbers on the satellite image correspond to the rows of the rose plots in the shaded boxes. See Fig. 10 for the lithology colours. Satellite imagery from © Google Earth, Landsat, and Copernicus.
Stacked fracture orientation histograms along a series of structural transects, derived from field-based orientation sampling, provides an overview of the spatial variability in dominant fracture orientations across the structure (Fig. 12). Field data show a general trend for the increased dominance of hinge-parallel fractures towards forelimb and hinge positions on the anticline. This trend is clearer in the central part of the structure (e.g. transects 3–7), where orientation histograms display distinct peaks towards SE and SSE, approximately parallel to the fold hinge axis (Fig. 12). This trend is not ubiquitous, however, because fracture orientations at some hinge and forelimb positions, particularly towards the southern part of the structure (e.g. transects 8, 9, 10), show no clear dominance of hinge-parallel fractures, and relatively dispersed orientations.
Strike perpendicular fractures (set B; Fig. 7b) are less prominent in the field data but do show dominance in some isolated positions (e.g. backlimb; transect 1; Fig. 12). Fracture sets C, D, E, and F, identified from satellite imagery (Fig. 7), are not clearly evident in field-based orientation histograms but do make up a component of dispersed fracture orientations, particularly towards the southern part of the structure. It should be noted that transects 7, 8, and 9 do not sample the forelimb of the structure, and thus, the increasing dominance of hinge-parallel fractures, mapped in satellite imagery (Fig. 9), towards the forelimb of the structure may not be represented here due to a lack of exposure. Many of the ground stations, when observed in isolation, show no clearly dominant fracture orientation; general trends are only apparent when multiple histograms are stacked along structural transects.
5.6 Impact of observation scale on apparent fracture orientations
To assess the impact of observation scale on the apparent fracture orientations, data from ground sampling sites were compared with digital-outcrop-derived (within a 50 m sampling circle) and satellite-image-derived (100 m sampling window) data around field measurement stations (Fig. 13). This window sampling method allows for the comparison of fracture orientations between field-based, digital outcrop, and satellite image observation scales. Fractures described in the section below are referred to according to their orientations and assigned fracture sets, as outlined in Fig. 7.
Field-derived orientation data generally record the dominance of hinge-parallel (set B) fractures in the forelimb and hinge of the structure (Fig. 13). Hinge-perpendicular (set A) fractures are also commonly sampled at these locations but are generally less well developed than set B. Field data from the backlimb of the structure show greater variability than in hinge-proximal positions, with no consistently dominant fracture orientations observed. In general, individual sample sites on the backlimb show greater apparent orientation dispersion (e.g. sites 11, 12, and 13) than their forelimb and hinge counterparts. Marked variations in fracture orientations are also recorded at sample sites that are adjacent to each other (e.g. sites 10 and 16) towards the fold backlimb.
Window samples of digital-outcrop- and satellite-image-derived fracture traces show some similarity to the field data at the fold forelimb (e.g. site 1; Fig. 13). Orientation distributions are generally dominated by sets A and B in forelimb digital outcrop and satellite image sampling windows, as is the case for field data (e.g. sites 1 and 2; Fig. 13). In some cases, sets A and B are both recorded, but there exists a difference in the fracture set dominance with the observation scale. At site 2, for example, field data show the dominance of a NNW–SSE component, while digital-outcrop- and satellite-image-derived fractures within sample windows around the site demonstrate an approximately bimodal orientation distribution (Fig. 13). In general, sample window data from the fold hinge and backlimb show less agreement to the field data than in the forelimb and hinge of the structure. In some cases, one or more of the fracture sets is represented at all three observation scales (e.g. site 7; set A; Fig. 13), while in others little similarity exists between datasets extracted from the same area (e.g. site 11; Fig. 13). In general, there appears to be greater agreement between observation scales where sets A and B are more strongly developed, primarily in hinge-proximal locations. General trends in fracture orientations, either from field-based sampling or by window sampling of remotely acquired data, are difficult to identify from the isolated sampling of the structure due to the variability in the fracture network at a range of scales.
5.7 Scaling of estimated fracture intensity
Watkins et al. (2019) employed a field-based approach to characterize the fracture intensity at Swift Reservoir anticline by collecting handheld imagery of fractured bedding surfaces and using the circular scanline method of Mauldon et al. (2001) to estimate fracture intensity in 193 scaled and oriented field images. The authors found that the fracture intensity varies substantially at Swift Reservoir anticline and that both lithology and structural position influence fracture occurrence. Here we compare our results with those of Watkins et al. (2019) by sampling our satellite image and digital-outcrop-derived fracture intensity maps (Figs. 6b and 10b) at the precise sample site locations used for the previous study. Fracture intensity map sampling was performed using the raster sampling tools (Extract Values to Points) in ArcMap 10.5.1 software.
The estimated fracture intensity varies substantially according to the image pixel size and scale of the observation (Fig. 14), with fracture intensity estimates of ca. 24 to 463 m m−2 for handheld camera images (pixel size is ca. 0.2 mm), 0.0026 to 0.69 m m−2 for digital outcrop data (pixel size is ca. 0.24 m), and 0.0003 to 0.33 m m−2 for satellite image data (pixel size is ca. 0.35 m). Power law regression fits for the minimum, median, and maximum fracture intensity values for the compiled data provide regression coefficients of 0.98 and higher and power law exponents of 0.9 to 1.4 (Fig. 14). Although we only assess only three image pixel sizes in this analysis, the high correlation coefficients for power law regression models suggest that the prediction of fracture intensity for a given observation scale may be relatively well constrained.
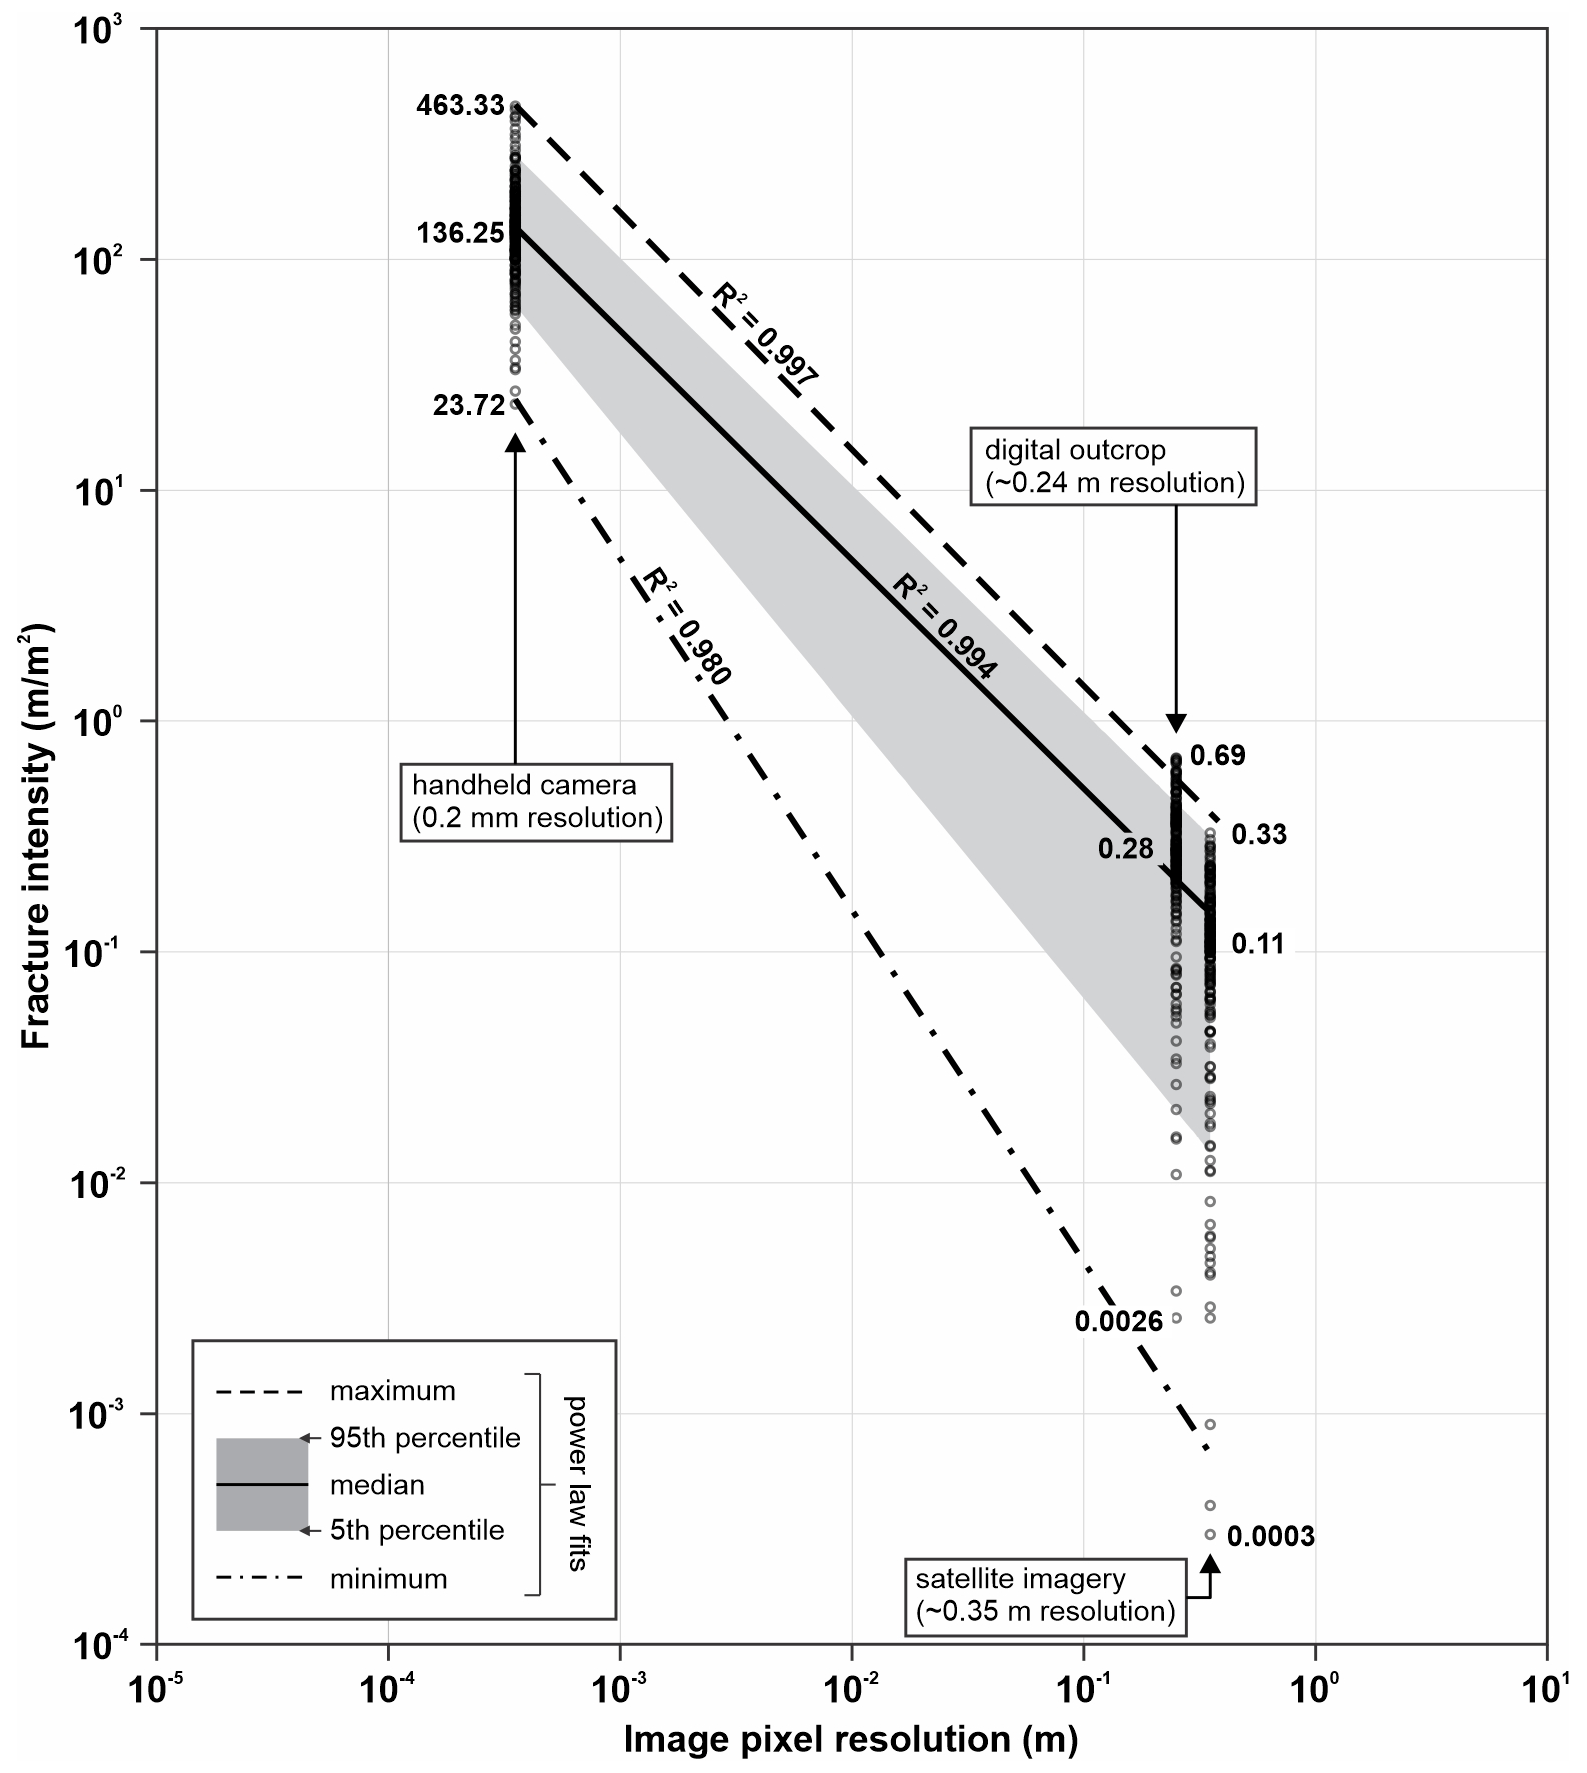
Figure 14Compilation of estimated fracture intensities and ground pixel resolutions for Swift Reservoir anticline. Fracture intensities estimated from handheld camera images are reproduced from Watkins et al. (2019). Satellite imagery and digital outcrop data are generated by sampling the fracture intensity rasters (Figs. 6b and 10b), using the geographic coordinates of Watkins et al. (2019) field localities. Labels denote the maximum, median, and minimum fracture intensity values for the respective datasets. Raster sampling was performed in ArcMap 10.5.1 software.
6.1 Controls on estimated fracture intensity
We show that the fracture intensity at Swift Reservoir anticline is controlled by both the lithology and structural position. Digital fracture maps and associated intensity contours show that fine-grained, mud-supported wackestones are the most intensely fractured lithologies at the site (Fig. 11). Previous studies have shown that rock strength generally decreases with increasing porosity (e.g. Price, 1966; Dunn et al., 1973; Nelson, 2001) and that fine-grained, low-porosity lithologies may be more brittle and therefore more prone to intense fracturing than coarse-grained rocks (e.g. Hugman and Friedman, 1979; Wennberg et al., 2006; Hanks et al., 1997). Our observations of the increased fracture intensity in fine-grained units are in agreement with the work of Watkins et al. (2019) and others and provide a relatively simple but logical link between rock texture and fracture intensity. Other lithological properties (e.g. bed thickness) may influence fracture abundance (e.g. McQuillan, 1974; Ladeira and Price, 1981; Wennberg et al.,2006; Sun et al., 2021). Our initial analyses did not provide any strong evidence for a relationship between bed thickness and fracture spacing at Swift Reservoir anticline and therefore, based on this early result, we did not address this topic further. We did not assess the mechanical layer thickness during fieldwork (from Schmidt rebound data, fracture heights, etc.), and the digital outcrop analysis alone does not allow an unequivocal determination of the mechanical layer thickness. Future studies could focus on collecting data such as Schmidt rebound measurements, fracture heights (i.e. strata bound vs. non-strata bound ), and observations of bed boundaries to investigate this topic further.
A limitation of the analysis of Watkins et al. (2019) is that specific lithologies (e.g. mud-supported units) identified in the field could not be easily correlated across the exposed crest of the structure. By digitally mapping lithological boundaries across the structure in 3D (Fig. 10a), spatial variations in fracture properties can be directly tied to the stratigraphic exposure levels, and therefore, larger-scale, three-dimensional assessments of fracture intensity vs. stratigraphic exposure can be more easily performed using the digital approach (e.g. Corradetti et al., 2018; Triantafyllou et al., 2019). It should be noted that limits to the image resolution may partly hamper lithologic boundary mapping (e.g. Humair et al., 2015), and while every effort was made to generate robust interpretations in this study, we acknowledge that delineating precise boundaries between units was not always straightforward. A potential solution to this problem, resources allowing, would be to carry out initial digital mapping or reconnaissance of sites using satellite imagery or photogrammetric reconstructions, followed by field campaigns focused on further data collection and field-checking of digital interpretations (e.g. Scheiber et al., 2015).
We provide evidence for increased fracture abundances towards the hinge zone of the anticline (Figs. 6 and 10). These results are generally consistent with the results of Watkins et al. (2019), but in both this and the previous study, the relationship between structural position and fracture intensity is not straightforward (e.g. Fig. 6 in Watkins et al., 2019). We show that the fracture intensity values generally increase towards the fold hinge but that the zones of highest fracture intensities are not always perfectly coincident with the interpreted hinge position (Fig. 6b and 10b). Increased fracture abundances in hinge-proximal zones have been recorded on folds in a multitude of settings (e.g. Ramsay, 1967; Hanks et al., 1997; Hennings et al., 2000; Wennberg et al., 2007; Ghosh and Mitra, 2009; Watkins et al., 2015), but, as noted above, lithology also influences estimated fracture intensity at Swift Reservoir anticline. Because multiple stratigraphic units are exposed on the crest of the structure, our fracture intensity maps (Figs. 6b and 10b) record the influence of both structural position and stratigraphic exposure level on fracture abundance. Where multiple lithologies are exposed on fold structures, it should perhaps be expected that the apparent fracture intensity does not directly correlate with either structural position (e.g. forelimb vs. backlimb) or proximity to the fold hinge.
6.2 Fracture orientation variability
Natural fracture orientations at Swift Reservoir anticline are highly variable and appear to vary according to stratigraphic exposure level (Fig. 11), structural position (Figs. 9 and 12), and observation scale (Fig. 13). We do, however, document at least two systematic fracture sets that appear to conform to established models of fold-related fracturing. Most of the set A (fold axis perpendicular) and set B (fold axis parallel) fractures observed on the crest of the anticline (Figs. 7 and 8) are interpreted as being fold related. These sets exhibit (i) a general increase in intensity towards the interpreted fold hinge position and (ii) orientations that are consistently parallel (set B) and perpendicular (set A) to the local fold hinge orientation (Fig. 7a). Opening-mode fractures oriented parallel and perpendicular to the fold hinges have been documented on contractional anticlines in a number of settings (e.g. McQuillan, 1974; Bergbauer and Pollard, 2004; Cooper et al., 2006; Wennberg et al., 2006; Francioni et al., 2019), including at sites proximal to Swift Reservoir anticline in the Sawtooth Range (e.g. Stearns, 1964; Ghosh and Mitra, 2009).
We interpret the hinge-parallel (set B) fractures at Swift Reservoir anticline as being opening-mode fractures formed in response to the outer arc bending of relatively competent carbonate strata during fold formation, which is consistent with the predicted bending strain on contractional folds (e.g. Ramsay, 1967). While most fractures observed at the site show no evidence for displacement parallel to the fracture walls (i.e. shear), the cross-sectional exposure of the anticline (Fig. 5b) exposes several thrusts and back thrusts, with similar strike orientations to fracture set B (Figs. 5c and 7). It is therefore possible that a small proportion of the set B fractures observed in map view (Fig. 7) are reverse faults rather than bending-related opening-mode fractures. The underlying mechanisms that led to the development of set A fractures is somewhat speculative. The hinge-perpendicular (set A) fractures observed in the field typically exhibit opening-mode kinematics, and these may have developed as a result of the extension parallel to the fold hinge. Subtle along-strike plunge variations in the fold and associated hinge-parallel curvature (e.g. Cosgrove and Ameen, 1999) may be a potential mechanism for this hinge-parallel extension. We did not find any clear relationship between hinge-parallel curvature and hinge-perpendicular fracture intensity at the site, however, because of difficulties in accurately estimating fold curvature from the vegetated, eroded fold crest.
Fracture sets C, D, E, and F exhibit no clear relationship between fracture intensity and proximity to the fold hinge (Fig. 9) and are less consistently oriented with respect to the fold hinge compared to sets A and B (Fig. 7). From these general patterns, we tentatively interpret sets C, D, E, and F as having developed prior to, or possibly after, fold formation. The units exposed on the crest of Swift Reservoir anticline were deposited during the Mississippian era (Nichols, 1984), and based on tectonic frameworks for North America in many published sources (e.g. Marshak et al., 2000; Weil and Yonkee, 2023), these rocks likely experienced variable regional stress through time that is related to multiple late Paleozoic through Paleogene convergent tectonic events in western North America, although only the Late Cretaceous to Palaeocene development of the Sawtooth Range (Fuentes et al., 2012) resulted in any significant contractional shortening. The strata exposed at the site have also experienced a documented localized forebulge-related extension during the Middle Jurassic (Ward and Sears, 2007) and probably regional extension (eastern Basin and Range province) during the Cenozoic period (e.g. Wallace et al., 1990; Stewart et al., 1998).
The units exposed at Swift Reservoir anticline have therefore experienced at least two phases of prolonged regional contraction, one phase of localized extension and one phase of regional, plate-scale extension. Because of this complex tectonic evolution and the likely variations in principal stress orientations, fracture failure modes, and fracture orientations that this deformation history implies (Ferrill et al., 2021), it should perhaps be expected that multiple fracture sets (with shear, compaction, or opening failure modes) could have developed both before and after fold formation at the site. Candidate structures include conjugate strike–slip faults that may have formed during early contraction and layer-parallel shortening prior to fold formation (Tavani et al., 2015; Ferrill et al., 2021). Set C, E, and F orientations are approximately consistent with the expected range of orientations for strike–slip faults related to the ENE-directed contraction, but without definitive evidence for strike–slip faulting (e.g. from kinematic indicators), this remains speculative. While we did not observe kinematic indicators consistent with strike–slip faulting, our efforts here focus on fracture characterization using remote sensing data, rather than on detailed field observations.
The existence of pre-folding fractures could have resulted in the reactivation of optimally oriented fracture sets to accommodate strain during folding that may not directly conform to the expected orientation in conceptual models (e.g. Tavani et al., 2015). A further consideration is the curvilinear nature of the fold hinge line and the implications for strain and fracture set development, as compared to the models derived for linear folds. Future studies focused on detailed field observations, microscopy, and the dating of fracture cements would likely provide valuable insights into fracture kinematics and timing at the site.
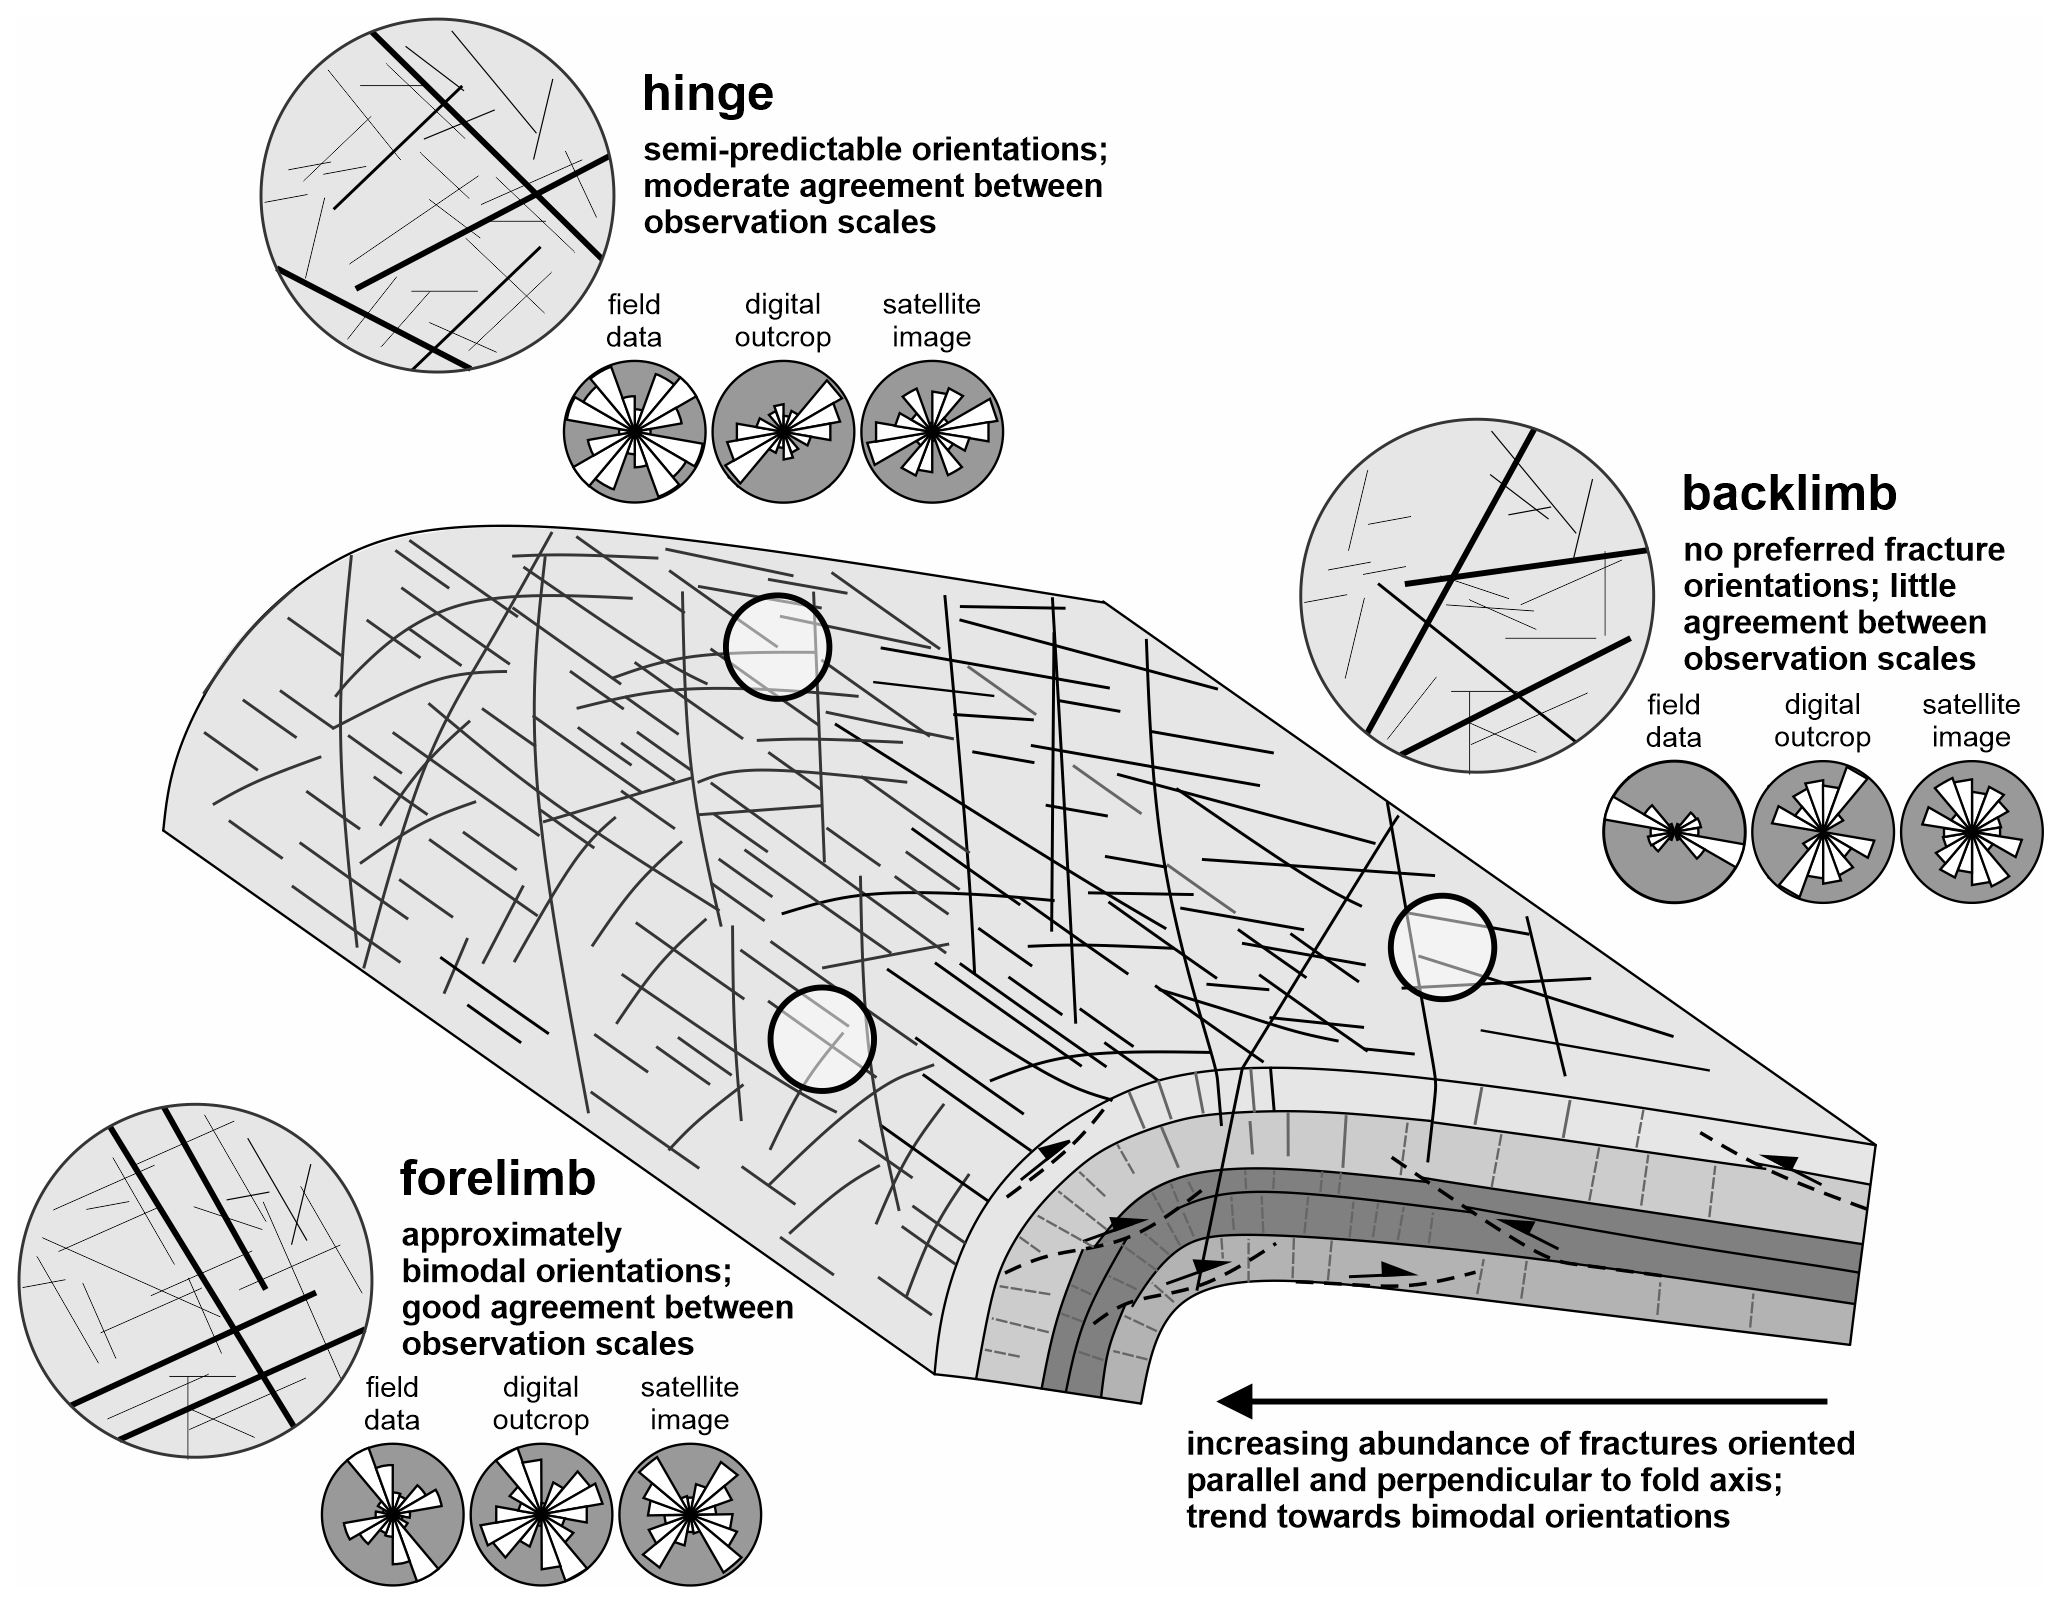
Figure 15Conceptual diagram showing the variations in the fracture attributes at Swift Reservoir anticline. Results from this study provide evidence for three general trends in fracture attributes, namely the (i) increasing intensity of hinge-parallel and hinge-perpendicular fractures towards the fold hinge, which results in a bulk increase in fracture intensity in hinge-proximal positions; (ii) higher fracture intensities in fine-grained, thinly bedded units; (iii) variable fracture orientations in backlimb positions, with little agreement between observation scales; (iv) moderate to high intensity of hinge-parallel and hinge-perpendicular fractures and some agreement between fracture orientation measurements at hinge positions; and (v) moderate to high intensity of hinge-parallel and hinge-perpendicular fractures and good agreement between fracture orientation measurements in high-, medium-, and low-resolution data towards the forelimb. The rose diagrams are a subset of the data provided in Fig. 13.
6.3 Predicting fracture intensities and orientations
Fracture orientations derived from field images, digital outcrop data, and satellite imagery show a general trend for increased proportions of hinge-parallel and hinge-perpendicular fractures towards the anticline hinge and forelimb. In contrast, more dispersed and less predictable orientations are present towards the backlimb of the structure (Fig. 13). This overall pattern results in a more clearly defined structural grain in the hinge and forelimb and, as such, greater agreement between observation scales at these structural positions. Fewer systematic or dispersed fracture orientations on the backlimb result in greater disparity in the orientations between observation scales and a general trend for disagreement between data derived from field images, digital outcrop data, and satellite imagery (Fig. 15). These results suggest that the extrapolation or prediction of fracture orientations from one observation scale to another is not straightforward and that the scaling of fracture properties is dependent on both structural position and deformation history, among other factors.
Our observations of a more clearly defined structural grain in hinge and forelimb positions are similar to those of Watkins et al. (2015, 2018), who showed that in strata that have experienced a long and complex deformation history, fracture orientations are more consistent and predictable at hinge and forelimb positions and generally unpredictable on backlimbs. Recent subsurface image log analysis by Wang et al. (2023) provides evidence for more clustered but lower-intensity fracture patterns in the backlimb of the East Painter Reservoir anticline (also in the Rockies) than in hinge and forelimb positions. This result is potentially compatible with the patterns observed at Swift Reservoir anticline. Our conceptual model of fold-related fracturing acknowledges that complex fracture patterns are likely to exist in rocks that have experienced complex deformation histories and that fold-related fracturing is more likely to overprint pre-existing deformation fabrics in the hinge and forelimb positions (Fig. 15). Furthermore, we account for the stratigraphic exposure level, based on our observation that fine-grained, thinly bedded units at the site exhibit higher fracture intensity than coarse-grained, thickly bedded units (Fig. 15). This model develops early conceptual models that predict highly organized, discrete fracture sets with little orientation variability by (i) accounting for the effects of lithological properties on fracture abundance; (ii) acknowledging that brittle deformation fabrics may form before, during, and after folding; and (iii) documenting that the scaling of fracture properties is likely dependent on structural position.
Our results and conceptual model suggest that the accurate prediction of fracture properties requires analysis not only of lithologic and structural properties but also of fracture property scaling and the spatial variability in the scaling relationships. Finally, predictions should account for all known deformation events and the effects that these events may have on existing fracture patterns in the present day.
In this study, we assess the effects of structural position, lithology, and variable data resolution on estimates of natural fracture network properties. By characterizing fracture intensities and orientations derived from mapping fractures at three image resolutions, we assess how interacting geological factors influence fracture development and the scaling of natural fracture systems. Our findings are relevant for estimating and extrapolating fracture properties in the subsurface, where data resolution and coverage are limited. The key findings of this study are as follows:
-
Hinge-parallel and hinge-perpendicular fractures exhibit systematic increases in abundance towards the fold hinge at Swift Reservoir anticline. In contrast, fractures not oriented parallel or perpendicular to the fold hinge show no systematic variations in abundance across the structure.
-
We document a general trend for increased fracture intensity in relatively fine-grained, thinly bedded units at the site. Variations in the stratigraphic exposure level across the crest of the structure result in fracture intensity maps that capture both lithologic and structural elements. We attribute mismatches between the zones of the highest fracture intensity and the fold hinge position to variations in the rock type, with finer-grained units exhibiting higher fracture intensities than coarse-grained units in equivalent structural positions.
-
Fracture orientations at the site are highly variable, and only hinge-parallel and hinge-perpendicular fractures are consistently oriented with respect to the orientation of the fold hinge. Furthermore, these fracture sets are consistently identified at all observational scales in the forelimb and hinge and show increased intensity in these regions. Other fracture sets show less consistency between observational scales and no intensity relationship with fold position.
-
Fracture orientation data exhibit the greatest agreement between observation scales at hinge and forelimb positions where the hinge-parallel and hinge-perpendicular fracture sets are best developed. Based on these results, we suggest that the scaling of fracture properties is likely to be dependent on structural position. Extrapolation of fracture properties from one scale to another should therefore account for variations in deformation intensity.
All data are available in Sect. 5 and Figs. 5, 6, 7, 8, 9, 10, 11, 12, 13, 14 in the paper.
All authors performed data collection during the field work. AJC collected UAV imagery and processed photogrammetry data. All authors collected fracture orientation data in the field, with HW collecting most of the fracture measurements. AJC and MJW collected stratigraphic log data presented in Fig. 5. AJC performed all formal data analysis, including photogrammetry processing and fracture mapping. Analysis of fracture properties, including fracture intensity, orientation, and fracture length estimation, was performed by AJC. An initial draft of the paper text and figures was prepared by AJC. Other authors provided edits and feedback, which were incorporated into an updated draft by AJC. This work was conceptualized by all of the paper authors.
The contact author has declared that none of the authors has any competing interests.
Publisher's note: Copernicus Publications remains neutral with regard to jurisdictional claims in published maps and institutional affiliations.
We gratefully acknowledge constructive reviews by Amerigo Corradetti and an anonymous reviewer and thank Stefano Tavani for editorial handling. Adam J. Cawood is grateful to David Ferrill, Kevin Smart, and Paul Gillespie for helpful conversations about fracture patterns, although the data and interpretations shown here are of course the sole responsibility of the authors. This study was carried out as part of a University of Aberdeen doctoral programme supported by the Natural Environment Research Council (NERC) Centre for Doctoral Training in Oil and Gas. Additional funding for fieldwork was provided by the University of Aberdeen Fold–Thrust Research Group. Petroleum Experts (formerly Midland Valley Exploration) is acknowledged for allowing the academic use of Move 2016.1 software.
This research has been supported by the Natural Environment Research Council (grant no. NE/M00578X/1).
This paper was edited by Stefano Tavani and reviewed by Amerigo Corradetti and one anonymous referee.
Agosta, F., Alessandroni, M., Antonellini, M., Tondi, E., and Giorgioni, M.: From fractures to flow: a field-based quantitative analysis of an outcropping carbonate reservoir, Tectonophysics, 490, 197–213, 2010.
Aliverti, E., Biron, M., Francesconi, A., Mattiello, D., Nardon, S., and Peduzzi, C.: Data analysis, processing and 3D fracture network simulation at wellbore scale for fractured reservoir description, in: Fracture and In-Situ Stress Characterization of Hydrocarbon Reservoirs, edited by: Ameen, M., Geol. Soc. Spec. Publ., 209, 27–37, 2003.
Awdal, A., Healy, D., and Alsop, G. I.: Fracture patterns and petrophysical properties of carbonates undergoing regional folding: A case study from Kurdistan, N Iraq, Mar. Petrol. Geol., 71, 149–167, 2016.
Bachu, S.: Synthesis and model of formation-water flow, Alberta Basin, Canada, Am. Assoc. Petrol. Geol. Bull., 79, 1159–1178, 1995.
Becker, I., Koehrer, B., Waldvogel, M., Jelinek, W., and Hilgers, C.: Comparing fracture statistics from outcrop and reservoir data using conventional manual and t-LiDAR derived scanlines in Ca2 carbonates from the Southern Permian Basin, Germany, Mar. Petrol. Geol., 95, 228–245, 2018.
Bemis, S. P., Micklethwaite, S., Turner, D., James, M. R., Akciz, S., Thiele, S. T., and Bangash, H. A.: Ground-based and UAV-Based photogrammetry: A multi-scale, high-resolution mapping tool for structural geology and paleoseismology, J. Struct. Geol., 69, 163–178, 2014.
Bergbauer, S. and Pollard, D. D.: A new conceptual fold-fracture model including prefolding joints, based on the Emigrant Gap anticline, Wyoming, Geol. Soc. Am. Bull., 116, 294–307, 2004.
Bödvarsson, G. S. and Tsang, C. F.: Injection and thermal breakthrough in fractured geothermal reservoirs, J. Geophys. Res.-Solid, 87, 1031–1048, 1982.
Bond, C. E., Wightman, R., and Ringrose, P. S.: The influence of fracture anisotropy on CO2 flow, Geophys. Res. Lett., 40, 1284–1289, 2013.
Bond, C. E., Kremer, Y., Johnson, G., Hicks, N., Lister, R., Jones, D. G., Haszeldine, R. S., Saunders, I., Gilfillan, S. M., Shipton, Z. K., and Pearce, J.: The physical characteristics of a CO2 seeping fault: The implications of fracture permeability for carbon capture and storage integrity, Int. J. Greenh. Gas Control, 61, 49–60, 2017.
Bonnet, E., Bour, O., Odling, N. E., Davy, P., Main, I., Cowie, P., and Berkowitz, B.: Scaling of fracture systems in geological media, Rev. Geophys., 39, 347–383, 2001.
Bossennec, C., Frey, M., Seib, L., Bär, K., and Sass, I.: Multiscale characterisation of fracture patterns of a crystalline reservoir analogue, Geosciences, 11, 371, https://doi.org/10.3390/geosciences11090371, 2021.
Bowness, N., Cawood, A., Ferrill, D., Smart, K., and Bellow, H: Mineralogy controls fracture containment in mechanically layered carbonates, Geol. Mag., 159, 1855–1873, 2022.
Burberry, C. M., Cannon, D. L., Cosgrove, J. W., and Engelder, T.: Fracture patterns associated with the evolution of the Teton anticline, Sawtooth Range, Montana, USA, in: Folding and Fracturing of Rocks: 50 Years of Research since the Seminal Text Book of J. G. Ramsay, edited by: Bond, C. E. and Lebit, H. D., Geol. Soc. Spec. Publ., 487, 229–261, 2019.
Caine, J. S., Evans, J. P., and Forster, C. B.: Fault zone architecture and permeability structure, Geology, 24, 1025–1028, 1996.
Casini, G., Gillespie, P. A., Vergés, J., Romaire, I., Fernández, N., Casciello, E., Saura, E., Mehl, C., Homke, S., Embry, J. C., and Aghajari, L.: Sub-seismic fractures in foreland fold and thrust belts: insight from the Lurestan Province, Zagros Mountains, Iran, Petrol. Geosci., 17, 263–282, 2011.
Castaing, C., Halawani, M. A., Gervais, F., Chilès, J. P., Genter, A., Bourgine, B., Ouillon, G., Brosse, J. M., Martin, P., Genna, A., and Janjou, D.: Scaling relationships in intraplate fracture systems related to Red Sea rifting, Tectonophysics, 261, 291–314, 1996.
Cawood, A. J., Bond, C. E., Howell, J. A., Butler, R. W., and Totake, Y.: LiDAR, UAV or compass-clinometer? Accuracy, coverage and the effects on structural models, J. Struct. Geol., 98, 67–82, 2017.
Cawood, A. J., Corradetti, A., Granado, P., and Tavani, S.: Detailed structural analysis of digital outcrops: A learning example from the Kermanshah-Qulqula radiolarite basin, Zagros Belt, Iran, J. Struct. Geol., 154, 104489, https://doi.org/10.1016/j.jsg.2021.104489, 2022.
Chabani, A., Trullenque, G., Ledésert, B. A., and Klee, J.: Multiscale Characterization of fracture patterns: A case study of the Noble Hills Range (Death Valley, CA, USA), application to geothermal reservoirs, Geosciences, 11, 280, https://doi.org/10.3390/geosciences11070280, 2021.
Cooke, M. L. and Underwood, C. A.: Fracture termination and step-over at bedding interfaces due to frictional slip and interface opening, J. Struct. Geol., 23, 223–238, 2001.
Cooke, M. L., Simo, J. A., Underwood, C. A., and Rijken, P.: Mechanical stratigraphic controls on fracture patterns within carbonates and implications for groundwater flow, Sediment. Geol., 184, 225–239, 2006.
Cooper, M. A.: The analysis of fracture systems in subsurface thrust structures from the Foothills of the Canadian Rockies, in: Thrust Tectonics, edited by: McClay, K. R., Chapman & Hall, London, 391–406, https://doi.org/10.1007/978-94-011-3066-0_35, 1991.
Cooper, S. P., Goodwin, L. B., and Lorenz, J. C.: Fracture and fault patterns associated with basement-cored anticlines: The example of Teapot Dome, Wyoming, AAPG Bull., 90, 1903–1920, 2006.
Corradetti, A., Tavani, S., Parente, M., Iannace, A., Vinci, F., Pirmez, C., Torrieri, S., Giorgioni, M., Pignalosa, A., and Mazzoli, S.: Distribution and arrest of vertical through-going joints in a seismic-scale carbonate platform exposure (Sorrento peninsula, Italy): insights from integrating field survey and digital outcrop model, J. Struct. Geol., 108, 121–136, 2018.
Cosgrove, J. W. and Ameen, M. S. (Eds.): A comparison of the geometry, spatial organization and fracture patterns associated with forced folds and buckle folds, in: Forced Folds and Fractures, Geol. Soc. Spec. Publ., 169, 7–21, 1999.
De Marsily, G., Delay, F., Gonçalvès, J., Renard, P., Teles, V., and Violette, S.: Dealing with spatial heterogeneity, Hydrogeol. J., 13, 161–183, 2005.
Dimmen, V., Rotevatn, A., and Lecomte, I.: Imaging of small-scale faults in seismic reflection data: Insights from seismic modelling of faults in outcrop, Mar. Petrol. Geol., 147, 105980, https://doi.org/10.1016/j.marpetgeo.2022.105980, 2023.
Dunn, D. E., LaFountain, L. J., and Jackson, R. E.: Porosity dependence and mechanism of brittle fracture in sandstones, J. Geophys. Res., 78, 2403–2417, 1973.
Ferrill, D. A., Winterle, J., Wittmeyer, G., Sims, D. W., Colton, S., Armstrong, A., and Morris, A. P.: Stressed rock strains groundwater at Yucca Mountain, Nevada, GSA Today, 9, 1–8, 1999.
Ferrill, D. A., Smart, K. J., Cawood, A. J., and Morris, A. P.: The fold-thrust belt stress cycle: Superposition of normal, strike-slip, and thrust faulting deformation regimes, J. Struct. Geol., 148, 104362, https://doi.org/10.1016/j.jsg.2021.104362, 2021.
Fischer, M. P. and Wilkerson, M. S.: Predicting the orientation of joints from fold shape: Results of pseudo–three-dimensional modeling and curvature analysis, Geology, 28, 15–18, 2000.
Fox, D. B., Sutter, D., Beckers, K. F., Lukawski, M. Z., Koch, D. L., Anderson, B. J., and Tester, J. W.: Sustainable heat farming: Modeling extraction and recovery in discretely fractured geothermal reservoirs, Geothermics, 46, 42–54, 2013.
Francioni, M., Pace, P., Vitulli, M., Sciarra, N., and Calamita, F.: Distribution of joints in the hinge-line culmination of foreland-verging overturned anticlines: an example from the Montagna dei Fiori structure in the Central Apennines of Italy, Geol. Mag., 156, 1445–1454, 2019.
Fuentes, F., DeCelles, P. G., and Constenius, K. N.: Regional structure and kinematic history of the Cordilleran fold-thrust belt in northwestern Montana, USA, Geosphere, 8, 1104–1128, 2012.
Gautschi, A.: Hydrogeology of a fractured shale (Opalinus Clay): Implications for deep geological disposal of radioactive wastes, Hydrogeol. J., 9, 97–107, 2001.
Gholami, R., Raza, A., and Iglauer, S.: Leakage risk assessment of a CO2 storage site: A review, Earth-Sci. Rev., 223, 103849, https://doi.org/10.1016/j.earscirev.2021.103849, 2021.
Ghosh, K. and Mitra, S.: Structural controls of fracture orientations, intensity, and connectivity, Teton anticline, Sawtooth Range, Montana, Geol. Soc. Am. Bull., 93, 995–1014, 2009.
Gillespie, P. A., Howard, C. B., Walsh, J. J., and Watterson, J.: Measurement and characterisation of spatial distributions of fractures, Tectonophysics, 226, 113–141, 1993.
Gillespie, P. A., Walsh, J. J., Watterson, J., Bonson, C. G., and Manzocchi, T.: Scaling relationships of joint and vein arrays from The Burren, Co. Clare, Ireland, J. Struct. Geol., 23, 183–201, 2001.
Glaas, C., Vidal, J., and Genter, A.: Structural characterization of naturally fractured geothermal reservoirs in the central Upper Rhine Graben, J. Struct. Geol., 148, 104370, https://doi.org/10.1016/j.jsg.2021.104370, 2021.
Gong, L., Wang, J., Gao, S., Fu, X., Liu, B., Miao, F., Zhou, X., and Meng, Q.: Characterization, controlling factors and evolution of fracture effectiveness in shale oil reservoirs, J. Petrol. Sci. Eng., 203, 108655, https://doi.org/10.1016/j.petrol.2021.108655, 2021.
Green, A. G. and Mair, J. A.: Subhorizontal fractures in a granitic pluton: Their detection and implications for radioactive waste disposal, Geophysics, 48, 1428–1449, 1983.
Hancock, P. L.: Brittle microtectonics: principles and practice, J. Struct. Geol., 7, 437–457, 1985.
Hanks, C. L., Lorenz, J., Teufel, L., and Krumhardt, A. P.: Lithologic and structural controls on natural fracture distribution and behavior within the Lisburne Group, northeastern Brooks Range and North Slope subsurface, Alaska, AAPG Bull., 81, 1700–1720, 1997.
Hardebol, N. J., Maier, C., Nick, H., Geiger, S., Bertotti, G., and Boro, H.: Multiscale fracture network characterization and impact on flow: A case study on the Latemar carbonate platform, J. Geophys. Res.-Solid, 120, 8197–8222, 2015.
Harris, J. F., Taylor, G. L., and Walper, J. L.: Relation of deformational fractures in sedimentary rocks to regional and local structure, AAPG Bull., 44, 1853–1873, 1960.
Healy, D., Rizzo, R. E., Cornwell, D. G., Farrell, N. J., Watkins, H., Timms, N. E., Gomez-Rivas, E., and Smith, M.: FracPaQ: A MATLABTM toolbox for the quantification of fracture patterns, J. Struct. Geol., 95, 1–16, 2017.
Hennings, P. H., Olson, J. E., and Thompson, L. B.: Combining outcrop data and three-dimensional structural models to characterise fractured reservoirs: an example from Wyoming, AAPG Bull., 84, 830–849, 2000.
Holl, J. E. and Anastasio, D. J.: Deformation of a foreland carbonate thrust system, Sawtooth Range, Montana, Geol. Soc. Am. Bull., 104, 994–953, 1992.
Hooker, J. N., Laubach, S. E., and Marrett, R.: Fracture-aperture size – Frequency, spatial distribution, and growth processes in strata-bounded and non-strata-bounded fractures, Cambrian Mesón Group, NW Argentina, J. Struct. Geol., 54, 54–71, 2013.
Hugman, R. H. H. and Friedman, M.: Effects of texture and composition on mechanical behaviour of experimentally deformed carbonate rocks, AAPG Bull., 63, 1478–1489, 1979.
Humair, F., Abellan, A., Carrea, D., Matasci, B., Epard, J. L., and Jaboyedoff, M.: Geological layers detection and characterisation using high resolution 3D point clouds: example of a box-fold in the Swiss Jura Mountains, Eur. J. Remote Sens., 48, 541–568, 2015.
Iding, M. and Ringrose, P.: Evaluating the impact of fractures on the performance of the In Salah CO2 storage site, Int. J. Greenh. Gas Control, 4, 242–248, 2010.
Inks, T. L., Engelder, T., Jenner, E., Golob, B., Hocum, J. S., and O'Brien, D. G.: Marcellus fracture characterization using P-wave azimuthal velocity attributes: Comparison with production and outcrop data, Interpretation, 3, SU1–SU15, 2015.
Ishii, E.: Constant-head step injection tests to quantify the stress dependence of fracture transmissivity in an excavation damaged zone: A case study from the Horonobe Underground Research Laboratory, Int. J. Rock Mech. Min. Sci., 159, 105229, https://doi.org/10.1016/j.ijrmms.2022.105229, 2022.
James, M. R. and Robson, S.: Straightforward reconstruction of 3D surfaces and topography with a camera: Accuracy and geoscience application, J. Geophys. Res.-Earth, 117, F03017, https://doi.org/10.1029/2011jf002289, 2012.
Kou, Z., Wang, T., Chen, Z., and Jiang, J.: A fast and reliable methodology to evaluate maximum CO2 storage capacity of depleted coal seams: A case study, Energy, 231, 120992, https://doi.org/10.1016/j.energy.2021.120992, 2021.
Ladeira, F. L. and Price, N. J.: Relationship between fracture spacing and bed thickness, J. Struct. Geol., 3, 179–183, 1981.
Laubach, S. E., Olson, J. E., and Gross, M. R.: Mechanical and fracture stratigraphy, AAPG Bull., 93, 1413–1426, 2009.
Laubach, S. E., Lander, R. H., Criscenti, L. J., Anovitz, L. M., Urai, J. L., Pollyea, R. M., Hooker, J. N., Narr, W., Evans, M. A., Kerisit, S. N., and Olson, J. E.: The role of chemistry in fracture pattern development and opportunities to advance interpretations of geological materials, Rev. Geophys., 57, 1065–1111, 2019.
Li, L. and Lee, S. H.: Efficient field-scale simulation of black oil in a naturally fractured reservoir through discrete fracture networks and homogenized media, SPE Reserv. Eval. Eng., 11, 750–758, 2008.
Lisle, R. J.: Constant bed-length folding: three-dimensional geometrical implications, J. Struct. Geol., 14, 245–252, 1992.
Lisle, R. J.: Detection of zones of abnormal strains in structures using Gaussian curvature analysis, AAPG Bull., 78, 1811–1819, 1994.
Ma, J., Vaszi, A. Z., Couples, G. D., and Harris, S. D.: The link between a heterogeneous model and its flow response: examples from fault damage zones highlighting issues in domain discretization and flow simulation, in: Structurally Complex Reservoirs, edited by: Jolley, S. J., Barr, D., Walsh, J. J., and Knipe, R. J., Geol. Soc. Spec. Publ., 292, 337–352, 2007.
Mäkel, G. H.: The modelling of fractured reservoirs: Constraints and potential for fracture network geometry and hydraulics analysis, in: Structurally Complex Reservoirs, edited by: Jolley, S. J., Barr, D., Walsh, J. J., and Knipe, R. J., Geol. Soc. Spec. Publ., 292, 375–403, 2007.
Marrett, R. and Allmendinger, R. W.: Amount of extension on “small” faults: An example from the Viking graben, Geology, 20, 47–50, 1992.
Marshak, S., Karlstrom, K., and Timmons, J. M.: Inversion of Proterozoic extensional faults: An explanation for the pattern of Laramide and Ancestral Rockies intracratonic deformation, United States, Geology, 28, 735–738, 2000.
Mauldon, M., Dunne, W. M., and Rohrbaugh Jr., M. B.: Circular Scanlines and circular windows: new tools for characterizing the geometry of fracture traces, J. Struct. Geol., 23, 247–258, 2001.
McGinnis, R. N., Ferrill, D. A., Smart, K. J., Morris, A. P., Higuera-Diaz, C., and Prawica, D.: Pitfalls of using entrenched fracture relationships: Fractures in bedded carbonates of the Hidden Valley Fault Zone, Canyon Lake Gorge, Comal County, Texas, AAPG Bull., 99, 2221–2245, 2015.
McGinnis, R. N., Ferrill, D. A., Morris, A. P., Smart, K. J., and Lehrmann, D.: Mechanical stratigraphic controls on natural fracture spacing and penetration, J. Struct. Geol., 95, 160–170, 2017.
McQuillan, H.: Small-scale fracture density in Asmari Formation of Southwest Iran and its relation to bed thickness and structural setting, AAPG Bull., 57, 2367–2385, 1973.
McQuillan, H.: Fracture patterns on Kuh-e Asmari anticline, southwest Iran, AAPG Bull., 58, 236–246, 1974.
Medici, G., Smeraglia, L., Torabi, A., and Botter, C.: Review of modeling approaches to groundwater flow in deformed carbonate aquifers, Groundwater, 59, 334–351, 2021.
Mitra, S.: Duplex structures and imbricate thrust systems: geometry, structural position, and hydrocarbon potential, AAPG Bull., 70, 1087–1112, 1986.
Moore, J. P. and Walsh, J. J.: Quantitative analysis of Cenozoic faults and fractures and their impact on groundwater flow in the bedrock aquifers of Ireland, Hydrogeol. J., 29, 2613–2632, 2021.
Morris, A. P., Ferrill, D. A., Sims, D. W., Franklin, N., and Waiting, D. J.: Patterns of fault displacement and strain at Yucca Mountain, Nevada, J. Struct. Geol., 26, 1707–1725, 2004.
Mudge, M. R.: A résumé of the structural geology of the Northern Disturbed Belt, northwest Montana, Geological Studies of the Cordilleran Thrust Belt, 1, 91–122, 1982.
Mudge, M. R. and Earhart, R. L.: Bedrock geologic map of part of the northern Disturbed Belt, Lewis and Clark, Teton, Pondera, Glacier, Flathead, Cascade, and Powell counties, Montana: US Geological Survey Miscellaneous Investigation Series Map I-1375, scale , https://doi.org/10.3133/i1375, 1983.
Nadimi, S., Forbes, B., Moore, J., Podgorney, R., and McLennan, J. D.: Utah FORGE: Hydrogeothermal modeling of a granitic based discrete fracture network, Geothermics, 87, 101853, https://doi.org/10.1016/j.geothermics.2020.101853, 2020.
Narr, W. and Suppe, J.: Joint spacing in sedimentary rocks, J. Struct. Geol., 13, 1037–1048, 1991.
Nelson, R.: Geologic analysis of naturally fractured reservoirs, Elsevier, ISBN 978-0-88415-317-7, 2001.
Nichols, K. M.: Stratigraphy of the upper part of The Madison Group, Sawtooth Range, northwestern Montana, Montana Geological Society, 1984 Field Conference, Northwestern Montana, I27-I4A, 1984.
Nichols, K. M.: Regional Significance of Lithologic Correlation of Mississippian Rocks at Pentagon Mountain and the Sawtooth Range, Northwestern Montana, USGS Open-File Report 86-39 (one Plate), USGS, https://doi.org/10.3133/ofr8639, 1986.
Odling, N. E.: Scaling and connectivity of joint systems in sandstones from western Norway, J. Struct. Geol., 19, 1257–1271, 1997.
Price, N. J.: Fault and Joint Development in Brittle and Semi-Brittle Rock, Pergamon, New York, ISBN 978-0-08-011275-6, 1966.
Ramsay, J. G.: Folding and fracturing of rocks, McGraw Hill Book Company, 568 pp., ISBN 193066589X, 1967.
Rawnsley, K., De Keijzer, M., Wei, L., Bettembourg, S., Asyee, W., Massaferro, J. L., Swaby, P., Drysdale, D., and Boettcher, D.: Characterizing fracture and matrix heterogeneities in folded Devonian carbonate thrust sheets, Waterton tight gas fields, Western Canada, in: Fractured Reservoirs, edited by: Lonergan, L., Jolly, R. J. H., Rawnsley, K., and Sanderson, D. J., Geol. Soc. Spec. Publ., 270, 265–279, 2007.
Scheiber, T., Fredin, O., Viola, G., Jarna, A., Gasser, D., and Łapińska-Viola, R.: Manual extraction of bedrock lineaments from high-resolution LiDAR data: methodological bias and human perception, GFF, 137, 362–372, 2015.
Seers, T. D. and Hodgetts, D.: Comparison of digital outcrop and conventional data collection approaches for the characterization of naturally fractured reservoir analogues, in: Advances in the Study of Fractured Reservoirs, edited by: Spence, G. H., Redfern, J., Aguilera, R., Bevan, T. G., Cosgrove, J. W., Couples, G. D., and Daniel, J.-M., Geol. Soc. Spec. Publ., 374, 51–77, 2014.
Shaik, A. R., Rahman, S. S., Tran, N. H., and Tran, T.: Numerical simulation of fluid-rock coupling heat transfer in naturally fractured geothermal system, Appl. Therm. Eng., 31, 1600–1606, 2011.
Sinclair, S.: Analysis of macroscopic fractures on Teton anticline, northwestern Montana, MS thesis, Texas A&M University, College Station, Texas, 102 pp., https://hdl.handle.net/1969.1/ETD-TAMU-1980-THESIS-S616 (last access: 23 June 2022), 1980.
Singdahlsen, D. S.: Structural geology of the Swift Reservoir Culmination, Sawtooth Range, Montana, MSc Thesis, Montana State University, Bozeman, Montana, 124 pp., https://scholarworks.montana.edu/xmlui/handle/1/4005 (last access: 23 June 2022), 1986.
Smeraglia, L., Mercuri, M., Tavani, S., Pignalosa, A., Kettermann, M., Billi, A., and Carminati, E.: 3D Discrete Fracture Network (DFN) models of damage zone fluid corridors within a reservoir-scale normal fault in carbonates: multiscale approach using field data and UAV imagery, Mar. Petrol. Geol., 126, 104902, https://doi.org/10.1016/j.marpetgeo.2021.104902, 2021.
Spence, G. H., Couples, G. D., Bevan, T. G., Aguilera, R., Cosgrove, J. W., Daniel, J. M., and Redfern, J. (Eds.): Advances in the study of naturally fractured hydrocarbon reservoirs: a broad integrated interdisciplinary applied topic, in: Advances in the Study of Fractured Reservoirs, Geol. Soc. Spec. Publ., 374, 1–22, 2014.
Spooner, J. A.: Field and laboratory study of fracture characteristics as a function of bed curvature in folded dolomites, Sawtooth Mountains, Montana, MS thesis, University of Oklahoma, Norman, Oklahoma, 135 pp., 1984.
Stearns, D. W.: Macrofracture patterns on Teton Anticline, northwest Montana, Trans. Am. Geophys. Union, 45, 107–108, 1964.
Stearns, D. W.: Fracture as a mechanism of flow in naturally deformed layered rocks. In Proceedings of the Conference on Research in Tectonics, Kink Bands and Brittle Deformation, Geol. Surv. Can. Pap., 68, 79–96, 1969.
Stearns, D. W. and Friedman, M.: Reservoirs in fractured rock: Geologic exploration methods, in: Stratigraphic Oil and Gas Fields: Classification, Exploration Methods, and Case Histories, edited by: King, R. E., AAPG Memoirs, 16, 82–106, 1972.
Stewart, J. H., Anderson, R. E., Aranda-Gómez, J. J., Beard, L. S., Billingsley, G. H., Cather, S. M., Dilles, J. H., Dokka, R. K., Faulds, J. E., Ferrari, L., and Grose, T. L.: Map showing Cenozoic tilt domains and associated structural features, western North America. Accommodation zones and transfer zones: The regional segmentation of the Basin and Range province, Geol. Soc. Am. Spec. Pap., 323, 1998.
Streltsova, T. D.: Hydrodynamics of groundwater flow in a fractured formation, Water Resour. Res., 12, 405–414, 1976.
Strijker, G., Bertotti, G., and Luthi, S. M.: Multi-scale fracture network analysis from an outcrop analogue: A case study from the Cambro-Ordovician clastic succession in Petra, Jordan, Mar. Petrol. Geol., 38, 104–116, 2012.
Sun, J., Gamboa, E. S., Schechter, D., and Rui, Z.: An integrated workflow for characterization and simulation of complex fracture networks utilizing microseismic and horizontal core data, J. Nat. Gas Sci. Eng., 34, 1347–1360, 2016.
Sun, X., Gomez-Rivas, E., Alcalde, J., Martín-Martín, J. D., Ma, C., Muñoz-López, D., Cruset, D., Cantarero, I., Griera, A., and Travé, A.: Fracture distribution in a folded fluvial succession: the Puig-reig anticline (South-eastern Pyrenees), Mar. Petrol. Geol., 132, 105169, https://doi.org/10.31223/x5j31s, 2021.
Tamagawa, T. and Pollard, D. D.: Fracture permeability created by perturbed stress fields around active faults in a fractured basement reservoir, AAPG Bull., 92, 743–764, 2008.
Tavani, S., Storti, F., Lacombe, O., Corradetti, A., Muñoz, J. A., and Mazzoli, S.: A review of deformation pattern templates in foreland basin systems and fold-and-thrust belts: Implications for the state of stress in the frontal regions of thrust wedges, Earth-Sci. Rev., 141, 82–104, 2015.
Thomas, L. K., Dixon, T. N., and Pierson, R. G.: Fractured reservoir simulation, Soc. Petrol. Eng. J., 23, 42–54, 1983.
Triantafyllou, A., Watlet, A., Le Mouélic, S., Camelbeeck, T., Civet, F., Kaufmann, O., Quinif, Y., and Vandycke, S.: 3-D digital outcrop model for analysis of brittle deformation and lithological mapping (Lorette cave, Belgium), J. Struct. Geol., 120, 55–66, 2019.
Ukar, E., Laubach, S. E., and Hooker, J. N.: Outcrops as guides to subsurface natural fractures: Example from the Nikanassin Formation tight-gas sandstone, Grande Cache, Alberta foothills, Canada, Mar. Petrol. Geol., 103, 255–275, 2019.
Vollgger, S. A. and Cruden, A. R.: Mapping folds and fractures in basement and cover rocks using UAV photogrammetry, Cape Liptrap and Cape Paterson, Victoria, Australia, J. Struct. Geol., 85, 168–187, 2016.
Wallace, C. A., Lidke, D. J., and Schmidt, R. G.: Faults of the central part of the Lewis and Clark line and fragmentation of the Late Cretaceous foreland basin in west-central Montana, Geol. Soc. Am. Bull., 102, 1021–1037, 1990.
Wang, Q., Narr, W., and Laubach, S. E.: Quantitative characterization of fracture spatial arrangement and intensity in a reservoir anticline using horizontal wellbore image logs and an outcrop analogue, Mar. Petrol. Geol., 152, 106238, https://doi.org/10.1016/j.marpetgeo.2023.106238, 2023.
Ward, E. G. and Sears, J. W.: Reinterpretation of fractures at Swift Reservoir, Rocky Mountain thrust front, Montana: Passage of a Jurassic forebulge?, Geol. Soc. Am. Spec. Pap., 433, 197–210, 2007.
Watanabe, K. and Takahashi, H.: Fractal geometry characterization of geothermal reservoir fracture networks, J. Geophys. Res.-Solid, 100, 521–528, 1995.
Watkins, H., Butler, R. W., Bond, C. E., and Healy, D.: Influence of structural position on fracture networks in the Torridon Group, Achnashellach fold and thrust belt, NW Scotland, J. Struct. Geol., 74, 64–80, 2015.
Watkins, H., Healy, D., Bond, C. E., and Butler, R. W.: Implications of heterogeneous fracture distribution on reservoir quality; an analogue from the Torridon Group sandstone, Moine Thrust Belt, NW Scotland, J. Struct. Geol., 108, 180–197, 2018.
Watkins, H., Bond, C. E., Cawood, A. J., Cooper, M. A., and Warren, M. J.: Fracture distribution on the Swift Reservoir Anticline, Montana: Implications for structural and lithological controls on fracture intensity, in: Folding and Fracturing of Rocks: 50 Years of Research since the Seminal Text Book of J. G. Ramsay, edited by: Bond, C. E. and Lebit, H. D., Geol. Soc. Spec. Publ., 487, 209–228, 2019.
Weil, A. B. and Yonkee, A.: The Laramide orogeny: Current understanding of the structural style, timing, and spatial distribution of the classic foreland thick-skinned tectonic system. In: Laurentia: Turning Points in the Evolution of a Continent, edited by: Whitmeyer, S. J., Williams, M. L., Kellett, D. A., and Tikoff, B., Geol. Soc. Am. Memoirs, 220, https://doi.org/10.1130/2022.1220(33), 2023.
Wennberg, O. P., Svånå, T., Azizzadeh, M., Aqrawi, A. M. M., Brockbank, P., Lyslo, K. B., and Ogilvie, S.: Fracture intensity vs. mechanical stratigraphy in platform top carbonates: the Aquitanian of the Asmari Formation, Khaviz Anticline, Zagros, SW Iran, Petrol. Geosci., 12, 235–246, 2006.
Wennberg, O. P., Azizzadeh, M., Aqrawi, A. A. M., Blanc, E., Brockbank, P., Lyslo, K. B., Pickard, N., Salem, L. D., and Svånå, T.: The Khaviz Anticline: an outcrop analogue to giant fractured Asmari Formation reservoirs in SW Iran, in: Fractured Reservoirs, edited by: Lonergan, L., Jolly, R. J. H., Rawnsley, K., and Sanderson, D. J., Geol. Soc. Spec. Publ., 270, 23–42, 2007.
Worthington, M. H. and Lubbe, R.: The scaling of fracture compliance, in: Fractured Reservoirs, edited by: Lonergan, L., Jolly, R. J. H., Rawnsley, K., and Sanderson, D. J., Geol. Soc. Spec. Publ., 270, 73–82, 2007.
Wu, H. and Pollard, D. D.: An experimental study of the relationship between joint spacing and layer thickness, J. Struct. Geol., 17, 887–905, 1995.
Yielding, G., Needham, T., and Jones, H.: Sampling of fault populations using sub-surface data: a review, J. Struct. Geol., 18, 135–146, 1996.
Yin, T. and Chen, Q.: Simulation-based investigation on the accuracy of discrete fracture network (DFN) representation, Comput. Geotech., 121, 103487, https://doi.org/10.1016/j.compgeo.2020.103487, 2020.
Yu, H., Lu, C., Chen, W., and Li, H.: Permeability changes in fractured Tamusu mudstone in the context of radioactive waste disposal, Bull. Eng. Geol. Environ., 80, 7945–7957, 2021.