the Creative Commons Attribution 4.0 License.
the Creative Commons Attribution 4.0 License.
 | 10 Mar 2023
Transport mechanisms of hydrothermal convection in faulted tight sandstones
Guoqiang Yan
Benjamin Busch
Robert Egert
Morteza Esmaeilpour
Kai Stricker
Thomas Kohl
Motivated by the unknown reasons for a kilometre-scale high-temperature overprint of 270–300 ∘C in a reservoir outcrop analogue (Piesberg quarry, northwestern Germany), numerical simulations are conducted to identify the transport mechanisms of the fault-related hydrothermal convection system. The system mainly consists of a main fault and a sandstone reservoir in which transfer faults are embedded. The results show that the buoyancy-driven convection in the main fault is the basic requirement for elevated temperatures in the reservoir. We studied the effects of permeability variations and lateral regional flow (LRF) mimicking the topographical conditions on the preferential fluid-flow pathways, dominant heat-transfer types, and mutual interactions among different convective and advective flow modes. The sensitivity analysis of permeability variations indicates that lateral convection in the sandstone and advection in the transfer faults can efficiently transport fluid and heat, thus causing elevated temperatures (≥269 ∘C) in the reservoir at a depth of 4.4 km compared to purely conduction-dominated heat transfer (≤250 ∘C). Higher-level lateral regional flow interacts with convection and advection and changes the dominant heat transfer from conduction to advection in the transfer faults for the low permeability cases of sandstone and main fault. Simulations with anisotropic permeabilities detailed the dependence of the onset of convection and advection in the reservoir on the spatial permeability distribution. The depth-dependent permeabilities of the main fault reduce the amount of energy transferred by buoyancy-driven convection. The increased heat and fluid flows resulting from the anisotropic main fault permeability provide the most realistic explanation for the thermal anomalies in the reservoir. Our numerical models can facilitate exploration and exploitation workflows to develop positive thermal anomaly zones as geothermal reservoirs. These preliminary results will stimulate further petroleum and geothermal studies of fully coupled thermo–hydro–mechanical–chemical processes in faulted tight sandstones.
- Article
(10320 KB) - Full-text XML
-
Supplement
(510 KB) - BibTeX
- EndNote


Thermal anomalies in sedimentary basins are common geological phenomena and may affect hydrocarbon reservoir properties and the utilisation of subsurface space concerning porosity and permeability due to cementation with temperature-related authigenic cement (Baillieux et al., 2013). Meanwhile, the thermal anomalies in sedimentary basins can be targeted as geothermal resources for heat and electricity production (Moeck, 2014). In general, thermal anomalies may be caused by variations of thermal conductivities around structures such as salt domes (O'Brien and Lerche, 1988; Magri et al., 2008), geological and tectonic activity (Emry et al., 2020), geochemical reactions (Elderfield et al., 1999) or hydrothermal activities in faults and fractures (Cherubini et al., 2013). Indeed, in addition to being a possible cause of thermal anomalies (Zwingmann et al., 1998, 1999; Liewig and Clauer, 2000; Will et al., 2016), the hydrothermal activities in faults and fractures are often invoked to explain natural processes in sedimentary basins, such as hydrothermal mineralisation (Kühn and Gessner, 2009; Harcouët-Menou et al., 2009). The common driving force for hydrothermal activities in faulted and fractured lithologies is the fluid-density difference caused by temperature variations (Nield and Bejan, 2017). The resulting process is called buoyancy-driven convection/flow. Many numerical models imply that buoyancy-driven convection in faulted basins could explain the correlation between faulted zones or adjacent lithologies and thermal anomalies (Bruhn et al., 1994; Andrews et al., 1996; Lampe and Person, 2000). Besides the buoyancy-driven force, pore-pressure gradients or lateral regional flow (LRF) from topographical, magmatic or metamorphic fluid production also cause hydrothermal activities (e.g. controlling the fluid flow and heat transfer) (Wisian and Blackwell, 2004b), while the two flow modes may also coexist (McKenna and Blackwell, 2004). Several studies further reveal that these flow modes generate complex flow patterns within the faults (i.e. convection cells) and/or across the adjacent permeable lithologies (Magri et al., 2016).
Transport mechanisms of hydrothermal convection in faulted zones, including preferential fluid-flow pathways, dominant heat-transfer types (i.e. conduction, advection and convection) and the mutual interactions of different flow modes, are crucial for interpreting related diagenetic, petrophysical and thermal phenomena in sedimentary basins. Therefore, it is necessary to understand the transport mechanisms of hydrothermal convection in faulted zones, which are mainly controlled by the permeability distributions of the fault systems and the surrounding lithologies, pore-pressure gradients and LRF (López and Smith, 1995; Fairley, 2009). The dominant heat-transfer types are quantified by analysing the Peclet number, which in this case represents the ratio of heat transfer by convection/advection to heat transfer by conduction (Jobmann and Clauser, 1994). For Peclet numbers much less than 1 (e.g. <0.1), the system is conduction-dominated, while for values greater than 1, the system is convection/advection-dominated (Kämmlein et al., 2019). A Peclet number within the range of 0.1 and 1 indicates a convective–conductive system (Beck et al., 1989). Furthermore, rock heterogeneities (e.g. anisotropic and depth-dependent permeabilities), mainly resulting from sedimentary depositional environments, superimposed tectonics and lithostatic stress, are common phenomena in sedimentary basins (Parry, 1998; Achtziger-Zupanèiè et al., 2017b; Panja et al., 2021). Affected by the preferential orientation of pore connectivity during deformation, the orientation of maximum permeability of faulted zones commonly lies parallel to the fault plane (i.e. parallel to bedding) (Scibek, 2020). The horizontal permeability of sedimentary rocks generally shows higher values than the vertical (i.e. perpendicular to bedding) permeability due to the effect of bedding, as controlled by the sedimentary depositional environments (Panja et al., 2021). Permeability is generally expected to decrease with increasing lithostatic pressure (Manning and Ingebritsen, 1999; Saar and Manga, 2004). Anisotropic and depth-dependent permeabilities may change the fluid-flow pathways and affect heat transfer (Guillou-Frottier et al., 2020). López and Smith (1995) and Magri et al. (2016) presented 3D numerical investigations involving topography-driven flow and buoyancy-driven flow to infer the transport mechanisms of a hydrothermal convection system. The hydraulic conditions of Magri et al. (2016) were isotropic and homogeneous, whereas the simulation of López and Smith set partly anisotropic and heterogeneous hydraulic conditions. The effects of thermo–hydraulic conditions, including permeability distributions of fault systems and surrounding lithologies, and LRF, on the transport mechanisms, have not yet been systematically investigated.
A blueprint for complex hydrothermal conditions is the Piesberg quarry, exposing Upper Carboniferous sandstones from the Lower Saxony Basin (LSB) in northwestern Germany. The quarry is chosen as a reservoir analogue because of its similarity to still-producing tight sandstone reservoirs in LSB concerning sedimentology, stratigraphy, fault patterns and average porosity. Tight sandstone, generally referred to as low permeability reservoirs that produce mainly dry natural gas, is a common play type of petroleum reservoir (Becker et al., 2019). The Upper Carboniferous sandstone reservoir analogue, once located at a maximum depth of about 5 km, was affected by a kilometre-scale thermal anomaly (270–300 ∘C), as interpreted from geothermometry data including fluid inclusion, K–Ar dating, chlorite thermometry and vitrinite reflectance analyses (Wüstefeld et al., 2017b). The geothermometry data indicated that the chlorite in veins typically reaches temperatures of ∼ 300 ∘C due to fluid flow, whereas the pore-filling chlorite records an average temperature of 270 ∘C. Furthermore, the Piesberg quarry is also an experimental study case for the thermal control of a porosity–permeability evolution defined by long-term history matching in this play type (Becker et al., 2019). Thus, revealing the transport mechanisms of the hydrothermal convection system in the Piesberg quarry is an effective strategy for interpreting related geological phenomena such as kilometre-scale thermal anomalies).
Our study aims to systematically identify the transport mechanisms as inferred from the results of fluid flow and heat transfer in the tight sandstone reservoir. For the first time, the example of the Upper Carboniferous sandstones of the Piesberg quarry and its geological past is used to numerically investigate the physical processes leading to the kilometre-scale thermal anomaly in faulted tight sandstones. A 3D model is established based on the geological conditions of the Piesberg quarry. Firstly, considering complex thermo–hydraulic conditions, numerical modelling is performed, and the influence of the different transport mechanisms is quantified. Then, the transport mechanisms are further assessed and discussed to study the effects of the anisotropic and depth-dependent permeabilities on the transport mechanisms. Possible reasons for the kilometre-scale thermal anomaly in the Piesberg quarry are inferred. Based on the generalised structural characteristics of the studied domain, the numerical results can be applied to interpret hydrothermal convection-related geological phenomena and to draw implications for future exploration and exploitation of reservoirs in analogous settings.
2.1 The reservoir analogue study area
The studied Piesberg quarry is located at the southern margin of the LSB (Fig. 1a and b). The reservoir-scaled Piesberg study site has dimensions of approximately 1 km in the W–E direction and 0.5 km in the N–S direction, with a depth of roughly 0.1 km (Fig. 1c).
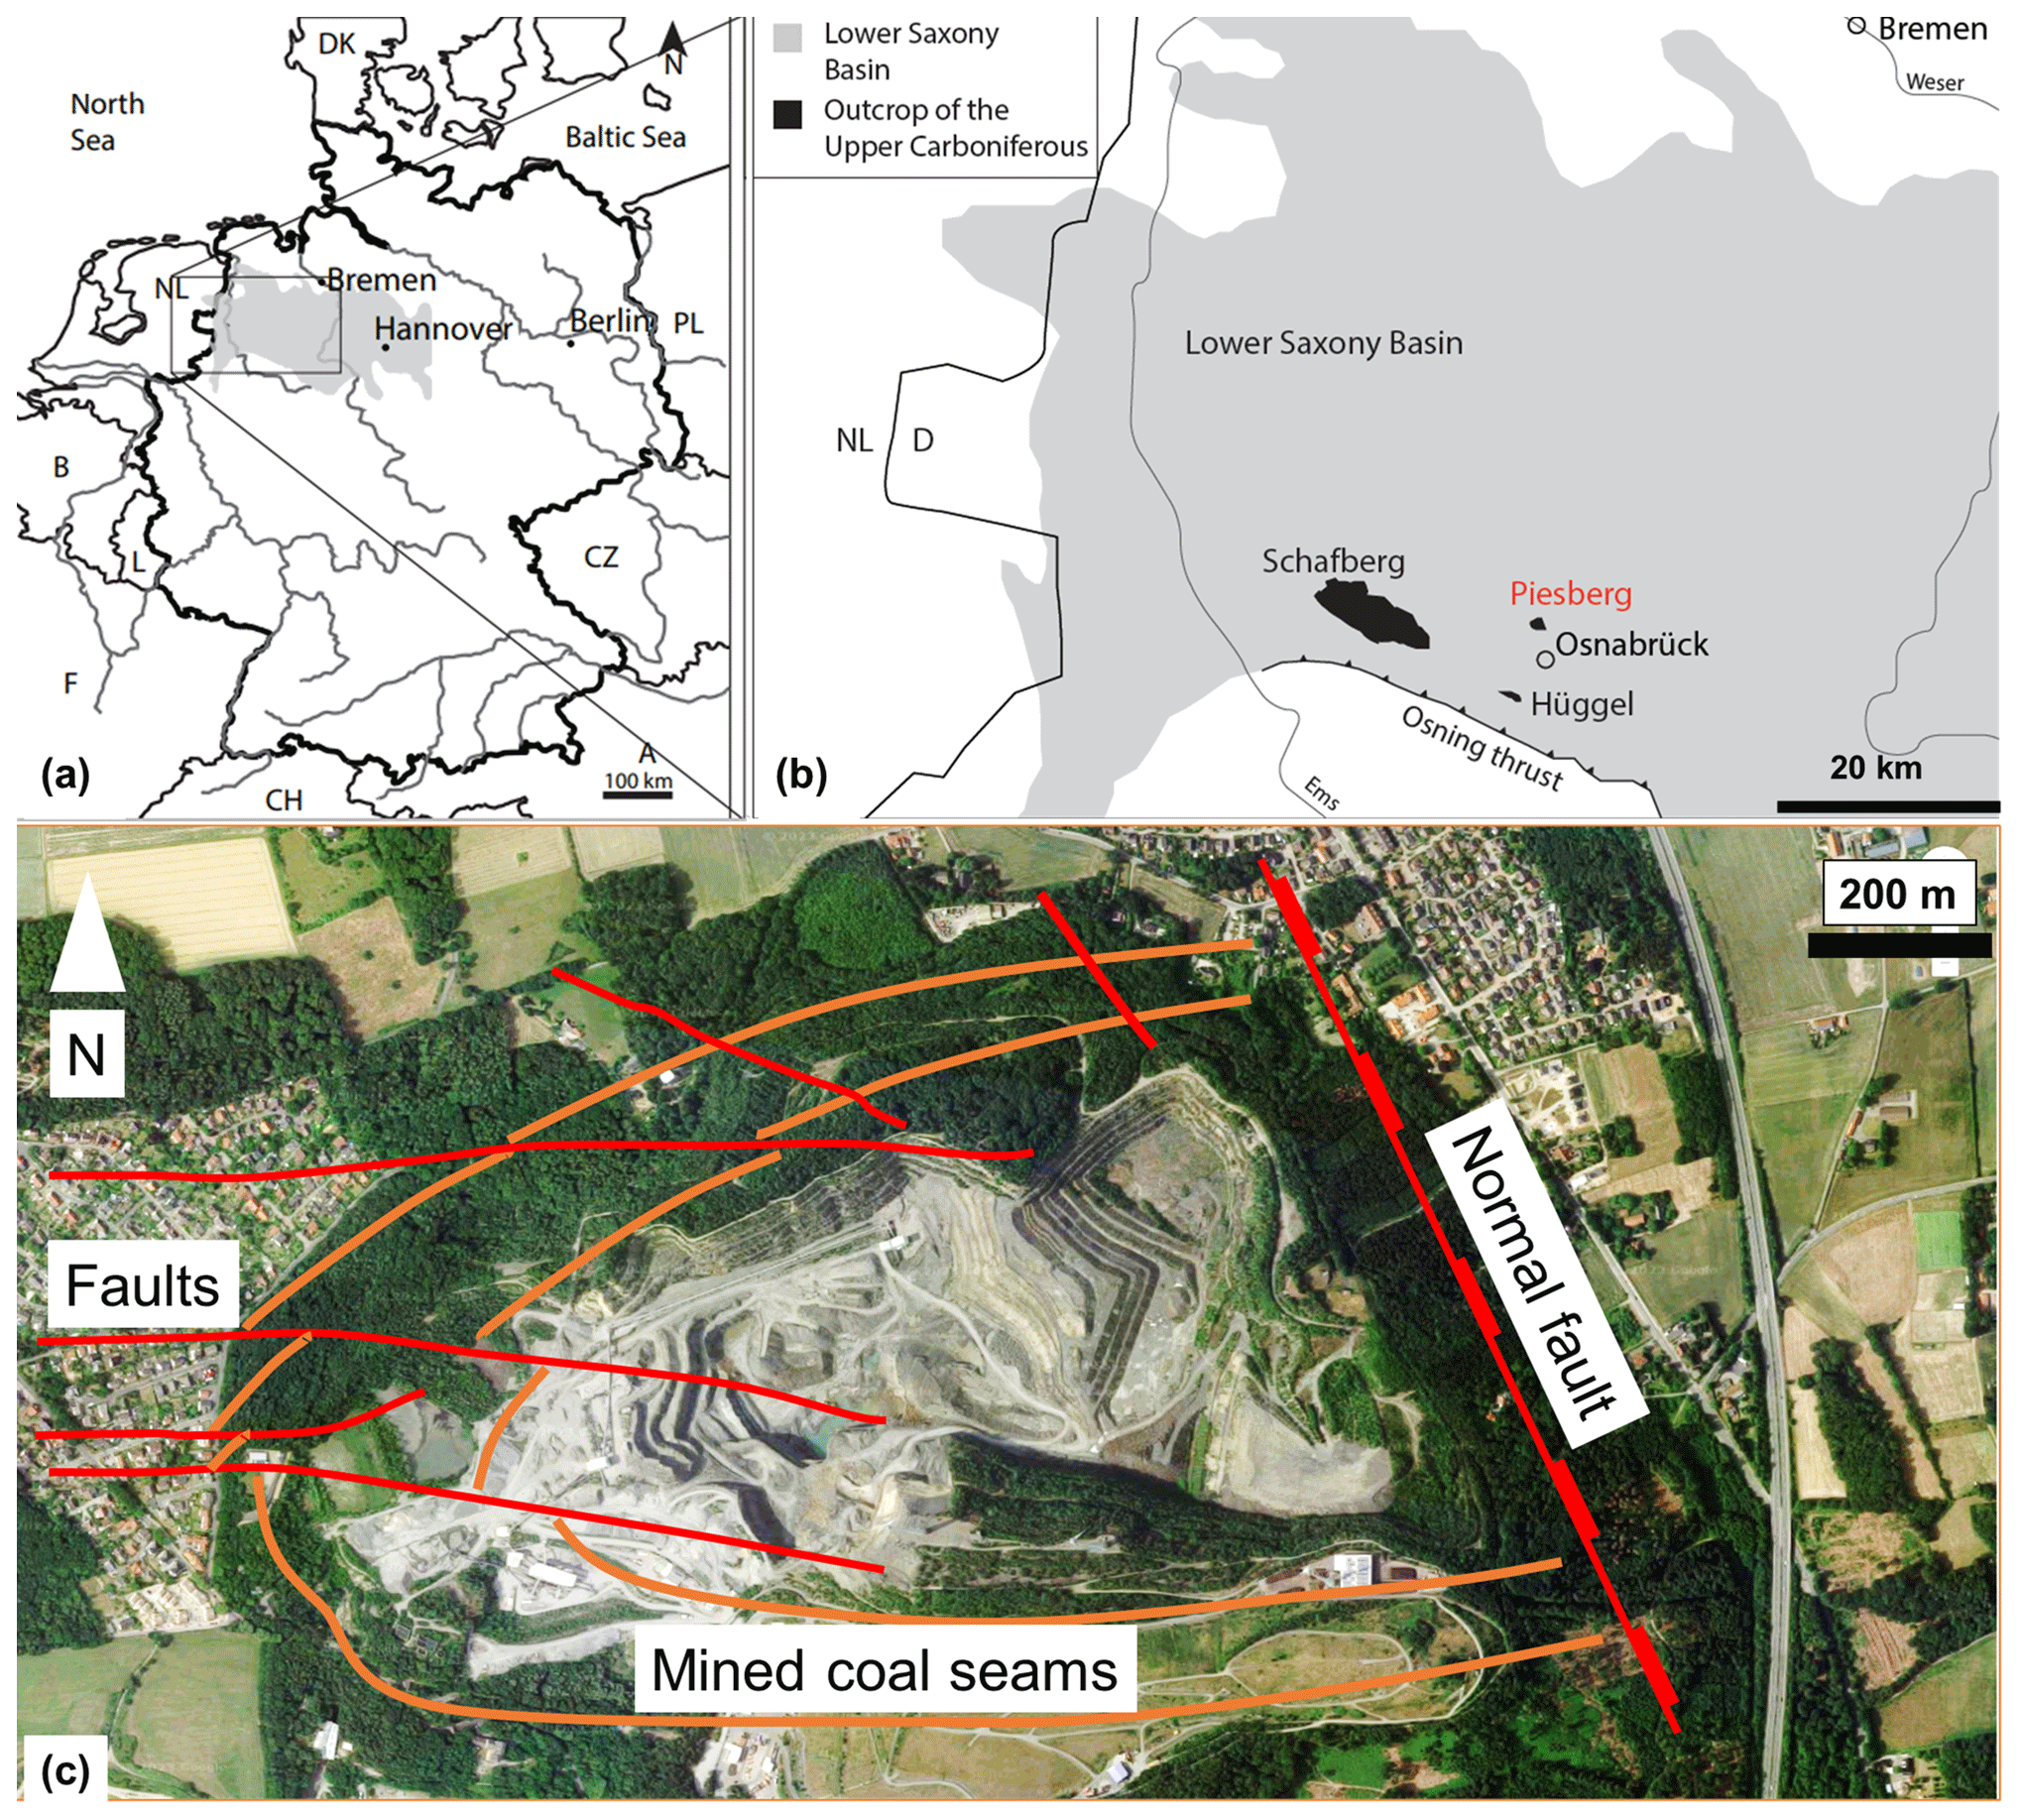
Figure 1(a) Location of the studied area in northwestern Germany. (b) Detailed location of the investigated Piesberg quarry at the southern rim of the LSB (redrawn from Senglaub et al., 2006 and Busch et al., 2019). (c) Aerial image of the Piesberg quarry (© Google Maps, 2023). The coal seams, faults, and the main normal fault in the east are based on historical subsurface mining data (Haarmann, 1909; Wüstefeld et al., 2017b).
Within the Piesberg quarry, two dominant fault systems can be distinguished (Fig. 1c). First, the NNW–SSE striking normal fault (at ∼ 170∘ strike angle) is represented in the east of the quarry (not exposed anymore), with a down-dip displacement of up to 600 m (Hinze, 1979; Baldschuhn et al., 2001). The second main strike orientation of the normal faults is W–E (at ∼ 95∘ strike angle) to WNW–ESE, with average fault displacements of 10 m (Wuestefeld et al., 2014; Wüstefeld et al., 2017a; Becker et al., 2019). The initial total thickness of Upper Carboniferous sandstones in the region was 1.5 km (David et al., 1990). During the burial, the thickness of the sandstones decreased to nearly 1 km in the Late Jurassic to Early Cretaceous periods. The sandstones are overlain by impermeable claystone and Zechstein cap rocks (Becker et al., 2019).
The geothermometry data from the outcrop samples in the Piesberg quarry show a high-temperature thermal overprint of about 270–300 ∘C at a depth of about 4.4 km around the significant NNW–SSE striking normal fault at about 160 Ma. The NNW–SSE striking normal fault may thus have acted as a conduit for the heat/fluid source of the thermal overprint. Wüstefeld et al. (2017b) concluded that the local thermal increase of approximately 90–120 ∘C was the result of hydrothermal fluids circulating along the fault damage zone of the NNW–SSE striking normal fault, which laterally heated the tight sandstones. Furthermore, it is noteworthy that the W–E striking faults within the tight sandstones may also affect fluid-flow and heat-transfer processes because of their higher permeability (i.e. 10−13 m2) and intersection with the NNW–SSE striking fault. Even though there are no field observations and evidence, LRF resulting from the topographical conditions are hypothesised to investigate the effect of topographical conditions on the transport mechanisms of hydrothermal convection. Considering the geological conditions, especially fault patterns and stratigraphy, the Piesberg quarry area might be an example of the coexistence of buoyancy-driven convective and lateral regional flows. Thermo–hydraulic numerical simulations are required to investigate and quantify the plausibility of different hypotheses of transport mechanisms that could contribute to the kilometre-scale thermal anomaly.
2.2 Numerical workflow
2.2.1 Governing equations
Inspired by the Piesberg quarry, an idealised and synthetic numerical analogue is created to characterise geological conditions in faulted tight sandstones and to enable investigation of the transport mechanisms leading to fluid flow and heat transfer. Only single-phase liquid flow is considered in this study. The numerical simulations for coupled fluid-flow and heat-transfer processes are carried out with a finite element open-source application called TIGER (THMC sImulator for GEoscience Research) (Gholami Korzani et al., 2019; Egert et al., 2020, 2021), which is based on the MOOSE (Multiphysics Object-Oriented Simulation Environment) framework (Permann et al., 2020). TIGER has been developed to tackle thermo–hydraulic–mechanical–chemical problems in petroleum and geothermal reservoirs. The numerical study of thermal convection in permeable and porous media involves coupling fluid-flow and heat-transfer equations as shown below (Gholami Korzani et al., 2020). The mass transport equation is written as
where the subscript m means porous media, Sm is the constrained specific storage of the porous media (Pa−1), p is the pore pressure (Pa), t is time (s), and q is the Darcy velocity in the porous media (m s−1). The Sm comprised a mechanical alteration in response to pressure and is assumed as a constant given by with porosity n (–), the bulk moduli of solid Ks and of liquid Kl (Pa) (Watanabe et al., 2017). The Darcy velocity is given as
where k is the permeability (m2), μ is the fluid dynamic fluid viscosity (Pa s), the superscript l means liquid phase, ρl is the fluid density (kg m−3) and g is the gravitational acceleration vector (m s−2).
The heat-transfer equation is written as
where the superscript s means solid phase, and are the specific heat capacity of the liquid and solid phases (J m−3 K−1), ρs is the solid density (kg m−3), T is the temperature (K), t is the time (s), λl and λs are the heat conductivity of the liquid and solid phases (W m−1 K−1), q is the Darcy velocity in the porous media (m s−1), and Q is the heat source (W m−3).
2.2.2 Numerical model
The numerical model represents the stratigraphic distributions of the Piesberg quarry region (belonging to the sandstone reservoir) at about 160 Ma. The model geometry extends 5 km along the W–E direction (i.e. x axis), 12 km along the N–S direction (i.e. y axis), and over a depth of 12 km (i.e. z axis). The NNW–SSE striking fault (“main fault” in Fig. 2a) has a damage zone width of 400 m based on damage zone scaling relations to the fault displacement (Shipton et al., 2006; Torabi and Berg, 2011), a length of 12 km and a height of 7 km (ranging from −11 to −4 km on the z axis (Schultz et al., 2006)). In addition, three W–E striking faults (“transfer faults”) with 10 m width (along y axis) and 100 m height (along z axis) are embedded in the sandstone (Fig. 2b). To the west of the main fault, the sandstone is located at 3.9–4.9 km depth; to the east of the main fault, it is located at 4.5–5.5 km depth due to the 600 m displacement of the main fault. Lithologies that have similar permeability and heat conductivity are merged into a single lithological unit. Basement layers mainly consist of shale, limestone and sandstone. The claystone and Zechstein are lumped into caprock at the top of the model. The model consists of 174 675 nodes connecting 827 610 tetrahedra, with mesh sizes of 1000 m for low permeability zones and mesh sizes of 100 m for high permeability zones. Preliminary mesh sensitivity analyses were performed to avoid any mesh dependency on the results.
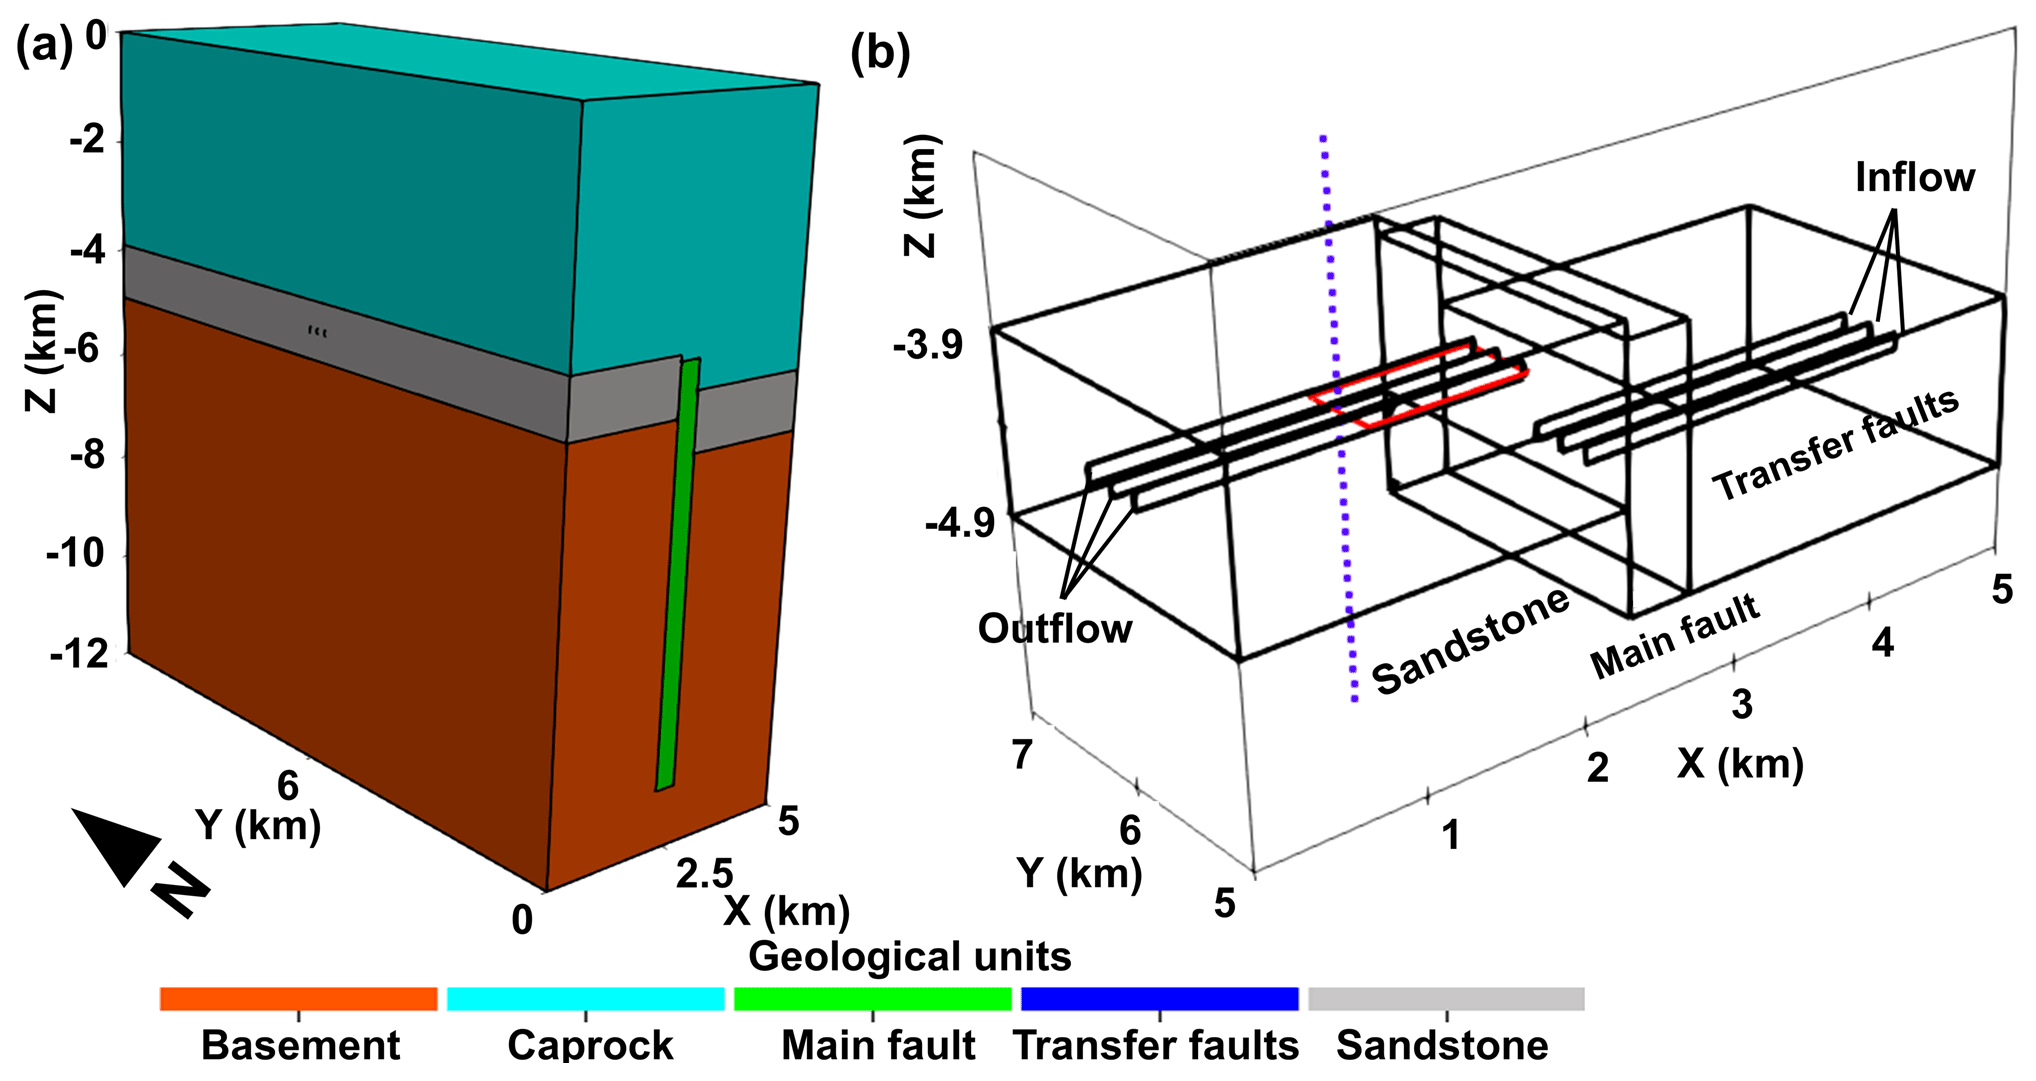
Figure 2Model geometry of the (a) total model and (b) zoomed part of the sandstone reservoir where the transfer faults are embedded. The red rectangle, which is perpendicular to the main fault, represents the outline of the Piesberg quarry. The dashed purple line shown in (b) is used to illustrate the extent of the temperature-depth profile.
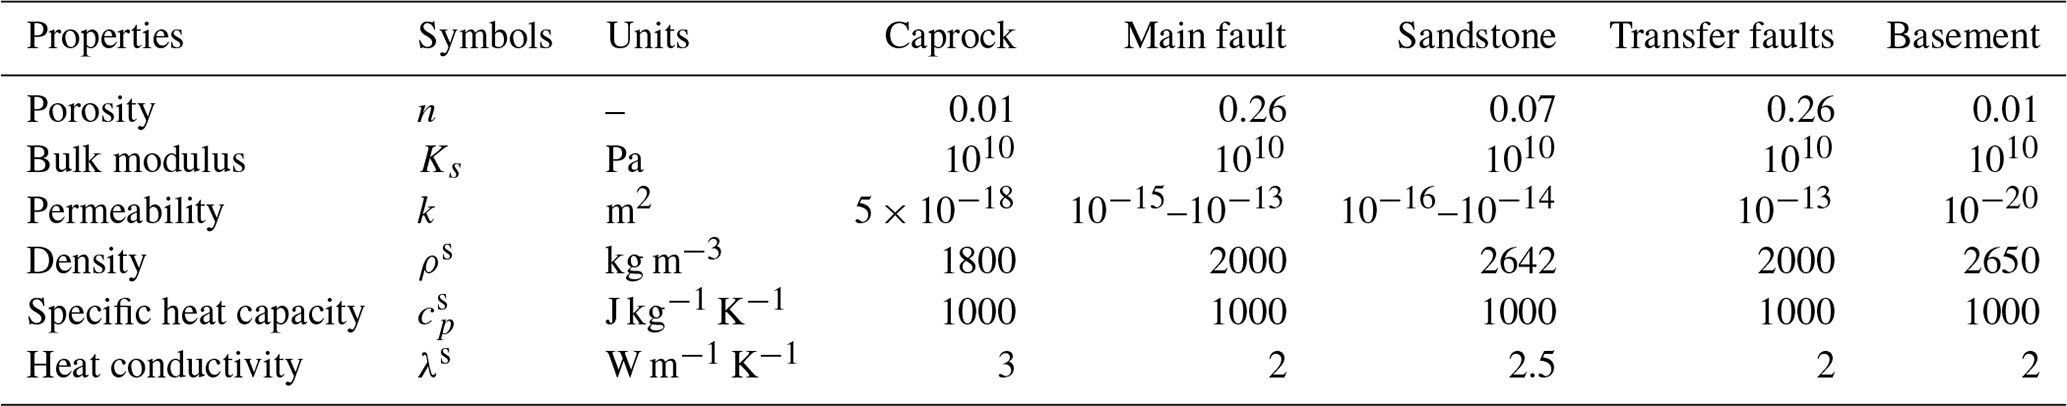
The physical properties of each lithological unit are summarised in Table 1. The main fault and sandstone permeabilities are abbreviated as κMF and κSST, respectively. The subscript MF means the main fault and the subscript SST denotes sandstone. The typical parameterisation of main fault permeability (κMF) and sandstone permeability (κSST) are 10−13 and 10−15 m2, respectively. The transfer fault permeability (κTF) is constant at 10−13 m2.
Table 1Parameters of the lithological units (Bruns et al., 2013; Wüstefeld et al., 2017a; Becker et al., 2019; Busch et al., 2019).
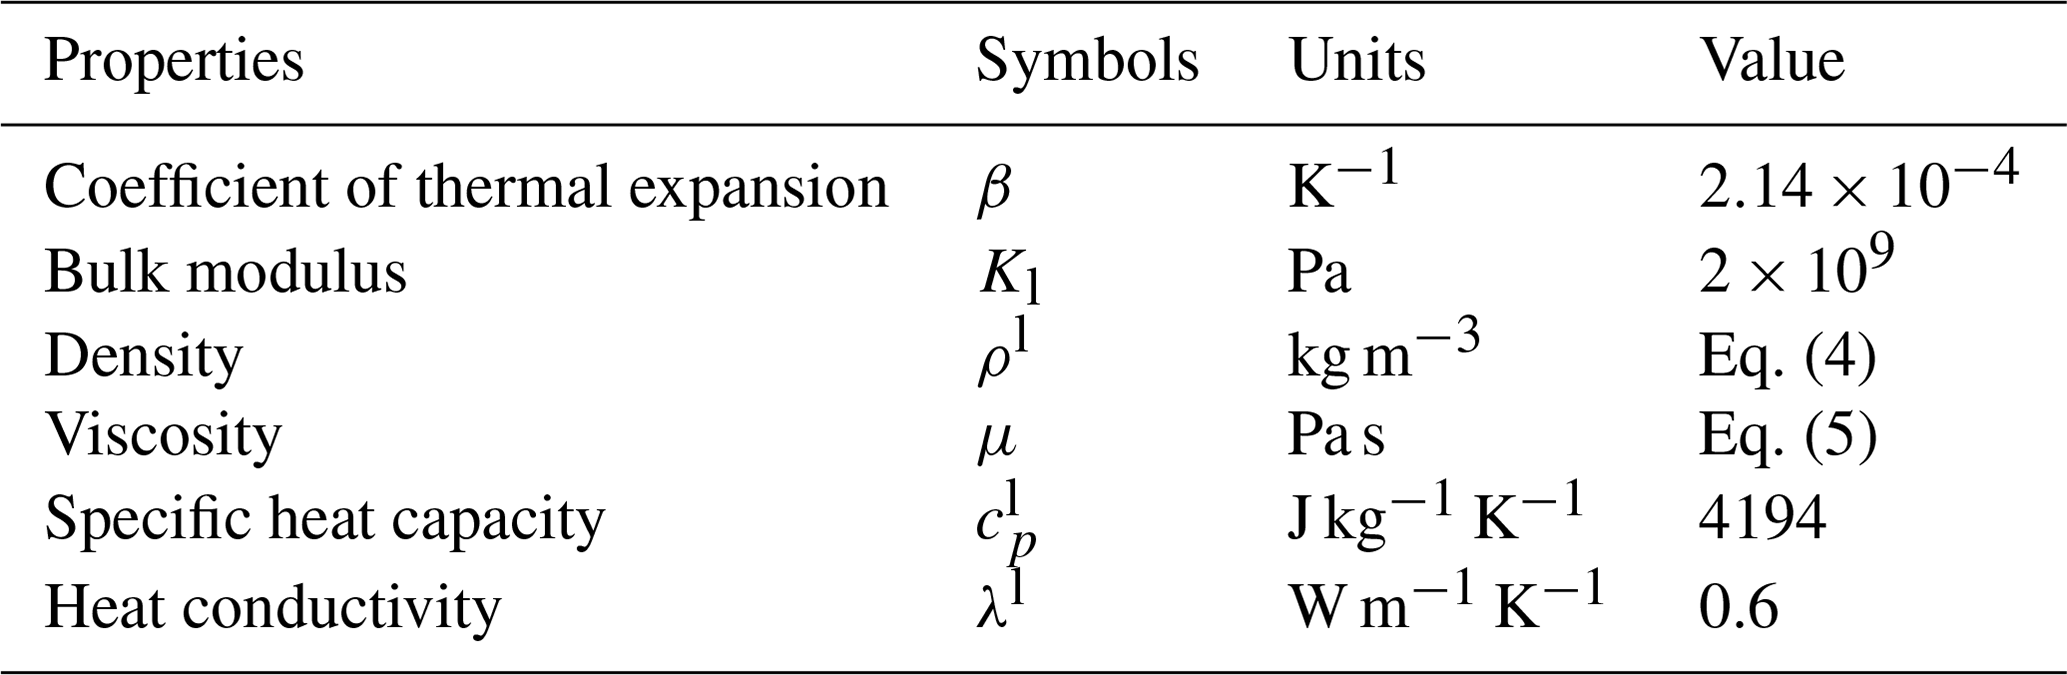
Fluid properties are summarised in Table 2. The fluid density is a temperature- and pore-pressure-dependent variable. The following polynomial function-fitting experimental data for pure water in the liquid phase are used to compute fluid density over temperature and pore-pressure ranges of 273.15–1273.15 K and 0–500 MPa (Linstrom and Mallard, 2001).
The dynamic viscosity of the fluid is temperature-dependent and follows the equation (Smith and Chapman, 1983):
Table 2Fluid properties (Smith and Chapman, 1983; Linstrom and Mallard, 2001; Watanabe et al., 2017).
The boundary and initial conditions are set as follows. An air surface pore pressure of 105 Pa is fixed at the top of the model as a Dirichlet boundary condition. The initial condition of the hydraulic field corresponds to a hydrostatic gradient. The lateral sides of the model are assigned to no-flow boundary conditions in terms of pore pressure and temperature. The temperature at the top of the model is fixed at 20 ∘C as a Dirichlet boundary condition. A basal heat flux (BHF) of 0.1 W m−2 represents the sum of the mantle heat flow and the heat emitted by the decay of radioactive elements in the crust (Wisian and Blackwell, 2004b), and is set at the bottom of the model as a Neumann boundary condition. The Global Heat Flow database (Lucazeau, 2019) showed two available surface heat flow data of 0.058 and 0.084 W m−2 near the Piesberg quarry. These data were measured at 60 km southwest and 42 km north of the Piesberg quarry, respectively. The preliminary tests reveal that a BHF of 0.1 W m−2 is close to the minimum requirement for reproducing the kilometre-scale thermal anomaly of 270–300 ∘C in the Piesberg quarry. A typical BHF threshold of 0.1 W m−2 for geothermal development is assumed here (e.g. Blackwell et al., 2007; Cloetingh et al., 2010; Erkan, 2015), even though there is no evidence for the high BHF of 0.1 W m−2 near the Piesberg quarry areas during the Late Jurassic to Early Cretaceous periods and at the current time. It must be noted that the magnitudes of these physical characteristics are not significant because the transport mechanism of hydrothermal convection is mostly controlled by permeability distributions of the main fault and sandstone, which can vary by many orders of magnitude. The initial condition of the thermal field is derived from the steady-state simulation of pure heat conduction to avoid the effects of initial temperature perturbation on mass transport and heat transfer. The solution of the initial condition of temperature in our model is shown as follows:
where Tinitial(z) is the initial temperature at z (m) position, Ttop is the imposed surface temperature (∘C) and QBHF is the imposed BHF (W m−2).
Under the coexistence of buoyancy-driven convection, lateral convection and LRF, Neumann boundary conditions are superimposed on the eastern (as “inflow zones”) and western (as “outflow zones”) boundaries of the transfer faults, respectively (Fig. 2b). The transient simulations are run up to 1 Myr, which allows the simulations to reach an approximate thermo–hydraulic equilibrium to compare the results of different transport mechanisms of hydrothermal convection.
2.3 Simulation cases
Based on the permeability distributions in the reservoir and LRF boundary conditions, the following simulations have been carried out to identify the different fluid-flow pathways (Fig. 3) and to understand how the reservoir parameterisation impacts fluid flow and heat transport. The Rayleigh number (Ra) is a dimensionless number to characterise the fluid's flow regime and is defined as the ratio of buoyancy and viscosity forces multiplied by the ratio of momentum and thermal diffusivities (e.g. Nield and Bejan, 2017):
where β is the coefficient of fluid thermal expansion (K−1), ΔT is the temperature variation (K) over the porous media height H (m). The initial temperature and pore pressure of the main fault range from 152.5 to 502.3 ∘C and 39.3 to 108 MPa over its 7 km height, respectively. Thus, according to Eq. (4), the density and viscosity of the fluid are 921.5 kg m−3 and Pa s at the lowest temperature and pore-pressure conditions leading to
for the lowest permeability (i.e. 10−15 m2) of the main fault in Fig. 2a. The Ra is proportional to the permeability of the porous media. Buoyancy-driven convection in the main fault (Fig. 3, dashed red ovals) is triggered when its Ra exceeds the critical Rayleigh number (Racrit). Furthermore, an analytical solution to calculate Racrit values for the case of a porous media with dynamic fluid viscosity are shown as follows (Malkovsky and Magri, 2016):
with half of the aspect ratio , where d is the thickness of the porous media. In this studied case (Fig. 2a), the half aspect ratio of the main fault leads to the for a temperature-dependent viscous fluid. This estimation suggests that the buoyancy-driven convection likely develops within the main fault even at the lowest permeability and temperature conditions. Furthermore, the presented model on the scale of faulted hydrothermal systems has been successfully validated against the results of the study conducted by Malkovsky and Magri (2016) and Guillou-Frottier et al. (2020) (shown in the Appendix). Lateral convection in the sandstone (Fig. 3, yellow arrows) can be enhanced if the pore-pressure difference between the sandstone and the main fault decreases (McKenna and Blackwell, 2004). Natural advective flow in the transfer faults (Fig. 3, blue vectors) becomes significant when the transfer fault is more permeable than the main fault. Apart from the natural advective flow, forced advection in the transfer faults (Fig. 3, green vectors) becomes significant if an LRF boundary condition is applied.
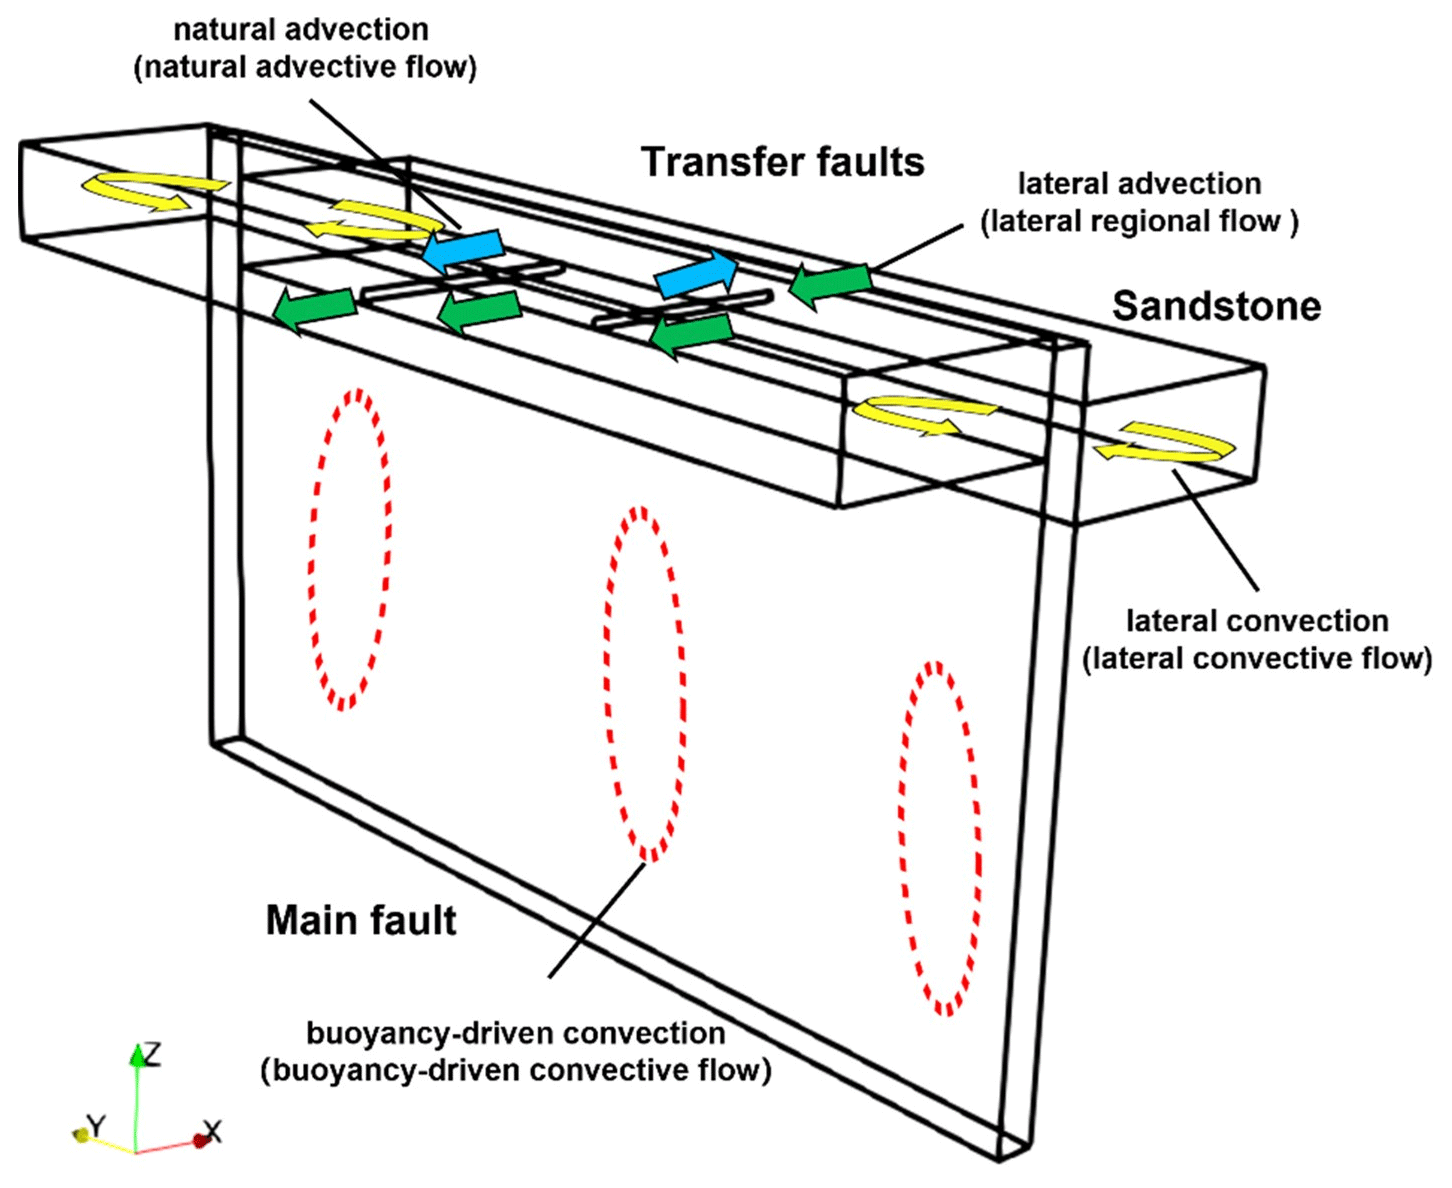
Figure 3Schematic representation of the modelled 3D main fault. Four different types of fluid-flow pathways involving the lithological units are illustrated. The 3D main fault accounts for the relative displacement (i.e. 600 m) of the surrounding lithological units. Only one transfer fault is shown on both sides of the main fault for simplicity.
Herein, a reference case with typical play-type parameterisation (Table 1) has been selected to demonstrate the general behaviour of fluid-flow pathways and heat-transfer types in the hydrothermal convection system. Then, a sensitivity analysis is conducted on the κMF (ranging from 10−15 to 10−13 m2) and κSST (between 10−16 and 10−14 m2) to identify their effects on the preferential fluid-flow pathways and dominant heat-transfer types. Then, these permeability cases described above are superimposed by three representative LRFs. The LRFs range from 10−8 to m s−1 (LRFmax). Besides the preferential fluid-flow pathways and heat-transfer types, the mutual interactions between the LRF and convective/advective flows are studied.
Furthermore, the effects of anisotropic and depth-dependent permeabilities on the transport mechanism are discussed. Many researchers show that the degree of permeability heterogeneity greatly varies even within the metre scale of the lithological unit (Ingebritsen and Manning, 1999; Saar and Manga, 2004). However, our discussion only focuses on the effects of the anisotropic and depth-dependent permeabilities of the main fault on the transport mechanisms. This is because the variation in lithostatic stress and sandstone properties is smaller than that of the main fault and the low value of median κSST (i.e. 10−15 m2). Farrell et al. (2014) showed that the degree of anisotropy (i.e. horizontal permeability (κMF_vertical)/vertical permeability (κMF_horizontal)) of the fault ranges from 1 to 3 orders of magnitude. Thus, the κMF_horizontal is set at 1–3 orders of magnitudes (i.e. 10−16–10−14 m2) lower than κMF_vertical (i.e. 10−13 m2), in which the anisotropic κMF is investigated. Influenced by the in situ lithostatic pressure distribution in the LSB (Manning and Ingebritsen, 1999; Saar and Manga, 2004), the κMF is exponentially decreased by 1–3 orders of magnitudes from its top locations (i.e. 10−13 m2 at km location) to its bottom locations (i.e. 10−16–10−14 m2 at km location). The above anisotropic and depth-dependent variations lie in the inferred ranges by Kuang and Jiao (2014) and Achtziger-Zupanèiè et al. (2017a).
In this study, the thermal anomaly is defined by the computed temperature minus the initial temperature distribution conditions. The maximum temperature at the western boundary of the Piesberg quarry (Tmax) is employed to compare with the geothermometer data. The temperature-depth profile following the western boundary of the Piesberg quarry (Fig. 2b) and the Peclet number of the lithological units are used to reveal the temperature distribution with depth and to identify the dominant heat-transfer types, respectively. The Peclet number is calculated as the ratio of the heat flow rate by convection to the heat flow rate by conduction for a uniform temperature gradient (Jobmann and Clauser, 1994) as follows:
where Pe is the Peclet number (–) and L is the length scale of the fluid flow (m). The Peclet numbers are not uniform across lithological units, therefore the statistically median value of the Peclet numbers rather than the Peclet number at a specific location (e.g. geometric center) is used to assess the general heat-transfer types within the lithological units. The statistically median Peclet number of the main fault, transfer faults and sandstone are abbreviated to Pe_MF, Pe_TF and Pe_SST, respectively.
3.1 Reference case
A reference case is developed to demonstrate the general behaviour of fluid-flow pathways and heat-transfer types in the hydrothermal convection system, as shown in Fig. 4. In the initial state (t=0 s), the temperature and its gradient increase with depth depending on the thermal conductivities of deep lithological units (black line in Fig. 4a). At 1 Myr, the buoyancy-driven convection in the main fault with Pe_MF=9.0 results in 13 convective cells which consist of 7 downflows and upflows in each at the maximum Darcy velocity of m s−1 (Fig. 4b). The buoyancy-driven convection is triggered by fluid-density variations resulting from the temperature difference. The mentioned upward and downward flows of fluids generate six full and one-half thermal plumes, as shown in Fig. 4c. The convective flow transports heat upwards inside the main fault. Thus, compared to the initial temperature distribution (black line in Fig. 4a), the buoyancy-driven convection results in positive thermal anomalies ranging between 0 and 86 ∘C in the shallow part of the main fault (i.e. to −4 km locations in Fig. 4d).
Initiated by the same permeability of the main fault and transfer faults (i.e. 10−13 m2), the lateral convection in the transfer faults with Pe_TF=0.5 includes fluid recharge and discharge processes at the maximum Darcy velocity of m s−1 as shown in Fig. 4b. The heated fluid recharges from the main fault into the shallow part of the transfer faults (i.e. to −4.35 km locations) and discharges from the deep part of the transfer faults (i.e. to −4.4 km locations) into the main fault, respectively. However, the temperature-depth profile of the reference case (i.e. the red line in Fig. 4a) shows that the lateral convection has a negligible effect on increasing the temperature in the transfer faults because of the narrow (i.e. width 10 m) and thin (i.e. thickness 100 m) geometry conditions of the transfer faults and the low permeability of the surrounding sandstone (i.e. 10−15 m2).
Figure 4b shows that the reference case yields weak fluid flow with Darcy velocity m s−1 in the sandstone, caprock and basement units (“off-faults domains”) owing to their relatively low permeabilities (i.e. m2). The temperature distribution in the off-fault domains (e.g. Pe<0.1) is mainly dominated by heat conduction, as shown in Fig. 4a and c. Influenced by the thermal anomalies inside the main fault, heat conduction leads to upward-convex isotherms in the units located near the shallow region of the main fault (i.e. to −4 km locations in Fig. 4c). However, heat conduction causes downward-convex isotherms in the units located near the deep region of the main fault (i.e. to −7.5 km locations in Fig. 4c). The resulting upward- and downward-convex isotherms agree with an increase and decrease in temperature above and below 7 km depth (red line in Fig. 4a) compared to the initial temperature profile (black line in Fig. 4a), respectively. Additionally, impacted by the convective mass flow, a pore-pressure perturbation ( MPa) around the main fault extends ∼ 0.3 km in the sandstone and transfer faults at a depth of 4.4 km.
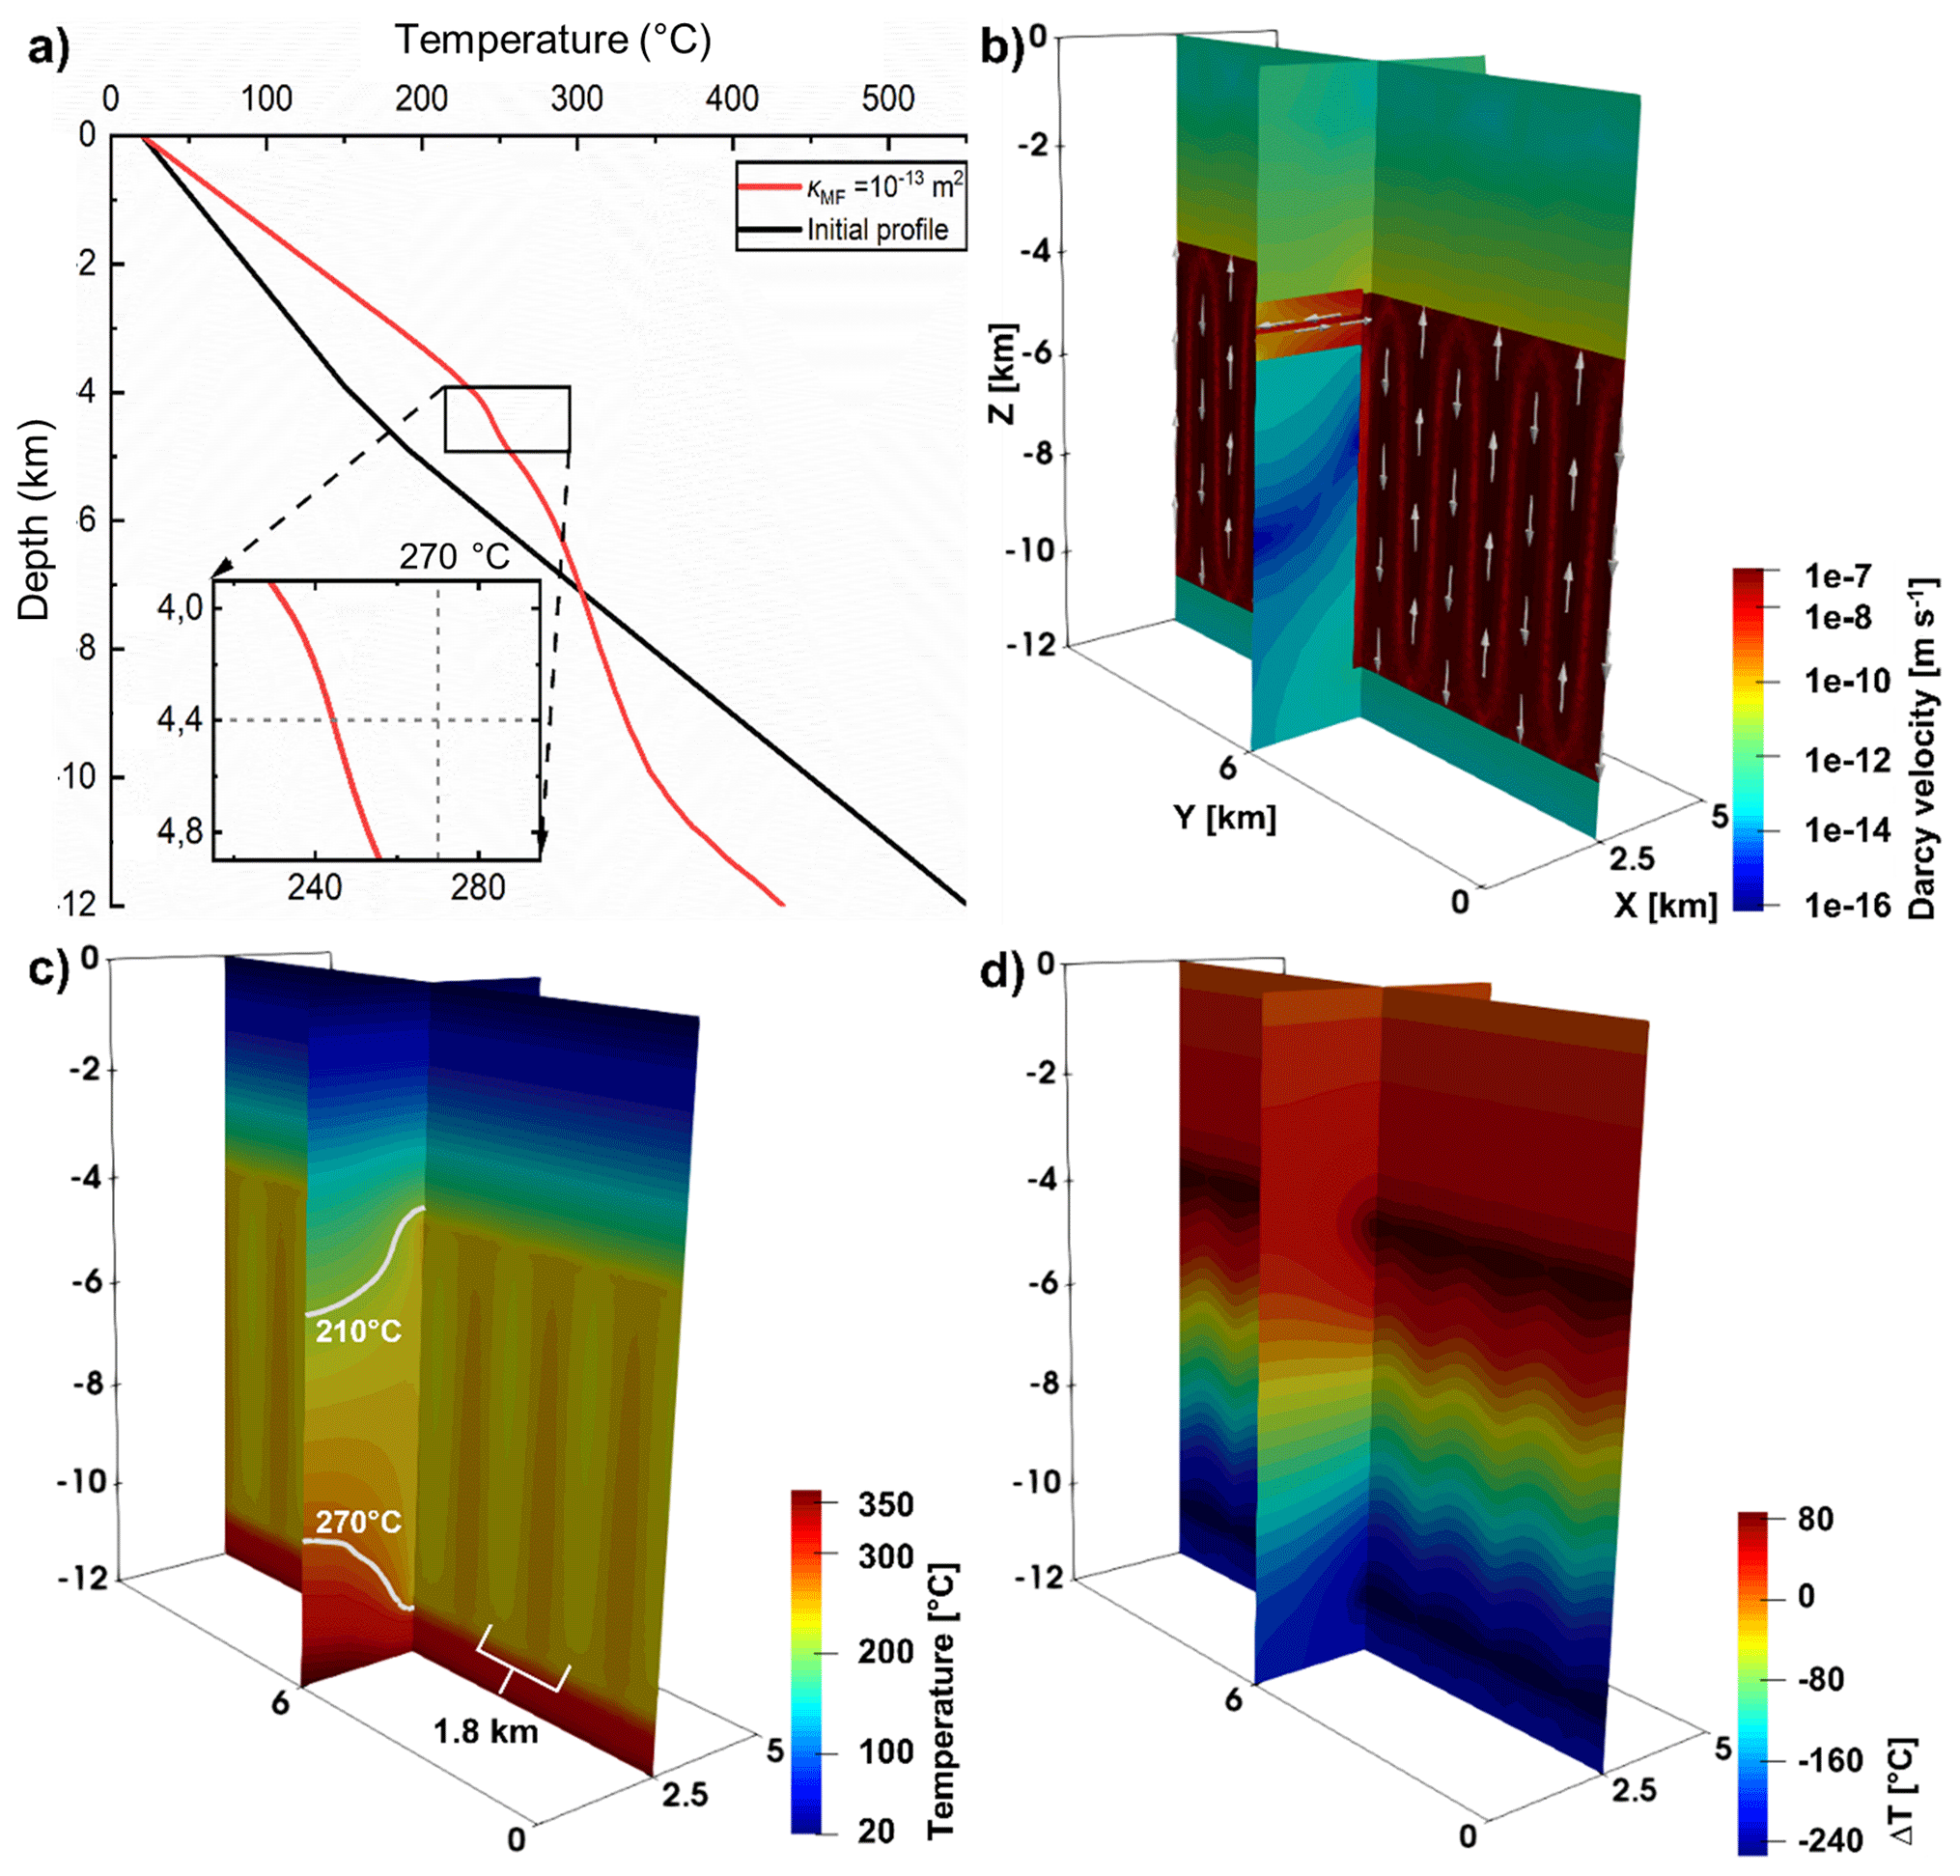
Figure 4Fluid-flow and temperature fields of the reference case. (a) Temperature-depth profiles that follow the western boundary of the Piesberg quarry (Fig. 2b) at the initial time and when Tmax is reached, respectively. At 1 Myr, cross-sectional views of the (b) flow field with arrows representing the preferential fluid-flow pathways and (c) resulting temperature distributions. The 210 and 270 ∘C isotherms are highlighted to indicate the dominant heat-transfer types and (d) temperature differences compared to the initial conductive temperature distribution.
3.2 Effects of permeability distributions
3.2.1 Main fault
We evaluate how the κMF variations affect the fluid-flow pathways and heat-transfer types in the hydrothermal convection system. Their differences compared to the reference case are described as follows. The m2 case results in eight buoyancy-convection cells in the main fault with Pe_MF=2.6 and 3 times lower maximum Darcy velocity of the convective flow than in the reference case with m2. In addition to the above differences, the m2 case has a similar focused flow in the faults and conduction-dominated heat transfer in the sandstone to the reference case. Results of fluid-flow, temperature and pore-pressure changes at 1 Myr are illustrated in Fig. 5. for the m2 case. In Fig. 5a, it is observed that the m2 case leads to two buoyancy-driven convection cells in the main fault with Pe_MF=0.7 and 8 times lower maximum Darcy velocity of the convective flow than in the reference case. Figure 5b and c show that the temperature increases in the centre of the main fault ( km), associated with the upward flow of fluid, and decreases along the main fault's lateral sides ( and 12 km).
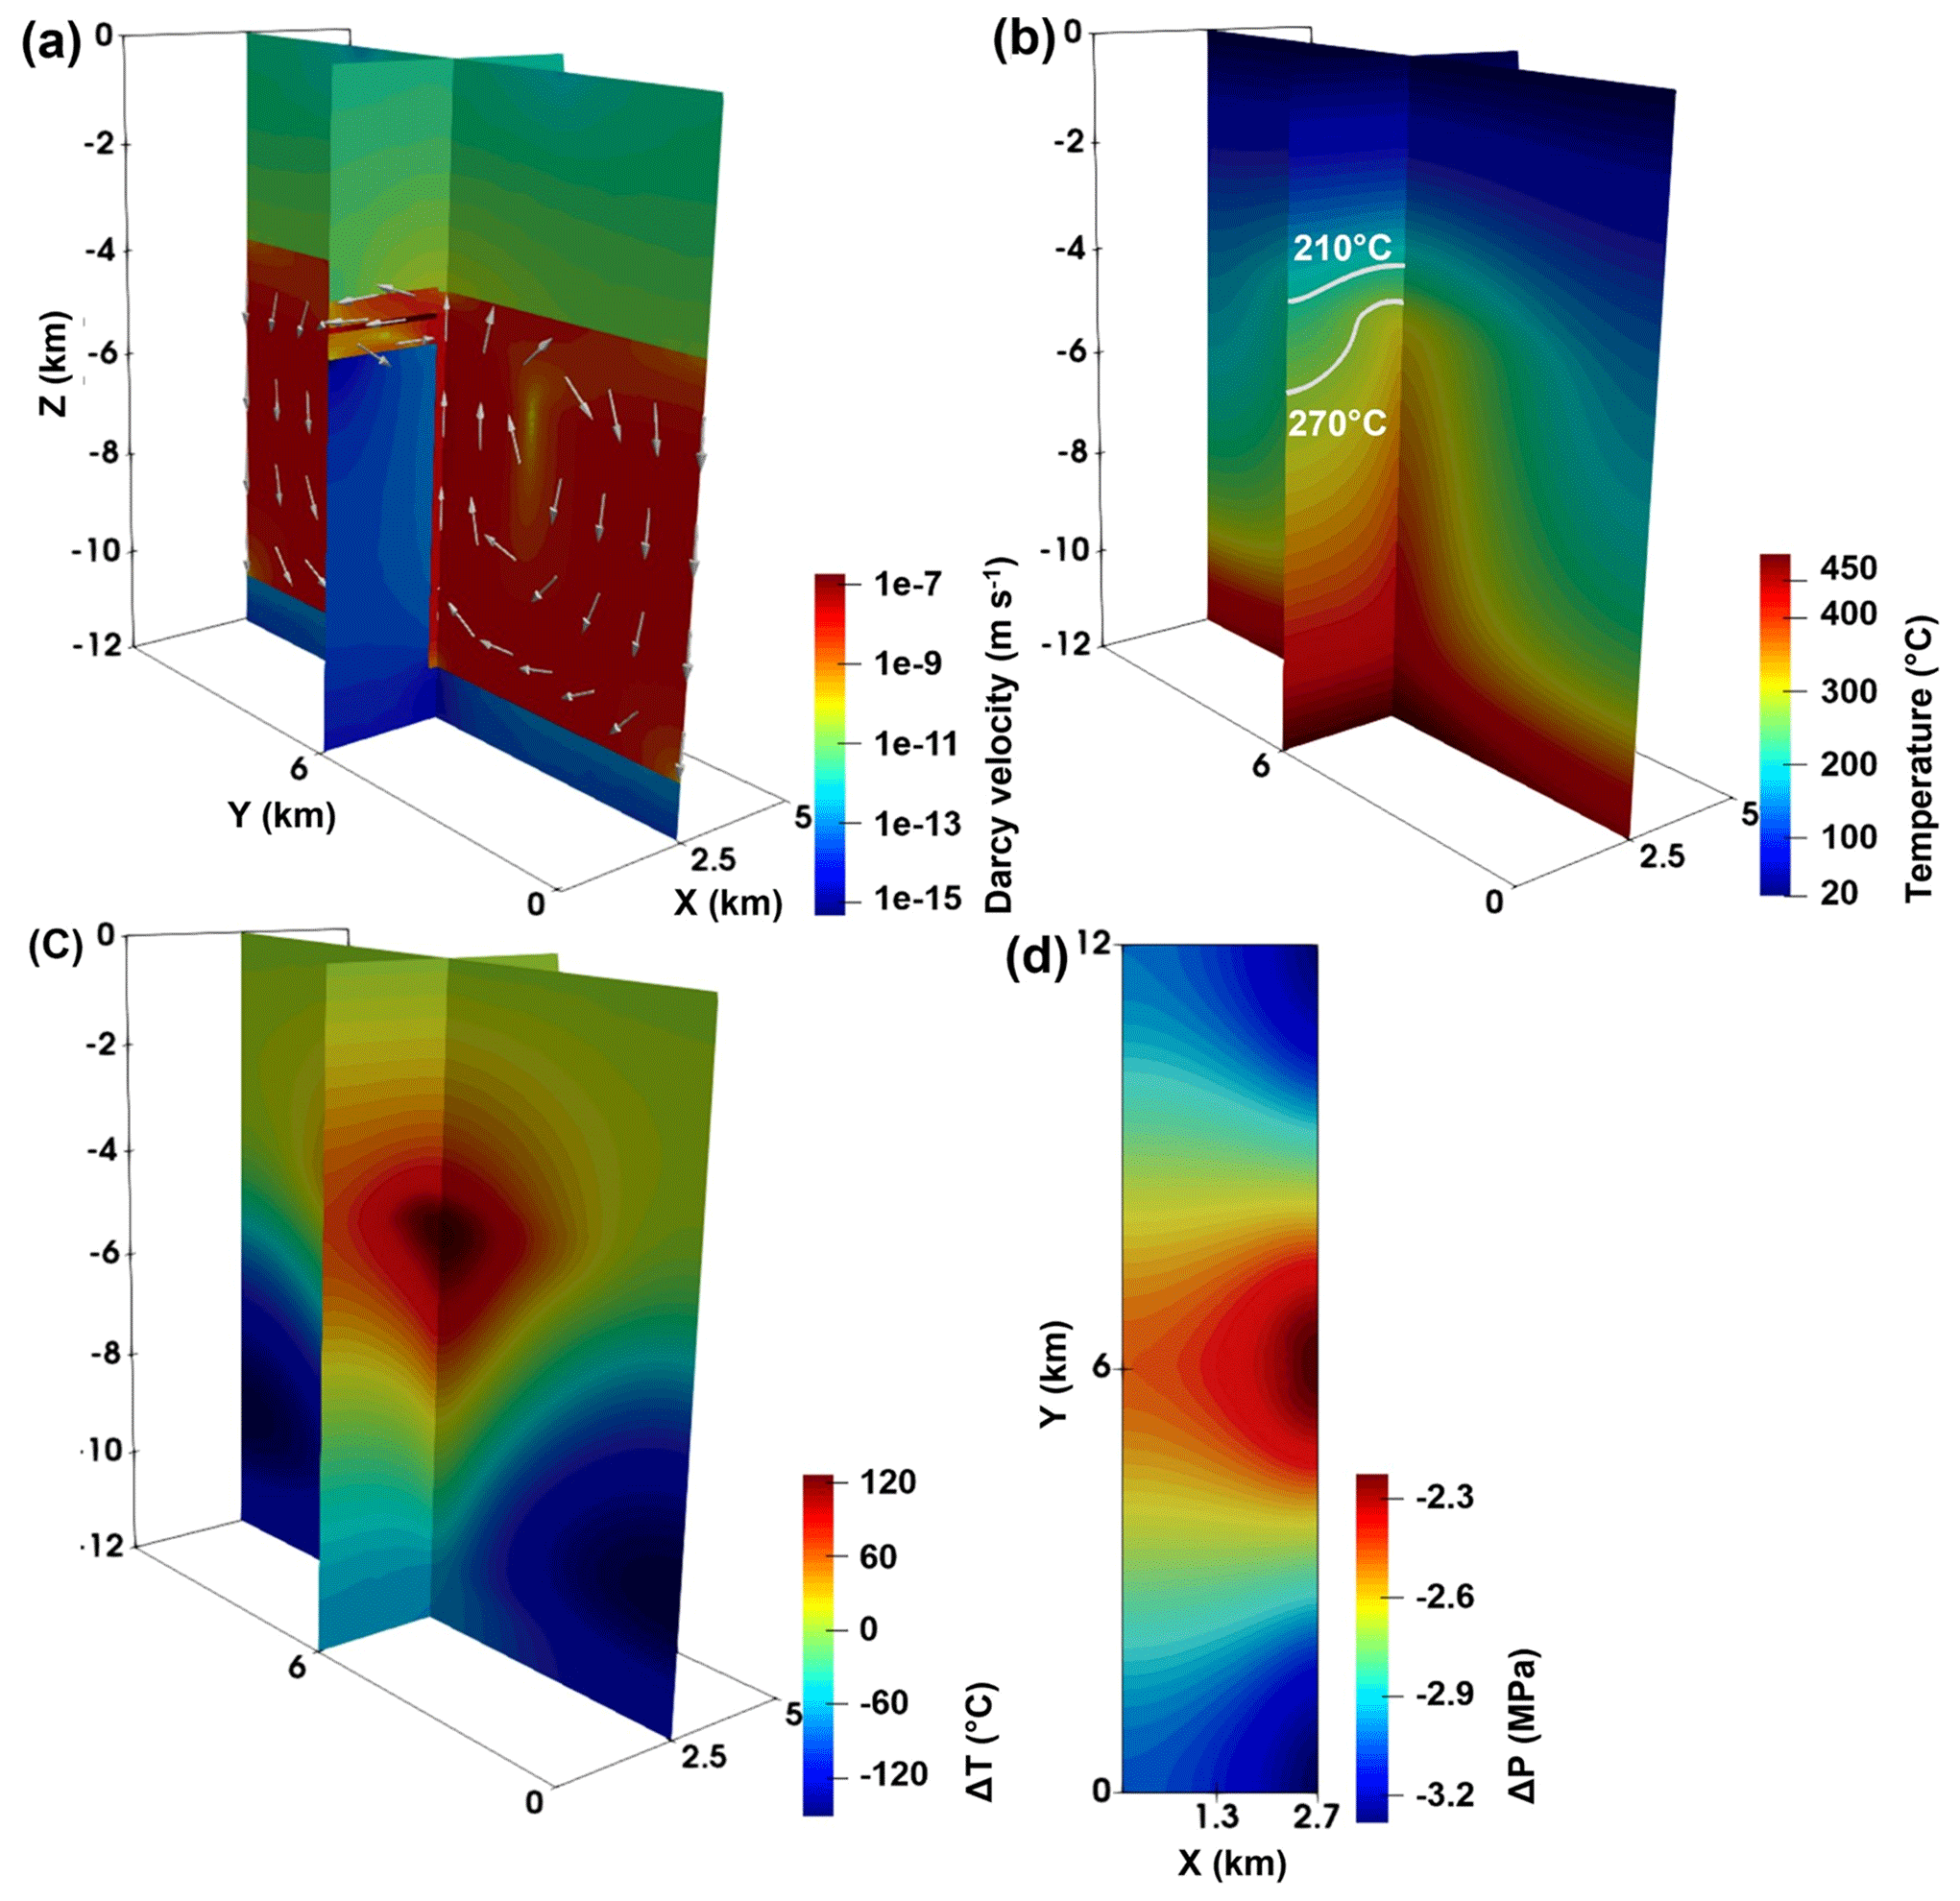
Figure 5Fluid-flow, temperature and pore-pressure change fields of the m2 case at 1 Myr. Cross-sectional view of the (a) flow field with arrows representing the preferential fluid-flow pathways and (b) resulting temperature field. The 210 and 270 ∘C are highlighted to indicate the dominant heat-transfer types. Panel (c) shows the temperature differences compared to the initial conductive temperature distribution. Panel (d) represents the top view of the pore-pressure change compared to the initial hydrostatic pore pressure (43.3 MPa) in the western sandstone, transfer faults and main fault at a depth of 4.4 km. The 1.3 and 2.7 km along the x axis follow the western boundary of the Piesberg quarry and the eastern boundary of the main fault, respectively.
From Fig. 5a, it is observed that the lateral convection can be enhanced in the sandstone, especially in the part (i.e. Pe_SST≥0.9) near the main fault, by the equal κMF and κSST (i.e. 10−15 m2). The lateral convection consists of fluid recharge and discharge processes at a maximum Darcy velocity of 10−8 m s−1, slightly lower than the buoyancy-driven convection. The heated fluid recharges from the central part of the main fault into the sandstone and discharges from the sandstone into the main fault's margins, respectively. Furthermore, caused by the large permeability contrast between the transfer faults and the main fault (i.e. ), the natural advective flow in the transfer faults with Pe_TF=3.9 propagates towards the lateral boundaries of the model as shown in Fig. 5a. The maximum Darcy velocity of the natural advective flow reaches m s−1, which is 1 order higher than the buoyancy-driven convection. Figure 5b and c demonstrate that, compared to the reference case, the increased mass flow involved in the lateral convection and natural advection effectively causes elevated temperatures in the sandstone and transfer faults near the centre of the main fault. Affected by the increased mass flow, the convective/advective flow processes in the main fault, sandstone and transfer faults result in a larger ( MPa) and more extensive (0–5 km) pore-pressure perturbation than in the reference case as shown in Fig. 5d.
In the following discussion, we study how κMF variations affect the dominant heat-transfer types and temperature distribution with depth. With the κMF decreased from 10−13 to 10−15 m2, the number of convection cells is reduced from 13 to 2, and the maximum Darcy velocity of the buoyancy-driven convective flow is decreased from to m s−1 (Figs. 4b and 5b). These variations show that the intensity of the buoyancy-driven convection within the main fault becomes relatively weak and correspondingly, the Pe_MF is also decreased from 9.0 to 0.7 as shown in Fig. 6. Thus, the upward energy transfer by the buoyancy-driven convection within the main fault is reduced. Conversely, the energy stored at the bottom of the model increases as the κMF is decreased. This is illustrated by the increase in bottom temperature from 432 to 519 ∘C, as shown in Fig. 7.

Figure 6Effects of the main fault permeability (κMF) on the Pe (median Peclet numbers) of the main fault (MF), transfer faults (TF) and sandstone (SST).
Figure 6 shows that for the m2 case, fluid flow is mainly confined in the faults and the heat transfer is dominated by conduction in the sandstone with Pe_SST<0.1, in agreement with the reference case. Thus, the energy conducted from the main fault and basement into the sandstone is decreased when the κMF is reduced from 10−13 to 10−14 m2. This is evidenced by the decrease in Tmax from 244 to 239 ∘C as shown by their temperature-depth profiles (i.e. the red and blue lines in Fig. 7). The m2 case (i.e. the green line in Fig. 7) results in temperature in the range of to −3.5 km which is higher than the other two cases. This is due to the larger depth extent (i.e. to −4 km locations) and maximum magnitude (i.e. 130 ∘C) of the positive thermal anomaly (Fig. 4d) near the central part of the main fault compared to the reference case (Fig. 5c). Furthermore, in the case with m2, the upward energy transfer within the main fault is less than that in the other two cases (i.e. cases with and 10−14 m2). However, the enhanced lateral convection and natural advection efficiently increase the fluid and heat flows from the main fault to the sandstone (with Pe_SST=0.13) and transfer faults (with Pe_TF=3.9), higher than the conduction-dominated heat transfer. Consequently, the temperature increases significantly in the sandstone range of to −3.9 km as shown by its temperature-depth profile (blue line in Fig. 7), unlike in the other two cases. The result of m2 is a higher Tmax of 285 ∘C (green line in Fig. 7), which is 41 ∘C higher than the reference case.
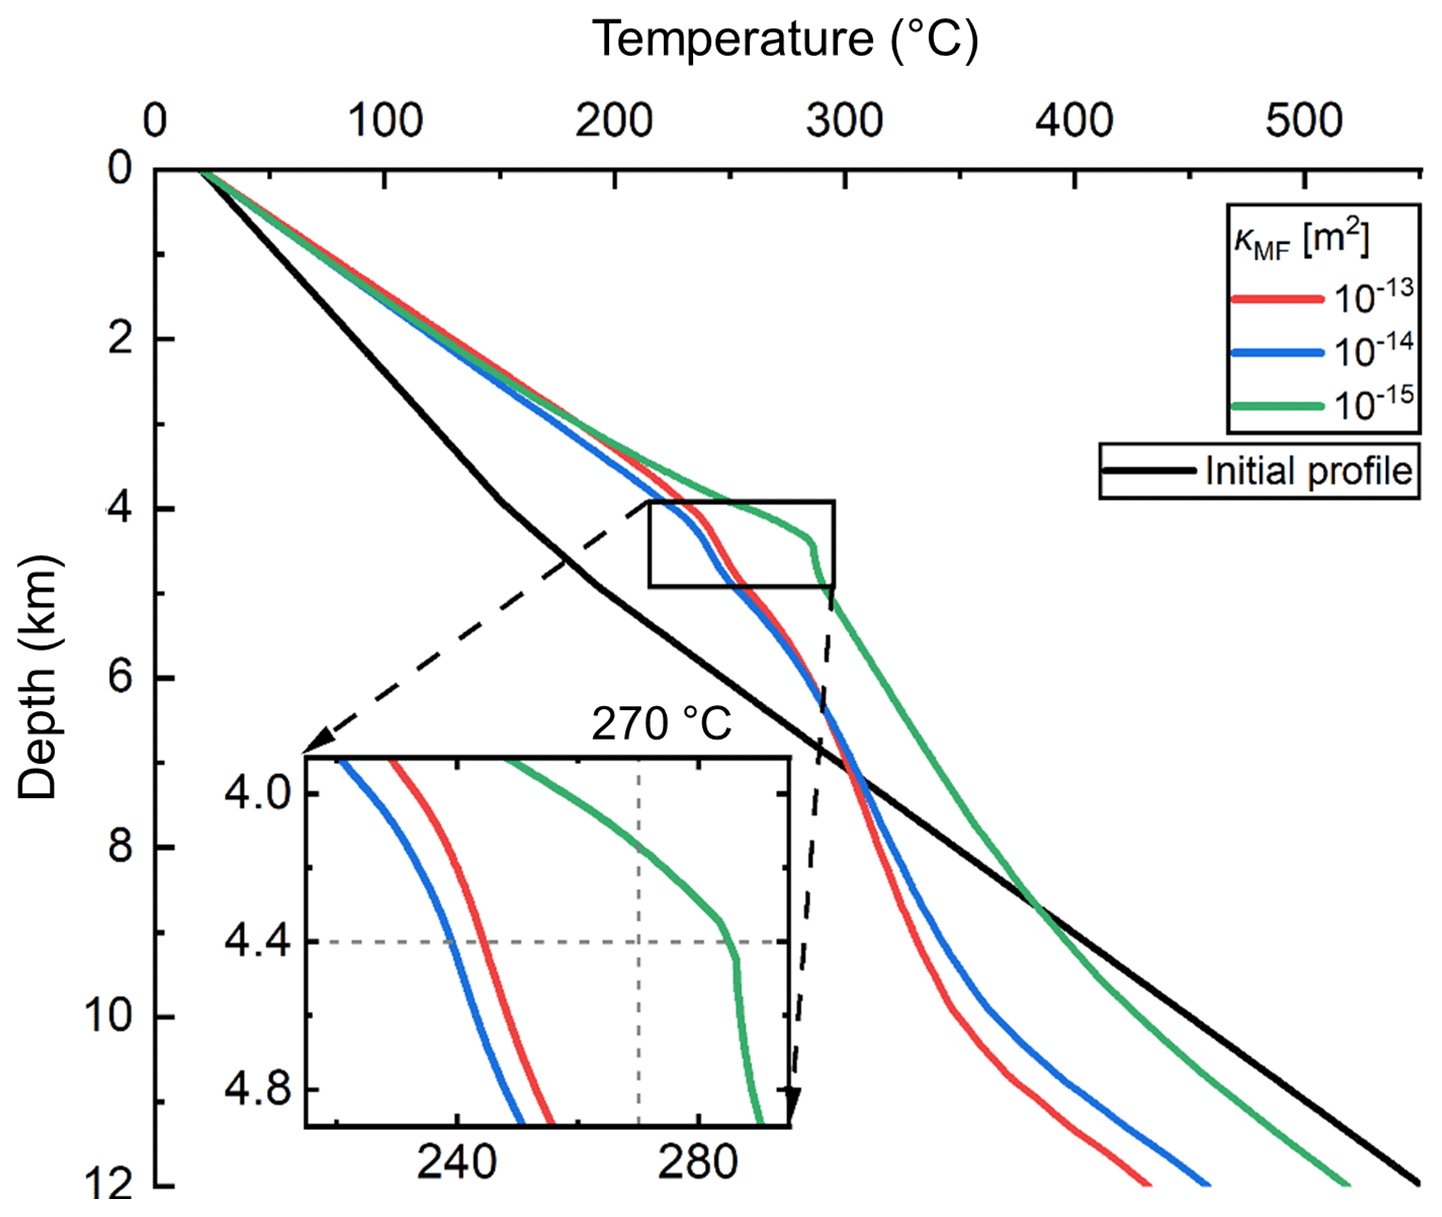
Figure 7Effects of the main fault permeability (κMF) on the temperature-depth profiles. The m2 case represents the reference case.
3.2.2 Sandstone
We investigate the effects of the κSST variations on the transport mechanisms of the hydrothermal convection system. The m2 case results in 11 buoyancy-convection cells in the main fault with Pe_MF=9.1 and a similar maximum Darcy velocity of the convective flow to the reference case with m2. It has a similar concentrated flow in the faults and conduction-dominated heat transfer in the sandstone to the reference case. Results of fluid-flow, temperature, and pore-pressure change at 1 Myr are shown in Fig. 8 for the m2 case. Focusing on Fig. 8b, it is observed that the m2 case leads to 14 convective cells in the main fault with Pe_MF=8.3 and similar maximum Darcy velocity of the convective flow to the reference case due to their nearly same Pe_MF (Fig. 9).
Initiated by the high κMF and κTF, the lateral convection in the sandstone (i.e. Pe_SST=0.5) and transfer faults (i.e. Pe_TF=1.0) is limited and consists of fluid recharge and discharge processes as shown in Fig. 8a. The heated fluid recharges from the main fault into the shallow part (i.e. to −3.9 km locations) of the sandstone and transfer faults and discharges from the deep part (i.e. to −4.4 km locations) of the sandstone and transfer faults into the main fault, respectively. The maximum Darcy velocity of the recharge and discharge processes reaches m s−1, which is 10 times higher than in the reference case (Fig. 8a). Figure 8b and c show that the increased mass flow involved in the lateral convection raises the temperature in the sandstone and transfer faults compared to the reference case. The isotherms of mixed concave–convex shapes in the sandstone range demonstrate that the lateral convection results in a higher temperature rise in the shallow part than the deep part of the sandstone and transfer faults. This is due to the energy and fluid losses in the discharge process. From Fig. 8d, it is observed that the lateral convection causes larger ( MPa) and more extensive (∼ 1.8 km) pore-pressure disturbances in the sandstone and transfer faults at a depth of 4.4 km than in the reference case.
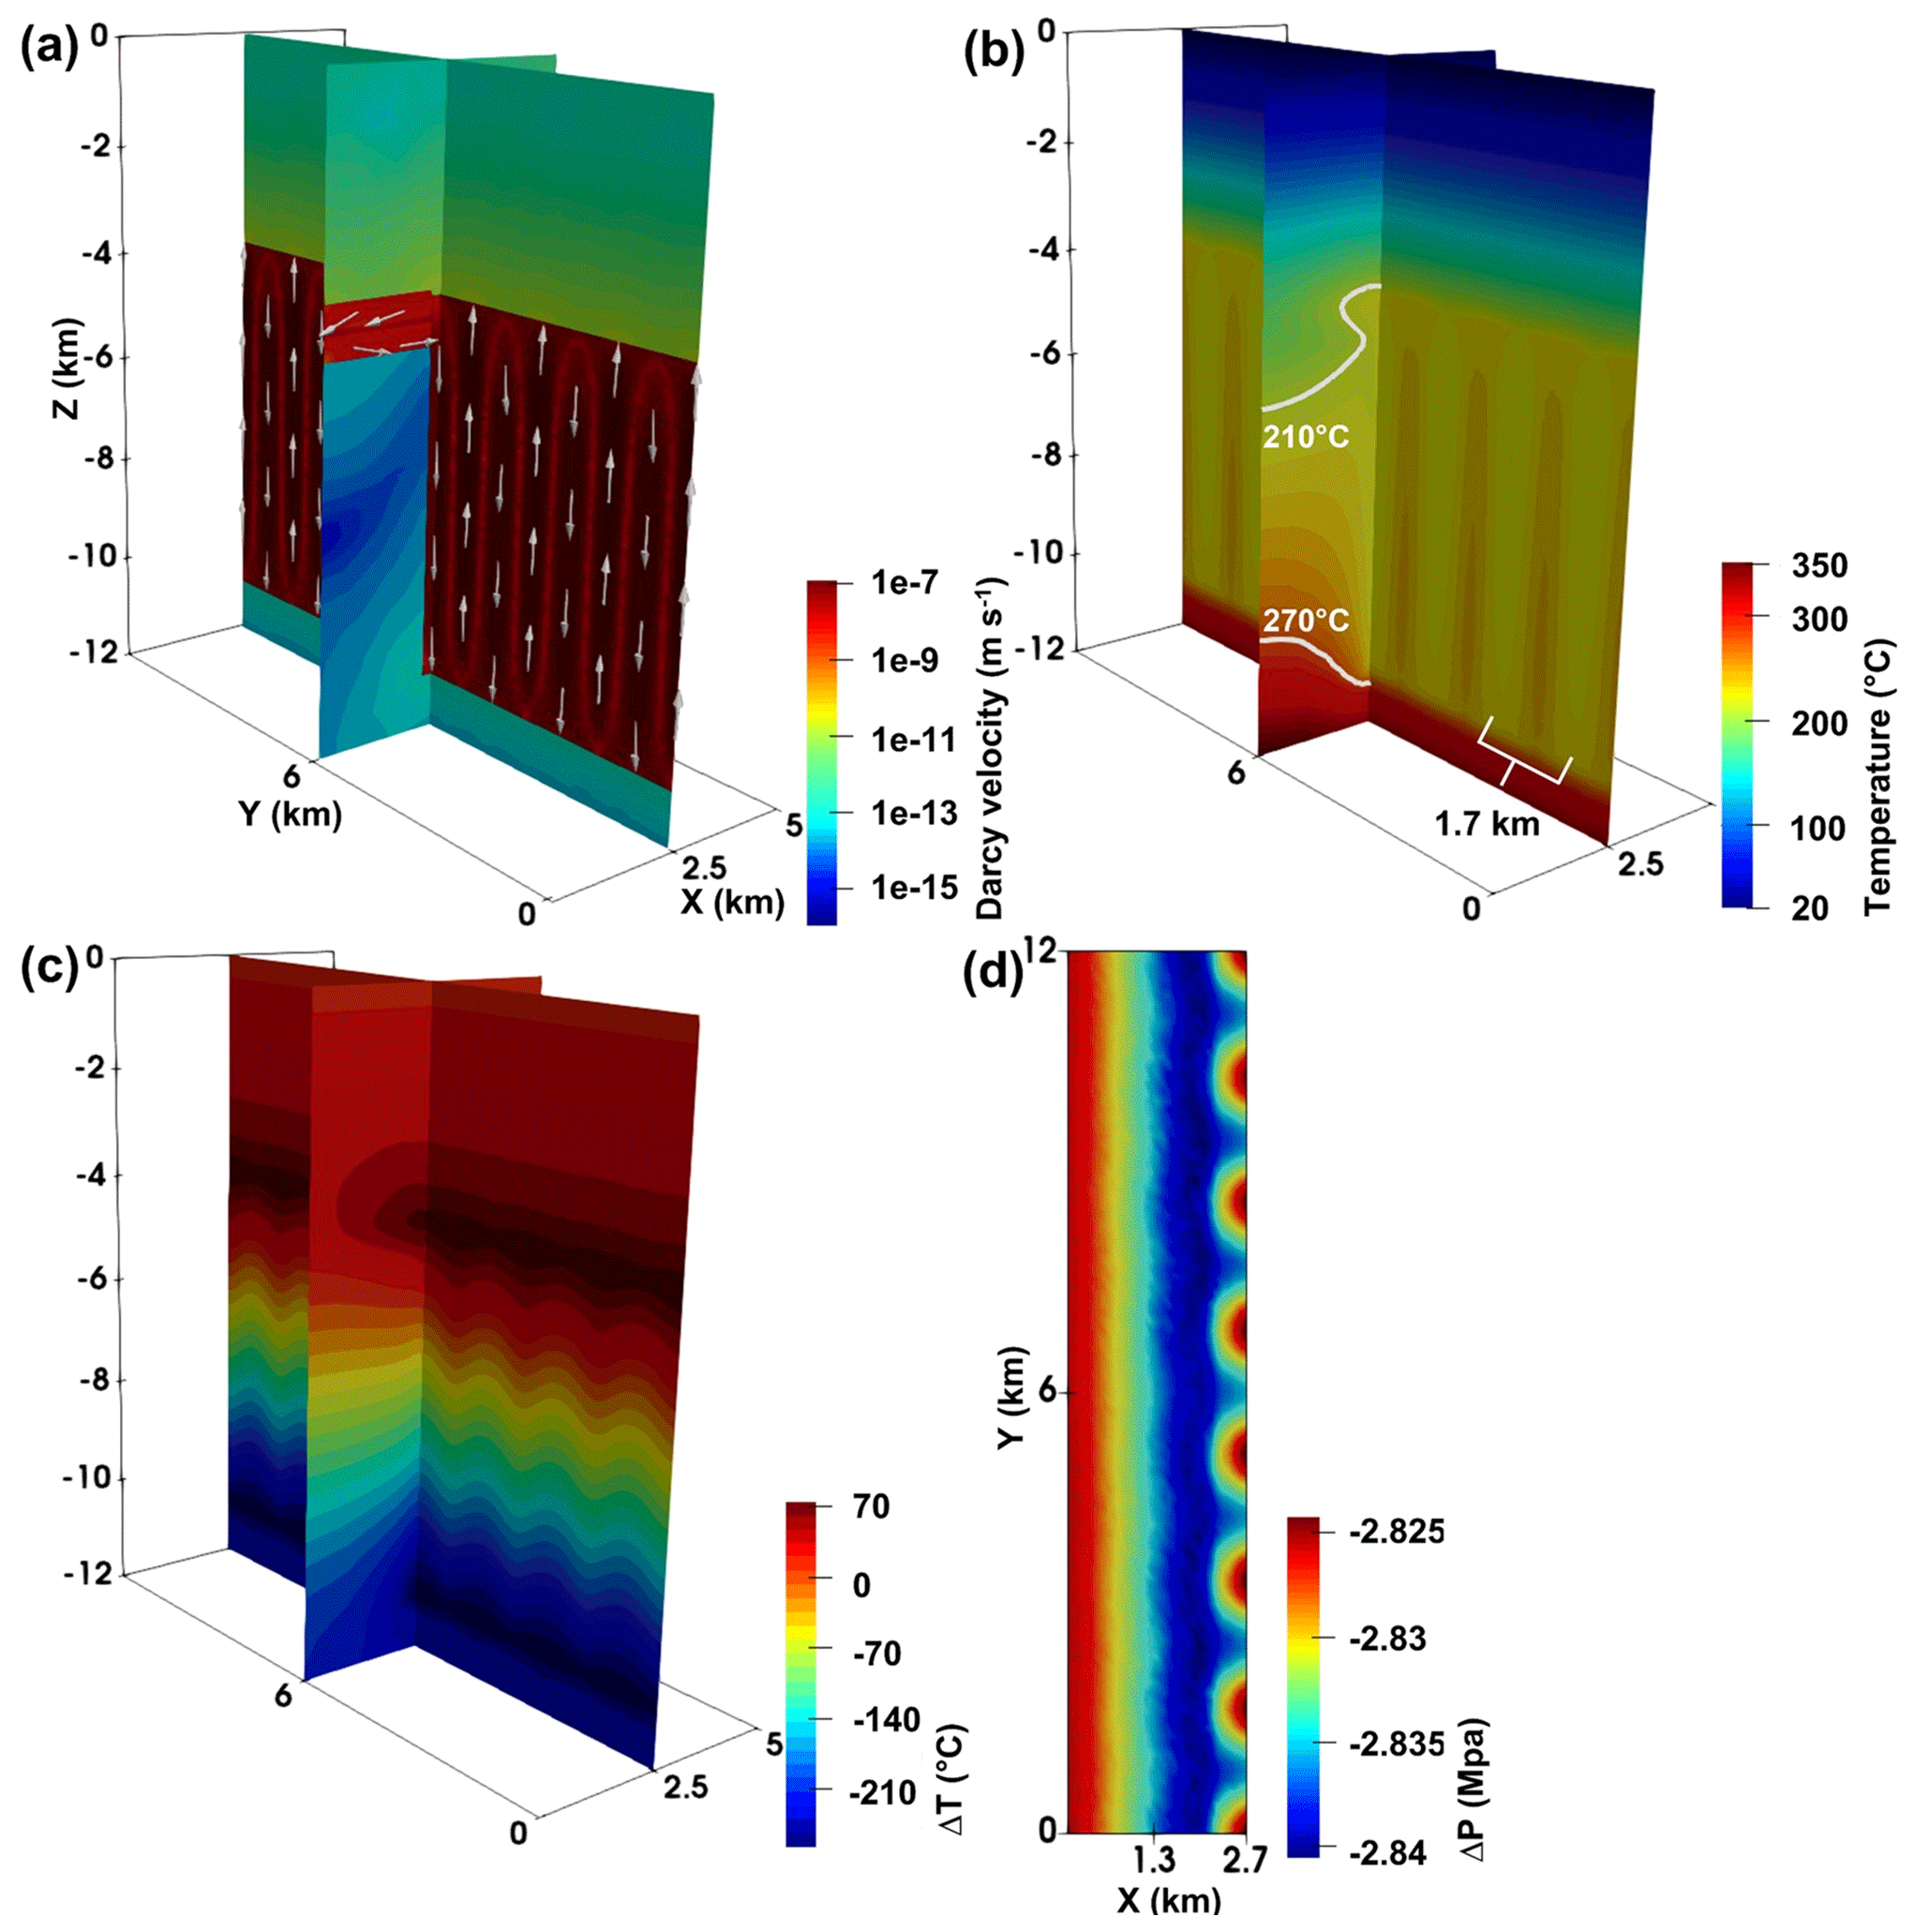
Figure 8Fluid-flow, temperature and pore-pressure change fields of the case at 1 Myr. Cross-sectional view of the (a) flow field with arrows representing the preferential fluid-flow pathways and (b) resulting temperature field. The 210 and 270 ∘C isotherms are highlighted to indicate the dominant heat-transfer types. Panel (c) shows the temperature differences compared to the initial conductive temperature distribution. Panel (d) shows the top view of the pore-pressure change compared to the initial hydrostatic pore pressure (43.3 MPa) in the western sandstone, transfer faults and main fault at a depth of 4.4 km. The 1.3 and 2.7 km along the x axis follow the western boundary of the Piesberg quarry and the eastern boundary of the main fault, respectively.
Next, we illustrate how the κSST variations affect the dominant heat-transfer types and temperature distribution with depth. With the κSST increased from 10−16 to 10−14 m2, the lateral convection in the sandstone and transfer faults is gradually enhanced which is evidenced by the increased Pe_SST from ∼ 0 to 0.5 (Fig. 9). This is caused by the reduced pore-pressure difference between the main fault and the sandstone due to their decreased permeability contrasts.
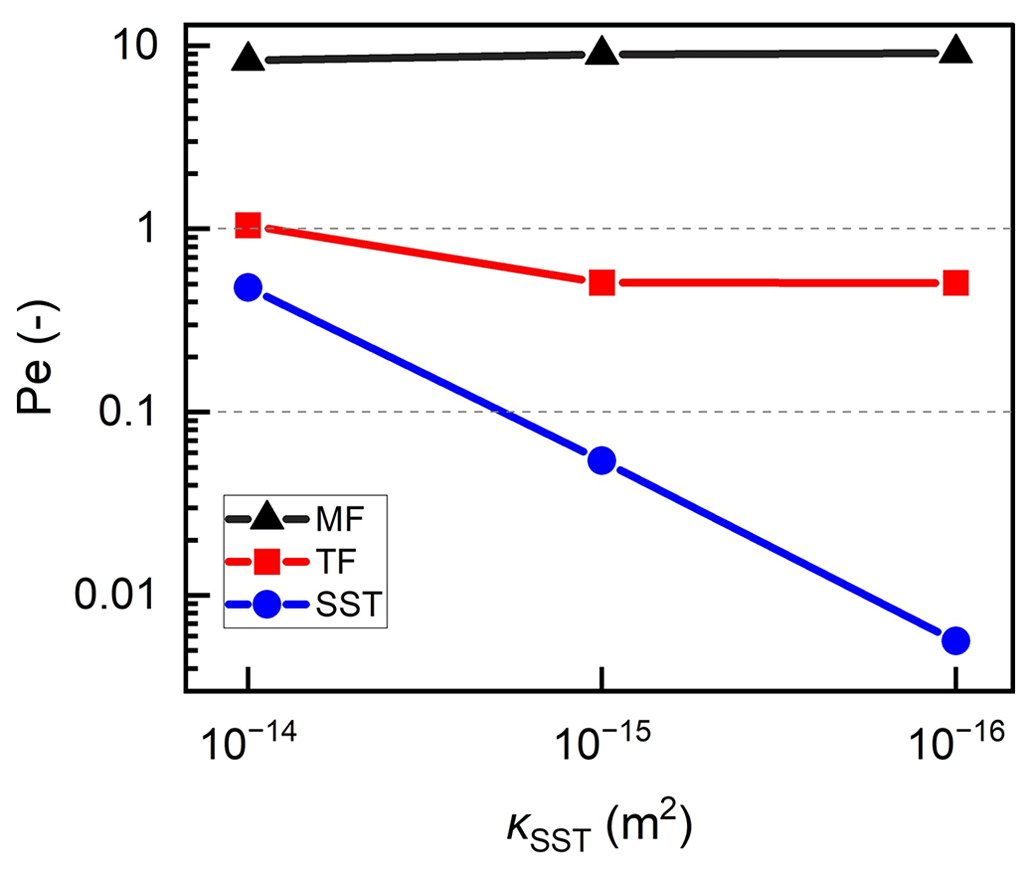
Figure 9Effects of the sandstone permeability (κSST) on the Pe (median Peclet numbers) of the main fault (MF), transfer faults (TF) and sandstone (SST).
Figure 10 illustrates divergent temperature distributions within the 2 to 5 km depth for all three κSST cases. The m2 case yields a continuous rise of temperature down to 5 km depth due to conduction-dominated heat transfer in the sandstone (Pe_SST≈0) as shown by its temperature-depth profile (i.e. the green line in Fig. 10). A slightly decreased Tmax (i.e. 244 ∘C) is observed in the reference case (Fig. 10, red line) compared to the m2 case (i.e. 248 ∘C) (Fig. 10, green line). The reason is that weak lateral convection (Pe_SST=0.1) transfers energy into the sandstone away from the main fault and decreases the temperature of the sandstone near the main fault. However, a higher temperature increase within the 2 to 4.8 km depth is shown for the m2 case (Fig. 10, blue line). The Tmax in the m2 case is 269 ∘C, which is 25 ∘C higher than in the reference case. This is due to the increased mass flow involved in the enhanced lateral convection (i.e. Pe_SST=0.5), which transfers the energy from the main fault into the sandstone, transfer faults and caprock. The energy and fluid losses in the discharge process cause lower temperature rises than the recharge process in lateral convection. Compared to linear temperature distribution at the initial time, the mixed concave–convex shapes of the temperature profile (Fig. 10, blue line) agree with the isotherms and fluid-flow pathways of the lateral convection within the sandstone (Fig. 8a and b).
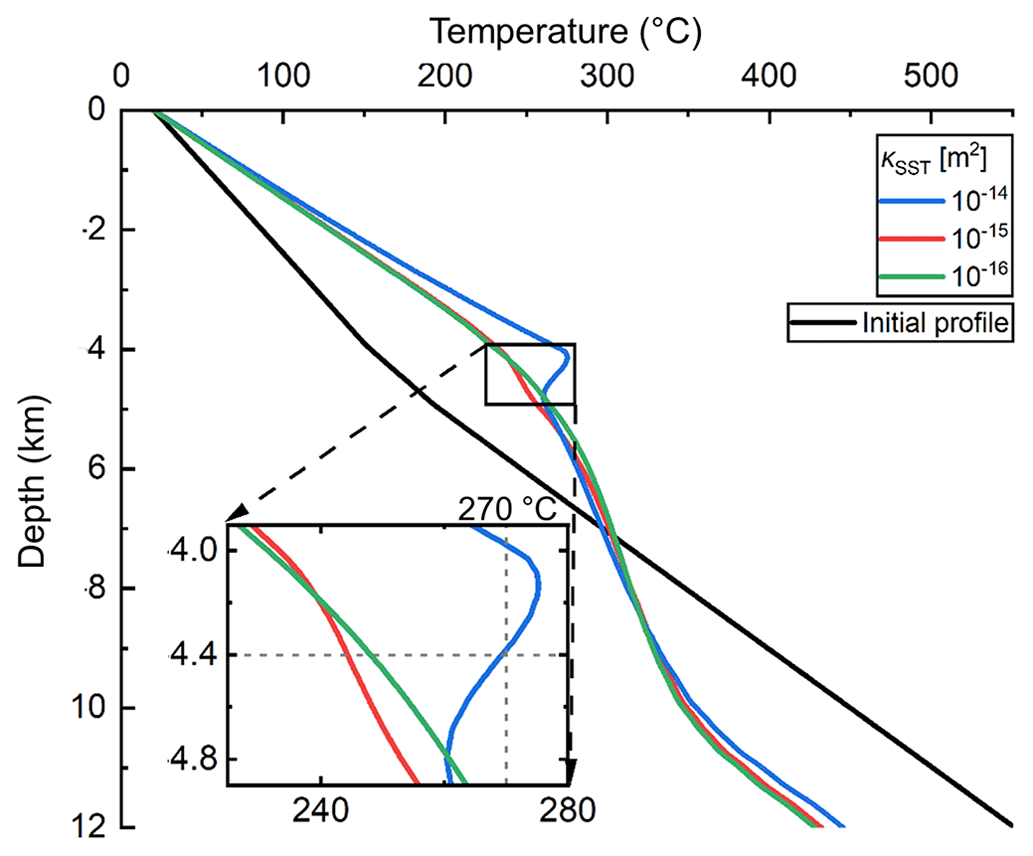
Figure 10Effects of the sandstone permeability (κSST) on the temperature-depth profiles. The m2 case represents the reference case.
3.3 Effects of lateral regional flow
Here, we study whether a superimposed LRF changes the fluid-flow pathways and types of heat transfer in the hydrothermal convection system. The mutual interaction between LRF and convective/advective flows is also studied. The reference case superimposed by LRFs is used to investigate whether an LRF enhances heat extraction and transfer from the buoyancy-driven convection within the main fault. The results show that forced advection is initiated in the transfer faults only when the LRF exceeds the buoyancy-driven convective flow in the reference case. The dominant heat-transfer type in the transfer faults changes from conduction to advection, as proven by the increased Pe_SST from 0.5 to 2.3 (Schilling et al., 2013). The LRF of m s−1 that is superimposed on the reference case increases the Tmax by 8 ∘C compared to the reference case without LRF (Table 3).
Table 3The effect of maximum lateral regional flow (LRF m s−1) on the maximum temperature at the western boundary of the Piesberg quarry (Tmax) under different permeability distributions of the main fault (κMF) and sandstone (κSST).
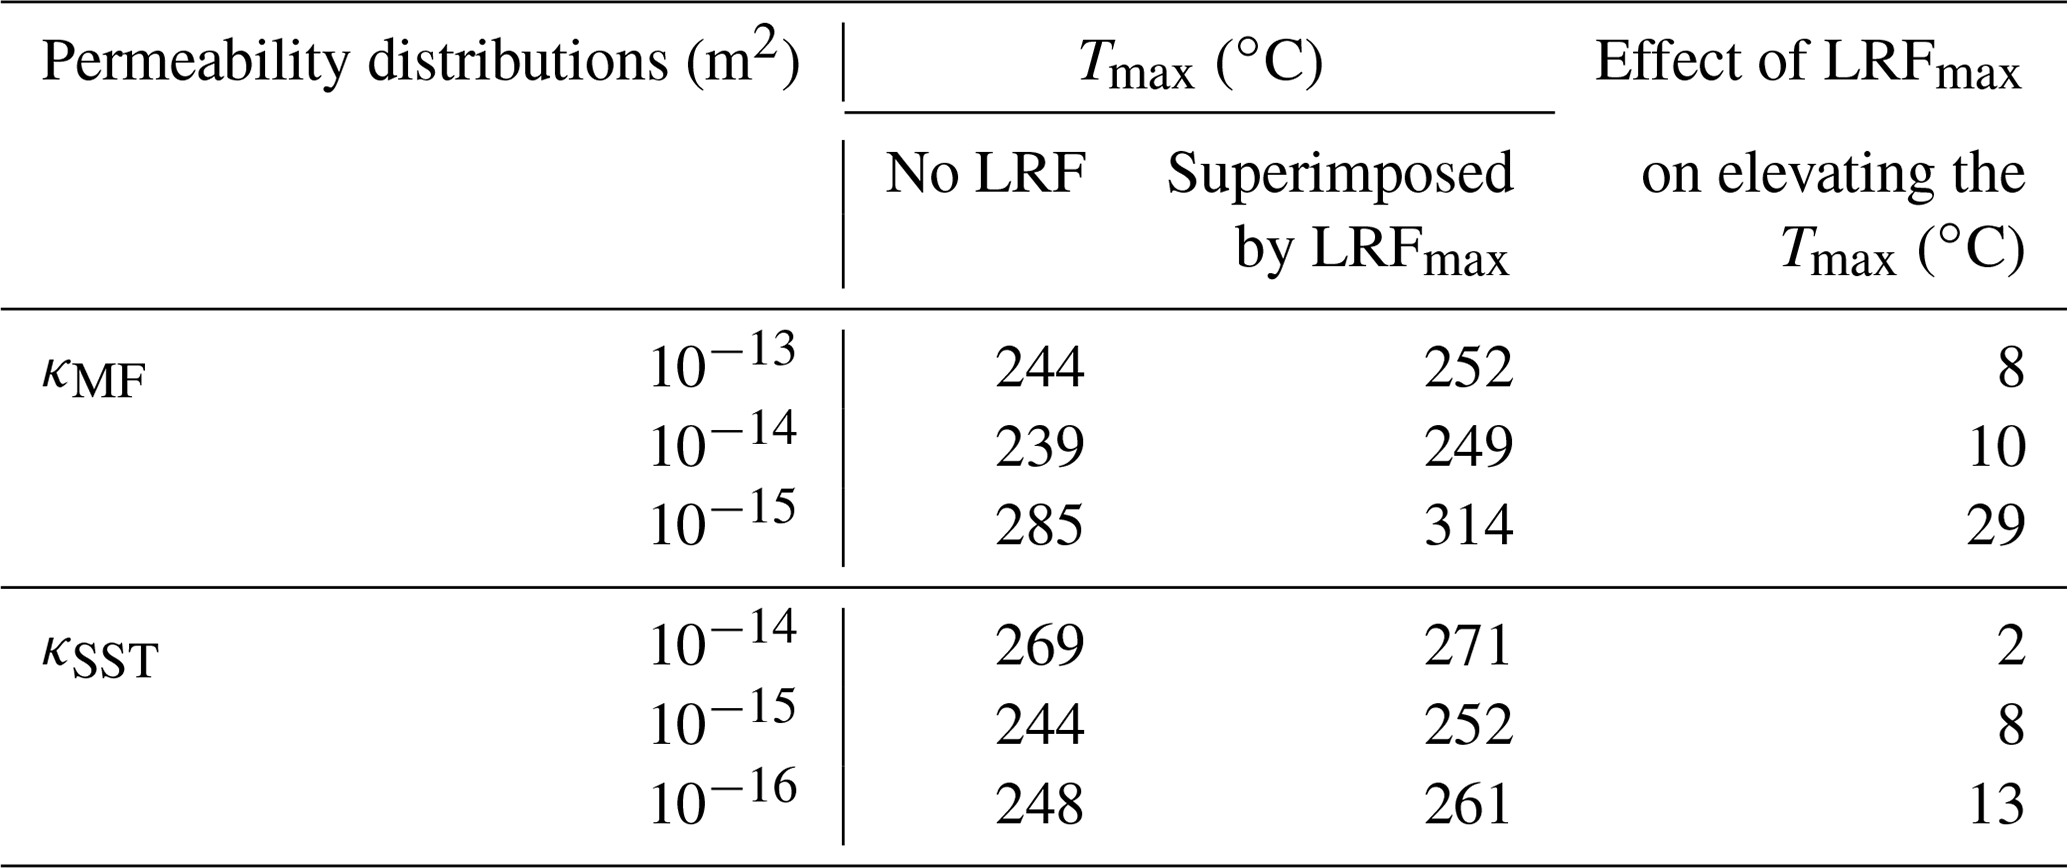
The interactions between the LRF, buoyancy-driven convective flow and natural advective flow are shown in the κMF variation cases in Table 3. As mentioned in Sect. 3.2.1, the maximum Darcy velocity of the buoyancy-driven convective flow is reduced when κMF is decreased from 10−13 to 10−15 m2. Therefore, the extent to which the LRFmax overwhelms the buoyancy-driven convective flow increases. This is evidenced by the increased Pe_TF ranging from 2.3 to 6.7. In contrast, the natural advective flow in the transfer faults becomes significant when κMF is decreased to 10−15 m2. Figure 5a shows that the natural advective flow in the western part propagates towards the western boundaries of the model, which is the same as the LRF. Thus, the LRFmax can enhance the heat and mass flow in the transfer faults, leading to a larger increase in Tmax (ranging from 8 to 29 ∘C) compared to the cases without LRF.
The κSST variation cases in Table 3 illustrate the interactions between the LRF, buoyancy-driven convective flow and lateral convective flow. Section 3.2.2 shows that the lateral convective flow is gradually weakened (Figs. 4b and 8a) when κSST is decreased from 10−14 to 10−16 m2. The maximum Darcy velocity of the buoyancy-driven convective flow is ∼ m s−1, nearly the same in all κSST cases. Thus, the LRFmax can also enhance the heat and mass flows in the sandstone and transfer faults when the κSST is decreased, causing larger Tmax (from 2 to 13 ∘C) and increased Pe_TF ranging from 2 to 5.4.
According to the above results, the impact of LRF on enhancing the mass and heat flows within the sandstone and transfer faults is reduced for higher κMF and κSST cases (López and Smith, 1996; Sheldon et al., 2012). The reason is that the higher κMF (i.e. 10−13 m2) and κSST (i.e. 10−14 m2) lead to a stronger fluid flow and heat transfer in the buoyancy-driven convection and lateral convection, respectively. Thus, the fluid mass fraction that can be impacted by LRF is decreased, resulting in less effect on the increased Tmax compared to the lower κMF and κSST cases.
4.1 Effects of the anisotropic and depth-dependent permeabilities
We consider the anisotropic κMF cases described in Sect. 2.3 to study how the anisotropic permeability affects the transport mechanisms. Preliminary tests show that the cases with the 1 and 3 orders of magnitude of anisotropy in the κMF have similar concentrated flow in the faults and conduction-dominated heat transfer in the sandstone to the reference case. They result in a Tmax of ∼ 240 ∘C, which is 4 ∘C lower than the reference case. This suggests that the anisotropic main fault acts as a complex pipe-barrier system that favours vertical fluid migration and impedes horizontal fluid migration. In contrast, the κMF case with 2 orders of magnitude of anisotropy leads to an elevated temperature in the to −3 km range, especially in the sandstone range of to −3.9 km, as shown by its temperature-depth profile (i.e. the blue line in Fig. 11). The Tmax is elevated to 280 ∘C, which is 36 ∘C higher than in the reference case. This is caused by the enhanced lateral convection in the sandstone (Pe_SST=0.1) and natural advection in the transfer faults (Pe_TF=4.6) that transfer energy more efficiently than the conduction-dominated heat transfer. The lateral convection and natural advection are initiated by the decreased horizontal permeability contrast between the sandstone and main fault, and the increased horizontal permeability contrast between the transfer faults and main fault, respectively.
The depth-dependent κMF cases are used to study depth-dependent permeability effects on transport mechanisms. All the depth-dependent κMF cases have similar focused flow in the faults and conduction-dominated heat transfer in the sandstone to the reference case. However, the number of upward flows within the main fault is decreased in all three cases. When the degree of depth-dependent κMF is changed from 1 to 3 orders of magnitudes, the amount of upward transported energy by the buoyancy-driven convection within the main fault is gradually decreased, resulting in a decreased Pe_MF, ranging between 6.7 and 0.9. The Tmax is decreased from 217 to 195 ∘C with the decreased degree of depth-dependent κMF. Inferred from the in situ lithostatic pressure distribution in the LSB (Manning and Ingebritsen, 1999; Saar and Manga, 2004), the κMF is exponentially decreased by 2 orders of magnitudes from its top locations to its bottom locations. Its equation is shown as
where z is the location (m) and κMF(z) is the main fault permeability (m2) at the z (m) location. The resulting temperature profile is shown by its temperature-depth profile (i.e. the green line in Fig. 11) with a Tmax of 207 ∘C.

Figure 11Effects of the anisotropic and depth-dependent permeabilities of the main fault (κMF) on the temperature-depth profiles.
The anisotropic permeability cases prove that the onset of lateral convection and natural advection relies on the horizontal permeability contrast between the sandstone and main fault, and the horizontal permeability contrast between the transfer faults and main fault, respectively. Influenced by the increasing lithostatic pressure with depth, the mass flow and heat transfer of the buoyancy-driven convection is gradually weakened in the main fault. Thus, the main controlling parameter of the transport mechanism is detailed from the idealised permeability distributions into the spatial permeability distributions of the main fault and sandstone.
4.2 Implications for the kilometre-scale thermal anomaly in the Piesberg quarry and comparable reservoirs
Our study performs the first numerical investigation of possible reasons for the kilometre-scale thermal anomaly (270–300 ∘C) in the Piesberg quarry. Since only the geothermometry data from the outcrop samples in the Piesberg quarry are available, our discussion will be limited to the thermal profiles at a 4.4 km depth where the Piesberg quarry was located during the Late Jurassic–Early Cretaceous period. The relation between temperatures and mass flows within the sandstone and transfer faults (shown in Figs. 4, 5, 8, 11 and Table 3) suggests that the thermal anomaly results from the coexistence of the buoyancy-driven convection in the main fault and lateral convection in the sandstone, rather than from conduction-dominated heat transfer. Both buoyancy-driven convection in the main fault and lateral convection are indispensable to reproducing the measured thermal anomaly. Therein, the buoyancy-driven convection in the main fault is an essential prerequisite for the formation of high temperatures in relatively shallow depths because it can transport heat from deeper to shallow depths (Kohl et al., 2000; Bächler et al., 2003). Moreover, the main role played by lateral convection in the sandstone is to redistribute both heat and fluid mass within the sandstone (Wisian and Blackwell, 2004a), as shown in Fig. 3 with the results obtained in Sect. 3. However, the hypothetical LRF that mimics the effect of topography on the transport mechanisms behaves less importantly than buoyancy-driven convection and lateral convection according to the elevation of the Tmax by LRF (Table 3). Favourable permeability distributions for reproducing the measured thermal anomaly include moderately permeable sandstone (i.e. 10−14 m2), same permeabilities (i.e. 10−15 m2) in the main fault and sandstone, and the anisotropic case of the main fault (i.e. m10−15 m2). The Tmax obtained from the simulations for these three cases are 269, 285 and 280 ∘C, respectively. These results show that the measured thermal anomaly can be reproduced only if the κMF is equal to or greater than 10−15 m2. Meanwhile, the ratio of κSST_horizontal to κMF_horizontal is equal to or greater than 1. Thus, the magnitude of the κMF and the ratio of κSST_horizontal to κMF_horizontal are the determinative factors of the formation of the kilometre-scale thermal anomaly (270–300 ∘C) in the Piesberg quarry, rather than the LRF. Wuestefeld et al. (2014) and Becker et al. (2019) study the permeability heterogeneity properties in the Piesberg quarry. Based on the in situ geological and petrophysical properties (i.e. mean permeability distribution, heterogeneities) around Piesberg quarry and within the LSB (Wuestefeld et al., 2014; Wüstefeld et al., 2017a; Becker et al., 2019), the increased mass flows involved in the coexisting flow modes resulting from the anisotropic case of the main fault (i.e. m10−15 m2) provide the most realistic permeability distribution case to explain the thermal anomaly in the Piesberg quarry.
In order to make geothermal projects more economically attractive, especially in sedimentary basins (e.g. LSB) with constrained conditions (e.g. low permeability and temperature gradient), fractured/faulted zones are preferentially targeted as valuable geothermal reservoirs (Bruns et al., 2013). As shown in the reference case (Fig. 4), the upward fluid flow within the main fault leads to positive thermal anomalies (i.e. at a maximum of 86 ∘C) in a relatively shallow depth (∼ 4 km). The relatively shallow locations of geothermal reservoirs greatly decrease the investments (i.e. the costs of drilling and completions) for developing geothermal energy in the sedimentary basin (Huenges and Ledru, 2010). The processes within geothermal reservoirs have important consequences for their successful exploration since the interesting scale at which thermal anomalies could be exploited greatly depend on the heat-transfer types and fluid-flow pathways (Huenges and Ledru, 2010; Przybycin et al., 2017). If the temperature anomaly is assumed to persist to the present and geologic conditions are constant for the given reference case, geothermal drilling should target the kilometre-scale elevated temperatures (i.e. 2.8 km on the x axis; 12 km on the y axis; 2.8 km on the z axis) around the depth of 4 km (Fig. 4). Our 3D numerical model allows for a better understanding of the processes within geothermal reservoirs (e.g. the role of different selected parameters in the origin, location, scale and magnitude of thermal anomalies), thus providing tools for predicting and targeting geothermal exploration (Clauser and Villinger, 1990; Guillou-Frottier et al., 2013).
Inspired by the Piesberg quarry in northwestern Germany and its established thermal anomaly, we created an idealised numerical model to derive parameters and processes that cause the onset of thermal anomalies in comparable geological settings. The study focused on the developments and mutual interactions of predominant heat-transfer types and preferential fluid-flow pathways in faulted tight sandstones. The hydraulic parameterisations of the main fault and sandstone are crucial for inferring the mechanisms causing the transport of fluid and heat. Buoyancy-driven convection transports energy upward inside the main fault. Induced by favourable hydraulic conditions (e.g. high sandstone permeability of 10−14 m2; equal permeability of 10−15 m2 of the main fault and sandstone), convective flow in the sandstone and advective flow in the transfer faults redistribute both heat and fluid within the reservoir, causing elevated temperatures (≥269 ∘C) and thermal gradients in the sandstones compared to conduction-dominated heat transfer (≤250 ∘C). Lateral regional flow can interact with convective/advective flows in the sandstone and transfer faults and changes the dominant heat transfer from conduction to advection in the transfer faults when it overwhelms the magnitude of the convective flows in the main fault and sandstone. However, its influence is limited by the geometric and hydraulic constraints of the transfer faults and, therefore, significantly reduced compared to the influence of the local permeability distribution. The anisotropic and depth-dependent permeability cases detail the main controlling parameter of the transport mechanism into the spatial permeability distributions of the main fault and sandstone.
The magnitude of the main fault permeability and the ratio of the horizontal permeability of the sandstone to the horizontal permeability of the main fault are the determining factors in the formation of the thermal anomaly at the Piesberg quarry rather than topographic conditions. The increased mass flows involved in the coexisting flow modes resulting from the anisotropic case of the main fault (i.e. m10−15 m2) provide the most realistic explanation for the kilometre-scale elevated temperature of 270–300 ∘C in the Piesberg quarry. Our study proves that fractured/faulted zones in tight sandstone reservoirs (a common petroleum reservoir play type) and associated thermal anomalies may be preferred geothermal reservoirs in sedimentary basins worldwide (e.g. LSB). Our 3D numerical model also provides predictive tools for the origin, location, scale and magnitude of exploitable geothermal reservoirs. More processes (i.e. chemistry and (geo-)mechanics) should be investigated in a further step for the fully coupled transport mechanisms in faulted tight sandstones.
The numerical codes and data are available upon request to the first author.
The supplement related to this article is available online at: https://doi.org/10.5194/se-14-293-2023-supplement.
GY, BB, and RE: conceptualisation and methodology; GY and RE: software; GY: formal analysis, investigation, data curation, writing – original draft preparation, and visualisation; BB, RE, ME, KS, and TK: writing – review and editing; TK: supervision. All authors have read and agreed to the published version of the paper.
The contact author has declared that none of the authors has any competing interests.
Publisher's note: Copernicus Publications remains neutral with regard to jurisdictional claims in published maps and institutional affiliations.
This study is part of the subtopic “Geoenergy” in the programme “MTET – Materials and Technologies for the Energy Transition” of the Helmholtz Association. The support from the programme is gratefully acknowledged. Guoqiang Yan is funded by the China Scholarship Council (grant no. 201709370076) and Robert Egert is partly funded by the German Federal Ministry for Economic Affairs and Climate Action in the project INSIDE (grant no. 03EE4008C). We acknowledge support by the KIT-Publication Fund of the Karlsruhe Institute of Technology. We thank Ali Dashti and Fabian Nitschke (all from Karlsruhe Institute of Technology) for their assistance in reviewing the paper as well as Maziar Gholami Korzani (Queensland University of Technology) for his contribution in the early stages of this study. We thankfully acknowledge constructive review comments by Laurent Guillou-Frottier and an anonymous reviewer, who improved the quality of this paper.
This research has been supported by the Helmholtz Association (subtopic “Geoenergy” in the programme “MTET – Materials and Technologies for the Energy Transition”), the German Federal Ministry for
Economic Affairs and Climate Action in the project INSIDE (grant no. 03EE4008C), and the China Scholarship Council (grant no. 201709370076).
The article processing charges for this open-access publication were covered by the Karlsruhe Institute of Technology (KIT).
This paper was edited by Susanne Buiter and reviewed by Laurent Guillou-Frottier and one anonymous referee.
Achtziger-Zupanèiè, P., Loew, S., and Mariéthoz, G.: A new global database to improve predictions of permeability distribution in crystalline rocks at site scale, J. Geophys. Res.-Sol. Ea., 122, 3513–3539, https://doi.org/10.1002/2017JB014106, 2017a.
Achtziger-Zupanèiè, P., Loew, S., and Hiller, A.: Factors controlling the permeability distribution in fault vein zones surrounding granitic intrusions (Ore Mountains/Germany), J. Geophys. Res.-Sol. Ea., 122, 1876–1899, https://doi.org/10.1002/2016JB013619, 2017b.
Andrews, J. R., Day, J., and Marshall, J. E. A: A thermal anomaly associated with the Rusey Fault and its implications for fluid movements, Proceedings of the Ussher Society, 9, 68–71, 1996.
Bächler, D., Kohl, T., and Rybach, L.: Impact of graben-parallel faults on hydrothermal convection – Rhine Graben case study, Phys. Chem. Earth Pt. A/B/C, 28, 431–441, https://doi.org/10.1016/S1474-7065(03)00063-9, 2003.
Baillieux, P., Schill, E., Edel, J.-B., and Mauri, G.: Localization of temperature anomalies in the Upper Rhine Graben: insights from geophysics and neotectonic activity, Int. Geol. Rev., 55, 1744–1762, https://doi.org/10.1080/00206814.2013.794914, 2013.
Baldschuhn R., Binot F., Fleig S., and Kockel F.: Geotektonischer Atlas von Nordwest-Deutschland und dem deutschen Nordsee-Sektor, Geologisches Jahrbuch Reihe A, 153, 3–95, 2001.
Beck, A. E., Garven, G., and Stegena, L. (Eds.): Hydrogeological Regimes and Their Subsurface Thermal Effects, Geophysical Monograph Series, 47, American Geophysical Union, Washington, D. C., America, 158 pp., ISBN 9780875904511, 1989.
Becker, I., Busch, B., Koehrer, B., Adelmann, D., and Hilgers, C.: Reservoir quality evolution of Upper Carboniferous (Westphalian) tight gas sandstones, Lower Saxony Basin, NW Germany, J. Petrol. Geol., 42, 371–392, https://doi.org/10.1111/jpg.12742, 2019.
Blackwell, D. D., Negraru, P. T., and Richards, M. C.: Assessment of the Enhanced Geothermal System Resource Base of the United States, Nat. Resour. Res., 15, 283–308, https://doi.org/10.1007/s11053-007-9028-7, 2007.
Bruhn, R. L., Parry, W. T., Yonkee, W. A., and Thompson, T.: Fracturing and hydrothermal alteration in normal fault zones, Pageoph, 142, 609–644, https://doi.org/10.1007/BF00876057, 1994.
Bruns, B., Di Primio, R., Berner, U., and Littke, R.: Petroleum system evolution in the inverted Lower Saxony Basin, northwest Germany: a 3D basin modeling study, Geofluids, 13, 246–271, https://doi.org/10.1111/gfl.12016, 2013.
Busch, B., Becker, I., Koehrer, B., Adelmann, D., and Hilgers, C.: Porosity evolution of two Upper Carboniferous tight-gas-fluvial sandstone reservoirs: Impact of fractures and total cement volumes on reservoir quality, Mar. Petrol. Geol., 100, 376–390, https://doi.org/10.1016/j.marpetgeo.2018.10.051, 2019.
Cherubini, Y., Cacace, M., Blöcher, G., and Scheck-Wenderoth, M.: Impact of single inclined faults on the fluid flow and heat transport: results from 3-D finite element simulations, Environ. Earth Sci., 70, 3603–3618, https://doi.org/10.1007/s12665-012-2212-z, 2013.
Clauser, C. and Villinger, H.: Analysis of conductive and convective heat transfer in a sedimentary basin, demonstrated for the Rheingraben, Geophys. J. Int., 100, 393–414, https://doi.org/10.1111/j.1365-246X.1990.tb00693.x, 1990.
Cloetingh, S., van Wees, J. D., Ziegler, P. A., Lenkey, L., Beekman, F., Tesauro, M., Förster, A., Norden, B., Kaban, M., and Hardebol, N.: Lithosphere tectonics and thermo-mechanical properties: An integrated modelling approach for Enhanced Geothermal Systems exploration in Europe, Earth-Sci. Rev., 102, 159–206, https://doi.org/10.1016/j.earscirev.2010.05.003, 2010.
David, F., Albertsen, M., and Blohm, M.: Sedimentologie und Beckenanalyse im Westfal C und D des Nordwestdeutschen Oberkarbons, DGMK-Bericht 384-3, Sedimentologie des Oberkarbons, Deutsche Gesellschaft für Mineralölwissenschaft und Kohlechemie e.V., Hamburg, Germany, 1990.
Egert, R., Korzani, M. G., Held, S., and Kohl, T.: Implications on large-scale flow of the fractured EGS reservoir Soultz inferred from hydraulic data and tracer experiments, Geothermics, 84, 101749, https://doi.org/10.1016/j.geothermics.2019.101749, 2020.
Egert, R., Nitschke, F., Gholami Korzani, M., and Kohl, T.: Stochastic 3D Navier-Stokes Flow in Self-Affine Fracture Geometries Controlled by Anisotropy and Channeling, Geophys. Res. Lett., 48, e2020GL092138, https://doi.org/10.1029/2020GL092138, 2021.
Elderfield, H., Wheat, C. G., Mottl, M. J., Monnin, C., and Spiro, B.: Fluid and geochemical transport through oceanic crust: a transect across the eastern flank of the Juan de Fuca Ridge, Earth Planet. Sc. Lett., 172, 151–165, https://doi.org/10.1016/S0012-821X(99)00191-0, 1999.
Emry, E. L., Nyblade, A. A., Horton, A., Hansen, S. E., Julià, J., Aster, R. C., Huerta, A. D., Winberry, J. P., Wiens, D. A., and Wilson, T. J.: Prominent thermal anomalies in the mantle transition zone beneath the Transantarctic Mountains, Geology, 48, 748–752, https://doi.org/10.1130/G47346.1, 2020.
Erkan, K.: Geothermal investigations in western Anatolia using equilibrium temperatures from shallow boreholes, Solid Earth, 6, 103–113, https://doi.org/10.5194/se-6-103-2015, 2015.
Fairley, J. P.: Modeling fluid flow in a heterogeneous, fault-controlled hydrothermal system, Geofluids, 9, 153–166, https://doi.org/10.1111/j.1468-8123.2008.00236.x, 2009.
Farrell, N., Healy, D., and Taylor, C. W.: Anisotropy of permeability in faulted porous sandstones, J. Struct. Geol., 63, 50–67, https://doi.org/10.1016/j.jsg.2014.02.008, 2014.
Gholami Korzani, M., Nitschke, F., Held, S., and Kohl, T.: The Development of a Fully Coupled Wellbore-Reservoir Simulator for Geothermal Application, Transactions, 43, 927–936, 2019.
Gholami Korzani, M., Held, S., and Kohl, T.: Numerical based filtering concept for feasibility evaluation and reservoir performance enhancement of hydrothermal doublet systems, J. Petrol. Sci. Eng., 190, 106803, https://doi.org/10.1016/j.petrol.2019.106803, 2020.
Guillou-Frottier, L., Carrë, C., Bourgine, B., Bouchot, V., and Genter, A.: Structure of hydrothermal convection in the Upper Rhine Graben as inferred from corrected temperature data and basin-scale numerical models, J. Volcanol. Geoth. Res., 256, 29–49, https://doi.org/10.1016/j.jvolgeores.2013.02.008, 2013.
Guillou-Frottier, L., Duwiquet, H., Launay, G., Taillefer, A., Roche, V., and Link, G.: On the morphology and amplitude of 2D and 3D thermal anomalies induced by buoyancy-driven flow within and around fault zones, Solid Earth, 11, 1571–1595, https://doi.org/10.5194/se-11-1571-2020, 2020.
Haarmann, E.: Die geologischen Verhältnisse des Piesbergs-Sattels bei Osnabrück, Jahrbuch der Königl. Preuss. Geologischen Landesanstalt, 30, 1–58, 1909.
Harcouët-Menou, V., Guillou-Frottier, L., Bonneville, A., Adler, P. M., and Mourzenko, V.: Hydrothermal convection in and around mineralized fault zones: insights from two- and three-dimensional numerical modeling applied to the Ashanti belt, Ghana, Geofluids, 9, 116–137, https://doi.org/10.1111/j.1468-8123.2009.00247.x, 2009.
Hinze, C.: Erläuterungen zu Blatt Nr. 3614 Wallenhorst, Geologische Karte von Niedersachsen , Niedersächsisches Landesamt Bodenforschung, Hannover, Federal Republic of Germany, 1, 154, 1979.
Huenges, E. and Ledru, P. (Eds.): Geothermal energy systems: Exploration, development and utilization, Online-Ausg., Wiley-VCH Verlag GmbH & Co. KGaA, Weinheim, 463 pp., 2010.
Ingebritsen, S. E. and Manning, C. E.: Geological implications of a permeability-depth curve for the continental crust, Geology, 27, 1107, https://doi.org/10.1130/0091-7613(1999)027<1107:GIOAPD>2.3.CO;2, 1999.
Jobmann, M. and Clauser, C.: Heat advection versus conduction at the KTB: possible reasons for vertical variations in heat-flow density, Geophys. J. Int., 119, 44–68, https://doi.org/10.1111/j.1365-246X.1994.tb00912.x, 1994.
Kämmlein, M., Dietl, C., and Stollhofen, H.: The Franconian Basin thermal anomaly: testing its origin by conceptual 2-D models of deep-seated heat sources covered by low thermal conductivity sediments, Int. J. Energy Environ. Eng., 10, 389–412, https://doi.org/10.1007/s40095-019-00315-2, 2019.
Kohl, T., Bächler, D., and Rybach, L. (Eds.): Steps towards a comprehensive thermo-hydraulic analysis of the HDR test site Soultz-sous-Forêts, in: Proceedings World Geothermal Congress, Kyushu-Tohoku, Japan, 28 May–10 June 2000, 2671–2676, 2000.
Kuang, X. and Jiao, J. J.: An integrated permeability-depth model for Earth's crust, Geophys. Res. Lett., 41, 7539–7545, https://doi.org/10.1002/2014GL061999, 2014.
Kühn, M. and Gessner, K.: Testing Hypotheses for the Mount Isa Copper Mineralisation with Numerical Simulations, Surv. Geophys., 30, 253–268, https://doi.org/10.1007/s10712-009-9064-4, 2009.
Lampe, C. and Person, M.: Episodic hydrothermal fluid flow in the Upper Rhinegraben (Germany), J. Geochem. Explor., 69-70, 37–40, https://doi.org/10.1016/S0375-6742(00)00049-2, 2000.
Liewig, N. and Clauer, N.: K–Ar dating of varied microtextural illite in Permian gas reservoirs, northern Germany, Clay Miner., 35, 271–281, https://doi.org/10.1180/000985500546648, 2000.
Linstrom, P. J. and Mallard, W. G.: The NIST Chemistry WebBook: A Chemical Data Resource on the Internet, J. Chem. Eng. Data, 46, 1059–1063, https://doi.org/10.1021/je000236i, 2001.
López, D. L. and Smith, L.: Fluid flow in fault zones: analysis of the interplay of convective circulation and topographically driven Groundwater Flow, Water Resour. Res., 31, 1489–1503, https://doi.org/10.1029/95WR00422, 1995.
López, D. L. and Smith, L.: Fluid flow in fault zones: Influence of hydraulic anisotropy and heterogeneity on the fluid flow and heat transfer regime, Water Resour. Res., 32, 3227–3235, https://doi.org/10.1029/96WR02101, 1996.
Lucazeau, F.: Analysis and Mapping of an Updated Terrestrial Heat Flow Data Set, Geochem. Geophys. Geosy., 20, 4001–4024, https://doi.org/10.1029/2019GC008389, 2019.
Magri, F., Littke, R., Rodon, S., Bayer, U., and Urai, J. L.: Temperature fields, petroleum maturation and fluid flow in the vicinity of salt domes, in: Dynamics of Complex Intracontinental Basins: The Central European Basin System, edited by: Littke, R., Bayer, U., Gajewski, D., and Nelskamp, S., Springer, 323–344, https://gfzpublic.gfz-potsdam.de/pubman/item/item_237239 (last access: 10 October 2022), 2008.
Magri, F., Möller, S., Inbar, N., Möller, P., Raggad, M., Rödiger, T., Rosenthal, E., and Siebert, C.: 2D and 3D coexisting modes of thermal convection in fractured hydrothermal systems – Implications for transboundary flow in the Lower Yarmouk Gorge, Mar. Petrol. Geol., 78, 750–758, https://doi.org/10.1016/j.marpetgeo.2016.10.002, 2016.
Malkovsky, V. I. and Magri, F.: Thermal convection of temperature-dependent viscous fluids within three-dimensional faulted geothermal systems: Estimation from linear and numerical analyses, Water Resour. Res., 52, 2855–2867, https://doi.org/10.1002/2015WR018001, 2016.
Manning, C. E. and Ingebritsen, S. E.: Permeability of the continental crust: Implications of geothermal data and metamorphic systems, Rev. Geophys., 37, 127–150, https://doi.org/10.1029/1998RG900002, 1999.
McKenna, J. R. and Blackwell, D. D.: Numerical modeling of transient Basin and Range extensional geothermal systems, Geothermics, 33, 457–476, https://doi.org/10.1016/j.geothermics.2003.10.001, 2004.
Moeck, I. S.: Catalog of geothermal play types based on geologic controls, Renew. Sust. Energ. Rev., 37, 867–882, https://doi.org/10.1016/j.rser.2014.05.032, 2014.
Nield, D. A. and Bejan, A.: Convection in porous media, 5th edn., Springer, 988 pp., ISBN 978-3-319-49561-3, 2017.
O'Brien, J. J. and Lerche, I.: Impact of heat flux anomalies around salt diapirs and salt sheets in the Gulf Coast on hydrocarbon maturity, Gulf Coast Association of Geological Societies Transactions, 38, 231–243, 1988.
Panja, P., McLennan, J., and Green, S.: Influence of permeability anisotropy and layering on geothermal battery energy storage, Geothermics, 90, 101998, https://doi.org/10.1016/j.geothermics.2020.101998, 2021.
Parry, W.: Fault-fluid compositions from fluid-inclusion observations and solubilities of fracture-sealing minerals, Tectonophysics, 290, 1–26, https://doi.org/10.1016/S0040-1951(98)00013-4, 1998.
Permann, C. J., Gaston, D. R., Andrš, D., Carlsen, R. W., Kong, F., Lindsay, A. D., Miller, J. M., Peterson, J. W., Slaughter, A. E., Stogner, R. H., and Martineau, R. C.: MOOSE: Enabling massively parallel multiphysics simulation, SoftwareX, 11, 100430, https://doi.org/10.1016/j.softx.2020.100430, 2020.
Przybycin, A. M., Scheck-Wenderoth, M., and Schneider, M.: The origin of deep geothermal anomalies in the German Molasse Basin: results from 3D numerical models of coupled fluid flow and heat transport, Geotherm. Energy, 5, 1, https://doi.org/10.1186/s40517-016-0059-3, 2017.
Saar, M. O. and Manga, M.: Depth dependence of permeability in the Oregon Cascades inferred from hydrogeologic, thermal, seismic, and magmatic modeling constraints, J. Geophys. Res., 109, B04204, https://doi.org/10.1029/2003JB002855, 2004.
Schilling, O., Sheldon, H. A., Reid, L. B., and Corbel, S.: Hydrothermal models of the Perth metropolitan area, Western Australia: implications for geothermal energy, Hydrogeol. J., 21, 605–621, https://doi.org/10.1007/s10040-012-0945-0, 2013.
Schultz, R. A., Okubo, C. H., and Wilkins, S. J.: Displacement-length scaling relations for faults on the terrestrial planets, J. Struct. Geol., 28, 2182–2193, https://doi.org/10.1016/j.jsg.2006.03.034, 2006.
Scibek, J.: Multidisciplinary database of permeability of fault zones and surrounding protolith rocks at world-wide sites, Scientific Data, 7, 95, https://doi.org/10.1038/s41597-020-0435-5, 2020.
Senglaub, Y., Littke, R., and Brix, M. R.: Numerical modelling of burial and temperature history as an approach for an alternative interpretation of the Bramsche anomaly, Lower Saxony Basin, Int. J. Earth Sci., 95, 204–224, https://doi.org/10.1007/s00531-005-0033-y, 2006.
Sheldon, H. A., Florio, B., Trefry, M. G., Reid, L. B., Ricard, L. P., and Ghori, K. A. R.: The potential for convection and implications for geothermal energy in the Perth Basin, Western Australia, Hydrogeol. J., 20, 1251–1268, https://doi.org/10.1007/s10040-012-0886-7, 2012.
Shipton, Z. K., Soden, A. M., Kirkpatrick, J. D., Bright, A. M., and Lunn, R. J.: How thick is a fault? Fault displacement-thickness scaling revisited, in: Earthquakes: Radiated Energy and the Physics of Faulting, edited by: Abercrombie, R., McGarr, A., Kanamori, H., and Di Toro, G., American Geophysical Union, Washington, D. C., 193–198, https://doi.org/10.1029/170GM19, 2006.
Smith, L. and Chapman, D. S.: On the thermal effects of groundwater flow: 1. Regional scale systems, J. Geophys. Res., 88, 593–608, https://doi.org/10.1029/JB088iB01p00593, 1983.
Torabi, A. and Berg, S. S.: Scaling of fault attributes: A review, Marine and Petroleum Geology, 28, 1444–1460, https://doi.org/10.1016/j.marpetgeo.2011.04.003, 2011.
Watanabe, N., Blöcher, G., Cacace, M., Held, S., and Kohl, T.: Geoenergy Modeling III: Enhanced Geothermal Systems, Springer Cham, 104 pp., ISBN 978-3-319-46579-1, 2017.
Will, P., Lüders, V., Wemmer, K., and Gilg, H. A.: Pyrophyllite formation in the thermal aureole of a hydrothermal system in the Lower Saxony Basin, Germany, Geofluids, 16, 349–363, https://doi.org/10.1111/gfl.12154, 2016.
Wisian, K. W. and Blackwell, D. D.: Numerical modeling of Basin and Range geothermal systems, Geothermics, 33, 713–741, https://doi.org/10.1016/j.geothermics.2004.01.002, 2004a.
Wisian, K. W. and Blackwell, D. D.: Numerical modeling of Basin and Range geothermal systems, Geothermics, 33, 713–741, https://doi.org/10.1016/j.geothermics.2004.01.002, 2004b.
Wuestefeld, P., Hilgers, C., Koehrer, B., Hoehne, M., Steindorf, P., Schurk, K., Becker, S., and Bertier, P.: Reservoir heterogeneity in Upper Carboniferous tight gas sandstones: Lessons learned from an analog study, in: SPE/EAGE European Unconventional Resources Conference and Exhibition, Vienna, Austria, 25–27 February, 1–10, https://doi.org/10.2118/167793-MS, 2014.
Wüstefeld, P., Hilse, U., Koehrer, B., Adelmann, D., and Hilgers, C.: Critical evaluation of an Upper Carboniferous tight gas sandstone reservoir analog: Diagenesis and petrophysical aspects, Mar. Petrol. Geol., 86, 689–710, https://doi.org/10.1016/j.marpetgeo.2017.05.034, 2017a.
Wüstefeld, P., Hilse, U., Lüders, V., Wemmer, K., Koehrer, B., and Hilgers, C.: Kilometer-scale fault-related thermal anomalies in tight gas sandstones, Mar. Petrol. Geol., 86, 288–303, https://doi.org/10.1016/j.marpetgeo.2017.05.015, 2017b.
Zwingmann, H., Clauer, N., and Gaupp, R.: Timing of fluid flow in a sandstone reservoir of the north German Rotliegend (Permian) by K–Ar dating of related hydrothermal illite, Geological Society, London, Special Publications, 144, 91–106, https://doi.org/10.1144/GSL.SP.1998.144.01.07, 1998.
Zwingmann, H., Clauer, N., and Gaupp, R.: Structure-related geochemical (REE) and isotopic (K–Ar, Rb–Sr, δ18O) characteristics of clay minerals from Rotliegend sandstone reservoirs (Permian, northern Germany), Geochim. Cosmochim. Ac., 63, 2805–2823, https://doi.org/10.1016/S0016-7037(99)00198-2, 1999.