the Creative Commons Attribution 4.0 License.
the Creative Commons Attribution 4.0 License.
 | 14 Mar 2023
The Münsterdorf sinkhole cluster: void origin and mechanical failure
Georg Kaufmann
Douchko Romanov
Ulrike Werban
Thomas Vienken
Since 2004, collapse sinkholes occur on the sports field of Münsterdorf, a village north of Hamburg in Germany. The sinkholes, around 2–5 m in diameter and 3–5 m deep, develop in peri-glacial sand, which at around 20 m depth is underlain by Cretaceous chalk. The chalk has been pushed up close to the surface by a salt diapir. The sinkhole formation initiated suddenly and occurs with a frequency of one every 2 years.
We use a variety of geophysical results (e.g. gravity, electrical resistivity imaging, ground-penetrating radar) from previous fieldwork campaigns together with a new data set from direct-push-based methods to infer mechanical and hydrological properties of the material beneath the sports field (peri-glacial sand, glacial marl, Cretaceous chalk).
Based on the derived material properties, we develop a mechanical model for the sinkhole collapse, starting from simple analytical considerations and then moving towards a three-dimensional distinct-element model explaining the sudden onset of collapse sinkholes for the sports field.
The mechanical model supports our hypothesis that the sudden onset of sinkholes is triggered by changes in groundwater level.
- Article
(11395 KB) - Full-text XML
- BibTeX
- EndNote


Collapse sinkholes are cylindrical to elliptical surface structures with diameters ranging from 1 m to several hundred metres and similar depth extensions (e.g. Williams, 2004; Waltham et al., 2005). Collapse sinkholes form suddenly and pose a substantial risk to infrastructure because of their sudden inception and almost no warning signs before (e.g. Parise and Gunn, 2007; De Waele et al., 2011; Kaufmann, 2014; Kaufmann and Romanov, 2016). Often, collapse sinkholes form in karst terrains.
A karst terrain is defined as an area comprising a soluble rock, such as limestone, dolomite, anhydrite, gypsum, or salt. Common to all these soluble rock types is the ability of water flowing through rock fractures and bedding partings to dissolve material from the rock mass. While for the first two types of soluble rocks mentioned, limestone and dolomite, dissolution is substantial only when the water is acidic, e.g. by dissolving carbon dioxide from air and/or soil to form carbonic acid, for the latter rock types – anhydrite, gypsum, and salt – dissolution occurs in pure water.
The dissolution of soluble rock enhances the initially low primary permeability of the rocks, which is controlled by fractures in the sub-millimetre range. With time, the developing secondary permeability becomes orders of magnitude larger. The reason is the enlargement of fissures and bedding partings in the subsurface, in parts to the metre scale, to form subsurface voids and caves. This process occurs naturally over timescales of 10 000–100 000 years (limestone, dolomite), 1000–10 000 years (anhydrite and gypsum), and even faster in salt.
Once the subsurface voids reach a critical size, they can become mechanically unstable and start to collapse. If the void is deep below the surface, the collapse results in roof and wall breakdown, and breakdown can enlarge the void space by forming a mechanically stable shape. If the voids develop closer to the surface, breakdown might slowly migrate towards the surface, until only a thin ledge of rock remains. It is the final collapse of this thin ledge which causes the sudden appearance of the collapse sinkhole (e.g. Parise and Lollino, 2011; Lollino et al., 2013).
Depending on the overburden of the soluble rock, collapse sinkholes are classified into bedrock-collapse sinkholes, caprock-collapse sinkholes, and cover-collapse sinkholes (see Waltham and Fookes, 2003; Waltham et al., 2005; Gutiérrez et al., 2008a, b, 2014; Parise, 2019, 2022; and references therein). All of the three types of sinkholes listed above describe collapse as a process to form the sinkholes, but the surface layer affected by the collapse is different: soluble bedrock in the first case, unconsolidated deposits in the second case, and insoluble rock in the third case.
We discuss a group of collapse sinkholes formed on the sports field in the village of Münsterdorf in northern Germany. As the material above the soluble rock comprises both unconsolidated peri-glacial sand and more consolidated glacial marl, these sinkholes fall somewhere between the cover- and caprock-collapse sinkhole categories. The sinkholes started to appear in 2004 with a rate of one per year, being steep-walled, with a diameter of 2–3 and 2–5 m deep. We explore the mechanical stability (or instability) of the locality and try to answer the following questions:
- i.
Why did the collapse sinkhole formation start suddenly in 2004?
- ii.
What mechanical conditions are needed to initiate sinkhole collapse?
- iii.
Where is the location of the initial subsurface void responsible for the sinkhole formation?
We have organised the paper as follows. In Sect. 2, we introduce the locality and its geological set-up, and we describe the sinkhole cluster. In Sect. 3, we briefly summarise the results of previous geophysical campaigns, and we derive a lithological model for the subsurface structure. We then discuss locations of the initial voids responsible for the sinkhole collapse in terms of depth and size, and we investigate the chance to spot these voids prior to sinkhole formation with geophysical methods, depending on their depth. In Sect. 4, we describe several direct-push-based methods performed on and around the sports field in Münsterdorf. We then discuss hydrological and mechanical properties derived from these direct-push-based methods. In Sect. 5, we first develop a simple mechanical model for sinkhole collapse, and then we apply a discrete-element model to simulate the collapse sinkholes occurring on the sports field. We discuss the mechanical and hydrological properties likely to trigger the collapse sinkholes. In Sect. 6, we come back to our hypothesis of the void origin and present geochemical measurements favouring the deep void origin in the chalk layer. In Sect. 7, we refine our previous hypothesis on the temporal evolution of the collapse sinkholes on the sports field in Münsterdorf. We finally summarise our findings in Sect. 8.
The village of Münsterdorf is located around 50 km north of Hamburg in the northern part of Germany (Fig. 1), just south of the river Stör, which runs in a westerly direction close to Münsterdorf, then turns south to flow into the river Elbe. The river Stör is the natural local base level for the region and is influenced by the tides of the North Sea.

Figure 1Topographical map of the Münsterdorf–Lägerdorf area. Shown are the elevation (colour-coded); the river Stör as the local base level in the north; the villages of Münsterdorf and Lägerdorf (grey dots); the three open-pit chalk mines Saturn (abandoned), Schinkel, and Heidestrasse (black contour lines), including their actual extension (dashed blue line) not present in the SRTM (Shuttle Radar Topography Mission) model; the depth to the chalk layer (red contours); and the recent sinkholes since 2004 (blue dots). Insert: overview map with working area marked in red.
2.1 Geological set-up
As most of the landscape in northern Germany, the surface morphology is dominated by the Pleistocene ice-age cycles. The repeated advance and retreat of the Fennoscandian Ice Sheet carried glacial and peri-glacial sediments, which form the main features in the landscape: Münsterdorf sits on a geest ridge, a sandy deposit from deposition below the ice, about 20–30 m above sea level in the region. Beyond this geest island, the landscape is lower, between 5–15 m above sea level, and dominated by swampy marshland. The geest ridge was deposited during the Elsterian (455–320 ka) and Saalian (300–125 ka) glacial cycles, while during the last glacial cycle, the Weichselian, the ice did not reach the area around Münsterdorf.
The geest ridge consists of unconsolidated and consolidated peri-glacial sand, interbedded with glacial till, in parts composed of clay lenses.
The entire region is tectonically controlled by the Krempe–Lägerdorf salt ridge (e.g. Grube, 1955; Köstler and Ehrmann, 1986), a salt diapir, with salt sequences from the Permian Zechstein period. These Zechstein rocks can usually be found in a depth range between 3–5 km underneath northern Germany, but as the salt layers in the Zechstein evaporite they can flow plastically under stress; numerous salt structures have been pushed up by the large stress imposed by the overburden. The vertical uplift of these salt domes has pushed up the overburden by several kilometres, often reaching the surface. In the Münsterdorf region, the Krempe–Lägerdorf salt ridge has pushed up Cretaceous chalk from its original depth of 0.5–1 km to a position close to the surface (e.g. Grube et al., 2017; Grube and Rickert, 2019).
Just 1.5 km south-west of Münsterdorf, the chalk is just below the surface (6 m below the ground), and several large open-pit mines exploit the material. The deepest open-pit mine reaches down to 90 m below sea level, which requires a substantial effort to dewater the mines (e.g. Iwanoff, 1998). The pumped groundwater from the open-pit mines is routed via an artificial channel in the east towards the river Stör. In the mines, numerous karst features can be observed, such as dissolutionally enlarged fissures and bedding planes and small collapse sinkholes.
The local sports field is located on the southern rim of the village of Münsterdorf. The chalk can be found here at around 20 m depth below the sports field (see Fig. 1), confirmed by several boreholes (see Kirsch and Werner, 2008; Kirsch et al., 2011; Göthling et al., 2010; and references therein). Above the Cretaceous chalk, we find mainly peri-glacial sand, inter-bedded with glacial till.
From the geological and morphological set-up, we identify three key aspects responsible for the presence of karst structures in the Münsterdorf region:
-
salt diapirism responsible for local tectonics and uplift of Permian and Cretaceous sequences;
-
Cretaceous chalk around 20 m below the sports field;
-
and landscape morphology dominated by ice-age cycles, with deposition of glacial till as a flow barrier.
The glacial till with its lower hydraulic permeability confines groundwater flow, whilst the salt diapirism caused chalk layers to uplift close to the surface (see also Kaufmann et al., 2018).
2.2 Sinkhole cluster
Since 2004, collapse sinkholes have occurred regularly on the sports field (Fig. 2). These collapse sinkholes are about 2–3 m in diameter and about 3–5 m deep, exposing the peri-glacial sand. The sinkholes occur suddenly, often underneath the grass of the sports field, and are initially steep-walled, with near-vertical sides. Most of the sinkholes are filled with artificial material immediately but, if left open (as in Fig. 3), develop towards a mechanically more stable funnel shape. No groundwater can be found in the sinkholes, as the groundwater table nowadays is lower, at about 5–7 m depth, when compared to previous decades (1–3 m depth). Fluctuations due to rainfall are in the sub-metre range. The sinkholes are aligned along a narrow band about 50–70 m wide and 300 m long, striking in a west–easterly direction.
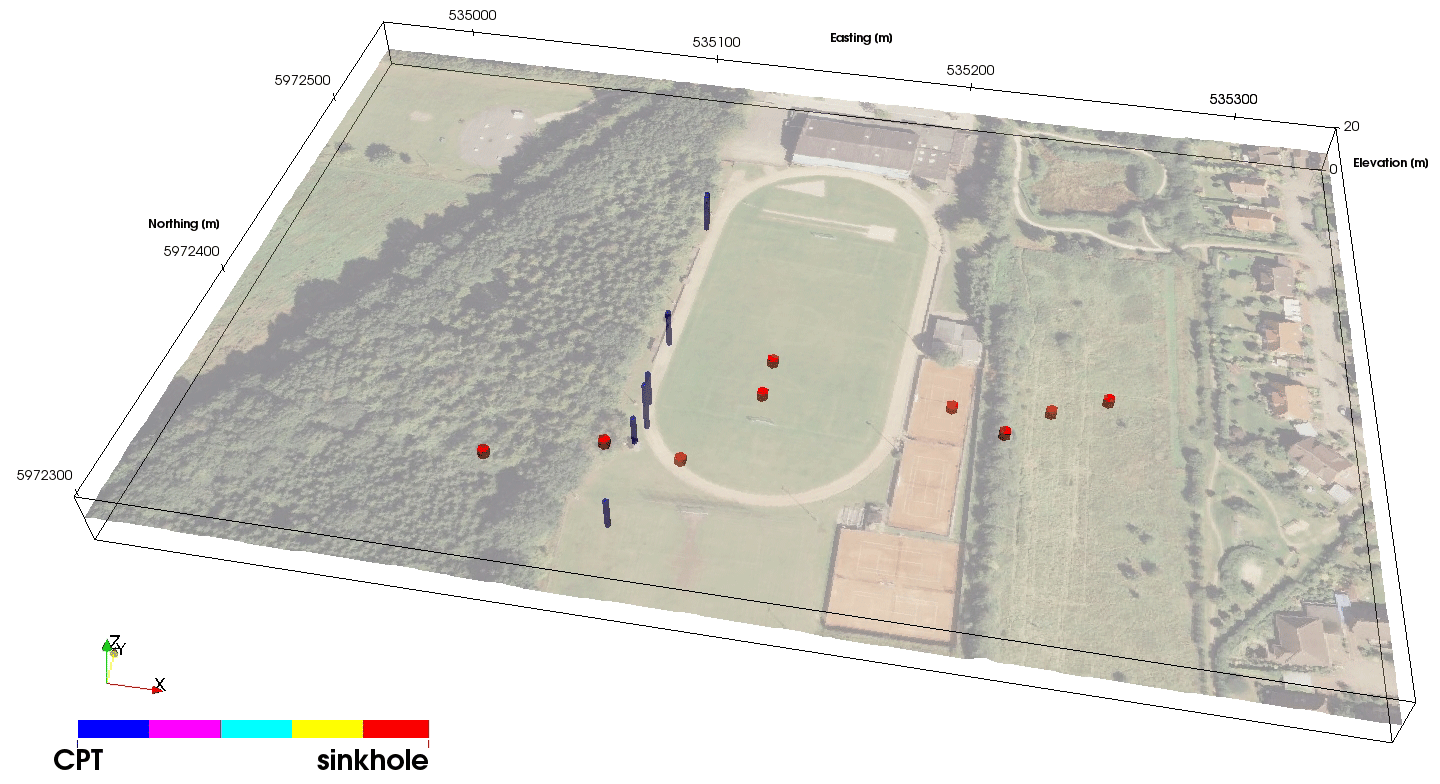
Figure 2Sports field in Münsterdorf, view from the south towards north. Areal photo draped onto topography. The red cylinders mark the locations of the sinkholes, which occur along a narrow west–east trending line. The blue cylinders are direct-push-based probe locations (shown along a south–north profile in Fig. 7). Digital orthophoto © GeoBasis-DE/LVermGeo SH.
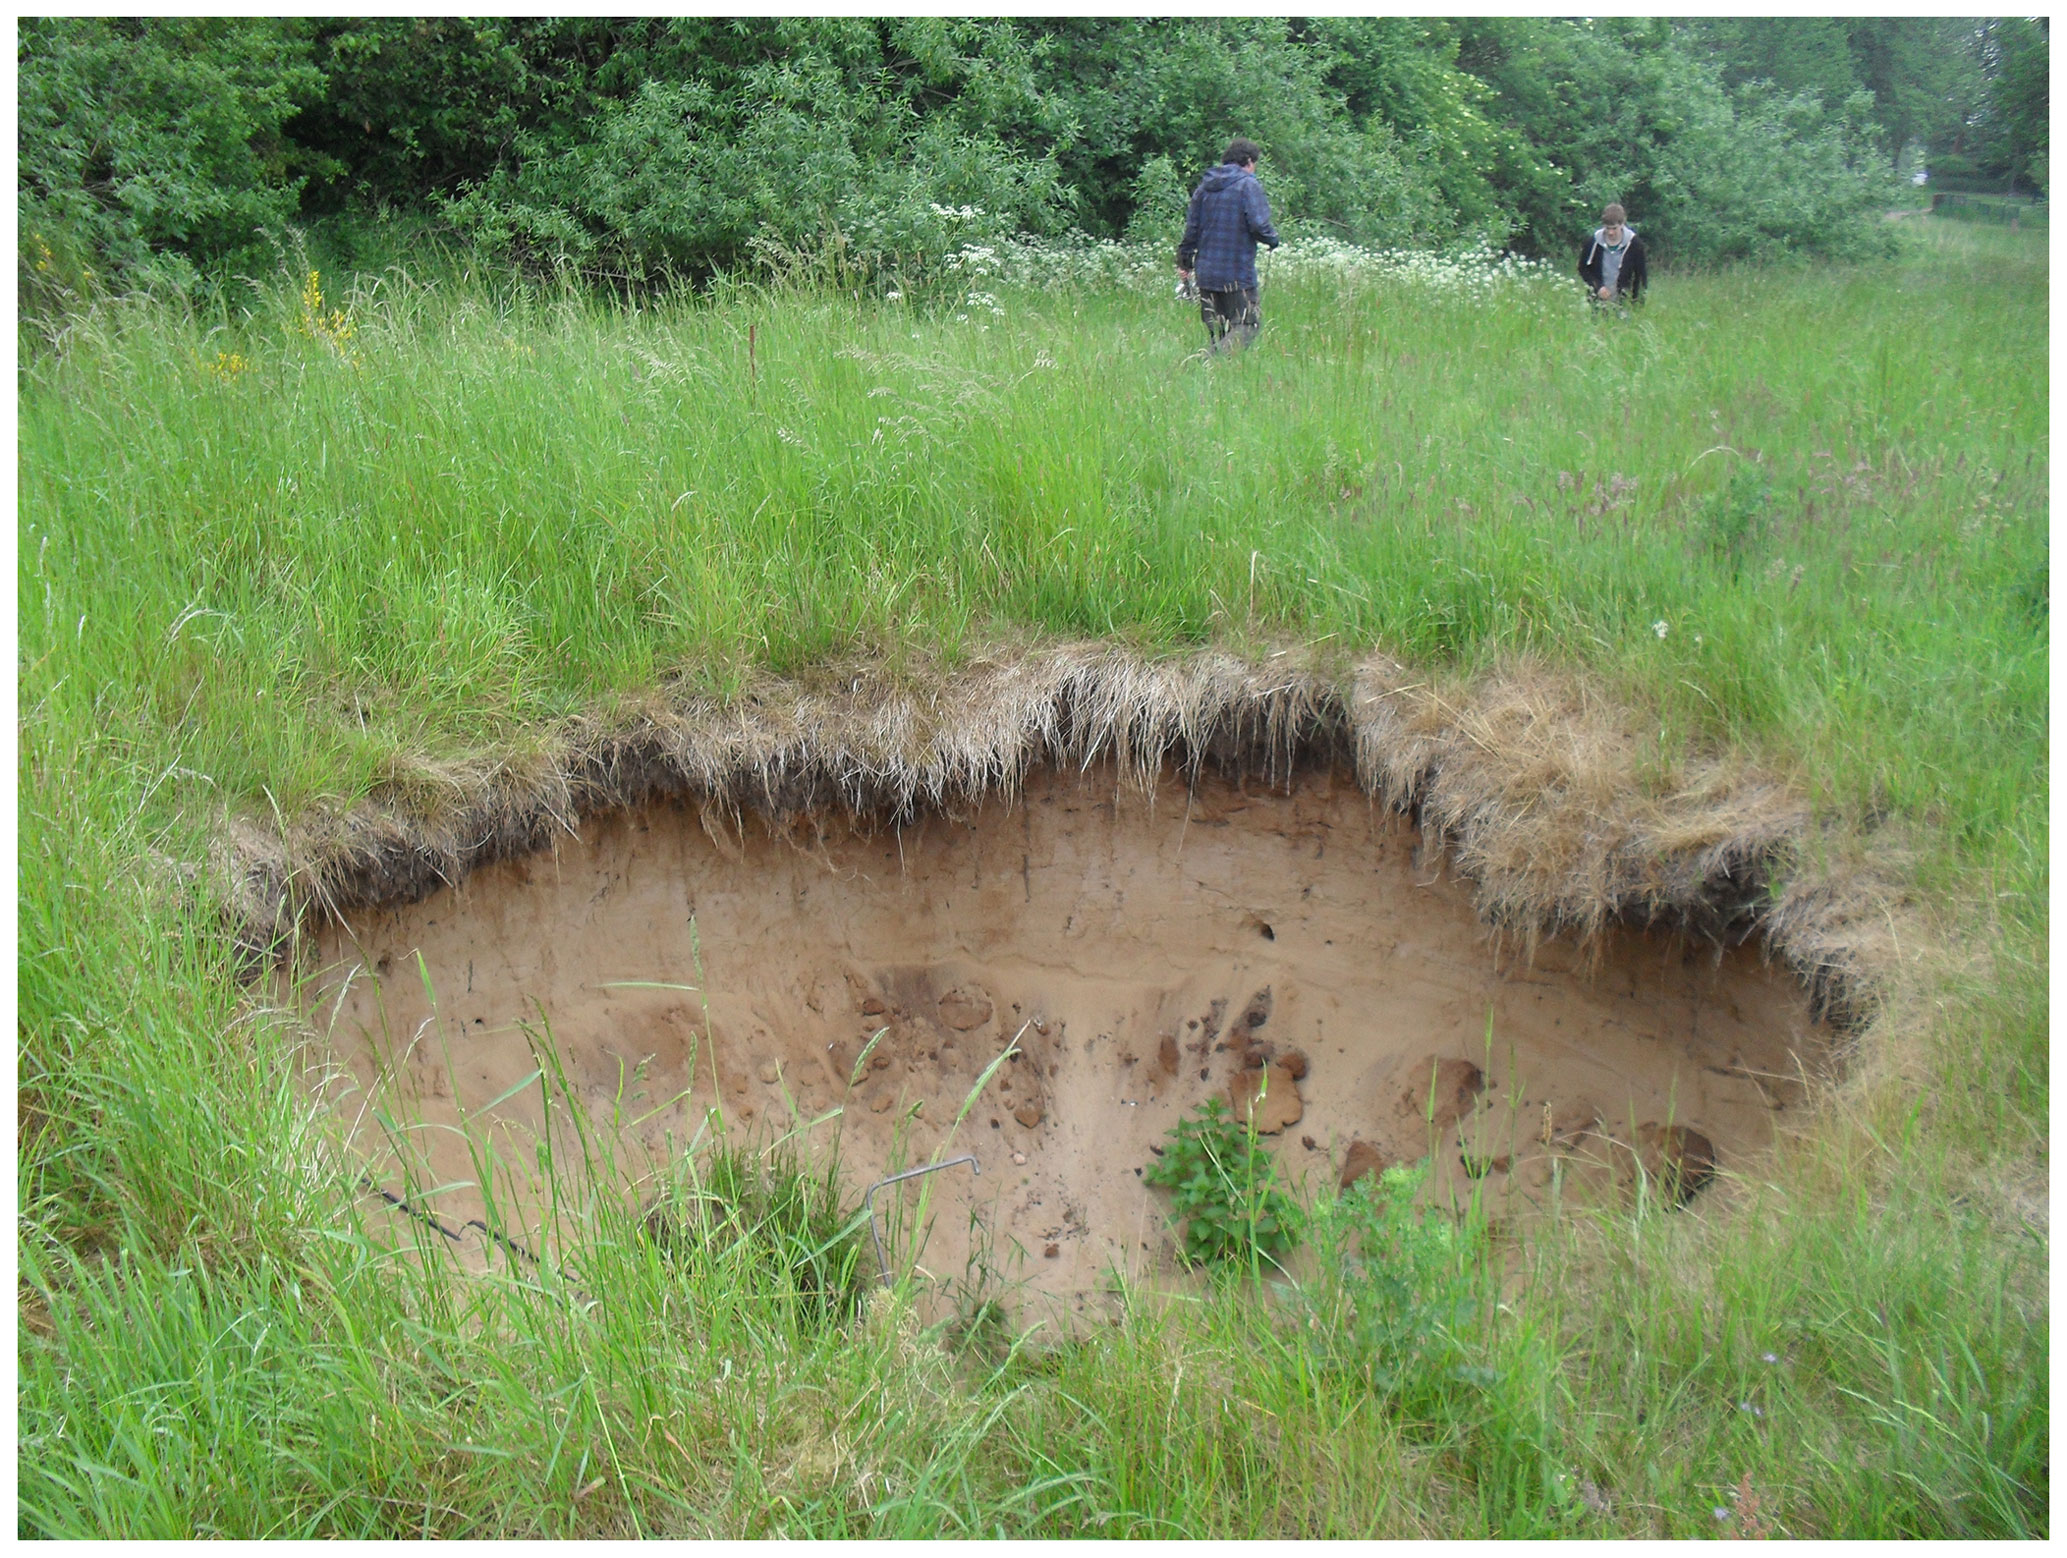
Figure 3Typical sinkhole (2015, east of sports field in the meadow), with a diameter of 2 m, about 3 m visible depth, and the originally vertical slopes already collapsing to form a more stable form (Photo: Georg Kaufmann).
The sudden onset of the sinkhole occurrence and the limitation to the narrow band suggest a relation to a lithological feature in the subsurface and a possible inception by a change in hydraulic conditions (e.g. Kaufmann et al., 2018). Thus, we regard these two aspects as important constraints for the explanation of the collapse sinkholes along the sports field in Münsterdorf: (i) sudden onset in around 2004, (ii) restriction to the narrow west–east band.
Since the sudden onset of sinkholes on and around the sports field in 2004, several geophysical investigations have been carried out (e.g. Kirsch, 2009; Gebregziabher-Gared, 2010; Harland, 2010; Kirsch et al., 2011; Schulze-Dieckhoff, 2015; Timm, 2015; Tippelt et al., 2017; Mai et al., 2017; Kaufmann et al., 2018), with the aim to (i) find the cause of the sinkholes and (ii) characterise the subsurface beneath the sports field.
3.1 Previous work
From the numerous geophysical methods used (gravity, geoelectrics, electro-magnetics, georadar, seismics, borehole-based spectrally induced polarisation; see Table 1 for a summary), especially geoelectrics and georadar have been successful in delineating the glacial till from the peri-glacial sand. In almost all profiles (taken in a north–south direction), the high-resistivity peri-glacial sand is thin (1–2 m) in the north and underlain by more conductive glacial till, while the peri-glacial sand becomes thicker (5–8 m) towards the south, and the glacial till seems to be thinner and more isolated in the south. These results can be explained by the geest island, on which Münsterdorf rests, which peters out towards the south (Fig. 4). Cored boreholes confirm this set-up locally (e.g. Kaufmann et al., 2018).
Kirsch et al. (2011)Kirsch et al. (2011)Kirsch et al. (2011)Kirsch et al. (2011)Kirsch et al. (2011); Gebregziabher-Gared (2010)Kirsch et al. (2011); Gebregziabher-Gared (2010)Schulze-Dieckhoff (2015)Schulze-Dieckhoff (2015)Timm (2015)Tippelt et al. (2017)Mai et al. (2017)Kaufmann et al. (2018)Kaufmann et al. (2018)Kaufmann et al. (2018)Table 1Selected geophysical fieldwork carried out around the Münsterdorf sports field.
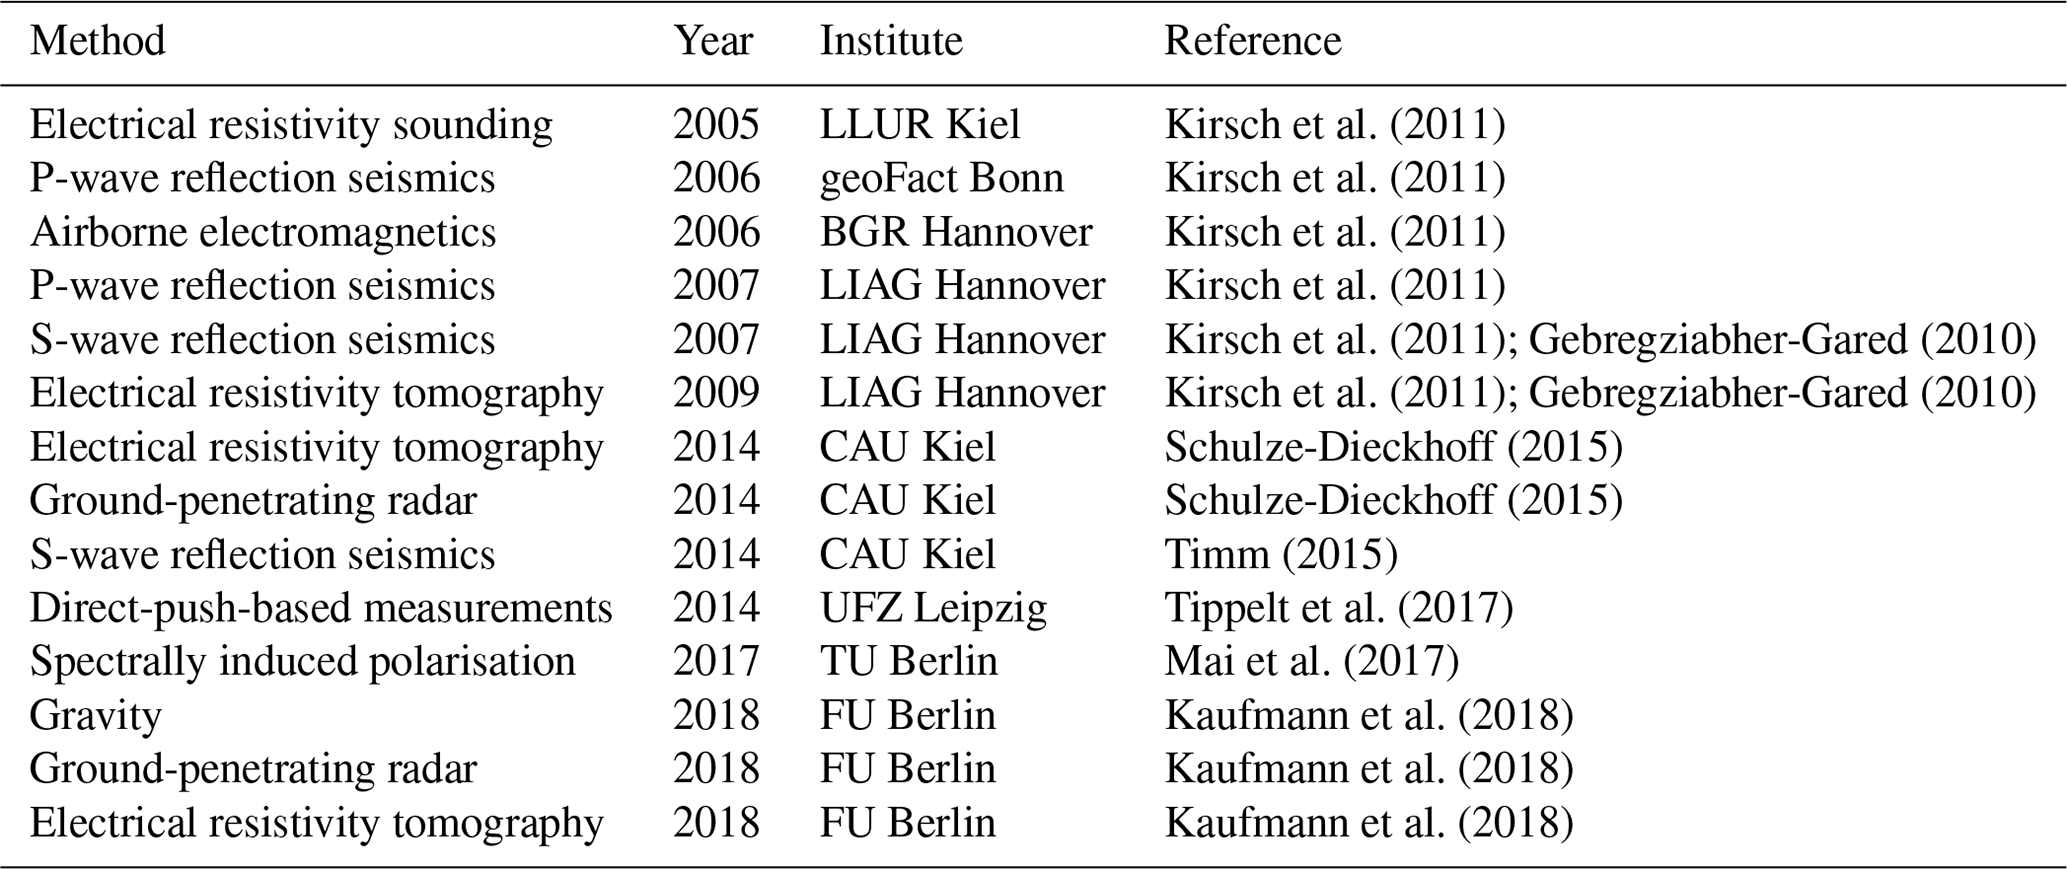
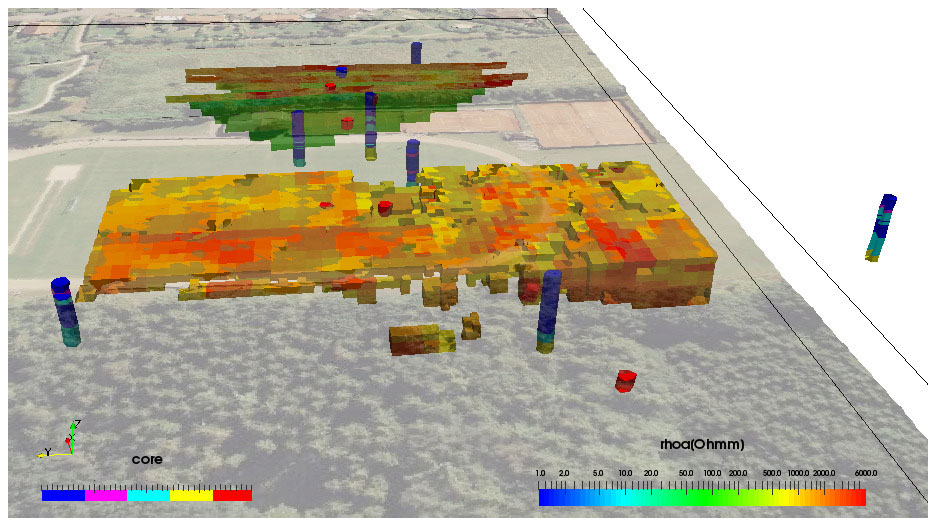
Figure 4Sports field in Münsterdorf, view from the west towards east. The red cylinders mark the locations of the sinkholes, which occur along a narrow west–east trending line. The colour-coded cylinders are boreholes from the LLUR. The blocky area underneath the sports field shows mapped high electrical resistivities above 1000 Ωm from ERT profiles. In the interpretation, the anomaly delineates the dry peri-glacial sand from the more conductive glacial till. Digital orthophoto © GeoBasis-DE/LVermGeo SH.
The chalk layer at about 20 m depth has not been identified in the geoelectric and georadar measurements because electrical conductivities between the chalk and wet till are too similar for the former method and because of depth restrictions for the latter method. However, in seismic p-wave profiles, the chalk layer can be seen.
From the geophysical and borehole measurements, we have derived a simplified lithological set-up underneath the sports field:
-
three layers – peri-glacial sand, glacial till, soluble chalk;
-
peri-glacial sand varying from 2 to 8 m thickness, becoming thicker in the south;
-
massive glacial till layers in the north (several metres thick), petering out towards the south;
-
chalk at an almost constant depth of 20 m below the surface underneath the sports field.
We discuss this simplified set-up in more detail later, with more sub-divisions of glacial sand and till, based on our results of the direct-push-based methods.
We argue that the soluble chalk at shallow depth is accessible to groundwater and thus has the potential to be dissolved, resulting in karstified structures. However, as stated below in our first hypothesis, there is also the possibility that voids are present in the sand layers.
3.2 Hypothesis
To start our discussion on the origin of the subsurface voids, we propose two different competing scenarios for the development of the collapse sinkholes.
-
Non-karstified. The initial void causing the sinkhole collapse has developed above the lower till layer, at about 6–8 m depth in the peri-glacial sand.
As we know the sinkhole sizes (w=2–3 m diameter, d=2–5 m depth), the initial void should have a volume around m3, a substantial initial void, which at this depth should possibly be detectable by geophysical methods. We try to estimate the effect on gravity and ERT (electrical resistivity tomography) surveys below.
We note that in this scenario the initial void would be located in insoluble unconsolidated rocks; thus the origin of the void cannot be dissolution of material, only either removal of material by erosion or melting of a block of ice. We then have to ask ourselves why such a void is only present along the narrow band on the sports ground, and not much more widespread, as expected in a landscape dominated by glacial features.
-
Karstified. The initial void causing the sinkholes developed in the chalk at around 20 m depth by chemical dissolution of the rock. The initial void volume must be similar to that above.
In Kaufmann et al. (2018) we have argued that initial voids can have developed in the top part of the chalk because surface water undersaturated with respect to calcium is diverted into deeper zones. The reason for surface water to reach the chalk layer is the lower hydraulic conductivity of the glacial till, which is more prominent underneath the northern part of the sports field. This massive glacial till in the northern section of the sports field acts as a flow barrier, forcing surface water to greater depths. Here, the aggressive water with calcium concentrations below the calcium equilibrium concentration creates (on timescales of 10 000–100 000 years) dissolutionally enlarged voids, having metre-size dimensions. The voids are mechanically meta-stable because the water in the voids with its buoyancy counteracts gravity (which we show later by modelling).
In this case we speculate that the overconsolidated lower peri-glacial sand layer, which is directly above the initial void, has been loosened and then slowly drops into the karst void, but the layers above the peri-glacial sand were kept in place by the finite strength of one of these layers. Thus the initial void started migrating upwards, into the saturated zone. A drop of the groundwater table through mining (as discussed in Kaufmann et al., 2018) then removed the buoyant support for the overburden, and the upper layers finally collapse.
3.3 Geophysical forward modelling
In our summary of the geophysical work done over the years, we mentioned the identification of the lithological set-up of the region around the sports field. However, geophysical exploration was less successful in identifying the subsurface voids causing the collapse sinkholes. Only old sinkholes show a faint signal in georadar and (in parts) in geoelectrical measurements.
We therefore present results from forward modelling of gravity and geoelectrical signals induced by subsurface voids in a simplified set-up (Figs. 5 and 6): a top layer of dry peri-glacial sand (0–10 m), followed by a wet layer of peri-glacial sand (10–20 m), and below the soluble chalk (>20 m). We do not include a glacial till layer, as (i) the model depicts the situation close to the transition zone from thicker glacial till to thin, more isolated glacial till, and (ii) the material properties of the glacial till, especially electrical resistivity, are not too different from the wet chalk.
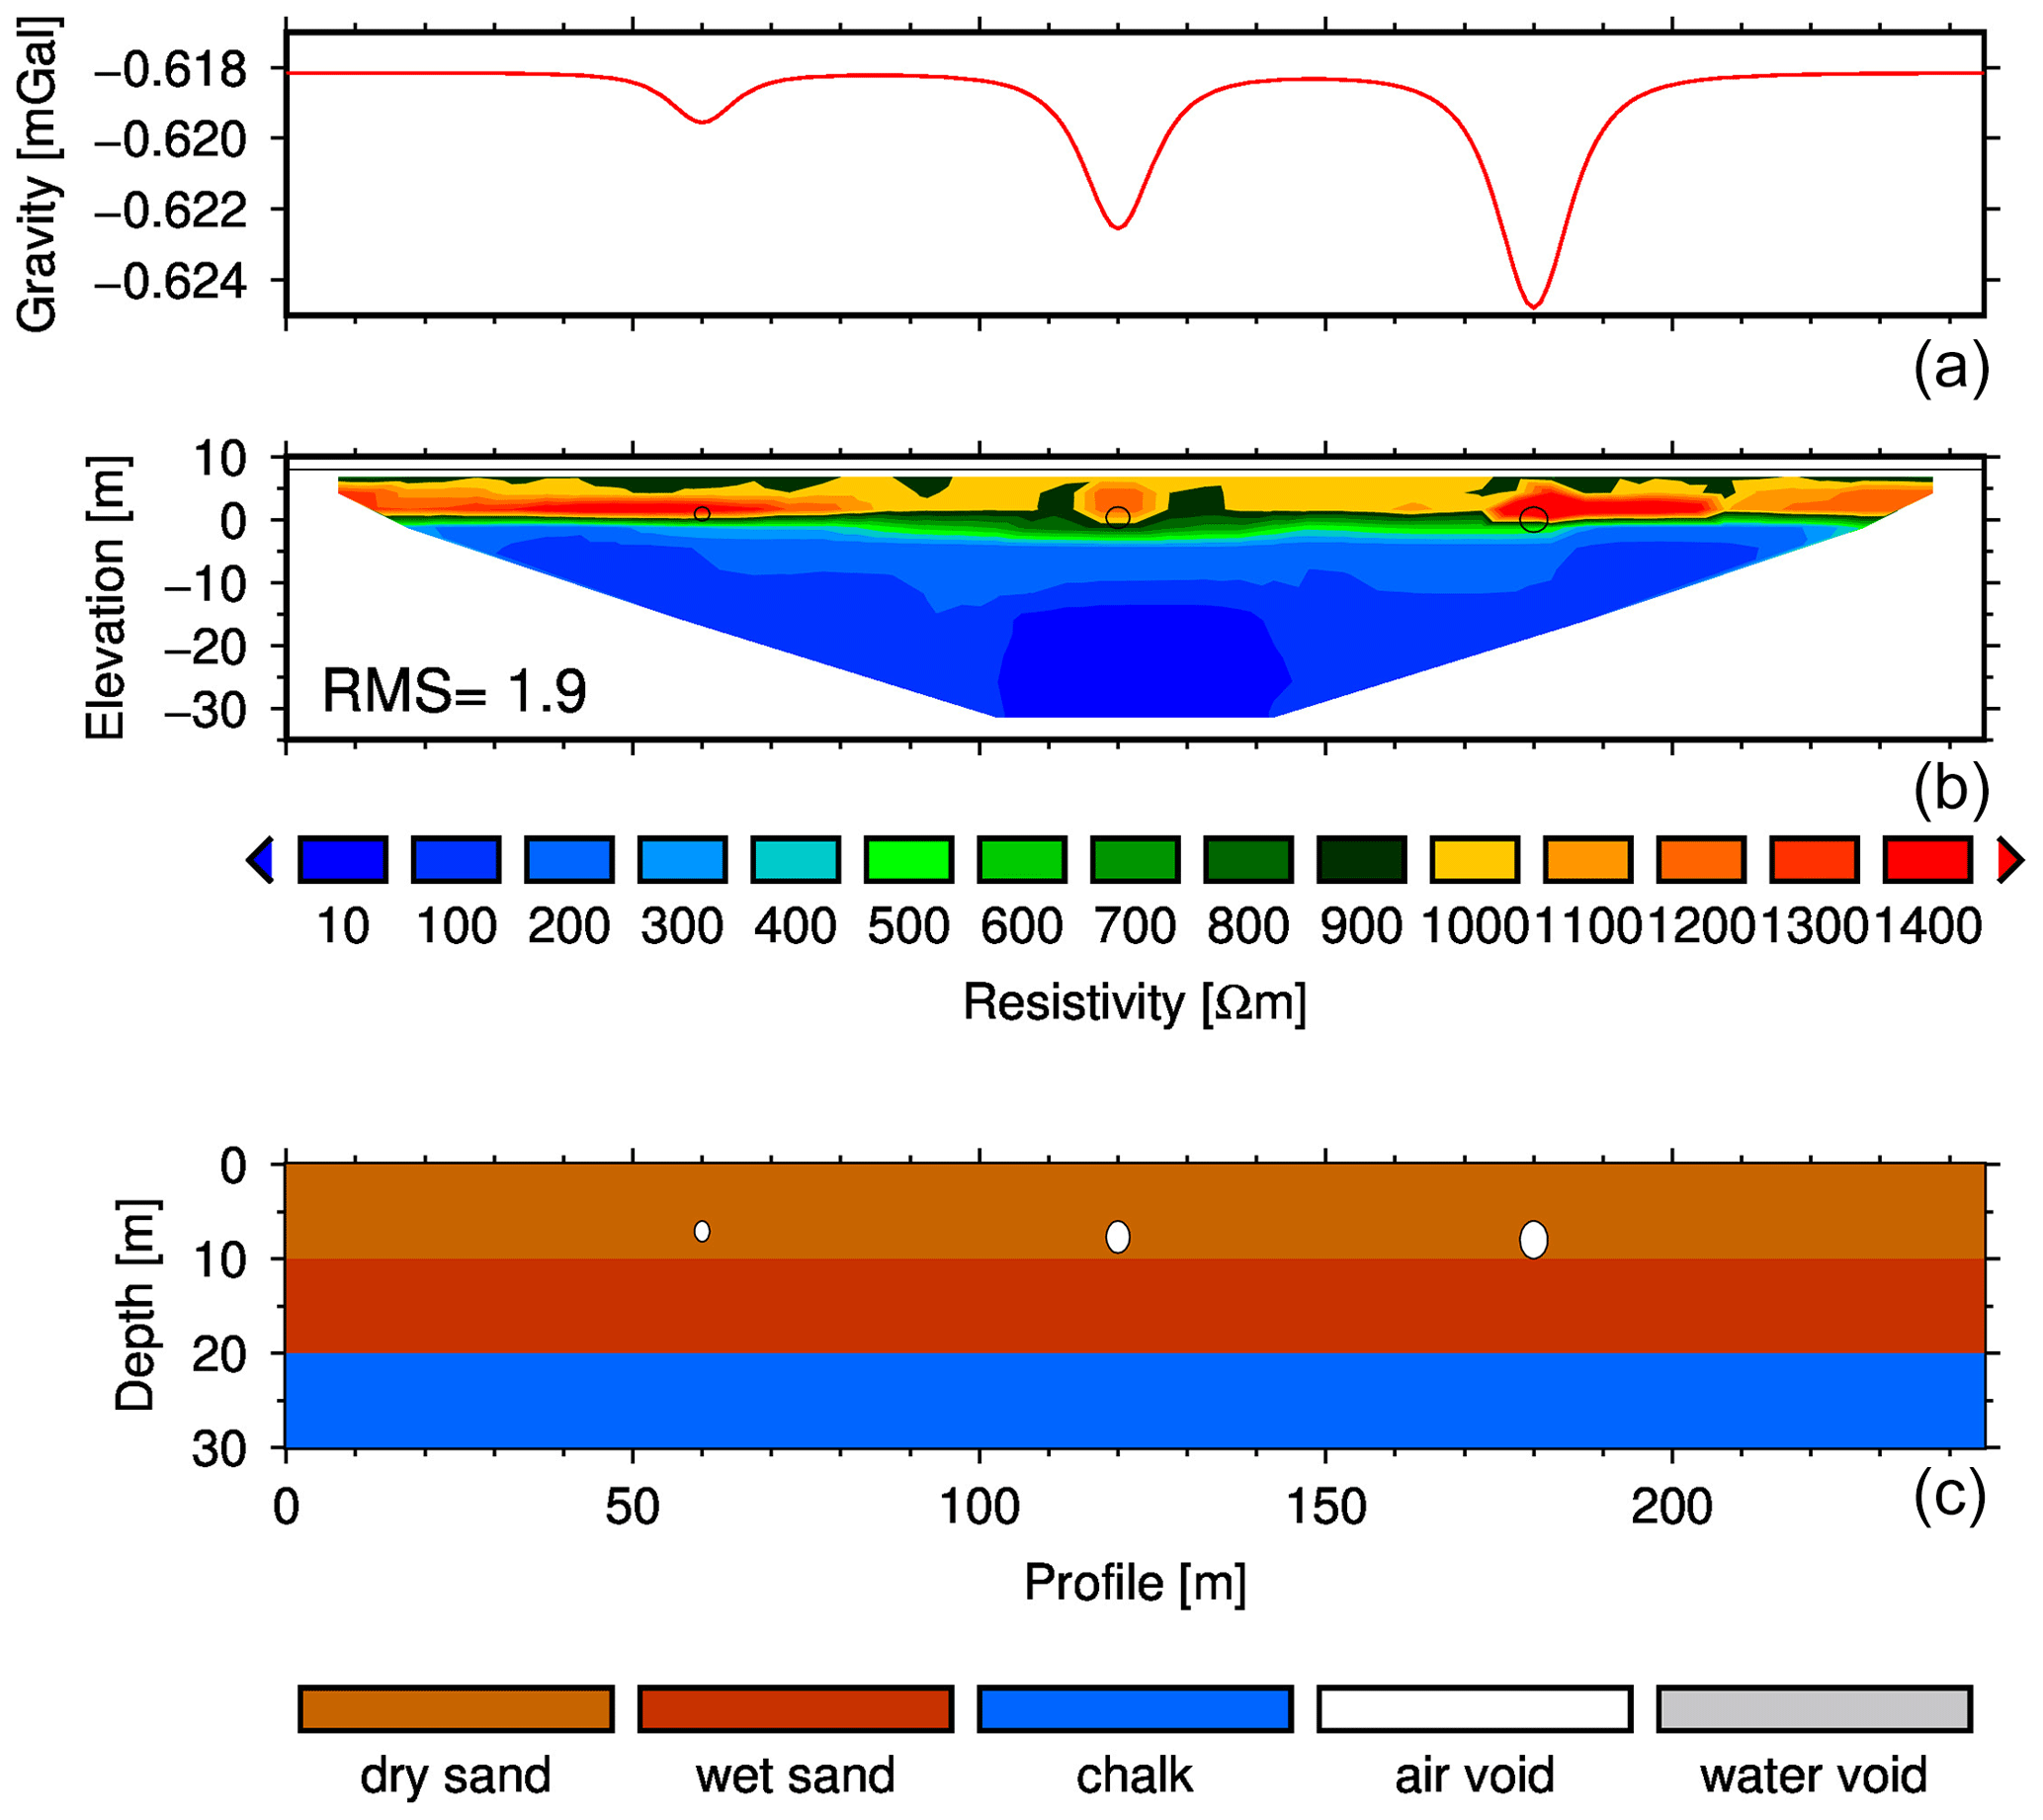
Figure 5Prediction for Bouguer gravity (a) and electrical resistivity (b) resulting from a given lithological structure (c). The structural model (c) comprises dry and wet peri-glacial sand (brown and red), chalk (blue), and either air-filled (white) or water-filled (grey) voids. For the first hypothesis, we located air-filled voids at around 6 m depth with radii (from left to right) of 1.1, 1.7, and 2.0 m. Density and electrical resistivity values can be found in Table 2. Gravity predictions are based on a box geometry model, and electrical resistivity predictions are based on a Wenner set-up with 5 m electrode spacing.

Figure 6As Fig. 5, but voids are water-filled (1000 kg m−3 and 0.5 Ωm) and start at 20 m depth.
Depending on the hypothesis, voids are either (i) in the peri-glacial sand (air-filled; see Fig. 5) or (ii) in the chalk (water-filled; see Fig. 6). Material properties are listed in Table 2.
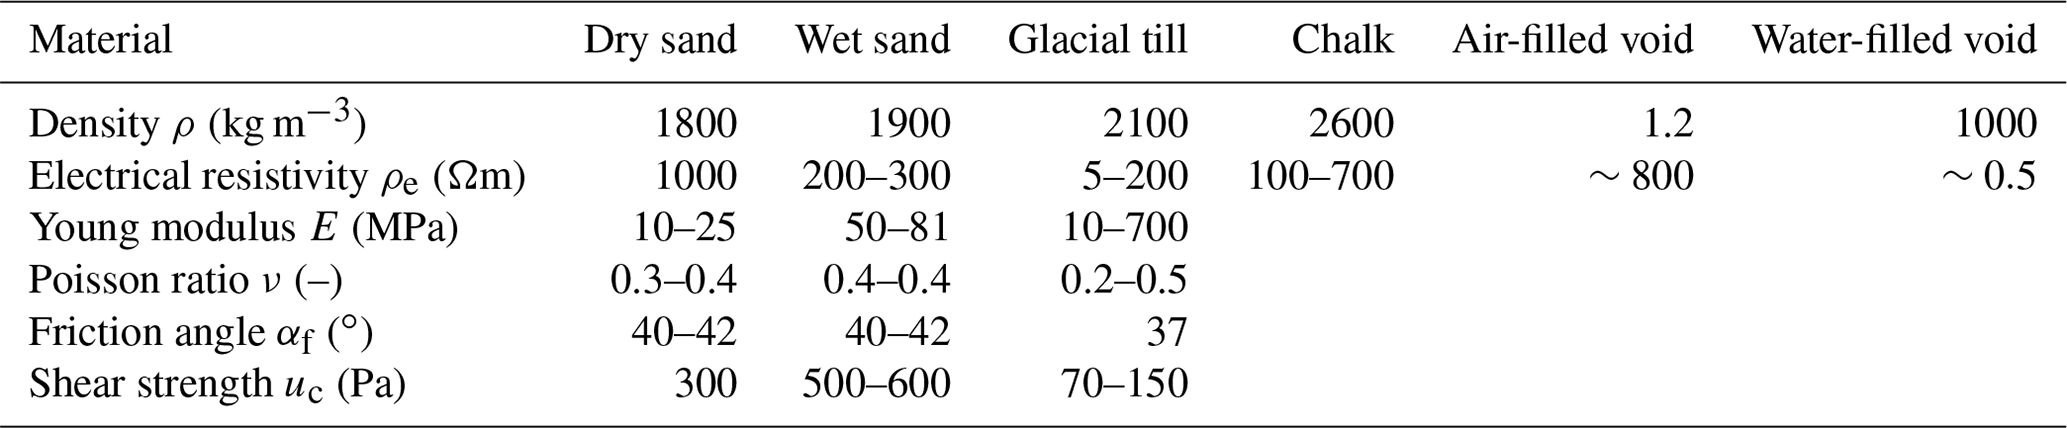
Table 2Material properties for different lithological layers beneath the Münsterdorf sports field. Density and electrical resistivity from Kaufmann et al. (2018). Young modulus and Poisson ratio from Bowles (1997) (sand and till) and Olsen et al. (2008) (chalk).
The gravity forward model is based on box models for the lithological layers and spheres for the voids (e.g. Blakely et al., 2004). All density values are referenced against the chalk density; thus the calculated Bouguer gravity values will be negative, as peri-glacial sand and voids have lower densities when compared to the chalk.
For the electrical resistivity model, we first create a 2D forward model with res2Dmod (e.g. Loke, 2016) to calculate apparent resistivities for the given set-up. Then, these apparent resistivities are perturbed by random noise (2 %) and then loaded into res2Dinv (e.g. Loke and Barker, 1995, 1996) to find the resulting resistivity model from inverse modelling.
Following our two hypotheses for the void origin, the non-karstified and the karstified case, we define two forward models with voids at different depths: (i) shallow origin (6–8 m) in insoluble dry sand – air-filled voids, (ii) deeper origin (20–22 m) in soluble chalk – water-filled voids. We locate three voids in these two different depth ranges, with increasing radius from left to right (1.1, 1.7, and 2.0 m) to account for the uncertainty in initial void volume introduced before.
-
Non-karstified. In the non-karstified set-up (Fig. 5), the voids are located in the dry peri-glacial sand. The Bouguer gravity is negative because the density of the peri-glacial sand (1800–19 000 kg m−3) is lower than the density of the chalk (2600 kg m−3), which we took as a reference density. The air-filled voids are modelled with a density of 0 kg m−3. All three initial voids are visible in the Bouguer signal, but the amplitude (less than 1 mGal) would be hard to detect within the accuracy of a typical relative gravimeter.
In the ERT cross section, we used electrical resistivities of 1000 Ωm for the dry peri-glacial sand and 800 Ωm for the air-filled voids. Below, both the wet peri-glacial sand and the chalk are more conductive, with values around 200 Ωm. The resulting resistivity model can distinguish between dry sand and wet sand/chalk but does not reveal the void spaces, as their resistivity is too close to the one of the dry sand.
-
Karstified. In the karstified set-up (Fig. 6), we moved the voids down to the top of the chalk, with a water-filled void density of 1000 kg m−3 and a void resistivity of 0.5 Ωm, resembling water with dissolved ions. The Bouguer gravity signal now is rather uniform, reflecting the mass deficit of the peri-glacial sand, but no clear indication of the voids. In the ERT cross section, resistivities again identify the interface between dry and wet sand, but the low-resistivity voids within the low-resistivity chalk cannot be seen.
From this simple forward-modelling exercise, we would expect to find hints for initial voids from geophysical signals (mainly gravity), if these initial voids would be in the shallow peri-glacial sand. For a deeper-seated origin of the voids, e.g. in the chalk, no clear geophysical signal in either gravity or geoelectrics can be expected. As outlined in Kaufmann et al. (2018), we have not found evidence for subsurface voids in the geophysical data.
In this section, we discuss results from direct-push-based methods applied to several locations on the sports field, which we use to characterise the hydrogeological regime and relevant mechanical parameter values for the site. The results from the direct-push-based methods provide high-resolution data for geomechanical and hydrogeological properties of the subsurface.
These new field data will complement the existing geophysical data set used to derive a lithological model for the Münsterdorf sports field and its vicinity. For the numerical modelling discussed later, the results from the direct-push-based methods are mandatory to calibrate the models.
The area around the sports field has been probed extensively by several direct-push-based methods (e.g. Vienken et al., 2012). These versatile in situ measurements can be used in unconsolidated and weakly consolidated sediments to obtain vertical high-resolution profiles of a number of material properties, e.g. mechanical failure criteria, hydraulic parameter values, and electrical conductivities, as we outline below. From the measured parameter values listed above, several hydrological and mechanical material properties can be derived.
- i.
HPT (hydraulic profiling tool). Water is injected with a flow rate Q (m3 s−1) from the direct-push-based probe into the surrounding unconsolidated rock, and the back pressure P (Pa) is measured and used to delineate hydro-stratigraphic units within the subsurface. The ratio of flow rate and back pressure (corrected for air pressure and hydro-stratigraphic pressure) can be used as a proxy that can be correlated to hydraulic conductivity, K (m s−1), of the material probed (e.g. Rogiers et al., 2014). Relative HPT hydraulic conductivity, referring to the ratio of HPT injection rate Q and back pressure P, can be correlated with hydraulic conductivity ΔKh (m s−1; e.g. McCall, 2011):
Note that Q is in millilitres, and P is in pounds per square inch in this ratio.
- ii.
EC (electrical conductivity). By injecting an electric current I (A) from the probe into the ground and measuring the resulting electrical potential U (V), electrical conductivity σe (Sm) can be calculated (e.g. Christy et al., 1994).
- iii.
CPT (cone penetration testing). A cone can be pushed at constant speed into the ground, and the force at the tip of the cone can be measured and normalised to the cone surface area to obtain the cone pressure qc (Pa). Additionally, the force acting along the side of the cone can be measured and normalised by the so-called sleeve area to obtain the sleeve friction fs (Pa) (Lunne et al., 1997). To estimate the failure of the material under stress, both the friction angle αf and the shear strength μ0 can be derived. The friction angle is related to the cone pressure qc (DIN Deutsches Institut für Normung e.V., 2011):
with the function f tabulated in geotechnical manuals (e.g. DIN Deutsches Institut für Normung e.V., 2011).
The undrained shear strength uc (Pa) can be calculated from the cone pressure qc and the overburden stress qv0 (Pa) as (Lunne et al., 1997)
with Nk an empirical cone factor, around Nk∼17 for overconsolidated clays (e.g. Kjekstad et al., 1978) and Nk∼11–19 for normally consolidated marine clays (e.g. Lunne and Kleven, 1981). The overburden stress can be approximated as qv0=ρgh, with ρ (kg m−3) the average density, g (m s−2) gravitational acceleration, and h (m) the thickness of the overburden.
With the two quantities friction angle and undrained shear strength, the shear stress σs (Pa) as a function of normal stress σn (Pa) can be defined as
which can be used to evaluate the likelihood that the material will break under certain applied stresses. Here, we assume μ0≃uc. From cone pressure qc and sleeve friction fs, the soil-behaviour type (SBT) index can be calculated following Robertson (2016):
with our cone pressure qc defined earlier, pa (Pa) the atmospheric pressure, the friction ratio, and fs (Pa) the sleeve friction defined earlier. The SBT index characterises soil types, as it maps the qc–fs parameter space, and thus the position in the Mohr circle.
- iv.
SMP (soil moisture probe). Electrical permittivity ϵr (–) can be measured in the frequency domain to derive the soil moisture content Θ (–), which for the saturated zone is equal to the porosity Φ (–; e.g. Vienken et al., 2013). From the dielectric permittivity ϵr measured, we can derive the volumetric water content Θ (–) from an empirically fitted relation (e.g. Topp et al., 1980):
In the saturated zone, the volumetric water content is equal to the porosity Φ (–): Θ=Φ.
All direct-push-based methods listed above have been carried out along a south–north transect on the western edge of the sports field; thus the locations are aligned perpendicular to the sinkhole zone (for locations see Fig. 2).
The following lithological units can be identified from the combined interpretation of the direct-push-based methods (Fig. 7): (i) well-sorted sand and silty sand (peri-glacial sand), (ii) poorly sorted sand/till layers (glacial till), (iii) dissolved chalk along the maximum depth reached by the direct-push measurements. Thus, the direct-push-inferred set-up provides more details when compared to the simpler lithological structure derived earlier from other geophysical methods. The glacial till can be further sub-divided into an upper discontinuous layer (3–5 m depth) and a lower, more continuous till layer (10–12 m depth). The lower till layer can be characterised as aquitard based on the results from the HPT measurements.
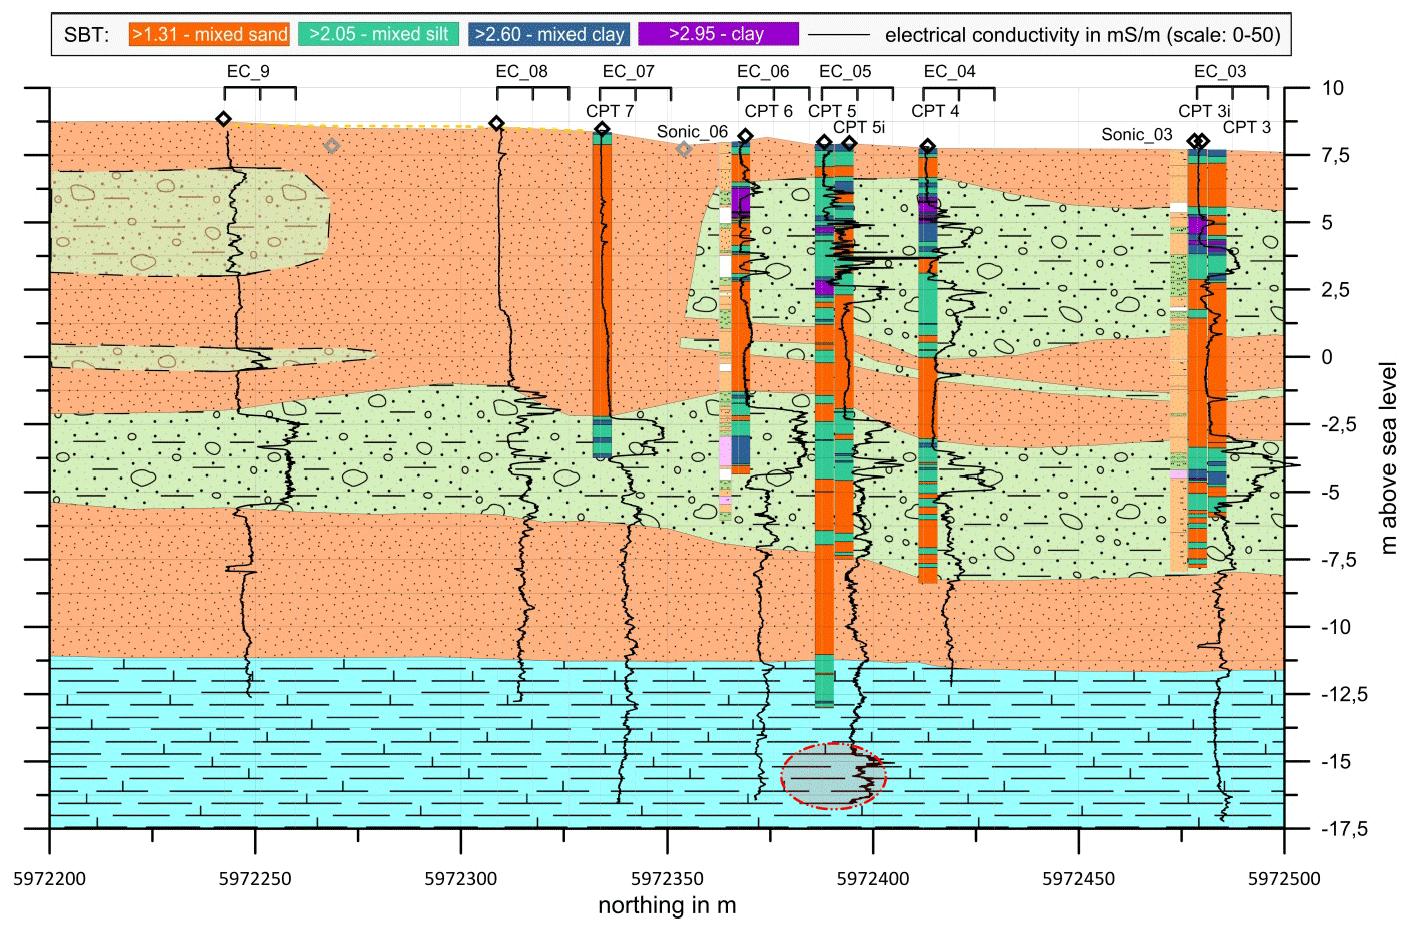
Figure 7Results from direct-push-based methods, plotted along a south–north transect. Direct-push-based locations are labelled on top (EC_x,CPT_x, with x the core number). Borehole transects show the calculated soil-behaviour type (SBT; legend on top) and additionally electrical conductivity (EC; solid lines). The colours in the background represent the structural model interpolated from the direct-push-based results (orange: peri-glacial sand; green: glacial till; blue: chalk).
It is interesting to note that the direct-push-based profile performed at investigation point 5 (see Fig. 7) reveals an isolated depth interval of increased relative hydraulic conductivity within the chalk. This isolated interval is also characterised by increased values of measured electrical conductivity. The combination of these two elevated parameter values can be interpreted as a karstified zone, having a high hydraulic conductivity and water enriched with dissolved species from the chalk, e.g. calcium and bicarbonate. This is also supported by a CPT log that was performed through an artificially filled sinkhole at approximately 10 m distance from the HPT probing location 5. This CPT log, which was in contrast to the other CPT measurements able to reach into the chalk layer, shows an area with very low cone resistance (indicating very weak and/or loose material) between 22–27 m below the ground surface.
Mechanical properties have been estimated from the CPT measurements (see also Table 2). While the glacial till seems to have a friction angle around and an undrained shear strength around uc≃70–150 Pa, the peri-glacial sand is stronger, with a friction angle around αf≃40–42∘ and an undrained shear strength of uc≃300 Pa in the upper part and up to uc≃500–600 Pa in the lower part of the cross section. It seems that the lower package of peri-glacial sand is overconsolidated, a result from the high normal stress induced during the ice-covered phases (Elsterian and Saalian). The peri-glacial sand above the lower till layer is also strong, except in the zone where the sinkholes occur (friction angles around ).
From the results of the direct-push-based methods, with the almost continuous lower till layer being (at least in parts) an aquitard, we continue discussing mechanical models for the sinkhole collapse to elucidate which of our two hypotheses is more likely.
In this section, we introduce and discuss mechanical concepts and models, which we use to describe the sudden occurrence of collapse sinkholes on the sports field. We start with simple analytical stability considerations, which serve as a base for more complicated discrete-element mechanical deformation models.
5.1 Simple mechanical models
We first discuss two simple end-members of a situation prone to collapse sinkhole generation (e.g. Panno et al., 2013; Messerklinger, 2014): a first case considering buoyancy only and a second case assuming that some of the stresses are supported by a stronger elastic material.
5.1.1 Buoyancy-driven model
We define a two-layer set-up (Fig. 8 top), with consolidated sediments of thickness H (m) on top and a density of ρs (kg m−3), underlain by soluble rock of density ρc. Below the depth H, a circular void of radius a (m) is present, created by dissolution of the rock. The void is either water-filled, with the density of water ρw≃1000 kg m−3, or air-filled, with a density of ρa≃0. Thus, in this set-up, a vertical cylinder (thin dashed line) with cross section A=πa2 (m2) and volume V=πa2H (m3) hangs above the void and is kept in place by buoyancy and friction along its side walls.
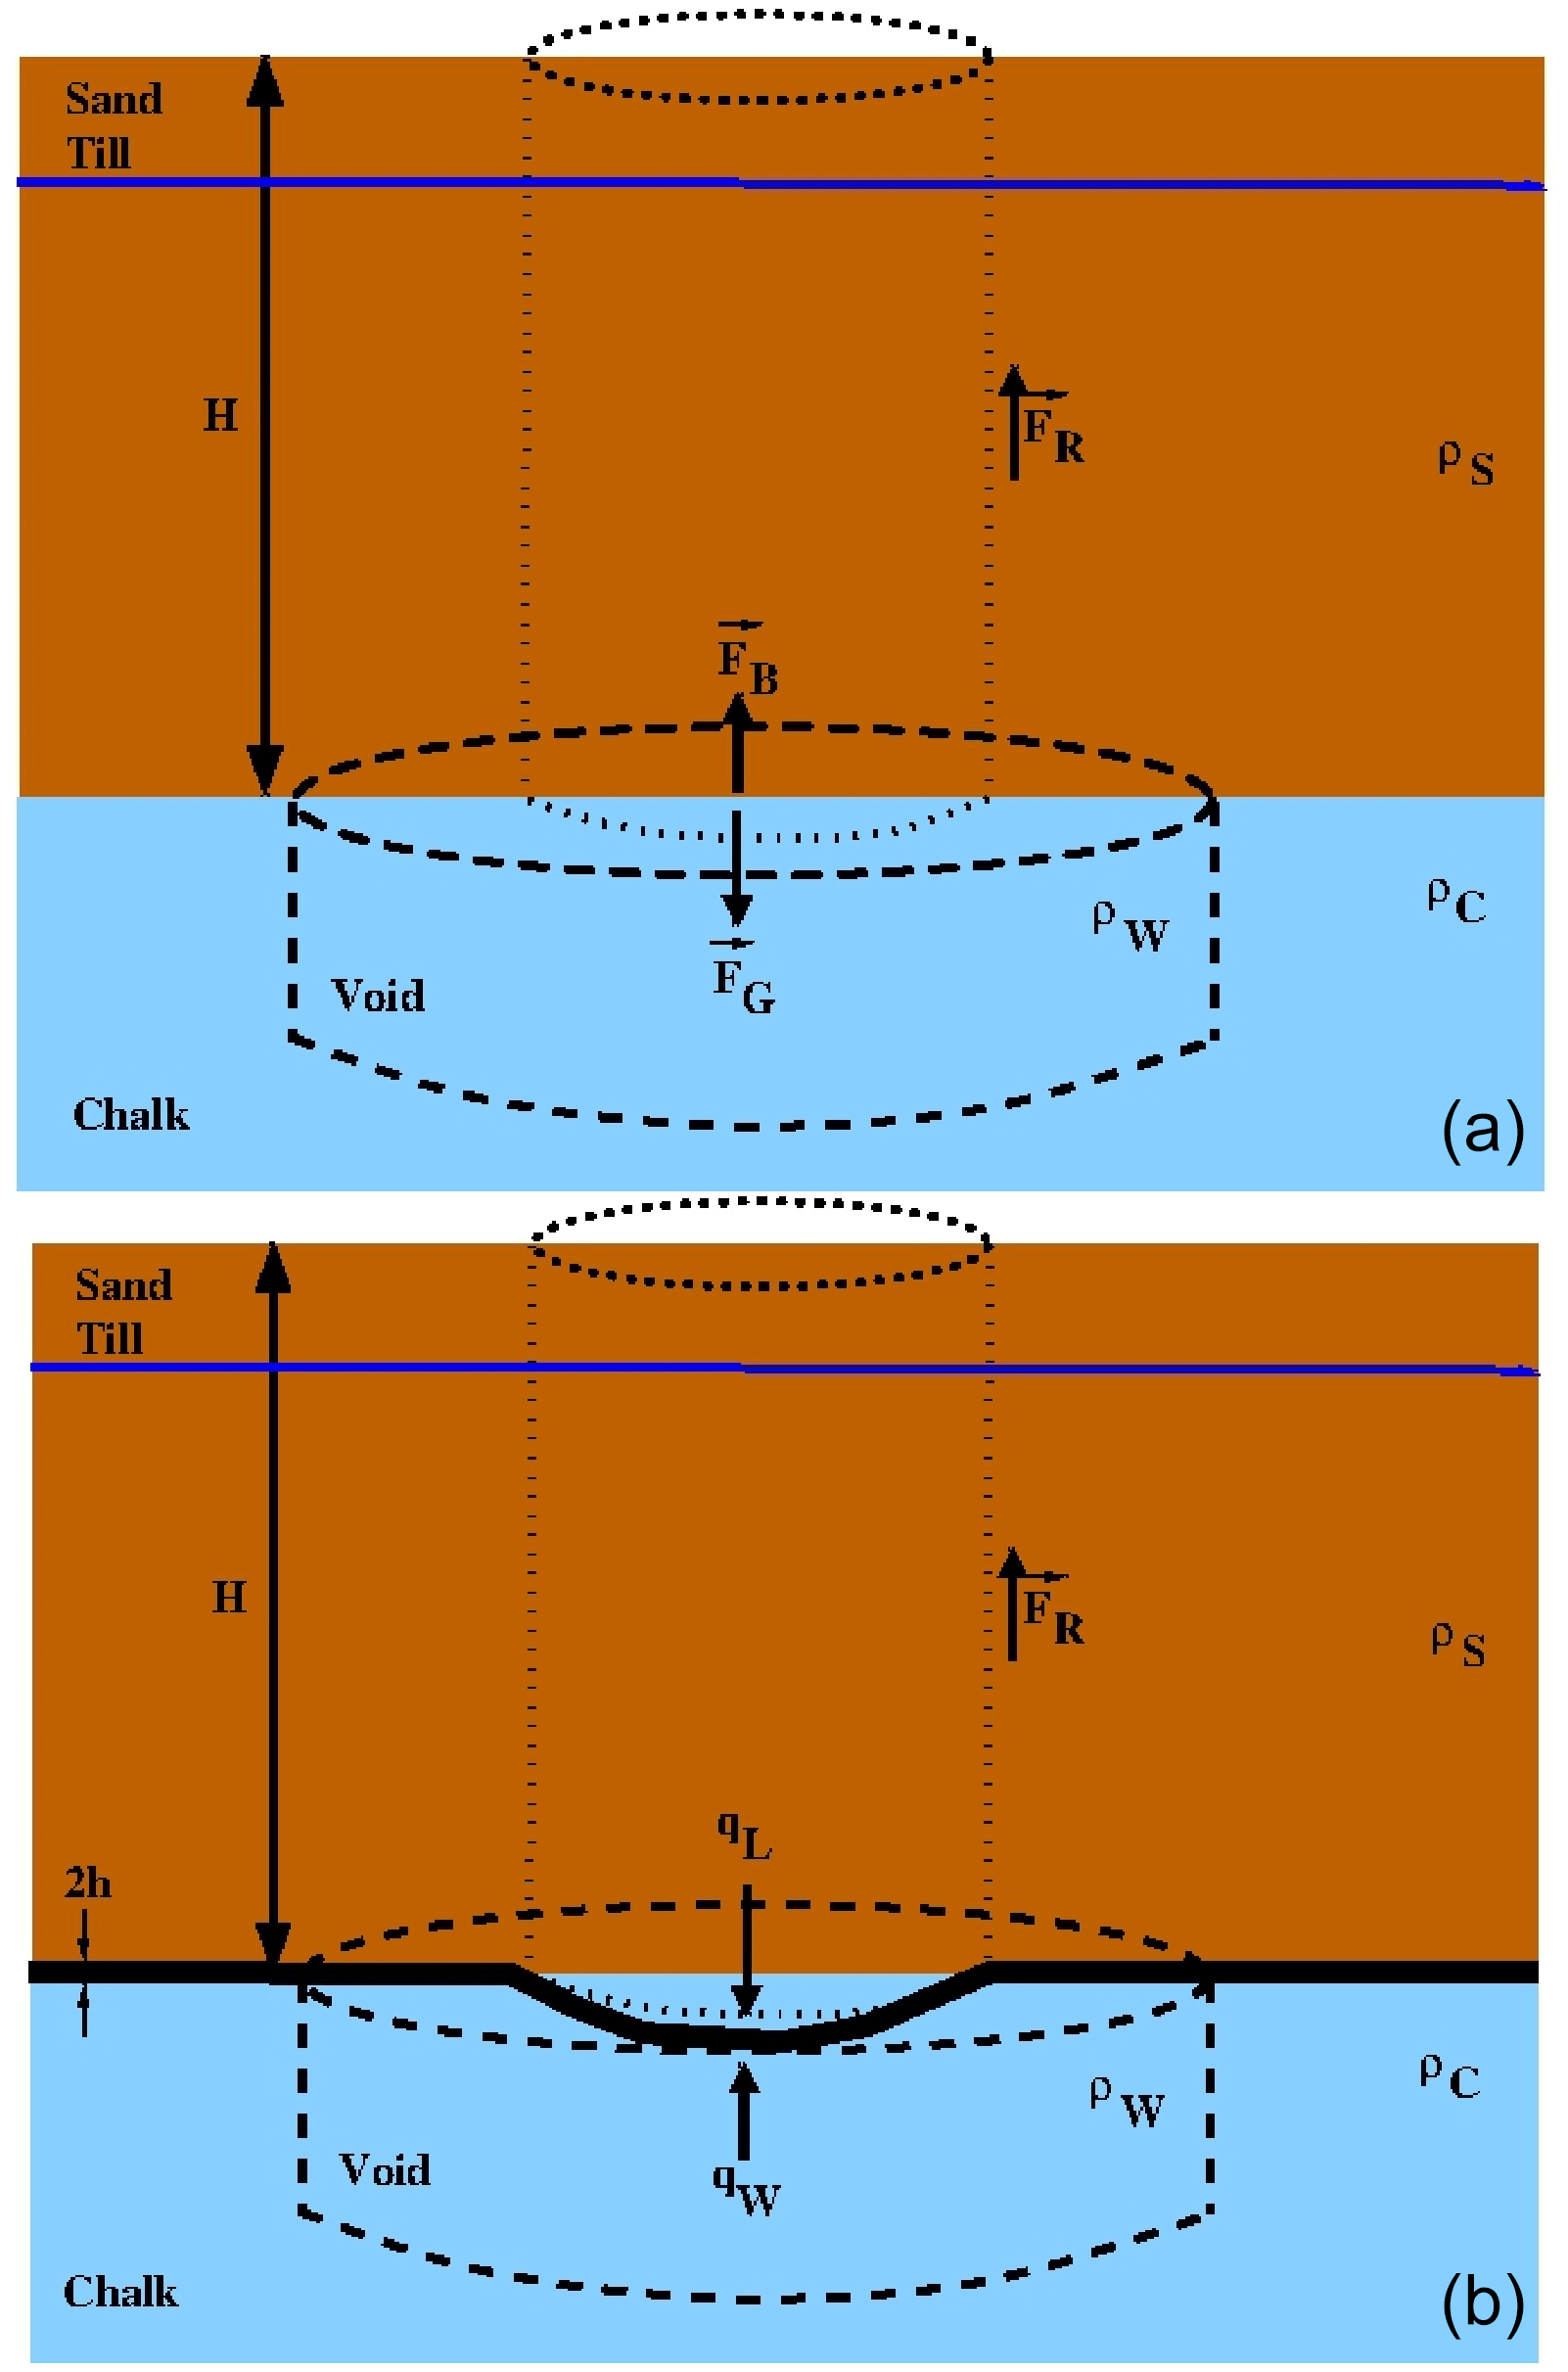
Figure 8Simple mechanical sinkhole set-up. (a) Buoyancy-driven sinkhole, void as thick dashed line, sediment pile on top as thin dotted line, forces as black arrows, water table as blue line. H is the sediment thickness. (b) Flexure-driven sinkhole, parameter values as above; 2h is the thickness of the elastic plate.
We then can derive a force balance:
with FG and FB (N) the gravitational and the buoyancy forces, acting in the normal direction, and FR the frictional force, acting on the side of the column. Considering only the vertical component of the force balance (e.g. ) and solving for the frictional force, we obtain
Note that the variable ρw/a means either water or air density. Rewriting Eq. (8) to a shear stress by using (Pa), with AR=2πaH the side hull of the cylinder, we obtain
We now define a standard model with parameter values similar to the Münsterdorf sinkholes: sinkhole radius a=1.5 m, depth of unconsolidated rock column above void H=20 m, and gravitational acceleration g=9.81 m s−2. For a sediment density of ρs≃2000 kg m−3, a water density of ρw=1000 kg m−3, and air density of ρa=0, as shear stress we find for a water-filled and an air-filled void, respectively,
This result exemplifies the minimum shear stress needed to support the hanging column in both cases, water-filled and air-filled cavity. If the measured shear stress is above the maximum value of 15 kPa, the hanging column remains stable, and the void is kept open. For shear stresses below this threshold, the column drops into the void, and a collapse sinkhole forms.
5.1.2 Flexure- and buoyancy-driven model
For the second example (Fig. 8 bottom), we consider the same set-up as above, but this time the vertical cylinder is held in place by a thin (2h) elastic layer. From the force balance, we can derive the classical equation for a thin elastic plate under surface loading q (e.g. Turcotte and Schubert, 1982) with isotropic and homogeneous material properties:
with D (Nm) the flexural rigidity, w (m) the vertical deformation, and q (Pa) the load acting on the plate (in the vertical direction). For the flexural rigidity, we use (e.g. Turcotte and Schubert, 1982)
with E (Pa) the Young modulus, ν (–) the Poisson ratio, and 2h (m) the plate thickness. Considering a thin circular plate of radius a (m), which is fixed around its perimeter, an analytical solution of Eq. (10) can be derived within the framework of Love–Kirchhoff plate theory (e.g. Reddy, 2006):
Defining the load as the sum of the vertical sediment cylinder ρsgH and the buoyancy induced by the water-filled void ρwgH and assuming wall friction τR along the side of the column, we arrive at
Inserting Eq. (13) into Eq. (12), we can now calculate the deflection of the supporting layer in the centre (r=0). For a Young modulus of E≃10 GPa, a Poisson ratio of ν≃0.3, and a plate thickness of 2h=0.6 m, the deflection for a water-filled and for an air-filled void, respectively, is
with the left values assuming no wall friction (τR=0) and the right value assuming a wall friction of τR=50 kPa (a higher value than the minimum shear stress derived before).
However, the more important parameter is the thickness of the elastic layer h as, according to Eq. (11), it scales with the power of 3.
We now want to estimate when the elastic layer will break. We therefore need to calculate the stresses in the thin elastic plate:
with z (m) the vertical coordinate, . As the shear stress τrθ is zero, the two normal stresses σrr and σθθ are the two principal stresses, which we term σ1=σrr and σ2=σθθ. The maximum values for these two normal stresses are obtained for r=a and z=h:
Using the material parameter values from our numerical example above, the normal stresses are
Note that by reducing the plate thickness to 50 %, both normal stresses increase by a factor of 4!
For the two principal stresses, we can calculate the centre Mc and the radius Mr of the Mohr circle as (e.g. Stüwe, 2007)
with the values given for a water-filled and an air-filled void, respectively.
The two Mohr circles are shown in Fig. 9, along with the lines of failure for the glacial till and the peri-glacial sand. For the failure lines, parameter values have been taken from the results of the direct-push-based methods discussed before. If the column above the void is supported by the buoyancy of water, the Mohr circle is below the line of failure. Removing the buoyant support moves the Mohr circle closer to the failure line. Here both the thickness of the elastic plate, 2h, and the Poisson ratio, ν, strongly control the failure: reducing either one or both of these values results in a Mohr circle crossing the failure line.
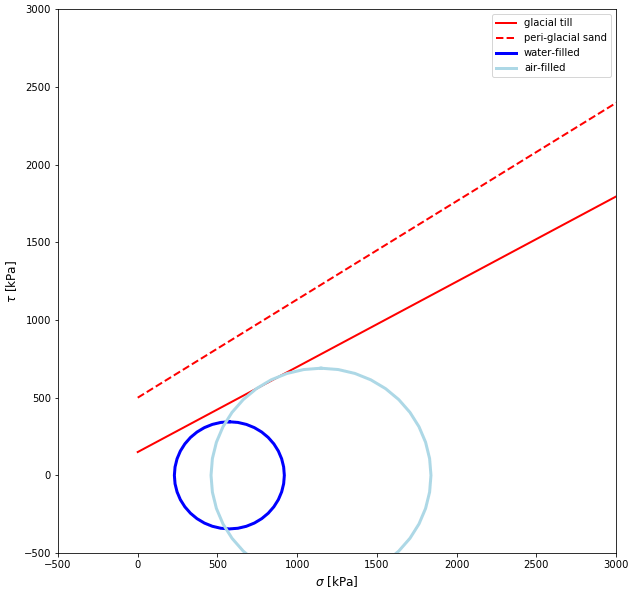
Figure 9Mohr–Coulomb circle for stresses induced by column resting on elastic plate, with buoyancy (dark blue) and without buoyancy (light blue). The line of failure is shown for the weaker glacial till (solid red) and the stronger peri-glacial sand (dashed red), with parameter values derived from results of the direct-push-based methods.
Thus we have shown with our simple analytical examples that a collapse sinkhole with size and depth typical of the Münsterdorf sinkholes can form if the buoyant support of the material above the void is reduced.
Next, we extend our simple set-up to a three-dimensional mechanical model, based on the discrete-element method.
5.2 Discrete-element mechanical models
The discrete-element method (DEM) is a computational method to simulate the interaction of a large number of particles (e.g. Cundall and Strack, 1979). Often, the particles are spheres with pre-described radius and some material properties such as density ρ (kg m−3), Young modulus E (Pa), and Poisson ratio ν (–). Spheres are packed into a three-dimensional region to represent a macroscopic material, with packing being either regular or irregular. Neighbouring spheres can interact, with a large choice of mechanical laws defined. Modelling of the mechanical deformation consists of several steps: (i) set-up of modelling domain, (ii) packing with spheres, (iii) definition of material properties and interaction laws, (iv) time-stepping procedure to track position and velocity of each sphere.
We use the open-source DEM model YADE (e.g. Scholtés and Donzè, 2012, 2013; Šmilauer et al., 2020). Our modelling domain is 50 × 50 × 50 m in size, thus 10 times larger than the collapse sinkholes in Münsterdorf (Fig. 10). This large modelling domain ensures that the fixed boundary spheres (also shown in red as the chalk) have no influence on the deformation (see Romanov et al., 2020, for more details on the implementation). The material properties for the different layers (upper and lower peri-glacial sand, glacial till, chalk) have been taken from the literature (Young modulus, Poisson ratio) and from the direct-push-based methods discussed above (friction angle and cohesion).
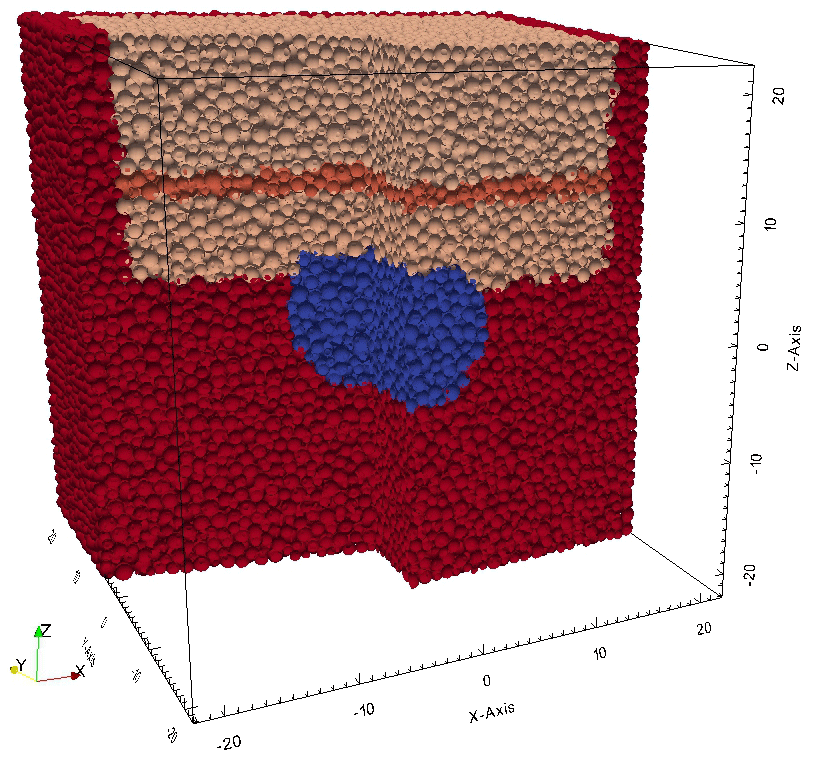
Figure 10Set-up of YADE mechanical model. The model is 50 × 50 × 50 m in size and filled with spheres irregularly packed. The colours of the sphere represent different layers: upper peri-glacial sand (light brown), glacial till (orange), lower peri-glacial sand (light brown), chalk (red), and initial void (blue). Note that the sides of the modelling domain (also shown in red) are fixed.
The spheres in the initial model (upper and lower peri-glacial sand: light brown; glacial till: orange; chalk: red) are packed, and the model is stable; thus no deformation is observed (Fig. 11 top). We then initiate a void in the chalk (red spheres) by removing spheres within a given radius (removed spheres marked in blue). The removed spheres represent either a water- or an air-filled initial void. This initial void in the chalk destabilises the model domain mechanically. The material above the void starts to break down into the void until a new mechanical equilibrium is reached.
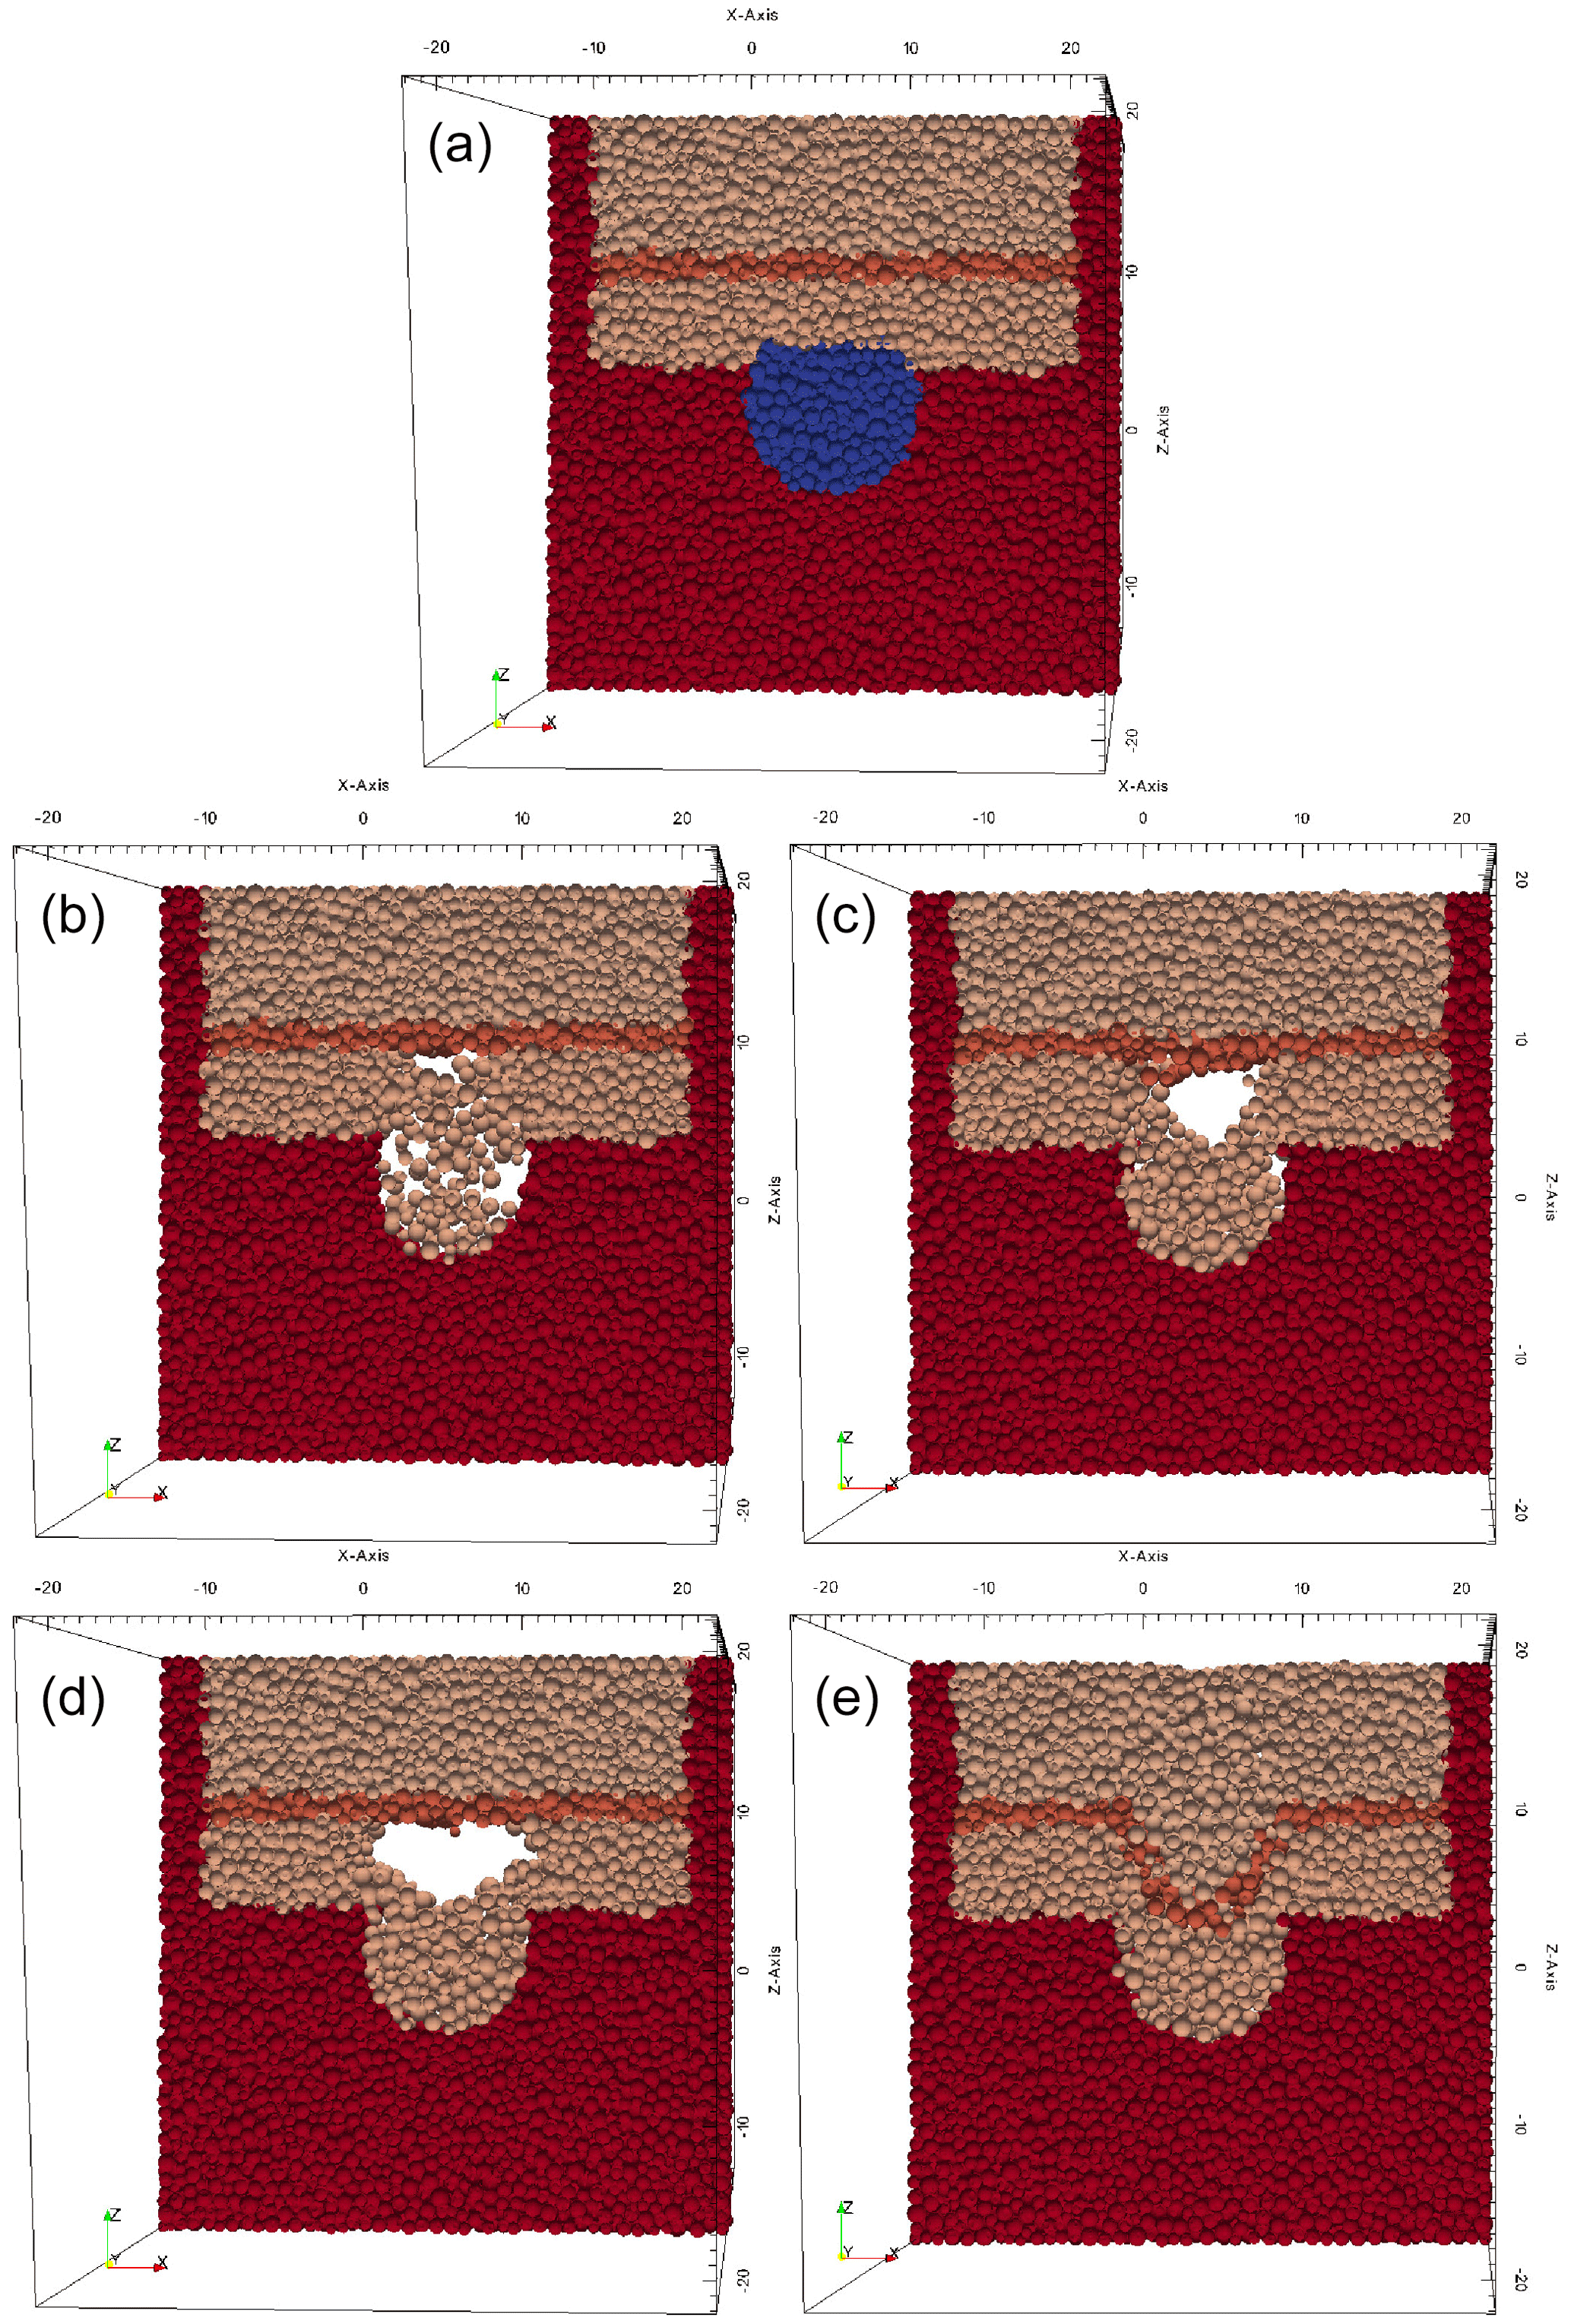
Figure 11Mechanical breakdown simulated with YADE. (a) Initial condition; the dissolved void in the chalk is shown in blue. (b, d) Two snapshots of collapse with full buoyant support. (c, e) Two snapshots of collapse with partial buoyant support. Note that we show a thin slice of the 3D model, crossing the void in the chalk.
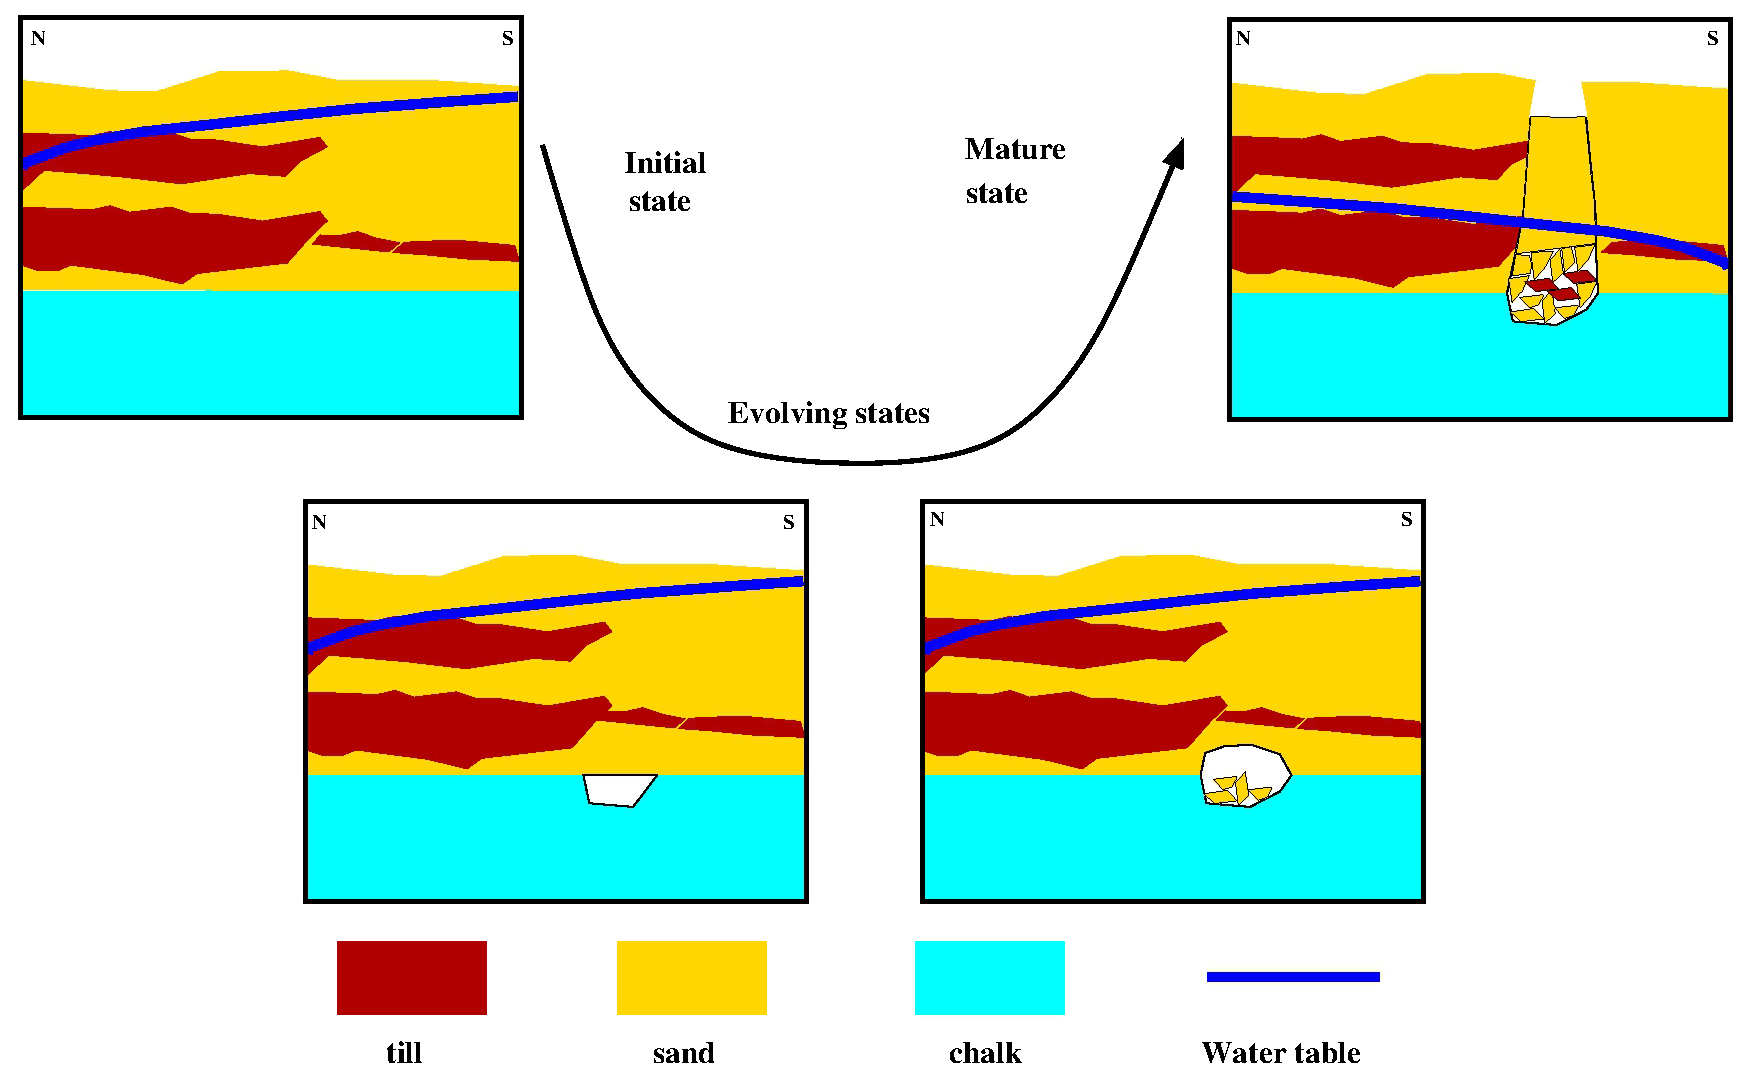
Figure 12Evolution of collapse sinkhole. Light-blue colours indicate chalk as soluble rock, yellow colours peri-glacial sand, and brownish colours glacial till, the latter two as insoluble rocks. The dark-blue line is the hypothetical water table, and the white area is a void in the chalk.
Two scenarios are shown in Fig. 11 (middle and bottom row).
- i.
Buoyant support. In the left column, the subsurface is characterised by a high water table, and the initial void is filled with water. Thus the difference between gravitational force and buoyancy force is smaller, (ρs−ρw)g, and thus the buoyant force compensates the gravitational force significantly. The model experiences breakdown of sand layers above the chalk, but the elastic strength of the till supports the weight of the column above, and the void does not migrate towards the surface. The initial void enlarged by chemical dissolution becomes enlarged by additional breakdown but remains stable. No collapse sinkhole will form (unless the boundary conditions are changed).
- ii.
No buoyant support. In the right column, we reduce the buoyant force, and the initial void is air-filled, simulating a drop in water table, as possibly initiated by groundwater withdrawal. The difference between gravitational force and buoyancy force becomes larger, (ρs−ρa)g with ρa≃0, and thus the overlying column experiences a stronger downward force. In this model, the initial void also enlarges through roof collapse, but the overlying layers cannot support the weight anymore, the entire overburden slips into the void, and a collapse sinkhole appears suddenly on the surface.
By comparing these two models we have shown that a simple change in the hydraulic boundary condition, here a drop in water table, which reduces buoyancy and thus increases the weight of the column hanging above the void, can trigger a collapse sinkhole.
We stress that the timescales of dissolution and mechanical breakdown are completely decoupled: while the void in the chalk, created by chemical dissolution of the material on timescales of 1000–100 000 years, might initiate roof collapse into the insoluble formation, the surface remains stable because the overlying material is partially supported by the mechanical strength of the layers. However, a drop in water table through groundwater withdrawal on timescales of years can destabilise the system and initiate a sudden collapse of the surface, creating a collapse sinkhole.
Of course one can argue that a similar situation might occur for a void located in the peri-glacial sand. However, we have no evidence for a mechanically sound layer in the top part of the insoluble overburden (down to 6–8 m); thus a potential subsurface void in the peri-glacial sand is unlikely to be mechanically meta-stable but will collapse more or less immediately. Thus we argue that the void origin is more likely to be in the chalk layer. We support this argument further in the next section.
In this section, we pick up the short-term mechanical failure models developed in the last section in view of the long-term evolution of the sinkhole cluster on the sports field. With the mechanical models presented before we show that a water table drop can trigger the sinkhole collapse. The initial void, however, can be present in the subsurface for a long period before the collapse.
We want to continue the discussion on the origin of the voids in the surface. In Sect. 4, we discuss the lower glacial till layer, which seems to be a continuous structure at around 12–15 m depth, with possible interruptions in the sinkhole zone. Hints for these interruptions come from the higher hydraulic conductivities and the elevated electrical conductivities in boreholes crossing the sinkhole zone, which might indicate water from the chalk, enriched with dissolved matter (we come back to this argument later).
6.1 Chemistry
From the direct-push-based electrical conductivity measurements, we found values for the electrical conductivity around –50 mS m−1 where direct-push profiling reached the hydraulically conductive part of the chalk, in parts even higher. We convert this electrical conductivity representative of the fluid, σe,f (µS cm−1), to the total amount of dissolved solids, TDS (mg L−1), using an experimentally determined linear relation (e.g. Lloyd, 1985; Atekwana et al., 2004)
with (cm mg L−1 µS−1) a correlation factor and the electrical conductivity σe,f (µS cm−1) in this equation referenced to 25 ∘C. Using ke=0.6, we obtain a TDS value around 180–300 mg L−1.
When we argue that a large amount of the TDS value can be explained with dissolution of the chalk, we derive the concentration of calcium c (mol m−3) from the TDS value, using
with mr=0.101 kg mol−1 the atomic mass of calcite, resulting in c∼2–3 mol m−3.
If we compare this calcium concentration c derived from TDS to the calcium equilibrium concentration ceq (mol m−3) for calcite dissolved under closed-system conditions (decoupled from the atmosphere), which is in the range of ceq≃2–5 mol m−3 (e.g. Buhmann and Dreybrodt, 1985a, b), we find that the dissolution of chalk is close to or at its equilibrium value, thus at its maximum.
Arguing that the high calcium concentration in the probed water in the chalk has been attained locally, the EC results from direct-push-based methods support the idea of Kaufmann et al. (2018) that enlargement of voids in chalk by chemical dissolution has created the initial void space at around 20 m depth. The isolated area of high permeability within the chalk that was identified using the direct-push-based HPT as well as the depth interval with strongly reduced cone pressure (CPT measurement) supports the theory that the high calcium concentration has been generated by the local dissolution, creating a large secondary permeability in the chalk.
In Kaufmann et al. (2018), we have developed a simple hypothetical model for the formation of sinkholes on the sports field in Münsterdorf. With the additional information gained in this work from the direct-push-based methods, the short-term mechanical collapse models, and estimates of the chemical composition of the groundwater, we are now able to refine our previous hypothesis.
The cross sections in Fig. 12 follow a temporal evolution (from top left via bottom towards top right). Shown are three lithological units: chalk (light blue), peri-glacial sand (yellow), and glacial till (brown). The thick blue line depicts the water table.
From our evolution models, we speculate that groundwater is forced to flow vertically down in the middle of the section because the glacial till present in the northern part is less hydraulically conductive. The groundwater, undersaturated with respect to calcium, reaches the chalk at around 20 m depth and dissolves it, creating voids up to the metre range. This dissolution process, a long-term process, occurs on the 10 000–100 000-year timescale.
The voids developing in the chalk start to migrate upwards through roof breakdown, once they reach a certain size. However, thin glacial till layers in the south, mechanically stronger than the peri-glacial sand, stabilise the situation, as the entire void and collapsed roof part is located in the saturated zone; thus buoyancy supports the strength of the thin glacial till layers in the southern part. This situation is meta-stable, as long as there are no significant changes in groundwater level.
A drop in groundwater level, which can be initiated through pumping in the nearby open-pit mines, removes the buoyant support to the glacial till above a void, and the weight of the overburden becomes too much and triggers a collapse, which results in a sinkhole in the overlying peri-glacial sand.
The collapse sinkhole cluster on the sports field of Münsterdorf started in 2004, with an occurrence rate of about one per year. The sinkholes, typical cover-collapse sinkholes, are usually 2–3 m in diameter and 3–5 m deep. We have investigated the mechanical stability of collapse sinkholes with similar dimensions with a discrete-element model to simulate the stability conditions of the final collapse.
In the introduction, we pose three main questions, which we want to answer in this last part.
- i.
Sudden onset. The sudden onset of collapse sinkhole formation in 2004 points to a change in a boundary condition close to the site, e.g. changes in the mechanical and/or hydrological situation. We are able to explain the sinkhole collapse with a drop in groundwater table, reducing the buoyant force, which stabilises the existing subsurface voids.
- ii.
Mechanical failure. Our mechanical models of a void in the subsurface, embedded in the typical set-up of the locality (peri-glacial sand, glacial till, and soluble chalk at 20 m depth), indicate stability of the layers above an existing subsurface void when the water table is high.
A drop in groundwater reduces the buoyant force, which counteracts the gravitational force of the overburden, and the overburden can exceed its mechanical threshold and collapse into the void below, creating a cover-collapse sinkhole.
- iii.
Void origin. We have speculated about a void origin either shallow in the peri-glacial sand (6–9 m depth) or deeper in the chalk (20–22 m depth). We have shown that the shallow void might be detectable by gravity measurements, but a deeper void is not really detectable with geophysical measurements.
The high electrical conductivity, together with an elevated hydraulic permeability, which we measured with direct-push-based methods at about 22.7–25 m depth, points to dissolution on top of the chalk layer, thus pointing to void spaces developing at around or below 20 m depth.
Simple calculations have been performed with the open-source programming language Python (https://www.python.org, last access: 27 February 2023). The discrete-element model has been run with the open-source YADE package (https://yade-dem.org, last access: 27 February 2023, YADE, 2023). Geoelectric inversions are based on the commercial Res2DInv package (https://www.aarhusgeosoftware.dk/res2dinv, last access: 27 February 2023, Aarhus GeoSoftware, 2022, see also Loke and Barker, 1995, 1996).
The direct-push-based data are the property of UFZ Leipzig (please contact Ulrike Werban or Thomas Vienken for details).
GK designed the set-up of the numerical experiments and participated in writing the manuscript. DR designed and ran the distinct-element model runs and participated in writing the manuscript. UW performed the direct-push-based measurements and participated in writing the manuscript. TV performed the direct-push-based measurements and participated in writing the manuscript.
The contact author has declared that none of the authors has any competing interests.
Publisher’s note: Copernicus Publications remains neutral with regard to jurisdictional claims in published maps and institutional affiliations.
We acknowledge funding from the BMBF within the SIMULTAN project. Figures were prepared using GMT software (Wessel and Smith, 1998; Wessel et al., 2013) and the PARAVIEW software (Ahrens et al., 2005; Ayachit, 2015).
This research has been supported by the Bundesministerium für Bildung und Forschung (BMBF) within the SIMULTAN project under research grants 03G0843G
(Georg Kaufmann, Douchko Romanov) and 03G0843F (Ulrike Werban, Thomas Vienken).
We acknowledge support from the Open Access Publication Initiative of Freie Universität Berlin.
This paper was edited by Kei Ogata and reviewed by two anonymous referees.
Aarhus GeoSoftware: Res2DInv DC/IP processing and inversion software, Aarhus GeoSoftware [software], https://www.aarhusgeosoftware.dk/res2dinv (last access: 27 February 2023), 2022. a
Ahrens, J., Geveci, B., and Law, C.: ParaView: An End-User Tool for Large Data Visualization, in: Visualisation Handbook, edited by: Hansen, C. D. and Johnson, C. R., Elsevier, 717–731, ISBN-13 978-0123875822, 2005. a
Atekwana, E., Atekwana, E., Rowe, R., Werkema Jr., D., and Legall, F.: The relationship of total dissolved solids measurements to bulk electrical conductivity in an aquifer contaminated with hydrocarbon, J. Applied Geophys., 56, 281–294, https://doi.org/10.1016/j.jappgeo.2004.08.003, 2004. a
Ayachit, U.: The ParaView Guide: A Parallel Visualization Application, Kitware, 276 pp., ISBN-13 978-1930934290, 2015. a
Blakely, R., Beeson, M., Cruikshank, K., Wells, R., Johnson, A., and Walsh, K.: Gravity Study through the Tualatin Mountains, Oregon: Understanding Crustal Structure and Earthquake Hazards in the Portland Urban Area, Bull. Seis. Soc. Am., 94, 1402–1409, 2004. a
Bowles, J.: Foundation analysis and design, fifth edn., McGraw-Hill, ISBN 0-07-912247-7, 1997. a
Buhmann, D. and Dreybrodt, W.: The kinetics of calcite dissolution and precipitation in geologically relevant situations of karst areas. 1. Open system, Chem. Geol., 48, 189–211, 1985a. a
Buhmann, D. and Dreybrodt, W.: The kinetics of calcite dissolution and precipitation in geologically relevant situations of karst areas. 2. Closed system, Chem. Geol., 53, 109–124, 1985b. a
Christy, C. D., Christy, T. M., and Wittig, V.: A Percussion Probing Tool for the Direct Sensing of Soil Conductivity, Technical Paper 94-100, Geoprobe Systems, https://geoprobe.com/sites/default/files/pdfs/conductivity_paper_0_0_0.pdf (last access: 27 February 2023), 1994. a
Cundall, P. A. and Strack, O. D. L.: A discrete numerical model for granular assemblies, Géotechnique, 29, 47–65, https://doi.org/10.1680/geot.1979.29.1.47, 1979. a
De Waele, J., Gutierrez, F., Parise, M., and Plan, L.: Geomorphology and natural hazards in karst areas: a review, Geomorphology, 134, 1–8, https://doi.org/10.1016/j.geomorph.2011.08.001, 2011. a
DIN Deutsches Institut für Normung e.V.: Geotechnische Bemessung. Normen-Handbuch Eurocode 7, vol. Band 2: Erkundung und Untersuchung DI, Beuth-Verlag, ISBN 978-3-410-20862-4, 2011. a, b
Gebregziabher-Gared, B.: Environmental and Engineering Geophysical Studies for Sinkhole Problems Using Seismic Reflection, Refraction Tomography, Electrical Resistivity Imaging, and Joint Inversions, PhD thesis, Gottfried Wilhelm Leibniz Universität Hannover, 2010. a, b, c
Göthling, S., Henrich, V., Klein, E., Kling, C., Muhrbeck, M., Schiperski, F., Tsami, S., and Wilke, H.: Interdisziplinäre Projektanalyse im Kreide-Tagebau bei Lägerdorf, Report, TU Berlin, 2010. a
Grube, A. and Rickert, B.: Karstification of the Elmshorn salt diapir (SW Schleswig-Holstein, Germany), Z. Dt. Ges. Geowiss., 169, 547–566, 2019. a
Grube, A., Grube, F., Rickert, B., and Strahl, J.: Eemian fossil caves and other karst structures in Cretaceous chalk and succeeding Quaternary sediments covering the salt structure Krempe-Lägerdorf (SW Schleswig-Holstein, North Germany), Z. Dt. Ges. Geowiss., 168, 263–284, 2017. a
Grube, F.: Tektonische Untersuchungen in der Oberkreide von Laegerdorf (Holstein), Mitteilungen aus dem Mineralogisch-Geologischen Institut in Hamburg, 24, 32 pp., 1955. a
Gutiérrez, F., Guerrero, J., and Lucha, P.: A genetic classification of sinkholes illustrated from evaporite paleokarst exposures in Spain, Env. Geol., 53, 993–1006, 2008a. a
Gutiérrez, F., Johnsson, K. S., and Cooper, H. J.: Evaporite karst processes, landforms, and environmental problems, Env. Geol., 53, 935–936, 2008b. a
Gutiérrez, F., Parise, M., De Waele, J., and Jourde, H.: A review on natural and human-induced geohazards and impacts in karst, Earth sci. Rev., 138, 61–88, 2014. a
Harland, M.: Radiomagnetotellurische Messungen zur Erdfallgefährdung in Münsterdorf (Kreis Steinburg, Schleswig-Holstein), Master's thesis, Universität zu Köln, 2010. a
Iwanoff, A.: Environmental impacts of deep opencast limestone mines in Lägerdorf, Northern Germany, Mine Water Environ., 17, 52–61, 1998. a
Kaufmann, G.: Geophysical mapping of solution and collapse sinkholes, J. Appl. Geophys., 111, 271–288, 2014. a
Kaufmann, G. and Romanov, D.: Structure and evolution of collapse sinkholes; Combined interpretation from physico-chemical modelling and geophysical field work, J. Hydrol., 540, 688–698, https://doi.org/10.1016/j.jhydrol.2016.06.050, 2016. a
Kaufmann, G., Romanov, D., Tippelt, T., Vienken, T., Werban, U., Dietrich, P., Mai, F., and Börner, F.: Mapping and modelling of collapse sinkholes in soluble rock: the Münsterdorf site, northern Germany, J. Appl. Geophys., 154, 64–80, 2018. a, b, c, d, e, f, g, h, i, j, k, l, m
Kirsch, R. (Ed.): Groundwater Geophysics: A Tool for Hydrogeology, 2nd edn., Springer, ISBN 978-3-642-10005-5, 2009. a
Kirsch, R. and Werner, G.: Ergebnisse der Bohrarbeiten und Rammkernsondierungen auf dem Erdfallgelände Münsterdorf, November–Dezember 2007, Internal report, Landesamt für Bergbau, Energie und Geologie, Hannover, 20 pp., 2008. a
Kirsch, R., Wiederhold, H., Siemon, B., Harland, M., and Gebregziabher, B.: Geophysikalische Erkundung im Erdfallgebiet Münsterdorf, Internal Report TK 2023/2123, LIAG & LLUR, 2011. a, b, c, d, e, f, g, h
Kjekstad, O., Lunne, T., and Clausen, J.: Comparison between in situ cone resistance and laboratory strength for overconsolidated north sea clays, Mar. Geotech., 3, 23–36, https://doi.org/10.1080/10641197809379792, 1978. a
Köstler, A. and Ehrmann, W.: Fault patterns in the calcareous overburden of a salt diapir: Laegerdorf, NW Germany, N. Jb. Geol. Paläont. Mh., H9, 555–569, 1986. a
Lloyd, J.W.; Heathcote, J.: Natural Inorganic Hydrochemistry in Relation to Groundwater, Clarendon Press, Oxford, England, 302 pp., ISBN-13 978-0198544227, 1985. a
Loke, M.: RES2DMOD ver. 3.03 Rapid 2D resistivity and I.P. forward modeling using the finite-difference and finite-element methods, Tech. Rep., Geotomosoft Solutions, Malaysia, 2016. a
Loke, M. and Barker, R.: Rapid least-squares inversion of apparent resistivity pseudosections using a quasi-Newton method, Geophys. Prospect., 44, 131–152, 1995. a, b
Loke, M. H. and Barker, R. D.: Practical techniques for 3D resistivity surveys and data inversion, Geophys. Prospect., 44, 499–523, 1996. a, b
Lollino, P., Martimucci, V., and Parise, M.: Geological survey and numerical modeling of the potential failure mechanisms of underground caves, Geosystem Engineering, 16, 100–112, 2013. a
Lunne, T. and Kleven, A.: Role of CPT in North Sea Foundation Engineering, pp. 49–75, Symposium on Cone Penetration Engineering Division, ASCE, 1981. a
Lunne, T., Robertson, R., and Powell, J.: Cone Penetration Testing in Geotechnical Practice, SPON Press, Taylor and Francis, 312 pp., ISBN 13 978 0 419 23750 1, 1997. a, b
Mai, F., Kirsch, R., Rücker, C., and Börner, F.: Petrophysical effects during karstification, in: Geophysical Research Abstracts, vol. 19, EGU2017-9966, EGU General Assembly, 2017. a, b
McCall, W.: Application of the Geoprobe© HPT Logging System for Geo-Environmental Investigation, Tech. Rep., Technical Bulletin No. MK3184, https://geoprobe.com/sites/default/files/storage/pdfs/mk3184_application_of_hpt_for_geo-environmental_investigations_0_0.pdf (last access: 27 February 2023), 2011. a
Messerklinger, S.: Formation mechanism of large subsidence sinkholes in the Lar valley in Iran, Quat. J. Eng. Geol. Hydrogeol., 47, 237–250, 2014. a
Olsen, C., Christensen, H., and Fabricius, I.: Static and dynamic Young's moduli of chalk from the North Sea, Geophysics, 73, E41–E50, 2008. a
Panno, S., Kelly, W., Angel, J., and Luman, D.: Hydrogeologic and topographic controls on evolution of karst features in Illinous' sinkhole plain, Carbonates Evaporates, 28, 13–21, 2013. a
Parise, M.: Sinkholes, in: Encyclopedia of Caves, edited by: White, W. B., Culver, D. C., and Pipan, T.A, Academic Press, 934–942, ISBN 9780128141243, 2019. a
Parise, M.: Sinkholes, Subsidence and Related Mass Movements, in: Treatise on Geomorphology, edited by: Schroder, J. J. F., Academic Press, 200–220, https://doi.org/10.1016/B978-0-12-818234-5.00029-8, 2022. a
Parise, M. and Gunn, J.: Natural and anthropogenic hazards in karst areas: Recognition, Analysis and Mitigation, Special Publications 279, Geological Society, London, ISBN-13 978-1862392243, 2007. a
Parise, M. and Lollino, P.: A preliminary analysis of failure mechanisms in karst and man-made underground caves in Southern Italy, Geomorphology, 134, 132–143, 2011. a
Reddy, J. N.: Theory and analysis of elastic plates and shells, 2nd edn., CRC Press, Taylor and Francis, ISBN-13 978-0849384158, https://doi.org/10.1201/9780849384165, 2006. a
Robertson, P.: Cone penetration test (CPT)-based soil behaviour type (SBT) classification system – an update, Can. Geotech. J., 53, 1910–1927, https://doi.org/10.1139/cgj-2016-0044, 2016. a
Rogiers, B., Vienken, T., Gedeon, M., Batelaan, O., Mallants, D., Huysmans, M., and Dassargues, A.: Multi-scale aquifer characterization and groundwater flow model parameterization using direct push technologies, Environ. Earth Sci., 72, 1303–1324, 2014. a
Romanov, D., Kaufmann, G., and Al-Halbouni, D.: Basic processes and factors determining the evolution of collapse sinkholes – a sensitivity study, Eng. Geol., 270, 105589, https://doi.org/10.1016/j.enggeo.2020.105589, 2020. a
Scholtés, L. and Donzè, F.: Modelling progressive failure in fractured rock masses using a 3D discrete element method, Int. J. Rock Mech. Min. Sci,, 52, 18–30, 2012. a
Scholtés, L. and Donzè, F.: A DEM model for soft and hard rocks: Role of grain interlocking on strength, J. Mech. Phys. Solids, 61, 352–369, 2013. a
Schulze-Dieckhoff, T.: The sinkhole area of Münsterdorf, Northern Germany – 3D GPR and ERT investigations, Master's thesis, Christian-Albrechts-Universität zu Kiel, 2015. a, b, c
Šmilauer, V., Catalano, E., Chareyre, B., Dorofeenko, S., Durie, J., Dyc, N., Eliáš, J., Er, B., Eulitz, A., Gladky, A., Guo, N., Jakob, C., Kneib, F., Kozicki, J., Marzougui, D., Maurin, R., Modenese, C., Scholtès, L., Sibille, L., Stránský, J., Sweijen, T., Thoeni, K., and Yuan, C.: Yade Documentation, 2nd edn., The Yade Project, Zenodo [software], https://doi.org/10.5281/zenodo.5705394 2020. a
Stüwe, K.: Geodynamics of the Lithosphere: An Introduction, 2nd edn., Springer, ISBN-13 978-3-540-71236-7, https://doi.org/10.1007/978-3-540-71237-4, 2007. a
Timm, R.: Seismische Untersuchungen im Erdfallgebiet Münsterdorf, Master's thesis, Christian Albrechts-Universität Kiel, 2015. a, b
Tippelt, T., Vienken, T., Kirsch, R., Dietrich, P., and Werban, U.: Direct Push supported geotechnical and hydrogeological characterisation of an active sinkhole area, in: Geophysical Research Abstracts, vol. 19, EGU2017-16813, EGU General Assembly, 2017. a, b
Topp, G., Davis, J., and Annan, P.: Electromagnetic Determination of Soil Water Content: Measurements in Coaxial Transmission Lines, Water Resour. Res., 16, 574–582, https://doi.org/10.1029/WR016i003p00574, 1980. a
Turcotte, D. L. and Schubert, G.: Geodynamics, 1st edn., John Wiley and Sons, New York, ISBN-13 978-0471060185, 1982. a, b
Vienken, T., Leven, C., and Dietrich, P.: Use of CPT and other direct push methods for (hydro-) stratigraphic aquifer characterization – a field study, Can. Geotech. J., 49, 197–206, 2012. a
Vienken, T., Reboulet, E., Leven, C., Kreck, M., Zschornack, L., and Dietrich, P.: Field comparison of selected methods for vertical soil water content profiling, J. Hydrology, 501, 205–212, 2013. a
Waltham, A. and Fookes, P.: Engineering classification of karst ground conditions, Q. J. Eng. Geol. Hydroge., 36, 101–118, 2003. a
Waltham, T., Bell, F., and Culshaw, M.: Sinkholes and Subsidence: Karst and Cavernous Rocks in Engineering and Construction, 1st edn., Springer, 384 pp., ISBN13 978-3-642-05851-6, https://doi.org/10.1007/b138363, 2005. a, b
Wessel, P. and Smith, W. H. F.: New, improved version of Generic Mapping Tools released, EOS, 79, 47, https://doi.org/10.1029/98EO00426, 1998. a
Wessel, P., Smith, W. H. F., Scharroo, R., Luis, J. F., and Wobbe, F.: Generic Mapping Tools: Improved version released, EOS, 94, 409–410, https://doi.org/10.1002/2013EO450001, 2013. a
Williams, P.: Dolines, in: Encyclopedia of caves and karst science, 2nd edn., edited by: Gunn, J., Fitzroy Dearborn Publ., 628–642, 2004. a
YADE: YADE package, https://yade-dem.org, last access: 27 February 2023. a
- Abstract
- Introduction
- Site
- Geophysical site exploration
- Direct-push-based methods
- Mechanical models
- Chemical considerations
- Interpretation
- Conclusions
- Code availability
- Data availability
- Author contributions
- Competing interests
- Disclaimer
- Acknowledgements
- Financial support
- Review statement
- References