the Creative Commons Attribution 4.0 License.
the Creative Commons Attribution 4.0 License.
 | 01 Feb 2023
Investigation of the effects of surrounding media on the distributed acoustic sensing of a helically wound fibre-optic cable with application to the New Afton deposit, British Columbia
Sepidehalsadat Hendi
Gilles Bellefleur
Christopher D. Hawkes
Don White
Fibre-optic sensing technology has recently become popular for oil and gas extraction, mining, geotechnical engineering, and hydrogeology applications. With a successful track record in many applications, distributed acoustic sensing using straight fibre-optic cables has become a method of choice for seismic studies. However, distributed acoustic sensing using straight fibre-optic cables cannot detect off-axial strain at high incident angles (the angle between the ray and normal vector of the surface); hence, a helically wound cable design was introduced to overcome this limitation. The helically wound cable field data at the New Afton deposit in British Columbia, Canada, showed that the quality of the data is highly dependent on the incident angle and surrounding media. A 3D finite element model developed using COMSOL Multiphysics quickly and efficiently assessed the effects of various materials surrounding a helically wound cable for simple geometry for scenarios corresponding to a real deployment of such cable underground at the New Afton mine. The proposed numerical modelling workflow could be applied to more complicated scenarios (e.g., non-linear material constitutive behaviour and the effects of pore fluids). The results of this paper can be used as a guideline for analyzing the impact of surrounding media and incident angle on the response of helically wound cable, optimizing the installation of helically wound cable in various conditions, and validating boundary conditions of 3D numerical models built for analyzing complex scenarios.
- Article
(5136 KB) - Full-text XML
- BibTeX
- EndNote


© His Majesty the King in Right of Canada, as represented by the Minister of Natural Resources, 2023.
Fibre-optic technology has become popular in geophysical, mining, geotechnical, hydrological, environmental, and oil and gas extraction applications. Fibre-optic sensing offers many advantages over conventional sensors, including lower price, lower weight, large area coverage when compared to point sensors, simultaneous sensing over the entire length of the fibre-optic cable, low sensitivity of glass fibre to electromagnetic radiation, and the possibility of use in harsh environments (Mollahasani Madjdabadi, 2016). A comprehensive literature review about the different types of fibre-optic sensing technology in terms of application, modulation and scattering of light, and polarization can be found in Mollahasani Madjdabadi (2016), Miah and Potter (2017), and Hartog (2018). In Earth-related engineering, the following three main fibre-optic sensing categories are commonly used: distributed temperature sensing (DTS), distributed strain sensing (DSS), and distributed acoustic sensing (DAS) (Ranjan and McColpin, 2013; Daley et al., 2013; Hornman, 2015).
Distributed acoustic sensing is commonly applied to measure elastic waves in seismic applications. In this case, fibre-optic cables replace conventional point sensors such as geophones and accelerometers. DAS has been used in vertical seismic profile (VSP) surveys for over 12 years (Daley et al., 2013, 2016), is often used to monitor micro-seismicity associated with hydraulic fracturing (Hornman, 2015), and is used in seismology (Jousset et al., 2018; Lindsey et al., 2019; Sladen et al., 2019; Walter et al., 2020). In terms of environmental application, DAS has been recently used in CO2 sequestration projects to characterize storage reservoirs and to map the progression of the CO2 plume within geological formations (Miller et al., 2016; Harris et al., 2016). In mining, DAS-VSP was used to image steeply dipping ore at the Kylylahti Cu–Au–Zn deposit in Finland and to provide geological information at the New Afton Cu–Au deposit in Canada (Riedel et al., 2018; Bellefleur et al., 2020).
To date, most DAS applications use cables with straight optical fibres deployed in trenches at surface or in boreholes. Fibre-optic cables are most sensitive to seismic waves exerting strain in the axial direction (i.e., longitudinal to the fibre) (Mateeva et al., 2014). For plane compressional waves, the sensitivity of a straight fibre-optic cable varies as a function of cos2θ, where θ is the angle between the plane wave direction and the cable (Mateeva et al., 2014; Kuvshinov, 2016). Thus, straight fibre-optic cables are most suitable for specific survey geometries. These include VSP applications because the reflected compressional seismic waves propagate predominantly in a direction parallel to the fibre axis and hydraulic fracturing monitoring because the monitoring wells are proximal to the induced microseismic events; hence, the waveforms reaching the monitoring well possess sufficient curvature to generate a detectable component in the direction of the fibre axis. Conversely, DAS can hardly detect seismic waves that have particle displacements orthogonal to a straight fibre-optic cable due to a lack of resultant axial dynamic strain along the fibre (Hornman, 2015; Ning and Sava, 2016; Innanen, 2017; Eaid et al., 2018; Ning and Sava, 2018; Ning, 2019). With a proper acquisition geometry, DAS can measure not only compressional waves but also mode-converted waves, shear waves, and surface waves when the fibre-optic cable is at or near the surface (Jousset et al., 2022).
The broadside sensitivity of DAS can be improved by using helically wound fibre-optic cable (HWC) (Den Boer et al., 2017). HWC consists of fibres wrapped around a mandrel core with a predetermined wrapping angle (α) (Fig. 1). The wrapping angle controls the sensitivity of the cable, with lower wrapping angles providing higher sensitivity to broadside seismic waves. Specifically, a HWC is sensitive to both axial and radial strain, the latter being more dependent on the material around the cable.

Figure 1Illustration showing the meaning of wrapping angle (α). If the cylindrical surface of a cable (grey) is cut along A–B and unwrapped to a horizontal plane, the fibre trajectory would be represented by the diagonal red line shown in the image on the right. The wrapping angle (α) is the angle between the fibre and the circumference of the cable (B–B). When a wave hits the HWC, the cable is deformed (dashed black line), and the fibre is deformed accordingly (dashed red line). Dynamic strains (denoted by e) imposed on a HWC due to acoustic waves are defined in an x, y, ∥ coordinate system (after Kuvshinov, 2016).
The properties of the engineered and natural media surrounding the cable and the coupling of these media with the rock formation are important factors controlling the performance of HWC (Kuvshinov, 2016). Here, we present modelling results to help understand the performance of a helically wound fibre in a field study conducted at the New Afton mine, Canada (Bellefleur et al., 2020). At New Afton, poor coupling and soft formations near the monitoring borehole caused weak seismic amplitudes in data acquired with HWC but had minimal effects on data measured on a coincident straight fibre-optic cable (Fig. 2). This experience illustrates the importance of understanding the impact of surrounding media on HWC in selecting and designing DAS monitoring systems.
The main objectives of this work were to help address the following questions.
-
Why does HWC sometimes acquire low-quality data in the field?
-
What are the effects of the surrounding media and incident angle on their impacts on cable design and installation techniques?
To meet these objectives, a 3D numerical model was developed using the commercial software COMSOL Multiphysics. Material properties and HWC geometry used for the modelling were based on the field conditions and data previously acquired during a survey at the New Afton deposit in Canada. Several scenarios are modelled and compared to help identify near-borehole conditions explaining the difference between data acquired with straight cables and HWC at New Afton, specifically the weak-amplitude data obtained with HWC (Fig. 2). The HWC modelling results and approach used here can provide insights for optimizing field deployments. Service companies could benefit by using this workflow prior to installation of HWC fibre-optic cable in the field.
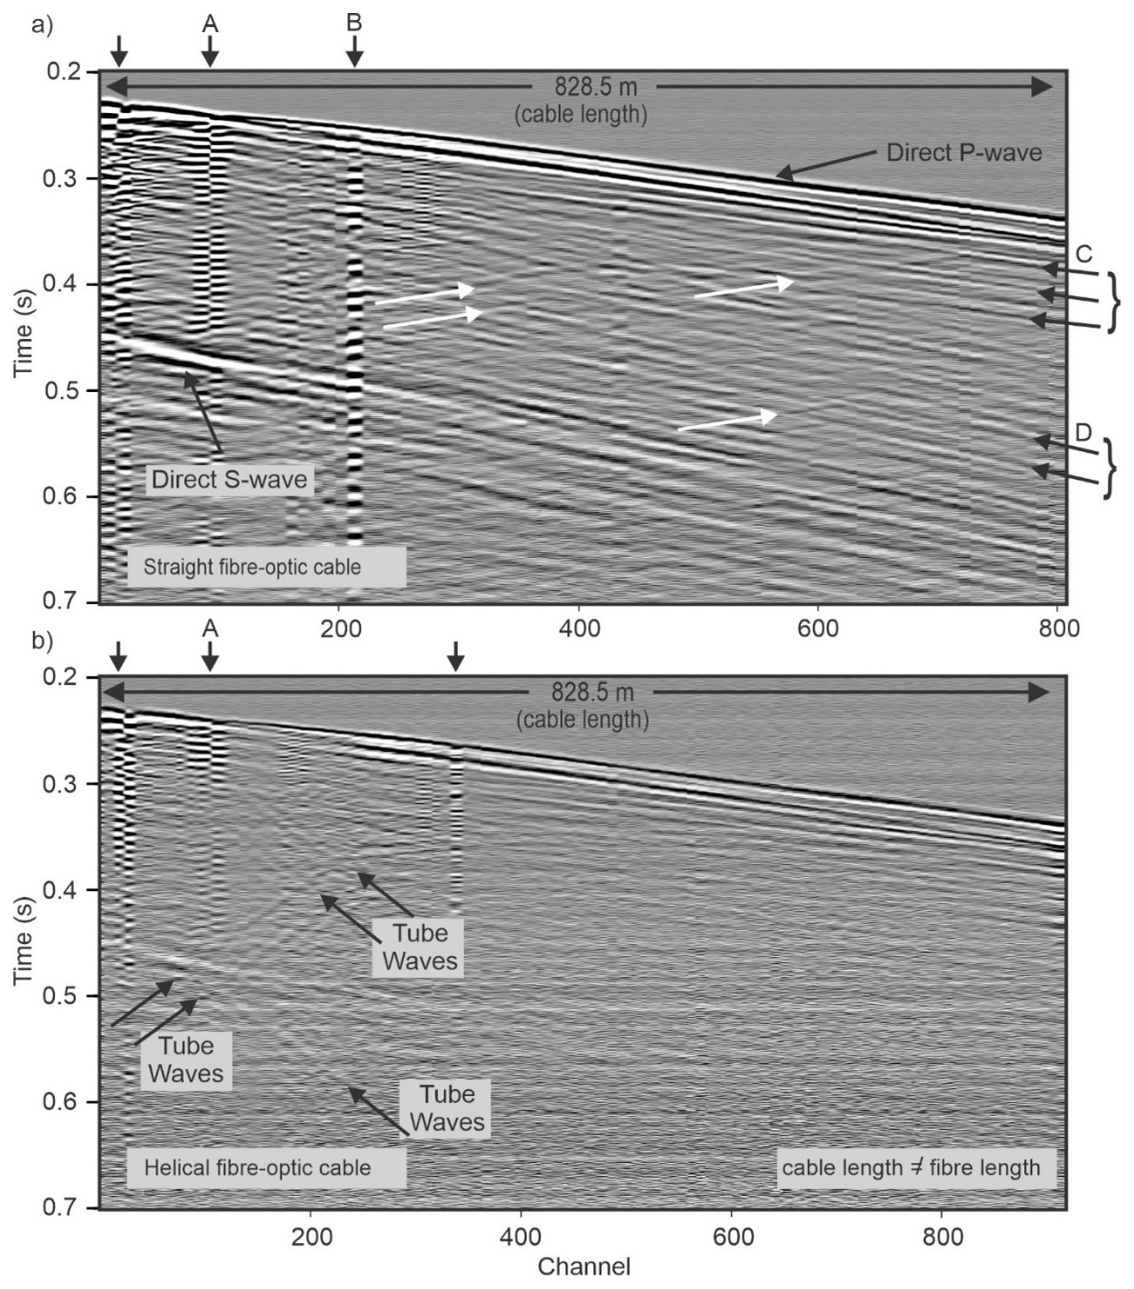
Figure 2Comparison of field VSP data for (a) straight fibre-optic cable and (b) helically wound fibre-optic cable. The helically wound optical fibre has more channels than the straight fibre for the same length of cable due to the wrapping around the cable core (i.e., 925 channels for helically wound cable versus 813 for the straight fibre-optic cable). Vertical arrows point to noisy channels indicating poor coupling. White arrows indicate upward reflections. Arrows C and D point to events of the downward wavefield with move out of P waves and S waves, respectively. Events D arrive before the direct S wave and are likely the result of P-to-S conversion at a lithological contact or fault zone. The same display gain was used for (a) and (b). Horizontal banding observed across all channels is optical noise. Incident angles of seismic waves for data shown here range between 25 and 40∘. Greyscale colours show relative seismic amplitudes from negative (white) to positive (black). Modified from Bellefleur et al. (2020).
The modelling work presented in this paper is used to help understand the performance of a helically wound fibre from a VSP field study at the New Afton mine (Bellefleur et al., 2020). Straight and helically wound fibre-optic cables were deployed in a single borehole to assess the efficiency of DAS to detect geological interfaces and structures associated with mineralization. The New Afton deposit is a porphyry deposit comprising primarily disseminated Cu–Au mineralization. The fibre-optic cables were deployed in a steeply dipping (70∘ from horizontal) deviated borehole starting in a work bay located 650 m below the surface and ending at a depth of approximately 1300 m. Both cables were placed inside steel drill rods (used as casing) and cemented in place with grout. The grout was circulated to the bottom of the borehole via a grout tube located inside the casing until grout eventually reached surface from both inside and outside of the casing (drill rods). The grout cured for 1 month prior to the VSP survey. Based on the aforementioned grout returns both within and outside the casing, it was assumed at the time that grout had filled both the casing and the formation–casing annulus; however, data collected during the survey (discussed below) suggest this may not have been the case. The data were acquired with 1 kg of explosives fired in a 20 m deep shot hole at surface.
An advanced DAS system providing higher signal-to-noise ratio (Carina system by Silixa) was used to record the seismic data on both straight cable and HWC. Gauge length was 10 m for both straight and helically wound DAS data. Due to the wrapping, strain rate over the gauge length is measured over a shorter cable distance for a helically wound fibre than for a straight optic fibre. This resulted in more channels for the HWC data (925 for HWC versus 813 for straight fibre-optic cable) for cables with identical length (828.5 m). More details about instruments and acquisition parameters can be found in Bellefleur et al. (2020).
Figure 2 presents a comparison of raw field VSP data acquired on co-located straight and helically wound fibre-optic cables at the New Afton mine. The seismic data (or strain rate) for the straight cable (Fig. 2a) show typical downward P and S waves (black arrows) and some reflected waves (white arrows). Surface waves were likely generated at the source, but they are not observed on the DAS data, which start at a depth of 650 m below the surface. Also note that almost all reflections (Fig. 2a) have a P-wave move-out velocity and are standard P-wave reflections. In comparison, the seismic data obtained with the HWC are characterized by significantly weaker downward waves and the lack of reflections (Fig. 2b). Tube waves are also present on the HWC data but not on data measured with the straight fibre-optic cable. The modelling work presented below aims at evaluating the effect of the surrounding media on HWC data and assessing if it could explain the overall low data quality in Fig. 2b.
The numerical models for this work are based on the finite element method and were developed using the COMSOL Multiphysics software. The model predicts the axial strain of a fibre as a function of the incident angle of a planar compressional wave. S wave could also be modelled for isotropic cases by considering that particle displacement is orthogonal to the wave propagation direction and adjusting the incidence angle accordingly. Finite element modelling can handle the complexity of realistic geological conditions and is not subject to the simpler geometric assumptions used in analytical modelling (i.e., for instance planar or cylindrical assumptions). We simulated only incident P waves because they are the primary body waves used for exploration at the New Afton mine. As shown in Fig. 2, the reflected wavefield at New Afton is dominated by P-wave reflections, whereas S-wave and mode-converted wave reflections were not identified with high certainty.
The models were developed in the frequency domain using a dominant frequency of 100 Hz (wavelength of approximately 40 m) in order to match the field data at New Afton. Since the maximum response of a fibre as a function of incident angle was the main objective, simulations were conducted in the frequency domain. Dominant frequency is deemed to have an effect on the transmitted energy to the fibre in an absolute sense, but not on the relative magnitudes of the results generated for a range of scenarios. We do not expect significant variations in the incident angle yielding maximum response over the range of frequencies typical of seismic surveys for mineral exploration (5–150 Hz).
Six scenarios were modelled in the frequency domain with different mechanical properties for the materials within and around the borehole. The number and type of layers in order of proximity to the centre of the cable (domains) are given in Table 1. Inside the domain, a tetrahedral mesh was employed, while lower reflecting surfaces were covered with a swept mesh (see Fig. 4). These scenarios are listed in Table 1 and were chosen to enable assessment of the effects of various potential geometries, materials, and conditions on DAS data measured with a HWC. For example, scenarios 1 and 2 compare the effect of soft and hard cement between casing and rock formation, whereas scenarios 3 and 4 compare the effect of soft versus hard formations. Scenarios 5 and 6 investigate the effect of water located either inside or outside the casing. For this work, the geometries (Table 2) and properties (Table 3) of the materials were chosen to be similar to those of a DAS field experiment conducted at the New Afton mine, Canada (Bellefleur et al., 2020). The rock properties were based on unpublished triaxial compression testing results obtained for representative samples of crystalline fragmental volcanic host rocks at the New Afton deposit. Samples were retrieved at depths ranging from 2 to 214 m. The average values of elastic properties are presented in Table 3. The material properties related to the cable, casing, and hard cement were taken from Kuvshinov (2016).
Table 1Number and type of layers (domain) implemented in numerical modelling for six scenarios. The layers are concentric, as illustrated in Fig. 3.
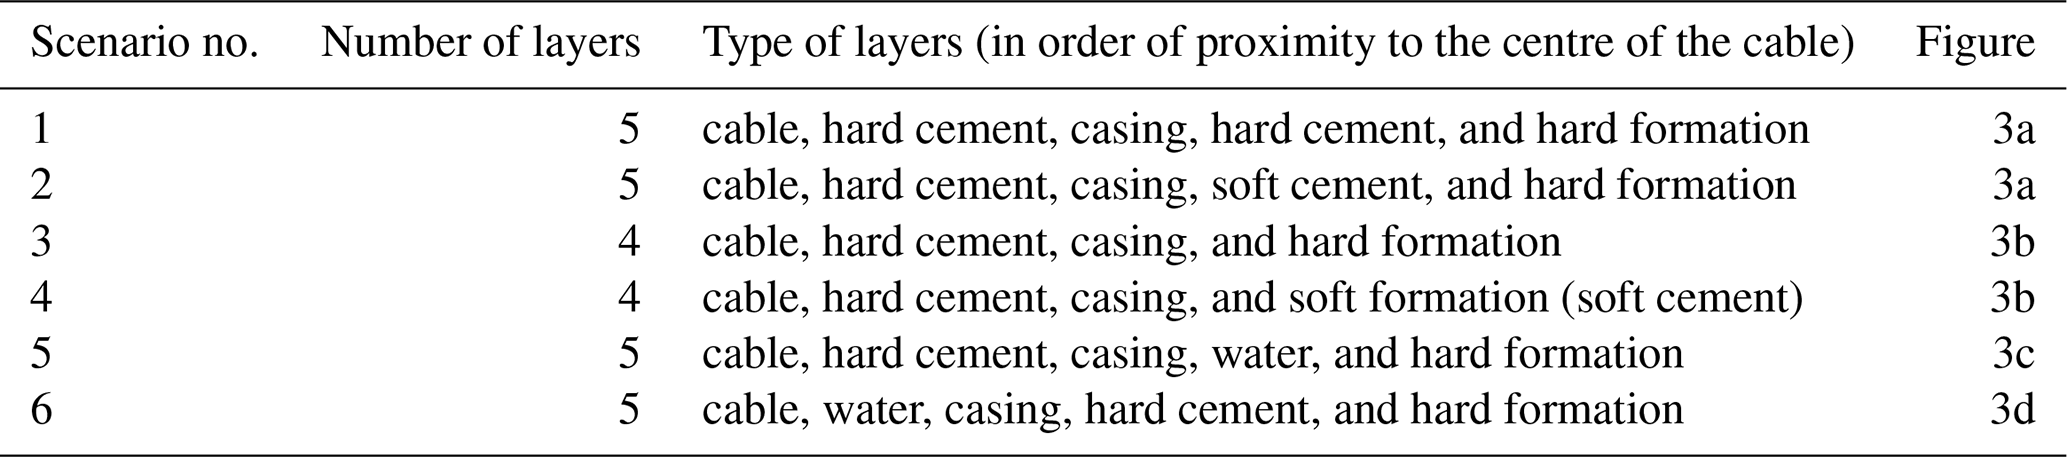
Table 2Geometrical parameters used in numerical modelling.

a . b Sizes of the model for hard and soft formations are 4.783 and 1.633 m3, respectively.
Table 3Layer (domain) properties used for modelling.

n/a stands for not applicable. ∗ E′ is the plane strain Young's modulus, which is equivalent to , where E is Young's modulus and ν is Poisson's ratio.
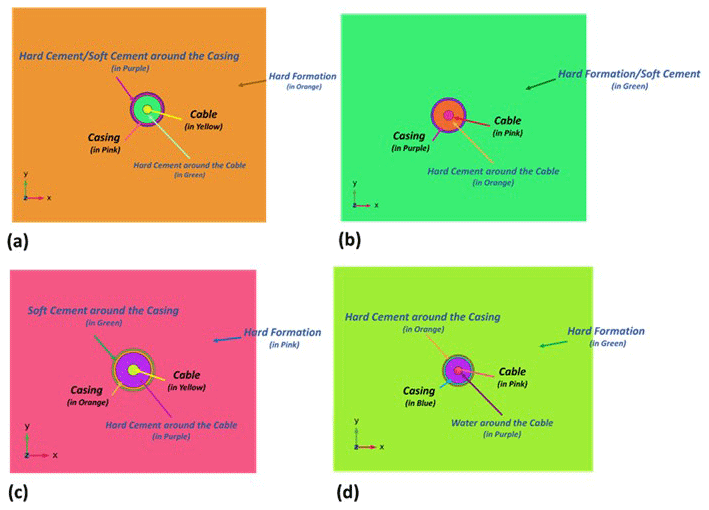
Figure 3The 3D model geometries for various scenarios: (a) scenarios 1 and 2, (b) scenarios 3 and 4, (c) scenario 5, and (d) scenario 6.
In all scenarios, strain was simulated for a helically wound cable with a wrapping angle (α) of 30∘ (this wrapping angle is derived from the HWC cable used in the New Afton mine; see Fig. 2). The longitudinal and radial strains of the cable were modelled separately and combined together with the wrapping angle to obtain the resultant axial strain of the fibre. As mentioned previously, the impact of the surrounding media is best observed on the radial strain. Thus, modelling strains separately allows us to show details of radial strain and assess the effect of surrounding media more effectively.
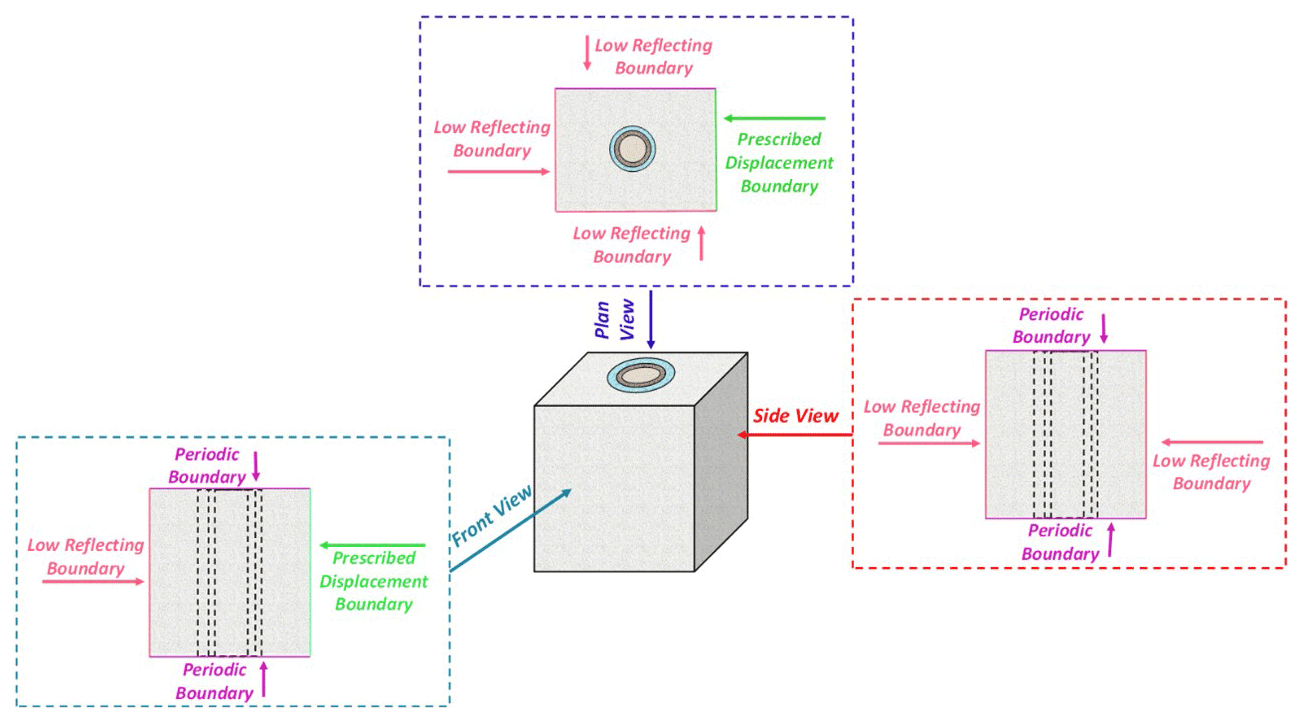
The geometry and boundary conditions used for the 3D simulations are presented in Fig. 4. The material domains are concentric and centred around the cable. The low reflecting boundary condition is applied to the other boundaries as depicted.
Radial strain distributions generated using the three-dimensional numerical model for scenarios 1 to 6 are shown in Figs. 5–10. Those figures show the strain in all layers for a horizontal section of the 3D model, which cannot be obtained easily with analytical methods. Axial strain results were also obtained from COMSOL and used to calculate helically wound cable strain ( by considering a wrapping angle (α) equal to 30∘). Scenarios with five layers and several thin layers (scenario 1, 2, 5, and 6) required a significantly finer mesh in the region between the formation–casing annulus and the cable. Though valid results were obtained, graphical rendering of strains in these finely meshed domains caused some issues, particularly for strain inside the cable. Rendered strains inside the cable for scenarios 1, 2, 5, and 6 are not displayed correctly in Figs. 5, 6, 9, and 10, respectively. Strains inside the cable for scenarios 3 and 4 (Figs. 6 and 7) are correctly displayed. Despite any graphical rendering issues, valid numerical strain values were obtained for all elements in all scenarios, and these results were used to generate graphs of fibre strain versus incident angle, as shown in Figs. 11 through 14.
Figures 5 and 6 compare the radial strain in cases where hard or soft cement fills the formation–casing annulus, respectively. Strain in the formation for both scenarios is similar and has a maximum value along the x axis, which corresponds to the direction of plane wave propagation. The main difference is the higher strain observed in the thin layer of soft cement between the formation–casing annulus. Strain in the hard cement between cable and casing is, however, similar. The effect of having a hard or soft rock formation on radial strain is shown in Figs. 7 and 8, respectively. The soft formation has higher strain than the hard formation. The maximum value of strain for the soft formation, contrary to the hard formation, is distributed along the y axis (Fig. 8). This distribution of maximum strain along the y axis is also observed inside the cable (Fig. 8). The difference is pronounced when comparing with strain inside the cable for the hard formation (Fig. 7). Also note the significantly higher radial strain inside the cable when the borehole is within a hard formation. Finally, Figs. 10 and 11 compare the effect of having water inside the casing or outside the casing between the rock formation. The distribution of strain in the formation in the immediate vicinity of the borehole is significantly different for both scenarios, with four areas of maximum strain occurring when water fills the inside of the casing. Strain in the formation–casing annulus is, however, larger when filled with water. For the reason mentioned above, strain inside the casing and inward cannot be compared in those figures. However, a comparison of strain as a function of angle of incidence for these scenarios is shown in Fig. 13.
Figure 11 shows a comparison of modelled fibre strains for scenarios 1 and 2. These are identical five-layer scenarios, except scenario 1 assumes hard cement in the formation–casing annulus, whereas scenario 2 assumes a soft cement in this annulus. The results (fibre strain) are nearly identical for incident angles less than 30∘. However, for larger incident angles, the scenario with soft cement in the annulus (i.e., scenario 2) is slightly more sensitive (i.e., nearly 10 % greater fibre strain). This is interpreted to be due to the lower Young's modulus for soft cement, resulting in the fibre experiencing greater strain in response to an imposed dynamic stress. In 3D, the cylindrical casing would have a slight dampening (shielding) effect on strains transmitted to the inner cement and fibre cable, but in 2D a planar “casing” would have no such dampening effect.
Figure 12 shows a comparison of modelled fibre strains for scenarios 3 and 4. Both of these are four-layer scenarios that assume that casing is in direct contact with the formation; as such, there is no formation–casing annulus. The difference between these scenarios is the fact that scenario 3 assumes a hard formation, whereas scenario 4 assumes a soft formation. The results are nearly identical for incident angles less than 5∘, but with increasing angles scenario 3 shows a much stronger response (strains at 90∘ angle are nearly 5 times greater in scenario 3 versus scenario 4). For the same frequency (100 Hz), the wave number of the hard formation is more than that of the soft formation. As a result, amplitude decrease is higher in the soft formation than in the hard formation. Accordingly, less seismic energy is transmitted to the cable in scenario 4 compared to scenario 3, resulting is less strain for scenario 4.
Figure 13 shows a comparison of modelled fibre strains for scenarios 5 and 6. These are both five-layer scenarios similar to scenario 1, except for one difference in each case. In scenario 5, it is assumed that the formation–casing annulus contains water rather than hard cement. In scenario 6, it is assumed that the cable–casing annulus has water rather than hard cement. Scenario 6 shows tensile strains at low incident angles (less than 18∘). However, the increase in strain with incident angle is relatively high compared to scenario 5; hence, the compressional fibre strains for scenario 6 exceed those for scenario 5 for incident angles greater than 25∘. Overall, the results show that the existence of water in the media surrounding the cable results in lower fibre strains than most of the other scenarios. More specifically, the maximum strain (which occurs at 90∘ incident angle for all scenarios) is roughly 0.0065 for scenario 5 and 0.0185 for scenario 6 compared to values in the 0.027 to 0.05 range for scenarios 1 to 3. The only other scenario with a comparably low strain, at 0.009, is scenario 4, which assumes a soft formation, as discussed in the previous paragraph. The low strains observed for scenarios 5 and 6 are mainly due to the interfaces between solid and water forming a free surface, which decompose incident waves into interface waves (i.e., tube waves) and compressional waves. Accordingly, less compressional energy is transmitted to the fibre cable. Though this is true of both scenarios 5 and 6, strains are greater in scenario 6 because cable extension and contraction are uninhibited when the cable is within water rather than cement.
Figure 14 shows a comparison of modelled fibre strains for scenarios 1 and 3. These are based on the same material properties, except scenario 1 includes a cement-filled formation–casing annulus (five-layer system), while scenario 3 assumes direct contact between the casing and formation (four-layer system). Both scenarios show relatively high fibre strains, with scenario 3 having the most significant strains of all scenarios considered and scenario 1 having the third-highest strains (only slightly less than scenario 2). As such, the number of layers, as a standalone factor, should not be expected to result in poor signal quality for a HWC, assuming the layers present are hard (i.e., stiff) and well coupled. More wave energy is reflected when the cement layer is soft (less wave energy is refracted), which causes less transmitted energy to be projected onto fibre cable and, as a result, a reduced strain response.
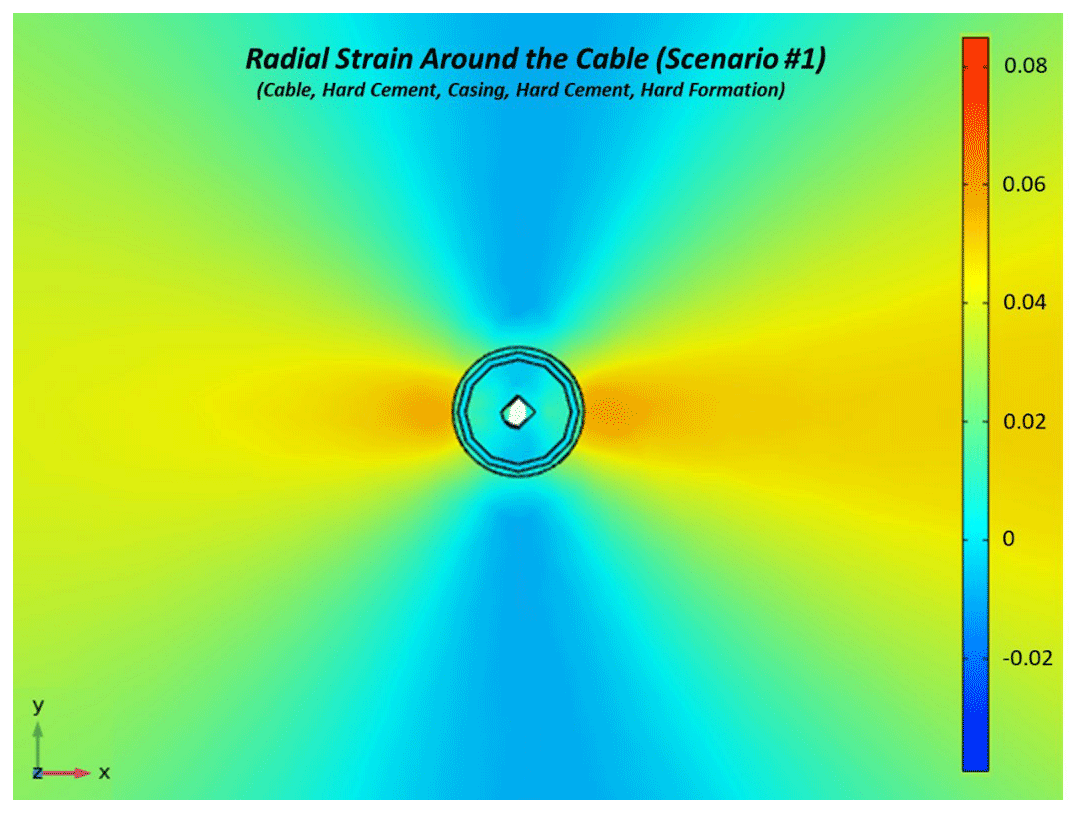
Figure 5Radial strain around the cable as a response of compressional wave propagation at a 90∘ incident angle in scenario 1 (incident waveform is incoming from the right).
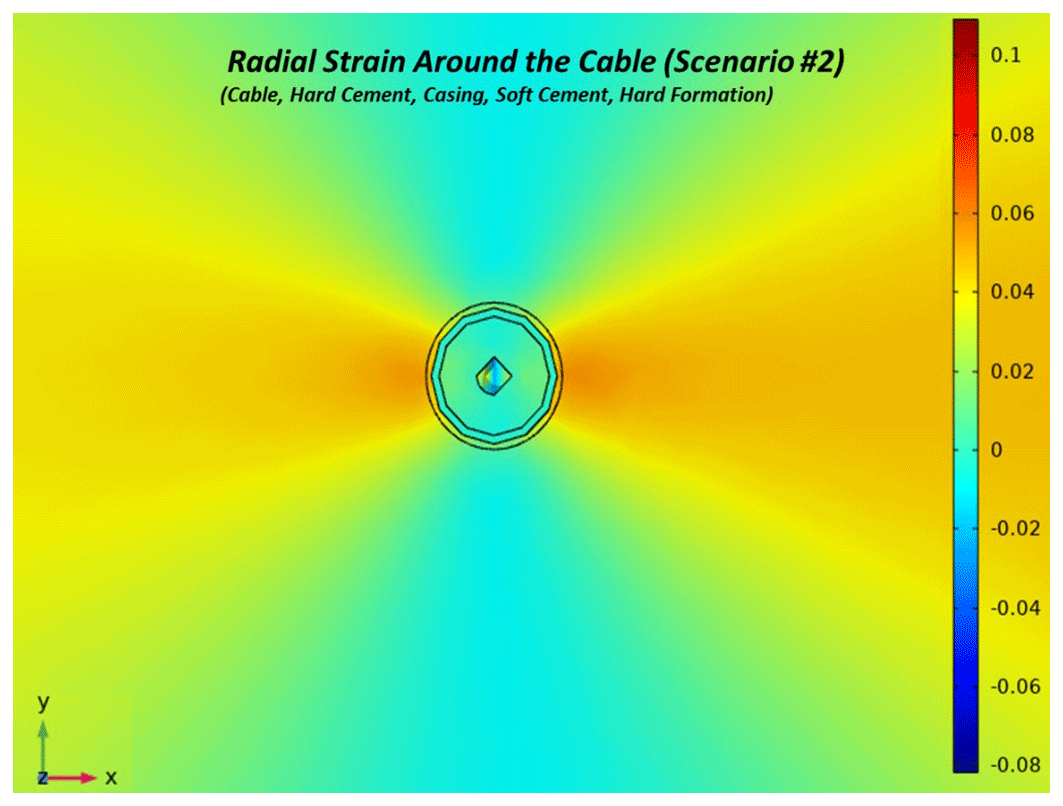
Figure 6Radial strain around the cable as a response of compressional wave propagation at a 90∘ incident angle in scenario 2 (incident waveform is incoming from the right).

Figure 7Radial strain around the cable as a response of compressional wave propagation at a 90∘ incident angle in scenario 3 (incident waveform is incoming from the right).
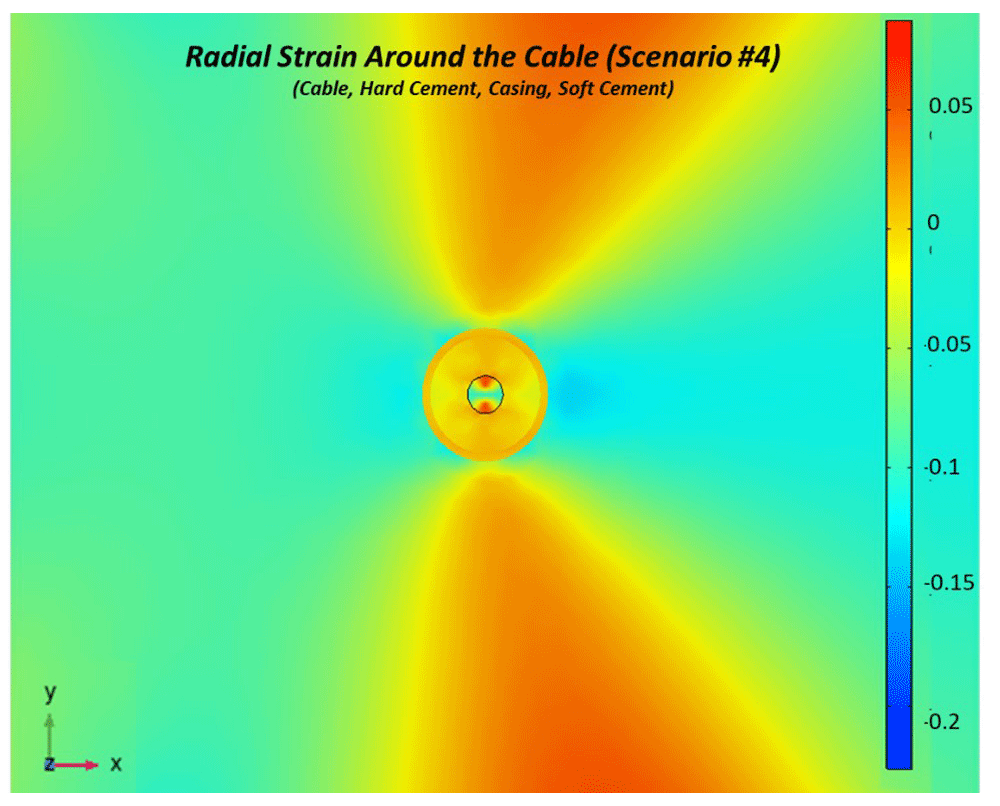
Figure 8Radial strain around the cable as a response of compressional wave propagation at a 90∘ incident angle in scenario 4 (incident waveform is incoming from the right).
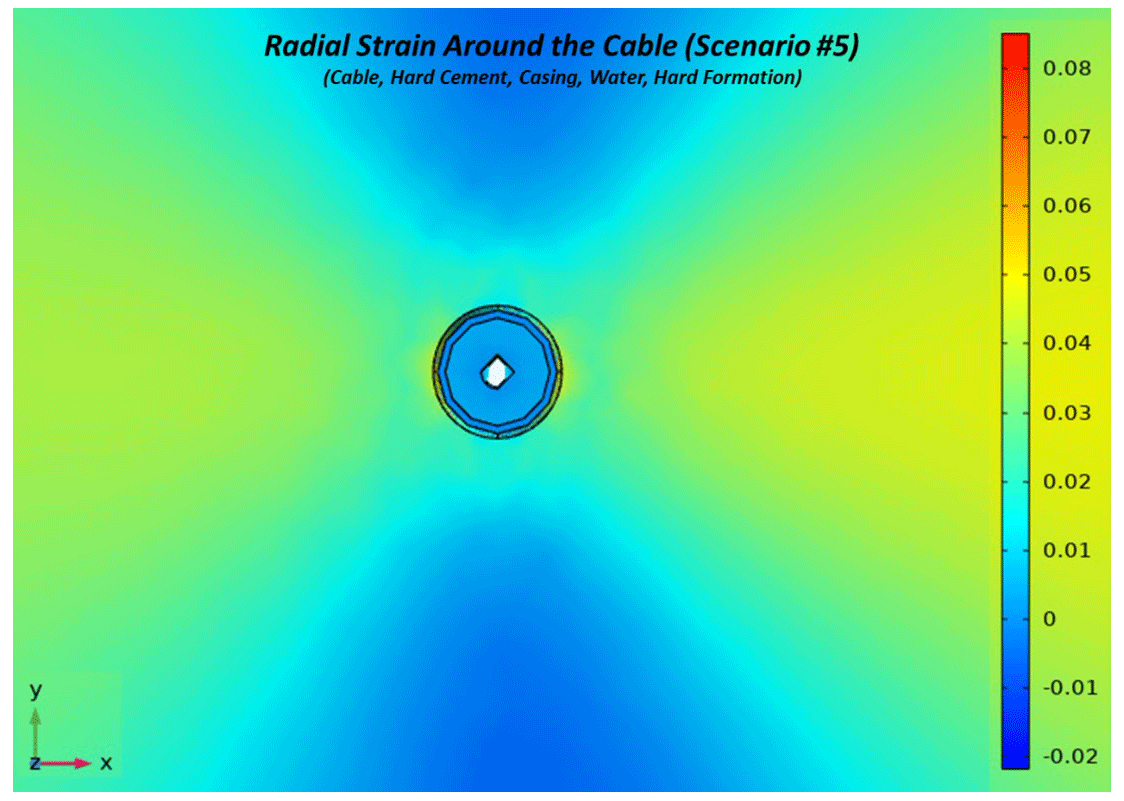
Figure 9Radial strain around the cable as a response of compressional wave propagation at a 90∘ incident angle in scenario 5 (incident waveform is incoming from the right).
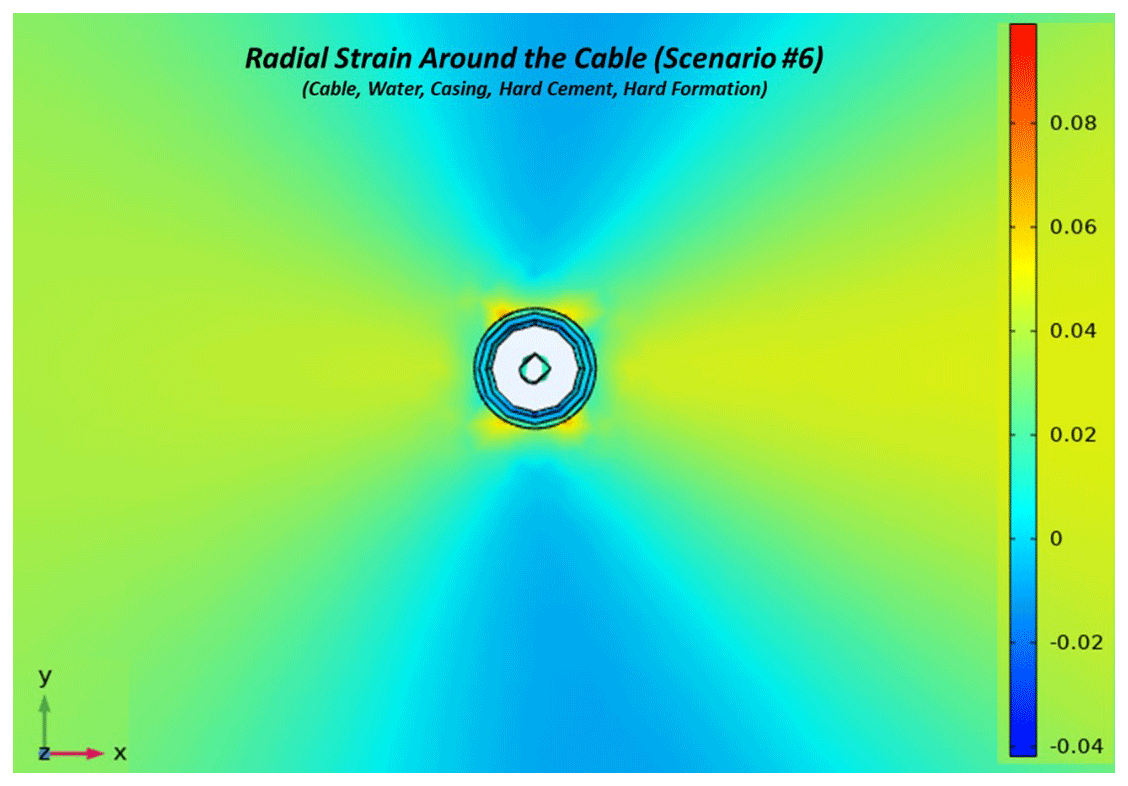
Figure 10Radial strain around the cable as a response of compressional wave propagation at a 90∘ incident angle in scenario 6 (incident waveform is incoming from the right).
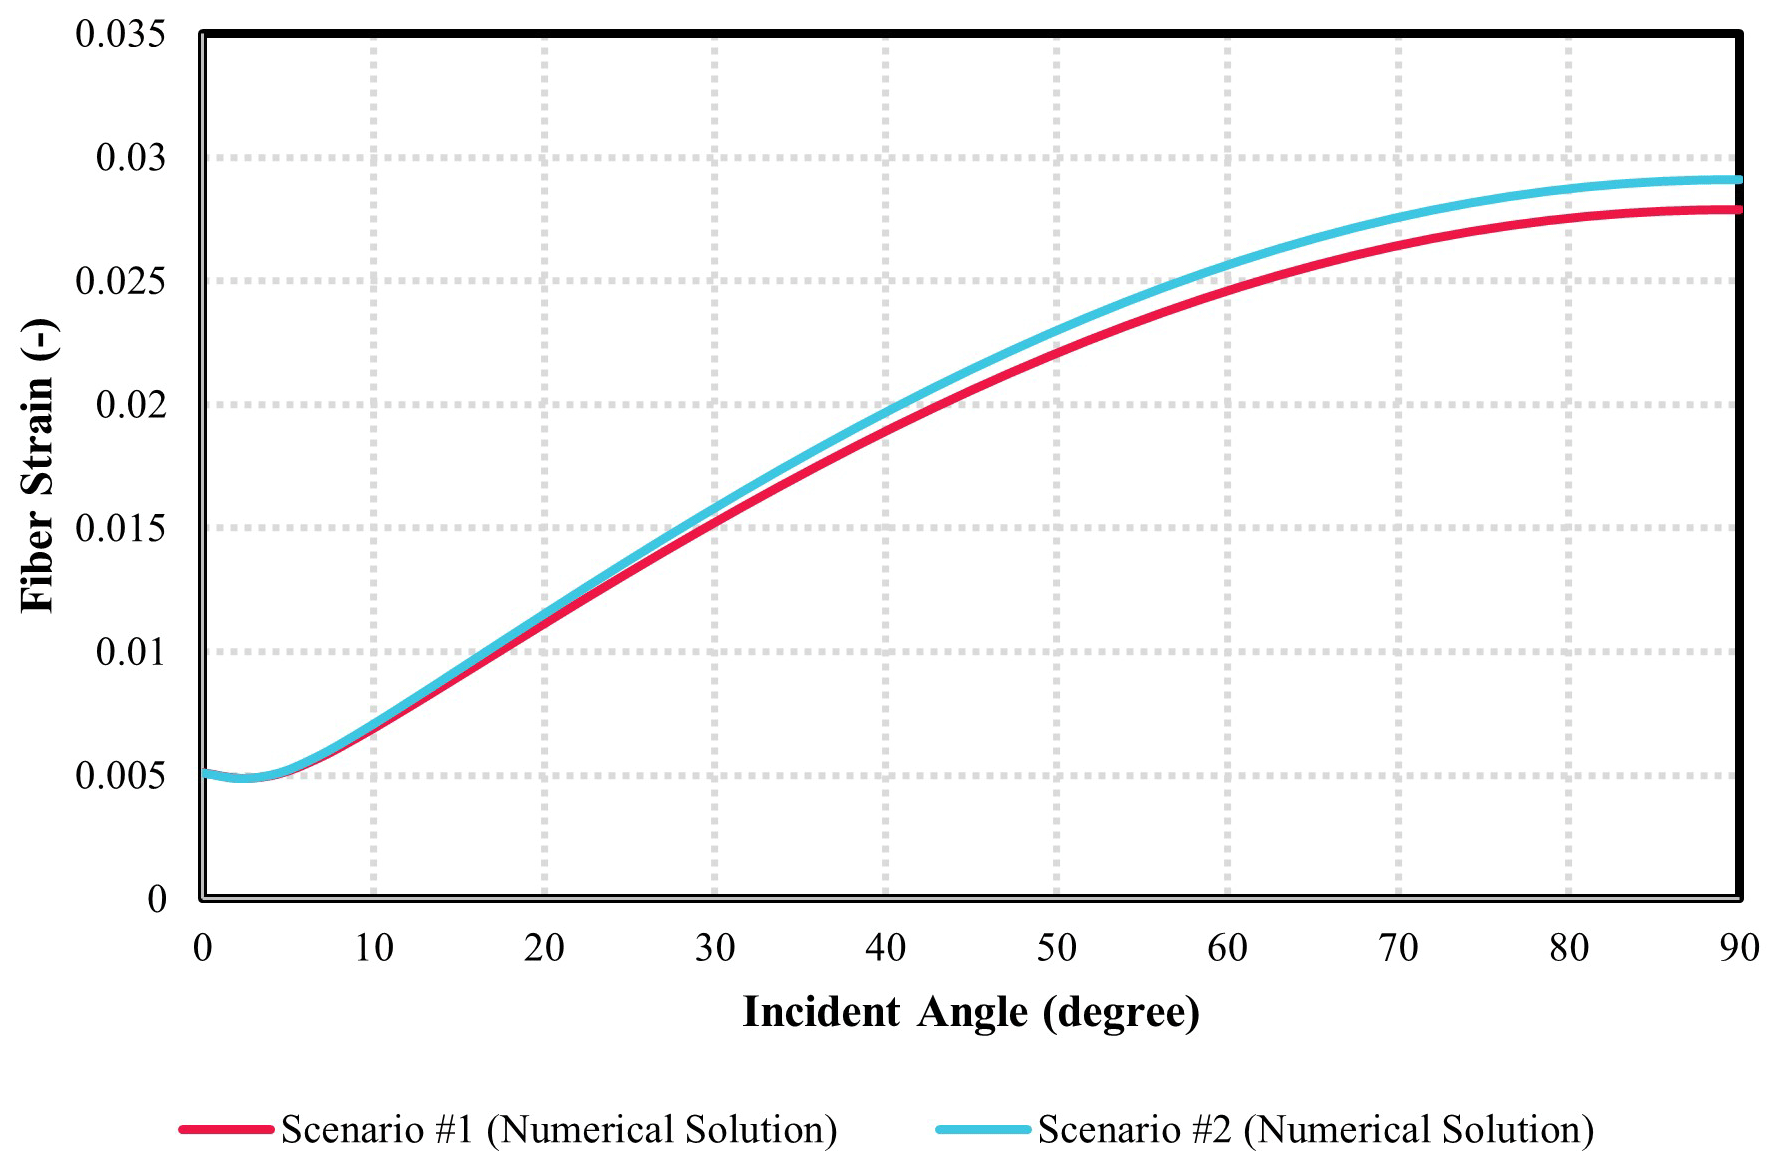
Figure 11Investigation of the effect of cement quality (soft versus hard) surrounding the casing on the acoustic response of fibre (comparison between scenarios 1 and 2).
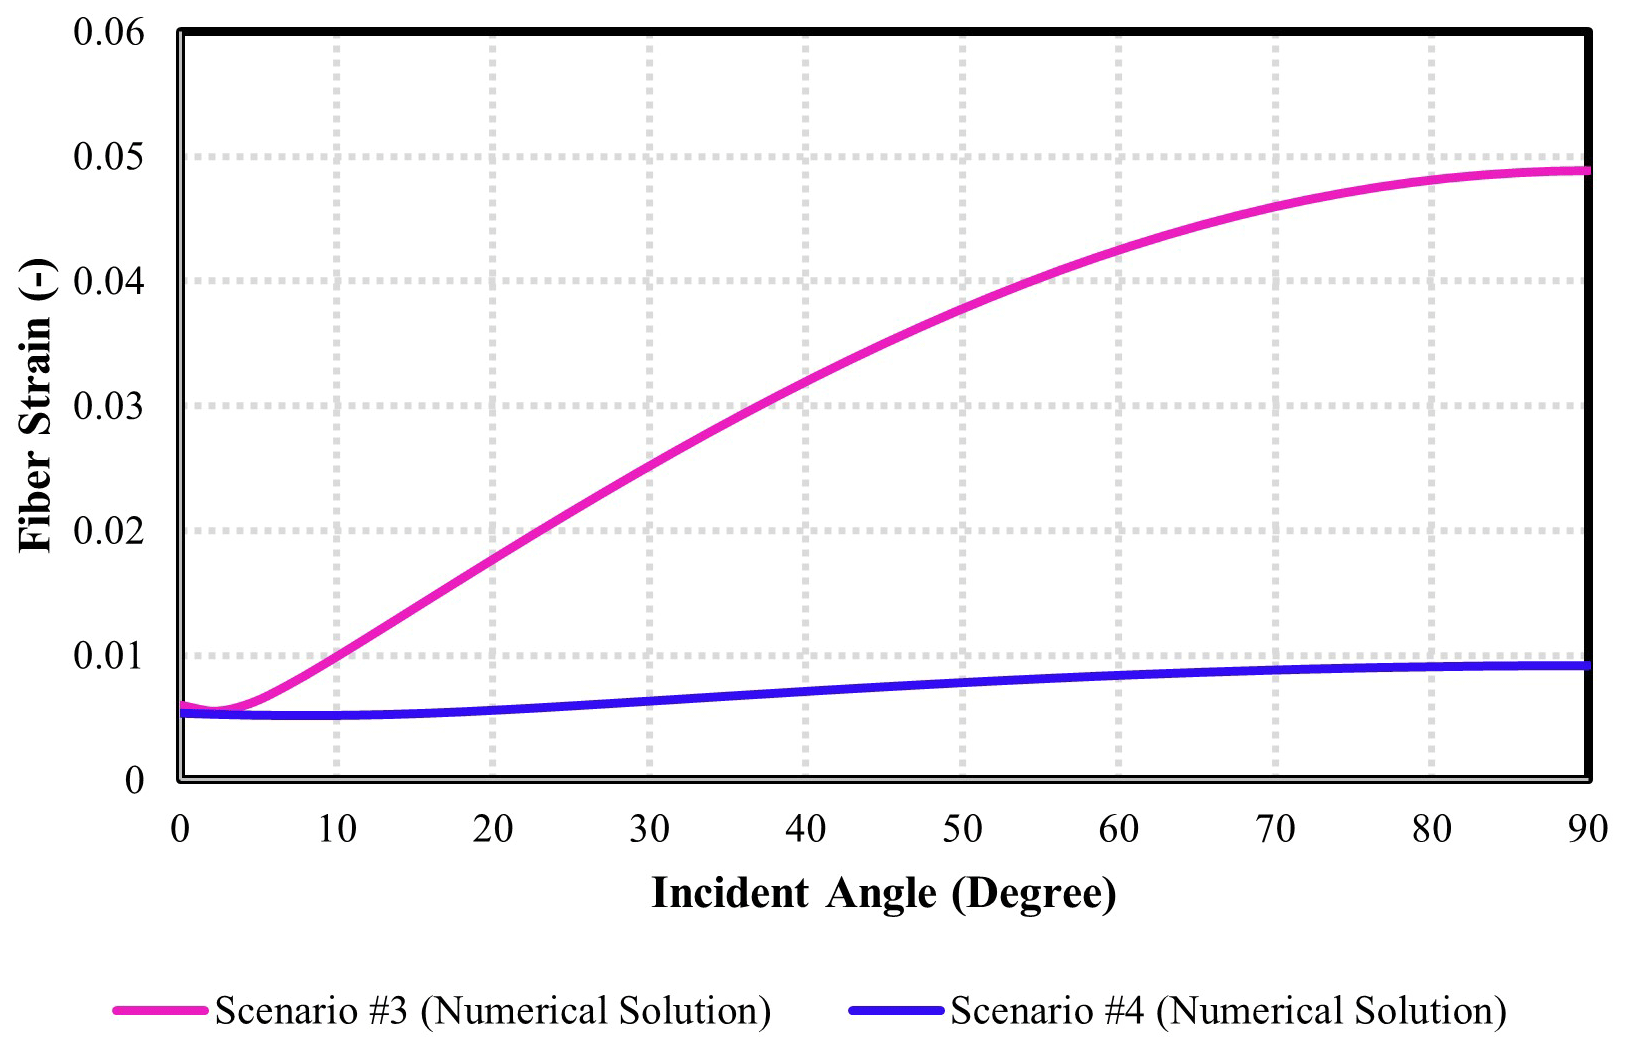
Figure 12Investigation of the effect of a hard or soft formation adjacent to the casing on the acoustic response of fibre (comparison between scenarios 3 and 4).

Figure 13Investigation of the effect of water on the acoustic response of fibre (comparison between scenarios 5 and 6). The strains are given as absolute values, and the strains for an incident angle below 18∘ are tensile.
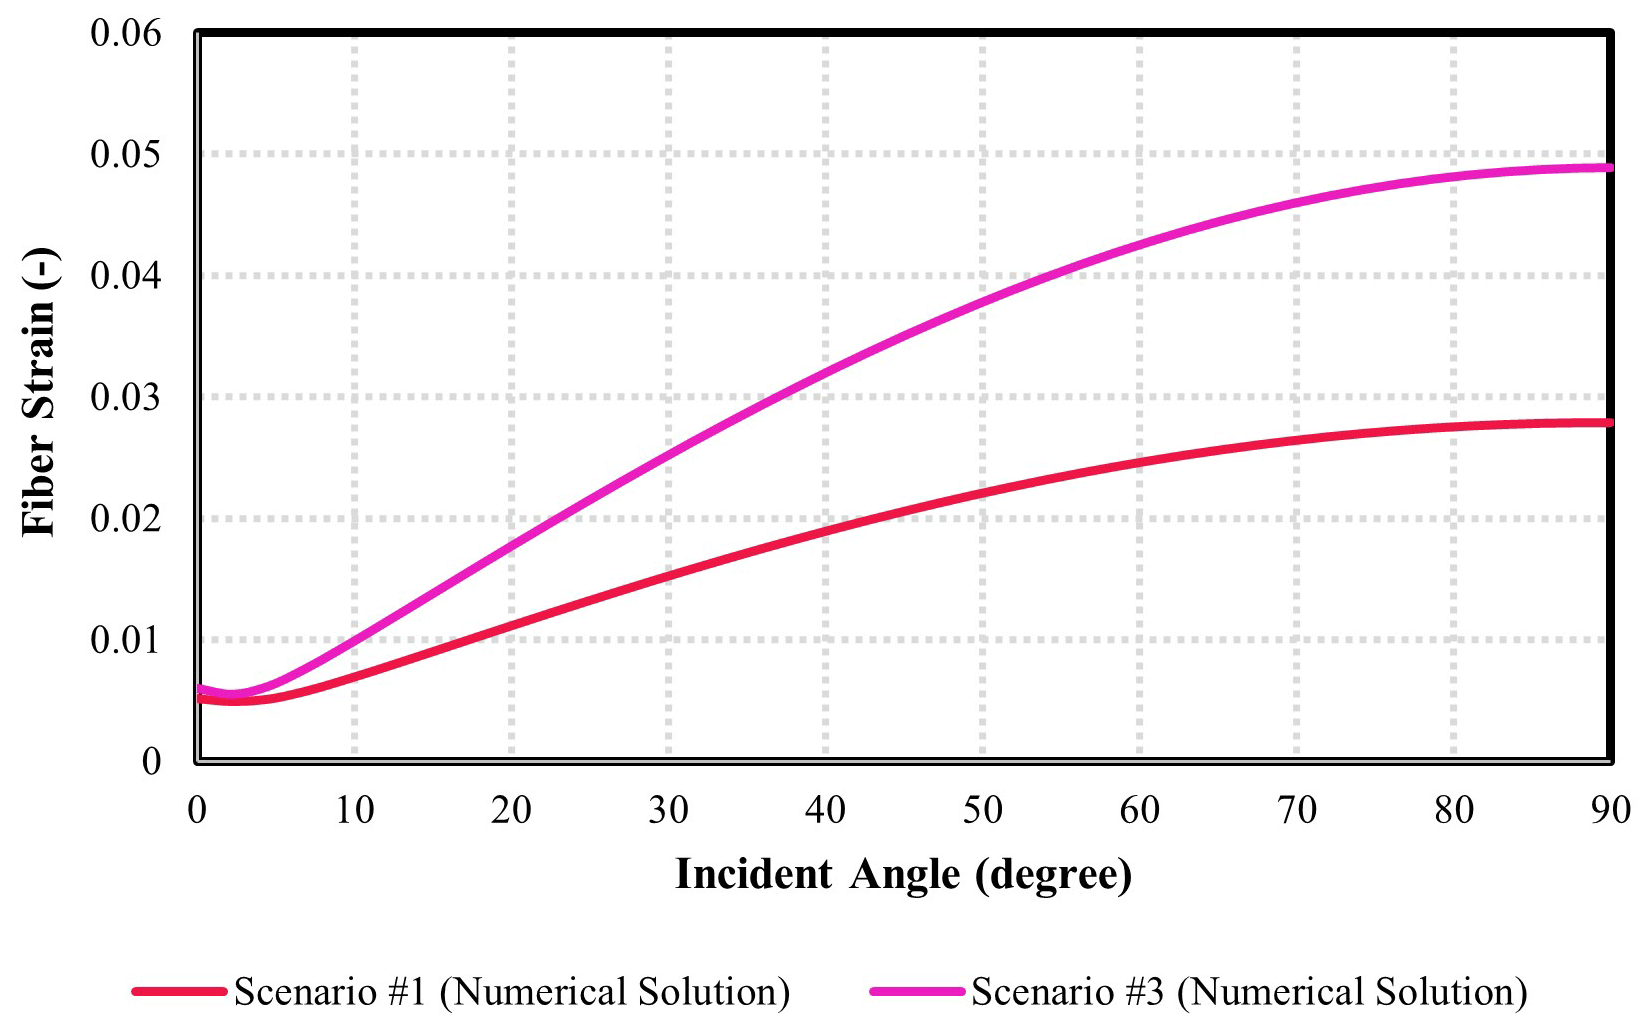
Figure 14Investigation of the number of layers in the acoustic response of fibre (comparison between scenarios 1 and 3).
Bellefleur et al. (2020) make the following observations for the New Afton DAS data and offer the following interpretations to explain them. First, data recorded with the straight fibre-optic cable include several noisy traces at the locations indicated by the vertical arrows near the top-left corner of Fig. 2a, particularly near traces 90 and 215, which coincide with fault zones as identified using wire line log data. Such noise is typical of uncemented or poorly cemented casing and is caused by local casing resonance. Second, noisy traces are also observed at similar locations in the HWC (see vertical arrows near the top-left corner of Fig. 2b), but resonance noise on those traces is not as strong as the straight fibre data. The HWC data are, however, strongly affected by tube waves between the two fault zones (see diagonal arrows in the left half of Fig. 2b), which suggests the presence of liquid or incomplete cementing of the formation–casing annulus. Finally, aside from the traces showing noise and resonance, the signal strength (fibre strain) of the linear fibre appears relatively good. As shown in Fig. 2a, this dataset contains many events indicated with arrows and comprising direct P and S waves, many downward waves (arrows C and D), and reflected waves (indicated with white arrows). This suggests that the cement within the casing (i.e., encompassing the fibre cables) cured properly and contained no liquid, hence enabling a strong signal in the axial direction in response to the vertical component of the propagating seismic waves. Conversely, the HWC dataset showed a relatively weak response to the aforementioned events.
While the modelling scenarios considered in this work do not fully capture the complexity of ground conditions and coupling behind the casing (inferred from DAS data), they offer some explanation for some of the observations made above. Based on the results obtained in this work, the presence of a soft formation (scenario 4) or water (scenario 5) outside the casing is likely to reduce the amplitude measured on a HWC located inside the casing. At New Afton, faults zones consist of weakly competent and brittle rocks that could likely be considered similar or even weaker than the soft formation used in our models. The presence of water outside the casing is also indicated locally by tube waves on the HWC data. For scenario 5 (water-filled formation–casing annulus), the relatively weak response of the HWC dataset suggests that cementing the emplacement and curing outside of casing was not effective for a significant portion of this borehole. A casing properly coupled with rock formation with either soft or hard cement (scenarios 1 and 2) would not impede HWC measurements. The results obtained in scenario 4 (soft rock formation in direct contact with casing) provide an additional explanation for poor signal quality; one which might be relevant over some intervals of the borehole. This is suggested because Bellefleur et al. (2020) noted several weak and unstable intervals (including fault zones) and had to ream these intervals during drilling and logging operations and leave drill rods in place over these intervals to prevent borehole collapse during logging operations. Scenario 4 suggests that the soft nature of the rocks in these intervals would result in low fibre strains for the HWC even if the weak zone converged on the casing and achieved reasonably effective coupling.
The DAS dataset at New Afton, interpreted in the context of our modelling, serves as a practical demonstration of the extreme effects of surrounding media and coupling on HWC data quality. These results and new scenarios simulated with the models developed in this work can also be used to design more effective HWC systems in future field work.
We have investigated the effects of the surrounding media on the axial and radial strains of HWC for six scenarios representative of realistic situations and based on parameters of DAS experiments conducted at the New Afton deposit, British Columbia. Based on our parameters, our 3D numerical results show that the quality of cement (hard versus soft) between the casing and rock formation has a moderate effect on HWC data, with lower strain values observed for hard cement. However, having fully cured and emplaced cement inside and outside of casing is crucial to acquire a decent signal from HWC. Effects of rock formation (hard versus soft) are more significant and can contribute to signal reduction in DAS data for HWC placed in a soft rock formation. In all scenarios, the effects are largest at higher incident angles (i.e., 90∘). The presence of a water domain in the surrounding materials would make the fibre response more complicated owing to the combined effect of compressional and surface waves (i.e., tube waves).
The data that support the findings of this study are available from the corresponding author upon request.
SH did the data curation, formal analysis, visualization, and writing of the original draft. MG did the data curation, revision, and editing. GB, CDH, and DW provided supervision and did revisions of the text.
The contact author has declared that none of the authors has any competing interests.
Publisher's note: Copernicus Publications remains neutral with regard to jurisdictional claims in published maps and institutional affiliations.
This article is part of the special issue “Fibre-optic sensing in Earth sciences”. It is not associated with a conference.
The authors would like to thank the Petroleum Technology Research Centre and Mitacs for providing support funding for the modelling components of this research.
This research has been supported by Mitacs and the Petroleum Technology Research Centre through the Mitacs Accelerate Program (project reference no. IT12131).
This paper was edited by Philippe Jousset and reviewed by three anonymous referees.
Bellefleur, G., Schetselaar, E., Wade, D., White, D., Enkin, R., and Schmitt, D. R.: Vertical seismic profiling using distributed acoustic sensing (DAS) with scatter-enhanced fiber-optic cable at the Cu-Au New Afton porphyry deposit, British Columbia, Canada, Geophysical Prospecting, 68, 313–333, https://doi.org/10.1111/1365-2478.12828, 2020.
Daley, T. M., Freifeld, B. M., Ajo-Franklin, J., Dou, S., Pevzner, R., Shulakova, V., Kashikar, S., Miller, D. E., Goetz, J., Henninges, J., and Lueth, S.: Field testing of fiber-optic distributed acoustic sensing (DAS) for subsurface seismic monitoring, The Leading Edge, 32, 699–706, 2013.
Daley, T. M., Pevzner, R., Dou, S., Correa, J., Robertson, M., Tertyshnikov, K., Wood, T., Ajo-franklin, J., Urosevic, M., Popik, D., Gurevich, B., Miller, D. E., White, D., Robertson, M., Cocker, J., Strudley, A., Craven, M., Worth, K., and Harris, K.: Advanced Monitoring Technology: DAS (Distributed Acoustic Sensing) at Otway and Aquistore, IEA Greenhouse Gas Monitoring Network, Edinburgh, Scotland, 340, 2016.
Den Boer, J. J., Mateeva, A. A., Pearce, J. G., Mestayer, J. J., Birch, W., Lopez, J. L., Hornman, J. C., and Kuvshinov, B. N.: Shell Oil Co.: Detecting broadside acoustic signals with a fiber optical distributed acoustic sensing (DAS) assembly, U.S. Patent 9,766,119, 2017.
Eaid, M., Li, J., and Innanen, K. A.: Modeling the response of shaped-DAS fibres to microseismic moment tensor sources, in: SEG Technical Program Expanded Abstracts 2018, Society of Exploration Geophysicist, 4698–4702, 2018.
Harris, K., White, D., Melanson, D., Samson, C., and Daley, T.: Feasibility of time-lapse VSP monitoring at the Aquistore CO2 storage site using a distributed acoustic sensing system, Int. J. Greenh. Gas Con., 50, 248–260, https://doi.org/10.1016/j.ijggc.2016.04.016, 2016.
Hartog, A. H.: An introduction to distributed optical fibersensing, CRC Press, Boca Raton, 472 pp., 2018.
Hornman, K.: Distributed Acoustic Sensing Cable for Surface Seismic, EAGE E-Lecture, https://www.youtube.com/watch?v=nCv5qytW1Y4 (last access: 5 June 2019), 2015.
Innanen, K.: Determination of seismic-tensor strain from Helical Wound Cable-Distributed Acoustic Sensing cable with arbitrary and nested-helix winds, in: SEG Technical Program Expanded Abstracts 2017, 926–930, Society of Exploration Geophysicists, 2017.
Jousset, P., Reinsch, T., Ryberg, T., Blanck, H., Clarke, A., Aghayev, R., Hersir, G. P., Henninges, J., Weber, M., and Krawczyk, C.: Dynamic strain determination using fibre-optic cables allows imaging of seismological and structural features, Nat. Commun., 9, 2509, https://doi.org/10.1038/s41467-018-04860-y, 2018.
Jousset, P., Currenti, G., Schwarz, B., Chalari, A., Tilmann, F., Reinsch, T., Zuccarello, L., Privitera, E., and Krawczyk, C. M.: Fibre optic distributed acoustic sensing of volcanic events, Nat. Commun., 13, 1753, https://doi.org/10.1038/s41467-022-29184-w, 2022.
Kuvshinov, B. N.: Interaction of helically wound fiber-optic cables with plane seismic waves, Geophys. Prospect., 64, 671–688, 2016.
Lindsey, N. J., Dawe, C. T., and Ajo-Franklin, J. B.: Illuminating seafloor faults and ocean dynamics with dark fibre distributed acoustic sensing, Science, 366, 1103–1107, 2019.
Mateeva, A., Lopez, J., Potters, H., Mestayer, J., Cox, B., Kiyashchenko, D., Wills, P., Grandi, S., Hornman, K., Kuvshinov, B., and Berlang, W.: Distributed acoustic sensing for reservoir monitoring with vertical seismic profiling, Geophys. Prospect., 62, 679–692, 2014.
Miah, K. and Potter, D. K.: A review of hybrid fiber-optic distributed simultaneous vibration and temperature sensing technology and its geophysical applications, Sensors, 17, 2511, https://doi.org/10.3390/s17112511, 2017.
Miller, D. E., Daley, T. M., White, D., Freifeld, B. M., Robertson, M., Cocker, J., and Craven, M.: Simultaneous acquisition of distributed acoustic sensing VSP with multi-mode and single-mode fiber-optic cables and 3C-geophones at the Aquistore CO2 storage site, CSEG Recorder, 41, 28–33, 2016.
Mollahasani Madjdabadi, B.: Experimental Evaluation of a Distributed Fiber Optic Sensor for Mining Application, Doctoral dissertation, UWSpace, 2016.
Ning, I. L. C.: Multicomponent Distributed Acoustic Sensing: Concept, Theory, and Applications, Colorado School of Mines, 2019.
Ning, I. L. C. and Sava, P.: Multicomponent distributed acoustic sensing, in: SEG Technical Program Expanded Abstracts 2016, Society of Exploration Geophysicists, 5597–5602, 2016.
Ning, I. L. C. and Sava, P.: Multicomponent distributed acoustic sensing: Concept and theory, Geophysics, 83, P1–P8, 2018.
Ranjan, P. and McColpin, G.: Fiber-Optic Sensing: Turning the Lights on Downhole, The Digital Oil Field, 83, 34–37, 2013.
Riedel, M., Cosma, C., Enescu, N., Koivisto, E., Komminaho, K., Vaittinen, K., and Malinowski, M.: Underground vertical seismic profiling with conventional and fiber-optic systems for exploration in the Kylylahti polymetallic mine, eastern Finland, Minerals, 8, 538, https://doi.org/10.3390/min8110538, 2018.
Sladen, A. Rivet, D., Ampuero, J.-P., De Barros, L., Hello, Y., Calbris, G., and Lamare, P.: Distributed sensing of earthquakes and ocean-solid Earth interactions on seafloor telecom cables, Nat. Commun., 18, 5777, https://doi.org/10.1038/s41467-019-13793-z, 2019.
Walter, F., Gräff, D., Kindner, F., Paitz, P., Köpfli, M., Chmiel, M., and Fichtner, A.: Distributed acoustic sensing of microseismic sources and wave propagations in glaciated terrain, Nat. Commun., 11, 2436, https://doi.org/10.1038/s41467-020-15824-6, 2020.