the Creative Commons Attribution 4.0 License.
the Creative Commons Attribution 4.0 License.
 | 30 Aug 2023
Numerical modeling of stresses and deformation in the Zagros–Iranian Plateau region
Srishti Singh
The Zagros orogenic system resulted due to collision of the Arabian plate with the Eurasian plate. The region is characterized by ocean–continent subduction and continent–continent collision, and the convergence velocity shows variations from east to west. Therefore, this region shows the complex tectonic stress and a wide range of diffuse or localized deformation between both plates. The in situ stress and GPS data are very limited and sparsely distributed in this region; therefore, we performed a numerical simulation of the stresses causing deformation in the Zagros–Iran region. The deviatoric stresses resulting from the variations in lithospheric density and thickness and those from shear tractions at the base of the lithosphere due to mantle convection were computed using thin-sheet approximation. Stresses associated with both sources can explain various surface observations of strain rates, , and plate velocities, thus suggesting a good coupling between lithosphere and mantle in most parts of Zagros and Iran. As the magnitude of stresses due to shear tractions from density-driven mantle convection is higher than those from lithospheric density and topography variations in the Zagros–Iranian Plateau region, mantle convection appears to be the dominant driver of deformation in this area. However, the deformation in the east of Iran is caused primarily by lithospheric stresses. The plate velocity of the Arabian plate is found to vary along the Zagros belt from the north–northeast in the southeast of Zagros to the northwest in northwestern Zagros, similarly to observed GPS velocity vectors. The output of this study can be used in seismic hazards estimations.
- Article
(21097 KB) - Full-text XML
-
Supplement
(2248 KB) - BibTeX
- EndNote


The Zagros Mountains are a part of the Alpine–Himalayan belts that originated due to the Arabian plate colliding with the southern boundary of the Eurasian plate. This collision resulted from the closing of the Neotethys Ocean and formed the Zagros fold-and-thrust belt (Agard et al., 2005, 2011; Alavi, 1980; Mouthereau et al., 2012). The Zagros Mountains extend from the eastern part of Anatolia for over 1500 km in the NW–SE direction until the Makran subduction zone, showing large-scale diffuse deformation. Despite the first-order characteristics of the active deformation and present-day kinematics of the Zagros orogen being relatively well understood (Allen et al., 2011; Le Dortz et al., 2009; Reilinger et al., 2010; Vernant et al., 2004; Walker, 2006), the timing of the collision is debated. The timing of the collision ranges from Cretaceous (Alavi, 1994; Mohajjel and Fergusson, 2000) to Miocene (Berberian and King, 1981) or Eocene (Allen and Armstrong, 2008; Jolivet and Faccenna, 2000). However, there has been an increasing consensus on Late Eocene to Oligocene for the onset of collision (Jolivet and Faccenna, 2000; Agard et al., 2005, 2011; Vincent et al., 2005; Ballato et al., 2011; Mouthereau et al., 2012; Koshnaw et al., 2019). The Arabia–Eurasia collision zone is a tectonically active region, where ongoing convergence is accommodated by distributed shortening across the Zagros Mountains and the northern and eastern margins of the Iranian Plateau and the southern Caspian Sea. The rate of convergence of Arabia relative to Eurasia also varies significantly, decreasing from 36 mm yr−1 in the east to 16 mm yr−1 in the west (Fig. 1). The diverse structures, tectonic history, and convergence velocity variations in the Zagros–Iran plateau region lead to variable tectonic stresses and deformations, thus making it the focus of various geophysical, geological, and geodesy studies (Engdahl et al., 2006; Hatzfeld et al., 2010; Khorrami et al., 2019; Masson et al., 2006; Tunini et al., 2016, 2017). Based on earthquake focal mechanisms, fault slips, and GPS velocities, the Zagros–Iran region has been categorized as a highly seismic region; thus, a better constraint on stresses and deformation in this region may be helpful in disaster mitigation studies.
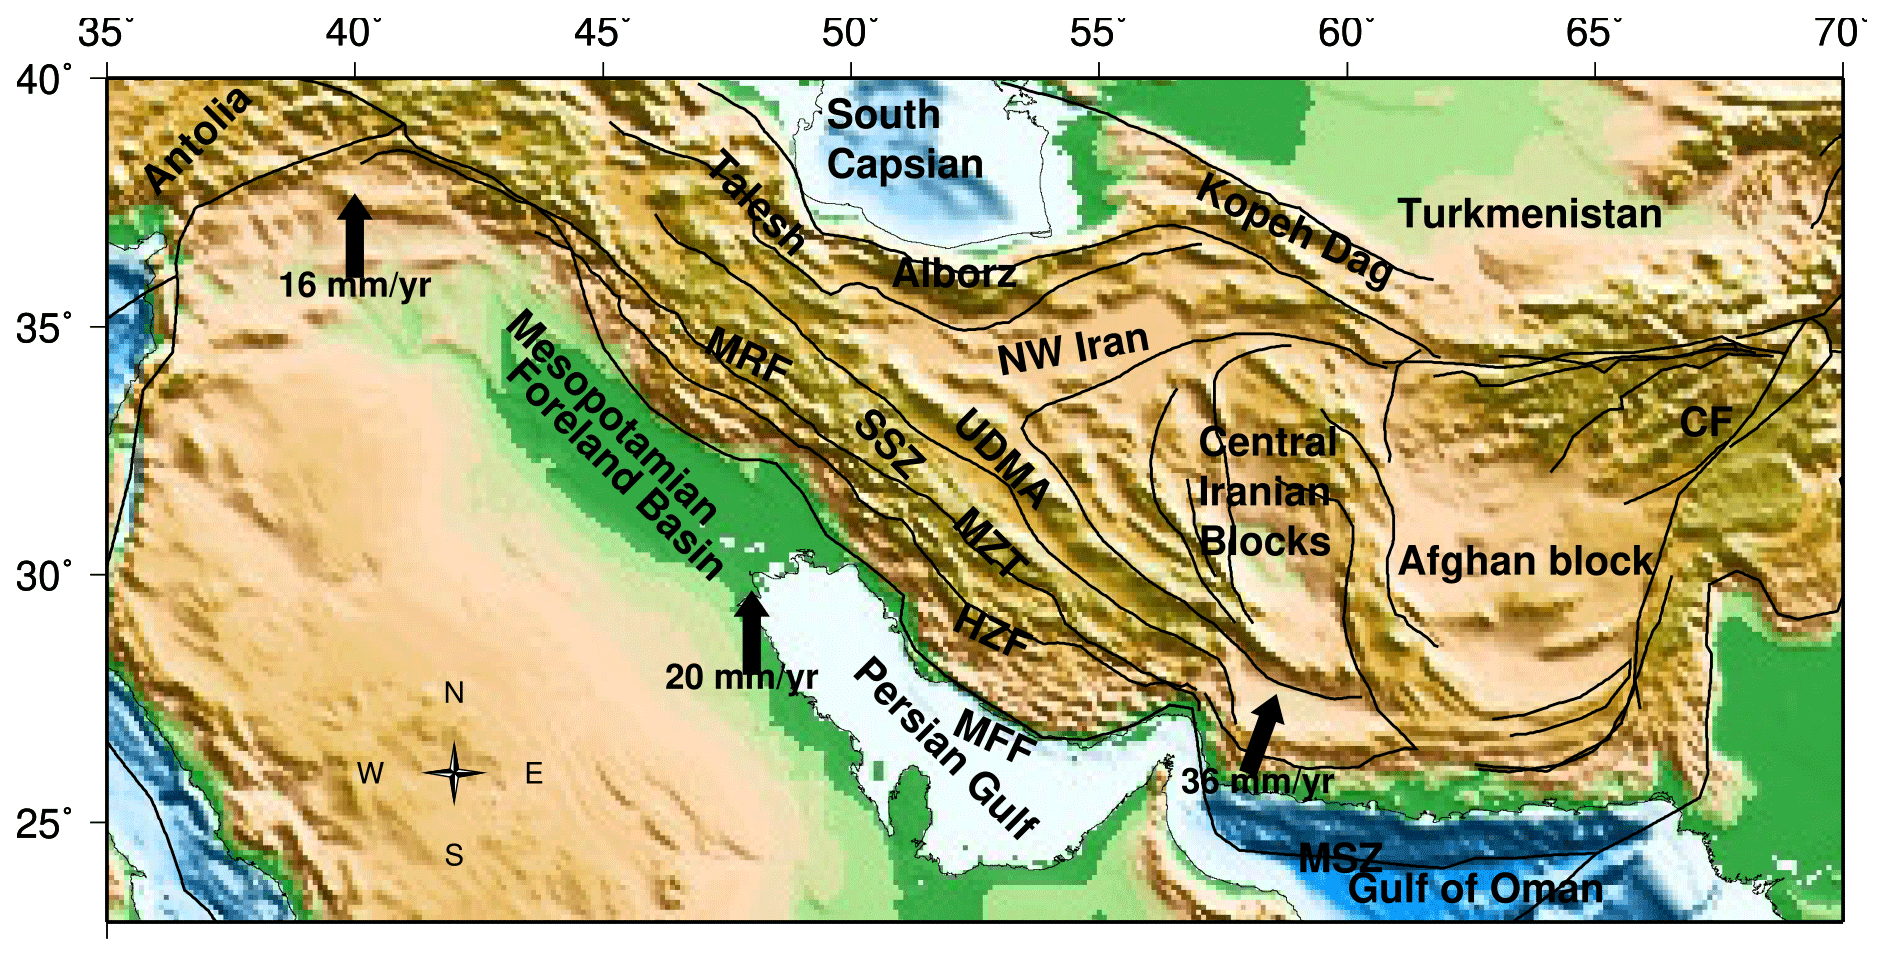
Figure 1Tectonic overview of central Eurasia. Abbreviations: CF – Chaman Fault, MSZ – Makran subduction zone, MZT – Main Zagros Thrust, HZF – High Zagros Fault, MFF – Mountain Front Fault, SSZ – Sanandaj–Sirjan Zone, UDMA – Urumieh–Dokhtar Magmatic Arc, and MRF – Main Recent Fault.
Generally, tectonic stress refers to the forces acting on the Earth's crust that cause it to deform or undergo changes, and it is classified by first, second, and third order on the spatial scale (Heidbach et al., 2007; Zoback, 1992). The first-order stresses originate due to plate boundary forces like ridge push, slab pull, and continental collision, and second-order stresses originate due to rifting, isostasy, and deglaciation. Moreover, third-order stresses are caused by local sources like interaction between fault systems, topography, and density heterogeneity. Therefore, to understand the origin of these stresses, in situ stress measurements are done using the focal-mechanism inversion, wellbore breakouts, hydraulic fracturing, and overcoring and are compiled under the World Stress Map project. However, in situ stress data are sparsely distributed and limited, so numerical modeling plays an important role in understanding the kinematics and dynamics of the Zagros–Iran region. Numerical modeling of tectonic stresses and deformation is generally conducted using two approaches: (1) using 2D and 3D geometrical structures (obtained from geophysical studies), plate boundary forces (like ridge push, slab pull, and continent collision forces), and rheological properties (like Young’s modulus, Poisson's ratio, viscosity, and density) (Coblentz and Sandiford, 1994; Dyksterhuis and Müller, 2008; Koptev and Ershov, 2010; Richardson et al., 1976; Yadav and Tiwari, 2018) or (2) considering gravitational potential energy and shear tractions from mantle convection with thin-sheet approximation (Bird, 1998; Flesch et al., 2001; Ghosh and Holt, 2012; Lithgow-Bertelloni and Guynn, 2004; Singh and Ghosh, 2020).
There are various studies that have tried to investigate present-day stresses and deformations of the Zagros–Iranian Plateau region using focal-mechanism inversions, GPS data, and numerical modeling. The stresses were computed through the inversion of focal mechanisms in areas like the Zagros fold-and-thrust belt (Nouri et al., 2023; Sarkarinejad et al., 2018; Yaghoubi et al., 2021), the Zagros–Makran transition zone (Ghorbani Rostam et al., 2018), western Zagros (Navabpour et al., 2008), northwestern Iran to southeastern Turkey (Mokhoori et al., 2021), the northeastern Lut block, eastern Iran (Rashidi et al., 2022; Raeesi et al., 2017), and the southern Caspian Sea (Jackson et al., 2002). The GPS studies also provided constraints on the present-day deformation in the Zagros–Makran transition zone (Bayer et al., 2006), Makran subduction zone (Frohling and Szeliga, 2016), Iran (Khorrami et al., 2019; Masson et al., 2006, 2007; Vernant et al., 2004; Walpersdorf et al., 2014), and the Nubia–Arabia–Eurasia plate system (Reilinger and McClusky, 2011). Sobouti and Arkani-Hamed (1996) studied the large-scale tectonic processes of the region and reproduced observed faulting patterns by considering highly rigid central Iran and the southern Caspian Sea using a viscous thin-sheet approximation. On the other hand, Md and Ryuichi (2010) used finite-element modeling (FEM) to analyze the neotectonic stress field of Zagros and the adjoining area and showed N–S- and NNE–SSW-oriented in Lurestan and the eastern Zagros simple folded belt, whereas was NW–SE-oriented around the Main Recent Fault (MRF) and in the northern High Zagros Fault (HZF). Further, the kinematic model by Khodaverdian et al. (2015) provided constraints on the fault slip rates, plate velocities, and seismicity of the Iranian Plateau. Most of the deformation studies done in this region focus on different tectonic fragments of the Arabia–Eurasia collision zone. Moreover, the previous studies do not include the role of shear tractions associated with mantle convection in affecting the deformation and stresses in the Zagros–Iran regions.
In this study, we investigate the stress and deformation in the entire Zagros–Iranian Plateau region to constrain the forces acting in this region with gravitational potential energy (GPE) and shear traction of mantle tractions. We will use a thin viscous sheet model based on Flesch et al. (2001) to compute various deformation parameters such as deviatoric stresses, strain rates, most compressive principal stress (), and plate velocities within the Zagros–Iran region.
The evolution of the Zagros mountain belt is a direct consequence of the continental collision between the Arabian and Eurasian plates. Zagros is located on the northeastern margin of the Arabian plate, trending in the southwest direction (Fig. 1). It is bounded by the Main Zagros Thrust (MZT) in the northeast, while it joins the Tauras Mountains in southern Turkey in the northwest. In the southeast, the N–S-trending Minab–Zandan fault zone separates Zagros from the Makran range. In outer Zagros are the young folded mountains in the southwest of the orogeny (Falcon, 1974; Sattarzadeh et al., 2002). The High Zagros Fault (HZF) separates the highly deformed metamorphic rocks of inner Zagros from the simply folded mountains of outer Zagros (Hatzfeld and Molnar, 2010; Hatzfeld et al., 2010). Inner Zagros is bounded by the MZT in the northeast and is dominated by thrust faulting, possibly due to compression during the Late Cretaceous (Alavi, 1980). Northwestern Zagros is separated from central Zagros by a north–south-trending strike–slip zone of deformation known as the Kazerun fault system (KFS) (Authemayou et al., 2005).
The Zagros Mountains were formed between ∼35 and ∼23 Ma due to the convergence of the Arabian platform beneath the central Iranian crust (Agard et al., 2005; Ballato et al., 2011; Mouthereau et al., 2012). The Arabian plate moved towards Eurasia with a plate velocity of 22–35 mm yr−1 (DeMets et al., 1990; McClusky et al., 2000; Jackson et al., 2002; McQuarrie et al., 2003; Reilinger et al., 2006) in N–S to NNE direction. The convergence of the two rigid plates of Arabia and Eurasia lead to a zone of widespread deformation in the form of the high plateaus of Iran. The Iranian Plateau extends from the Caspian Sea and the Kopet Dagh range in the north to the Zagros Mountains in the west. The Iranian Plateau is bounded by the Persian Gulf and Hormuz Strait in the south and the country's political borders on the eastern side. Several tectonic processes such as intracontinental collisions, subduction along the Makran, and the transition from the Zagros fold-and-thrust belt to the Makran subduction zone contribute to the complex tectonics of the Iranian plateau.
During the last few decades, various geophysical studies (receiver function, deep seismic, GPS, and tomographic) have been carried out in the Zagros–Iran region to investigate the structure and deformation in this region. Southeastern Zagros accommodates the convergence between Arabia and Eurasia by pure shortening that occurs through high-angle (30–60∘) reverse faults that are perpendicular to the belt (Hessami et al., 2006; Irandoust et al., 2022; Walpersdorf et al., 2006). On the other hand, oblique convergence in central and northern Zagros is partitioned into a strike–slip component that is accommodated by the MRF and shortening occurring across the belt (Jackson et al., 2002; Talebian and Jackson, 2002). Zagros is separated from the Makran subduction zone (MSZ) by the Minab–Zendan–Palami (MZP) fault (54–58∘ E), which is a right-lateral strike–slip fault (Bayer et al., 2006). East of MZP shows significant shortening that is accommodated through the subduction in the MSZ. Due to the difference between convergence rates, a shearing occurs in eastern Iran, which is accommodated by the N–S-trending faults bounding the Lut block. In northern Iran, the fold-and-thrust belt of Alborz accommodates a quarter of the Arabia–Eurasia convergence (Irandoust et al., 2022). The oblique convergence in eastern Alborz is also partitioned into shortening at the southern boundary and a left-lateral component across the mountain belt (Irandoust et al., 2022; Khorrami et al., 2019; Tatar and Hatzfeld, 2009). The Alborz Mountains extend into Talesh in the west, which shows thrust faulting on nearly flat faults. The Kopet Dagh range in the northeast accommodates the Arabia–Eurasia convergence through N–S shortening on major thrust faults in the south.
3.1 Equations
To model the present-day stresses causing deformation in the Zagros–Iranian Plateau due to the Arabia–Eurasia collision, we solve the force balance equation considering the thin sheet approximation.
Here σij, xj, ρ, and gi indicate the ijth component of the total stress tensor, the jth coordinate axis, the density, and the acceleration due to gravity, respectively (England and Molnar, 1997; Ghosh et al., 2013b).
In the above equation, total stress σij is substituted by deviatoric stress using the following relation:
In the above equation, the Kronecker delta and mean stress are denoted by δij and , respectively. The force balance equation (Eq. 1) is integrated up to the base of the lithospheric sheet (L), resulting in the following full horizontal force balance equations:
In Eqs. (3) and (4), the over bars indicate integration over depth. Both equations (Eqs. 3 and 4) contain the first term representing horizontal gradients of GPE per unit area on the right-hand side. On the other hand, the shear tractions at the lithosphere base (L) arising due to mantle convection are denoted by τxz(L) and τyz(L) (Ghosh et al., 2009).
Both of the force balance equations (Eqs. 3 and 4) were solved using the finite-element technique (Flesch et al., 2001; Ghosh et al., 2009, 2013b; Singh and Ghosh, 2019, 2020) for a 100 km thick lithosphere of varying strength (Fig. S1a in the Supplement). The laterally varying viscosities for the lithosphere were assigned from Singh and Ghosh (2020). After solving these equations, we obtained the horizontal deviatoric stresses , strain rates, and plate velocities and compared them with observations.
The quantitative comparison between predicted and observed axes (Fig. 3a) was performed by computing the misfit given by sin θ(1+R) (Ghosh et al., 2013a; Singh and Ghosh, 2019, 2020), where R represents the quantitative difference between stress regimes of observed and predicted , while θ denotes the angular difference between both. Hence, this misfit accounts for both the angular and regime misfits with values lying between 0 and 3.
The correlation between predicted deviatoric stresses and the Global Strain Rate Model (GSRM) strain rates (Fig. 3b) (Flesch et al., 2007; Ghosh et al., 2013b; Singh and Ghosh, 2019, 2020) is given by the following equation:
where
and
In the above equations, the second invariants of the strain rate and stress tensors are denoted by E and T. GSRM strain rates, area, and predicted deviatoric stresses are represented by , ΔS, and τij, respectively. We also get the relative plate velocities and strain rates as output from models. However, to calculate the absolute plate velocities and strain rates, we require absolute viscosity values. We compute the scaling factor for relative viscosities by placing the predicted velocities in a no-net-rotation (NNR) frame, such that , minimizing the misfit between the predicted dynamic velocities and those from Kreemer et al. (2014). Here, v denotes the horizontal surface velocity at position r, and S is the area over the Earth's surface (see Ghosh et al., 2013b, for details).
3.2 Crustal models
On the right-hand side of Eqs. (3) and (4), the first term represents the vertically integrated vertical stress. It is computed and integrated from the top of the variable topography up to depth L (100 km) (England and Molnar, 1997; Flesch et al., 2001; Ghosh et al., 2013b; Singh and Ghosh, 2019, 2020) using the following relation:
where ρ(z), L, and h denote density, the depth to the lithosphere base (100 km), and topographic elevation, respectively. z and z′ are variables of integration, and g represents the acceleration due to gravity. We also calculated the stresses for a thicker lithosphere (L=150 and L=200 km) as studies have shown a much thicker lithosphere in the region (Robert et al., 2017; Tunini et al., 2017) (Fig. S2a–f).
The right-hand side of Eq. (6) is given by the negative GPE per unit area. To calculate GPE and the stresses associated with it, we used three global crustal models, namely CRUST2.0 (Bassin et al., 2000), CRUST1.0 (Laske et al., 2013), and LITHO1.0 (Pasyanos et al., 2014). The upper-crust thickness lies within 15–20 km in the Zagros–Iran region for the CRUST2 model (Fig. 2a). However, the thickness of the upper crust in the Zagros–Iranian region is much higher for CRUST1 and LITHO1 (>25 km) (Fig. 2b and c). The Zagros–Iran region has a thicker middle crust (>20 km) in the case of both the CRUST2 and LITHO1 models (Fig. 2d and f), while CRUST1 shows a much thinner middle crust (<12 km) in this region (Fig. 2e). The lower crust in the Zagros–Iran region is found to be very thin (<10 km) for all three models (Fig. 2g–i).
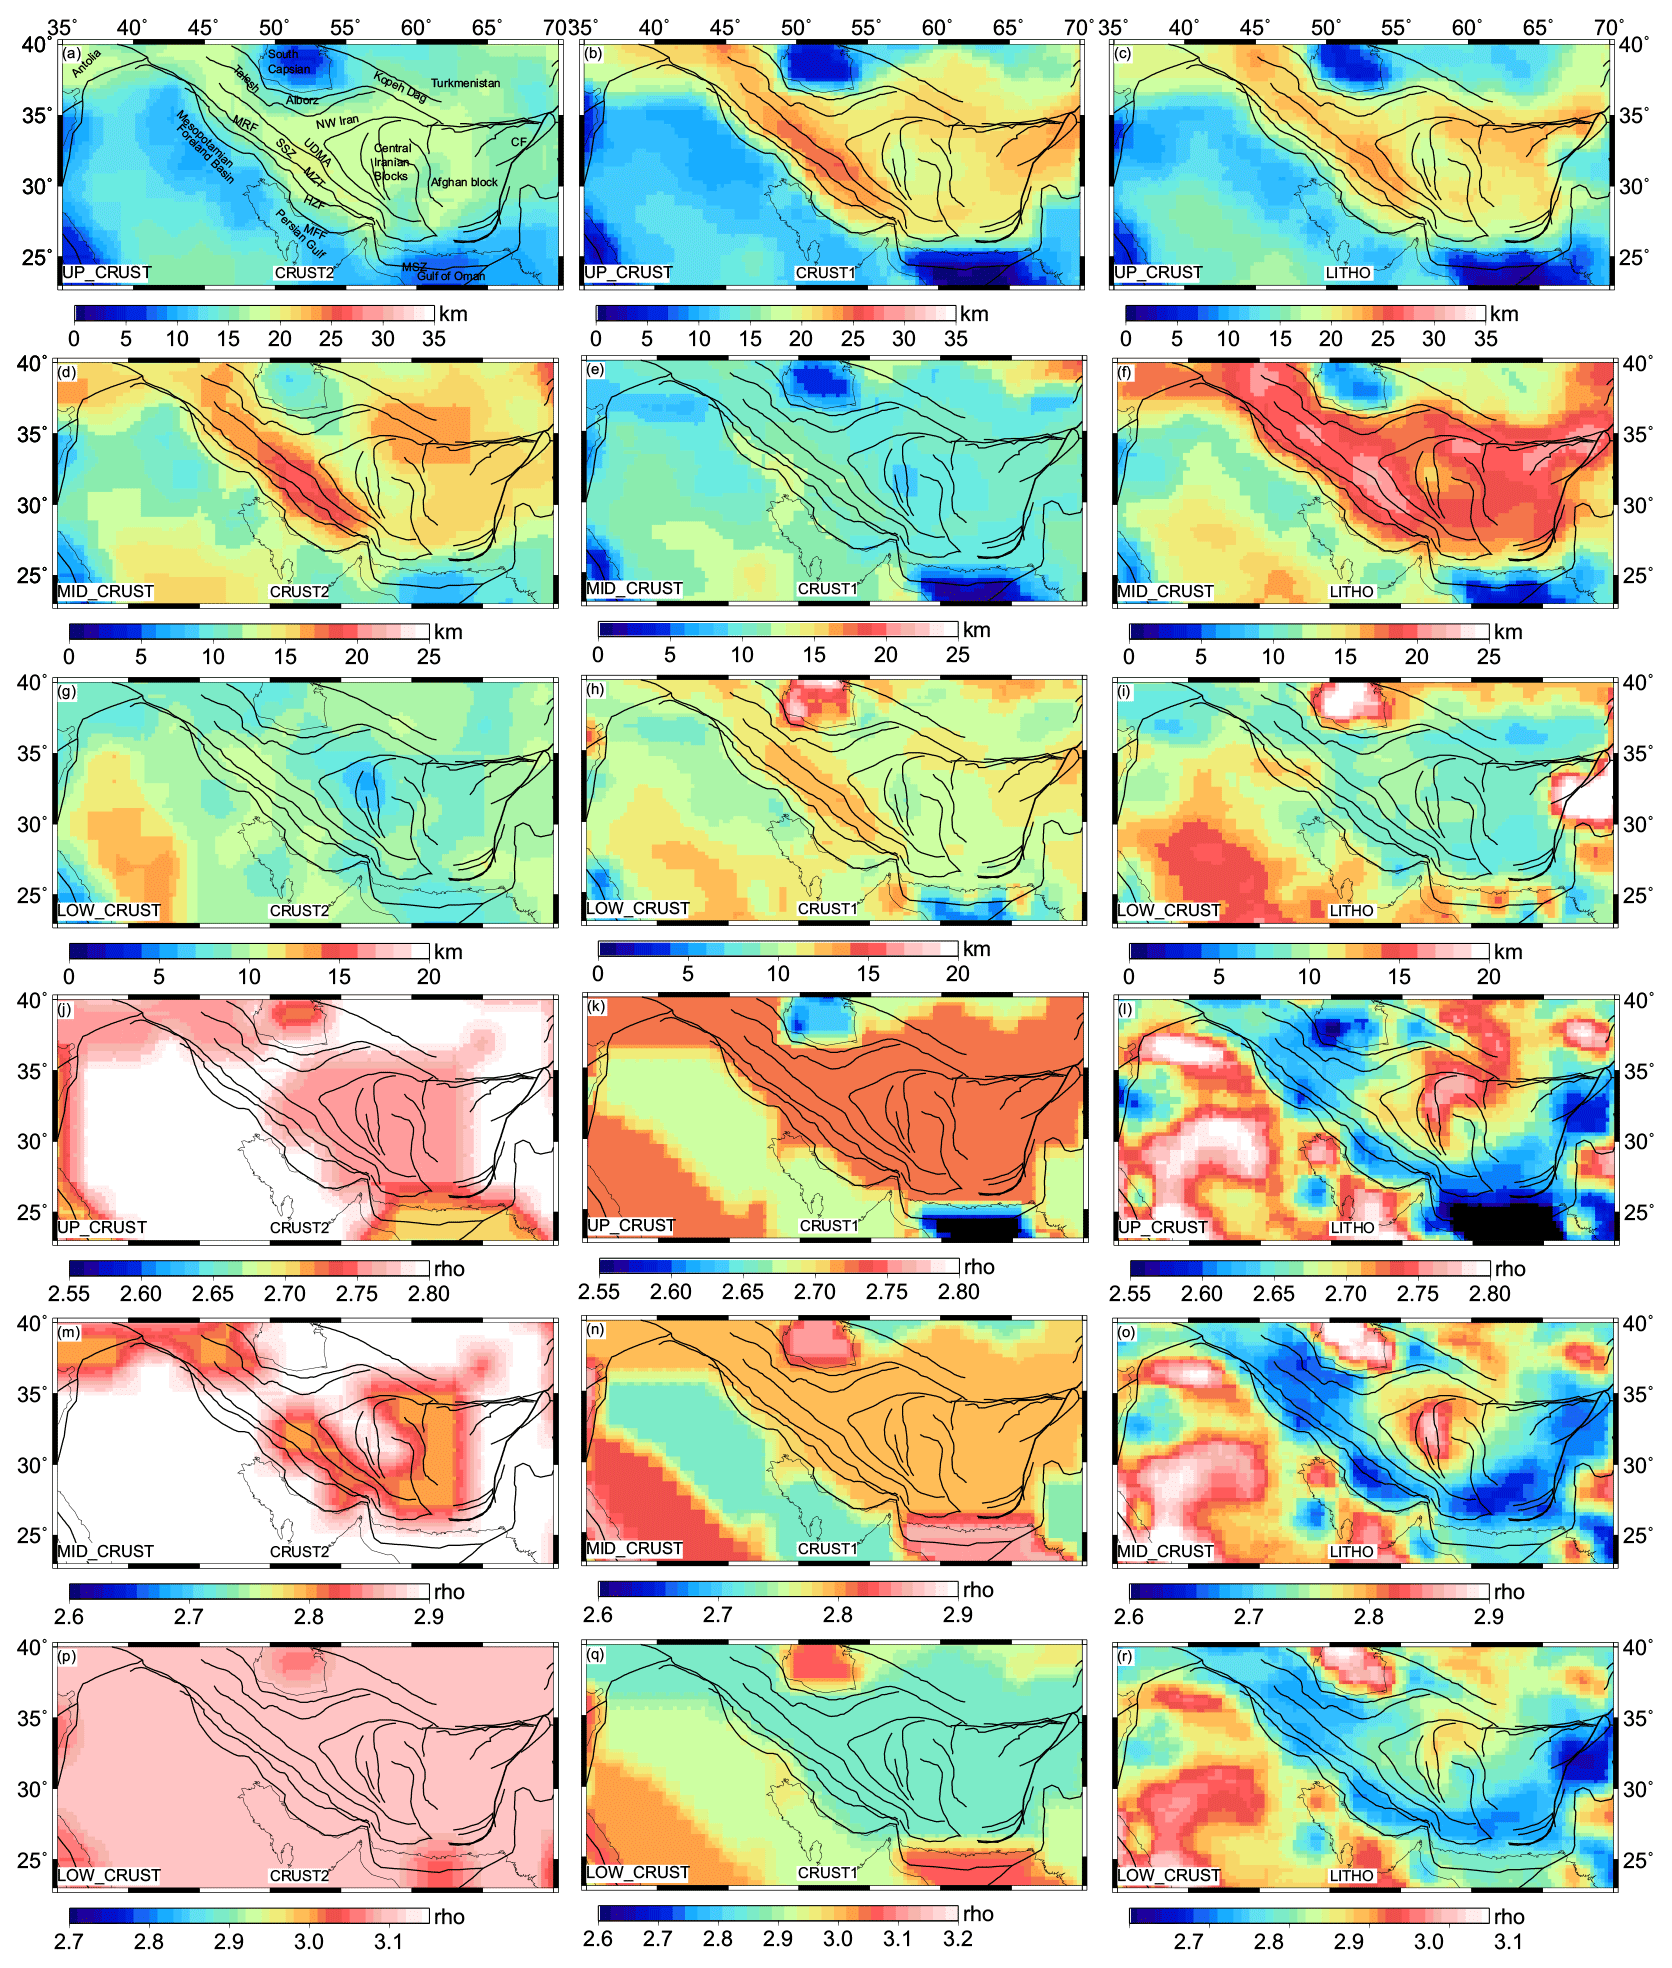
Figure 2Thickness and density variations of different layers in all three crustal and lithospheric models: CRUST2 (a, d, j, m, p), CRUST1 (b, e, h, k, n, q), and LITHO1 (c, f, i, j, o, r).
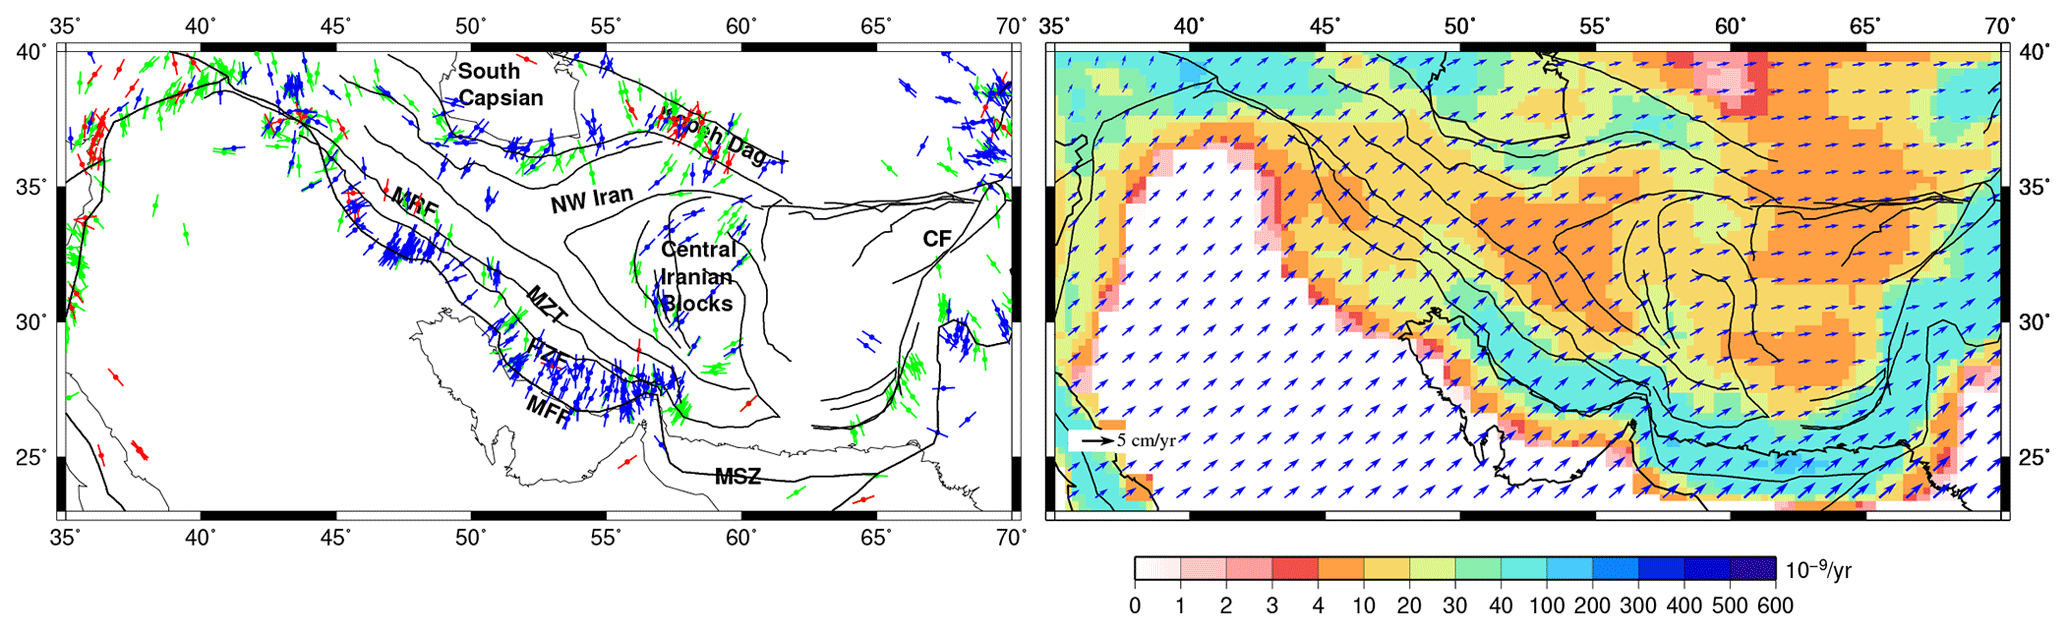
Figure 3(a) Most compressive horizontal principal axes () from WSM (Heidbach et al., 2016). Red indicates normal fault regime, and blue indicates thrust regime, whereas green denotes strike–slip regime. (b) Observed plate velocities in a no-net-rotation frame of reference from Kreemer et al. (2014) plotted on top of the second invariant of strain rate tensors obtained from Kreemer et al. (2014) plotted on grid.
The density variations in the study area are minimal for the CRUST2 model. CRUST2 also shows the highest average density in all three layers (>2.7 g cm−3) (Fig. 2j, m, and p). CRUST1 also indicates an average density of ∼2.72 g cm−3 in the Zagros–Iran region for the upper crust (Fig. 2k). The middle and lower crustal layers of CRUST1 show average densities of 2.80 and ∼2.85 g cm−3, respectively (Fig. 2n and q). The LITHO1 model shows the lowest average density in the study area for all three layers (Fig. 2l, o, and r). The upper crust of the LITHO model shows an average density of ∼2.65 g cm−3. The central Iran block has a relatively denser upper crust (∼2.75 g cm−3), while the density decreases to ∼2.62–2.64 g cm−3 near the Zagros region. Similar patterns of density variations are observed in the middle and lower crusts of the LITHO1 model (Fig. 2o and r). Such differences in thickness and density data lead to varying GPE values and hence different stresses.
3.3 Mantle convection
We ran mantle convection models using the HC solver code (Hager and O'Connell, 1981). HC is a semi-analytical mantle convection code that uses density anomalies derived from seismic tomography models and radial viscosity as inputs. Here, we considered four global mantle convection models, namely S40RTS (Ritsema et al., 2011), SAW642AN (Mégnin and Romanowicz, 2000), 3D2018_S40RTS, and S2.9_S362 to infer the mantle density anomalies. 3D2018_S40RTS is a merged model of SV wave upper-mantle tomography model, 3D2018_Sv given by Debayle et al. (2016), and S40RTS. S2.9 is a global tomography model of the upper mantle with higher resolution, which is given by Kustowski et al. (2008b). We merged this model with the global shear wave velocity model, S362ANI (Kustowski et al., 2008a), to obtain the merged tomography model of S2.9_S362. We used two different radial viscosity structures, namely GHW13, which is the best viscosity model from Ghosh et al. (2013b), and SH08, given by Steinberger and Holme (2008). GHW13 is a four-layered viscosity structure, with a highly viscous lithosphere (∼1023 Pa s−1). The viscosity drops to ∼1020 Pa s−1 in the asthenosphere, which again increases to ∼1021 Pa s−1 in the upper mantle and ∼1022 Pa s−1 in the lower mantle (Fig. S1b). On the other hand, the viscosity in the SH08 model increases gradually with depth, and it has a slightly weaker lithosphere as compared to GHW13. It has the highest viscosity value of 1023 Pa s−1 around 2000–2300 km depth and significantly lower viscosity for the D” layer (Fig. S2b). The GHW13 viscosity model performed slightly better than SH08 in fitting the observed parameter; thus, we have shown results from the same throughout this paper. However, we have also included the predicted results and their fit to the observables in the Supplement (Table S1).
3.4 Data
To have better constraints on this study's models, we also estimated (most compressive horizontal principal axes) orientations, as well as plate velocities. Various deformation indicators such as orientations from the World Stress Map (WSM) (Heidbach et al., 2016), strain rates, and plate velocities from the Global Strain Rate Model (Kreemer et al., 2014) were used to perform a quantitative comparison with the predicted results of this study (Fig. 3).
The WSM project provides a global database of the crustal stress field obtained from various sources such as focal mechanisms, geophysical logs of borehole breakouts and drilled-induced fractures, engineering methods such as hydraulic fractures and overcoring, and geological indicators that are obtained from fault slip analysis and volcanic alignments. These data have been assigned quality ranks from A to E based on the accuracy range. A-type data suggest that the standard deviations of orientations are within ±15∘ range; this range is ±20∘ for B-type data, ±25∘ for C-type data, and ±40∘ for D-type data. However, E-type data indicate that the data records are either incomplete or from non-reliable sources or that the accuracy is ∘. This study uses A–C quality stress data records (Fig. 3a). Observed axes are aligned in a NNE–SSW direction in Zagros, with dominant thrust faulting. NW and central Iran show some strike–slip mode of deformation with NE–SW compressional directions.
The strain rates and plate velocities are taken from the GSRM v2.1 model (Kreemer et al., 2014) (Fig. 3b). GSRM v2.1 provides a global dataset of strain rates and plate motions that are determined using ∼22 500 geodetic plate velocities. Higher strain rates are observed along the simply folded mountains (∼40– yr). Most of Iran shows strain rates between 4– yr. The plate motions used in our study for comparison with predicted velocities are given in a no-net-rotation (NNR) frame interpolated on a grid. The velocity vectors show an eastward motion in the study area, which becomes nearly E–W in the Afghan block (Fig. 3b).
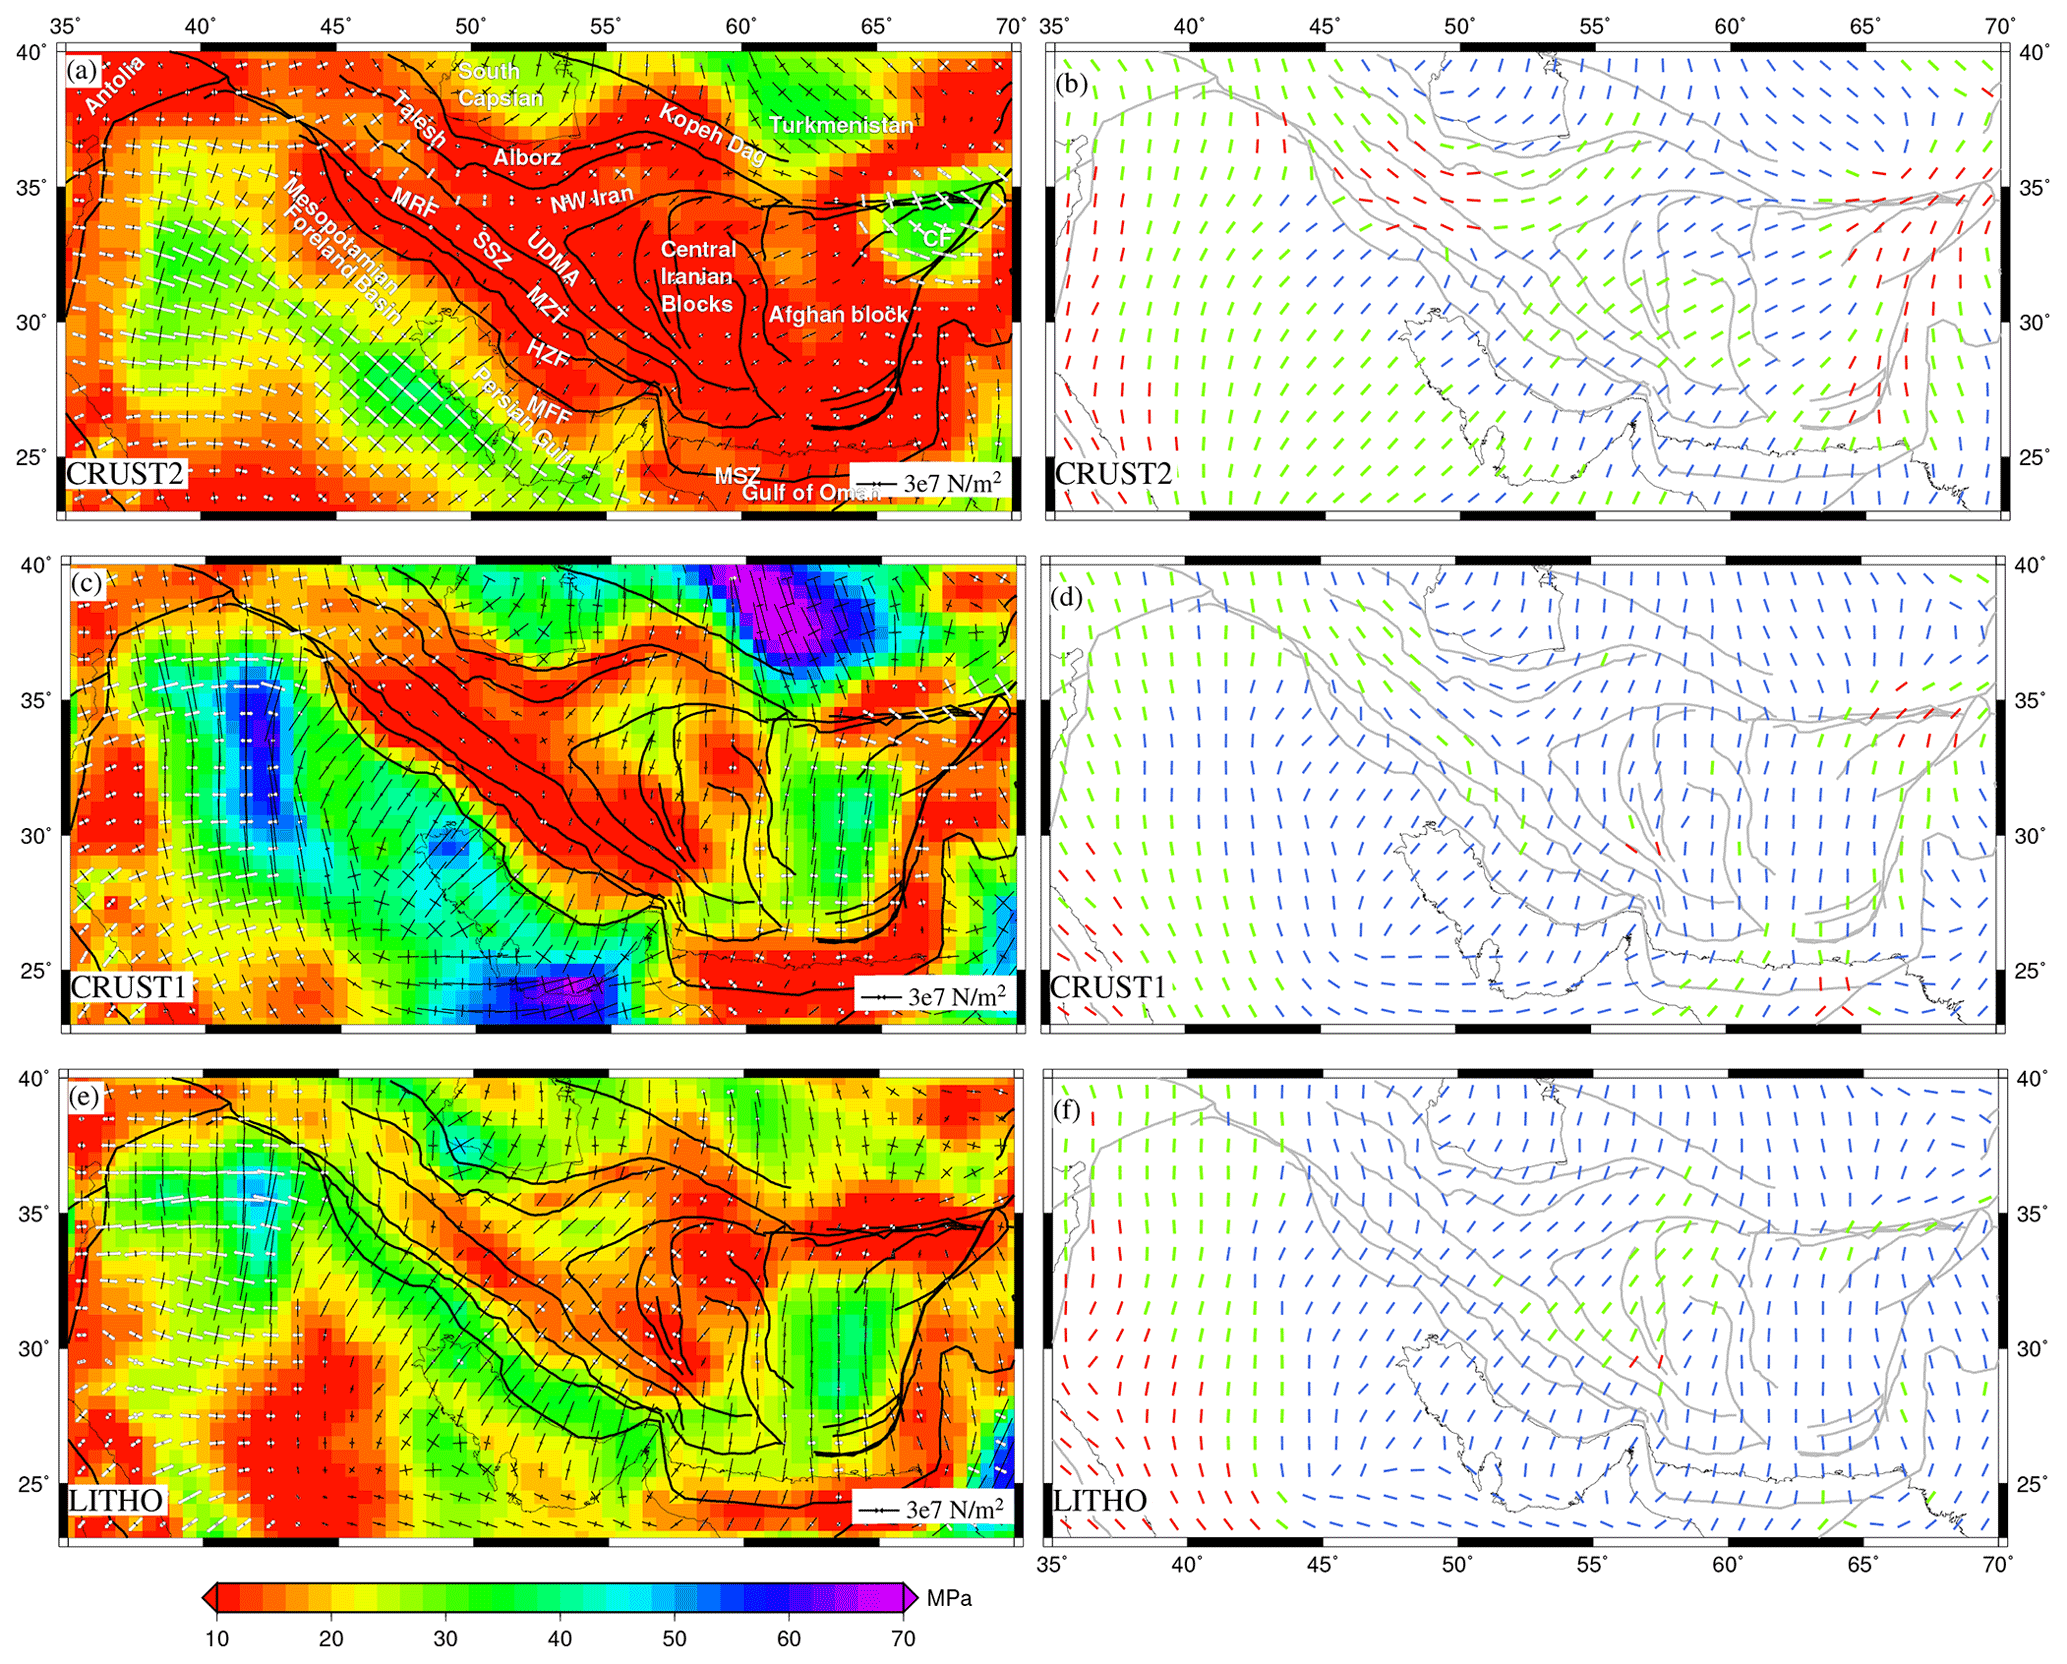
Figure 4(a, c, e) Deviatoric stresses predicted from GPE variations, plotted on top of their second invariants. The compressional stresses are denoted by solid black arrows, while white arrows show tensional stresses. axes predicted from GPE variations are plotted in (b), (d), and (f). Red denotes the tensional regime, blue is for thrust, and green is for the strike–slip regime.
4.1 Stress and deformation due to GPE
Three crustal models (CRUST1.0, CRUST2.0, and LITHO1.0) were used to compute GPE within the study region. The second invariant of stress computed using GPE lies within ∼10–12 MPa along Zagros for the CRUST2 and CRUST1 models (Fig. 4a and c). The LITHO1 model predicts larger stress magnitudes along Zagros (Fig. 4e). NE–SW compressional stresses are observed along the frontal faults of Zagros (MFF) (Fig. 1a and c). The central part of the Zagros thrust faults (MZT) shows the strike–slip mode of faulting for nearly all three models (Fig. 4b, d and f). The strike–slip regime further extends into the Sanandaj–Sirjan Zone (SSZ), while it lies north of the MZT for the CRUST2 and LITHO1 models (Fig. 4b and f). It transitions to a thrust type of deformation in the north of the MZT for CRUST1 (Fig. 4d). The Urmia–Dokhtar magmatic arc (UDMA) and central Iran also show the strike–slip mode of faulting for CRUST2 and LITHO1. The north of the MRF shows tension for the CRUST2 model, while CRUST1 predicts this area to be predominantly strike–slip. On the other hand, the entire region shows significant compression for LITHO1 model.
We compared predicted from our three GPE-only models to observed orientations and type obtained from the WSM (Heidbach et al., 2016) by computing the regime misfit (Fig. 5, left panel). The average misfit is lowest for the LITHO1 model with a value of 0.59 (Fig. 5g), while the CRUST2 model shows the highest average misfit of 0.77 (Fig. 5a). High misfits (2–3) are observed to the north of the MRF and Tehran for CRUST2, while the lowest (<1) are observed in the case of LITHO1, suggesting that the dominant mode of faulting in this area is possibly thrust as opposed to normal deformation predicted by CRUST2. In central Iran, misfit is low (<1) when the dominant mode of deformation is strike–slip, as predicted by the LITHO1 model.
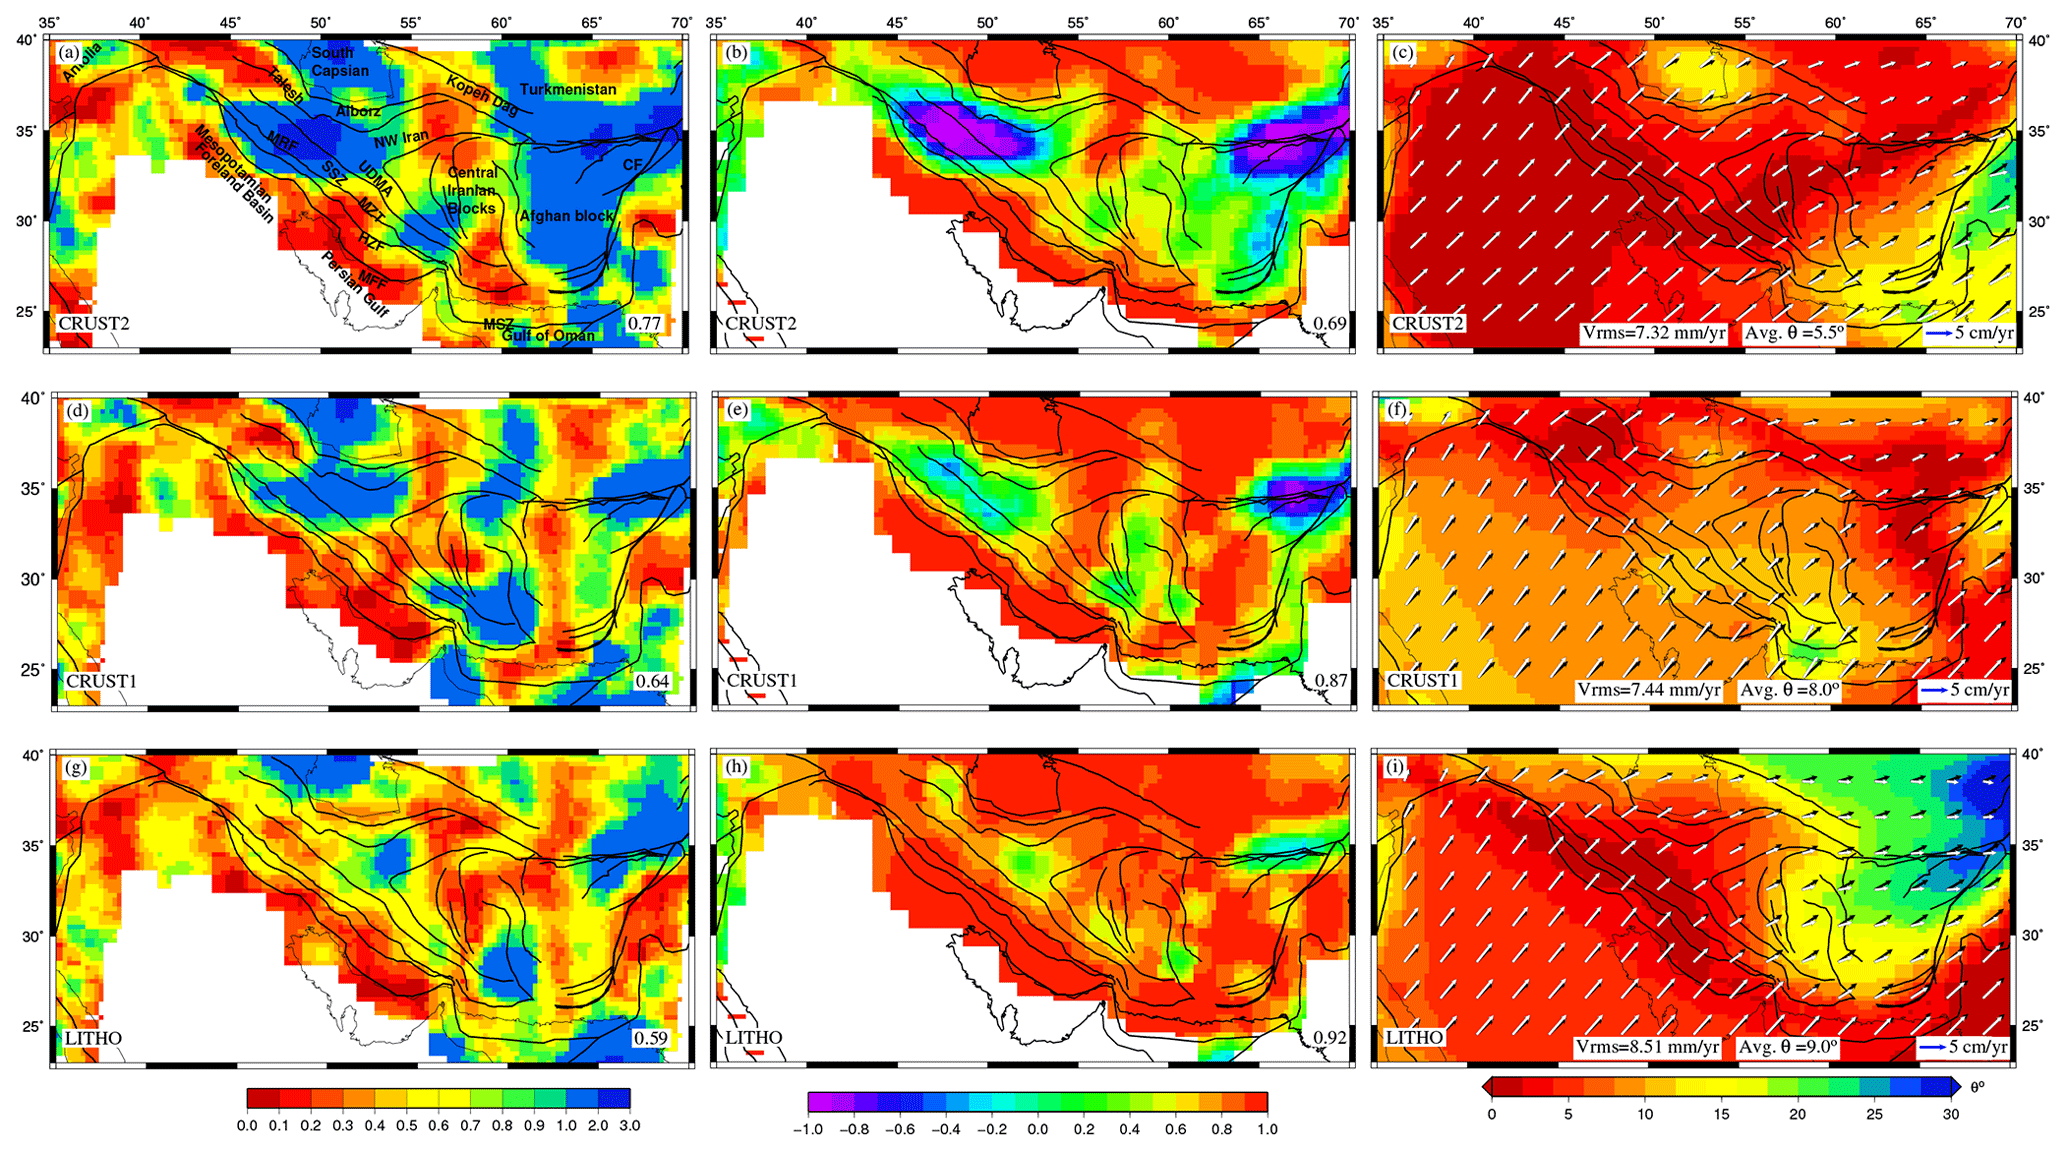
Figure 5(a, d, g) Total misfit between observed and predicted SH−max from GPE variations. Correlation coefficients between strain rate tensors obtained from Kreemer et al. (2014) and deviatoric stresses predicted using GPE variations are shown in (b, e, h), with average regional correlation coefficients in each figure's bottom right. (c, f, i) Observed velocities (black) and predicted plate velocities(white) from GPE variations in the NNR frame, plotted on the top of the angular misfit between both.
On calculating the correlation between the predicted deviatoric stresses and GSRM strain rates, the LITHO1 model shows the highest average correlation (0.92) (Fig. 5, middle panel). The correlation is found to be extremely poor () for the CRUST2 model in the north of the MRF (Fig. 5b). Such poor correlation suggests that the predicted stresses differ entirely from those causing deformation. For example, anti-correlation north of the MRF suggests that the dominant mode of deformation in this area might be thrust rather than normal faulting. Again, the correlation coefficient is less than 0.2 in the central Iranian block for the CRUST2 and CRUST1 models (Fig. 5b and e), while the LITHO1 model shows a better correlation, suggesting that the strike–slip type of deformation is more prominent in central Iran (Fig. 5h).
We predicted the plate velocities for all three models in the NNR frame and compared them with observed plate velocities obtained from Kreemer et al. (2014) (Fig. 5, right panel). CRUST2 gives the lowest rms error (7.32 mm yr−1) and the lowest angular misfit (5.5∘) (Fig. 5c). The LITHO1 model shows high misfits (>20∘) between observed and predicted velocities in the east of central Iran (i.e., Afghan block) (Fig. 5i). Both the CRUST2 and LITHO1 models predict the plate velocities very closely to observed ones in the Zagros mountains, as shown by nearly zero angular misfits along Zagros (Fig. 5c and i). CRUST1 performs at an average level in predicting the plate velocities in the study area (Fig. 5f).
Interestingly, the use of a thicker lithosphere to calculate GPE leads to the introduction of more compressional stresses in the region (Fig. S2a–f). The average misfit between predicted and observed is found to be lowest for the 200 km thick lithosphere (Table S2). Similarly, the correlations between strain rate tensor and predicted stresses and the rms errors between observed and predicted NNR velocities show significant improvement for a thicker lithosphere. However, the improvement in the fit is better for CRUST2 as opposed to the other two models, CRUST1 and LITHO1, where the misfit between observed and predicted velocities shows an increase. Thus, we can say that, while considering lithospheric contributions only, the thicker lithosphere does a better job of explaining the observed deformation indicators (Table S2).
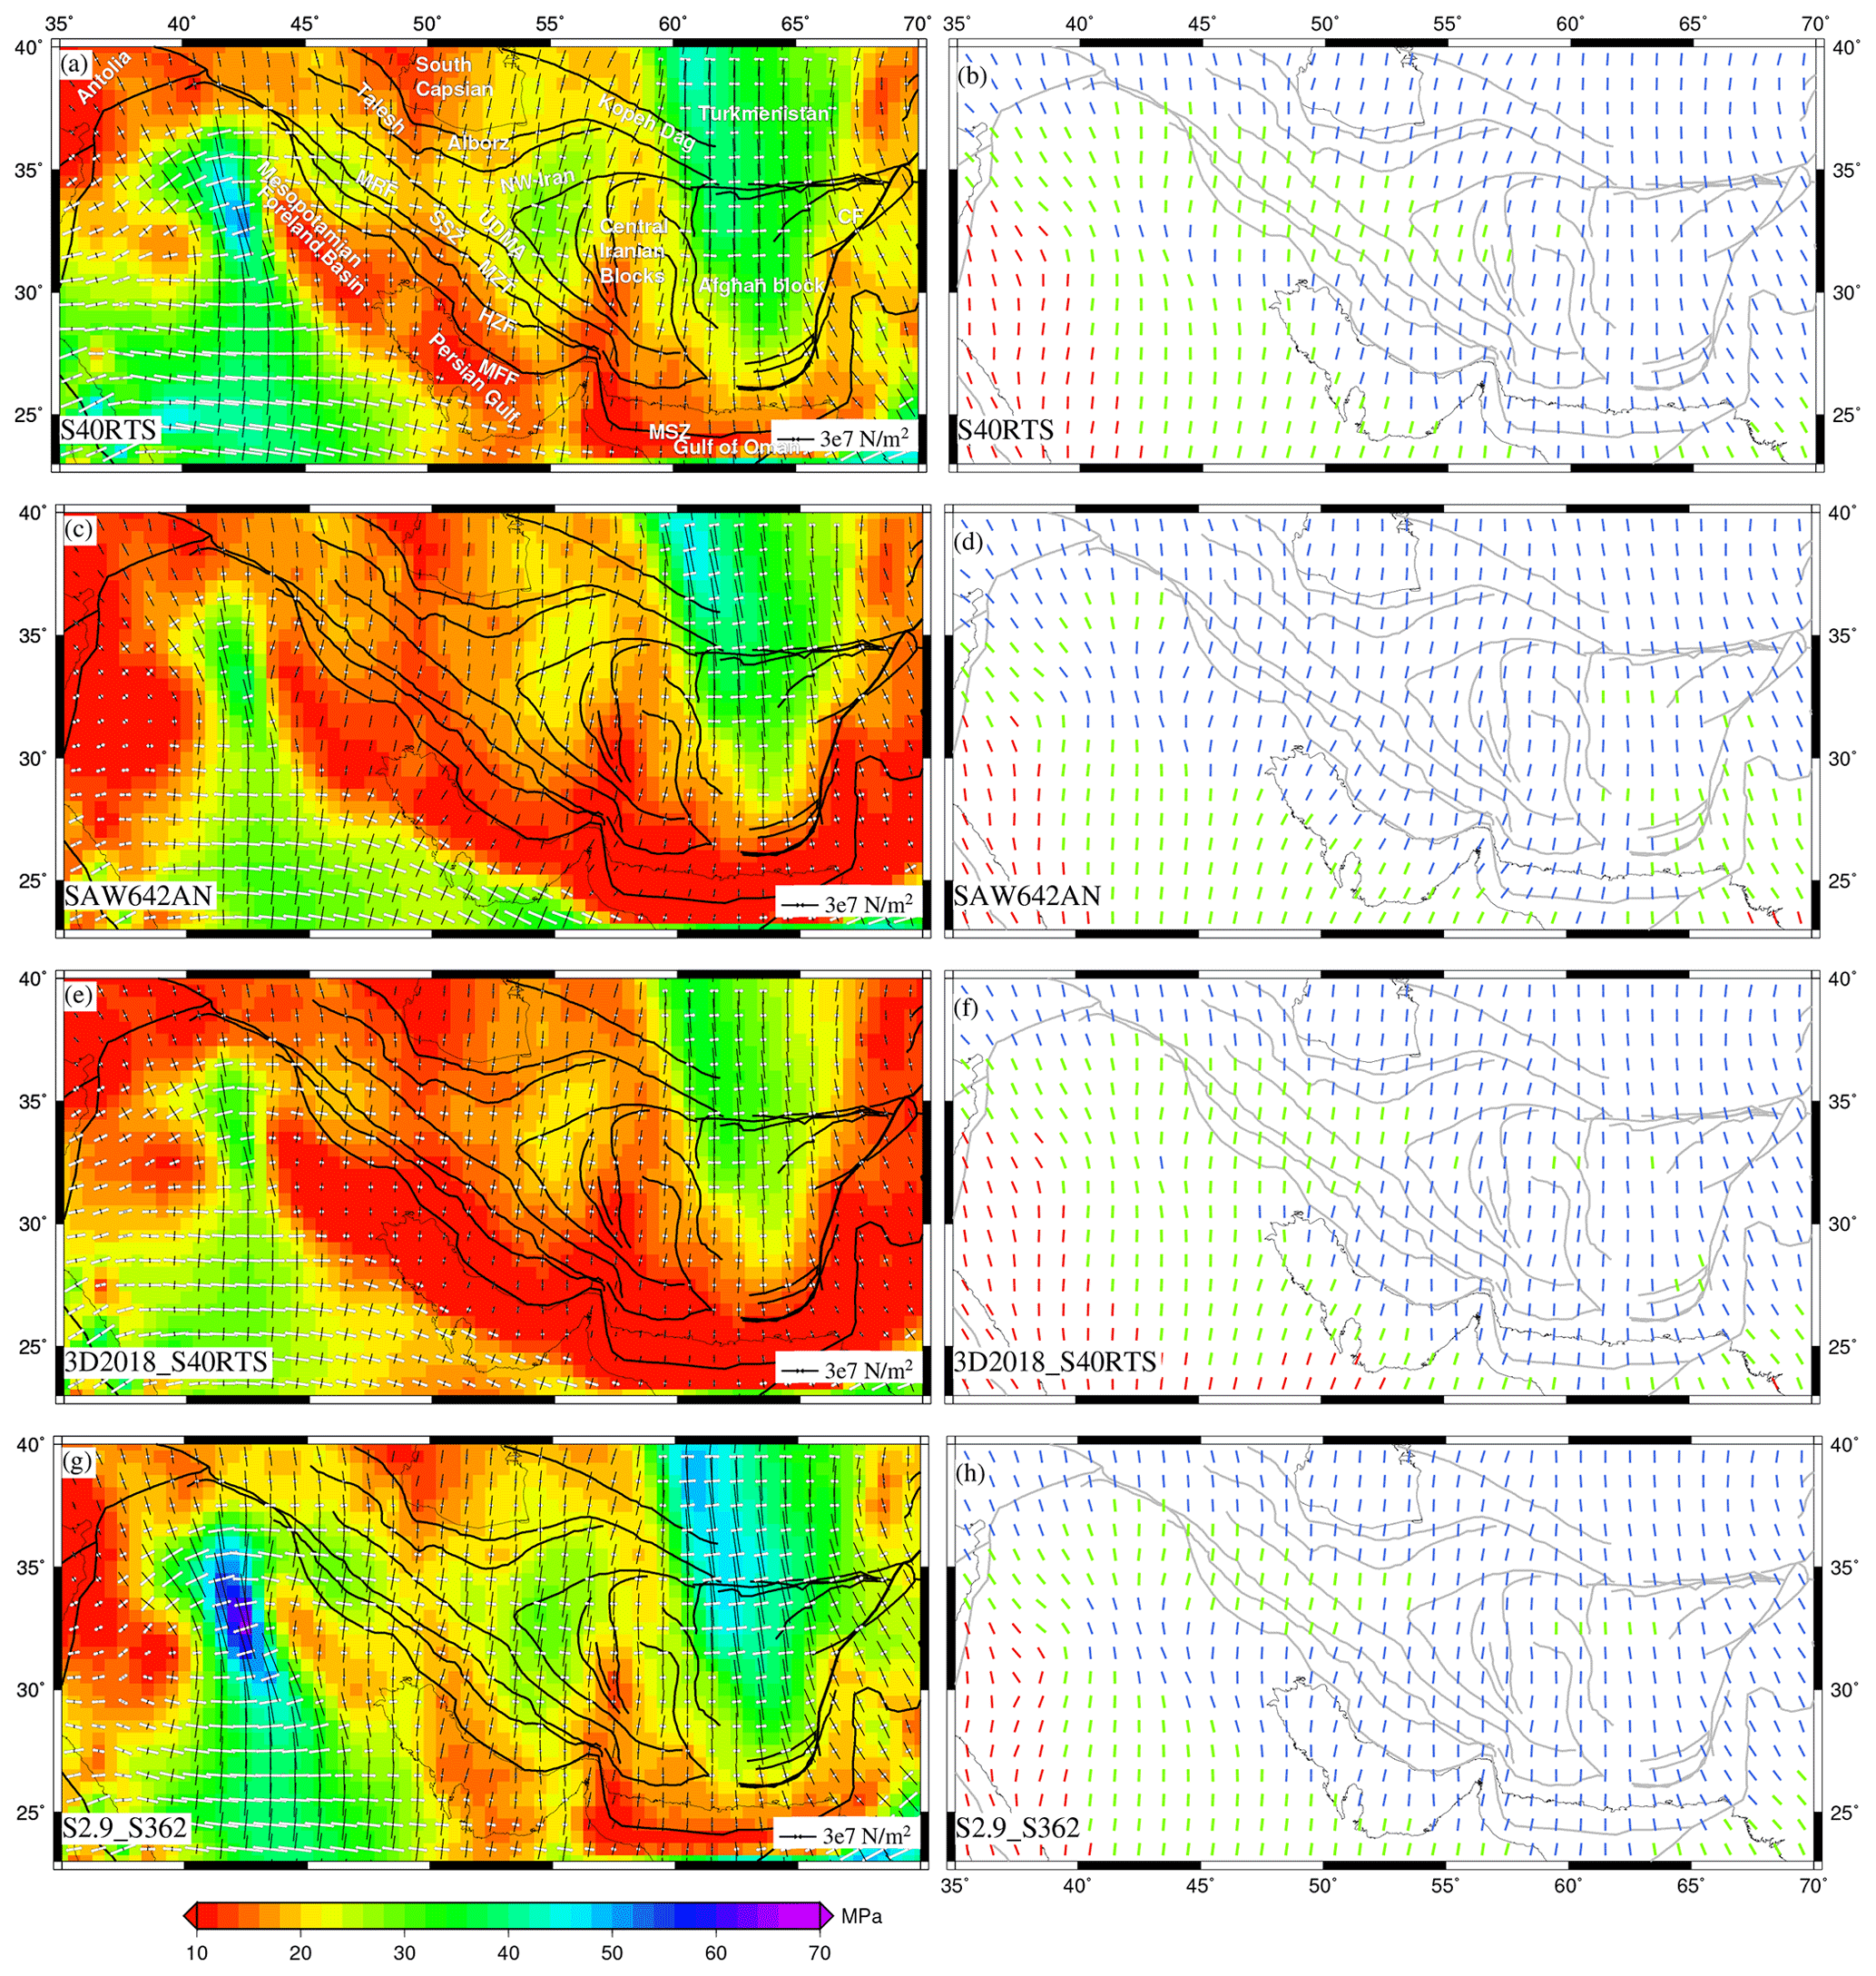
Figure 6(a, c, e, g) Deviatoric stresses predicted using mantle tractions derived from various tomography models for GHW13 viscosity structure, plotted on the second invariant of deviatoric stresses. The white arrows denote tensional stresses, and the black arrows indicate compressional stresses. predicted from mantle tractions is shown in (b), (d), (f), and (h). Red denotes the tensional regime, blue is for thrust, and green is for the strike–slip regime.
4.2 Stress and deformation due to mantle convection
The deviatoric stresses predicted using all four mantle convection models are found to be mostly compressional along MFF (Fig. 6). All models, except for SAW642AN, predict the strike–slip mode of faulting in the northwestern parts of Zagros with nearly E–W-oriented extensional axes and N–S compressional axes (Fig. 6a, e and g). On the other hand, SAW642AN shows predominant compression within this area (Fig. 6e). S40RTS, 3D2018_Sv, and S2.9_S362 show strike–slip deformation in the northwestern parts of SSZ, UDMA, and northwestern Iran. Central Iran is predicted to have mostly compressional stresses by all models, except for S40RTS. Thrust type of deformation is predicted in the Afghan block by all models with some intermittent strike–slip deformation. The SINGH_SAW model predicts the whole Afghan block in the strike–slip regime (Fig. 6g and h). S40RTS and S2.9_S362 predict higher stress magnitude in northwestern parts of the Zagros orogeny system and central Iran compared to other models.
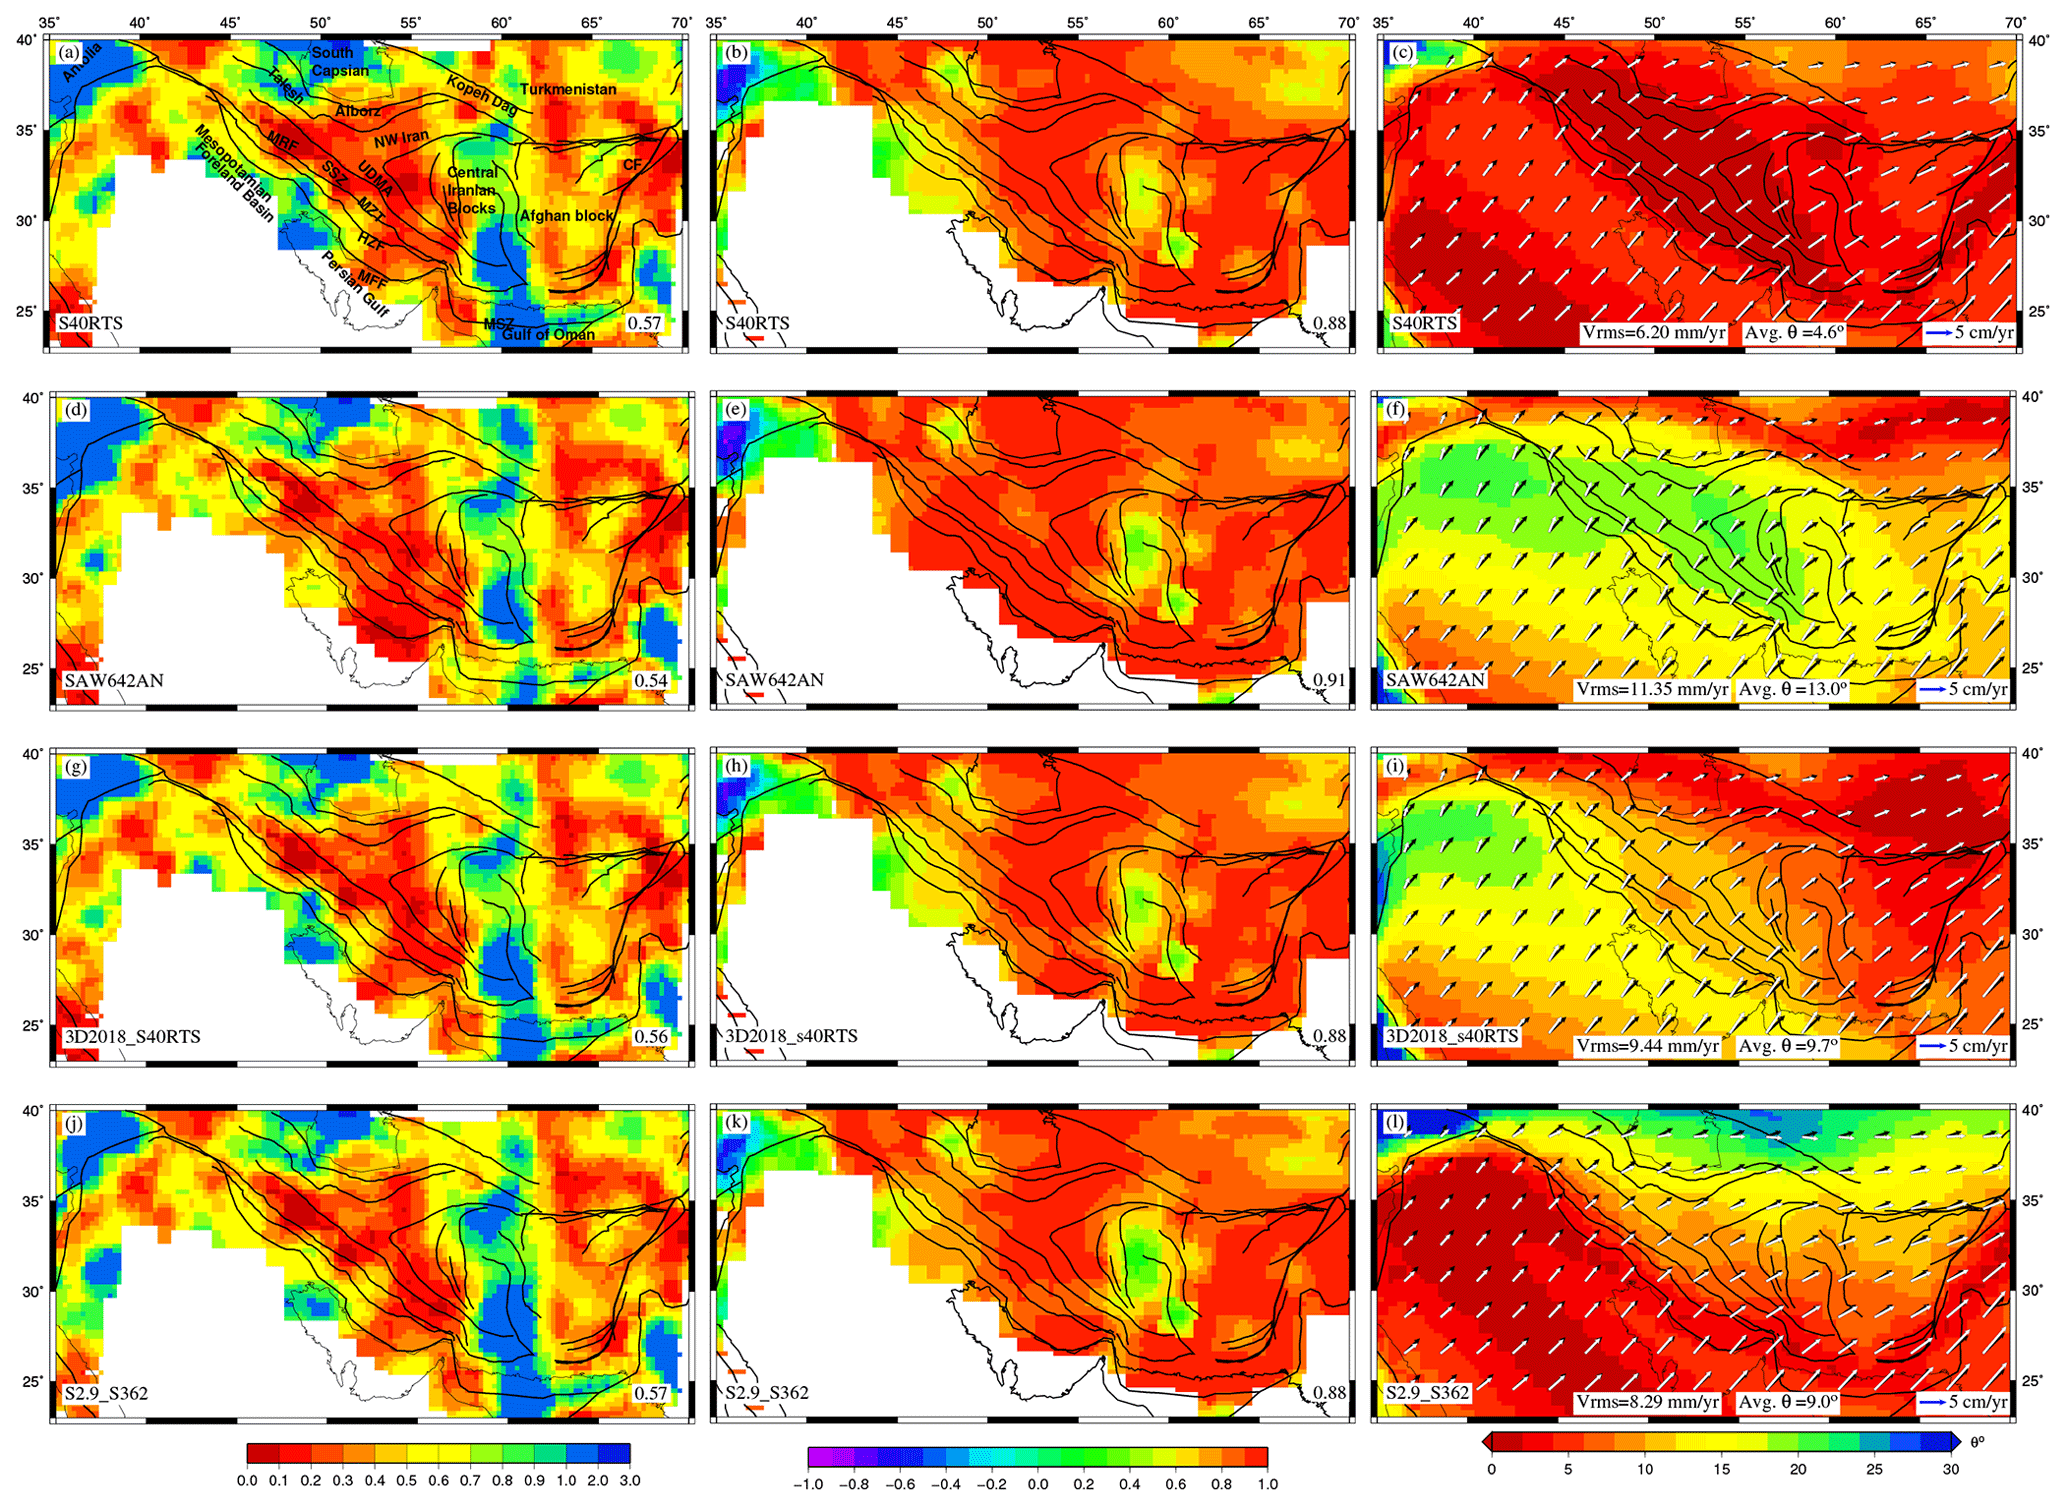
Figure 7Parameters predicted from mantle tractions and their comparisons with observables. (a, d, g, j) Total misfit between obtained from WSM (Heidbach et al., 2016) and those predicted using mantle tractions derived from various tomography models using GHW13 viscosity structure. Correlation coefficients between strain rate tensors obtained from Kreemer et al. (2014) and deviatoric stresses predicted using basal tractions are shown in (b), (e), (h), and (k) with average regional correlation coefficients in each figure's bottom right. (c, f, i, l) Observed velocities (black) and plate velocities predicted using mantle tractions (white) in the NNR frame plotted on the top of the angular deviation between both.
The misfit between observed and predicted is found to be much lower for mantle convection models (0.54–0.57) (Fig. 7, left panel) than for those of GPE-only models (Fig. 5, left panel), evidently showing the importance of mantle flow. The lowest average misfit is observed for SAW642AN (0.54) (Fig. 7d), though the misfit increases in the east, the Lut block, and near the MSZ. The correlation of predicted deviatoric stresses with GSRM strain rates improves over GPE-only models (Fig. 7, middle panel), with SAW642AN yielding the highest correlation coefficient (0.91) (Fig. 7e). Correlation drops below 0.4 in parts of central Iran. S40RTS predicts the plate velocities most closely to the observed one out of all models, with the lowest rms error (∼6.20 mm yr−1) between predicted and observed plate velocities (Fig. 7c). On the other hand, SAW642AN and 3D2018_S40RTS models show high misfits (rms error ∼10 mm yr−1) as they are unable to match observed plate velocities in the Zagros–Iran plateau, both in orientation and magnitude (Fig. 7f and i).
As discussed above, mantle convection models perform better in predicting deviatoric stresses in the study area, which is made evident by the high correlation between predicted stresses and observed strain rates and by the low misfits between observed and predicted . However, the error in predicting plate velocities is higher for mantle convection models than for GPE-only models. As there are still significant misfits in fitting the observables, we added the deviatoric stresses predicted from GPE differences and mantle convection models to constrain the total stress field in the Zagros–Iranian plateau, which may account for both forces.
We also ran the S40RTS model with LAB (lithosphere–asthenosphere boundary) at 150 and 200 km (Fig. S2g and h). Similarly to GPE models, the fit to observed data shows an improvement when LAB is at 200 km, though the stress patterns do not change significantly (Table S2).
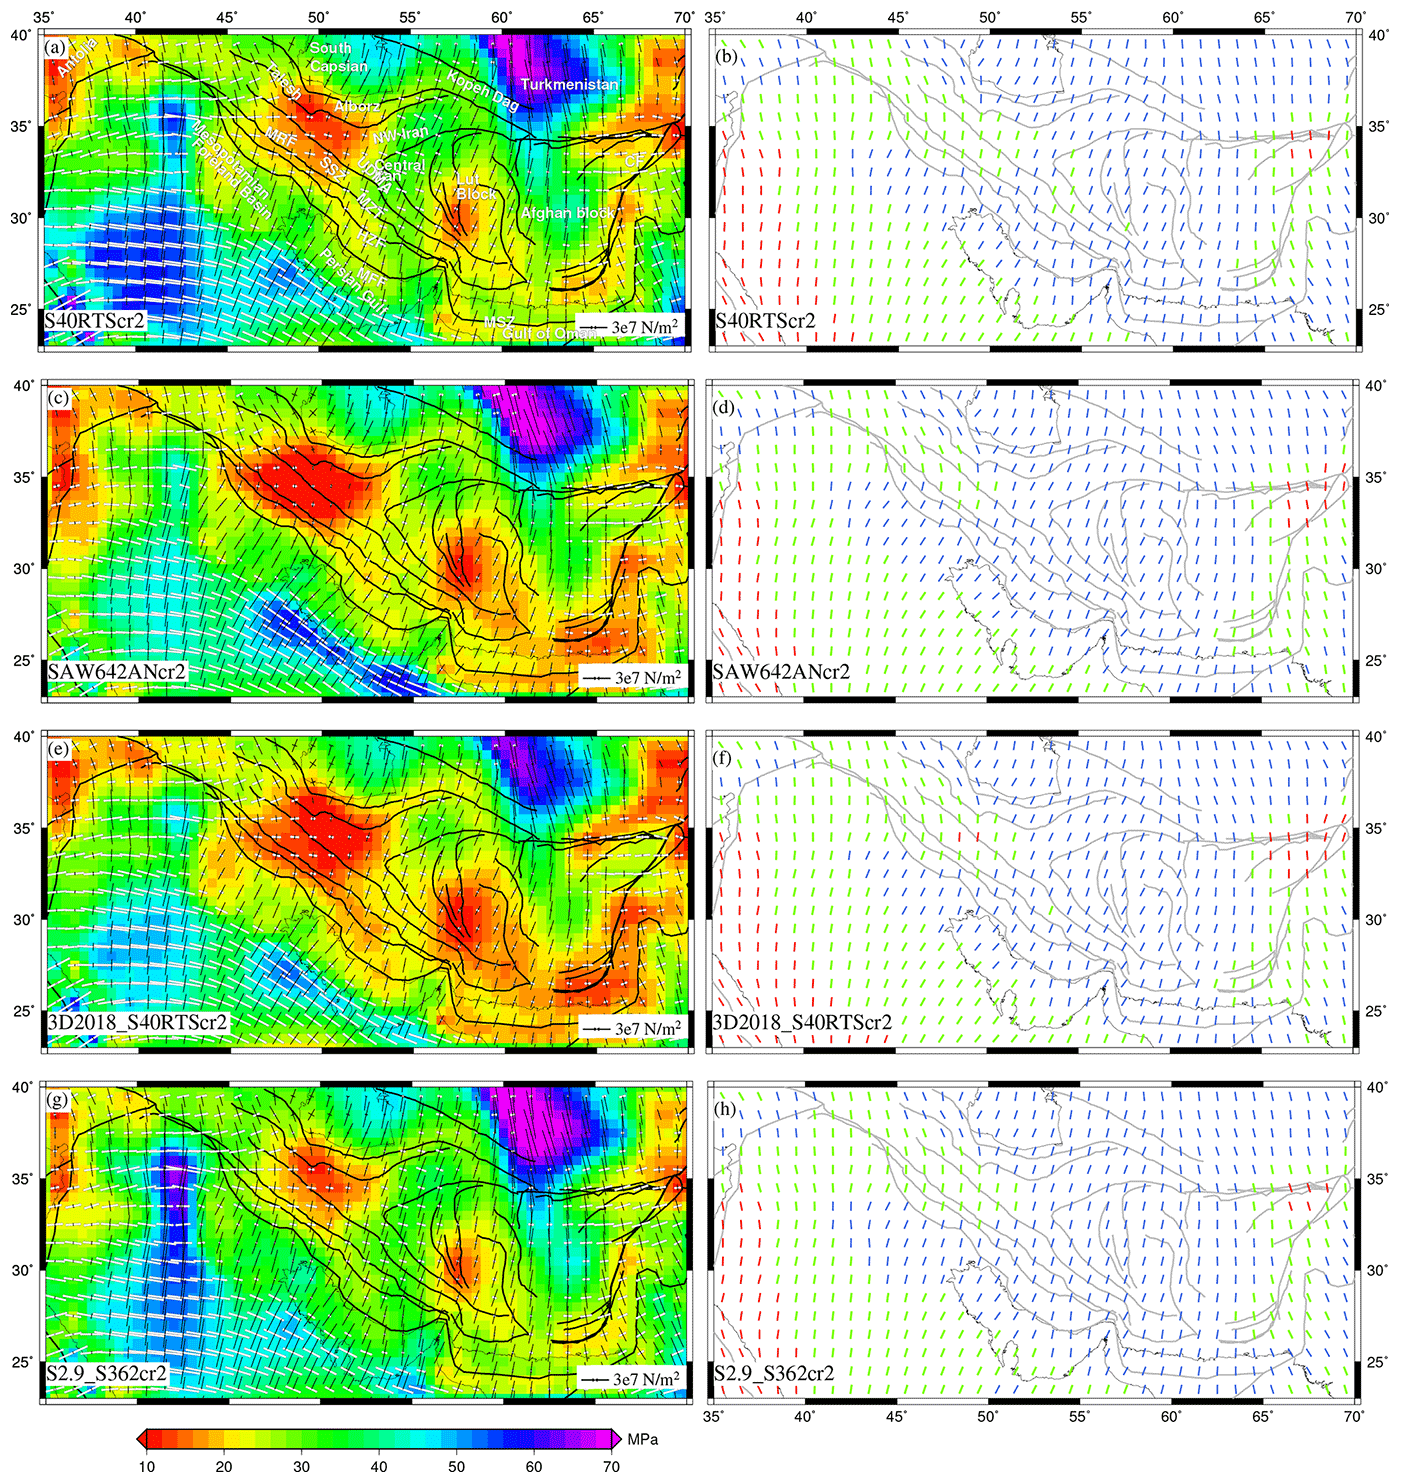
Figure 8(a, c, e, g) Deviatoric stresses predicted using the combined effects of GPE computed from CRUST2 and mantle tractions derived from various tomography models plotted on top of their second invariants. The white arrows denote tensional stresses, and the black arrows indicate compressional stresses. Panels (b, d, f, h) show predicted from these models. The red lines denote the tensional regime, blue is for thrust, and green is for the strike–slip regime.
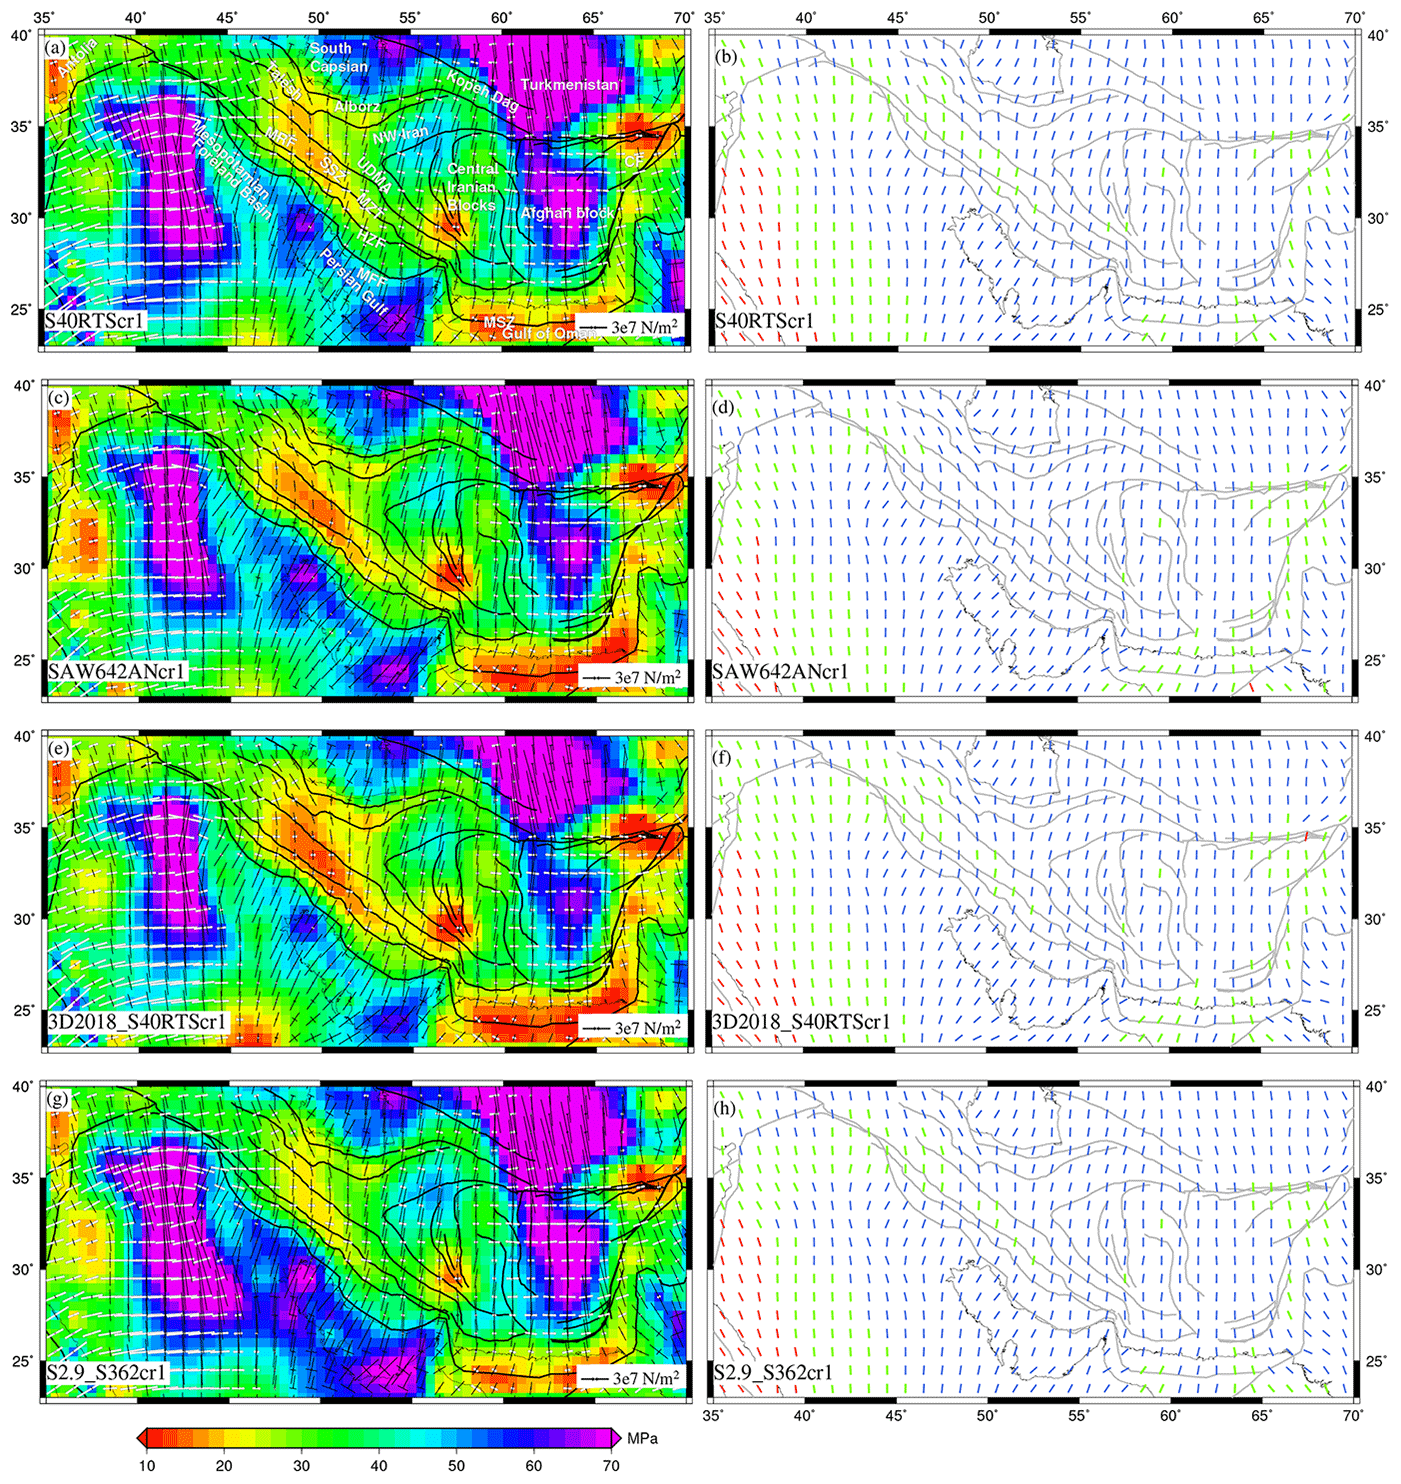
Figure 9(a, c, e, g) Deviatoric stresses predicted using the combined effects of GPE computed from CRUST1 and mantle tractions derived from various tomography models plotted on top of their second invariants. The white arrows denote tensional stresses, and black arrows indicate compressional stresses. Panels (b, d, f, h) show predicted from these models. The red lines denote tensional regime, blue is for thrust, and green is for strike–slip regime.
4.3 Stress and deformation by GPE and mantle convection
Adding mantle contributions to GPE-only models led to significant changes in total deviatoric stresses for all models (Figs. 8–10). There is a significant increase in the total stress magnitude of the entire study area, except north of the MRF and SE of central Iran, which show slightly lower stresses (<16 MPa) for combined models of CRUST2 and mantle convection (Fig. 8). These models show predominant compression in most of Zagros, SSZ, UDMA, and NW and central Iran, except for the strike–slip type of deformation in the northwestern parts. The joint models of CRUST1 and mantle convection predict higher stresses (>25 MPa) in NW Iran and at MFF (Fig. 9). Interestingly, the stresses drop below 20 MPa towards the north of the HZF and the MRF till the southern Caspian. The combined models of CRUST1 and mantle convection show that compressional stresses are dominant in the study area, with occasional strike–slip faulting in the northwest (Fig. 9, right panel). The stresses predicted by combined models of LITHO1 and mantle convection models are higher in magnitude than other models in the study area (>25 MPa) (Fig. 10). S40RTS+LITHO and S2.9_S362+LITHO models show high stresses in Zagros (>50 MPa) (Fig. 10a and g).
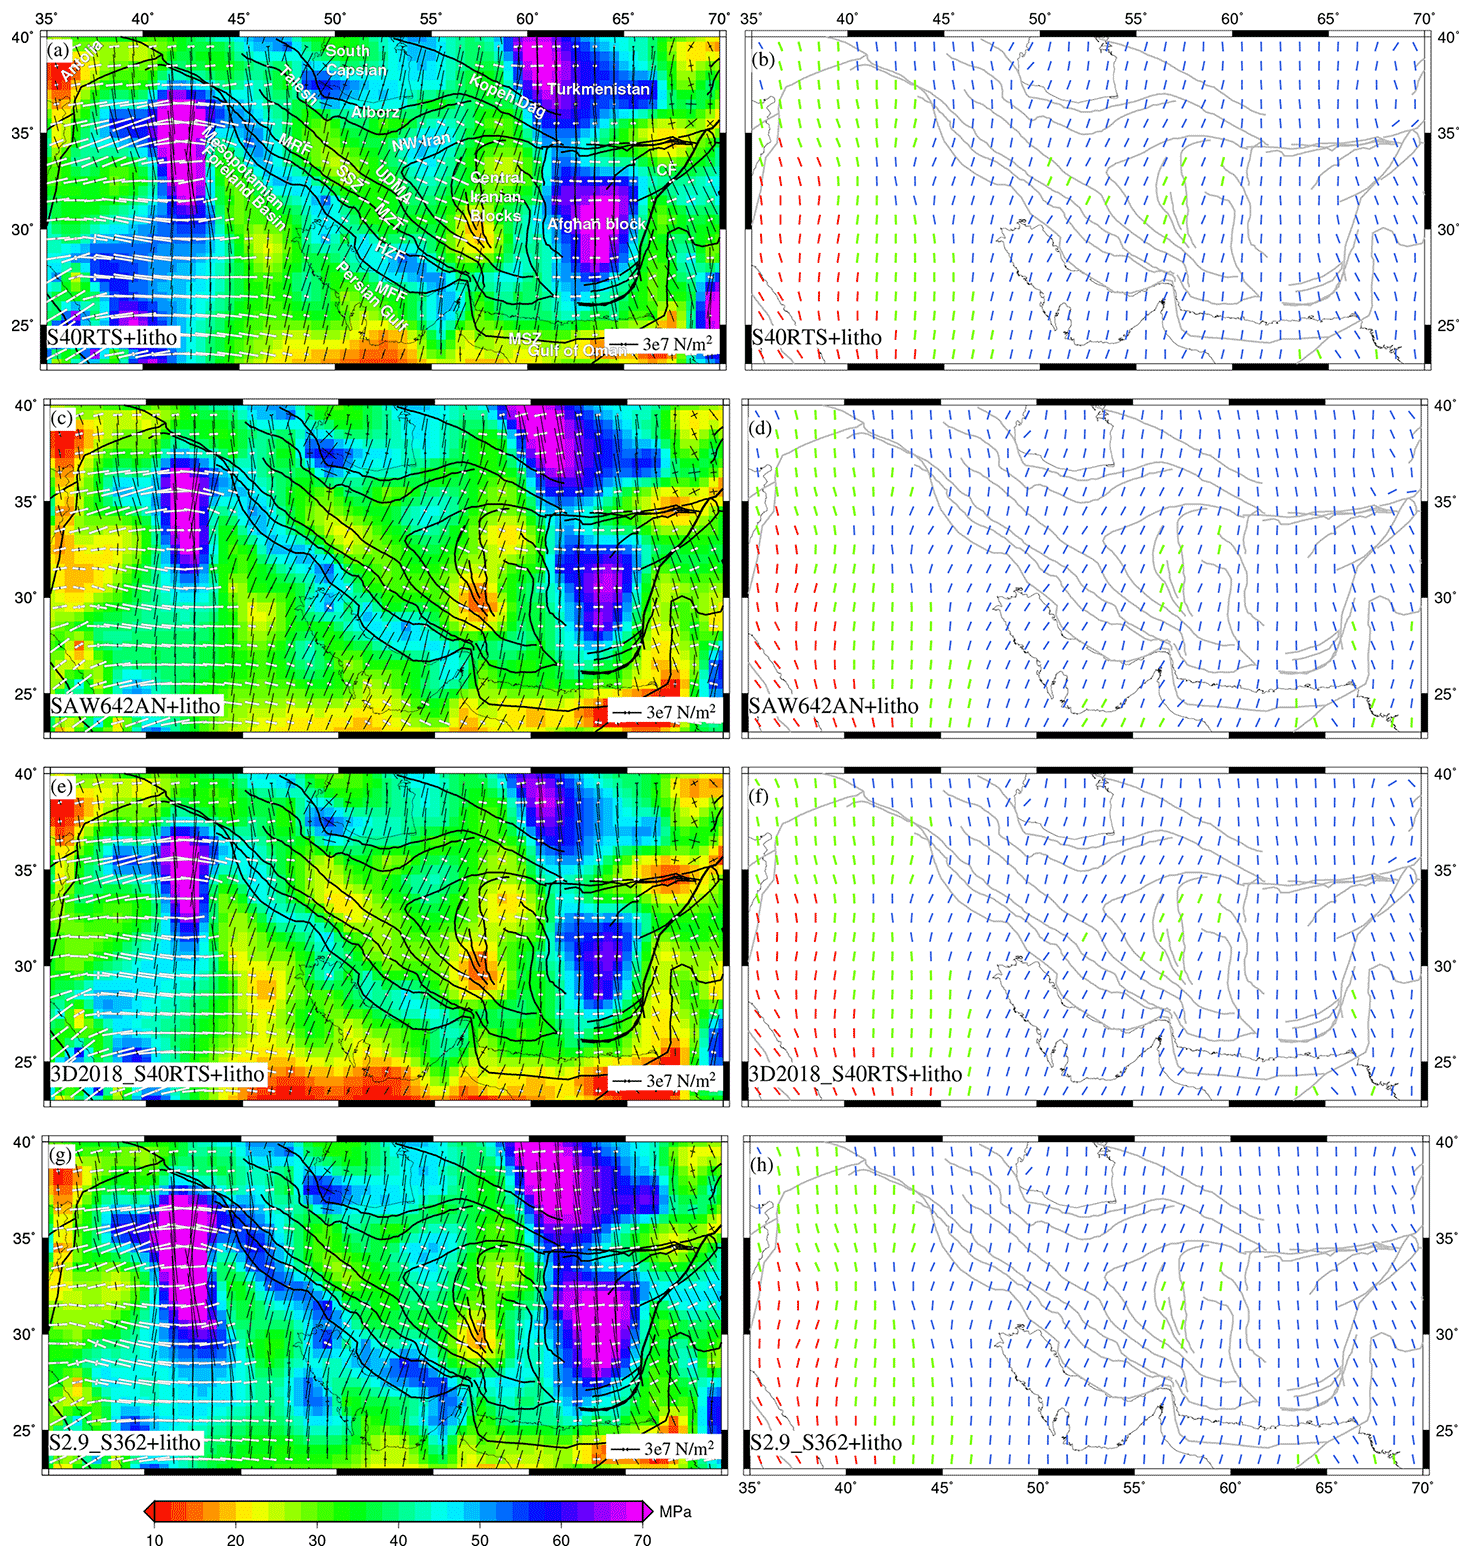
Figure 10(a, c, e, g) Deviatoric stresses predicted using the combined effects of GPE computed from LITHO and mantle tractions derived from various tomography models plotted on top of their second invariants. The white arrows denote tensional stresses, and the black arrows indicate compressional stresses. Panels (b, d, f, h) show predicted from these models. The red lines denote tensional regime, blue is for thrust, and green is for the strike–slip regime.
The combined models show a lower misfit between observed and predicted (Fig. 11), especially when compared to GPE-only models (Fig. 5, left panel). SAW642AN+LITHO showed the lowest average misfit of 0.47 (Fig. 11f). Interestingly, SAW642ANcr2 and 3D2018_S40RTScr2 show low misfits in the Zagros–Iranian plateau region despite not having the lowest average misfit (Fig. 11d and g). The higher misfits in NW Iran and in the SE of the central Iran block observed for GPE-only models get reduced significantly due to the addition of mantle-derived stresses, reflecting the importance of mantle convection in these areas.
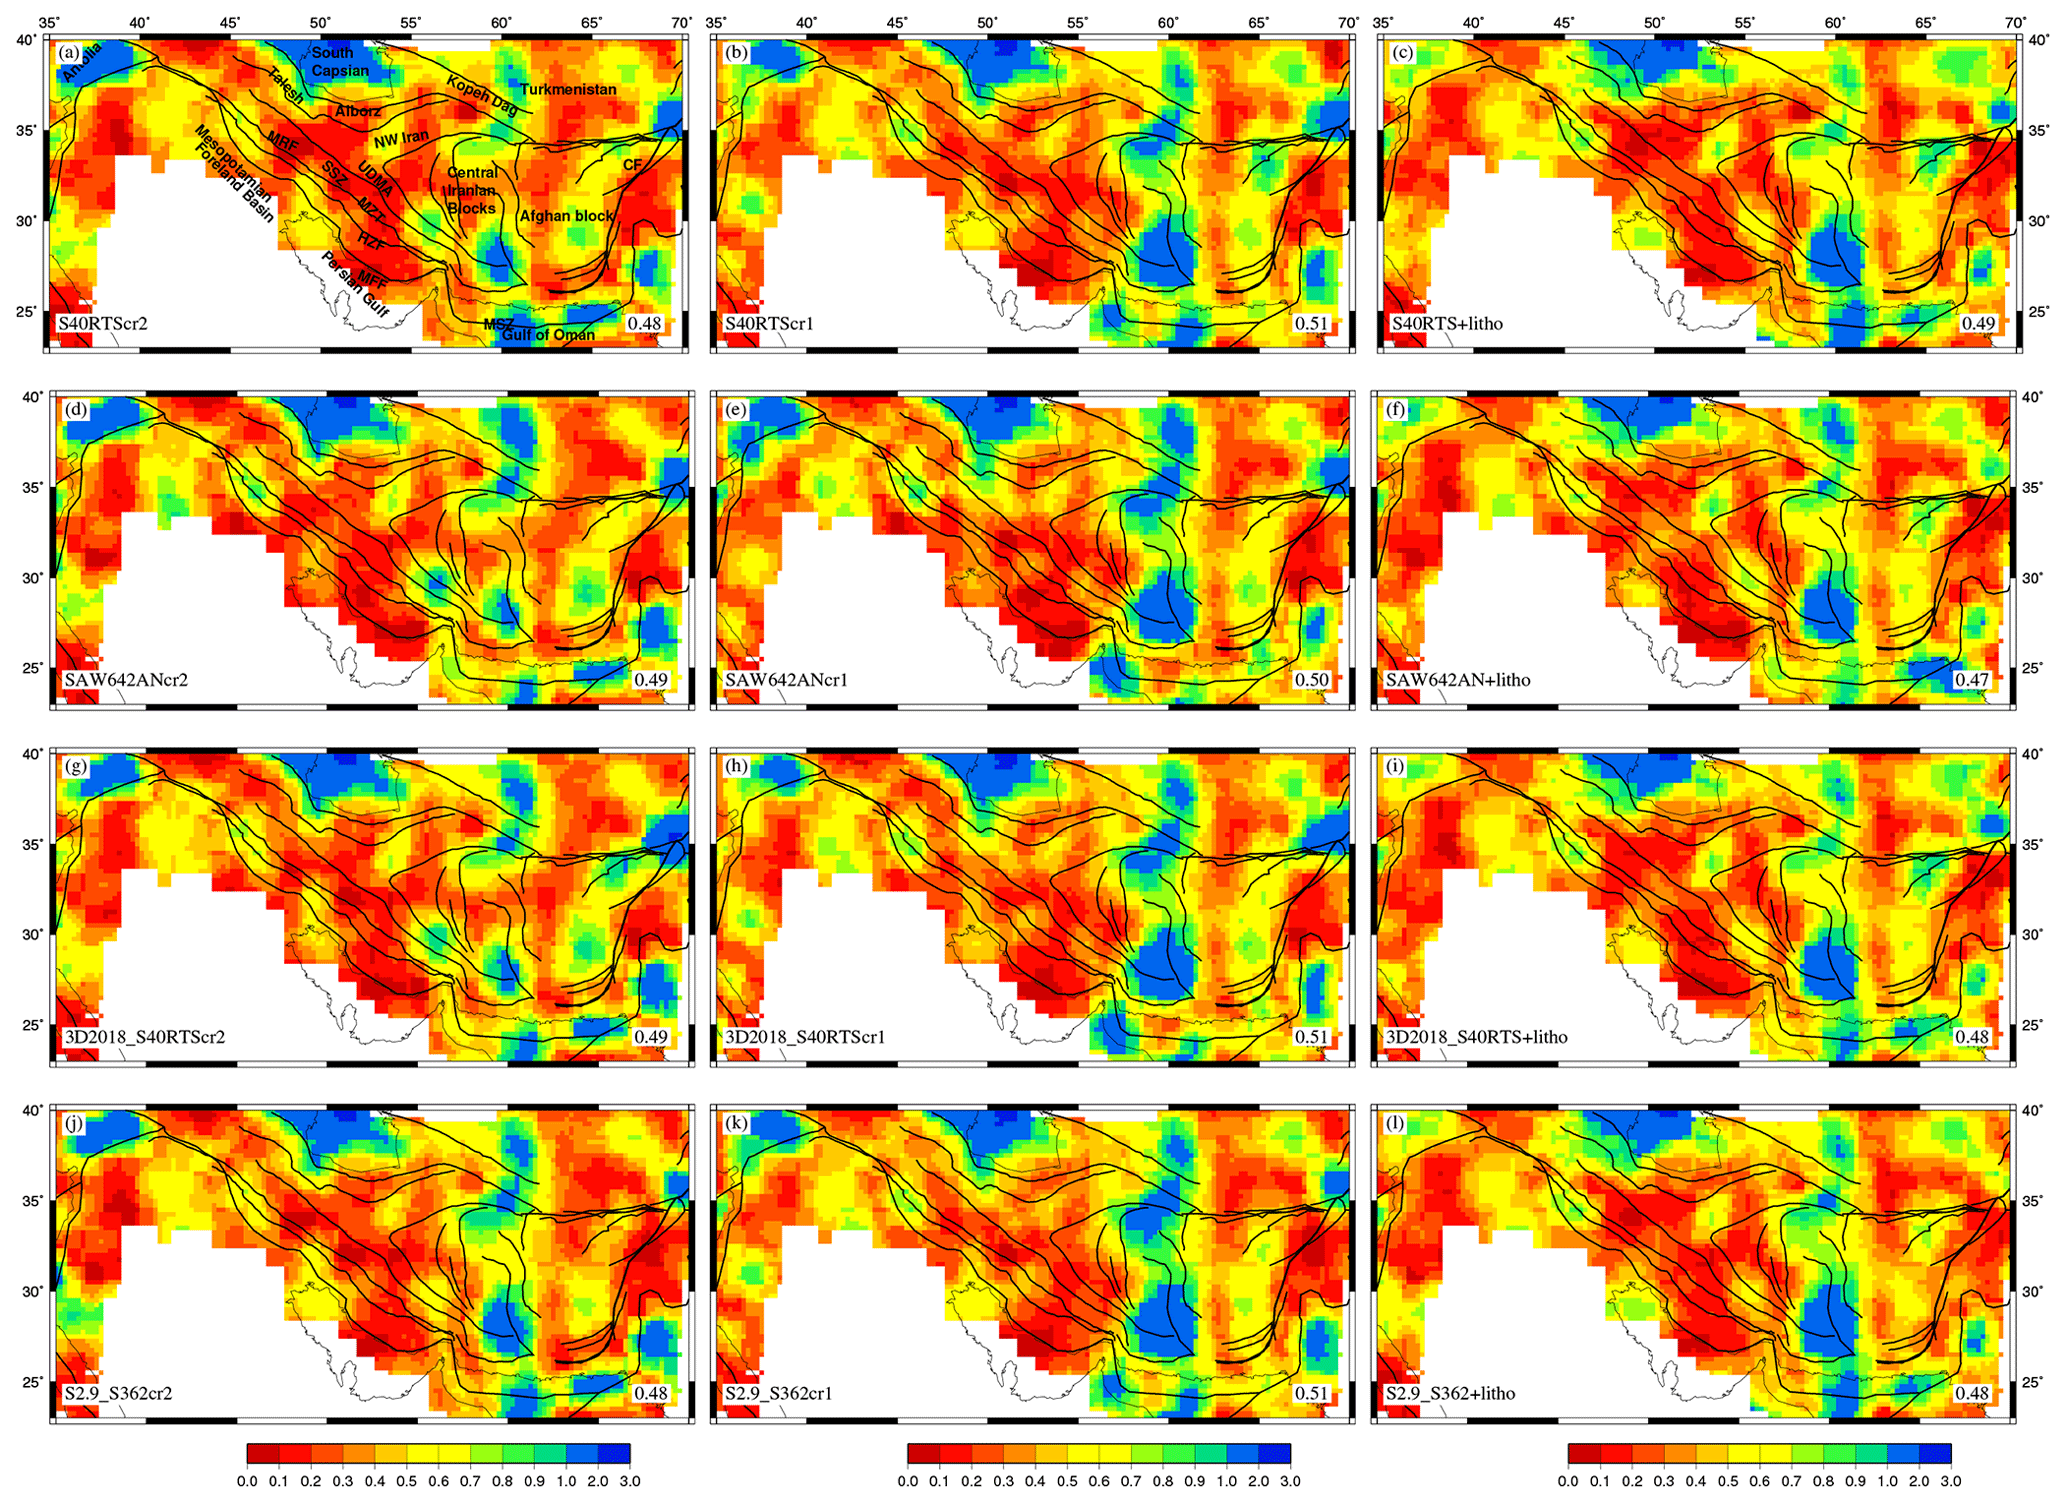
Figure 11Total misfit between observed from WSM (Heidbach et al., 2016) and predicted using the combined effects of GPE computed from different crustal models and mantle tractions derived from various tomography models.
As we look at the correlation between predicted stress tensors and GSRM strain rate tensors, the overall correlation is better for combined models (Fig. 12), especially for combined models of LITHO1 and mantle convection (Fig. 12, right panel). A high average correlation coefficient of 0.94 is observed for SAW642AN+LITHO, 3D2018_S40RTS+LITHO, and S2.9_S362+LITHO1 (Fig. 12f, i, and l). Despite an overall improvement in correlation between observed strain tensors and predicted deviatoric stresses, the correlation is found to be much poorer in areas such as the northwestern parts of Zagros and east of the central Iranian block for combined models of mantle convection and the GPE-only models of CRUST2 and CRUST1 (Fig. 12, left and middle panels). In NW Zagros, mantle-only models are found to perform much better as they show better correlation (Fig. 7, middle panel), thus suggesting that mantle-derived stresses should be much higher than those from GPE to explain the observed deformation in these areas.
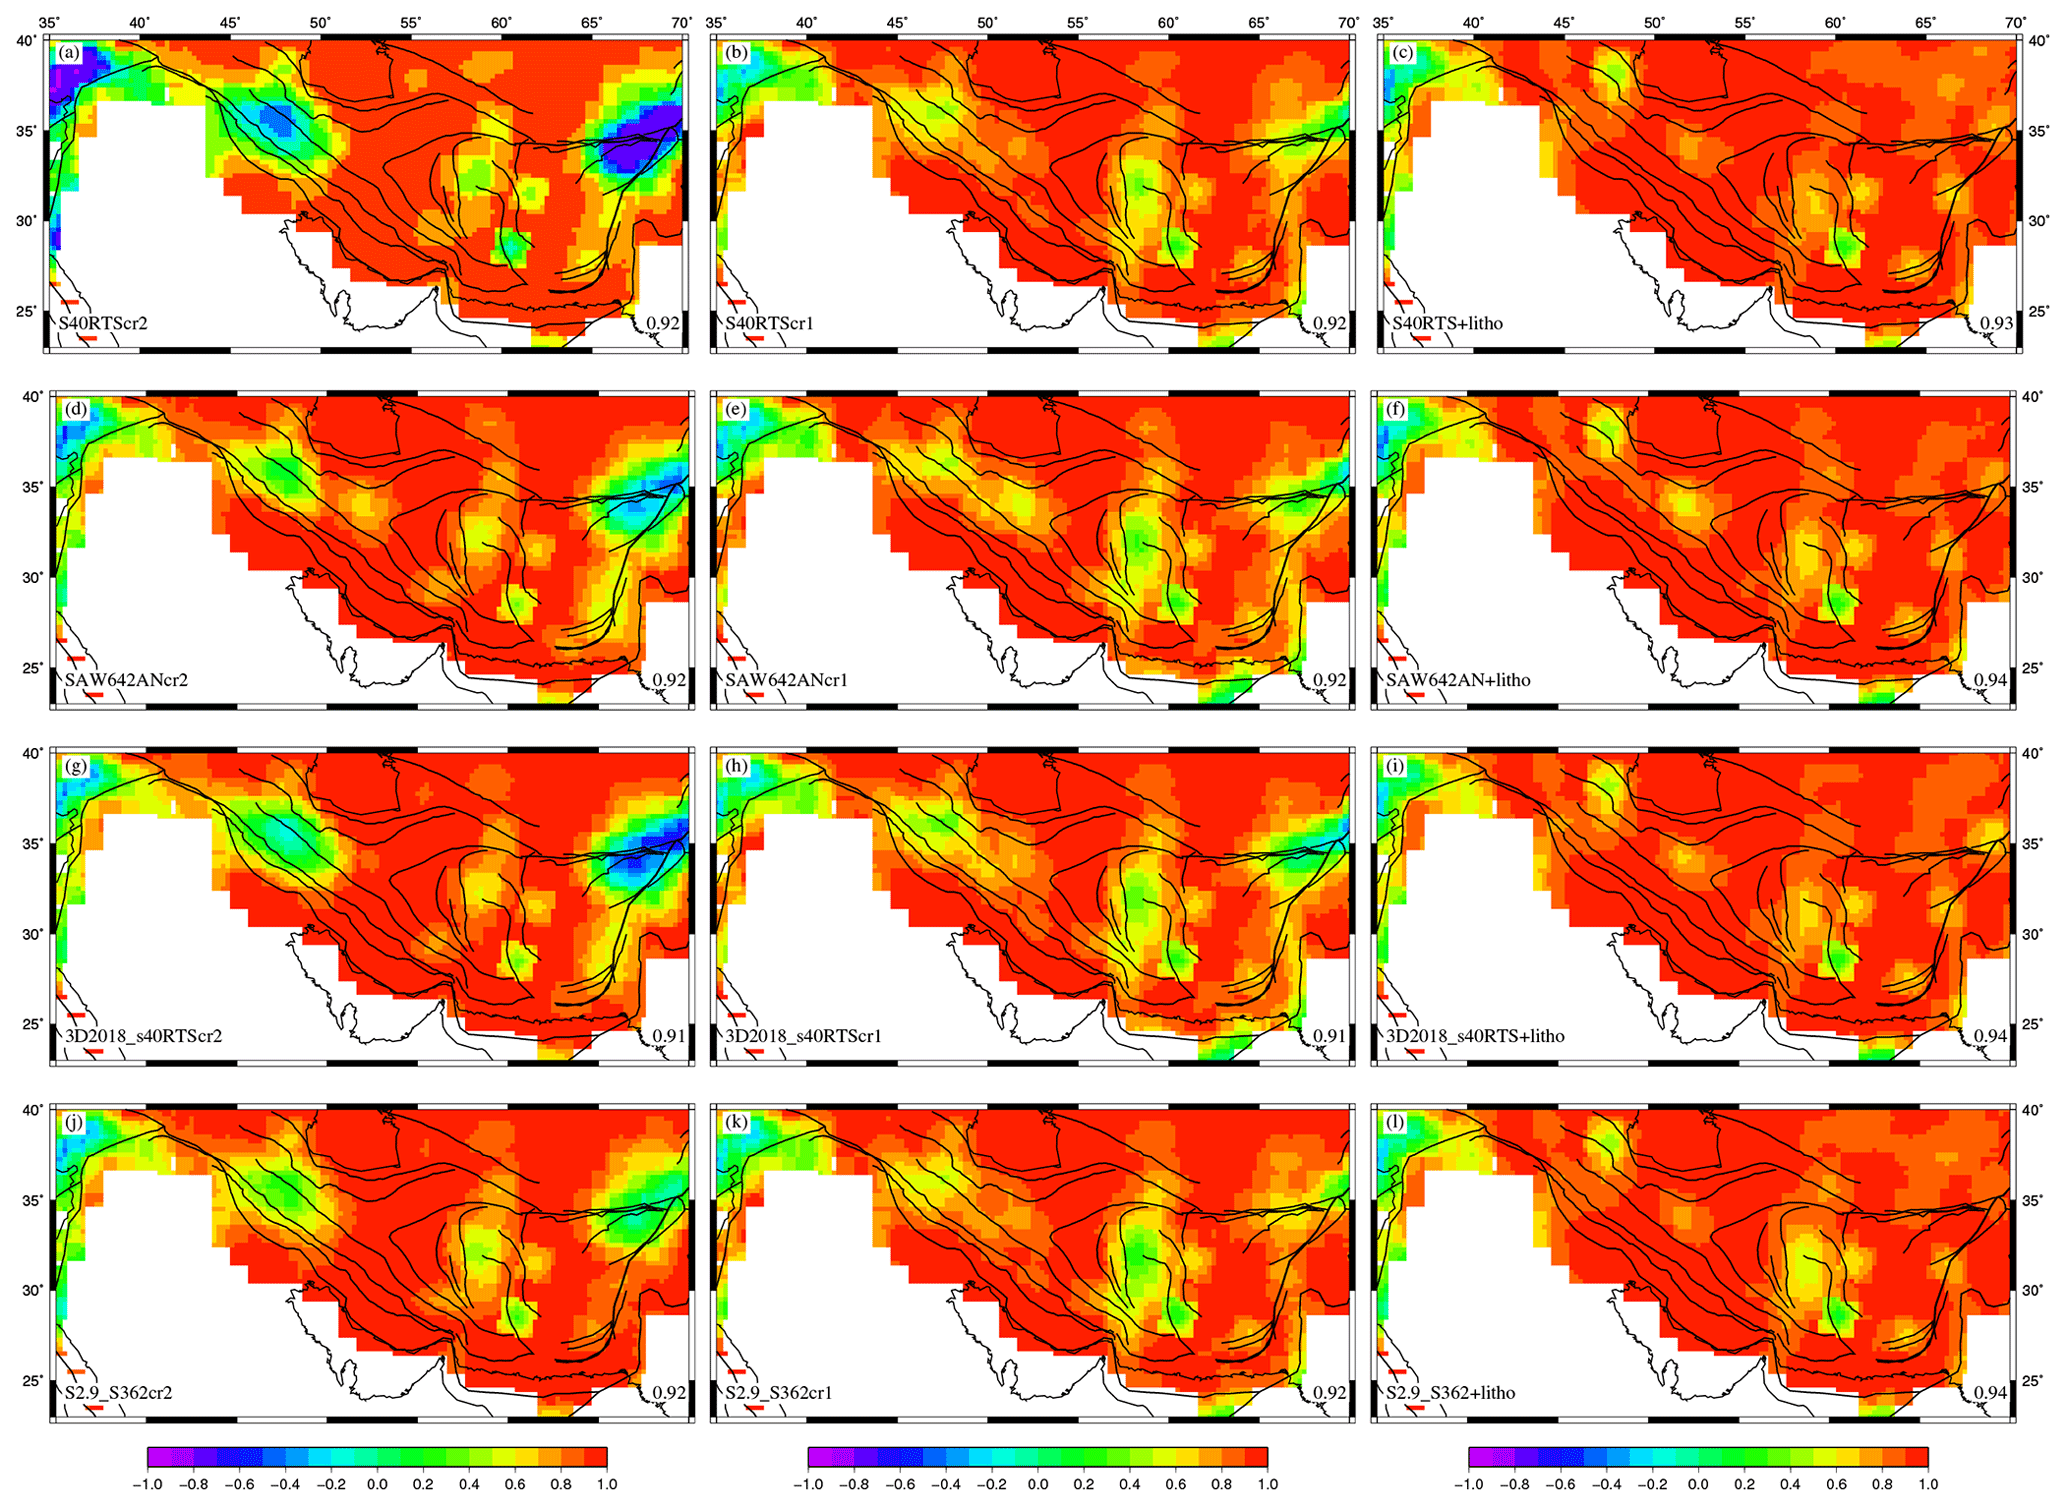
Figure 12Correlation coefficients between strain rate tensors from Kreemer et al. (2014) and deviatoric stress tensors predicted using the combined effects of GPE computed from different crustal models and mantle tractions derived from various tomography models. The figure shows the average correlation coefficient in the lower-right corner of the figure.
Again the combined models of GPE and mantle tractions give lower rms errors when predicted plate velocities are compared to the observed ones. S40RTScr2 shows the lowest rms error (3.28 mm yr−1) and the least average angular misfit (3.0∘) between predicted and observed plate velocities (Fig. 13a). Relatively, the combined models of S40RTS and S2.9_S362 and GPE perform much better than other models in predicting the orientation and magnitude of plate velocities. Significant misfits are observed for the SAW642ANcr1 and 3D2018_S40RTScr1 models. The joint models of S40RTS and GPE for a thicker lithosphere do not offer any significant changes in terms of stresses and their fit to observed data (Table S2) (Ghosh et al., 2009; Jay et al., 2018; Hirschberg et al., 2018). Thus, considering the lithosphere base at 100 km appears to be a satisfactory approach.
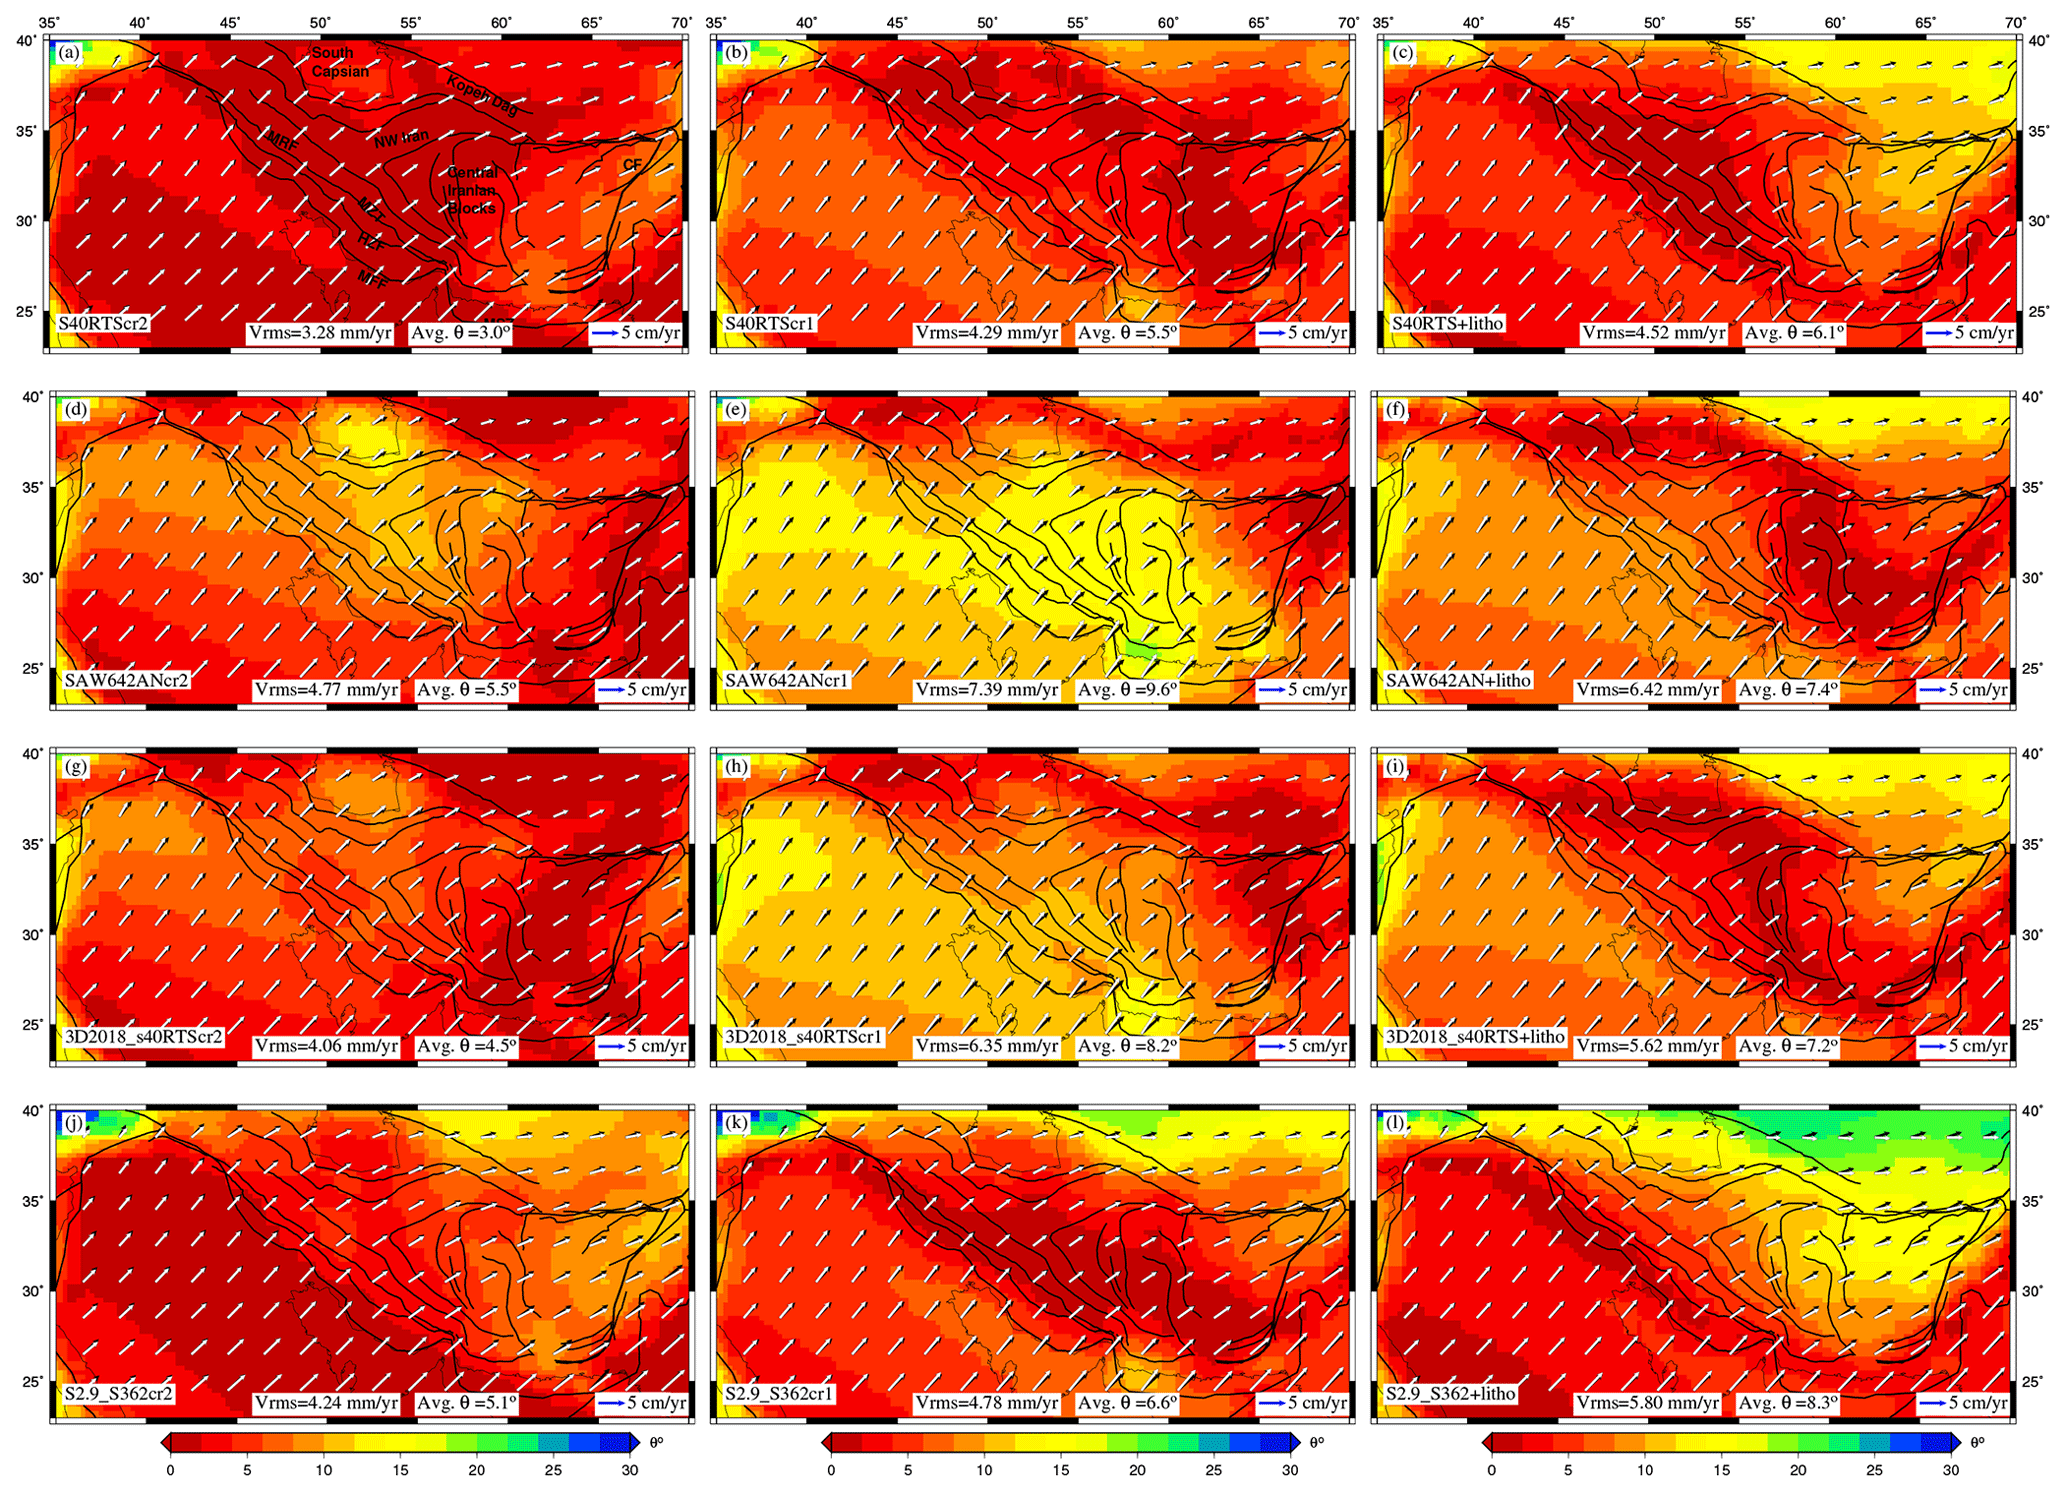
Figure 13Plate velocities predicted using the combined effects of GPE computed from different crustal models and mantle tractions derived from various tomography models plotted on top of angular misfit (θ). Black arrows represent observed NNR velocities (Kreemer et al., 2014), and white ones denote predicted velocities.
The Zagros–Iranian plateau region is formed due to the convergence of the Arabian plate towards the Eurasian plate. The Zagros mountain belt demarcates the southwestern boundary of the deformation zone, whereas it is bounded by the Makran subduction zone in the southeast and by the Afghan block in the east. Kopet Dagh and Arborz act as this region's northeastern and northern boundaries (Irandoust et al., 2022). We modeled the stresses and deformation parameters in the study area by solving the force balance equation using the finite-element method for a global grid of resolution considering two primary sources of stresses, namely GPE and mantle tractions. GPE was calculated using the thickness and density variation from the different global models CRUST1.0, CRUST2.0, and LITHO1.0. The shear tractions were computed from a density-derived mantle convection model.
The magnitude of stresses due to GPE variations was below 15 MPa in the Iranian plateau for the CRUST2 and CRUST1 models (Fig. 4a and c). However, the LITHO1 model predicted higher stresses (>30 MPa) with predominant compression in parts of the Zagros–Iran region and Afghan block. Most of the convergence of the Arabian and Eurasian plates has been accommodated by shortening across Zagros (Irandoust et al., 2022; Khodaverdian et al., 2015). Walpersdorf et al. (2006) and Hessami et al. (2006) suggested a nearly pure N–S shortening of 8±2 mm yr−1 in southeastern Zagros. The convergence occurs perpendicularly to the simply folded mountains and is restricted to the shore of the Persian Gulf. Earthquake focal mechanisms also show reverse faulting within this area (Berberian, 1995; Hatzfeld et al., 2010; Hatzfeld and Molnar, 2010; Irandoust et al., 2022). In our study, the LITHO1 model predicted the thrust mode of faulting within Zagros, which is consistent with these results. In NW Zagros, Hatzfeld et al. (2010); Hatzfeld and Molnar (2010), Jackson and McKenzie (1984), Khorrami et al. (2019), Talebian and Jackson (2002), and various others have suggested partitioning of deformation. The oblique shortening is partitioned into strike–slip faulting that is accommodated by the MRF, while shortening occurs perpendicularly to the mountain belt (Hatzfeld et al., 2010; Hatzfeld and Molnar, 2010; Jackson and McKenzie, 1984; Khorrami et al., 2019; Talebian and Jackson, 2002). In considering lithospheric models only, we predicted the normal mode of faulting to be dominant in this area for CRUST2. On the other hand, the CRUST1 model predicted strike–slip components in the northern segment of the MRF, while LITHO1 showed thrust type of deformation in this area. Interestingly, the misfits of predicted parameters with various observations of , strain rates, and plate velocities were found to be lowest for the LITHO1 model, thus arguing for thrust type of deformation in this area. SSZ in the north of the MZT consists of various thrust systems (Alavi, 1994). CRUST1 predicted the thrust mode of faulting in this region, while the CRUST2 and LITHO1 models showed an intermittent strike–slip type of faulting. Alborz and Kopet Dagh in the north have also been subjected to reverse faulting (Allen et al., 2003; Hatzfeld and Molnar, 2010; Hollingsworth et al., 2010; Irandoust et al., 2022; Khodaverdian et al., 2015), which has also been shown by the CRUST1 and LITHO1 models. Models predicting thrust in the Talesh mountains showed low misfits to observations, suggesting thrusting of the mountain range over the basin, with slip vectors directed towards the southern Caspian Sea (Irandoust et al., 2022). The N–S convergence in the Kopet Dagh range was predicted by the LITHO1 model considering the contribution from lithospheric density and topographic variations only. The shearing between central Iran and the Afghan block caused due to varying rates of shortening across Zagros, Alborz, and Caucasus is accommodated by strike–slip faults near the Lut block boundaries (Khorrami et al., 2019; Vernant et al., 2004; Walpersdorf et al., 2014). Again, the LITHO1 model predicted similar strike–slip deformation in these areas; however, CRUST2 and CRUST1 failed to do so.
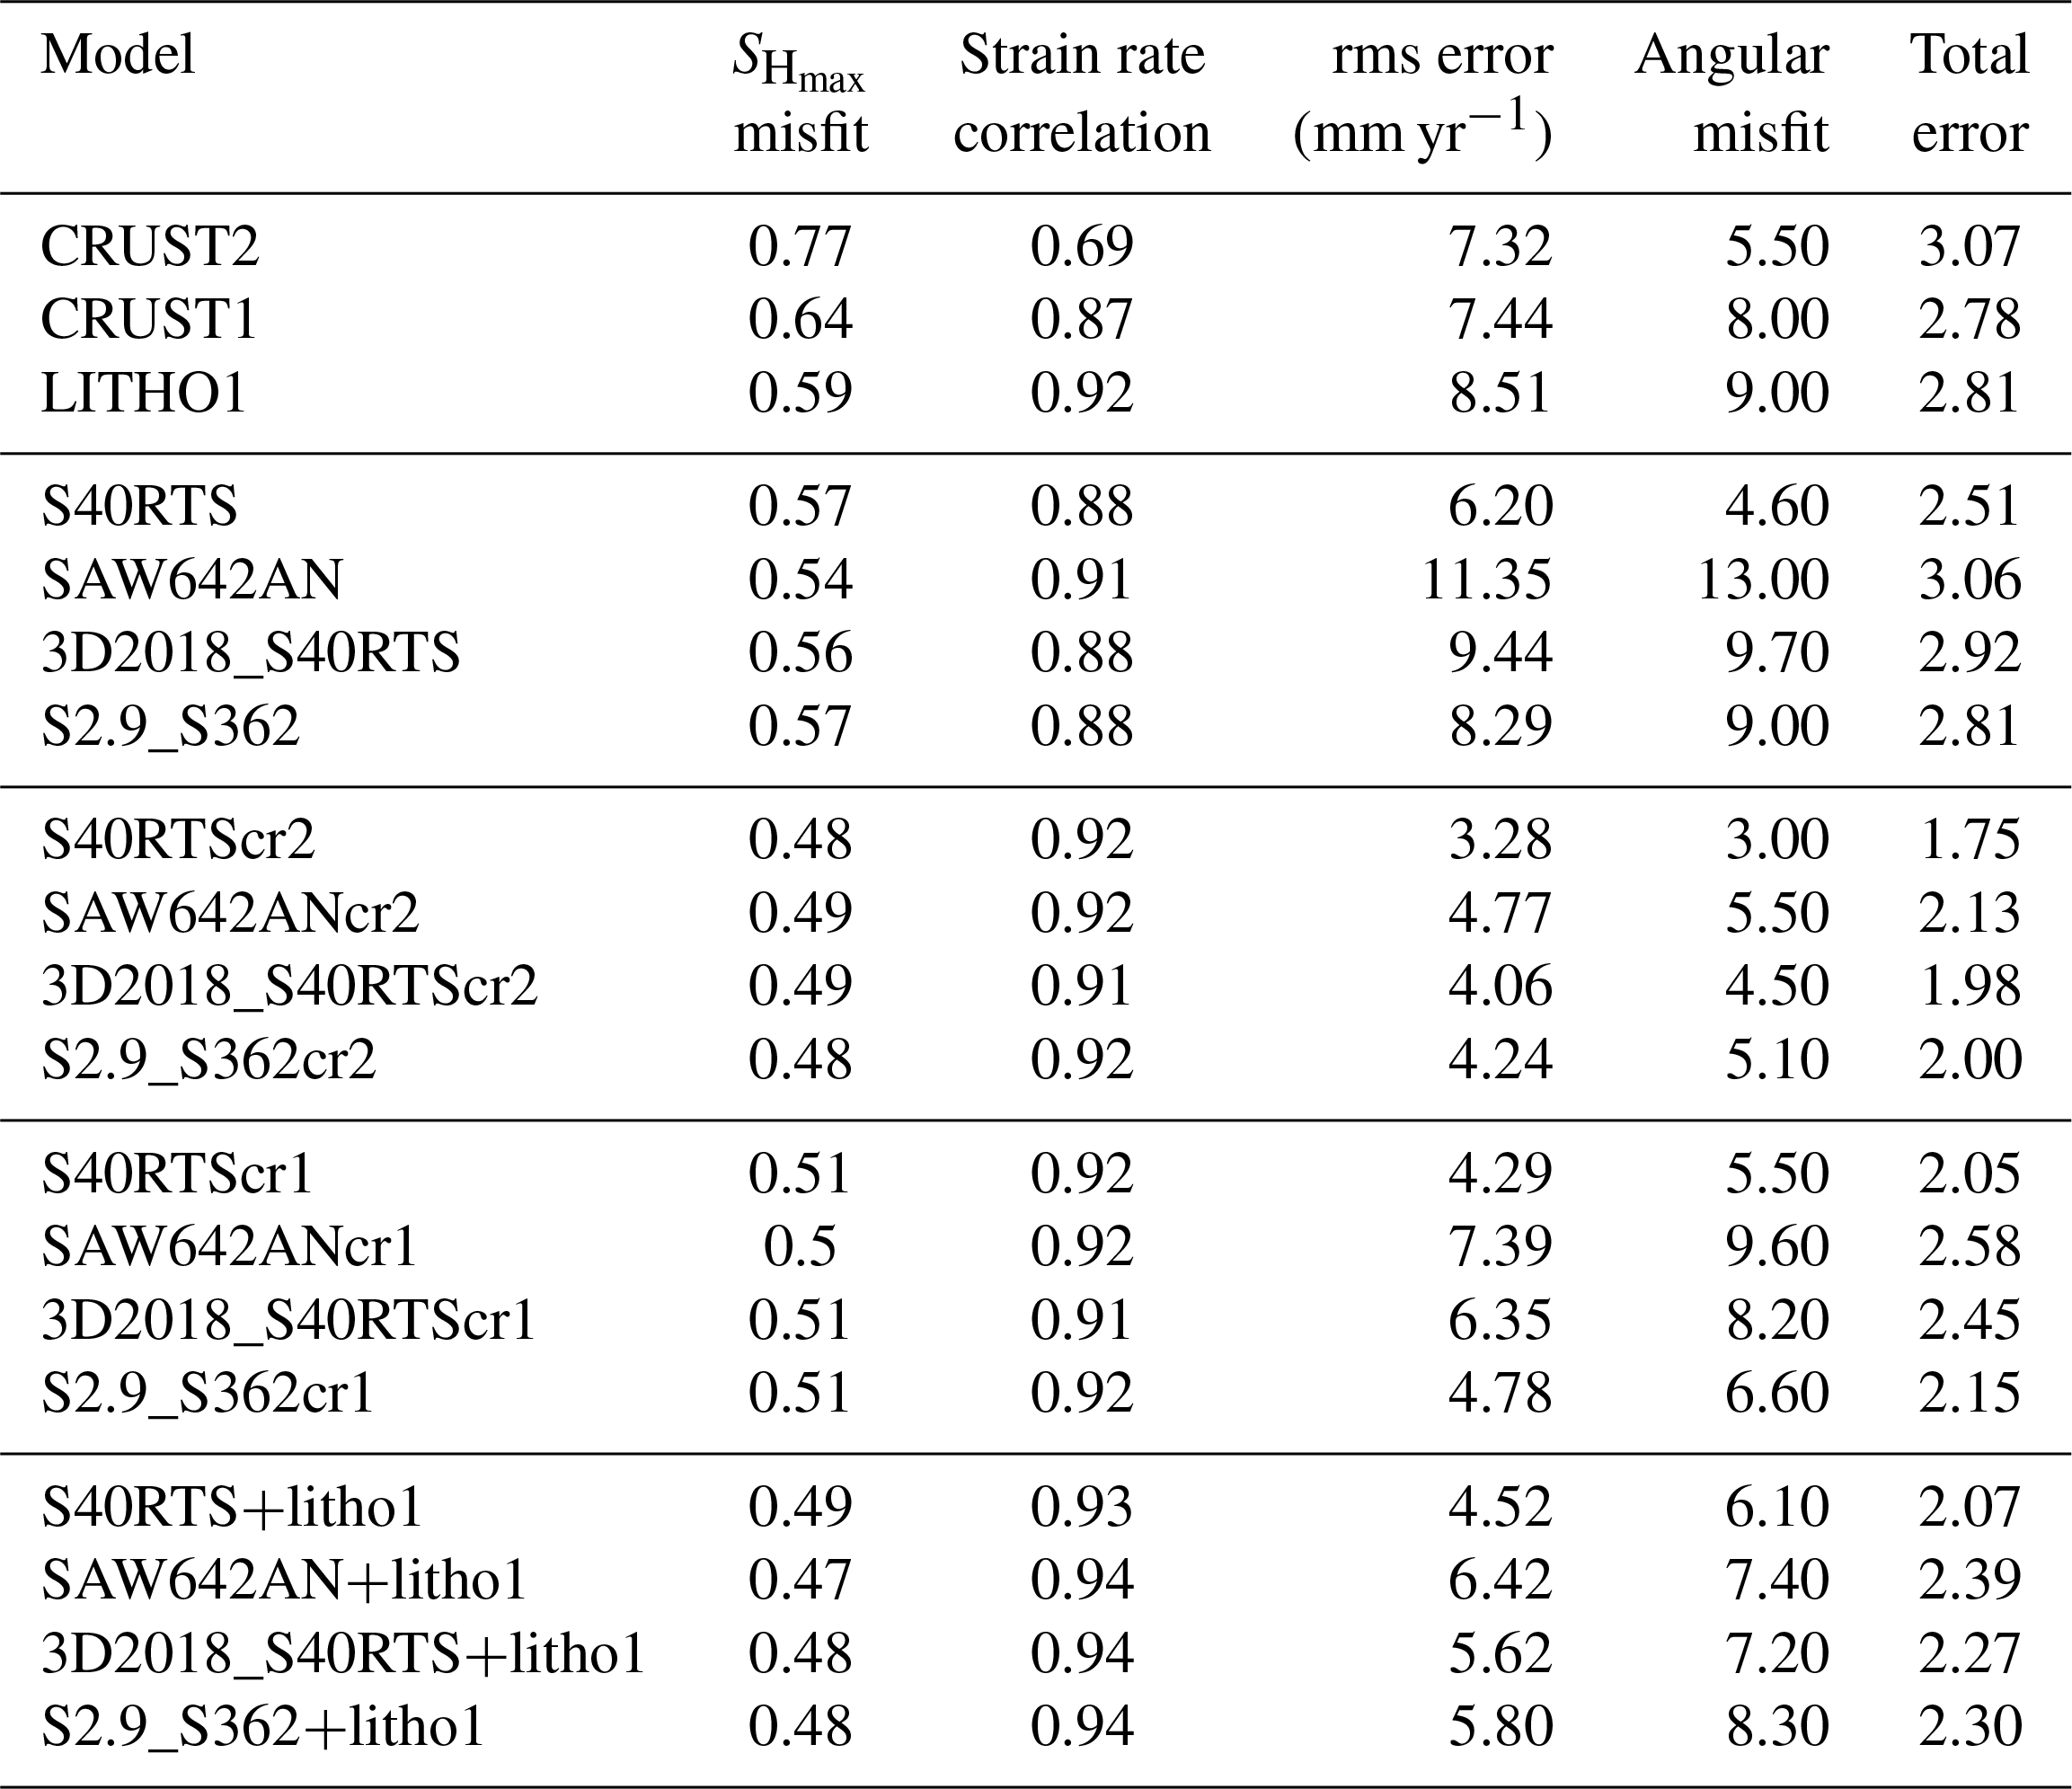
Table 1Summary of quantitative comparison of predicted results of various models with observed data.
The stresses predicted using basal tractions were mostly compressional in southeastern Zagros owing to the convergence of Arabia–Eurasia (Fig. 6). However, all models except SAW642AN predicted strike–slip type of deformation in northwestern Zagros (MRF), which concurs with the results from various studies (Hatzfeld et al., 2010; Hatzfeld and Molnar, 2010; Jackson and McKenzie, 1984; Khorrami et al., 2019; Talebian and Jackson, 2002). The mantle-derived stress parameters showed a better fit to observables than those from GPE variations (Fig. 7, left and middle panels), though the correlation dropped below 0.5 in central Iran. Here, mantle convection models found a compressional type of deformation, while Baniadam et al. (2019) and Khorrami et al. (2019) suggested strike–slip faulting along the fault system bounding the Lut block. The velocity misfits were very high for all models except S40RTS (Fig. 7, right panel). Although we used four tomography models to compute the mantle-derived stresses, the stress regimes for all models are found to be similar, with varying magnitudes. Such results suggest that nearly all four seismic tomography models are relatively consistent in predicting the stresses in this region.
Adding the GPE-derived stresses to those from the mantle to obtain the total lithospheric stress field showed a notable improvement in constraining the observed deformation parameters. The final stress regimes also varied significantly depending on particular combinations of GPE and mantle convection models. All joint models of CRUST2 and mantle tractions showed lower magnitudes of stresses (<15 MPa) in the north of the MRF, Tehran, and the southern Lut block. The stresses showed an obvious increase in these areas for other models. Significantly higher stresses (>30 MPa) were also observed near the collisional front (MFF) for all models. On comparison with observations, combined models of CRUST2 and mantle tractions showed significant improvement in fit, except in areas north of the MRF and Tehran. The CRUST1 model, when added to mantle contribution, predicted thrust faulting along the faults bounding the Lut block, leading to poor correlation (<0.5). On the other hand, combined LITHO1 and mantle convection models gave a much better fit in this area as they predicted strike–slip faulting. The use of different mantle convection models is much less sensitive in the Iran–Zagros region as most models can match various surface observables reasonably well.
On running various models and comparing the stresses in Zagros–Iran, we try to explain the relative roles of GPE and mantle tractions in causing observed deformation. The contributions from both sources vary significantly among different models. However, these variations arise mainly from GPE-only models, which may be due to uncertainties in the crustal models of this area. Another interesting observation from this study is that the role of GPE in the study region may not be that significant as mantle-derived stresses were able to explain many of the deformation indicators. To get a quantitative constraint on the best model, we computed a total error as given below:
The error in the above equation is calculated as described in Sect. 3.4, while Cstrain is the correlation computed using Eq. (6). Vrms is the rms error between predicted and observed velocities. The total errors calculated using Eq. (7) have been tabulated in Table 1. S40RTScr2 is found to have the lowest error.
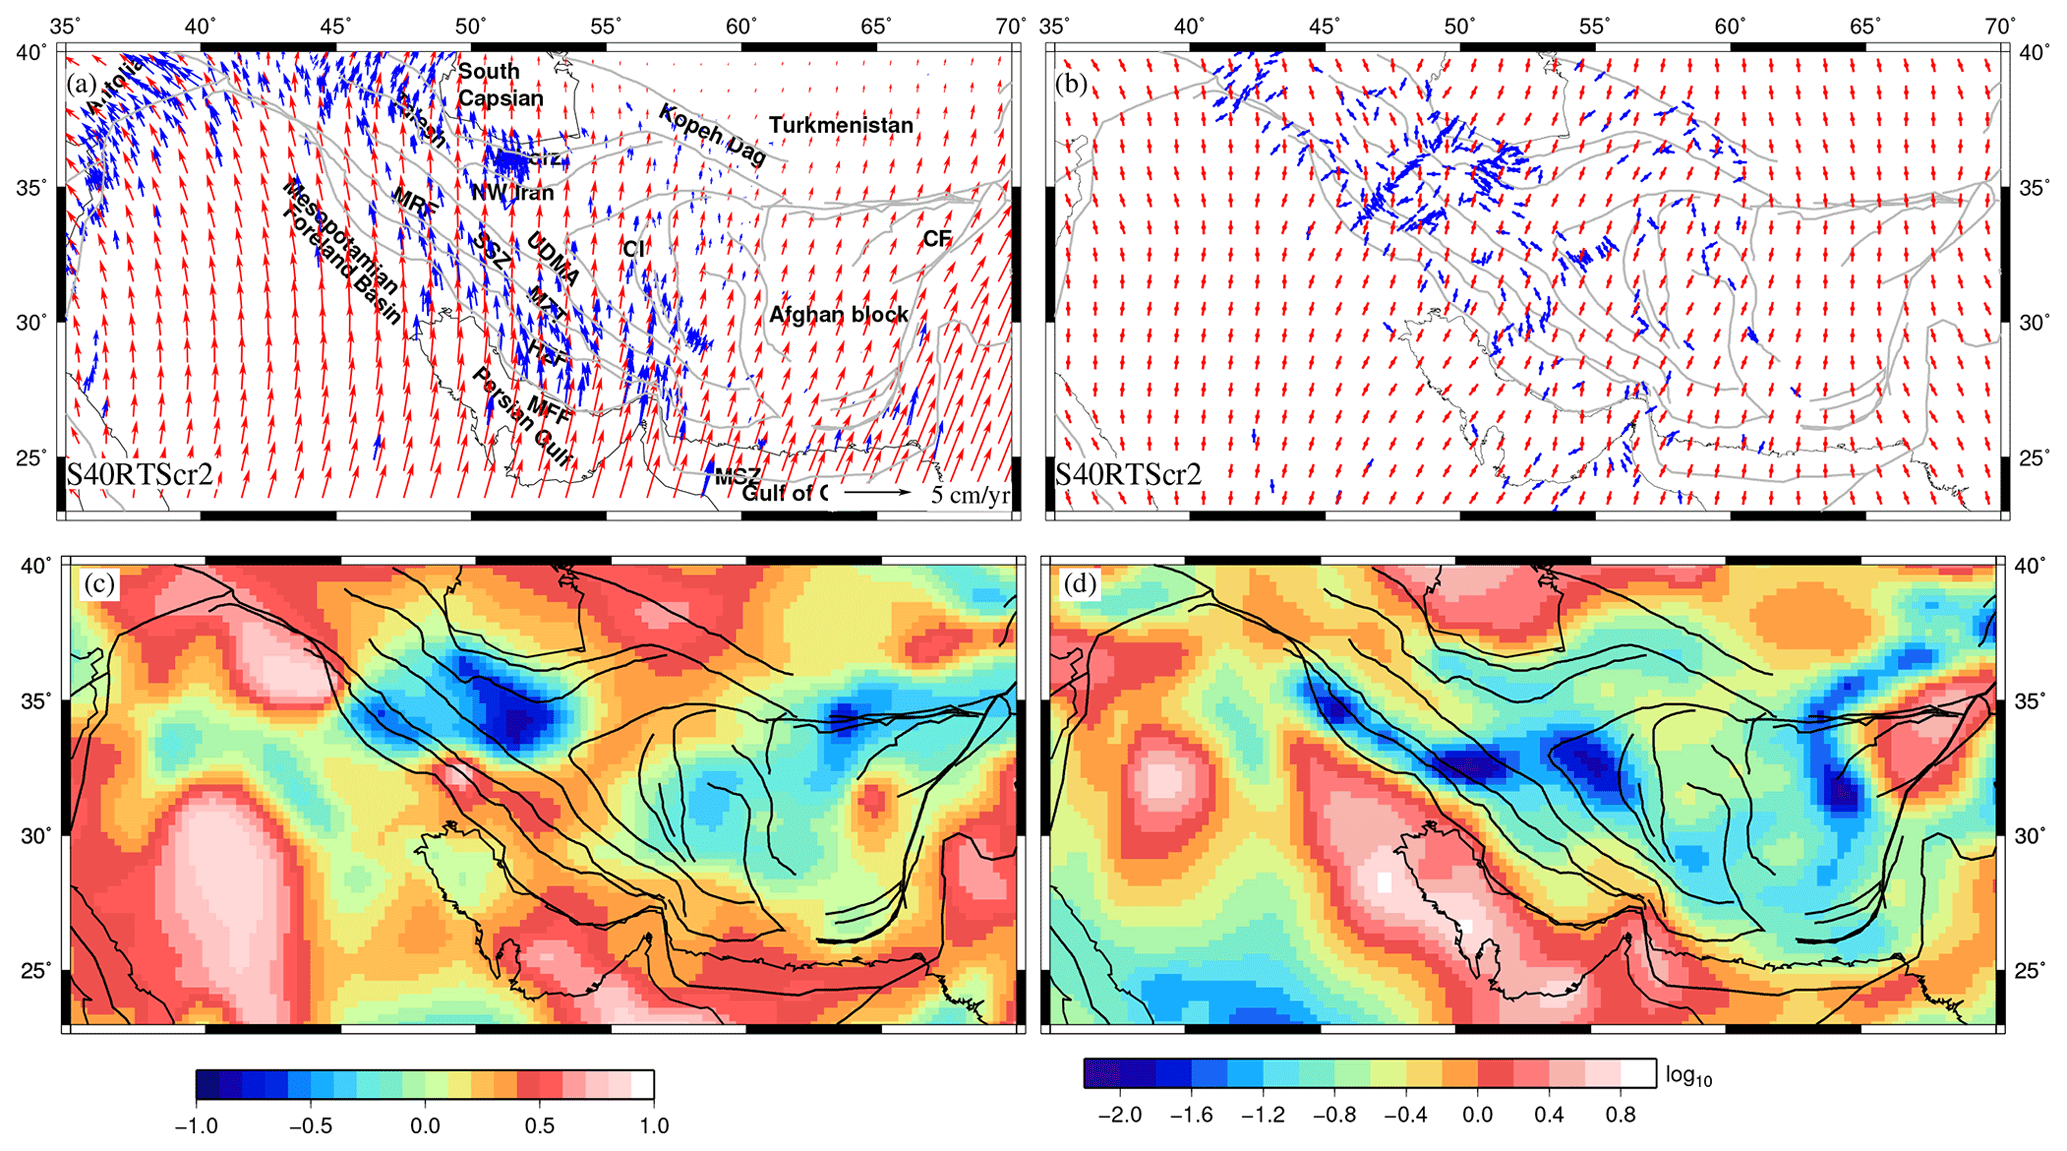
Figure 14Predicted parameters of the best-fit model, S40RTScr2. (a) GPS (blue) and predicted (red) plate velocities with respect to a fixed Eurasian plate, (b) fast polarization directions (FPDs) (blue), and (red) are plotted for the best-fit model. (c) Correlation between deviatoric stresses predicted from GPE and mantle convection models and (d) ratio () of the second invariant of deviatoric stresses from GPE (T1) to those from mantle tractions (T2).
We also calculated plate velocities with respect to the Eurasian plate (Fig. 14) and compared them with observed GPS velocities relative to Eurasia. The GPS velocities were obtained from various studies conducted in this area (ArRajehi et al., 2010; Bayer et al., 2006; Frohling and Szeliga, 2016; Khorrami et al., 2019; Masson et al., 2006, 2007; Raeesi et al., 2017; Reilinger and McClusky, 2011; Vernant et al., 2004). GPS measurements show a northward convergence rate of ∼22 mm yr−1 for Arabia relative to Eurasia (Reilinger et al., 2006; Vernant et al., 2004); however, it varies significantly along Zagros. Southeastern Zagros shows the highest convergence rates of ∼25 mm yr−1, oriented in the north–northeast direction. GPS vectors are oriented northward in central Zagros, which transitions to become oriented north–northwest in northwestern parts of Zagros with the lowest convergence rates of ∼18 mm yr−1 (Hatzfeld and Molnar, 2010; Hatzfeld et al., 2010; Khorrami et al., 2019). Vernant et al. (2004) suggested that the MSZ accommodates most of the shortening (19.5±2 mm yr−1) east of 58∘ E, while fold-and-thrust belts of Zagros, Alborz, and Caucasus collectively accommodate the shortening west of 58∘ E. GPS velocities in the east of Iran (Afghan block) are very small in magnitude. To the west, velocities increase, showing a westward rotation of Anatolia (Khorrami et al., 2019; Reilinger et al., 2006). The northern part of Iran shows that GPS vectors are aligned towards the northeast. We found that the combined model of S40RTS and CRUST2 can approximately match the GPS velocities (Fig. 14a). Predicted plate velocities with respect to the fixed Eurasian plate show a northward movement of ∼2–3 cm yr−1 in southeastern Zagros. The plate moves in an NNE direction east of central Zagros (53∘ E). On the other hand, west of 53∘ E shows a movement in an NNW direction, becoming much more prominent in the north. However, the convergence rates in the east of Iran, i.e., the Lut block and Afghan block, are predicted to be much higher (∼1–2 cm yr−1) than those suggested by various observations. Plate velocities predicted by joint models, S40RTScr1 and S40RTS+LITHO1, show nearly N–S contraction of very high magnitudes (4–5 cm yr−1) throughout the region (Fig. S3), which suggests much higher rates of deformation than those suggested by the above-mentioned studies.
We also used shear-wave-splitting measurements to further study the deformation in the Zagros–Iran region by comparing them with (Fig. 14b). The fast polarization directions (FPDs) are the indicators of seismic anisotropy. We consider two primary causes of seismic anisotropy, namely induction by stress and that due to the structure of the region (Yang et al., 2018). If the FPDs are parallel to orientations, it suggests that anisotropy is associated with stress. On the other hand, the latter kind of anisotropy is related with the alignment of fault, fast axes of minerals that may cause polarization, and sedimentary bedding planes. The FPDs in our study were obtained from Sadeghi-Bagherabadi et al. (2018) and Kaviani et al. (2009, 2021). The FPDs are subparallel to orientations in NW Zagros, the Arabian plate, northern Iran, and the MSZ. Such a correlation between both indicates that anisotropy in this region may be stress induced. Additionally, the correlation of orientations and FPDs argues for a good coupling between the lithosphere and mantle in those areas. In contrast, Sadeghi-Bagherabadi et al. (2018) showed FPDs parallel to the strike of the fault (subparallel to directions of CRUST2), suggesting that seismic anisotropy mainly reflects the deformation in the lithospheric mantle. Again, FPDs are subparallel to the strike of range in northeastern Iran, eastern Kopet Dagh, and central Alborz, indicating structure-induced anisotropy caused by strong shearing along the strike–slip faults (Gao et al., 2022; Kaviani et al., 2021).
To explore the relative roles of lithospheric and mantle-derived stresses, we compared the deviatoric stresses from CRUST2 to those from S40RTS. We performed a correlation between both stresses by using Eq. (5) and found a high correlation (>0.5) near the MSZ and central Zagros (Fig. 14c). The correlation degrades north of the simply folded mountains and NW Iran. The stresses are anti-correlated in northwestern parts of higher Zagros and north of the MRF and Tehran as CRUST2 predicted NNE–SSW tension (Fig. 4b) as opposed to the strike–slip faulting predicted by S40RTS (Fig. 6b). The Lut block also shows a slight anticorrelation between stresses () as the stresses predicted by CRUST2 are very low. The log of the ratio of second invariants of deviatoric stresses from GPE variations (T1) to those of mantle tractions (T2) is plotted in Fig. 14d. Positive values of the logarithmic ratio suggest the dominance of GPE-derived stresses over mantle ones, as observed in the south of the collisional boundary (MFF). The ratio is negative in most parts of the Iranian plateau and Zagros, indicating that the magnitude of mantle-derived stresses is higher than that of GPE, especially in higher Zagros and central Iran (Fig. 14d).
The deformation in the Zagros–Iran plateau region has been found to exhibit various similarities to another similar complex collision zone, i.e., the Himalaya–Tibetan plateau region, as both continental collisions went through many of the same processes. The high topography in both collisions reflects ongoing crustal deformation through crustal thickening and shortening. However, there are differences in the convergence rates, total amounts of convergence, and various stages of development of the Zagros–Iran and Himalaya–Tibet regions (Hatzfeld and Molnar, 2010). Singh and Ghosh (2020) studied the deformation in the Himalaya–Tibet region by joint modeling of lithosphere and mantle. They showed that GPE plays a crucial role in the ongoing deformation of the India–Eurasia collision zone as it leads to the observed E–W extension in the Tibetan plateau. In contrast, we found that GPE has a much lesser role in the Zagros–Iran plateau region (Fig. 14d), and no normal mode of faulting is observed in this area. In the Zagros–Iran plateau region, mantle convection appears to be the primary driver of deformation in most parts, as discussed above. Despite these differences, numerical models argue for a good coupling between the lithosphere and mantle in both collision zones, which is also supported by seismic anisotropy studies in both regions (Kaviani et al., 2021; Singh et al., 2016; Sol et al., 2007).
The Zagros–Iranian plateau region has large deformations along and across the collision zones. Therefore, we conducted numerical simulation studies for stress and deformations. The stresses predicted in this region were primarily compressional, with magnitudes lower than 30 MPa. The southeastern boundary of Zagros was found to be under high stress, which is also reflected by higher convergence rates. Mantle convection models were able to constrain most observations in the Iranian plateau. However, the misfits with observations were much larger in the east of Iran, when only mantle contributions were considered. The combined models of lithosphere and mantle-derived stresses can explain surface observables in most of the area, suggesting a good lithosphere–mantle coupling, except east of Iran. The shearing in those areas was predicted by lithosphere models, though variation in the lithospheric and density structures given by these models lead to varying degrees of misfits. Hence, there is a need for better constraint on lithospheric structure in this area.
The mantle-derived stresses were found to be much higher than lithospheric stresses; thus, the overall stress regimes predicted by combined models were more biased towards the compressional type of stresses. This caused our combined models to predict the thrust mode of faulting in most cases, especially when lithospheric stresses were computed from the CRUST1 and LITHO1 models. The CRUST2 model predicted more extensional stress in the Iranian plateau, which in turn balanced the effect of compressional stresses predicted by mantle convection models, hence leading to the prominence of the strike–slip mode of faulting in the northwestern parts of the study region. The rate of convergence of Arabia relative to a fixed Eurasia was found to vary along the Zagros orogeny in a similar way to that found with GPS measurements.
The finite-element code is available upon request. HC convection codes are publicly accessible from https://github.com/geodynamics/hc (Becker et al., 2009).
Three models, namely CRUST1.0, CRUST2.0, and LITHO1.0, were used to obtain the crustal and lithospheric structure data, which are required as input in finite-element models. We downloaded these three models and the seismic tomography models used in mantle convection codes from the Incorporated Research Institutions for Seismology (IRIS) Earth Model Collaboration repository (http://ds.iris.edu/ds/products/emc-earthmodels/, last access: March 2022, SAGE, 2022). The strain rate model, GSRMv2.1, was obtained from http://geodesy.unr.edu/GSRM/ (https://doi.org/10.1002/2014GC005407, Kreemer et al., 2014). The World Stress Map Website (https://doi.org/10.5880/WSM.2016.001, Heidbach et al., 2016) provides the orientations and fault types, which were used to perform a quantitative comparison with the predicted results. GPS velocities relative to Eurasia were taken from ArRajehi et al. (2010), Bayer et al. (2006), Frohling and Szeliga (2016), Khorrami et al. (2019), Masson et al. (2006, 2007), Raeesi et al. (2017), Reilinger and McClusky (2011), and Vernant et al. (2004). We also used seismic anisotropy data from Sadeghi-Bagherabadi et al. (2018) and Kaviani et al. (2009, 2021).
The supplement related to this article is available online at: https://doi.org/10.5194/se-14-937-2023-supplement.
SrS ran the numerical models for computing various parameters in this papers. Both the authors, SrS and RY, were involved in the interpretation of the predicted results. This paper was prepared by SrS under the supervision of RY.
The contact author has declared that neither of the authors has any competing interests.
Publisher's note: Copernicus Publications remains neutral with regard to jurisdictional claims in published maps and institutional affiliations.
We thank Attreyee Ghosh for sharing the codes for finite-element modeling of stresses. We are also thankful to the director of CSIR-NGRI (Council of Scientific and Industrial Research National Geophysical Research Institute) for the permission to publish this work (ref. no. NGRI/Lib/2022/ Pub-110). This article is published as a part of the MLP-FBR-003(AM) project. The figures in this article were generated from the open-source GMT modules.
This paper was edited by Simone Pilia and reviewed by Debasis D. Mohanty and Frédéric Mouthereau.
Agard, P., Omrani, J., Jolivet, L., and Mouthereau, F.: Convergence history across Zagros (Iran): constraints from collisional and earlier deformation, Int. J. Earth Sci., 94, 401–419, 2005. a, b, c
Agard, P., Omrani, J., Jolivet, L., Whitechurch, H., Vrielynck, B., Spakman, W., Monié, P., Meyer, B., and Wortel, R.: Zagros orogeny: a subduction-dominated process, Geol. Mag., 148, 692–725, 2011. a, b
Alavi, M.: Tectonostratigraphic evolution of the Zagrosides of Iran, Geology, 8, 144–149, 1980. a, b
Alavi, M.: Tectonics of the Zagros orogenic belt of Iran: new data and interpretations, Tectonophysics, 229, 211–238, 1994. a, b
Allen, M., Ghassemi, M., Shahrabi, M., and Qorashi, M.: Accommodation of late Cenozoic oblique shortening in the Alborz range, northern Iran, J. Struct. Geol., 25, 659–672, 2003. a
Allen, M. B. and Armstrong, H. A.: Arabia–Eurasia collision and the forcing of mid-Cenozoic global cooling, Palaeogeogr. Palaeocl. Palaeoecol., 265, 52–58, 2008. a
Allen, M. B., Kheirkhah, M., Emami, M. H., and Jones, S. J.: Right-lateral shear across Iran and kinematic change in the Arabia–Eurasia collision zone, Geophys. J. Int., 184, 555–574, 2011. a
ArRajehi, A., McClusky, S., Reilinger, R., Daoud, M., Alchalbi, A., Ergintav, S., Gomez, F., Sholan, J., Bou-Rabee, F., Ogubazghi, G., Haileab, B., Fisseha, S., Asfaw, L., Mahmoud, S., Rayan, A., Bendik, R., and Kogan, L.: Geodetic constraints on present-day motion of the Arabian Plate: Implications for Red Sea and Gulf of Aden rifting, Tectonics, 29, TC3011, https://doi.org/10.1029/2009TC002482, 2010. a
Authemayou, C., Bellier, O., Chardon, D., Malekzade, Z., and Abassi, M.: Role of the Kazerun fault system in active deformation of the Zagros fold-and-thrust belt (Iran), Comptes Rendus Geoscience, 337, 539–545, 2005. a
Ballato, P., Uba, C. E., Landgraf, A., Strecker, M. R., Sudo, M., Stockli, D. F., Friedrich, A., and Tabatabaei, S. H.: Arabia-Eurasia continental collision: Insights from late Tertiary foreland-basin evolution in the Alborz Mountains, northern Iran, Bulletin, 123, 106–131, 2011. a, b
Baniadam, F., Shabanian, E., and Bellier, O.: The kinematics of the Dasht-e Bayaz earthquake fault during Pliocene-Quaternary: implications for the tectonics of eastern Central Iran, Tectonophysics, 772, 228218, https://doi.org/10.1016/j.tecto.2019.228218, 2019. a
Bassin, C., Laske, G., and Masters, G.: The Current Limits of Resolution for Surface Wave Tomography in North America, EOS Trans. AGU, 81, F897, http://igppweb.ucsd.edu/~gabi/rem.html (last access: March 2022), 2000 a
Bayer, R., Chery, J., Tatar, M., Vernant, P., Abbassi, M., Masson, F., Nilforoushan, F., Doerflinger, E., Regard, V., and Bellier, O.: Active deformation in Zagros–Makran transition zone inferred from GPS measurements, Geophys. J. Int., 165, 373–381, 2006. a, b, c
Becker, T. W., O'Neill, C., and Steinberger, B.: HC, a global mantle circulation solver, GitHub [code], https://github.com/geodynamics/hc, 2009.
Berberian, M.: Master “blind” thrust faults hidden under the Zagros folds: active basement tectonics and surface morphotectonics, Tectonophysics, 241, 193–224, 1995. a
Berberian, M. and King, G.: Towards a paleogeography and tectonic evolution of Iran, Can. J. Earth Sci., 18, 210–265, 1981. a
Bird, P.: Testing hypotheses on plate-driving mechanisms with global lithosphere models including topography, thermal structure, and faults, J. Geophys. Res.-Solid, 103, 10115–10129, 1998. a
Coblentz, D. D. and Sandiford, M.: Tectonic stresses in the African plate: Constraints on the ambient lithospheric stress state, Geology, 22, 831–834, 1994. a
Debayle, E., Dubuffet, F., and Durand, S.: An automatically updated S-wave model of the upper mantle and the depth extent of azimuthal anisotropy, Geophys. Res. Lett., 43, 674–682, 2016. a
DeMets, C., Gordon, R. G., Argus, D., and Stein, S.: Current plate motions, Geophys. J. Int., 101, 425–478, 1990. a
Dyksterhuis, S. and Müller, R.: Cause and evolution of intraplate orogeny in Australia, Geology, 36, 495–498, 2008. a
Engdahl, E. R., Jackson, J. A., Myers, S. C., Bergman, E. A., and Priestley, K.: Relocation and assessment of seismicity in the Iran region, Geophys. J. Int., 167, 761–778, 2006. a
England, P. and Molnar, P.: Active deformation of Asia: From kinematics to dynamics, Science, 278, 647–650, 1997. a, b
Falcon, N. L.: Southern Iran: Zagros Mountains, Geol. Soc. Lond. Spec. Publ., 4, 199–211, 1974. a
Flesch, L. M., Haines, A. J., and Holt, W. E.: Dynamics of the India-Eurasia collision zone, J. Geophys. Res., 106, 16435–16460, 2001. a, b, c, d
Flesch, L. M., Holt, W. E., Haines, A. J., Wen, L., and Shen-Tu, B.: The dynamics of western North America: stress magnitudes and the relative role of gravitational potential energy, plate interaction at the boundary and basal tractions, Geophys. J. Int., 169, 866–896, 2007. a
Frohling, E. and Szeliga, W.: GPS constraints on interplate locking within the Makran subduction zone, Geophysical Supplements to the Monthly Notices of the Royal Astronomical Society, 205, 67–76, 2016. a, b
Gao, Y., Chen, L., Talebian, M., Wu, Z., Wang, X., Lan, H., Ai, Y., Jiang, M., Hou, G., Khatib, M. M., Xiao, W., and Zhu, R.: Nature and structural heterogeneities of the lithosphere control the continental deformation in the northeastern and eastern Iranian plateau as revealed by shear-wave splitting observations, Earth Planet. Sc. Lett., 578, 117284, https://doi.org/10.1016/j.epsl.2021.117284, 2022. a
Ghorbani Rostam, G., Pakzad, M., Mirzaei, N., and Sakhaei, S. R.: Analysis of the stress field and strain rate in Zagros-Makran transition zone, J. Seismol., 22, 287–301, 2018. a
Ghosh, A. and Holt, W. E.: Plate motions and stresses from global dynamic models, Science, 335, 838–843, 2012. a
Ghosh, A., Holt, W. E., and Flesch, L. M.: Contribution of gravitational potential energy differences to the global stress field, Geophys. J. Int., 179, 787–812, 2009. a, b, c
Ghosh, A., Becker, T. W., and Humphreys, E. D.: Dynamics of the North American continent, Geophys. J. Int., 194, 651–669, 2013a. a
Ghosh, A., Holt, W. E., and Wen, L.: Predicting the lithospheric stress field and plate motions by joint modeling of lithosphere and mantle dynamics, J. Geophys. Res.-Solid, 118, 346–368, 2013b. a, b, c, d, e, f
Hager, B. H. and O'Connell, R. J.: A simple global model of plate dynamics and mantle convection, J. Geophys. Res., 86, 4843–4867, 1981. a
Hatzfeld, D. and Molnar, P.: Comparisons of the kinematics and deep structures of the Zagros and Himalaya and of the Iranian and Tibetan plateaus and geodynamic implications, Rev. Geophys., 48, RG2005, https://doi.org/10.1029/2009RG000304, 2010. a, b, c, d, e, f, g, h
Hatzfeld, D., Authemayou, C., van der Beek, P., Bellier, O., Lavé, J., Oveisi, B., Tatar, M., Tavakoli, F., Walpersdorf, A., and Yamini-Fard, F.: The kinematics of the Zagros mountains (Iran), Geol. Soc. Lond. Spec. Publ., 330, 19–42, 2010. a, b, c, d, e, f, g
Heidbach, O., Reinecker, J., Tingay, M., Müller, B., Sperner, B., Fuchs, K., and Wenzel, F.: Plate boundary forces are not enough: Second-and third-order stress patterns highlighted in the World Stress Map database, Tectonics, 26, TC6014, https://doi.org/10.1029/2007TC002133, 2007. a
Heidbach, O., Rajabi, M., Reiter, K., and Ziegler, M.: World Stress Map Database Release 2016, GFZ Data Services [data set], https://doi.org/10.5880/WSM.2016.001, 2016. a, b, c, d, e
Hessami, K., Nilforoushan, F., and Talbot, C. J.: Active deformation within the Zagros Mountains deduced from GPS measurements, J. Geol. Soc., 163, 143–148, 2006. a, b
Hirschberg, H. P., Lamb, S., and Savage, M. K.: Strength of an obliquely convergent plate boundary: lithospheric stress magnitudes and viscosity in New Zealand, Geophys. J. Int., 216, 1005–1024, 2018. a
Hollingsworth, J., Fattahi, M., Walker, R., Talebian, M., Bahroudi, A., Bolourchi, M. J., Jackson, J., and Copley, A.: Oroclinal bending, distributed thrust and strike-slip faulting, and the accommodation of Arabia–Eurasia convergence in NE Iran since the Oligocene, Geophys. J. Int., 181, 1214–1246, 2010. a
Irandoust, M. A., Priestley, K., and Sobouti, F.: High-resolution Lithospheric Structure of the Zagros Collision Zone and Iranian Plateau, J. Geophys. Res.-Solid, 127, e2022JB025009, https://doi.org/10.1029/2022JB025009, 2022. a, b, c, d, e, f, g, h
Jackson, J. and McKenzie, D.: Active tectonics of the Alpine–Himalayan Belt between western Turkey and Pakistan, Geophys. J. Int., 77, 185–264, 1984. a, b, c
Jackson, J., Priestley, K., Allen, M., and Berberian, M.: Active tectonics of the south Caspian basin, Geophys. J. Int., 148, 214–245, 2002. a, b, c
Jay, C. N., Flesch, L. M., and Bendick, R. O.: Kinematics and dynamics of the Pamir, Central Asia: Quantifying the roles of continental subduction in force balance, J. Geophys. Res.-Solid, 123, 8161–8179, 2018. a
Jolivet, L. and Faccenna, C.: Mediterranean extension and the Africa-Eurasia collision, Tectonics, 19, 1095–1106, 2000. a, b
Kaviani, A., Hatzfeld, D., Paul, A., Tatar, M., and Priestley, K.: Shear-wave splitting, lithospheric anisotropy, and mantle deformation beneath the Arabia–Eurasia collision zone in Iran, Earth Planet. Sc. Lett., 286, 371–378, 2009. a
Kaviani, A., Mahmoodabadi, M., Rümpker, G., Pilia, S., Tatar, M., Nilfouroushan, F., Yamini-Fard, F., Moradi, A., and Ali, M. Y.: Mantle-flow diversion beneath the Iranian plateau induced by Zagros' lithospheric keel, Sci. Rep., 11, 1–12, 2021. a, b, c
Khodaverdian, A., Zafarani, H., and Rahimian, M.: Long term fault slip rates, distributed deformation rates and forecast of seismicity in the Iranian Plateau, Tectonics, 34, 2190–2220, 2015. a, b, c
Khorrami, F., Vernant, P., Masson, F., Nilfouroushan, F., Mousavi, Z., Nankali, H., Saadat, S. A., Walpersdorf, A., Hosseini, S., Tavakoli, P., Aghamohammadi, A., and Alijanzade, M.: An up-to-date crustal deformation map of Iran using integrated campaign-mode and permanent GPS velocities, Geophys. J. Int., 217, 832–843, 2019. a, b, c, d, e, f, g, h, i, j, k
Koptev, A. and Ershov, A.: The role of the gravitational potential of the lithosphere in the formation of a global stress field, Izvestiya, Phys. Solid Earth, 46, 1080–1094, 2010. a
Koshnaw, R. I., Stockli, D. F., and Schlunegger, F.: Timing of the Arabia-Eurasia continental collision – Evidence from detrital zircon U-Pb geochronology of the Red Bed Series strata of the northwest Zagros hinterland, Kurdistan region of Iraq, Geology, 47, 47–50, 2019. a
Kreemer, C., Blewitt, G., and Klein, E. C.: A geodetic plate motion and Global Strain Rate Model, Geochem. Geophy. Geosy., 15, 3849–3889, https://doi.org/10.1002/2014GC005407, 2014 (data available at: http://geodesy.unr.edu/GSRM/). a, b, c, d, e, f, g, h, i, j
Kustowski, B., Ekström, G., and Dziewoński, A.: Anisotropic shear-wave velocity structure of the Earth's mantle: A global model, J. Geophys. Res.-Solid, 113, B06306, https://doi.org/10.1029/2007JB005169, 2008a. a
Kustowski, B., Ekström, G., and Dziewoński, A.: The shear-wave velocity structure in the upper mantle beneath Eurasia, Geophys. J. Int., 174, 978–992, 2008b. a
Laske, G., Masters, G., Ma, Z., and Pasyanos, M.: Update on CRUST1.0 – A 1-degree global model of Earth's crust, Geophys. Res. Abstr., 15, Abstract EGU2013-2658, 2013. a
Le Dortz, K., Meyer, B., Sébrier, M., Nazari, H., Braucher, R., Fattahi, M., Benedetti, L., Foroutan, M., Siame, L., Bourlès, D., Talebian, M., Bateman, M. D., and Ghoraishi, M.: Holocene right-slip rate determined by cosmogenic and OSL dating on the Anar fault, Central Iran, Geophys. J. Int., 179, 700–710, 2009. a
Lithgow-Bertelloni, C. and Guynn, J. H.: Origin of the lithospheric stress field, J. Geophys. Res.-Solid, 109, B01408, https://doi.org/10.1029/2003JB002467, 2004. a
Masson, F., Djamour, Y., Van Gorp, S., Chèry, J., Tatar, M., Tavakoli, F., Nankali, H., and Vernant, P.: Extension in NW Iran driven by the motion of the South Caspian Basin, Earth Planet. Sc. Lett., 252, 180–188, 2006. a, b, c
Masson, F., Anvari, M., Djamour, Y., Walpersdorf, A., Tavakoli, F., Daignieres, M., Nankali, H., and Van Gorp, S.: Large-scale velocity field and strain tensor in Iran inferred from GPS measurements: new insight for the present-day deformation pattern within NE Iran, Geophys. J. Int., 170, 436–440, 2007. a, b
McClusky, S., Balassanian, S., Barka, A., Demir, C., Ergintav, S., Georgiev, I., Gurkan, O., Hamburger, M., Hurst, K., Kahle, H., Kastens, K., Kekelidze, G., King, R., Kotzev, V., Lenk, O., Mahmoud, S., Mishin, A., Nadariya, M., Ouzounis, A., Paradissis, D., Peter, Y., Prilepin, M., Reilinger, R., Sanli, I., Seeger, H., Tealeb, A., Toksöz, M. N., and Veis, G.: Global Positioning System constraints on plate kinematics and dynamics in the eastern Mediterranean and Caucasus, J. Geophys. Res.-Solid, 105, 5695–5719, 2000. a
McQuarrie, N., Stock, J., Verdel, C., and Wernicke, B.: Cenozoic evolution of Neotethys and implications for the causes of plate motions, Geophys. Res. Lett., 30, 2036, https://doi.org/10.1029/2003GL017992, 2003. a
Md, S. I. and Ryuichi, S.: Neotectonic stress field and deformation pattern within the Zagros and its adjoining area: An approach from finite element modeling, J. Geol. Mining Res., 2, 170–182, 2010. a
Mégnin, C. and Romanowicz, B.: The three-dimensional shear velocity structure of the mantle from the inversion of body, surface and higher-mode waveforms, Geophys. J. Int., 143, 709–728, 2000. a
Mohajjel, M. and Fergusson, C. L.: Dextral transpression in Late Cretaceous continental collision, Sanandaj–Sirjan zone, western Iran, J. Struct. Geol., 22, 1125–1139, 2000. a
Mokhoori, A. N., Rahimi, B., and Moayyed, M.: Active tectonic stress field analysis in NW Iran-SE Turkey using earthquake focalmechanism data, Turk. J. Earth Sci., 30, 235–246, 2021. a
Mouthereau, F., Lacombe, O., and Vergés, J.: Building the Zagros collisional orogen: timing, strain distribution and the dynamics of Arabia/Eurasia plate convergence, Tectonophysics, 532, 27–60, 2012. a, b, c
Navabpour, P., Angelier, J., and Barrier, E.: Stress state reconstruction of oblique collision and evolution of deformation partitioning in W-Zagros (Iran, Kermanshah), Geophys. J. Int., 175, 755–782, 2008. a
Nouri, A., Rahimi, B., Vavryčuk, V., and Ghaemi, F.: Spatially varying crustal stress along the Zagros seismic belt inferred from earthquake focal mechanisms, Tectonophysics, 846, 229653, https://doi.org/10.1016/j.tecto.2022.229653, 2023. a
Pasyanos, M. E., Masters, G., Laske, G., and Ma, Z.: LITHO1.0: An updated crust and lithospheric model of the Earth, J. Geophys. Res.-Solid, 119, 2153–2173, 2014. a
Raeesi, M., Zarifi, Z., Nilfouroushan, F., Boroujeni, S. A., and Tiampo, K.: Quantitative analysis of seismicity in Iran, Pure Appl. Geophys., 174, 793–833, 2017. a, b
Rashidi, A., Kianimehr, H., Yamini-Fard, F., Tatar, M., and Zafarani, H.: Present Stress Map and Deformation Distribution in the NE Lut Block, Eastern Iran: Insights from Seismic and Geodetic Strain and Moment Rates, Pure Appl. Geophys., 179, 1887–1917, 2022. a
Reilinger, R. and McClusky, S.: Nubia–Arabia–Eurasia plate motions and the dynamics of Mediterranean and Middle East tectonics, Geophys. J. Int., 186, 971–979, 2011. a, b
Reilinger, R., McClusky, S., Vernant, P., Lawrence, S., Ergintav, S., Cakmak, R., Ozener, H., Kadirov, F., Guliev, I., Stepanyan, R., Nadariya, M., Hahubia, G., Mahmoud, S., Sakr, K., ArRajehi, A., Paradissis, D., Al-Aydrus, A., Prilepin, M., Guseva, T., Evren, E., Dmitrotsa, A., Filikov, S. V., Gomez, F., Al-Ghazzi, R., and Karamm, G.: GPS constraints on continental deformation in the Africa-Arabia-Eurasia continental collision zone and implications for the dynamics of plate interactions, J. Geophys. Res.-Solid, 111, B05411, https://doi.org/10.1029/2005JB004051, 2006. a, b, c
Reilinger, R., McClusky, S., Paradissis, D., Ergintav, S., and Vernant, P.: Geodetic constraints on the tectonic evolution of the Aegean region and strain accumulation along the Hellenic subduction zone, Tectonophysics, 488, 22–30, 2010. a
Richardson, R. M., Solomon, S. C., and Sleep, N. H.: Intraplate stress as an indicator of plate tectonic driving forces, J. Geophys. Res., 81, 1847–1856, 1976. a
Ritsema, J., Deuss, A. A., Van Heijst, H. J., and Woodhouse, J. H.: S40RTS: a degree-40 shear-velocity model for the mantle from new Rayleigh wave dispersion, teleseismic traveltime and normal-mode splitting function measurements, Geophys. J. Int., 184, 1223–1236, 2011. a
Robert, A. M., Fernàndez, M., Jiménez-Munt, I., and Vergés, J.: Lithospheric structure in Central Eurasia derived from elevation, geoid anomaly and thermal analysis, Geol. Soc. Lond. Spec. Publ., 427, 271–293, 2017. a
Sadeghi-Bagherabadi, A., Sobouti, F., Ghods, A., Motaghi, K., Talebian, M., Chen, L., Jiang, M., Ai, Y., and He, Y.: Upper mantle anisotropy and deformation beneath the major thrust-and-fold belts of Zagros and Alborz and the Iranian Plateau, Geophys. J. Int., 214, 1913–1918, 2018. a, b
SAGE: Data Services Products: EMC-EarthModels, SAGE [data set], http://ds.iris.edu/ds/products/emc-earthmodels/, last access: March 2022.
Sarkarinejad, K., Pash, R. R., Motamedi, H., and Yazdani, M.: Deformation and kinematic evolution of the subsurface structures: Zagros foreland fold-and-thrust belt, northern Dezful Embayment, Iran, Int. J. Earth Sci., 107, 1287–1304, 2018. a
Sattarzadeh, Y., Cosgrove, J. W., and Vita-Finzi, C.: The geometry of structures in the Zagros cover rocks and its neotectonic implications, Geol. Soc. Lond. Spec. Publ., 195, 205–217, 2002. a
Singh, A., Eken, T., Mohanty, D. D., Saikia, D., Singh, C., and Kumar, M. R.: Significant seismic anisotropy beneath southern Tibet inferred from splitting of direct S-waves, Phys. Earth Planet. Inter., 250, 1–11, 2016. a
Singh, S. and Ghosh, A.: Surface motions and continental deformation in the Indian plate and the India-Eurasia collision zone, J. Geophys. Res.-Solid, 124, 12141–12170, https://doi.org/10.1029/2018JB017289, 2019. a, b, c, d
Singh, S. and Ghosh, A.: The role of crustal models in the dynamics of the India–Eurasia collision zone, Geophys. J. Int., 223, 111–131, 2020. a, b, c, d, e, f, g
Sobouti, F. and Arkani-Hamed, J.: Numerical modelling of the deformation of the Iranian plateau, Geophys. J. Int., 126, 805–818, 1996. a
Sol, S., Meltzer, A., Burgmann, R., Van der Hilst, R., King, R., Chen, Z., Koons, P., Lev, E., Liu, Y., Zeitler, P., Zhang, X., Zhang, J., and Zurek, B.: Geodynamics of the southeastern Tibetan Plateau from seismic anisotropy and geodesy, Geology, 35, 563–566, 2007. a
Steinberger, B. and Holme, R.: Mantle flow models with core-mantle boundary constraints and chemical heterogeneities in the lowermost mantle, J. Geophys. Res.-Solid, 113, B05403, https://doi.org/10.1029/2007JB005080, 2008. a
Talebian, M. and Jackson, J.: Offset on the Main Recent Fault of NW Iran and implications for the late Cenozoic tectonics of the Arabia–Eurasia collision zone, Geophys. J. Int., 150, 422–439, 2002. a, b, c, d
Tatar, M. and Hatzfeld, D.: Microseismic evidence of slip partitioning for the Rudbar-Tarom earthquake (Ms 7.7) of 1990 June 20 in NW Iran, Geophys. J. Int., 176, 529–541, 2009. a
Tunini, L., Jiménez-Munt, I., Fernandez, M., Vergés, J., Villaseñor, A., Melchiorre, M., and Afonso, J. C.: Geophysical-petrological model of the crust and upper mantle in the India-Eurasia collision zone, Tectonics, 35, 1642–1669, 2016. a
Tunini, L., Jiménez-Munt, I., Fernandez, M., Vergés, J., and Bird, P.: Neotectonic deformation in central Eurasia: A geodynamic model approach, J. Geophys. Res.-Solid, 122, 9461–9484, 2017. a, b
Vernant, P., Nilforoushan, F., Hatzfeld, D., Abbassi, M., Vigny, C., Masson, F., Nankali, H., Martinod, J., Ashtiani, A., Bayer, R., Tavakoli, F., and Chéry, J.: Present-day crustal deformation and plate kinematics in the Middle East constrained by GPS measurements in Iran and northern Oman, Geophys. J. Int., 157, 381–398, 2004. a, b, c, d, e, f
Vincent, S. J., Allen, M. B., Ismail-Zadeh, A. D., Flecker, R., Foland, K. A., and Simmons, M. D.: Insights from the Talysh of Azerbaijan into the Paleogene evolution of the South Caspian region, Geol. Soc. Am. Bull., 117, 1513–1533, 2005. a
Walker, R. T.: A remote sensing study of active folding and faulting in southern Kerman province, SE Iran, J. Struct. Geol., 28, 654–668, 2006. a
Walpersdorf, A., Hatzfeld, D., Nankali, H., Tavakoli, F., Nilforoushan, F., Tatar, M., Vernant, P., Chéry, J., and Masson, F.: Difference in the GPS deformation pattern of North and Central Zagros (Iran), Geophys. J. Int., 167, 1077–1088, 2006. a, b
Walpersdorf, A., Manighetti, I., Mousavi, Z., Tavakoli, F., Vergnolle, M., Jadidi, A., Hatzfeld, D., Aghamohammadi, A., Bigot, A., Djamour, Y., Nankali, H., and Sedighi, M.: Present-day kinematics and fault slip rates in eastern Iran, derived from 11 years of GPS data, J. Geophys. Res.-Solid, 119, 1359–1383, 2014. a, b
Yadav, R. and Tiwari, V.: Numerical simulation of present day tectonic stress across the Indian subcontinent, Int. J. Earth Sci., 107, 2449–2462, 2018. a
Yaghoubi, A., Mahbaz, S., Dusseault, M. B., and Leonenko, Y.: Seismicity and the state of stress in the Dezful embayment, Zagros fold and thrust belt, Geosciences, 11, 254, https://doi.org/10.3390/geosciences11060254, 2021. a
Yang, Y., Liang, C., Fang, L., Su, J., and Hua, Q.: A comprehensive analysis on the stress field and seismic anisotropy in eastern Tibet, Tectonics, 37, 1648–1657, 2018. a
Zoback, M. L.: First-and second-order patterns of stress in the lithosphere: The World Stress Map Project, J. Geophys. Res.-Solid, 97, 11703–11728, 1992. a