the Creative Commons Attribution 4.0 License.
the Creative Commons Attribution 4.0 License.
 | 01 Sep 2023
Rapid hydration and weakening of anhydrite under stress: implications for natural hydration in the Earth's crust and mantle
David Healy
Nicholas E. Timms
Enrique Gomez-Rivas
Mineral hydration is an important geological process that influences the rheology and geochemistry of rocks and the fluid budget of the Earth's crust and mantle. Constant-stress differential compaction (CSDC) tests, dry and “wet” tests under confining pressure, and axial-stress tests were conducted for the first time to investigate the influence of triaxial stress on hydration in anhydrite–gypsum aggregates. Characterization of the samples before and after triaxial experiments was performed with optical and scanning electron microscopy, including energy-dispersive spectroscopy and electron backscatter diffraction mapping. Stress–strain data reveal that samples that underwent constant-stress differential compaction in the presence of fluids are ∼ 14 % to ∼ 41 % weaker than samples deformed under wet conditions. The microstructural analysis shows that there is a strong temporal and spatial connection between the geometry, distribution, and evolution of fractures and hydration products. The increasing reaction surface area in combination with pre-existing gypsum in a gypsum-bearing anhydrite rock led to rapid gypsification. The crystallographic orientations of newly formed vein gypsum have a systematic preferred orientation for long distances along veins, beyond the grain boundaries of wall-rock anhydrite. Gypsum crystallographic orientations in {100} and {010} are systematically and preferentially aligned parallel to the direction of maximum shear stress (45∘ to σ1). Gypsum is also not always topotactically linked to the wall-rock anhydrite in the immediate vicinity. This study proposes that the selective inheritance of crystal orientations from favourably oriented wall-rock anhydrite grains for the minimization of free energy for nucleation under stress leads to the systematic preferred orientation of large, new gypsum grains. A sequence is suggested for hydration under stress that requires the development of fractures accompanied by localized hydration. Hydration along fractures with a range of apertures up to 120 µm occurred in under 6 h. Once formed, gypsum-filled veins represent weak surfaces and are the locations of further shear fracturing, brecciation, and eventual brittle failure. These findings imply that non-hydrostatic stress has a significant influence on hydration rates and subsequent mechanical strength of rocks. This phenomenon is applicable across a wide range of geological environments in the Earth's crust and upper mantle.
- Article
(15493 KB) - Full-text XML
-
Supplement
(9100 KB) - BibTeX
- EndNote


The hydration of minerals and rocks is a common and important process in the Earth's crust and upper mantle that influences the dynamic evolution of rocks in terms of their mineral composition, fabrics, geochemistry, and rheology (e.g. Olgaard et al., 1995; De Paola et al., 2009; Llana-Fúnez et al., 2012; Leclère et al., 2018). However, hydration of rocks under non-hydrostatic-stress (rather than hydrostatic pressure) conditions has not been fully explored. Given the ubiquitous presence of non-hydrostatic-stress conditions in the Earth, this represents a significant knowledge gap for an important geological process.
Hydration of anhydrite to gypsum, also called gypsification, is of interest in several economic fields, including mining, oil, and gas as well as storage of hydrocarbons and hazardous and nuclear waste (e.g. Mertineit et al., 2012; Singh et al., 2018; Wang et al., 2020). It is also highly relevant in construction, as gypsum is a major cement and plaster ingredient (e.g. Farnsworth, 1925; Leininger et al., 1957; Sievert et al., 2005). Moreover, predicting anhydrite hydration is key in civil engineering because of the potential rock volume change related to the reaction (e.g. Sass and Burbaum, 2010; Singh et al., 2018). Additionally, reactions between gypsum and anhydrite have been studied in laboratory experiments as analogues of mantle minerals (Rutter et al., 2009; Llana-Fúnez et al., 2012; Leclère et al., 2016). Due to its relevance in those fields and because gypsification is also a very common mineral reaction in nature under surface conditions (e.g. Farnsworth, 1925; De Paola et al., 2007; Bedford, 2017), the CaSO4–H2O system has been studied scientifically for over 90 years. Furthermore, anhydrite-bearing evaporite sequences are often the weakest horizons in sedimentary basins and form detachment horizons in foreland fold-and-thrust belts (e.g. Heard and Rubey, 1966; Hildyard et al., 2011a). Therefore, processes that can potentially affect the mechanics of anhydrite-bearing evaporites, such as hydration, are significant because they potentially have control over the rheology and deformation behaviour of sedimentary basins and fold-and-thrust belts.
This study focuses on the influence of stress on hydration in the CaSO4 • H2O system (Fig. 1a), specifically the hydration of anhydrite (CaSO4, orthorhombic) to gypsum (CaSO4 • 2H2O, monoclinic), as an analogue for hydration systems in the Earth's crust and upper mantle. This is a simple geochemical system, and hydration is readily achievable under moderate laboratory conditions of temperature and pressure. Hydration of anhydrite under experimental differential-stress conditions using natural polycrystalline rocks has been studied only recently (Li et al., 2019; Xu et al., 2019; Wang et al., 2020), with a focus on the mechanical properties of anhydrite (Yin and Xie, 2019) and the complex expansion or swelling of theoretically up to 60 % volume increase associated with hydration (Serafeimidis and Anagnostou, 2013; Xu et al., 2019; Li et al., 2019). Additionally, long-term (several months long) hydration experiments, mainly on powders of sieved natural and synthetic anhydrite under hydrostatic conditions (water), have failed to produce hydration products or show relatively slow hydration rates (e.g. Ramsdell and Partridge, 1929; Leininger et al., 1957; Hardie, 1967). Laboratory experiments of hydration of anhydrite under an applied non-hydrostatic stress field with a focus on microstructural evolution have not yet been attempted. Consequently, the effects of stress on hydration remain to be assessed.
The study uses a conventional triaxial-deformation apparatus to investigate the rheological and microstructural response of natural anhydrite under wet and dry non-hydrostatic conditions and at different displacement rates. The ability to control parameters governing and influencing the reaction activity and kinetics of hydration of anhydrite to gypsum is essential to test the magnitude of their effects on the reactions. The following parameters were controlled: (i) mineralogy and microstructure, such as mineral content, grain size, and fabric; (ii) experimentally controllable physical and mechanical parameters, including temperature, fluid, effective and confining pressure, applied stress field, and displacement rate; and (iii) geochemical parameters like fluid composition.
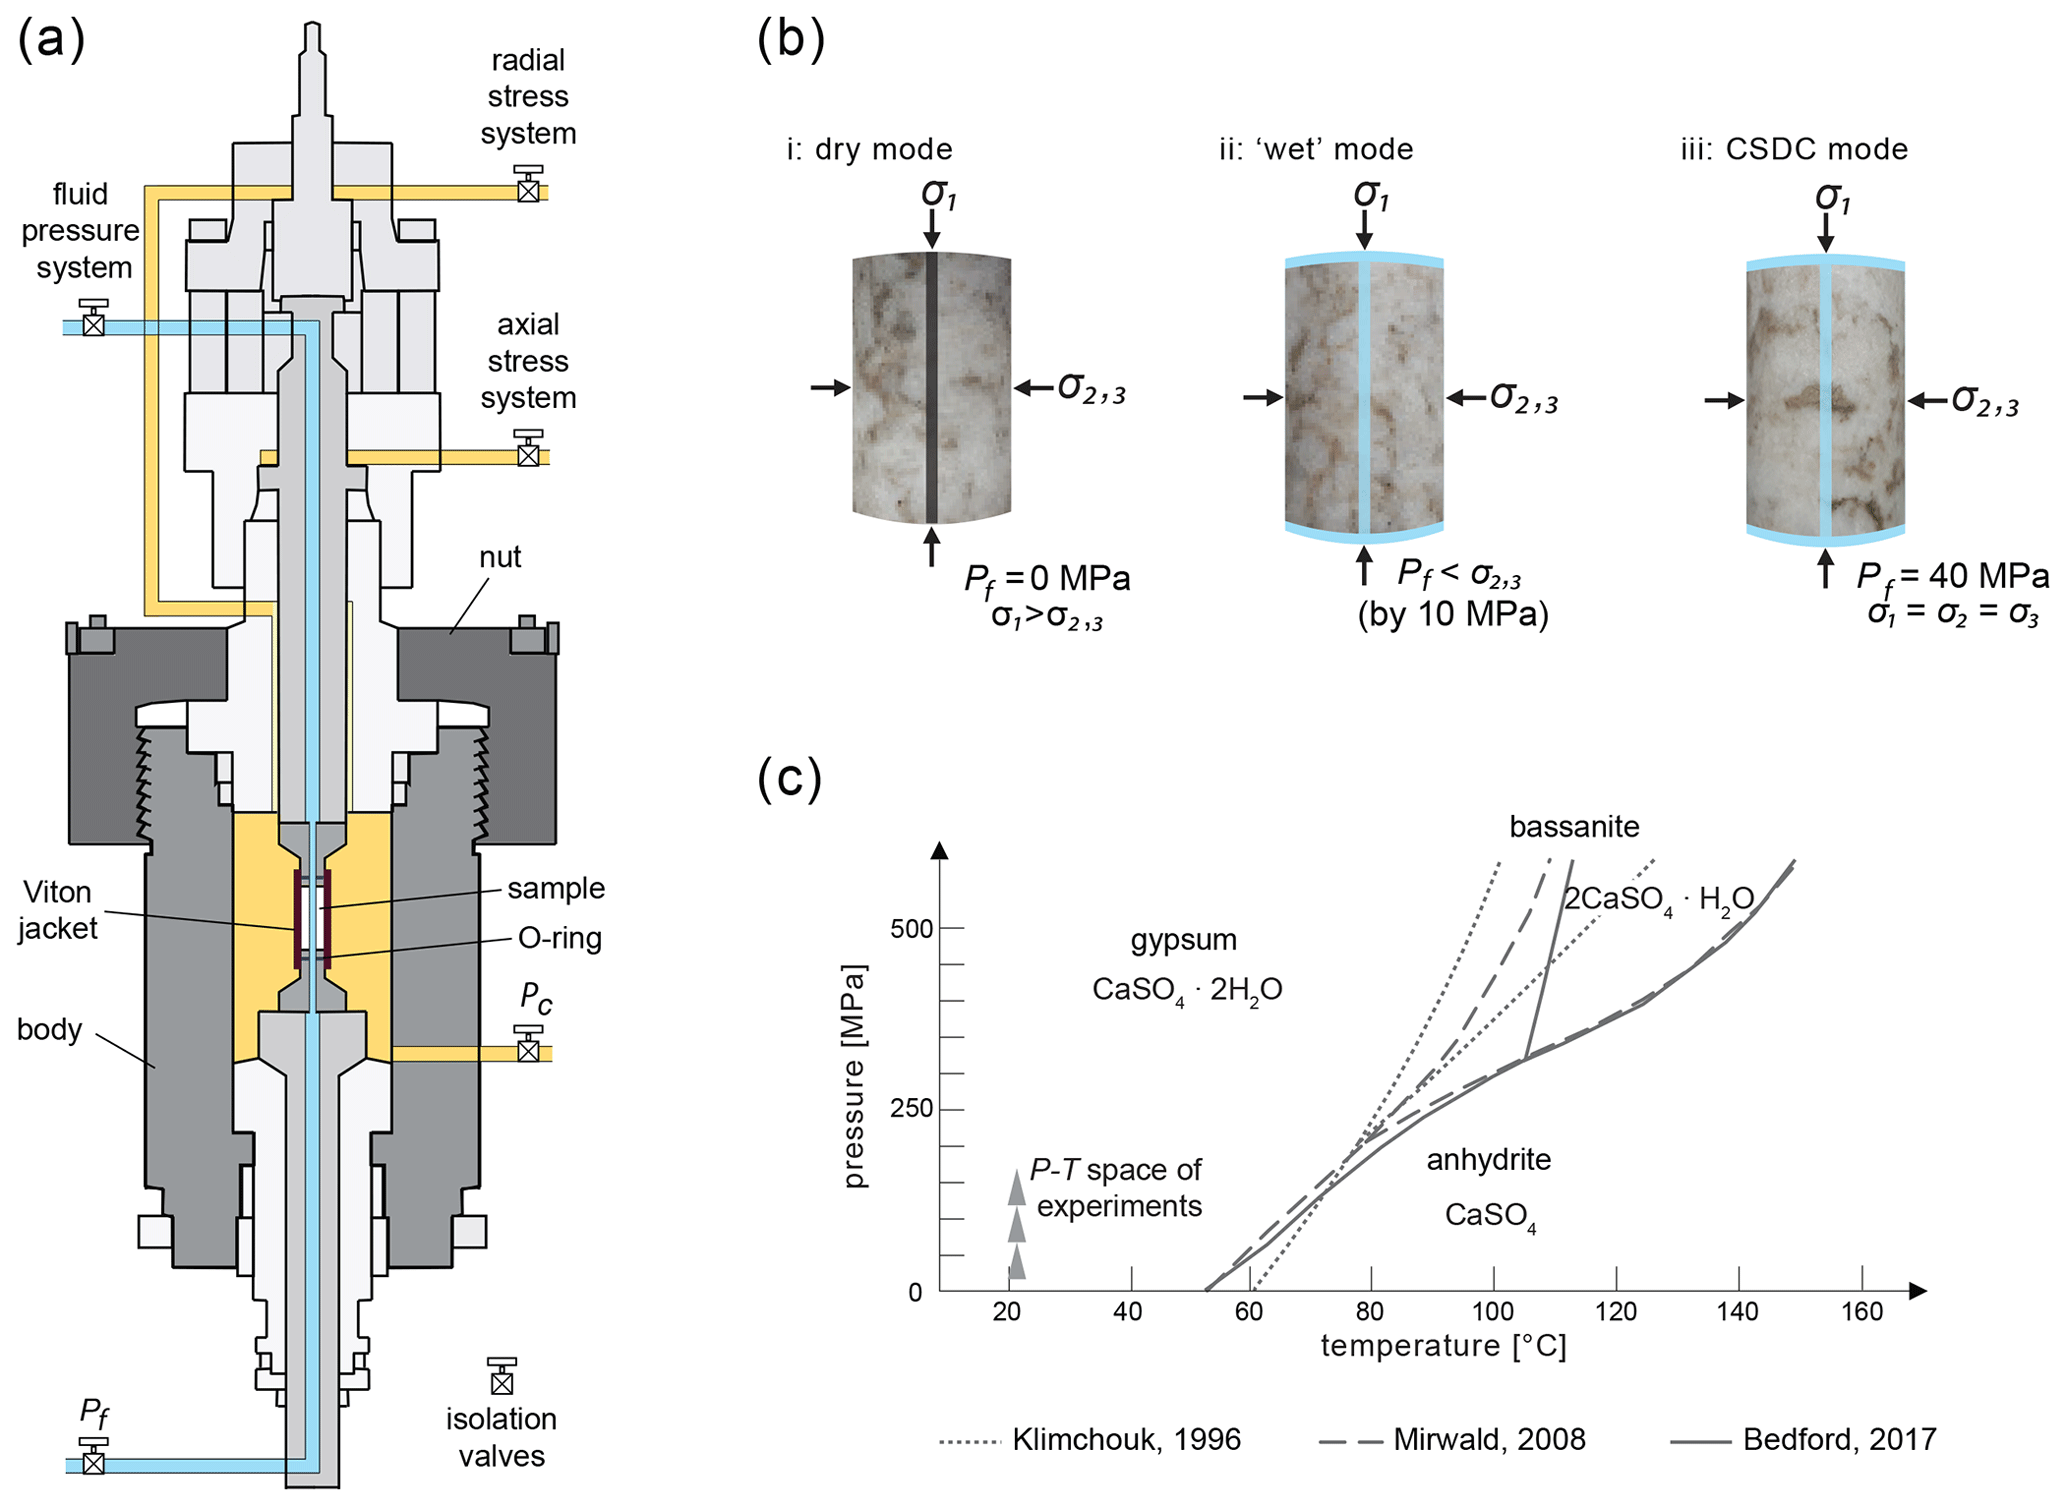
Figure 1Preparation and set-up for triaxial experiments. (a) Schematic diagram of the configuration of the triaxial-rock-deformation apparatus (Sanchez TRI-X 250 MPa/200 ∘C). (b) Experimental set-up for tests. (c) Phase diagram of the CaSO4–H2O system, adapted from Klimchouk (1996), Mirwald (2008), and Bedford (2017).
1.1 Review of research on the CaSO4–H2O system
Previous research on the interaction and evolution of stress, permeability, strength, and reaction kinetics in this chemical system has concentrated on the dehydration reaction of gypsum (Olgaard et al., 1995; Ko et al., 1995; 1997; Wang and Wong 2003; Milsch and Scholz, 2005; Milsch et al., 2011; Llana-Fúnez et al., 2012; Leclère et al., 2016; Marti et al., 2021; Schrank et al., 2021). Hydration of anhydrite to gypsum has been studied mainly with powders of sieved natural and synthetic anhydrite under hydrostatic conditions (e.g. Leininger et al., 1957; Hardie, 1967; Sievert et al., 2005). Hardie (1967) studied the influence of temperature on pure anhydrite powders with different grain sizes in experiments lasting about 8 months at different temperatures between 25–60 ∘C without recording hydration. Only the addition of gypsum “seeds” under similar conditions induced relatively rapid hydration. A 1:1 mixture of polycrystalline anhydrite and gypsum produced 3 % more gypsum after 83 d (Hardie, 1967).
Evolution of strength, stress–strain behaviour, permeability as well as the role of grain size and fabric without any hydration or dehydration reaction in gypsum and anhydrite has been studied by Bell (1994) and De Paola et al. (2009). Bell (1994) found that anhydrite has a “strong” unconfined compressive strength (102.9 and 97.5 MPa for two types of anhydrites), whereas gypsum is ranked as having “medium” properties (average ranges between 24.1 and 34.8 MPa, depending on the pressure). Based on the stress vs. strain behaviour, Bell (1994) found that the onset of plastic deformation occurs at an earlier stage during axial loading for gypsum compared to anhydrite. Effective pressure has a significant effect on the permeability evolution under confined-stress conditions and controls the brittle-to-ductile transition of pure polycrystalline anhydrite during deformation (De Paola et al., 2009). During brittle failure, permeability increased dynamically by about 2 to 3 orders of magnitude. The dynamic permeability and porosity evolution during the triaxial-loading tests can be summarized in three stages: (i) permeability and volume reduction through compaction in progress, (ii) permeability increase due to the onset of intra-granular micro-cracking, and (iii) volume increase (dilation) and brittle failure (De Paola et al., 2009). The strength of dry anhydrite cap rock during triaxial tests increased with increasing confining pressure and slightly weakened with increasing temperature, whereas fluid contact prior to failure changed the effective pressure and lowered the strength, but not the volumetric (permeability) behaviour (Hangx et al., 2010, 2011).
1.2 Mechanisms of anhydrite hydration
Petrographic observations from natural rocks and experimental studies indicate that the mechanisms behind hydration (and dehydration) are (dis)solution–precipitation and direct replacement with additional water available (Hardie, 1967; Sievert et al., 2005; Jaworska and Nowak, 2013; Bedford, 2017). Secondary gypsum is produced initially in the most fractured areas of anhydrite rocks and forms along cracks and grain boundaries (Jaworska, 2012; Warren, 2016). Leininger et al. (1957) studied the effect of acids, bases, and salts, particularly alkali sulfates, and showed that cations serve as activators and accelerate the hydration of gypsum, whereas anions decelerate the reaction. Activator solutions speed up the time for the appearance of maximum specific surface area and the rate of formation of maximum gypsum.
Sievert et al. (2005) developed a conceptual model for solution–precipitation that is now widely accepted (Pina, 2009; Jaworska and Nowak, 2013; Lebedev and Avilina, 2019). Hydration experiments of natural anhydrite in a ball mill with water and activator solutions, such as H2SO4 (pH 1), 5 % MgSO4 • 7H2O, and a solution of calcium hydroxide, show that the maximum specific surface area develops quickly and does not coincide with the formation rate of the maximum amount of gypsum, which takes rather longer to achieve. There is a time lag between adsorption of ions on the surface of anhydrite, which increases the specific surface area, and the formation of gypsum. Sievert et al. (2005) proposed a five-step mechanism of hydration via solution–precipitation: (i) rapid initial partial dissolution of CaSO4 and adsorption of hydrated Ca2+ and SO ions at the surface of anhydrite, (ii) slow increase in thickness of the adsorbed layer, (iii) crack formation in the adsorbed layer and counter-migration of H2O (in) and Ca2+ and SO ions (out), (iv) formation of gypsum nuclei at the surface of anhydrite, and (v) formation of nuclei followed by rapid gypsum crystallization.
2.1 Sample description and preparation
A total of eight natural-anhydrite core plugs were used for the triaxial experiments. Six samples were run with water present, and two were run without the presence of water. The core plugs were extracted from two anhydrite-dominated surface outcrop field samples of the Òdena Gypsum Formation. This is the marginal equivalent of the salt deposits of the Cardona Saline Formation (upper Eocene) in the southern Pyrenean foreland basin in Spain (Ortí Cabo et al., 1985).
Macroscopically, the Òdena samples are of a pale beige colour with discrete centimetre-scale domains that contain light-brown clay or mud inclusions (Fig. 2a). The anhydrite rocks have minor natural-gypsum content of approximately 10 % to 15 %. All samples show fibro-radiate crystals of anhydrite (Fig. 2b, c). These spherulites appear either isolated or arranged in centimetre-long bands. Microscopically, gypsum is located in between the anhydrite blades of the spherulites in veins (up to 10 µm in aperture), in the spherulite centres, and in between spherulites in broader fractures (up to 50 µm in aperture) and in the centre of the band structures. Electron backscatter diffraction (EBSD) analysis shows that the crystal orientation in the spherulite “blades” changes successively with radial rotation, with lattice orientation being mirrored from the centre (Fig. 2d). The statistical description of the intensity of the fabric based on clustering of poles on pole figures, known as the “multiple of uniform density” (m.u.d.), was calculated. A crystallographic preferred orientation, or CPO, exists where m.u.d. > 1.
One additional core of pure gypsum was taken from an outcrop from Volterra, Italy, to compare the stress–strain behaviour and strength of anhydrite-dominated vs. gypsum-dominated rocks. Volterra gypsum is a well-studied polycrystalline material (Heard and Rubey, 1966; Ko et al., 1997; Llana-Fúnez et al., 2012) and has been used in many experiments (e.g. Olgaard et al., 1995; Hildyard et al., 2011b; Brantut et al., 2012). As required for the triaxial apparatus, cores with a length (x axis) of 60 mm and a diameter of 25 mm (y and z dimension) were drilled out of sample blocks. Given that the sample material does not display any preferred orientation fabric at the macroscale and was collected from an outcrop, cores were drilled perpendicular to the bedding. The Volterra gypsum is homogeneous with no foliation; thus the orientation of the core from this material is arbitrary.
Core plugs were drilled in the presence of water and were air-dried for 24 h immediately afterward to mitigate any potential alteration effects. It was presumed that the time of exposure to water under ambient laboratory conditions did not permit hydration of the anhydrite before deformation experiments. Pre- and post-experiment analysis of thin sections validates this assumption. A hole was then drilled (dry) into the centre of the anhydrite cores along the x axis using a drill head with a diameter of 1.5 mm through the axis of each core to increase fluid flow and sample surface to facilitate faster and more intense hydration. All core plugs intended to be used in the experiment with fluid pressure were immersed in water and left to soak 10 min before starting experimental runs. Core plugs were prepared for triaxial experiments by encapsulation in Viton™ elastomer jackets to ensure a seal is formed during the experiments that shields the sample from the oil used to generate confining pressure in the cell.
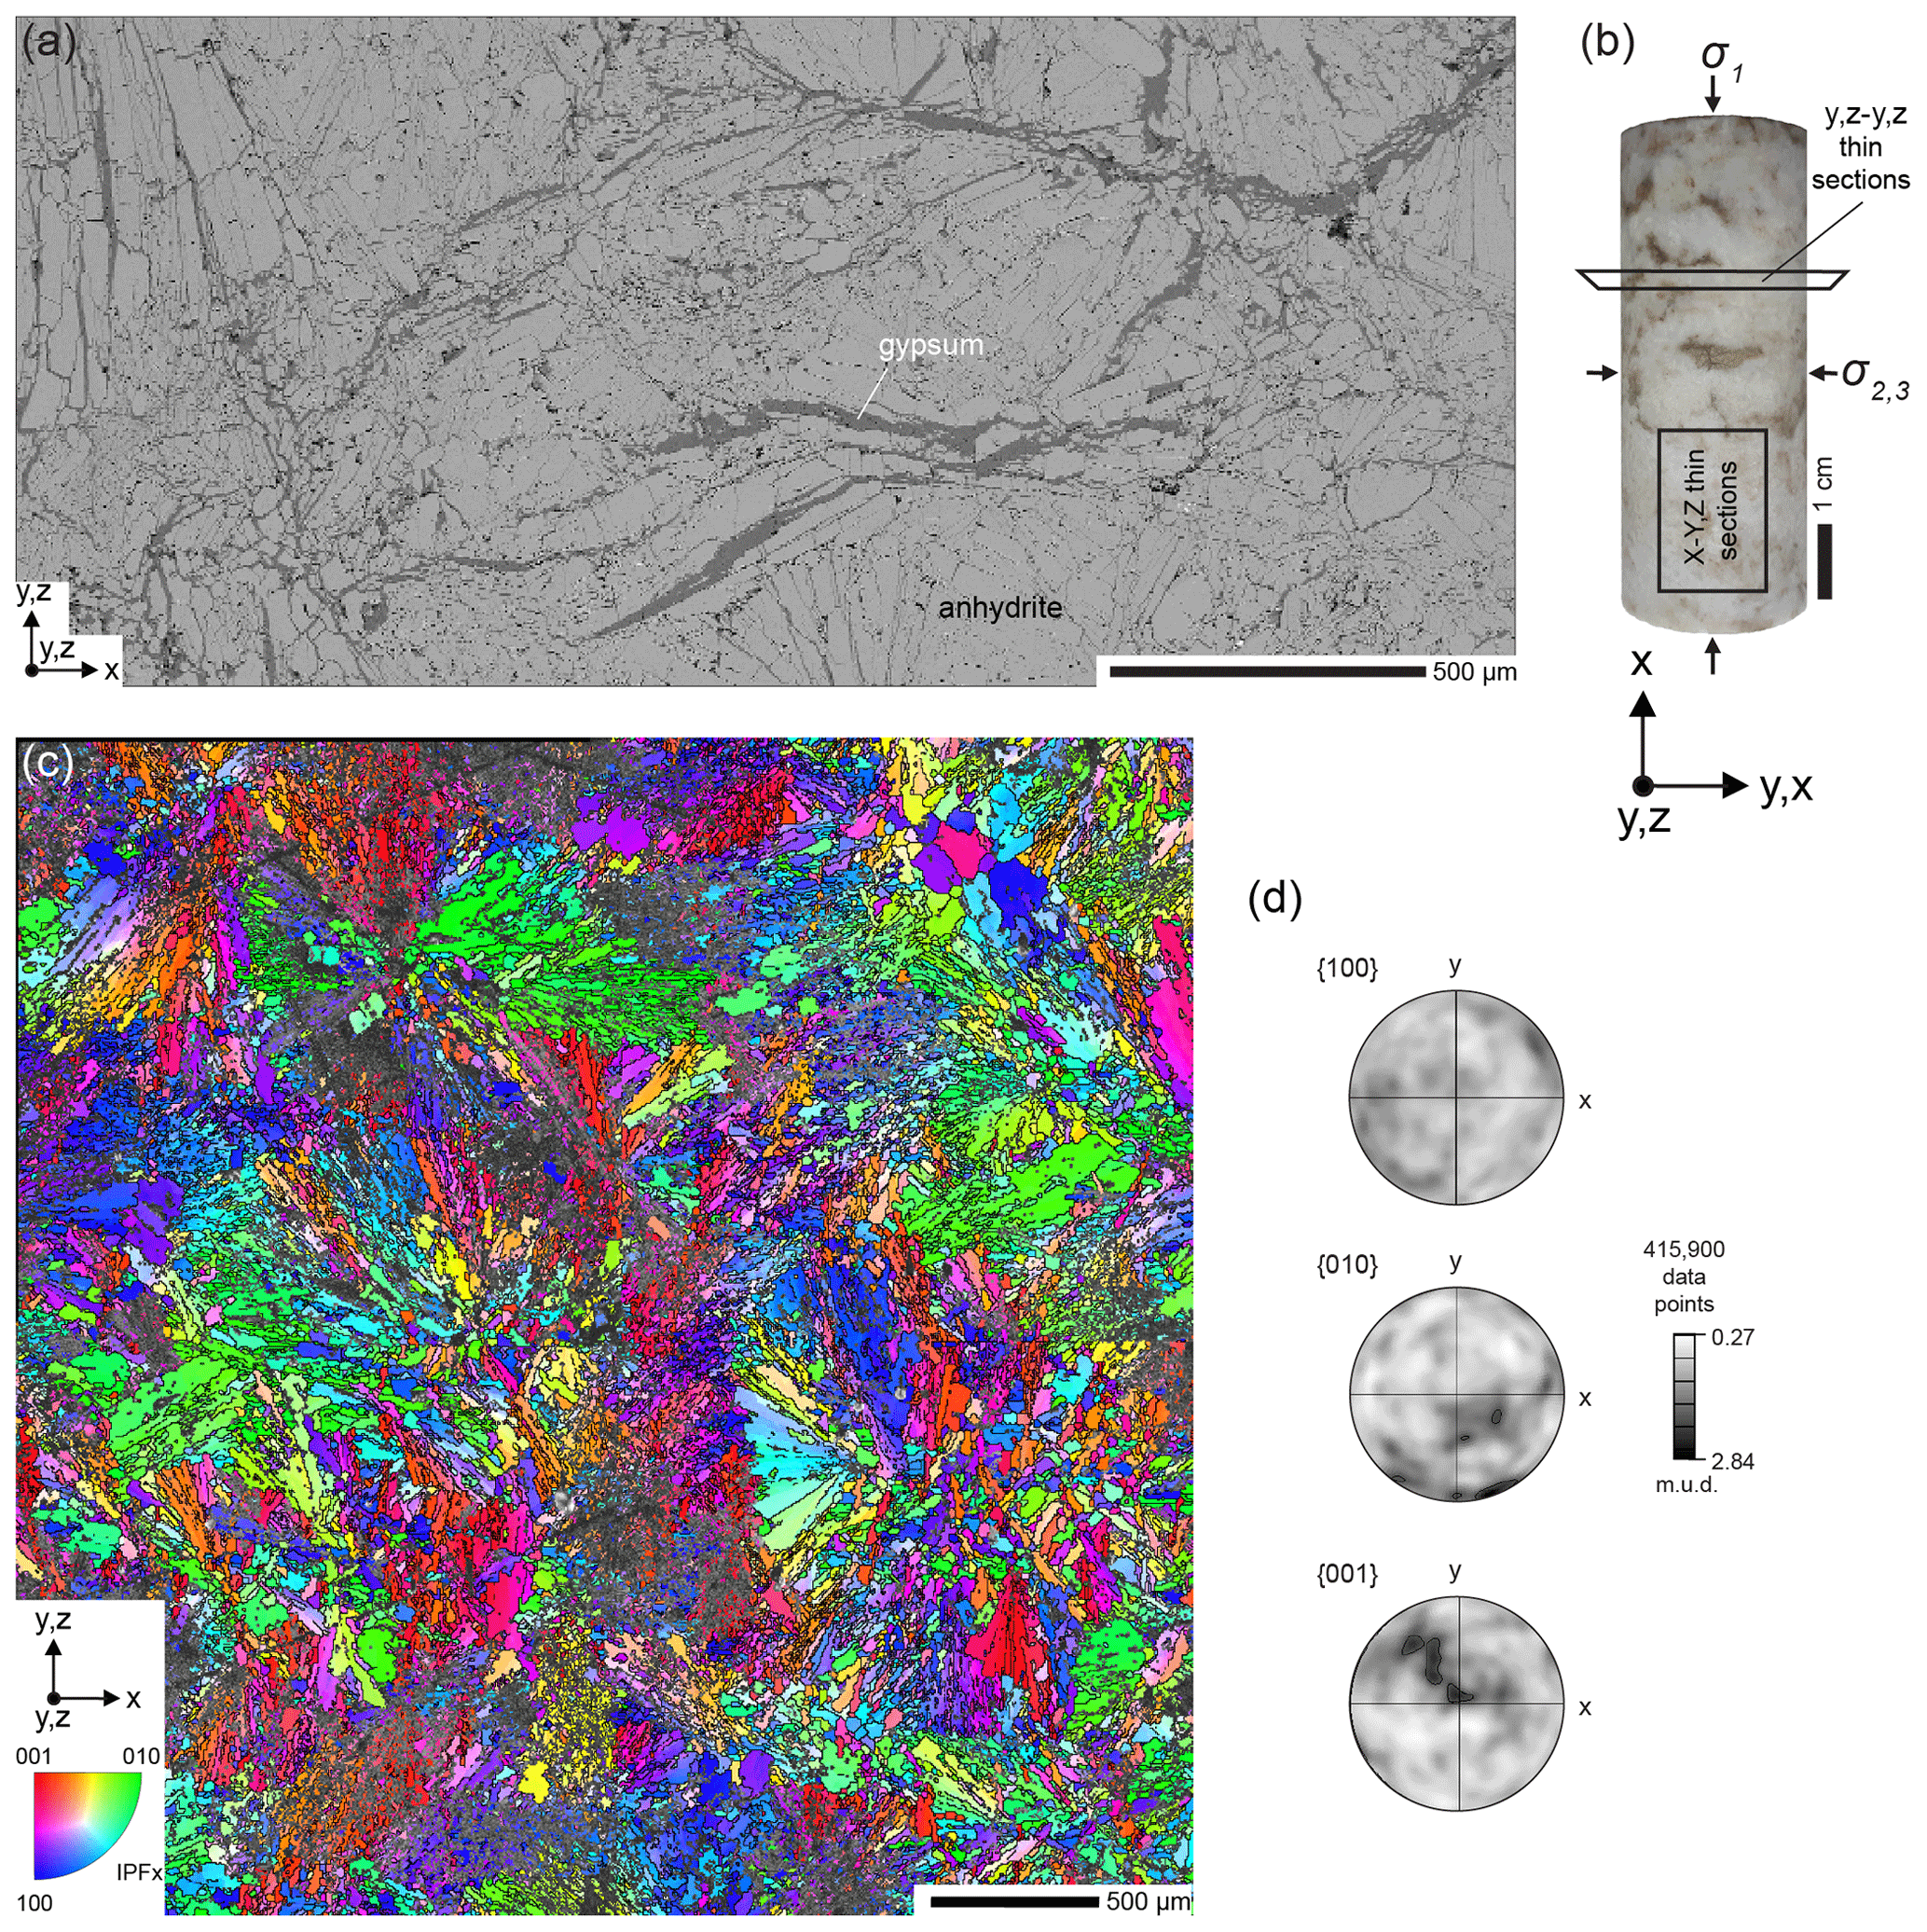
Figure 2Macro- and microscopic characterization of the sample material. (a) Axial orientation of cylindrical samples, whereby the long axis is defined as x, and perpendicular directions are y and z (sample H2, pre-experiment); (b) backscattered electron image (sample D2, post-experiment); (c) crystallographic-orientation EBSD map of anhydrite (sample block, initial material). Colours indicate orientation using an inverse-pole-figure scheme relative to the map's x direction (IPFx). Step size = 4 µm. (d) Contoured equal area. Lower-hemisphere pole figures of anhydrite data are shown in (c). Plots are oriented in the reference frame (x, y, z) of the EBSD maps. Greyscale indicates multiples of uniform density (m.u.d.).
All samples were analysed before and, where possible, after triaxial-loading tests under confining pressure via scanning electron microscopy using backscattered electron (BSE) imaging, energy-dispersive X-ray spectroscopy (EDS), and EBSD. Grain and fracture characteristics and mineral content were analysed via a range of software, including FracPaQ (Healy and Rizzo, 2017; Healy et al., 2017), ImageJ (Rasband, 1997; Schneider et al., 2012), and Oxford Instruments Channel 5 for EBSD data processing.
2.2 Microstructural characterization
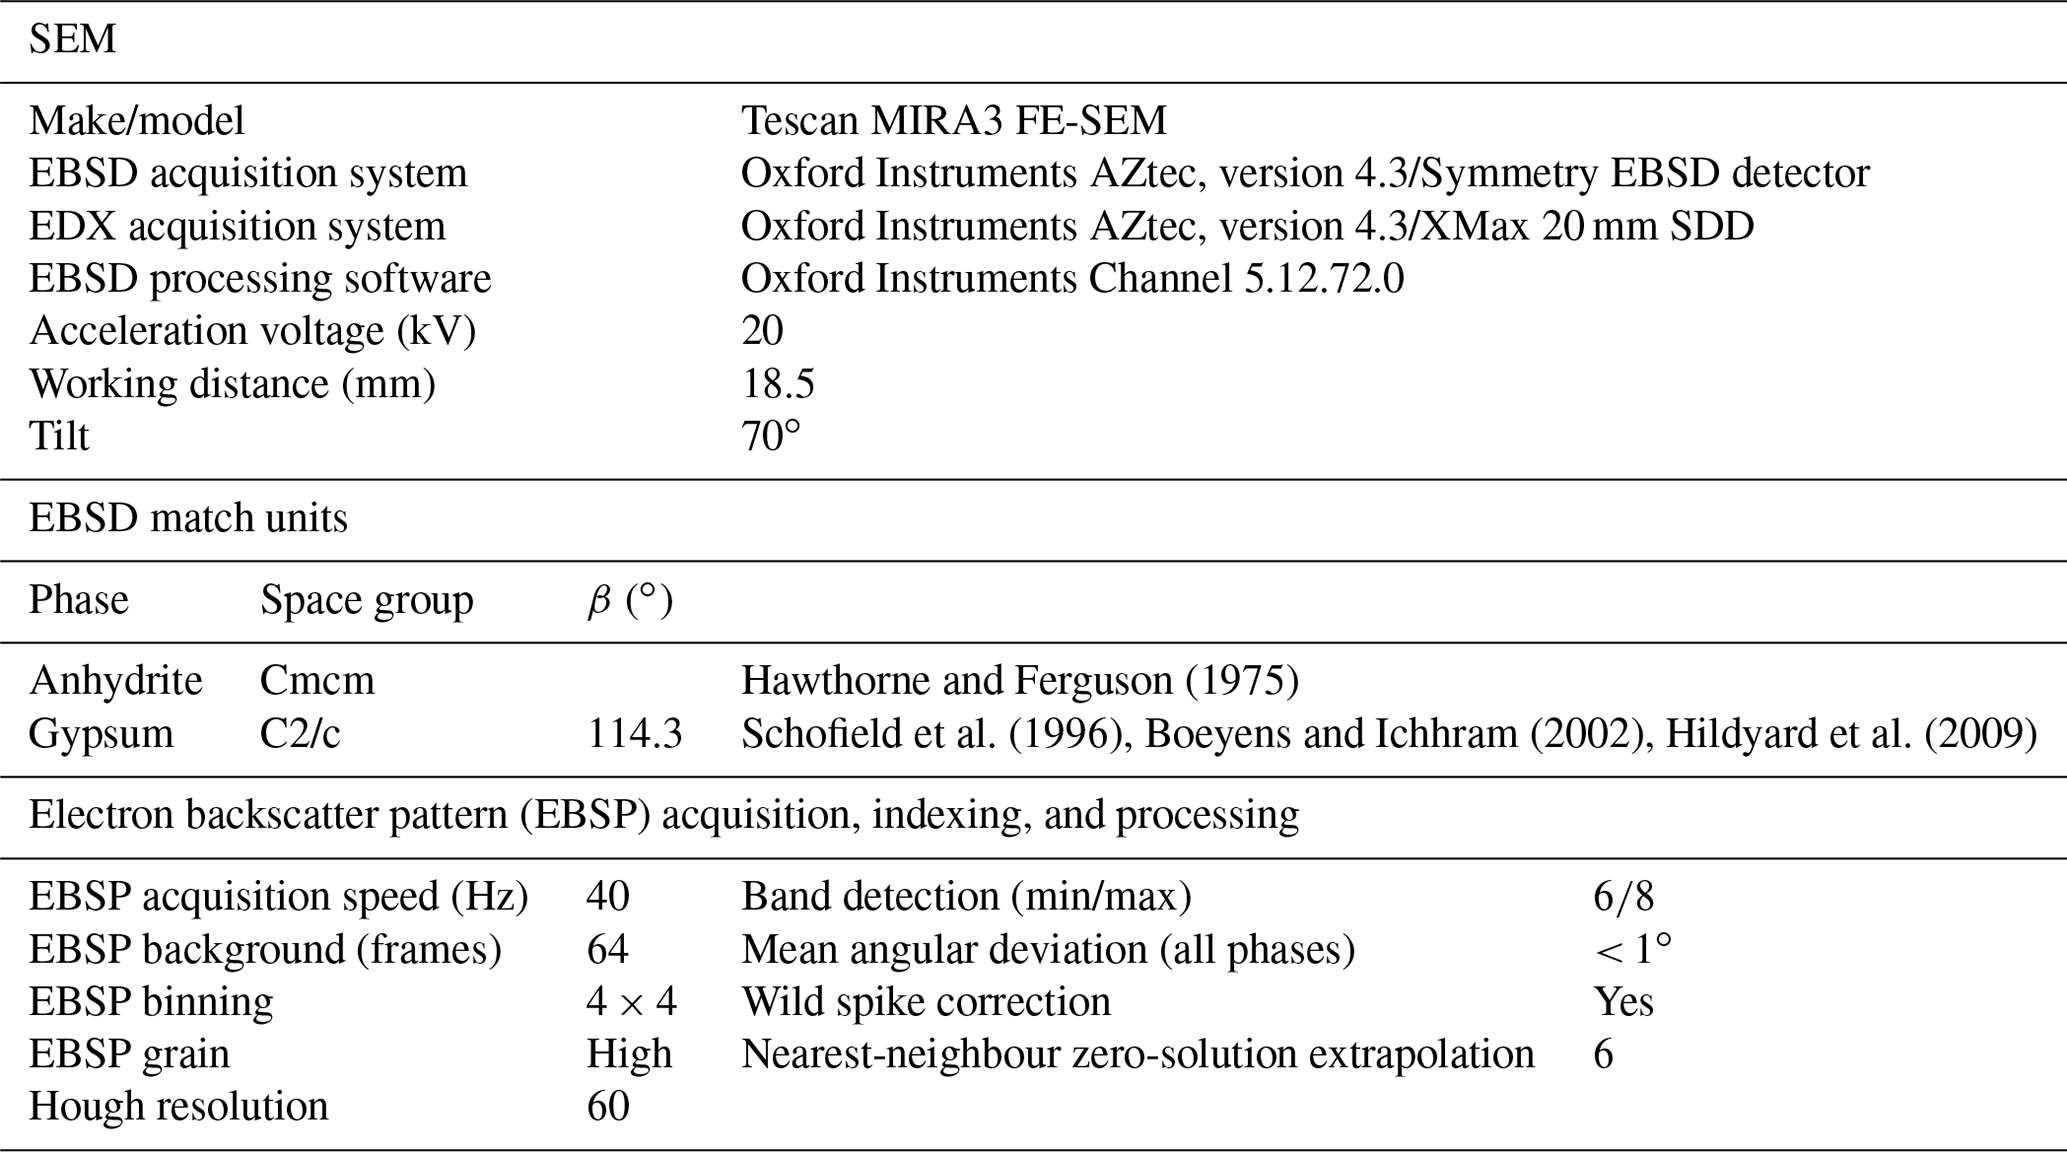
Surplus material sourced directly adjacent to the core plugs was used to prepare polished thin sections in the core plug reference frame x–y, z and x= y, z–y, and z directions before starting any experiment. Thin sections of the samples taken after experiments were cut approximately parallel to the x axis (i.e. parallel to σ1). Thin sections were prepared for scanning electron microscopy (SEM) by polishing with alumina, followed by a final polish with 0.6 µm colloidal silica in NaOH using a Buehler VibroMet II polisher for 2 to 4 h. An evaporative carbon coating was applied to prevent charging during SEM. BSE imaging was conducted with a Zeiss EVO MA10 SEM fitted with an Oxford Instruments INCA X-ray microanalysis system. A Tescan MIRA3 field emission scanning electron microscope (FE-SEM) at the John de Laeter Centre at Curtin University with an Oxford Instruments EBSD acquisition system, including a Symmetry EBSD detector, was used to quantify crystallographic microstructures.
Secondary electron (SE) and BSE images were acquired, and EBSD maps with step sizes ranging from 1.7 to 50 µm were collected. Data acquisition and processing settings as well as processing procedures (Table 1) followed those of Vargas-Meleza et al. (2015) and Timms et al. (2017, 2019). Isolated, erroneous EBSD data points were removed using a “wild spike” correction in Channel 5, and a zero-solution infill to six nearest-neighbour extrapolations was applied routinely. Mis-indexing of anhydrite with a range of systematic-crystallographic-orientation relationships was identified, and data were corrected using the function in the Tango module of Channel 5.
For phase quantification, BSE images were combined with energy dispersive spectroscopy (EDS) phase identification data and analysed with ImageJ software (Rasband, 1997; Schneider et al., 2012) using a greyscale threshold to determine phase abundance. Minor uncertainties of this approach include greyscale variation at phase boundaries and/or due to the topography of the polished surface. Additionally, fracture patterns in post-experiment sample material were quantified by manual digital tracing of gypsum-filled fractures and veins in BSE images followed by FracPaQ analysis of orientation and length of the mapped linear-fracture trace segments (Healy and Rizzo, 2017; Healy et al., 2017).
Table 1Scanning-electron-microscopy settings and electron-backscatter-diffraction acquisition and processing parameters.
2.3 Experimental methods of triaxial deformation and hydration
All testing was conducted with the high-pressure, high-temperature (HP–HT) triaxial-rock-deformation apparatus (TRI-X 250 MPa/200 ∘C) from Sanchez Technologies at the University of Aberdeen (Fig. 1b). The parameters chosen for testing are listed in Table 2. The experiments followed three different testing modes: (i) dry, (ii) “wet”, and (iii) constant-stress differential compaction (CSDC) (Fig. 1c). The principal stress configuration was σ1 > σ2=σ3 throughout runs in modes (i) and (ii) and achieved through the application of an axial load (“active” deformation). The (i) dry and (ii) wet modes were created to evaluate material strength and stress vs. strain behaviour for the sample material with different axial-load and pressure settings.
During wet-mode tests, fluid pressure was applied before initiating the axial load. In the case of constant-stress differential compaction, the axial load (i.e. displacement rate) was put on hold after achieving ∼ 100 MPa differential stress (75 % yield stress of the wet experiments W3 and W4) to achieve micro-cracking, and before coalescing shear fractures are supposed to have formed. Only then was water flooded into the sample chamber and fluid pressure applied. The principal stress configuration was hydrostatic, i.e. σ3. If failure was not achieved within 6 h of starting CSDC, the same axial load was reapplied, which reinstated the respective differential-stress field. At the end of each experiment of modes (ii) and (iii) the Viton™ jackets were opened, and the samples were placed in an oven at 50 ∘C for ∼ 30 min to prevent any further hydration from proceeding.
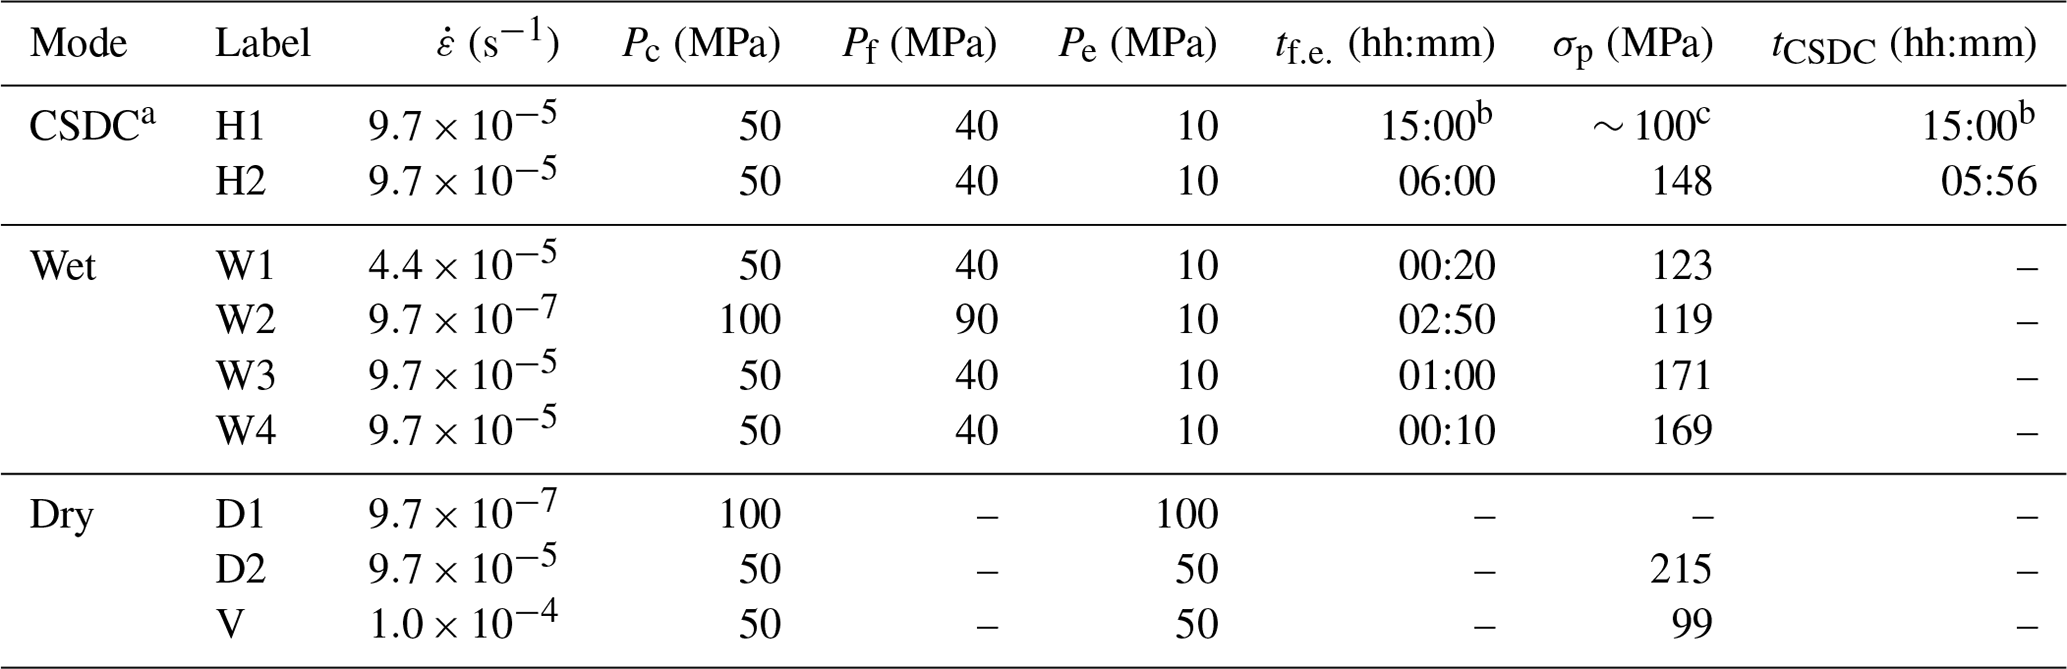
Table 2Triaxial-test parameters: – strain rate (corresponding to the applied axial load at the beginning of a test), Pc – confining pressure, Pf – fluid pressure, Pe – effective pressure, – fluid exposure time, tCSDC – CSDC time, σp – peak differential stress. a Fluid pressure is applied only after reaching a differential stress of ∼ 100 MPa. b Catastrophic failure after 1 h 11 min during constant-stress differential compaction. c Peak stress reached during constant-stress differential compaction.
3.1 Laboratory triaxial-deformation tests – mechanical data
3.1.1 Macroscopic sample characteristics
Brittle fractures are readily visible in the post-test cores, with different characteristics depending on the deformation mode (Fig. 3a). All samples deformed in dry mode show bulging around the middle of the x axis. The bulging zone shows intense fracturing via two sets of shear fractures, each with an approximate angle of 30∘ to σ1. Most of the samples experienced localized failure. Samples after the wet testing mode show intense fracturing. The fractures follow the same pattern described for the dry samples, i.e. macroscopic shear fractures. The main shear faults after CSDC are characterized by an area of intense fracturing filled with brecciated material. The resulting lateral chips are either not faulted or extremely faulted compared to the dry- and wet-test samples. Altogether, the pieces resulting from fracturing seem smaller in size and are coated by a pale-grey, soft, viscous layer.
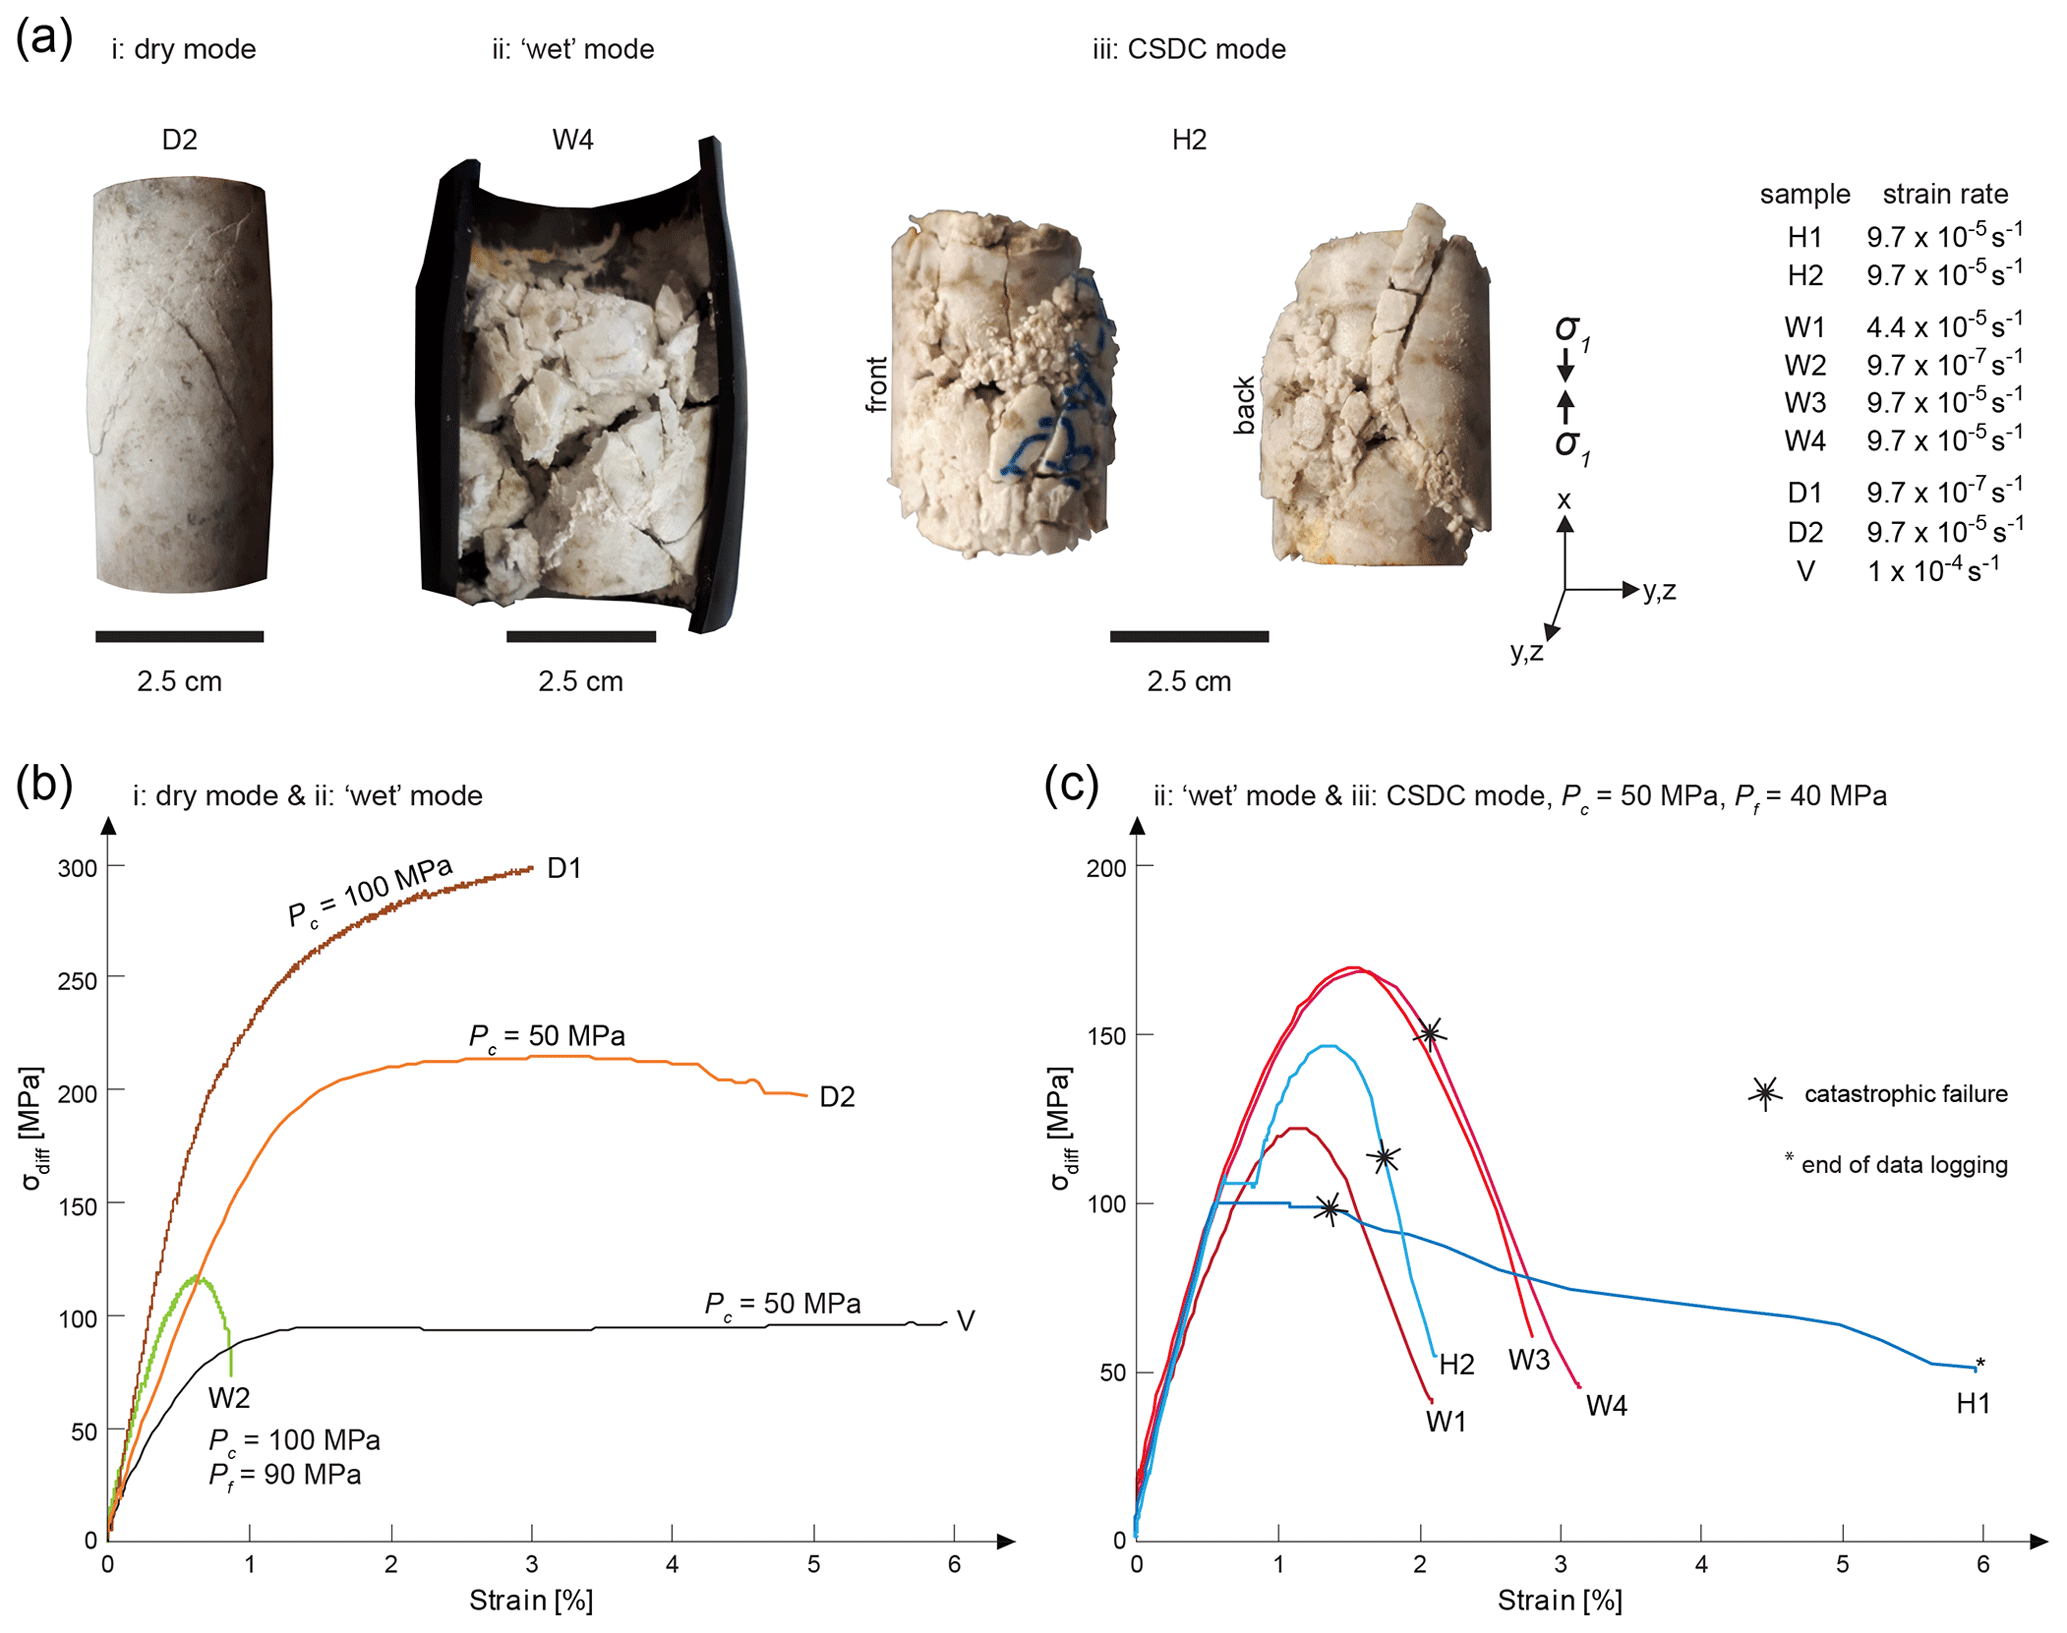
Figure 3Post-experimental mechanical results. (a) Photographs of post-experiment cores after undergoing all three test modes. (b) Stress vs. strain curves or all dry-mode tests and a single wet-mode test, deformed under different conditions from the other wet-mode test and the two CSDC-mode tests, shown in (c). Strain (%) in the shortening direction x (σ1) on the x axis is plotted against differential stress (σdiff, axial stress/radial pressure) on the y axis. Catastrophic failure marked for H1 at the point of a rapid increase in stable strain during constant-stress differential compaction (CSDC) phase (no displacement rate applied, stable confining and fluid pressure).
3.1.2 Mechanical data
The different loading modes produced distinctly different deformation behaviour, as shown in the differential-stress vs. axial-strain curves (Fig. 3b, c). Loading after yield stress results in different behaviour, depending on the test mode.
Dry tests showed either strain hardening (sample D1) or a phase of constant differential stress with increasing strain and with an increasing tendency to slightly weaken (sample D2). The Volterra gypsum is considerably weaker compared to all anhydrite tests. The linear elastic response is limited to stresses and strains below 40 MPa and 0.25 %, respectively. The stress–strain relationship of the dry tests shows neither strain hardening nor softening and is without any sign of failure during the ongoing test. The wet tests show considerably weaker behaviour compared to the dry tests. Strain weakening or softening was displayed after reaching peak differential strength (Table 2). The wet experiments were stopped when steep catastrophic strain weakening happened.
The CSDC experiments behaved similarly to wet and dry experiments during the first stages until the axial load was set to constant before the yield point was reached (∼ 100–110 MPa), and fluid pressure was applied (20–90 MPa; Table 2) in under 1 min. Sample H1 was stable with increasing strain for about 1 h before catastrophic failure at 1.35 % strain and 99 MPa differential stress. Catastrophic failure occurred under higher-differential-stress and lower-strain conditions than wet tests under the same conditions, and H2 showed steep catastrophic strain weakening. During the CSDC phase, strain increased, and the stress conditions were stable for sample H2. Compared with samples W3 and W4, which were run with the same displacement rate, H2 is weaker, and differential strain decreases more steeply.
3.2 Microstructures
3.2.1 Analysis of fracture and gypsum-filled vein pattern
A fracture pattern was analysed for gypsum-filled veins from BSE images of a thin section from wet-mode sample W1. This sample failed with one main shear fracture (Fig. 4), which left enough solid material for detailed analysis of a wet-mode sample. Mapping of gypsum-filled veins in a part of the sample that features a significant vein system yielded a representative dataset for orientation analysis of all gypsum veins in view with apertures > 25 µm and of a sufficient dataset of identifiable < 25 µm wide narrow gypsum-filled veins.
Orientation analysis of all gypsum-filled fracture segments in 2D shows a preferred orientation with a prominent peak close to 30∘ from the core axis (and therefore to σ1) of all aperture classes (Fig. 4c). The wider, less abundant cracks and gypsum-filled veins show stronger preferred orientations than narrower cracks and veins and those observed in the pre-experiment undeformed Òdena anhydrite. The preferred orientation of > 25 µm gypsum-filled veins is like that of shear- and extensional-fracture orientations predicted by the orientation of the applied stress field during the experiment: macroscopic fractures visible in this thin section that were created by the triaxial test should have azimuths of either 30∘/210∘ or 150∘/330∘ relative to x, the direction of the principal stress σ1 (Fig. 4). However, gypsum infill implies an extensional component to the kinematics of these structures (extensional or hybrid shear). In detail, there are two different preferred orientations dominant in fracture populations of different widths. Veins narrower than 25 µm are almost evenly distributed around 1 % for all directions, with the exception of a distinct peak around 45∘ anti-clockwise from x (Fig. 4c). This peak coincides with the trend of cleavage in a large anhydrite grain that dominates the lower part of the map.
Analysis of gypsum-filled vein segments with widths in the ranges of 25–50, 50–100, and > 100 µm show that the preferred orientation becomes stronger with increasing width of the veins (the standard deviation of circular mean decreases) (Fig. 4c). Furthermore, the length of segment traces increases (average segment lengths for the ranges increase from 48.34 to 74.43 to 102.11 µm) with increasing vein width.
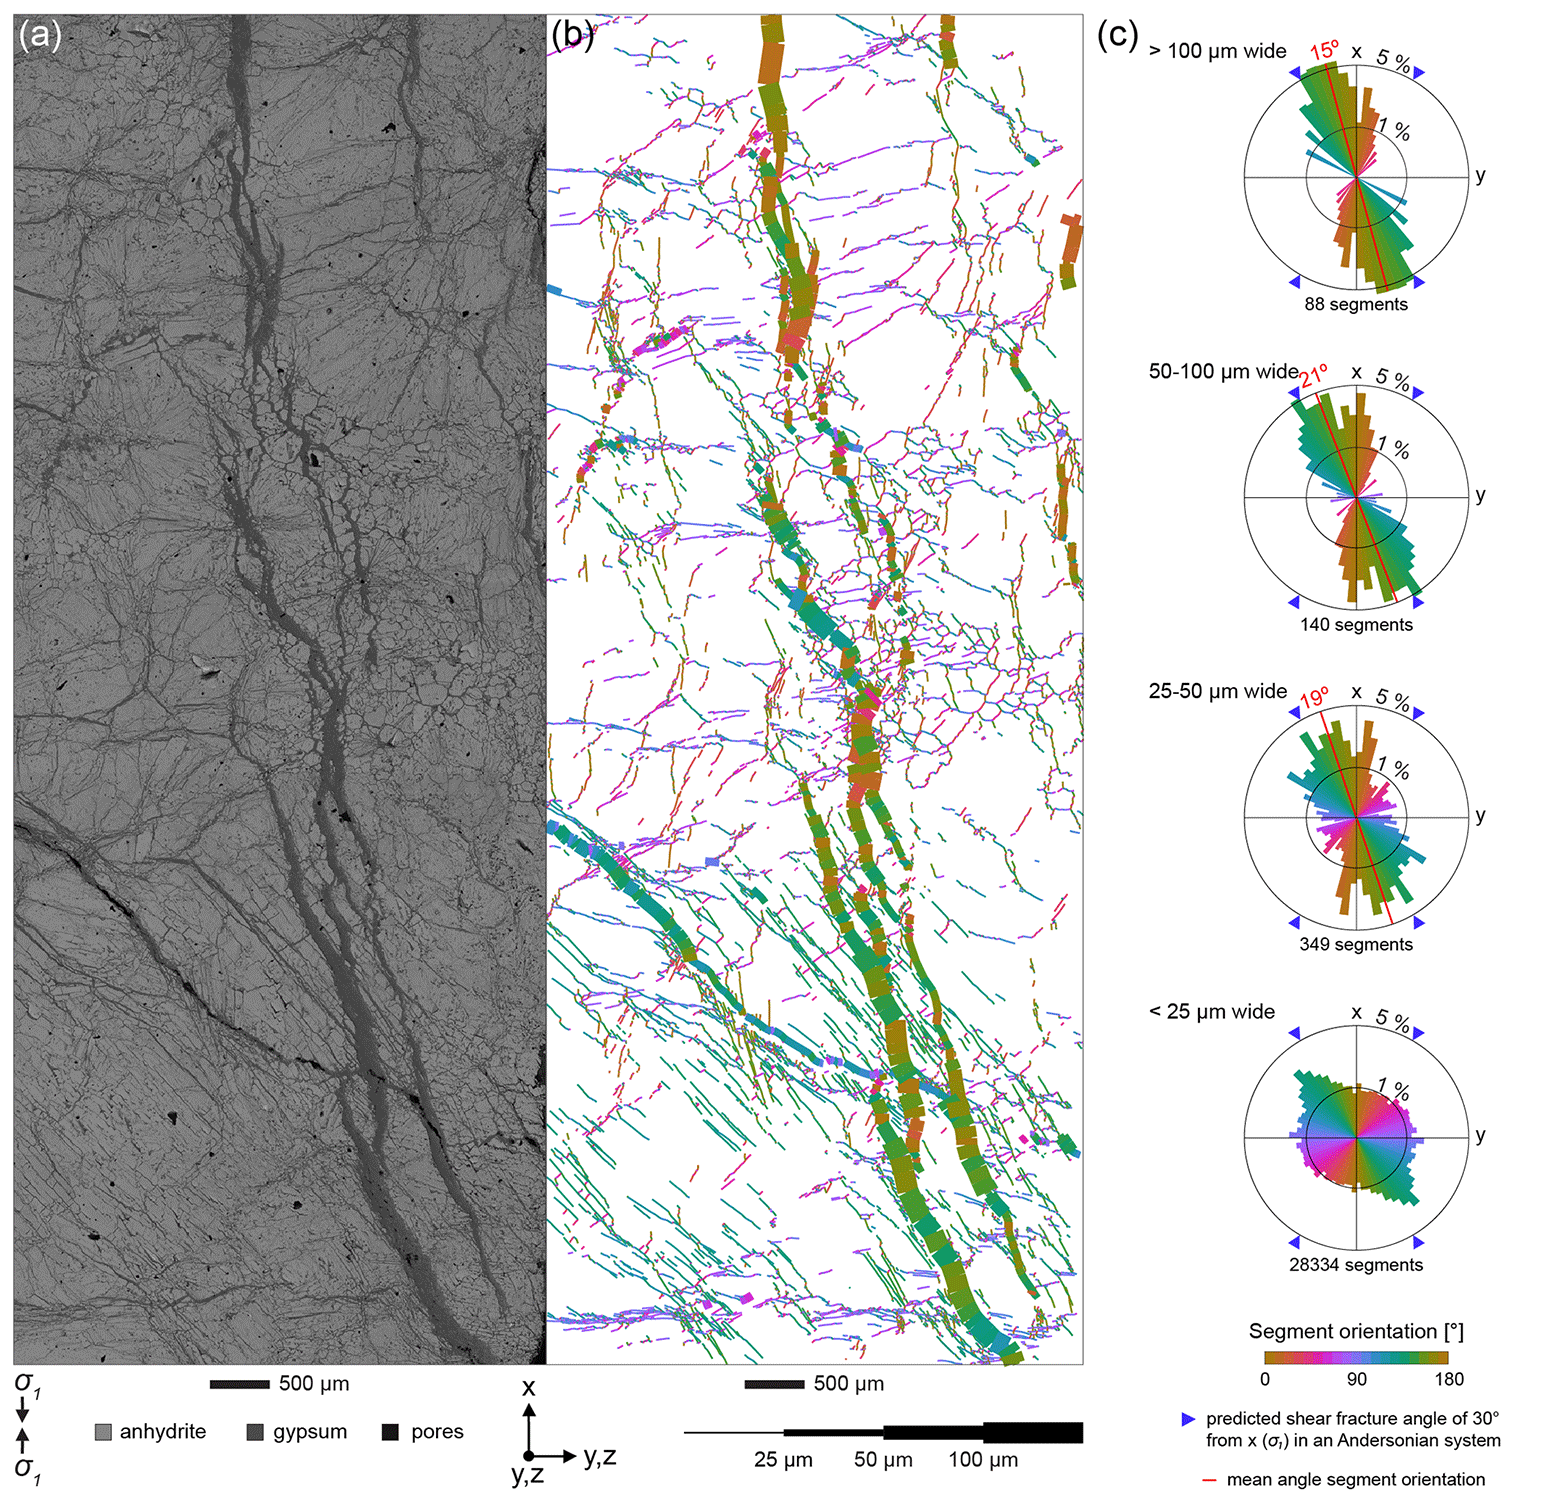
Figure 4Distribution of gypsum veins in sample W1 after wet experimental run. (a) BSE image showing the distribution of phases. (b) Map of gypsum-filled veins, with segments coloured for orientation and line width representing vein widths (FracPaQ; Healy and Rizzo, 2017; Healy et al., 2017). Not all fractures smaller 25 µm are traced due to their high abundance. (c) Length-weighted segment orientation rose diagrams corresponding to the dataset shown in (b), with 5∘ bin size.
3.2.2 Crystallographic-orientation analysis of newly formed gypsum
Crystallographic-orientation mapping was performed for anhydrite and gypsum of the same area of wet-mode sample W1 from Fig. 4 (Fig. 5). The dominant form of anhydrite in the upper part of the map is spherulites comprising radially oriented anhydrite blades that progressively change their crystallographic orientation (Fig. 5a).
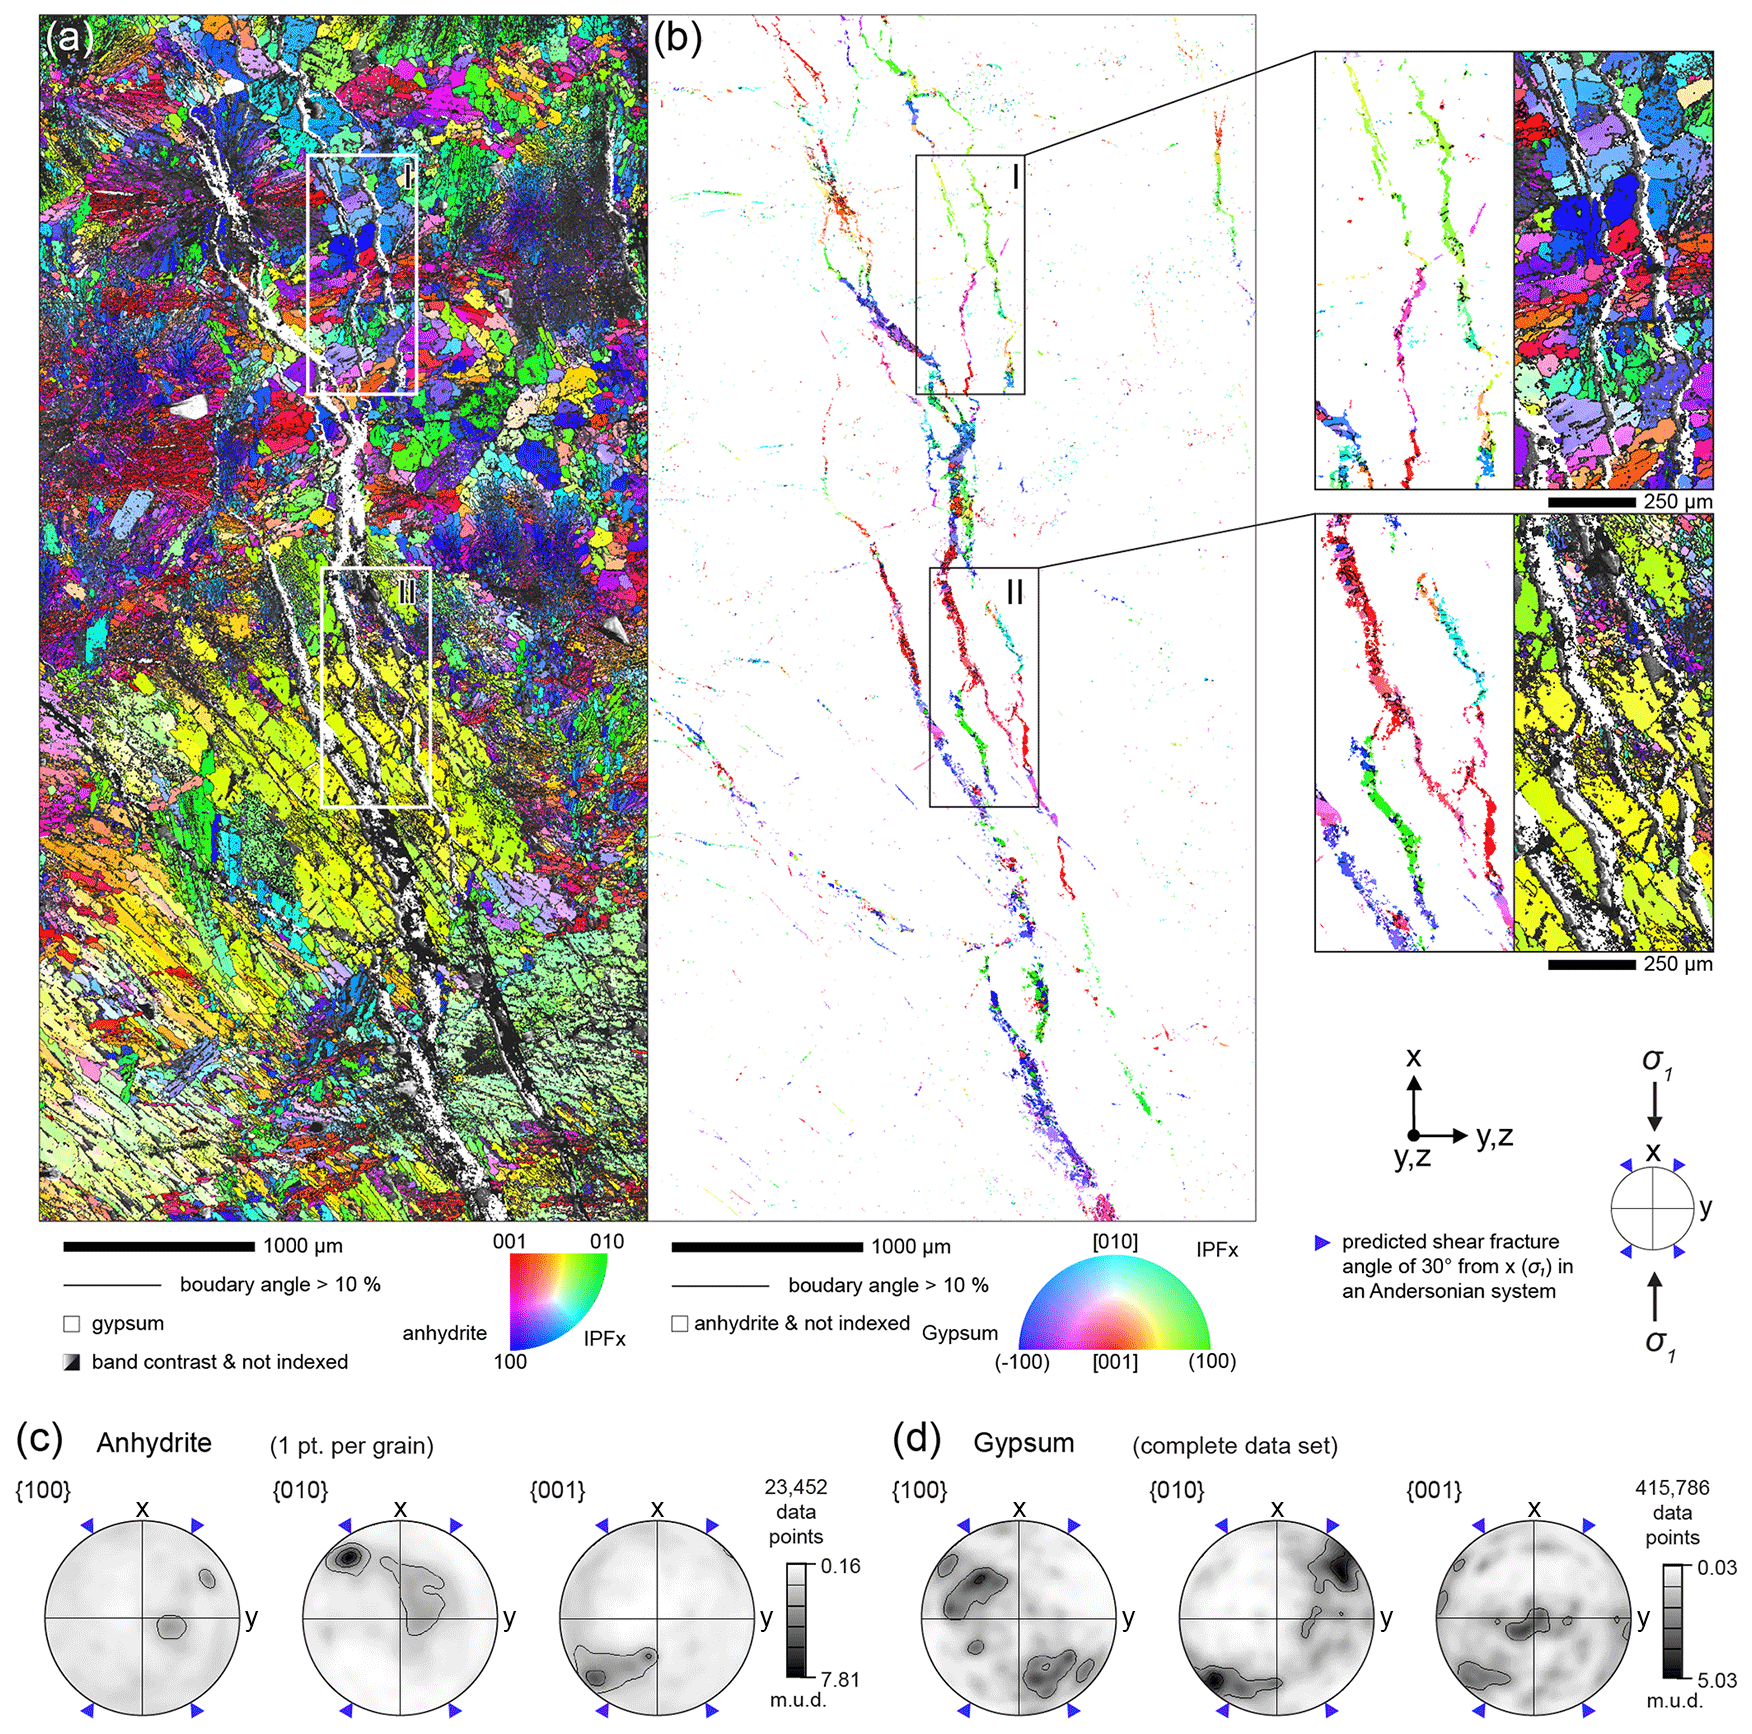
Figure 5Electron backscatter diffraction analysis of the same area shown in Fig. 4 from sample W1, deformed in wet testing mode. (a) Crystallographic-orientation EBSD map showing anhydrite orientations via inverse-pole-figure colour scheme relative to the map's x direction (IPFx). Step size = 2.2 µm. Underlying band contrast image. (b) Crystallographic-orientation EBSD map of gypsum with IPFx colour scheme. Enlarged insets (I) and (II) from (a) and (b), respectively, to compare crystallographic orientations of host anhydrite with vein-hosted gypsum. (c, d) Contoured equal area, lower-hemisphere pole figures of anhydrite and gypsum for data shown in (a) and (b), respectively. Plots are oriented in the reference frame (x, y, z) of the EBSD maps. Greyscale indicates multiples of uniform density (m.u.d.).
The spherulites have an approximate diameter of ∼ 700 to 1250 µm. Clusters of blocky anhydrite crystals with approximate diameters in the range of 70 to 350 µm are scattered between the anhydrite spherulites (Fig. 5a). The third fabric component is made up of large, strained crystals (1000 µm long) with cleavage, dominating the lower part of the map and visible in green in the EBSD crystallographic-orientation map (Fig. 5a).
Anhydrite in the mapped area shows a strong CPO with the pole to {010} orientated ∼ 40∘ anti-clockwise from x (Fig. 5c). This fabric is dominated by aligned (cleaved) components of the large crystals, whereas the crystallographic orientations of the blocky grains are randomly oriented (Fig. 5a). The majority of the gypsum present in the mapped area is concentrated in the main vein structure (Fig. 5b). Only a small proportion of the gypsum is distributed in “traces” inside the anhydrite fabrics. Orientation mapping shows that the gypsum filling the main veins forms domains (grains) up to ∼ 1000 µm long, with segments that have a similar crystallographic orientation (Fig. 5bI, II). Only a small fraction of crystals show different crystallographic orientations. However, the EBSD map shows that, locally, the sizes and spatial positions of gypsum grains in the veins do not have any relationship with the neighbouring anhydrite in the wall rock (Fig. 5bI, II). Nevertheless, pole figures show that poles to {010} of anhydrite and poles to {100} of gypsum show broad alignment (Fig. 5c, d). Similarly, poles to {001} of anhydrite and poles to {010} of gypsum tend to align in some parts of the veins (Fig. 5c, d).
Overall, there is no clear link between crystallographic orientation of vein gypsum and the orientation of principal stress σ1 or predicted shear-fracture planes. However, there is a clustering of poles to {100} and {010} in gypsum at approximately 45∘ to σ1, which is parallel to the direction of maximum shear stress (Fig. 5c, d).
3.2.3 Characterization of fractures after constant-stress differential compaction
The fabric elements and phase abundance related to CSDC followed by failure are analysed from a BSE image of one of the main shear planes of sample H2 (Fig. 6). The thin section of this sample provides the opportunity to study gypsification related to shear fractures after CSDC. Five domains (A to E) are defined mostly after the phase abundance contrast. In detail, the A–B boundary is defined by compromising between abundance and fabric characteristics. The B–C boundary is easily placed by tracing a fault plane. The C–D boundary is defined mainly by the porosity contrast between domains. The D–E boundary results from a combination of fault horizon and material abundance.
Domain A mostly has blades of anhydrite with sharp edges; the spherulitic structures are still visible, and gypsum is located interstitially between these blades. The anhydrite grains are blocky towards the domain boundary, with edges that can be sharp but are most commonly rounded. There is no evidence of rotation of grains in these domains due to the kinematics of the experiment.
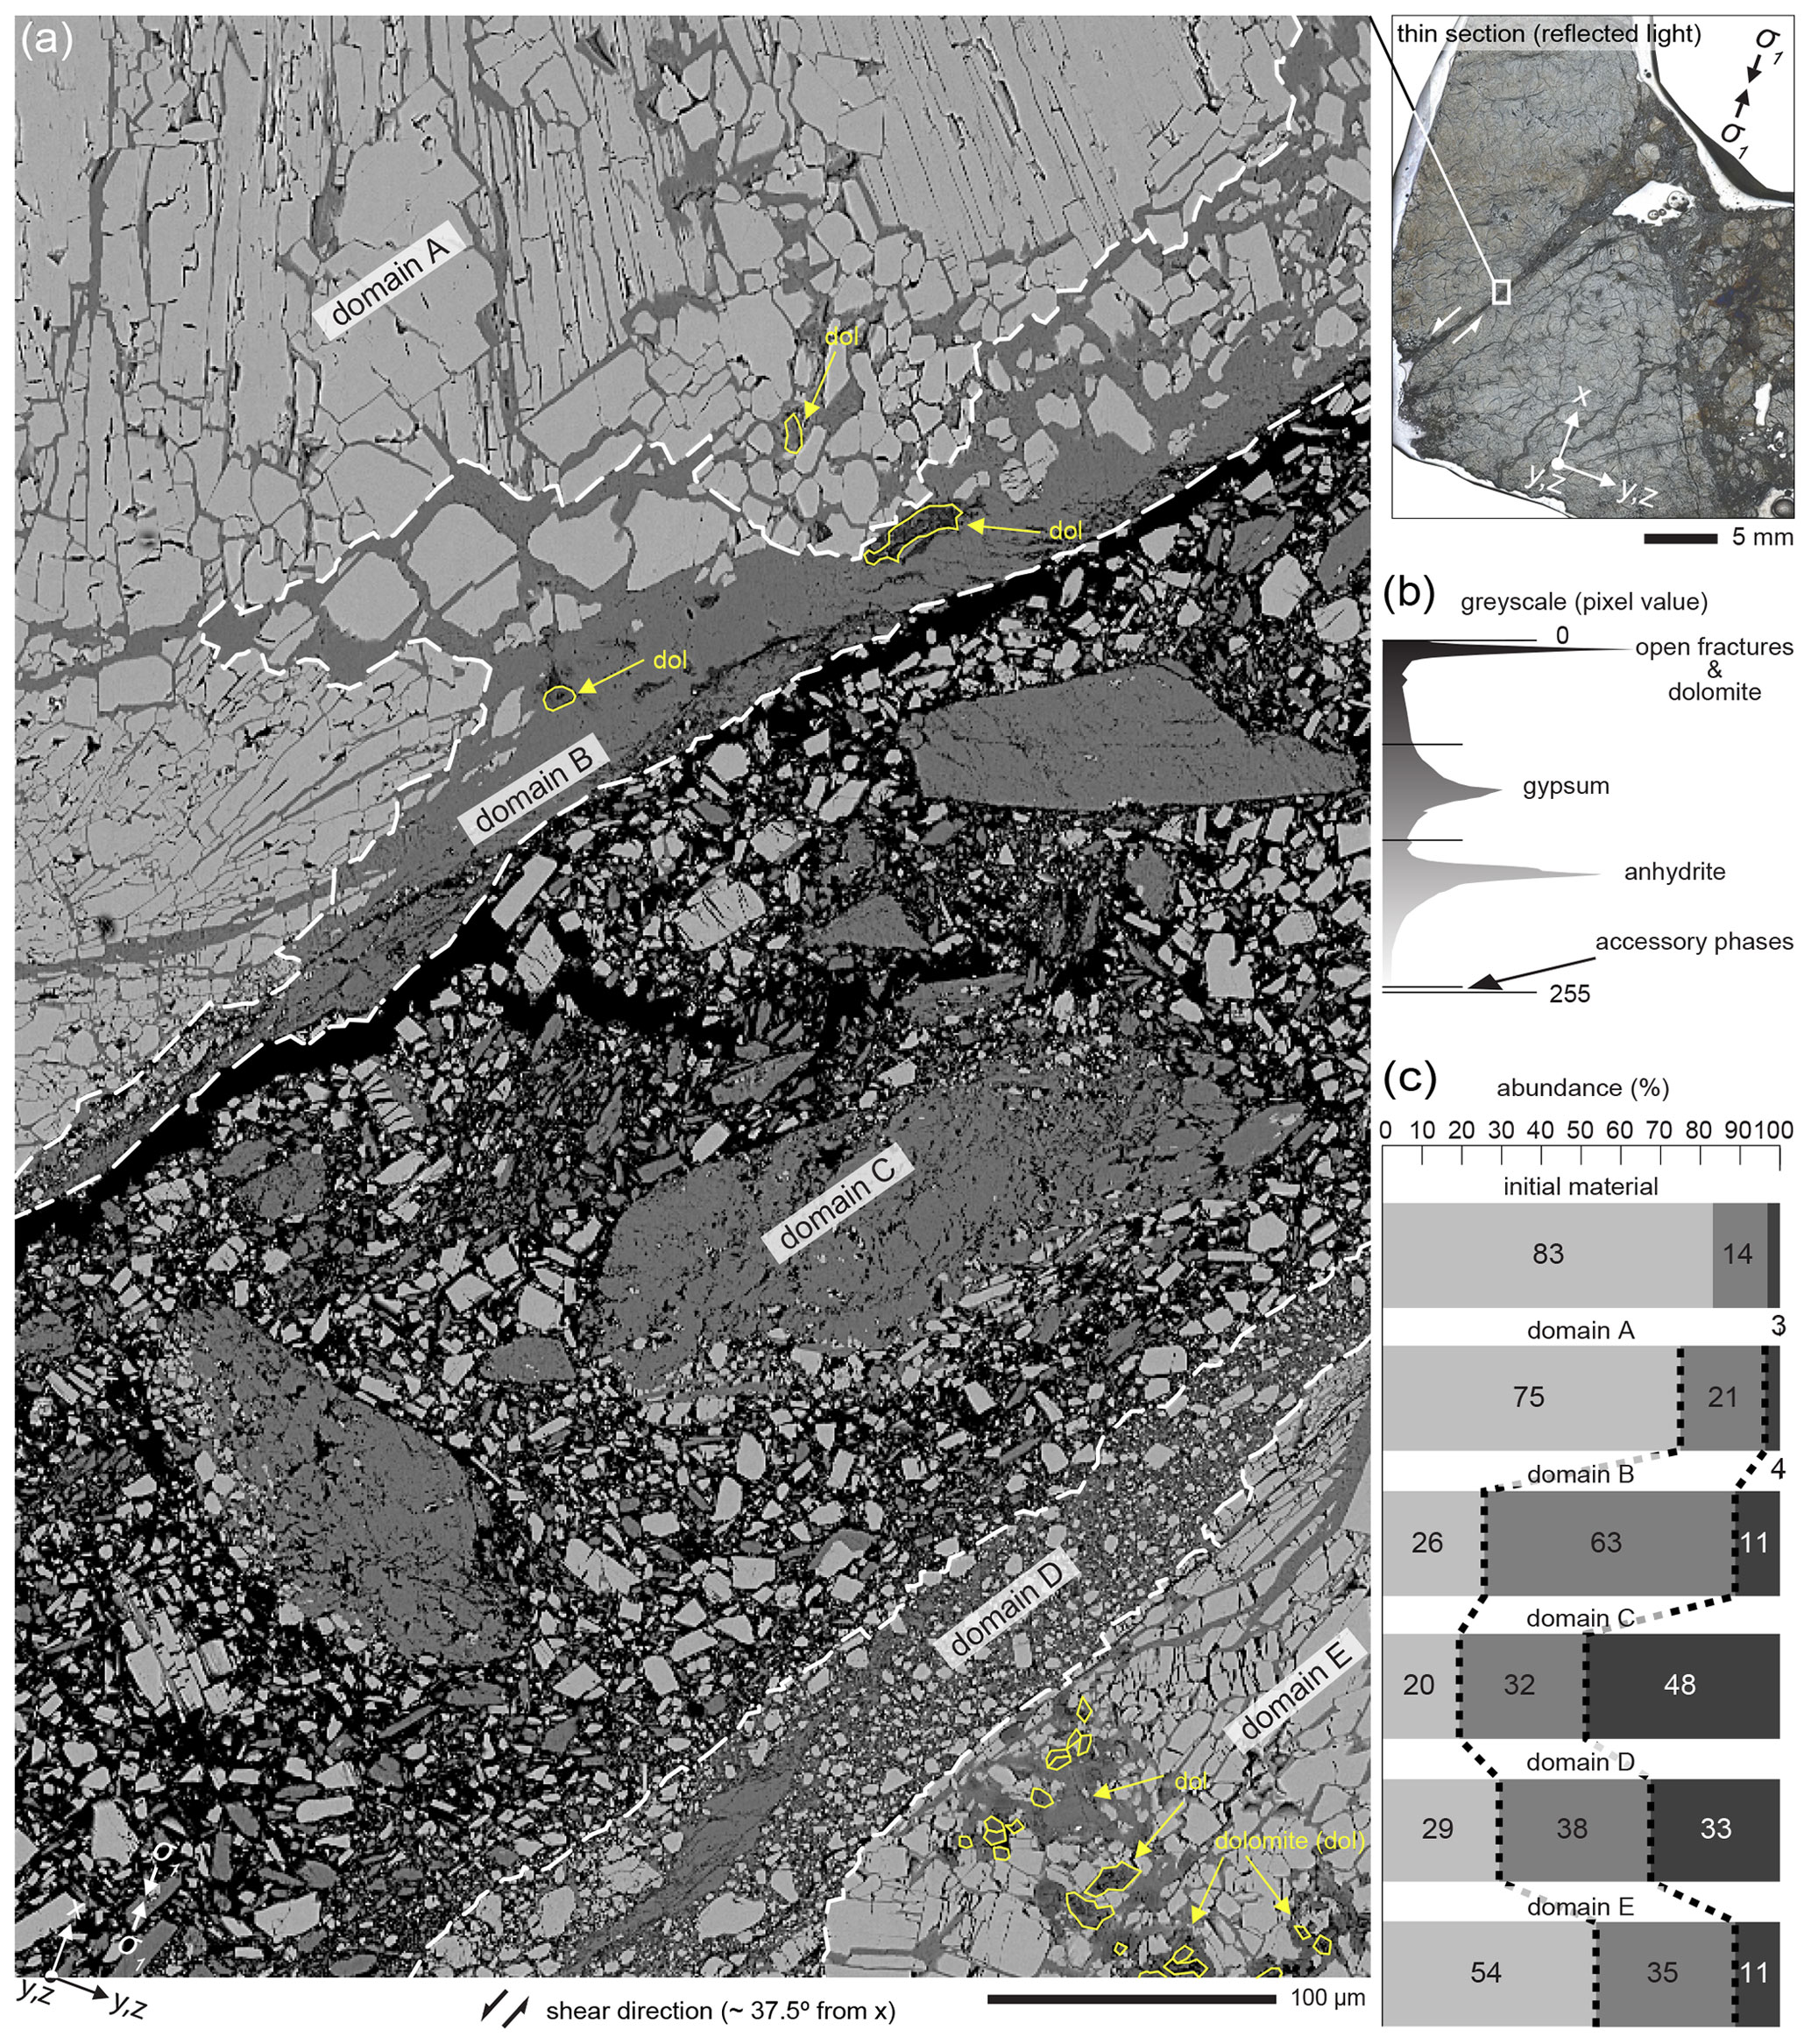
Figure 6Analysis of a shear fracture in sample H2 after constant-stress differential compaction and failure. The area in the image shows the main shear fracture that separates the lower intact end piece of the sample core from an intact side slab. (a) Backscatter electron image with domains (A–D) defined by texture and composition. Dolomite is identified based on habitus and experience from EDX results of other areas in the thin section (Rasband, 1997; Schneider et al., 2012). (b) Greyscale threshold settings defined to quantify the percentage of area of phases from the backscatter image analysis via ImageJ. (c) Bar chart to show percentage of area of phases in domains and mean values of the pre-test Òdena anhydrite (same thresholds applied).
Domain B is dominated by gypsum with a mosaic of isolated anhydrite grains (inclusions). Anhydrites are mostly rounded, with some evidence of rotation with respect to one another. The abundance of gypsum increases towards domain C, forming a layer of pure gypsum. Domain C mainly consists of clasts that contain anhydrite, gypsum, or both, and with no significant matrix. The size (long axis) of the gypsum clasts ranges from < 1 µm to > 100 µm. The big gypsum clasts can be highly fractured, with sporadic smaller anhydrite grains at the rims or as small ∼ 1 µm inclusions. Almost half of the domain is porous, and gypsum content is higher than that of anhydrite. In domain D, the anhydrite grains are rotated and embedded into a gypsum matrix. The edges are round to semi-round in shape, and the particle size is up to 25 µm (length of long axis). The domain is highly brecciated, with contact between particles. The boundary to domain D is defined by a series of fractures. The initial fabric is preserved in domain E but highly affected, showing abundant intra- and inter-granular fracturing. Inter-granular fractures are mostly filled with gypsum, whereas intra-granular fractures are predominantly empty. The shape of the edges of the anhydrite grains ranges from sharp to slightly rounded. Abundance analysis results indicate that more than half of the domain consists of anhydrite.
4.1 Evidence for new gypsum formation
The strongest evidence for successful hydration and formation of gypsum is represented by the breccia vein shown in Fig. 6. The main vein has an orientation of 37.5∘ to x (σ1), which is consistent with a shear fracture caused by the CSDC-mode experiment. Optical assessment and greyscale threshold analysis shows that the gypsum content in and around the shear fracture is significantly higher compared to the initial sample material (Fig. 2b). The higher abundance of gypsum and the presence of rounded, rotated anhydrite grains in the margins (domains B and D) of the breccia vein are evidence for active (syn-experiment) gypsification. The centre of the breccia vein (Fig. 6, domain C) contains >100 µm gypsum clasts, which is orders of magnitude larger than any observed pre-experiment gypsum, located in centres of anhydrite spherulites and short, narrow (< 50 µm) veins (Fig. 2b). These clasts can contain small anhydrite inclusions and are derived from newly formed gypsum (Fig. 6a). Based on the distribution of the anhydrite inclusions at the margins of the gypsum clasts, the gypsum was part of a shear interface with active gypsification before brecciation occurred.
The formation of the gypsum vein system from sample W1, documented after a wet-mode experiment (Fig. 4a, b), is consistent with syn-experiment gypsification and deformation. The wide vein apertures (≫ 50 µm) in combination with the systematic orientation and length of the gypsum-filled vein system of > 2.5 cm were not present in the primary sample material. These are strong indicators for experimentally induced extension and formation of new gypsum. The wide gypsum-filled vein system formed by linked extensional fractures with a minor shear component that progressively coalesced to result in a stepped shear fracture. (Fig. 4). Additionally, the crystallographic orientation of the vein gypsum is such that poles to {010} generally coincide with the direction of maximum shear stress during the experiments. This geometric link between gypsum growth and stress during an experiment and independent of the surrounding anhydrite has not been described before and requires further discussion.
4.2 Evolution and mechanisms of hydration
4.2.1 Rapid hydration of anhydrite under stress
A significant outcome of this study is that hydration of anhydrite to gypsum was achieved under non-hydrostatic-stress conditions over a few hours. The CSDC experiment with sample H2 lasted for 6 h and produced gypsum in the fracture-related pore space created during the experiment. Microfractures produced during high effective pressure and further grain size reduction by comminution successfully facilitated hydration. Sample W1 shows a significant amount of new gypsum in veins even after a 20 min long wet-mode experiment. These results contrast starkly with previous attempts to hydrate anhydrite, which failed to produce gypsum over many months under hydrostatic conditions (e.g. Ramsdell and Partridge, 1929; Leininger et al., 1957; Hardie, 1967). This suggests that there is an intrinsic link (or links) between the application of a non-hydrostatic stress field, microstructural change, change in permeability, and the rate of the hydration reaction.
4.2.2 Spatial distribution and timing relationships
Microstructural observations (Figs. 4, 5, and 6) show a paragenesis that links to the stress–strain evolution. A model to establish the spatial distribution and timing relationships of hydration products and fracture-pattern-development results from experimental observations was developed (Fig. 7). During the initial loading phase, the onset of intra-granular fracturing concentrated in the centre of the core, and the orientation of shear planes (30∘ angle to σ1) significantly increased sample permeability and provided three-dimensional fracture networks as pathways for fluids (Fig. 7ai). Application of fluid pressure during CSDC- and wet-mode experiments ensured the fast distribution of H2O through these networks (Fig. 7aii). At fracture–fluid interfaces, the presence of anhydrite, gypsum, and H2O led to in situ hydration and gypsum vein formation. Sample H2 had approximately 6 h of contact with H2O in total: 5 h 56 min under isotropic-principal-stress conditions (i.e. ) and less than 2 min of axial reloading of the sample from CSDC differential stress to maximum differential stress (σmax).
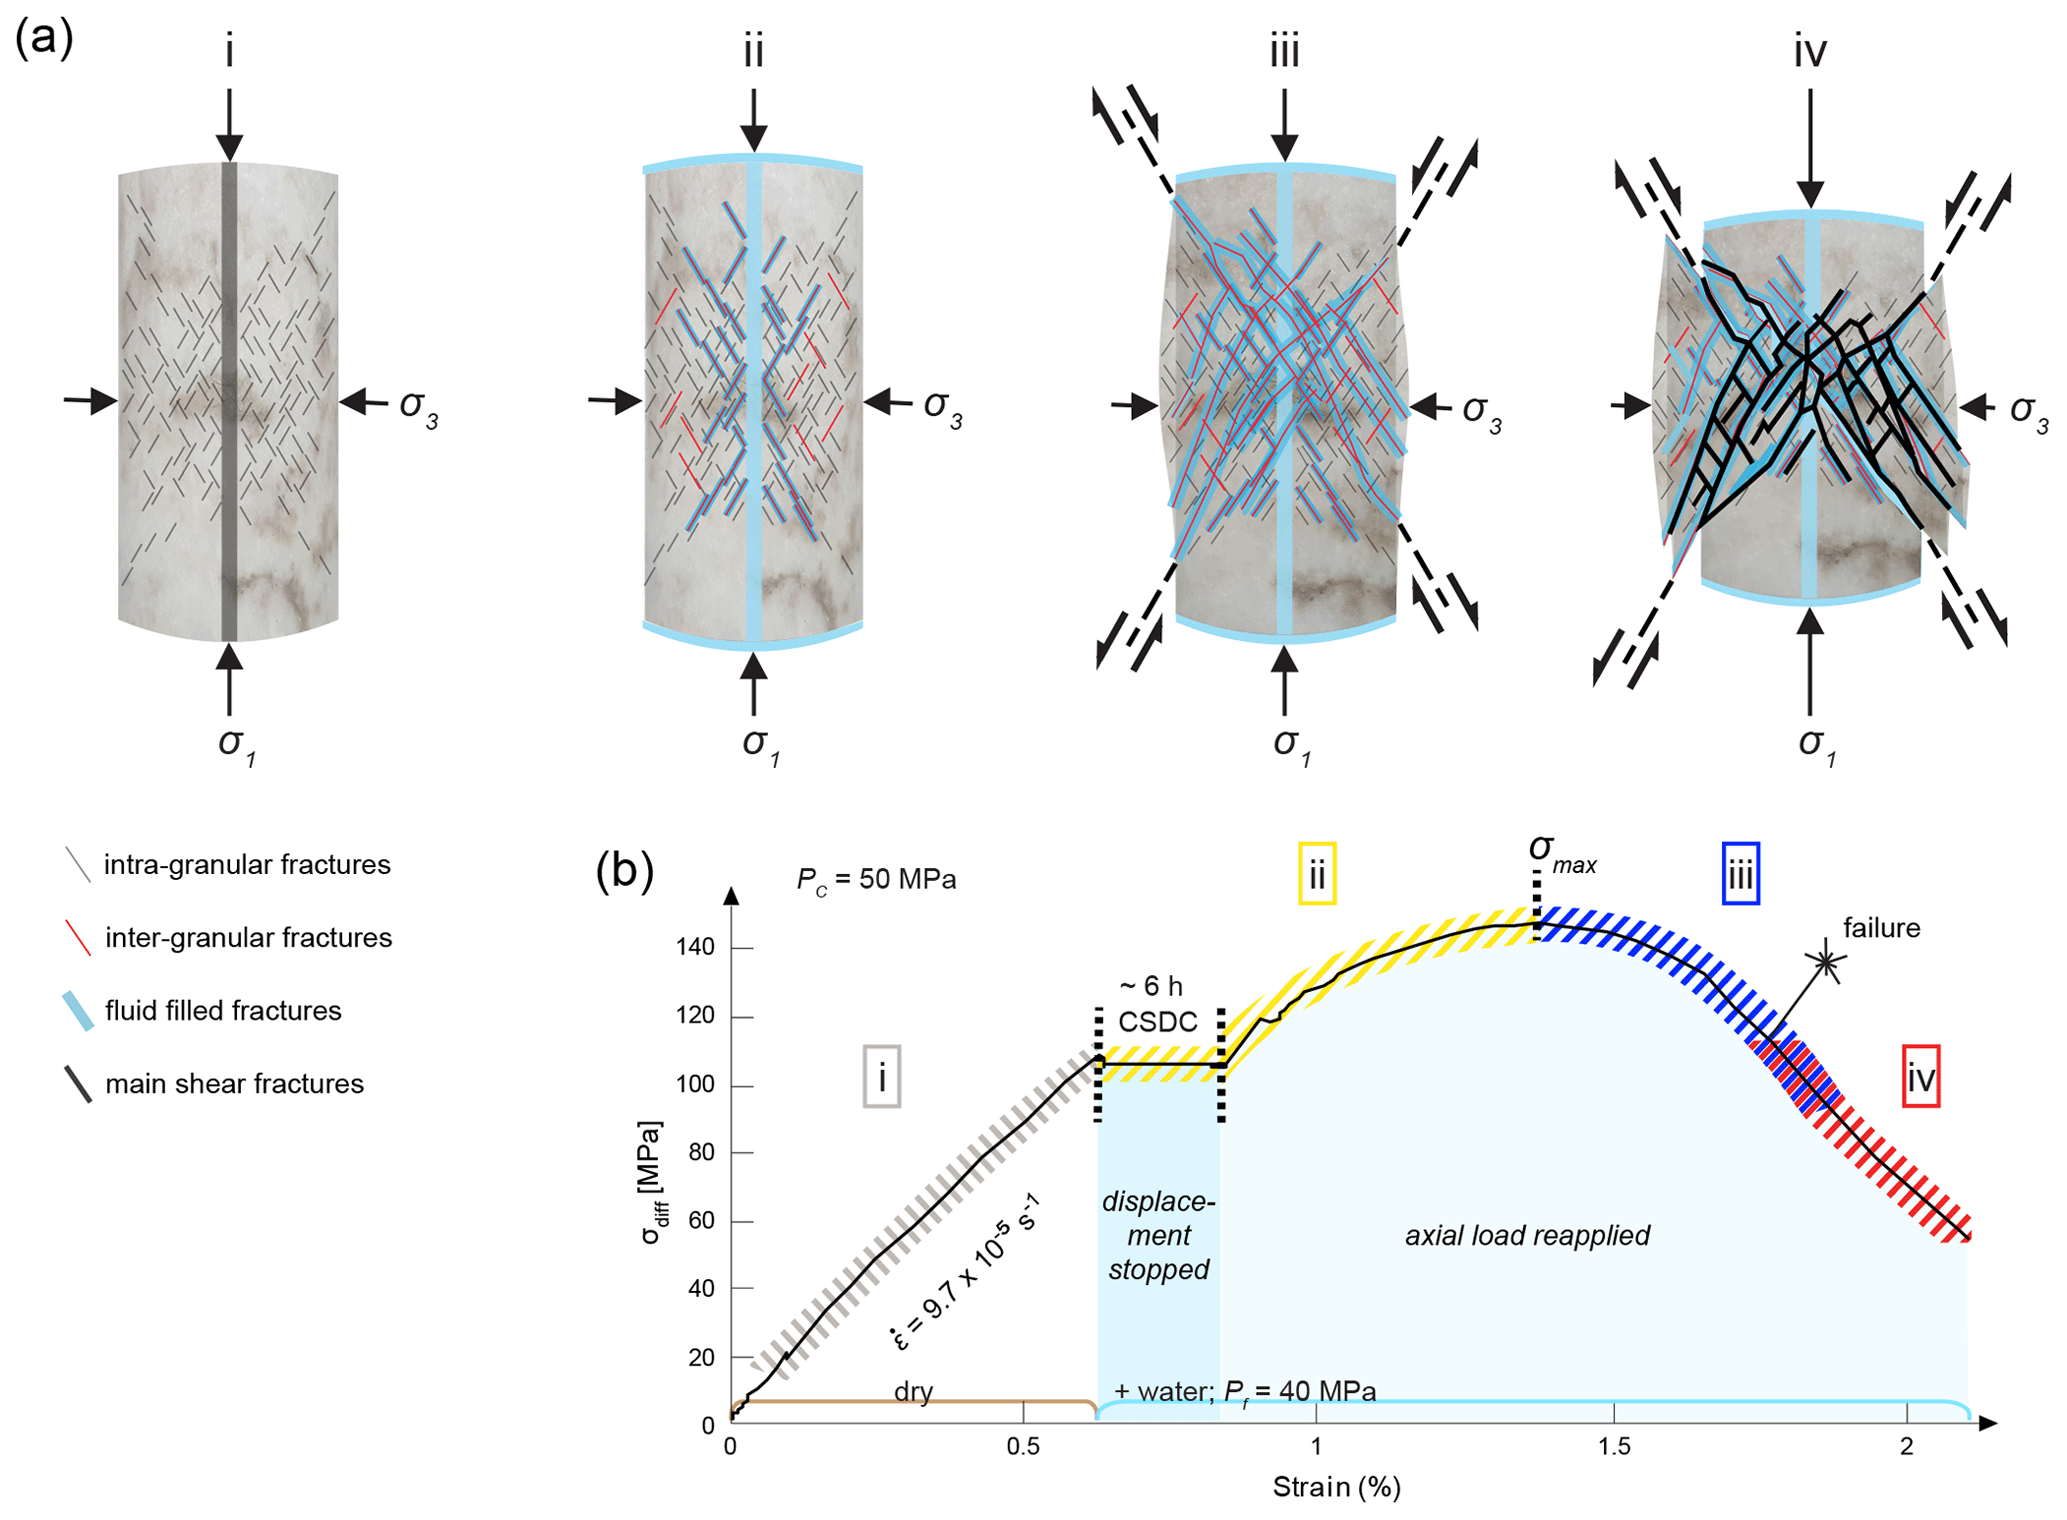
Figure 7Interpretation of fracture formation and fluid distribution in the sample cores throughout triaxial tests. (a) Schematic fracture formation. Not all stages apply to all tests; this depends on the experimental mode. (b) Relationship of (a) to CSDC stress–strain curve of sample H2.
The margins of gypsum grains and large gypsum clasts contained in the brecciated zone of the shear fractures after CSDC in sample H2 exceeded the gypsum formation documented after the wet-mode experiment in sample W1. Combined with the timeline, this larger gypsum grain content strongly indicates early inter-granular fracturing combined with the formation of new gypsum before reaching maximum differential stress. After maximum differential stress and prior to dynamic hydration-related brecciation (Fig. 7iii), bulging and (faster) shortening of the sample in the x direction through the activation of shear-plane fractures and local extensional operation of a three-dimensional fluid pathway network occurred within 2 min. Shearing along the main shear fractures results in rapid shortening in the x direction during the last stage (Fig. 7aiv) and is characterized by a rapid stress drop (−10 MPa every 3 s) with ongoing strain. The onset of such catastrophic failure 30 s after maximum differential stress was reached led to the formation of cataclastic zones and brecciated veins (Fig. 6).
4.2.3 Crystallographic orientation of newly formed gypsum
The crystallographic orientations of newly formed gypsum in the veins have a systematic preferred orientation for long distances along veins beyond the grain boundaries of wall-rock anhydrite (Fig. 5a, b). Gypsum is not always topotactically linked to the wall-rock anhydrite in the immediate vicinity, indicating that inheritance of crystal orientation from anhydrite did not lead to the strong clustering of poles. There is also no evidence of alignment of crystals with respect to the vein walls or evidence of gypsum crystals that grew from the vein margin to its centre, and so alignment by competitive crystal growth of gypsum into the vein is unlikely.
Instead, gypsum crystallographic orientations are observed to be systematically and preferentially aligned parallel to the direction of maximum shear stress (Fig. 5c). Gypsum has a monoclinic crystal structure, where a bilayer of water molecules, stacked along the b axis, separates bilayers of Ca2+ cations and tetrahedral SO anionic groups. The adjoining layers are linked through weak hydrogen bonding, making the plane containing the water molecules {010} the weakest plane of shear and causing the perfect cleavage of gypsum (Wooster, 1936). The two secondary cleavages {100} and {011} have much higher ultimate shear strength than any shear directions measured on {010} (Williams, 1988). The pole plots show that there is a strong preferred orientation of the {010} planes of the gypsum crystals parallel to the predicted shear-fracture angle in the analysed area (Fig. 5), further favouring slip along the veins. The crystals in the veins are larger and longer than the aperture of the veins, which makes CPO likely to be a growth phenomenon rather than a result of deformation of pre-existing natural gypsum.
This study proposes that inheritance of crystal orientations from wall-rock anhydrite grains combined with crystal orientations favourable for nucleation and growth under the applied stress field (e.g. stress-related minimization of the energy barrier for nucleation) led to selective crystallographic orientations of large, new gypsum grains.
4.3 Mechanical–chemical coupling
The spatial link between newly formed gypsum and fractures shows that hydration predominantly progressed through the fracture network rather than a front that progressed through the sample, similar to that reported for gypsum dehydration and anhydritization (Wang and Wong, 2003; Llana-Fúnez et al., 2012). A concept for the hydration mechanism of anhydrite particles developed by Sievert et al. (2005) involves dissolution and precipitation, which was adapted here to explain hydration of the Òdena anhydrite under stress (Fig. 8). The wet-mode experiments make H2O groups available to new mineral interfaces during the initial intra-granular fracturing. Upon the contact of anhydrite surfaces with water, the CaSO4 solution and the surface absorption layer of hydrated Ca2+ and SO ions formed (Fig. 8) (Sievert et al., 2005). The increase in thickness of the absorbed layer is reportedly a slow process and needs to be followed by the crack formation in the absorbed layer and counter-migration of H2O and Ca2+ as well as SO ions (Sievert et al., 2005).
Pre-existing gypsum in the samples acted as a natural seeding material, which has been demonstrated elsewhere to enable (or speed up) the hydration reaction process because the kinetically challenging process of forming nuclei (e.g. Hardie, 1967; Wheeler, 1991; Sievert et al., 2005) is skipped. The enhancement of mineral replacement reactions by the presence of seeds is also a common phenomenon in other diagenetic processes, such as dolomitization (e.g. Whitaker and Xiao, 2010). Therefore, hydration was possible as soon as the samples had water contact and more likely in CSDC experiments due to the amount of time of contact with H2O. However, the importance of this process is difficult to reconcile with the distinct microstructural location of new gypsum in newly formed veins or the lack of gypsum in hydrostatic experiments. Rounded anhydrite inclusions in gypsum margins of shear fractures and as clasts in brecciated veins (Fig. 6a) are specific indicators for the dissolution of anhydrite.
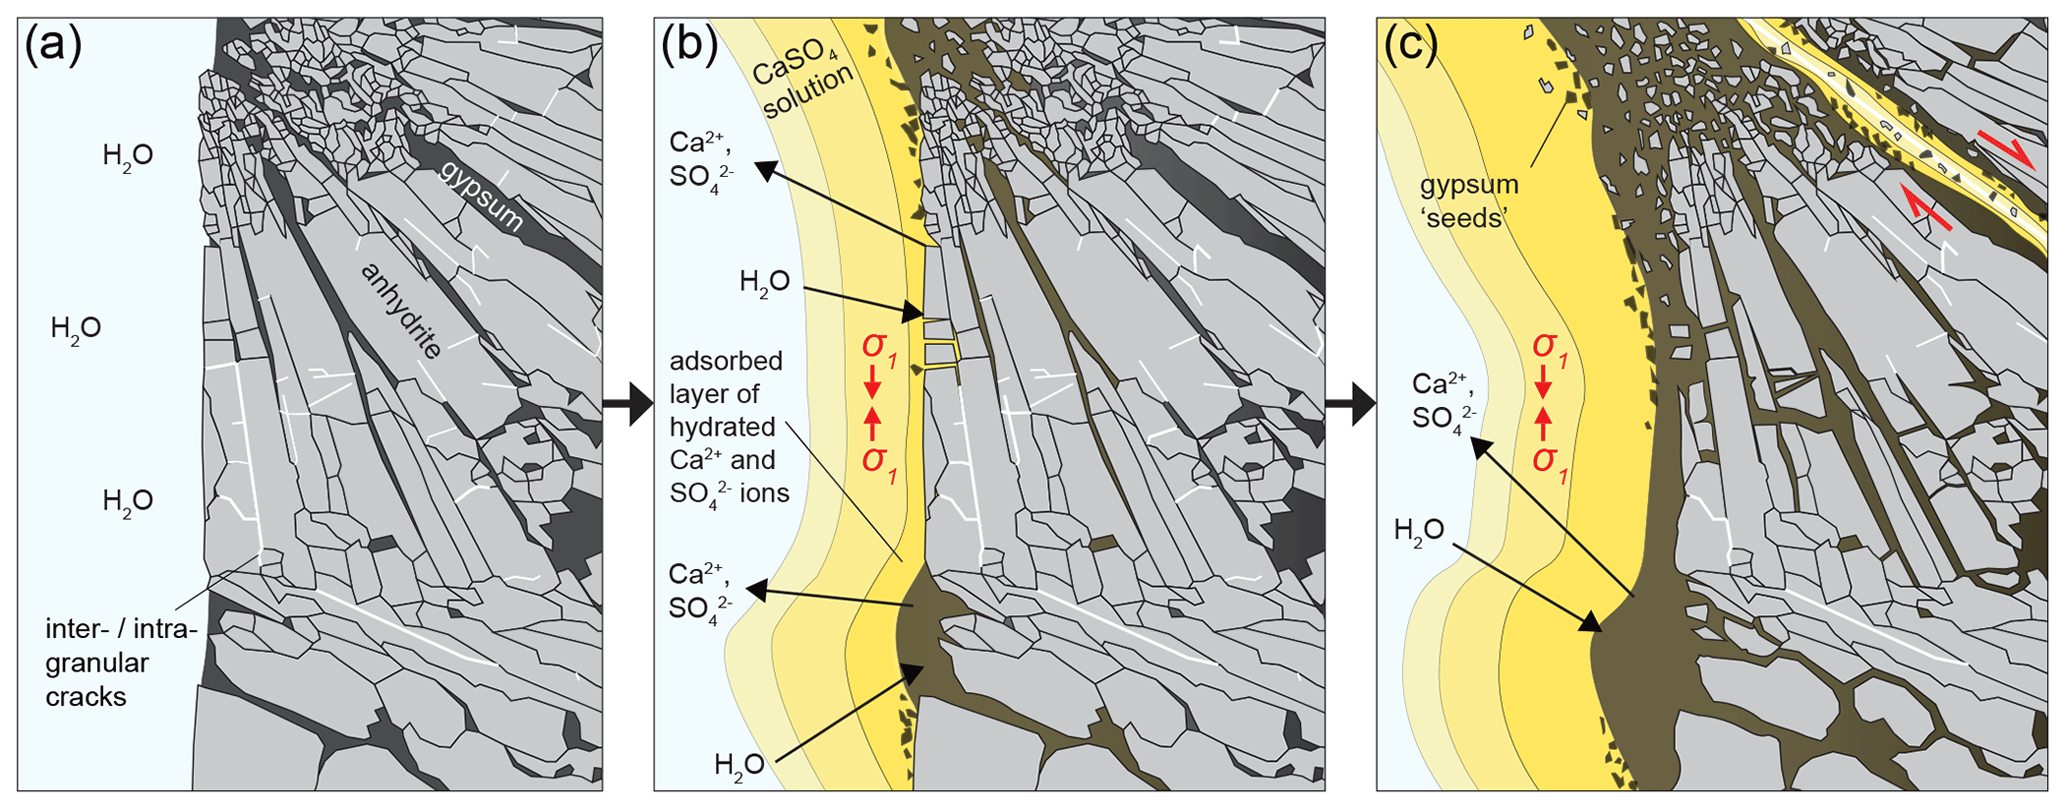
Figure 8Model for solution–precipitation hydration in Òdena anhydrite based on the hydration mechanism suggested by Sievert et al. (2005). The model includes a spherulite structure, cleavage, and blocky anhydrite areas in contact with water. Initial gypsum is located in veins along grain boundaries and the centre of the spherulite.
The role of fractures is threefold: firstly, they provide new surface area available for reaction. Secondly, they facilitate fluid flow to enable a readily available medium (H2O) for solution transfer of Ca2+ and SO ions. Thirdly, locally variable stresses associated with fracture propagation give rise to spatial variations in chemical potential and, as a consequence, chemical disequilibrium (Llana-Fúnez et al., 2012; Wheeler, 2018). Solid–fluid contacts will be at the pressure of the fluids (Pf), whilst solid–solid contacts will have a higher average normal stress, depending on the bulk effective pressure and contact area (Llana-Fúnez et al., 2012). That provides different pathways of Ca2+ and SO ions during the reaction. Therefore, the anhydrite solution was preferentially formed in the stressed anhydrite at fracture tips, grain boundaries, and gypsum–anhydrite contacts. Once gypsum nuclei were established, growth was likely to be rapid, following the findings of Sievert et al. (2005).
The transformation of anhydrite to gypsum requires a significant change in volume of solid material (i. e. swelling). Upon contact with water, gypsum is no longer solid but partly dissolved and starts to moderately swell (Fig. 8b). Simultaneously, anhydrite dissolution occurs, and Ca2+ and SO ions and H2O molecules permeate through the gypsum (Fig. 8b, c). The consumption of water acts to lower local fluid pressure, whereas replacement of anhydrite by gypsum causes swelling, counteracting the decrease in local fluid pressure. Recall that the tests were conducted at a constant bulk fluid pressure (held 10 MPa lower than confining pressure) without any induced sample-scale fluid flow. Nevertheless, fresh supply of H2O at the scale of grains, pores, and cracks was facilitated by the opening of a connective network of new inter-granular fractures (Fig. 7aiii). Fracturing, combined with the availability of water for the formation of gypsum, facilitates dilatancy, which is seen as bulging of the jacketed sample charges (Fig. 7aiii). Swelling (volume increase) and water loss through H2O groups being bound into the gypsum impact activity of hydration in places. Swelling can seal up cracks and trap free water. This potentially stops the hydration reaction in places, while the water migrates into other, harder-to-reach environments, like grain boundaries, facilitating hydration there with fewer H2O groups available.
Cataclastic flow and the full development of major shear fractures (Fig. 7a, biv) occurred after the peak stress was reached. The wet tests show that these major shear fractures with thin interconnected parallel fractures and areas of wide fractures are all filled with gypsum. These form planar zones of weakness for catastrophic shear failure. For the phase after peak stress is achieved, De Paola et al. (2009) recorded a rapid increase in permeability that becomes “chaotic” in the final stage of failure. This is likely to be coupled with a rapid increase in the area of available reaction surfaces. The macroscopic observations show that the sample cores after experiments with applied fluid pressure, if they do not fail catastrophically, comprise fragmented debris of centimetre to millimetre size, covered with a white slurry. This indicates that rapid gypsum formation may occur during the last stage (only seconds long) and upon failure. The lower peak stress of sample H2 after re-initiation of the axial-displacement rate can be explained by the development of weakening zones due to the appearance of mechanically weaker gypsum and dynamic opening and filling of cracks. Only sample H1 failed during CSDC. This could be due to a favourable orientation of pre-existing zones of weakness. There is gypsum in the initial sample in short (< 1 cm) veins with an aperture of < 50 µm. The formation of new gypsum is linked to sample failure.
4.3.1 Mechanical strength
A consequence of hydration under stress is the weakening of the sample during deformation. Samples H1 and H2, which experienced CSDC, have considerably lower peak strength compared to wet and dry runs with the same strain rate of s−1. Faster-strain-rate (W1, s−1) and higher-stress conditions (W2, Pc= 100 MPa, Pf= 90 MPa) generate weaker peak strengths. Besides axial load, the testing mode has the most significant influence on peak differential stress. Sample D2 showed the highest peak differential stress (215 MPa), and wet experiments W3 and W4 were intermediate (∼ 170 MPa). Sample H1 failed catastrophically at the beginning of the CSDC phase, with a maximum differential stress before failure of ∼ 100 MPa, about 41 % less compared to wet experiments. Sample H2 reached a peak strength (147 MPa) after reapplication of the axial load. The peak strength of sample H2 is 14 % lower than that of the wet experiments.
The microstructural analysis shows that the new gypsum is located along fractures in extensional and shear orientations, creating planes of weakness and lowering the bulk mechanical strength. A strongly connected shear-fracture network developed before the onset of constant-axial-stress and constant-radial-stress conditions (i.e. σ3), which likely caused the rapid development of a highly connective fracture network filled with gypsum in samples H1 and H2. The coalescence of fractures accompanied by hydration in sample H1 occurred within 71 min under isotropic-confining-stress conditions once fluids were introduced.
4.4 The influence of stress on chemical reactions
The magnitude and significance of differential stresses that may be induced through hydration reactions of mineral systems accompanied by a solid-volume increase are poorly understood. However, hydration reactions are commonly associated with deformation reactions like dilatant fracturing, which increases the fluid permeability. Plümper et al. (2022) showed that the hydration reaction MgO + H2O = Mg(OH)2 can induce stresses of several hundred megapascals in nature, with maximum local stresses up to ∼ 1.5 GPa. This is in agreement with the findings of this study, based on which stress, as opposed to pressure, influences the hydration reaction specifically through micro-cracking and faulting, providing pathways for fluids and surface area for the reaction.
There are two different stress–material interactions to consider for understanding the impact of stress on chemical reactions (Wheeler, 2018). Normal stress (anisotropy) along grain interfaces and between interfaces with different orientations has the main impact on chemical reactions in the Earth and thus plays a key role in quantifying stress-related chemical processes (Wheeler, 2014, 2018). Chemical potential depends on a “weighted” mean stress, which means that the magnitude and orientation of stress have an impact (Wheeler, 2018). Experiments show that narrow aqueous fluid or other fluid films along (grain) boundaries may persist, even if normal stress is greater than fluid pressure (Hickman and Evans, 1995; Israelachvili, 2011). They are regarded as stressed solids rather than fluids (e.g. Israelachvili, 1992; Wheeler, 2018), which provide fast diffusion pathways (Rutter, 1976). Integral parameters for models are the grain boundary structure, assumptions about the mobility of specific components, and reaction activity (Wheeler, 2018). These include grain boundary film properties like the connection between surface and interface energies and film structure (Hickman and Evans, 1995) as well as the relationship of fluid film thickness to normal stress (Israelachvili, 2011). The basic concept is that grain boundaries, representing a small-scale volume, are locally buffered by (i.e. are in local equilibrium with) the adjacent solids (Wheeler, 2018). Wheeler (2018) states that diffusion is the main mechanism of stress-related chemical processes and is active along long-range chemical reaction pathways that are provided by interconnected interfaces under crustal conditions. It is established that diffusion rates along interfaces such as grain boundaries are several orders of magnitude faster compared to intracrystalline diffusion (Dohmen and Milke, 2010).
Further, segregation of (incompatible) elements and their enrichment in grain interfaces are considered to have a significant impact on the physical and chemical properties of mantle rocks (Hiraga et al., 2007). Interfacial segregation linked with grain boundary character distribution (GBCD) may lead to grain boundary energy minimization (Tacchetto et al., 2021). It follows that interfacial segregation potentially influences if and where diffusion is active or accelerated in natural samples during hydration.
Macroscopically, the difference between the wet- and CSDC-mode samples is that the main shear faults after CSDC are characterized by an area of intense fracturing, filled with brecciated material. The resulting lateral chips are either not faulted or extremely faulted compared to the dry- and wet-test samples. Altogether, the pieces resulting from fracturing seem smaller in size and are coated by a pale-grey, soft, viscous layer. Combined with the relative mechanical weakness of samples after CSDC compared to dry and especially wet tests, it is possible to conclude that there is a difference between reaction rates and mechanisms for hydrostatic and non-hydrostatic loadings. The possible relationship between the spatial distribution and crystallographic orientation of the new gypsum in veins with orientations of 45∘ from the maximum shear stress presented by this study is a start to understanding hydration processes on the grain–pore–crack scale and how they are linked to mechanic, thermodynamic, and kinetic processes.
4.5 Implications for the Earth's crust and mantle
The main implication of this study of hydration under stress in the crystalline CaSO4–H2O system is that mechanical–chemical coupling of deformation and hydration is central to permitting water to reach the reaction zone and cause significant mechanical weakening. The stability of natural evaporites is of major interest in various settings, especially in contexts of underground structures with a variety of purposes, including road and tunnel construction and monitoring as well as mining of evaporites, and where caverns in evaporites are used as geo-energy storage facilities. In general, evaporitic rock salt deposits are anything but homogeneous or monomineralic (Stewart, 1963), with gypsum and anhydrite being two of the nine most important minerals. Organizations in Germany and the United States of America are already storing low- and intermediate-level nuclear waste in repositories within rock salt deposits. The basic assumptions are that rock salt functions as a seal, with halokinesis “healing” potential leaks. The need for more studies to determine the safety and efficiency of rock salt deposits is widely recognized.
The findings of this study, mechanical–chemical weakening through hydration of anhydrite along stressed fractures, show how rapidly mechanical weaknesses may form and threaten the stability of caverns in natural evaporite deposits. This needs to be included in future stability models. Anhydrite-bearing evaporite sequences are commonly the weakest horizons in sedimentary basins and form detachment horizons in foreland fold-and-thrust belts (e.g. Heard and Rubey, 1966; Hildyard et al., 2011a). Hydration of the anhydrite through stressed fractures must further weaken the mechanical strength of such sequences and make the formation of detachment horizons easier.
The findings of this study also have implications for hydration in a wider variety of geological settings. The CaSO4–H2O system could be seen as an analogue for other rock systems that are controlled by hydration, dehydration, and stress. Common fluid pathways in the Earth include faults, shear zones, and stratigraphic aquifers. The study suggests that hydration along such pathways can be rapid and generate planes of significant weakness under differential stress. Deep crustal earthquakes are often associated with local weakening of the generally dry, mechanically strong deep crust through fluid-driven metamorphic reactions (Jamtveit et al., 2019). Studies from the Bergen Arcs in western Norway show that fluid migration through shear zones facilitates highly localized eclogitization of anhydrous (granulite) crust along these zones (e.g. Austrheim and Griffin, 1985; Austrheim, 1987; Jamtveit et al., 1990; Jamtveit et al., 2019) and can result in transient mechanical weakening, brittle deformation, and earthquakes (e.g. Jamtveit et al., 2019; Bras et al., 2021). However, weakening in the case of granulite is the consequence of fracturing, not necessarily of hydration, unless the eclogites were deformed. At an early stage, eclogite facies mineralogy is even known to be found as veins in extension fractures (Jamtveit et al., 1990), although the difference in strength between granulite and eclogite is not as significant as that of anhydrite and gypsum. Subduction of oceanic and continental crust (Pérez-Gussinyé and Reston, 2001; Ranero et al., 2003; Bayrakci et al., 2016) even transports water to the deep mantle and creates local water-rich horizons.
This is the first study to look at the coupled mechanical behaviour and microstructural evolution during hydration in natural samples of anhydrite. Experimental hydration under non-hydrostatic-stress conditions was successfully achieved over several hours, and evidence was found for newly formed gypsum in post-experimental wet-mode and constant-stress differential compaction (CSDC)-mode samples. Syn-experiment gypsum-filled veins and breccia veins with large gypsum clasts formed in extensional and shear orientations. Significant mechanical weakening of the natural Òdena anhydrite accompanied rapid hydration under non-hydrostatic-stress conditions during CSDC-mode experiments. The CSDC results in decreased (∼ 14 % to ∼ 41 %) peak strength and lower differential stress and strain during failure compared to the wet- and dry-mode tests. The mechanical–chemical link resulted in failure along gypsum veins after 71 min for one sample under CSDC conditions, whereas the other lasted ∼ 6 h in CSDC mode. EBSD analysis shows a selective topotactical relationship of large gypsum grains to the vein-hosting anhydrite. The crystallographic orientations of the gypsum grains in new veins are also selective, systematic, and preferentially aligned parallel to the direction of maximum shear stress during the experiments. A model for the evolution of fracture formation and hydration involving mechanical–chemical coupling is proposed. The insights into rapid hydration under stress provided by this study have wider implications for geological and engineering settings.
Data have been made available in the Supplement.
The supplement related to this article is available online at: https://doi.org/10.5194/se-14-985-2023-supplement.
The experiments were conceptualized and designed by JH and DH and then carried out by JH. The Òdena rock samples were collected and selected by EGR. Experimental data were collected, processed, and analysed by JH. Microstructural data were collected, processed, and analysed by JH with assistance from NET. JH prepared the manuscript with contributions from all co-authors.
At least one of the (co-)authors is a member of the editorial board of Solid Earth. The peer-review process was guided by an independent editor, and the authors also have no other competing interests to declare.
Publisher’s note: Copernicus Publications remains neutral with regard to jurisdictional claims in published maps and institutional affiliations.
The principal author thanks Chris Elders for supervision throughout this project and Thomas Blenkinsop, Steven M. Reddy, Mark Jessell, and Ian Alsop for their reviews of earlier versions of this work (in the form of a PhD thesis chapter) as well as the two referees, Sergio Llana-Fúnez and James Gilgannon, who gave valuable input for this publication. We thank Juan Diego Martín-Martín and Federico Ortí for their advice and help with the Òdena Gypsum Formation sample collection and Roberto E. Rizzo for collecting the Volterra gypsum sample material in Italy. The authors acknowledge the support of the Microscopy and Microanalysis Facility and the John de Laeter Centre at Curtin University, whose instrumentation has been supported by university, state, and commonwealth government funding.
This research has been supported by an Aberdeen–Curtin Alliance international postgraduate scholarship, by a Curtin publication grant, and by the Natural Environment Research Council (grant no. NE/T007826/1). Enrique Gomez-Rivas acknowledges the “Ramón y Cajal” fellowship RYC2018-026335-I, funded by the Spanish Ministry of Science and Innovation (MCIN), the State Research Agency of Spain (AEI), and the European Social Fund (ESF)/10.13039/501100011033, as well as the DGICYT research project PID2020-118999GB-I00, funded by the Spanish Ministry of Science and Innovation (MCIN) and State Research Agency of Spain (AEI)/10.13039/501100011033.
This paper was edited by Federico Rossetti and reviewed by Sergio Llana-Fúnez and James Gilgannon.
Austrheim, H.: Eclogitization of lower crustal granulites by fluid migration through shear zones, Earth Planet. Sc. Lett., 81, 221–232, https://doi.org/10.1016/0012-821X(87)90158-0, 1987.
Austrheim, H. and Griffin, W. L.: Shear deformation and eclogite formation within granulite-facies anorthosites of the Bergen Arcs, western Norway, Chem. Geol., 50, 267–281, https://doi.org/10.1016/0009-2541(85)90124-X, 1985.
Bayrakci, G., Minshull, T. A., Sawyer, D. S., Reston, T. J., Klaeschen, D., Papenberg, C., Ranero, C., Bull, J. M., Davy, R. G., Shillington, D. J., Perez-Gussinye, M., and Morgan, J. K.: Fault-controlled hydration of the upper mantle during continental rifting, Nat. Geosci., 9, 384–388, https://doi.org/10.1038/NGEO2671, 2016.
Bedford, J.: The kinetics and mechanics of a dehydrating system and the deformation of porous rock, PhD thesis, University of Liverpool, United Kingdom, https://livrepository.liverpool.ac.uk/3009159/ (last access: 1 February 2023), 172 pp., 2017.
Bell, F. G.: A survey of the engineering properties of some anhydrite and gypsum from the north and midlands of England, Eng. Geol., 38, 1–23, https://doi.org/10.1016/0013-7952(94)90021-3, 1994.
Boeyens, J. C. A. and Ichhram, V. V. H.: Redetermination of the crystal structure of calcium sulphate dihydrate, CaSO4 • 2H2O, Z. Kristallogr., 217, 9–10, 2002.
Brantut, N., Schubnel, A., David, E. C., Héripré, E., Guéguen, Y., and Dimanov, A.: Dehydration-induced damage and deformation in gypsum and implications for subduction zone processes, J. Geophys. Res., 117, 639, https://doi.org/10.1029/2011JB008730, 2012.
Bras, E., Baïsset, M., Yamato, P., and Labrousse, L.: Transient weakening during the granulite to eclogite transformation within hydrous shear zones (Holsnøy, Norway), Tectonophysics, 819, 229026, https://doi.org/10.1016/j.tecto.2021.229026, 2012.
De Paola, N., Collettini, C., Trippetta, F., Barchi, M. R., and Minelli, G.: A mechanical model for complex fault patterns induced by evaporite dehydration and cyclic changes in fluid pressure, J. Struct. Geol., 29, 1573–1584, https://doi.org/10.1016/j.jsg.2007.07.015, 2007.
De Paola, N., Faulkner, D. R., and Collettini, C.: Brittle versus ductile deformation as the main control on the transport properties of low-porosity anhydrite rocks, J. Geophys. Res., 114, B06211, https://doi.org/10.1029/2008JB005967, 2009.
Dohmen, R. and Milke, R.: Diffusion in polycrystalline materials: grain boundaries, mathematical models, and experimental data, Rev. Mineral. Geochem., 72, 921–970, doi:10. 2138/ rmg.2010. 72. 21, 2010.
Farnsworth, M.: The Hydration of Anhydrite, Ind. Eng. Chem., 17, 967–970, 1925.
Hangx, S. J. T., Spiers, C. J., and Peach, C. J.: Mechanical behaviour of anhydrite cap rock and implications for CO2 sealing capacity, J. Geophys. Res., 115, B07402, https://doi.org/10.1029/2009JB006954, 2010.
Hangx, S. J. T., Spiers, C. J., and Peach, C. J.: The mechanical behaviour of anhydrite and the effect of deformation on permeability development–Implications for cap rock integrity during geological storage of CO2, Energ. Proced., 4, 5358–5363, https://doi.org/10.1016/j.egypro.2011.02.518, 2011.
Hardie, L. A.: The gypsum-anhydrite equilibrium at one atmosphere pressure, Am. Mineral., 52, 171–200, 1967.
Hawthorne, F. C. and Ferguson, R. B.: Anhydrous sulphates, II. Refinement of the crystal structure of anhydrite, Can. Mineral., 13, 289–292, 1975.
Healy, D., Rizzo, R. E., Cornwell, D. G., Farrell, N. J. C., Watkins, H., Timms, N. E., Gomez-Rivas, E., and Smith, M.: FracPaQ: A MATLAB™ toolbox for the quantification of fracture patterns, J. Struct. Geol., 95, 1–16, https://doi.org/10.1016/j.jsg.2016.12.003, 2017.
Healy, D. and Rizzo, R.: Fracture Pattern Quantification, FracPaQ, Version 2.8, GitHub [code], https://github.com/DaveHealy-github/FracPaQ (last access: 29 March 2021), 2021.
Heard, H. C. and Rubey, W. W.: Tectonic Implications of Gypsum Dehydration, Geol. Soc. Am. Bull., 77, 741–760, https://doi.org/10.1130/0016-7606(1966)77[741:TIOGD]2.0.CO;2, 1966.
Hickman, S. H. and Evans, B.: Kinetics of pressure solution at halite-silica interfaces and intergranular clay films, J. Geophys. Res., 100, 13113–13132, https://doi.org/10.1029/95JB00911, 1995.
Hildyard, R. C., Prior, D. J., Faulkner, D. R., and Mariani, E.: Microstructural analysis of anhydrite rocks from the Triassic Evaporites, Umbria-Marche Apennines, Central Italy: An insight into deformation mechanisms and possible slip systems, J. Struct. Geol., 31, 92–103, https://doi.org/10.1016/j.jsg.2008.10.009, 2009.
Hildyard, R. C., Prior, D. J., Mariani, E., and Faulkner, D. R.: Characterization of microstructures and interpretation of flow mechanisms in naturally deformed, fine grained anhydrite by means of EBSD analysis, Geol. Soc. Spec. Publ., 360, 237–255, https://doi.org/10.1144/SP360.14, 2011a.
Hildyard, R. C., Llana-Fúnez, S., Wheeler, J., Faulkner, D. R., and Prior, D. J.: Electron Backscatter Diffraction (EBSD) Analysis of Bassanite Transformation Textures and Crystal Structure Produced from Experimentally Deformed and Dehydrated Gypsum, J. Petrol., 52, 839–856, https://doi.org/10.1093/petrology/egr004, 2011b.
Hiraga T., Hirschmann M. M., and Kohlstedt, D. L.: Equilibrium interface segregation in the diopside–forsterite system II: applications of interface enrichment to mantle geochemistry, Geochim. Cosmochim. Ac., 71, 1281–1289, doi:10. 1016/j. gca.2006. 11. 020, 2007.
Israelachvili, J. N.: Adhesion forces between surfaces in liquids and condensable vapors, Surf. Sci. Rep., 14, 109–159, https://doi.org/10.1016/0167-5729(92)90015-4, 1992.
Israelachvili, J. N.: Intermolecular and surface forces, Elsevier Science, 3rd Ed., https://doi.org/10.1016/C2009-0-21560-1, 2011.
Jamtveit, B., Bucher-Nurminen, K., and Austrheim, H.: Fluid controlled eclogitization of granulites in deep crustal shear zones, Bergen arcs, Western Norway, Contrib. Mineral. Petr., 140, 184–193, https://doi.org/10.1007/BF00306442, 1990.
Jamtveit, B., Petley-Ragan, A., Incel, S., Dunkel, K. G., Aupart, C., Austrheim, H., Corfu, F., Menegon, L., and Renard, F.: The Effects of Earthquakes and Fluids on the Metamorphism of the Lower Continental Crust, J. Geophys. Res.-Sol. Ea., 124, 7725–7755, https://doi.org/10.1029/2018JB016461, 2019.
Jaworska, J.: Crystallization, Alternation and Recrystallization of Sulphates, in: Advances in Crystallization Processes, 1, edited by: Mastai, Y., Intech, 465–490, https://doi.org/10.5772/2672, 2012.
Jaworska, J. and Nowak, M.: Anhydrites from gypsum cap-rock of Zechstein salt diapirs. Geology Geophysics & Environment, 39, 233–250, https://doi.org/10.7494/geol.2013.39.3.233, 2013.
Klimchouk, A.: The dissolution and conversion of gypsum and anhydrite, Int. J. Speleol., 25, 21–36, https://doi.org/10.5038/1827-806X.25.3.2, 1996.
Ko, S.-c., Olgaard, D. L., and Briegel, U.: The transition from weakening to strengthening in dehydrating gypsum: Evolution of excess pore pressures, Geophys. Res. Lett., 22, 1009–1012, https://doi.org/10.1029/95GL00886, 1995.
Ko, S.-c., Olgaard, D. L., and Wong, T.-F.: Generation and maintenance of pore pressure excess in a dehydrating system 1. Experimental and microstructural observations, J. Geophys. Res., 102, 825–839, https://doi.org/10.1029/96JB02485, 1997.
Lebedev, A. L. and Avilina, I. V.: The Kinetics of Gypso Anhydrites Dissolution in Water: Experimental Studies, Moscow University Geology Bulletin, 74, 429–432, https://doi.org/10.3103/S0145875219040094, 2019.
Leclère, H., Faulkner, D., Wheeler, J., and Mariani, E.: Permeability control on transient slip weakening during gypsum dehydration: Implications for earthquakes in subduction zones, Earth Planet. Sc. Lett. 442, 1–12, https://doi.org/10.1016/j.epsl.2016.02.015, 2016.
Leclère, H., Faulkner, D., Llana-Fúnez, S., Bedford, J., and Wheeler, J.: Reaction fronts, permeability and fluid pressure development during dehydration reactions, Earth Planet. Sc. Lett., 496, 227–237, https://doi.org/10.1016/j.epsl.2018.05.005, 2018.
Leininger, R. K., Conley, Robert F., and Bundy, W. M.: Rapid Conversion of Anhydrite to Gypsum, Ind. Eng. Chem., 49, 818–821, https://doi.org/10.1021/ie50569a023, 1957.
Li, Lei, He, Liang, Wang, and Yao: Test Study on the Expansion Mechanical Properties of Regenerated Anhydrite Rock, IOP C. Ser. Earth Env., 358, 52029, https://doi.org/10.1088/1755-1315/358/5/052029, 2019.
Llana-Fúnez, S., Wheeler, J., and Faulkner, D. R.: Metamorphic reaction rate controlled by fluid pressure not confining pressure: implications of dehydration experiments with gypsum, Contrib. Mineral. Petr., 164, 69–79, https://doi.org/10.1007/s00410-012-0726-8, 2012.
Marti, S., Fusseis, F., Butler, I. B., Schlepütz, C., Marone, F., Gilgannon, J., Kilian, R., and Yang, Y.: Time-resolved grain-scale 3D imaging of hydrofracturing in halite layers induced by gypsum dehydration and pore fluid pressure buildup, Earth Planet. Sc. Lett., 554, 116679, https://doi.org/10.1016/j.epsl.2020.116679, 2021.
Mertineit, M., Behlau, J., Hammer, J., Schramm, M., and Zulauf, G.: Mechanical behaviour of anhydrite rocks: Results of field investigations, mineralogical-geochemical studies and thermomechanical experiments, in: Mechanical Behaviour of Salt VII, edited by: Bérest, P., Ghoreychi, M., Hadj-Hassen, F., and Tijani, M., 123–129, 2012.
Milsch, H., Priegnitz, M., and Blöcher, G.: Permeability of gypsum samples dehydrated in air, Geophys. Res. Lett., 38, L18304, https://doi.org/10.1029/2011GL048797, 2011.
Milsch, H. H. and Scholz, C. H.: Dehydration-induced weakening and fault slip in gypsum: Implications for the faulting process at intermediate depth in subduction zones, J. Geophys. Res., 110, B04202, https://doi.org/10.1029/2004JB003324, 2005.
Mirwald, P. W.: Experimental study of the dehydration reactions gypsum-bassanite and bassanite-anhydrite at high pressure: indication of anomalous behaviour of H2O at high pressure in the temperature range of 50–300 ∘C, J. Chem. Phys., 128, 74502, https://doi.org/10.1063/1.2826321, 2008.
Olgaard, D. L., Ko, S.-c., and Wong, T.-f.: Deformation and pore pressure in dehydrating gypsum under transiently drained conditions, Tectonophysics, 245, 237–248, https://doi.org/10.1016/0040-1951(94)00237-4, 1995.
Ortí Cabo, F., Pueyo Mur J. J., and Rosell Ortiz, L.: La halite du bassin potassique sud-pyreneen (Eocene superieur, Espagne), B. Soc. Géol. Fr., 6, 863–872, https://doi.org/10.2113/gssgfbull.I.6.863, 1985.
Pérez-Gussinyé, M. and Reston, T. J.: Rheological evolution during extension at nonvolcanic rifted margins: onset of serpentinization and development of detachments leading to continental breakup, J. Geophys. Res., 106, 3961–3975, https://doi.org/10.1029/2000JB900325, 2001.
Pina, C. M.: Nanoscale dissolution and growth on anhydrite cleavage faces, Geochim. Cosmochim. Ac., 73, 7034–7044, https://doi.org/10.1016/j.gca.2009.08.032, 2009.
Plümper, O., Wallis, D., Teuling, F., Moulas, E., Schmalholz, S. M., Amiri, H., and Müller, T.: High-magnitude stresses induced by mineral-hydration reactions, Geology, 50, 1351–1355, https://doi.org/10.1130/G50493.1, 2022.
Ramsdell, L. S. and Partridge, E. P.: The crystal forms of calcium sulphate, Am. Mineral., 14, 59–74, 1929.
Ranero, C. R., Moran, J. P., McIntosh, K., and Reichert, C.: Bending-related faulting and mantle serpentinization at the Middle America trench, Nature, 425, 367–373, https://doi.org/10.1038/nature01961, 2003.
Rasband, W.: Image Processing and Analysis in Java, ImageJ, GitHub [code], https://github.com/imagej/ImageJ (last access: 12 June 2016), 1997.
Rutter, E. H.: A Discussion on natural strain and geological structure – The kinetics of rock deformation by pressure solution, Philos. T. R. Soc. A., 283, 203–219, https://doi.org/10.1098/rsta.1976.0079, 1976.
Rutter, E. H., Llana-Fúnez, S., and Brodie, K. H.: Dehydration and deformation of intact cylinders of serpentinite, J. Struct. Geol., 31, 29–43, 2009.
Sass, I. and Burbaum, U.: Damage to the historic town of Staufen (Germany) caused by geothermal drillings through anhydrite-bearing formations, Acta Carsologica, 39, 233–245, 2010.
Schneider, C. A., Rasband, W. S., and Eliceiri, K. W.: NIH Image to ImageJ: 25 years of image analysis, Nat. Methods, 9, 671–675, https://doi.org/10.1038/nmeth.2089, 2012.
Schofield, P. F., Knight, K. S., and Stretton, I. C.: Thermal expansion of gypsum investigated by neutron powder diffraction, Am. Mineral., 81, 847–851, https://doi.org/10.2138/am-1996-7-807, 1996.
Schrank, C. E., Gaede, O., Blach, T., Gioseffi, K. C. M., Mudie, S., Kirby, N., Regenauer-Lieb, K., and Radliński, A. P.: Fast in-situ X-ray scattering reveals stress sensitivity of gypsum dehydration kinetics, Commun. Mater., 2, 51, https://doi.org/10.1038/s43246-021-00156-9, 2021.
Serafeimidis, K. and Anagnostou, G.: On the Time-Development of Sulphate Hydration in Anhydritic Swelling Rocks, Rock Mech. Rock Eng., 46, 619–634, https://doi.org/10.1007/s00603-013-0376-9, 2013.
Sievert, T., Wolter, A., and Singh, N. B.: Hydration of anhydrite of gypsum (CaSO4.II) in a ball mill, Cement Concrete Res., 35, 623–630, https://doi.org/10.1016/j.cemconres.2004.02.010, 2005.
Singh, A., Kumar, C., Kannan, L. G., Rao, K. S., and Ayothiraman, R.: Engineering properties of rock salt and simplified closed-form deformation solution for circular opening in rock salt under the true triaxial stress state, Eng. Geol., 234, 218–230, https://doi.org/10.1016/j.enggeo.2018.07.008, 2018.
Stewart, F. H.: Marine Evaporites. Data of Geochemistry. 6th Edition: U.S. Government Printing Office, 440-Y, 53 pp., https://doi.org/10.3133/pp440Y, 1963.
Tacchetto, T., Reddy, S. M., Saxey, D. W., Fougerouse, D., Rickard, W. D. A., and Clark, C.: Disorientation control on trace element segregation in fluid-affected low-angle boundaries in olivine, Contrib. Mineral. Petr., 176, 59, https://doi.org/10.1007/s00410-021-01815-3, 2021.
Timms, N. E., Erickson, T. M., Pearce, M. A., Cavosie, A. J., Schmieder, M., Tohver, E., Reddy, S. M., Zanetti, M. R., Nemchin, A. A., and Wittmann, A.: A pressure-temperature phase diagram for zircon at extreme conditions, Earth-Sci. Rev., 165, 185–202, https://doi.org/10.1016/j.earscirev.2016.12.008, 2017.
Timms, N. E., Pearce, M. A., Erickson, T. M., Cavosie, A. J., Rae, A. S. P., Wheeler, J., Wittmann, A., Ferrière, L., Poelchau, M. H., Tomioka, N., Collins, G. S., Gulick, S. P. S., Rasmussen, C., Morgan, J. V., Chenot, E., Christeson, G. L., Claeys, P., and IODP-ICDP Expedition 364 Scientists: New shock microstructures in titanite (CaTiSiO5) from the peak ring of the Chicxulub impact structure, Mexico, Contrib. Mineral. Petr., 174, 245, https://doi.org/10.1007/s00410-019-1565-7, 2019.
Vargas-Meleza, L., Healy, D., Alsop, G. I., and Timms, N. E.: Exploring the relative contribution of mineralogy and CPO to the seismic velocity anisotropy of evaporites, J. Struct. Geol., 70, 39–55, https://doi.org/10.1016/j.jsg.2014.11.001, 2015.
Wang, H., Zhang, B., Wang, L., Yu, X., Shi, L., and Fu, D.: Experimental investigation on the long-term interactions of anhydrite rock, crude oil, and water in a mine-out space for crude-oil storage, Eng. Geol., 265, 105414, https://doi.org/10.1016/j.enggeo.2019.105414, 2020.
Wang, W.-H. and Wong, T.-f.: Effects of reaction kinetics and fluid drainage on the development of pore pressure excess in a dehydrating system, Tectonophysics, 370, 227–239, https://doi.org/10.1016/S0040-1951(03)00188-4, 2003.
Warren, J. K.: Interpreting Evaporite Textures, Evaporites as Uplift Indicators (Tertiary Evaporites), in: Evaporites, A Geological Compendium, 2nd Edition, Springer Cham, 74–80, https://doi.org/10.1007/978-3-319-13512-0, 2016.
Wheeler, J.: A view of texture dynamics, Terra Nova, 3, 123–136, https://doi.org/10.1111/j.1365-3121.1991.tb00864.x, 1991.
Wheeler, J.: Dramatic effects of stress on metamorphic reactions, J. Geol., 42, 647–650, https://doi.org/10.1130/G35718.1, 2014.
Wheeler, J.: The effects of stress on reactions in the Earth: Sometimes rather mean, usually normal, always important, J. Metamorph. Geol., 36, 439–461, https://doi.org/10.1111/jmg.12299, 2018.
Whitaker, F. F. and Xiao, Y.: Reactive transport modelling of early burial dolomitization of carbonate platforms by geothermal convection, AAPG Bull., 94, 889–917, https://doi.org/10.1306/12090909075, 2010.
Williams, S. C.: The shear strength of gypsum single crystals on three cleavage planes, Tectonophysics, 148, 163–173, https://doi.org/10.1016/0040-1951(88)90168-0, 1988.
Wooster, W. A.: On the Crystal Structure of Gypsum, CaSO4 • 2H2O, Z. Kristallogr., 94, 375–396, https://doi.org/10.1524/zkri.1936.94.1.375, 1936.
Xu, C., Zhang, Y., and Yan, J.: Test Study on the Expansional Properties of Regenerated Anhydrite Rock, IOP C. Ser. Earth Env., 330, 42004, https://doi.org/10.1088/1755-1315/330/4/042004, 2019.
Yin, S. and Xie, R.: Experimental analysis of dynamic and static mechanical properties of deep thick anhydrite cap rocks under high-stress conditions, Carbonate. Evaporite., 34, 807–823, https://doi.org/10.1007/s13146-018-0450-1, 2019.