the Creative Commons Attribution 4.0 License.
the Creative Commons Attribution 4.0 License.
 | 23 Aug 2024
Stress state at faults: the influence of rock stiffness contrast, stress orientation, and ratio
Robin Seithel
Thomas Niederhuber
Oliver Heidbach
Thomas Kohl
Birgit Müller
Mojtaba Rajabi
Karsten Reiter
Luisa Röckel
The contemporary crustal stress state is primarily driven by gravitational volume forces and plate tectonics. However, there are various smaller-scale sources such as geological structures and stiffness contrast that perturb stresses and deviate them from the regional pattern. For example, borehole stress analysis in numerous cases has revealed abrupt rotations of horizontal stress orientation of up to 90° when faults are crossed. Herein, we investigate the rotation of principal stress axes at a fault by means of a 2D generic numerical model. We focus on the near field of the fault and the damage zone with a fault parameterized as a rock stiffness contrast. A substantial influence of the far-field stress field in terms of the differential stress and in terms of the stress ratio is shown. Furthermore, the contrast in material properties is the basis for any stress rotation, and in particular the stiffness is demonstrated to have a significant influence. Eventually, the impact of the angle between the fault strike and the orientation of SHmax is demonstrated. Our results show that the stress rotation is negatively correlated with the ratio of principal far-field stresses. A small angle between the far-field stress orientation and the fault facilitates stress rotation. A high contrast in rock stiffness further increases the stress rotation angle. Faults striking perpendicular to the maximum principal stress orientation experience no rotation at all. However, faults oriented parallel to the maximum principal stress orientation experience either no rotation or a 90° rotation, dependent on the ratio of principal stresses and the rock stiffness contrast. A comparison with observations from various boreholes worldwide shows that in general the findings are in agreement, even though the dip angle proves to have an influence on the stress rotation, in particular for shallow-dipping faults.
Please read the corrigendum first before continuing.
-
Notice on corrigendum
The requested paper has a corresponding corrigendum published. Please read the corrigendum first before downloading the article.
-
Article
(7674 KB)
- Corrigendum
-
Supplement
(512 KB)
-
The requested paper has a corresponding corrigendum published. Please read the corrigendum first before downloading the article.
- Article
(7674 KB) - Full-text XML
- Corrigendum
-
Supplement
(512 KB) - BibTeX
- EndNote


The contemporary crustal stress state is a key parameter in the stability and safety assessment of subsurface operations, such as the extraction of raw materials, storage of waste, and exploitation of geothermal energy (Catalli et al., 2013; Müller et al., 2018; van Wees et al., 2018). The most frequently freely available and most easily obtained stress information is the orientation of the maximum horizontal stress component SHmax which is compiled in the World Stress Map (Heidbach et al., 2018). The SHmax orientation is often observed to be consistent over large areas and volumes following the general patterns imposed by plate tectonics (Han et al., 2019; Heidbach et al., 2018; Engelder, 1992; Rajabi et al., 2017a; Reiter et al., 2014), but regionally variable patterns are also observed (Konstantinou et al., 2017; Niederhuber et al., 2023; Ziegler et al., 2016c). The SHmax orientation pattern is influenced by topography of large mountain ranges (Levi et al., 2019; Reinecker et al., 2010; Zoback, 1992; Engelder, 1992) or sedimentary basin geology (Rajabi et al., 2016a, b; Snee and Zoback, 2018). It has also been hypothesized that the SHmax orientation is diverted by faults (Dart and Swolfs, 1992; Faulkner et al., 2006; Konstantinovskaya et al., 2012; Li et al., 2023; Schoenball et al., 2018; Yale, 2003). Reiter et al. (2024) showed with a comprehensive study using a generic geomechanical model that large-scale fault-induced stress changes due to a discontinuity beyond a distance of a few hundred metres from the fault core are too small to be resolved by stress data.
Nevertheless, abrupt or gradual rotations of the SHmax orientation have been observed on a metre scale in boreholes (Barton and Zoback, 1994; Brudy et al., 1997; Massiot et al., 2019; Sahara et al., 2014; Shamir and Zoback, 1992; Wang et al., 2023). Over the last decade, a great increase in high-resolution image logs in various basins provides the opportunity for detailed observation of such small-scale stress rotations in the vicinity of faults at borehole scales (Lin et al., 2010; Rajabi et al., 2022, 2024; Sahara et al., 2014; Talukdar et al., 2022; Zhang et al., 2023). Figure 1a shows an example of stress re-orientation of approximately 90° indicated by borehole breakouts (Bell and Gough, 1979; Heidbach et al., 2018; Engelder, 1992) in the vicinity of (and attributed to) a fault, which has been interpreted in an electrical image log in the Surat Basin of Queensland, Australia (Rajabi et al., 2017a).
The observed change in breakout orientation is the manifestation of a change in the orientation of the maximum circumferential stress at the borehole wall (Fig. 1b), which is a function of the position at the borehole wall with respect to the orientation of the principal stress components S1, S2, and S3 (Kirsch, 1898). The principal stress components result from the transformation of the second-order symmetric stress tensor:
into the main axis system (Eq. 2), where the three remaining components are the three principal stresses that are perpendicular to each other, and it is defined that .
Any changes in the magnitudes of the individual components of the stress tensor σij are reflected in the principal stress components. In the main axis system, the changes in magnitudes in σij can also be reflected by changes in principal stress axis orientation (Fig. 1b) However, this only occurs if the deviatoric stress tensor changes (Engelder, 1994). The phenomenon of changes in the magnitudes of the components of σij that can be observed as changes in the orientation of the principal stress axes is commonly referred to as stress rotation. It can be observed, e.g. as a change in the orientation of borehole breakouts (Fig. 1a).
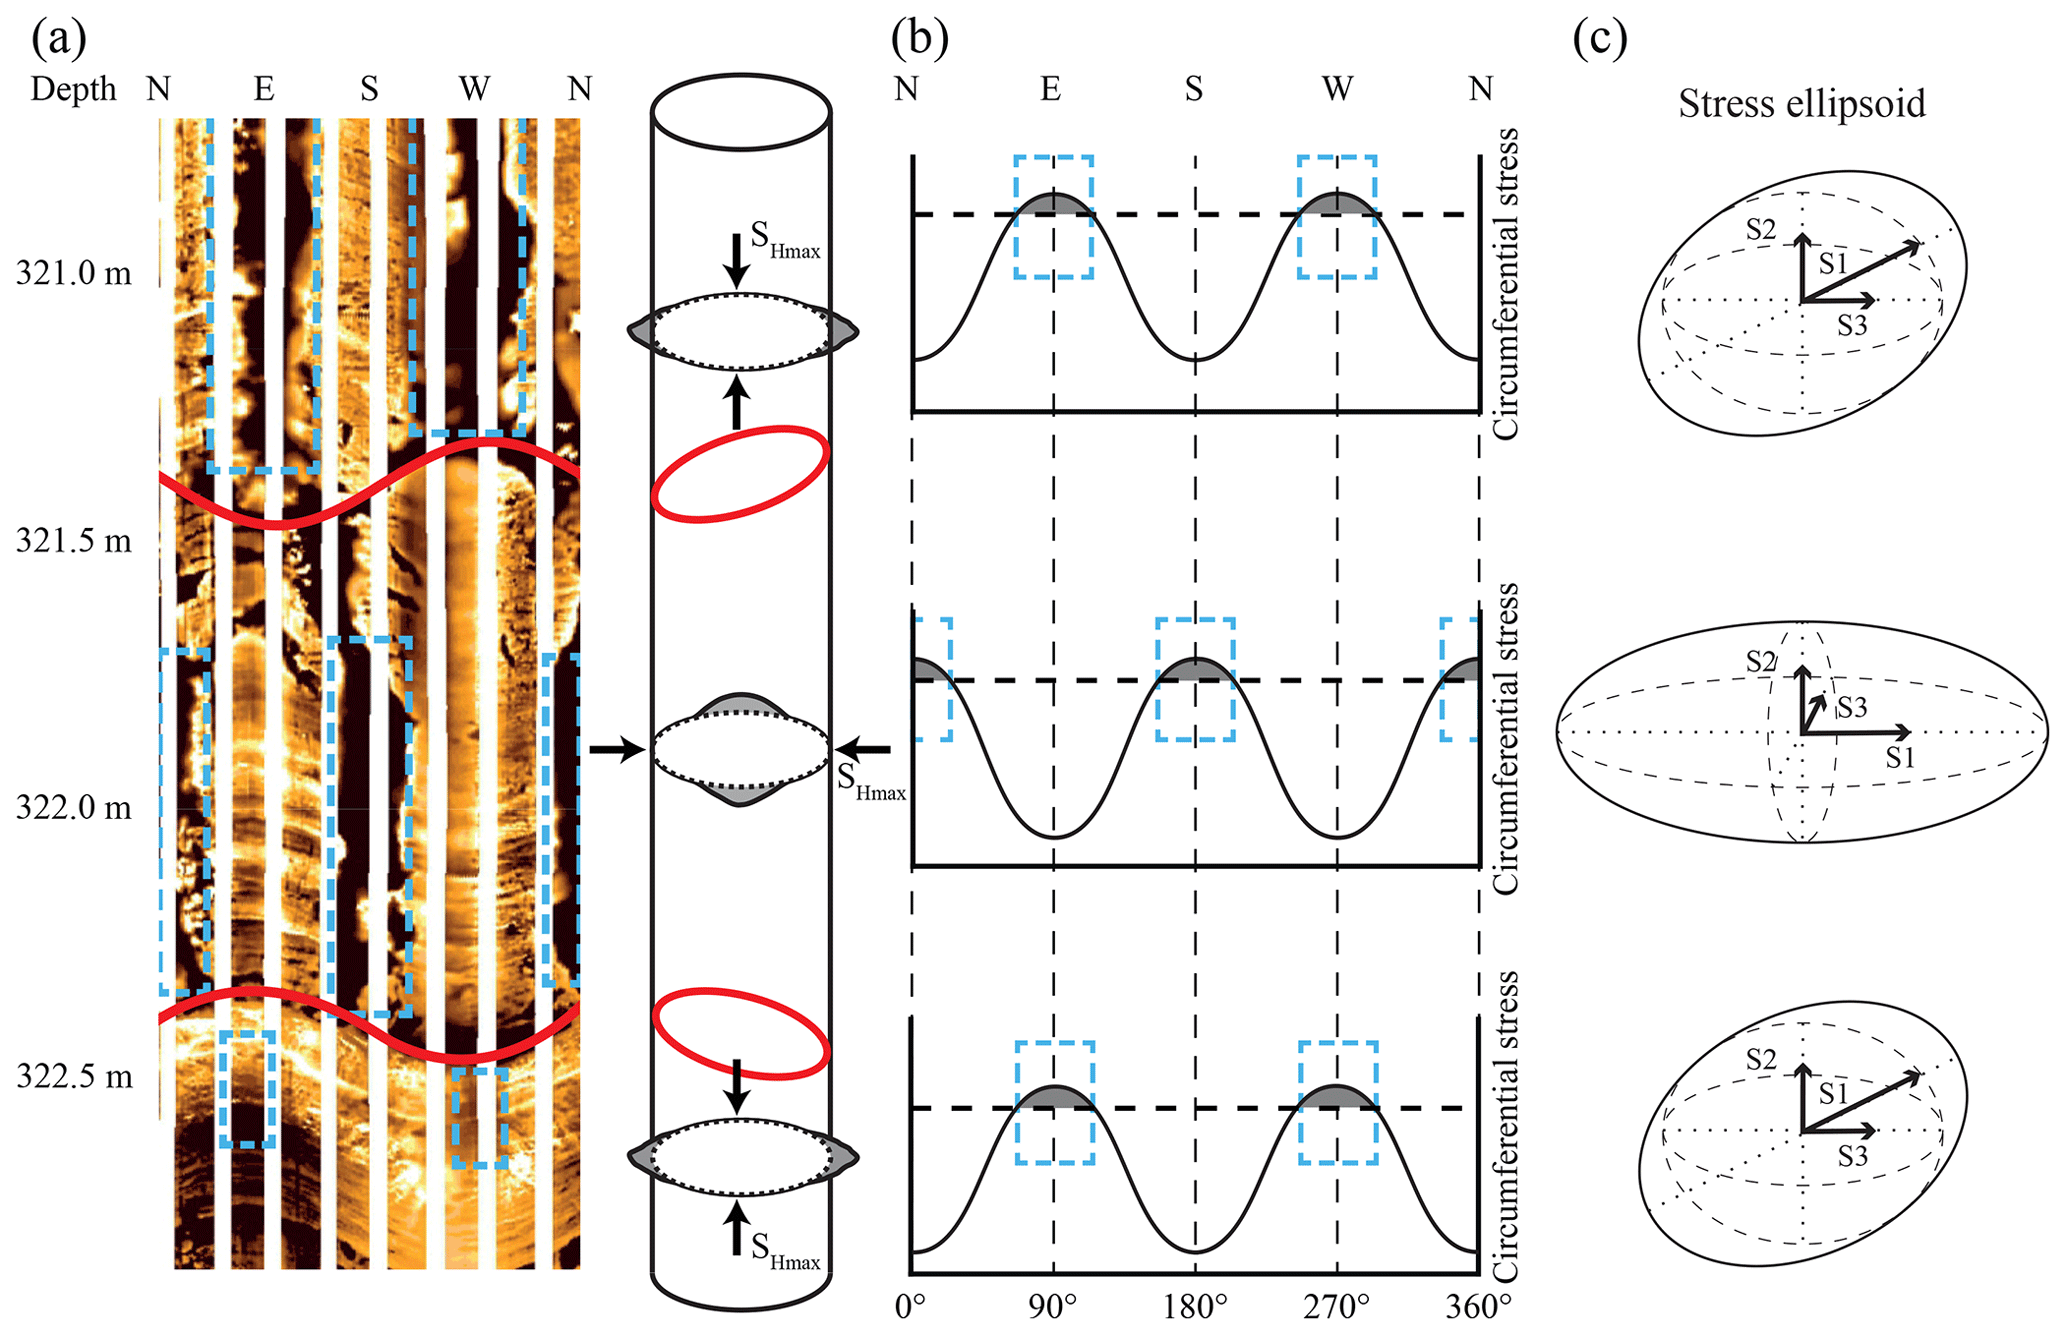
Figure 1An example of stress rotation due to the presence of a small-scale fault in a borehole. The regional SHmax orientation in the vicinity of this well is approx. 0° (Rajabi et al., 2017a) as indicated by borehole breakouts (black areas in image log) oriented east–west above and below the fault zone delineated by the two sinusoidal red lines. The part in between shows the section that is affected by the fault and thus shows a rotated stress state. (a) Borehole breakouts (dashed blue lines) interpreted in a resistivity image log in the Kenya East Well in the Surat Basin, eastern Australia, and the borehole diameter represented in 3D. Dark areas represent conductive zones where the borehole is elongated, while light areas show zones of high resistivity. (b) Variations of the circumferential stress at the borehole wall (bold sinusoidal line) with the orientations where the compressive strength (dashed horizontal line) is exceeded (grey areas) and breakouts occur (dashed blue lines). (c) Representation of the stress tensor above and below the fault with the stress ellipsoid visualizing orientations and magnitudes of the three principal stresses S1, S2, and S3.
Stress rotations are observed at various locations worldwide where boreholes have been drilled through faults while observations of the stress state were possible (e.g. Brudy et al., 1997; Cui et al., 2014; Hickman and Zoback, 2004; Lin et al., 2007). While some faults exhibit a rotation of up to 90° (Lin et al., 2007), others show significantly lower rotation (Cui et al., 2014; Hickman and Zoback, 2004) or considering the uncertainties almost no rotation at all (Yamada and Shibanuma, 2015). Even though stress rotations can be observed in boreholes under some circumstances, knowledge of where to expect stress rotations is important for subsurface operations that specifically target faults for their permeable properties (Freymark et al., 2019; Konrad et al., 2021) or may avoid them for the same reasons but still will encounter them (Gilmore et al., 2022; Long and Ewing, 2004). This raises the question as to which parameters determine a stress rotation and how sensitive they are.
The potential for stress rotation and the magnitude for such rotation are assumed to be determined by the smallest and largest principal stress components, S1 and S3, usually considered in terms of the differential stress S1–S3 (Reiter, 2021; Sonder, 1990; Ziegler et al., 2017); the contrast in rock stiffness between the fault and an intact host rock; and the angle of the fault strike represented by a rock stiffness contrast with respect to the orientation of SHmax (Reiter, 2021; Siler, 2023). Several additional parameters such as rock fabric and geological structures (i.e. faults and fractures) have been suggested as the possible causes of these stress re-orientations at small scales (Faulkner et al., 2006; Hung et al., 2007; Siler, 2023; Yale, 2003).
We investigate the reason for the diverse behaviour of the stress state at faults from a geomechanical perspective and investigate the influence of various parameters on the angle of stress rotation. We focus on the near field of the fault and the damage zone, i.e. the volume around the fault where the rock is significantly fractured and affected in its integrity. We expect a substantial influence of the far-field stress field in terms of the differential stress as shown in previous studies (Reiter, 2021; Sonder, 1990; Ziegler et al., 2017) but also in terms of the stress ratio . Furthermore, the contrast in material properties is the basis for any stress rotation and in particular the stiffness (Young's modulus) is demonstrated to have a significant influence (Hergert et al., 2015; Reiter, 2021; Ziegler, 2022). Eventually, the angle between the fault strike and the orientation of SHmax is investigated as an influential parameter (Reiter et al., 2024; Siler, 2023).
We use a generic geomechanical-numerical model that allows a systematic and comprehensive investigation of the model parameter space in terms of stiffness contrast, stress ratio, and angle of the fault with respect to the far-field stress state. We focus on the near field of the fault at scales of tens of metres and limit the investigation to the linear elastic response of the stress state to rock stiffness contrasts, which has not been investigated in previous studies that focused on processes Ziegler et al. (2017). Additionally, we did not investigate the full range of parameters (Reiter, 2021) and methods of fault representation due to a different objective (Reiter et al., 2024). Herein, we conduct an exhaustive study and investigate the entire parameter space.
In order to investigate the stress rotation at a fault dominated by mode-II failure (shear failure) we set up a numerical 2D plane strain model that focuses on the basic characteristics of a material contrast at faults. A generic mature fault zone is assumed with no damage zone outside the core and highly localized damage represented by a 5 m wide zone with a reduction in stiffness. The model assumes a vertical fault in a strike slip stress regime in map view, meaning that the largest principal stress component is S1=SHmax and the smallest principal stress component is S2 due to the limitation to two dimensions and is assumed to be Shmin. At the same time, the model is also representative of other types of faults, which requires us to assume the model to be a depth section. For a normal fault S1=Sv and S2=Shmin or for a thrust fault S1=SHmax and S2=Sv.
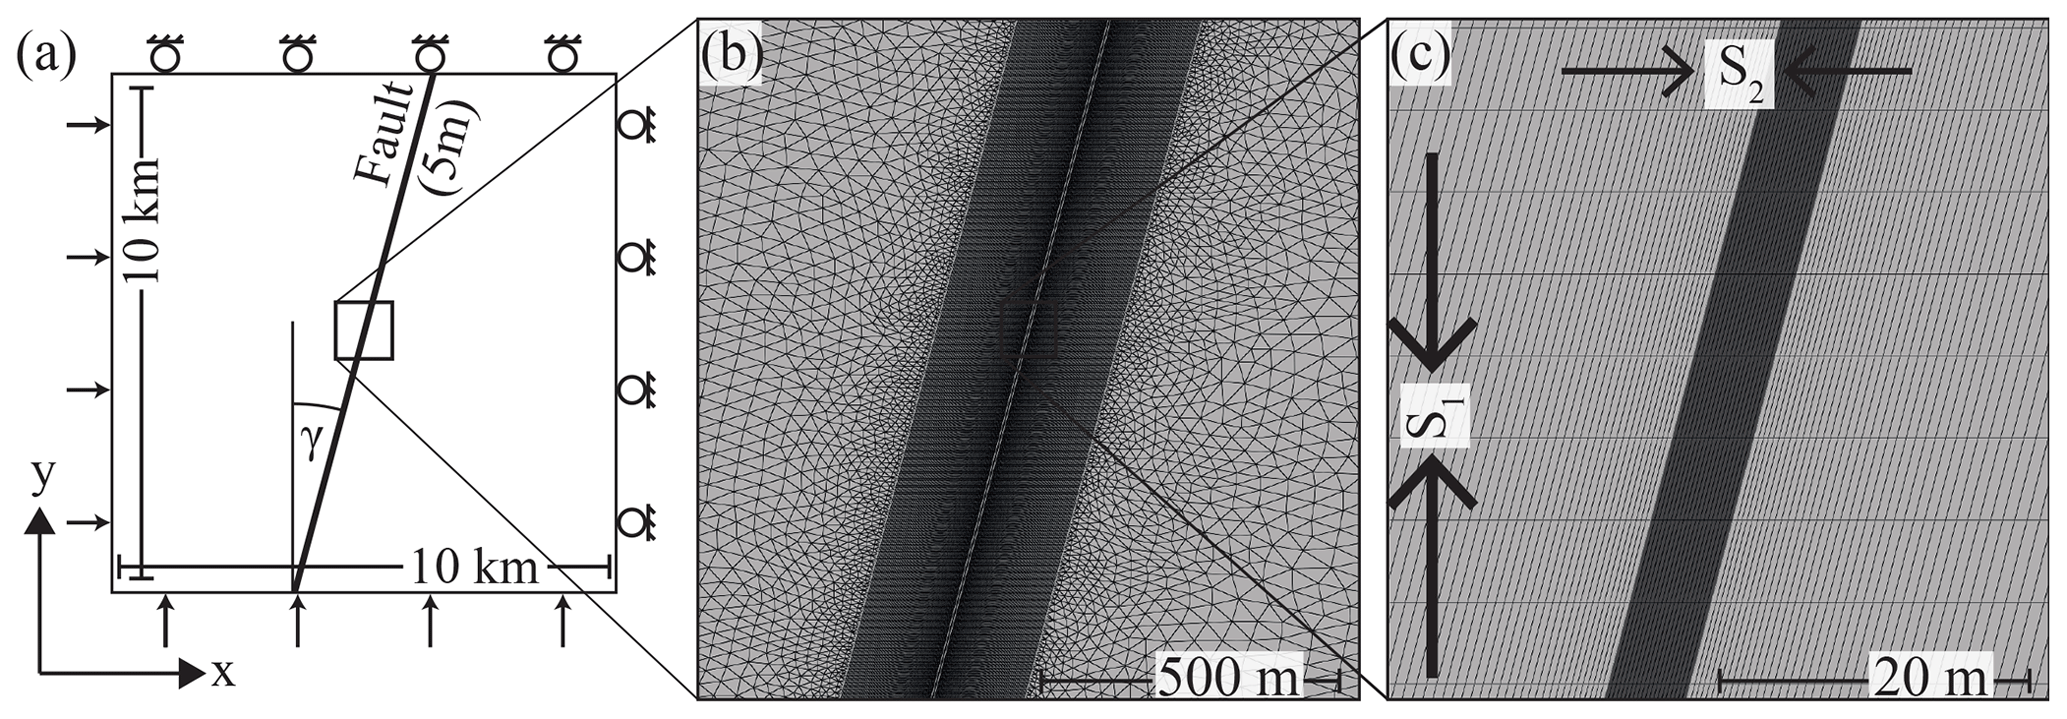
Figure 2Sketch of the model setup. (a) Conceptual setup of the generic 2D model with the applied boundary conditions and the location of the fault in the centre of the model. Please note that the fault can be rotated in 5° steps. (b) Detailed excerpt that shows the refined mesh geometry in the fault core and close to the fault. An area of 200 m on either side of the fault is discretized with quadrilateral elements for a better resolution. (c) Closeup of the fault (dark area) and its immediate vicinity (light area) that shows the high resolution of 25 cm normal to the fault strike and 5 m in fault strike direction. Please note that S1=SHmax and S2=Shmin.
The dimension of the numerical model is 10×10 km2 with a central 5 m wide fault that dissects the entire model (Fig. 2a). We use the finite-element method to solve the problem numerically and the model is discretized in a way that boundary effects and numerical artefacts are reduced (Homberg et al., 1997; Spann et al., 1994). Within the fault, plane strain quadrilateral elements form a finite-element mesh with a resolution of 5 m along strike and 0.25 m normal to the fault strike. These elements represent the fault by a rock stiffness that is different to that of the host rock. The 200 m at each side of the fault are also discretized by quadrilateral elements (Fig. 2c). The element size normal to the fault strike increases with distance from the fault. Outside the immediate vicinity of the fault, plane strain triangle elements with a mesh coarsening to 100 m at the boundary are used (Fig. 2b). In total, 19 realizations of the model were created with different strike angles of the fault. The number of elements slightly varies depending on the strike angle but is always between 145 612 and 172 484 elements. An exception is made for a high-resolution model (732 526 elements) for visualization purposes with a fault strike angle of 15°. The independence of the solution from the discretization is shown in Appendix A. The stress state of the model is controlled with displacement boundary conditions that are chosen in such a way that they result in the desired horizontal stress magnitudes (Fig. 2a) (Ziegler et al., 2023).
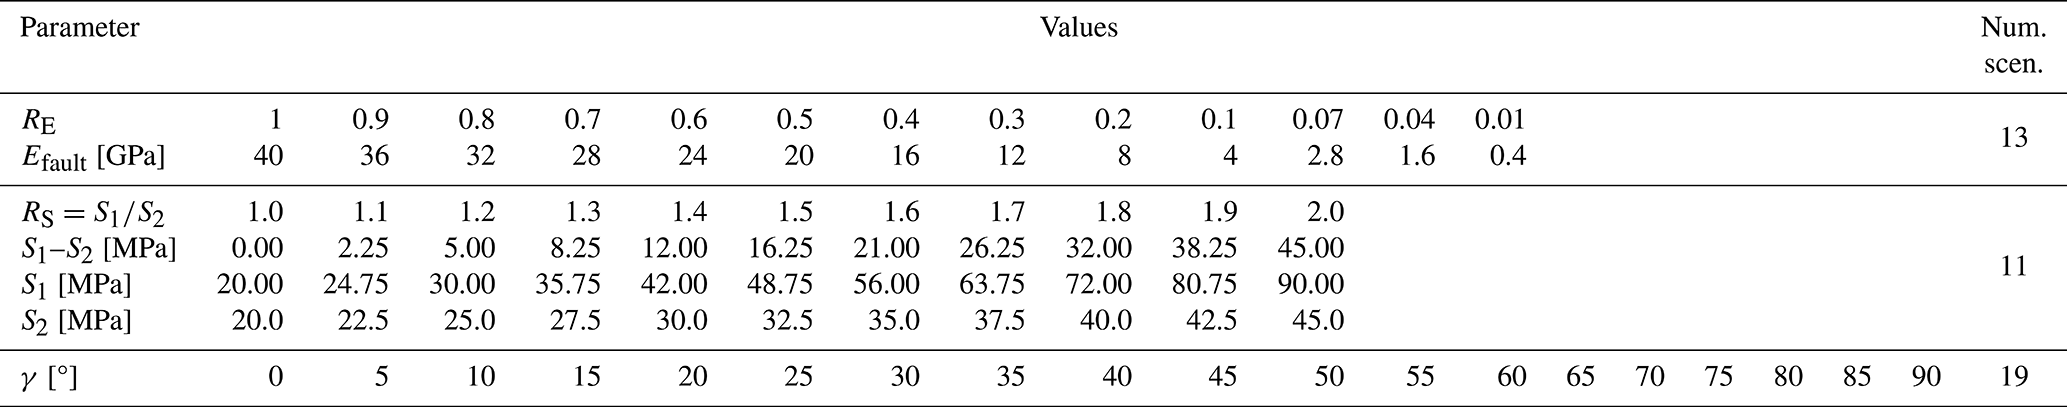
To evaluate which parameter controls the amount of stress rotation, we systematically vary the stiffness contrast between the fault and the host rock, the ratio of principal stresses , and the angle γ between the faults strike and the far-field S1 orientation (Table 1). For the host rock we choose a Young's modulus of Ehost=40 GPa and a Poisson's ratio of 0.25, and for the fault the stiffness is systematically varied between Efault=0.4 and Efault=40 GPa, resulting in 13 scenarios with a rock stiffness contrast between 0.01 and 1. This corresponds to a range from a very soft fault up to the intact rock. The Poisson's ratio was kept constant at 0.25 as the influence of the stiffness is considered the most important parameter, as shown by previous studies (Reiter, 2021; Ziegler, 2022). We tested the influence of the material contrast in 11 far-field principal stress ratios. We iterated the angle γ from 0 to 90° in 5° steps. For the full parameter space this results in total in 2717 model scenarios that were solved and then analysed.
Table 1Range of parameters investigated in this study. Note that the rock stiffness contrast RE has a step width of 0.1 (4 GPa) between a RE=1 and RE=0.1. Larger contrasts are realized to be 0.07, 0.04, and 0.01. The host rock always has a Young's modulus of Ehost=40 GPa. The stress ratio Rs, the differential stress S1–S2, and the absolute stress magnitudes are indicated. γ is the angle between fault strike and S1 orientation that varies between 0° (parallel) and 90° (perpendicular). The results of all computations are provided in the Supplement.
The rotation of the principal stress axes at a material contrast in a fault centre are investigated. In a sensitivity study, the influence on the rotation of (1) the material contrast ratio, (2) the initial stress ratio, and (3) the orientation between the fault strike and the background stress field orientation are tested. A 2D geomechanical–numerical finite-element model is used to rapidly solve various scenarios that are analysed in the following.
The models provided the normal stress components σxx and σyy and the shear stress component σxyat the nodes of the finite elements. The orientation of S1 in the far-field from the fault is parallel to the y axis (Fig. 2c). In order to obtain the angle of stress rotation we determine the change in the S1 and S2 orientation in the centre of the fault with the initial far-field orientation. The influence of the three individual parameters on the stress rotation angle is investigated in a sensitivity study in the following.
3.1 Basic behaviour
The difference between far-field stress state and the altered stress state due to the material contrast are displayed in Fig. 3. In order to initially test the hypothesis that the three parameters, the angle γ between the faults strike and the background stress field, the rock stiffness contrast RE, and the relative stress magnitudes of S1 and S2, influence the stress rotation angle, each of the parameters is changed, and the results are observed in the individual panels of Fig. 3 in comparison to Fig. 3a.
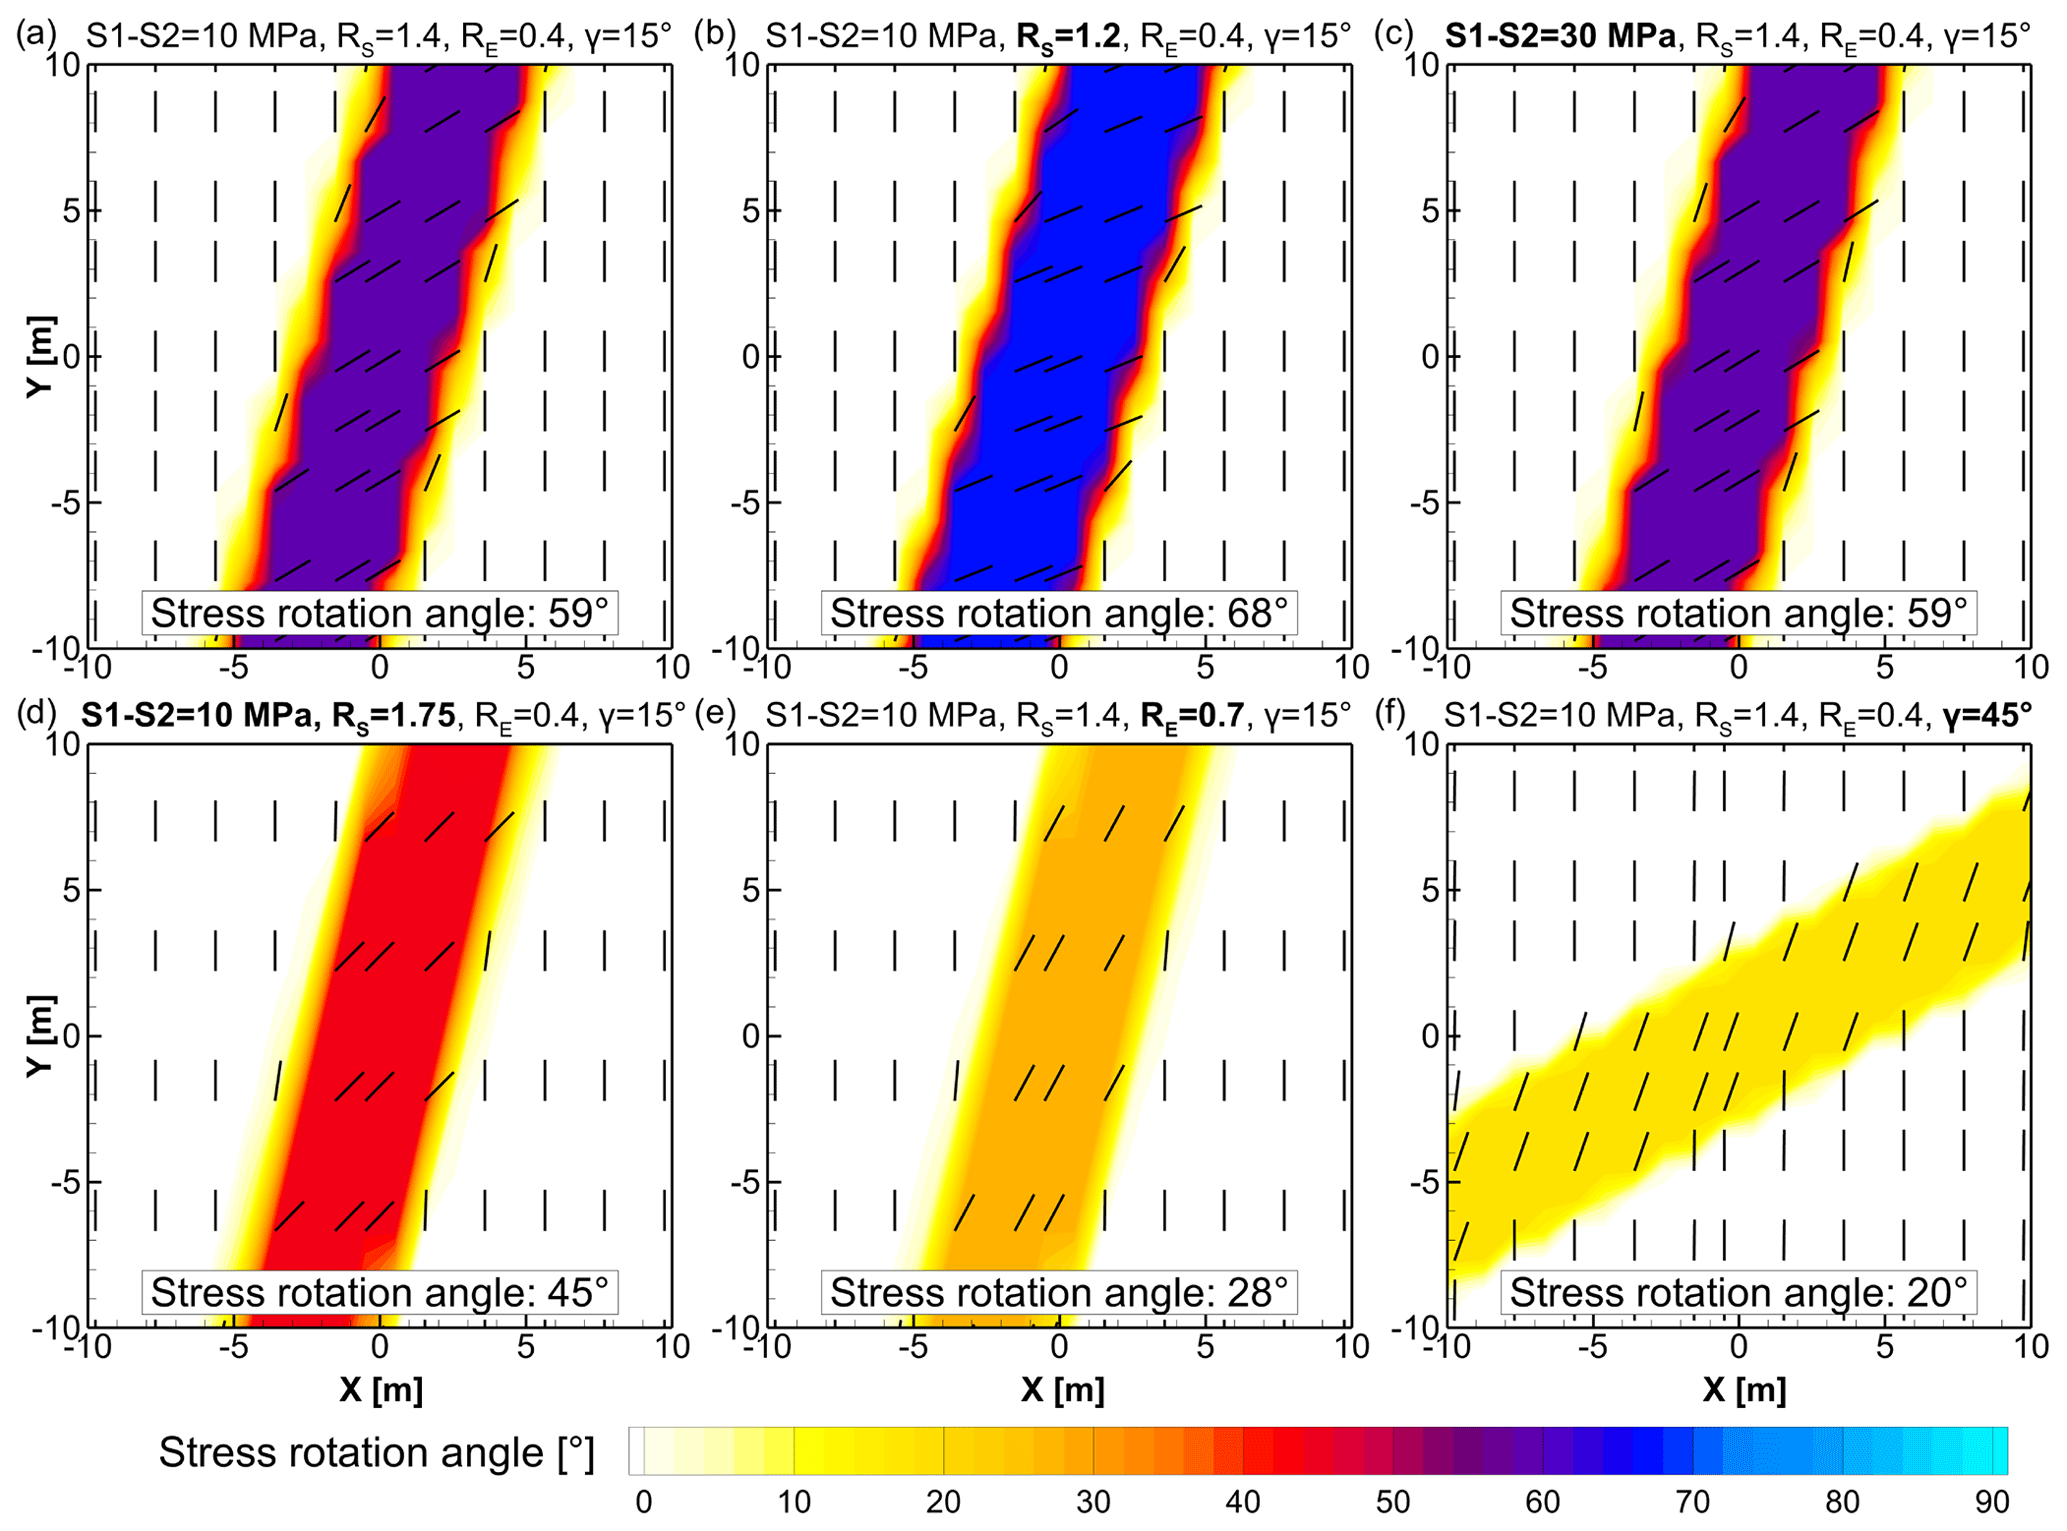
Figure 3Influence of different parameters on the stress rotation angle. The stress rotation is colour coded and shown as vectors or lines that indicate the S1 orientation due to a material contrast in the fault core area (Fig. 2c). (a) A basic setting with a fault that is 15° deviated from the orientation of S1, a differential stress of 10 MPa, a stress ratio of RS=1.4, and a rock stiffness contrast of RE=0.4 (E=16 GPa in the fault core and E=40 GPa in the host rock). This reference setting is compared with stress rotation based on individually changed parameters (bold in titles of b– f). (b) RS=1.2. (c) Differential stress increased to 30 MPa and RS=1.2. (d) Differential stress increased to 30 MPa with the same S2 magnitude as in (a), RS=1.75. (e) RE=0.7. (f) Deviation of 45° between fault strike and the S1 orientation. All parameters of all panels are comprehensively listed in Table 2.
The stress rotation for a fault with an angle γ=15° between the strike of the fault and the orientation of the far-field stress component (S1), a moderate stiffness contrast RE=0.4 (16 GPa fault, 40 GPa host rock), and a principal stress ratio RS=1.4 (S1=35 MPa, S2=25 MPa, S1–S2=10 MPa) is displayed in Fig. 3a. A clockwise rotation of the principal stress axes by 59° can be observed in the fault centre. Outside this zone, the principal stress orientations adhere to the far-field stress state as no visual rotation can be observed (Fig. 3a). This setting is used as a reference and compared to changes due to altered individual parameters in the following. The results are displayed in Fig. 3 and summarized in Table 2.
Table 2All parameters of the model scenarios tested in Fig. 3 listed according to the panels.
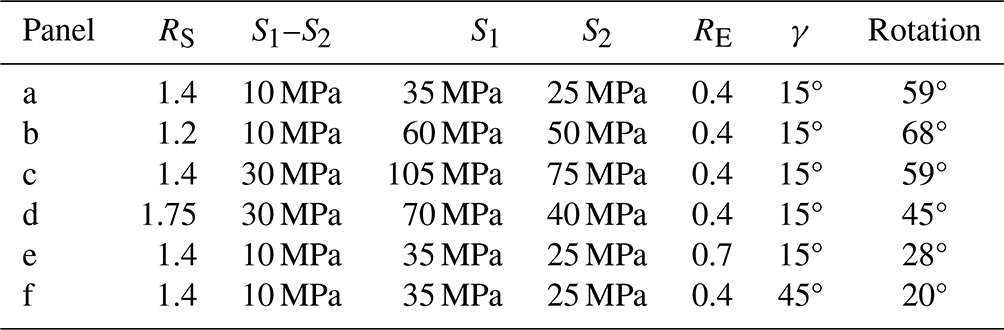
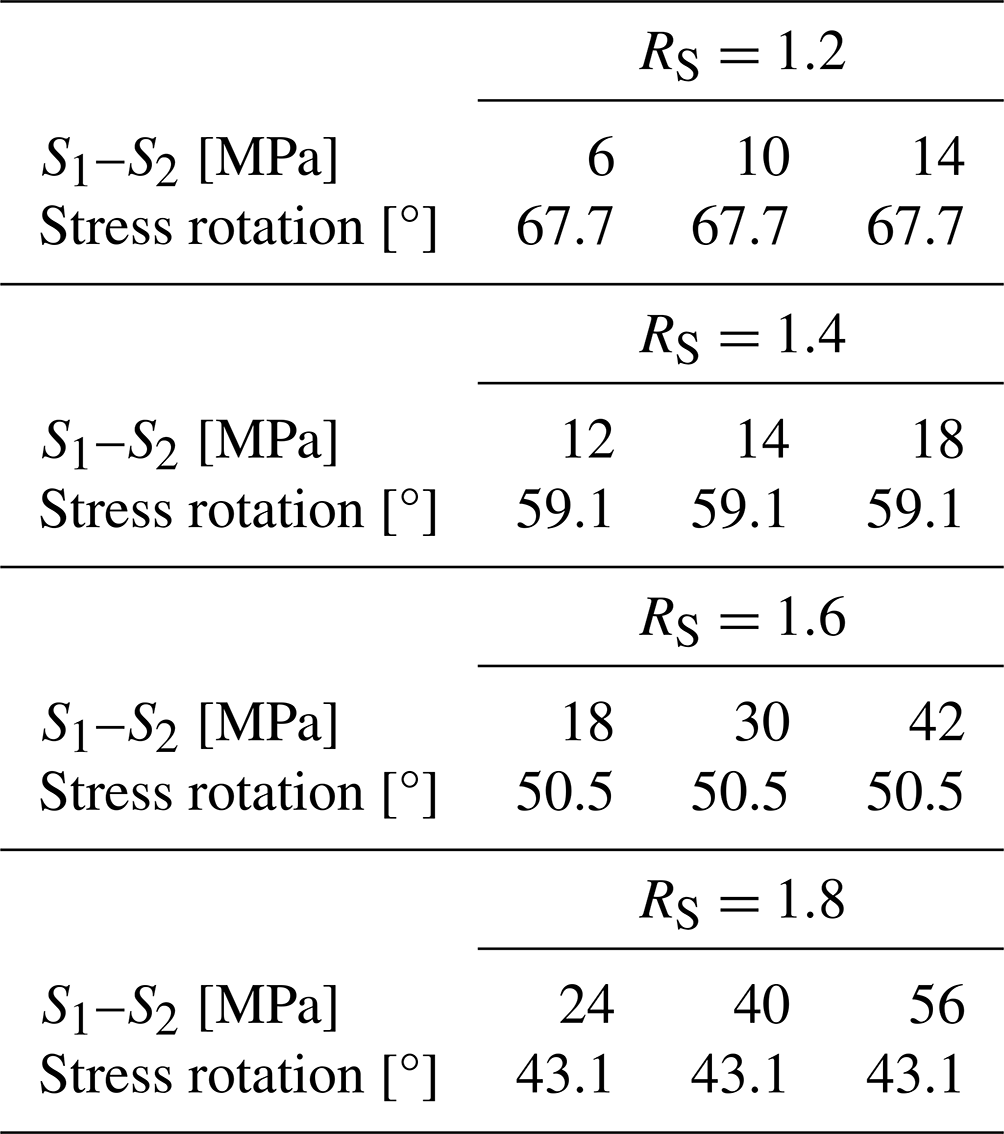
A decrease in the stress ratio to RS=1.2 while the differential stress S1–S2 remains constant (but the magnitudes of the principal stresses change to S1=60 MPa and S2=50 MPa) leads to an increased stress rotation angle of 68° (Fig. 3b). An increase in S1–S2 from 10 to 30 MPa (S1=105 MPa, S2=75 MPa) while RS=1.4 and therefore constant results in the same rotation angle of 59° as in the reference case (Fig. 3c). In contrast, an increase in S1–S2 to 30 MPa (S1=70 MPa, S2=40 MPa) with a change in stress ratio to RS=1.75 results in a decrease in stress rotation to 45° (Fig. 3d). This indicates that it is rather the stress ratio RS that controls the stress rotation than the differential stress S1–S2. A more comprehensive comparison is shown in Table 3, which indicates the independence of stress rotation angle from differential stress S1–S2 and its dependence on stress ratio RS.
Table 3Dependence of the stress rotation on the stress ratio RS. The RS values are compared with different S1–S2 associated with the same angle γ=15° and the same rock stiffness contrast RE=0.4.
A reduction in the stiffness contrast from RE=0.4 to RE=0.7 means that the fault is stiffer and thus closer to the host rock's stiffness. This results in a reduction in the stress rotation of 31 to 28° (Fig. 3e). This positive correlation of rock stiffness contrast RE to potential stress rotation angle has been observed previously (Reiter, 2021). It is intuitive in that with the assumptions made herein the same stiffness in fault and host rock (RE=1) cannot lead to any rotation at all. Thus, greater stiffness contrast (small values for RE) promote less stress rotation.
An increase in the angle γ between the fault strike and the far-field S1 orientation from initially 15° to now 45° results in a smaller rotation angle of 19° (Fig. 3f). The angle γ is thus negatively correlated with the rotation angle. No rotation is expected for faults that strike perpendicular to the S1 orientation (γ=90°). Large stress rotation angles are expected for faults that strike with a low angle towards the S1 orientation.
3.2 Spatial effects
As already indicated in Fig. 3, stress rotation is observed only directly in the fault zone where a rock stiffness contrast RE exists. In order to investigate its influence beyond the fault itself we display the stress rotation angle as a function of distance normal to the fault (Fig. 4). In this idealized representation of a fault without a damage zone, no significant changes in the orientation of S1 can be observed outside the fault (Fig. 4). However, significantly different stress rotation angles are observed within the fault dependent on the RE value in line with the observations made in Fig. 3b and e.
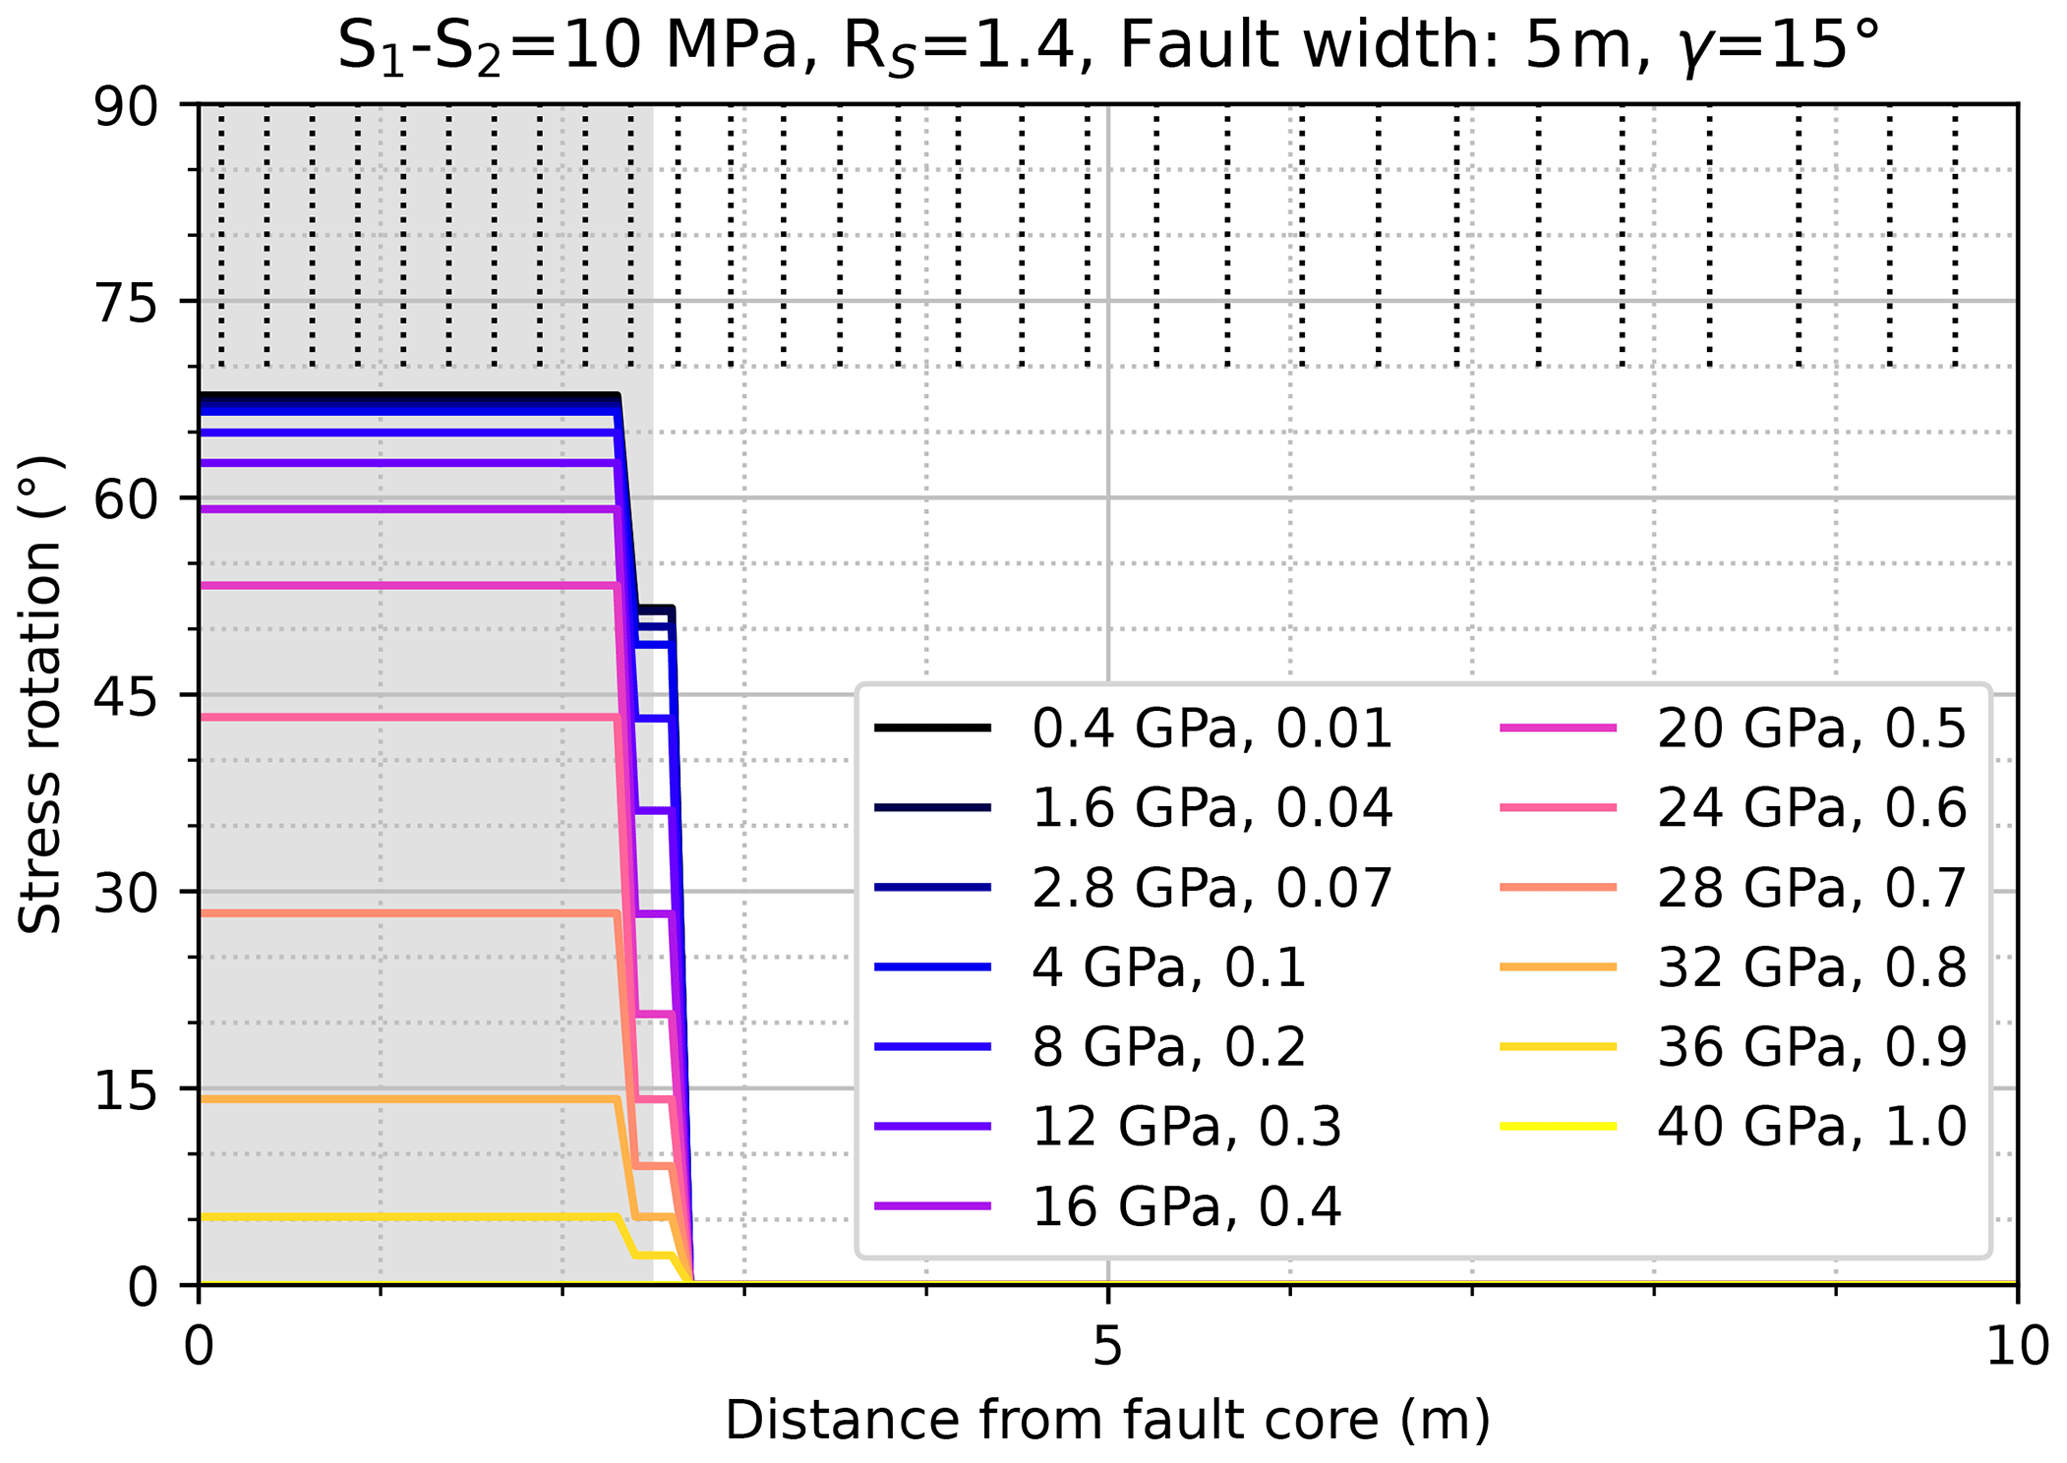
Figure 4Intrinsic stress rotation in the fault zone as a function of increasing rock stiffness contrast. The abrupt change from a rotated to a far-field stress state is observed at the border of the fault. The rotation is shown perpendicular to the fault. The rock stiffness contrast between the fault's Young's modulus and a host rock stiffness of Ehost=40 GPa is colour coded and indicated in the legend as absolute values in GPa and ratio RE. For reference, the purple line RE=0.4 is taken from Fig. 3a, while the orange line RE=0.7 is taken from Fig. 3e. See also Table 2. The distance from the fault core centre (x axis) in relation to the stress rotation (y axis) is shown. The vertical dotted lines at the top indicate the discretization normal to the fault strike with an element size of 25 cm within the fault and increasing outside the fault. Please note that the distance is from the fault core centre, and thus only half of the fault width is shown here in grey.
Furthermore, within the contrasting rock volumes there is no gradual difference observed between the borders and the centre (Fig. 4). Only at the border between fault and host rock can an intermediate stress rotation angle be observed (transition from grey to white in Fig. 4). This apparent stress rotation should not be interpreted as it is a result of the interpolation from the integration points within the elements to the nodes. At the borders between bodies with different material properties the stress state is a mixture of stress states from the two bounding lithologies and its extent depends on the discretization. It can be disregarded in the following analysis. Thus, in the following we refer to the stress rotation in the centre of the modelled fault only. This allows us to display the results in a more comprehensive way (Fig. 5).
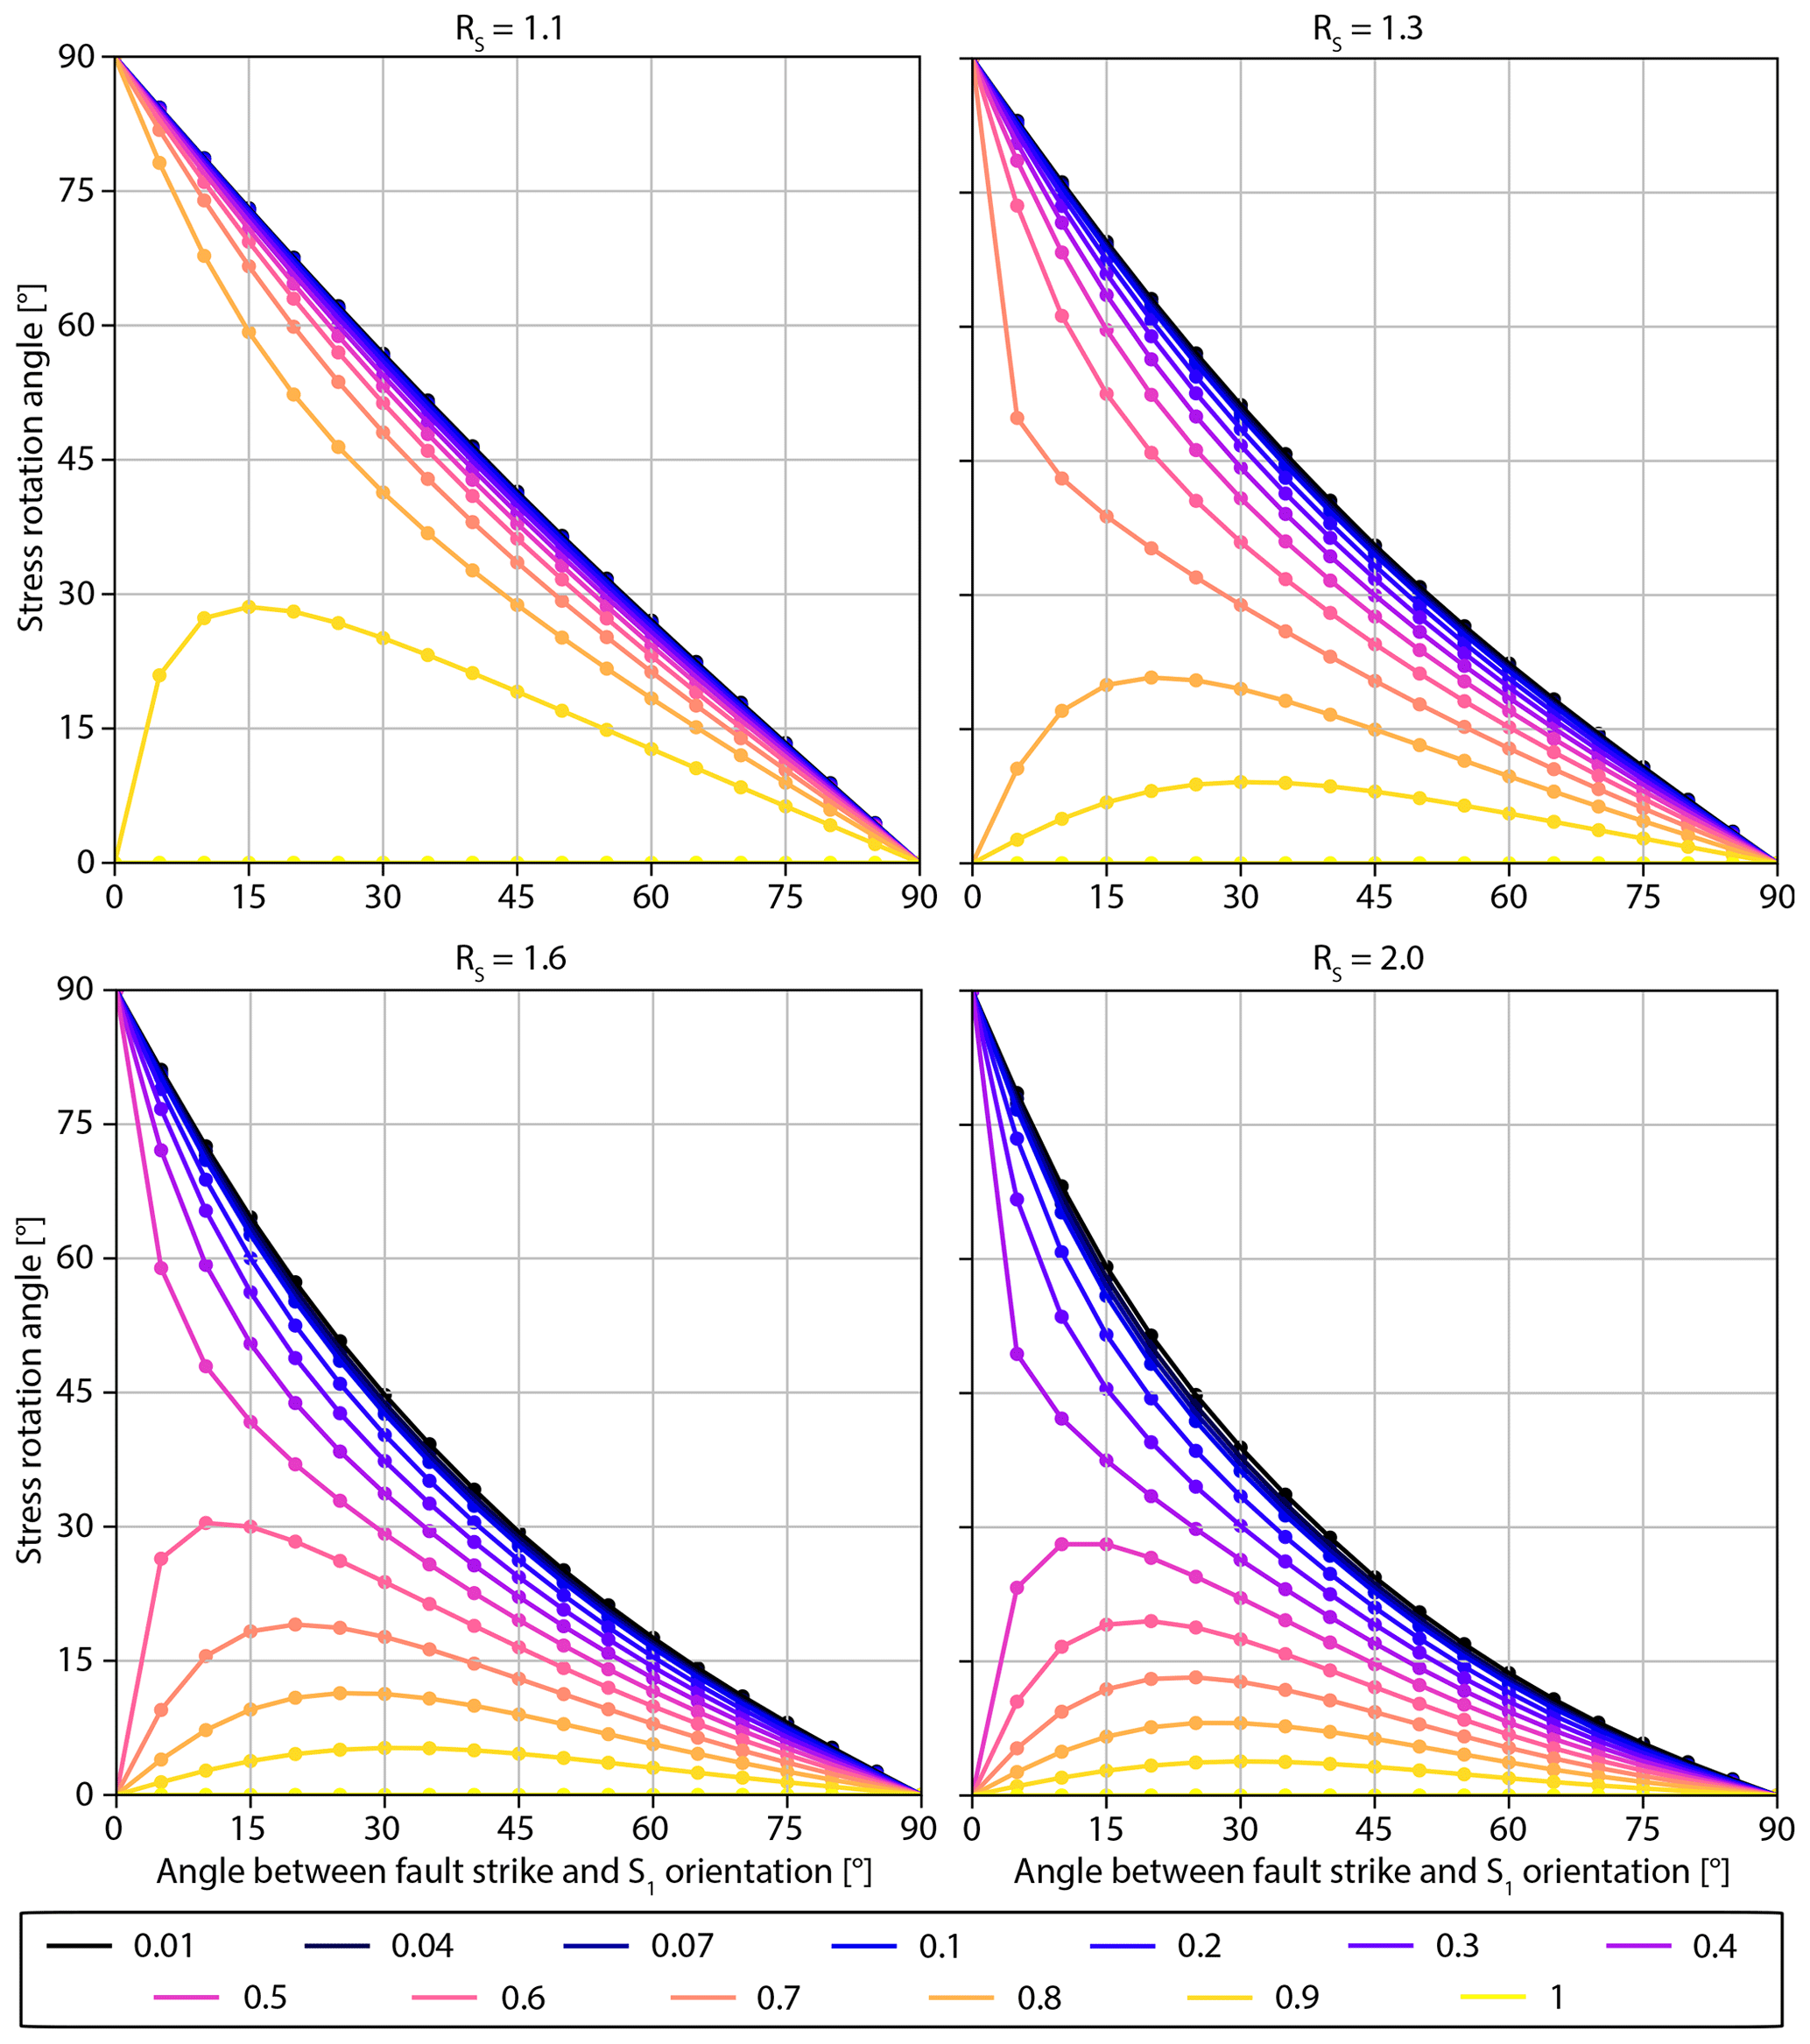
Figure 5The dependence of stress rotation inside the fault core (y axes) on the angle γ between the fault strike and the far-field orientation of S1 (x axes), the stiffness contrast RE between fault core and host rock (colour-coded lines), and the stress ratio RS (panels). The underlying data are provided in the Supplement.
3.3 Parameter space
In order to explore the full parameter space, we chose a different visualization. Each stress ratio RS is represented by an individual diagram (panels of Fig. 5). Within each diagram, the angle γ between fault strike and S1 orientation is related to the modelled stress rotation angle. Each model scenario with an individual set of parameters is now displayed as a point in a diagram (Fig. 5). The material contrast RE is colour coded. Four different stress ratios RS are compared in the four panels of Fig. 5.
The initial observation is the importance of the angle γ. Structures with a significant contrast in rock stiffness that are perpendicular to the far-field orientation of S1 (γ=90°) do not exhibit any rotation of the principal stress axes at all. This is independent of all other parameters. In turn, structures parallel to the S1 orientation (γ=0°) can rotate by up to 90°. This signifies a mutual replacement of S1 and S2 orientation. Whether a stress rotation of 90° is reached or not is tied to the ratios RE and RS.
For large contrasts (i.e. small RE) and small RS values, the maximum stress rotation angle is reached in several scenarios. At the same time, high RE values limit the maximally achieved stress rotation angle. The maximum angle for any given RE value is then up to 90° and controlled by the stress ratio RS (Fig. 5). However, in these cases the maximum angle is not observed for γ=0° but for angles . Apparently, for an angle γ=0° either no stress rotation at all or the maximally possible stress rotation of 90° occurs.
The large influence of the RS value is additionally displayed in a representation of the three model parameters investigated in this study, where the decisiveness of the RS value becomes apparent (Fig. 6). This is particularly observable for RE=0.6 at faults that are striking parallel to the S1 orientation (γ=0°). A low RS of around 1.1 leads to a stress rotation of 90° (Fig. 5a). However, an increase in RS to ≥1.5 (Fig. 6) prevents any stress rotation at all.
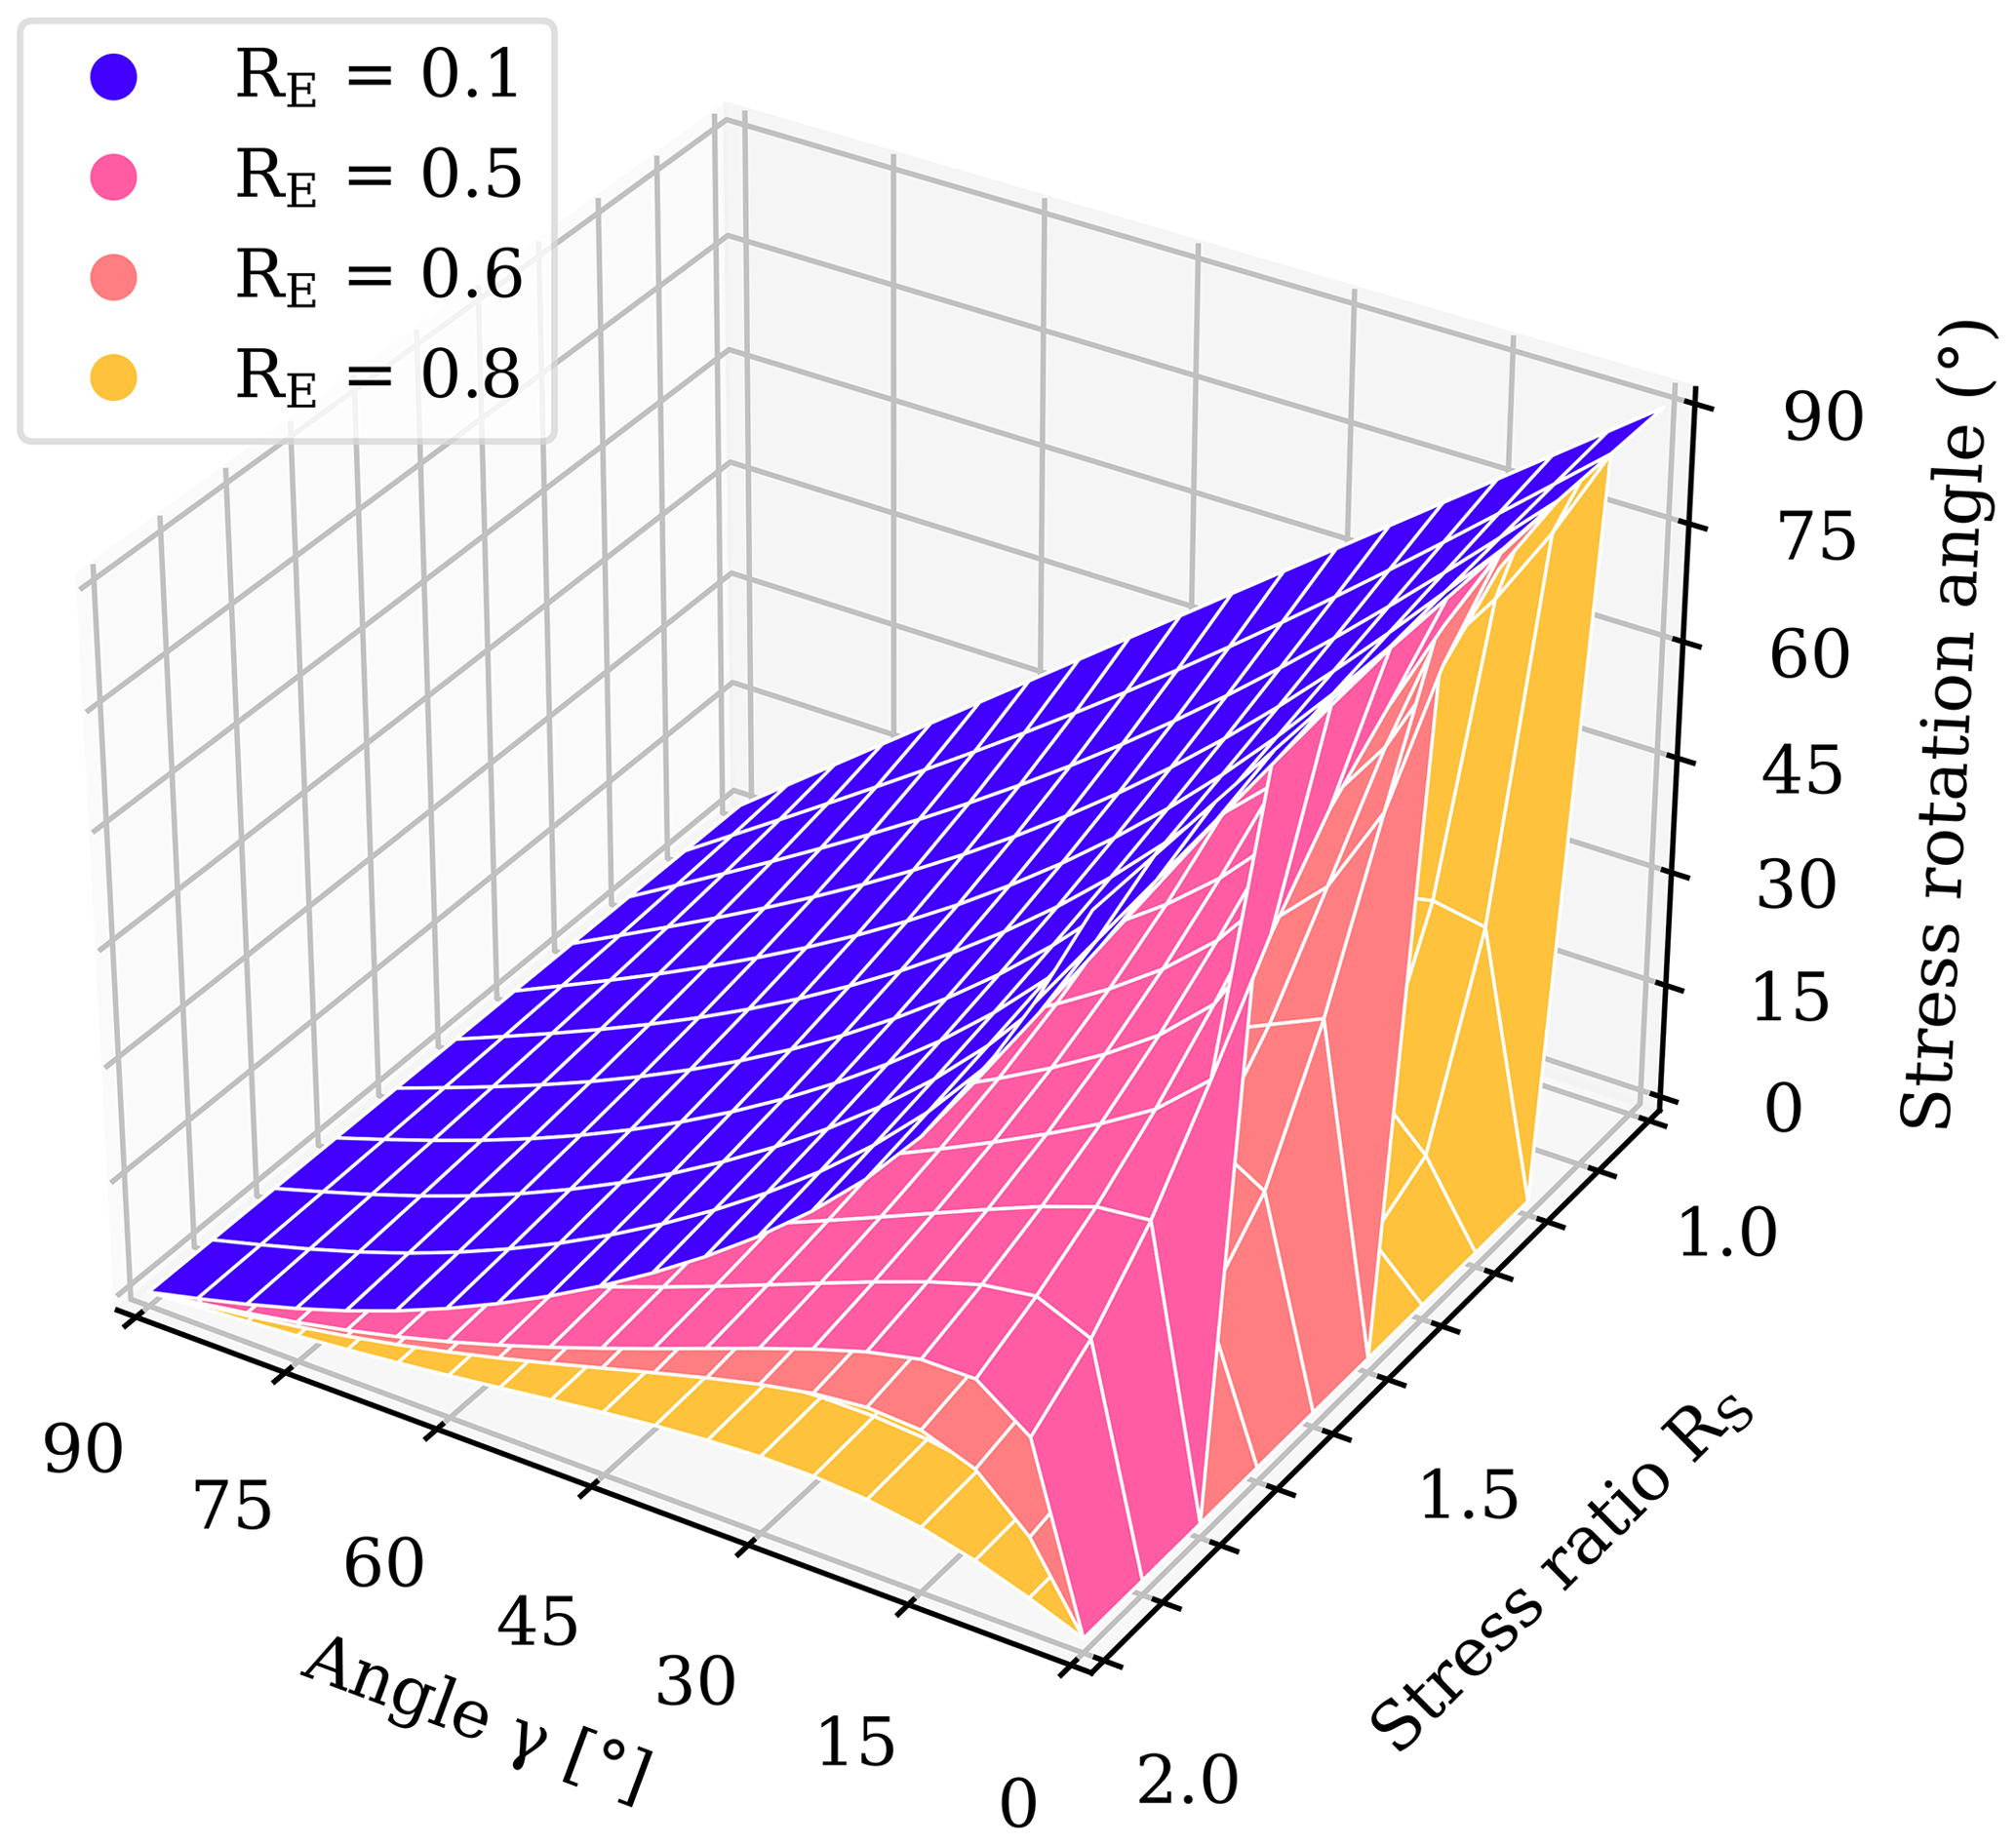
Figure 6A 3D representation of the stress rotation (z axis) and its dependency on the stiffness contrast RE (colour-coded planes), the angle γ between fault and S1 orientation (x axis), and the stress ratio RS (y axis). To improve visibility, only four different RE values are displayed.
These results show that the previously indicated correlations (Fig. 3) can be confirmed. These correlations are as follows.
-
A negative correlation between RS and the stress rotation angle, i.e. large stress rotations for principal stress magnitudes that are similar to each other.
-
A negative correlation between RE and the stress rotation angle, i.e. large stress rotations for large material contrast (small values of RE).
-
A mostly negative correlation between the angle γ between strike angle vs. far-field S1 orientation and the stress rotation angle, meaning that S1 that acts normal to a faults strike will see no rotation. An exception is an angle of γ=0°, where either no stress rotation or a rotation of 90° is observed.
This shows the combined influence of the stress ratio, the magnitude of material contrast, and the orientation of the fault strike compared to the far-field stress state on the angle of stress rotation. The expected angle of stress rotation can be estimated if all corresponding data are available.
In addition to the previously mentioned correlations, further rules can be observed in Fig. 5. The sum of the angle between fault strike and far-field stress orientation γ and the angle of observed stress rotation cannot exceed 90°. No rotation is observed if the fault strikes perpendicular to the far-field stress orientation, i.e. γ=90°. A rotation of 90° is only possible if γ=0°. However, a rotation of 90° is not observed for all scenarios with γ=0°. Whether any rotation is observed or not depends on the stiffness contrast. This highlights the importance of all three parameters on the expected angle of stress rotation.
The influence of the rock stiffness contrast RE, the stress ratio RS, and angle between a fault or a geological structure and the far-field S1 orientation on the rotation of the principal stress axes are derived from a generic study using a 2D plane strain numerical model. The results indicate the importance of the aforementioned parameters on the possibility of occurrence and expected angle of stress rotation. They are discussed in light of their general geological implications, impact on geo-energy applications, and limitations.
4.1 Implication for fault zones
Faults and fault zones are diverse in their extent, characteristics, and behaviour (Gabrielsen et al., 2017; Childs et al., 2009). While they have several characteristics in common, other features may vary greatly. For example, for some faults a significant damage zone is expected around the fault core that largely depends on the faults maturity (Gabrielsen et al., 2017; Childs et al., 2009). Furthermore, the dominant processes that control fault zone behaviour differ, which highlights the complexity of geomechanically describing a fault zone.
For the presented study, we assume a weakened fault core compared to the host rock (Casey, 1980; Faulkner et al., 2006, 2010; Isaacs et al., 2008; Holdsworth, 2004; Collettini et al., 2009). The weakness of fault material is herein implemented as a reduced Young's modulus focused on the fault core assuming a mature fault zone with a clearly delineated core and localized damage. Such a sharp elastic stiffness contrast between the host rock and the fault core is observed for some fault zones in nature (Barton and Zoback, 1994; Holdsworth et al., 2010). Other (less mature) fault zones have several metres (Barton and Zoback, 1994; Lockner et al., 2009) or even several tens of metres (Faulkner et al., 2006, 2010; Li et al., 2012; Williams et al., 2016) of damage zone, which separates the intact rock from the fault core.
To investigate the influence of a significant damage zone as assumed for an immature fault zone, a gradual change in rock properties is implemented in an additional model. Therefore, a linear gradient in rock stiffness perpendicular to the fault strike increases the Young's modulus from the fault's stiffness to the host rock's stiffness. The resulting stress rotation displays a gradual decrease from the fault core towards the intact host rock (Fig. 7). The angles observed within the damage zone correspond to those observed for the same rock stiffness within the fault core from previous model results (Fig. 5). They do not show any particular deviations from the previously modelled correlations. It is particularly noteworthy that the non-linear dependency on the rock stiffness contrast is reflected in the gradual decrease in stress rotation from the fault core through the damage zone towards the intact host rock.
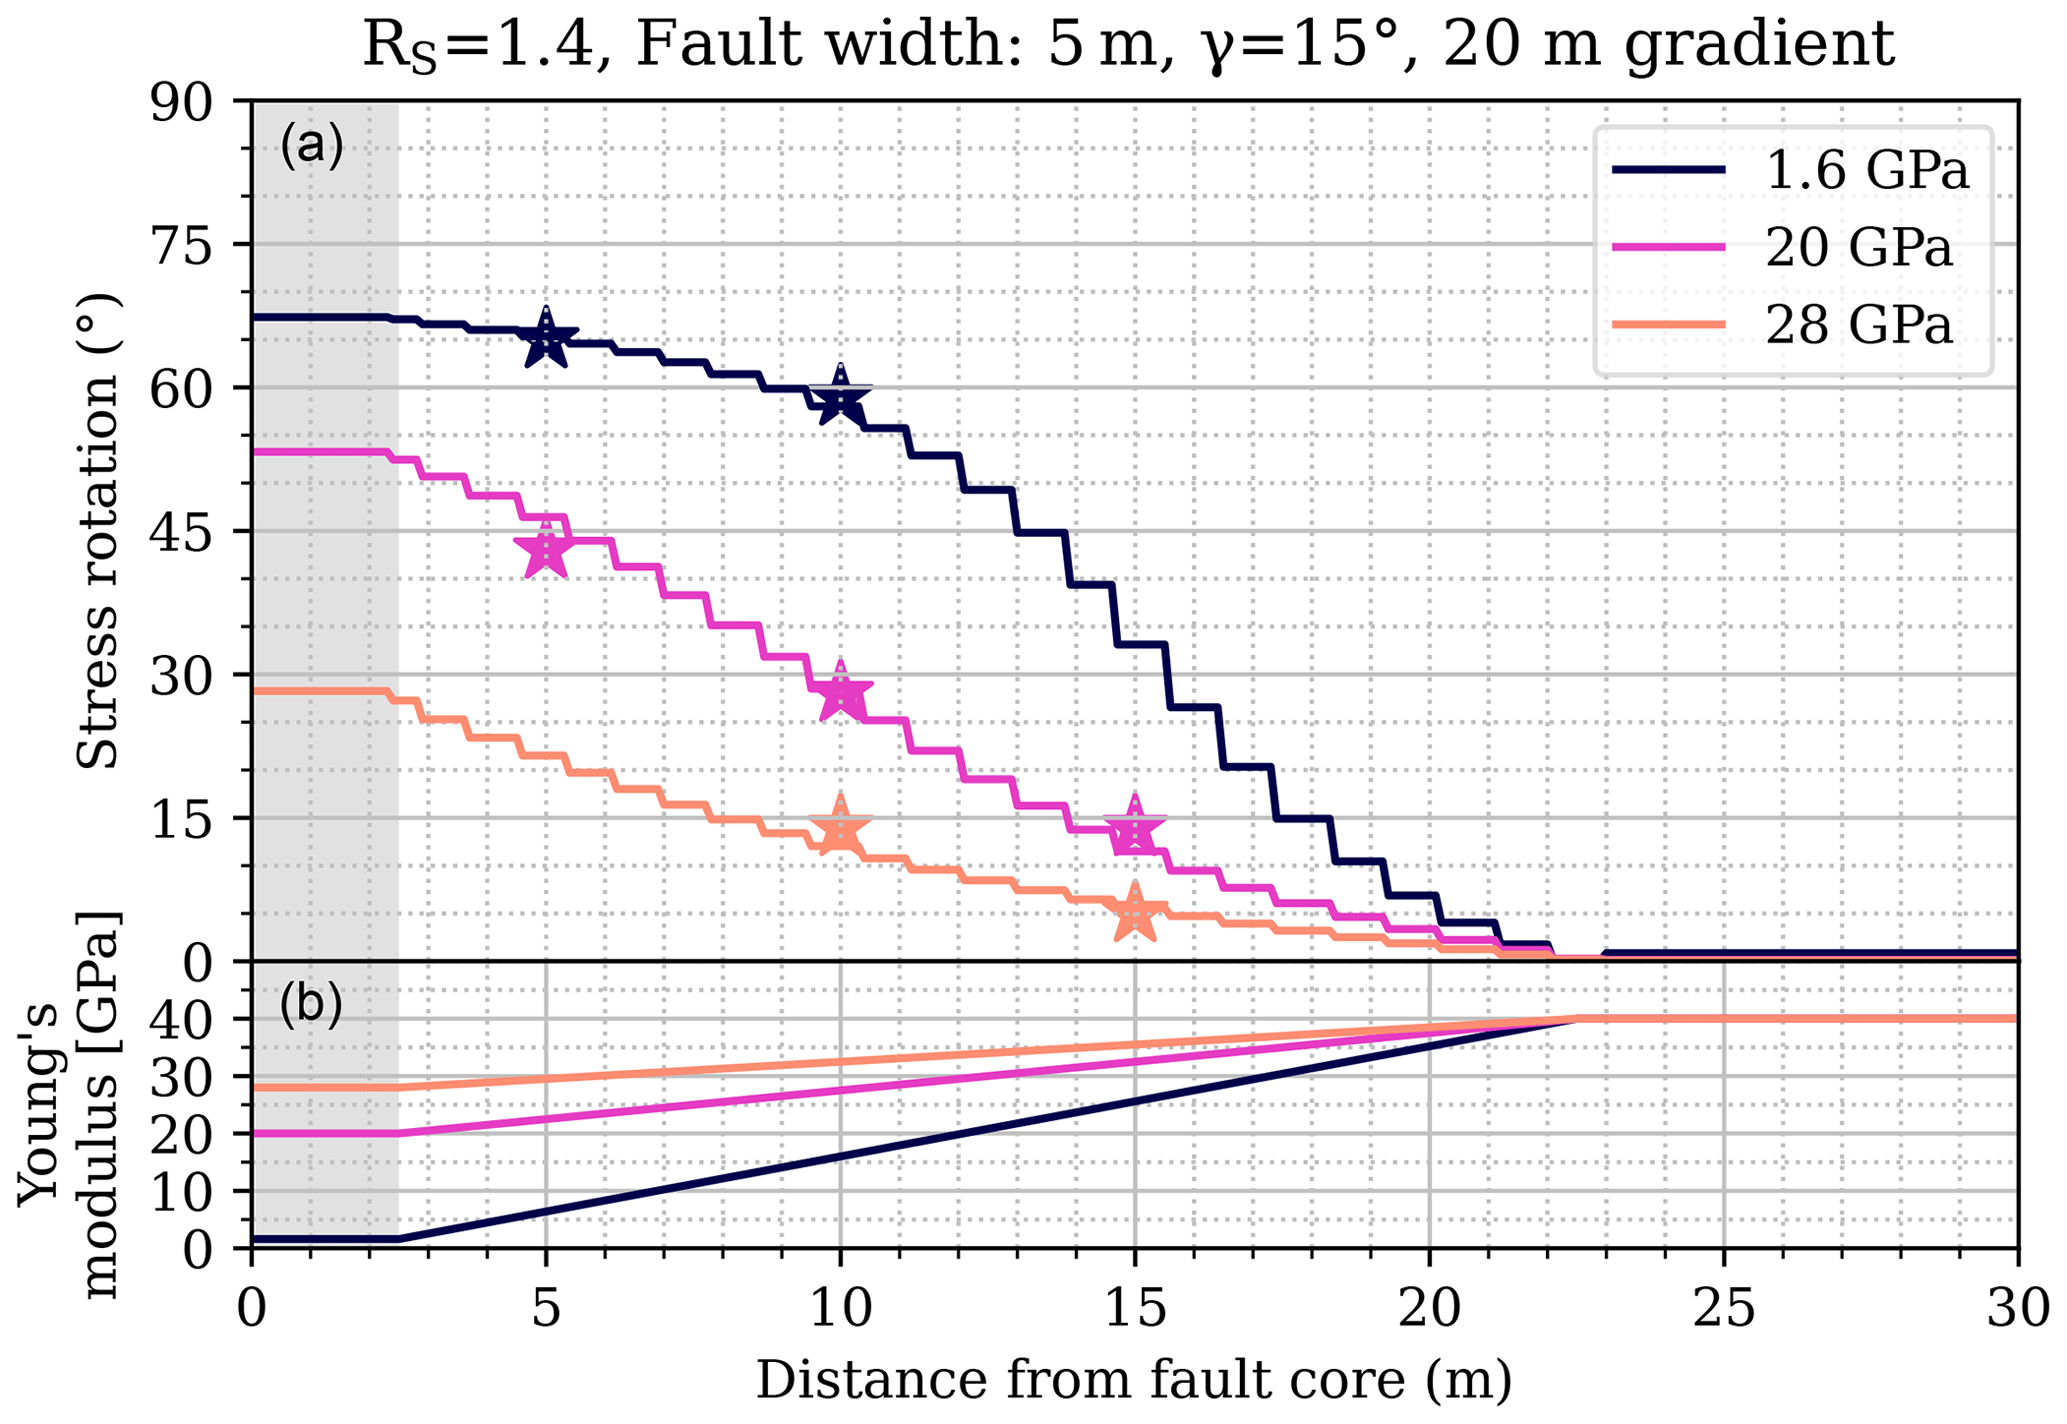
Figure 7Stress rotation in the vicinity of a fault (a) with different fault stiffness (colour-coded lines) in contrast to the same host rock stiffness of 40 GPa with a stress ratio RS=1.4 and an angle γ=15°. The damage zone of the fault is realized by an increase in stiffness over 20 m (b). The stress rotation angles expected according to the presented study (Fig. 5) without a gradient of rock stiffness are indicated (stars).
This shows that the extent of a deviated stress field around a structure with different rock stiffness is dependent on the transition from host rock properties to deviated rock properties. This means that in this simple and generic case the different rock properties in the structure itself do not have any influence on the stress rotation angle beyond its border. Any modelling approach that chooses a representation of faults by a weakened rock material has to include the damage zone – if it is observed and its extent is known – in terms of rock properties.
4.2 Application
Modelling of the behaviour of a stiffness contrast with regard to stress rotation is of particular interest for geotechnical ventures. The occurrence of stress rotation is particularly significant for applications such as geothermal energy, where faults are often specifically targeted for their permeability (Barton et al., 1995; Konrad et al., 2021; Seithel et al., 2015; Siler, 2023). At the same time, these faults potentially host induced seismicity (Gaucher et al., 2015; Schoenball et al., 2014; Seithel et al., 2019). Further geotechnical operations, such as mining and tunnelling, affect the stress state, weaken the rock, and lead to stress rotations themselves (Cai et al., 2022; Ptáček et al., 2015; Ziegler et al., 2015), which can lead to rockfall or other damage. Thus, it is of key interest to estimate the potential for these damage sources, such as (induced) seismicity on pre-existing faults, in advance.
This requires detailed information on the stress state itself, but information on the angle of faults with respect to the stress state is also crucial (Healy and Hicks, 2022; Morris et al., 1996; Röckel et al., 2022; Worum et al., 2004). A regional stress state obtained from geomechanical models often does not include local fault geometries (Ahlers et al., 2022; Clavijo et al., 2024; Gradmann et al., 2024). The modelled stress state is thus then mapped to fault geometries and the according potential for failure is estimated (Röckel et al., 2022; Vadacca et al., 2021; Ziegler et al., 2016a, b). In other instances, faults and their effect on the stress field are included in the model (Hergert et al., 2015; Wees et al., 2003; Xing et al., 2007).
Various different approaches to include faults in a model exist which mimic the different involved processes that have a different impact on the fault behaviour (Henk, 2020; Reiter et al., 2024; Treffeisen and Henk, 2020; Cappa and Rutqvist, 2011). As a result, faults represented in numerical models tend to be implemented in different ways depending on the focus of a study (Henk, 2020; Reiter et al., 2024). Instead of aiming at a realistic representation of a fault, different aspects of a faults properties are commonly investigated individually. This can be the slip behaviour (Hergert et al., 2015; Reiter et al., 2024), the plastic deformation (Nabavi et al., 2018), or the approach presented in this study as the alteration of rock properties in the immediate fault core and damage zone (Reiter et al., 2024; Treffeisen and Henk, 2020; Cappa and Rutqvist, 2011).
This means that there is a chance that the reactivation potential of a fault is incorrectly estimated if the stress state inside a fault zone is not modelled or is incorrectly modelled. This can happen if the far-field stress state is assumed to be the correct stress state inside a fault instead of a rotated far-field stress state. Röckel et al. (2022) potentially indicate this challenge, which in some regions could contribute to a mismatch of estimated slip tendency and observed seismicity. Consequently, incorrect estimates of the potential for seismicity could be provided by geomechanical models. Knowledge of the expected stress rotation as a result of the setting provides a first indication of whether significant rotations of the principal stress axes are expected or not.
4.3 Observations
Rotations of the SHmax orientation associated with changes in rock stiffness are mainly observed in boreholes, e.g. by rotating borehole breakouts or drilling-induced tensile fractures (Brudy et al., 1997; Cui et al., 2014; Haimson et al., 2010; Hickman and Zoback, 2004; Lin et al., 2007; Massiot et al., 2019). Some notable examples are shown in Table 4. The observation is inherently subject to uncertainties due to the need for breakouts or drilling-induced tensile fractures to occur in order to be able to identify a rotation. Thus, the number of significant observations of rotations is rather small, and for some projects no rotation at the fault can be observed (Brodsky et al., 2017). In the following we use the investigated correlations to link an observed stress rotation to a stiffness contrast. Therefore, we use available estimates on the stress ratio and observations of a fault in conjunction with the far-field stress orientation.
Table 4Observed stress rotations and associated parameters from different (scientific) boreholes that allow for the derivation of the stiffness contrast.
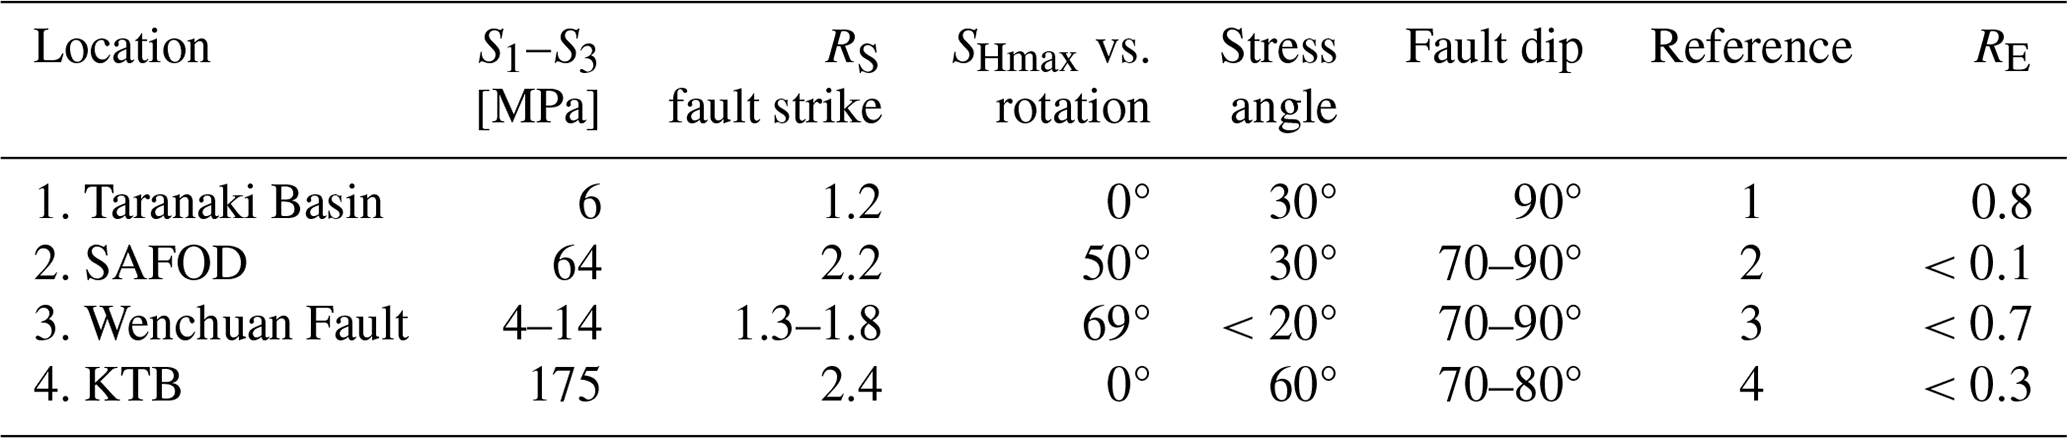
1. Massiot et al. (2019), 2. Hickman and Zoback (2004), 3. Cui et al. (2014), 4. Brudy et al. (1997).
Massiot et al. (2019) observed significant rotations of the SHmax orientation in the Taranaki Basin offshore New Zealand. Most prominently a 30° rotation at the intersection of the borehole Whio-1 with the almost vertically dipping Whio-1-fault. In this setting the orientation of SHmax is approximately parallel to the strike of aforementioned fault (Massiot et al., 2019; Rajabi et al., 2016c). The prevailing stress state is classified as close to transtensional () with all three stress components inferred. This allows us to estimate a preferential differential stress of 9 MPa, which corresponds to a stress ratio of RS=1.2, although uncertainties of up to 18 MPa have to be considered in the stress components (Massiot et al., 2019). This information allows us to use the herein-estimated relations to derive a value for the stiffness contrast of RE=0.8.
Further observations can be made for steeply dipping faults, for example, at the San Andreas Fault Observatory Drilling (SAFOD) site (Hickman and Zoback, 2004) or the Wenchuan fault drilling site (Cui et al., 2014) (Table 4). At the SAFOD site, a differential stress of 64 MPa (RS=2.2) is expected, with an angle between fault strike and SHmax orientation of 50° (Hickman and Zoback, 2004). The relations established in this paper predict that the observed stress rotation of approx. 30° requires a high stiffness contrast of RE<0.1 (Table 4). This is consistent with Zoback et al. (2011) observations in the San Andreas Fault zone.
Stress rotations of up to 20° are observed at the Wenchuan fault drilling project site. A large angle between fault strike and SHmax orientation and a small stress ratio (Cui et al., 2014) call for a rather moderate rock stiffness contrast of RE<0.7 in order to explain the observed stress rotation angles (Table 4).
At the German Continental Deep Drilling (KTB) site, 60° stress rotations are observed in unprecedented depths > 7000 m (Brudy et al., 1997). Considering the depth of observed stress rotation, the estimated stress magnitudes are high, as are the differential stress at about 175 MPa and the stress ratio RS=2.4 (Brudy et al., 1997). The small angle between fault strike and SHmax orientation allows a 60° rotation to occur even though RE≤0.3 is required according to our generic approach.
The Taiwan Chelungpu Drilling Project (TCDP) drilled into the Chelungpu Fault that dips 30° and hosted the 1999 Chi-Chi earthquake (Hung et al., 2007; Lin et al., 2007). Stress rotations of up to 90° have been observed in the vicinity of the fault (Lin et al., 2007). The inferred differential stress and stress ratio, rock stiffness contrast, and observed stress rotation of 90° are well in agreement. However, the angle γ=90° between SHmax and fault strike should prohibit any stress rotation at all. Interestingly, contrary to the other faults in Table 4, this one is not steeply dipping, which may indicate the relevance of the intermediate principal stress component and the need to investigate the stress rotation in a full 3D modelling approach.
4.4 Limitations and outlook
Most of our knowledge on the stress rotations at small scales is from the interpretation of borehole image logs. However, such rotations cannot be observed everywhere, mainly due to the uncertainties in borehole image log interpretation, particularly when it comes to the analysis of borehole breakouts (Azzola et al., 2019; Kingdon et al., 2016). Borehole breakouts are defined as a significant section of the borehole wall that spalls off (Aadnoy and Bell, 1998). In some cases, where breakouts are wide (i.e. opening angles of 15–30°) it is difficult to observe rotation < 30° (Aadnoy and Bell, 1998). While rotation angles > 30° can be observed more easily using breakouts, a higher certainty in observations is expected for drilling-induced tensile fractures, which are usually described as thin (sub)vertical fractures, in vertical boreholes (Aadnoy and Bell, 1998). However, they are less frequently observed and harder to interpret and may be misinterpreted as incipient breakouts in some cases (Rajabi et al., 2017b). In addition, borehole breakouts and/or drilling-induced tensile fractures need to form in the first place both in the host rock and in the contrasting material in order to be able to detect a rotation at all. Thus, the detection of a stress rotation and (to an even greater extent) the estimation of the material contrast are always subject to uncertainties.
The presented approach in this study investigates elastic rock stiffness contrast in fault zones as the primary reason for stress rotations in a spatially homogeneous far-field stress state. In addition to these static stress rotations, temporal rotations of the principal stress axes can occur co-seismically or post-seismically due to natural seismicity (Hardebeck, 2017; Hardebeck and Okada, 2018; King et al., 1994; Nishiwaki et al., 2018). Further temporal back-and-forth rotations of the principal stress components have been observed (Martínez-Garzón et al., 2013, 2014) and are related to reservoir operations such as injection of fluids (Ziegler et al., 2017) and excavation works such as mining or tunnelling (Eberhardt, 2001; Ziegler et al., 2015). Stress rotation is not only observed at faults. It also occurs if lithological units are mechanically decoupled at a certain horizon due to a contrasting lithology. This also results in a perceived stress rotation in terms of different stress orientations above and below the respective horizon (Cornet and Röckel, 2012; Roth and Fleckenstein, 2001). These changes in rock properties, e.g. in intrusions but also due to faults, can cause massive changes in the SHmax orientation of up to 90° (Ahlers et al., 2018; Cornet and Röckel, 2012; Rajabi et al., 2024; Reiter, 2021; Tingay et al., 2011). However, the different angles of SHmax could instead be inherited remnant stresses instead of local deviations due to material contrasts. In other cases stress rotations cannot be attributed to a specific cause (Wang et al., 2023) or anisotropies are assumed (Sahara et al., 2014; Wang et al., 2022). As such, temporal stress rotations and decoupling effects are not covered by the presented work.
The failure of the generically derived relations to predict the expected stress rotation of 90° at the Chelungpu Fault (Table 4) indicates a limitation of the approach. The behaviour of any faults that have a significant deviation from a vertical to subvertical dip apparently do not follow the proposed scheme. This is expected to be a result of its limitation to two dimensions even though the generically modelled fault strike could also represent the dip. That shows the influence of the intermediate principal stress, which cannot be investigated in a 2D model. Furthermore, the observed rotation of the SHmax orientation is only a part of the actual rotation that likely affects the magnitudes and orientations of all of the principal stress components, as observed by the analysis of focal mechanism solutions, e.g. by Martínez-Garzón et al. (2013, 2014). This indicates the necessity to extend the presented approach to the full 3D stress tensor. In particular, this includes the necessity to investigate the influence of the intermediate principal stress component S2 and its relation to S1 and S3. This should be the aim of future studies as it is well beyond the scope of this work.
We investigate the relationship between stress rotation in a fault core influenced by (1) a variable rock stiffness contrast compared to the host rock, (2) the stress ratio of the far field, and (3) the far-field stress orientation with regard to the strike of the fault. We use a 2D plane strain model that in a sensitivity study shows that stress rotation is promoted by a low stress ratio and a low angle between the far-field stress orientation and the fault strike. A high stiffness contrast further increases the stress rotation angle. No stress rotation is possible for faults that are striking perpendicular to the maximum principal stress orientation, while faults parallel to the maximum principal stress orientation experience either no stress rotation or a 90° stress rotation, depending on the stress ratio and the rock stiffness contrast within the fault core. The established relations agree with observations from various scientific boreholes worldwide. However, they are only valid for steeply dipping faults where the intermediate principal stress component S2 only has a minor effect. A fully 3D investigation of the established relations including the effect of S2 should be addressed in future research.
The discretization and thus the element size have an effect on model results. In order to prevent interpretation of results influenced by the discretization, a mesh convergence check is performed. The same model geometry is discretized with different element sizes and therefore a different total number of elements. Following this, the different variations are solved and the results are compared, which in this case uses the modelled stress rotation angle.
Herein, two different variations of discretization are investigated. First, the absolute number of elements used to discretize the model. Four different realizations are tested, namely 300, 3000, 170 000, and 700 000 elements. Second, the number of elements that are used to represent the fault normal to the fault strike are varied (Fig. A1). We tested seven different scenarios, namely with 1, 3, 5, 7, 10, 15, and 20 elements normal to the fault strike. All combinations of total numbers of elements and fault elements were combined, meaning that in total 28 different discretization scenarios were tested.
To test the influence of the discretization on the results, the discretizations were compared using an identical set of parameters. The reference set of parameters from Fig. 3a was chosen. This means an angle γ=15° between the strike of the fault and the far-field stress (S1), a stiffness contrast RE=0.4 (16 GPa fault, 40 GPa host rock), and a principal stress ratio RS=1.4 (S1=35 MPa, S2=25 MPa, S1–S2=10 MPa). This set of parameters was used on all 28 different discretization scenarios.
The resulting stress rotation angle that is only dependent on the discretization is shown in Fig. A2. The total number of elements in the tested range does not show any impact on the stress rotation angle. However, the number of elements used for fault representation normal to the fault strike significantly influence the results. This influence, however, is limited to a fault represented by less than three elements normal to the strike (Fig. A2). This effect is observed independent of the total number of elements. These results indicate that the discretization approach realized in this study (20 elements normal to fault strike, approx. 170 000 elements in total, red dot in Fig. A2) is very well suited to model the stress rotation angle. An influence of the discretization on the results can be ruled out.
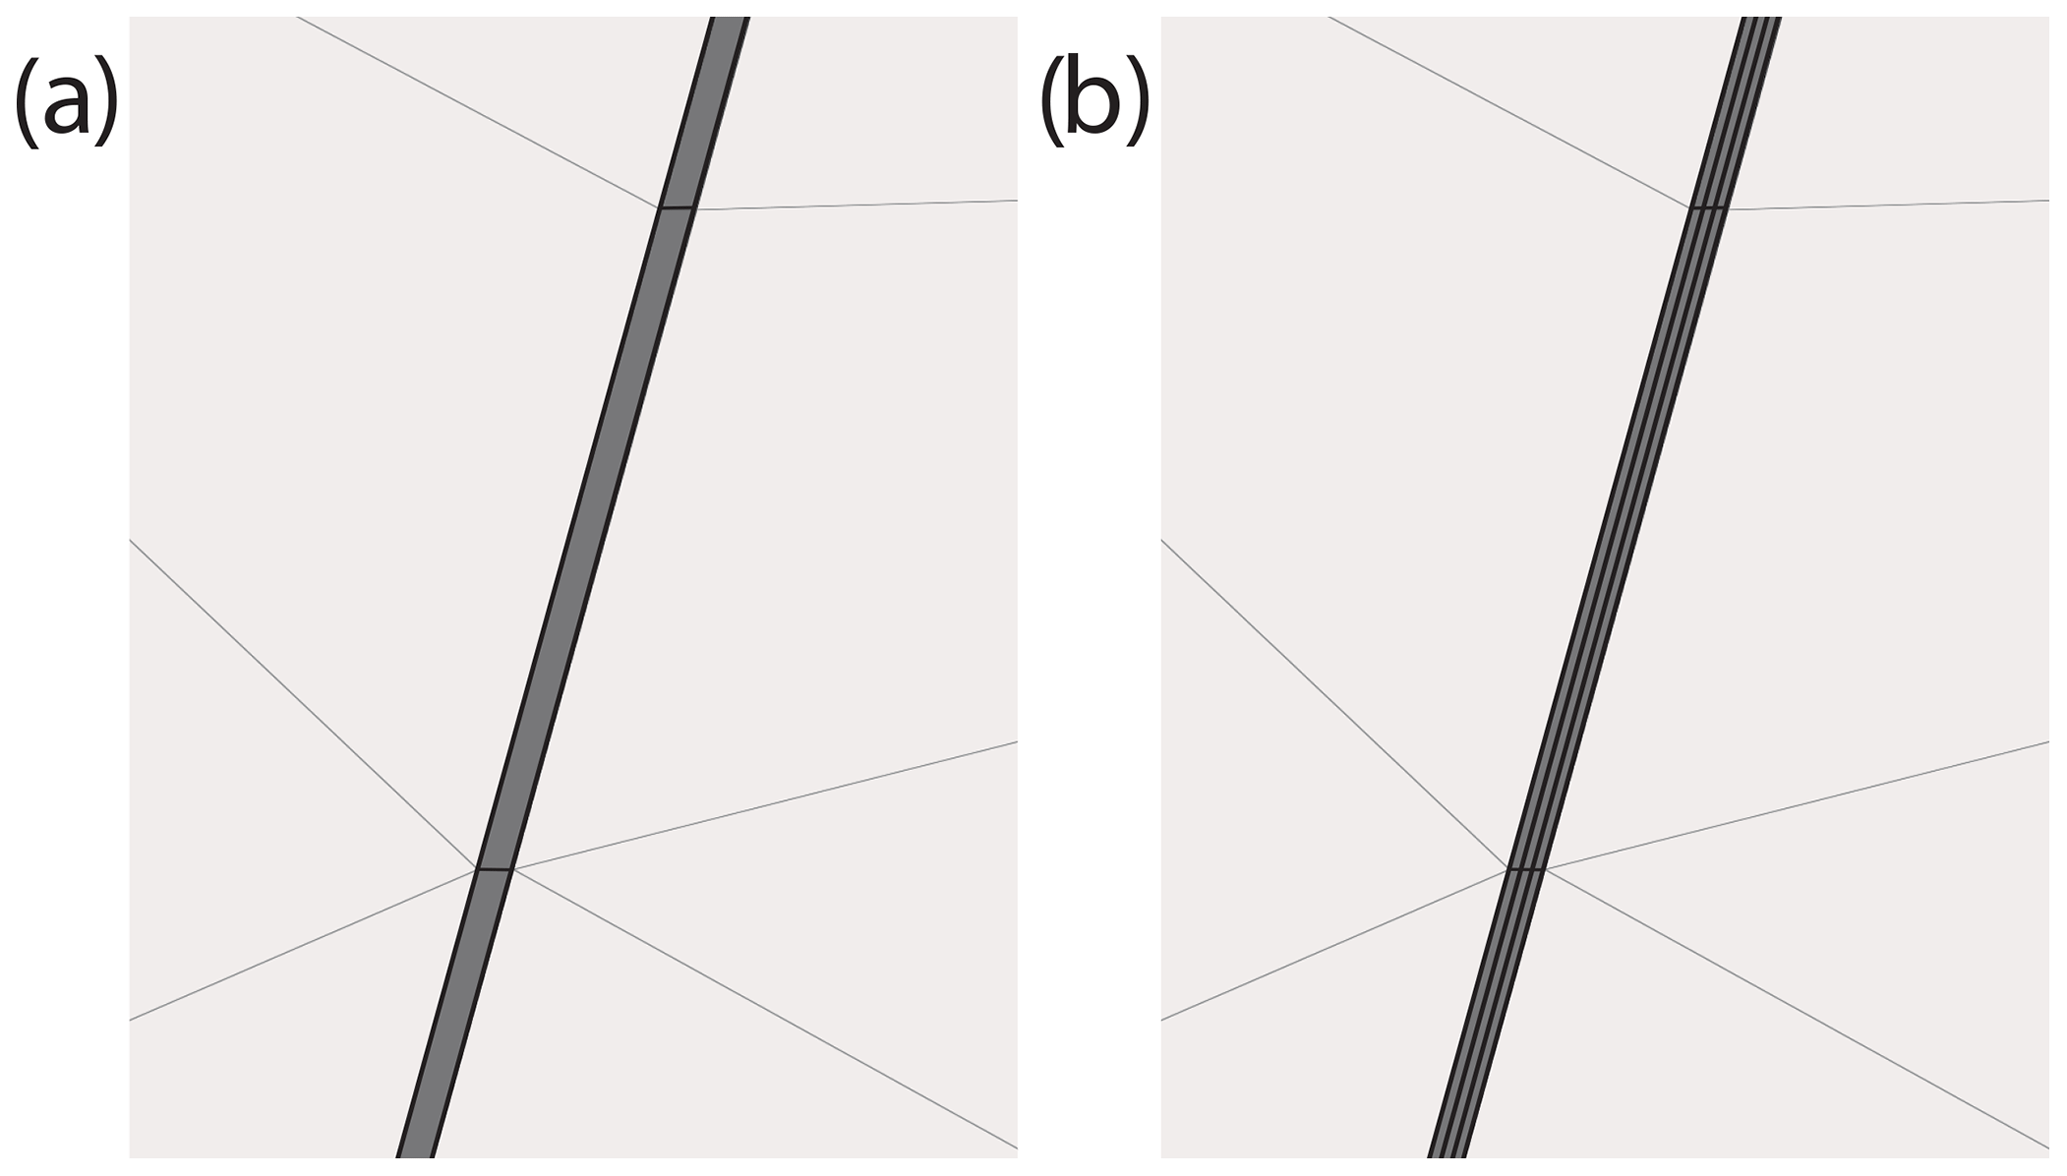
Figure A1Examples of fault discretization. While the absolute number of elements remains approximately the same, the number of elements used for fault discretization varies. (a) A single element is used to discretize the fault. (b) Three elements are used normal to the fault strike to represent the fault.
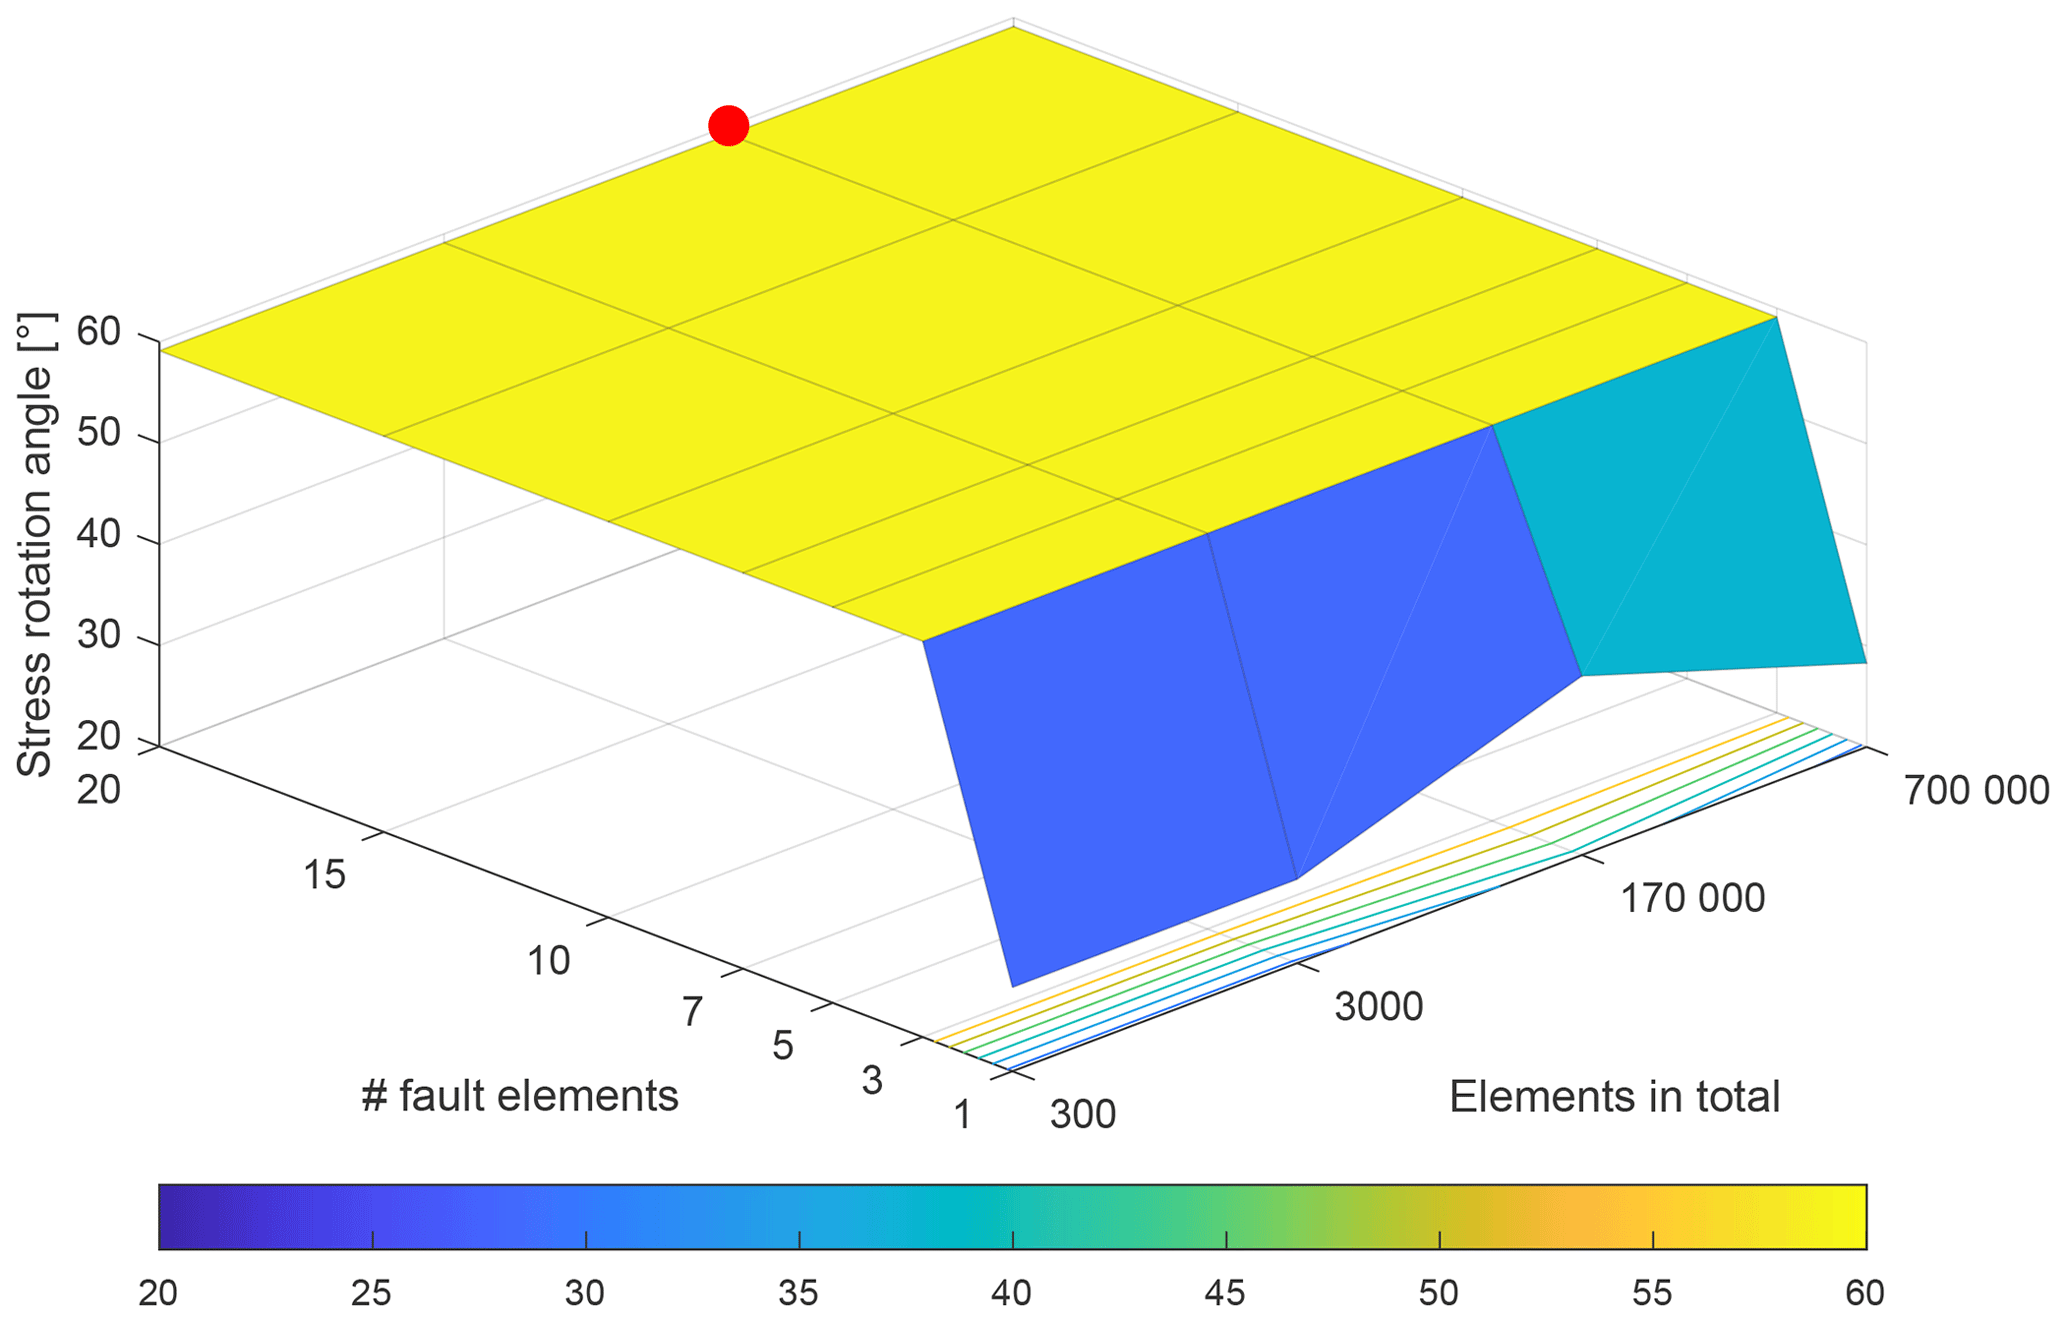
Figure A2Stress rotation in dependence of different discretizations. The total number of elements (y axis) and the number of elements used to represent the fault normal to its strike (x axis) are put into relation to the modelled stress rotation angle (z axis). The approximate mesh resolution used for this study is indicated by the red dot. The tested parameters are the same as in Fig. 3a.
All modelling results are available in the Supplement.
The supplement related to this article is available online at: https://doi.org/10.5194/se-15-1047-2024-supplement.
Conception and study design: RS, TN, MZ, LR, and BM. Software: TN, MZ, and RS. Writing: MZ, OH, and RS. All authors contributed equally to interpretation and discussion.
The contact author has declared that none of the authors has any competing interests.
Publisher's note: Copernicus Publications remains neutral with regard to jurisdictional claims made in the text, published maps, institutional affiliations, or any other geographical representation in this paper. While Copernicus Publications makes every effort to include appropriate place names, the final responsibility lies with the authors.
The authors express their gratitude to the two anonymous reviewers, whose comments helped to improve the manuscript.
This research has been supported by the Deutsche Forschungsgemeinschaft (grant no. PHYSALIS 523456847); the Bavarian State Ministry of Education and Culture (Science and Arts) within the framework of the “Geothermal-Alliance Bavaria” (GAB); the Bundesministerium für Umwelt, Naturschutz, nukleare Sicherheit und Verbraucherschutz (grant no. SQuaRe 02E12062C); project SpannEnD 2.0, funded by the Federal Company for Radioactive Waste Disposal (BGE); and Helmholtz Recruiting Initiative funds from Fabrice Cotton. Contributions by Mojtaba Rajabi were made under his ARC Discovery Early Career Researcher Award (award no. DE200101361).
The article processing charges for this open-access publication were covered by the Helmholtz Centre Potsdam – GFZ German Research Centre for Geosciences.
This paper was edited by David Healy and reviewed by two anonymous referees.
Aadnoy, B. S. and Bell, J. S.: Classification Of Drilling-induced Fractures And Their Relationship To In-situ Stress Directions, The Log Analyst 39 (06), Paper Number: SPWLA-1998-v39n6a2, 1998. a, b, c
Ahlers, S., Hergert, T., and Henk, A.: Numerical Modelling of Salt-Related Stress Decoupling in Sedimentary Basins – Motivated by Observational Data from the North German Basin, Geosciences, 9, 19, https://doi.org/10.3390/GEOSCIENCES9010019, 2018. a
Ahlers, S., Röckel, L., Hergert, T., Reiter, K., Heidbach, O., Henk, A., Müller, B., Morawietz, S., Scheck-Wenderoth, M., and Anikiev, D.: The crustal stress field of Germany: a refined prediction, Geoth. Energ., 10, 1–32, https://doi.org/10.1186/s40517-022-00222-6, 2022. a
Azzola, J., Valley, B., Schmittbuhl, J., and Genter, A.: Stress characterization and temporal evolution of borehole failure at the Rittershoffen geothermal project, Solid Earth, 10, 1155–1180, https://doi.org/10.5194/se-10-1155-2019, 2019. a
Barton, C. A. and Zoback, M. D.: Stress perturbations associated with active faults penetrated by boreholes: Possible evidence for near‐complete stress drop and a new technique for stress magnitude measurement, J. Geophys. Res.-Solid, 99, 9373–9390, https://doi.org/10.1029/93JB03359, 1994. a, b, c
Barton, C. A., Zoback, M. D., and Moos, D.: Fluid flow along potentially active faults in crystalline rock, Geology, 23, 683, https://doi.org/10.1130/0091-7613(1995)023<0683:FFAPAF>2.3.CO;2, 1995. a
Bell, J. and Gough, D.: Northeast-southwest compressive stress in Alberta evidence from oil wells, Earth Planet. Sc. Lett., 45, 475–482, https://doi.org/10.1016/0012-821X(79)90146-8, 1979. a
Brodsky, E. E., Saffer, D., Fulton, P., Chester, F., Conin, M., Huffman, K., Moore, J. C., and Wu, H.: The postearthquake stress state on the Tohoku megathrust as constrained by reanalysis of the JFAST breakout data, Geophys. Res. Lett., 44, 8294–8302, https://doi.org/10.1002/2017GL074027, 2017. a
Brudy, M., Zoback, M. D., Fuchs, K., Rummel, F., and Baumgaertner, J.: Estimation of the complete stress tensor to 8 km depth in the KTB scientific drill holes' Implications for crustal strength, J. Geophys. Res., 102, 453–471, https://doi.org/10.1029/96JB02942, 1997. a, b, c, d, e, f
Cai, W., Zhu, H., and Liang, W.: Three-dimensional stress rotation and control mechanism of deep tunneling incorporating generalized Zhang–Zhu strength-based forward analysis, Eng. Geol., 308, 106806, https://doi.org/10.1016/j.enggeo.2022.106806, 2022. a
Cappa, F. and Rutqvist, J.: Impact of CO2 geological sequestration on the nucleation of earthquakes, Geophys. Res. Lett., 38, L17313, https://doi.org/10.1029/2011GL048487, 2011. a, b
Casey, M.: Mechanics of shear zones in isotropic dilatant materials, J. Struct. Geol., 2, 143–147, https://doi.org/10.1016/0191-8141(80)90044-9, 1980. a
Catalli, F., Meier, M. A., and Wiemer, S.: The role of Coulomb stress changes for injection-induced seismicity: The Basel enhanced geothermal system, Geophys. Res. Lett., 40, 72–77, https://doi.org/10.1029/2012GL054147, 2013. a
Childs, C., Manzocchi, T., Walsh, J. J., Bonson, C. G., Nicol, A., and Schöpfer, M. P.: A geometric model of fault zone and fault rock thickness variations, J. Struct. Geol., 31, 117–127, https://doi.org/10.1016/j.jsg.2008.08.009, 2009. a, b
Clavijo, S. P., Dash, A., Baby, G., Alafifi, A. M., and Finkbeiner, T.: Modeling principal stress orientations in the Arabian Plate using plate velocities, Geol. Soc. Lond. Spec. Publ., 546, 193–214, https://doi.org/10.1144/SP546-2022-327, 2024. a
Collettini, C., Niemeijer, A., Viti, C., and Marone, C.: Fault zone fabric and fault weakness, Nature, 462, 907–910, 2009. a
Cornet, F. H. and Röckel, T.: Vertical stress profiles and the significance of “stress decoupling”, Tectonophysics, 581, 193–205, https://doi.org/10.1016/J.TECTO.2012.01.020, 2012. a, b
Cui, J., Lin, W., Wang, L., Gao, L., Huang, Y., Wang, W., Sun, D., Li, Z., Zhou, C., Qian, H., Peng, H., Xia, K., and Li, K.: Determination of three-dimensional in situ stresses by anelastic strain recovery in Wenchuan Earthquake Fault Scientific Drilling Project Hole-1 (WFSD-1), Tectonophysics, 619–620, 123–132, https://doi.org/10.1016/j.tecto.2013.09.013, 2014. a, b, c, d, e, f
Dart, R. and Swolfs, H.: Subparallel faults and horizontal-stress orientations: an evaluation of in-situ stresses inferred from elliptical wellbore enlargements, Elsevier, 519–529, https://doi.org/10.1016/B978-0-444-88607-1.50041-3, 1992. a
Eberhardt, E.: Numerical modelling of three-dimension stress rotation ahead of an advancing tunnel face, Int. J. Rock Mech. Min. Sci., 38, 499–518, https://doi.org/10.1016/S1365-1609(01)00017-X, 2001. a
Engelder, T.: Stress Regimes in the Lithosphere, Princeton University Press, ISBN 9781400863150, https://doi.org/10.1515/9781400863150, 1992. a, b, c
Engelder, T.: Deviatoric stressitis: A virus infecting the Earth science community, Eos Trans. Am. Geophys. Union, 75, 209–212, https://doi.org/10.1029/94EO00885, 1994. a
Faulkner, D. R., Mitchell, T. M., Healy, D., and Heap, M. J.: Slip on `weak' faults by the rotation of regional stress in the fracture damage zone, Nature, 444, 922–925, https://doi.org/10.1038/nature05353, 2006. a, b, c, d
Faulkner, D. R., Jackson, C. A., Lunn, R. J., Schlische, R. W., Shipton, Z. K., Wibberley, C. A., and Withjack, M. O.: A review of recent developments concerning the structure, mechanics and fluid flow properties of fault zones, J. Struct. Geol., 32, 1557–1575, https://doi.org/10.1016/J.JSG.2010.06.009, 2010. a, b
Freymark, J., Bott, J., Cacace, M., Ziegler, M. O., and Scheck-Wenderoth, M.: Influence of the Main Border Faults on the 3D Hydraulic Field of the Central Upper Rhine Graben, Geofluids, 2019, 7520714, https://doi.org/10.1155/2019/7520714, 2019. a
Gabrielsen, R. H., Braathen, A., Kjemperud, M., and Valdresbråten, M. L. R.: The geometry and dimensions of fault-core lenses, Geol. Soc. Lond. Spec. Publ., 439, 249–269, https://doi.org/10.1144/SP439.4, 2017. a, b
Gaucher, E., Schoenball, M., Heidbach, O., Zang, A., Fokker, P. A., Wees, J. D. V., and Kohl, T.: Induced seismicity in geothermal reservoirs: A review of forecasting approaches, Renew. Sustain. Energ. Rev., 52, 1473–1490, https://doi.org/10.1016/j.rser.2015.08.026, 2015. a
Gilmore, K. A., Sahu, C. K., Benham, G. P., Neufeld, J. A., and Bickle, M. J.: Leakage dynamics of fault zones: experimental and analytical study with application to CO2 storage, J. Fluid Mech., 931, A31, https://doi.org/10.1017/JFM.2021.970, 2022. a
Gradmann, S., Olesen, O., Keiding, M., and Maystrenko, Y.: The 3D stress field of Nordland, northern Norway – insights from numerical modelling, Geol. Soc. Lond. Spec. Publ., 546, 215–238, https://doi.org/10.1144/SP546-2023-163, 2024. a
Haimson, B., Lin, W., Oku, H., Hung, J. H., and Song, S. R.: Integrating borehole-breakout dimensions, strength criteria, and leak-off test results, to constrain the state of stress across the Chelungpu Fault, Taiwan, Tectonophysics, 482, 65–72, https://doi.org/10.1016/J.TECTO.2009.05.016, 2010. a
Han, C., Huang, Z., Xu, M., Wang, L., Mi, N., Yu, D., and Li, H.: Focal mechanism and stress field in the northeastern Tibetan Plateau: insight into layered crustal deformations, Geophys. J. Int., 218, 2066–2078, https://doi.org/10.1093/gji/ggz267, 2019. a
Hardebeck, J. L.: The spatial distribution of earthquake stress rotations following large subduction zone earthquakes, Earth Planets Space, 69, 69, https://doi.org/10.1186/s40623-017-0654-y, 2017. a
Hardebeck, J. L. and Okada, T.: Temporal Stress Changes Caused by Earthquakes: A Review, J. Geophys. Res.-Solid, 123, 1350–1365, https://doi.org/10.1002/2017JB014617, 2018. a
Healy, D. and Hicks, S. P.: De-risking the energy transition by quantifying the uncertainties in fault stability, Solid Earth, 13, 15–39, https://doi.org/10.5194/se-13-15-2022, 2022. a
Heidbach, O., Rajabi, M., Cui, X., Fuchs, K., Müller, B., Reinecker, J., Reiter, K., Tingay, M., Wenzel, F., Xie, F., Ziegler, M. O., Zoback, M.-L., and Zoback, M.: The World Stress Map database release 2016: Crustal stress pattern across scales, Tectonophysics, 744, 484–498, https://doi.org/10.1016/j.tecto.2018.07.007, 2018. a, b, c
Henk, A.: Chapter 4 – Numerical modelling of faults, Elsevier, 147–165, ISBN 978-0-12-815985-9, https://doi.org/10.1016/B978-0-12-815985-9.00004-7, 2020. a, b
Hergert, T., Heidbach, O., Reiter, K., Giger, S. B., and Marschall, P.: Stress field sensitivity analysis in a sedimentary sequence of the Alpine foreland, northern Switzerland, Solid Earth, 6, 533–552, https://doi.org/10.5194/se-6-533-2015, 2015. a, b, c
Hickman, S. and Zoback, M.: Stress orientations and magnitudes in the SAFOD pilot hole, Geophys. Res. Lett., 31, L15S12, https://doi.org/10.1029/2004GL020043, 2004. a, b, c, d, e, f
Holdsworth, R. E.: Weak Faults–Rotten Cores, Science, 303, 181–182, https://doi.org/10.1126/science.1092491, 2004. a
Holdsworth, R. E., Diggelen, E. W. E. V., Spiers, C. J., Bresser, J. H. P. D., Walker, R. J., and Bowen, L.: Fault rocks from the SAFOD core samples: Implications for weakening at shallow depths along the San Andreas Fault, California, J. Struct. Geol., 33, 132–144, https://doi.org/10.1016/j.jsg.2010.11.010, 2010. a
Homberg, C., Hu, J. C., Angelier, J., Bergerat, F., and Lacombe, O.: Characterization of stress perturbations near major fault zones: insights from 2-D distinct-element numerical modelling and field studies (Jura mountains), J. Struct. Geol., 19, 703–718, https://doi.org/10.1016/S0191-8141(96)00104-6, 1997. a
Hung, J.-H., Ma, K.-F., Wang, C.-Y., Ito, H., Lin, W., and Yeh, E.-C.: Subsurface structure, physical properties, fault-zone characteristics and stress state in scientific drill holes of Taiwan Chelungpu Fault Drilling Project, Tectonophysics, 466, 307–321, https://doi.org/10.1016/j.tecto.2007.11.014, 2007. a, b
Isaacs, A. J., Evans, J. P., Kolesar, P. T., and Nohara, T.: Composition, microstructures, and petrophysics of the Mozumi fault, Japan: In situ analyses of fault zone properties and structure in sedimentary rocks from shallow crustal levels, J. Geophys. Res.-Solid, 113, B12408, https://doi.org/10.1029/2007JB005314, 2008. a
King, C. P., Stein, R. O. S. S. S., and Lin, J.: Static Stress Changes and the Triggering of Earthquakes, Bull. Seismol. Soc. Am., 84, 935–953, https://doi.org/10.1785/BSSA0840030935, 1994. a
Kingdon, A., Fellgett, M. W., and Williams, J. D.: Use of borehole imaging to improve understanding of the in-situ stress orientation of Central and Northern England and its implications for unconventional hydrocarbon resources, Mar. Petrol. Geol., 73, 1–20, https://doi.org/10.1016/j.marpetgeo.2016.02.012, 2016. a
Kirsch, E.: Die Theorie der Elastizität und die Bedürfnisse der Festigkeitslehre, Zeitschrift des Vereines deutscher Ingenieure, 42 pp., 1898. a
Konrad, F., Savvatis, A., Degen, D., Wellmann, F., Einsiedl, F., and Zosseder, K.: Productivity enhancement of geothermal wells through fault zones: Efficient numerical evaluation of a parameter space for the Upper Jurassic aquifer of the North Alpine Foreland Basin, Geothermics, 95, 102119, https://doi.org/10.1016/J.GEOTHERMICS.2021.102119, 2021. a, b
Konstantinou, K. I., Mouslopoulou, V., Liang, W. T., Heidbach, O., Oncken, O., and Suppe, J.: Present-day crustal stress field in Greece inferred from regional-scale damped inversion of earthquake focal mechanisms, J. Geophys. Res.-Solid, 122, 506–523, https://doi.org/10.1002/2016JB013272, 2017. a
Konstantinovskaya, E., Malo, M., and Castillo, D.: Present-day stress analysis of the St. Lawrence Lowlands sedimentary basin (Canada) and implications for caprock integrity during CO2 injection operations, Tectonophysics, 518–521, 119–137, https://doi.org/10.1016/j.tecto.2011.11.022, 2012. a
Levi, N., Habermueller, M., Exner, U., Piani, E., Wiesmayr, G., and Decker, K.: The stress field in the frontal part of the Eastern Alps (Austria) from borehole image log data, Tectonophysics, 769, 228175, https://doi.org/10.1016/J.TECTO.2019.228175, 2019. a
Li, H., Wang, H., Xu, Z., Si, J., Pei, J., Li, T., Huang, Y., Song, S.-R., Kuo, L.-W., Sun, Z., Chevalier, M.-L., and Liu, D.: Characteristics of the fault-related rocks, fault zones and the principal slip zone in the Wenchuan Earthquake Fault Scientific Drilling Project Hole-1 (WFSD-1), Tectonophysics, 584, 23–42, https://doi.org/10.1016/j.tecto.2012.08.021, 2012. a
Li, P., Cai, M., Gorjian, M., Ren, F., Xi, X., and Wang, P.: Interaction between in situ stress states and tectonic faults: A comment, Int. J. Miner. Metallurg. Mater., 30, 1227–1243, https://doi.org/10.1007/s12613-023-2607-8, 2023. a
Lin, W., Yeh, E.-C., Ito, H., Hirono, T., Soh, W., Wang, C.-Y., Ma, K.-F., Hung, J.-H., and Song, S.-R.: Preliminary Results of Stress Measurement Using Drill Cores of TCDP Hole-A: an Application of Anelastic Strain Recovery Method to Three-Dimensional In-Situ Stress Determination, Terr. Atmos. Ocean. Sci., 18, 379–393, https://doi.org/10.3319/TAO.2007.18.2.379(TCDP), 2007. a, b, c, d, e
Lin, W., Yeh, E.-C., Hung, J.-H., Haimson, B., and Hirono, T.: Localized rotation of principal stress around faults and fractures determined from borehole breakouts in hole B of the Taiwan Chelungpu-fault Drilling Project (TCDP), Tectonophysics, 482, 82–91, https://doi.org/10.1016/j.tecto.2009.06.020, 2010. a
Lockner, D. A., Tanaka, H., Ito, H., Ikeda, R., Omura, K., and Naka, H.: Geometry of the Nojima fault at Nojima-Hirabayashi, Japan – I. A simple damage structure inferred from borehole core permeability, Pure Appl. Geophys., 166, 1649–1667, https://doi.org/10.1007/s00024-009-0515-0, 2009. a
Long, J. C. and Ewing, R. C.: YUCCA MOUNTAIN: Earth-Science Issues at a Geologic Repository for High-Level Nuclear Waste, Annu. Rev. Earth Planet. Sci., 32, 363–401, https://doi.org/10.1146/annurev.earth.32.092203.122444, 2004. a
Martínez-Garzón, P., Bohnhoff, M., Kwiatek, G., and Dresen, G.: Stress tensor changes related to fluid injection at the Geysers geothermal field, California, Geophys. Res. Lett., 40, 2596–2601, https://doi.org/10.1002/grl.50438, 2013. a, b
Martínez-Garzón, P., Kwiatek, G., Sone, H., Bohnhoff, M., Dresen, G., and Hartline, C.: Spatiotemporal changes, faulting regimes, and source parameters of induced seismicity: A case study from the Geysers geothermal field, J. Geophys. Res.-Solid, 119, 8378–8396, https://doi.org/10.1002/2014JB011385, 2014. a, b
Massiot, C., Seebeck, H., Nicol, A., McNamara, D. D., Lawrence, M. J., Griffin, A. G., Thrasher, G. P., O'Brien, G., and Viskovic, G. P. D.: Effects of regional and local stresses on fault slip tendency in the southern Taranaki Basin, New Zealand, Mar. Petrol. Geol., 107, 467–483, https://doi.org/10.1016/J.MARPETGEO.2019.05.030, 2019. a, b, c, d, e, f
Morris, A., Ferrill, D. A., and Henderson, D. B.: Slip-tendency analysis and fault reactivation, Geology, 24, 275, https://doi.org/10.1130/0091-7613(1996)024<0275:STAAFR>2.3.CO;2, 1996. a
Müller, B., Schilling, F., Röckel, T., and Heidbach, O.: Induced Seismicity in Reservoirs: Stress Makes the Difference Induzierte, Erdöl Erdgas Kohle, https://doi.org/10.19225/180106, 2018. a
Nabavi, S. T., Alavi, S. A., Mohammadi, S., and Ghassemi, M. R.: Mechanical evolution of transpression zones affected by fault interactions: Insights from 3D elasto-plastic finite element models, J. Struct. Geol., 106, 19–40, https://doi.org/10.1016/j.jsg.2017.11.003, 2018. a
Niederhuber, T., Kruszewski, M., Röckel, T., Rische, M., Alber, M., and Müller, B.: Stress orientations from hydraulic fracturing tests in the Ruhr area in comparison to stress orientations from borehole observations and earthquake focal mechanisms, Zeitschrift der Deutschen Gesellschaft für Geowissenschaften, 173, 625–635, https://doi.org/10.1127/zdgg/2022/0352, 2023. a
Nishiwaki, T., Lin, A., and Lin, W.: Recovery of Stress During the Interseismic Period Around the Seismogenic Fault of the 1995 Mw 6.9 Kobe Earthquake, Japan, Geophys. Res. Lett., 45, 12814–12820, https://doi.org/10.1029/2018GL079317, 2018. a
Ptáček, J., Konicek, P., Staš, L., Waclawik, P., and Kukutsch, R.: Rotation of principal axes and changes of stress due to mine-induced stresses, Can. Geotech. J., 52, 1440–1447, https://doi.org/10.1139/cgj-2014-0364, 2015. a
Rajabi, M., Tingay, M., and Heidbach, O.: The present-day state of tectonic stress in the Darling Basin, Australia: Implications for exploration and production, Mar. Petrol. Geol., 77, 776–790, https://doi.org/10.1016/j.marpetgeo.2016.07.021, 2016a. a
Rajabi, M., Tingay, M., and Heidbach, O.: The present-day stress field of New South Wales, Australia, Aust. J. Earth Sci., 63, 1–21, https://doi.org/10.1080/08120099.2016.1135821, 2016b. a
Rajabi, M., Ziegler, M. O., Tingay, M., Heidbach, O., and Reynolds, S.: Contemporary tectonic stress pattern of the Taranaki Basin, New Zealand, J. Geophys. Res.-Solid., 121, 6053–6070, https://doi.org/10.1002/2016JB013178, 2016c. a
Rajabi, M., Tingay, M., Heidbach, O., Hillis, R., and Reynolds, S.: The present-day stress field of Australia, Earth-Sci. Rev., 168, 165–189, https://doi.org/10.1016/j.earscirev.2017.04.003, 2017a. a, b, c
Rajabi, M., Tingay, M., King, R., and Heidbach, O.: Present-day stress orientation in the Clarence-Moreton Basin of New South Wales, Australia: a new high density dataset reveals local stress rotations, Basin Res., 29, 622–640, https://doi.org/10.1111/bre.12175, 2017b. a
Rajabi, M., Esterle, J., Heidbach, O., Travassos, D., and Fumo, S.: Characterising the contemporary stress orientations near an active continental rifting zone: A case study from the Moatize Basin, central Mozambique, Basin Res., 34, 1292–1313, https://doi.org/10.1111/bre.12660, 2022. a
Rajabi, M., Ziegler, M., Heidbach, O., Mukherjee, S., and Esterle, J.: Contribution of mine borehole data toward high-resolution stress mapping: An example from northern Bowen Basin, Australia, Int. J. Rock Mech. Min. Sci., 173, 105630, https://doi.org/10.1016/j.ijrmms.2023.105630, 2024. a, b
Reinecker, J., Tingay, M., Müller, B., and Heidbach, O.: Present-day stress orientation in the Molasse Basin, Tectonophysics, 482, 129–138, https://doi.org/10.1016/j.tecto.2009.07.021, 2010. a
Reiter, K.: Stress rotation – impact and interaction of rock stiffness and faults, Solid Earth, 12, 1287–1307, https://doi.org/10.5194/se-12-1287-2021, 2021. a, b, c, d, e, f, g, h
Reiter, K., Heidbach, O., Schmitt, D., Haug, K., Ziegler, M. O., and Moeck, I.: A revised crustal stress orientation database for Canada, Tectonophysics, 636, 111–124, https://doi.org/10.1016/j.tecto.2014.08.006, 2014. a
Reiter, K., Heidbach, O., and Ziegler, M. O.: Impact of faults on the remote stress state, Solid Earth, 15, 305–327, https://doi.org/10.5194/se-15-305-2024, 2024. a, b, c, d, e, f, g
Röckel, L., Ahlers, S., Müller, B., Reiter, K., Heidbach, O., Henk, A., Hergert, T., and Schilling, F.: The analysis of slip tendency of major tectonic faults in Germany, Solid Earth, 13, 1087–1105, https://doi.org/10.5194/se-13-1087-2022, 2022. a, b, c
Roth, F. and Fleckenstein, P.: Stress orientations found in north-east Germany differ from the West European trend, Terra Nova, 13, 289–296, https://doi.org/10.1046/J.1365-3121.2001.00357.X, 2001. a
Sahara, D. P., Schoenball, M., Kohl, T., and Müller, B. I.: Impact of fracture networks on borehole breakout heterogeneities in crystalline rock, Int. J. Rock Mech. Min. Sci., 71, 301–309, https://doi.org/10.1016/j.ijrmms.2014.07.001, 2014. a, b, c
Schoenball, M., Dorbath, L., Gaucher, E., Wellmann, J. F., and Kohl, T.: Change of stress regime during geothermal reservoir stimulation, Geophys. Res. Lett., 41, 1163–1170, https://doi.org/10.1002/2013GL058514, 2014. a
Schoenball, M., Walsh, F. R., Weingarten, M., and Ellsworth, W. L.: How faults wake up: The Guthrie-Langston, Oklahoma earthquakes, Leading Edge, 37, 100–106, https://doi.org/10.1190/tle37020100.1, 2018. a
Seithel, R., Steiner, U., Müller, B., Hecht, C., and Kohl, T.: Local stress anomaly in the Bavarian Molasse Basin, Geoth. Energy, 3, 4, https://doi.org/10.1186/s40517-014-0023-z, 2015. a
Seithel, R., Gaucher, E., Mueller, B., Steiner, U., and Kohl, T.: Probability of fault reactivation in the Bavarian Molasse Basin, Geothermics, 82, 81–90, https://doi.org/10.1016/j.geothermics.2019.06.004, 2019. a
Shamir, G. and Zoback, M. D.: Stress orientation profile to 3.5 km depth near the San Andreas Fault at Cajon Pass, California, J. Geophys. Res.-Solid, 97, 5059–5080, https://doi.org/10.1029/91JB02959, 1992. a
Siler, D. L.: Structural discontinuities and their control on hydrothermal systems in the Great Basin, USA, Geoenergy, 1, geoenergy2023-009, https://doi.org/10.1144/geoenergy2023-009, 2023. a, b, c, d
Snee, J. E. L. and Zoback, M. D.: State of stress in the Permian Basin, Texas and New Mexico: Implications for induced seismicity, Leading Edge, 37, 127–134, https://doi.org/10.1190/TLE37020127.1, 2018. a
Sonder, L. J.: Effects Of Density Contrasts On The Orientation Of Stresses In The Litosphere: Relation To Principal Stress Directions In the Transverse Ranges, California, Tectonics, 9, 761–771, https://doi.org/10.1029/TC009i004p00761, 1990. a, b
Spann, H., Müller, B., and Fuchs, K.: Interpretation of anomalies in observed stress data at the central graben (north sea) – numerical and analytical approach, Soil Dynam. Earthq. Eng., 13, 1–11, https://doi.org/10.1016/0267-7261(94)90036-1, 1994. a
Talukdar, M., Sone, H., and Kuo, L.: Lithology and Fault‐Related Stress Variations Along the TCDP Boreholes: The Stress State Before and After the 1999 Chi‐Chi Earthquake, J. Geophys. Res.-Solid, 127, e2021JB023290, https://doi.org/10.1029/2021JB023290, 2022. a
Tingay, M., Bentham, P., de Feyter, A., and Kellner, A.: Present-day stress-field rotations associated with evaporites in the offshore Nile Delta, Bull. Geol. Soc. Am., 123, 1171–1180, https://doi.org/10.1130/B30185.1, 2011. a
Treffeisen, T. and Henk, A.: Representation of faults in reservoir-scale geomechanical finite element models – A comparison of different modelling approaches, J. Struct. Geol., 131, 103931, https://doi.org/10.1016/j.jsg.2019.103931, 2020. a, b
Vadacca, L., Rossi, D., Scotti, A., and Buttinelli, M.: Slip Tendency Analysis, Fault Reactivation Potential and Induced Seismicity in the Val d'Agri Oilfield (Italy), J. Geophys. Res.-Solid, 126, 2019JB019185, https://doi.org/10.1029/2019JB019185, 2021. a
van Wees, J.-D., Osinga, S., Thienen-Visser, K. V., and Fokker, P. A.: Reservoir creep and induced seismicity: inferences from geomechanical modeling of gas depletion in the Groningen field, Geophys. J. Int., 212, 1487–1497, https://doi.org/10.1093/gji/ggx452, 2018. a
Wang, W., Schmitt, D. R., and Li, W.: A program to forward model the failure pattern around the wellbore in elastic and strength anisotropic rock formations, Int. J. Rock Mech. Min. Sci., 151, 105035, https://doi.org/10.1016/j.ijrmms.2022.105035, 2022. a
Wang, W., Schmitt, D. R., and Chan, J.: Heterogeneity Versus Anisotropy and the State of Stress in Stable Cratons: Observations From a Deep Borehole in Northeastern Alberta, Canada, J. Geophys. Res.-Solid, 128, e2022JB025287, https://doi.org/10.1029/2022JB025287, 2023. a, b
Wees, J. D. V., Orlic, B., Eijs, R. V., Zijl, W., Jongerius, P., Schreppers, G. J., Hendriks, M., and Cornu, T.: Integrated 3D geomechanical modelling for deep subsurface deformation: a case study of tectonic and human-induced deformation in the eastern Netherlands, in: New Insights into Structural Interpretation and Modelling, Geological Society, edited by: Nieuwland, D. A., London, Special Publications, 212, 313–328, 0305-8719/03/15, 2003. a
Williams, J. N., Toy, V. G., Massiot, E., Mcnamara, D. D., and Wang, T.: Damaged beyond repair? Characterising the damage zone of a fault late in its interseismic cycle, the Alpine Fault, New Zealand, J. Struct. Geol., 90, 76–94, https://doi.org/10.1016/j.jsg.2016.07.006, 2016. a
Worum, G., van Wees, J.-D., Bada, G., van Balen, R. T., Cloetingh, S., and Pagnier, H.: Slip tendency analysis as a tool to constrain fault reactivation: A numerical approach applied to three-dimensional fault models in the Roer Valley rift system (southeast Netherlands), J. Geophys. Res.-Solid, 109, B2, https://doi.org/10.1029/2003JB002586, 2004. a
Xing, H., Makinouchi, A., and Mora, P.: Finite element modeling of interacting fault systems, Phys. Earth Planet. Inter., 163, 106–121, https://doi.org/10.1016/j.pepi.2007.05.006, 2007. a
Yale, D. P.: Fault and stress magnitude controls on variations in the orientation of in situ stress, Geol. Soc. Lond. Spec. Publ., 209, 55–64, https://doi.org/10.1144/GSL.SP.2003.209.01.06, 2003. a, b
Yamada, Y. and Shibanuma, J.: Small-scale stress fluctuations in borehole breakouts and their implication in identifying potential active faults around the seismogenic megasplay fault, Nankai Trough, SW Japan, Earth Planets Space, 67, 17, https://doi.org/10.1186/s40623-014-0176-9, 2015. a
Zhang, S., Ma, X., Bröker, K., van Limborgh, R., Wenning, Q., Hertrich, M., and Giardini, D.: Fault Zone Spatial Stress Variations in a Granitic Rock Mass: Revealed by Breakouts Within an Array of Boreholes, J. Geophys. Res.-Solid, 128, e2023JB026477, https://doi.org/10.1029/2023JB026477, 2023. a
Ziegler, M. O.: Rock Properties and Modelled Stress State Uncertainties: A Study of Variability and Dependence, Rock Mech. Rock Eng., 55, 4549–4564, https://doi.org/10.1007/s00603-022-02879-8, 2022. a, b
Ziegler, M. O., Reiter, K., Heidbach, O., Zang, A., Kwiatek, G., Stromeyer, D., Dahm, T., Dresen, G., and Hofmann, G.: Mining-Induced Stress Transfer and Its Relation to a Mw 1.9 Seismic Event in an Ultra-deep South African Gold Mine, Pure Appl. Geophys., 172, 2557–2570, https://doi.org/10.1007/s00024-015-1033-x, 2015. a, b
Ziegler, M. O., Heidbach, O., Reinecker, J., Przybycin, A. M., and Scheck-Wenderoth, M.: A multi-stage 3-D stress field modelling approach exemplified in the Bavarian Molasse Basin, Solid Earth, 7, 1365–1382, https://doi.org/10.5194/se-7-1365-2016, 2016a. a
Ziegler, M. O., Heidbach, O., Reinecker, J., Przybycin, A. M., and Scheck-Wenderoth, M.: Corrigendum to “A multi-stage 3-D stress field modelling approach exemplified in the Bavarian Molasse Basin” published in Solid Earth, 7, 1365–1382, 2016, Solid Earth, 7, 1365–1382, https://doi.org/10.5194/se-7-1365-2016-corrigendum, 2016b. a
Ziegler, M. O., Rajabi, M., Heidbach, O., Hersir, G. P., Ágústsson, K., Árnadóttir, S., and Zang, A.: The stress pattern of Iceland, Tectonophysics, 674, 101–113, https://doi.org/10.1016/j.tecto.2016.02.008, 2016c. a
Ziegler, M. O., Heidbach, O., Zang, A., Martínez-Garzón, P., and Bohnhoff, M.: Estimation of the differential stress from the stress rotation angle in low permeable rock, Geophys. Res. Lett., 44, 6761–6770, https://doi.org/10.1002/2017GL073598, 2017. a, b, c, d
Ziegler, M. O., Heidbach, O., Morawietz, S., and Wang, Y.: Manual of the Matlab Script FAST Calibration v2.4, GFZ Helmholtz Zentrum, Potsdam, https://doi.org/10.48440/wsm.2023.002, 2023. a
Zoback, M., Hickman, S., Ellsworth, W., and the SAFOD Science Team: Scientific Drilling Into the San Andreas Fault Zone – An Overview of SAFOD's First Five Years, Scient. Drill., 11, 14–28, https://doi.org/10.2204/iodp.sd.11.02.2011, 2011. a
Zoback, M. L.: First- and second-order patterns of stress in the lithosphere: The World Stress Map Project, J. Geophys. Res.-Solid, 97, 11703–11728, https://doi.org/10.1029/92JB00132, 1992. a
The requested paper has a corresponding corrigendum published. Please read the corrigendum first before downloading the article.
- Article
(7674 KB) - Full-text XML
- Corrigendum
-
Supplement
(512 KB) - BibTeX
- EndNote