the Creative Commons Attribution 4.0 License.
the Creative Commons Attribution 4.0 License.
 | 12 Sep 2024
How a volcanic arc influences back-arc extension: insight from 2D numerical models
J. Huw Davies
Investigating plate tectonics through the lens of back-arc extension in subduction systems, this study introduces a “hot region” onto an overriding plate (OP) in 2D thermo-mechanical models, simulating the role of an arc. The models identified two extension locations on the OP: Extension in the Hot region (mode EH) and Extension at a Far-field location (mode EF), which is about 750 km from the trench. The study also found that extension can occur at the same far-field location without a hot region when the OP is young and thin or when the subducting plate (SP) is old with a high sinking velocity. Our models suggest that the EH mode is common, occurring in many cases like the Mariana Trough and Lau Basin, while the EF mode is rare, potentially occurring in locations like the Japan Sea. The primary driving mechanism in our models is poloidal flow beneath the OP, and the extension process involves competition between basal drag, which thins the OP, and thermal healing, which thickens it, as well as competition between thermal weakening in the hot region and that at the far-field location. Increased trench retreat rates, facilitated by increased hot-region temperature and width, have encouraged this flow and have consequently promoted back-arc extension.
- Article
(12191 KB) - Full-text XML
- BibTeX
- EndNote


Back-arc extension is the first stage of the formation of a back-arc basin (BAB), which is found at the rear of an arc on the overriding plate (OP) in a subduction system. It provides a significant window into plate tectonics by displaying both convergent and divergent margins.
The driving mechanisms of back-arc extension have been widely explored through laboratory (Duarte et al., 2013; Clio and Pieter, 2013; Chen et al., 2016) and numerical modelling (Schellart and Moresi, 2013; Baitsch-Ghirardello et al., 2014; Holt et al., 2015; Sheng et al., 2019; Dal Zilio et al., 2018; Wolf and Huismans, 2019; Erdős et al., 2022). Numerous factors that influence back-arc extension have been investigated, including plate ages (Capitanio et al., 2011; Sheng et al., 2019; Dasgupta et al., 2021), slab width (Schellart and Moresi, 2013; Magni et al., 2014), slab dip (Lallemand et al., 2005; Dasgupta et al., 2021), and the negative buoyancy of the slab (Chen et al., 2015). Many previous models have concentrated on the effect of the subducting plate (SP), which has been identified as a driving force for mantle flow and plate tectonics (Schellart, 2004), while some other studies have explored the role that OP properties play in back-arc extension (Clio and Pieter, 2013). Moreover, most of the models listed above include a homogeneous OP, which eliminates the impact that possible weak regions (such as previous suture zones or volcanic arcs) may have on the results. There are a few numerical studies that introduce inherited weak zones onto the OP by directly lowering the viscosity (Nakakuki and Mura, 2013; Dal Zilio et al., 2018; Yang et al., 2019, 2021), but they primarily focus on simulating “suture zones” on the continental lithosphere. There are also some works about volcanic arcs and back-arc extension. For example, Corradino et al. (2022) and Baitsch-Ghirardello et al. (2014) considered models that include the arc formation process and its role in upper-plate rifting. In these studies, volcanic arcs formed self-consistently through the gradual hydration of the mantle wedge. Our work, in contrast, directly studies the effect of an instantaneous hot region on extension.
Even though BABs are all referred to as back-arc basins, most of them were formed by breaking volcanic island arcs apart, leaving a remnant arc on the other side of the basin. Examples include the Lau Basin, which was formed by splitting the Tonga Ridge and Lau Ridge apart (Zellmer and Taylor, 2001); the Havre Trough between the Kermadec Ridge and Colville arc; and the Mariana Trough between the Mariana Arc and the West Mariana Ridge. This phenomenon demonstrates that the presence of a volcanic arc can be important for constraining the location of the extension, but few studies have taken this into account. To investigate this further, in this study, we ran a series of 2D thermo-mechanical and self-consistently driven models with a hot region that simulates a thermal volcanic arc on the OP. We will interchangeably use the terms “volcanic arc”, “arc”, and “hot zone”, knowing that readers understand this as shorthand for approximating the effect of an arc with a hot zone. Firstly, we tested a series of models which have homogeneous OPs without arcs for comparison. Then, an arc was introduced onto the OP to investigate its role in back-arc extension. We aim to look into how an arc influences back-arc extension and its position.
A remaining issue is that the properties of a volcanic arc are not very well known. Even though the locations of present-day arcs are known from the Smithsonian Institution's Global Volcanism Program database, arc–trench distances range widely from 2–1539 km according to data from EarthByte (Jodie, 2016). Additionally, the temperatures of arcs before their extension are difficult to constrain. Thus, we introduced a simplified model for the thermal signature of an arc, which allowed us to systematically test a range of parameters for the arcs (including their width, arc–trench distance, and central temperature anomaly) to figure out their roles in back-arc extension.
Based on the work of Garel et al. (2014), a series of 2D thermally driven subduction models are run using the code “Fluidity”, a computational modelling framework suitable for geodynamic models, which uses an adaptive unstructured mesh that can be optimised dynamically (Davies et al., 2011). Fluidity provides a higher resolution in regions where fields are changing most quickly spatially and a lower resolution in regions where the field of the prognostic variable is stable and hardly changing. For example, in this 2D subduction model within a domain of 10 000 km by 2900 km, adaptivity allows the model to have grid spacing ranging from 400 m (near the subduction zone interface between the SP and OP) to 200 km (in more quiescent regions in the deepest mantle). The grid adapts throughout the simulation, keeping the finest resolution where the spatial gradients of fields (viscosity, second invariant of the strain rate, temperature, and weak-zone phase amount) are highest. It is a significant advantage as it retains the accuracy of the solution while reducing the calculation effort.
2.1 Model setup
A 2D thermo-mechanical model of the subduction system was built by Garel et al. (2014) using a juxtaposed subducting plate (SP) and an overriding plate (OP). Based on this model, we further tested the role that the initial plate ages near the trench play in back-arc extension and introduced a hot region onto the OP.
The model built by Garel et al. (2014) has a large domain to reduce the influence of boundary conditions, measuring 10 000 km in length and 2900 km in depth (the entire mantle depth) (Fig. 1), and a thin weak layer, with a lower maximum composite viscosity and a lower friction coefficient, lies on the SP and decouples the two plates to encourage the subduction of the SP. In the initial configuration, the SP is set to bend beneath the OP, with a radius of curvature of 250 km, and the depth of the tip of the SP is 194 km – that is, the SP has already started subduction at the beginning of the model run. In this way, the problem of subduction initiation is avoided. The two corners on the top surface represent the ridges of the two plates, where the initial age is 0 Myr. The intersection of the plates indicates the position of the trench, where we set the initial ages of the plates as Age and Age. The initial ages of the plates exhibit a horizontal linear change from 0 to Age and Age. Velocity boundary conditions are set as free slip on the bottom and the two sides, whereas the top boundary has a free surface (Kramer et al., 2012).
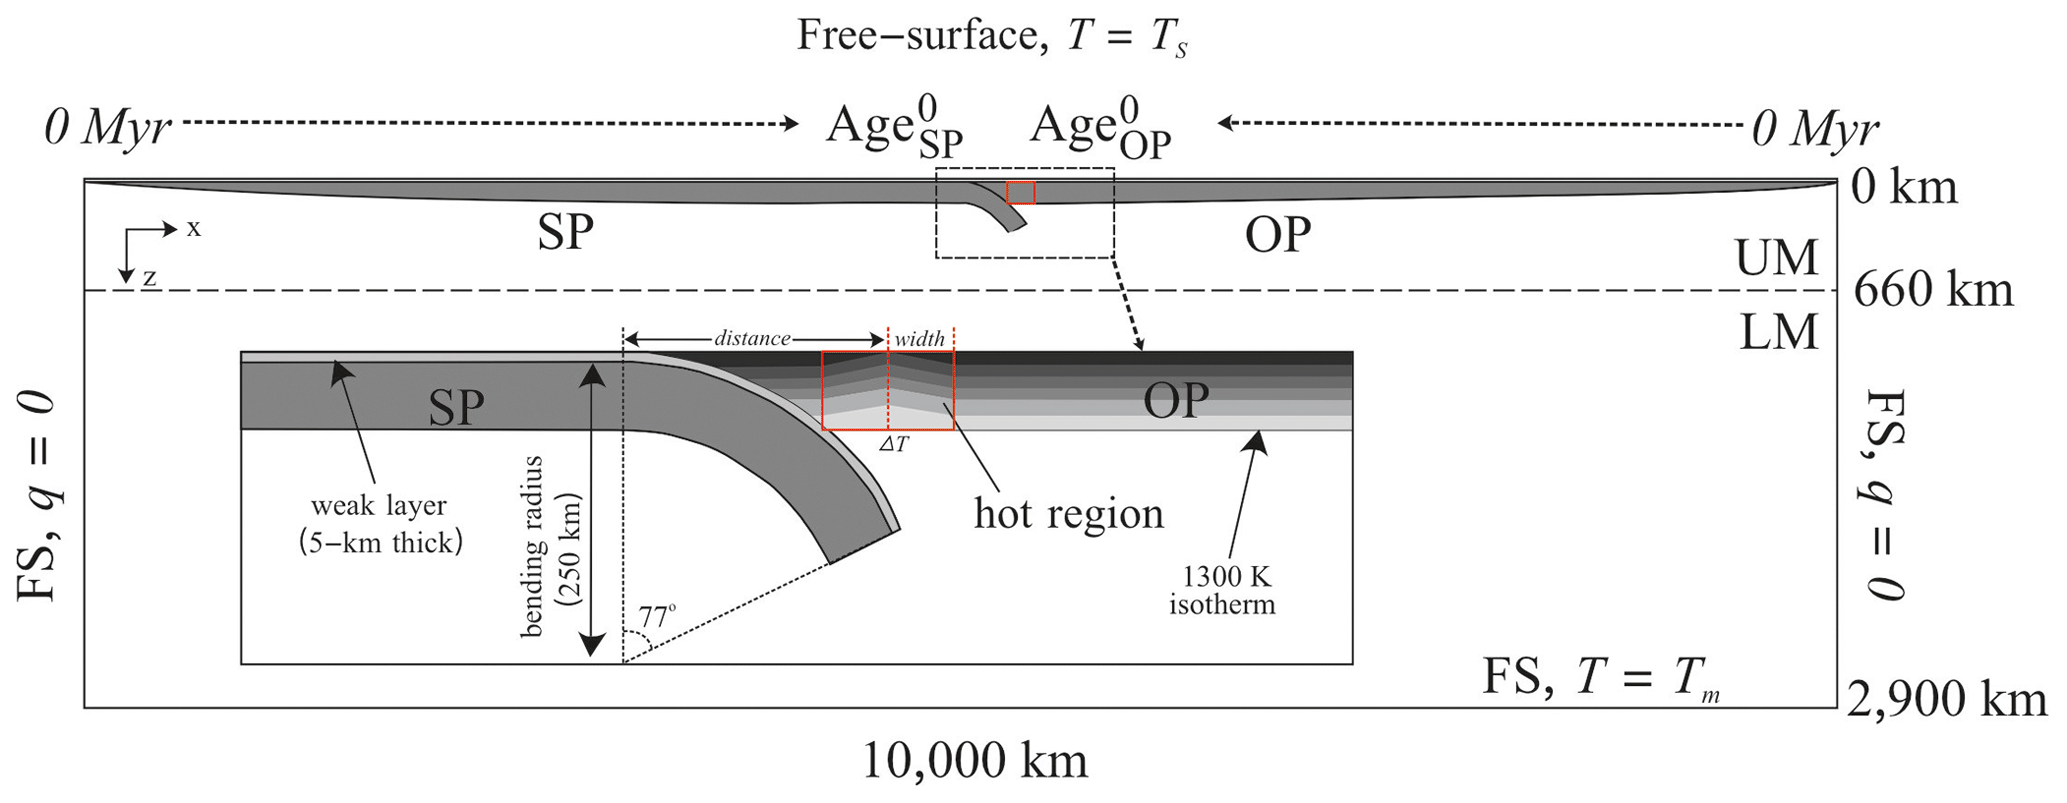
Figure 1Model setup and initial geometry of the subduction simulations with the initial thermal structure of the hot region (modified from Garel et al., 2014). The heat flux (q) is zero at the side boundaries. Free-slip (FS) conditions are imposed at the bottom and sides, with a free surface at the top. UM: upper mantle. LM: lower mantle.
High heat flow has been observed in active volcanic arcs (Manga et al., 2012), meaning arcs can be expected to be characterised by a relatively high temperature. In the initial thermal structure, a hot region has been introduced onto the OP in Garel's model to simulate the volcanic arc (Fig. 1). The temperature at a chosen distance (from 100 to 1050 km) from the trench is increased vertically by a certain degree (from 25 to 800°) from the mantle depth (which varies with the age of the OP) to the surface. It cools off by means of a linear function over a prescribed horizontal distance, named “Width” (from 10 to 50 km), to merge with the background temperature. The mantle temperature limits the maximum value, which is 1300 °C. The hot region extends in depth from the surface to where it reaches the maximum temperature. The hot region has a higher temperature than the background, so its viscosity is lower as well, producing a pre-existing weak zone in the OP at the start of the simulation.
2.2 Governing equations
The governing equations of mantle dynamics follow the conservation law of mass, momentum, and energy. We solve the simplest set of equations by assuming an incompressible mantle and the Boussinesq approximation (McKenzie et al., 1974). The momentum and continuity equations are given as
and the evolution of the thermal field follows
In these three equations, κ denotes the thermal diffusivity, and ui and gj are the vectors of velocity and gravity (which is oriented downwards vertically), respectively. In Δρ (the density anomaly term); T is the temperature; Ts is the temperature at the Earth's surface; ρs is the nominal density at Ts; α is the coefficient of thermal expansion; and σij is the stress tensor, which can be decomposed into deviatoric and non-deviatoric components in accordance with
where τij is the deviatoric stress tensor, p is dynamic pressure, and δij is the Kronecker delta function.
The relationship between the deviatoric stress tensor τij and the strain rate tensor is governed by the viscosity μ:
2.3 Rheology
Four deformation processes of rocks that occur in the slab and mantle are considered: diffusion creep, dislocation creep, Peierls creep, and yielding. The first two mechanisms dominate deformation at high temperatures, with diffusion creep being important in a low-stress environment, while dislocation creep is most significant in a high-stress environment. All of these are temperature-dependent processes, except for yielding viscosity, and they have the following generic relationship with temperature, stress, activation energy, the prefactor, and strain rate:
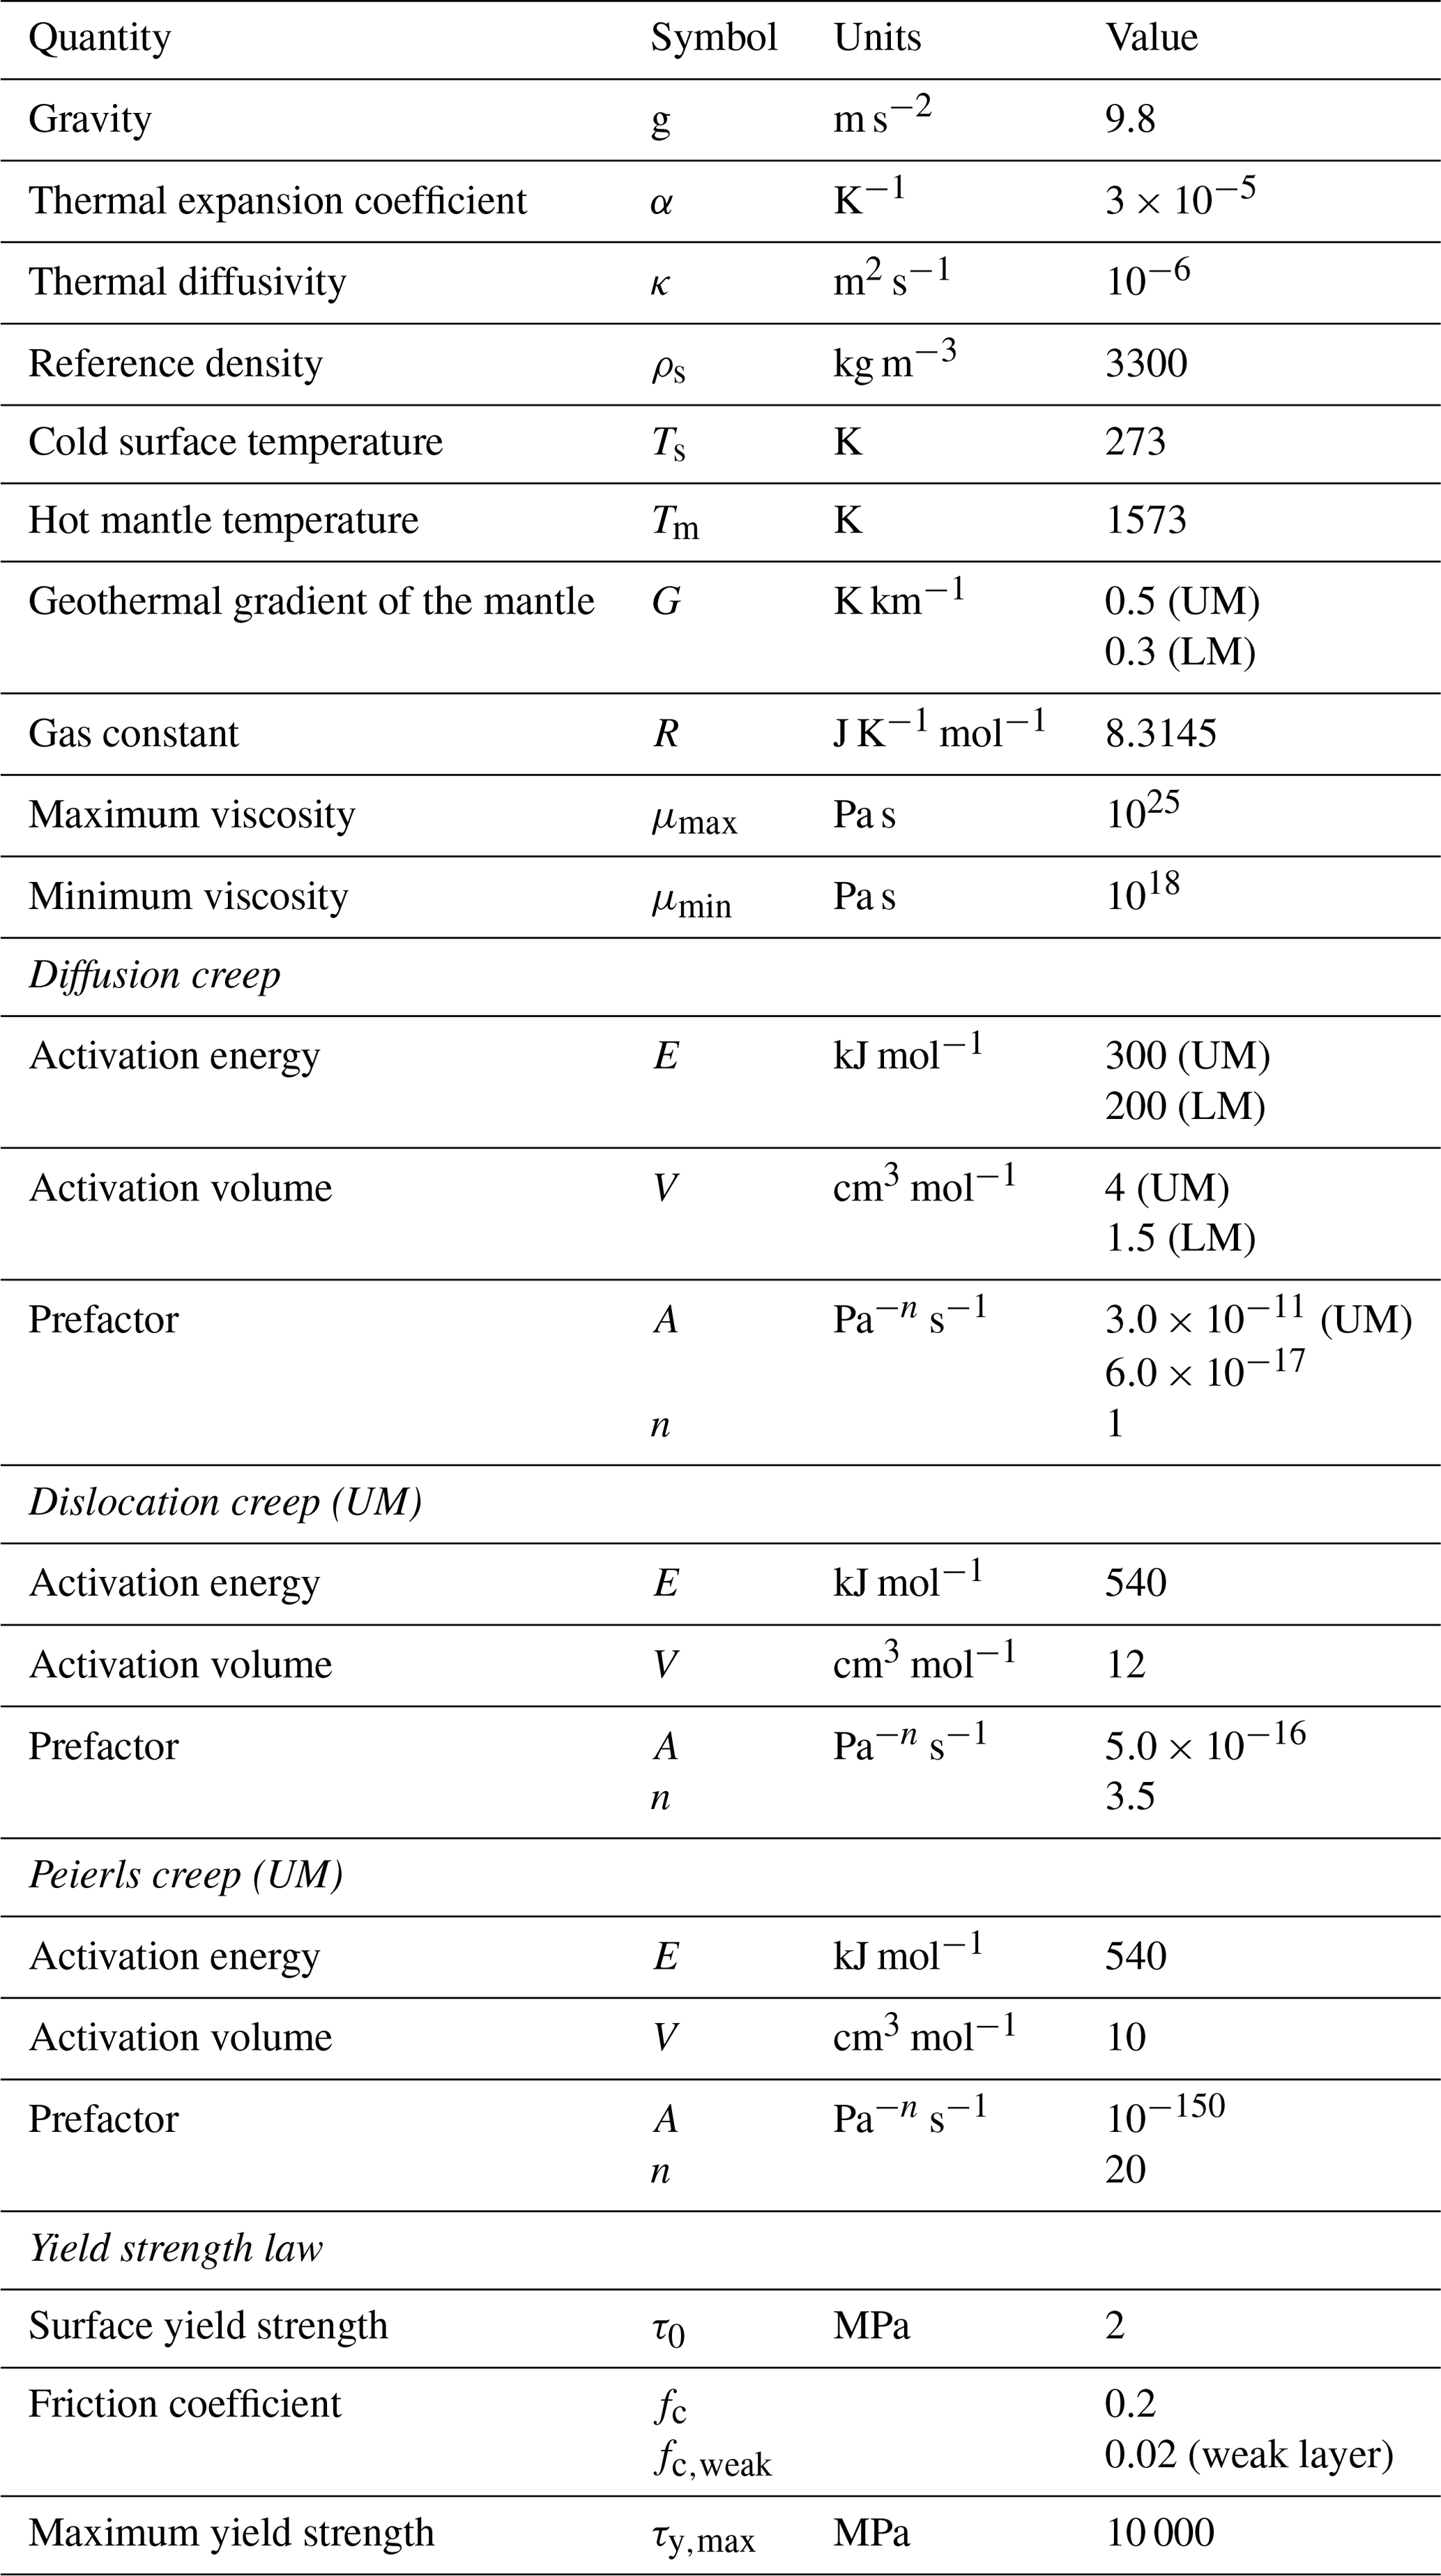
In this equation, A is the prefactor; n is the stress exponent with values of 1, 3.5, and 20 for diffusion, dislocation, and Peierls creep, respectively; E is the activation energy, which is 300 kJ mol−1 in diffusion creep (200 kJ mol−1 in the lower mantle), 540 kJ mol−1 in dislocation creep, and 540 kJ mol−1 in Peierls creep in the upper mantle (Hirth and Kohlstedt, 2003; Karato and Wu, 1993; Karato, 1997); P is the lithostatic pressure, expressed as P=ρsgz; ρs is the reference density at the Earth's surface temperature Ts; g is the acceleration due to gravity; z is the depth; V is the activation volume; R is the gas constant; and is the second invariant of the strain rate tensor. Temperature (T), on which the rheology of slabs and mantles most depends, is given initially as
where z is the depth, x is the horizontal coordinate, t is the time, Ts is the temperature at the Earth's surface, and Tm the mantle temperature. Tr in Eq. (6) is the temperature in Eq. (7), incorporating an adiabatic gradient of 0.5 K km−1 in the upper mantle and 0.3 K km−1 in the lower mantle (Fowler, 1990).
In addition, yielding viscosity is given as
where τy is the yield strength, which is expressed as
Here, τ0 is the surface yield strength (2 MPa), fc is the friction coefficient (0.2), P is the lithostatic pressure, and τy,max is the maximum yield strength (10 000 MPa). The friction coefficient of 0.2 in our models falls between the lower values observed in previous subduction models (Di Giuseppe et al., 2008; Crameri et al., 2012).
For Peierls creep, we use Eq. (6), following the simplification outlined in Čížková et al. (2002). A high exponent n (20 in our work) approximates the exponential strain rate and the temperature dependency of the Peierls mechanism.
The composite viscosity is based on the following combination of these mechanisms:
This assumes that the strain rates of all four deformation processes can be summed, as is the case for viscous dashpots in series (Schmeling et al., 2008). There are two materials set in our models, and the whole domain is controlled by similar rheological laws for both of them. The second material forms a weak layer (5 km thick) on top of the subducting plate, extending down to 194 km depth and grading out below 200 km depth. It has the same parameters as the other material, which covers virtually the entire domain but has a very low friction coefficient (1/10 of that in the normal material) and a lower maximum viscosity of 1020 Pa s (compared to 1025 Pa s in normal material) to ensure decoupling between the subducting and overriding plates. All parameters for the model setup are listed in Table 1.
Two sets of models with a hot region were run to test the roles of properties of a hot region (Table A1) and plate ages (Table A2), respectively. Prior to this, we only ran models with varying initial plate ages for comparison with those containing a hot region on the OP (Table A2). The naming of the models depends on the parameter types, and the names are shown in Tables A1 and A2.
The SP90_OP20 model (Age: 90 Myr; Age: 20 Myr) without a hot region was chosen as a reference model (RM; Fig. 2) for testing the properties of the hot region. The subducting plate (SP) sinks rapidly and reaches the boundary between the upper mantle (UM) and lower mantle (LM) about 4 Myr after model initiation. We note that the sinking velocity of the SP in this short time period increases to a very high value (with a local peak of about 38 cm yr−1 and a lower peak when averaged over 1 Myr (geologically observable time frame)), as expected, as the length of the driving subducting slab increases, before decreasing to nearly steady values of <2 cm yr−1 once the slab approaches and enters the more viscous lower mantle. During the time of rapid sinking, the OP basement near the trench becomes thinned by the mantle wedge flow, and the region that is about 750 km away from the trench on the OP, a region which is under extensional stress, becomes thinner (Fig. 2d). After the SP tip reaches the LM, which is more viscous compared to the UM, its subduction slows down due to the increased resistance, which leads to subduction becoming a steady-state process (Capitanio et al., 2007). The thinning regions of the OP lithosphere heal gradually during the steady-state subduction stage, after which the whole OP is subjected to a compressional environment. The trench retreats all the time, although the rate of retreat varies. The models that tested the effect of the properties of the hot region all have the same Age and Age as the RM (Table A1).
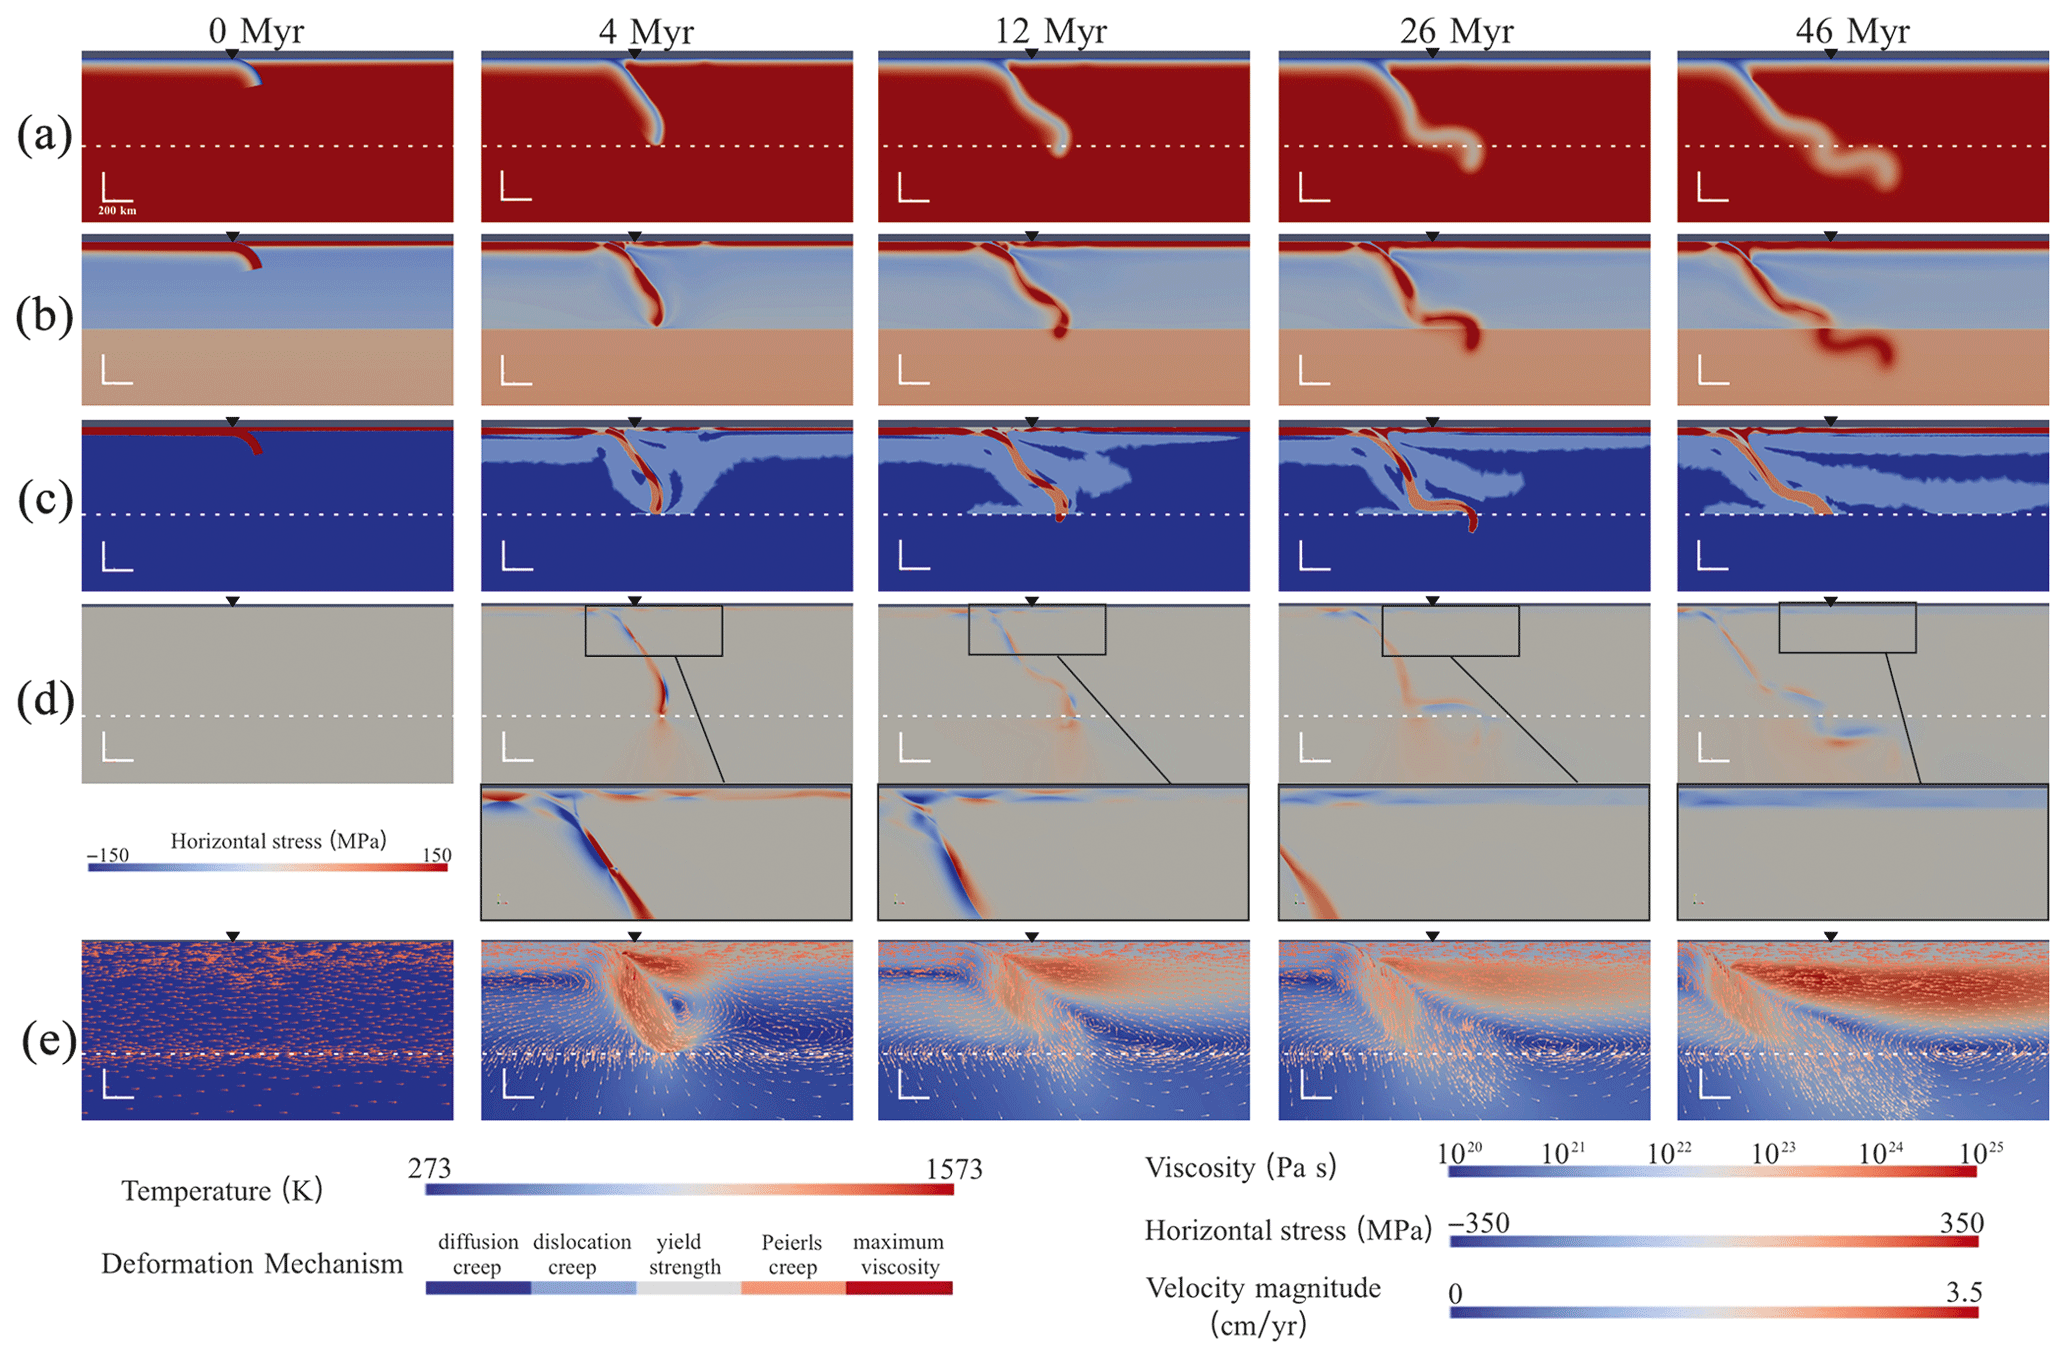
Figure 2Simultaneous snapshots of a zoomed-in view of the reference model showing the time evolution of (a) the temperature field, (b) the viscosity field, and (c) the dominant deformation mechanism. (d) Horizontal stress (positive values indicate extensional stress, and the zoomed-in stress field under each snapshot is shown for a clearer view, displayed with a different coloured bar compared to the original. (e) The velocity magnitude field with arrows (the arrows only indicate directions, while the colours represent the values). The upturned black triangles mark the initial trench positions, and the dashed line represents the boundary of the UM and LM. The horizontal and vertical scales are the same, which are both set at 200 km.
3.1 Back‐arc extension modes
The extension levels on the OP are defined by the isothermal contour of 1300 K (Fig. 3). The contour curving upwards indicates the OP is thinned in terms of thermal structure, which is defined as “Thermal Thinning” (Fig. 3b). When the contour curve reaches the cold thermal surface, the OP finishes thinning (Complete Thermal Thinning; Fig. 3c) and starts to spread (Fig. 3d), which is named “Spreading”. The stage at which Thermal Thinning is completed marks the critical point between Thermal Thinning and Spreading and is regarded as “Incipient Extension”, after which the extensional state begins. Thus, we introduce two new classifications, “Extension” and “No Extension”, identified by capitalisation. Here, we classify Complete Thermal Thinning and Spreading as “Extension” and the states before Complete Thermal Thinning as “No Extension”.
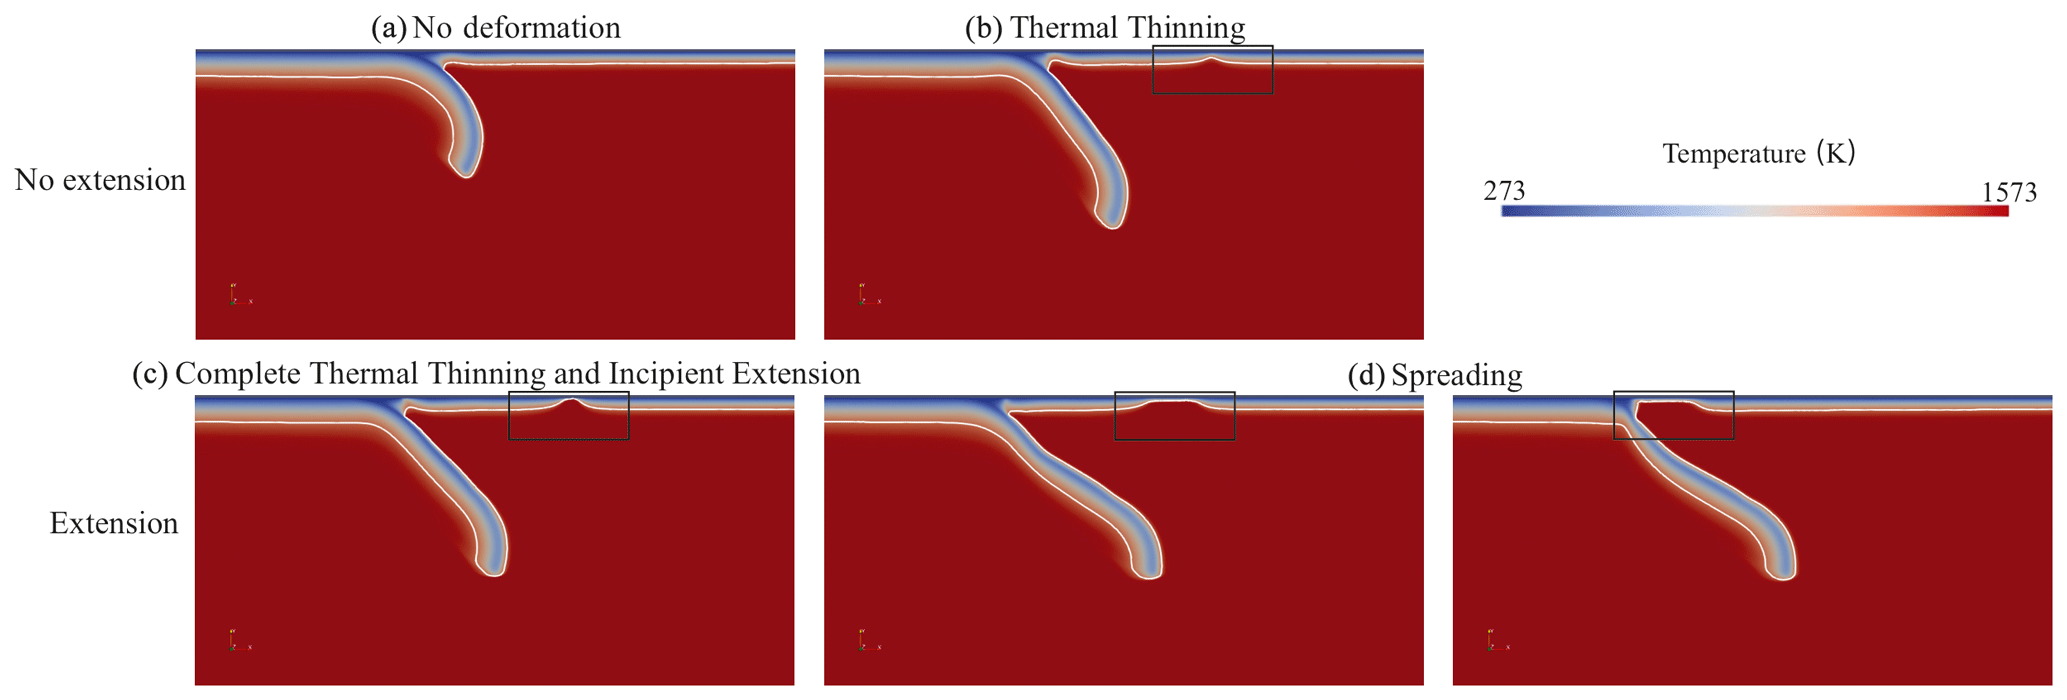
Figure 3Definitions of the extension levels based on the isothermal contour of 1300 K (the white line). The temperature fields depict (a) No Deformation, (b) Thermal Thinning, (c) Complete Thermal Thinning and Incipient Extension, and (d) Spreading (far-field spreading on the left and hot-region spreading on the right). Panels (a) and (b) are classified as “No Extension”, whereas panels (c) and (d) are classified as “Extension”.
Based on the above definitions, three end-member modes of back-arc extension on the OP are recognised (Fig. 4): (A) No Extension (NE) on the OP, which means there is no actual spreading on the OP; (B) Extension at a Far-field location (mode EF; around 750 km from the trench), which is far away from the hot region and the very same region where thinning takes place in the RM; and (C) Extension in the Hot region (EH), including models with slab detachment (EH–D). We also have a fourth mode (D), which has two (dual) extensions (Fig. 5) – i.e. it occurs at both places in modes B and C (EF + EH). The ones showing slab detachment after back-arc extension have been subdivided into EH–D (Fig. 5a and b) – in cases where the slab breaks off, the plate loses its slab pull, and both subduction and trench retreat stop. Extension in all modes lasts for a short time (just 1 to several million years) before gradually healing in the steady subduction state or after slab detachment (in EH–D mode).
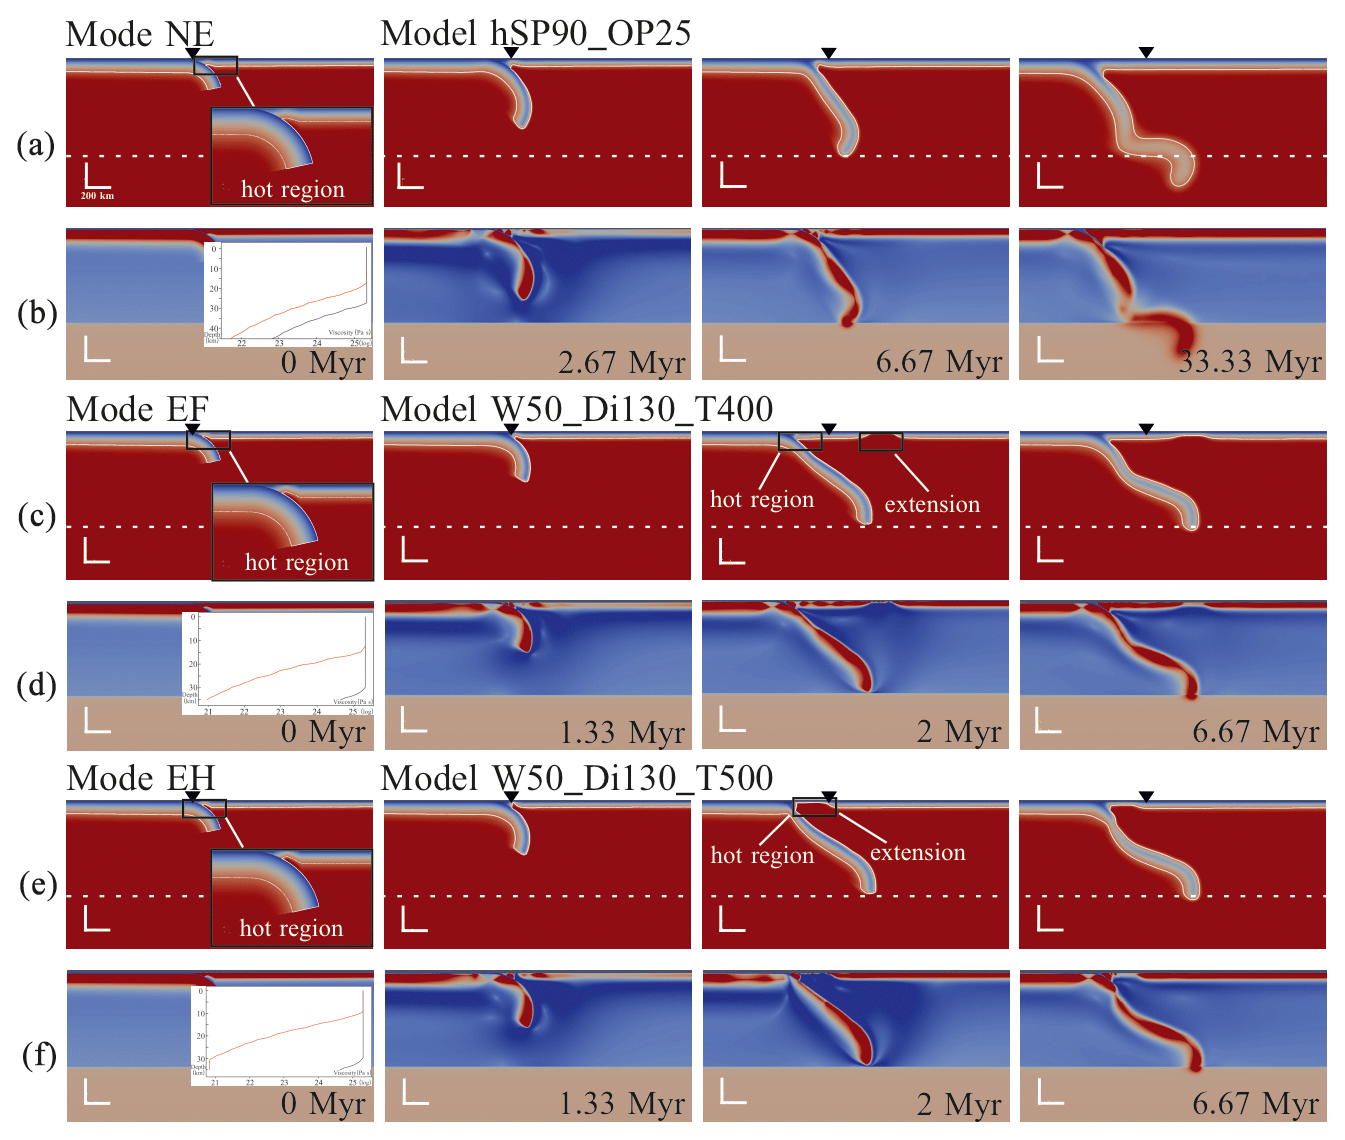
Figure 4Three end-member modes of back-arc extension on the OP. (a, b) NE. (c, d) EF. (e–h) EH. Panels (a), (c), and (e) show the temperature field with the isothermal contour of 1300 K (shown in white), and we have a zoomed-in view showing the hot region in the 0 Myr configuration of each model. Panels (b), (d), and (f) show the viscosity field and plots of the initial vertical viscosity in the hot-region centre in the 0 Ma configuration of each model, represented by the red lines, while the black lines represent the viscosity without the hot region. The two lines in different colours show the change in viscosity resulting from emplacing a hot zone. The parameters of each model are shown in Tables A1 and A2. In the hSP90_OP25 model, Age is 90 Myr, Age is 25 Myr, and “h” means a hot region is included and the properties are as follows: Width = 50 km, Distance = 150 km, and ΔT=100 °C. The name “W50_Di130_T400–500” indicates that Width = 50 km, Distance = 130 km, ΔT = 400–500 °C, and the plate ages are the same as in the reference model (Age is 90 Myr, and Age is 20 Myr).
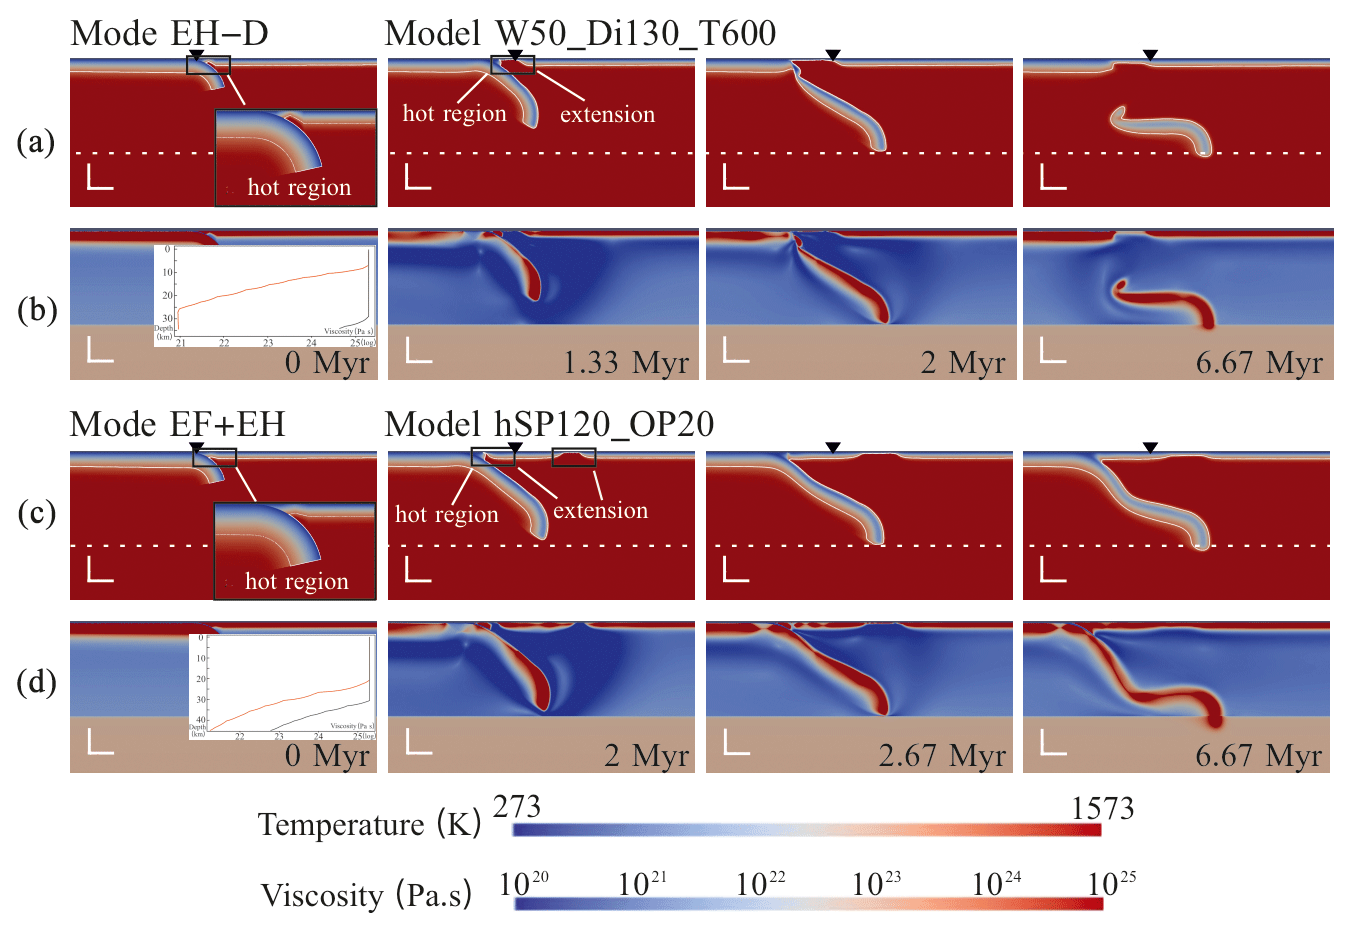
Figure 5Supplementary modes of back-arc extension: (a, b) EH–D, which shows slab detachment, and (c, d) EF + EH. As in Fig. 4, panels (a) and (c) show the temperature field, and panels (b) and (d) show the viscosity field and plots of the initial vertical viscosity in the hot-region centre. The specific description is given in Fig. 4. The hSP120_OP20 model has a hot region with the same properties as the hSP90_OP25 model but different plate ages of 120 and 20 Myr. The name “W50_Di130_T600” indicates that Width = 50 km, Distance = 130 km, ΔT = 600 °C, and the plate ages are the same as in the reference model.
The reason why we combine EH and EH–D into the same mode is that slab detachment occurs after back-arc extension and has no effect on driving extension. The specific morphology is not the primary focus of this research.
3.2 Varying parameters of the hot region
More than 200 models have been ran by varying the following parameters of the hot region: the distance from the trench to the centre of the hot region (“Distance”), the width from the heated centre of the hot region to each side (“Width”), and the increased temperature at the centre of the hot region resulting from the background temperature (ΔT) (shown in Fig. 1 and Table A1). This has been done to investigate the influence of a pre-existing hot region (a volcanic arc) on back-arc extension.
3.2.1 Regime diagrams
In this section, we mainly show how the modes change through variations in the above parameters (Figs. 6 and 8).
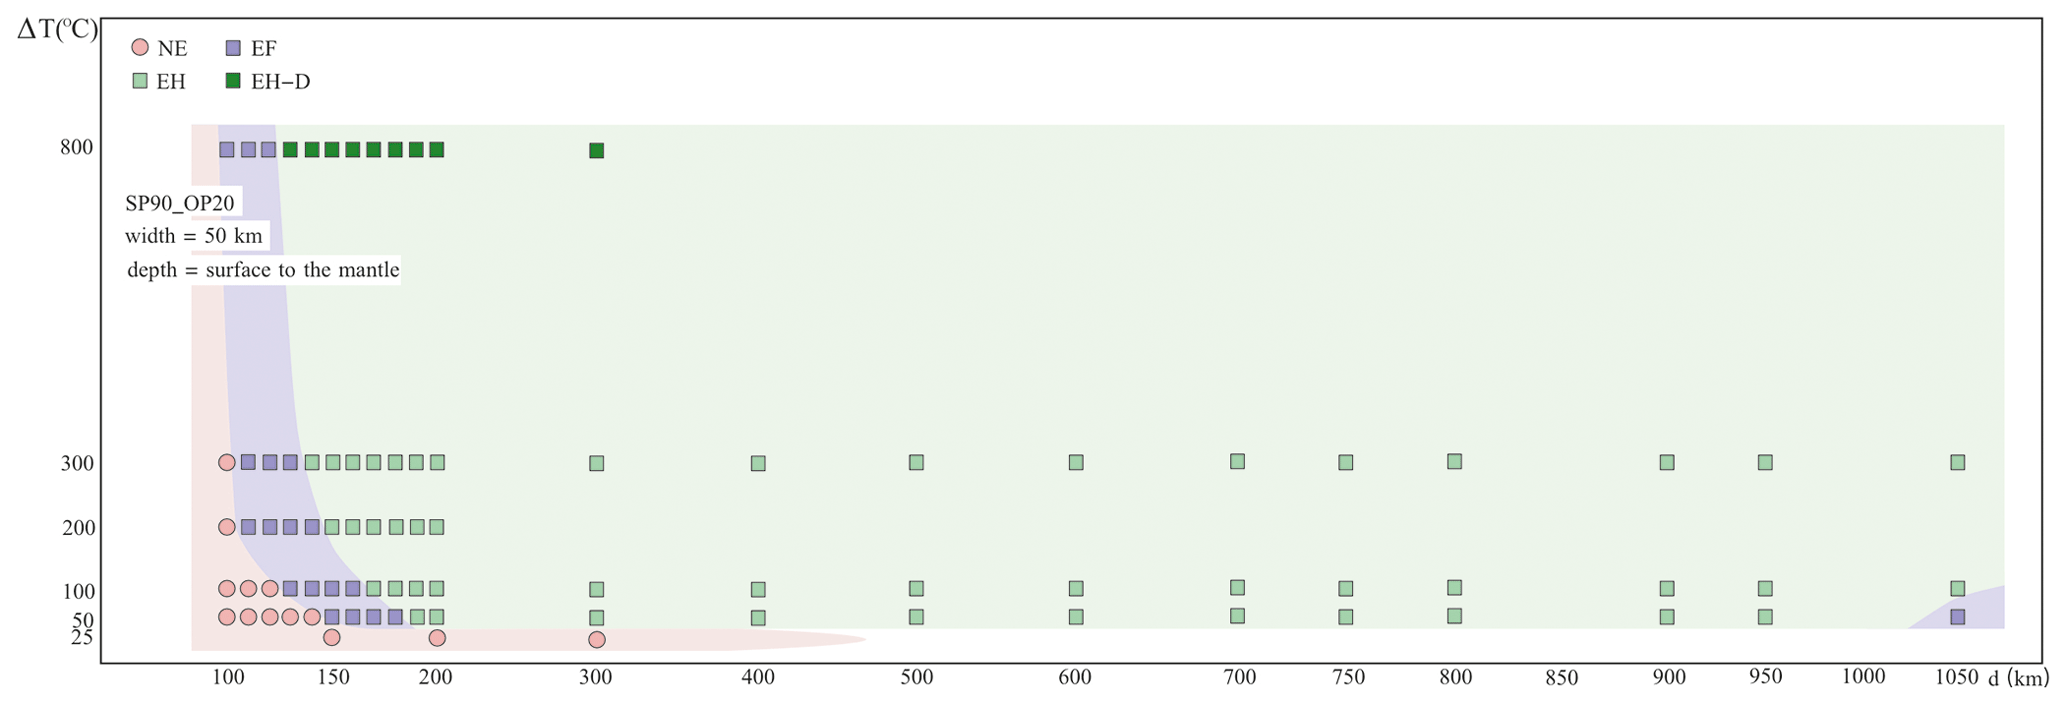
Figure 6Regime diagram showing the Extension behaviour of the overriding plate with a hot zone. It is a function of the distance from the trench to the centre of the hot region (d, km) and the temperature anomaly of the hot region (ΔT). The Width of the hot region is fixed at 50 km.
Firstly, Width was fixed at 50 km, and Distance and ΔT were tested systematically (Fig. 6). All of the modes we introduced in Sect. 3.1 are identified in this series of models. When the hot region is quite close to the trench, such as when Distance = 100 km, the model behaves in mode NE (No Extension) no matter how hot the hot region is. As the hot region is emplaced farther away from the trench, Extension at the Far-field location (mode EF) emerges. When ΔT is prescribed to 50 °C, extension cannot appear if Distance is less than 150 km, whereas when the thermal anomaly is increased to 100 °C, extension occurs even when Distance is only 130 km. In other words, the Distance threshold controlling the emergence of extension on the OP reduces as the temperature of the thermal anomaly increases.
As Distance increases further, the mode of the cases changes from EF to EH, indicating extension occurs in the hot region close to the trench. The threshold of Distance controlling the transition from mode EF to mode EH has the same trend as that controlling the existence of extension. When Distance is larger than the threshold, most of the cases show mode EH as long as there is extension. However, the W50_Di1050_T50 model (W50 means that Width = 50 km, Di1050 means that Distance = 1050 km, and T50 means that ΔT = 50 °C) shows mode EF unexpectedly (Fig. 7). In this model, the hot region is located 1000–1100 km from the trench, but the extension is still around 750 km from the trench. When the hot region is either very close to or very far away from the trench, the extension may emerge at a distance of around 750 km from the trench.
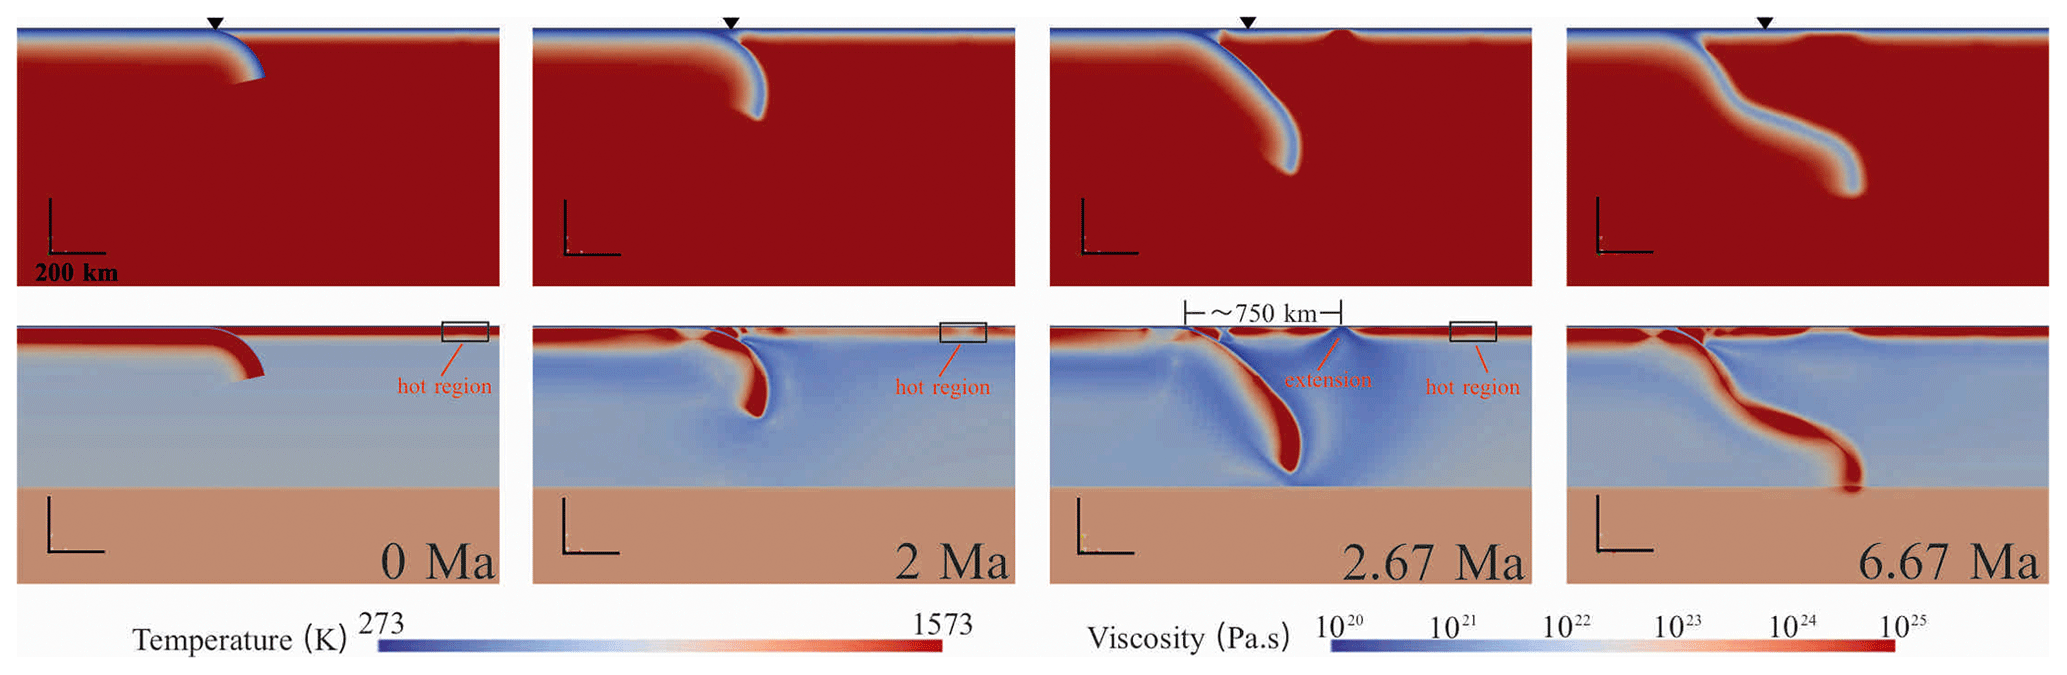
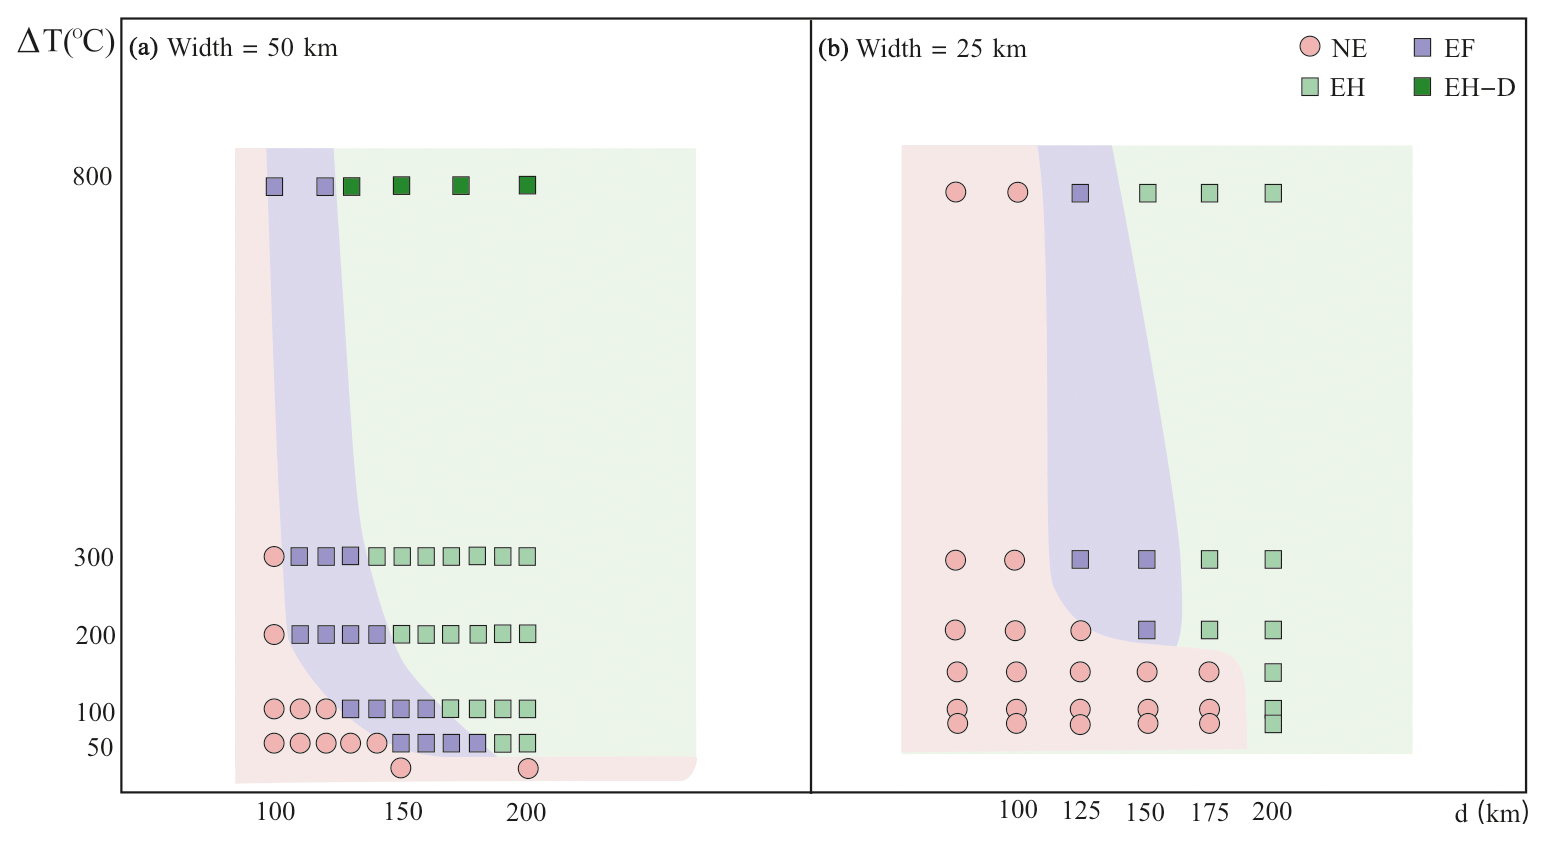
Figure 8(a) Regime diagram of Distance vs. ΔT when Width = 50 km and (b) a comparison with the results when Width = 25 km.
To find out the role that Width plays, we reduced it from 50 to 25 km. A series of cases investigated how the combination of Distance and ΔT changes the extension behaviour of the hot region when Width takes different values (Fig. 8). The depth extent of the thermal anomaly has not been changed in these models. Compared to Fig. 8a, the results in Fig. 8b show that the thresholds between modes NE and EF, as well as those between modes EF and EH, both clearly increase in terms of Distance and heating temperature. Take models with a 100 °C temperature increase, for example. When Distance = 150 km, the model with Width = 50 km is in EF mode, which shows Extension on the OP. However, the model with Width = 25 km is in NE mode, which does not show Extension on the OP. Regardless of the specific values, the trend in the changes in threshold when Width = 25 km is the same as that when Width = 50 km. In summary, as one might expect, a wider hot region favours an extension.
In conclusion, a farther distance from the heated centre to the trench, a higher temperature, and a larger size of the hot region all favour back-arc extension on the OP.
3.2.2 Correlation with the trench retreat rate
Vertical series of models with a Distance value of 130 km (shown in Fig. 6) were chosen to investigate the influence of ΔT. ΔT varies from 50 to 800 °C, with the modes transitioning from NE to EF and then to EH as ΔT increases.
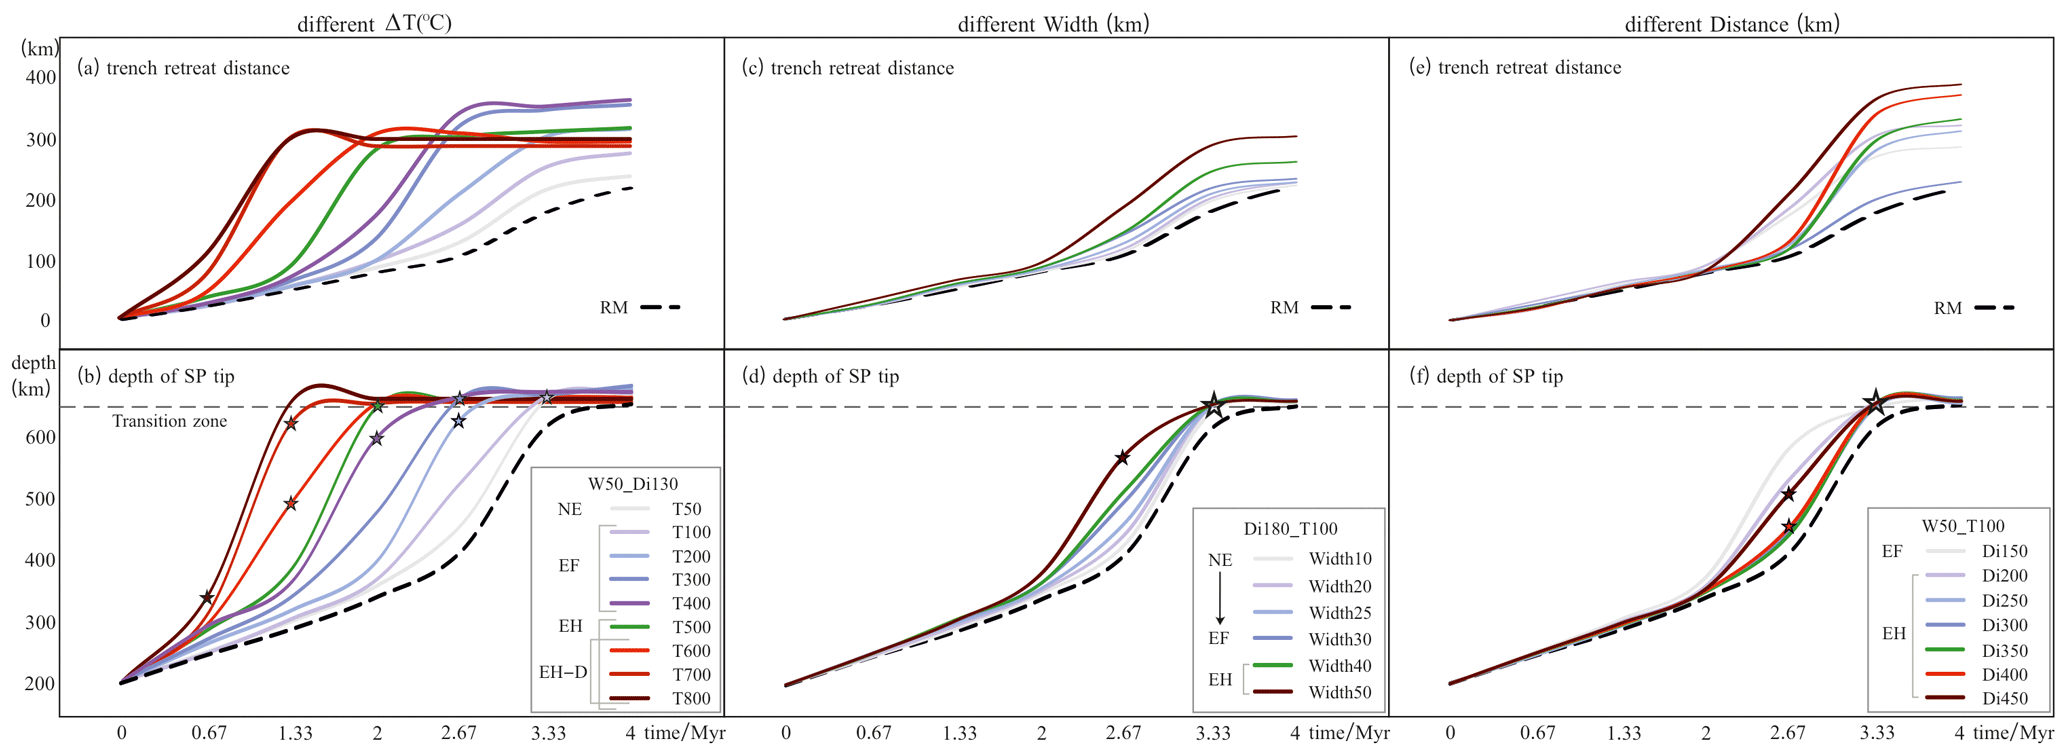
Figure 9Comparisons of total trench retreat (a, c, e) and total depth of SP tip subduction (b, d, f) throughout the first 4 Myr simulation with varying ΔT (a, b), Width (c, d), and Distance (e, f). The dashed grey line represents the transition zone depth (660 km). The stars mark the time when Extension occurs in each model, and the colours of the stars correspond to the lines of the models. The reference model (RM) is indicated by the dashed black line.
As stated in the description of the reference model (RM), the SP initially sinks rapidly and then accelerates until the tip reaches the transition zone between the UM and the LM. After introducing a hot region onto the OP, the SP sinks more rapidly on average, and the trench retreats slightly faster (peaking from 10 to 23 cm yr−1) than in the RM, before the SP reaches the lower mantle. When ΔT increases, the general sinking rate of the SP also rises, and the SP tip takes less time to get to the transition zone (Fig. 9b). Like the vertical-slab sinking rate, the trench retreat rate shows a similar trend as ΔT increases (Fig. 9a). When ΔT is no more than 400 °C, the trench retreats at a similar speed at first. Then, the model with a hotter “arc” shows a quicker trench retreat rate; after 3.33 Myr, the trench maintains a relatively slow retreating rate in the steady-state stage. As ΔT increases further, the trench obviously retreats faster before the SP reaches the transition zone. The trench stops retreating following slab detachment in mode EH–D as there is no extra force exerted on the SP.
Similarly, when Width increases, both the SP rate and trench retreat rate slightly increase, showing the same trend as when ΔT increases (Fig. 9c and d), although the increase with Width is much less than with ΔT. However, there is no specific correlation between Distance and the trench retreat rate (Fig. 9e) and between Distance and the SP sinking rate (Fig. 9f). For example, compared to the W50_T100_Di300 model, which shows the slowest trench retreat rate except for the RM, the trench in the W50_T100_Di200 model retreated more quickly and farther over the course of 4 Myr.
Whether increasing Width or ΔT, the hot region becomes hotter and weaker overall, which encourages trench retreat by providing less horizontal resistance to the trench rollback. In contrast, varying Distance alone has no influence on trench retreat since the heated area and temperature remain unchanged. Additionally, EH–D did not occur in the two latter series of models, which possibly means that ΔT has the most significant influence on the behaviours of the plates.
3.3 Varying initial plate ages adjacent to the trench
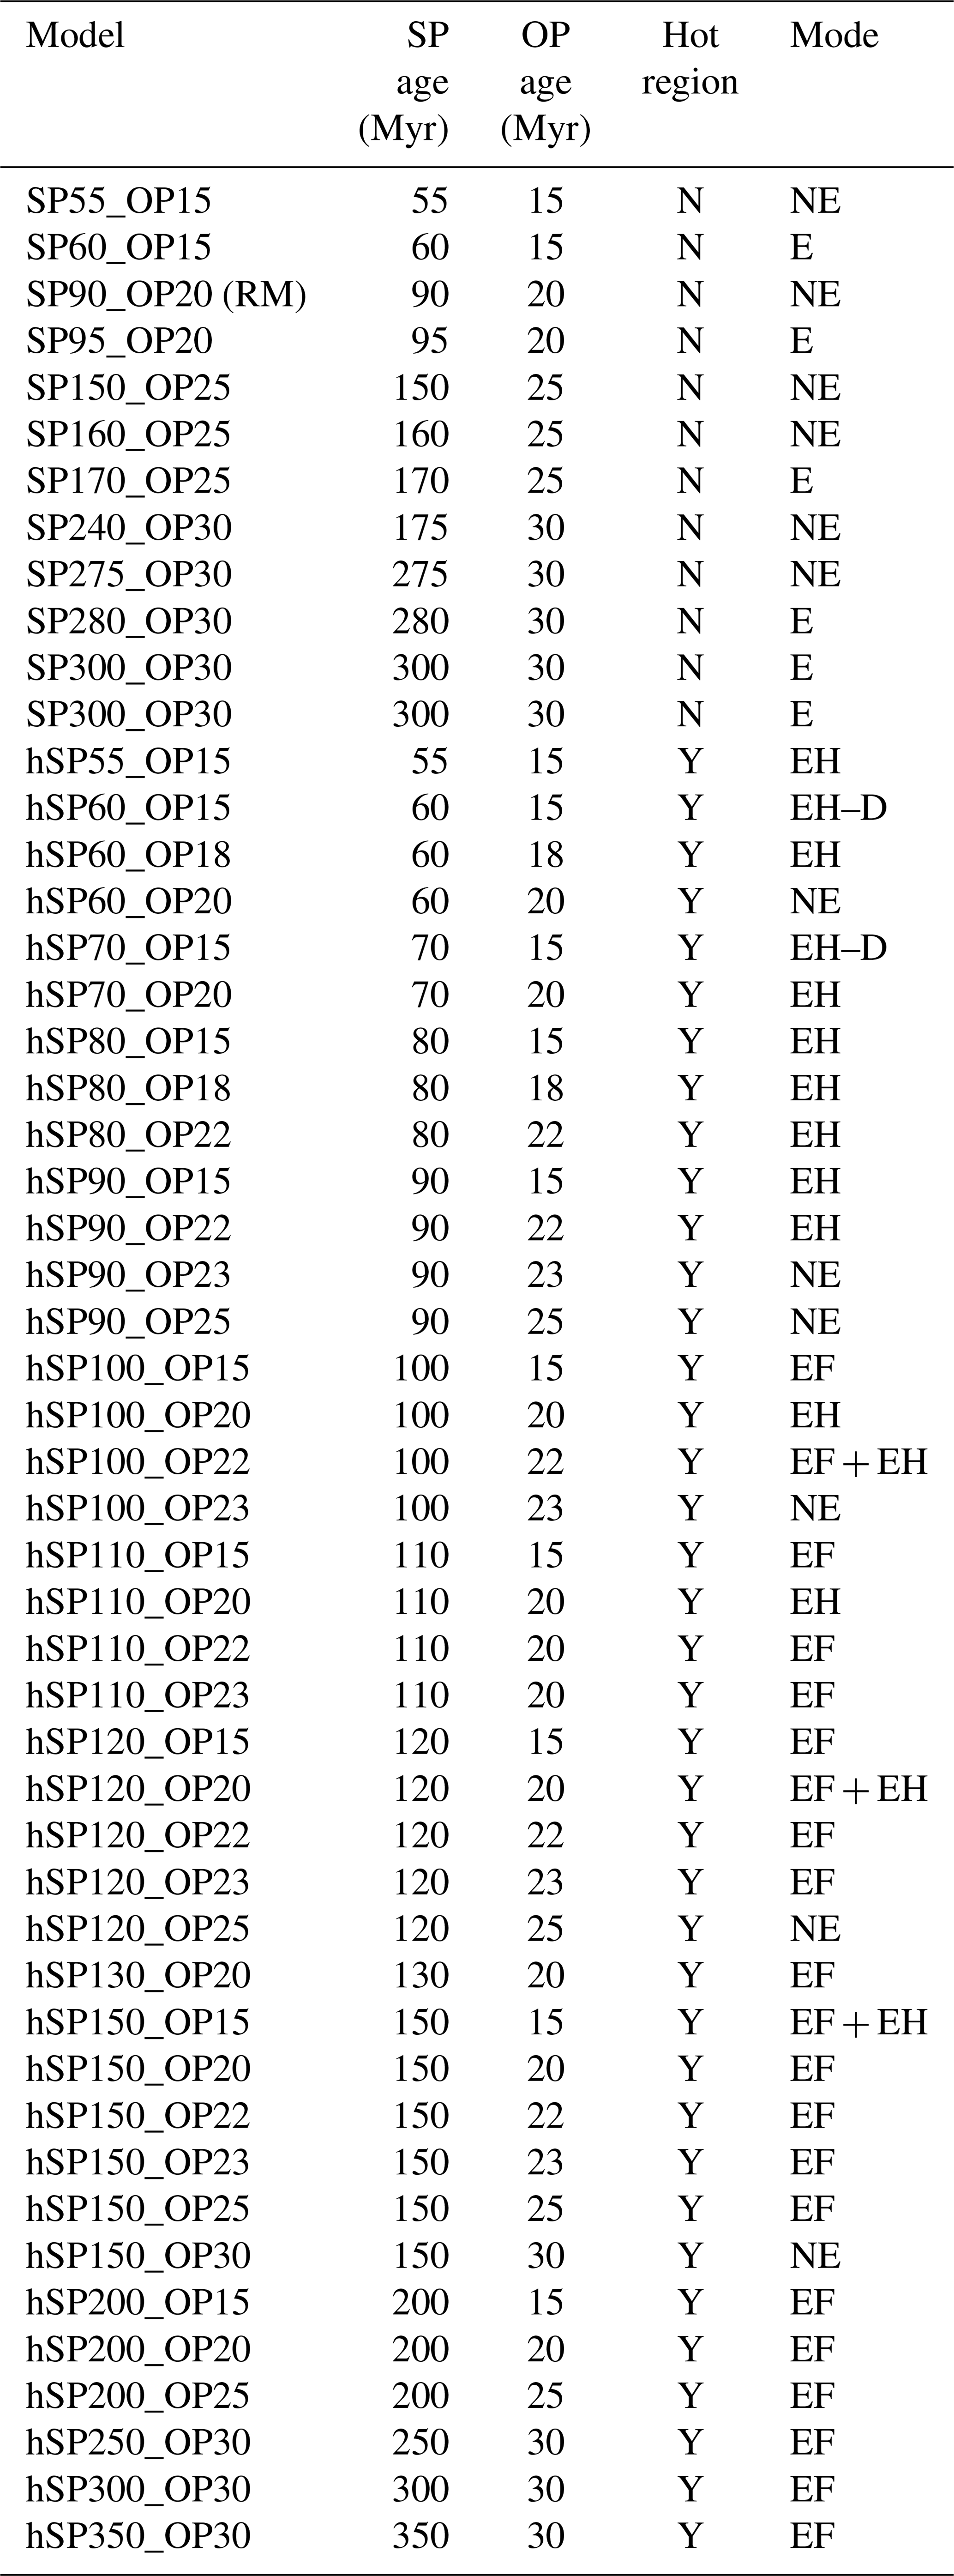
We chose the hot region located 100–200 km from the trench and heated it by 200 °C (consistent with the W100_Di150_T200 model). We then tested how different combinations of plate ages influence OP deformation (Table A2). The results of changing the initial OP age and SP age at the trench, showing the modes of OP deformation, are shown in Table A2 and Fig. 10. In general, the figure reveals that an older SP age tends to result in Extension when the OP age remains unchanged, whereas a younger OP age leads to Extension when the SP age is fixed.
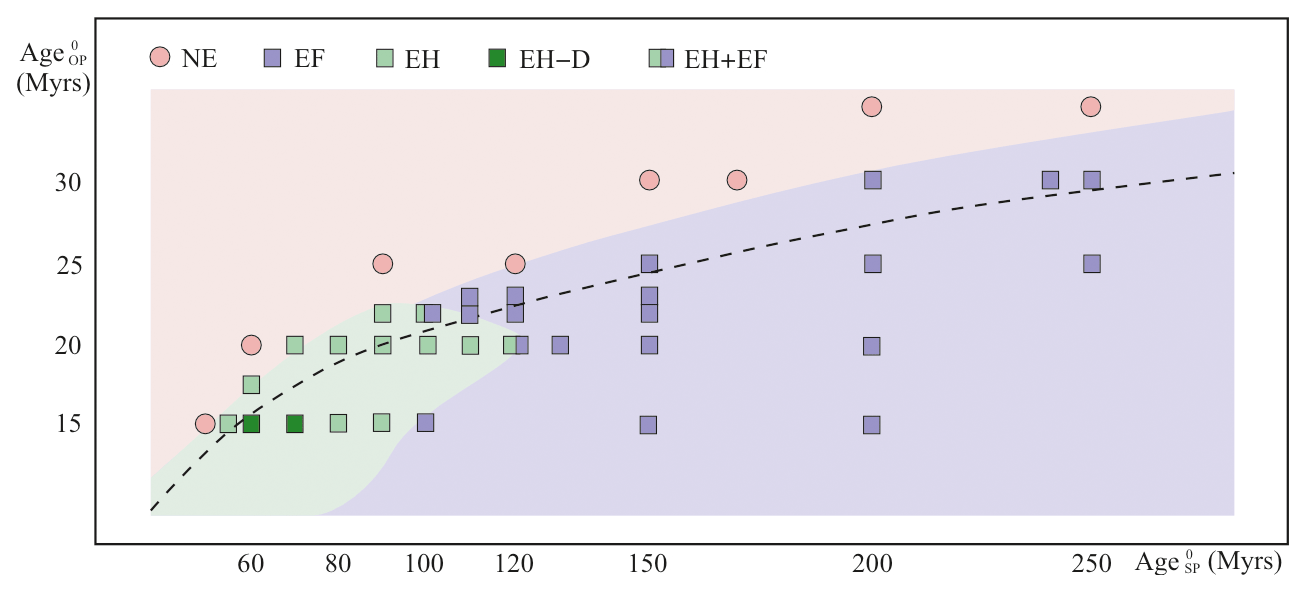
Figure 10Regime diagram illustrating the combination of Age and Age. Each symbol represents a model with a hot region located 100 to 200 km from the trench, and the different coloured regions are classified by the results of models with a hot region. For comparison, the threshold for the existence of extension in models without a hot region is marked by the dashed black line. Note that the symbols consisting of two squares each indicate that two end-member modes occur in one model.
In models without a hot region (changing modes indicated by the dashed line), when the initial age of the OP adjacent to the trench (Age) is prescribed to be 20 Myr, the threshold of the initial age of the SP at the trench (Age) that leads to Extension is 100 Myr (SP100_OP20 model). A little bit of thinning occurs at the place where Extension exists in the SP100_OP20 model if Age is decreased to 90 Myr (SP90_OP20 model). We vary Age and find the minimum Age to generate Extension for each Age. As seen in Fig. 10, the SP60_OP15, SP95_OP20, SP165_OP25, and SP280_OP30 models are the marginal cases in the region where the models exhibit Extension. As Age increases from 70 to 280 Myr, the time before extension occurs lengthens slightly – from 2.7 to 4.7 Myr. For these three models, increasing Age or decreasing Age stops extension. All of this Extension or Thermal Thinning occurs at a far-field location about 700–750 km from the trench.
Adding a hot region increases the Age threshold of the existence of Extension, which is indicated by the boundary of the pink area and the dashed line (Fig. 10), and allows extension to occur in the hot region, which is much closer to the trench than the far-field location. When Age is relatively low, Extension is more likely to happen at the arc, although some cases showed far-field extension before adding the hot region, e.g. the SP80_OP15 and hSP80_OP15 models (“h” in the model name indicates a hot region is set in the model). Most models with an Age higher than 100 Myr tend to lead to an EF mode. Furthermore, the transition modes in Fig. 10 show how the end-member modes change when the initial plate ages near the trench vary. Taking the OP20 series of models (where OP20 indicates that Age is 20 Myr) as an example, when Age increases from a low value (such as is the case for the hSP60_OP20 model, which is in mode NE), Extension first occurs in the hot region (e.g. in the hSP70_OP20 model; mode EH) and at the far-field location (mode EF) when Age is high enough (e.g. in the hSP150_OP20 model). The transitional mode EH + EF is shown in this process as well.
4.1 The driving mechanism of back-arc extension
Generally speaking, back-arc extension can be driven by extensional stresses related to plate motions (applied at the trench boundary of the OP) and/or subduction-induced mantle flow (applied at the base of the OP). In the first mechanism, extensional stress is generated from the speed difference between the trench and the OP, while in the second mechanism, it arises from variable shear stresses at the base of the OP. The plate starts to rift when extensional stress exceeds the natural strength of the plate, a phenomenon that can arise from increasing stress or decreasing strength. We further investigated these aspects to find out which are most important in our models.
We calculated the vertically averaged horizontal stress (σh) over the OP thickness and plotted the maximum value (σhmax) for each simulation as a function of Age (Fig. 11) in models without a hot region. The horizontal location for the stress calculation is the location of maximum σh at the time of maximum σh. When Age is relatively low, σhmax increases quickly as Age rises from 50 to about 110 Myr (Age Myr). After this age, σhmax no longer changes quickly as AgeSP0 keeps rising, even in cases where Age is greater than 270 Myr and Extension occurs (Fig. 11c). Most importantly, σhmax does not change when a hot region is introduced onto the OP (marked by the stars). In these models, the extensional force (indicated by σhmax) does not play a controlling role in back-arc extension, which implies the weakening of the OP dominates the process in these cases.
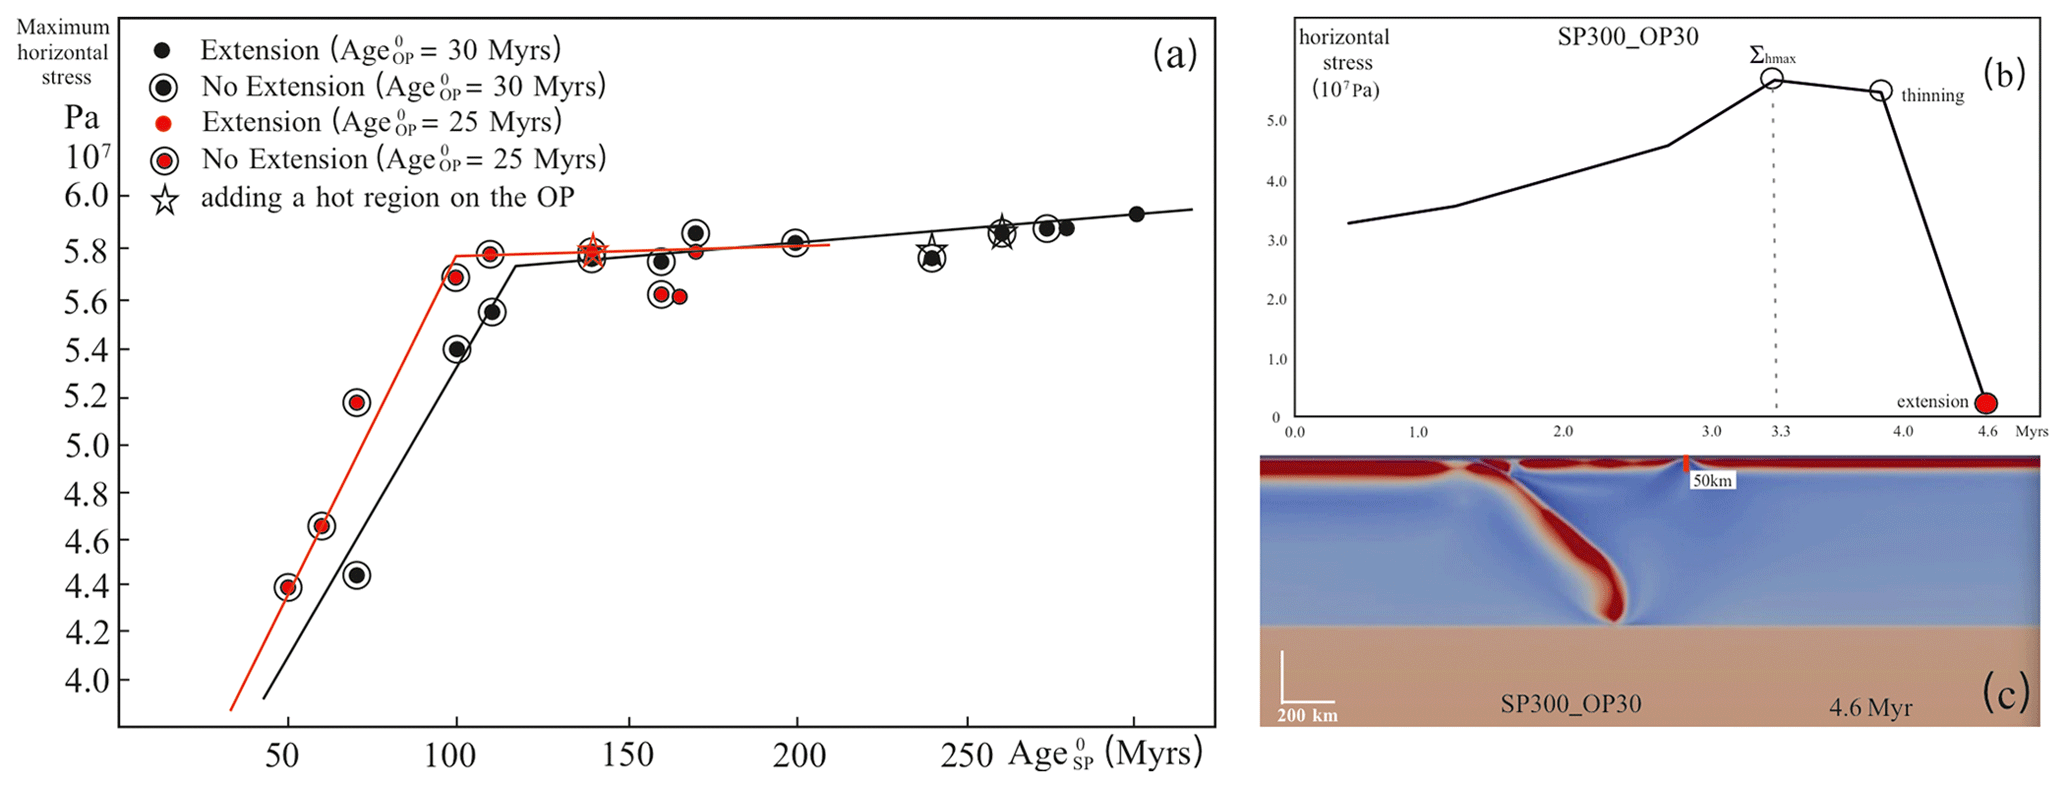
Figure 11(a) Maximum vertically averaged horizontal stress (σhmax) over the OP thickness (from the surface to the bottom of the OP – 50 km depth when Age is 30 Myr and 45 km depth when Age is 25 Myr, as defined by the temperature contour of 1300 K) vs. Age. The stars mark the models which have a hot region on the OP. (b) Depiction of the time evolution of vertically averaged horizontal stress (σh). (c) Depiction of the specific location (in the viscosity field) where the stress in panel(b) is calculated. Panels (b) and (c) both show the SP300_OP30 model. A positive stress value indicates extensional stress.
The analysis of the horizontal stress shows a compressional region close to the trench just before extension occurs in all the models (Fig. 12), which is consistent with the RM (Fig. 2d) and some previous numerical models (Chen et al., 2016; Schellart and Moresi, 2013; Corradino et al., 2022; Balázs et al., 2022). Even though Extension in mode EH occurs near the trench (orange star in Fig. 12), the vertically integrated horizontal stress (Σh) shows no observable difference from that in EF mode. The introduction of the hot region, as illustrated in Fig. 11, has almost no influence on σh. Therefore, the change in Σh or σh does not really determine if Extension occurs, which suggests that the horizontal extensional stress (though required) is not the critical cause of extension in our models. It is worth noting that these models have a mobile OP, facilitated by a ridge on the right-hand boundary, and that the conclusion might be different for fixed OP.
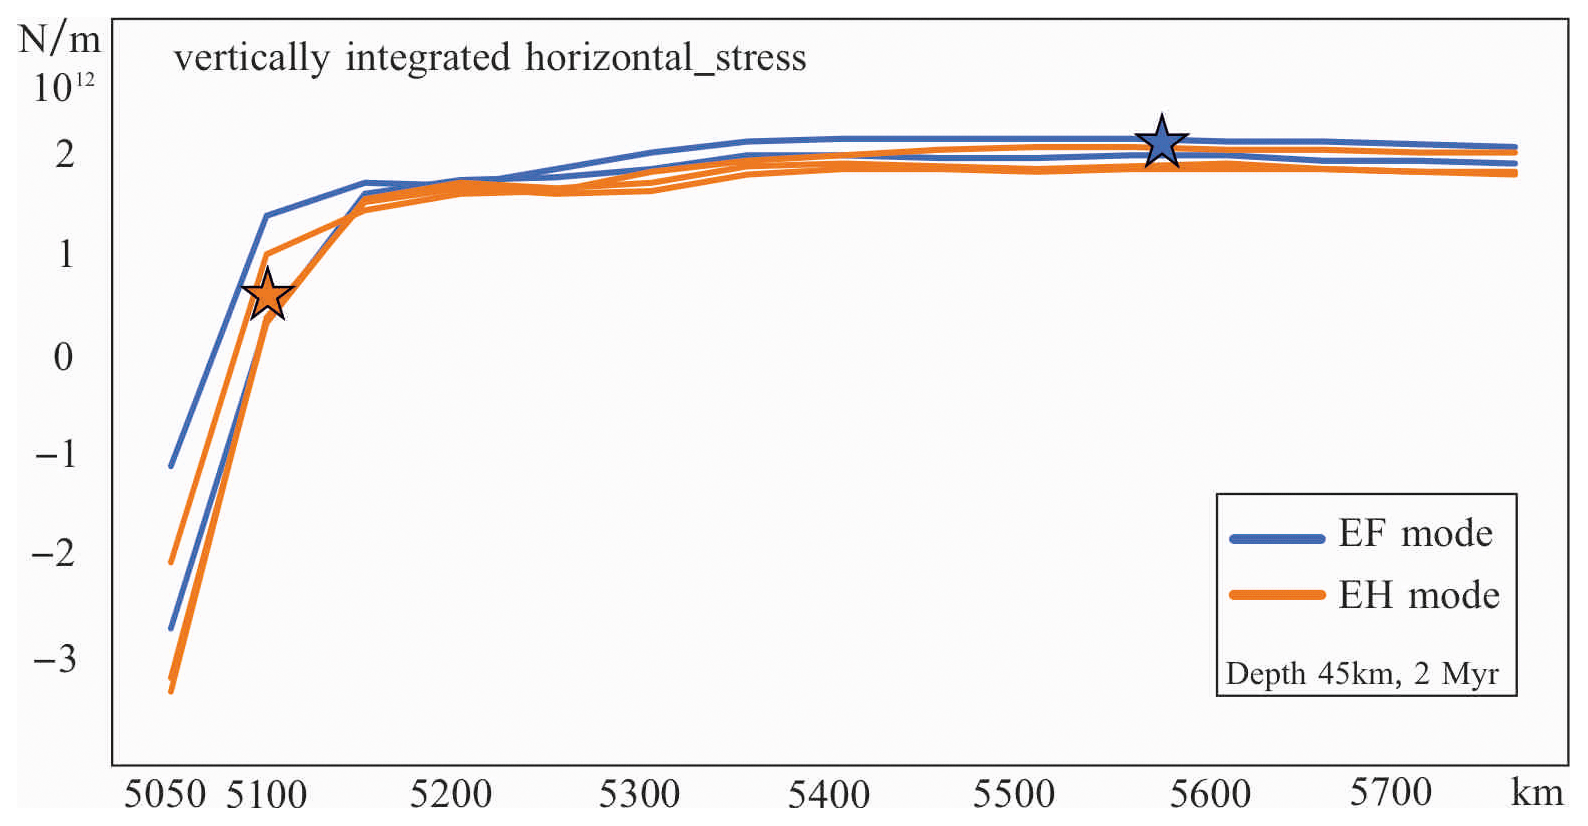
Figure 12Vertically integrated horizontal stress over the OP thickness (from the surface to the bottom of the OP – 45 km depth, defined by the temperature contour of 1300 K) vs. x coordinates (the trench starts with an x coordinate of 5000 km). A positive stress value indicates extensional stress. For clarity, only two colours are used in this figure to represent models in different modes (see legend). The chosen models are W50_Di120_T100 and W50_Di150_T100, which are in EF mode, along with W50_Di170_T100, W50_Di190_T100, and W50_Di250_T100, which are in EH mode. The stars each mark the locations of back-arc extension in the same colour as their plots (e.g. the blue star represents the extensional location in EF mode). This is evaluated after 2 Myr in all simulations.
The RM shows only very limited thinning approximately 750 km from the trench on the OP (Fig. 2). To produce back-arc extension, either the OP needs to weaken or the driving force needs to increase. In this series of models, the OP can be weakened in two ways. One way is through the introduction of a hot zone in the initial setup as viscosity decreases as temperature rises (Eq. 6), making the hot zone easier to extend. The other way it can be weakened is through upwelling flow beneath the OP. This latter process must have occurred in this series of models, as indicated by the existence of the EF mode. Overall, the main driving mechanism is poloidal flow induced by the subducting slab, as shown in the velocity field (Fig. 13). The trenchward horizontal flow (X component) produces basal drag via the velocity gradient (Fig. 14), which facilitates extension by producing the extensional force and weakening the OP. Moreover, the Y component of the flow also encourages the thermal weakening of the OP. The upwelling flow, the cause of both components of the flow, is always approaching the OP in a similar direction (about 60° to the horizontal). The horizontal size of the upwelling-flow cell varies a little and is around 750 km (±80 km) in the horizontal direction, largely as a result of the varying SP dip arising from varying slab retreat rates. This far-field location is regarded as the edge of the flow cell in this work.
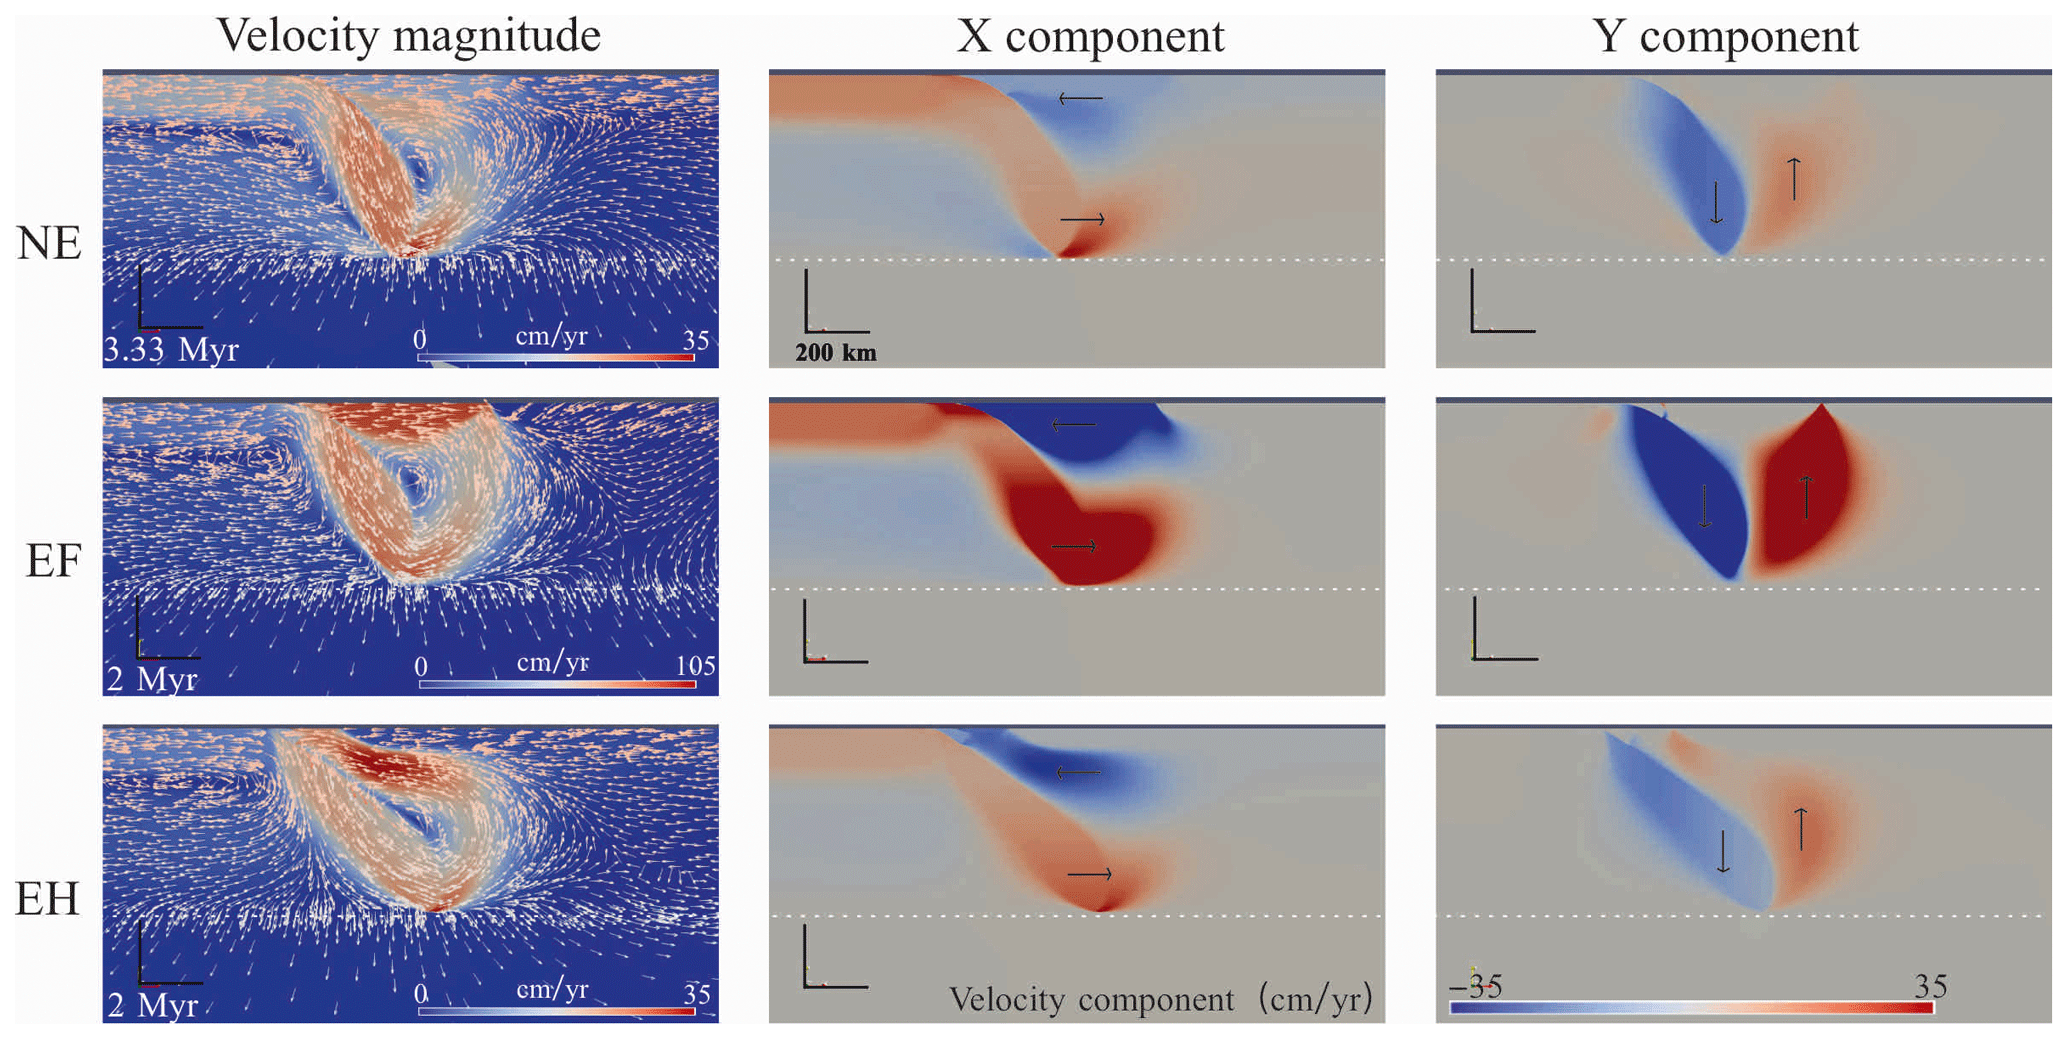
Figure 13Velocity fields in three modes. The small arrows indicating the direction of the mantle flow are marked in the velocity magnitude fields. In the velocity component fields, the positive values represent rightward (in the x component field) or upward (in the y component field) directions. The large arrows in the velocity component fields show the velocity directions. The chosen time is just before the Extension (in modes EF and EH) or Thermal Thinning (in mode NE). Note that the scale of velocity magnitude in mode EF is set to be 3 times larger than that in other modes to improve figure clarity.
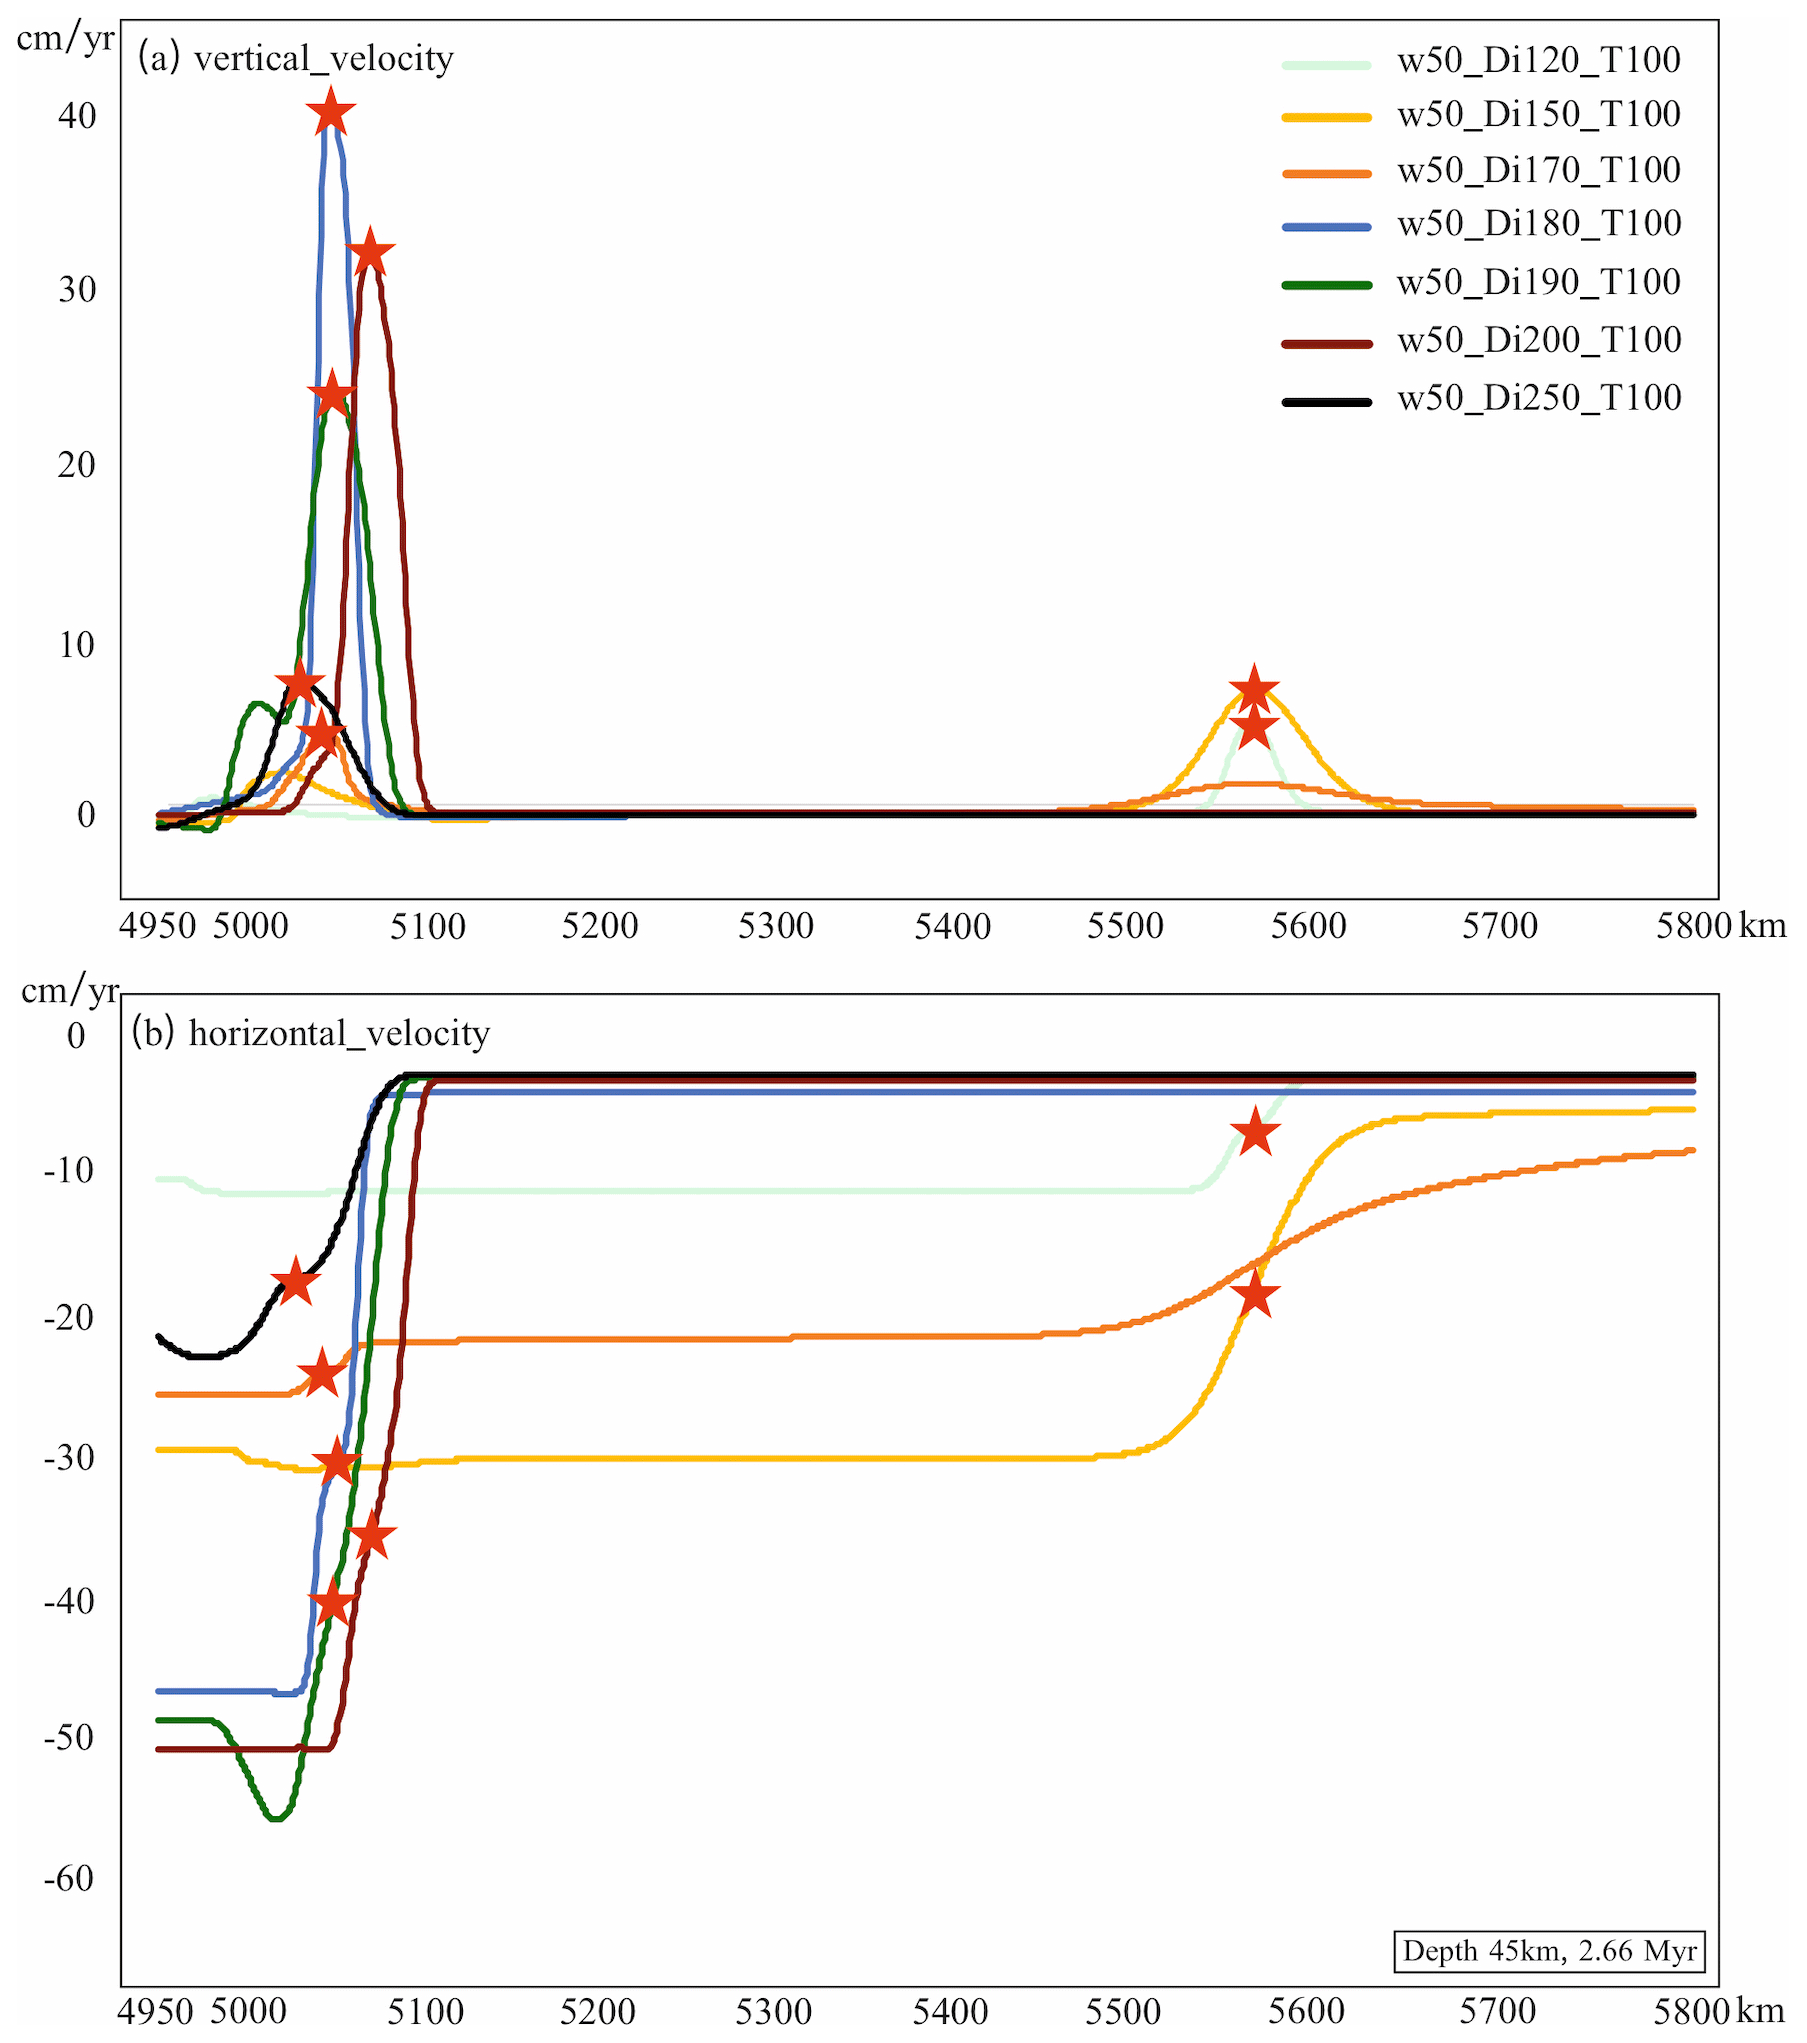
Figure 14Velocity components vs. x coordinates at 45 km depth after 2.66 Myr. (a) Vertical velocity (Y component) vs. x coordinates. (b) Horizontal velocity (X component) vs. x coordinates. Back-arc extension is marked by the red stars. The W50_Di120_T100 and W50_Di150_T100 models are in mode EF, while the others are all in mode EH.
The extension process involves competition between basal drag, which thins the OP, and thermal healing, which thickens it. The model starts to rift when basal drag prevails, but thermal healing is always efficient because all extensions heal within a few million years. Thermal weakening starts at the base of the thermal boundary between the OP and the underlying mantle. However, the viscosity weakens from both the base and the top of the OP (Fig. 4) and produces “necking” (Lei, 2022) in the middle, which is because yielding viscosity dominates at the top and is not dependent on the temperature but on the yielding strain rate and the depth. Then, extension occurs from the base of the OP, and the material flows into the gap at the surface. Thermal thinning induces thermal weakening; similarly, the hot region provides thermal thinning at the start of such simulations and encourages extension. The specific effect of basal drag will depend upon the asthenosphere–lithosphere coupling, which is self-consistently resolved in our work, which involves a thermal lithosphere. However, basal drag could differ slightly in reality with more complex lithospheres.
From this discussion, we conclude that the primary extensional force probably arises from basal drag, while Extension occurs when the OP is weakened.
4.2 The role of an existing arc
In numerical models, the existence of an arc is not necessary to produce extension on the OP (Fig. 10; Sheng et al., 2019). However, the position of extension depends on the size of the mantle flow cell (about 750 km in our models) if the OP is homogeneous. A hot region on the OP not only facilitates the occurrence of extension but also changes the position of extension under certain conditions (Figs. 6 and 10). The specific mode that a model produces depends on different parameters – in our cases, these include the properties of the hot region and plate ages. There have been many studies investigating back-arc extension (Sdrolias and Müller, 2006; Capitanio et al., 2010, 2011; Schellart and Moresi, 2013; Dal Zilio et al., 2018; Sheng et al., 2019; Dasgupta et al., 2021), and some have emphasised the balance of strength and forces that lead to extension and have shown that the location of extension on the OP can be related to the flow cell in the mantle wedge (Dal Zilio et al., 2018). In our work here, we similarly find extension occurring in a similar flow-cell-controlled location, but the emplacement of a hot region can sufficiently weaken the OP to change the location of extension to this weakened region.
When the plate ages are fixed and the model shows Thermal Thinning but no extension before a hot region is introduced, some models show Extension in the Hot region (mode EH), which means that the hotter and weaker “arc” is split apart, whereas some others show Extension occurring at the same place as the thinning location, even though the weakened zone is much closer to the trench (mode EF), which suggests that the driving force (including the force which weakens the OP) is undoubtedly enhanced.
The extension process is a competition between thermal weakening (reduced viscosity due to increased temperature) in the hot region and that at the far-field location. The former primarily results from the thermal thinning of the hot region itself, meaning it depends on Width and ΔT – the viscosity is dependent on temperature, which is shown in Eq. 6. The latter results from the mantle wedge flow, which is controlled by the initial plate ages (which controls the convergence rate), Width, and ΔT as faster trench retreat (Sect. 3.2.2) also induces a stronger mantle flow (Lei, 2022). The results show that the contribution of Width and ΔT to the thermal weakening of the hot region is greater than their contribution to the wedge flow. Thinning is generated by thermal weakening. Thermal weakening draws in some flow due to the continuity of the mass, which makes the hot region weaker and encourages more extension. At the same time, the weakening accelerates trench retreat and induces more wedge flow. When the mantle flow is first strengthened, the area concentrating the flow at the far-field location weakens and is dragged by stronger basal traction, regardless of where the weak region is, which results in mode EF. However, when Width is large enough and ΔT is high enough, thermal weakening in the hot region dominates the process, and the hot region becomes the region of extension, resulting in mode EH (Fig. 13). At the same time, the flow going to the far-field location reduces because the upwelling flow focuses on the hot region, meaning the far-field location no longer shows extension. If thermal thinning produced by the mantle wedge flow exceeds that produced by the hot region, then extension occurs at the far-field location.
Different from Width and ΔT, Distance influences neither the trench retreat rate nor the size of the mantle flow. The upwelling flow is sucked into the edge of the flow cell and gradually decreases on each side (Fig. 13). As Distance increases, the hot region initially gets close to the cell edge and gains more upwelling intrusion. Thus, the hot region is weakens further and attracts the mantle flow towards itself. As Distance increases further, the hot region moves away from the cell edge, and the mantle flow fades away, meaning the W50_Di1050_T100 model transitions to EF mode again (Fig. 7). However, a larger trench–arc distance is always associated with a flatter slab in nature (Cross and Pilger Jr, 1982), and there are positive correlations between the slab dip and back-arc extension, meaning that a BAB would rarely be observed when the arc is relatively far away from the trench.
Figure 10 shows that when Age is relatively low (e.g. 60–90 Myr), cases with extension occurring 750 km away from the trench and a homogeneous OP transition to EH mode after the hot region is added. In these cases, a hot region largely weakens the OP and concentrates the flow at the weak zone; however, the arc also facilitates the mantle flow. When the arc is more susceptible to breakage than the far-field location for this mantle flow, the flow tends to focus on the arc, and the far-field location loses extensional stress. The high negative buoyancy and strength of an older SP encourage a higher trench retreat rate and a stronger mantle flow (Garel et al., 2014), meaning that the flow is strong enough to break at the far-field location before the weak zone breaks. Under such circumstances, the models show EF mode. It is possible that at a very old age, the slab might resist bending, leading to another mode (Di Giuseppe et al., 2009).
4.3 Comparison to observations in nature
Mode NE (No Extension), mode EH (Extension in the Hot region), and mode EF (Extension at a Far-field location) are identified as three end-member modes (Sect. 3.1). In nature, behaviours similar to mode NE and mode EH are shown in many subduction zones. For example, the Lesser Antilles subduction zone does not exhibit back-arc extension on the OP (Caribbean Plate), which is consistent with mode NE. The phenomenon that many BABs were formed by splitting a volcanic arc apart (Mariana Trough, Lau Basin, East Scotia Basin, etc.) is reproduced by mode EH. However, very few or even no BABs are definitely observed extending far away from the volcanic arc (similar to the mode EF process). Speculating from the limited available information, the Japan Sea possibly formed far behind the Japan arc (Tatsumi et al., 1990) and might be an example of EF. The Japan arc is observed to be approximately 300 km away from the Japan Trench (Jarrard, 1986), and the distance from the spreading centre of the Japan Sea to the trench is around 700 km (Tamaki, 1992), which is close to the mantle flow size in our models (750 km). Admittedly, there are opinions suggesting that the Japan Sea opened at a proto-Japan arc (Jolivet et al., 1994), but the evidence presented is debatable due to the lack of a remnant ridge on the western side of the Japan Sea.
Generally speaking, an old SP is more likely to generate back-arc extension in our models, which is consistent with observations in nature. For example, the eastern Pacific SPs are quite young at the interface where they enter the subduction zones, corresponding to the fact there are few BABs found along the eastern Pacific margin. Specifically, the Juan de Fuca, Explorer, South Gorda and Winona plates, which are along the coast of North America, are less than 10 Myr old at the trench (Rogers, 1988), while the Nazca Plate, which subducts beneath the South American Plate, is about 40 Myr old (Capitanio et al., 2011). In contrast, most western Pacific SPs are more than 100 Myr old (Müller et al., 2008), and there are a lot of BABs distributed along that margin. This phenomenon aligns with our basic model behaviour. However, our models show mode EF when the SP age is quite old because of the strong mantle flow it induces, whereas most of the BABs across the western Pacific formed during the process of mode EH. To generate the EH mode, our models require either an SP aged less than about 100 Myr and a young OP or a hot region with a large size and high temperature if the SP is relatively old. In view of the ages of the western Pacific SPs (over 100 Myr), it is assumed that the arcs in nature would be hotter than those in our models. Unfortunately, the uncertainty regarding the effects of actual arcs on back-arc extension makes it difficult to compare our model directly with observations.
Additionally, the survival time of extension in our models is consistent with that in nature (Clark et al., 2008). Real back-arc basins are not active for a long time; most of the time, the extension duration lasts less than 20 Myr (Luyendyk et al., 1973; Tamaki, 1995; Fujioka et al., 1999; Jolivet and Faccenna, 2000; Eagles et al., 2005; Eagles, 2010; Barckhausen et al., 2014; Doo et al., 2015). For example, 40Ar–39Ar dating has shown that the basement of the Japan Basin is aged between 24–17 Myr old, which means the crust grew for 7 Myr (Kaneoka, 1992). The ages of present-day BABs are usually less than 10 Myr old (Madsen and Lindley, 1994; Caratori Tontini et al., 2019). For example, the Mariana Trough began forming 5 Myr ago (Yamazaki et al., 2003), the Okinawa Trough is only 2 Myr old (Kimura, 1985; Sibuet et al., 1998), and the Lau Basin has been active for less than 6 Myr (Weissel, 1977; Ruellan et al., 2003). The models in both EF and EH modes show that extension stops and tends to heal its thermal structure within 4–15 Myr (with older SPs maintaining extension longer), which is consistent with some cases in nature – e.g. the Sulu Sea lasted for about 4 Myr and the Vavilov Basin lasted for 3–4 Myr (Schliffke et al., 2022).
We must also acknowledge that in simulations like ours, the properties that a given arc would present to an overriding plate are currently poorly defined. This further complicates, for now, the detailed comparison between models and nature.
4.4 Limitations
-
2D modelling.
- a.
2D models lack the lateral dimension of the real 3D world, which means the toroidal component of the mantle flow is ignored. There is some research suggesting that toroidal flow plays an important role in back-arc extension on the OP (Clio and Pieter, 2013; Chen et al., 2016), especially in narrow subduction zones (Schellart and Moresi, 2013). The assumption in our 2D models is that the plates are infinitely wide and uniform along the third dimension. Thus, the models may not be applicable to narrow subduction systems, such as the Gibraltar and Calabrian subduction zones.
- b.
We implicitly assume that the arcs are linear and constant along the strike, while in reality, the arc volcanoes are concentrated along the strike.
- c.
The plates can either be inhomogeneous perpendicular to the strike, a direction which is modelled but only with simply varying plates to allow comparison, or along the strike, a direction that is not modelled.
- a.
-
Other simplifications of the models.
- a.
We did not run models with a real continental OP, even though the Japan Sea, a case with a continental OP, is discussed in this paper. Because the models are simplified to include only mantle viscosity (which is more viscous than the crust at the same temperature), the OP lithosphere is stronger than it should be at a given age (the thermal structure depends on the initial age of the plates). A younger age reduces the OP thickness and decreases the total strength to partly counteract the lack of crust. As a result, the same phenomenon requires a real plate to be older than that in our models (with an even older age required for a continental plate compared to an oceanic plate). Similarly, we did not consider eclogitisation, which would affect the SP.
- b.
We have used a simple far-field boundary condition on the OP of a ridge; actual settings might be better represented by different boundary conditions (Capitanio et al., 2010; Nakakuki and Mura, 2013; Schellart and Moresi, 2013). We have kept the models simple in this case to allow for comparison.
- c.
The process of forming an arc involves partial melting, which can be expected to lower the viscosity and density in local regions (Corradino et al., 2022; Baitsch-Ghirardello et al., 2014). There is also a possibility for important feedback between the arc and subduction that we cannot capture in these models.
- d.
The history of evolution is simple and similar across models to allow for comparison, but this might be important in actual cases, For example, we miss out on the initiation stage of subduction, and there is also a period of high subduction velocity in our models which might be higher than on Earth.
- a.
Our models show that a volcanic arc has a significant impact on back-arc extension on the OP in a subduction system, even though extension can also occur without the arc. It is worth noting that the conclusions are derived from 2D simulations with a mobile upper plate.
-
By introducing a hot region onto the OP and testing various parameters, three end-member types of back-arc extension are depicted:
- a.
Firstly, we have No Extension on the OP (mode NE).
- b.
Secondly, we have Extension at the Far-field location, i.e. about 750 km from the trench (mode EF).
- c.
Finally, we have Extension in the Hot region (mode EH), including models with slab detachment (EH–D). The NE and EH modes are common in nature, whereas the EF mode is very rare. We speculate that the Japan Sea might be a case of the EF mode.
- a.
-
The properties of the hot region influence the modes. A greater distance from the hot-region centre to the trench (Distance), a larger width of the hot region (Width), and a higher increase in temperature in the hot-region centre (ΔT) encourage back-arc extension on the OP and facilitate a transition from (A) mode NE to (B) mode EF and (C) mode EH.
-
Plate ages are also important parameters influencing mode changes. When the OP is homogeneous, an old SP or a young OP in a model encourages back-arc extension approximately 750 km from the trench on the OP (almost the same location as in mode EF). After introducing the hot region, we note that back-arc extension is more likely to occur and that extension switches from its far-field location into the hot region itself in certain modes with a relatively young SP (Age is less than 100 Myr in our models, but this threshold age would change if the hot region were to vary).
-
The primary driving mechanism of our models is poloidal flow beneath the OP. The flow cell is almost the same size in every model, focusing at around 750 km from the trench on the OP and gradually decreasing towards the trench. A higher trench retreat rate (achieved through a higher slab-sinking rate) facilitates poloidal flow, thereby encouraging back-arc extension.
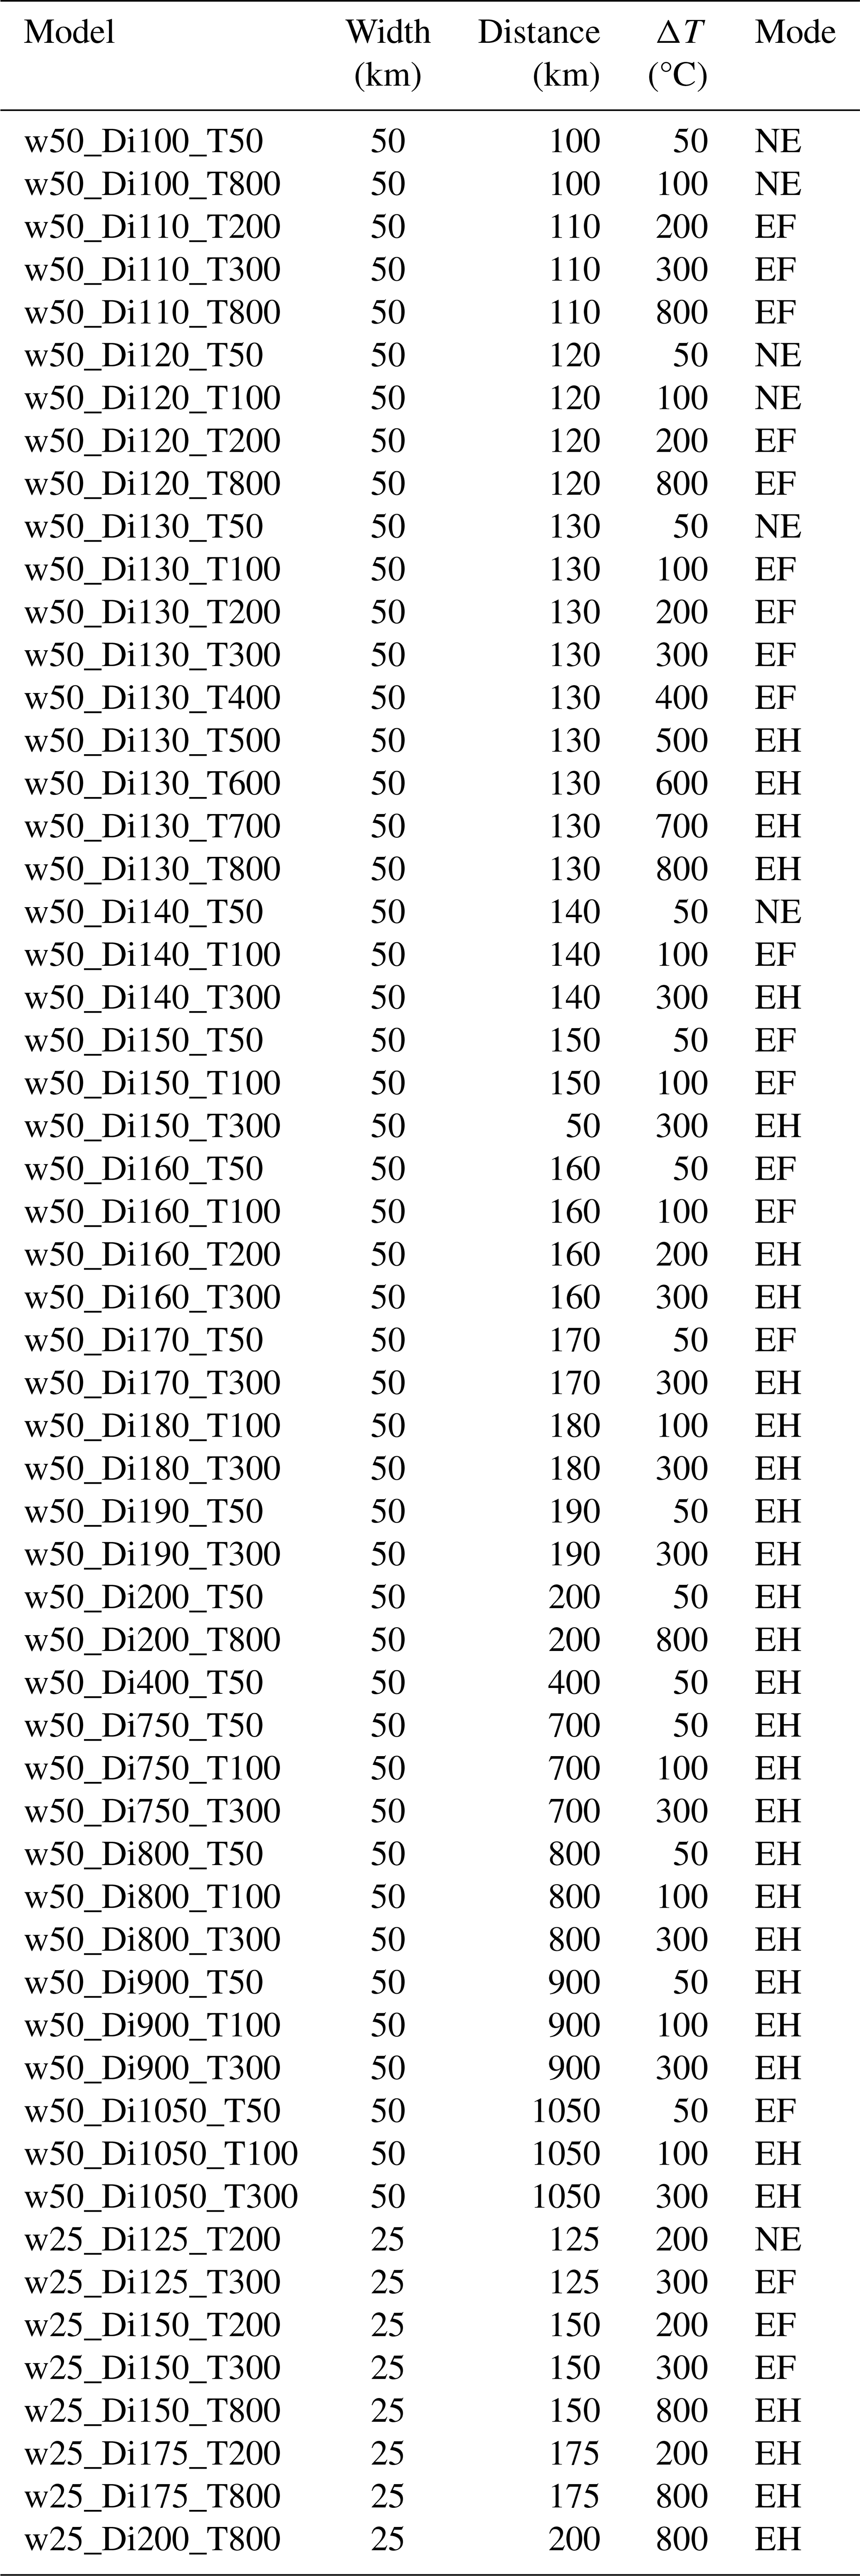
Table A2Models testing plate ages with/without a hot region. N: no. Y: yes.
The numerical simulations were run with the open-source and multiphase computational fluid dynamics code Fluidity (http://fluidityproject.github.io/, Davies et al., 2022). The input files required to reproduce the simulations presented herein have also been made available at https://zenodo.org/records/11143014 (Zhang, 2024).
DZ: writing (original draft, review, and editing), conceptualisation, formal analysis, investigation, methodology, visualisation, validation, and funding acquisition. JHD: writing (review and editing), conceptualisation, methodology, validation, supervision, funding acquisition, project administration, and resources.
The contact author has declared that neither of the authors has any competing interests.
Publisher's note: Copernicus Publications remains neutral with regard to jurisdictional claims made in the text, published maps, institutional affiliations, or any other geographical representation in this paper. While Copernicus Publications makes every effort to include appropriate place names, the final responsibility lies with the authors.
This study has been supported by a PhD grant (grant no. 201906170045) from the China Scholarship Council, Cardiff University, and the supercomputer “Hawk” at Cardiff University. The authors would like to thank Attila Balázs, the anonymous reviewer, and the editor Taras Gerya for their constructive comments that helped to improve the paper.
This research has been supported by the China Scholarship Council (grant no. 201906170045).
This paper was edited by Taras Gerya and reviewed by Attila Balázs and one anonymous referee.
Baitsch-Ghirardello, B., Gerya, T. V., and Burg, J.-P.: Geodynamic regimes of intra-oceanic subduction: Implications for arc extension vs. shortening processes, Gondwana Res., 25, 546–560, 2014. a, b, c
Balázs, A., Faccenna, C., Gerya, T., Ueda, K., and Funiciello, F.: The Dynamics of Forearc – Back-Arc Basin Subsidence: Numerical Models and Observations From Mediterranean Subduction Zones, Tectonics, 41, e2021TC007078, https://doi.org/10.1029/2021TC007078, 2022. a
Barckhausen, U., Engels, M., Franke, D., Ladage, S., and Pubellier, M.: Evolution of the South China Sea: Revised ages for breakup and seafloor spreading, Mar. Petrol. Geol., 58, 599–611, 2014. a
Capitanio, F. A., Morra, G., and Goes, S.: Dynamic models of downgoing plate-buoyancy driven subduction: Subduction motions and energy dissipation, Earth Planet. Sc. Lett., 262, 284–297, 2007. a
Capitanio, F. A., Stegman, D. R., Moresi, L.-N., and Sharples, W.: Upper plate controls on deep subduction, trench migrations and deformations at convergent margins, Tectonophysics, 483, 80–92, 2010. a, b
Capitanio, F. A., Faccenna, C., Zlotnik, S., and Stegman, D.: Subduction dynamics and the origin of Andean orogeny and the Bolivian orocline, Nature, 480, 83–86, 2011. a, b, c
Caratori Tontini, F., Bassett, D., de Ronde, C. E., Timm, C., and Wysoczanski, R.: Early evolution of a young back-arc basin in the Havre Trough, Nat. Geosci., 12, 856–862, 2019. a
Chen, Z., Schellart, W. P., and Duarte, J. C.: Quantifying the energy dissipation of overriding plate deformation in three-dimensional subduction models, J. Geophys. Res.-Solid, 120, 519–536, 2015. a
Chen, Z., Schellart, W. P., Strak, V., and Duarte, J. C.: Does subduction-induced mantle flow drive backarc extension?, Earth Planet. Sc. Lett., 441, 200–210, 2016. a, b, c
Čížková, H., van Hunen, J., van den Berg, A. P., and Vlaar, N. J.: The influence of rheological weakening and yield stress on the interaction of slabs with the 670 km discontinuity, Earth Planet. Sc. Lett., 199, 447–457, 2002. a
Clark, S. R., Stegman, D., and Müller, R. D.: Episodicity in back-arc tectonic regimes, Phys. Earth Planet. Inter., 171, 265–279, 2008. a
Clio, M. and Pieter, S. W.: Three-dimensional dynamic models of subducting plate-overriding plate-upper mantle interaction, J. Geophys. Res.-Solid, 118, 775–790, 2013. a, b, c
Corradino, M., Balazs, A., Faccenna, C., and Pepe, F.: Arc and forearc rifting in the Tyrrhenian subduction system, Sci. Rep., 12, 4728, https://doi.org/10.1038/s41598-022-08562-w, 2022. a, b, c
Crameri, F., Tackley, P. J., Meilick, I., Gerya, T. V., and Kaus, B. J. P.: A free plate surface and weak oceanic crust produce single-sided subduction on Earth, Geophys. Res. Lett., 39, L03306, https://doi.org/10.1029/2011GL050046, 2012. a
Cross, T. A. and Pilger Jr, R. H.: Controls of subduction geometry, location of magmatic arcs, and tectonics of arc and back-arc regions, Geol. Soc. Am. Bull., 93, 545–562, 1982. a
Dal Zilio, L., Faccenda, M., and Capitanio, F.: The role of deep subduction in supercontinent breakup, Tectonophysics, 746, 312–324, 2018. a, b, c, d
Dasgupta, R., Mandal, N., and Lee, C.: Controls of subducting slab dip and age on the extensional versus compressional deformation in the overriding plate, Tectonophysics, 801, 228716, https://doi.org/10.1016/j.tecto.2020.228716, 2021. a, b, c
Davies, D. R., Wilson, C. R., and Kramer, S. C.: Fluidity: A fully unstructured anisotropic adaptive mesh computational modeling framework for geodynamics, Geochem. Geophy. Geosy., 12, Q06001, https://doi.org/10.1029/2011GC003551, 2011. a
Davies, D. R., Wilson, C. R., and Kramer, S. C.: Fluidity, An open-source computational fluid dynamics code with adaptive unstructured mesh capabilities, GitHub [code], http://fluidityproject.github.io/, last access: October 2022. a
Di Giuseppe, E., Van Hunen, J., Funiciello, F., Faccenna, C., and Giardini, D.: Slab stiffness control of trench motion: Insights from numerical models, Geochem. Geophy. Geosy., 9, Q02014, https://doi.org/10.1029/2007GC001776, 2008. a
Di Giuseppe, E., Faccenna, C., Funiciello, F., van Hunen, J., and Giardini, D.: On the relation between trench migration, seafloor age, and the strength of the subducting lithosphere, Lithosphere, 1, 121–128, 2009. a
Doo, W. B., Hsu, S. K., Yeh, Y. C., Tsai, C. H., and Chang, C. M.: Age and tectonic evolution of the northwest corner of the West Philippine Basin, Mar. Geophys. Rese., 36, 113–125, 2015. a
Duarte, J. C., Schellart, W. P., and Cruden, A. R.: Three-dimensional dynamic laboratory models of subduction with an overriding plate and variable interplate rheology, Geophys. J. Int., 195, 47–66, 2013. a
Eagles, G.: The age and origin of the central Scotia Sea, Geophys. J. Int., 183, 587–600, 2010. a
Eagles, G., Livermore, R. A., Fairhead, J. D., and Morris, P.: Tectonic evolution of the west Scotia Sea, J. Geophys. Res.-Solid, 110, B02401, https://doi.org/10.1029/2004JB003154, 2005. a
Erdős, Z., Huismans, R. S., and Faccenna, C.: Wide Versus Narrow Back-Arc Rifting: Control of Subduction Velocity and Convective Back-Arc Thinning, Tectonics, 41, e2021TC007086, https://doi.org/10.1029/2021TC007086, 2022. a
Fowler, C. M. R.: The solid earth: an introduction to global geophysics, Cambridge University Press, https://doi.org/10.1017/CBO9780511819643, 1990. a
Fujioka, K., Okino, K., Kanamatsu, T., Ohara, Y., Ishizuka, O., Haraguchi, S., and Ishii, T.: Enigmatic extinct spreading center in the West Philippine backarc basin unveiled, Geology, 27, 1135–1138, 1999. a
Garel, F., Goes, S., Davies, D. R., Davies, J. H., Kramer, S. C., and Wilson, C. R.: Interaction of subducted slabs with the mantle transition-zone: A regime diagram from 2-D thermo-mechanical models with a mobile trench and an overriding plate, Geochem. Geophy. Geosy., 15, 1739–1765, 2014. a, b, c, d, e
Hirth, G. and Kohlstedt, D.: Rheology of the upper mantle and the mantle wedge: A view from the experimentalists, Geophysical monograph – American geophysical union, 138, 83–106, 2003. a
Holt, A. F., Becker, T., and Buffett, B.: Trench migration and overriding plate stress in dynamic subduction models, Geophys. J. Int., 201, 172–192, 2015. a
Jarrard, R. D.: Relations among subduction parameters, Rev. Geophys., 24, 217–284, 1986. a
Jodie, P.: Calculating arc-trench distances using the Smithsonian Global Volcanism Project database, https://www.earthbyte.org/calculating-arc-trench-distances-using-the-smithsonian-global, (last access: 27 April 2023), 2016. a
Jolivet, L. and Faccenna, C.: Mediterranean extension and the Africa-Eurasia collision, Tectonics, 19, 1095–1106, 2000. a
Jolivet, L., Tamaki, K., and Fournier, M.: Japan Sea, opening history and mechanism: A synthesis, J. Geophys. Res.-Solid, 99, 22237–22259, 1994. a
Kaneoka, I.: 40Ar-39Ar analysis of volcanic rocks recovered from the Japan Sea Floor: Constraints on the age of formation of the Japan Sea, Proceedings of the Ocean Drilling Program, Sci. Results, 127, 819–836, 1992. a
Karato, S. I.: Effects of pressure on plastic deformation of polycrystalline solids: some geological applications, MRS OPL – Online Proceedings Library, 499, 3, https://doi.org/10.1557/PROC-499-3, 1997. a
Karato, S. I. and Wu, P.: Rheology of the upper mantle: A synthesis, Science, 260, 771–778, 1993. a
Kimura, M.: Back-arc rifting in the Okinawa Trough, Mar. Petrol. Geol., 2, 222–240, 1985. a
Kramer, S. C., Wilson, C. R., and Davies, D. R.: An implicit free surface algorithm for geodynamical simulations, Phys. Earth Planet. Inter., 194, 25–37, 2012. a
Lallemand, S., Heuret, A., and Boutelier, D.: On the relationships between slab dip, back-arc stress, upper plate absolute motion, and crustal nature in subduction zones, Geochem. Geophy. Geosy., 6, Q09006, https://doi.org/10.1029/2005GC000917, 2005. a
Lei, Z.: Numerical investigation of the influence of subduction on deformation within the overriding plate, PhD thesis, Cardiff University, https://orca.cardiff.ac.uk/id/eprint/152759 (last access: May 2023), 2022. a, b
Luyendyk, B. P., MacDonald, K. C., and Bryan, W. B.: Rifting history of the Woodlark Basin in the southwest Pacific, Geol. Soc. Am. Bull., 84, 1125–1134, 1973. a
Madsen, J. A. and Lindley, I. D.: Large-scale structures on Gazelle Peninsula, New Britain: Implications for the evolution of the New Britain arc, Aust. J. Earth Sci., 41, 561–569, 1994. a
Magni, V., Faccenna, C., van Hunen, J., and Funiciello, F.: How collision triggers backarc extension: Insight into Mediterranean style of extension from 3-D numerical models, Geology, 42, 511–514, 2014. a
Manga, M., Hornbach, M. J., Le Friant, A., Ishizuka, O., Stroncik, N., Adachi, T., Aljahdali, M., Boudon, G., Breitkreuz, C., Fraass, A., Fujinawa, A., Hatfield, R., Jutzeler, M., Kataoka, K., Lafuerza, S., Maeno, F., Martinez-Colon, M., McCanta, M., Morgan, S., Palmer, M. R., Saito, T., Slagle, A., Stinton, A. J., Subramanyam, K. S. V., Tamura, Y., Talling, P. J., Villemant, B., Wall-Palmer, D., and Wang, F.: Heat flow in the Lesser Antilles island arc and adjacent back arc Grenada basin, Geochem. Geophy. Geosy., 13, Q08007, https://doi.org/10.1029/2012GC004260, 2012. a
McKenzie, D. P., Roberts, J. M., and Weiss, N. O.: Convection in the Earth's mantle: towards a numerical simulation, J. Fluid Mech., 62, 465–538, 1974. a
Müller, R. D., Sdrolias, M., Gaina, C., and Roest, W. R.: Age, spreading rates, and spreading asymmetry of the world's ocean crust, Geochem. Geophy. Geosy., 9, Q04006, https://doi.org/10.1029/2007GC001743, 2008. a
Nakakuki, T. and Mura, E.: Dynamics of slab rollback and induced back-arc basin formation, Earth Planet. Sc. Lett., 361, 287–297, 2013. a, b
Rogers, G. C.: An assessment of the megathrust earthquake potential of the Cascadia subduction zone, Can. J. Earth Sci., 25, 844–852, 1988. a
Ruellan, E., Delteil, J., Wright, I., and Matsumoto, T.: From rifting to active spreading in the Lau Basin–Havre Trough backarc system (SW Pacific): Locking/unlocking induced by seamount chain subduction, Geochem. Geophy. Geosy., 4, 8909, https://doi.org/10.1029/2001GC000261, 2003. a
Schellart, W. P.: Quantifying the net slab pull force as a driving mechanism for plate tectonics, Geophys. Res. Lett., 31, 1–5, https://doi.org/10.1029/2004GL019528, 2004. a
Schellart, W. P. and Moresi, L.: A new driving mechanism for backarc extension and backarc shortening through slab sinking induced toroidal and poloidal mantle flow: Results from dynamic subduction models with an overriding plate, J. Geophys. Res.-Solid, 118, 3221–3248, 2013. a, b, c, d, e, f
Schliffke, N., van Hunen, J., Allen, M. B., Magni, V., and Gueydan, F.: Episodic back-arc spreading centre jumps controlled by transform fault to overriding plate strength ratio, Nat. Commun., 13, 582, https://doi.org/10.1038/s41467-022-28228-5, 2022. a
Schmeling, H., Babeyko, A., Enns, A., Faccenna, C., Funiciello, F., Gerya, T., Golabek, G., Grigull, S., Kaus, B., Morra, G., Schmalholz, S., and van Hunen, J.: A benchmark comparison of spontaneous subduction models – Towards a free surface, Phys. Earth Planet. Inter., 171, 198–223, https://doi.org/10.1016/j.pepi.2008.06.028, 2008. a
Sdrolias, M. and Müller, R. D.: Controls on back-arc basin formation, Geochem. Geophy. Geosy., 7, 69–86, 2006. a
Sheng, J., Li, C., Liao, J., Yang, Z., and Jiang, S.: Dynamics of back-arc extension controlled by subducting slab retreat: Insights from 2D thermo-mechanical modelling, Geol. J., 54, 3376–3388, 2019. a, b, c, d
Sibuet, J. C., Deffontaines, B., Hsu, S. K., Thareau, N., Le Formal, J. P., and Liu, C. S.: Okinawa trough backarc basin: Early tectonic and magmatic evolution, J. Geophys. Res.-Solid, 103, 30245–30267, 1998. a
Tamaki, K.: Tectonic synthesis and implications of Japan Sea ODP drilling, edited by: Tamaki, K., Suyehiro, K., Allan, J. F., Ingle, J. C., and Pisciotto, K. A., Proceedings of the Ocean Drilling Program, Scientific Results, College Station, Texas, https://doi.org/10.2973/odp.proc.sr.127128-2.240.1992, 1992. a
Tamaki, K.: Opening tectonics of the Japan Sea, in: Backarc basins: Tectonics and magmatism, Springer, 407–420, https://doi.org/10.1007/978-1-4615-1843-3_11, 1995. a
Tatsumi, Y., Maruyama, S., and Nohda, S.: Mechanism of backarc opening in the Japan Sea: role of asthenospheric injection, Tectonophysics, 181, 299–306, 1990. a
Weissel, J. K.: Evolution of the Lau Basin by the growth of small plates, Island Arcs, Deep-Sea Trench. Back-Arc Basins, 1, 429–436, 1977. a
Wolf, S. G. and Huismans, R. S.: Mountain building or Backarc extension in ocean-continent subduction systems: A function of backarc lithospheric strength and absolute plate velocities, J. Geophys. Res.-Solid, 124, 7461–7482, 2019. a
Yamazaki, T., Seama, N., Okino, K., Kitada, K., Joshima, M., Oda, H., and Naka, J.: Spreading process of the northern Mariana Trough: Rifting-spreading transition at 22° N, Geochem. Geophy. Geosy., 4, 1–18, https://doi.org/10.1029/2002GC000492, 2003. a
Yang, S., Li, Z.-H., Wan, B., Chen, L., and Kaus, B. J.: Subduction-Induced Back-Arc Extension Versus Far-Field Stretching: Contrasting Modes for Continental Marginal Break-Up, Geochem. Geophy. Geosy., 22, e2020GC009416, https://doi.org/10.1029/2020GC009416, 2021. a
Yang, T., Moresi, L., Gurnis, M., Liu, S., Sandiford, D., Williams, S., and Capitanio, F. A.: Contrasted East Asia and South America tectonics driven by deep mantle flow, Earth Planet. Sc. Lett., 517, 106–116, 2019. a
Zellmer, K. E. and Taylor, B.: A three-plate kinematic model for Lau Basin opening, Geochem. Geophy. Geosy., 2, 1020–1026, https://doi.org/10.1029/2000GC000106, 2001. a
Zhang, D.: How a volcanic arc influences back-arc extension: insight from 2D numerical models, https://zenodo.org/records/11143014, Zenodo [data set], last access: April 2024. a