the Creative Commons Attribution 4.0 License.
the Creative Commons Attribution 4.0 License.
 | 05 Feb 2024
Multiple phase rifting and subsequent inversion in the West Netherlands Basin: implications for geothermal reservoir characterization
Kei Ogata
Francesco Vinci
Coen Leo
Giovanni Bertotti
Jerome Amory
Stefano Tavani
Aiming to contribute to the energy transition, this study provides an integrated picture of the geothermal system hosted in the West Netherlands Basin and shows how the reconstruction of the basin's geological history can contribute to the correct exploration and exploitation of its geothermal resources. In the West Netherlands Basin, the main geothermal targets are found in the Cretaceous and Jurassic strata that were deposited during the rifting and post-rifting stages and were deformed during the subsequent basin inversion. Despite multiple studies on the tectonic setting, the timing and tectono-stratigraphic architecture of the rift system and its overall control on the development and evolution of geothermal systems are still to be fully deciphered. In this study, a detailed seismo-stratigraphic interpretation of the syn- and post-rift intervals in the West Netherlands Basin will be given within the framework of geothermal exploration. A recently released and reprocessed 3D seismic cube is used, covering a large portion of the onshore section of the basin. We identified two major Jurassic rifting episodes and a Late Cretaceous inversion event. During the Jurassic rifting phases, the compartmentalization of the basin and the creation of accommodation space led to the deposition of the Late Jurassic Nieuwerkerk Formation, which is the main regional geothermal producing target. Within this formation, we individuate growth synclines located in the central portions of the Jurassic half-grabens as sites that show good potential for geothermal exploration.
- Article
(15592 KB) - Full-text XML
-
Supplement
(214985 KB) - BibTeX
- EndNote


Subsurface fluid flow systems hosted in rift basins form some of the resources that are indispensable in the global challenge to cut greenhouse gas emissions and cover current and future needs with sustainable energy sources. Basins' bounding faults and the laterally and vertically varying petrological characteristics of their infill control the distribution, abundance, and recoverability of these resources (Gawthorpe and Leeder, 2000). This includes the heat flow needed for high-enthalpy (T> 150 ∘C) to low-enthalpy (T<90 ∘C) geothermal systems (Carapezza et al., 2022). As a frontrunner in Europe, the Netherlands recognizes the contribution of geothermal energy to be crucial for a successful energy transition (e.g., Kramers et al., 2012; Willems and Nick, 2019; Mijnlieff, 2020).
The West Netherlands Basin (WNB) (Fig. 1) is a former prosperous hydrocarbon province where the interest changed to geothermal energy in the past decade. Having an energy-demanding greenhouse horticulture, a dense population which includes the cities of Rotterdam and The Hague, and an average geothermal gradient of 31 ∘C km−1 (Bonté et al., 2012), the WNB is considered one of the best case studies for low-enthalpy geothermal exploration (Kramers et al., 2012; Crooijmans et al., 2016; Willems et al., 2017c; Willems, 2017; Vondrak et al., 2018; Willems and Nick, 2019; Willems et al., 2020; Boersma et al., 2021). A typical geothermal project in the Netherlands comprises a low-enthalpy geothermal system for direct heat that contains two or more wells; hot water is produced by production wells and re-injected by injection wells after the heat has been extracted (Limberger et al., 2018). In the WNB, only open-loop geothermal systems (i.e., a geothermal doublet that uses the aquifer as a heat exchanger) reaching production temperatures ranging from 70 to 90 ∘C are used (Willems et al., 2017b). For hydrocarbon exploitation in the WNB, extensive data collection was undertaken (e.g., seismic and well data); the data are publicly available at https://www.nlog.nl/datacenter/ (last access: 1 September 2023) (e.g., Duin et al., 2006; Kombrink et al., 2012). Up to 2023, 14 geothermal projects were realized in the area (Geothermie Nederland, 2023), targeting aquifers hosted by the post-rift Cretaceous Rijnland Group (two projects), the syn-rift Jurassic Nieuwerkerk Formation (10 projects), and the pre-rift Triassic Buntsandstein (two projects). Financial budgets for geothermal projects are much tighter than for traditional hydrocarbon exploration, making the successful delivery of every well essential to ensuring the economic profitability of the geothermal projects. Understanding how the tectonic evolution of a rift basin influences the key parameters used for planning geothermal wells is therefore critical. Such parameters include aquifer thickness and heterogeneity (e.g., Poulsen et al., 2015). A thicker and more homogeneous reservoir allows for better fluid flow, a higher heat extraction, and an increased heat recovery (Crooijmans et al., 2016; Willems et al., 2017b), therefore making a geothermal system more profitable. As noted by Willems et al. (2020), current geothermal projects in the WNB demonstrate that the aquifer geology is still not fully understood. Increased knowledge of the regional architecture of the sedimentary formations hosting aquifers, the subsurface geology, and the aquifer properties would help to de-risk the geothermal well planning in the area (Willems et al., 2020).
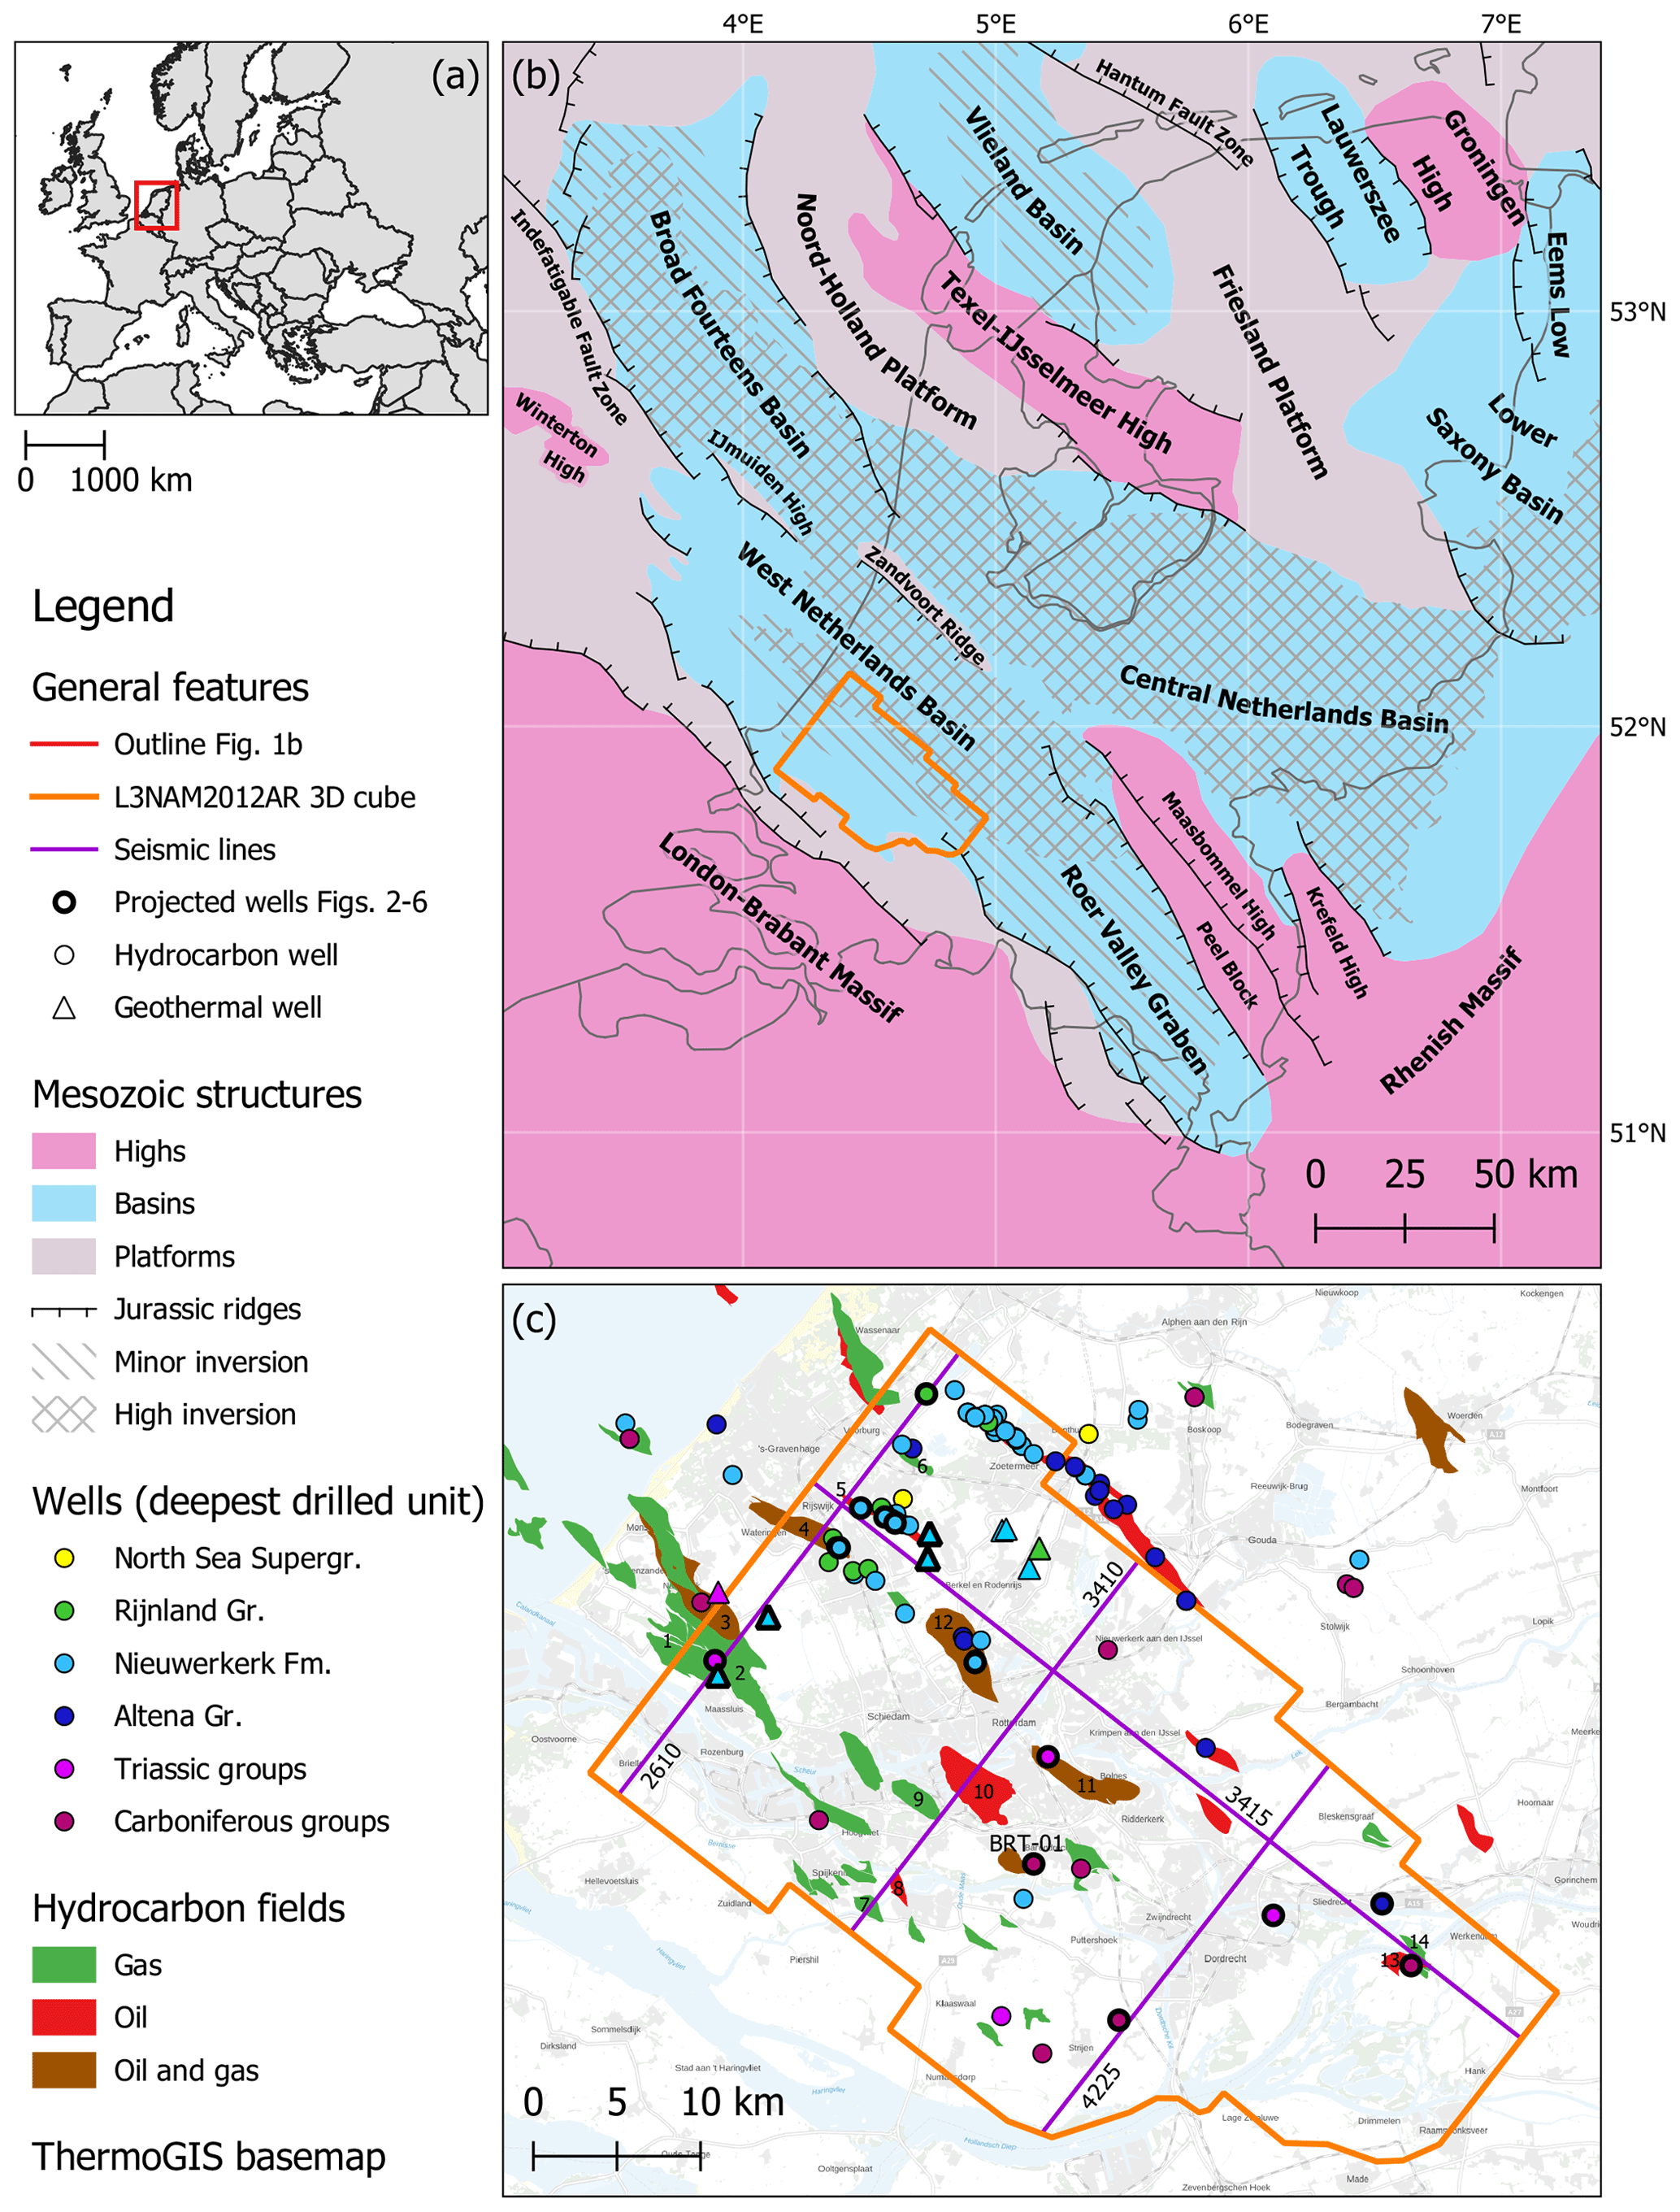
Figure 1(a) Location of Fig. 1b on the European continent. (b) Map of the Netherlands, showing the main structural elements during Jurassic times with the areas affected by the subsequent Late Cretaceous and Cenozoic inversion marked. The 3D seismic cube is displayed in orange. This map was produced by combining the maps from Wong et al. (2007) and Kombrink et al. (2012). (c) Map of the study area, highlighted in orange, showing all wells used with their colors delineating the deepest encountered formation,and the seismic cross-sections presented in Figs. 3 to 6 delineated in purple. Wells presented in Figs. 2 to 6 are marked by a thicker margin, and the hydrocarbon fields mentioned in the Results section of this study are numbered. (1): the Maasdijk field; (2): the Gaag field; (3): the De Lier field; (4): the Rijswijk field; (5): the Pijnacker field; (6): the Leidschendam field; (7): the Hekelingen field; (8): the Oud–Beijerland Noord field; (9): the Pernis field; (10): the Rotterdam field; (11): the IJsselmonde field; (12): the Berkel field; (13): the Werkendam field; and (14): the Werkendam–Diep field.
Presently, the main target for geothermal exploration in the WNB is the Jurassic Nieuwerkerk Formation (Willems et al., 2017c; Vondrak et al., 2018). This formation was interpreted as deposited in a fluvial–deltaic environment during the main rifting phase that shaped the basin, resulting in sharp lateral thickness and facies variations (van Wijhe, 1987; den Hartog Jager, 1996; Willems et al., 2020). Subsequent basin inversion, which started during the Late Cretaceous, caused uplift and deformation of the Nieuwerkerk Formation (e.g., van Wijhe, 1987; van Balen et al., 2000; de Jager, 2003; Deckers and van der Voet, 2018). This tectonic history makes the reconstruction of the Jurassic tectono-sedimentary sequence and therefore the thickness of its reservoir rocks more complex.
The quality of the recently reprocessed and released L3NAM2012AR 3D depth-migrated seismic cube allows for a detailed reconstruction of the main tectonic structures. In contrast to previous studies that mainly focused on the NW part of the onshore WNB (e.g., DeVault and Jeremiah, 2002; Willems et al., 2017c; Vondrak et al., 2018), now the SE part of the onshore WNB could be integrated into the study area as well. We use the L3NAM2012AR 3D seismic cube to provide a detailed interpretation of the subsurface geology, improving the knowledge of the structural regional aquifer architecture, with a focus on the Nieuwerkerk Formation.
The West Netherlands Basin (WNB) is a NW–SE elongated basin in the western sector of the onshore Netherlands (Fig. 1). The WNB developed above a former Paleozoic basin, forming part of the Southern Permian Basin, and partly retraces its structural trend (e.g., Ziegler, 1992; van Balen et al., 2000; Michon et al., 2003; Worum et al., 2005). Break-up of Pangea marked the onset of E–W-oriented extension in NW Europe at the beginning of the Mesozoic (e.g., Ziegler, 1992). Regionally, the Triassic is characterized by uplift due to the Early Triassic Hardegsen tectonic phase (Geluk et al., 1996) and the Late Triassic–early Kimmerian tectonic phase (Geluk and Röhling, 1997). An Early Jurassic faulting phase is recognized in the area, causing differential subsidence in the basin's various subdomains (van Balen et al., 2000), followed by Middle Jurassic uplift, referred to as the mid-Kimmerian tectonic phase (Herngreen et al., 2003).
Despite the tectonic phases mentioned above, late Permian to Middle Jurassic times are generally considered to be part of the pre-rift stage within the WNB (e.g., den Hartog Jager, 1996; Racero-Baena and Drake, 1996; van Balen et al., 2000; Vondrak et al., 2018; Willems et al., 2020). The WNB, characterized by horst and graben structures, formed from the Late Jurassic (Kimmeridgian) to the Late Cretaceous (Barremian) syn-rift phase (van Wijhe, 1987; den Hartog Jager, 1996; de Jager et al., 1996; Racero-Baena and Drake, 1996; Vondrak et al., 2018). In particular, the WNB developed during several short discrete pulses; the main one, known as the late Kimmerian tectonic phase, occurred during the Late Jurassic (van Wijhe, 1987; de Jager et al., 1996; Racero-Baena and Drake, 1996; van Balen et al., 2000). Rifting produced a main NW–SE-oriented fault trend and caused the fragmentation of the WNB into several sub-basins, resulting in large thickness variations within the Late Jurassic basin infill. After the end of the rifting phases by the Albian, the WNB underwent post-rift subsidence (van Wijhe, 1987) until basin inversion occurred from the Late Cretaceous to the Miocene (e.g., Ziegler, 1992; de Jager, 2003; Worum and Michon, 2005; Deckers and van der Voet, 2018; Kley, 2018).
The late Permian to Cenozoic sedimentary succession of the WNB, described in detail by van Adrichem Boogaert and Kouwe (1993) and TNO-GDN (2023), starts with the late Permian Zechstein Group. The very few deep wells that drilled into the Zechstein Group encountered carbonates and shales, but no evaporites. This group is overlain by the Triassic clastic under-Germanian Group, which includes the Volpriehausen, Detfurth, and Hardegsen formations. On top, the Middle to Late Triassic upper Germanian Group is made of mixed carbonates and (silici)clastics. Our seismic interpretation focused on the overlying Early to Middle Jurassic Altena Group (Fig. 2), which is primarily composed of shallow marine clays, but also carbonates and sandstones. The Altena Group includes the Posidonia Shale Formation, which forms a key seismic reflector (Fig. 2). In the study area, the overlying Late Jurassic–Early Cretaceous Schieland Group includes only the Nieuwerkerk Formation, which is one of the main targets for geothermal exploration in the WNB (see above). It is characterized by lateral thickness variations associated with extensional faulting and includes sandstones and shales that are both vertically stacked and laterally interfingered. The overlying Cretaceous Rijnland Group includes the Vlieland Subgroup and Holland Formation. The clastics of the Vlieland Subgroup were deposited in a transgressional setting that turned into a shallow to deep marine environment in which the carbonate and siliciclastic sediments of the Holland Formation were deposited. The Late Cretaceous carbonates of the Chalk Group were deposited in a shallow marine environment during the main inversion phase. The Cenozoic succession is known as the North Sea Supergroup, composed of the clastics of the lower, middle and upper North Sea groups (e.g., van Adrichem Boogaert and Kouwe, 1993; Duin et al., 2006).
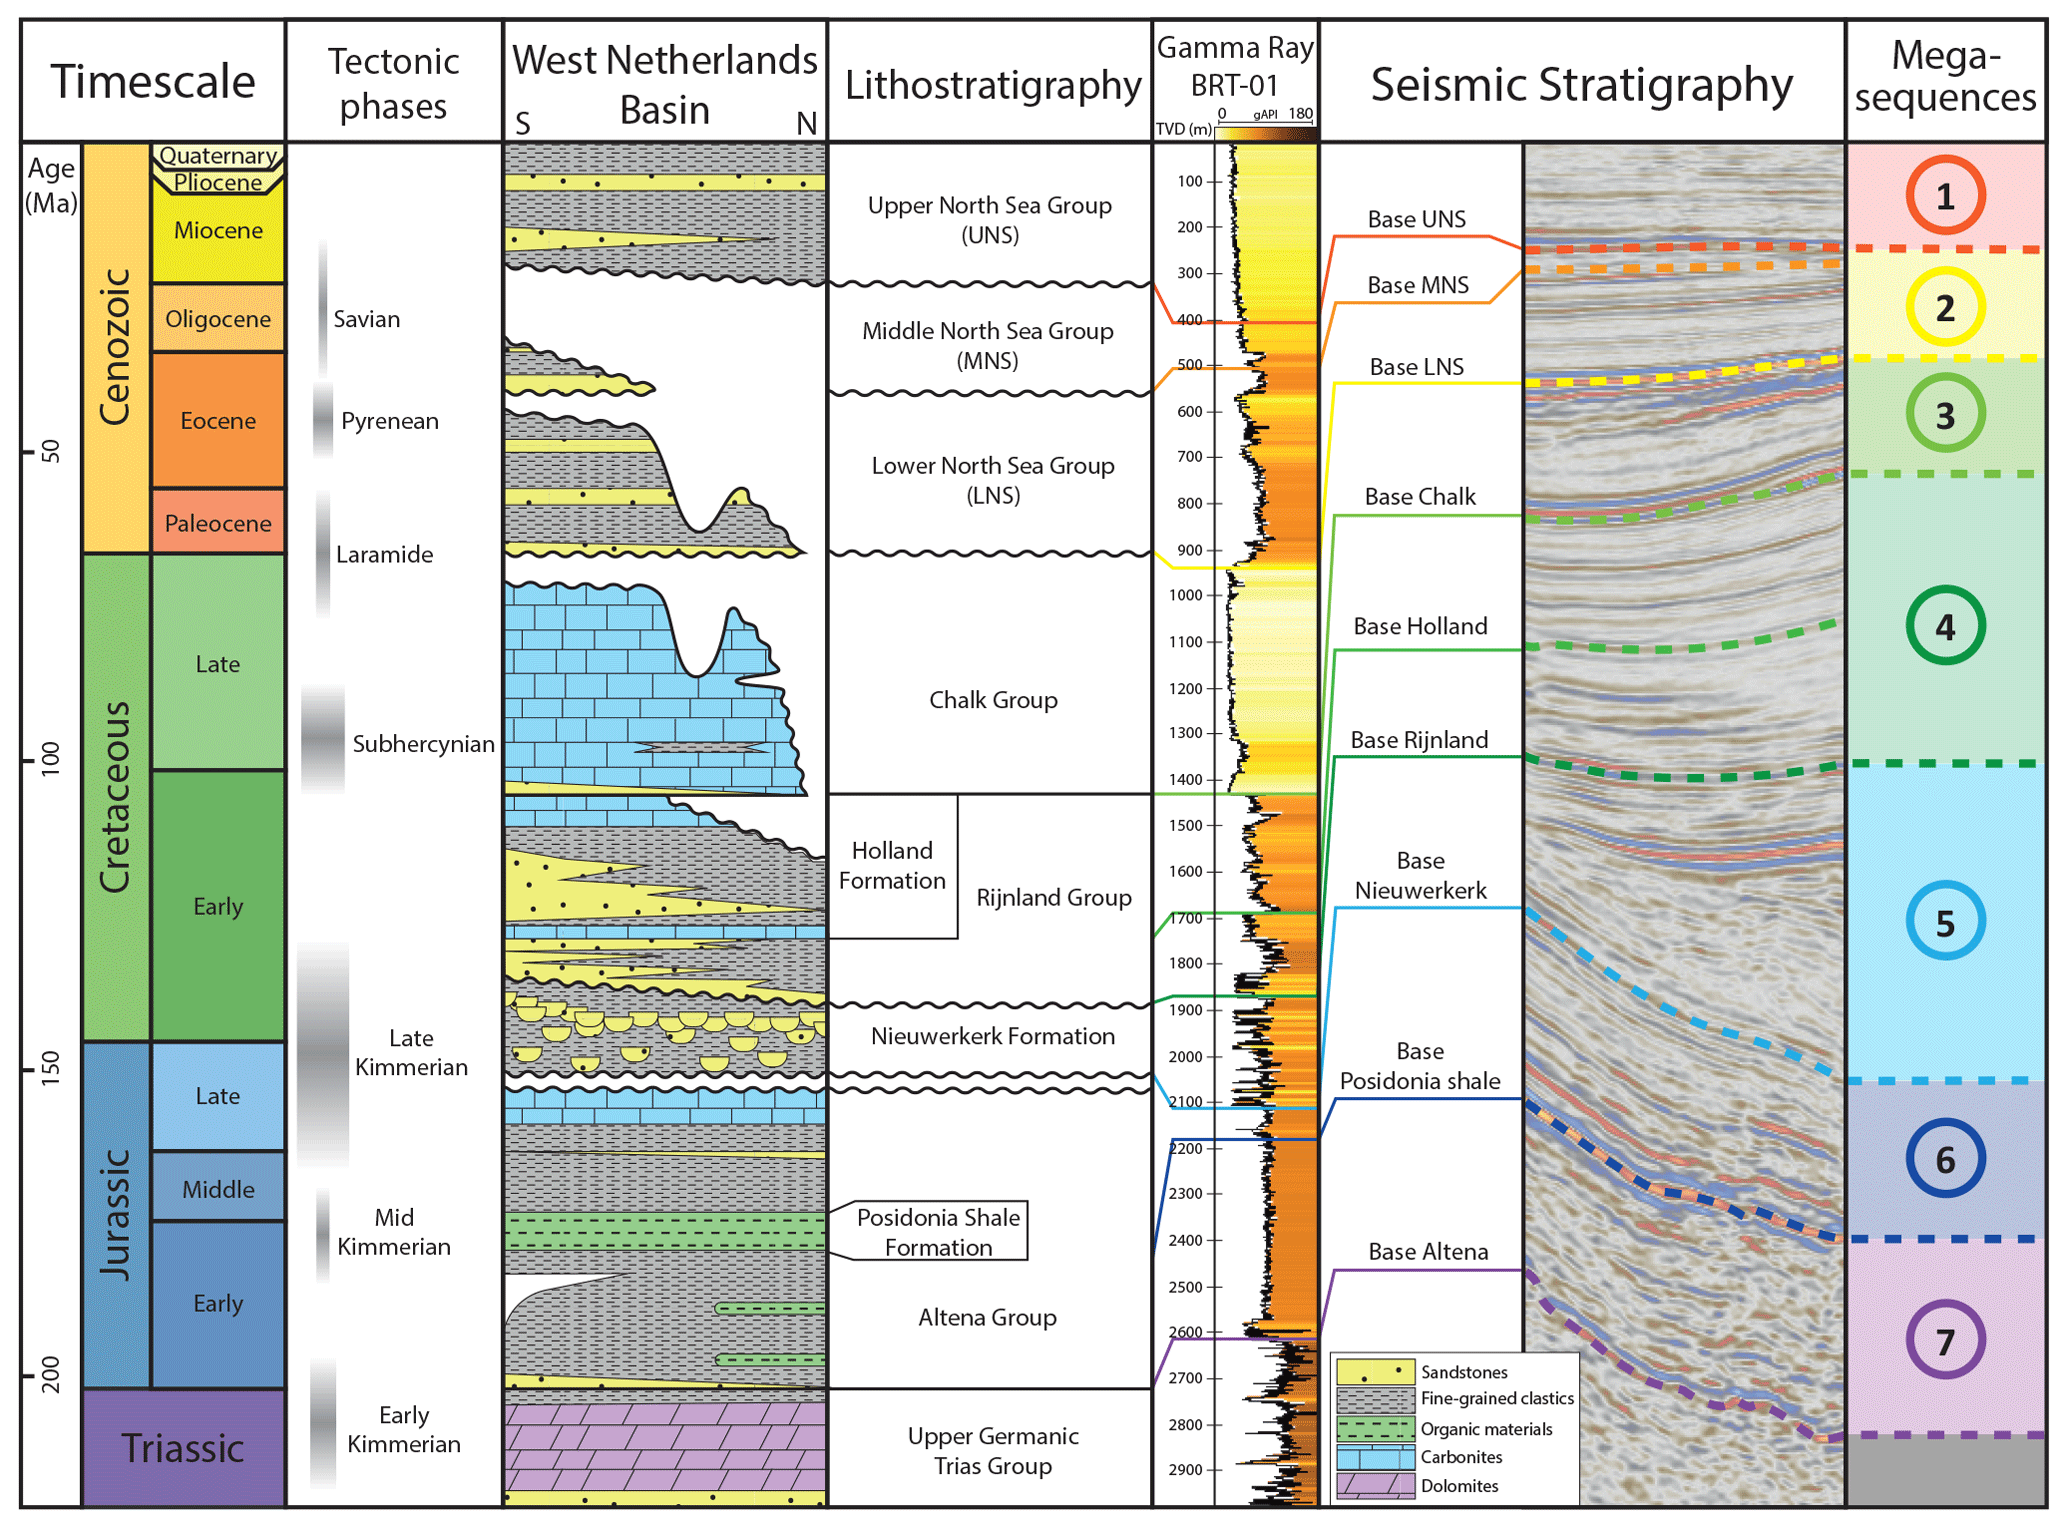
Figure 2Lithostratigraphic chart showing the timing of tectonic events, the simplified stratigraphy of the studied section of the West Netherlands Basin, the interpreted horizons and their age, the gamma-ray log for well BRT-01 that encountered the complete lithostratigraphy, and the typical seismic stratigraphy for the study area. Stratigraphic column adapted from van Adrichem Boogaert and Kouwe (1993) and Jeremiah et al. (2010); timing of tectonic events adjusted from Wong et al. (2007) with the results from this study.
This study uses the L3NAM2012AR 3D depth seismic cube and well data (Fig. 1c), which are publicly available and can be downloaded from https://www.nlog.nl/datacenter/ (last access: 1 September 2023). Additional technical details, including the reprocessing report and the acquisition, processing, and interpretation work that was done before the reprocessing, can be found on the same website using the steps described in the Supplement. The seismic coverage has a surface area of roughly 1200 km2, with 2678 dip lines (2500–5178) and 1714 strike lines (2273–3987), penetrating to a depth of 6 km. The 3D cube was depth-reprocessed and converted by Shell in 2011 using 59 wells for the depth conversion. We will use the depth-converted version of this seismic cube, as the velocity cube was not publicly available (on 01 September 2023). Additional wells are available, from which we have used a total of 94 inside and 31 close to the study area, with a maximum depth of 4 km and the deepest drilled formation being the Carboniferous Limburg Group (Fig. 1c). Specifically, for those wells, the gamma-ray logs in combination with the available formation tops made it possible to tie the wells to the seismic data (Fig. 2). This allowed the calibration of the age of the main seismic horizons and sequences. Yet, some of the wells used dated back to the start of hydrocarbon exploration in the basin during the 1950s. With the lithostratigraphic nomenclature changing over time, not all available formation tops match. This includes formation and group boundaries that are not used anymore. Therefore, non-matching well tops were neglected.
We performed the seismic analysis and interpretation using Petrel 2020.3 software, following the well-established workflow for interpretation of seismic datasets in extensional settings (e.g., O'Sullivan et al., 2022). We interpreted the main faults and defined the seismic stratigraphy by integrating the well data in order to date the main seismic units (megasequences in this work), unconformities, and brightly marked reflective horizons. In detail, nine horizons were interpreted for the whole 3D cube (Fig. 2). Such a 3D interpretation has allowed us to define the main megasequences of the basin and produce thickness maps of the pre-, syn-, and post-rift deposits, shedding light on the tectono-sedimentary evolution of the sub-basins.
The nine horizons were selected either for their easily recognizable seismic facies or for their structural appearance (e.g., unconformities). To date the interpreted seismic horizons, we relied on seismic-to-well ties to calibrate the seismic horizons with the well tops provided by TNO at http://nlog.nl. In particular, the bases of the Cenozoic upper, middle, and lower North Sea groups form angular unconformities, all easily recognized by their bright troughs that match the provided well tops very well (e.g., Figs. 2 and 5). The clastic package of this supergroup is defined by sub-horizontal, parallel reflectors. The base of the upper Cretaceous Chalk Group is represented by a bright peak that is easy to track, lying mainly conformable over the underlying strata, with some local unconformable contacts (e.g., Fig. 5). The Chalk Group comprises sub-horizontal reflectors in its upper part, showing some local folds in its central and lower parts that are separated from the overlying reflectors by a local unconformity. The base of the lower Cretaceous Holland Formation, part of the Rijnland Group, is defined by a trough that conformable overlies the Vlieland Subgroup. The base of the Rijnland Group is defined by a minor peak that is not easy to track. We used the well tops to interpret this horizon inside the sub-basins. The marine infill of the Rijnland Group includes parallel reflectors, affected by faults and folds (e.g., Fig. 4). Overall, the reflectors of the Holland Formation show a higher amplitude than the underlying unit of the Rijnland Group (e.g., Fig. 3). The base of the Upper Jurassic Nieuwerkerk Formation is defined by a bright trough which is easy to track along the sub-basins using the provided well tops. Overall, the Nieuwerkerk Formation lies conformably upon the underlying Altena Group, yet some unconformable contacts are present (e.g., Fig. 4). The package shows a range of seismic facies, going from bright parallel to chaotic reflectors. The bases of the Posidonia Shale Formation and the Altena Group are easy recognizable as bright troughs. The Altena Group, which includes the Posidonia Shale Formation, comprises bright and dull parallel reflectors, with some chaotic reflectors locally, all affected by faults and folds (e.g., Fig. 5).
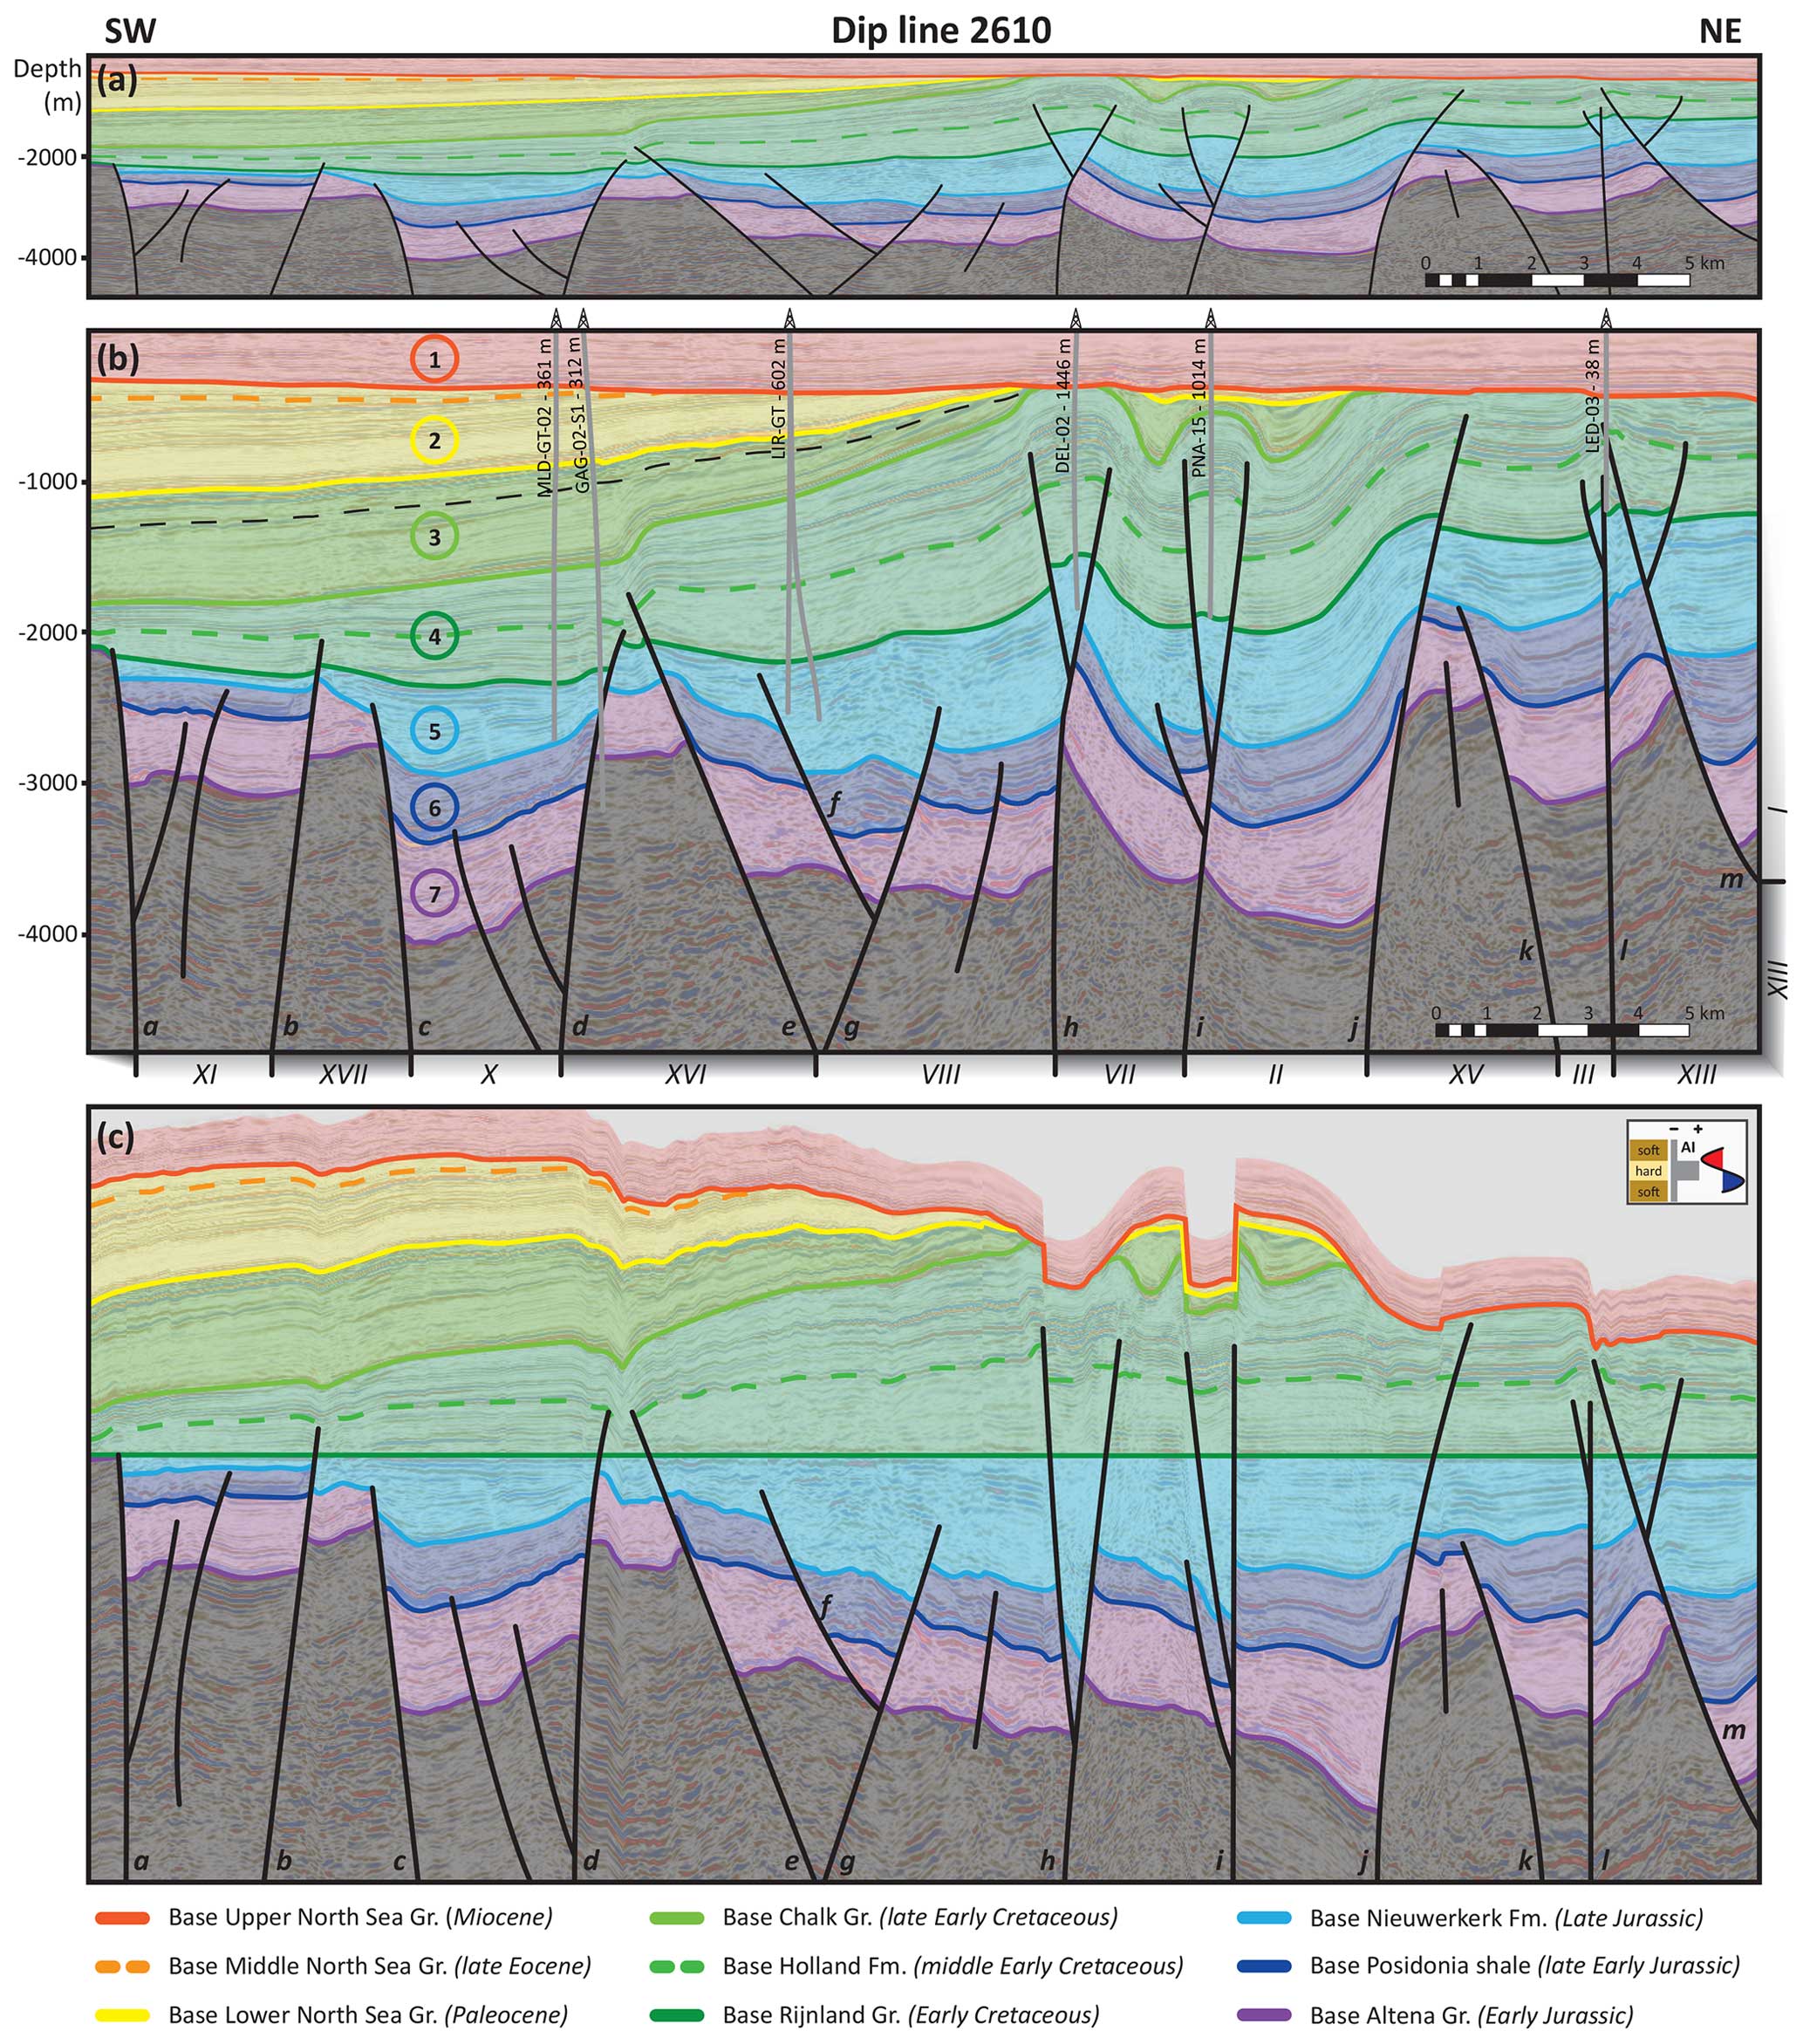
Figure 3Dip line 2610 displayed with three different scales: (a) 1:1 scale, displayed with the interpreted horizons, megasequences, and faults; (b) 1:3 scale, displayed with the interpreted horizons, megasequences, and faults, together with projected wells and their distance to the seismic line, as well as the unconformity within megasequence 3 (marked by the dotted black line). Below the section, the sub-basins and highs are numbered as in Fig. 7. (XI): Voorne Graben, (XVII): Hoek van Holland High, (X): Maasland Graben, (XVI): De Lier High, (VIII): Westland Graben, (VII): Rijswijk Graben, (II): Voorburg Graben, (XV): Zoetermeer High, (III): Zoetermeer Graben, (XIII): Moerkapelle High, (I): Waddinxveen Graben. (c) The 1:3 scaled section flattened for the base of the Rijnland Group, displayed with the interpreted horizons, megasequences, and faults.
For each horizon, a grid of 25 dip lines × 25 strike lines was made using a guided approach (guided autotracking + seeded 3D tools of Petrel). Continuous checking of the geological consistency of the interpretation was carried out during the interpretation by considering the seismic facies of the mapped horizons and the occurrence of regional unconformities, as illustrated in Fig. 2. The Results section describes three dip lines and one strike line that cover the study area and are considered representative for all the structures found in the 3D seismic cube (Figs. 3–6). The four seismic sections were flattened for the base of the Rijnland Group. Despite all the limitations and biases of the flattening procedure, the flattened sections provide insights into the thickness variations of the Rijnland Group and the underlying Nieuwerkerk Formation. Also, we build thickness maps for megasequences 2 to 7, respectively (Fig. 2): the middle and lower North Sea groups combined (Fig. 7b), the Chalk Group (Fig. 7c), the Rijnland Group (Fig. 7d), the Nieuwerkerk Formation (Fig. 7e), the upper half of the Altena Group (up to the base of the Posidonia Shale Formation, Fig. 7f), and the lower half of the Altena Group (Fig. 7g). The thickness map for each unit was produced in Petrel by computing the difference in elevation between the bounding horizons. Although such a difference is not the actual thickness, given that the horizons are characterized by a very gentle dip (mostly less than 5∘), it represents a reliable proxy. Exceptions are areas of steeply dipping layers associated with tight folds. Also, the difference in elevation returns artifacts across faults, in which the top and bottom horizons are located in the hanging wall and footwall, respectively. Those two exceptions are recognizable in maps as narrow ribbons of anomalous thickness values, mostly overlapping the major faults. A depth map was produced for the upper North Sea Group (Fig. 7a), corresponding to the uppermost megasequence 1 (Fig. 2).
4.1 Seismic sections
Here we present three SW–NE sections oriented perpendicular to the main trend of faults affecting the WNB and one section oriented NW–SE (Fig. 1c). Up to the top of the Triassic, the stratigraphic succession can be divided into seven megasequences, here described from top to bottom. For each section, we present 1:1 and 1:3 vertically exaggerated interpreted lines, along with a 1:3 vertically exaggerated one, flattened to the base of the Rijnland Group. The non-interpreted sections can be found in the Supplement.
4.1.1 Dip line 2610
Dip line 2610 (Fig. 3) is located on the NW edge of the study area. The section crosscuts the Pijnacker (PNA-15) and Rijswijk (DEL-02) abandoned oil fields, as well as the Maasdijk, the Gaag (GAG-02-S1), and the De Lier (LIR-GT wells) gas-producing fields. The Leidschendam (LED-03) abandoned gas field and two geothermal producing open-loop energy projects (MLD-GT-02 and LIR-GT wells) are nearby (hydrocarbon fields 1 to 6, Fig. 1c).
Megasequence 1 is positioned between the top of the seismic cross-section and the base of the upper North Sea Group. The package is characterized by sub-horizontal reflectors and an evident erosional surface at the bottom, forming an angular unconformity and a toplap surface. Megasequence 2 underlies this erosional surface, towards the SW. This megasequence is eroded in the NE part of the section and contains the middle and lower North Sea groups. To the SW, the package is slightly tilted, dipping a few degrees towards the SW. Towards the SW, reflectors of megasequence 2 and 3 are parallel, whereas megasequence 2 eroded the top of megasequence 3 in the Westland Graben (structure VIII, Fig. 3b). This leaves a local angular unconformity between megasequences 2 and 3 (the unconformity is also found in well PNA-15, Fig. 3b). Around well PNA-15, we observe two growth synclines capped by the unconformity that underlies megasequences 1 and 2. Megasequence 3 is composed of the Chalk Group, which thins from 700 to 0 m towards the NE. The upper part of megasequence 3 is locally separated from the central and lower ones by an unconformity (dashed black line, Fig. 3b). The apparent northeastward thinning of this megasequence resulted from erosion, which is marked by the erosional surface at the base of megasequence 1. The underlying megasequence 4 comprises the Rijnland Group. In contrast to megasequences 2 and 3, this package thins gradually from 1000 to 350 m towards the SW and it is affected by synclines and fault-cored anticlines. Despite some local thickness anomalies (associated with the flattening procedure and the presence of faults) the flattened profile corroborates the regional thinning of megasequence 4 towards the SW, which is not considerably affected by the faults and folds observed in the non-flattened profiles (Fig. 3). It is worth mentioning that observed major faults affect the upper part of megasequence 4 and megasequences 5, 6, and 7, with the youngest three megasequences being un-faulted. Megasequence 5, which corresponds to the Nieuwerkerk Formation, is characterized by abrupt thickness changes (from 100 to 900 m) across the numerous faults affecting the megasequence. Below, megasequence 6, composed of the upper part of the Altena Group and underlain by the Posidonia Shale Formation, is characterized by parallel reflectors and thickness variations from 700 to 0 m, which relate to erosion atop structural highs. Finally, megasequence 7, comprising the lower part of the Altena Group, displays both parallel reflectors and a few growth geometries at fault-bounded sub-basins.
The seismic line crosses 12 major faults. Some of them display normal offsets, while others show normal offset in the lowermost tracts and reverse displacement in the upper portions, which is a diagnostic feature of fault inversion (Williams et al., 1989). All major faults affect megasequences 5 to 7, whereas only those showing evidence of positive inversion propagated into megasequence 4. As previously mentioned, megasequences 1 to 3 are un-faulted. In detail, faults labeled a to d define horst as well as graben and half-graben structures. In the grabens and half-grabens, megasequence 5 shows growth geometries, whereas on the adjacent horst, the thickness of megasequences 5 to 7 is strongly reduced from 1400 m in the graben to 550 m on the adjacent horst. None of these faults show remarkable evidence of inversion and the lowermost part of megasequence 4 seals all of them. Faults e and h bound a pop-up structure resulting from the inversion of these two former normal faults and the uplift of the pre-existing sub-basin depocenter. Faults f and g, which show no evidence of inversion, were part of the array of extensional faults within this depocenter. In detail, the inversion of the SW boundary fault e caused fault propagation folding registered by “contractional” growth strata in megasequence 3. Inversion of the NE boundary fault h was accompanied by the development of an antithetic fault, forming a second-order pop-up structure that affected megasequence 4. To the NE, the SW-dipping fault i was syn-sedimentary with respect to megasequence 5. Its inversion was accompanied by the development (or inversion) of two conjugate NE-dipping faults and resulted in a second-order pop-up structure, which controlled the deposition of megasequence 3. Fault j displays evidence of positive inversion and, more importantly, bounds a half-graben (the Voorburg Graben, structure II, Fig. 3b) in which megasequence 7 displays growth-wedge geometries. The NE-dipping fault k also bounds the Zoetermeer Graben (structure III, Fig. 3b) in which the thickness of megasequence 5 varies from 400 to 500 m and the thickness of megasequence 7 changes from 500 to 600 m. Accordingly, the fault was active during the deposition of megasequences 5 and 7. It is worth mentioning that it was not reactivated during later inversion. Fault l is NE-dipping and was active during deposition of megasequence 5. This is evidenced by the flattened section, showing that megasequence 5 is about 100 m thicker on the NE side of fault l (Fig. 3c). Fault l shows slight inversion, as suggested by the gentle anticline deforming megasequence 4. Apart from the clear evidence of reverse offset on normal faults, folding of reflectors in both the hanging wall and footwalls of some faults (e.g., in the footwall of fault l or in the hanging wall of faults e and k) reveals a possible buttressing effect (i.e., folding and second-order faulting on the hanging wall and footwall without slip reversal along the master fault).
4.1.2 Dip line 3410
Dip line 3410 (Fig. 4) is located 16 km to the SE of dip line 2610. The section crosses the Rotterdam and Oud–Beijerland Noord oil-producing fields and the Pernis and Hekelingen gas-producing fields. Nearby are the IJsselmonde (IJS-64-S2) and Berkel (BRK-07) abandoned oil fields (hydrocarbon fields 7 to 12, Fig. 1c).
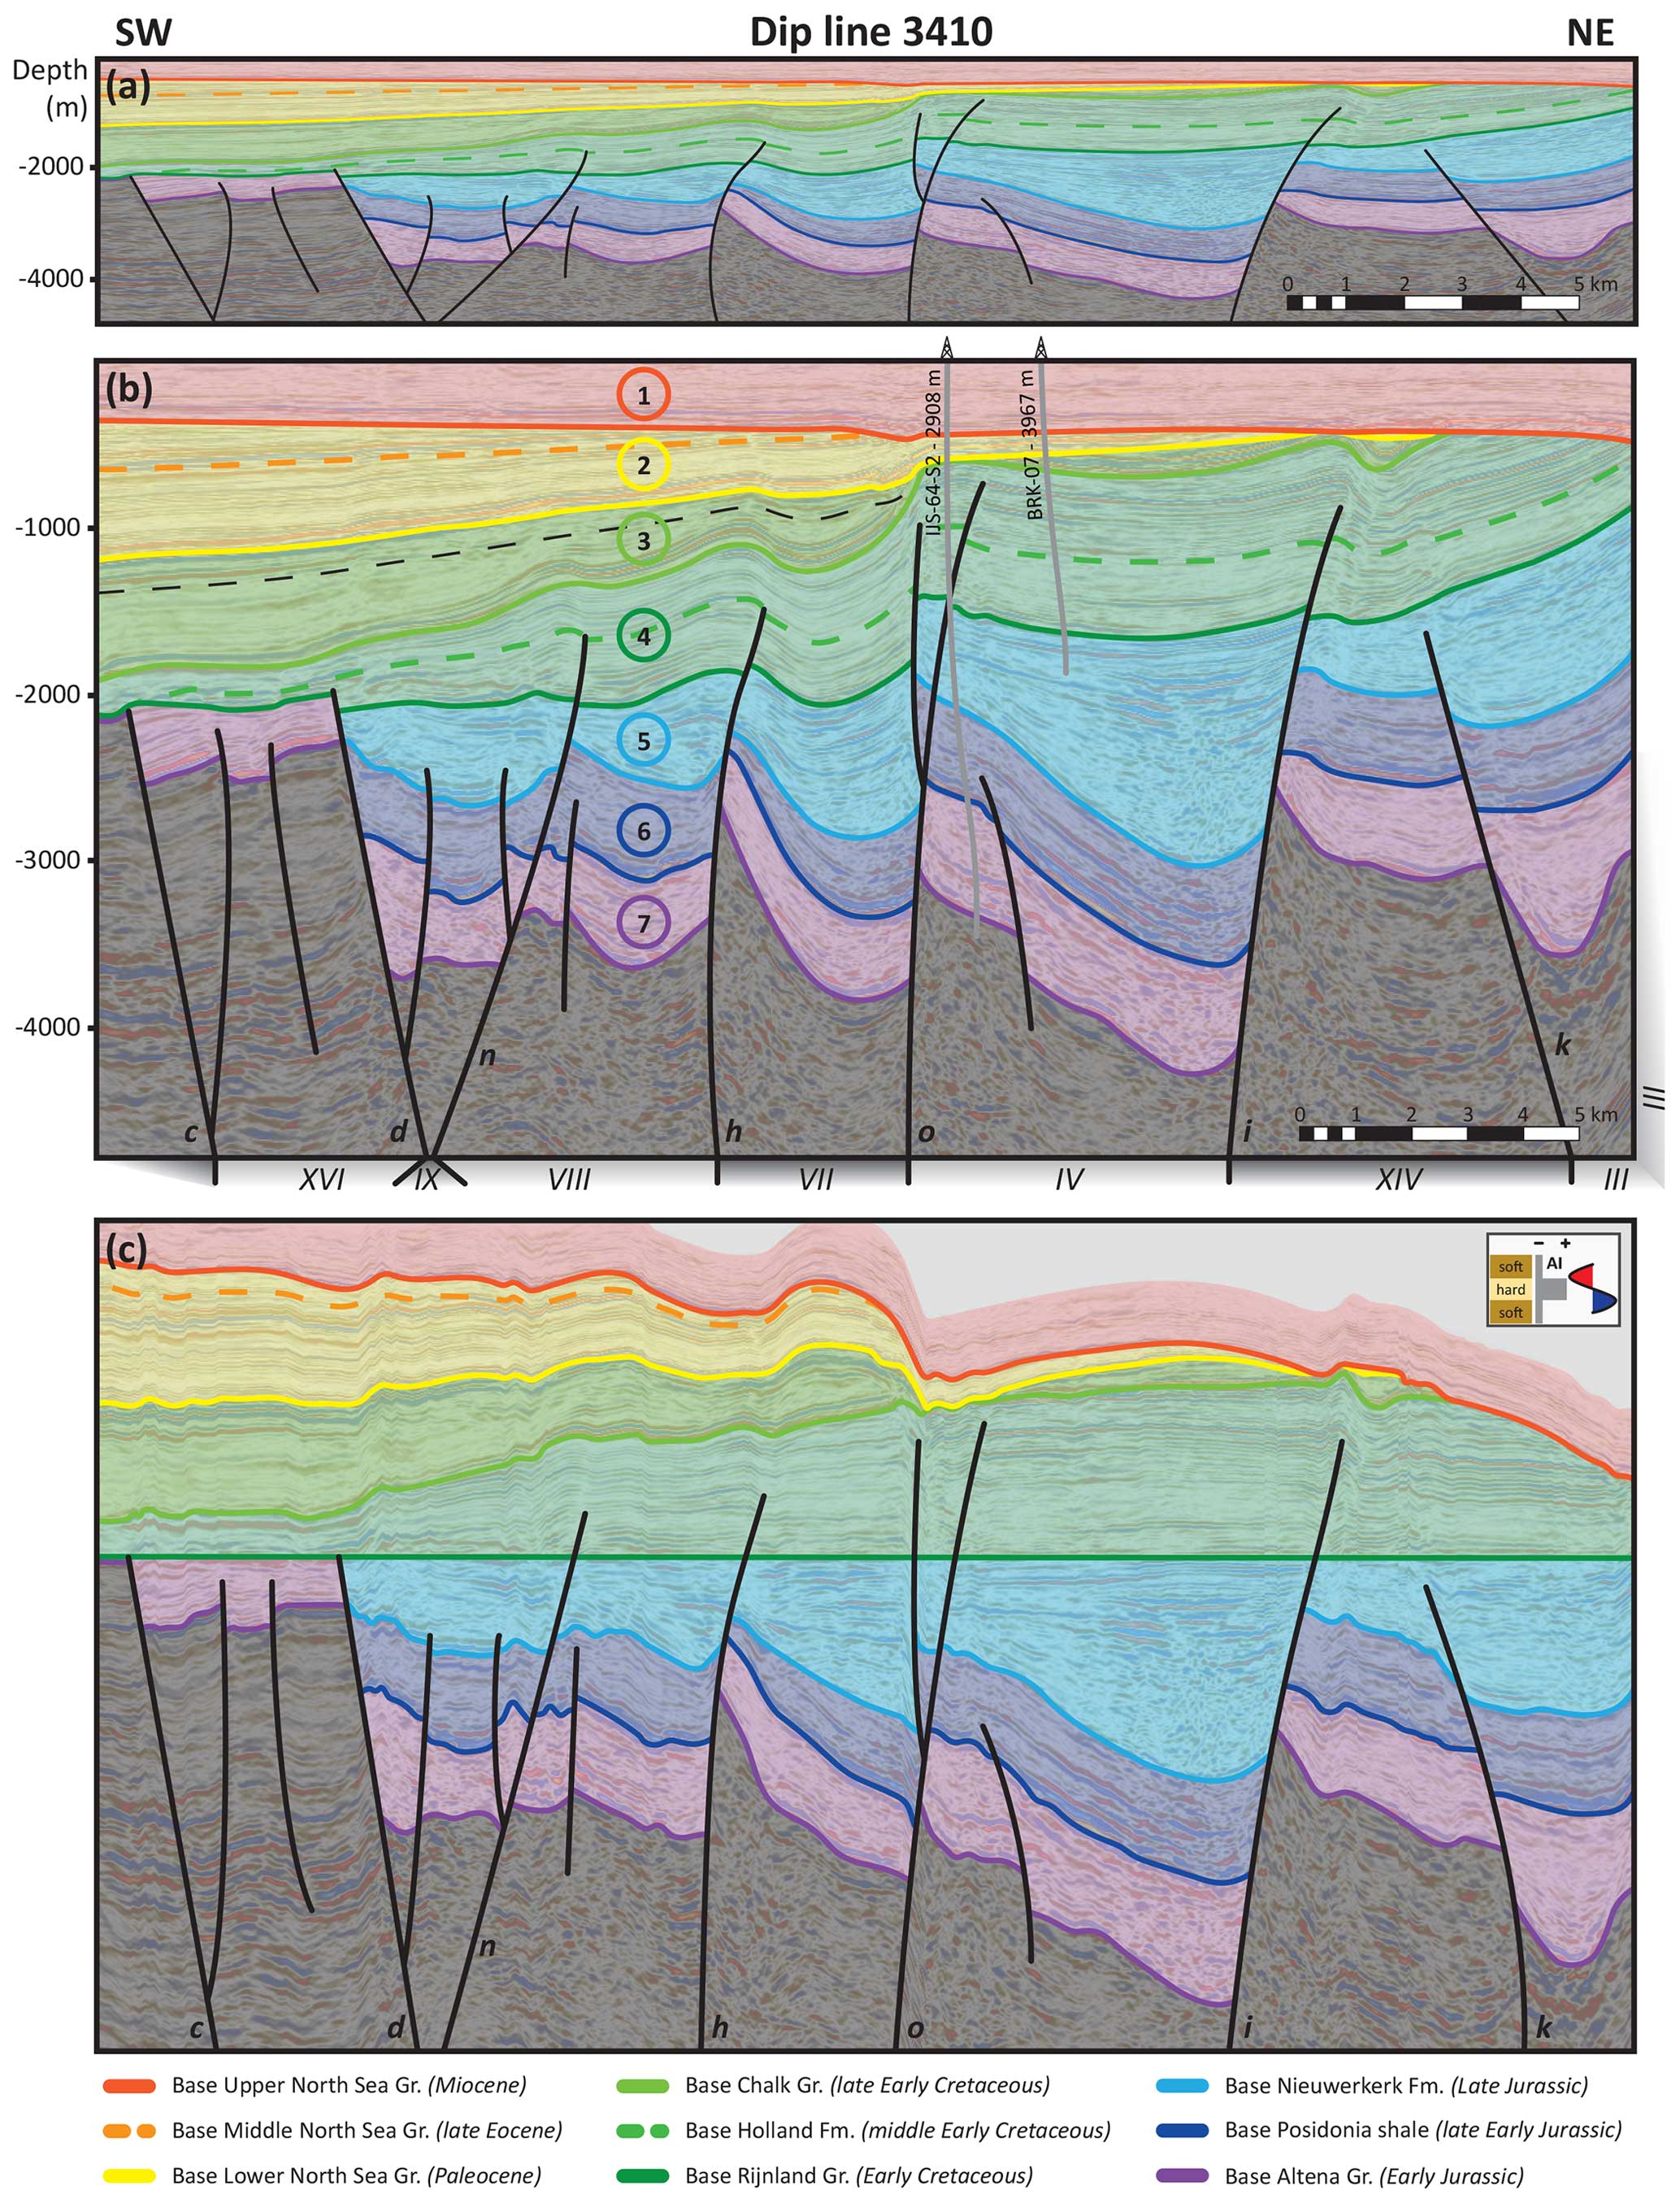
Figure 4Dip line 3410 displayed with three different scales: (a) 1:1 scale, displayed with the interpreted horizons, megasequences, and faults; (b) 1:3 scale, displayed with the interpreted horizons, megasequences, and faults, together with projected wells and their distance to the seismic line, and the unconformity within megasequence 3 (marked by the black dotted line). Below the section, the sub-basins and highs are numbered as in Figure 7. (XVI): De Lier High, (IX): Spijkenisse Graben, (VIII): Westland Graben, (VII): Rijswijk Graben, (IV): Pijnacker Graben, (XIV): Lansingerland High, (III): Zoetermeer Graben. (c) The 1:3 scaled section flattened for the base of the Rijnland Group, displayed with the interpreted horizons, megasequences, and faults.
Megasequence 1 shows sub-horizontal reflectors underlain by a regional erosional surface. In the SW part of the section, the underlying megasequence 2 shows gently tilted to parallel reflectors that are eroded towards the NE. An unconformable contact separates megasequences 2 and 3; the latter shows a substantial thinning from 700 to 0 m towards the NE. Megasequence 3 forms low-amplitude synclinal and anticlinal structures, which are well defined at its base and capped by the unconformable overlying megasequence 2. Similarly to the seismic line shown in Fig. 3, we observe a gently folded unconformity between the uppermost part and the central and lower parts of megasequence 3 (dashed black line in Fig. 4b). Megasequence 4 shows parallel reflectors thinning from 1000 to 200 m towards the SW (Fig. 4a and c), which are disrupted by faults. In the NE part of the section, the megasequence is partly eroded and directly toplapping onto megasequence 1. Major faults cut megasequence 4 above the base of the Holland Formation and megasequences 5, 6, and 7, while the three youngest megasequences are un-faulted. Megasequence 5 is affected by faults d, n, h, o, i, and k, displaying abrupt thickness changes ranging from 400 to 1300 m. These thickness changes are even more clearly visible on the flattened section. The package shows at least four distinct asymmetric fault-bounded half-grabens. The underlying megasequence 6 is characterized by parallel reflectors and, in contrast to section 2610, megasequence 6 does not show significant thickness changes, having an average thickness of 450 m. The lowermost megasequence 7 displays parallel layers, slight thickness changes (ranging from 500 to 850 m), and a fault-bounded half-graben in the Zoetermeer Graben (structure III, Fig. 4b).
Seven major faults are recognized in this seismic section, including both normal and partially (in the lowermost tracts) inverted faults. The faults cut megasequences 5 to 7, whereas only the faults showing positive inversion cut through megasequence 4. Faults c, d, h, i, and k, recognized in dip line 2610, are also mapped in this section. In detail, faults c and d bound a structural high (the De Lier High, structure XVI, Fig. 4b), describing small horst and graben structures. Megasequence 5 is absent in this region and the horst and graben, and the bounding faults are sealed by the uppermost part of megasequence 4. Fault c and minor related faults show notable evidence of inversion, marked by the antithetic fault connected to fault c. However, in contrast to section 2610, where fault d does not display evidence of inversion, the inversion of this fault in this section resulted in the development of antithetic fault n. Together, the faults formed a set of small pop-up structures, recorded by a fault propagation fold atop fault n in megasequence 4. The SW-dipping faults h and i show a similar geometry, being recorded by the deposition of megasequence 5. Inversion of both faults was accompanied by the development of fault propagation folds in megasequence 4. Both faults formed second-order pop-up structures in section 2610. Faults h, i, and o bound the Rijswijk and Pijnacker grabens (structures VII and IV, Fig. 4b). In these structures, megasequence 5 shows clear growth geometries. Inversion of fault o caused the development of an antithetic fault, forming a second-order pop-up structure. The growth geometries in megasequence 3 recorded the development of the fault propagation folds and the second-order pop-up structure as result of the inversion of faults d, h, o, and i. Fault k bounds the Zoetermeer Graben (structure III, Fig. 4b) in which megasequence 5 shows thickness variations ranging from 600 to 800 m and megasequence 7 displays thickness changes from 800 to 400 m. Like in section 2610, folded reflectors (e.g., in the hanging wall of fault d and footwall of fault i) suggest a buttressing effect upon inversion.
4.1.3 Dip line 4225
Dip line 4225 (Fig. 5) is located 16 km SE of dip line 3410, and it does not crosscut any wells of a hydrocarbon field or geothermal energy projects (Fig. 1c). From the projected wells (Fig. 5b), STR-01 resulted in oil and gas appearances, while well DRT-01 was dry.
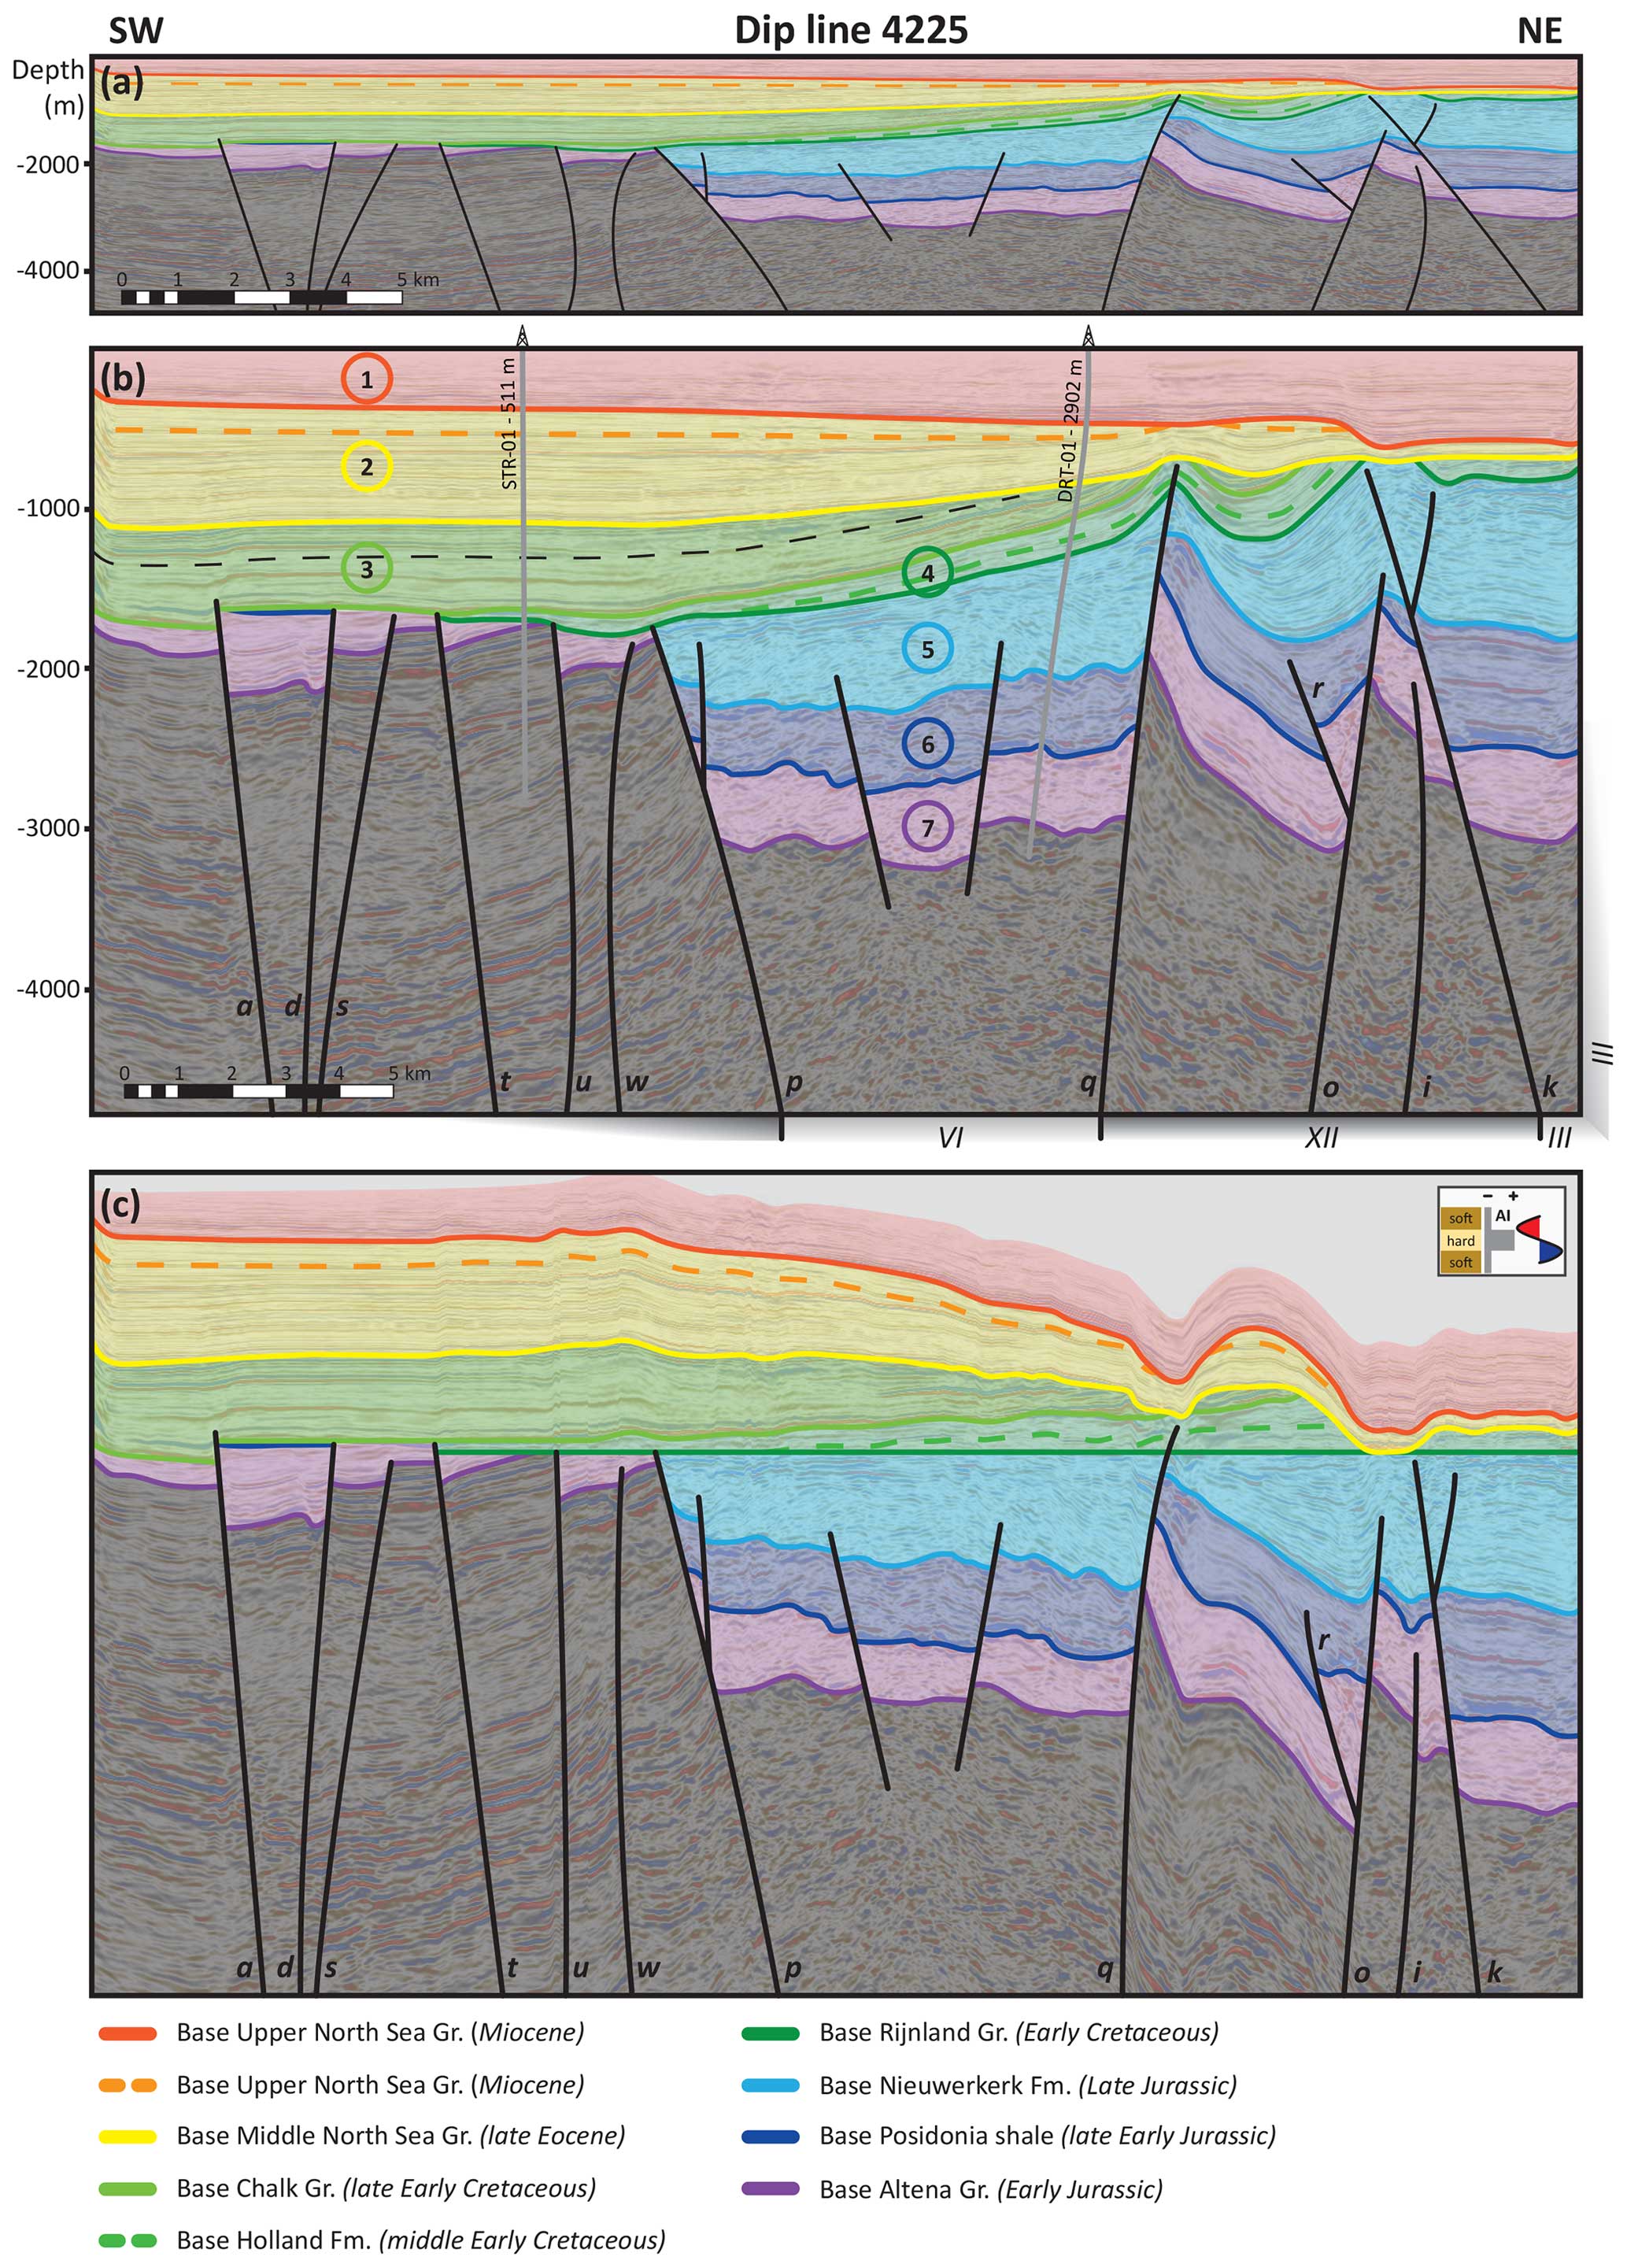
Figure 5Dip line 4225 displayed with three different scales: (a) 1:1 scale, displayed with the interpreted horizons, megasequences, and faults; (b) 1:3 scale, displayed with the interpreted horizons, megasequences, and faults, together with projected wells and their distance to the seismic line, and the unconformity within megasequence 3 (marked by the black dotted line). Below the section, the sub-basins and highs are numbered as in Fig. 7. (VI): Dordrecht Graben, (XII): Ridderkerk Graben, (III): Zoetermeer Graben. (c) The 1:3 scaled section flattened for the base of the Rijnland Group, displayed with the interpreted horizons, megasequences, and faults.
Megasequence 1 shows sub-horizontal reflectors, floored by a major erosional surface. Below, megasequence 2 shows gently dipping reflectors that are truncated towards the NE by the basal unconformity of megasequence 1. Towards the SW, the underlying megasequence 3 shows parallel reflectors, which are also parallel to those of megasequence 2, while in the underlying Dordrecht and Ridderkerk grabens (structures VI and XII, Fig. 5b), an unconformity separates these two megasequences. The intra-sequence unconformity, which is also observed in dip lines 2610 and 3410, separates the uppermost and lowermost parts of megasequence 3 in dip line 4225 (dashed black line in Fig. 5b). In the SW, megasequence 3 is affected by faults. Megasequence 4 thins from 200 to 0 m towards the SW and is affected by a syncline and fault-cored anticlines towards the NE that led to erosion and the unconformable deposition of megasequence 2 on top. Faults a and q crosscut the upper part of megasequence 4. Megasequence 5 is only present towards the NE portion of the section. Like in the previous dip lines, megasequence 5 is affected by faults p, q, o, i, and k and shows abrupt thickness changes ranging from 1000 to 0 m, which are more clearly visible on the flattened section (Fig. 5c). In the Ridderkerk Graben (structure XII, Fig. 5b), megasequence 5 has a maximum thickness of 750 m and describes a fault-bounded half-graben. The underlying megasequence 6 has an average thickness of 500 m and includes parallel reflectors. Thickness variations are restricted to the NE part of the section in the Ridderkerk and Zoetermeer grabens (structures XII and III, Fig. 5b), where megasequence 6 is 100 to 750 m thick, due to erosion atop former structural highs. Megasequence 7 includes parallel layers, showing locally slight thickness changes that are evident in the Ridderkerk and Zoetermeer grabens, where it is 300 to 800 m thick.
A total of 12 major faults are recognized in this seismic section, comprising both normal and partially (in the lowermost tracts) inverted faults. Faults a, d, i, and k are also recognized in dip line 2610, while faults d, o, i, and k also appear in dip line 3410. Megasequences 5 and 7 are affected by all the displayed faults, from which faults a, p, q, o, and k show evidence of positive inversion. Megasequence 4 is cut by faults p and q, and megasequences 1 and 2 are un-faulted. Unlike dip line 2610 and 3410, where megasequence 3 also remains un-faulted, here megasequence 3 is affected by the positively inverted fault a. This contrasts with observations performed in section 2610, where fault a does not show inversion and is capped by megasequence 4. The SW side of fault p marks the edge of the WNB, with faults a, d, s, t, u, and w delimiting horst and graben structures. The infill of the horst and graben structures includes megasequence 7 and a 50 m thick megasequence 6, which are capped by either megasequence 3 or 4. Faults p and q bound the Dordrecht Graben (structure VI, Fig. 5b) that shows some internal normal faulting. Faults p and q show positive inversion in their uppermost segments, evidenced by an antithetic fault in the upper part of fault p and the development of a fault-cored anticline in megasequence 4 atop fault q. Towards the NE, faults q and k bound the Ridderkerk Graben (structure XII, Fig. 5b). Faults o and k bound a former structural high underlying this graben. As observed in section 3410, the inversion of fault o resulted in the development of an antithetic fault, here called fault r, which affected megasequences 6 and 7 in dip line 4225. Inside the former structural high, fault i normally displaces megasequence 7. This contrasts with observations in seismic lines 2610 and 3410, where fault i shows positive inversion in the upper segment. Towards the NE, like in section 3410, fault k bounds the Zoetermeer Graben (structure III, Fig. 5b). In contrast to observations performed in seismic lines 2610 and 3410, where fault k does not show evidence of inversion, an antithetic fault formed in the upper segment as a result of reverse offset in seismic line 4225.
4.1.4 Strike line 3415
Strike line 3415 (Fig. 6) runs perpendicular to the previously described lines, crossing the NE part of the study area, the Werkendam abandoned oil field (WED-02), and the undeveloped Werkendam–Diep gas field. Nearby is the dry GSD-01 well, the Pijnacker (PNA-04-S1 and PNA-12) abandoned oil field, and the geothermal producing energy project (PNA-GT wells) (hydrocarbon fields 5, 13, and 14, Fig. 1c).
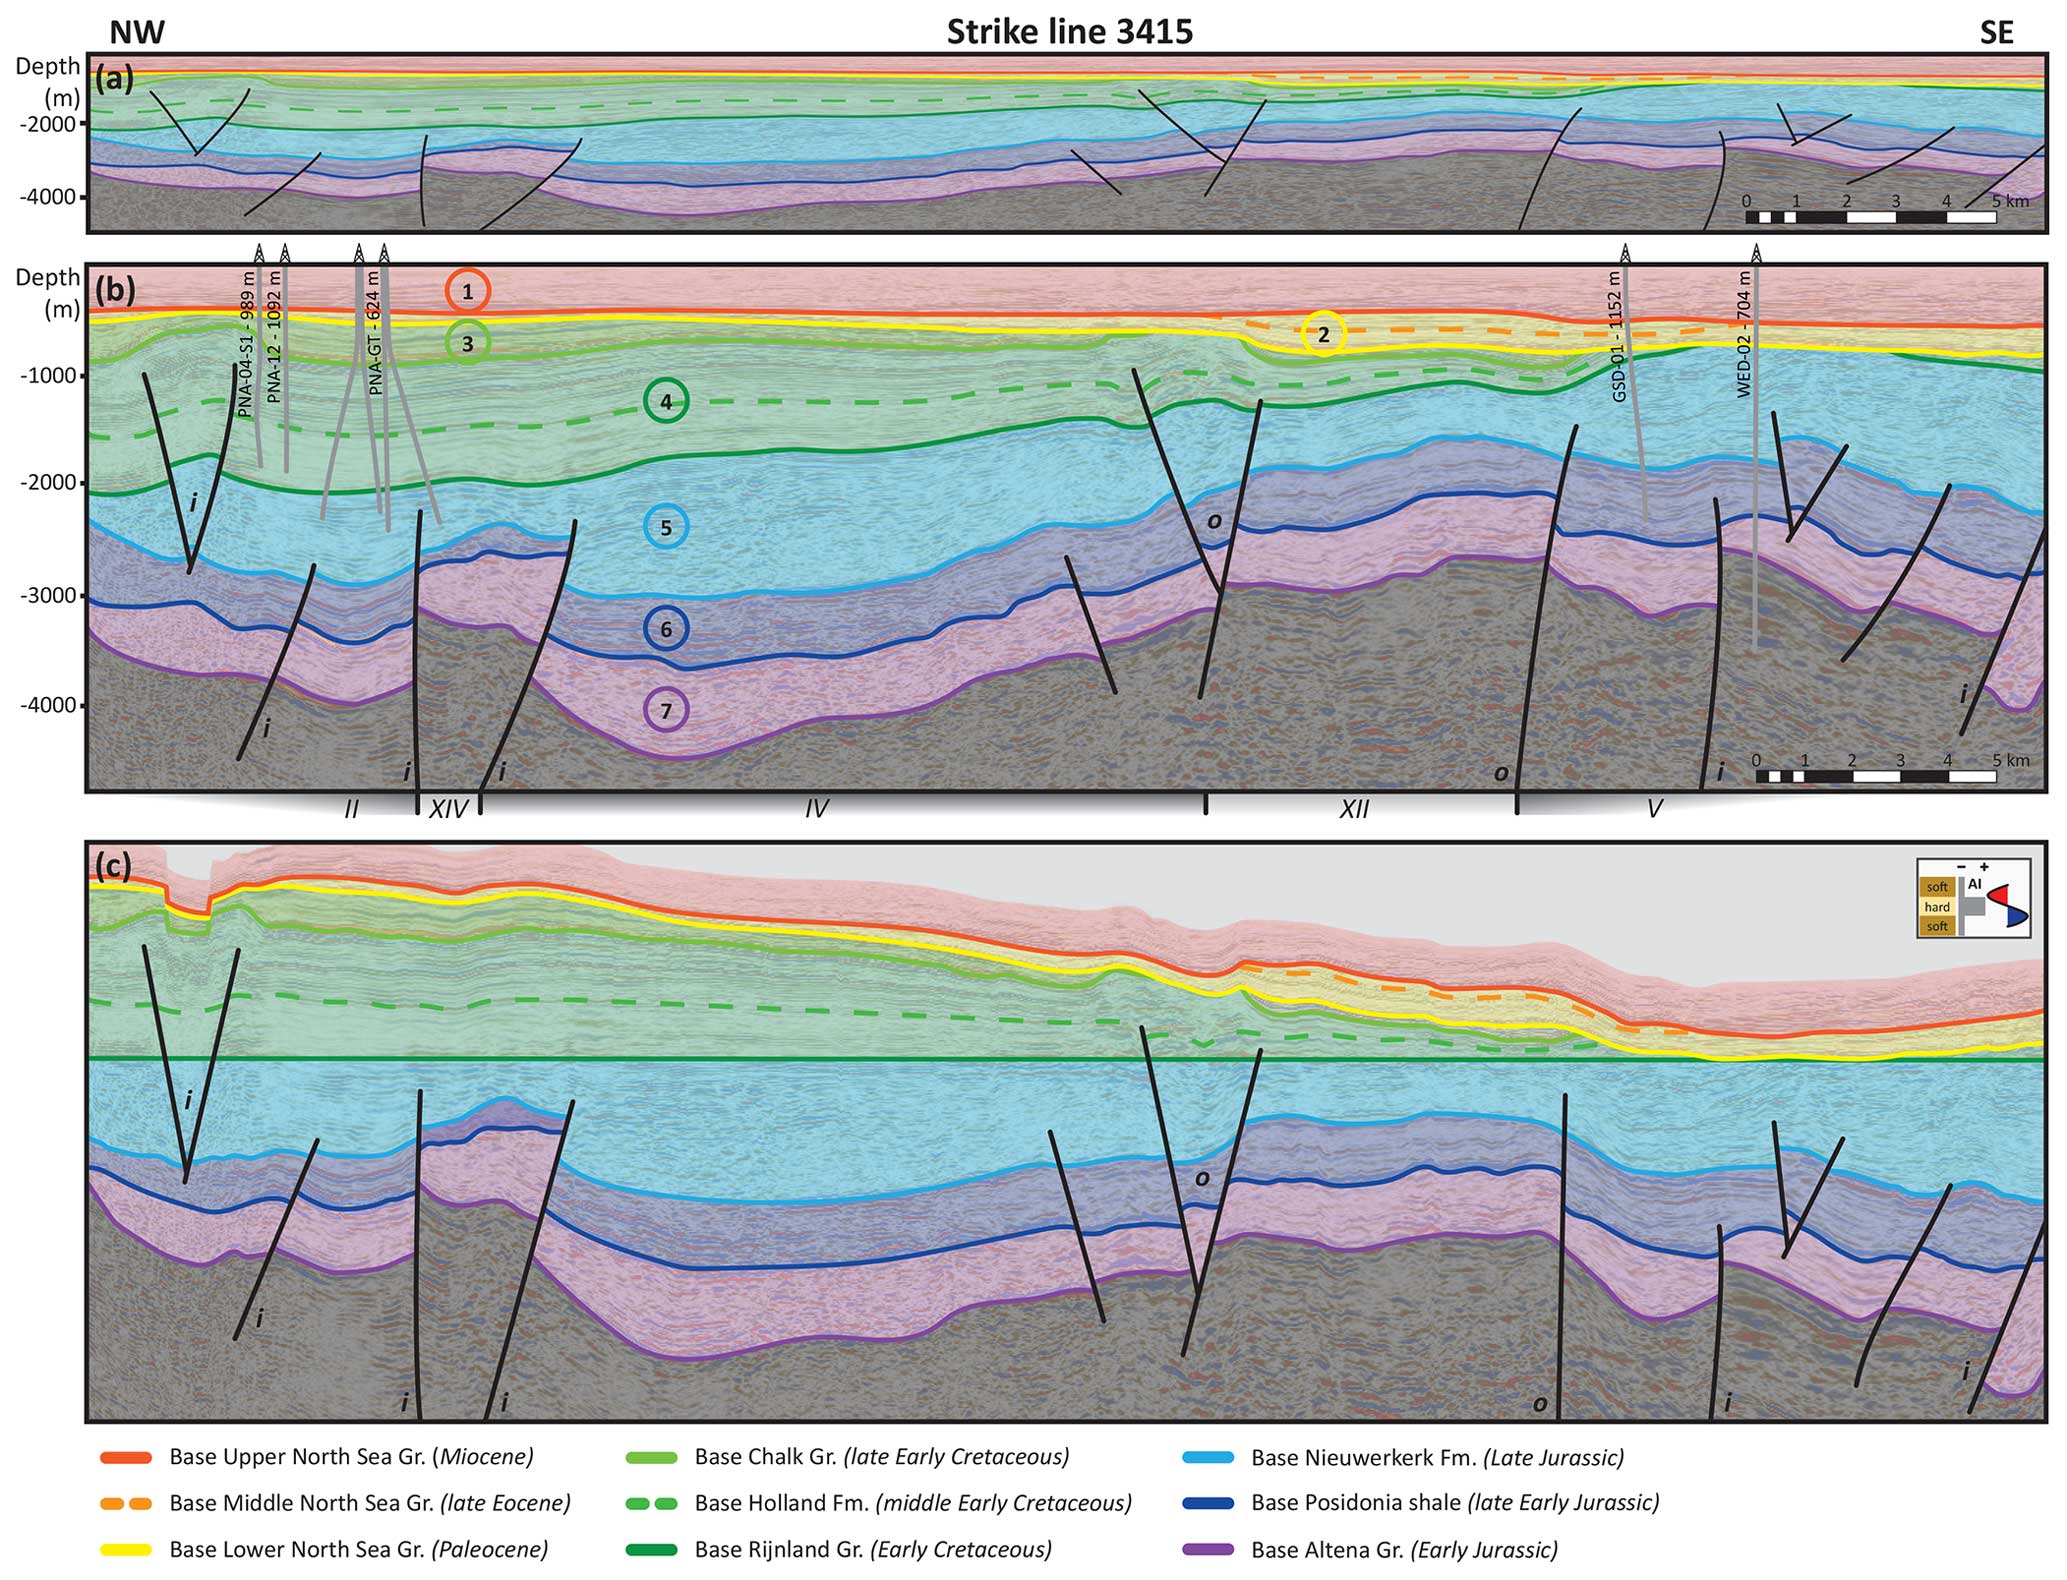
Figure 6Strike line 3415 displayed with three different scales: (a) 1:1 scale, displayed with the interpreted horizons, megasequences, and faults; (b) 1:3 scale, displayed with the interpreted horizons, megasequences, faults, and projected wells with their distance to the seismic line. The strike line intersects fault i several times, and therefore the fault can be recognized multiple times. Below the section, the sub-basins and highs are numbered as in Fig. 7. (II): Voorburg Graben, (XIV): Lansingerland High, (IV): Pijnacker Graben, (XII): Ridderkerk Graben, (V): Biesbosch Graben. (c) The 1:3 scaled section flattened for the base of the Rijnland Group, displayed with the interpreted horizons, megasequences, and faults.
Megasequence 1 is characterized by sub-horizontal reflectors and is underlain by an erosional surface. Megasequence 2 shows thickness variations ranging from 50 to 350 m, associated with uplift and erosion. Reflectors within megasequence 3 lap onto the limbs of anticlines cored by faults i and o. Megasequence 2 toplaps megasequence 3, which wedges out from 400 to 0 m towards the SE. The base of megasequence 2 represents an erosional surface that truncates open anticlines and synclines, showing erosion of megasequences 3, 4, and 5 at the hinges of the anticlines. Megasequence 4 includes parallel reflectors, has an average thickness of 1100 m in the Voorburg and Pijnacker grabens and the Lansingerland High (structures II, IV and XIV), and thins to 0 m along the Ridderkerk and Biesbosch grabens (structures XII and V) towards the SE. The underlying megasequence 5 displays thickness variations ranging from 500 to 1300 m across short distances. No clear boundary faults can be identified in this line for the growth structures observed in megasequence 4, corroborating the idea that the major faults are oriented at a low angle to this seismic section. Also, megasequence 5 includes parallel reflectors and chaotic seismic facies. Megasequence 6 does not show remarkable thickness variations, having an average thickness of 550 m. The lowermost megasequence 7 shows some slight changes in thickness ranging from 400–900 m.
As section 3415 crosscuts the main faults at a low angle, relatively mild deformation is observed. Fault i is parallel and can be interpreted several times along the section, suggesting that it extends throughout the whole 3D cube and bends along the section towards the SE. Minor folding is observed in megasequence 4 related to fault i, but no distinct inversion structures are recognized. In the middle of the section, fault o bounds the Ridderkerk Graben (structure XII, Fig. 6b) and shows a related second-order pop-up structure on the NW boundary of this horst, which is the same pop-up structure observed along fault o in section 3410. Except for the second-order pop-up structures related to faults i and o that are capped by megasequence 3, all faults are sealed by megasequence 4.
4.2 Thickness maps
Megasequence 1 represents the youngest unit and is bounded upwards by the seafloor; therefore, the depth map of its base is representative of its thickness (Fig. 7a). Figure 7b to g display the thickness maps of megasequences 2 to 7. Overall, megasequence 1 shows a constant thickness of about 400 m, but it thickens up to 650 m towards the east. This is related to the only fault crosscutting this megasequence, which is an extension of fault k (dip line 4225, Fig. 5b). Megasequence 2 thins from 800 to 0 m towards the NE (Fig. 7b) due to the uplift and erosion that led to the development of the overlying erosional surface, as observed in all seismic lines (Figs. 3–6). Within megasequence 2, we also observe the occurrence of narrow NNW–SSE and NW–SE elongated areas showing an increase in sediment thickness from 200 to 500 m. In the three seismic dip lines (Figs. 3–5), inverted faults cut megasequence 3, resulting in thickness variations of up to 800 m along elongated areas that correspond to folds (Fig. 7c). The overall northeastward thinning from up to 800 to 0 m was related to erosion due to basin inversion. The erosional surface at the base of megasequence 1 that is observed along all seismic sections (Figs. 3–6) correlates with NNW–SSE and (mostly) NW–SE elongated areas where the thickness is reduced to 0 m for both megasequences 2 and 3.
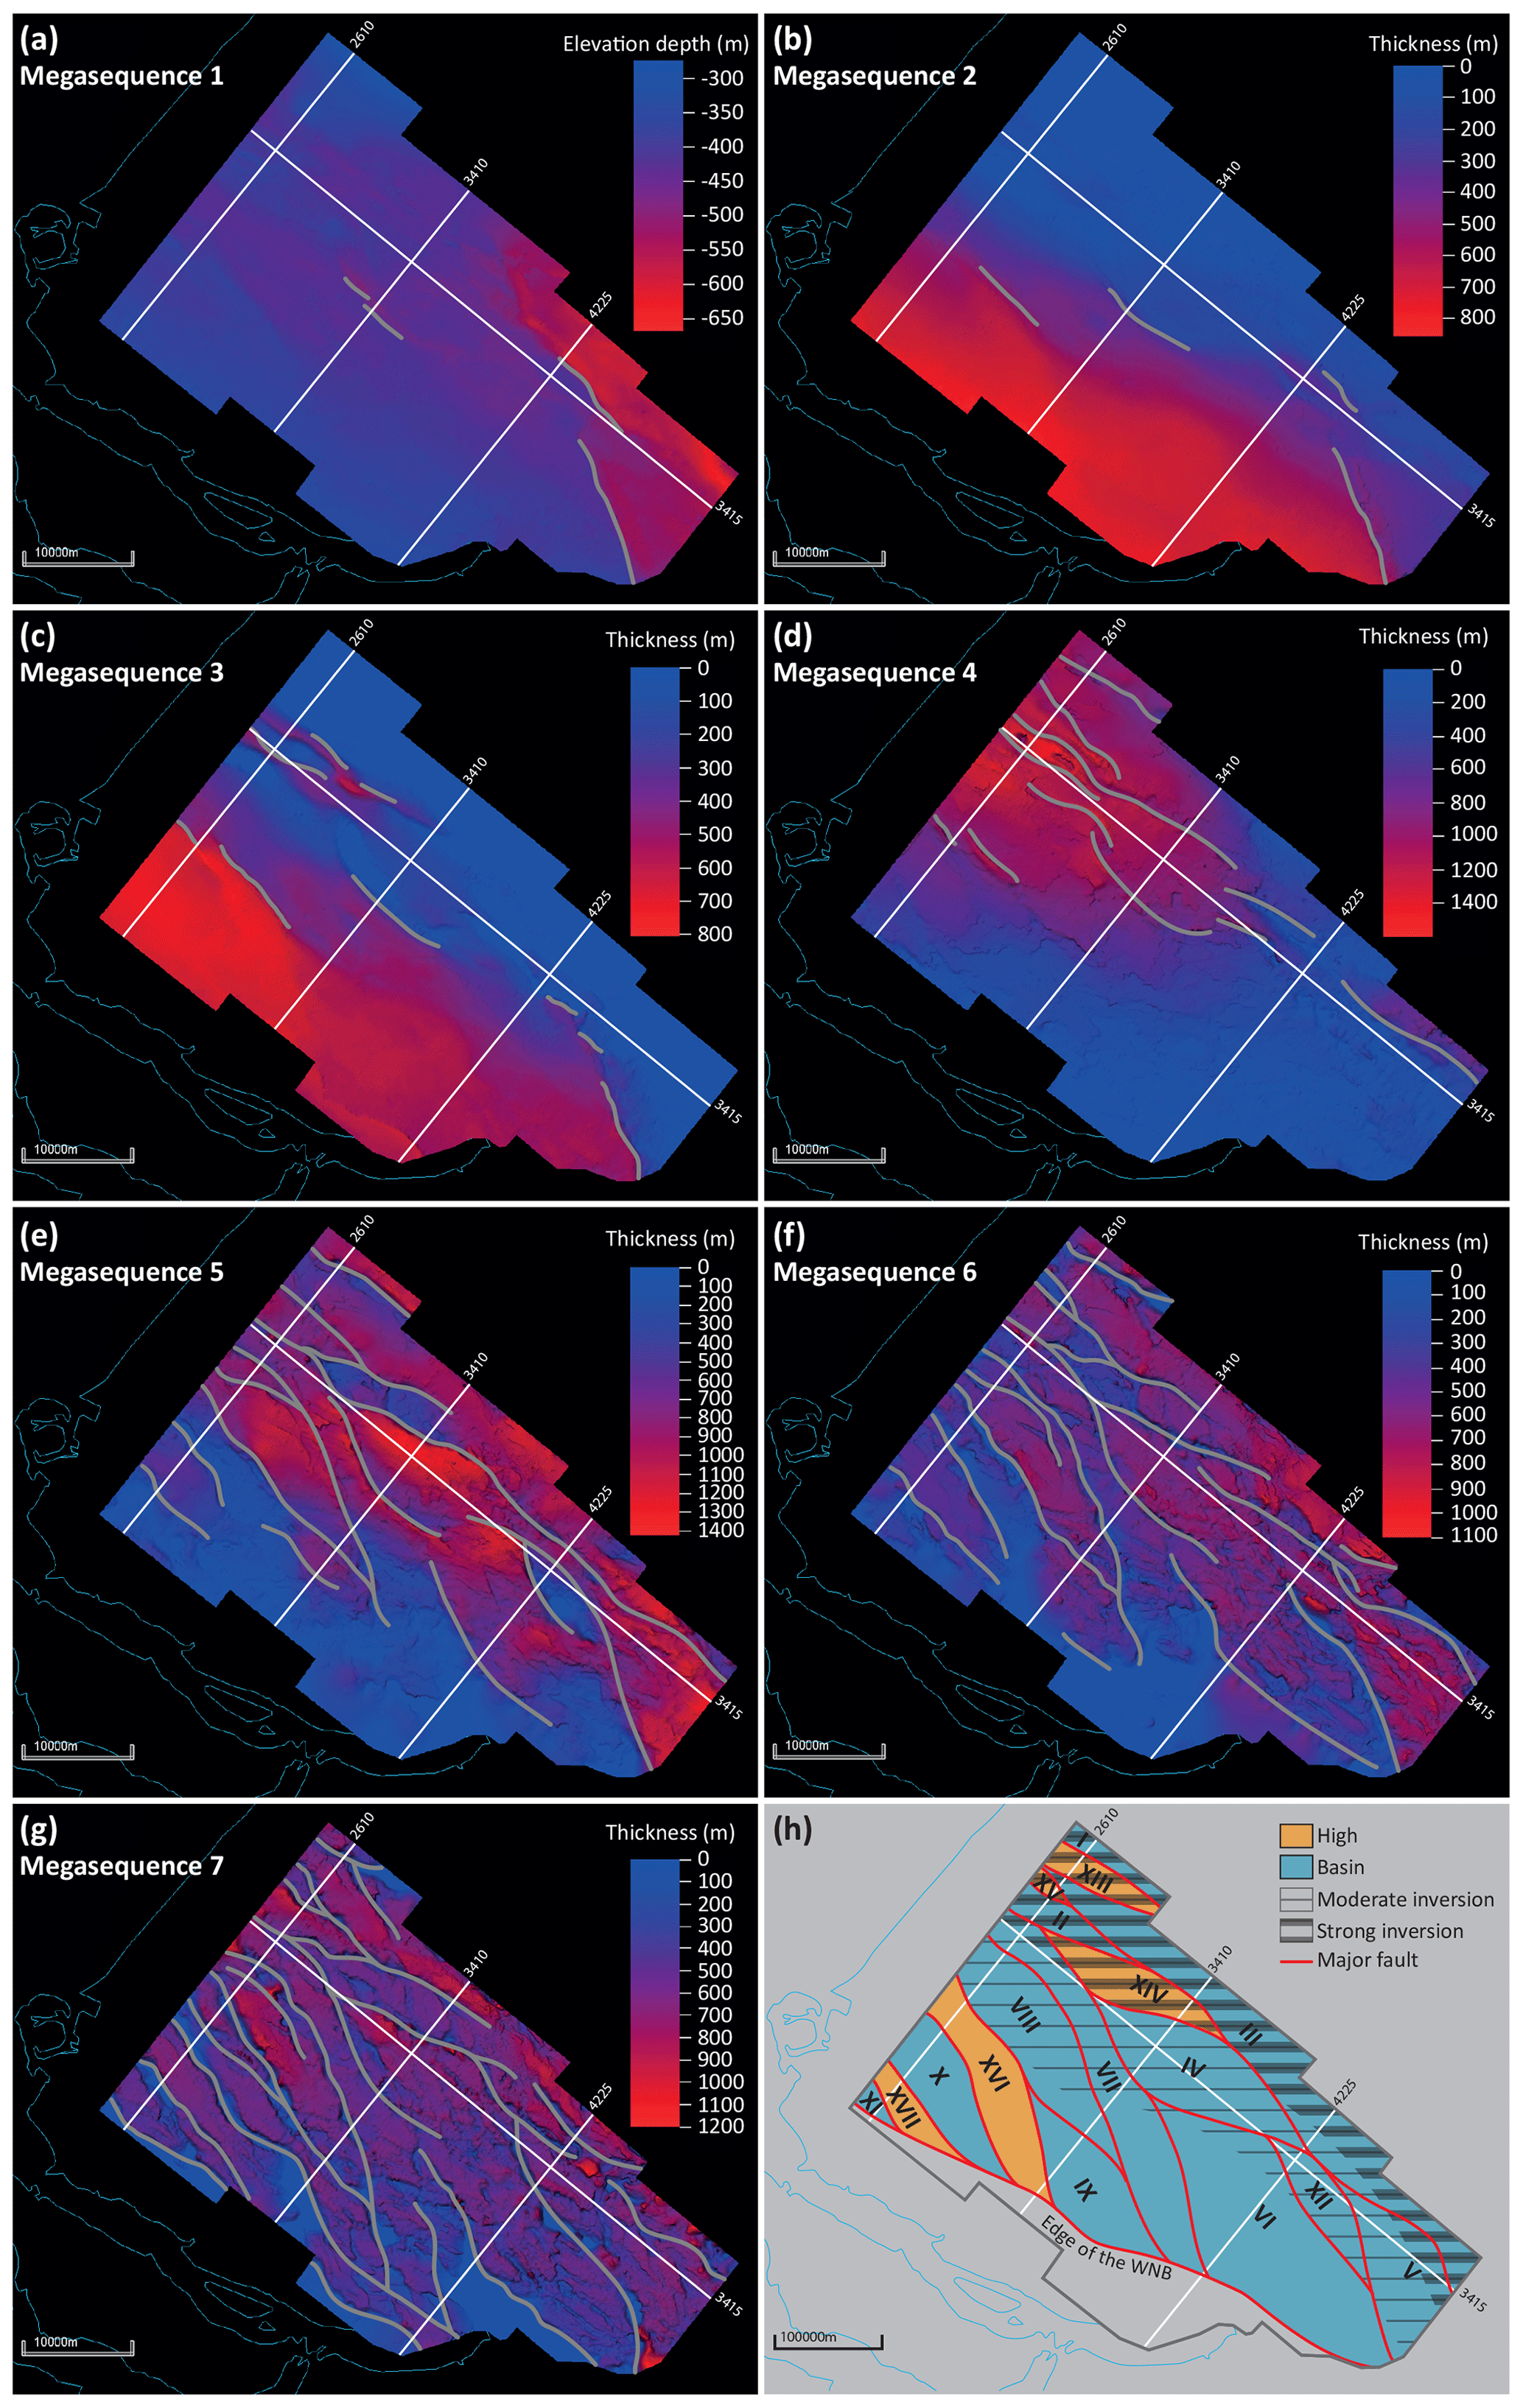
Figure 7(a) Depth map of megasequence 1, with present faults displayed in grey. (b–g) Thickness maps of megasequences 2–7 with present faults displayed in grey. (h) Simplified map showing the structural elements formed as a consequence of the first and second rifting episodes, together with a qualitative estimation of the degree of inversion. The seismic sections in Figs. 3–6 are displayed, together with the different highs and basins, which are numbered and named. (I): Waddinxveen Graben, (II): Voorburg Graben, (III): Zoetermeer Graben, (IV): Pijnacker Graben, (V): Biesbosch Graben, (VI): Dordrecht Graben, (VII): Rijswijk Graben, (VIII): Westland Graben, (IX): Spijkenisse Graben, (X): Maasland Graben, (XI): Voorne Graben, (XII): Ridderkerk Graben, (XIII): Moerkapelle High, (XIV): Lansingerland High, (XV): Zoetermeer High, (XVI): De Lier High, (XVII): Hoek van Holland High.
In contrast to the thickness variations of megasequence 3, megasequence 4 displays an overall thinning from 1500 to 0 m towards the south, with no localized areas of maximum or minimum thicknesses (Fig. 7d). Megasequence 5 (the main geothermal target interval) is characterized by an overall thickness increase from 0 to 1200 m towards the NE (Fig. 7e). NW–SE- and NNW–SSE-oriented faults bound areas of increased and reduced thicknesses that are mostly lozenge-shaped. Towards the south, the thickness of megasequence 5 is about 0 m due to erosion and/or non-deposition. Sub-basins filled by megasequence 5 are asymmetric, as evidenced by the abrupt thickness changes ranging from 400 to 1400 m that are observed towards the NE. This contrasts with the progressive thinning from 600 to 0 m towards the SW. Such an observation is suggestive of a first-order architecture composed of half-grabens bounded by SW-dipping master faults.
The interpretation of the thickness maps of megasequences 6 and 7 is more complex, as these megasequences experienced multiple tectonic events that caused faulting, folding, and erosion. These thickness maps show the effects of erosion during the deposition of megasequence 5, e.g., in the horst structure between faults b and c in section 2610 (Fig. 3). This effect is seen in the map as NNW–SSE-oriented ribbons of reduced thickness (roughly up to 1000 m thinner than the surrounding topography), resembling horst structures. If we remove the effect of those ribbons from the thickness maps of megasequences 6 and 7 and rely on the occurrence of growth geometries (such as the growth wedge observed in megasequence 7 in the Voorburg Graben, structure II, close to fault j, Fig. 3b), we can make some observations regarding the thickness variations. Megasequence 6 is 0 to 1100 m thick (Fig. 7f). None of the thicker areas (between 600 and 1100 m) show growth-wedge geometries, suggesting that thickness variations resulted from later erosion rather than syn-sedimentary creation of accommodation space. Megasequence 7 describes NW–SE elongated grabens and half-grabens where thicknesses increases abruptly from 400 to 1200 m (Fig. 7g). The infill consists of asymmetrically wedge-shaped growth strata, which are separated by horst structures. The Lansingerland High is an outstanding example in the northern corner of the map. This structure is a 20 km long NW–SE elongated horst (structure XIV, Figs. 4 and 7h) that shows a 1400 m thick sedimentary succession bounded by two depocenters. In the depocenters and the horst, the thickness of megasequence 6 is 500 m. This contrasts with megasequence 5 and 7, where changes in thickness are recognized from a maximum of 1000 m in the depocenters to 400 m on the horst for megasequence 5 and from a maximum of 800 m in the depocenters to 500 m on the horst for megasequence 7.
5.1 Tectonic evolution
The interpretation of the L3NAM2012AR 3D seismic cube has allowed us to define seven megasequences, including sediments spanning in age from Jurassic to present times. Megasequences are delimited either by unconformities (base of megasequences 1, 2, 4, and 5) or by the transition from unconformity (e.g., growth geometries, stratigraphic fanning and/or expansion tapering, convergent reflectors) to correlative conformity (e.g., parallel geometries). Intra-formational unconformities are also observed. However, in the framework of a reconstruction of the subsurface, only the main seismo-stratigraphic units are defined. Based on our observations, the evolution of the studied portion of the WNB from the Jurassic onwards can be assessed.
The first observed tectonic period can be dated to the Early Jurassic, which is the biostratigraphic age of the sedimentary rocks of megasequence 7. NW–SE elongated regions of reduced or thick sediments showing thickness variations of up to 800 m (Fig. 7g) are interpreted as Early to Middle Jurassic fault-bounded horst and graben structures, respectively. Growth geometries within this megasequence are observed, like the structures observed in the half-graben in the Voorburg Graben (structure II, associated with fault j, Fig. 3b). Coherently, megasequence 7 is interpreted as a syn-rift sequence, with the syn-rift infill thickening roughly 600 m towards the NE (Fig. 7g). Regionally, this rifting stage was synchronous with the final stage of the first rifting event that shaped the North Sea Rift system (e.g., Fossen et al., 2021). This rifting event seems to overlap with the regionally recognized early Kimmerian tectonics (Fig. 2) (Geluk and Röhling, 1997; Duin et al., 2006). The overlying megasequence 6 displays areas of slight thickness variations of up to 400 m (Fig. 7f). Erosion and non-deposition caused these variations, such as the Hoek van Holland, De Lier, and Zoetermeer former structural highs (structures XVII, XVI, and XV, Fig. 3b). No growth geometries are observed within megasequence 6, and it is therefore interpreted as a post-rift unit. Overall, both megasequences 6 and 7 display a slight northeastward thickening (Fig. 7f and g), with the thickening direction being perpendicular to the direction of the main normal faults that were active during the Early Jurassic rifting stage. According to the widely recognized features in rift systems (e.g., Franke, 2013; Peron-Pinvidic and Manatschal, 2019), we interpret the creation of accommodation space synchronously with deposition of megasequence 7 and the overlying megasequence 6 as the post-rift passive infill. Since the timing of deposition of megasequence 6 corresponds to the inception of the thermal North Sea Rift dome underneath the central North Sea (van Wijhe, 1987; Ziegler, 1992), an alternative hypothesis could be that thinning of megasequence 6 is somehow related to this lithospheric-scale bulging process. Given that the center of the dome was located further to the north (between NW Scotland and SE Norway) (Ziegler, 1992; Wong et al., 2007), northward thinning of megasequence 6 should be observed, which is not the case. Yet, it should be noted that later structural deformation events could have overprinted subtle effects related to the North Sea Rift dome. Still, the absence of northward thinning makes us discard the hypothesis of doming causing a large impact on the depositional pattern of megasequence 6.
Deposition of the overlying megasequence 5 started in the Late Jurassic during a second pulse of extensional faulting. The observed local unconformities within megasequence 5 suggest that faulting happened in several pulses. This stage was coeval with the second phase of rifting observed in the North Sea, further to the north (e.g., Færseth, 1996), which induced crustal extension, known as the late Kimmerian tectonics (van Wijhe, 1987; Ziegler, 1992; de Jager et al., 1996; Racero-Baena and Drake, 1996; van Balen et al., 2000). In the WNB, this extensional phase was simultaneous with igneous activity (Sissingh, 2004), a characteristic of continental rifting (e.g., Franke, 2013; Gouiza and Paton, 2019). We observe that the upper portion of megasequence 5 postdates all the normal faults (excluding those showing evidence of reverse reactivation). Similarly to megasequences 7 and 6, megasequence 5 thickens towards the NE (Fig. 7e), suggesting that these megasequences form part of the same multi-phase rift system. Several syn-depositional wedges, mostly describing half-grabens, are observed in megasequence 5, such as those associated with faults h, o, and i (Fig. 4). The various sub-basins active during this second extensional pulse are lozenge-shaped, bounded by NW–SE- and NNW–SSE-striking faults (Fig. 7e). The Westland, Pijnacker, Dordrecht, and Biesbosch grabens are good examples of this (structures VIII, IV, VI, and V, Fig. 7h). Their “zigzag” arrangement of faults is a typical feature when pre-existing faults occur (e.g., Henstra et al., 2019). Many horst and grabens active during this second rifting phase retrace structures developed during the first rifting stage, such as the ones seen in the NW part of the study area (e.g., the Westland and Pijnacker grabens, structures VIII and IV, Fig. 7h). Our observations show that during the first rifting stage the structures were NW–SE-oriented. This allows us to infer that during the second rifting phase, these NW–SE-striking structures were reactivated and that the NNW–SSE-striking normal faults were formed. Such an inference is coherent with natural examples and analogue models of multi-phase rift systems, where it is commonly observed that oblique inherited structures can be reactivated synchronously with the formation of new faults oriented perpendicular to the stretching direction (e.g., McClay and White, 1995; Mart and Dauteuil, 2000; Henza et al., 2010; Brune et al., 2014; Naliboff and Buiter, 2015; Zwaan et al., 2016; Zwaan and Schreurs, 2017; Cadenas et al., 2020). An alternative hypothesis is that the lozenge-shaped structures are pull-apart basins or ridges associated with transtensive–transpressive faults. We discard this hypothesis for the studied area, as we do not observe the diagnostic features of wrench tectonics, such as positive or negative flowers, branch faults, restraining or releasing bends, antithetic faults, and/or strike-slip duplexes (e.g., Riedel, 1929; Wilcox et al., 1973; Harding, 1974; Aydin and Nur, 1982; Sanderson and Marchini, 1984; Woodcock and Fischer, 1986; Sylvester, 1988; among others) in the L3NAM2012AR 3D seismic cube.
After the second period of rift-related Jurassic crustal extensions (e.g., Ziegler, 1992), the WNB entered a post-rift phase in the Early Cretaceous (van Wijhe, 1987). None of the observed extensional faults were active at that time. Post-rift infill of the WNB is well represented by megasequence 4 on the flattened displays of dip lines 2610, 3410, and 4225 (Figs. 3c, 4c, and 5c) and on the thickness map, showing a NW–SE elongated, 20 to 40 km wide, post-rift basin where the thickness of megasequence 4 increases to a maximum of 1400 m (Fig. 7d). Such a broad basin does not overlap the syn-rift grabens, and therefore it likely relates to large-scale sagging rather than to the simple passive infill of the previously developed half-grabens.
On top of the post-rift megasequence 4, the Lower Cretaceous megasequence 3 was deposited during a shortening stage. Strata within this megasequence describe growth geometries and buttressing-related structures in the hanging wall of positively inverted normal faults (e.g., associated with faults e, h, and i in Fig. 3 and fault a in Fig. 5). This Late Cretaceous period of inversion likely corresponds to the Late Cretaceous Subhercynian inversion phase (Fig. 2) (e.g., Ziegler, 1992; van Wijhe, 1987; de Jager, 2003, Worum and Michon, 2005), caused by the convergence between Africa and Europe (Kley and Voigt, 2008). During this stage, the NW–SE and NNW–SSE fault systems were inverted or deformed due to buttressing. Yet, we were not able to individuate newly formed reverse faults, which are a requirement to constrain the shortening direction. While the NE section of the WNB was inverted and uplifted, its SW flank underwent subsidence and developed as a marginal basin, referred to as the Voorne Trough (Deckers, 2015), where megasequence 3 thickens from 0 to 800 m towards the SW (Fig. 7c). The upper portion of megasequence 3 may represent a post-inversion succession. In fact, a local unconformity divides the upper from the central and lower portions of this megasequence (Figs. 3–5). This is consistent with regional constraints, indicating that due to a decrease in the convergence rate between Africa and Europe (Rosenbaum et al., 2002), the Subhercynian inversion ceased after the Campanian (de Jager, 2003), whereafter deposition of the chalk deposits of megasequence 3 continued until the end of the Late Cretaceous (van Balen et al., 2000; van der Voet et al., 2019).
Megasequence 2 is floored by a regional unconformity and no growth-wedge geometries are observed in this megasequence, suggesting that the gentle folding observed at its base is associated with compaction of the underlying sediments and/or the passive infill and draping of a paleo-topography. Both the syn-inversion megasequence 3 and the post-inversion megasequence 2 wedge out toward the NE (Fig. 7b and c), indicating that uplift of the NE sector of the study area started during faults' inversion. Evidenced by the SW tilting of the erosional unconformity separating the two megasequences, the uplift continued during the deposition of megasequence 2. The erosional unconformity at the base of megasequence 2 likely corresponds to the timing of the Laramide uplift that peaked during the middle Paleocene (Deckers, 2015), which may be related to a significant drop in global sea level (Haq et al., 1987), along with a contribution from dynamic topography due to mantle flow (Kley, 2018; Voigt et al., 2021). The Laramide tectonic phase may have been responsible for the uplift in the area of the WNB (Deckers and van der Voet, 2018; Kley, 2018). The erosional unconformity at the top of megasequence 2, instead, reflects a broad basin uplift (de Jager, 2003), likely initiated during the Alpine Orogeny (Worum and Michon, 2005). Lastly, the depth map of the base of megasequence 1 displays two large plateaus (Fig. 7a), separated by an ENE-dipping fault formed during the second extensional phase and reactivated during the Miocene.
5.2 Implications for geothermal systems
The WNB harbors well-developed geothermal reservoir rocks and is covered by good data collection, inherited from former hydrocarbon exploration (e.g., Willems et al., 2020). Presently, the most exploited geothermal reservoir units are the Late Jurassic Nieuwerkerk Formation (megasequence 5; second syn-rift) and, subordinately, the Cretaceous sandstones (megasequence 4, post-rift and pre-inversion). An additional reservoir is represented by the Triassic sandstones, which occur below the Altena Group and have not been mapped in this work. Although the first characterized rifting period is Early Jurassic in age, the kinematics and type of rift-related structures may have been similar during both the Jurassic and Triassic rifting periods. The Early Jurassic rifting episode can be linked to the regional early Kimmerian tectonic phase, which started during the early Late Triassic (e.g., van Wijhe, 1987; Ziegler, 1992; Geluk and Röhling, 1997, Fig. 2) and reactivated basement faults (Kortekaas et al., 2018); thus, the Early Jurassic rift might be a continuation of Triassic tectonics. The Triassic sandstones have a reduced reservoir quality (Boersma et al., 2021). The fault k does not show signs of reactivation during inversion (Fig. 3), suggesting that the Zoetermeer High (structure XV in Figs. 3b and 7h) may have been relatively stable throughout the evolution of the WNB. Therefore, the Triassic reservoir might be less fractured. In the Zoetermeer High, it shows shallower burial conditions than in the surrounding grabens, and its quality as a geothermal reservoir may be better.
Among the two Jurassic–Cretaceous reservoirs, the Jurassic Nieuwerkerk Formation is the most promising. It facilitates a deeper reservoir (spanning in depth from 0.5 to 3 km), and, given the geothermal gradient of the area (Fig. 8, 31 ∘C km−1; Bonté et al., 2012), it likely offers temperatures up to 90 ∘C, which is suitable for low-enthalpy geothermal systems. Instead, temperatures for the Cretaceous sandstones of the Rijnland Group (spanning in depth from 0.5 to 2 km) probably do not exceed 60 ∘C. The Nieuwerkerk Formation (megasequence 5) was deposited during the second rifting event in the Late Jurassic and the multi-phase extension led to the development of a compartmentalized reservoir made up of lozenge-shaped sub-basins. Given the fluvial nature of the Nieuwerkerk Formation (e.g., Willems et al., 2017c; Vondrak et al., 2018; Willems et al., 2020), the lateral and vertical compartmentalization of sands and shales is a characteristic that must be taken into account for the reservoir's geothermal exploration.
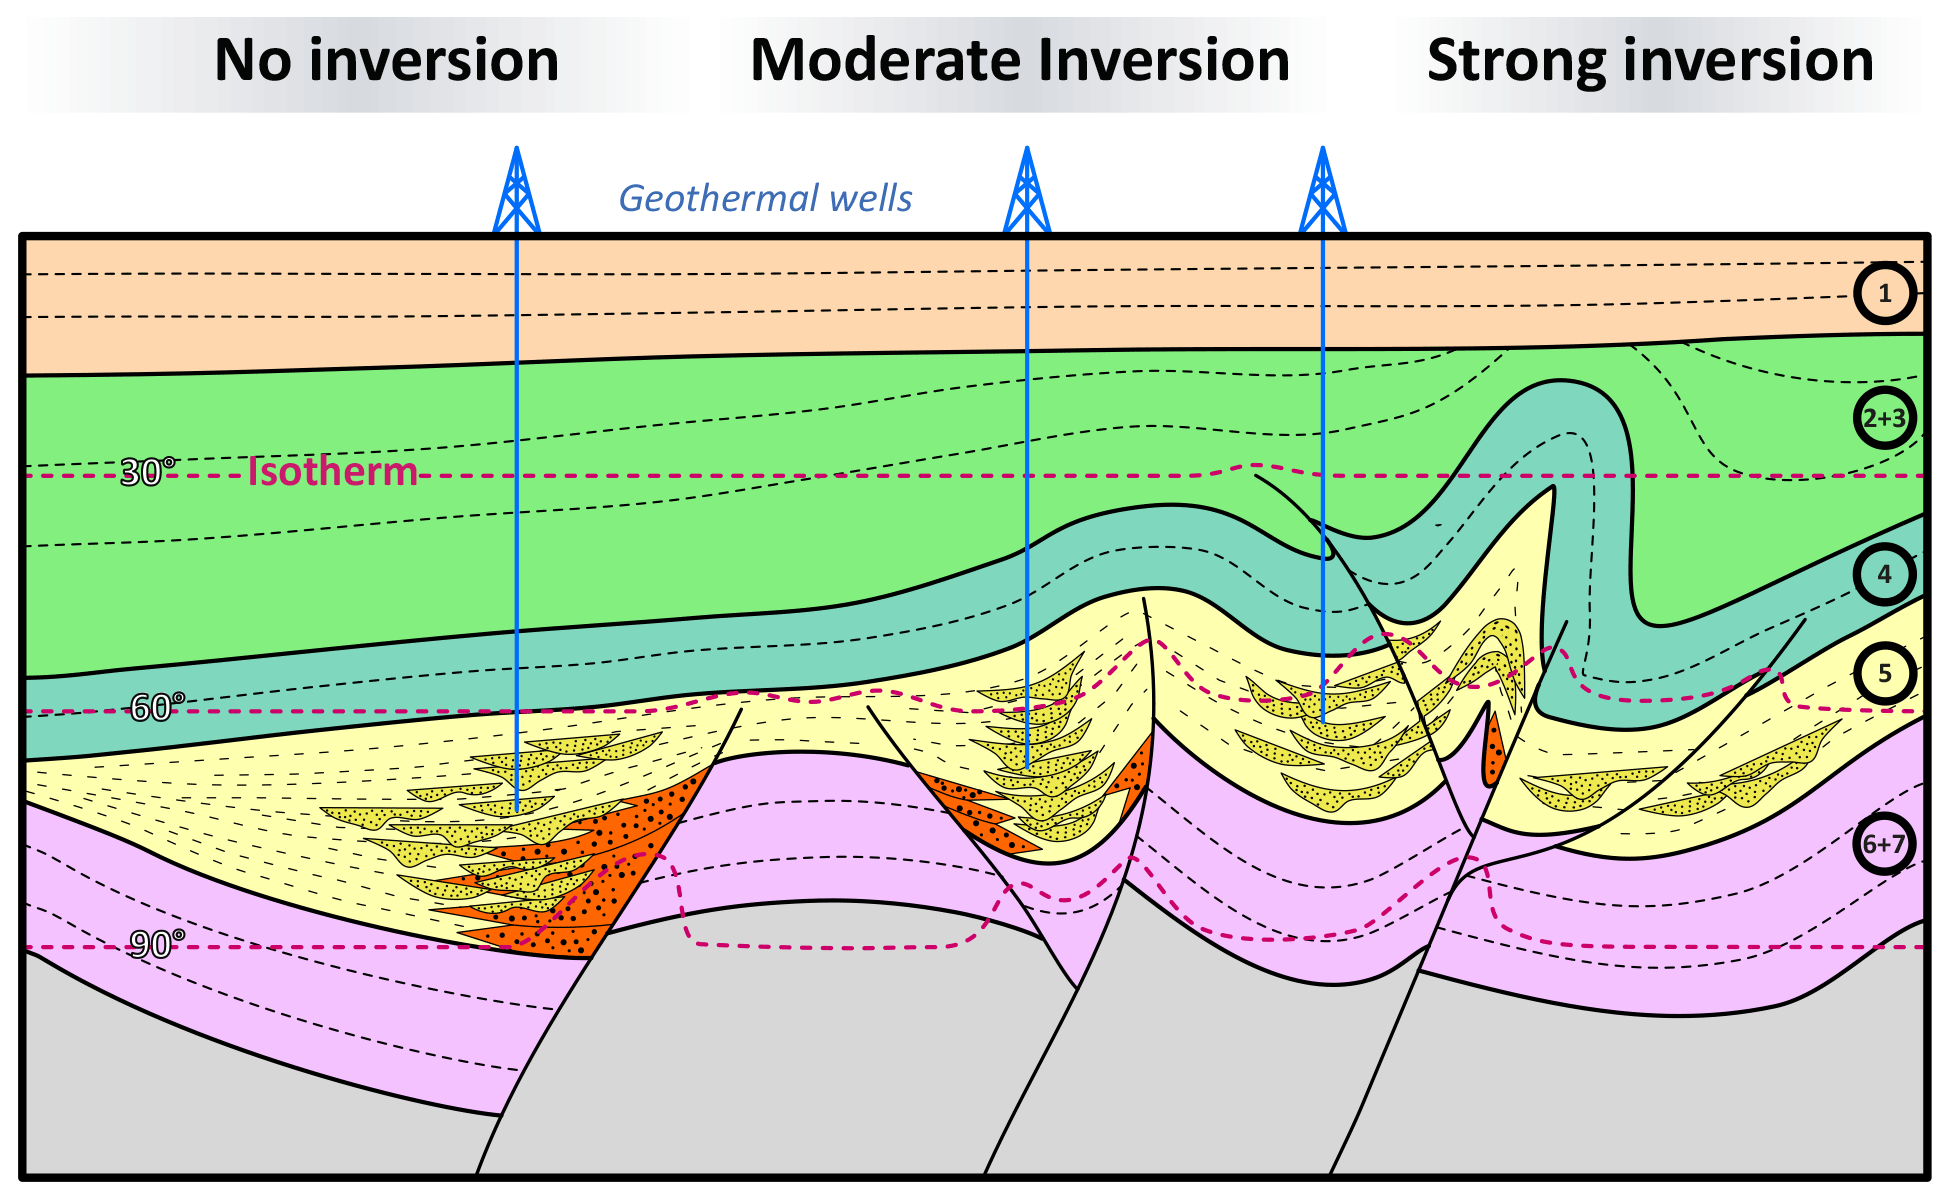
Figure 8Simplified cartoon, showing the geothermal play of a fluvial–deltaic reservoir in an inverted rift basin. The expected best spots for geothermal exploration are the central portions of the half-grabens, where the fluvial sands (dotted yellow material) are present, the geothermal gradients are highest, and the interference from footwall erosion (dotted orange material) is minor. The isotherms are based on a geotherm of 31 ∘C km−1 (Bonté et al., 2012). The sketched layers are based on the interpreted megasequences on this study, indicated in the circles on the right side.
The geothermal play of such a fluvial–deltaic reservoir in an inverted rift basin is illustrated in Fig. 8, where normal faults, positively inverted normal faults, half-grabens, geotherms, and sweet spots are outlined. In rift systems involving continental to coastal clastic syn-tectonic sedimentation, it is well known that the more coarse-grained facies are located close to the faults and along the axis of grabens and half-grabens (e.g., Gawthorpe and Leeder, 2000). In agreement, we expect fluvial channels and other coarse-grained sediments in the core of half-grabens or in the inner limbs close to master faults. Furthermore, close to the master fault, footwall erosion and related hanging-wall degradation complexes drive the development of a wide spectrum of heterogeneous sedimentary facies, possibly interfingered with the targeted reservoir rock. In contrast to petroleum systems, in which structural highs are the preferential targets for hydrocarbon exploration (hydrocarbons are lighter than water) (e.g., Bjørlykke, 2010), half-grabens are the most suitable sites for geothermal exploration. Indeed, half-grabens are deeper, thus ensuring higher temperatures than adjacent limbs and structural highs. All these characteristics allow us to individuate the core of half-grabens, i.e., syn-tectonic intervals in the core of half-grabens, as preferential sites for geothermal exploration. These areas offer greater chances of finding hot and thick fluvial sand packages with a higher net to gross ratio.
Such a simple template is modified during faults' reactivation and buttressing associated with inversion tectonics. Inversion can produce (1) the uplift of the former structural–stratigraphic reservoirs, i.e., the half-grabens, with a consequent decrease in water temperatures and, eventually, (2) fracturing of the reservoirs by second-order faults and brecciation and breaching of the reservoir due to an increase in the inversion (e.g., Tari et al., 2020).
Given the template illustrated in Fig. 8 and assuming that the most suitable areas for geothermal exploration are the central portions of the half-grabens, synclinal traps in half-grabens associated with highly inverted faults are more likely to be breached by faults during inversion tectonics. The effects of a secondary fracturing period due to inversion tectonics can be beneficial in terms of permeability (e.g., Fisher and Knipe, 2001). Instead, the consequences of breaching a geothermal reservoir due to inversion tectonics are less clear. In hydrocarbon reservoirs, indeed, breaching of the anticlinal traps has a clear negative effect (i.e., leakage of the hydrocarbons), while the consequences of breaching synclinal traps in geothermal systems are not yet fully understood. In order to de-risk geothermal exploitation, we therefore advise choosing half-grabens associated with either non-inverted or moderately inverted normal faults. By combining these findings, we can identify areas of interest for geothermal exploitation. Examples of such areas are the central portions of the Pijnacker, Rijswijk, and Westland grabens (structures IV, VII, and VIII, Figs. 4, 7e, and 7h). These grabens contain a 1 to 1.4 km thick megasequence 5 (Nieuwerkerk Formation) with no to moderate inversion. The deepest portions of these grabens are located away from the master faults, preventing interference by material originating from footwall erosion (e.g., the Pijnacker Graben, structure IV, Fig. 4). The central parts of these grabens are 2 to 3 km deep (Fig. 4b), with expected temperatures between 60 and 90 ∘C for the sand bodies (based on a geotherm of 31 ∘C km−1; Bonté et al., 2012). In such areas, additional work is required to assess the fluvial reservoir architecture (Willems et al., 2017a) in more detail and properly locate injection and recovery wells (i.e., geothermal doublets) within coarse-grained sediments.
The seismic interpretation of the recently released L3NAM2012AR 3D depth-migrated seismic cube allowed for the identification of seven megasequences and three main fault trends, as well as the mapping of horst and grabens and major bounding faults in the WNB. This helps to better understand the overall structure of the sedimentary infill, and the tectonic evolution of the major faults and the syn-rift infill, which hosts the main geothermal reservoir.
Faults affecting the Mesozoic sequence of the WNB can be arranged in three main trends. The first fault trend comprises NW–SE-striking extensional faults that cut the Early Jurassic syn-tectonic megasequence 7. The second fault trend includes NNW–SSE-striking extensional faults and reactivated faults of the first fault trend, affecting megasequences 7 and 6 and the Late Jurassic syn-tectonic megasequence 5. The third trend comprises reversely reactivated NW–SE- and NNW–SSE-oriented faults from the first and second fault trend that cut megasequences 4 to 7 and the Late Cretaceous syn-tectonic megasequence 3.
Fault kinematics and the age of syn-kinematic units enable the definition of seven main tectonic phases: (1) a first NE–SW-oriented Early Jurassic rifting phase; (2) a Middle Jurassic post-rift phase; (3) a second WSW–ENE-oriented Late Jurassic rifting phase, partly controlled by the Early Jurassic rifting phase; (4) an Early Cretaceous post-rift sag phase; (5) a Late Cretaceous orogenic phase, which led to the inversion of pre-existing extensional faults; (6) a regional Paleocene to Oligocene basin uplift; and (7) a minor Miocene orogenic phase of fault reactivation.
The occurrence of lozenge-shaped sub-basins filled by megasequence 5 suggests that the Jurassic multi-phase rifting led to compartmentalization of the main geothermal target in the WNB. This infill corresponds to the Late Jurassic fluvial–deltaic Nieuwerkerk Formation.
The presence of heterogeneous seismic facies within the detritic syn-rift sediments of the Nieuwerkerk Formation in the half-graben structures suggests that channel sands are likely present in their deepest, central portions. The highest temperatures and minimal interference by footwall erosion and residue hydrocarbons are expected in these areas.
The increase in Late Cretaceous inversion raises the risks of geothermal exploration. Reactivation of extensional faults could have caused breaching of the reservoir and uplift of the targeted half-grabens, hence decreasing the temperature. Therefore, only non-inverted to moderately inverted areas should be considered for geothermal exploration.
Hence, we conclude that for a fluvial–deltaic syn-rift reservoir rock in a geothermal play resulting from a multi-phase rift setting that undergoes a subsequent basin inversion, the best spots for geothermal exploration can be found in the central portions of non-inverted to moderately inverted half-grabens.
All data used are publicly available and can be downloaded from https://www.nlog.nl/datacenter/ (last access: 1 September 2023). The website is a partnership between the Dutch Ministry of Economic Affairs, TNO-AGE, https://www.nlog.nl/ (last access: 1 September 2023), and the TNO advisory group on economic affairs of the Dutch Organization for Applied Scientific Research TNO. Instructions for accessing the data can be found in the Supplement.
The Supplement includes a list of wells used with their coordinates, drilling results, and whether an LAS file is available; links to the public datasets with a description of how to download them; and a folder with TIFF files of the uninterpreted seismic lines together with some information about the L3NAM2012AR 3D seismic cube and how to download it. The supplement related to this article is available online at: https://doi.org/10.5194/se-15-121-2024-supplement.
AW: corresponding author, conceptualization, data acquisition and processing, seismic interpretation, figure and paper drafting and editing; KO: interpretation assistance, figure and paper drafting and editing; FV: data acquisition, paper drafting and editing; CL: data acquisition, interpretation assistance, paper drafting and editing; GB: paper drafting and editing; JA: paper drafting and editing; ST: conceptualization, data processing, interpretation assistance, figure and paper drafting and editing.
At least one of the (co-)authors is a member of the editorial board of Solid Earth. The peer-review process was guided by an independent editor, and the authors also have no other competing interests to declare.
Publisher's note: Copernicus Publications remains neutral with regard to jurisdictional claims made in the text, published maps, institutional affiliations, or any other geographical representation in this paper. While Copernicus Publications makes every effort to include appropriate place names, the final responsibility lies with the authors.
This article is part of the special issue “(D)rifting into the future: the relevance of rifts and divergent margins in the 21st century”. It is not associated with a conference.
PanTerra Geoconsultants B.V. are thanked for funding this project and for providing in-house expertise that greatly improved the quality of the research. We thank Schlumberger for providing access to Petrel Software (version 2020.3). David Iacopini is thanked for his help that greatly improved the quality of the work. We thank an anonymous reviewer and Connor O'Sullivan for their detailed and constructive comments and suggestions, which allowed us to improve the paper. The handling editor Patricia Cadenas Martínez and the executive editor Susanne Buiter are also thanked for guiding the review process.
This paper was edited by Patricia Cadenas Martínez and reviewed by Conor O'Sullivan and one anonymous referee.
Aydin, A. and Nur, A.: Evolution of pull-apart basins and their scale independence, Tectonics, 1, 91–105, https://doi.org/10.1029/TC001i001p00091, 1982.
Bjørlykke, K. (Ed.): Petroleum Geoscience: From sedimentary environments to rock physics, Springer Science and Business Media, Heidelberg, Germany, 662 pp., ISBN 978-3-642-34131-1, 2010.
Boersma, Q. D., Bruna, P. O., de Hoop, S., Vinci, F., Moradi Tehrani, A., and Bertotti, G.: The impact of natural fractures on heat extraction from tight Triassic sandstones in the West Netherlands Basin: a case study combining well, seismic and numerical data, Neth. J. Geosci., 100, e6, https://doi.org/10.1017/njg.2020.21, 2021.
Bonté, D., van Wees, J. D., and Verweij, J. M.: Subsurface temperature of the onshore Netherlands: new temperature dataset and modelling, Neth. J. Geosci., 91, 491–515, https://doi.org/10.1017/S0016774600000354, 2012.
Brune, S., Heine, C., Pérez-Gussinyé, M., and Sobolev, S. V.: Rift migration explains continental margin asymmetry and crustal hyper-extension, Nat. Commun., 5, 4014, https://doi.org/10.1038/ncomms5014, 2014.
Cadenas, P., Manatschal, G., and Fernández-Viejo, G.: Unravelling the architecture and evolution of the inverted multi-stage North Iberian-Bay of Biscay rift, Gondwana Res., 88, 67–87, https://doi.org/10.1016/j.gr.2020.06.026, 2020.
Carapezza, M. L., Chiappini, M., Nicolosi, I., Pizzino, L., Ranaldi, M., Tarchini, L., de Simone, G., Ricchetti, N., and Barberi, F.: Assessment of a low-enthalpy geothermal resource and evaluation of the natural CO2 output in the Tor di Quinto area (Rome city, Italy), Geothermics, 99, 102298, https://doi.org/10.1016/j.geothermics.2021.102298, 2022.
Crooijmans, R. A., Willems, C. J. L., Nick, H. M., and Bruhn, D. F.: The influence of facies heterogeneity on the doublet performance in low-enthalpy geothermal sedimentary reservoirs, Geothermics, 64, 209–219, https://doi.org/10.1016/j.geothermics.2016.06.004, 2016.
Deckers, J.: The Paleocene stratigraphic records in the Central Netherlands and close surrounding basins: Highlighting the different responses to a late Danian change in stress regime within the Central European Basin System, Tectonophysics, 659, 102–108, https://doi.org/10.1016/j.tecto.2015.07.031, 2015.
Deckers, J. and van der Voet, E.: A review on the structural styles of deformation during Late Cretaceous and Paleocene tectonic phases in the southern North Sea area, J. Geodyn., 115, 1–9, https://doi.org/10.1016/j.jog.2018.01.005, 2018.
de Jager, J., Doyle, M. A., Grantham, P. J., and Mabillard, J. E.: Hydrocarbon habitat of the West Netherlands Basin, in: Geology of Gas and Oil under the Netherlands, Springer Netherlands, Dordrecht, 191–209, https://doi.org/10.1007/978-94-009-0121-6_17, 1996.
de Jager, J.: Inverted basins in the Netherlands, similarities and differences, Neth. J. Geosci., 82, 339–349, https://doi.org/10.1017/S0016774600020175, 2003.
den Hartog Jager, D. G.: Fluviomarine sequences in the Lower Cretaceous of the West Netherlands Basin: correlation and seismic expression, in: Geology of Gas and Oil under the Netherlands, Springer Netherlands, Dordrecht, 229–241, https://doi.org/10.1007/978-94-009-0121-6_19, 1996.
DeVault, B. and Jeremiah, J.: Tectonostratigraphy of the Nieuwerkerk Formation (Delfland subgroup), West Netherlands Basin, AAPG Bull., 86, 1679–1707, https://doi.org/10.1306/61EEDD50-173E-11D7-8645000102C1865D, 2002.
Duin, E. J. T., Doornenbal, J. C., Rijkers, R. H. B., Verbeek, J. W., and Wong, Th. E.: Subsurface structure of the Netherlands – results of recent onshore and offshore mapping, Neth. J. Geosci., 85, 245–276, https://doi.org/10.1017/S0016774600023064, 2006.
Færseth, R. B.: Interaction of Permo-Triassic and Jurassic extensional fault-blocks during the development of the northern North Sea, J. Geol. Soc. London, 153, 931–944, https://doi.org/10.1144/gsjgs.153.6.0931, 1996.
Fisher, Q. J. and Knipe, R. J.: The permeability of faults within siliciclastic petroleum reservoirs of the North Sea and Norwegian Continental Shelf, Mar. Petrol. Geol., 18, 1063–1081, https://doi.org/10.1016/S0264-8172(01)00042-3, 2001.
Fossen, H., Ksienzyk, A. K., Rotevatn, A., Bauck, M. S., and Wemmer, K.: From widespread faulting to localised rifting: Evidence from K-Ar fault gouge dates from the Norwegian North Sea rift shoulder, Basin Res., 33, 1934–1953, https://doi.org/10.1111/bre.12541, 2021.
Franke, D.: Rifting, lithosphere breakup and volcanism: Comparison of magma-poor and volcanic rifted margins, Mar. Petrol. Geol., 43, 63–87, https://doi.org/10.1016/j.marpetgeo.2012.11.003, 2013.
Gawthorpe, R. L. and Leeder, M. R.: Tectono-sedimentary evolution of active extensional basins, Basin Res., 12, 195–218, https://doi.org/10.1111/j.1365-2117.2000.00121.x, 2000.
Geluk, M. C. and Röhling, H. G.: High-resolution sequence stratigraphy of the Lower Triassic Buntsandstein in the Netherlands and Northwestern Germany, Geol. Mijnbouw, 76, 227–246, https://doi.org/10.1023/A:1003062521373, 1997.
Geluk, M. C., Plomp, A., and van Doorn, T. H. M.: Development of the Permo-Triassic succession in the basin fringe area, southern Netherlands, in: Geology of Gas and Oil under the Netherlands, Springer Netherlands, Dordrecht, 57–78, https://doi.org/10.1007/978-94-009-0121-6_7, 1996.
Geothermie Nederland: Locaties op de kaart, https://geothermie.nl/geothermie/locaties-op-kaart/, last access: 25 May 2023.
Gouiza, M. and Paton, D. A.: The Role of Inherited Lithospheric Heterogeneities in Defining the Crustal Architecture of Rifted Margins and the Magmatic Budget During Continental Breakup, Geochem. Geophy. Geosy., 20, 1836–1853, https://doi.org/10.1029/2018GC007808, 2019.
Harding, T. P.: Petroleum Traps Associated with Wrench Faults, Am. Assoc. Petr. Geol. B., 58, 1290–1304, https://doi.org/10.1306/83D91669-16C7-11D7-8645000102C1865D, 1974.
Haq, B. U., Hardenbol, J., and Vail, P. R.: Chronology of fluctuating sea levels since the Triassic, Science, 235, 1156–1167, https://doi.org/10.1126/science.235.4793.1156, 1987.
Henstra, G. A., Berg Kristensen, T., Rotevatn, A., and Gawthorpe, R. L.: How do pre-existing normal faults influence rift geometry? A comparison of adjacent basins with contrasting underlying structure on the Lofoten Margin, Norway, Basin Res., 31, 1083–1097, https://doi.org/10.1111/bre.12358, 2019.
Henza, A. A., Withjack, M. O., and Schlische, R. W.: Normal-fault development during two phases of non-coaxial extension: An experimental study, J. Struct. Geol., 32, 1656–1667, https://doi.org/10.1016/j.jsg.2009.07.007, 2010.
Herngreen, G. F. W., Kouwe, W. F. P., and Wong, T. E.: The Jurassic of the Netherlands, Geol. Surv. Den. Greenl., 1, 217–230, https://doi.org/10.34194/geusb.v1.4652, 2003.
Jeremiah, J. M., Duxbury, S., and Rawson, P.: Lower Cretaceous of the southern North Sea Basins: reservoir distribution within a sequence stratigraphic framework, Neth. J. Geosci., 89, 203–237, https://doi.org/10.1017/S0016774600000706, 2010.
Kley, J.: Timing and spatial patterns of Cretaceous and Cenozoic inversion in the Southern Permian Basin, Geol. Soc. Spec. Publ., 469, 19–31, https://doi.org/10.1144/SP469.12, 2018.
Kley, J. and Voigt, T.: Late Cretaceous intraplate thrusting in central Europe: Effect of Africa-Iberia-Europe convergence, not Alpine collision, Geology, 36, 839–842, https://doi.org/10.1130/G24930A.1, 2008.
Kramers, L., van Wees, J. D., Pluymaekers, M. P. D., Kronimus, A., and Boxem, T.: Direct heat resource assessment and subsurface information systems for geothermal aquifers; the Dutch perspective, Neth. J. Geosci., 91, 637–649, https://doi.org/10.1017/S0016774600000421, 2012.
Kombrink, H., Doornenbal, J. C., Duin, E. J. T., den Dulk, M., ten Veen, J. H., and Witmans, N.: New insights into the geological structure of the Netherlands; results of a detailed mapping project, Neth. J. Geosci., 91, 419–446, https://doi.org/10.1017/S0016774600000329, 2012.
Kortekaas, M., Böker, U., van der Kooij, C., and Jaarsma, B.: Lower Triassic reservoir development in the northern Dutch offshore, Geol. Soc. Spec. Publ., 469, 149–168, https://doi.org/10.1144/SP469.19, 2018.
Limberger, J., Boxem, T., Pluymaekers, M., Bruhn, D., Manzella, A., Calcagno, P., Beekman, F., Cloetingh, S., and van Wees, J. D. (2018). Geothermal energy in deep aquifers: A global assessment of the resource base for direct heat utilization, Renew. Sust. Energ. Rev., 82, 961–975, https://doi.org/10.1016/j.rser.2017.09.084, 2018.
Mart, Y. and Dauteuil, O.: Analogue experiments of propagation of oblique rifts, Tectonophysics, 316, 121–132, https://doi.org/10.1016/S0040-1951(99)00231-0, 2000.
McClay, K. R. and White, M. J.: Analogue modelling of orthogonal and oblique rifting, Mar. Petrol. Geol., 12, 137–151, https://doi.org/10.1016/0264-8172(95)92835-K, 1995.
Michon, L., van Balen, R. T., Merle, O., and Pagnier, H.: The Cenozoic evolution of the Roer Valley Rift System integrated at a European scale, Tectonophysics, 367, 101–126, https://doi.org/10.1016/S0040-1951(03)00132-X, 2003.
Mijnlieff, H. F.: Introduction to the geothermal play and reservoir geology of the Netherlands, Neth. J. Geosci., 99, e2, https://doi.org/10.1017/njg.2020.2, 2020.
Naliboff, J. and Buiter, S. J. H.: Rift reactivation and migration during multiphase extension, Earth Planet Sc. Lett., 421, 58–67, https://doi.org/10.1016/j.epsl.2015.03.050, 2015.
O'Sullivan, C. M., Childs, C. J., Saqab, M. M., Walsh, J. J., and Shannon, P. M.: Tectonostratigraphic evolution of the Slyne Basin, Solid Earth, 13, 1649–1671, https://doi.org/10.5194/se-13-1649-2022, 2022.
Peron-Pinvidic, G. and Manatschal, G.: Rifted Margins: State of the Art and Future Challenges, Front Earth Sci., 7, 218, https://doi.org/10.3389/feart.2019.00218, 2019.
Poulsen, S. E., Balling, N., and Nielsen, S. B.: A parametric study of the thermal recharge of low enthalpy geothermal reservoirs, Geothermics, 53, 464–478, https://doi.org/10.1016/j.geothermics.2014.08.003, 2015.
Racero-Baena, A. and Drake, S. J.: Structural style and reservoir development in the West Netherlands oil province, in: Geology of Gas and Oil under the Netherlands, Springer Netherlands, Dordrecht, 211–227, https://doi.org/10.1007/978-94-009-0121-6_18, 1996.
Riedel, W.: Zur Mechanik geologischer Brucherscheinungen ein Beitrag zum Problem der Fiederspatten, Centralblatt für Mineralogie, Geologie und Paläontologie, 354–368, 1929.
Rosenbaum, G., Lister, G. S., and Duboz, C.: Relative motions of Africa, Iberia and Europe during Alpine orogeny, Tectonophysics, 359, 117–129, https://doi.org/10.1016/S0040-1951(02)00442-0, 2002.
Sanderson, D. J. and Marchini, W. R. D.: Transpression, J. Struct. Geol., 6, 449–458, https://doi.org/10.1016/0191-8141(84)90058-0, 1984.
Sissingh, W.: Palaeozoic and Mesozoic igneous activity in the Netherlands: a tectonomagmatic review, Neth. J. Geosci., 83, 113–134, https://doi.org/10.1017/S0016774600020084, 2004.
Sylvester, A. G.: Strike-slip faults, Geol. Soc. Am. Bull., 100, 1666–1703, https://doi.org/10.1130/0016-7606(1988)100{%}3C1666:SSF{%}3E2.3.CO;2, 1988.
Tari, G., Arbouille, D., Schléder, Z., and Tóth, T.: Inversion tectonics: a brief petroleum industry perspective, Solid Earth, 11, 1865–1889, https://doi.org/10.5194/se-11-1865-2020, 2020.
TNO-GDN: Stratigraphic Nomenclature of the Netherlands, https://www.dinoloket.nl/en/stratigraphic-nomenclature, last access: 10 May 2023.
van Adrichem Boogaert, H. A. and Kouwe, W. P. F.: Stratigraphic nomenclature of the Netherlands, revision and update by RGD and NOGEPA, TNO-NITG, Mededelingen Rijks Geologische Dienst, 1993.
van Balen, R. T., van Bergen, F., de Leeuw, C., Pagnier, H., Simmelink, H., van Wees, J. D., and Verweij, J. M.: Modelling the hydrocarbon generation and migration in the West Netherlands Basin, the Netherlands, Neth. J. Geol., 79, 29–44, https://doi.org/10.1017/S0016774600021557, 2000.
van der Voet, E., Heijnen, L., and Reijmer, J. J. G.: Geological evolution of the Chalk Group in the northern Dutch North Sea: inversion, sedimentation and redeposition, Geol. Mag., 156, 1265–1284, https://doi.org/10.1017/S0016756818000572, 2019.
van Wijhe, D. H.: Structural evolution of inverted basins in the Dutch offshore, Tectonophysics, 137, 171–219, https://doi.org/10.1016/0040-1951(87)90320-9, 1987.
Voigt, T., Kley, J., and Voigt, S.: Dawn and dusk of Late Cretaceous basin inversion in central Europe, Solid Earth, 12, 1443–1471, https://doi.org/10.5194/se-12-1443-2021, 2021.
Vondrak, A. G., Donselaar, M. E., and Munsterman, D. K.: Reservoir architecture model of the Nieuwerkerk Formation (Early Cretaceous, West Netherlands Basin): diachronous development of sand-prone fluvial deposits, Geological Society, London, Special Publications, 469, 423–434, https://doi.org/10.1144/SP469.18, 2018.
Wilcox, R. E., Harding, T. P., and Seely D. R.: Basic Wrench Tectonics, AAPG Bull., 57, 74–96, 1973.
Willems, C. J. L.: Doublet deployment strategies for geothermal Hot Sedimentary Aquifer exploitation: Application to the Lower Cretaceous Nieuwerkerk Formation in the West Netherlands Basin, Delft University of Technology, the Netherlands, 147 pp., https://doi.org/10.4233/uuid:2149da75-ca29-4804-8672-549efb004048, 2017.
Willems, C. J. L. and Nick, H. M.: Towards optimisation of geothermal heat recovery: An example from the West Netherlands Basin, Appl. Energ., 247, 582–593, https://doi.org/10.1016/j.apenergy.2019.04.083, 2019.
Willems, C. J. L., Nick, H. M., Donselaar, M. E., Weltje, G. J., and Bruhn, D. F.: On the connectivity anisotropy in fluvial Hot Sedimentary Aquifers and its influence on geothermal doublet performance, Geothermics, 65, 222–233, https://doi.org/10.1016/j.geothermics.2016.10.002, 2017a.
Willems, C. J. L., Nick, H. M., Weltje, G. J., and Bruhn, D. F.: An evaluation of interferences in heat production from low enthalpy geothermal doublets systems, Energy, 135, 500–512, https://doi.org/10.1016/j.energy.2017.06.129, 2017b.
Willems, C. J. L., Vondrak, A., Munsterman, D. K., Donselaar, M. E., and Mijnlieff, H. F.: Regional geothermal aquifer architecture of the fluvial Lower Cretaceous Nieuwerkerk Formation – a palynological analysis, Neth. J. Geosci., 96, 319–330, https://doi.org/10.1017/njg.2017.23, 2017c.
Willems, C. J. L., Vondrak, A., Mijnlieff, H. F., Donselaar, M. E., and van Kempen, B. M. M.: Geology of the Upper Jurassic to Lower Cretaceous geothermal aquifers in the West Netherlands Basin – an overview, Neth. J. Geosci., 99, e1, https://doi.org/10.1017/njg.2020.1, 2020.
Williams, G. D., Powell, C. M., and Cooper, M. A.: Geometry and kinematics of inversion tectonics, Geological Society, London, Special Publications, 44, 3–15, https://doi.org/10.1144/GSL.SP.1989.044.01.02, 1989.
Wong, T. E, Batjes, D. A. J., and de Jager, J. (Eds.): Geology of the Netherlands, Royal Netherlands Academy of Arts and Sciences, Amsterdam, the Netherlands, 362 pp., ISBN 978-9069844817, 2007.
Woodcock, N. H. and Fischer, M.: Strike-slip duplexes, J. Struct. Geol., 8, 725–735, https://doi.org/10.1016/0191-8141(86)90021-0, 1986.
Worum, G. and Michon, L.: Implications of continuous structural inversion in the West Netherlands Basin for understanding controls on Palaeogene deformation in NW Europe, J. Geol. Soc. London, 162, 73–85, https://doi.org/10.1144/0016-764904-011, 2005.
Worum, G., Michon, L., van Balen, R., van Wees, J., Cloetingh, S., and Pagnier, H.: Pre-Neogene controls on present-day fault activity in the West Netherlands Basin and Roer Valley Rift System (southern Netherlands): role of variations in fault orientation in a uniform low-stress regime, Quaternary Sci. Rev., 24, 473–488, https://doi.org/10.1016/j.quascirev.2004.02.020, 2005.
Ziegler, P. A.: North Sea rift system, Tectonophysics, 208, 55–75, https://doi.org/10.1016/0040-1951(92)90336-5, 1992.
Zwaan, F. and Schreurs, G.: How oblique extension and structural inheritance influence rift segment interaction: Insights from 4D analog models, Interpretation, 5, SD119–SD138, https://doi.org/10.1190/INT-2016-0063.1, 2017.
Zwaan, F., Schreurs, G., Naliboff, J., and Buiter, S. J. H.: Insights into the effects of oblique extension on continental rift interaction from 3D analogue and numerical models, Tectonophysics, 693, 239–260, https://doi.org/10.1016/j.tecto.2016.02.036, 2016.