the Creative Commons Attribution 4.0 License.
the Creative Commons Attribution 4.0 License.
Along-strike variation in volcanic addition controlling post-breakup sedimentary infill: Pelotas margin, austral South Atlantic
Marlise C. Cassel
Nick Kusznir
Gianreto Manatschal
Daniel Sauter
We investigate, using observations from seismic reflection data, the lateral variability in breakup extrusive magmatic addition along the strike of the Pelotas segment of the austral South Atlantic rifted margin and its control on post-rift accommodation space and sediment deposition. Our analysis of regional seismic reflection profiles shows that magmatic addition on the Pelotas margin varies substantially along strike from extremely magma-rich to magma-normal within a distance of ∼300 km. Using 2D flexural back-stripping, we determine the post-rift accommodation space above top volcanics. In the north, where volcanic seaward-dipping reflectors (SDRs) are thickest, the Torres High shows SDRs up to ∼20 km thick, and post-breakup water-loaded accommodation space is much less than in the south, where magmatic addition is normal and SDRs are thinner. We show that post-breakup accommodation space correlates inversely with SDR thickness, being less for magma-rich margins and more for magma-normal/intermediate margins. The Rio Grande Cone, with large sediment thickness, is underlain by small SDR thicknesses allowing large post-breakup accommodation space. A relationship is observed between the amount of volcanic material and the two-way travel time (TWTT) of first volcanics: first volcanics are observed between 1.2 and 2.2 s TWTT for the highly magmatic Torres High profile, while, in contrast, for the normally magmatic profiles in the south, first volcanics are observed between 4.2 and 6.5 s TWTT. The observed inverse relationship between post-breakup accommodation space and SDR thickness is consistent with predictions by a simple isostatic model of continental lithosphere thinning and magmatic addition melting during breakup. The methodology that we use in this paper provides a new approach for investigating the complex magmatic and sedimentary evolution of rifted continental margins.
- Article
(10736 KB) - Full-text XML
-
Supplement
(630 KB) - BibTeX
- EndNote
Much recent continental margin research has been focused on either magma-rich margins showing thick sequences of magmatic extrusives or, in contrast, magma-poor margins showing domains of exhumed mantle between thinned continental crust and new magmatic ocean crust. Sapin et al. (2021), however, point out that these represent end-members of rifted margin magmatic type and that a continuous spectrum may exist between them. In this paper we investigate, using observations from seismic reflection data, lateral variability in breakup volcanic addition along the strike of the Pelotas segment of the austral South Atlantic rifted margin and its control on post-rift accommodation space and sediment deposition. Breakup along the austral segment of the South Atlantic occurred by the propagation of rift systems accompanied by extensive magmatism, resulting in classical volcanic margins characterised by seaward-dipping reflectors (SDRs) (Koopmann et al., 2014). While SDRs have been mapped and described in detail through dip sections along the austral segment at both conjugate margins (Chauvet et al., 2021), much less is known about the along-strike evolution of the magmatic system. Stica et al. (2014) and Franke et al. (2007) described the along-strike evolution of the magmatic breakup, suggesting that the magmatic system was laterally continuous, with breakup evolution being controlled by the Tristan mantle plume resulting in the Paraná–Etendeka magmatic province (Thompson et al., 2001; Peace et al., 2020). In contrast, a more recent study by Sauter et al. (2023) shows that the magmatic budget along large parts of the austral segment does not need a hot-mantle booster and that higher magmatic budgets can only be observed north of the Chui–Cape Cross Fracture Zone when approaching the Paraná–Etendeka magmatic province. However, Sauter et al. (2023) only analysed the magmatic budget recorded in the first oceanic crust. There are important remaining questions: do variations in magmatic addition occur along the Pelotas margin, and, if variations do occur, how are they manifested in the margin architecture and how do they control margin accommodation space and depositional history?
The approach we use in our investigation is to restrict our observations from seismic reflection data to those which do not depend on speculative interpretations. As a consequence, our methodology is as follows:
- i.
We do not consider the nature of the basement onto which extrusive magmatism is deposited; the identification of whether basement is thinned continental crust, oceanic crust or hybrid is imprecise and ambiguous.
- ii.
We focus on the more proximal extrusive magmatism and avoid taking measurements where it transitions into oceanic layer 2.
- iii.
We only take measurements for extrusive magmatism and do not consider intrusive magmatism which cannot be reliably observed or quantified.
- iv.
We do not consider the formation processes of extrusive magmatism; we focus on measured observations from seismic reflection data.
- v.
We preferentially take our measurements from time domain seismic reflection sections which are the primary observational data set. Depth-converted seismic sections are model-dependent on the seismic velocities used in depth conversion; at magma-rich margins, seismic velocities are highly heterogeneous and uncertain (McDermott et al., 2019) and the resultant depth sections are unreliable.
Our study focuses on the Pelotas margin of the austral South Atlantic located north of the Chui–Cape Cross Fracture Zone and offshore of the southeastern border of the Paraná magmatic province (Fig. 1). We use four parallel deep long-offset seismic reflection dip lines that allow us to determine the along-strike variation in volcanic thickness, sediment thickness and post-breakup accommodation space. We first examine the relationship between thicknesses of SDRs and sediments in two-way travel time (TWTT). We then use 2D flexural back-stripping of depth-converted sections to determine post-rift accommodation space and its relationship with breakup volcanic addition. Our results reveal a direct relationship between the volume of breakup volcanics and post-breakup sedimentary fill along the Pelotas rifted margin.
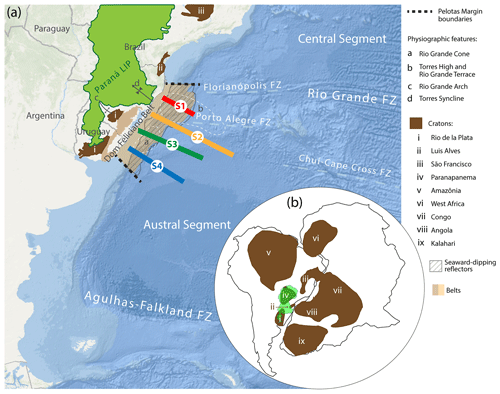
Figure 1(a) Map of the austral South Atlantic (adapted from Cassel et al., 2022) showing the location of the four Pelotas margin seismic reflection profiles examined in this study, the distribution of seaward-dipping reflectors from Chauvet et al. (2021), crustal basement from Stica et al. (2014) and the Paraná large igneous province (LIP) adapted from Rossetti et al. (2018). (b) Regional palaeo-map of western Gondwana adapted from Heilbron et al. (2008) showing the Paraná LIP and cratons.
SDRs with long flow lengths and large thicknesses, which form by extrusive magmatism in a sub-aerial environment, have been extensively studied (Mutter et al., 1982; Planke et al., 2000; McDermott et al., 2019; Harkin et al., 2020). However, volcanic SDRs also form in a deep marine environment as voluminous effusive sheet flows (Planke et al., 2000), as shown in Hinz et al. (1999; Fig. 14), Planke et al. (2000; Fig. 9) and Sapin et al. (2021; Fig. 6), with the top of these deep marine SDRs often showing perfect distal continuity with the top of oceanic layer 2. In this paper, we use the term SDRs to denote the general observation of volcanic seaward-dipping reflectors not only applied to those formed in a sub-aerial environment but also to those formed in deep water.
The Pelotas margin resulted from the assumed magma-rich breakup and separation of the Pangaea supercontinent during the Early Cretaceous. It is located offshore southern Brazil and is underlain by basement belonging to SW Gondwana. The continental basement is made of granitoids, schists and high-grade metamorphic rocks inherited from the Proterozoic Dom Feliciano Belt that records successive subduction and collision phases related to terrane accretion responsible for a strong NE–SW-trending fabric (Chemale, 2000). The overlying pre-breakup sedimentary succession was deposited in the intracratonic Paleozoic Paraná Basin, which is capped by the volcanic Serra Geral Formation (Rossetti et al., 2018) of the Paraná–Etendeka large igneous province (LIP). These Lower Cretaceous flood basalts correspond to the Paraná–Etendeka large igneous province that is tightly linked with the breakup of the austral segment of the South Atlantic (Zalán, 2004; Stica et al., 2014).
The Pelotas margin formed during the breakup of western Gondwana leading to the formation of the South Atlantic. This breakup may be regionally divided into equatorial, central and austral segments with the Pelotas margin belonging to the latter (Stica et al., 2014). Stica et al. (2014) present a detailed compilation of the rift and breakup evolution of the Pelotas and conjugate Namibia margins. There is consensus that the austral South Atlantic opening is diachronous, starting in the south and migrating northward (Franke et al., 2007). It is generally considered that final rifting and breakup of the Pelotas margin occurred in the Lower Cretaceous, with massive magmatic activity and the emplacement of high volumes of volcanic rocks forming prominent SDR sequences. The syn- to post-breakup sedimentary infill of the Pelotas margin can be subdivided into three main mega-sequences: (i) a transgressive mega-sequence (Aptian–Turonian) which includes the final rift phase, with depositional environments grading from continental deposits, including alluvial conglomerates and lacustrine facies, to shallow marine evaporite, carbonate and siliciclastic facies deposited during breakup; (ii) an aggradational mega-sequence (Turonian–Priabonian) with clastic fans in the more proximal domain and deeper marine shales and siltstone interbedded with turbiditic deposits in the distal domain; and (iii) a regressive mega-sequence starting in the Oligocene and lasting to the present, made of clastic fans and deltas that prograde oceanward over the distal deposits, forming a large regressive sedimentary wedge (Abreu and Anderson, 1998).
Recently, Cassel et al. (2022) demonstrated how along-strike variations in tectonic domains along the Andean Convergence Zone respond to the South Atlantic Mid-Ocean Ridge spreading rate and control the margin evolution. While many of the previous studies have focused on the down-dip and along-strike magmatic evolution of the margin (Stica et al., 2014; Chauvet et al., 2021), little is known about the along-strike variations in the post-rift sediment accommodation and sediment architecture and how they are linked to the volcanic addition. Here we focus on investigating the link between lateral variations in volcanic additions (e.g. SDR sequences) and the subsequent development of accommodation space and sedimentary infill along the Pelotas margin.
In this study, we interpret four parallel long-offset time-domain seismic reflection sections provided by TGS, the locations of which are shown in Fig. 1. We identify in the seismic sections the following units: (a) basement, (b) SDR package and (c) sedimentary package. These units are bounded from top to bottom by the seafloor, the top of SDRs, the base of SDRs, and the Moho.
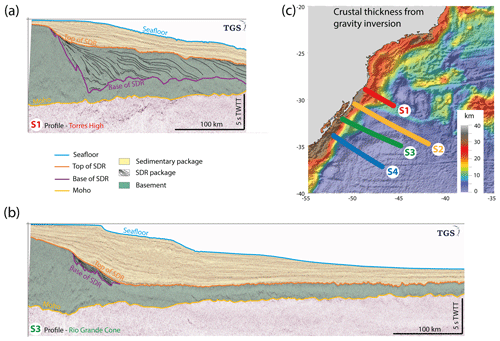
Figure 2(a) Seismic profiles in TWTT showing interpreted surfaces and units for profile S1. (b) Seismic profiles in TWTT showing interpreted surfaces and units for profile S3. (c) Locations of the four seismic profiles superimposed on a map of crust thickness from gravity inversion (adapted from Graca et al., 2019): profile S1 is located in the northern Pelotas margin along the Torres High. Profile S3 is located in the southern Pelotas margin crossing the Rio Grande Cone.
The basement unit is characterised by chaotic, discontinuous, low-amplitude reflectors (Fig. 2). Lines S1 and S3 (Fig. 2a and b) continentward of distance 100 km show that the top continental basement tapers down to about 9 s TWTT. Oceanward of 100 km, the top basement remains parallel to the distal end of the seismic sections. The top basement interface is a smooth horizon onto which the SDRs down-lap. The SDR package is characterised by several sequences of oceanward-dipping, oceanward-diverging high-amplitude reflectors. SDRs are well expressed on line S1, forming a thick volcanic package tapering oceanward and overlying both the tapering and the box-shaped (i.e. uniform thickness) basement. In contrast, for line S3, the SDRs are thin and overlie only the crustal taper. The interface topping the SDR package corresponds to a sharp, high-amplitude reflection interpreted to separate magmatic extrusives from the post-rift sedimentary package. The latter is well stratified, and its reflectors have good lateral continuity and high frequency, showing parallel, sub-parallel, oblique and sigmoidal internal patterns.
Comparison of the four seismic sections in a regional along-strike perspective (Fig. 3) shows some major differences. While in line S1 the continentward termination of the SDR sequence starts at approximately 30 km at about 2 s TWTT, in other sections the SDR package starts further oceanward at about 4 s TWTT (Fig. 3). The oceanward termination of the SDR package occurs, except for line S1, at the inflection point of the top basement, i.e. at the change from a tapering to a box-shaped basement. Strong along-strike variations in the thickness of the volcanic (SDR) and sedimentary packages are shown in Table 1 and Fig. 4.
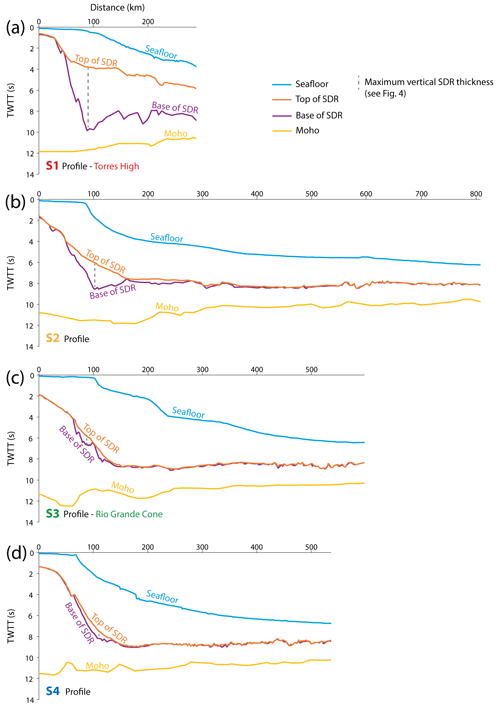
Figure 3Comparison of the four seismic profiles showing the interpreted surfaces in TWTT. (a) Seismic profile S1, located in the northern Pelotas margin crossing the Torres High. (b) Seismic profile S2. (c) Seismic profile S3 located in the southern Pelotas margin crossing the Rio Grande Cone. (d) Seismic profile S4.
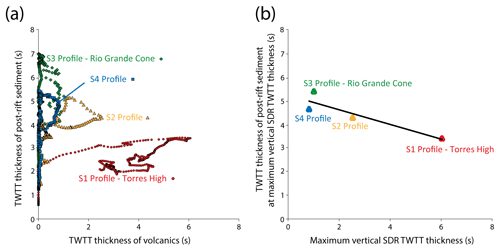
Figure 4(a) Plot of TWTT thickness of post-rift sediment against TWTT thickness of SDR for the same 300 km profile horizontal distance for each of the 4 profiles S1–S4. (b) Plot of TWTT thickness of post-rift sediment at maximum vertical SDR TWTT thickness against maximum vertical SDR TWTT thickness at the same horizontal profile distance for each profile S1–S4.
Table 1Summary of vertical thickness measurements in TWTT taken from profiles S1–S4, as shown in Fig. 3.
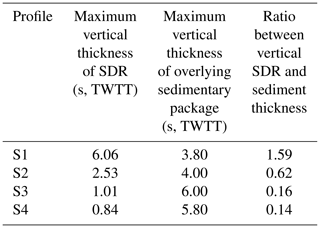
Although all four seismic sections (S1–S4) show volcanic SDR packages, the thicknesses of volcanics and post-breakup sediments show notable changes in vertical thickness along strike. Figure 4a shows a plot of vertical-sediment-thickness TWTT against corresponding SDR-thickness TWTT for each profile out to a distance of 300 km. It shows a clear difference between the value ranges of SDR and sediment thickness between the northern profile S1 (with high SDR and low sediment thickness) and the southern profiles S3 and S4 (with low SDR and high sediment thickness). Profile S2 shows an intermediate relationship. The relationship between maximum SDR TWTT thickness and the corresponding sediment TWTT thickness for each profile is shown in Fig. 4b. An inverse relationship can be seen; as volcanic (SDR) thickness in TWTT increases, the corresponding sediment TWTT decreases.
In the previous section, we observed an inverse correlation of post-breakup sediment thickness with volcanic addition. However, margin sediment thickness is dependent not only on accommodation space but also on sediment supply, which is controlled by factors external to margin formation. In this section, we determine the water-loaded post-rift accommodation space so that we can observe its relationship to volcanic addition. This requires flexural back-stripping and decompaction to be applied to depth-converted sections.
Figure 5a and c show the depth-converted seismic interpretations for the Torres High and the Rio Grande Cone profiles shown in Fig. 2. The depth conversion for post-rift sediment thickness uses a depth-dependent seismic velocity function , where z is depth (in km), Vo=1.75 km s−1 and k=0.3 km s−1 km−1. Figure 8d in McDermott et al. (2019) shows k values between 0.4 and 0.5 km s−1 km−1 for sediments immediately above top SDRs. However, at depth, these k values produce an unrealistically high-interval seismic velocity for profiles S2, S3 and S4 with thick sediment; hence we use a lower values of k=0.3 km s−1 km−1. Decreasing the k values results in a lower depth-converted thickness of post-rift sediment, which in turn results in a lower estimate of post-rift accommodation space. Our calculation of post-breakup accommodation space is therefore a conservative lower estimate. For simplicity, we used 6.5 km s−1 interval seismic velocity for depth-converting SDRs for all profiles (S1, S2, S3 and S4) to generate the depth sections shown in Fig. 5. McDermott et al. (2019) show a laterally variable “skin” of lower-interval seismic velocity SDRs about 2 km thick above deeper SDRs with 6.5 km s−1. The average interval velocity for the whole SDR pile is therefore slightly less than 6.5 km s−1. Because we only back-strip the post-breakup sediments (and not the SDRs), SDR thickness has no influence on the determined water-loaded post-breakup accommodation space. Errors in the depth conversion of post-rift sediment thickness does affect the magnitude of water-loaded accommodation space determined by flexural back-stripping and decompaction. However, these errors are likely to be consistent between profiles; therefore the relative differences in the determined accommodation space between profiles and our overall observations and interpretations are not changed. The uncertainty in seismic velocity required for depth conversion highlights why we focus in Figs. 4 and 8 on measurements in TWTT; the primary seismic reflection observation is in TWTT, while a depth conversion is a model with often substantial uncertainty.
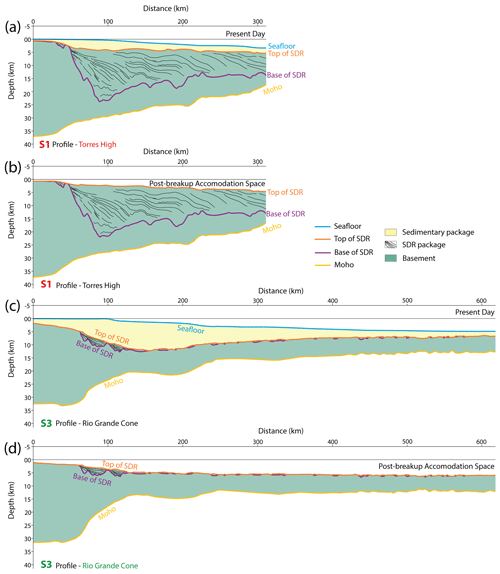
Figure 5(a, c) Comparison of present-day depth-converted sections S1 and S3 showing the interpreted surfaces and corresponding units. (b, d) Comparison of water-loaded post-breakup accommodation space from flexural back-stripping for profiles S1 and S3.
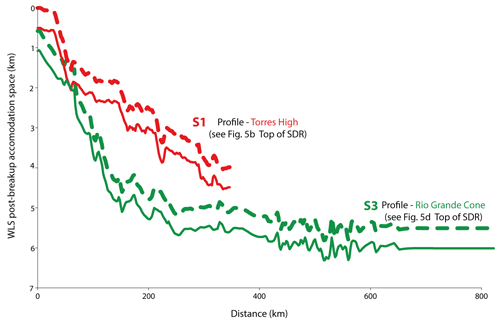
Figure 6Comparison of the water-loaded accommodation space from flexural back-stripping (solid line) for profiles S1 (Torres High) and S3 (Rio Grande Cone). Corresponding water-loaded accommodation space corrected for Oligocene–Miocene dynamic subsidence (dashed line).
Post-rift accommodation space has been determined from the depth-converted sections using 2D flexural back-stripping. This process consists of calculating the isostatic load of sediments and the consequent isostatic lithosphere rebound resulting from the removal of that load. This isostatic rebound is applied to the top basement depth to determine the bathymetry that would exist at present if no post-rift sedimentation had occurred. Note that the result of flexural back-stripping and decompaction is not a restoration to base post-rift; reverse post-rift thermal subsidence is not included. A detailed description of the 2D flexural back-stripping methodology is given in Kusznir et al. (1995) and Roberts et al. (1998). The magnitude of the sediment load depends on the thickness of the sediment and on the density increase with depth due to compaction. We assume that the post-rift sediments are normally pressured and have a shaly sand lithology. Compaction parameters for a shaly sand are used (Sclater and Christie, 1980). The SDRs are assumed to have experienced negligible compaction. Te=3 km is used to define the flexural strength of the lithosphere for the flexural back-stripping for removal of post-rift sediment loading (Roberts et al., 1998). Sensitivity tests to Te are shown in Fig. S1 in the Supplement.
The resulting water load accommodation space for the Torres High and Rio Grande Cone profiles is shown in Fig. 5b and d. These are directly compared in Fig. 6. For the same lateral position, the Rio Grande Cone profile shows significantly more accommodation space than the Torres High profile. While the predicted accommodation space is sensitive to the Te value used in the flexural back-stripping, the significant difference between accommodation post-rift space for the S1 and S3 profiles remains.
The southern South American continental margins and adjacent ocean basins, including the Pelotas margin segment, experienced significant subduction dynamic subsidence in the Cenozoic as a consequence of Andean subduction of Nazca oceanic lithosphere (Martinod et al., 2010; Shephard et al., 2012). This recent dynamic subsidence also contributes to the present-day water-loaded post-rift accommodation space. A correction of 500 m for present-day dynamic subsidence (a probable underestimate) decreases the component of post-rift accommodation space attributable to Cretaceous continental breakup. This component, directly related to the formation of the margin, when corrected for subduction dynamic subduction, is almost twice as large for the magma-normal southern profile (Rio Grande Cone) than for the magma-rich northern profile (Torres High).
The along-strike variation in post-rift accommodation space corrected for Oligocene–Miocene subduction dynamic subsidence is shown in Fig. 7. Both Figs. 6 and 7 show that post-rift accommodation space increases substantially from north to south. This anti-correlation with the decrease in volcanic addition observed from north to south is shown in Figs. 3 and 4.
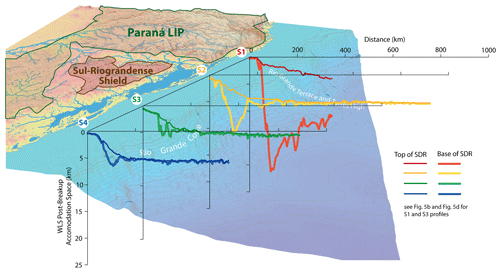
Figure 7Comparison of water-loaded post-rift accommodation space for the four profiles S1–S4 showing north-to-south variation along the Pelotas margin. Profile S1 (Torres High) is offshore the Serra Geral volcanics of the Paraná LIP. Profile S3 is offshore the cratonic lithosphere of the Sul-Riograndense Shield (SRS) where Serra Geral is absent.
5.1 Along-strike variation in magmatic addition along the Pelotas margin
The austral segment of the South Atlantic margin of South America is often assumed to be magma-rich along its whole length; however, our analysis of the seismic reflection in Sects. 3 and 4 (Fig. 3) demonstrates that this is clearly not correct. While the northern profile S1 along the Torres High shows very large thicknesses of volcanic addition indicated by SDR packages up to 20 km thick, the southern profiles S3 and S4 across the central and southern Pelotas margin segments display magmatic thicknesses more consistent with those of a normal margin, with oceanic crustal thickness ∼ 6.5 km (Bown and White, 1994; Dick et al., 2003).
Total magmatic addition on a rifted margin consists of the sum of magmatic intrusives emplaced within and at the base of thinned continental crust (often termed magmatic underplate) and volcanic extrusives. It is not possible to reliably quantify magmatic intrusives using seismic reflection and refraction data because their geophysical properties are similar to those of lower-continental basement rocks (Karner et al., 2021). In our analysis, we use the thicknesses of volcanic extrusives (SDRs) as a proxy for total magmatic volume. Estimates of the ratio of volcanic extrusives to magmatic intrusives/underplate range from approximately 1:2 for the volcanic margins of the Faroe Islands and Hatton Bank (White et al., 2008) to 2:1 for the Demerara Plateau (Gomez-Romeu et al., 2022). In all cases, measured thicknesses of volcanic extrusives represent a lower bound of total magmatic volume.
The north-to-south variation along strike of the volcanic addition seen in Fig. 3 (in TWTT) and Fig. 7 (in depth) can be summarised by plotting the TWTT of the maximum volcanic (SDR) interval against latitude. This north-to-south variation is shown in Fig. 8a and illustrates that the Pelotas margin is clearly not uniformly magma-rich. Within a distance of less than 300 km, volcanic addition varies from extremely magma-rich with SDRs up to 20 km thick for the Torres High profile (S1) to magma-normal for the Rio Grande Cone profile (S3) in the south.
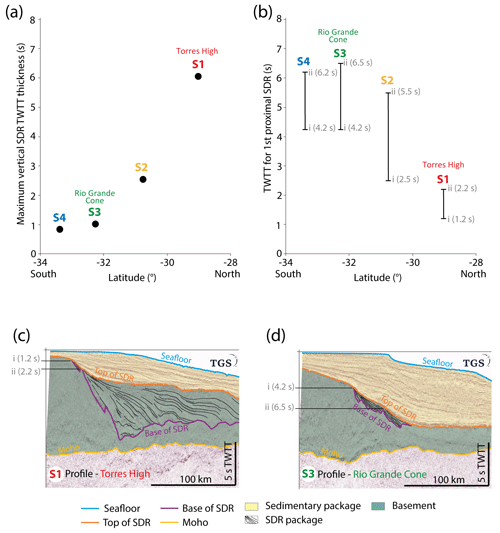
Figure 8(a) Maximum thickness of SDRs in TWTT for profiles S1–S4 plotted against latitude showing a north-to-south decrease. (b) TWTT of the first proximal occurrence of SDRs plotted against latitude showing a north-to-south decrease. (c, d) Comparison of the seismic reflection sections for S1 and S3 in TWTT highlighting the first proximal occurrence of SDRs. Two measurements of the TWTT of first proximal SDRs are shown in panels (b)–(d); (i) denotes the lower value, and (ii) denotes the upper value. See text for a more detailed explanation.
This large variation in extrusive magmatic volumes along the strike of the Pelotas margin is consistent with the observation reported in Sauter et al. (2023). This variation also correlates with the distribution of Serra Geral volcanics (Paraná large igneous province) on land (Figs. 1 and 7). Profiles 3 and 4, with normal magmatic volumes, are located offshore to where the Serra Geral is absent. In contrast, profile S1, which shows the very large SDR thicknesses on the Torres High, is located offshore where the Serra Geral is very thick and reaches the coast. The absence of Serra Geral in central and southern Rio Grande do Sul coincides with the presence of cratonic lithosphere on the Sul-Riograndense Shield (Chemale, 2000). In contrast, on land to the north, the distribution of Serra Geral coincides with that of the Palaeozoic Paraná Basin. As discussed in Sauter et al. (2023), this observed rapid decrease in magmatic volumes along strike may suggest that the large magmatic volumes observed in the north of the Pelotas margin (e.g. Torres High) are generated by a component of mantle inheritance rather than the usually assumed hot mantle plume mechanism alone.
5.2 Along-strike variation in accommodation space as a consequence of magmatic addition
Examination of seismic reflection profiles S1–S4 indicates that there is an inverse correlation of sediment TWTT with SDR TWTT thickness (Fig. 3), as shown in the cross-plot in Fig. 4. Sediment thickness is controlled by many factors, including source area erosion, sediment transport, deposition and preservation. As a consequence, we prefer to examine the lateral along-strike variation in accommodation space rather than sediment thickness. Post-rift (post-SDR) accommodation space, determined using 2D flexural back-stripping, shows large variations along strike (Figs. 5–7), which inversely correlates with the thickness of extrusive volcanics.
During rifting leading to continental breakup, syn-rift subsidence occurs in response to thinning of the continental crust, which is partly offset by thermal uplift from geotherm elevation (McKenzie, 1978). After breakup, re-equilibration of the elevated geotherm results in post-rift thermal subsidence. The amount of accommodation space available for post-rift sedimentation depends on the sum of accommodation space generated by post-rift thermal subsidence and that remaining unfilled from the syn-rift stage.
In the north of the Pelotas margin, where magmatic addition was very large, syn-rift accommodation space was filled by extrusive volcanics producing almost 20 km of SDRs on the Torres High (profile S1). These SDRs have long lateral flow lengths, which are interpreted to indicate that the top of the SDRs were deposited at or above sea level (Mutter et al., 1982; Planke et al., 2000). As a consequence, the accommodation space available for post-rift sedimentation observed today and shown in Figs. 5–7 consists of only that generated by post-rift thermal subsidence. In contrast, in the south of the Pelotas margin (profiles S3 and S4), where magmatic addition is much less, syn-rift accommodation space was underfilled, providing an additional contribution to add to accommodation space generated by post-rift thermal subsidence. As a consequence, more accommodation space is available in the south of the Pelotas margin for sediment deposition above volcanic extrusives. The observed inverse correlation of accommodation space with the thickness of extrusive volcanics can therefore be explained by the control of residual syn-rift accommodation space by the volume of extrusive volcanics. Put simply, syn-rift accommodation space filled by extrusive volcanics is no longer available for post-rift sedimentation.
The Pelotas margin has two major present-day offshore physiographic features: the Torres High in the north (imaged in profile S1) and the Rio Grande Cone in the south (imaged in profile S3). The former exists because of magma-rich breakup generating very thick SDRs, and the latter is located where the breakup occurred with much less magmatic addition and provided a larger amount of accommodation for thick post-rift sedimentation. Both physiographic features control oceanic drifts by deflecting ocean currents, but they have different origins. The variation in magmatic addition along the Pelotas margin exerts a strong control on depositional environments.
5.3 Significance of TWTT depth of first proximal volcanics on seismic reflection sections
Examination of the seismic reflection sections in the time domain shows that the TWTT for the first appearance of proximal SDRs is also very variable. The observed north-to-south variation in TWTT of first volcanics is plotted as a function of latitude in Fig. 8b. For the purpose of showing the uncertainty in the measurement, two measurements of the TWTT of first proximal SDRs are plotted for each profile corresponding to lower and higher measured values. The term SDR sensu stricto simply means “seaward-dipping reflector”, and, while the common use of the term is applied to volcanic seaward-dipping reflectors, seaward-dipping reflectors can also be generated by sedimentary sequences within fault-controlled half-grabens. The lower TWTT values shown in Fig. 8b may correspond to either the onset of volcanics or sedimentary accumulations; their exact nature cannot be reliably determined using the available seismic data alone. In contrast, the higher TWTT values shown in Fig. 8b represent a much more certain measurement for the onset of volcanics. The TWTT of first volcanic SDRs, using either lower or higher measured values, shows an inverse correlation with the magnitude of volcanic addition shown in Fig. 8a.
The lower and higher measurements of first proximal SDRs are shown in Fig. 8c for the magma-rich margin profile S1 over the Torres High in the north and in Fig. 8d for the magma-normal margin profile S3 in the south. For profile S1, TWTT measurements lie in the range of 1.2 to 2.2 s. These values are similar to those reported by Mutter et al. (1982) and Planke et al. (2000) for the long-flow-length SDRs on the Voring segment of the Norwegian margin which formed at or above sea level and have subsequently thermally subsided. For profile S3, TWTT measurements lie in the range 4.2 to 6.5 s, similar to those reported by Planke et al. (2000) and Hinz et al. (1999) for the deep-marine-erupted SDRs on the Exmouth Plateau on the Argentine margins.
We explore this observed inverse correlation using a simple isostatically balanced model of a rifted margin with varying amounts of magmatic addition. The simple model, described in more detail in Chenin et al. (2023), calculates the isostatically balanced crustal cross section for the idealised rifted margin produced by a prescribed thinning taper applied to continental crust and lithosphere and shows the resulting bathymetry, the remaining thickness of the continental crust, and the thickness of the new magmatic addition. The amount of decompression melt is calculated from the thinning-factor taper using a parameterisation of the decompression melt model of White and McKenzie (1989). Isostatically balanced cross sections are produced for thermally re-equilibrated lithosphere and at syn-breakup time by including lithosphere thermal uplift from the syn-tectonic elevated geotherm consistent with McKenzie (1978). Magmatic addition is partitioned into one-third as extrusives overlying the thinned continental crust and two-thirds as intrusives (underplate); in the oceanic domain, these two layers correspond approximately to oceanic layers 2 and 3. The model is used to examine the magma-rich or magma-poor consequences for margin architecture and accommodation space resulting from increasing or decreasing the amount of decompression melt with respect to the 7 km generating normal oceanic crust and also the timing of melt initiation with respect to crustal thinning.
Figure 9 shows isostatically balanced margin cross sections at breakup (with thermal uplift) and full thermal re-equilibration for an idealised margin with normal magmatic addition (left) and magma-rich addition (right). The magma-normal model assumes a maximum of 7 km magmatic addition (forming normal-thickness oceanic crust) with decompression melting starting at β=3, consistent with the decompression melt model of White and McKenzie (1989). The magma-rich model has a maximum magmatic addition of 10 km (producing a 10 km oceanic crust) with decompression melting starting at β=2, with the onset of decompression melting slightly advanced with respect to crustal thinning.
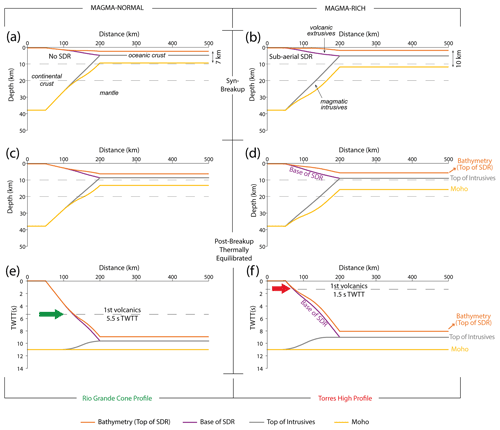
Figure 9Isostatically balanced model cross sections of a rifted margin with varying amounts of magmatic addition. (a, b) At breakup time with syn-rift lithosphere thermal uplift. (c, d) At large post-breakup time with full lithosphere thermal re-equilibration. (e, f) Time domain representation of model cross sections for full lithosphere thermal re-equilibration converted from depth model using the 10 s rule of Warner (1987). The proximal onset of first volcanics is indicated by the coloured arrows. (a, c, e) An idealised margin with normal magmatic addition as for the Rio Grande Cone S3 profile. (b, d, f) An idealised magma-rich margin as for the Torres High S1 profile.
At breakup, the magma-rich model (Fig. 9b) shows the upper surface of proximal volcanics at or above sea level consistent with SDRs with long flow lengths, as seen on the Torres High seismic section S1. In contrast, the normal magmatic addition model (Fig. 9a) shows the upper surface of first volcanics at ∼2 km water depth corresponding to submarine lava flows erupted onto thinned continental crust and consistent with the observation that the tops of distal deep-water SDRs often merge seamlessly with the top of oceanic layer 2 (Hinz et al., 1999). The water depth of first volcanics is controlled by the isostatic consequences of the relative timing of crustal/lithospheric thinning and the onset of melt production by decompression melting (see Chenin et al., 2023). Early melt production relative to crustal/lithospheric thinning reduces the bathymetry of first volcanics. Factors advancing the initiation of melt production with respect to crustal/lithospheric thinning are elevated lithosphere and asthenosphere temperature, inherited lithosphere chemical enrichment, and lithosphere deformation mode (Lu and Huismans, 2021). The corresponding cross sections after thermal re-equilibration and subsidence are shown in Fig. 9c and d.
Warner (1987) observed that the Moho TWTT on marine deep long-offset seismic data was consistently at about 10 s TWTT for thermally equilibrated lithosphere and was remarkably constant (flat) in time irrespective of the complexity of the geology above, including sediment thickness variation. Invoking Warner's 10 s rule for the Moho TWTT for thermally equilibrated lithosphere allows the cross sections shown in Fig. 9c and d to be converted into the time domain as shown in Fig. 9e and f. To do this, basement thickness is converted to interval TWTT (using a basement velocity of 6.5 km s−1) and subtracted from 10 s to give the TWTT of the top basement; this estimate of the TWTT of the top basement is therefore independent of the interval TWTT of bathymetry and post-rift sediments. In the time domain, first volcanics are predicted to occur at ∼1.5 s TWTT for the magma-rich model, while, for the magma-normal magmatic addition model, first volcanics occur at ∼5.5 s. These model predictions are consistent with the observed TWTT of first proximal volcanics between 1.2 to 2.2 s for the Torres High profile (S1) and 4.2 to 6.5 s for the Rio Grande Cone profile (S3) shown in Fig. 8. It should be noted that the model prediction assumes a fully equilibrated lithosphere thermal structure, while the Pelotas margin with Early Cretaceous breakup age is not yet fully re-equilibrated.
A common classification of rifted margins is whether a margin is magma-rich, magma-normal or magma-poor. An obvious approach to distinguishing a magma-rich from a magma-normal margin, or a margin's position in between these two end-members, might appear to be through measurement of the volume of magmatic addition. However, the problem arises, as highlighted by Tugend et al. (2020), that, in practice, thinned continental crust at a rifted margin cannot reliably be distinguished from volcanic extrusives above it and from magmatic intrusives (underplate) below it for reasons explained by Karner et al. (2021). As a consequence, it is not possible to accurately measure the volume of magmatic addition at a rifted margin. Tugend et al. (2020) and Chenin et al. (2023) also show that the relative timing of decompression melting with respect to crustal thinning may be as important as magmatic volume in generating a magma-rich margin. As shown above, the TWTT of first proximal volcanics may represent a practical and efficient method of distinguishing a magma-rich from a magma-normal margin or for placing a margin in between these two end-members.
-
The amount of magmatic addition on the Pelotas margin varies substantially along strike from extremely magma-rich to magma-normal within a distance of ∼300 km.
-
In the north, where the SDR package is thickest, the Torres High shows SDR thicknesses of ∼20 km, and post-breakup water-loaded accommodation space is much less than in the south, where magmatic addition is normal and SDR thicknesses are small.
-
Post-breakup accommodation space correlates inversely with SDR thickness, being less for magma-rich margins and more for magma-normal/intermediate margins.
-
The Rio Grande Cone is underlain by small SDR thicknesses, allowing large post-breakup accommodation space and the accumulation of large sediment thickness.
-
The observed inverse relationship between post-breakup accommodation space and SDR thickness is predicted by a simple isostatic model of continental lithosphere thinning and decompression melting during breakup.
-
In the time domain, a magma-rich margin with sub-aerial SDR flows shows first volcanics between 1.2 to 2.2 s TWTT, while a “normal” magmatic margin has first volcanics between 4.2 and 6.5 TWTT.
-
Our study shows that the TWTT of first volcanics may provide an alternative approach for distinguishing magma-rich margins from margins with normal magmatic addition compared to estimating total magmatic volumes.
-
The methodology that we use in this paper provides a new approach for investigating the complex magmatic and sedimentary evolution of rifted continental margins.
Flexural backstripping code was carried out using Flex-Decomp, commercially available software owned by Badley Geoscience Ltd. The methodology used by the software is described and illustrated in references cited in the text (Kusznir et al., 1995; Roberts et al., 1998).
The seismic reflection cross section images used in this study are the private commercial property of TGS and are not publicly available.
The supplement related to this article is available online at: https://doi.org/10.5194/se-15-1265-2024-supplement.
MC: conceptualisation, seismic interpretation, data analysis, visualisation and writing (original draft and revisions). NK: conceptualisation, seismic interpretation, data analysis, methodology, modelling and writing (original draft and revisions) GM: conceptualisation, seismic interpretation, writing (review and revisions) and funding. DS: conceptualisation, data access, seismic interpretation and writing (review and revisions).
The contact author has declared that none of the authors has any competing interests.
Publisher's note: Copernicus Publications remains neutral with regard to jurisdictional claims made in the text, published maps, institutional affiliations, or any other geographical representation in this paper. While Copernicus Publications makes every effort to include appropriate place names, the final responsibility lies with the authors.
This article is part of the special issue “(D)rifting into the future: the relevance of rifts and divergent margins in the 21st century”. It is not associated with a conference.
We thank TGS for the seismic data supporting this study. The raw data are the private property of TGS, who should be contacted for any lending or acquisition. We also thank colleagues for their comments and discussions.
This research was supported by the M6 project administered by the University of Strasbourg.
This open-access publication was funded by RWTH Aachen University.
This paper was edited by Mohamed Gouiza and reviewed by Valentin Rime and one anonymous referee.
Abreu, V. S. and Anderson, J.B.: Glacial eustasy during the Cenozoic: sequence stratigraphic implications, AAPG Bull., 82, 1385–1400, https://doi.org/10.1306/1D9BCA89-172D-11D7-8645000102C1865D, 1998.
Bown, J. W. and White, R. S.: Variation with spreading rate of oceanic crustal thickness and geochemistry, Earth Planet. Sc. Lett., 121, 435–449, https://doi.org/10.1016/0012-821X(94)90082-5, 1994.
Cassel, M. C., Chemale Jr., F., Vargas, M. R., Souza, M. K., Girelli, T. J., and Oliveira, G. S.: From the Andes and the Drake Passage to the Rio Grande Submarine Fan: paleoclimatic and paleogeographic evidence in the Cenozoic Era from the South Atlantic – Austral Segment, Pelotas Basin, Global Planet. Change, 213, 103838, https://doi.org/10.1016/j.gloplacha.2022.103838, 2022.
Chauvet, F., Sapin, F., Geoffroy, L., Ringenbach, J. C., and Ferry, J. N.: Conjugate volcanic passive margins in the austral segment of the South Atlantic – Architecture and development, Earth-Sci. Rev., 212, 103461, https://doi.org/10.1016/j.earscirev.2020.103461, 2021.
Chemale, F.: Evolução geológica do Escudo Sul-rio-grandense, in: Geologia do Rio Grande do Sul, edited by: Paim, P. S. G., Chemale, F., Lopes, R. C., Holz, M., and De Ros, L. F., Editora UFRGS, Porto Alegre, Universidade Federal do Rio Grande do Sul, Instituto de Gesciencias, 13–52, 2000.
Chenin, P., Tomasi, S., Kusznir, N., and Manatschal, G.: Linking Rifted Margin Crustal Shape with the Timing and Volume of Magmatism, Terra Nova, 36, 53–61, https://doi.org/10.1111/ter.12690, 2023.
Dick, H. J. B., Lin, J., and Schouten, H.: An ultraslow-spreading class of ocean ridge, Nature, 426, 403–412, https://doi.org/10.1038/nature02128, 2003.
Franke, D., Neben, S., Ladage, S., Schreckemberger, B., and Hinz, K.: Margin segmentation and volcano-tectonic architecture along the volcanic margin off Argentina/Uruguay, South Atlantic, Mar. Geol., 244, 46–67, https://doi.org/10.1016/j.margeo.2007.06.009, 2007.
Gomez-Romeu, J., Kusznir, K., Ducoux, M., Jammes, S., Ball, P., Calassou, S., and Masini, E.: Formation of SDRs-Ocean transition at magma-rich rifted margins: Significance of a mantle seismic reflector at the western Demerara margin, Tectonophysics, 84520, 229624, https://doi.org/10.1016/j.tecto.2022.229624, 2022.
Graca, M. C., Kusznir, N., and Stanton, N.: Crustal thickness mapping of the central South Atlantic and the geodynamic development of the Rio Grande Rise and Walvis Ridge, Mar. Petrol. Geol., 101, 230–242, https://doi.org/10.1016/j.marpetgeo.2018.12.011, 2019.
Harkin, C., Kusznir, N., Roberts, A., Manatschal, G., and Horn, B.: Origin, composition and relative timing of seaward dipping reflectors on the Pelotas rifted margin, Mar. Petrol. Geol., 114, 104235, https://doi.org/10.1016/j.marpetgeo.2020.104235, 2020.
Heilbron, M., Valeriano, C. M., Tassinari, C. C. G., Almeida, J., Tupinambá, M., Siga Jr., O., and Trouw, R.: Correlation of Neoproterozoic terranes between the Ribeira Belt, SE Brazil and its African counterpart: comparative tectonic evolution and open questions, in: West Gondwana: Pre-cenozoic Correlations Across the South Atlantic Region, Special Publications, 294, edited by: Pankhurst, R. J., Trouw, R. A. J., Brito Neves, B. B., and De Wit, M. J., Geological Society, London, 211–237, https://doi.org/10.1144/SP294.12, 2008.
Hinz, K., Neben, S., Schreckenberger, B., Roeser, H. A., Block, M., Goncalves de Souza, K., and Meyer, H.: The Argentine continental margin north of 48° S: sedimentary successions, volcanic activity during breakup, Mar. Petrol. Geol., 16, 1–25, https://doi.org/10.1016/S0264-8172(98)00060-9, 1999.
Karner, G. D., Johnson, C., Shoffner, J., Lawson, M., Sullivan, M., Sitgreaves, J., McHarge, J., Stewart, J., and Figueredo, P.: Tectono-Magmatic Development of the Santos and Campos Basins, Offshore Brazil, in: The Supergiant Lower Cretaceous Pre-Salt Petroleum Systems of the Santos Basin, Brazil, edited by: Mello, M. R., Yilmaz, P. O., and Katz, B. J., AAPG Memoir, 124, 215–256, 2021.
Koopmann, H., Brune, S., Franke, D., and Breuer, S.: Linking rift propagation barriers to excess magmatism at volcanic rifted margins, Geology, 42, 1071–1074, https://doi.org/10.1130/G36085.1, 2014.
Kusznir, N. J., Roberts, A., and Morley, C.: Forward and reverse modelling of rift basin formation, in: Hydrocarbon Habitat in Rift Basins, Special Publications, 80, edited by: Lambiase, J., Geological Society, London, 33–56, https://doi.org/10.1144/GSL.SP.1995.080.01.02, 1995.
Lu, G. and Huismans, R. S.: Melt volume at Atlantic volcanic rifted margins controlled by depth-dependent extension and mantle temperature, Nat. Commun., 12, 1–10, https://doi.org/10.1038/s41467-021-23981-5, 2021.
Martinod, J., Husson, L., Roperch, P., and Guillaume, B.: Horizontal subduction zones, convergence velocity and the building of the Andes, Earth Planet. Sc. Lett., 299, 299–309, https://doi.org/10.1016/j.epsl.2010.09.010, 2010.
McDermott, C., Collier, J. S., Lonergan, L., Fruehn, J., and Bellingham, P.: Seismic velocity structure of seaward-dipping reflectors on the South American continental margin, Earth Planet. Sc. Lett., 521, 14–24, https://doi.org/10.1016/j.epsl.2019.05.049, 2019.
McKenzie, D. P.: Some remarks on the development of sedimentary basins, Earth Planet. Sc. Lett., 40, 25–32, https://doi.org/10.1016/0012-821X(78)90071-7, 1978.
Mutter, J. C., Talwani, M., and Stoffa, P. L.: Origin of seaward-dipping reflectors in oceanic crust off the Norwegian margin by “subaerial sea-floor spreading”, Geology, 10, 353–357, https://doi.org/10.1130/0091-7613(1982)10<353:OOSRIO>2.0.CO;2, 1982.
Peace, A. L., Phethan, J. J. J., Frande, D., Foulger, G. R., Schiffer, C., Welford, J. K., McaHone, G., Rocchi, S., Schabel, M., and Doré, A. G.: A review of Pangaea dispersal and Large Igneous Provinces – In search of a causative mechanism, Earth-Sci. Rev., 206, 102902, https://doi.org/10.1016/j.earscirev.2019.102902, 2020.
Planke, S., Symonds, P. A., Alvestad, E., and Skogseid, J.: Seismic volcanostratigraphy of large-volume basaltic extrusive complexes on rifted margins, J. Geophys., Res., 105, 19335–19352, https://doi.org/10.1029/1999JB900005, 2000.
Roberts, A. M., Kusznir, N. J., Yielding, G., and Styles, P.: 2D flexural backstripping of extensional basins: the need for a sideways glance, Petrol. Geosci., 4, 327–338, https://doi.org/10.1144/petgeo.4.4.327, 1998.
Rossetti, L., Lima, E. F., Waichel, B. L., Hole, M. J., Simoes, M. S., and Scherer, C. M. S.: Lithostratigraphy and volcanology of the Serra Geral Group, Paraná-Etendeka Igneous Province in Southern Brazil: Towards a formal stratigraphical framework, J. Volcanol. Geoth. Res., 355, 98–114, https://doi.org/10.1016/j.jvolgeores.2017.05.008, 2018.
Sapin, F., Ringenbach, J. C., and Clerc, C.: Rifted margins classification and forcing parameters, Sci. Rep., 11, 8199, https://doi.org/10.1038/s41598-021-87648-3, 2021.
Sauter, D., Manatschal, G., Kusznir, N., Masquelet, C., Werner, P., Ulrich, M., Bellingham, P., Franke, D., and Autin, J.: Ignition of the southern Atlantic seafloor spreading machine without hot-mantle booster, Sci. Rep., 13, 1195, https://doi.org/10.1038/s41598-023-28364-y, 2023.
Sclater, J. G. and Christie, P. A. F.: Continental Stretching: an explanation of the post mid-Cretaceous subsidence of the Central North Sea Basin, J. Geophys. Res., 85, 3711–3739, https://doi.org/10.1029/JB085iB07p03711, 1980.
Shephard, G. E., Liu, L., Müller, R. D., and Gurnis, M.: Dynamic topography and anomalously negative residual depth of the Argentine Basin, Gondwana Res., 22, 658–663, https://doi.org/10.1016/j.gr.2011.12.005, 2012.
Stica, J. M., Zalán, P. V., and Ferrari, A. L.: The evolution of rifting on the volcanic margin of the Pelotas Basin and the contextualization of the Paraná-Etendeka LIP in the separation of Gondwana in the South Atlantic, Mar. Petrol. Geol., 50, 1–21, https://doi.org/10.1016/j.marpetgeo.2013.10.015, 2014.
Thompson, R. N., Gibson, S. A., Dickin, A. P., and Smith, P. M.: Early Cretaceous Basalt and Picrite Dykes of the Southern Etendeka Region, NW Namibia: Windows into the Role of the Tristan Mantle Plume in Paraná–Etendeka Magmatism, J. Petrol., 42, 2049–2081, https://doi.org/10.1093/petrology/42.11.2049, 2001.
Tugend, J., Gillard, M., Manatschal, G., Nirrengarten, M., Harkin, C., Epin, M. E., Sauter, D., Autin, J., Kusznir, N., and McDermott, K.: Reappraisal of the magma-rich versus magma-poor rifted margin archetypes, Geol. Soc. Lond. Spec. Publ., 476, 23–47, https://doi.org/10.1144/SP476.9, 2020.
Warner, M. R.: Seismic reflections from the Moho – the effect of isostasy, Geophys. J. Int., 88, 425–435, https://doi.org/10.1111/j.1365-246X.1987.tb06651.x, 1987.
White, R. S. and McKenzie, D.: Magmatism at Rift Zones the Generation of Volcanic Continental Margins and Flood Basalts, J. Geophys. Res., 94, 7685–7730, https://doi.org/10.1029/JB094iB06p07685, 1989.
White, R. S., Smith, L. K., Roberts, A. W., Christie, P. A. F, Kusznir, N. J., Roberts, A. M., Healy, D., Spitzer, R., Chappell, A., Eccles, J. D., Fletcher, R., Hurst, N., Lunnon, Z., Parkin, C. J., and Tymms, V. J.: Lower-crustal intrusion on the North Atlantic continental margin, Nature, 452, 460–464, https://doi.org/10.1038/nature06687, 2008.
Zalán, P. V.: Evolução Fanerozóica das Bacias Sedimentares Brasileiras, in: Geologia do Continente Sul-Americano e Evolução da Obra de Fernando Flávio Marques de Almeida, edited by: Mantesso-Neto, V., Bartorelli, A., Carneiro, C. D. R., and Brito-Neves, B. B., Beca Produções Culturais Ltda, São Paulo, 595–612, ISBN 13 978-8587256454, 2004.
- Abstract
- Introduction
- Geological setting
- Along-strike variation in volcanic addition and post-breakup sediment thickness
- Variation in post-breakup accommodation space and dependency on volcanic addition
- Discussion
- Summary
- Code availability
- Data availability
- Author contributions
- Competing interests
- Disclaimer
- Special issue statement
- Acknowledgements
- Financial support
- Review statement
- References
- Supplement


