the Creative Commons Attribution 4.0 License.
the Creative Commons Attribution 4.0 License.
 | 07 Feb 2024
Subduction plate interface shear stress associated with rapid subduction at deep slow earthquake depths: example from the Sanbagawa belt, southwestern Japan
Yukinojo Koyama
Simon R. Wallis
Takayoshi Nagaya
Maximum shear stress along an active deformation zone marking the subduction plate interface is important for understanding earthquake phenomena and is an important input parameter in subduction zone thermomechanical modeling. However, such maximum shear stress is difficult to measure directly at depths more than a few kilometers and is generally estimated by simulation using a range of input parameters with large associated uncertainties. In addition, estimated values generally represent maximum shear stress conditions over short observation timescales, which may not be directly applicable to long-timescale subduction zone modeling. Rocks originally located deep in subduction zones can record information about deformation processes, including maximum shear stress conditions, occurring in regions that cannot be directly accessed. The estimated maximum shear stress is likely to be representative of maximum shear stress experienced over geological timescales and be suitable to use in subduction zone modeling over timescales of millions to tens of millions of years. In this study, we estimated maximum shear stress along a subduction plate interface by using samples from the Sanbagawa metamorphic belt of southwestern (SW) Japan, in which slivers of mantle-wedge-derived serpentinite are widely distributed and in direct contact with metasedimentary rocks derived from the subducted oceanic plate. These areas can be related to the zone of active deformation along the subduction plate interface.
To obtain estimates of maximum shear stress at the subduction interface, we focused on the microstructure of quartz-rich metamorphic rocks – quartz is the main component of the rocks we collected and its deformation stress is assumed to be roughly representative of the stress experienced by the surrounding rock and plate interface deformation zone. Maximum shear stress was calculated by applying deformation temperatures estimated by the crystallographic orientation of quartz (the quartz c-axis fabric opening-angle thermometer) and the apparent grain size of dynamically recrystallized quartz in a thin section to an appropriate piezometer. Combined with information on sample deformation depth, estimated from the P–T (pressure–temperature) path and deformation temperatures, it is suggested that there was nearly constant maximum shear stress of 15–41 MPa in the depth range of about 15–30 km, assuming plane stress conditions even when uncertainties related to the measurement direction of thin section and piezometer differences are included.
The Sanbagawa belt formed in a warm subduction zone. Deep slow earthquakes are commonly observed in modern-day warm subduction zones such as SW Japan, which has a similar thermal structure to the Sanbagawa belt. In addition, deep slow earthquakes are commonly observed to be concentrated in a domain under the shallow part of the mantle wedge. Samples showed the depth conditions near the mantle wedge, suggesting that these samples were formed in a region with features similar to the deep slow earthquake domain. Estimated maximum shear stress may not only be useful for long-timescale subduction zone modeling but also represent the initial conditions from which slow earthquakes in the same domain nucleated.
- Article
(14414 KB) - Full-text XML
-
Supplement
(4435 KB) - BibTeX
- EndNote


Knowledge about the distribution and values of maximum shear stress along an active zone of deformation along the subduction plate interface (plate interface in this paper) is fundamental to understanding seismic phenomena and the thermal evolution of subduction zones: earthquakes along a plate interface occur when the shear stress on a fault plane exceeds the shear strength (e.g., Vavryčuk, 2015), and frictional heating increases with increasing maximum shear stress, which can significantly affect the thermal structure of subduction zones (e.g., Ishii and Wallis, 2020). Recently, it has also been suggested that for the same material and fault plane the initial maximum shear stress values significantly affect slip rates, rupture rates, and stress drop values (Passelègue et al., 2020).
However, direct measurement of maximum shear stress at plate interfaces is difficult, and the associated strength along the subduction plate interface is not well known. Estimates of maximum shear stress can be obtained by direct measurement of borehole breakouts and drilling-induced tensile fractures (e.g., Chang et al., 2010; Lin, 2014). However, such techniques are limited to relatively shallow areas with depths of up to a few kilometers. At greater depths, friction coefficients (shear strength) and maximum shear stress have been estimated from subduction plate interface simulation using surface heat flow, friction law, and flow law combined with thermal modeling (e.g., Gao and Wang, 2014; England, 2018). A difficulty encountered when using surface heat flow is its strong local scatter due to bottom-water temperature variations, the influence of localized fluid flow, and other upper-crustal processes (e.g., Gao and Wang, 2014; England, 2018; Ishii and Wallis, 2020). As an example, Gao and Wang (2014) modeled maximum shear stress along the Kamchatka subduction plate interface and concluded that the average effective coefficient of friction lies within the range 0.03–0.09 with the uncertainties largely due to the large scatter in the heat flow values related to variations in bottom-water temperature. The uncertainties yield a correspondingly large range in estimates for the maximum estimated maximum shear stress of about double the minimum estimated value (Fig. S4 in Gao and Wang, 2014). In addition, features such as the thickness of the plate interface and the parameters that make up the flow law are generally not well constrained, and these also affect the results. These issues can lead to order-of-magnitude uncertainties in estimates of maximum shear stress and strength. Stress inversion using seismic data has also been used to estimate the strength of the subduction boundary and the surrounding crust (e.g., Yoshida et al., 2015). However, this approach is limited to the brittle deformation domain and it is difficult to obtain values for absolute stress. A further issue is that any stresses obtained from the above approaches are only representative of the observation period. When stresses are used in a model, ideally, they should be estimated on a timescale appropriate for the phenomenon being examined. However, the timescales of observation and the modeled phenomena are commonly very different. For instance, stresses estimated from seismic data represent timescales several orders of magnitude shorter than the thermal evolution of a subduction zone which develops over timescales of millions to several tens of millions of years.
The study of rocks that were once distributed along the plate interface is one of the key ways to obtain information along deeper inaccessible parts of subduction zones. The most reliable and widely used differential (maximum shear) stress indicator in such rocks is based on grain size measurements, and this technique is referred to as piezometry (e.g., Twiss, 1977, 1980; Derby, 1991; Stipp and Tullis, 2003; Shimizu, 2008, 2012; Cross et al., 2017; Goddard et al., 2020). The relationships used in piezometry express the dynamically recrystallized grain size of a particular mineral as a function of deformation temperature and applied differential stress. Differential stress is the cause of non-volumetric strain and is defined as the difference between the greatest and least principal stress. Maximum shear stress is equal to half the differential stress. Most piezometers are calibrated based on deformation experiments that use uniaxial compressive stress states. However, most naturally deformed rocks show approximately plane strain, suggesting deformation under plane stress conditions. Maximum shear stress required to deform a material under uniaxial conditions can be converted to the maximum shear stress required under plane stress conditions using properties of the deviatoric stress tensor (see Appendix B).
If it is assumed that the plate motion causes the material in the plate boundary region to deform by simple shear, the thickness of the subduction zone is w (we assume 100 m to 10 km), and the subduction rate is v (we assume 3 cm yr−1), then the strain rate of rocks along the subduction interface can be calculated as to 10−11 s−1. Dynamic recrystallization requires strains of at least 0.2 (e.g., Stipp and Tullis, 2003). In this situation, the time required for dynamic recrystallization is about 0.01–1 million years. Therefore, obtained stress values can be regarded as representative of the stress state over a period of at least 0.01–1 million years and are more appropriate for considering the geological timescale evolution of subduction zones compared with stress values obtained by drilling or thermal observations.
In this study, we applied piezometers to dynamically recrystallized quartz grains observed in rocks (quartz, pelitic, and psammitic schist) of the subduction-type Sanbagawa belt in SW Japan to estimate differential (maximum shear) stress along the subduction zone plate interface. In the Sanbagawa belt, slivers and blocks of mantle-wedge-derived serpentinite are widely distributed and in direct contact with sedimentary rocks derived from the subducted oceanic plate. These areas can be related to an ancient subduction plate interface (Aoya et al., 2013a). We found that there was no clear correlation between the deformation depth and differential (maximum shear) stress in the depth range of 17–27 km along the subduction zone plate interface, and differential (maximum shear) stress at this depth range was almost constant. This result contrasts with a previous study (Takeshita, 2021), which proposes a trend of decreasing differential stress with increasing metamorphic temperature and pressure. This difference may be due to the fact that Takeshita (2021) did not consider the temperature dependence in the piezometer. This temperature dependence reflects a balance between recrystallized grain nucleation and migration of grain boundaries. We estimated deformation temperatures using an empirical relationship between quartz c-axis orientation patterns and deformation temperatures, and we selected samples appropriate for discussions of the deformation along the subduction plate interface. In this study, we focus on the relationship between the differential (and maximum shear) stress and the stress state along the subduction plate interface. This is also in contrast to Takeshita (2021), who focuses on the relationship between the obtained stress values and exhumation processes.
Our study shows that the Sanbagawa belt is not only useful for long-timescale subduction zone modeling but also suitable to study deep slow earthquakes, and the estimated differential (maximum shear) stress likely represents the initial conditions under which slow earthquakes in the same domain nucleated.
2.1 The Sanbagawa belt
The Sanbagawa belt is a belt of high-P (pressure) subduction-type metamorphism developed in the eastern Asian convergent margin during the Cretaceous (Isozaki and Itaya, 1990; Wallis et al., 2009) and is now exposed over a distance of about 800 km from east to west in southwestern (SW) Japan. The widest range of metamorphic conditions is shown by rocks in central Shikoku and this area was chosen for more detailed study (Fig. 1a). The Sanbagawa belt is bounded to the north by a major tectonic discontinuity, the Median Tectonic Line (MTL), and in central Shikoku the southern boundary of the Sanbagawa belt is marked by the presence of significantly older units, the Kinouzu (psammitic schist, pelitic schist, quartz schist, calcareous schist, and mafic schist: Aoya et al., 2013b; Endo and Yokoyama, 2019) and Mikabu units (metachert, metabasalt, metagabbro, volcaniclastic rock, and ultramafic rocks: Aoya et al., 2013b; Endo and Yokoyama, 2019), which have undergone the Sanbagawa metamorphism but represent a tectonically distinct structurally overlying domain and are interpreted as part of the original hanging wall to the Sanbagawa subduction complex (Endo and Wallis, 2017).
Three distinct geological units can be defined within the Sanbagawa belt of central Shikoku. The eclogite unit (pelitic schist, quartz schist, mafic schist, marble, pelitic–psammitic gneiss, siliceous gneiss, mafic gneiss, metagabbro, diopside hornblende rock, and ultramafic rocks: Aoya et al., 2013b; Endo and Yokoyama, 2019) is located at the highest structural level (Aoya et al., 2013a) and underwent eclogite facies metamorphism at 89–88 Ma (Wallis et al., 2009). Parts of this unit are distinctly coarser-grained and show early Cretaceous (about 120 Ma) metamorphic ages (Okamoto et al., 2004; Endo et al., 2009). The Shirataki unit (pelitic schist, psammitic schist, quartz schist, mafic schist, metagabbro, and ultramafic rocks: Aoya et al., 2013b; Endo and Yokoyama, 2019), the subject of this study, structurally underlies the eclogite unit. Buoyancy-driven rise of the eclogite unit within the subduction boundary domain is thought to have emplaced it above the Shirataki unit (Aoya, 2001; Endo et al., 2012; Aoya and Endo, 2017). After the eclogite unit was juxtaposed with the subducting Shirataki unit within the subduction boundary, they underwent the same metamorphism at 89 to 85 Ma (Endo et al., 2012). This metamorphism overprints the eclogite metamorphism and is referred to as the main metamorphic stage. The Oboke unit (psammitic schist and pelitic schist: Aoya et al., 2013b; Endo and Yokoyama, 2019) represents the lowest structural level of the Sanbagawa metamorphic belt. The Shirataki unit has been thrust over the Oboke unit (Wallis, 1998).
As a result of the main metamorphic stage, we can identify four metamorphic zones based on constituent minerals in metapelite (Higashino, 1990; Fig. 1a). These mineral zones can be related to the depth at which the metamorphism occurred. In order of increasing grade and their estimated peak metamorphic temperature and pressure, these zones are the chlorite zone (<360 ∘C, 0.5–0.6 GPa), garnet zone (440±15 ∘C, 0.7–0.8 GPa), albite–biotite zone (520±25 ∘C, 0.8–0.9 GPa), and oligoclase–biotite zone (610±20 ∘C, 0.9–1.1 GPa) (Enami et al., 1994; Fig. 2a). The metamorphic zones are generally E–W-oriented, with the highest metamorphic temperature and pressure conditions found at the highest structural levels. In central Shikoku, the isograds have been tightly folded (e.g., Wallis et al., 1992; Mori and Wallis, 2010; Kouketsu et al., 2021), and the highest-grade units are locally found at intermediate structural levels, from which the temperature and pressure conditions decrease both to the north and south (Fig. 1). The deformation that caused this recumbent folding occurred after the peak of the main metamorphic stage; it is referred to as Ds following Wallis (1990) and is described in more detail below.
2.2 Deformation of Shirataki unit during the main metamorphic stage
In this study, our main focus is the ductile deformation in the Shirataki unit. The Shirataki unit is composed of subducted oceanic crust with basalt, chert, sandstone, and mudstone metamorphosed into mafic (basic), quartz, psammitic, and pelitic schist (Mori and Wallis, 2010; Figs. 1b, 3). There are also rare but widely dispersed ultramafic bodies (Figs. 1b, 3). Ultramafic bodies are mantle-wedge-derived rock bodies and differ in origin from schist derived from subducted material. It is suggested that the rocks of the garnet to oligoclase–biotite zone were subducted to depths below the Moho boundary and the hanging-wall mantle became tectonically entrained in these rocks (Aoya et al., 2013a).
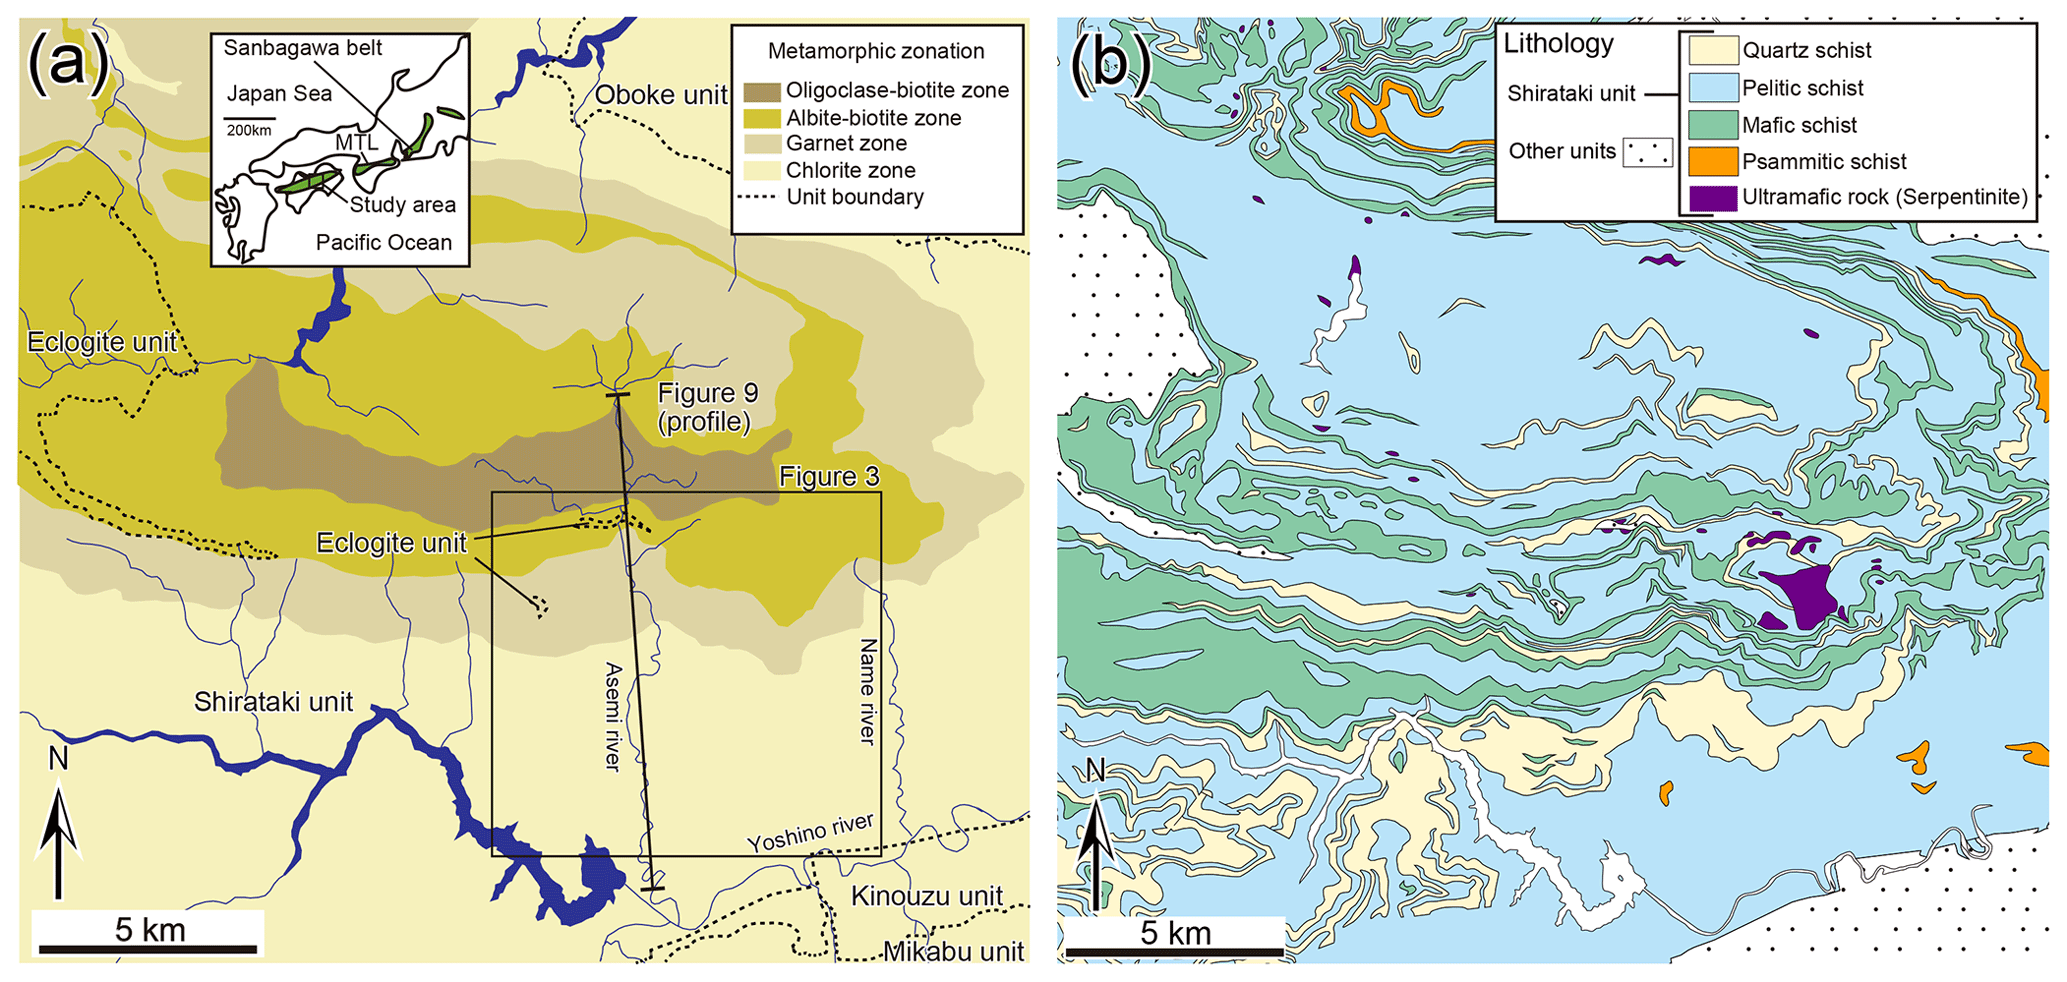
Figure 1(a) Location, geological units, and metamorphic zonation map of the Sanbagawa metamorphic belt in central Shikoku (after Kouketsu et al., 2021; Hara et al., 2018; Aoya et al., 2013b; Endo et al., 2018; Higashino, 1990). (b) Geological map of the Shirataki unit (after Endo and Yokoyama, 2019; Hara et al., 2018).
Each of the four metamorphic zones formed by the main metamorphic stage has a distinct P–T (pressure–temperature) path (Fig. 2a). Moreover, the rocks in all metamorphic zones show evidence of four phases of ductile deformation, named Dr (burial), Ds (exhumation starting at near the peak metamorphic conditions), Dt (exhumation after the peak metamorphic condition), and Du (slight burial after exhumation) deformation, respectively (Wallis, 1990; Fig. 2b, c). Dt and Du are non-penetrative and it is unlikely they had a major influence on exhumation or burial. Dr deformation is locally the main deformation phase, particularly in the high-temperature–pressure zone (i.e., oligoclase–biotite zone), but in most cases, the main high-strain deformation structures are due to Ds deformation, and Dr deformation is preserved mainly as inclusion trails in albite porphyroblasts representing Sr foliation (Mori and Wallis, 2010), which has been strongly overprinted. The lack of compositional zoning of hornblende, barroisite, or glaucophane cores to actinolite–winchite rims for grains of amphibole contained in the core of the albite porphyroblasts (preserving Dr deformation features) in hematite-bearing metabasite indicates that the Dr deformation was formed during the burial phase related to subduction (Wallis et al., 1992). The Ds deformation (D1 and D2 deformation in Banno and Sakai, 1989) is characterized by an overall gently north-dipping Ss foliation (Fig. 3; Aoya et al., 2013b) and a generally WNW–ESE-oriented orogen oblique stretching lineation (Aoya et al., 2013b; L1 lineation in Banno and Sakai, 1989; Faure, 1985). The Ds deformation is considered to have occurred close to or shortly after the peak temperature condition because metamorphic isograd surfaces were folded in this phase (Kouketsu et al., 2021; including the recumbent fold described above). However, amphibole formed at the highest temperatures (barroisite or hornblende) in the porphyroblasts rim (formed during Ds deformation) and compositional changes in Na-pyroxene in equilibrium with quartz and albite of the garnet zone suggest that some of the Ds deformation occurred during a pressure drop and temperature increase, i.e., before the peak metamorphic temperature was reached (Wallis et al., 1992; Enami et al., 1994). Dt and Du deformation are identified where the Ss foliation is folded (Wallis et al., 1992; Fig. 3). Both structures have E–W-oriented fold axes, but the Dt deformation is distinguished by axial surfaces that dip gently to the north, while the Du deformation is distinguished by fold axial surfaces that are nearly vertical (Wallis, 1990; D3 folds in Banno and Sakai, 1989).
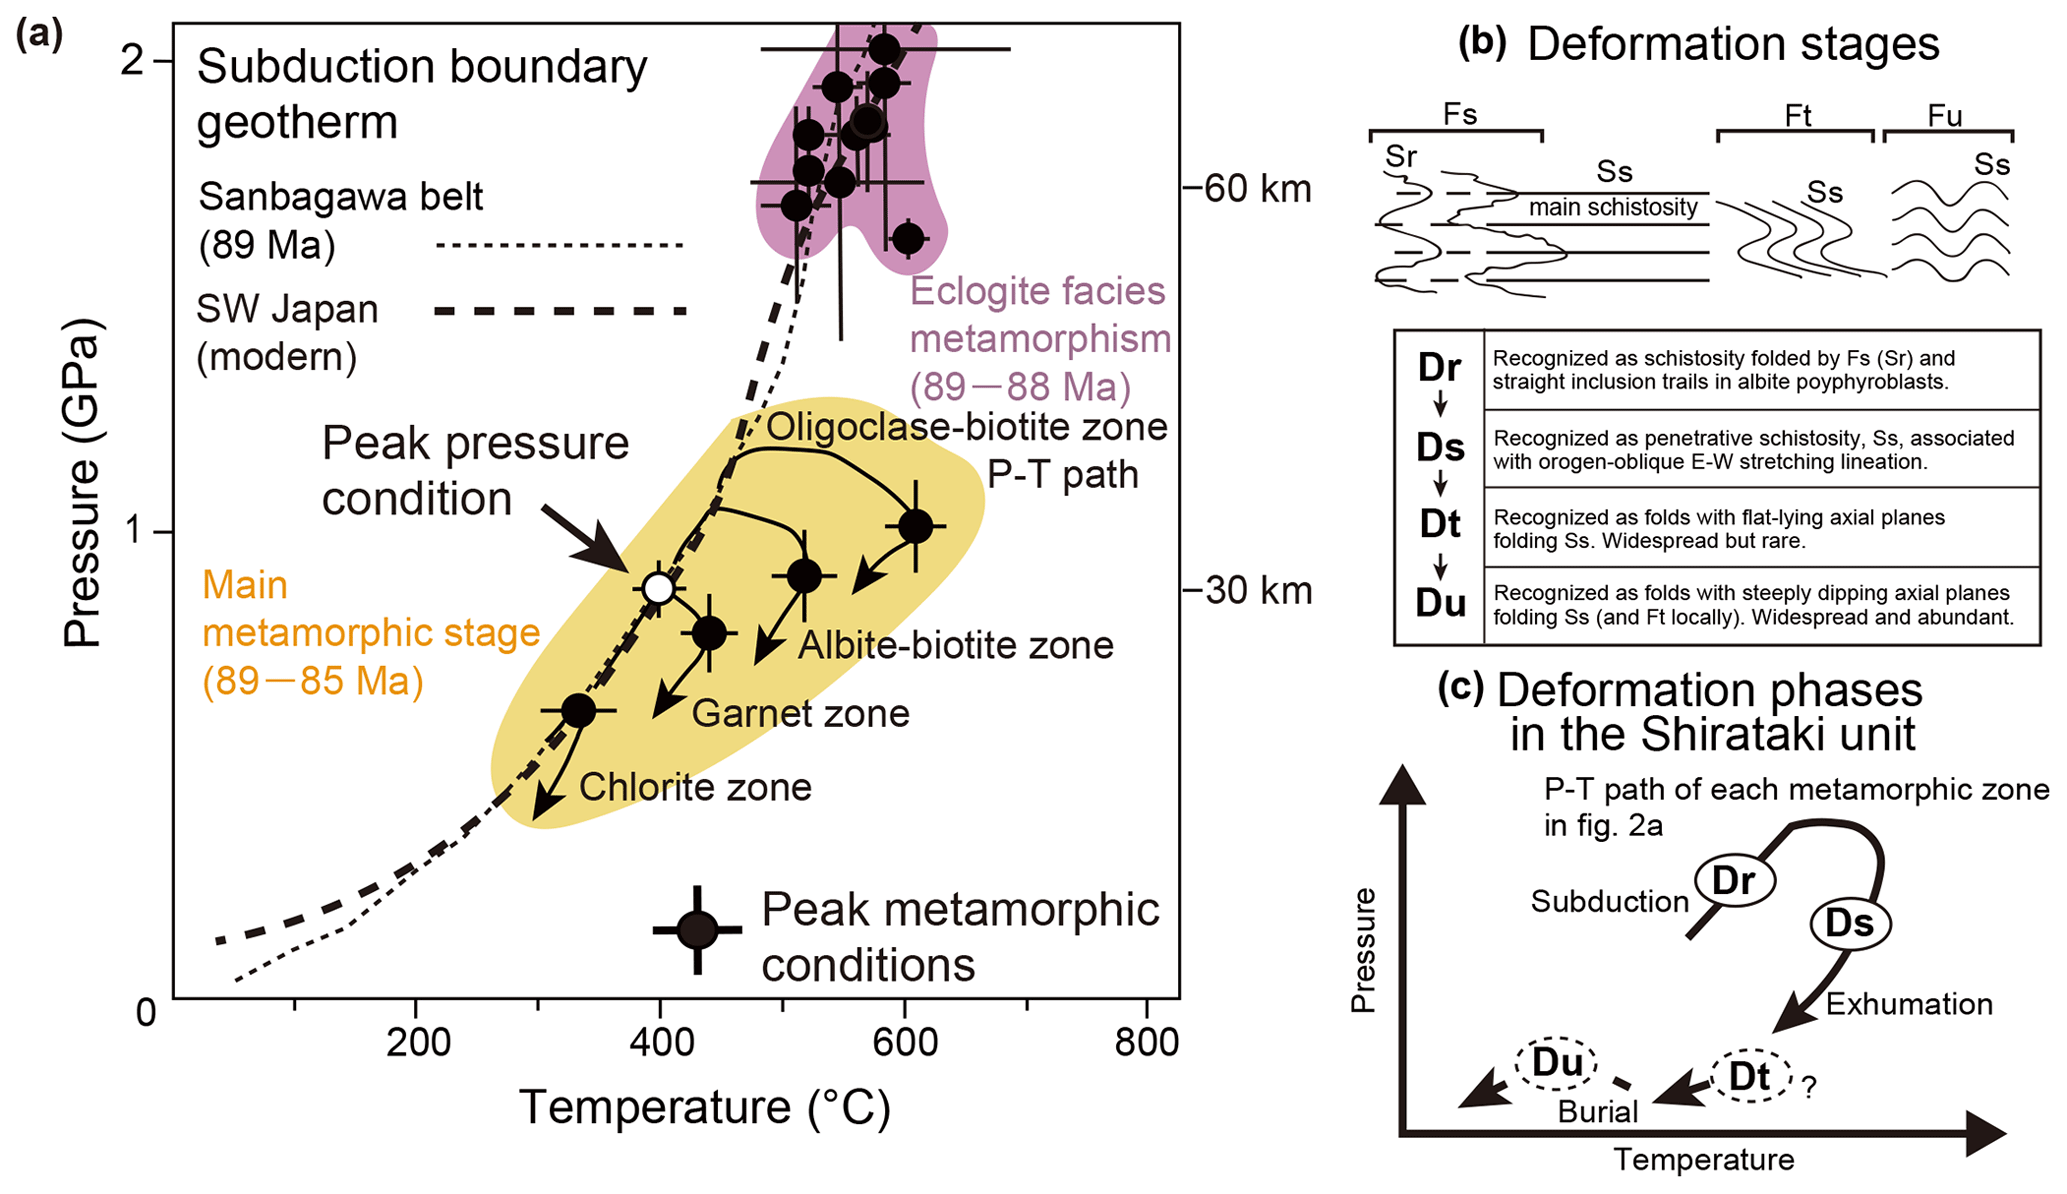
Figure 2(a) Petrographically derived P–T conditions of the Sanbagawa metamorphic belt (black and white circles: Aoya et al., 2017). The thin dashed line represents the subduction boundary geotherm at ca. 89 Ma from P–T estimates (Aoya and Endo, 2017; Aoya et al., 2017). The bold dashed line represents the inferred subduction boundary geotherm for modern-day SW Japan based on thermal modeling by Yoshioka and Murakami (2007). (b) Summary of deformation stages and their associated structures in the Shirataki unit based on Wallis et al. (1992) and Aoya (2001, 2002) modified by Kouketsu et al. (2021). (c) Deformation phases in the Shirataki unit (after Kouketsu et al., 2021). This P–T path corresponds to each metamorphic zone P–T path in the main metamorphism in Fig. 2a.
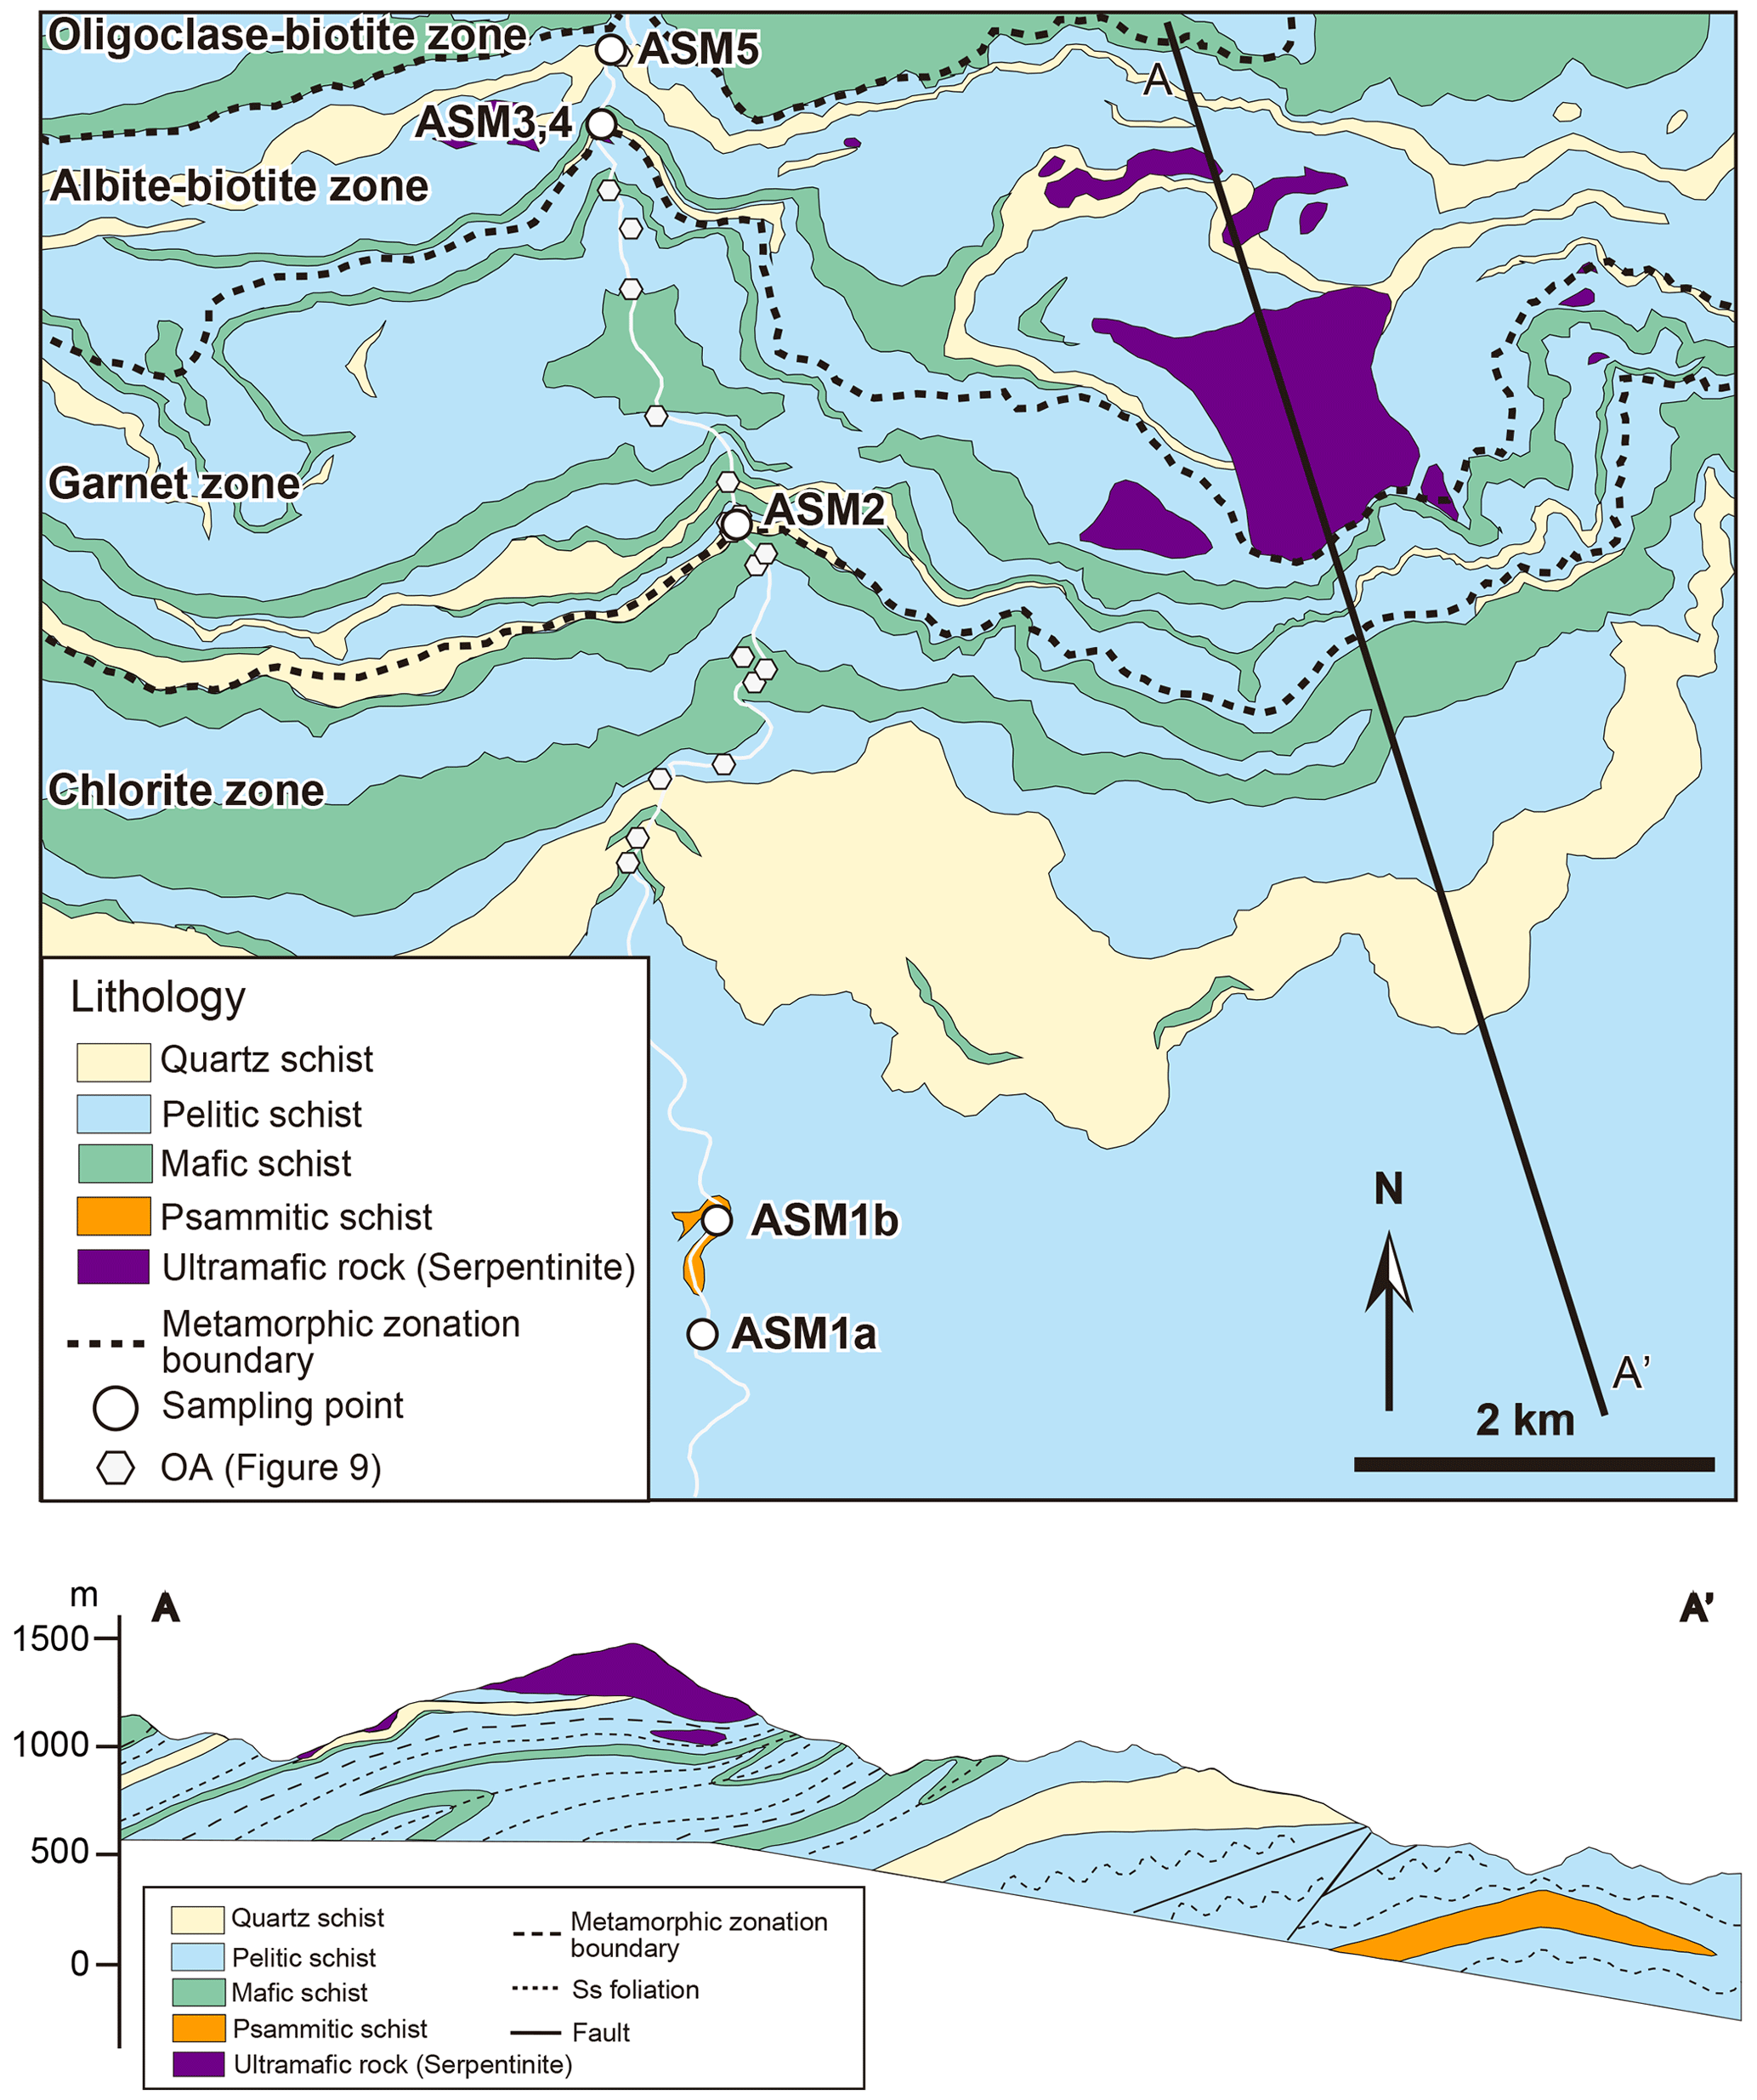
Figure 3Geological map, cross-section, and metamorphic zonation of study area, with sampling and data points (after Endo and Yokoyama, 2019).
As mentioned above, when the Ds deformation occurred, the Sanbagawa belt was exhuming. However, the orogen-oblique stretching lineation of the Ds deformation is thought to reflect deformation closely related to rapid (24 cm yr−1: Engebretson et al., 1985; Ishii and Wallis, 2020) and oblique subduction of the subducted Izanagi Plate (e.g., Wallis, 1992; Wallis et al., 2009). Moreover, if deformation of subducted sediments was driven by a combination of Couette flow (simple shear) driven by the subducting plate and Poiseulle flow (channelized flow) driven by a pressure gradient produced by the buoyancy of the subducted sediment (e.g., Fig. 4 in Platt et al., 2018), it is possible that exhumation of these rocks is associated with stable subduction. In this case, what we observed can be the area close to the overriding plate within the plate boundary domain. In addition, Ds structures are also the most widely developed in the Sanbagawa belt (Fig. 3). Therefore, this study focuses on the deformation structures associated with Ds deformation to discuss the deformation along the subduction plate interface.
3.1 Sampling and preparation for analysis
Samples were collected from quartz-rich metamorphic rocks (Fig. 3). The orientations of the z axes of finite strain were taken to be normal to the Ds foliation. The orientations of the x and y axes were taken to lie within the Ds foliation, the x axes were taken to be parallel to the Ds stretching lineation, and the y axes were taken to be perpendicular to the Ds stretching direction. Thin sections were prepared from chips cut parallel to the z axis and polished using a series of alundum types with decreasing grain sizes of 180 (about 80 µm), 320 (about 50 µm), 800 (about 20 µm), 2000 (about 7.5 µm), and 3000 (about 5 µm) as well as a series of diamond pastes with grain sizes of 3, 1, and 0.25 µm. After this sequence of polishing, the thin sections were further treated with colloidal silica to remove the surface damage zone before they were suitable for electron backscatter diffraction (EBSD) measurements as discussed below. Each phase of polishing took 30–120 min, which depends on the surface condition of the thin section. Constituent minerals were identified using a polarizing microscope and a DXR3 Raman microscope (Thermo Fisher Scientific) with DXR 532 nm laser at the University of Tokyo.
3.2 Differential (maximum shear) stress estimation
We estimated the differential (maximum shear) stress using piezometers based on the recrystallized grain size of quartz, which is the dominant mineral phase of the rocks examined. The following points were noted in the grain size measurements.
-
Quartz-only domains were selected for analysis as much as possible to remove the effects of grain growth inhibition by the presence of other minerals such as mica. In the thin sections used for the measurements, changes in grain size due to grain growth inhibition caused by the presence of other minerals were observed. When quartz-rich domains were compared there were no clear changes within a single thin section and the calculated grain size can be considered to be representative at least of the grain size in the thin section.
-
The general presence of well-developed foliation and stretching lineation in the region suggests that samples and selected microstructural domains deformed under conditions close to plane strain. To examine any potential sectioning effects, the grain size for individual samples was measured in both the x–z and y–z planes and treated as maximum and minimum grain sizes. When the Ds lineation was not well developed, the grain size was measured using a thin section oriented parallel to the z axis (p–z plane).
Grain size measurements of the samples were performed using W–SEM–EBSD and an open-source MTEX toolbox for MATLAB (http://mtex-toolbox.github.io/, last access: 27 January 2024). Crystallographic orientations were determined using W–SEM equipped with an EBSD system (JEOL JSM-6510LV with Oxford HKL Channel5) at the University of Tokyo. In the W–SEM, the load current was 73–107 µA. The W–SEM magnification during observation and measurement was kept to ×40. A step size of 1 µm was used for mapping. The HKL database from Sands (1969) was used for the quartz EBSD indexing. Other analytical conditions followed Nagaya et al. (2022). The grain boundaries were constructed from EBSD crystallographic orientation data using a Voronoi decomposition algorithm (Bachmann et al., 2011) implemented within the MTEX toolbox, and grain size distribution was calculated by measuring the area of each grain and converting it to the diameter of a circle with the same area (Fig. 4). A MATLAB script provided by Cross et al. (2017) was used in the analysis; this script defines grain boundaries where the misorientation angle is >10∘ and the root mean square (rms) grain size is used to represent the average grain size.
Recrystallized grains formed by bulging (BLG) or subgrain rotation (SGR) (Stipp et al., 2002; Shimizu, 2008) are derived from initial usually larger grains, and some of these grains may still be present in the microstructure. To apply the piezometer selected in this study it is necessary to filter these relict grains. This filtering was performed following the method of Cross et al. (2017). The grain size was then calculated and applied to the “EBSD 1 µm rms piezometer” of Cross et al. (2017) to estimate differential (maximum shear) stress, which is the empirical relationship between the rms grain size formed by BLG or SGR and applied differential stress. Uncertainties of estimated differential (maximum shear) stress are related to both the piezometer and the grain size measurement (Appendix C). In this study, the same procedure was also applied to microstructures formed by grain boundary migration (GBM in Stipp et al., 2002; SGR+GBM in Shimizu, 2008). These grains filtered by Cross et al. (2017) are relatively unaffected by GBM and can be regarded as formed by SGR, indicating that the application of the Cross et al. (2017) piezometer is reasonable. We also used the piezometer of Cross et al. (2017) with a correction for measured values by the Griggs apparatus, which is proposed by Holyoke and Kronenberg (2010). In this case, the stress value is 0.73 times the value obtained by the piezometer of Cross et al. (2017).
Domains consisting of recrystallized grains formed by SGR+GBM comprise a steady-state microstructure and are formed by one deformation stage. This type of microstructure is suitable for using the α-quartz piezometer of Shimizu (2012), in which the relationship between the grain size of microstructures formed by SGR+GBM and applied differential stress is theoretically considered. To calculate grain size, the MATLAB script provided by Cross et al. (2017) was revised following the definition of Shimizu (2012), in which boundaries where the misorientation angle is >12∘ were used to define grain boundaries, and the mode of the logarithmic grain size was used to represent the grain size. No grain filtering was performed. The piezometer of Shimizu (2012) includes a temperature dependency, and deformation temperatures derived from quartz c-axis fabric opening-angle thermometry (Sect. 3.3) were also applied. The uncertainties by the piezometer of Shimizu (2012) are not shown.
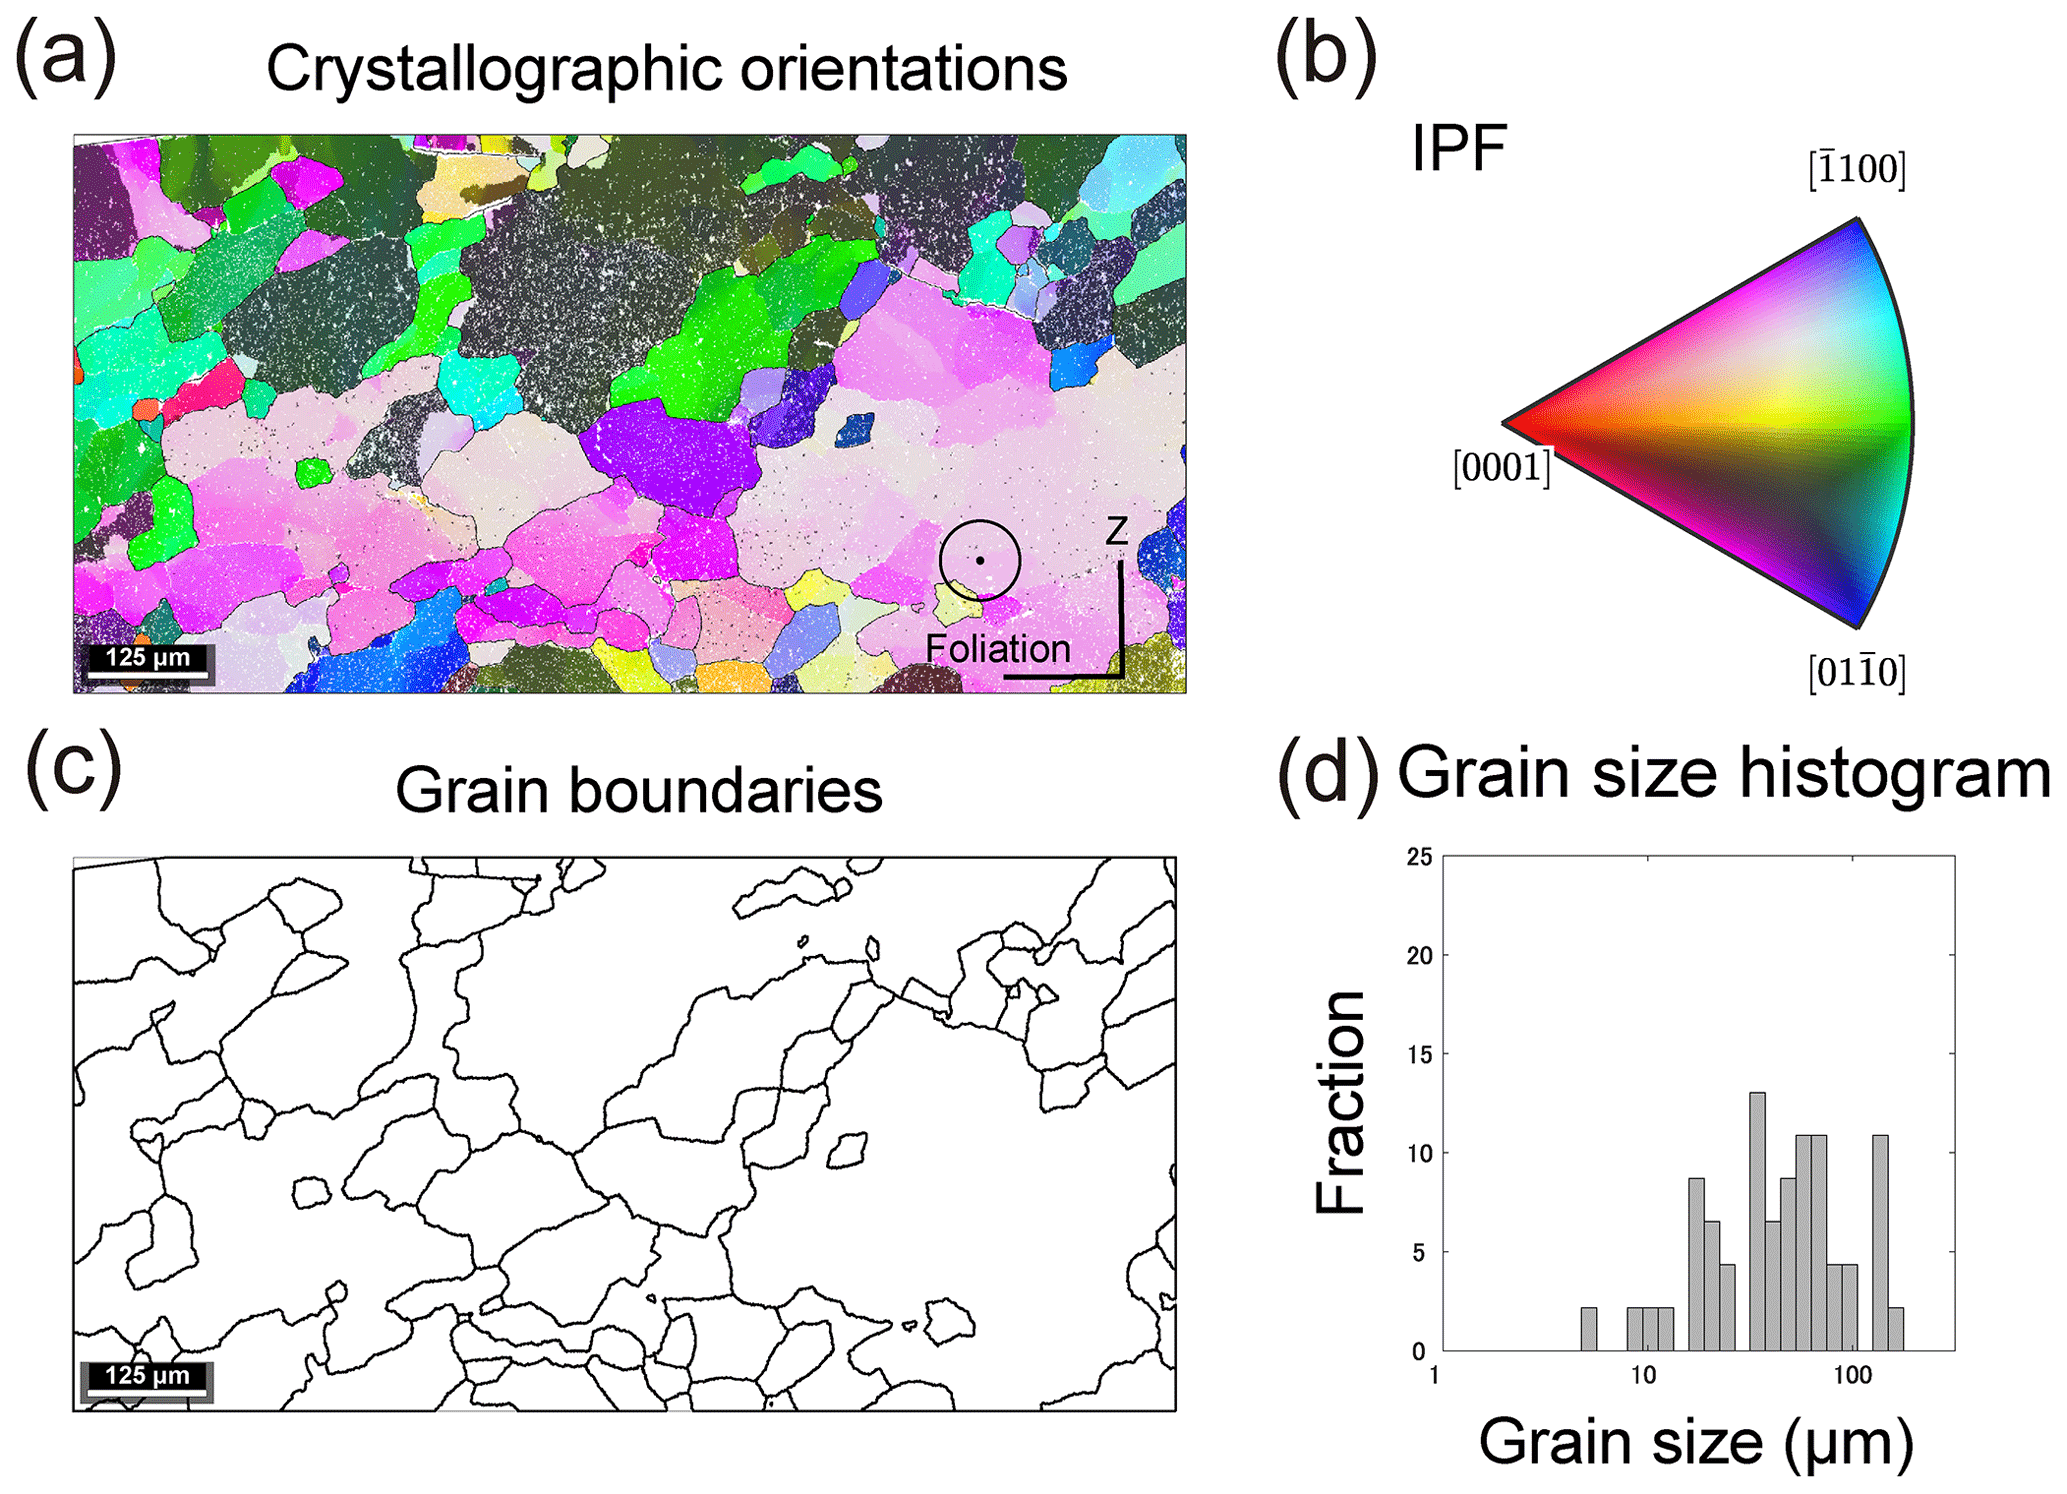
Figure 4Summary of the method used to determine grain boundaries and grain size distribution. (a) Crystallographic orientations measured by W–SEM–EBSD (inverse pole figure map) and (b) the corresponding inverse pole figure. ⊙ shows the observation direction of the crystallographic orientation (perpendicular to the paper). [0001] indicates the direction of the c axis. (c) Grain boundaries were determined using a critical misorientation angle. Grains that did not intersect the map border were used for the grain size calculation. (d) Grain size distribution derived from the image in panel (c).
Therefore, uncertainties of estimated differential (maximum shear) stresses are only related to grain size measurement and deformation temperature (Appendix D).
3.3 Deformation temperature estimation by quartz c-axis fabric opening-angle thermometer
When the c-axis orientations of quartz aggregates deformed by high-strain dislocation creep are projected onto a Schmidt net, they commonly show strong preferred orientation patterns also known as fabric patterns (Fig. 5a). An opening angle (OA) between the peripheral legs of such fabric patterns can be defined for many samples deformed at medium temperatures (Fig. 5b). There is a nearly linear relationship between the OA of quartz fabrics formed by plane strain and the associated metamorphic temperatures estimated by petrological geothermometers from greenschist to granulite facies (Kruhl, 1998; Morgan and Law, 2004). In this study, the relationships presented in Fig. 2 of Law (2014) were used to estimate the deformation temperature. The relationships shown in Law (2014) indicate that a 50∘ OA is equivalent to a deformation temperature of 400 ∘C and that a 1∘ increase (decrease) in OA represents an 8 ∘C increase (decrease) in the deformation temperature. As with the data used in Law (2014), only quartz grains produced by dynamic recrystallization were used, and the 3D strain patterns were also classified.
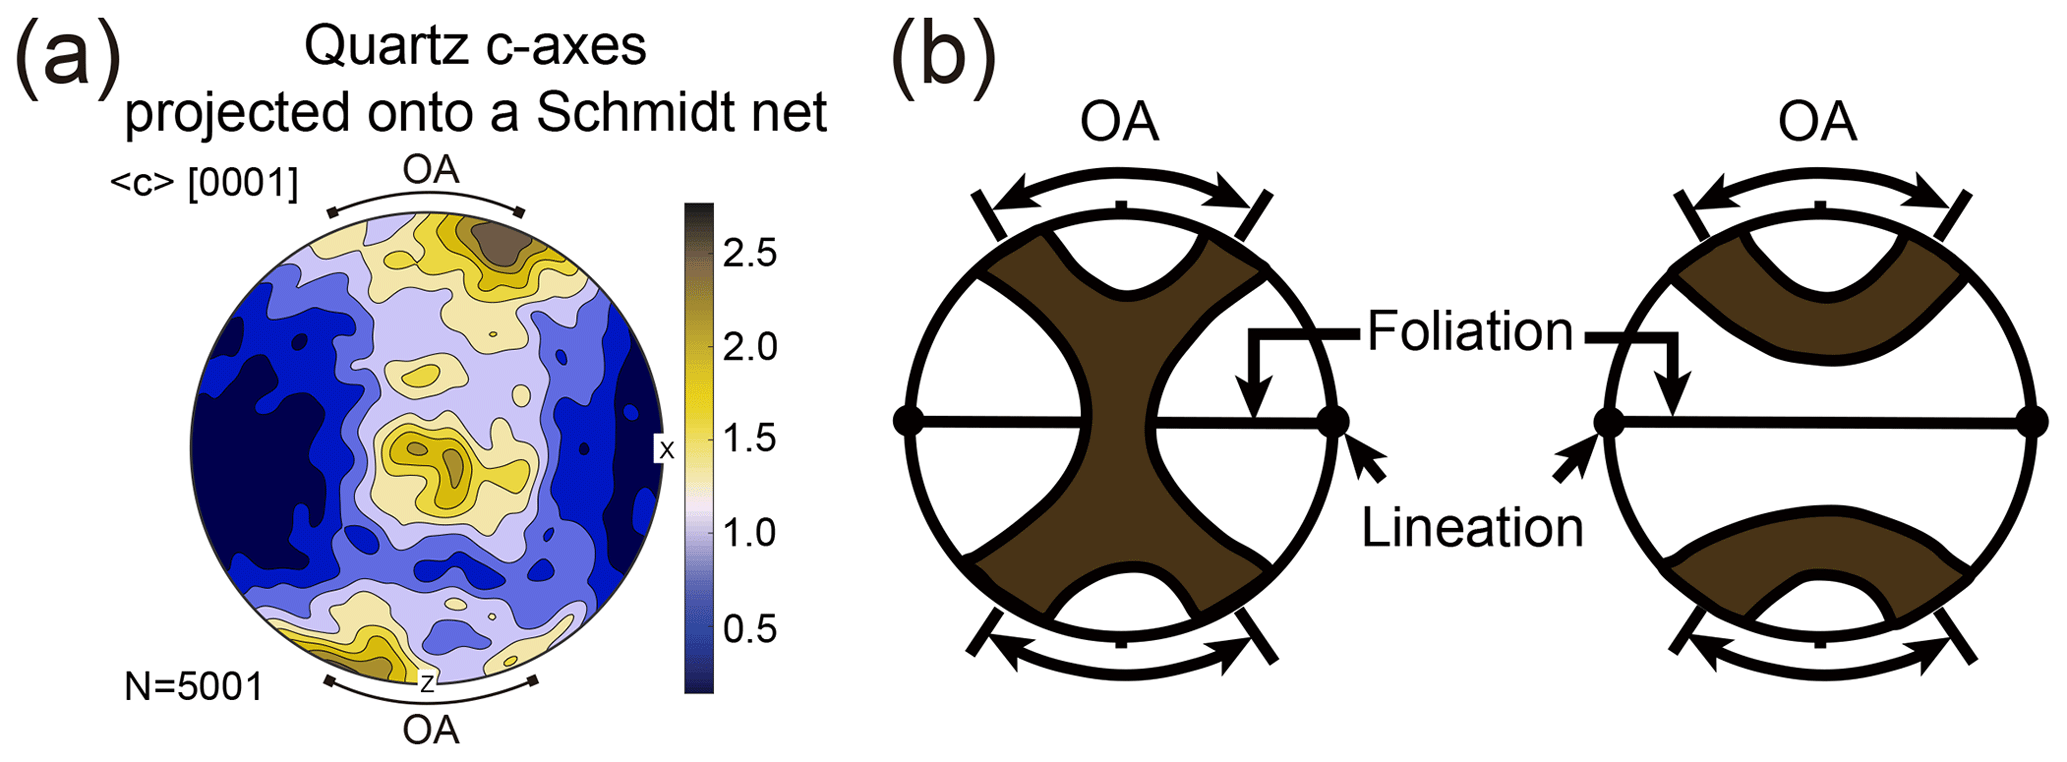
Figure 5(a) Quartz crystallographic orientations (c axes) projected onto a Schmidt net (c-axis fabric pattern). The color bar scale is an indication of measured intensity. (b) Definition of OA (opening angle). The dark regions correspond to high concentrations of quartz c axes plotted on the Schmidt net. Panel (a) shows a crossed girdle and panel (b) shows a small girdle.
For the samples with a well-defined Ds stretching lineation, the c-axis orientations of quartz grains were obtained by W–SEM–EBSD from thin sections parallel to x–z planes. When the Ds lineation is not observed in the sample, thin sections parallel to the z axis (p–z plane) were used. Analytical conditions were the same as for the grain size determination except the step size, which was 5 µm for samples ASM2–4 and 1 µm for samples ASM1b and 5. When analyzing microstructures formed by BLG or SGR, newly recrystallized grains were selected using the method of Cross et al. (2017), and the mean orientations of the c axes of each selected grain were plotted in a Schmidt net using MTEX. When analyzing microstructures formed by SGR+GBM, all grains were plotted. Well-formed fabric patterns indicate that the selected grains were formed by a single deformation stage.
Six samples were collected at five locations to obtain deformation information under a wide range of temperature and pressure conditions (Fig. 3). Samples strongly affected by Dt or Du deformation were not used in this study. Sample ASM1b is from a deformed quartz vein, which is part of a vein set developed in psammitic schist. These veins are oriented subparallel to the foliation (Fig. 6a). Sample ASM1a is from pelitic schist, and samples ASM2–5 are from quartz schist. The sites where samples ASM2–5 were collected are covered by vegetation and the outcrops are not well exposed (Fig. S1). Psammitic schist and pelitic schist consist mainly of quartz, calcite, albite, phengite, chlorite, hematite, graphite, and pyrite. Quartz schist consists mainly of quartz, phengite, albite, piemontite, garnet, hematite, epidote, and rutile. The phengitic composition of white mica was reported in earlier studies (e.g., Radvanec et al., 1994).
Ds foliation and stretching lineation of psammitic and pelitic schist around sample ASM1 are defined by pressure solution seams consisting of phengite, chlorite, and graphite with quartz strain fringes developing around pyrite (Figs. 3, 7a). The orientation of the strain fringes in sample ASM1a shows a WNW–ESE-oriented finite stretching, and their asymmetry indicates a top-to-west shear sense (Fig. 7a), both consistent with the characteristics of Ds (Wallis, 1992). Sample ASM1b was collected from quartz veins oriented subparallel to Ds foliation. Quartz grains in sample ASM1b are also elongated in an WNW–ESE direction (Figs. 6b, 7b), consistent with the characteristics of Ds deformation. Both samples ASM1a (quartz fringe) and 1b (quartz vein) exhibit wavy extinction, and observation under the optical microscope, mis2mean maps, and kernel average misorientation (KAM) maps all show that large grains were recrystallized into multiple finer subgrains (Figs. 7a, b, S2–S4). These microstructural features are evidence of dislocation creep and dynamic recrystallization by SGR (Stipp et al., 2002). Quartz grains in microlithon domain become finer due to grain growth inhibition by different minerals such as phyllosilicates (Fig. 7a).
In sample ASM2, phyllosilicate minerals with a platy shape are strongly aligned and form a well-defined Ds foliation (Fig. 7d). A thin section parallel to the foliation shows that quartz, phengite, and opaque minerals are elongated or aligned, defining a Ds mineral lineation (Fig. 7c). Quartz grains exhibit wavy extinction, amoeboid grain boundaries, and irregular grain sizes (Fig. 7d). Moreover, the mis2mean map and KAM map show that large grains were recrystallized into multiple finer subgrains (Fig. 8c, d). These microstructural characteristics indicate the action of dislocation creep and dynamic recrystallization: GBM of Stipp et al. (2002) or SGR+GBM of Shimizu (2008). Samples ASM3 and 4 were collected from the albite–biotite zone. Phyllosilicate minerals are strongly aligned and form a well-defined Ds foliation (Fig. 7e, f). However, a clear Ds stretching lineation is not observed. Quartz grains exhibit microstructures characteristic of dislocation creep and dynamic recrystallization: ASM3 with SGR+GBM (Figs. 7e, S6) and ASM4 with SGR (Figs. 7f, S7). In sample ASM2-4, albite includes traces of a Dr foliation oblique to the external Ds foliation, which is partly defined by the alignment of phengite. These observations suggest that both albite and phengite were formed before or synchronously with Ds, the timing of quartz deformation. This implies that albite and phengite have both been deformed along with the quartz.
Sample ASM5 was collected from the albite–biotite zone. In this sample, an SC′ shear band structure is observed (Fig. 7g, h). In the quartz domain wavy extinction is observed, and both bulges and recrystallized grains are present along grain boundaries. These microstructural characteristics indicate the action of dislocation creep and dynamic recrystallization: BLG of Stipp et al. (2002). However, mis2mean and KAM maps show that large grains were partly recrystallized into multiple finer subgrains (Fig. S8), indicating that SGR also occurred.
The results of observation and analyses are summarized in Table 1. Sample ASM2–5 showed a clear fabric pattern and an OA was measured (Figs. 8g, S2–S8). Estimated deformation temperatures are shown in Table 2. Grain boundary maps and the grain size distributions used for calculating differential stress are shown (Figs. 8e, f, h, i, j, S2–S8). Results for differential stress in both uniaxial and plane stress conditions (Appendix B) are also listed in Table 2 (uncertainties are shown in Figs. 12 and 14).
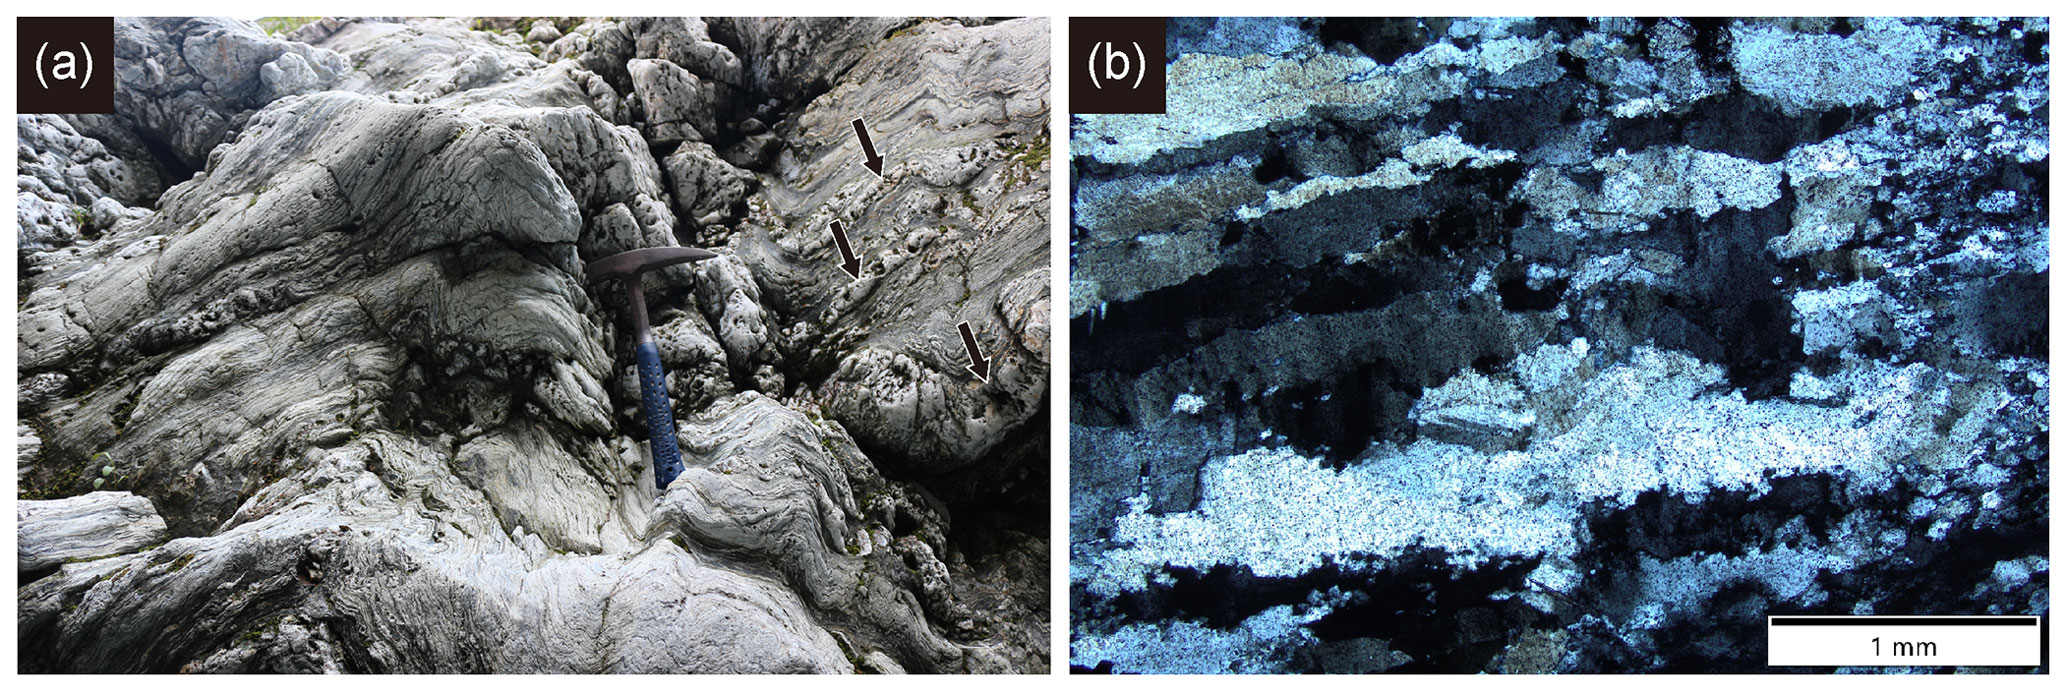
Figure 6(a) Outcrop photo showing foliation-subparallel veins (black arrows) in psammitic schist. Both foliation and veins were folded by later deformation (Du) but partly preserved unfolded structure, in which we collected sample ASM1b. The hammer for scale is 33 cm long. (b) Microstructure of quartz vein (sample ASM1b). Large fibrous quartz grains elongate parallel to the stretching lineation and have locally undergone dynamic recrystallization with the development of small recrystallized grains. The x–z plane. Crossed nicols.
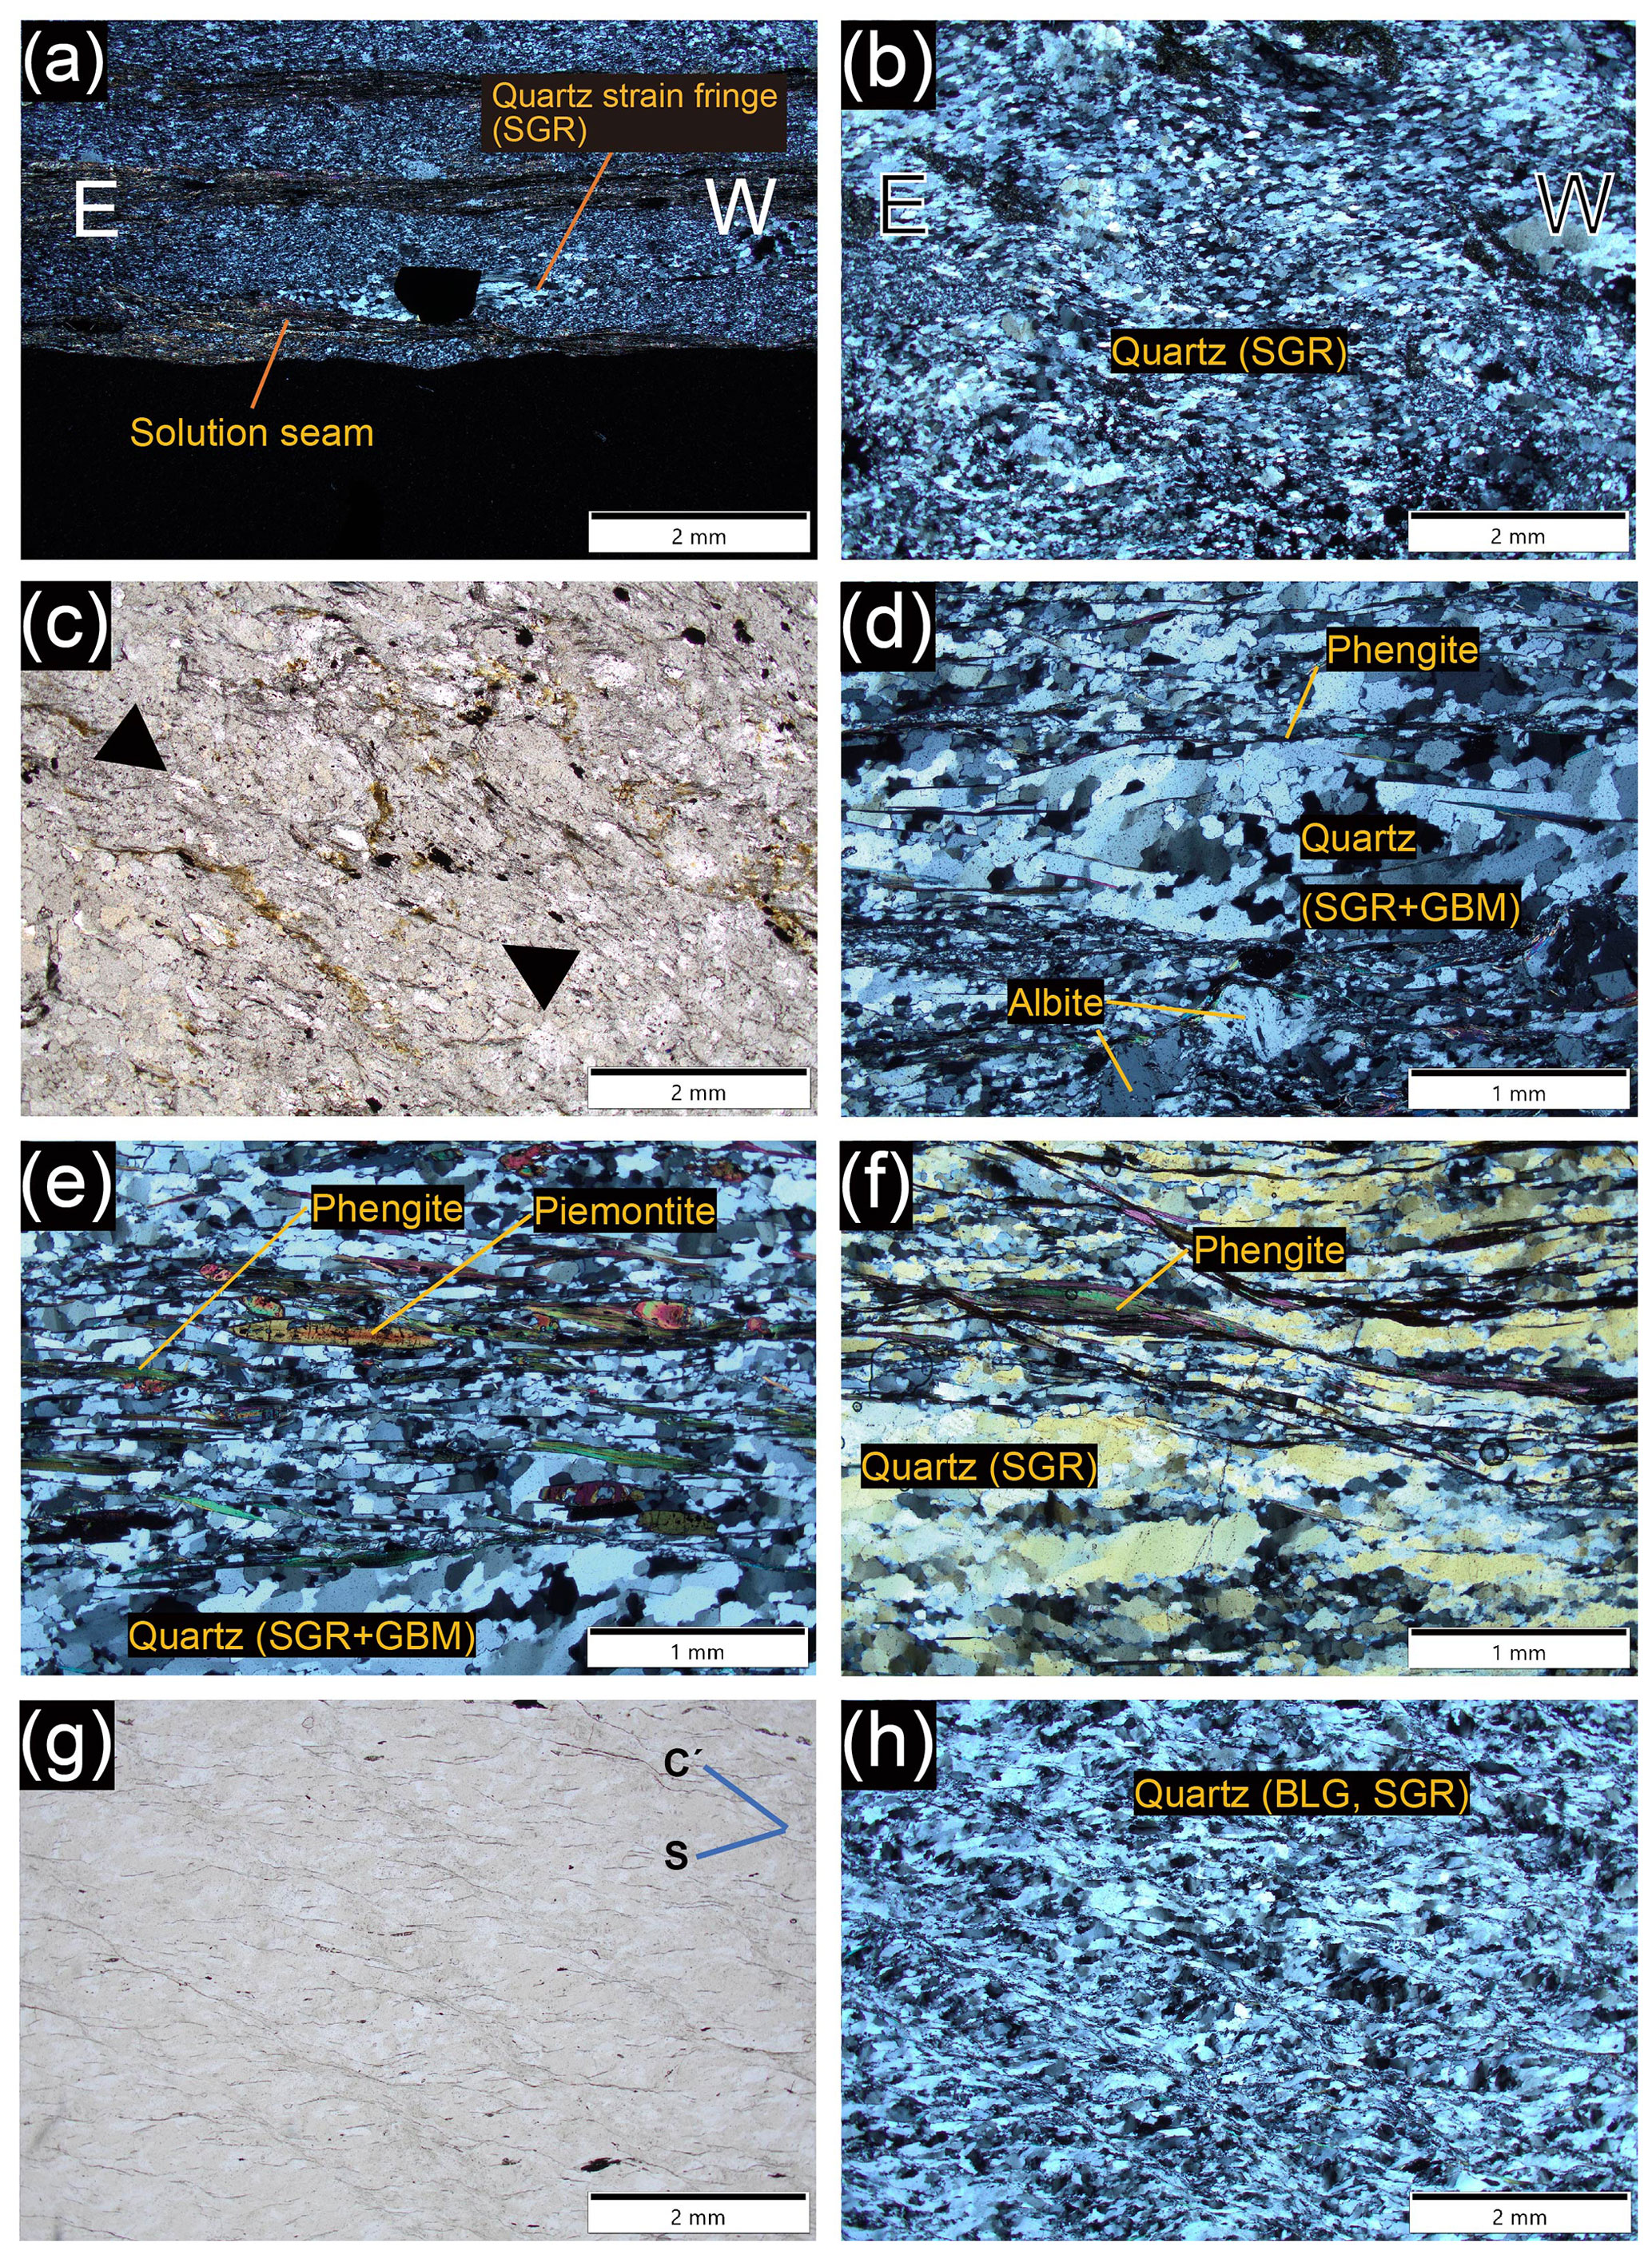
Figure 7E and W indicate the eastern and western sides of the thin section. Except for panels (c) and (e), the up direction on the page corresponds to the up direction in the field. (a) Pelitic schist close to sample ASM1a. The x–z plane. Crossed nicols. (b) Sample ASM1b. The x–z plane. Crossed nicols. (c) Sample ASM2. The x–y plane. Opened nicols. Elongated phengite and quartz form weak lineation (arrow direction). (d) Sample ASM2. The x–z plane. Crossed nicols. (e) Sample ASM3. The p–z plane. Crossed nicols. (f) Sample ASM4. The p–z plane. Crossed nicols. (g, h) Sample ASM5. The p–z plane. (g) Opened nicols. (h) Crossed nicols.
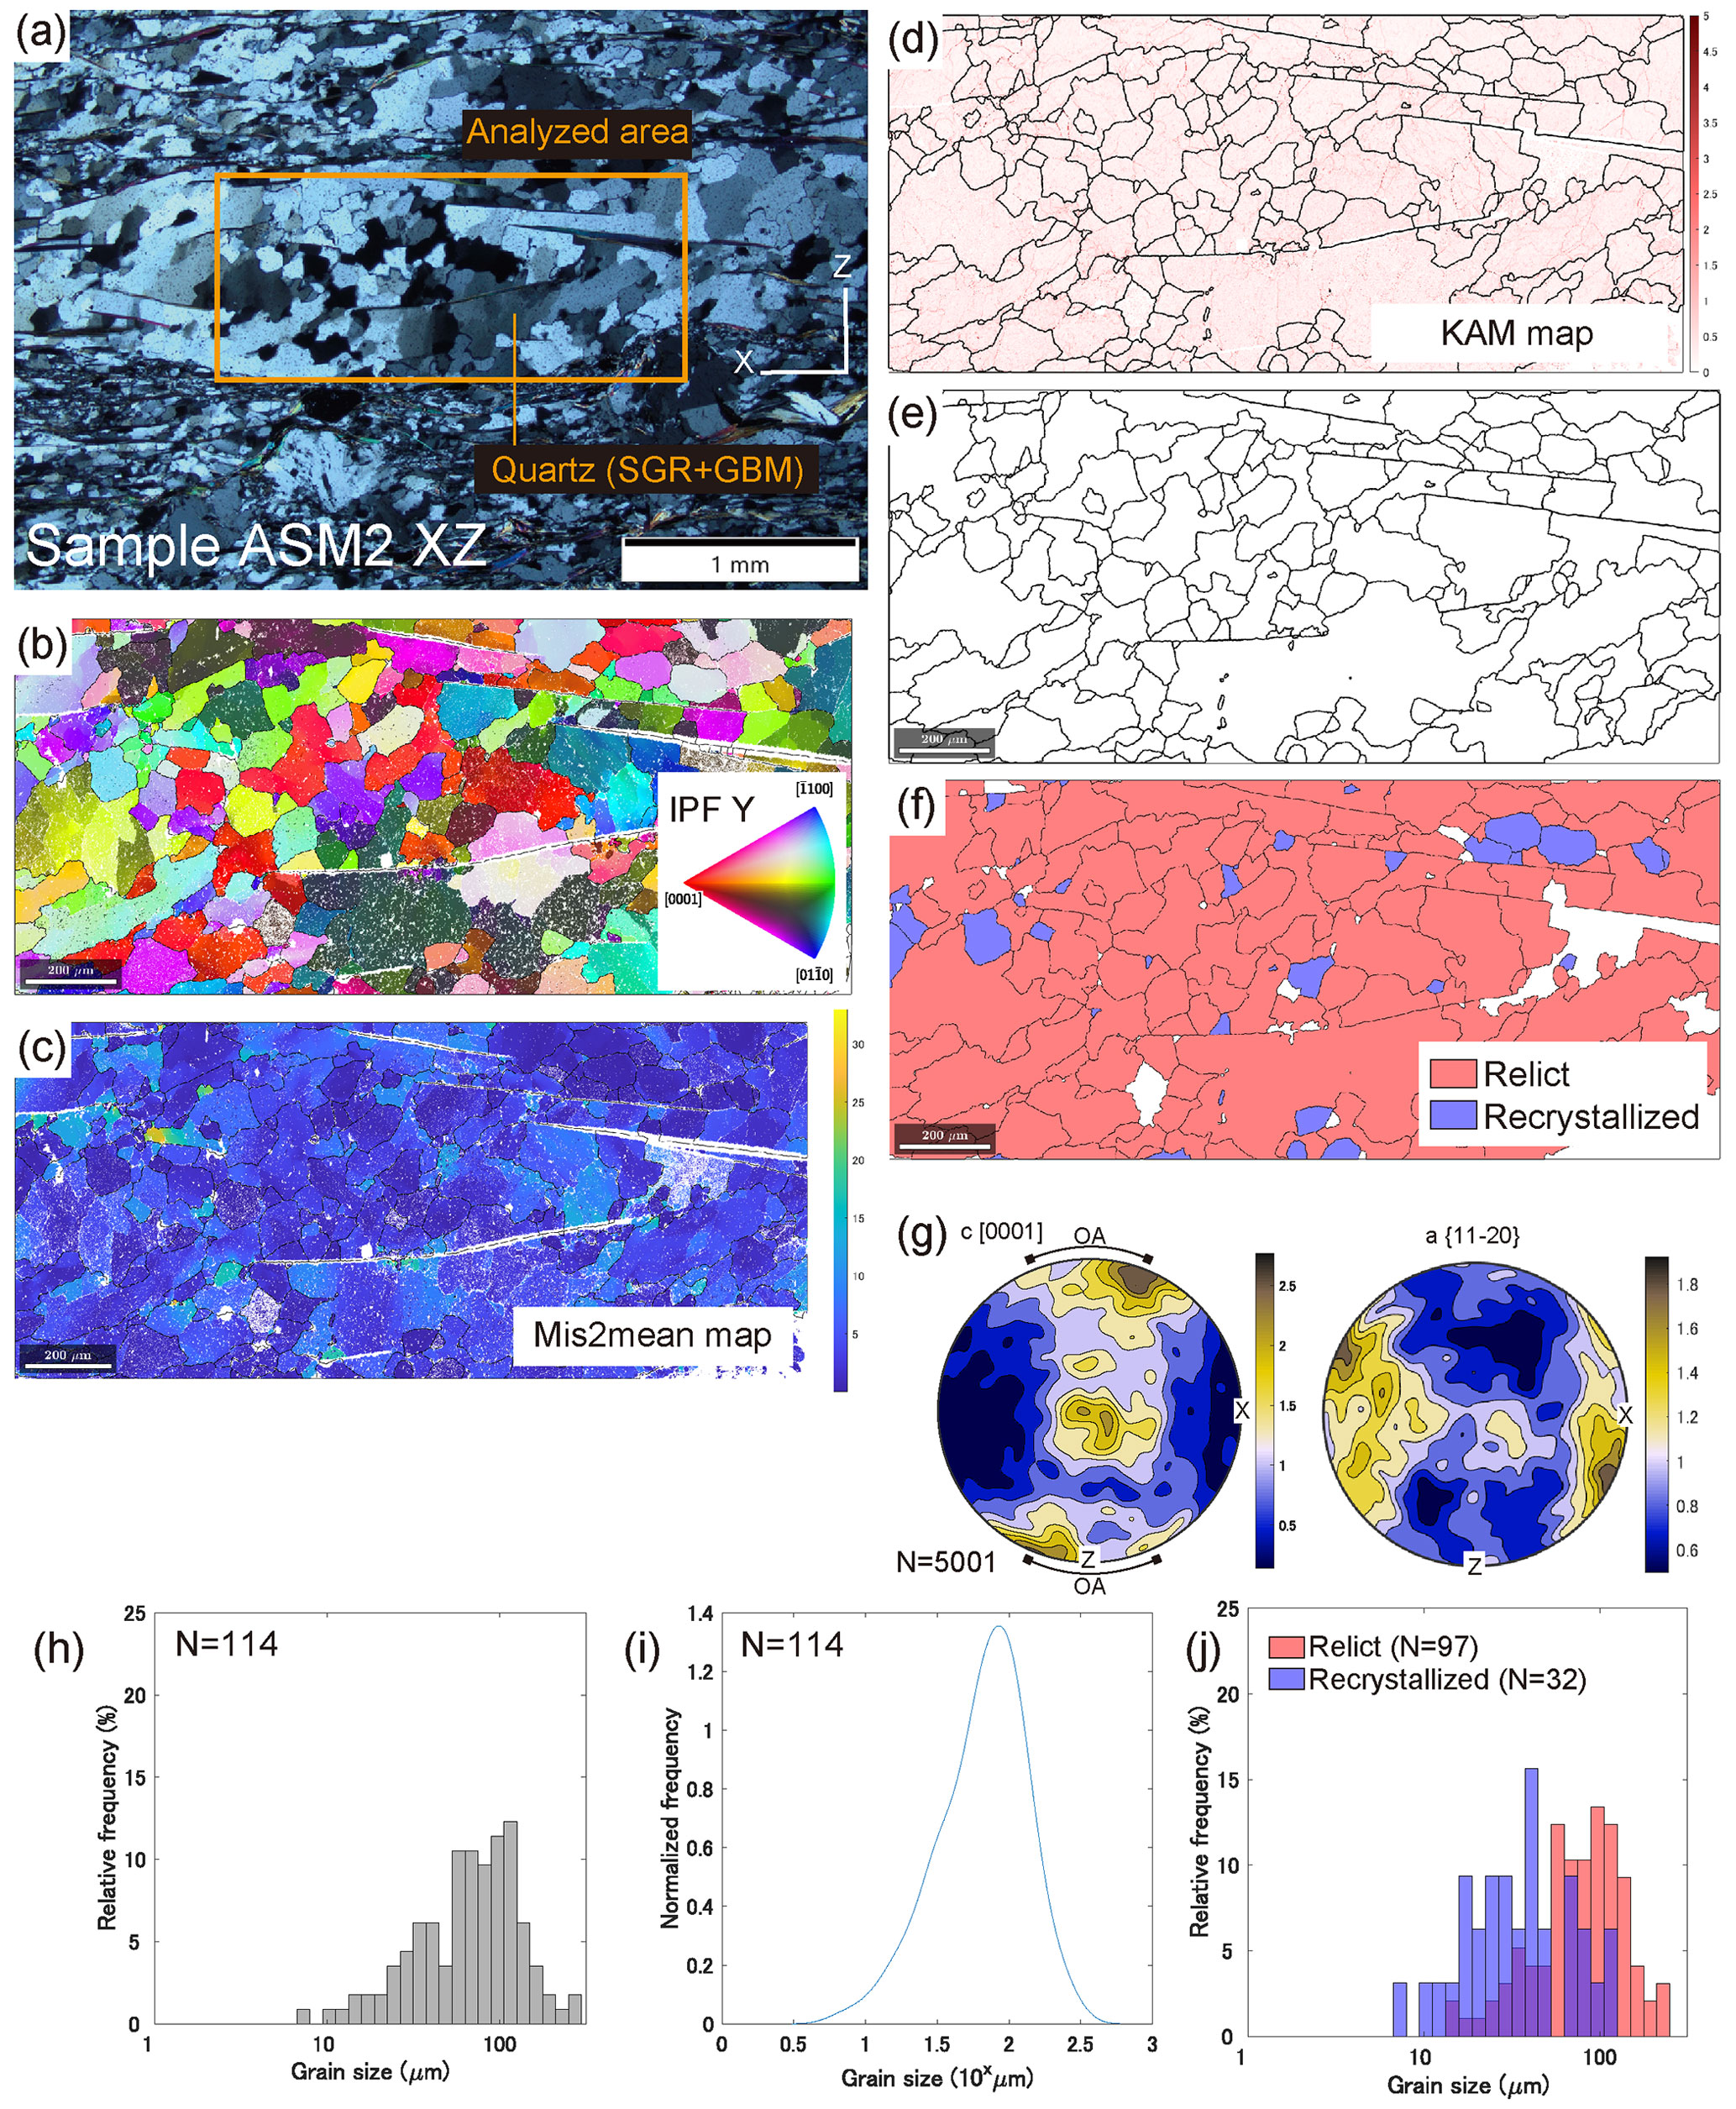
Figure 8Sample ASM2 x–z. (a) Polarizing microscope image (crossed nicols) and (b) inverse pole figure (IPF) map. Quartz grains exhibit wavy extinction, amoeboid grain boundaries, and irregular grain sizes. Both the (c) mis2mean map (d) kernel average misorientation (KAM) map show large grains that were recrystallized into multiple finer subgrains. These microstructural characteristics indicate dynamic recrystallization by GBM (SGR+GBM). (e) Grain boundary map for the piezometer of Shimizu (2012). (f) Grain boundary map for the piezometer of Cross et al. (2017). (g) Crystallographic orientations and measured OA. (h) Grain size histogram and (i) probability distribution for the piezometer of Shimizu (2012). (j) Grain size histogram for the piezometer of Cross et al. (2017).
Table 1Observation and analysis results.
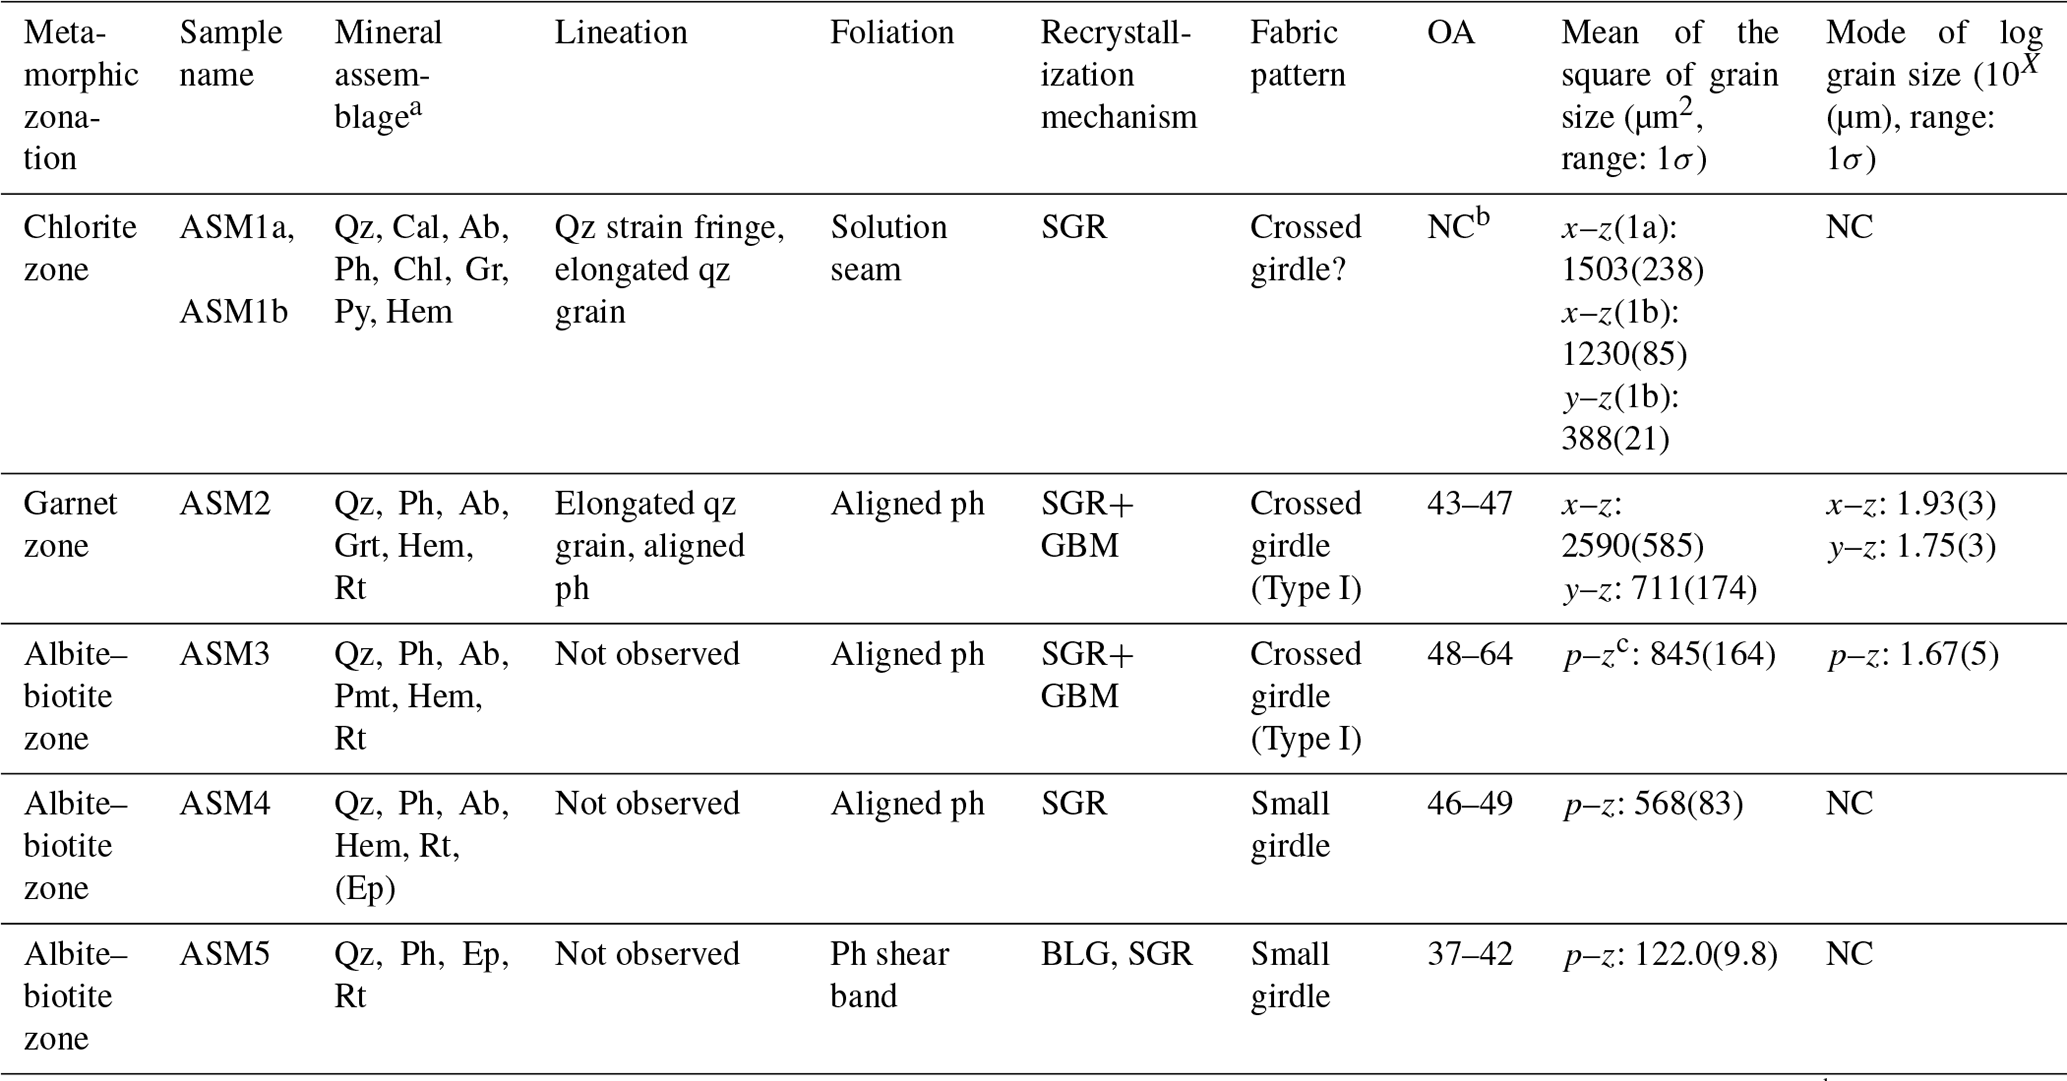
a Qz: quartz, Cal: calcite, Ab: albite, Ph: phengite, Chl: chlorite, Gr: graphite, Grt: garnet, Hem: hematite, Py: pyrite, Ep: epidote, Rt: rutile. (): only in albite porphyroblasts. b Not calculated. c Plane parallel to z axis.
Table 2Differential stress estimated by piezometer and deformation temperature estimated by OA (Cr: Cross et al., 2017; Cr+Ho: Cross et al., 2017, corrected by Holyoke, 2010; Sh: Shimizu, 2012).
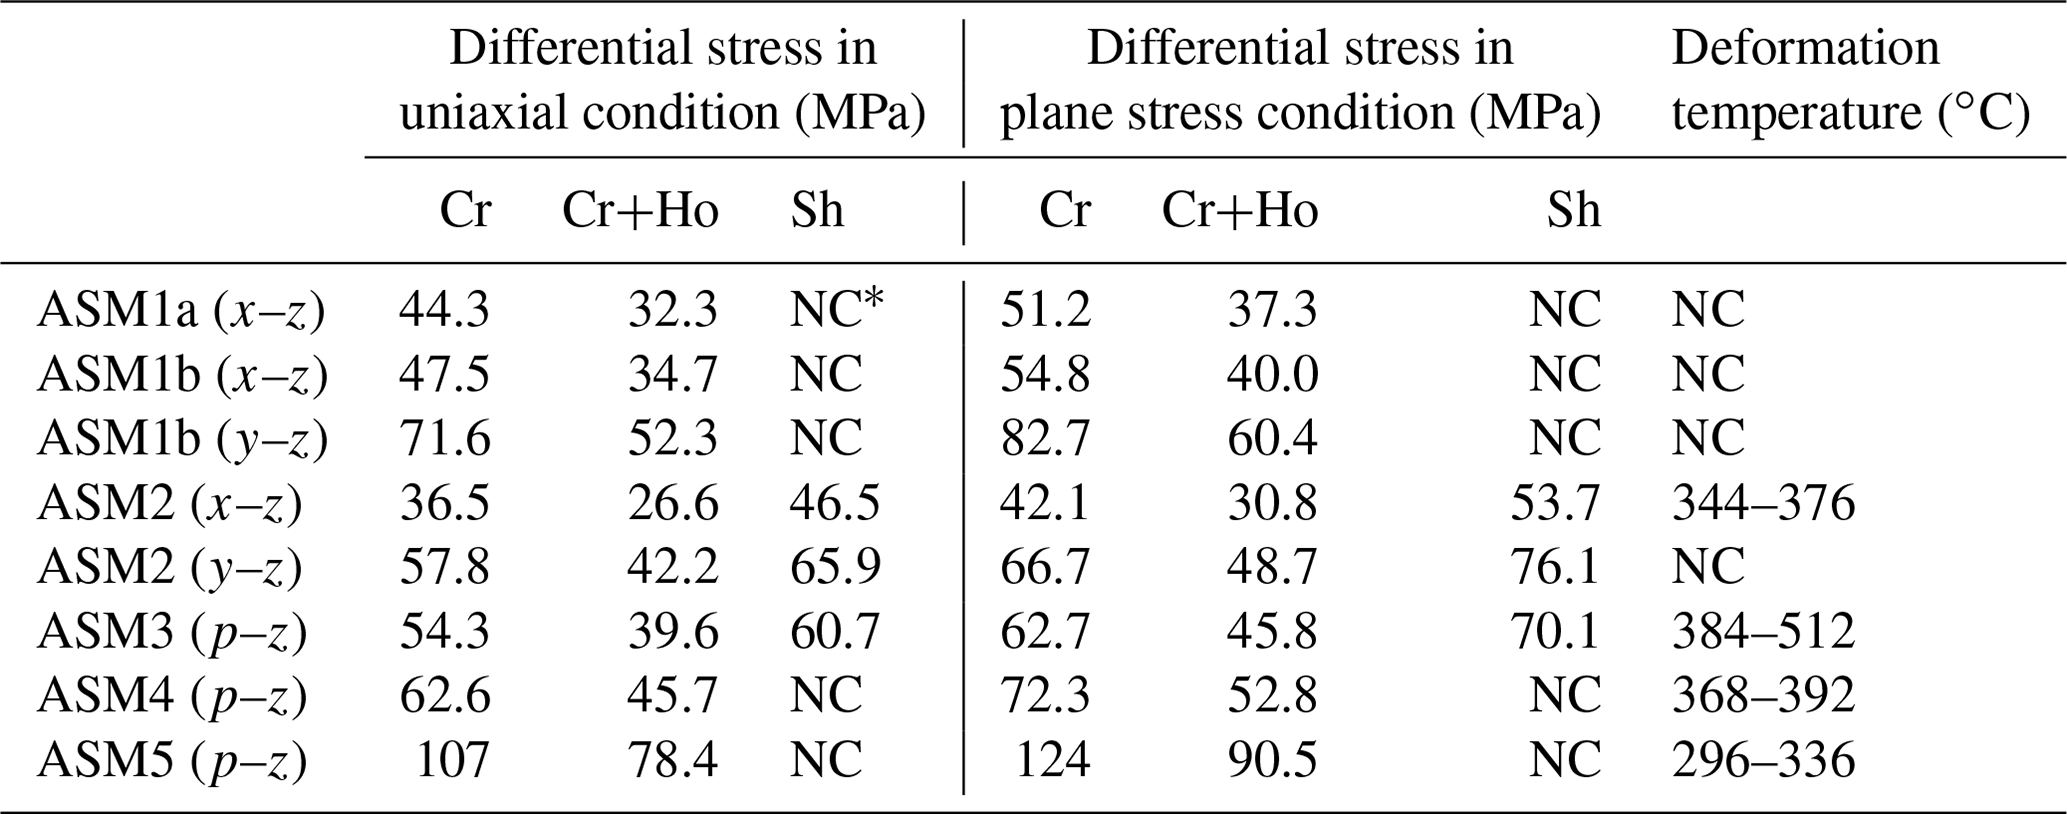
* Not calculated.
5.1 Tectonic stage of sample deformation
Knowledge of the tectonic stage represented by the deformation recorded in the quartz samples is important when discussing how the stress data for individual samples can be related to stresses in the paleo-subduction plate interface. In this study, we first compared peak metamorphic temperatures estimated by the Raman carbonaceous material geothermometer (Kouketsu et al., 2021) with deformation temperatures estimated by the quartz c-axis fabric opening-angle thermometer. The P–T path of the region has been determined in previous studies and this path allows us to link the deformation temperature to pressure and hence depth. The retrograde P–T gradient is the most important to draw a retrograde P–T path, and this has been estimated as 3 MPa K−1 in the albite–biotite zone and 4 MPa K−1 in the garnet and chlorite zones (Fig. 6d and f in Okamoto and Toriumi, 2005). Depth was calculated assuming that the thickness of granitic upper crust (2700kg m−3) is 20 km and that of gabbroic lower crust (3000 kg m−3) is 10 km.
In sample ASM1, the crystallographic preferred orientation pattern fabric is not clear and the OA cannot be measured (Fig. S3). However, sample ASM1 recorded Ds deformation and recrystallized grains were formed by SGR, indicating that its deformation process was dislocation creep and deformation temperature was at least about 300 ∘C (Passchier and Trouw, 2005). This temperature is close to the peak temperature of about 330 ∘C, and in the following discussion, we take the deformation temperature of sample ASM1 to be 300–330 ∘C.
To allow a better regional comparison between the deformation temperature and metamorphic peak temperature we also examined quartz fabric data from previous studies (Sakakibara et al., 1992; Wallis et al., 1992; Tagami and Takeshita, 1998; Yagi and Takeshita, 2002) that were suitable for the quartz c-axis fabric opening-angle thermometer. In many previous studies, the main ductile deformation of the region is referred to as D1 (Tagami and Takeshita, 1998; Yagi and Takeshita, 2002). D1 has the same characteristics as Ds in this study, and the same reference frame of the x axis and x–y plane was used to plot the quartz fabric as used in this study so a direct comparison is possible. One previous study (Sakakibara et al., 1992) relates the deformation of the study area to an Sb2−2 deformation phase. The Sb2−2 is defined by coupling of the Saruta–Fuyunose–Sogauchi units (classified as the Shirataki unit in this study) and the Sakamoto unit (classified as the Shirataki and Oboke unit in this study). We consider it to be the same as the Ds deformation because the boundary between the Shirataki unit, which is referred to as the Saruta–Fuyunose–Sogauchi units, and the Oboke unit, which is referred to as the Sakamoto unit, contains a mixed domain with rocks derived from both the overlying Shirataki and underlying Oboke units, in which characteristics of the Ds deformation were observed (Aoya et al., 2017). Measured OA values from previous studies are shown in Appendix A.
It is clarified that most of the plotted data are within a few tens of degrees Celsius below the peak metamorphic temperature (Fig. 9). However, some samples, mainly in the high metamorphic region, show deformation temperatures that are clearly lower than the peak metamorphic temperature (blue circles). It is assumed that samples ASM 1 and 3 were deformed near the peak metamorphic temperatures, samples ASM 2 and 4 were deformed at the early stage of exhumation, and sample ASM5 was deformed at the late stage of exhumation. In the following discussion we focus on samples ASM1–4. Taking into consideration the peak pressure condition by Enami et al. (1994), the peak temperature condition by Kouketsu et al. (2021), the retrograde P–T gradient by Okamoto and Toriumi (2005), and estimated deformation temperature, pressures at which samples ASM1 and 3 were deformed with 1σ error are estimated as 0.55±0.1 GPa (21 km) and 0.7±0.1 GPa (27 km). Samples ASM2 and 4 were deformed at 0.45±0.1 GPa (17 km) and 0.5±0.1 GPa (19 km). The error of the estimated pressure condition is derived from the measurement error of OA (treated as 2σ) and RCMT (1σ), as well as pressure conditions (Enami et al., 1994: treat as 2σ).
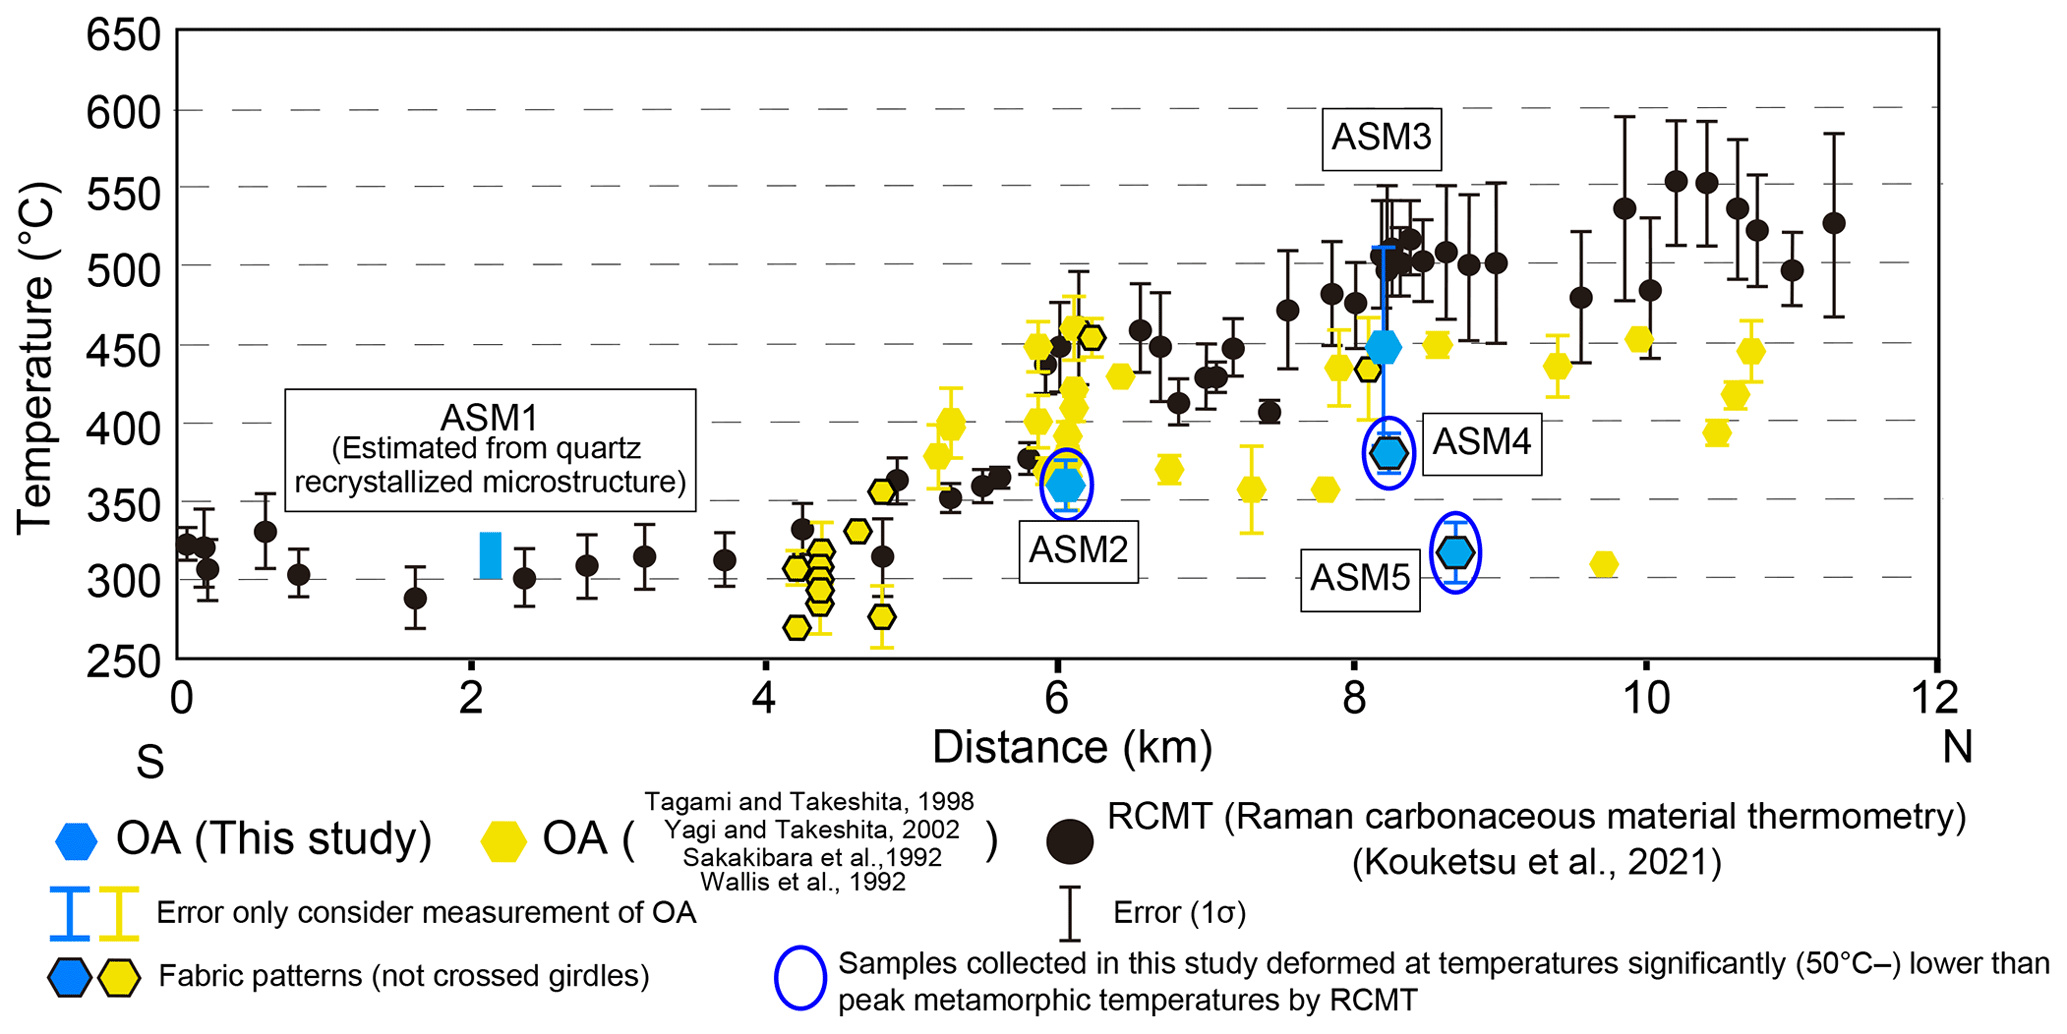
Figure 9A comparison between estimated peak metamorphic temperatures by the Raman carbonaceous material geothermometer (black circles) and the estimated deformation temperatures by the quartz c-axis fabric opening-angle thermometer (hexagons). The black frames around some hexagons indicate that the corresponding c-axis fabric patterns are not crossed girdles. Especially at the higher-temperature side (north of sample ASM2), all hexagons with black frames (three samples) show small girdles, which may cause a small overestimation of the deformation temperature (Law, 2014). Blue hexagons indicate samples collected in this study. Blue circles around blue hexagons indicate that these samples deformed at temperatures significantly (more than 50 ∘C) lower than the surrounding peak metamorphic temperatures and may record deformation at shallower levels. Errors for the RCMT estimates are given at the 1σ level. Errors for the quartz c-axis fabric opening-angle thermometer are based on the measurement of OA (treated as 2σ). The deformation temperature for sample ASM1 (blue rectangle) is derived from microstructural observations.
5.2 Stress recorded by quartz microstructure and in the subduction plate interface
In this section, we discuss the relationship between the stress recorded by the quartz microstructure and the stress state along the subduction interface. In this contribution, we use the term stress to refer to differential stress and maximum shear stress. In Appendix B, we also refer to the tensor nature of stress including the deviatoric stress. For the stress estimates, we focused on the microstructures of samples ASM1–4. We argue that the estimated stresses are likely to be similar to the surrounding rocks and representative of the plate interface.
5.2.1 Stress recorded by samples ASM2, 3, and 4 and stress received by surrounding quartz schist
In samples ASM2–4, in addition to quartz (volume fraction 70 %–80 %: inferred by indexing rate of EBSD analysis), albite and phengite are also significant mineral components, which deformed along with quartz during Ds (Fig. 7c–f). Albite shows only weak development of wavy extinction that is not nearly as well developed as in quartz (e.g., albite in Fig. 7d), suggesting that the albite underwent only very limited intracrystalline deformation during the Ds deformation. In general, albite is known to have a higher yield strength than quartz in this temperature condition (Passchier and Trouw, 2005), in agreement with the above inference. Phengite is expected to be much weaker and may have been significantly deformed. Hunter et al. (2016) pointed out that under a deformation temperature of 490–530 ∘C, even if they do not form an interconnected network, the appearance of mica with a volume ratio of less than 10 % may inhibit quartz deformation and concentrate deformation in the mica. Furthermore, it has been pointed out that the basal glide of phengite is weak and may undergo significant deformation when the von Mises criterion is satisfied under deformation conditions like our samples (Condit et al., 2022). In light of these considerations, we assessed the effect of mica deformation and deformation heterogeneity in rocks around our samples.
When phengite (a relatively weak phase) grains do not form an interconnected network, both the phengite and quartz deform at the same strain rate and are subjected to different stresses (mica distributed within a load-bearing quartz: load-bearing framework – LBF – in Handy, 1994). Phengite in samples ASM2, 3, and 4 shows only limited connectivity and does not form a uniform continuous foliation (Figs. 7d–f, 10), which means that deformation is unlikely to propagate along phengite and the LBF condition can be applied. In this situation, the estimated stresses would be larger than the stresses experienced by the phengite. However, the stress received by the whole rock body is, in this case, the sum of the stress received by each mineral multiplied by the volume fraction of the mineral (e.g., Condit et al., 2022; Handy, 1994). Thus, even if the phengite is subjected to a stress of 0 MPa and the volume fraction of the mica mineral is 20 %, the stress on the rock body is 0.8 times the estimated stress and the estimated stress can be considered to be a good approximation of the stress of the whole rock body.
In summary, the estimated stresses are almost identical to the stresses received by the surrounding rock body. However, the stresses received by the phengite may be even smaller, as the strength of the mica is assumed to be lower than the strength of the quartz undergoing dislocation creep at the temperature conditions discussed in our study.
5.2.2 Stress recorded by sample ASM1 and stress received by surrounding psammitic and pelitic schists
In the area around sample ASM1, both psammitic and pelitic schists are deformed by quartz pressure solution creep in the microlithon domains, and the developed foliation may have been deformed by phyllosilicate slip (Fig. 7a). As foliation develops as a layer, the foliation and microlithon domains are considered to have been subjected to the same stress and deformed at different strain rates (Condit et al., 2022). Both quartz veins (Figs. 6b, 7b) and strain fringes (Fig. 7a) are developed in the microlithon domain, but no boudin or other structures attributable to differences in strength could be identified (Figs. 6a, 7a). Therefore, quartz veins, strain fringes, and microlithon domains are considered to have had almost the same strength, i.e., were subjected to the same maximum shear stress and strain rate. In sample ASM1, stresses were estimated from quartz veins in psammitic schist and strain fringes in pelitic schist. From these results, we conclude it is likely that the obtained stress is representative of the stresses undergone by the pelitic and psammitic schists of the chlorite zone.
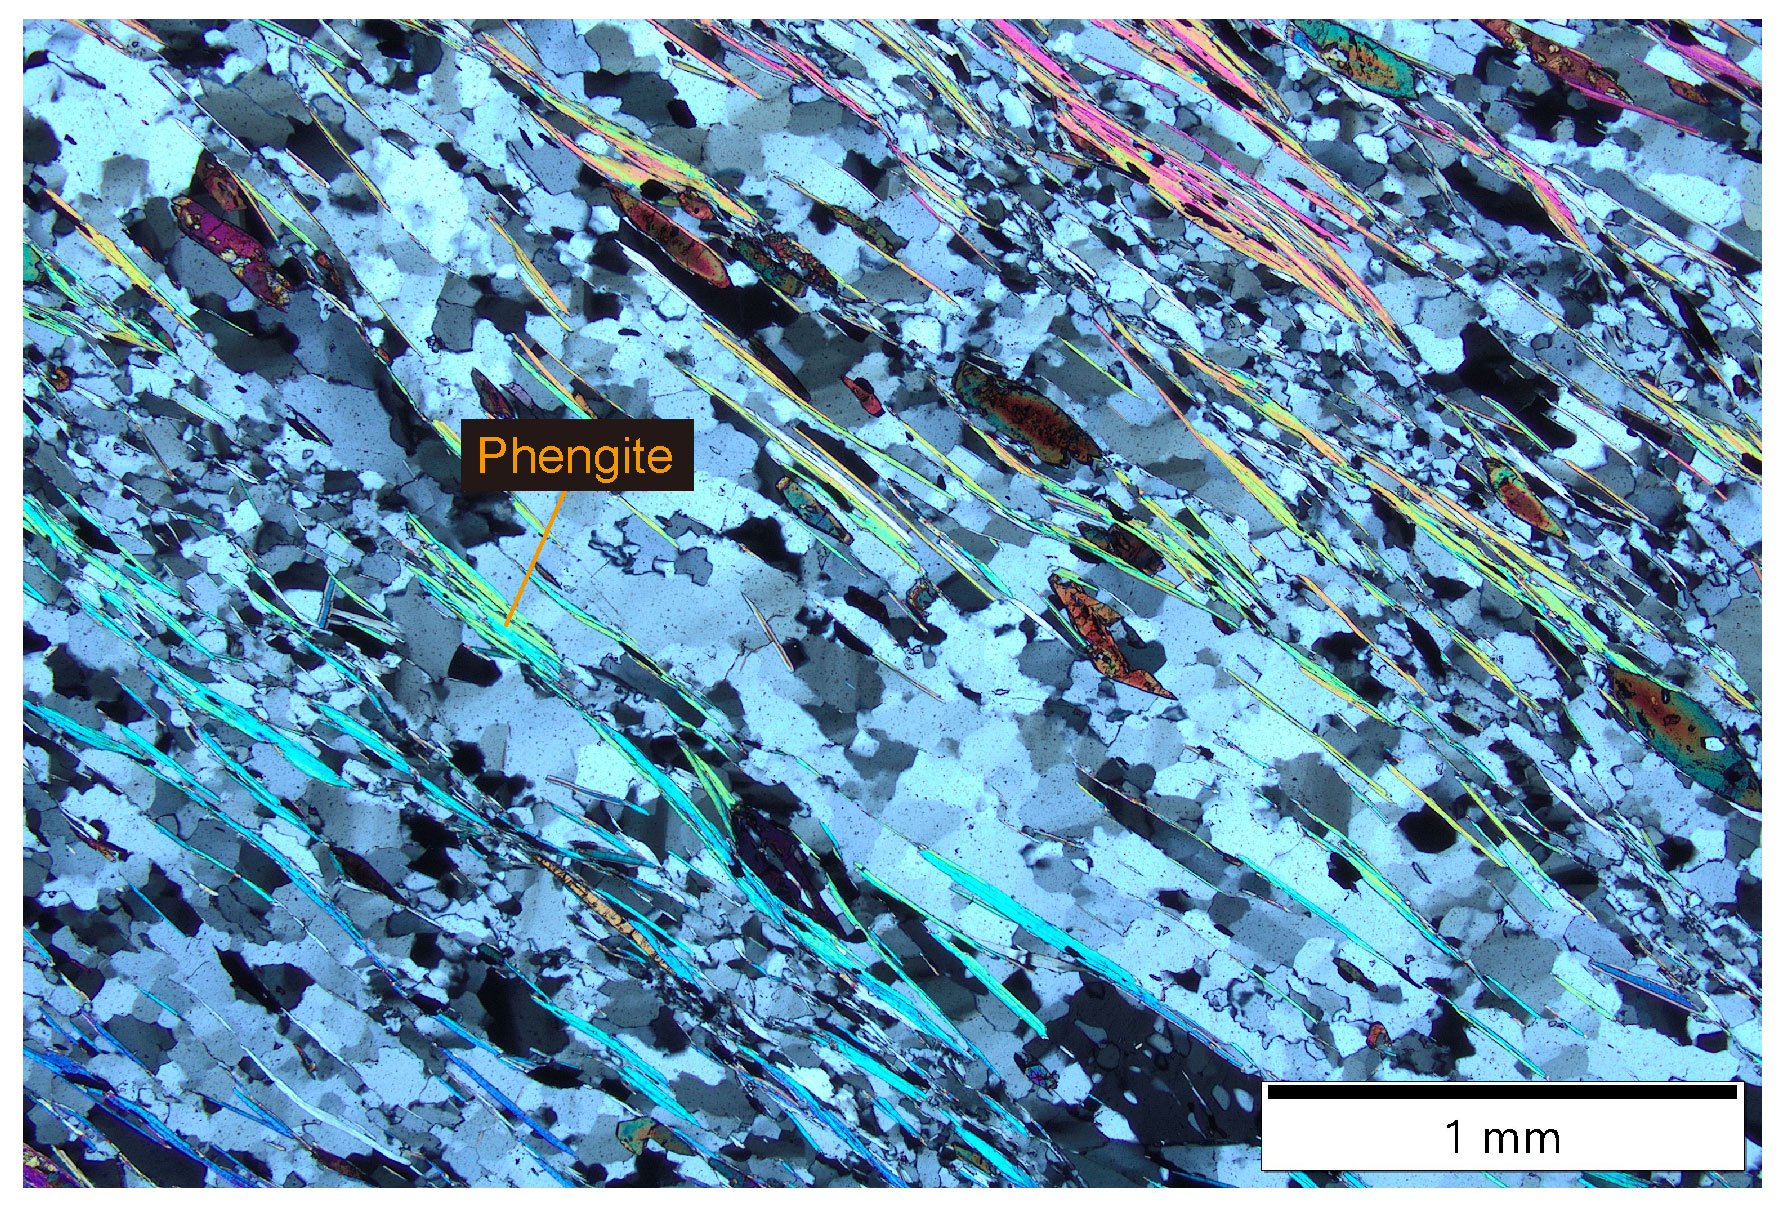
Figure 10Microstructure of phengite in quartz schist (sample ASM3). Phengite (greenish to purplish interference colored platy mineral) does not form a continuous foliation longer than a few millimeters.
Estimated differential stresses were 32.3–71.6 MPa. In a quartz deformation mechanism diagram drawn using the thin-film pressure solution creep flow law (Table 3: Rutter, 1976; Schmidt and Platt, 2022) and dislocation creep flow law (Table 3: Lusk et al., 2021), the conditions of the vein and fringe in sample ASM1 (Table 4) are located at the dislocation creep deformation dominant region (Fig. 11a), and the microlithon domain condition (Table 4) is located in the thin-film pressure solution creep dominant region (Fig. 11b), consistent with geological observation. Therefore, the above interpretation from outcrop and thin section observations is supported in terms of quartz rheology. In this case, the strain rate of the microlithon domain is estimated to be 20 times higher than that of dynamically recrystallized grains in the quartz vein and fringe (Fig. 11). However, dynamically recrystallized grains in the quartz vein and fringe are considered to have been formed by the recrystallization of larger quartz fiber grains (Figs. 6b, 7a). These fiber grains are elongate parallel to the stretching lineation and grew associated with the opening of the vein. The formation of such veins contributes to the strain of the rock. Therefore, the strain rate experienced by the quartz veins and fringes is considered to be the sum of the strain rate associated with the formation of quartz fiber grains and the strain rate associated with quartz dislocation creep. This additional contribution from dislocation creep may have allowed the quartz vein, fringe, and microlithon to deform at the same stress and strain rate.
The strain rate of thin-film pressure solution creep depends on grain size. Grain size estimation using this method is difficult for structures with significant grain growth inhibition by different minerals, and the grain size of the microlithon domain used in the discussion is an assumption. Although this is not a problem for rough strain rate comparisons such as the present study, an accurate grain size estimation method is required for more quantitative strain rate evaluations.
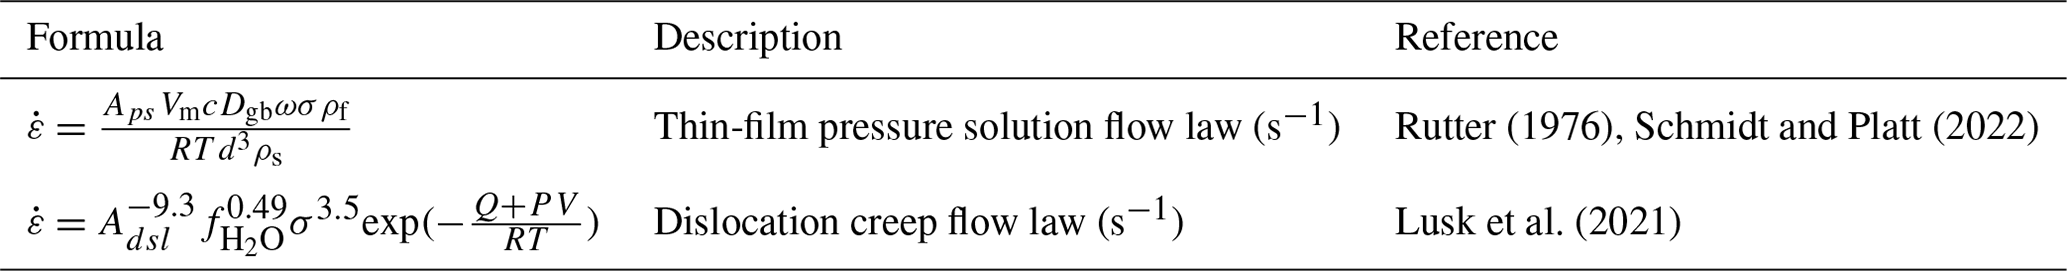
Table 4Parameters of dislocation creep and pressure solution creep flow law.
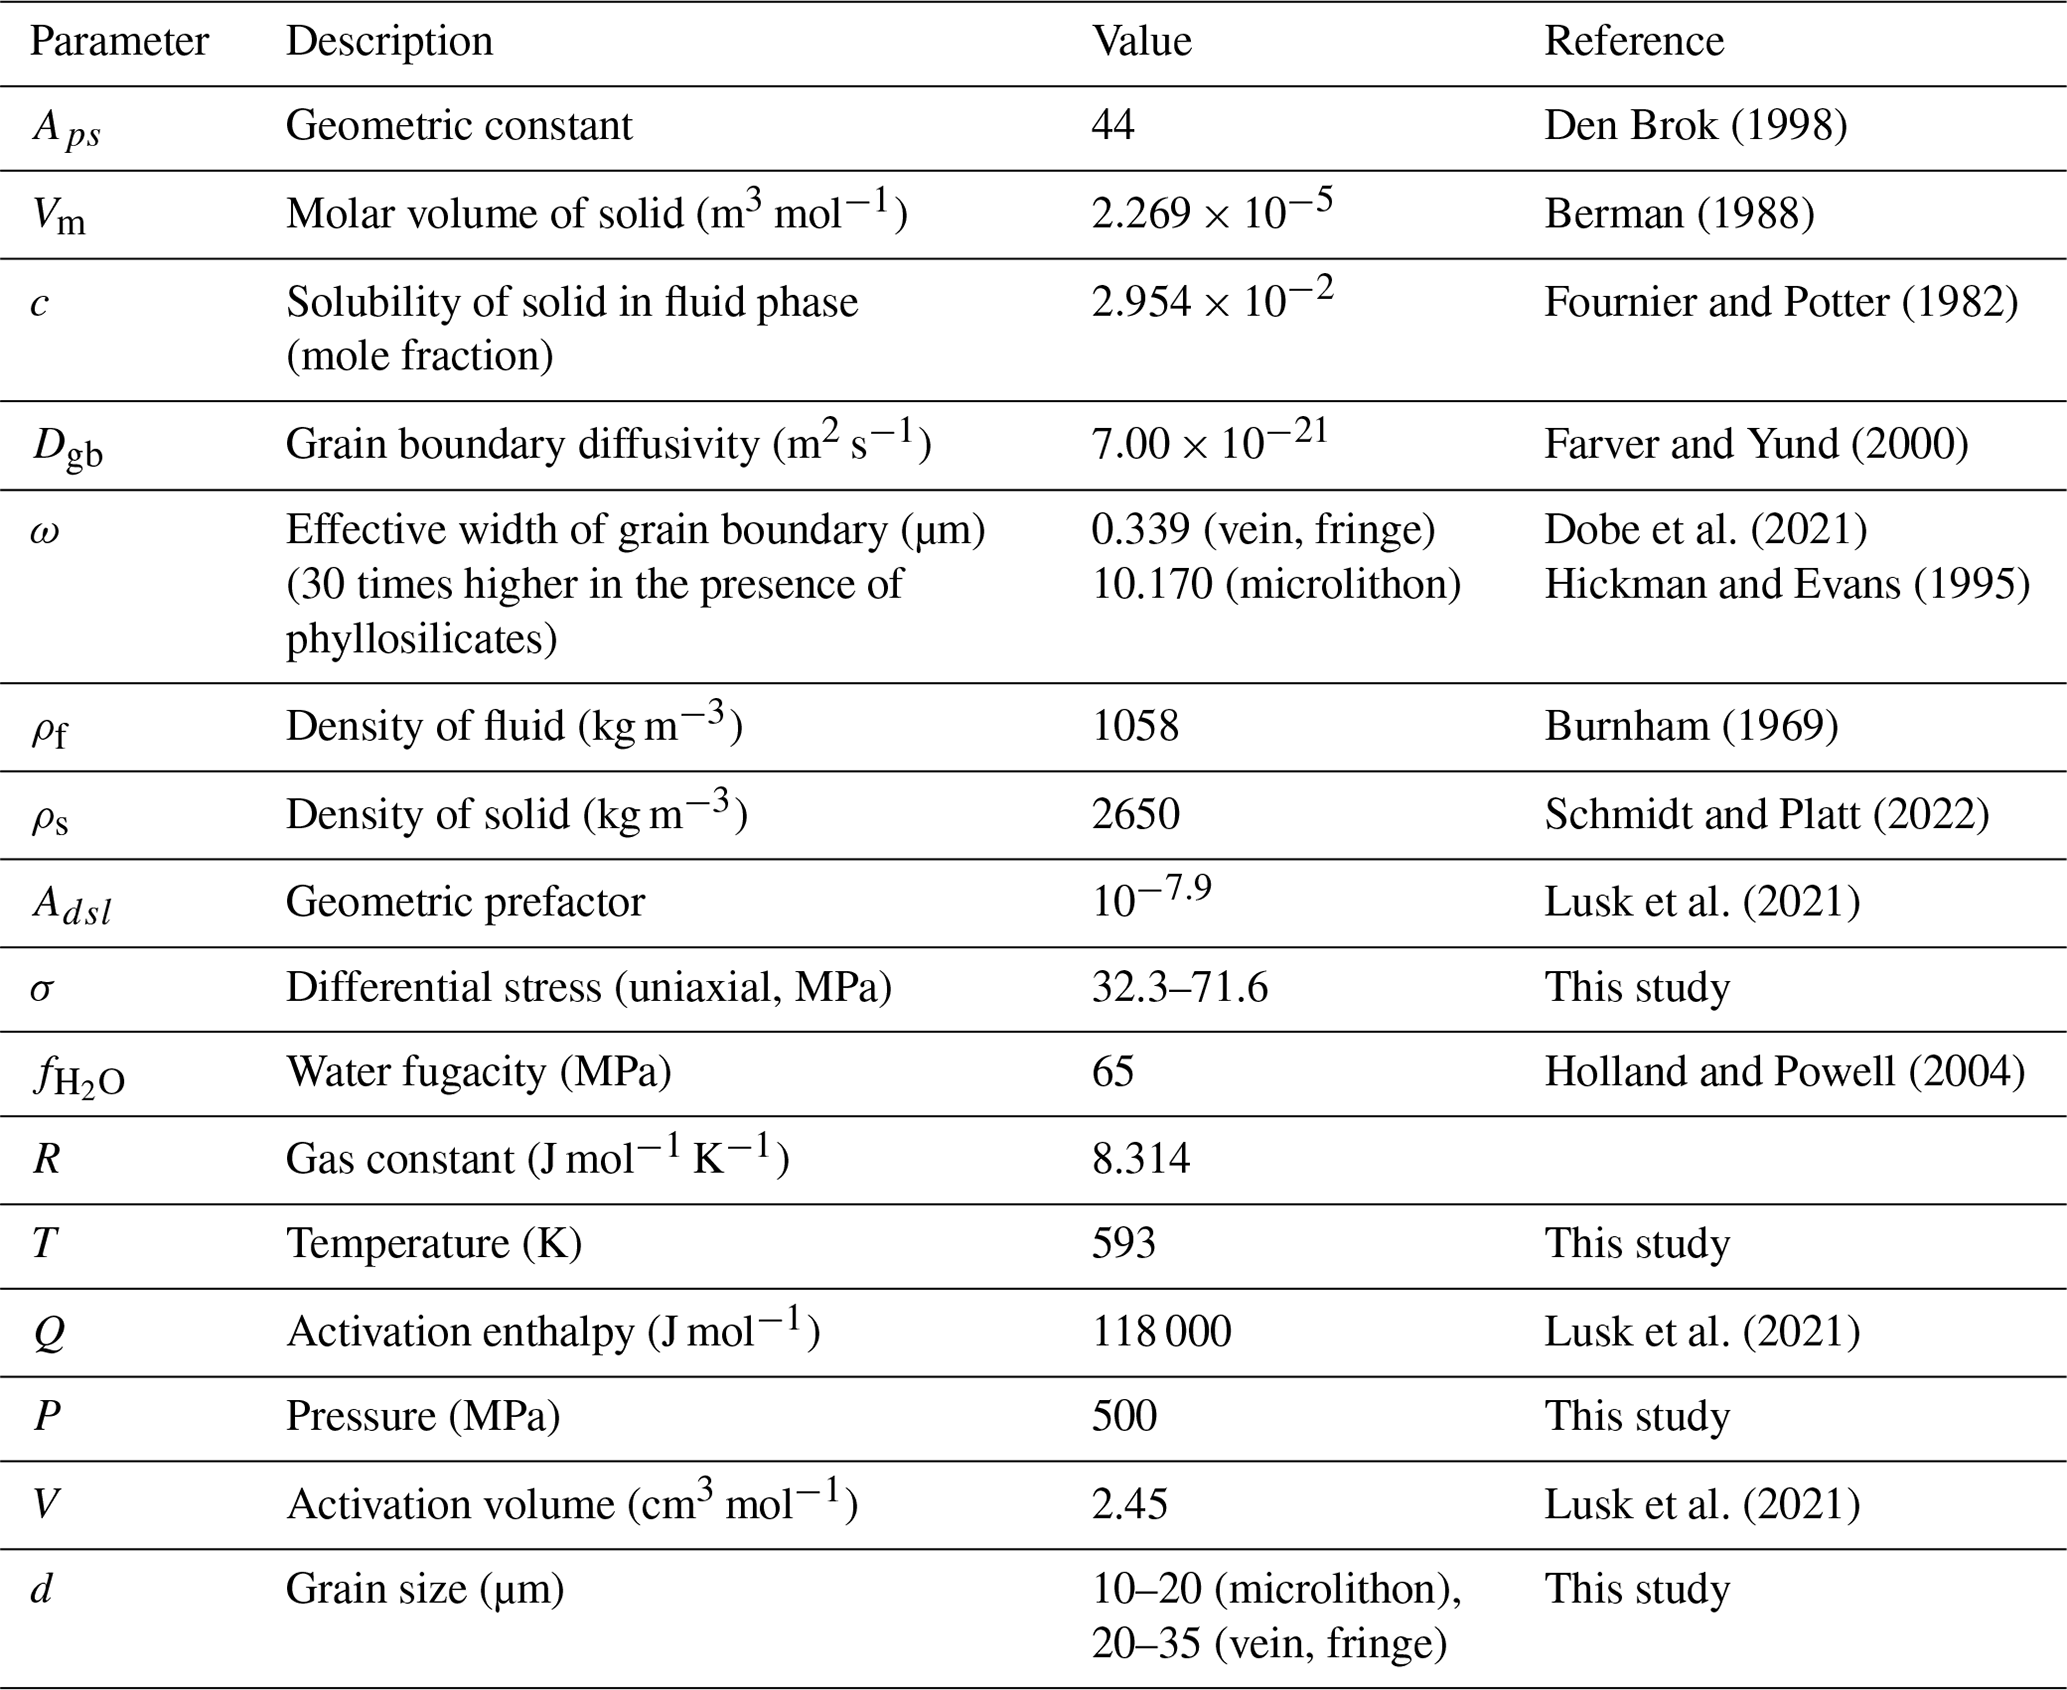
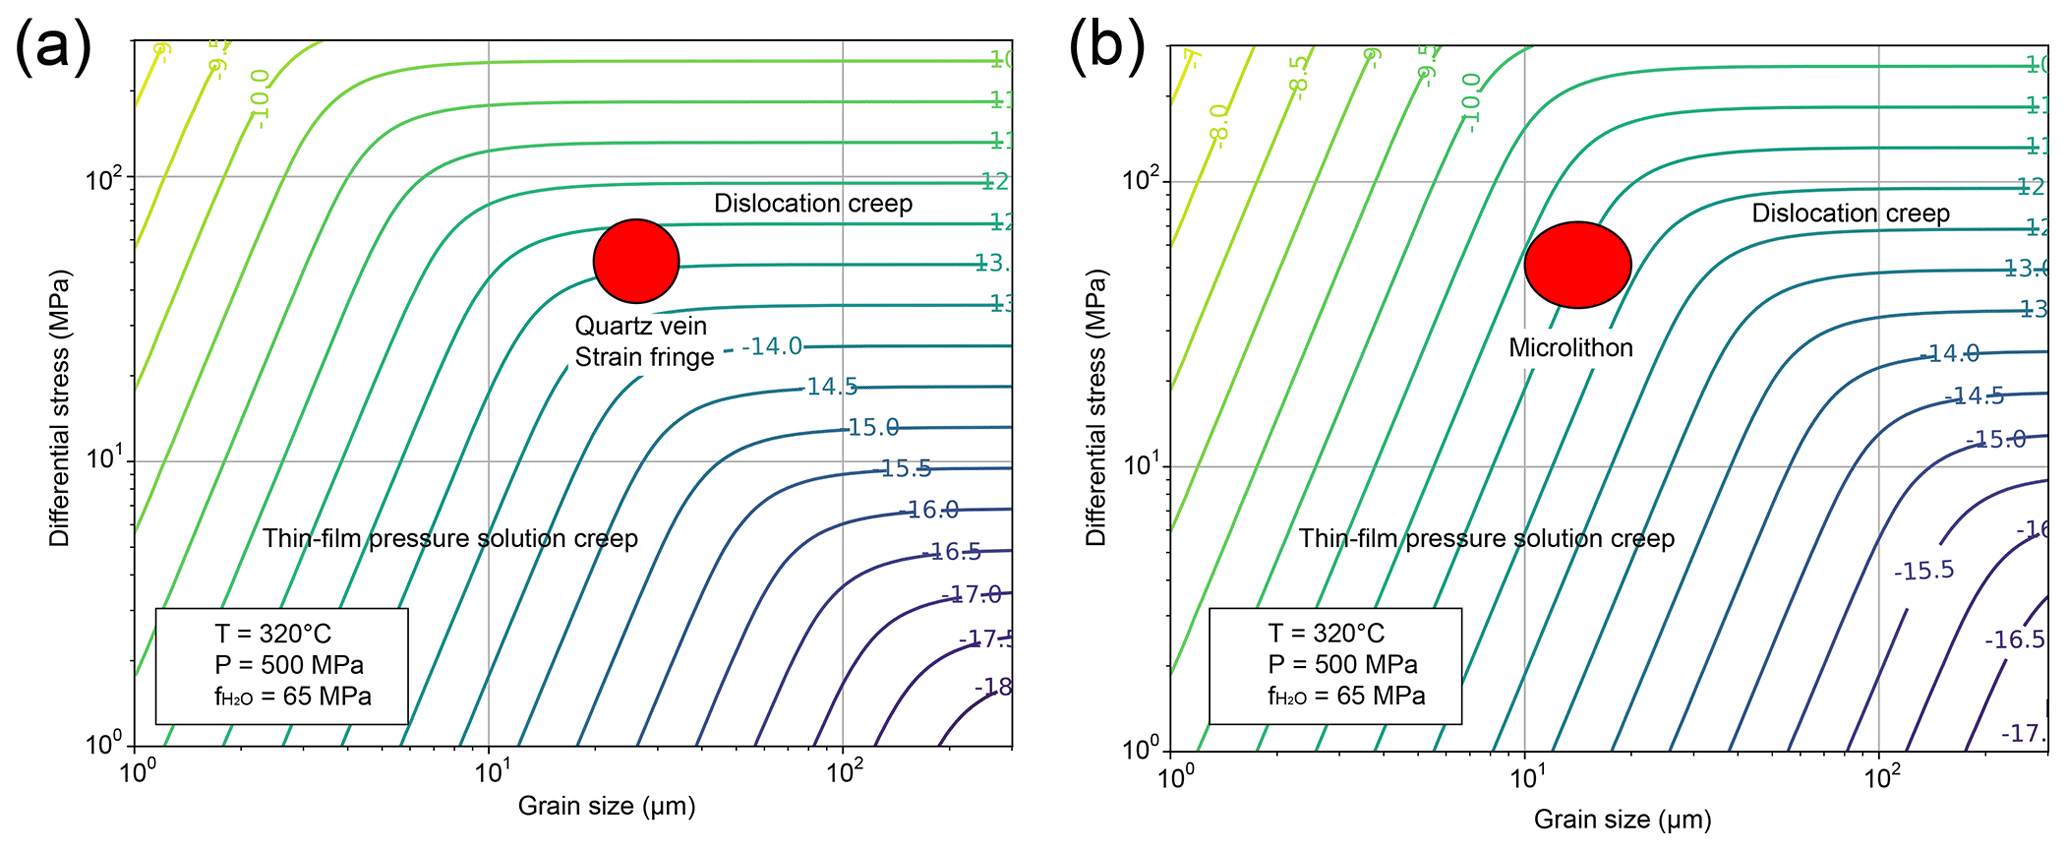
Figure 11Deformation mechanism diagram of (a) quartz vein and strain fringe condition as well as (b) microlithon condition. The contour line indicates the exponential part of the strain rate (given for uniaxial conditions – strain rate needs to be multiplied by if converting to simple shear strain rate; Lusk et al., 2021).
Trepmann and Seybold (2019) observed quartz veins that formed and developed simultaneously with ductile deformation and documented microstructures indicating dislocation glide and recrystallization associated with rapid stress loading (assumed to be from the seismogenic zone) and subsequent stress relaxation. They also observed the pressure solution creep of surrounding rock and opening and sealing of the veins (crack–seal veins) associated with gradual internal stress loading and subsequent stress relaxation. The structures observed in the sample ASM1b area are similar to the latter and may reflect multiple stages of stress concentration and relaxation with a time interval of several hundred years (Trepmann and Seybold, 2019). In this case, the stress measured from the quartz vein in sample ASM1 may be affected by a stress fluctuation. However, considering that dynamic recrystallization requires strains of at least 0.2 (e.g., Stipp and Tullis, 2003) and that the calculated strain rate is approximately 10−13 s−1, dynamically recrystallized grains require at least 30 000 years to form. Therefore, the influence of stress fluctuation over a period of a few hundred years can be considered almost negligible.
In summary, we consider the obtained stress to be representative of the stresses undergone by the surrounding pelitic and psammitic schists. Such situations are only likely to occur when the deformation conditions are located near the boundary between the dislocation creep domain and the pressure solution creep domain. The change in the deformation mechanism between the vein or fringe and microlithon domains can be attributed to differences in the degree of grain growth inhibition and activation of pressure solution creep due to the presence or absence of a quartz–mica boundary.
5.2.3 Deformation heterogeneity within different lithologies and stress in the subduction plate interface
Tulley et al. (2020) compared the flow laws for various rocks with the strength of hydrous metabasalt inferred from the geological structure and quartz recrystallized grain size. The results showed that mica-containing metasediments can be harder or softer than hydrous metabasalt or amphibolite, depending on temperature conditions. It was also shown that the strength of hydrous metabasalt is reduced by pressure solution creep and slip of phyllosilicates, which plays an important role in deformation along the subduction boundary. Therefore, the discussion of deformation other than quartz, pelitic, and psammitic schist is important for the discussion of rock deformation at subduction boundaries.
In this study, no microstructural observations or stress estimates of quartz schist and basic schist in the chlorite zone or pelitic and basic schist in the garnet and albite zones have been made. However, previous studies showed that the basic schist in the oligoclase biotite zone appears to be less affected by Ds deformation than other rock bodies (e.g., Mori and Wallis., 2010), indicating that the associated strain is smaller. In addition, the quartz schist in the garnet zone has well-developed sheath folds (Wallis, 1990; Endo and Yokoyama, 2019), which are not observed in the surrounding lithologies, suggesting that the strain in the quartz schist is particularly high. It is therefore possible that each rock body was deformed at a different strain rate and may have been deformed at the same stress. To investigate this, stress estimates should be made from the quartz domains for each type of schist, and the strength relationship between the other domains and the quartz domains in each schist should be investigated from structural observations to constrain the deformation strength of each rock type. If the flow laws of the constituent minerals are known, they may be combined to estimate the deformation of the entire rock body (Handy, 1994; Platt, 2015; Condit et al., 2022). It is also important to focus on lithological boundaries to confirm the presence or absence of structures that are attributable to strength contrasts. These are topics for future research.
Shear zones in antigorite serpentinite exist at the boundary between mantle-wedge-derived serpentinite and pelitic schist (Kawahara et al., 2016). Although the area examined in our study is on the oceanic plate side of the subduction boundary region, it is possible that different minerals and different stress and strain conditions existed on the overriding plate side. Further research is needed on this as well.
5.3 Spatial distribution of stress in the Sanbagawa subduction zone
The use of different proposed piezometer relationships based on grain size results in significant differences in the estimated stress. A further complication highlighted by this study is the variation in grain size depending on the orientation of the observed section with respect to the finite strain axes. This issue is not significant in deformation experiments that predominantly use uniaxial shortening but is significant in natural samples that are close to plane strain (e.g., Tagami and Takeshita, 1998). When these uncertainties are included, the differential (maximum shear) stress was found to be 30.8–82.7 MPa (15.4–41.4 MPa) for plane stress in samples ASM1–4. Moreover, there was no clear correlation between the sample location and stress (Fig. 12), implying that stress was constant throughout the range of different temperatures and pressures during peak metamorphism to the early stage of exhumation. This suggests that constant stress regardless of depth was maintained over a long timescale. If the stress recorded by the quartz recrystallization is representative of the stress along the plate interface, this result indicates that the stress along the former plate interface was independent of depth and nearly constant over the depth range of 17–27 km where depth is calculated under the assumption that granitic rock is present up to a depth of 20 km, and gabbroic rock is present at greater depths (e.g., Aoya et al., 2013a). This information can be applicable to long-timescale subduction zone modeling.
In an earlier study, Takeshita (2021) reported the results of microstructural analyses of quartz-rich samples in the Shirataki unit of the Sanbagawa belt and estimated differential stress from quartz grain size. Takeshita (2021) proposes a decrease in differential stress with increasing structural level (”upper Chl” to “Ab-bt” of Fig. 6 in Takeshita, 2021), which corresponds to increasing metamorphic temperature and pressure in this study domain. The results of Takeshita (2021) differ from those of this study, and it is particularly clear that samples formed by SGR+GBM (GBM in Takeshita, 2021) show very low differential stress. This difference may be mainly attributed to the type of piezometer used to analyze the recrystallized microstructures formed by SGR+GBM. As mentioned above, the recrystallized microstructure formed by SGR+GBM is developed by the formation of subgrains by SGR and the migration of grain boundaries by GBM. Several studies have pointed out that dislocation movement and grain nucleation have a greater temperature dependence than grain boundary migration, and this leads to grain size decreases with increasing temperature for the same differential stress (e.g., De Bresser, 1998; Shimizu, 1998) (and greater strain rate). Furthermore, Shimizu (2008, 2012) theoretically derived a piezometer for the SGR+GBM recrystallized microstructure that incorporates this temperature effect and shows a grain size decrease with increasing deformation temperature for the same differential stress. In contrast, Takeshita (2021) uses a piezometer proposed by Twiss (1980), in which grain size is temperature-independent (details of the differences between the theories of Twiss, 1980, and Shimizu, 2008, 2012, are described in Shimizu, 2008). Twiss (1980) quoted data from various experimental studies in which dynamically recrystallized grain size and differential stress were determined by using recrystallized microstructure of experimental samples and natural samples, including quartz, olivine, and metal alloys. Twiss (1980) subsequently generated a nondimensional piezometer that best fits these experimental data (Eq. 23 in Twiss, 1980), and Takeshita (2021) applied quartz physical properties (Table 2 in Twiss, 1980) to this nondimensional piezometer. This nondimensional piezometer does not have a strong material dependency and it is reasonable to use experimental results for different materials to construct a piezometer. However, a potentially significant problem is that the deformation experiments used in Twiss (1980) were conducted under higher temperature conditions (814–1699 ∘C) than the deformation temperatures of the samples in the Sanbagawa belt (about 500 ∘C).
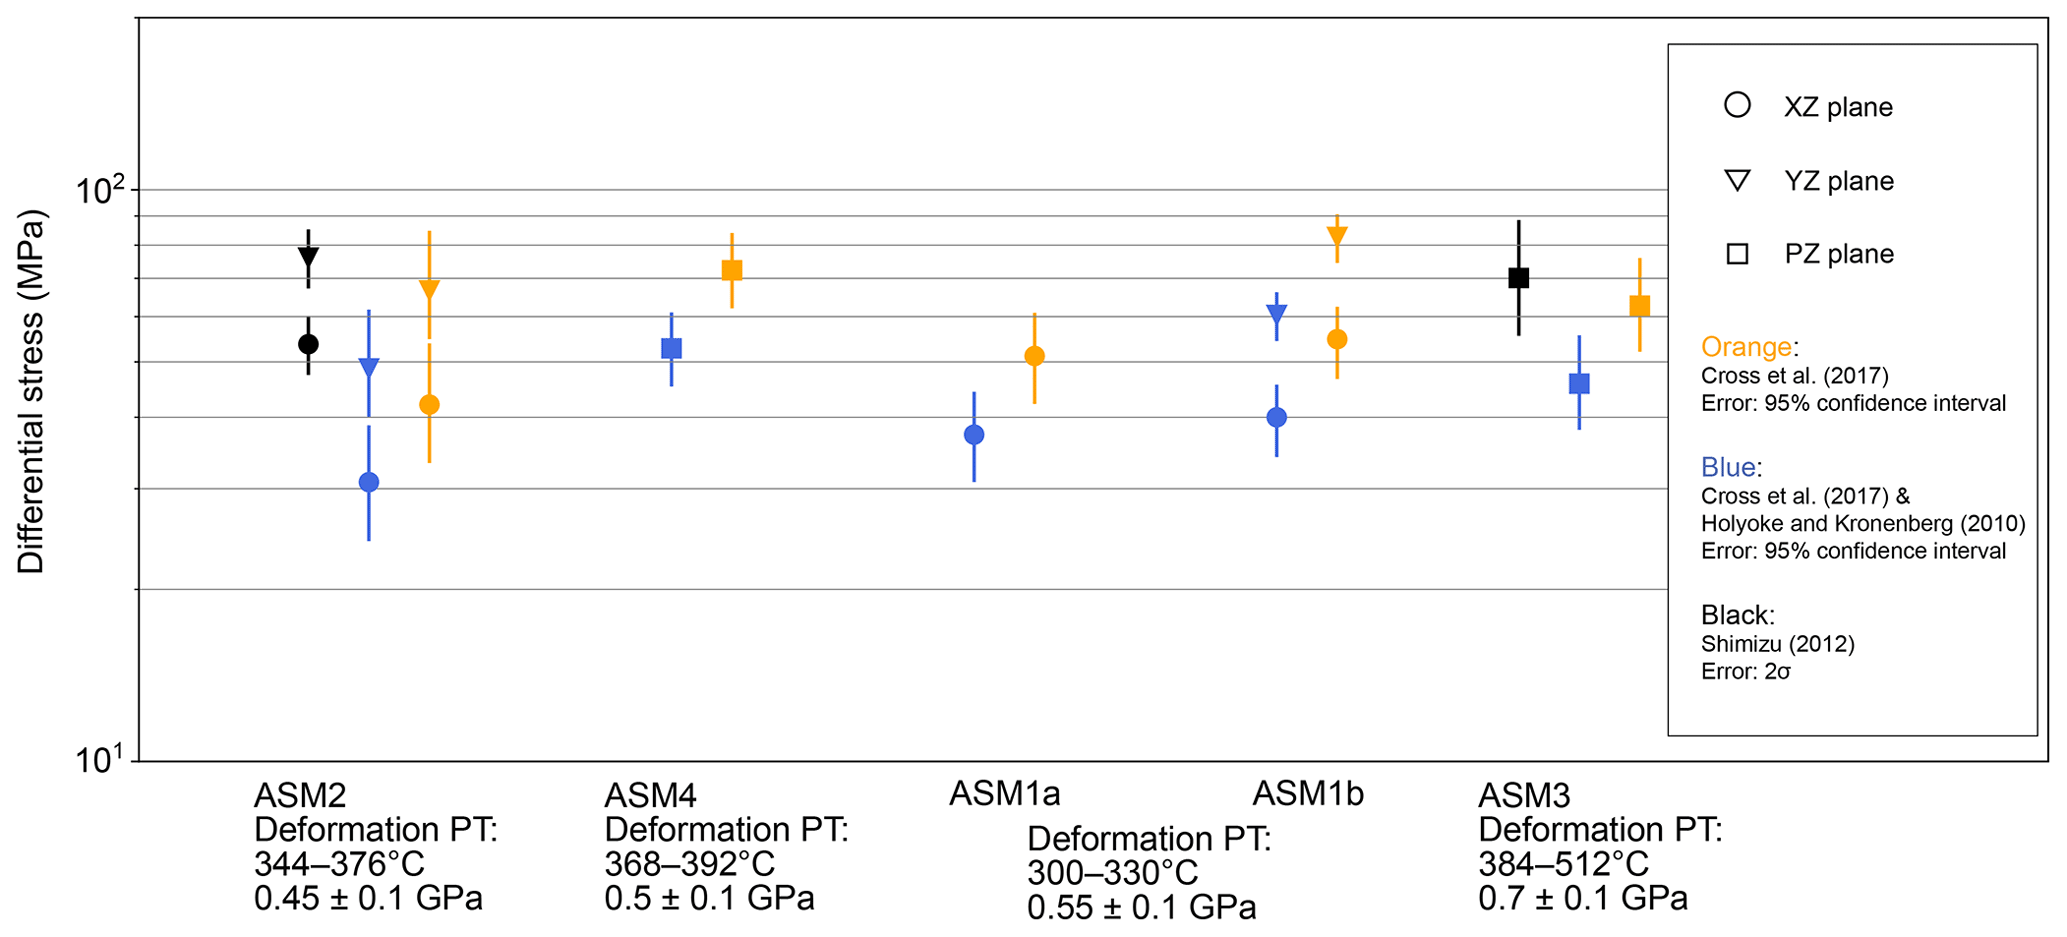
Figure 12Differential stress for plane stress conditions estimated using piezometers based on recrystallized quartz grain size. The vertical axis indicates differential stress. Black points were calculated following Shimizu (2012), orange points were calculated following Cross et al. (2017), and blue points were calculated following Cross et al. (2017) using a correction for measured values by the Griggs apparatus, which is proposed by Holyoke and Kronenberg (2010). Circle, triangle, and square points indicate measurements in the x–z, y–z, and p–z planes. The black, orange, and blue lines show uncertainties associated with differential stress associated with the black (2σ), orange (95 % confidence interval), and blue points (95 % confidence interval).
If SGR+GBM microtextures are contained in these deformation experiments, the piezometer will predict a smaller grain size under the same stress condition and therefore underestimates the differential stress when analyzing recrystallized microstructure formed by SGR+GBM in the Sanbagawa belt. We note that this problem also exists in the piezometer proposed by Cross et al. (2017), but this piezometer is based on analysis of newly recrystallized grains alone and the size of these grains is only weakly affected by GBM, so the temperature effect should be relatively small. The result of stress estimation of samples ASM1–4 by using the piezometer of Twiss (1980), which shows lower differential stress values for microstructures formed by SGR+GBM and higher values for microstructures formed by SGR (Fig. 13), supports this idea. The obtained stress values in Fig. 13 are greater than those of Takeshita (2021). This may be due to the fact that the EBSD-based grain boundary estimation method makes it possible to consider smaller grains.
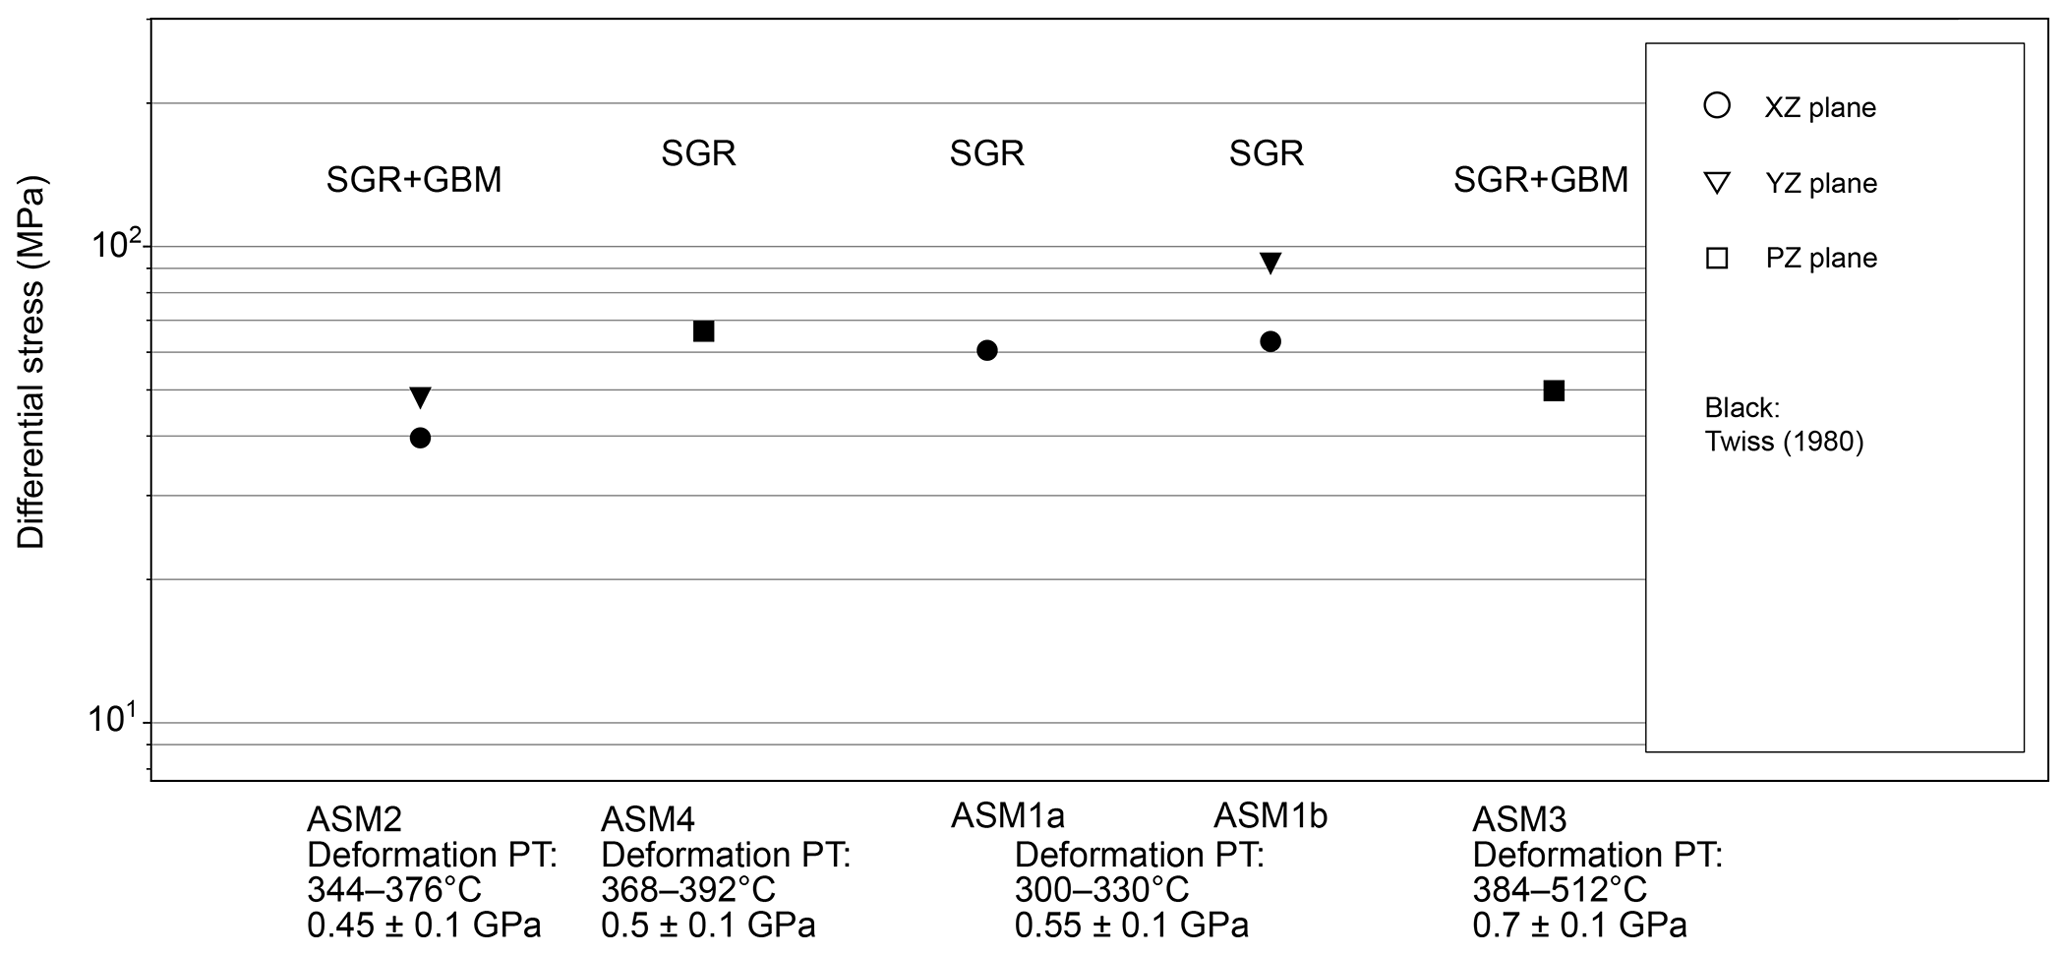
Figure 13Differential stress for plane stress conditions estimated using piezometers by Twiss (1980). The vertical axis indicates differential stress. Stress estimated by microstructures formed by SGR+GBM is clearly lower than stress estimated by microstructures formed by SGR. Applied grain sizes are the arithmetic mean and were calculated from the grain boundaries for Shimizu (2012).
5.4 Relationship with deep slow earthquakes
The Sanbagawa belt formed in a relatively warm subduction zone, and deep slow earthquakes are commonly observed in modern-day warm subduction zones such as SW Japan (Obara, 2020), which has a similar thermal structure to the Sanbagawa belt (Fig. 2). Moreover, the depth of deformation of samples ASM1–4 is consistent with the depth at which deep slow earthquakes occur. Deep slow earthquakes are commonly observed concentrated in a domain near and updip of the mantle wedge corner (Behr and Bürgmann, 2021). In the Sanbagawa belt, it is found that ultramafic rocks of the Shirataki unit are not present in the chlorite and lower garnet zone (Aoya et al., 2013a), and it is concluded that these ultramafic rocks are derived from the mantle wedge (Aoya et al., 2013a; Aoya and Endo, 2017). The peak pressure of the garnet zone corresponds to a depth of approximately 30–35 km, indicating that the mantle wedge of the Sanbagawa subduction zone was located at depths deeper than 30–35 km. The paleodepths of samples ASM1–4 were 17–27 km, which is near and updip of the mantle wedge, suggesting that these samples were formed in a region with features similar to the domain of deep slow earthquakes.
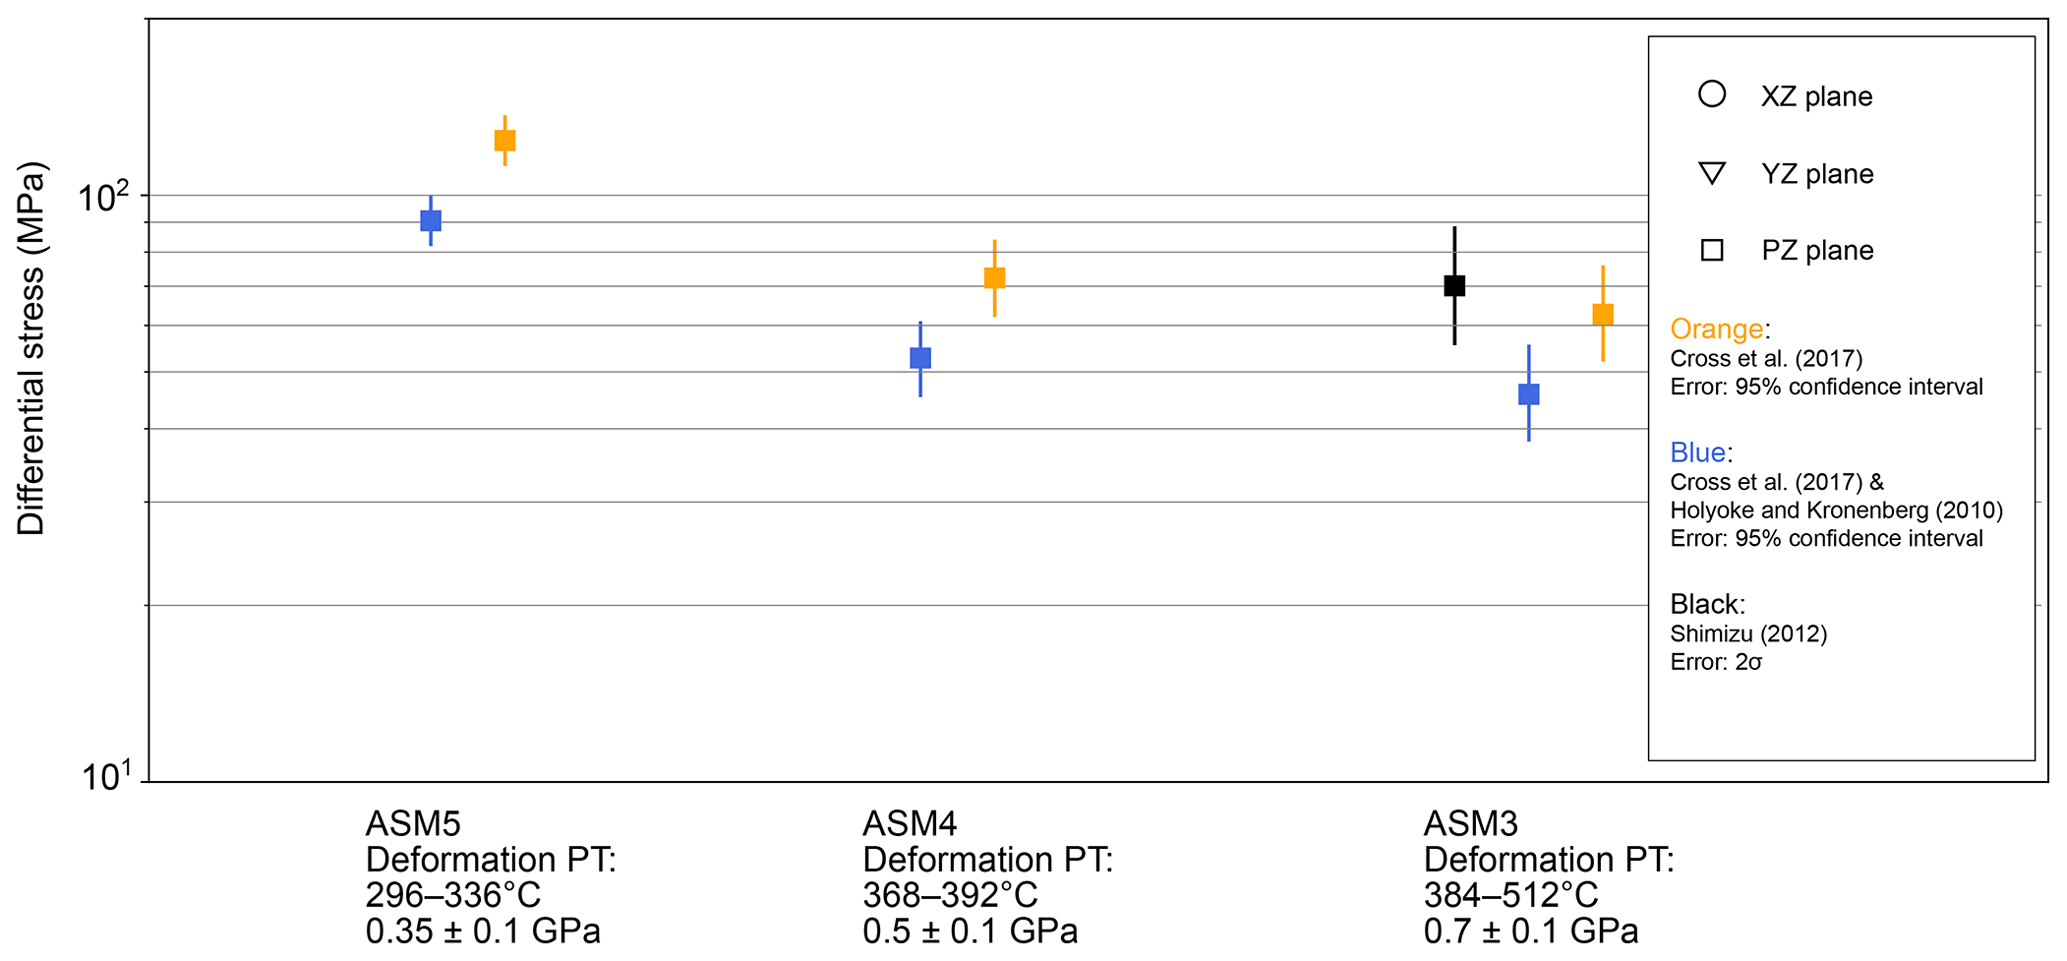
Figure 14Differential stress for plane stress conditions estimated using piezometers based on recrystallized quartz grain size. The vertical axis indicates differential stress. Black points were calculated following Shimizu (2012), orange points were calculated following Cross et al. (2017), and blue points were calculated following Cross et al. (2017) using a correction for measured values by the Griggs apparatus, which is proposed by Holyoke and Kronenberg (2010). Circle, triangle, and square points indicate measurements in the x–z, y–z, and p–z planes. The black, orange, and blue lines show uncertainties associated with differential stress associated with the black (2σ), orange (95 % confidence interval), and blue points (95 % confidence interval).
In sample ASM1b, traces of pressure solution creep and dislocation creep, such as dynamically recrystallized grains in quartz veins and strain fringes in microlithons, are observed. On the other hand, the partly recrystallized quartz fibers in quartz veins (Fig. 6b) and phyllosilicate foliation suggest that brittle deformation associated with features such as vein opening and phyllosilicate slip also occurred at the same time. This indicates that the quartz vein was opened under close to lithostatic pore fluid pressure and the fiber quartz grains grew before undergoing recrystallization. Repetition of this sequence in the rock deformed by quartz pressure solution creep combined with slip along phyllosilicates led to the formation of the present structure (Fig. 6a). This microstructure is similar to crack–seal veins, and the formation process is similar to the structures inferred by Giuntoli et al. (2022) and Ujiie et al. (2018), although bands of fluid inclusions were not observed. In particular, this feature may be compared with the results of the study by Giuntoli et al. (2022), which suggests that dislocation creep and pressure solution creep of quartz, phyllosilicate slip, and vein formation all contribute to slow earthquake cycles and associated fluid migration.
The stress estimates in sample ASM1 are considered to be representative of the surrounding rock body. The maximum shear stress drop on the fault plane caused by slow earthquakes could be hundreds to thousands of times smaller than that of ordinary earthquakes (e.g., Ito and Obara, 2006; Behr and Bürgmann, 2021), and unless the fault plate is oriented very close to the orientation of the principal stresses, it will have very little effect on the estimated maximum shear stress value. Therefore, the obtained stress can be used as stress conditions at the time that deep slow earthquakes were initiated. The results from sample ASM1 (32.3 to 71.6 MPa and 10−11 to 10−12 s−1 in uniaxial deformation, which must be multiplied by for simple shear strain rate; Lusk et al., 2021) show similar stresses but higher strain rates than the estimates reported by Giuntoli et al. (2022) (43 to 55 MPa as an upper bound and 10−14 to 10−13 s−1 as a lower bound). These differences may reflect the faster strain rates in the Sanbagawa subduction zone, associated with rapid subduction velocities (24 cm yr−1).
As discussed above, Trepmann and Seybold (2019) observed pressure solution creep of the surrounding rock and opening and sealing of the veins (crack–seal veins) associated with gradual internal stress loading and subsequent stress relaxation. The structures found in the ASM1 area are similar to these structures and may reflect multiple stress concentrations and relaxations on a scale of several hundred years. If the timescale for the formation of the veins can be constrained, the viability of this to generate slow earthquakes can be tested by measuring the number of veins and the timescale taken to form the entire vein seen in the outcrop, which can then be compared to known timescales of slow earthquakes.
5.5 Stress evolution of rock bodies during exhumation
In Fig. 9, the samples with blue circles are considered to have deformed later in the exhumation process than sample ASM3. Therefore, to examine the changes in stresses received by the rocks during exhumation, we compared the estimated stresses of samples ASM3–5, which were collected from almost the same location and recorded different deformation temperatures. Using the peak pressure condition by Enami et al. (1994), the peak temperature condition by Kouketsu et al. (2021), the retrograde P–T gradient by Okamoto and Toriumi (2005), and estimated deformation temperatures, we derived deformation pressure conditions for these samples of 0.7±0.1 GPa (27 km) for ASM3, 0.5±0.1 GPa (19 km) for ASM4, and 0.35±0.1 GPa (13 km) for ASM5. The results (Fig. 14) show that, assuming plane stress conditions, the estimated differential (maximum shear) stresses of samples ASM3 and 4 are 45.8–70.1 MPa (22.9–35.0 MPa) and 52.8–72.3 MPa (26.4–36.2 MPa), respectively, indicating that the stresses are almost constant until the middle part of the ascent. In contrast, the estimated differential (maximum shear) stress of sample ASM5, which is the final recorded stage of ductile deformation during ascent in this region, was found to increase significantly, ranging from 90.5 to 124 MPa (45.3 to 62.0 MPa). As shown in Fig. 9, there are few plots of deformation temperature conditions as low as ASM5, and almost all data recorded deformation closer to the onset of exhumation. Therefore, it is suggested that stress conditions remained similar until mid-crustal levels where deformation became concentrated in discrete bands associated with higher stresses as represented by sample ASM5.
Quartz-rich rocks, quartz veins, and quartz strain fringes from the subduction-type Sanbagawa belt exposed in central Shikoku, southwestern Japan, preserve deformation-related microstructures that can be used to estimate paleo-differential (maximum shear) stresses. These quartz-rich rocks have characteristics of quartz-dominant deformation, and quartz veins and fringes consisting almost entirely of quartz can be expected to have a strength comparable to the surrounding rocks, suggesting that the estimated stresses are roughly representative of the subduction interface. Estimates of both differential (maximum shear) stress and deformation temperature were obtained from measurements of recrystallized grain sizes and the opening angle of quartz c-axis fabric patterns. The known P–T paths for the region can be used to relate temperature to pressure (and depth). After correcting the differential (maximum shear) stress estimates based on uniaxial compression deformation experiments to account for plane stress conditions, the obtained results show 30.8–82.7 MPa (15.4–41.4 MPa) consistent over depths of 17–27 km in the paleo-subduction channel. Differential (maximum shear) stresses during exhumation initially show slight change but increase during the lower-T final stages of exhumation-related ductile deformation. The prograde P–T path of the Sanbagawa belt is similar to the thermal structure modeled for modern-day warm subduction zones such as SW Japan where deep slow earthquakes are common. Some of the studied samples were derived from depths near the mantle wedge where deep slow earthquakes are common. Therefore, the estimated differential (maximum shear) stress may not only be useful for long-timescale subduction zone modeling but also represent the initial conditions from which slow earthquakes in the same domain nucleated.
Table A1Quartz c-axis fabric opening-angle measurement.
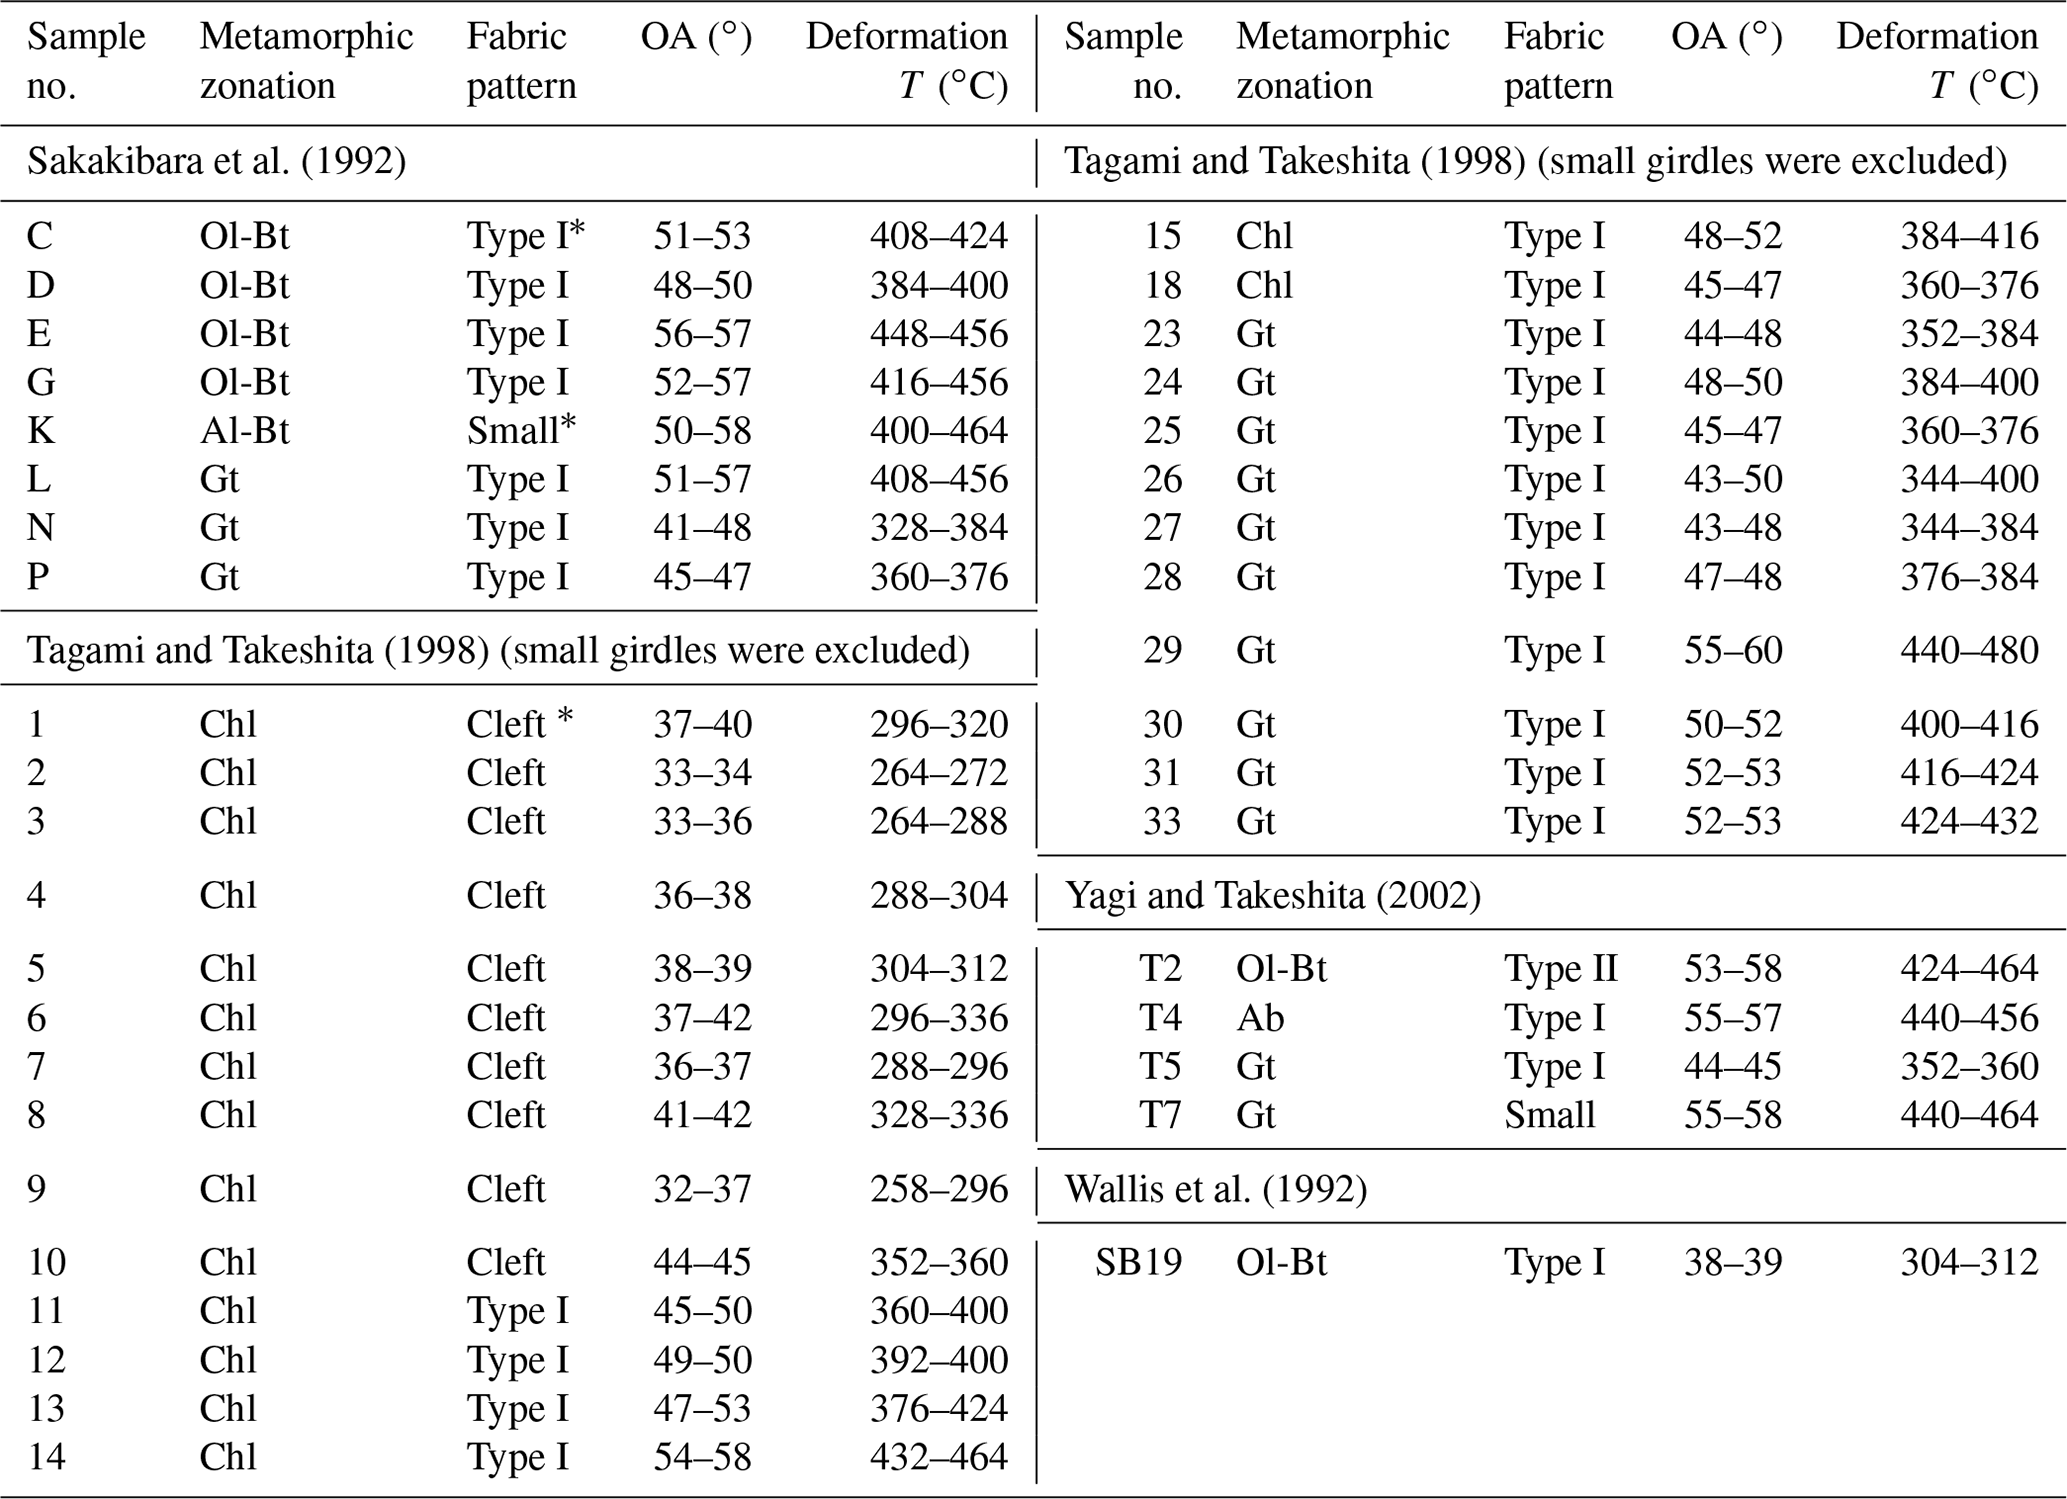
*Type I: type 1 crossed girdle. Type II: type 2 crossed girdle. Cleft: cleft girdle. Small: small girdle.
It is the deviatoric component of the stress tensor that causes shearing of materials. In general, definition of this tensor requires knowledge of all three of its principal stresses. However, the difference between the maximum and minimum principal stresses, or differential stress, can be used as an effective measure of the stresses causing deformation. Geological piezometers are presented as equations relating this differential stress to grain size. The main piezometer used in this study is based on the results of deformation experiments under uniaxial conditions ) (Cross et al., 2017) or theory under the assumption of uniaxial conditions (Shimizu, 2012). Therefore, to convert the output differential stresses to differential stresses in the stress field more representative of natural conditions ), a correction must be made. An overview of the procedure is given below (see also Behr and Platt, 2013). For simplicity, the material is assumed to be isotropic.
Deviatoric stress applied to a material causes it to shear and undergo strain. This strain generates elastic strain energy. The dislocation density varies with the amount of elastic strain energy and the recrystallized grain size varies according to the density of dislocations. The relationship between the deviatoric stress tensor (or differential stress) and grain size in the piezometer can then be summarized as the relationship between the elastic strain energy to which the material is subject and the grain size. The elastic strain energy due to the shear is the same amount as the elastic strain energy due to the deviatoric stress tensor the object is subjected to. Therefore, when the deviatoric stress tensor changes, the elastic strain energy applied to the material also changes, and the grain size will be different even if the differential stress is the same.
The second invariant of the deviatoric stress tensor, J2, is a scalar quantity that describes the magnitude of the elastic strain energy and is given by the following equation:
where σi is the magnitude of the principal stresses.
Substituting any stress condition,
Eq. (B1) is transformed into the following:
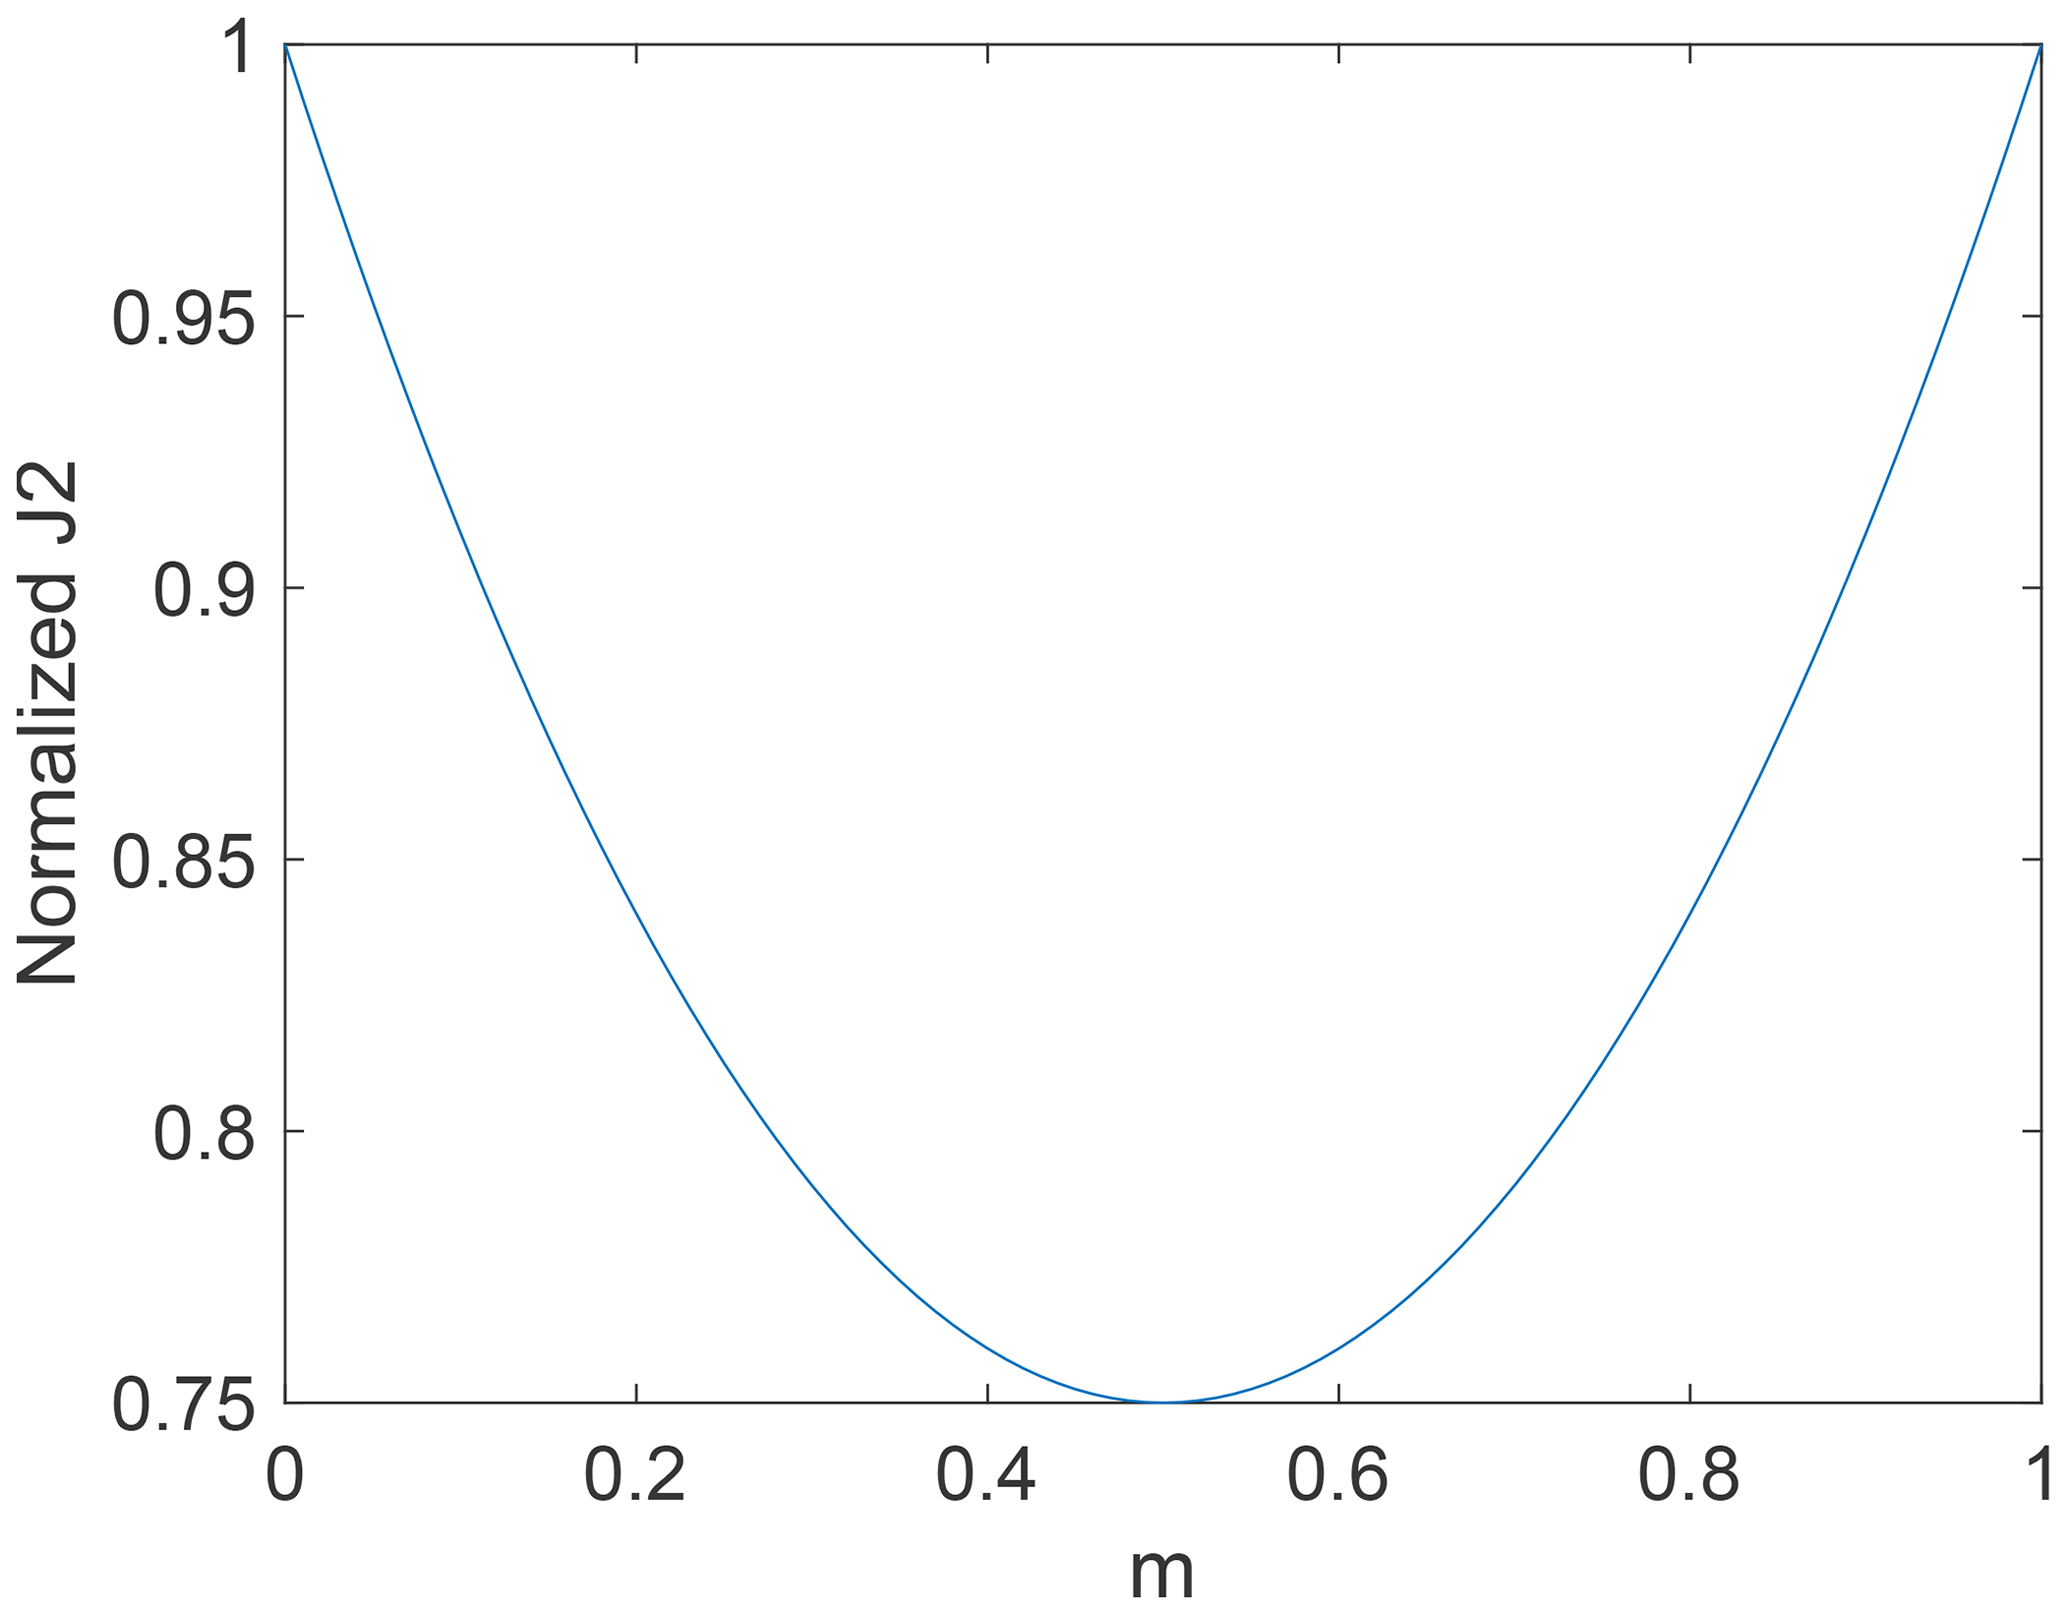
Figure B1Value of J2 normalized by max value. The horizontal axis indicates m in the above equation. 0.5: plane stress, 0 or 1: uniaxial.
It can be seen from Eq. (B3) and Fig. B1 that the elastic strain energy varies with the deviatoric stress tensor for the same differential stress: in the plane stress condition, it is times lower than for uniaxial conditions, where it reaches a maximum value. In order to give the same strain energy, this second invariant should show the same value. Therefore, to result in the same strain energy in the natural plane stress field as that given to quartz in the uniaxial compression test, the differential stress (σ1−σ3) for plane stress has to be greater by a factor of .
Since the dynamically recrystallized quartz grains measured in this study were generated in a natural stress field with conditions inferred to be close to plane stress, the original differential stress in natural conditions can be calculated by multiplying the piezometer results by . Since maximum shear stress is 0.5 times the differential stress, the maximum shear stress can be calculated by dividing the measurement result by .
The Cross et al. (2017) piezometer can be written as follows using the Briggsian logarithm of the experimentally obtained differential stress and the Briggsian logarithm of the recrystallized grain size:
where rms is root mean square grain size (µm), σ is differential stress (MPa), and a and b are parameters obtained by fitting experimental data. The errors shown in the piezometer of Cross et al. (2017) are derived from parameter fitting.
When substituting the measured grain size into this piezometer, we consider the error propagation between the error of the piezometer and the measured grain size (the Briggsian logarithm of the rms: log10RMS). The standard error of “the mean of the squares of particle sizes” can be calculated by using the central limit theorem (Table 1). The Briggsian logarithm of the square root of the mean of the squares of the particle sizes is “log10RMS”. Therefore, we generated 10 000 random numbers following a normal distribution with the mean and standard deviation of the mean of the squares of particle sizes and calculated the Briggsian logarithm of the square root of the generated random numbers to obtain a random number following log10RMS. “Average grain size” was defined as the Briggsian logarithm of the square root of the mean of the squares of particle sizes.
The regression coefficients and their variance–covariance matrix of the piezometer in Cross et al. (2017) were then calculated from the experimental data used to formulate the piezometer in Cross et al. (2017). Using the least-squares method, a best-fit equation of 10 and a covariance of −0.0234 were obtained. This is almost identical to the best-fit equation for the piezometer in Cross et al. (2017) of 10 if the error is considered to be 2σ.
When calculating the error propagation, a Monte Carlo simulation was performed because the relative error was too large to use an approximate formula. The 95 % confidence intervals of the stresses were estimated by generating 10 000 random numbers following a distribution of log10RMS, generating 10 000 random numbers following the regression coefficients and their variance–covariance matrix of the piezometer in Cross et al. (2017), and simulating the stress calculation 10 000 times. “Average stress” was calculated by substituting average grain size into the piezometer without considering errors and is written in Table 2 and plotted in Figs. 12 and 14. In this study, the code of Cross et al. (2017) was modified to perform the calculation (“Code and data availability” section).
The Shimizu (2012) piezometer can be written as follows using the differential stress σ, deformation temperature T, and the mode of the natural logarithm of the recrystallized grain size (defined as ModelnD):
ModelnD is measured by the probability density of logarithmic grain sizes obtained by applying kernel density estimation to the grain size histogram. Since the logarithmic grain size distribution can be regarded as the logarithmic normal distribution (Shimizu, 1998) and ModelnD is almost identical to the mean of the power index of grain size, the confidence interval of ModelnD can be calculated using the properties of a Student's t distribution. However, the number of data points is at least 72 (number of grains), indicating that the Student's t distribution closely approximates a standard normal distribution. Therefore, the standard error of ModelnD was calculated using the central limit theorem. In this study, the code of Cross et al. (2017) was modified to perform the calculation (“Code and data availability” section).
The uncertainties by the piezometer of Shimizu (2012) are not shown. Therefore, uncertainties of estimated differential (shear) stresses are only related to grain size measurement and deformation temperature.
S is the standard deviation (error).
Code and data are available at https://doi.org/10.5281/zenodo.10251625 (Koyama et al., 2023: https://github.com/YukinojoKoyama/Koyama-et-al.CodeandData/tree/v1.2.0, last access: 27 January 2024).
The supplement related to this article is available online at: https://doi.org/10.5194/se-15-143-2024-supplement.
YK and SRW developed the conceptualization of this study. All authors conducted geological field surveys and specimen sampling. TN and YK designed thin section production methods. TN provided the SEM–EBSD analysis method and appropriate analysis conditions. Crystallographic orientations were collected by YK and TN. The stress and deformation temperature estimation methods were organized by all authors. YK was involved in the data curation and modified computer programs from previous studies. All authors were involved in the validation process. The interpretation of the dataset, preparation of the original draft, figure design, reviews, and editing of the paper were carried by all authors.
The contact author has declared that none of the authors has any competing interests.
Publisher's note: Copernicus Publications remains neutral with regard to jurisdictional claims made in the text, published maps, institutional affiliations, or any other geographical representation in this paper. While Copernicus Publications makes every effort to include appropriate place names, the final responsibility lies with the authors.
We are grateful to Ken Yamaoka, Taisuke Ito, and Thomas Yeo of the University of Tokyo for a lot of useful advice concerning the polishing of thin sections and the deformation mechanisms of quartz. We also thank Kazuhito Ozawa, Asuka Yamaguchi, Yukio Masumoto, and all the members of the SGT and Petrotectonics seminar at the University of Tokyo for helpful discussions and suggestions on this research. We also thank two anonymous referees and the topical editor, Federico Rossetti, for their useful comments that helped to improve the paper and for conducting the peer-review process. People that have contributed to MTEX are also acknowledged for providing an open-source MTEX toolbox for MATLAB. This research was supported by JSPS Grants in Aid 21H05202, 21H01188, and 20KK0079 awarded to Simon R. Wallis.
This research has been supported by the Japan Society for the Promotion of Science (grant nos. 21H05202, 21H01188, and 20KK0079).
This paper was edited by Federico Rossetti and reviewed by two anonymous referees.
Aoya, M.: P-T-D Path of Eclogite from the Sambagawa Belt Deduced from Combination of Petrological and Microstructural Analyses, J. Petrol., 42, 1225–1248, 2001.
Aoya, M.: Structural position of the Seba eclogite unit in the Sambagawa Belt: Supporting evidence for an eclogite nappe, Isl. Arc., 11, 91–110, https://doi.org/10.1046/j.1440-1738.2002.00359.x, 2002.
Aoya, M. and Endo, S.: Recognition of the “early” Sambagawa metamorphism and a schematic cross-section of the Late-Cretaceous Sambagawa subduction zone, J. Geol. Soc. Japan, 123, 677–698, https://doi.org/10.5575/geosoc.2017.0008, 2017.
Aoya, M., Endo, S., Mizukami, T., and Wallis, S. R.: Paleo-mantle wedge preserved in the Sambagawa high-pressure: Metamorphic belt and the thickness of forearc continental crust, Geology, 41, 451–454, https://doi.org/10.1130/G33834.1, 2013a.
Aoya, M., Noda, A., Mizuno, K., Mizukami, T., Miyachi, Y., Matsuura, H., Endo, S., Toshimitsu, S., and Aoki, M.: Geology of the Niihama District. Quadrangle Series 1:50000, GSJ. AIST., Tsukuba, 181 pp., BB12998059, 2013b.
Aoya, M., Mizukami, T., and Endo, S.: Geologic traverse of the Sambagawa metamorphic belt in central Shikoku, SW Japan, J. Geol. Soc. Japan., 123, 491–514, https://doi.org/10.5575/geosoc.2017.0038, 2017.
Bachmann, F., Hielscher, R., and Schaeben, H.: Grain detection from 2d and 3d EBSD data-Specification of the MTEX algorithm, Ultramicroscopy, 111, 1720–1733, https://doi.org/10.1016/j.ultramic.2011.08.002, 2011.
Banno, S. and Sakai, C.: Geology and metamorphic evolution of the Sanbagawa metamorphic belt, Japan, Geol. Soc. Spec. Publ. Lond., 43, 519–532, https://doi.org/10.1144/GSL.SP.1989.043.01.50, 1989.
Behr, W. M. and Bürgmann, R.: What's down there? The structures, materials and environment of deep-seated slow slip and tremor, Philos. T. Roy. Soc. A, 379, 20200218, https://doi.org/10.1098/rsta.2020.0218, 2021.
Behr, W. M. and Platt, J. P.: Rheological evolution of a Mediterranean subduction complex, J. Struct. Geol., 54, 136–155, https://doi.org/10.1016/j.jsg.2013.07.012, 2013.
Berman, R. G.: Internally-Consistent Thermodynamic Data for Minerals in the System Na2O–K2O–CaO–MgO–FeO–Fe2O3–Al2O3–SiO2–TiO2–H2O–CO2, J. Petrol., 29, 445–522, https://doi.org/10.1093/petrology/29.2.445, 1998.
Burnham, C. W., Holloway, J. R., and Davis, N. F.: The thermodynamic properties of water to 1000 ∘C and 10,000 bars, Geol. Soc. Am. Spec. Paper, ISBN 9780813721323, 1969.
Chang, C., McNeill, L. C., Moore, J. C., Lin, W., Conin, M., and Yamada, Y.: In situ stress state in the Nankai accretionary wedge estimated from borehole wall failures, Geochem. Geophy. Geosy., 11, Q0AD04, https://doi.org/10.1029/2010GC003261, 2010.
Condit, C. B., French, M. E., Hayles, J. A., Yeung, L. Y., Chin, E. J., and Lee, C. A.: Rheology of Metasedimentary Rocks at the Base of the Subduction Seismogenic Zone, Geochem. Geophy. Geosy., 23, e2021GC010194, https://doi.org/10.1029/2021GC010194, 2022.
Cross, A. J., Prior, D. J., Stipp, M., and Kidder, S.: The recrystallized grain size piezometer for quartz: An EBSD-based calibration, Geophys. Res. Lett., 44, 6667–6674, https://doi.org/10.1002/2017GL073836, 2017.
De Bresser, J. H. P., Peach, C. J., Rejis, J. P. J., and Spiers, C. J.: On dynamic recrystallization during solid state flow: Effects of stress and temperature, Geophys. Res. Lett., 25, 3457–3460, https://doi.org/10.1029/98GL02690, 1998.
Den Brok, S. W. J.: Effect of microcracking on pressure-solution strain rate: The Gratz grain-boundary model, Geology, 26, 915–918, https://doi.org/10.1130/0091-7613(1998)026<0915:EOMOPS>2.3.CO;2, 1998.
Derby, B.: The dependence of grain size on stress during recrystallization, Acta Metall. Mater., 39, 955–962, https://doi.org/10.1016/0956-7151(91)90295-C, 1991.
Dobe, R., Das, A., Mukherjee, R., and Gupta, S.: Evaluation of grain boundaries as percolation pathways in quartz-rich continental crust using Atomic Force Microscopy, Sci. Rep.-UK, 11, 1–10, https://doi.org/10.1038/s41598-021-89250-z, 2021.
Enami, M., Wallis, S. R., and Banno, Y.: Paragenesis of sodic pyroxene-bearing quartz schists: implications for the P-T history of the Sanbagawa belt, Contrib. Mineral. Petr., 116, 182–198, https://doi.org/10.1007/BF00310699, 1994.
Endo, S. and Wallis, S. R.: Structural architecture and low-grade metamorphism of the Mikabu-Northern Chichibu accretionary wedge, SW Japan, J. Metamorph. Geol., 35, 695–716, https://doi.org/10.1111/jmg.12251, 2017.
Endo, S. and Yokoyama, S.: Geology of the Motoyama District. Quadrangle Series , Geol. Soc. Japan, Tsukuba, 100 pp., BB28807342, 2019.
Endo, S., Wallis, S., Hirata, T., Anczkiewicz, R., Platt, J., Thirlwall, M., and Asahara, Y.: Age and early metamorphic history of the Sanbagawa belt: Lu-Hf and P–T constraints from the Western Iratsu eclogite, J. Metamorph. Geol., 27, 371–384, https://doi.org/10.1111/j.1525-1314.2009.00821.x, 2009.
Endo, S., Wallis, S. R., Tsuboi, M., Aoya, M., and Uehara, S.: Slow subduction and buoyant exhumation of the Sanbagawa eclogite, Lithos, 146–147, 183–201, https://doi.org/10.1016/j.lithos.2012.05.010, 2012.
Endo, S., Miyazaki, K., Danhara, T., Iwano, H., and Hirata, T.: Progressive changes in lithological association of the Sanbagawa metamorphic complex, Southwest Japan: Relict clinopyroxene and detrital zircon perspectives, Isl. Arc., 27, e12261, https://doi.org/10.1111/iar.12261, 2018.
Engebretson, D. C., Cox, A., and Gordon, R. G.: Relative Motions Between Oceanic and Continental Plates in the Pacific Basin, Geol. Soc. Am. S., 206, 1–59, https://doi.org/10.1130/SPE206-p1, 1985.
England, P.: On maximum shear stresses, Temperatures, and the Maximum Magnitudes of Earthquakes at Convergent Plate Boundaries, J. Geophys. Res.-Sol. Ea., 123, 7165–7202, https://doi.org/10.1029/2018JB015907, 2018.
Farver, J. and Yund, R.: Silicon diffusion in a natural quartz aggregate: constraints on solution-transfer diffusion creep, Tectonophysics, 325, 193–205, https://doi.org/10.1016/S0040-1951(00)00121-9, 2000.
Faure, M.: Microtectonic evidence for eastward ductile shear in the Jurassic orogen of SW Japan, J. Struct. Geol., 7, 175–186, https://doi.org/10.1016/0191-8141(85)90130-0, 1985.
Fournier, R. O. and Potter II, R. W.: An equation correlating the solubility of quartz in water from 25∘ to 900 ∘C at pressures up to 10,000 bars, Geochim. Cosmochim. Ac., 46, 1969–1973, https://doi.org/10.1016/0016-7037(82)90135-1, 1982.
Gao, X. and Wang, K.: Strength of stick-slip and creeping subduction megathrusts from heat flow observation, Science, 345, 1038–1041, https://doi.org/10.1126/science.1255487, 2014.
Giuntoli, F., Viola, G., and Sørensen, B. E.: Deformation Mechanisms of Blueschist Facies Continental Metasediments May Offer Insights Into Deep Episodic Tremor and Slow Slip Events, J. Geophys. Res.-Sol. Ea., 127, e2022JB024265, https://doi.org/10.1029/2022JB024265, 2022.
Goddard, R. M., Hansen, L. N., Wallis, D., Stipp, M., Holyoke III, C. W., Kumamoto, K. M., and Kohlstedt, D. L.: A Subgrain-Size Piezometer Calibrated for EBSD, Geophys. Res. Lett., 47, e2020GL090056, https://doi.org/10.1029/2020GL090056, 2020.
Hara, H., Aoya, M., Noda, A., Tanabe, S., Yamasaki, T., Ohno, T., and Komazawa, M.: Geological map of Japan 1:200 000, Kochi, 2nd edn., Geol. Soc. Japan., Tsukuba, 11 pp., BA73944602, 2018.
Handy, M. R.: Flow laws for rocks containing two non-linear viscous phases: A phenomenological approach, J. Struct. Geol., 16, 287–301, https://doi.org/10.1016/0191-8141(94)90035-3, 1994.
Hickman, S. H. and Evans, B.: Kinetics of pressure solution at halite-silica interfaces and intergranular clay films, J. Geophys. Res.-Sol. Ea., 100, 13113–13132, https://doi.org/10.1029/95JB00911, 1995.
Higashino, T.: The higher grade metamorphic zonation of the Sambagawa metamorphic belt in central Shikoku, Japan, J. Metamorph. Geol., 8, 413–423, https://doi.org/10.1111/j.1525-1314.1990.tb00628.x, 1990.
Holland, T. J. B. and Powell, R.: An internally consistent thermodynamic data set for phases of petrological interest, J. Metamorph. Geol., 16, 309–343, https://doi.org/10.1111/j.1525-1314.1998.00140.x, 2004.
Holyoke, C. W. and Kronenberg, A. K.: Accurate differential stress measurement using the molten salt cell and solid salt assemblies in the Griggs apparatus with applications to strength, piezometers and rheology, Tectonophysics, 494, 17–31, https://doi.org/10.1016/j.tecto.2010.08.001, 2010.
Hunter N. J. R., Hasalová, P., Weinberg, R. F., and Wilson, C. J. L.: Fabric controls on strain accommodation in naturally deformed mylonites: The influence of interconnected micaceous layers, J. Struct. Geol., 83, 180–193, https://doi.org/10.1016/j.jsg.2015.12.005, 2016.
Ishii, K. and Wallis, S. R.: High- and low-stress subduction zones recognized in the rock record, Earth. Planet. Sc. Lett., 531, 115935, https://doi.org/10.1016/j.epsl.2019.115935, 2020.
Isozaki, Y. and Itaya, T.: Chronology of Sanbagawa metamorphism, J. Metamorph. Geol., 8, 401–411, https://doi.org/10.1111/j.1525-1314.1990.tb00627.x, 1990.
Ito, Y. and Obara, K.: Very low frequency earthquakes within accretionary prisms are very low stress-drop earthquakes, Geophys. Res. Lett., 33, L09302, https://doi.org/10.1029/2006GL025883, 2006.
Kawahara, H., Endo, S., Wallis, S. R., Nagaya, T., Mori, H., and Asahara, Y.: Brucite as an important phase of the shallow mantle wedge: Evidence from the Shiraga unit of the Sanbagawa subduction zone, SW Japan, Lithos, 254–255, 53–66, https://doi.org/10.1016/j.lithos.2016.02.022, 2016.
Kouketsu, Y., Sadamoto, K., Umeda, H., Kawahara, H., Nagaya, T., Taguchi, T., Mori, H., Wallis, S., and Enami, M.: Thermal structure in subducted units from continental Moho depths in a palaeo subduction zone, the Asemigawa region of the Sanbagawa metamorphic belt, SW Japan, J. Metamorph. Geol., 39, 727–749, https://doi.org/10.1111/jmg.12584, 2021.
Koyama, Y., Wallis, S. R., and Nagaya, T.: YukinojoKoyama/Koyama-et-al.CodeandData: Code and Data (v1.2.0), Zenodo [code and data set], https://doi.org/10.5281/zenodo.10251625, 2023.
Kruhl, J. H.: Reply: prism- and basal-plane parallel subgrain boundaries in quartz: a microstructural geothermobarometer, J. Metamorph. Geol., 16, 142–146, https://doi.org/10.1111/j.1525-1314.1998.00063.x, 1998.
Law, R. D.: Deformation thermometry based on quartz c-axis fabrics and recrystallization microstructures: A review, J. Struct. Geol., 66, 129–161, https://doi.org/10.1016/j.jsg.2014.05.023, 2014.
Lin, W.: Determination of in-situ stress state in a Japan Trench Fast Drilling Project (JFAST) borehole one year after the Tohoku-Oki great earthquake, Int. J. JRCM, 10, 1–4, https://doi.org/10.11187/ijjcrm.10.1, 2014.
Lusk, A. D. J., Platt, J. P., and Platt, J. A.: Natural and Experimental Constraints on a Flow Law for Dislocation-Dominated Creep in Wet Quartz, J. Geophys. Res.-Sol. Ea., 126, e2020JB021302, https://doi.org/10.1029/2020JB021302, 2021.
Morgan, S. S. and Law, R. D.: Unusual transition in quartzite dislocation creep regimes and crystal slip systems in the aureole of the Eureka Valley-Joshua Flat-Beer Creek pluton, California: A case for anhydrous conditions created by decarbonation reactions, Tectonophysics, 384, 209–231, https://doi.org/10.1016/j.tecto.2004.03.016, 2004.
Mori, H. and Wallis, S.: Large-scale folding in the Asemi-gawa region of the Sanbagawa Belt, southwest Japan, Isl. Arc., 19, 357–370, https://doi.org/10.1111/j.1440-1738.2010.00713.x, 2010.
Nagaya, T., Okamoto, A., Kido, M., Muto, J., and Wallis, S. R.: Dehydration of brucite + antigorite under mantle wedge conditions: insights from the direct comparison of microstructures before and after experiments, Contrib. Mineral. Petr., 177, 87, https://doi.org/10.1007/s00410-022-01956-z, 2022.
Obara, K.: Characteristic activities of slow earthquakes in Japan, P. Jpn. Acad. B-Phys., 96, 297–315, https://doi.org/10.2183/pjab.96.022, 2020.
Okamoto, A. and Toriumi, M.: Progress of actinolite-forming reactions in mafic schists during retrograde metamorphism: An example from the Sanbagawa metamorphic belt in central Shikoku, Japan, J. Metamorph. Geol., 23, 335–356, https://doi.org/10.1111/j.1525-1314.2005.00580.x, 2005.
Okamoto, K., Shinjoe, H., Katayama, I., Terada, K., Sano, Y., and Johnson, S.: SHRIMP U-Pb zircon dating of quartz-bearing eclogite from the Sanbagawa Belt, south-west Japan: Implications for metamorphic evolution of subducted protolith, Terra Nova, 16, 81–89, https://doi.org/10.1111/j.1365-3121.2004.00531.x, 2004.
Passchier, C. W. and Trouw, R. A. J.: Microtectonics, 2nd edn., Springer Berlin Heidelberg, Germany, 366 pp., https://doi.org/10.1007/3-540-29359-0, 2005.
Passeleque, F. X., Almakari, M., Dublanchet, P., Barras, F., Fortin, J., and Violay, M.: Initial effective stress controls the nature of earthquakes, Nat. Commun., 11, 5132, https://doi.org/10.1038/s41467-020-18937-0, 2020.
Platt, J. P.: Rheology of two-phase systems: A microphysical and observational approach, J. Struct. Geol., 77, 213–227, https://doi.org/10.1016/j.jsg.2015.05.003, 2015.
Platt, J. P., Xia, H., and Schmidt, W. L.: Rheology and stress in subduction zones around the aseismic/seismic transition, Prog. Earth Planet. Sci., 5, 24, https://doi.org/10.1186/s40645-018-0183-8, 2018.
Radvanec, M., Banno, S., and Okamoto, K.: Multiple stages of phengite formation in Sanbagawa schists, Miner. Petrol., 51, 37–48, 1994.
Rutter, E. H.: A Discussion on natural strain and geological structure – The kinetics of rock deformation by pressure solution, Philos. T. Roy. Soc.-A., 283, 203–219, https://doi.org/10.1098/rsta.1976.0079, 1976.
Sakakibara, N., Hara, I., Kanai, K., Shiota, T., Hide, K., and Paulitsch, P.: Quartz microtextures of the Sambagawa schists and their implications in convergent margin processes, Isl. Arc., 1, 186–197, https://doi.org/10.1111/j.1440-1738.1992.tb00069.x, 1992.
Sands, D. E.: Introduction to Crystallography, W.A. Benjamin Inc., ISBN 9780805384734, 1969.
Schmidt, W. L. and Platt, J. P.: Stress, microstructure, and deformation mechanisms during subduction underplating at the depth of tremor and slow slip, Franciscan Complex, northern California, J. Struct. Geol., 154, 104469, https://doi.org/10.1016/j.jsg.2021.104469, 2022.
Shimizu, I.: A stochastic model of grain size distribution during dynamic recrystallization, Philos. Mag., 79, 1217–1231, https://doi.org/10.1080/01418619908210357, 1998.
Shimizu, I.: Theories and applicability of grain size piezometers: The role of dynamic recrystallization mechanisms, J. Struct. Geol., 30, 899–917, https://doi.org/10.1016/j.jsg.2008.03.004, 2008.
Shimizu, I.: Steady-State Grain Size in Dynamic Recrystallization of Minerals, in: Recrystallization, edited by: Sztwiertnia, K., Intech, 371–386, https://doi.org/10.5772/33701, 2012.
Stipp, M. and Tullis, J.: The recrystallized grain size piezometer for quartz, Geophys. Res. Lett., 30, 2088, https://doi.org/10.1029/2003GL018444, 2003.
Stipp, M., Stünitz, H., Heilbronner, R., and Schmid, S. M.: The eastern Tonale fault zone: A “natural laboratory” for crystal plastic deformation of quartz over a temperature range from 250 to 700 ∘C, J. Struct. Geol., 24, 1861–1884, https://doi.org/10.1016/S0191-8141(02)00035-4, 2002.
Tagami, M. and Takeshita, T.: c-Axis fabrics and microstructures in quartz schist from the Sambagawa metamorphic belt, central Shikoku, Japan, J. Struct. Geol., 20, 1549–1568, https://doi.org/10.1016/S0191-8141(98)00044-3, 1998.
Takeshita, T.: Quartz microstructures from the sambagawa metamorphic rocks, southwest japan: Indicators of deformation conditions during exhumation, Minerals-Basel, 11, 1038, https://doi.org/10.3390/min11101038, 2021.
Trepmann, C. A. and Seybold, L.: Deformation at low and high stress-loading rates, Geosci. Front., 10, 43–54, https://doi.org/10.1016/j.gsf.2018.05.002, 2019.
Tulley, C. J., Fagereng, A., and Ujiie, K.: Hydrous oceanic crust hosts megathrust creep at low shear stresses, Sci. Adv., 6, eaba1529, https://doi.org/10.1126/sciadv.aba1529, 2020.
Twiss, R. J.: Theory and Applicability of a Recrystallized Grain Size Paleopiezometer, Pageoph, 115, 227–244, https://doi.org/10.1007/BF01637105, 1977.
Twiss, R. J.: Static theory of size variation with stress for subgrains and dynamically recrystallized grains, in: Proceeding of conference Magnitude of deviatoric stress in the earth's crust and upper mantle, U.S. Department of The Interior, Menlo Park, California, America, 665–683, https://doi.org/10.3133/ofr80625, 1980.
Ujiie, K., Saishu, H., Fagereng, Å., Nishiyama, N., Otsubo, M., Masuyama, H., and Kagi, H.: An Explanation of Episodic Tremor and Slow Slip Constrained by Crack-Seal Veins and Viscous Shear in Subduction Mélange, Geophys. Res. Lett., 45, 5371–5379, https://doi.org/10.1029/2018GL078374, 2018.
Vavryčuk, V.: Earthquake Mechanisms and Stress Field, in: Encyclopedia of Earthquake Engineering, edited by: Beer, M., Kougioumtzoglou, I. A., Patelli, E., and Au, S.-K., Springer, Berlin, Heidelberg, Germany, 728–746, https://doi.org/10.1007/978-3-642-35344-4, 2015.
Wallis, S. R.: The timing of folding and stretching in the Sambagawa belt: The Asemigawa region, central Shikoku, J. Geol. Soc. Jpn., 96, 345–352, https://doi.org/10.5575/geosoc.96.345, 1990.
Wallis, S. R.: Vorticity analysis in a metachert from the Sanbagawa Belt, SW Japan, J. Struct. Geol., 14, 271–280, https://doi.org/10.1016/0191-8141(92)90085-B, 1992.
Wallis, S.: Exhuming the Sanbagawa metamorphic belt: the importance of tectonic discontinuities, J. Struct. Geol., 16, 83–95, 1998.
Wallis, S. R., Banno, S., and Radvanec, M.: Kinematics, structure and relationship to metamorphism of the east-west flow in the Sanbagawa Belt, southwest Japan, Isl. Arc., 1, 176–185, https://doi.org/10.1111/j.1440-1738.1992.tb00068.x, 1992.
Wallis, S. R., Anczkiewicz, R., Endo, S., Aoya, M., Platt, J. P., Thirlwall, M., and Hirata, T.: Plate movements, ductile deformation and geochronology of the Sanbagawa belt, SW Japan: Tectonic significance of 89–88 Ma Lu-Hf eclogite ages, J. Metamorph. Geol., 27, 93–105, https://doi.org/10.1111/j.1525-1314.2008.00806.x, 2009.
Yagi, K. and Takeshita, T.: Regional variation in exhumation and strain rate of the high-pressure Sambagawa metamorphic rocks in central Shikoku, south-west Japan, J. Metamorph. Geol., 20, 633–647, https://doi.org/10.5575/geosoc.112.S101, 2002.
Yoshida, K., Hasegawa, A., and Okada, T.: Spatial variation of stress orientations in NE Japan revealed by dense seismic observations, Tectonophysics, 647–648, 63–72, https://doi.org/10.1016/j.tecto.2015.02.013, 2015.
Yoshioka, S. and Murakami, K.: Temperature distribution of the upper surface of the subducted Philippine Sea Plate along the Nankai Trough, southwest Japan, from a three-dimensional subduction model: relation to large interplate and low-frequency earthquakes, Geophys. J. Int., 171, 302–315, https://doi.org/10.1111/j.1365-246X.2007.03510.x, 2007.
- Abstract
- Introduction
- Geological setting
- Methods
- Results
- Discussion
- Conclusions
- Appendix A: Measured OA from c-axis fabric patterns by previous studies
- Appendix B: Differential (maximum shear) stress calculation under any deviatoric stress tensor
- Appendix C: Error calculation method when using the Cross et al. (2017) piezometer
- Appendix D: Error calculation method when using the Shimizu (2012) piezometer
- Code and data availability
- Author contributions
- Competing interests
- Disclaimer
- Acknowledgements
- Financial support
- Review statement
- References
- Supplement