the Creative Commons Attribution 4.0 License.
the Creative Commons Attribution 4.0 License.
 | 13 Mar 2024
Investigating rough single-fracture permeabilities with persistent homology
Anna Suzuki
Togo Hasumi
Philipp Blum
The permeability of rock fractures is a crucial parameter for flow processes in the subsurface. In the last few decades, different methods were developed to investigate on permeability in fractures, such as flow-through experiments, numerical flow simulations, or empirical equations. In recent years, the topological method of persistent homology was also used to estimate the permeability of fracture networks and porous rocks but not for rough single fractures yet. Hence, we apply persistent homology analysis on a decimetre-scale, rough sandstone bedding joint. To investigate the influence of roughness, three different data sets are created to perform the analysis: (1) 200 µm, (2) 100 µm, and (3) 50 µm resolutions. All estimated permeabilities were then compared to values derived by experimental air permeameter measurements and numerical flow simulation. The results reveal that persistent homology analysis is able to estimate the permeability of a single fracture, even if it tends to slightly overestimate permeabilities compared to conventional methods. Previous studies using porous media showed the same overestimation trend. Furthermore, the expenditure of time for persistent homology analysis, as well as air permeameter measurements and numerical flow simulation, was compared, which showed that persistent homology analysis can be also an acceptable alternative method.
- Article
(3639 KB) - Full-text XML
- BibTeX
- EndNote


The permeability of rocks is a crucial parameter for fluid flow processes in the subsurface. While the prevailing flow processes in porous media are well understood, a different picture emerges when the flow is dominated by fractures (Suzuki et al., 2019). Although flow in geological settings controlled by fractures is occurring in both shallow aquifers (e.g. for drinking water supply) and deep reservoirs (e.g. geothermal energy production and oil and gas abstraction), fractures are often simplified as two parallel plates. In addition, due to complexity reasons, a single parameter, the hydraulic aperture, is often used to represent the permeability of a single fracture or even entire discrete fracture networks (Min et al., 2004; Blum et al., 2009; Müller et al., 2010). However, due to roughness of fracture surfaces, a single value is not sufficient to capture the flow channelling and critical flow paths (Tsang, 1992; Tsang and Neretnieks, 1998). Hence, investigations of the fracture roughness are essential, although this is more expensive in terms of the costs and time (Tatone and Grasselli, 2012, 2013).
Nowadays, various methods are available to study how fluid flow is influenced by fracture roughness through single fractures. These can be divided into four major categories: (1) empirical, (2) experimental, (3) numerical, and (4) geometric methods.
Empirical methods are simple and also fast, cheap, and often sufficient to provide a first overview over the flow behaviour of a fracture. There are different empirical models derived from flow experiments, numerical simulations, or statistical models of different fracture types (Louis, 1972; Barton and Quadros, 1997; Xiong et al., 2011; Kling et al., 2017; Suzuki et al., 2017). Often, solely mechanical apertures and relative roughness, depending on the standard deviation, are required to not only calculate hydraulic apertures but also the fractal dimension or the Peklenik number, which is defined as the ratio of the correlation length in the x and y directions (Patir and Cheng, 1978; Brown, 1987).
Experimental methods provide more detailed results than empirical methods which use more simplified relations for fast practical application. The standard methodology is flow-through experiments at laboratory scale to observe flow patterns in single fractures (Brown et al., 1998; Watanabe et al., 2008; Ferer et al., 2011). In recent years, hydromechanical coupling (Vogler et al., 2018; Wang et al., 2021) or reactive transport have additionally been performed for the exclusive investigation of flow patterns in flow-through experiments (Durham et al., 2001; Huerta et al., 2013). In addition to typical flow tests at laboratory scale, it is also possible to perform flow experiments on larger scales in the laboratory or in the field (Novakowski and Lapcevic, 1994; Thörn and Fransson, 2015; Weede and Hötzl, 2005). Flow-through experiments allow us to investigate direct fluid flow through fractures. The flow distribution and preferred flow paths can be predicted by replicating the fracture geometry in transparent materials. Beside flow-through experiments, air permeameters can be used to determine the permeability of fractures (Cheng et al., 2020; Hale et al., 2020; Hale and Blum, 2022). Air permeameters allow us to measure the permeability of fractures directly on an outcrop or drilling core (Brown and Smith, 2013). In addition, it is also possible to obtain a zonal observation of the permeability, since several measurements have to be conducted along a fracture outcrop due to the measurement method (Hale et al., 2020).
Another way to investigate flow in fractures is the representation of the fracture in numerical models. For this purpose, the geometry of a fracture is either projected onto a two-dimensional surface (Pyrak-Nolte and Morris, 2000; Javanmard et al., 2021) or represented in three dimensions (Javadi et al., 2010; Xiong et al., 2011; Wang et al., 2016; Chen et al., 2021). The latter increases the computational effort considerably and also allows a more accurate investigation of flow processes. Another major advantage is that it is possible to simulate various scenarios under different conditions, such as high confining pressures or high flow rates, which would exceed technically possible conditions in laboratory experiments. In addition, numerical models are able to consider flow effects, region by region, in the fracture and therefore characterise the main flow paths (Marchand et al., 2020; Javanmard et al., 2021). However, the geometry of the fracture and the prevailing boundary conditions for simulations have to be precisely known in order to obtain meaningful results (Barton et al., 1985; Tatone and Grasselli, 2012).
If the focus is set on the investigation of the flow behaviour and permeability distribution within the fracture, then geometric methods can also be used. The Kozeny–Carman equation is well known as a representative method for estimating flow properties from pore structures (Kozeny, 1927; Carman, 1937), and attempts have long been made to estimate permeability by extracting porosity from images without experiments or numerical simulations (Costa, 2006; Torskaya et al., 2014; Oliveira et al., 2020). More recently, attempts have been made to use machine learning or deep learning on images (Sudakov et al., 2019; Anderson et al., 2020; Araya-Polo et al., 2020; Hong and Liu, 2020; Alqahtani et al., 2021; Da Wang et al., 2021). Of course, deep learning is a powerful method, but adequate use of machine learning requires deep technical understanding, rigorous testing, and sufficient amounts of training data.
Topological data analysis (TDA) is another way to extract the information of shapes and structures from big data (Carlsson, 2009; Thiele et al., 2016). TDA is an analysis method that focuses on the structure of data within the field of algebraic topology, demonstrating particular strengths in handling data types such as images, complex structures, and networks. TDA can capture the structure of the data in a rough sense and characterise the features of connectivity and holes, therefore ignoring noises in data and extracting important information, such as the independent of coordinate system and number of dimensions. Persistent homology (PH), one of the most used TDA methods, can capture changes and continuity of topological features by tracking algebraic descriptions called homology. This method was developed in the early 2000s (Edelsbrunner et al., 2000; Zomorodian and Carlsson, 2005) and is applied in various research fields such as materials science (Hiraoka et al., 2016), computer science (Choudhury et al., 2012), and biology (Chan et al., 2013). In geosciences, this approach has only been applied in the past decade to characterise porous rocks and to determine their permeability (Delgado-Friedrichs et al., 2014; Robins et al., 2016; Bizhani and Haeri Ardakani, 2021). Furthermore, the determination of hydroelastic properties of porous media is possible with this method (Jiang et al., 2018). In the field of fractured rocks, persistent homology was recently also applied to study small-scale fracture networks (Suzuki et al., 2020, 2021). Based on these studies, the general application of PH for permeability estimation of fracture networks could be demonstrated. In these small-scale (millimetre to centimetre scale) studies, the effect of fracture roughness was not particularly investigated (Suzuki et al., 2020, 2021). Further research is therefore needed to investigate larger-scale fractured rocks, in which surface roughness has a significant effect on flow behaviour.
The objective of this study is therefore the application of the persistent homology analysis on a natural, mesoscale (decimetre scale) single fracture to estimate the permeability. The focus is on the anisotropy of permeability in different flow directions, as well as the influence of resolution on permeability. Thus, three data sets of the same fracture are prepared, which have different resolutions (50, 100, and 200 µm). Finally, these results are compared with results from experimental air permeameter measurements, as well as numerical flow simulations.
2.1 Fracture sample
The fracture sample is a natural bedding joint in a sandstone block taken from a quarry in Bebertal, Germany (Fig. 1; Heidsiek et al., 2020; Hale and Blum, 2022). The sandstone is Flechtinger sandstone, an oil and gas reservoir rock in the North German Basin. The block contains one bedding joint, with a length of 120 mm in the x direction and 450 mm in the y direction (Fig. 1). Previous studies have already characterised the relevant hydromechanical properties of Flechtinger sandstone such as porosity (9 %–11 %), matrix and fracture permeability, Young's modulus and bulk modulus, thermal dependencies of stress and strain behaviour, and the mineralogical composition (Frank et al., 2020; Cheng et al., 2020; Fischer et al., 2012; Hale and Blum, 2022; Heidsiek et al., 2020; Hale et al., 2020; Hassanzadegan et al., 2012; Blöcher et al., 2019). Of particular interest for this study is the low-matrix permeability of 0.1–1 mD (Cheng et al., 2020; Hassanzadegan et al., 2012). Furthermore, the findings of Gutjahr et al. (2022), Hale et al. (2020), and Hale and Blum (2022) are crucial, since they performed investigations on fracture permeability on exactly the same fracture. Gutjahr et al. (2022) investigated on the roughness of the fracture and calculated the Hurst exponent for different angles. The medians of all Hurst exponents in the x direction and in the y direction are 0.48 and 0.42, respectively. Hale et al. (2020) and Hale and Blum (2022) determined the average fracture permeability to be m2. In addition, they found that the centre of the fracture is less permeable than the left and right side of the fracture (according to the front view of the sandstone block shown in Fig. 1a). On the right-hand side of the fracture, this can be explained by a barite vein intersecting the fracture, which was formed before the fracture opening. In the closer vicinity of the vein, the mechanical aperture is increased compared to central parts of the fracture. Comparing fracture and matrix permeabilities shows that the fracture permeability exceeds the matrix permeability by more than 8 orders of magnitude. Thus, the matrix permeability is considered negligible in this study.
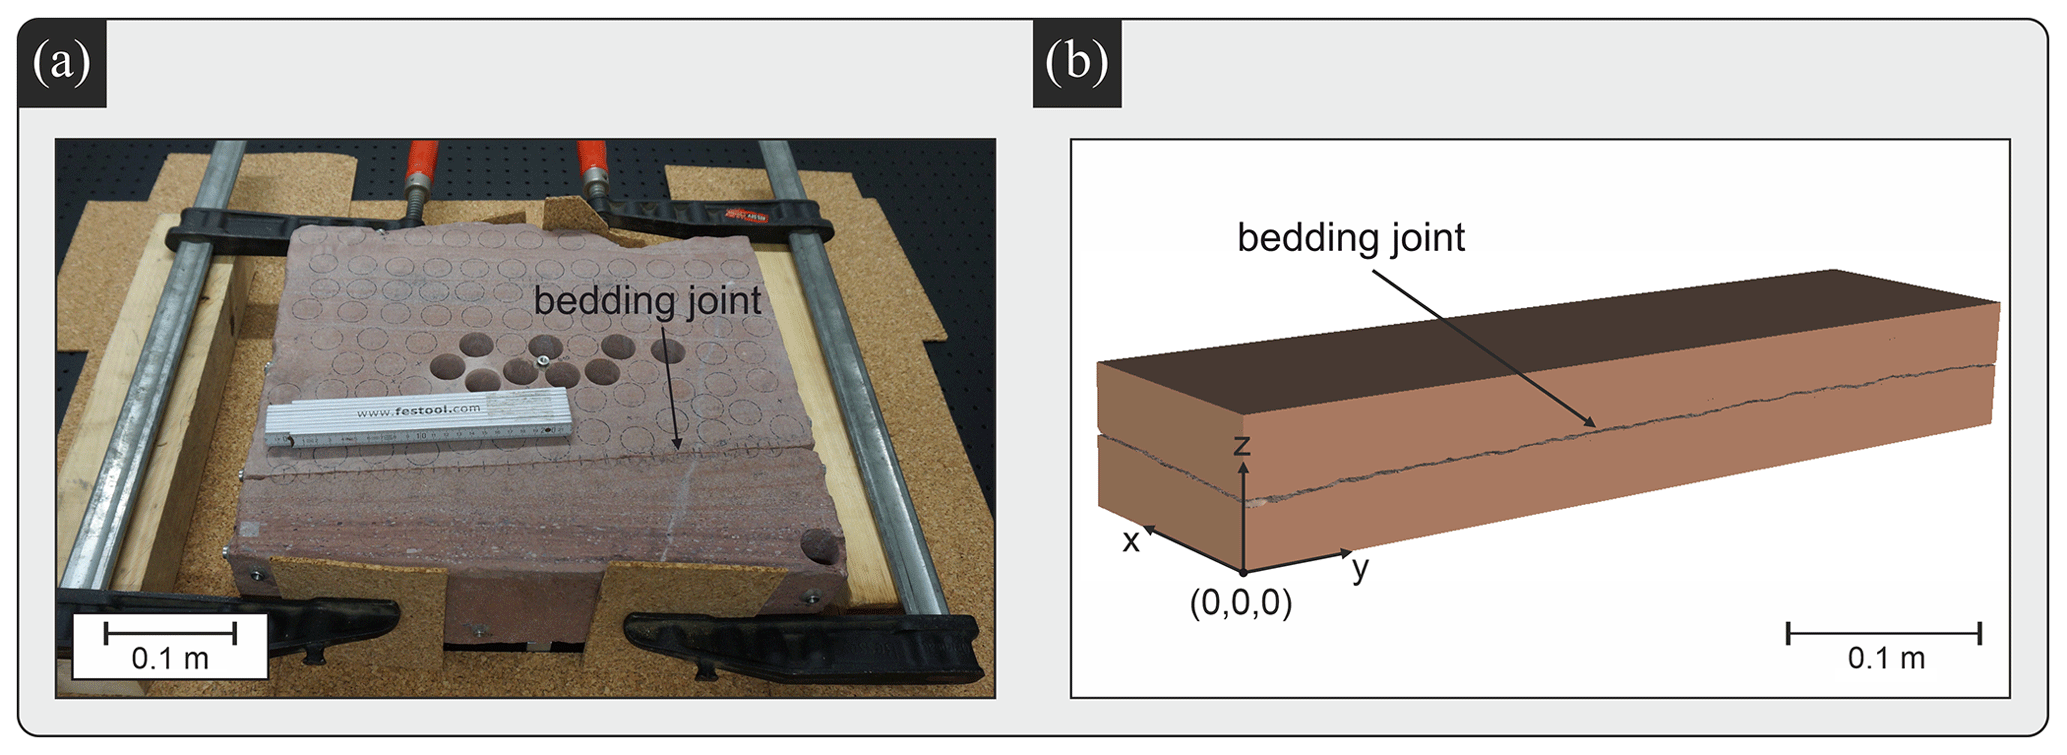
Figure 1(a) Photo of the studied sandstone block showing also the investigated bedding joint. The front surface of the real block corresponds to the y–z plane in the digital model on the right-hand side. (b) 3D model of the bedding joint and the surrounding sandstone block.
2.2 Data preparation and matching
For data preparation, a self-developed Python code called FracMatchPy was used. This code is able to (1) match two separated and spatially uncorrelated fracture surfaces and (2) create binary cross sections of the fracture as input for the PH analysis.
In the matching process, meshed laser scans of the bedding joint surfaces were used as input data for the Python code (Fig. 2). The surfaces were scanned by a combined system of the high-resolution laser scanner Nikon ModelMaker MMDx 100 and the articulated arm MCA II on which the scanner was mounted (Nikon Metrology NV, 2010, 2018). The scanner provides a resolution of 100 µm and a single-point accuracy of 10 µm (Nikon Metrology NV, 2018). The scanned point cloud was then meshed using MeshLab (Cignoni et al., 2008). Since the meshes were not spatially related, the two surfaces were roughly matched by hand to shorten the runtime of the Python code for data preparation. The exact matching was then performed stepwise by several rotation and translation steps within specified limits using the Python code. The translation limit was 3 mm total distance in each direction so that one surface was displaced in 100 µm steps, starting from the geometric centre of the surface. In addition, there was a rotation range of −0.3 to 0.3° in which the rotation was performed in 0.01° steps. The best fit was then determined by applying a minimisation function of the average mechanical aperture using the arithmetic mean between the fracture surfaces.
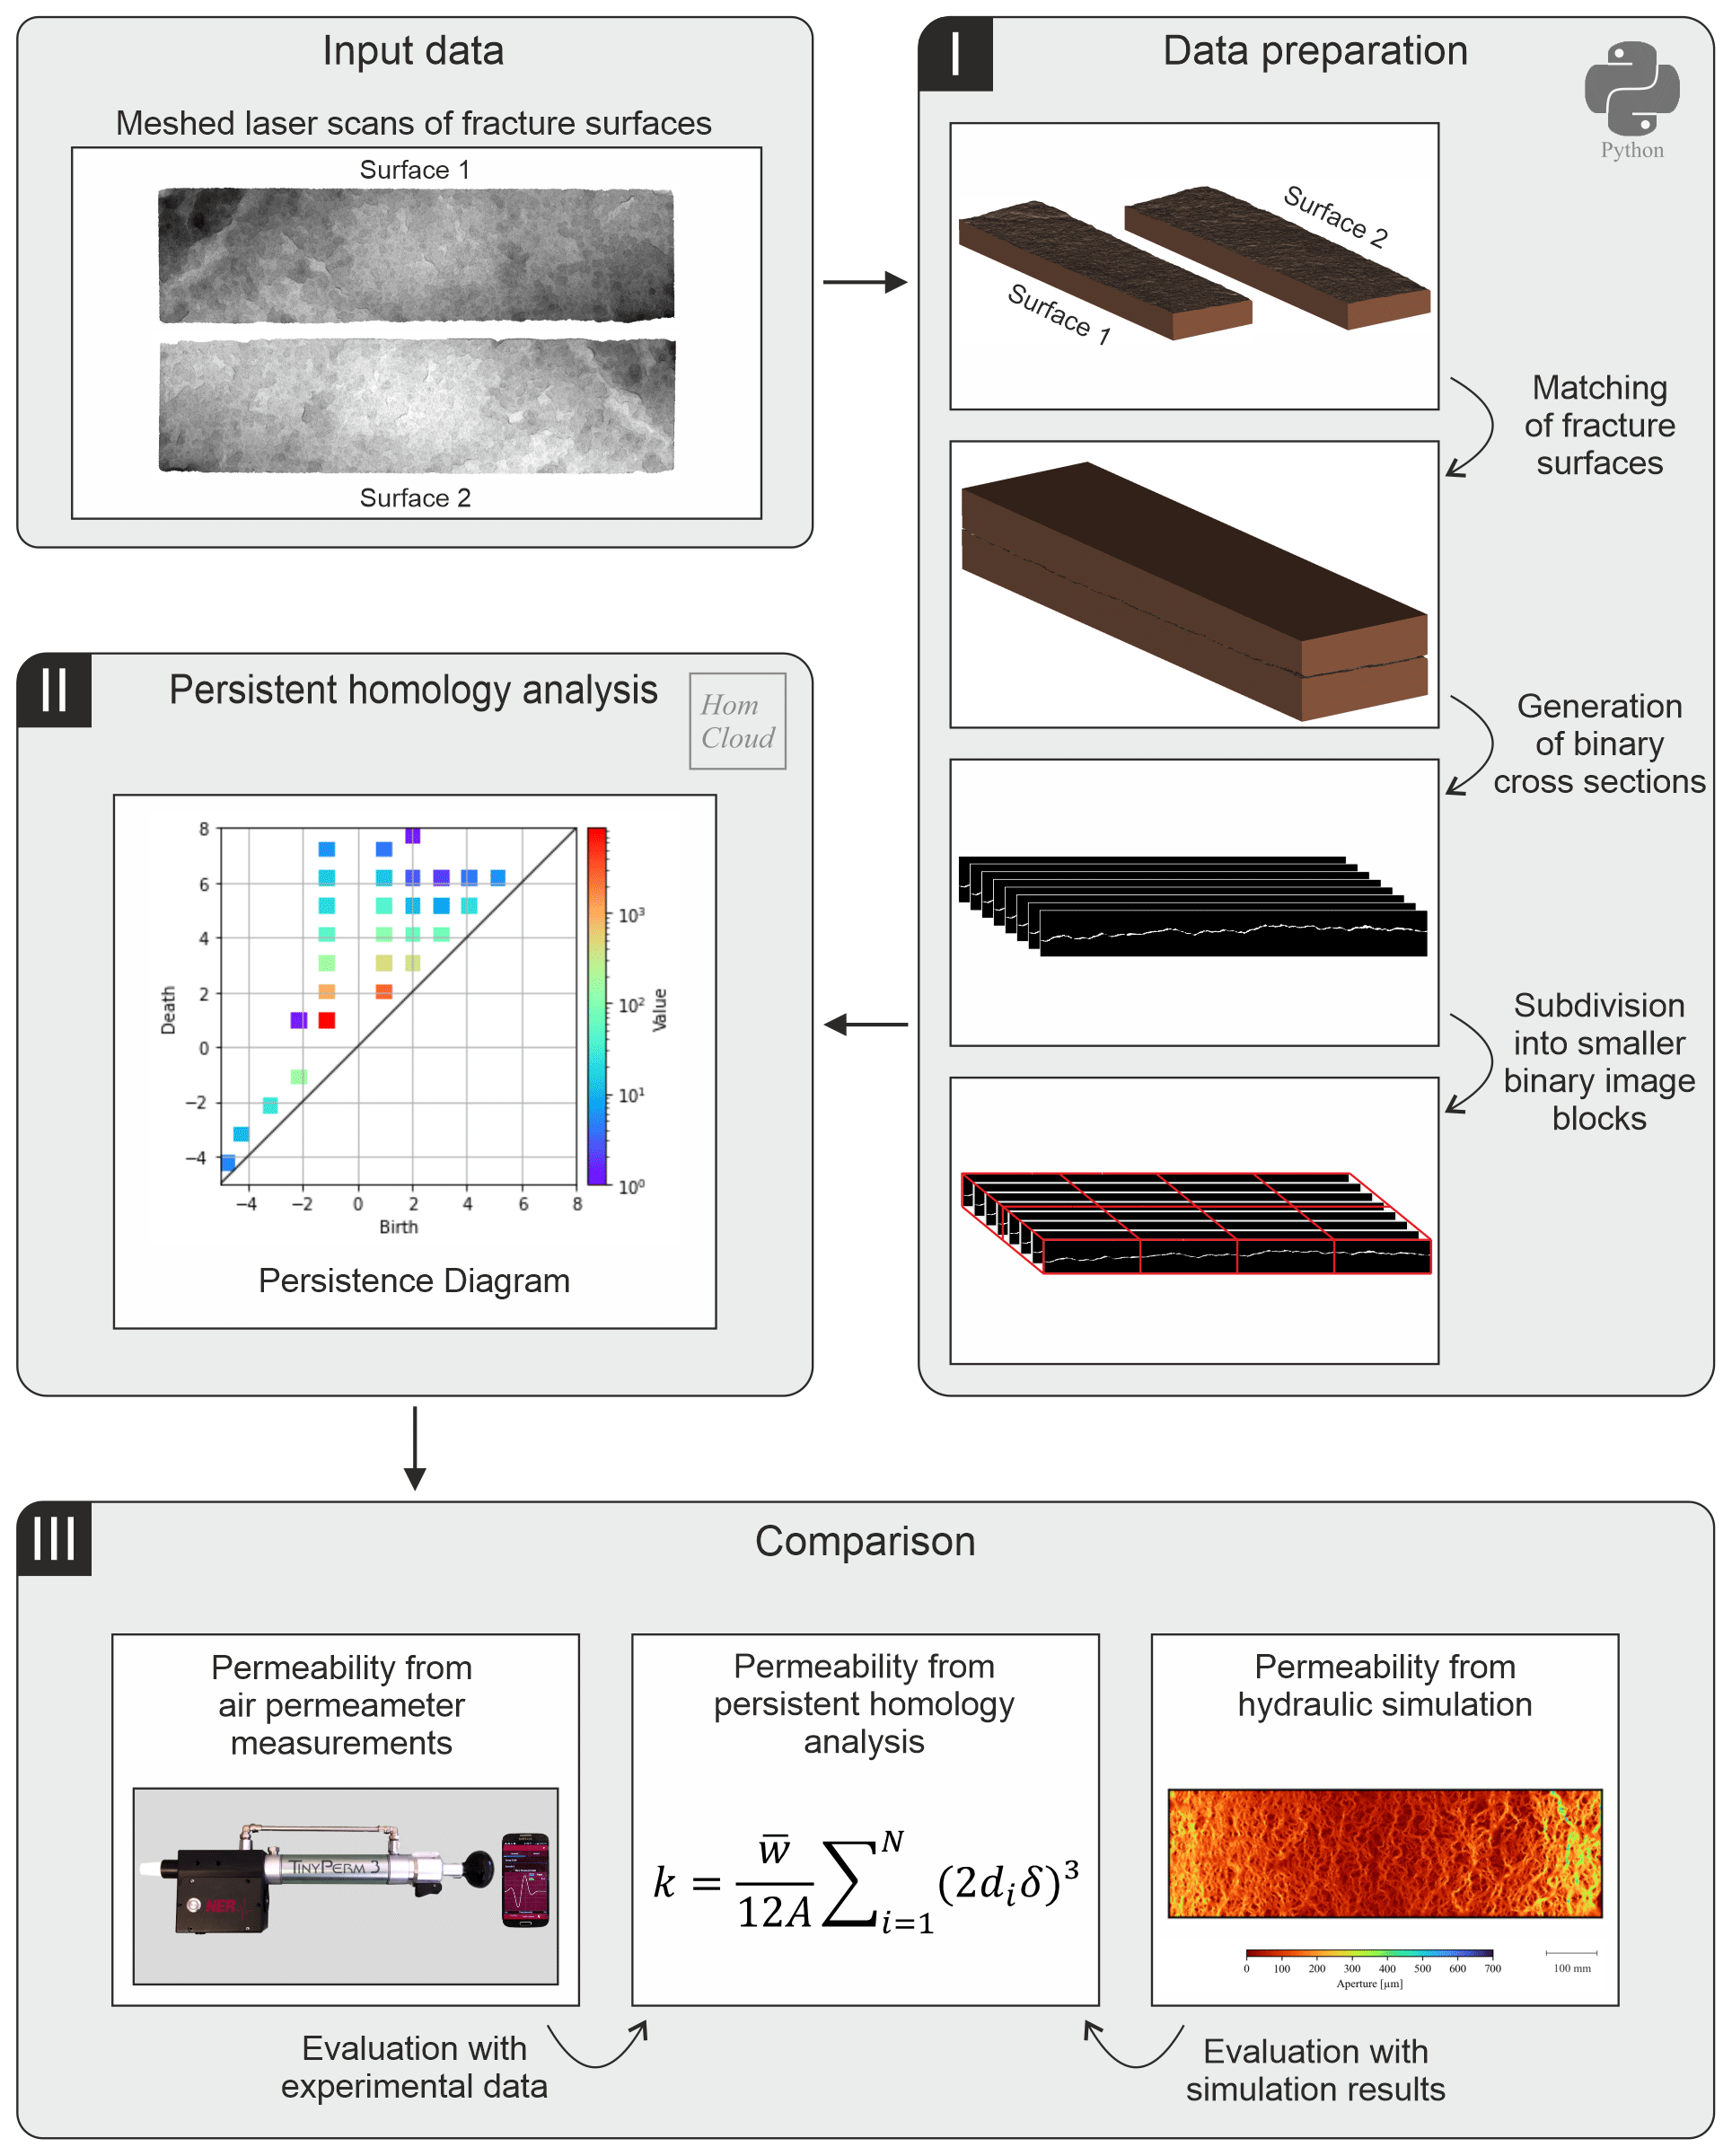
Figure 2Workflow of this study with three distinct steps, which is applied on the laser-scanned fracture surfaces.
2.3 Binary image generation and permeability estimation using persistent homology
We apply the permeability estimation method proposed by Suzuki et al. (2021), which uses persistent homology (PH) to extract information about the flow channels from image data. The first step is to convert the fracture information prepared in Sect. 2.2 into 3D binarised image data sets.
Three-dimensional image construction of the bedding joint and the surrounding sandstone block was generated. The image construction is a series of binary cross-sectional images of the x–z planes along the y axis. The size of the image area is 115 mm × 8.4 mm × 392.2 mm. Three data sets with different resolutions were generated to investigate the effect of varying resolution on permeability estimation. The first data set was created with a low resolution of 200 µm in all spatial directions. The data set contains voxels. The second data set was generated with a medium resolution of 100 µm in each spatial direction. The data set contains voxels. In the third data set, the resolution was again reduced by half to 50 µm in all spatial directions. The data set contains voxels. The fracture was considered to be fully permeable, with no low permeable filling or sealing. Since the matrix permeability is 8 orders of magnitude lower than the fracture permeability, the matrix was considered to be fully impermeable (Cheng et al., 2020; Hassanzadegan et al., 2012). Thus, each image contains the permeable fracture in white colours (binary value = 1) and the impermeable matrix in black colours (binary value = 0).
PH analysis was then performed using HomCloud (Obayashi et al., 2022). Since HomCloud can only handle a maximum data volume of 10213 voxels in a single-analysis run, the data sets were divided into several subpackages which were processed separately (Fig. 2). The data set with low resolution (200 µm/pixel) has voxels and was split into two divisions in the y direction. Thus, two subpackages were created for the data set with low resolution, each of which contained voxels. Dividing the x direction and z direction for the data was not necessary because the length of one side of the image was <1021 pixels. The data set with middle resolution (100 µm pixel) has voxels and was split into two divisions in the x direction and four divisions in the y direction. The data set was divided into eight subpackages, with an average of voxels each. The data set with high resolution (50 µm/pixel) has voxels and was split into three divisions in the x direction and eight divisions in the y direction. The data set was divided into 24 subpackages, with an average of voxels each.
PH analysis was then performed for each subpackage. HomCloud enables the extraction o topological features; a 3D object can consist of three different topological features. First, 0-dimensional topological features characterise connected components such as impermeable, solid matrices without voids. Structures such as fractures or connected pores are recognised as 1-dimensional (1D) topological features. Finally, 2-dimensional (2D) topological features are represented by enclosed pores not connecting to other flow channels. Since only fractures connected between an inlet and an outlet of the domain can serve as potential flow channels, this study focuses on the analysis of 1D topological features.
In HomCloud, a process called filtration is performed to detect 1D topological features from image data. For simplicity, an example of a two-dimensional image is shown in Fig. 3. In the binary image, the black areas are the rock matrix (binary value = 0), while the white areas are the void space (binary value = 1). During the filtration, the black pixels are thinned or thickened by 1 pixel from the boundary between the white and black pixels. The process is considered to be time variation, and the initial image is assumed to be time 0 (t=0). The time change in the negative direction is to make the black pixels thin, and the time change in the positive direction is to make the black pixels thick. The images are stored at each time. Continuing this operation, if the pixels continue to be thinned (time change in the negative direction), then the image becomes all white. If time is advanced in the positive direction from the all-white state, then a channel (i.e. 1D topological feature) appears at certain times, and if time is continuously advanced in the positive direction, then the channel disappears further. Note that the channel (1D topological feature) here is the connected shape from left to right, surrounded by black pixels. These times are called birth (b) and death (d), respectively. This method is named “persistent homology” because it attempts to see how persistent topological features are. While other topological data analysis extracts only topological features, the advantage of PH is that by utilising birth–death information, one can obtain not only topological features but also the geometric information on length.
In HomCloud, the output is a persistence diagram representing a frequency distribution of the number of birth and death pairs, as shown in step II in Fig. 2. From the definitions of birth and death, the presence of a flow channel (1D topological feature) in an image means that birth time is negative and death time is positive. Thus, the number of such pairs () can be considered to be the number of flow channels in the image. In addition, in the case of the process of the thickening of the black area, as shown in Fig. 3, the fracture is closed from both sides (see the image labelled “t=d”). Therefore, the doubling of death and multiplying by the resolution of the image can be taken as the smallest aperture of the channel. Thus, from HomCloud, the frequency distribution of the number of channels present in the image and their minimum aperture widths can be obtained. It is important to note that the 1D topological features evaluated in PH include the aforementioned left-to-right connected shapes surrounded by black pixels, as well as the void ring structures that are not connected to the outside. How to remove such structures is described in Suzuki et al. (2021). It should also be noted that if the channels are connected like a ladder, then PH may detect a large number of channels.
Suzuki et al. (2021) assumed that the channels have parallel-plate geometries and that they are parallel to each other. The permeability is estimated based on the power law as follows:
A is the surface area of the cross section of the medium, and N is the number of flow channels. wi is the depth of flow channel i, and hi is the aperture of the flow channel i. As mentioned above, the number of flow channels N was estimated from the number of birth–death pairs, and the aperture hi was estimated as 2diδ in PH analysis, where di is the death of the flow channel i, and δ is the resolution of the images. The average of the depth of flow channel is determined by the cross-sectional area of the image (Suzuki et al., 2021). Thus, the above equation can be converted to the parameters from PH and image analysis.
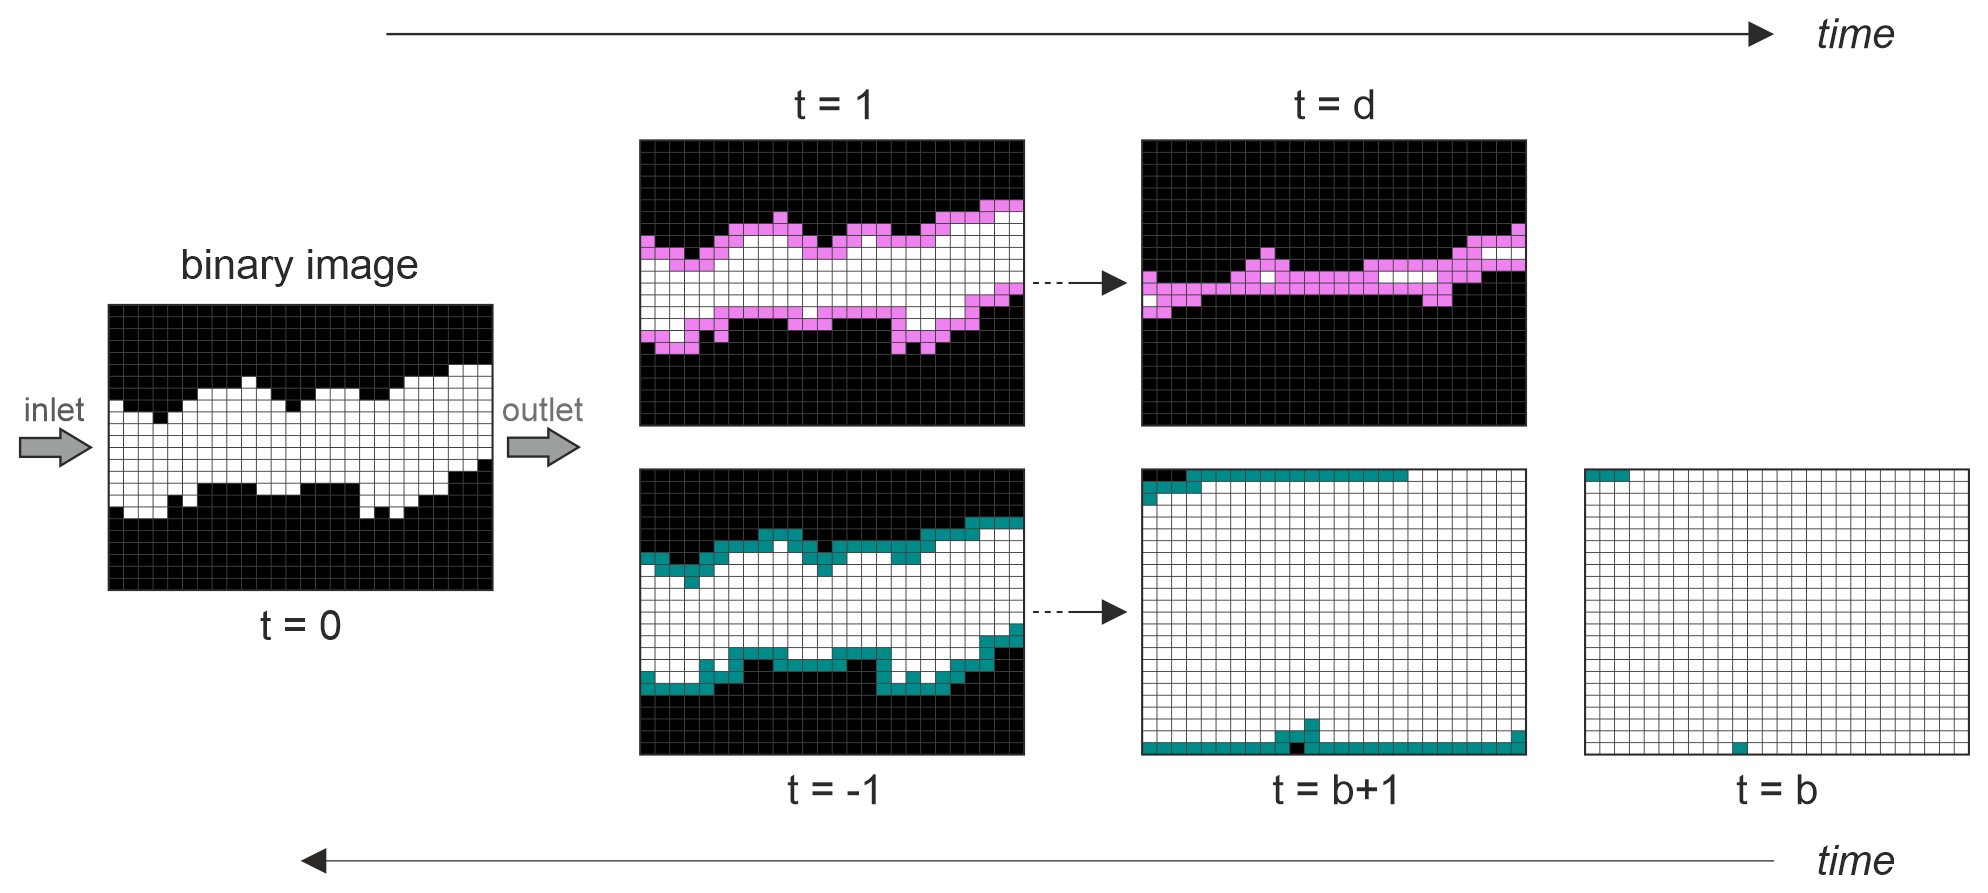
Figure 3Schematic illustration of the filtration process during persistent homology analysis. The permeable area of the binary image (fracture) is thickened (cyan) and thinned (pink).
2.4 Experimental measurement of the fracture permeability
An air permeameter was used to experimentally measure the fracture permeability. The transient air permeameter TinyPerm 3 (manufactured by New England Research, Inc.) is a portable device, which is able to directly measure matrix permeabilities or hydraulic fracture apertures on outcrops or cores (Filomena et al., 2014; Cheng et al., 2020; Hale and Blum, 2022). For this purpose, the device is filled with air by lifting the piston, and the rubber nozzle of the instrument is pressed against the fracture outlet. The measurement is started by depressing the piston in direction of the sample, creating a vacuum between the fracture and the device. A microcontroller unit in the air permeameter simultaneously records the transient change in air pressure at the fracture outlet and the volume change in the device. Once the total volume of the device is compressed, the permeability is automatically determined from the recorded curve (Brown and Smith, 2013). The range of measurable permeabilities is from 1 mD to 10 D for porous rocks and hydraulic apertures of approximately 10 µm to 2 mm for fractures (New England Research Inc., 2016). The latter corresponds to permeabilities in orders of magnitude from 10−11 to 10−7 m2.
This study uses both existing air permeameter measurements from Hale et al. (2020) and measurements conducted in this study. In the study of Hale et al. (2020), experiments along the long edge (y direction) of the fractured block were performed and the permeability in the x direction was measured. In addition, complementary measurements along the x axis with permeabilities measured in the y direction were performed in the frame of this study. In total, the y axis was divided into 21 sections and the x axis into 4 sections. The corner areas were not included in the measurement due to breakouts from the block. Each section was measured 10 times to obtain average values. The hydraulic aperture along the y edge in the x direction was determined to be 81±1 µm (Hale and Blum, 2022) and that along the x edge in the y direction to be 57±1 µm.
2.5 Numerical flow simulation
Apart from experimental air permeameter measurements, hydraulic apertures of the fracture were also determined by numerical flow simulations, using the Multiphysics Object-Oriented Simulation Environment (MOOSE) framework (Permann et al., 2020). Within this framework, the fluid flow through the fracture was simulated with the SaintBernard application (Schädle, 2020), which is based on the inbuilt PorousFlow module (Wilkins et al., 2020, 2021). In this application, a 3D fracture is projected on a 2D surface embedded in a 3D environment. The aperture of the fracture is assigned as a permeability parameter to each cell of the 2D mesh. The fluid flow velocity is then simulated in the lower dimension, and the hydraulic aperture is calculated, considering Darcy flow and the cubic law with the following equation for each cell of the mesh:
In Eq. (2), ah is the hydraulic aperture of the fracture, v is the fluid flow velocity, μ is the dynamic viscosity, L is the length of the fracture (in flow direction), and Δp is the hydraulic pressure gradient. Further information about the numerical simulation and SaintBernard can be found in Javanmard et al. (2021).
Similar to the air permeameter measurements, numerical flow simulations were performed with fluid flow in both the x and y direction to determine the permeability in each of these.
3.1 Permeability estimation from persistent homology analysis
The prepared binary data sets were used to calculate the permeability of the fracture. The permeability was calculated in two different flow directions for flow parallel to the x axis and parallel to the y axis (Fig. 4). The calculated permeabilities for the 200 µm resolution data set are m2 in the x direction and m2 in the y direction. Using the cubic law, the calculated hydraulic apertures are 88 and 86 µm, respectively. For the data set with 100 µm resolution, the permeabilities are m2 in the x direction and m2 in the y direction. This corresponds to hydraulic apertures of 73 µm in the x direction and 69 µm in the y direction. For the 50 µm resolution data set, the permeability in the x direction is m2 and m2 in the y direction, which equals hydraulic apertures of 92 and 62 µm, respectively. Comparing the three different data set shows that PH analysis for all data sets results in higher permeability in the x direction than in the y direction ().
The ratio of the data sets with 200 and 100 µm resolution is nearly identical, 1.0 and 1.1, respectively, whereas the ratio of the 50 µm data set shows a higher ratio of 2.2.
Detailed examination of the individual fracture surfaces and the matched fracture shows that the highest mechanical apertures of >1 mm occur mainly along the barite vein that crosses the fracture parallel to the x direction (Fig. 4). From previous studies on the fracture, it appears that this barite vein dominates the flow behaviour and, thus, forms the main flow path along the fracture due to its increased mechanical aperture and lower roughness compared to other regions of the fracture (Hale et al., 2020). Hence, it serves as a preferential flow path in the x direction, whereas it acts more as a barrier or redirection for flow in the y direction. The study of Gutjahr et al. (2022) shows that, in addition to the anisotropy of the permeabilities, a slight anisotropy of the roughness can be observed. Analogous to the permeability, the Hurst exponent in the x direction is higher (Hx=0.48) than in the y direction (Hy=0.42). It is noteworthy that the ratio of the Hurst exponents () is 1.1 and thus corresponds well with the determined ratios for permeabilities. This is reasonable, as increased roughness tends to result in more distinct flow channels with larger mechanical apertures. Consequently, this leads to increased permeabilities.
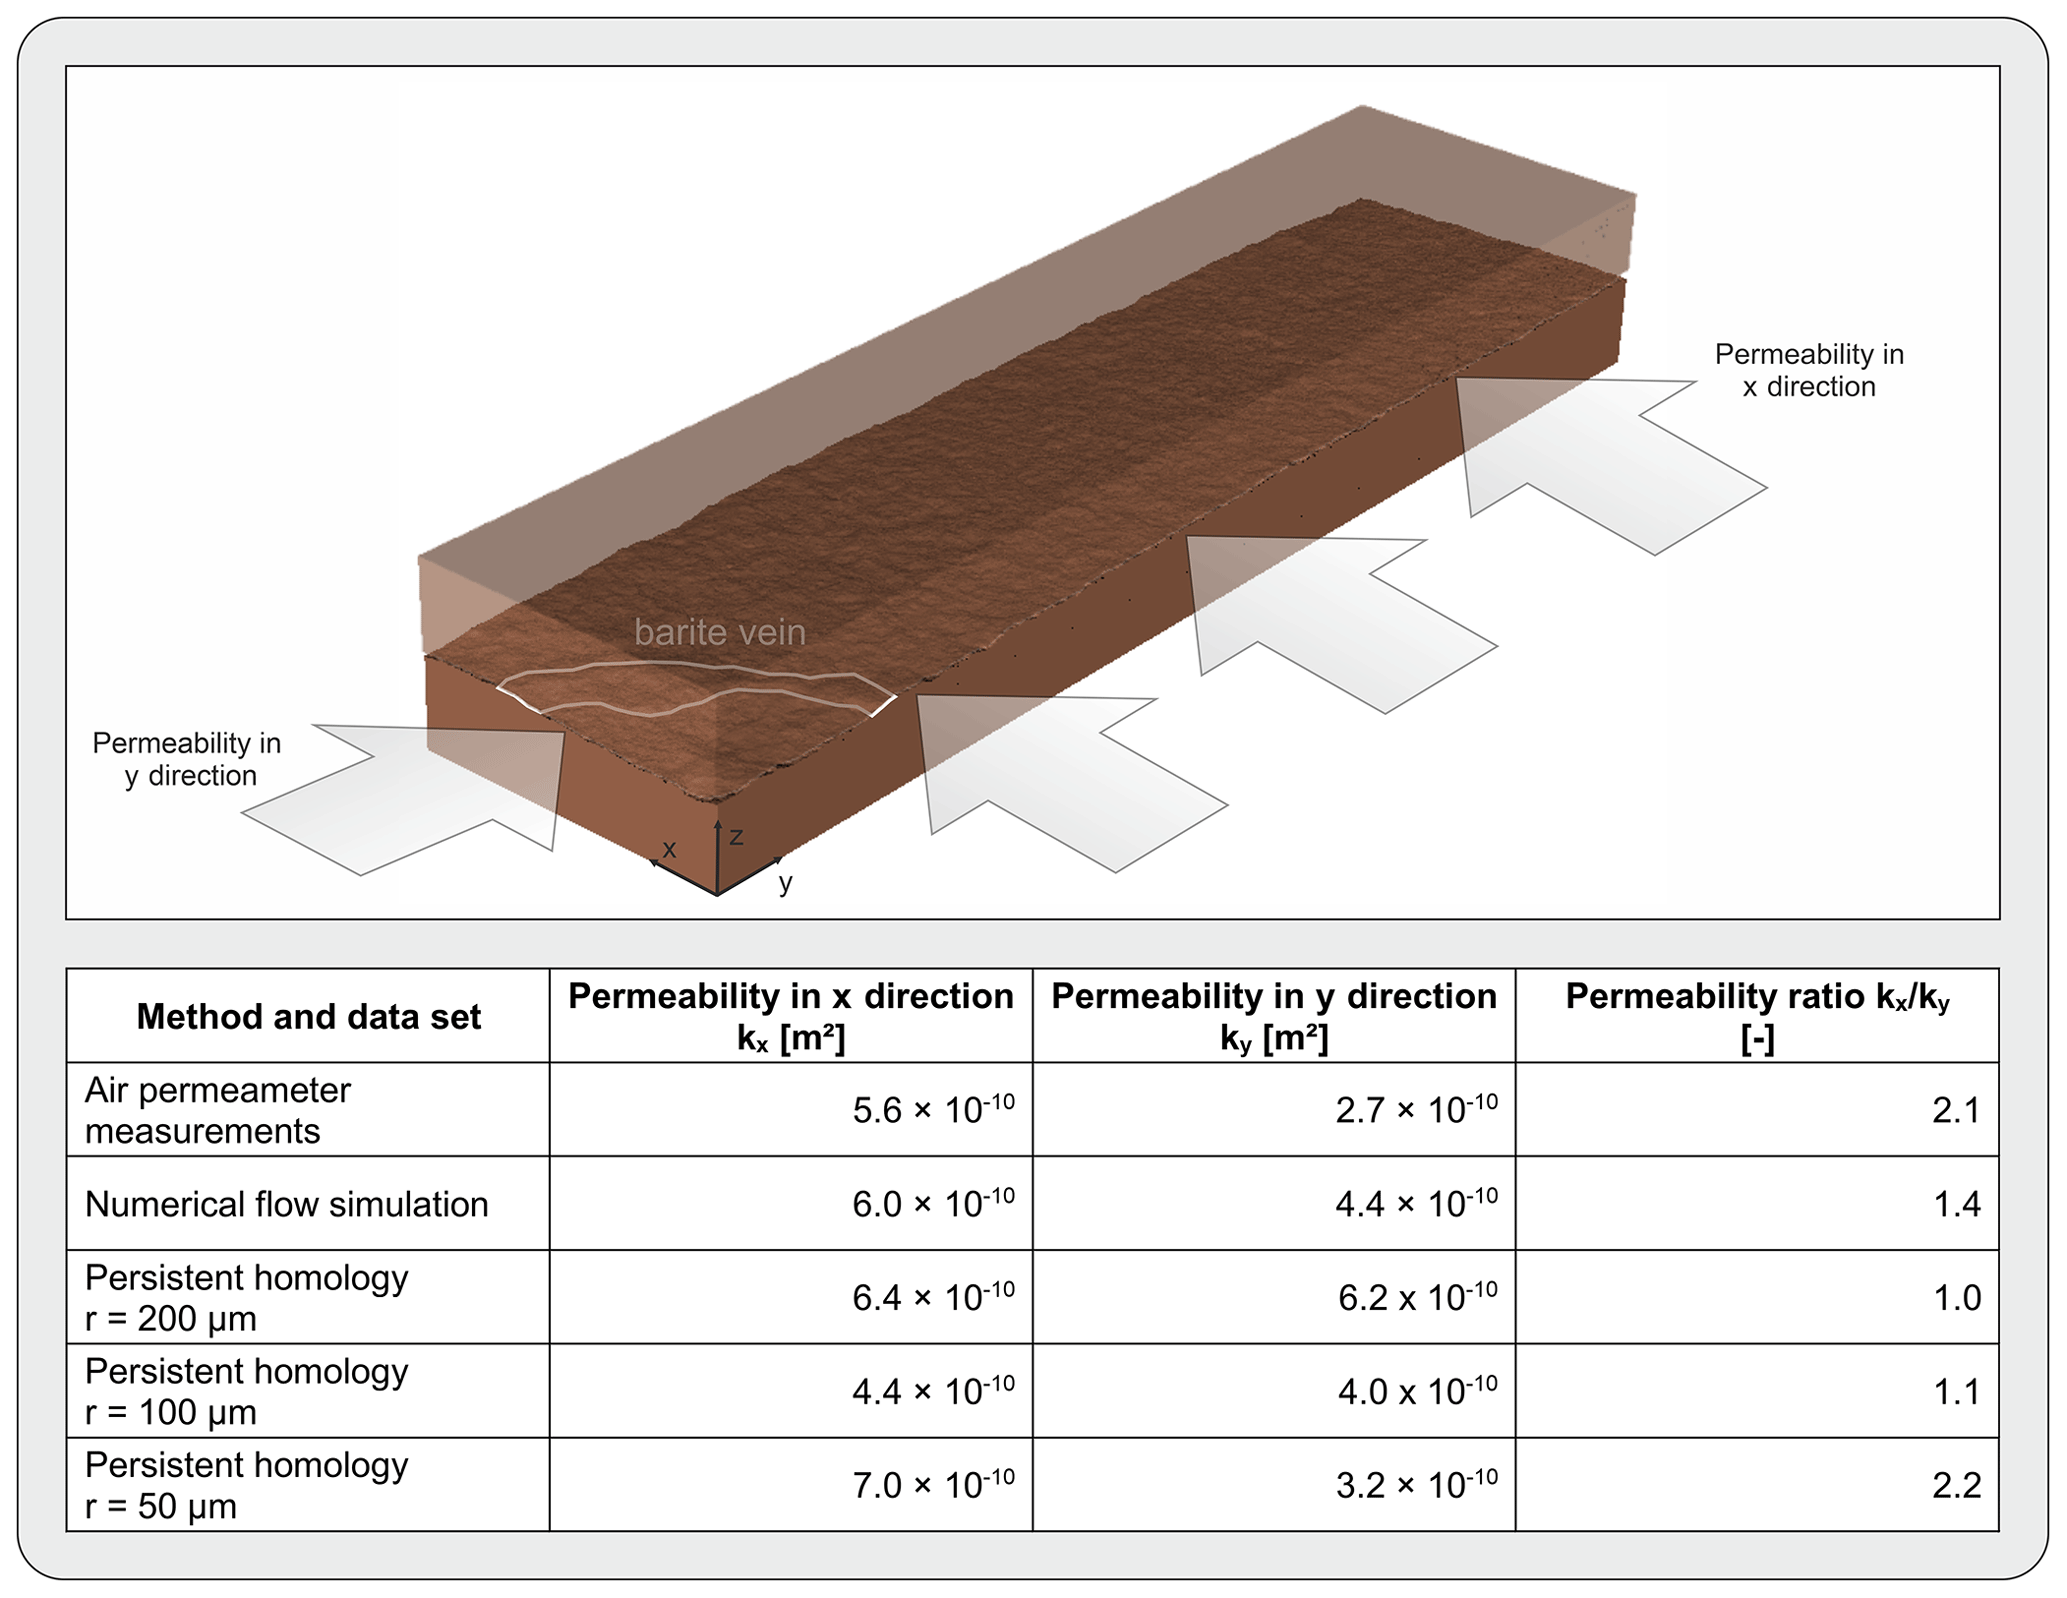
Figure 4Permeability determined by air permeameter measurements, numerical flow simulations, and persistent homology using data sets with resolutions of 200, 100, and 50 µm.
3.2 Comparison to air permeameter measurements and numerical simulation
In addition to the estimation of the fracture permeability by PH, the results were also compared to permeabilities derived from alternative methods. Thus, a comparison was performed using experimental air permeameter measurements and numerical flow simulations to show the validity of the PH analysis. In Fig. 4, the values for the permeability in the x and y directions, as well as the ratio of the two permeability values of air permeameter measurements and numerical simulation, are also shown. All x permeabilities differ by m2 from the experimental or numerical results. However, the permeabilities in the y direction scatter slightly more. Overall, there is a good fit between PH analysis and alternative methods, which is reflected by a root mean squared error (RMSE) of m2. Normalisation with the difference between maximum and minimum of all observed permeabilities leads to a normalised root mean squared error (NRMSE) of 0.34. However, there is also the trend that the values agree increasingly better with the comparative values as the resolution of the data set increases. For example, the RMSE of the x and y permeability between air permeameter or numerical simulation and the 200 µm resolved data set is m2. For the 100 µm data set, it reduces to m2, and for the 50 µm data set, it is m2. The NRMSEs are 0.54 (200 µm), 0.38 (100 µm), and 0.25 (50 µm), respectively. This trend was also shown in studies using persistent homology in porous media or fracture networks before (Moon et al., 2019; Suzuki et al., 2021). The study of Moon et al. (2019), in which fluid flow through the pore spaces of different digital sandstone and chalk samples was examined, could show particularly that the number of excessively high outlier permeabilities can be prevented with higher resolution. Similar findings are shown in Suzuki et al. (2021), in which permeabilities that are significantly higher than the comparison simulation could also be reduced by improving the resolution. Conclusively, it can be stated that apart from the permeability estimation of the 50 µm data set in the x direction, the results of the PH analysis improve with increasing resolution.
3.3 Evaluation of persistent homology analysis
Since the results of three different methods for permeability determination are in good agreement (NRMSE = 0.34), a classification of the results in the context of other PH analyses was carried out. The study of Suzuki et al. (2021) applied PH on different data sets of porous and fractured rocks of previous studies (Andrew et al., 2014; Muljadi et al., 2016; Mehmani and Tchelepi, 2017). The 16 data sets of porous media and 15 data sets of fracture networks were analysed, each with PH and numerical flow simulation. In Fig. 5, the results of this study, as well as the results by Suzuki et al. (2021), are shown. The method of PH for permeability estimation in both studies provides comparable results to the respective reference method. The results of this study are closely scattered around the 1:1 line and thus match well with the results based on fracture networks (dark grey diamonds). It appears that the results of this study can be estimated even better than most of the data points of previous data sets, especially those generated from porous media (light grey crosses). In the latter, PH tends to overestimate the permeability, which cannot be confirmed for the data in this study. However, this study indicates that the quality of the permeability estimation is not only attributable to the type of cavity (pores, single fractures, or fracture networks). Based on the results, the quality of the permeability estimation by PH is also dependent on the resolution and anisotropy of the respective data set. Nevertheless, a larger number of data sets should be examined for a more precise assessment of the various influences on the quality of the permeability estimation.
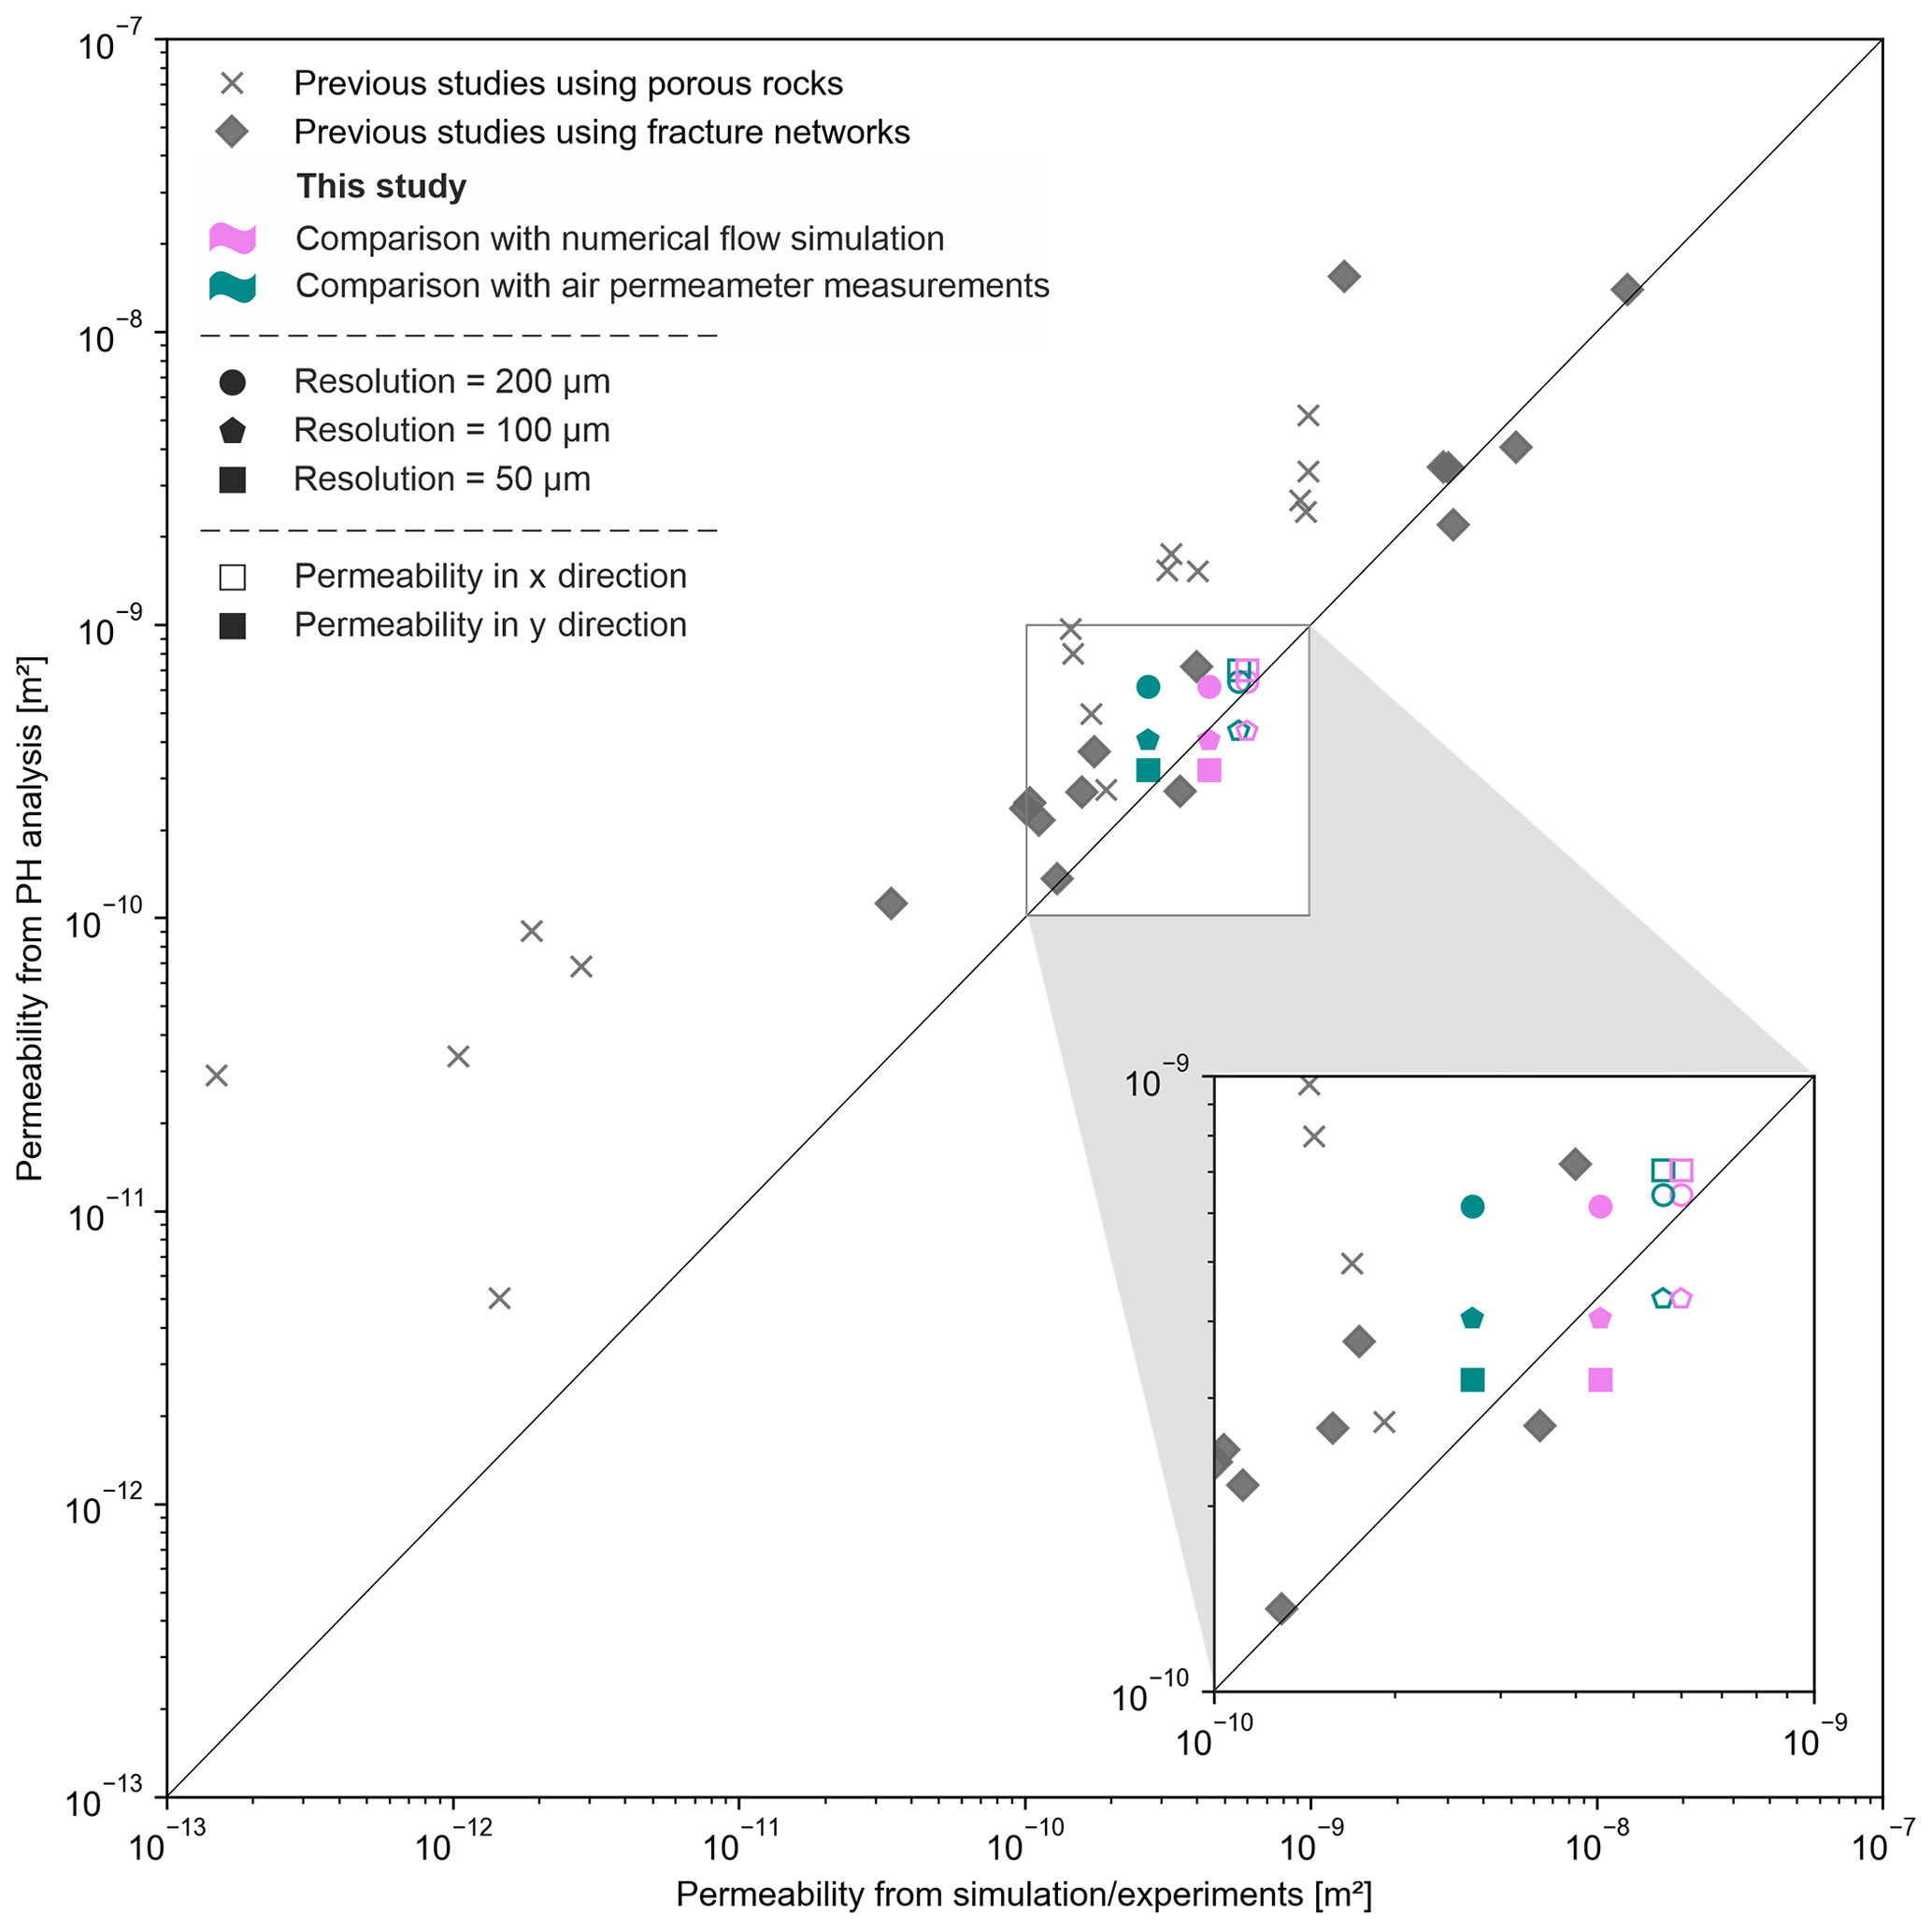
Figure 5Comparison of the estimated permeabilities of this study with the estimated permeabilities for porous media (light grey crosses) and fracture networks (dark grey diamonds) of previous studies by Suzuki et al. (2021), using data of Andrew et al. (2014), Muljadi et al. (2016), and Mehmani and Tchelepi (2017).
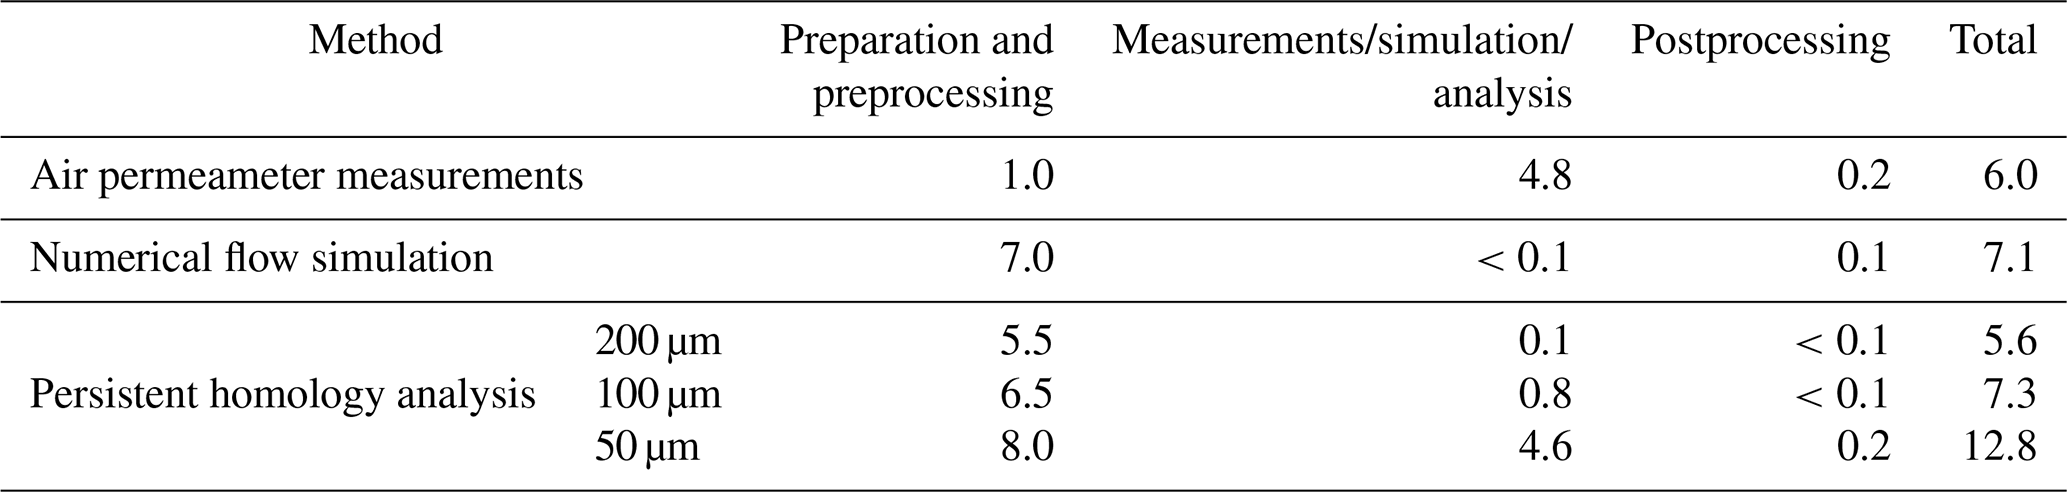
In previous sections, it is shown that PH provides comparable results for permeability estimation of rough single fractures compared to other more conventional methods. However, for it to be an alternative, the effort and computational time also has to be considered. In Table 1, an estimation of different working steps is presented for the permeability estimation of single fractures. For PH analysis, the dependency of the time needed on the resolution is also considered. The table is divided into three working steps. The step of preparation and preprocessing contains every working step after the collection of a sample, including imaging and matching of fracture surfaces, generating binary images, setting up a numerical model, or initialising the air permeameter. In the second working step, the effort for the actual measurement, numerical simulation or PH analysis is considered for one sample. In postprocessing, all working steps recalculating the fracture permeability from the measured, simulated, or analysed results is considered. Comparing the expenditure of time for all methods and resolutions, all methods apart from PH analysis for 50 µm data are ranging in the same order of magnitude. An increase to 50 µm resolution demands an enormous increase in time expenditure, mainly due to the extremely high analysis time. Considering the quality of the results, the data set with 100 µm therefore seems to be an adequate alternative to conventional methods, as it can provide high-quality results with similar efforts.
Table 1Estimation of expenditure of time in hours for air permeameter measurements, numerical flow simulation, and persistent homology for three different resolution steps (200, 100, and 50 µm).
This study shows that persistent homology (PH) provides acceptable results for the permeability estimation of a natural bedding plane joint of a sandstone. Compared to other methods such as experimental air permeameter measurements and numerical flow simulation, it tends to slightly overestimate lower permeabilities. The overestimation of permeabilities is also traceable in previous studies using PH analysis on porous media, as well as small-scale fracture networks. For single-fracture application, a reason could be the application of the cubic law, which tends to overestimate the permeability in fracture networks or rough fractures.
In comparison to other methods, PH is a cheap and time-effective method. Once the geometry of a fracture is imaged (e.g. laser scanning, computed tomography, and structure from motion), all the tools to determine permeability are accessible and open-source. In contrast to most experimental methods, no laboratory is required to estimate the permeability. An exception to this is the air permeameter used here, which is even applicable in field experiments due to its portability. The advantages of PH compared to numerical modelling are, first, the lower required computing capacity and computing time. Furthermore, the number of parameters required to successfully perform a simulation is significantly reduced, since only the geometry is sufficient as an input parameter.
Suzuki et al. (2020) showed that small-scale (millimetre to centimetre scale) discrete fracture networks (DFNs) can be precisely studied by PH analysis. Our study demonstrates the applicability of the methods to a mesoscale (decimetre scale), rough bedding joint of Flechtinger sandstone. In order to verify these results, future work should focus on other types of fractures, such as open-mode or shear-mode fractures, as well as different lithologies, such as fractures in granites or clay. Furthermore, the influence of roughness on the flow behaviour and the permeability distribution across the fracture should be investigated. In addition, a more detailed investigation of the permeabilities of different areas of this fracture could be performed on the basis of the high-resolution scans used here. This could also allow a potential scaling effect of the permeabilities to be analysed in more detail. By combining the approach of fracture networks and rough single fractures, a long-term objective could also investigate the influence of fracture surface roughness on fracture networks at larger scales. In particular, the well-functioning subdivision of the total data set into smaller, high-resolution subpackages should allow analysis of larger DFNs without compromising the resolution. Other potential future work could be found in the comparison of such PH analysis with numerical DFN models. In addition, since numerical models for the accurate representation of fracture networks are computationally expensive, it is expected that PH is able to save time and costs.
The binary image data of this study are available from the authors upon reasonable request.
MF, AS, and PB initiated the key concepts. MF prepared the data for persistent homology analysis, performed numerical simulations, conducted air permeameter measurements, and visualised the results. AS performed the persistent homology analysis and supervised the research. TH assisted the persistent homology analysis. PB supervised the research. MF wrote the original draft. All authors reviewed and edited the paper.
The contact author has declared that none of the authors has any competing interests.
Publisher's note: Copernicus Publications remains neutral with regard to jurisdictional claims made in the text, published maps, institutional affiliations, or any other geographical representation in this paper. While Copernicus Publications makes every effort to include appropriate place names, the final responsibility lies with the authors.
The authors would like to thank Ruben Stemmle, Anna Albers, and Hagen Steger, for their support in conducting the air permeameter experiments, and Keiichiro Goto, for his support in performing the persistent homology analysis.
This research has been supported by the Japan Society for the Promotion of Science (KAKENHI, grant no. JP22H05108) and the Japan Science and Technology Agency, ACT-X (grant no. JPMJAX190H).
The article processing charges for this open-access publication were covered by the Karlsruhe Institute of Technology (KIT).
This paper was edited by David Healy and reviewed by two anonymous referees.
Alqahtani, N. J., Chung, T., Da Wang, Y., Armstrong, R. T., Swietojanski, P., and Mostaghimi, P.: Flow-Based Characterization of Digital Rock Images Using Deep Learning, SPE J., 26, 1800–1811, https://doi.org/10.2118/205376-PA, 2021.
Anderson, T. I., Guan, K. M., Vega, B., Aryana, S. A., and Kovscek, A. R.: RockFlow: Fast Generation of Synthetic Source Rock Images Using Generative Flow Models, Energies, 13, 6571, https://doi.org/10.3390/en13246571, 2020.
Andrew, M., Bijeljic, B., and Blunt, M. J.: Pore-scale imaging of trapped supercritical carbon dioxide in sandstones and carbonates, International J. Greenh. Gas Contr., 22, 1–14, https://doi.org/10.1016/j.ijggc.2013.12.018, 2014.
Araya-Polo, M., Alpak, F. O., Hunter, S., Hofmann, R., and Saxena, N.: Deep learning–driven permeability estimation from 2D images, Comput. Geosci., 24, 571–580, https://doi.org/10.1007/s10596-019-09886-9, 2020.
Barton, N. and de Quadros, E. F.: Joint aperture and roughness in the prediction of flow and groutability of rock masses, Int. J. Rock Mech. Min., 34, 252.e1–252.e14, https://doi.org/10.1016/S1365-1609(97)00081-6, 1997.
Barton, N., Bandis, S., and Bakhtar, K.: Strength, deformation and conductivity coupling of rock joints, Int. J. Rock Mech. Min., 22, 121–140, https://doi.org/10.1016/0148-9062(85)93227-9, 1985.
Bizhani, M. and Haeri Ardakani, O.: Pore Characterization of Organic-Rich Shales through Application of Topological Data Analysis and Persistent Homology, Energy Fuels, 35, 18563–18573, https://doi.org/10.1021/acs.energyfuels.1c03255, 2021.
Blöcher, G., Kluge, C., Milsch, H., Cacace, M., Jacquey, A. B., and Schmittbuhl, J.: Permeability of matrix-fracture systems under mechanical loading – constraints from laboratory experiments and 3-D numerical modelling, Adv. Geosci., 49, 95–104, https://doi.org/10.5194/adgeo-49-95-2019, 2019.
Blum, P., Mackay, R., and Riley, M. S.: Stochastic simulations of regional scale advective transport in fractured rock masses using block upscaled hydro-mechanical rock property data, J. Hydrol., 369, 318–325, https://doi.org/10.1016/j.jhydrol.2009.02.009, 2009.
Brown, S. and Smith, M.: A transient-flow syringe air permeameter, Geophysics, 78, D307–D313, https://doi.org/10.1190/geo2012-0534.1, 2013.
Brown, S., Caprihan, A., and Hardy, R.: Experimental observation of fluid flow channels in a single fracture, J. Geophys. Res., 103, 5125–5132, https://doi.org/10.1029/97JB03542, 1998.
Brown, S. R.: Fluid flow through rock joints: The effect of surface roughness, J. Geophys. Res., 92, 1337, https://doi.org/10.1029/JB092iB02p01337, 1987.
Carlsson, G.: Topology and data, B. Am. Math. Soc., 46, 255–308, https://doi.org/10.1090/S0273-0979-09-01249-X, 2009.
Carman, P. C.: Fluid flow through granular beds, Trans. Inst. Chem. Eng., 15, 150–167, 1937.
Chan, J. M., Carlsson, G., and Rabadan, R.: Topology of viral evolution, P. Natl. Acad. Sci. USA, 110, 18566–18571, https://doi.org/10.1073/pnas.1313480110, 2013.
Chen, Y., Selvadurai, A., and Zhao, Z.: Modeling of flow characteristics in 3D rough rock fracture with geometry changes under confining stresses, Comput. Geotech., 130, 103910, https://doi.org/10.1016/j.compgeo.2020.103910, 2021.
Cheng, C., Hale, S., Milsch, H., and Blum, P.: Measuring hydraulic fracture apertures: a comparison of methods, Solid Earth, 11, 2411–2423, https://doi.org/10.5194/se-11-2411-2020, 2020.
Choudhury, A. I., Wang, B., Rosen, P., and Pascucci, V.: Topological analysis and visualization of cyclical behavior in memory reference traces, in: 2012 IEEE Pacific Visualization Symposium, 28 February–2 March 2012, Songdo, Korea (South), 9–16, 2012.
Cignoni, P., Corsini, M., and Ranzuglia, G.: MeshLab: an Open-Source 3D Mesh Processing System, ERCIM News, 73, 47–48, 2008.
Costa, A.: Permeability-porosity relationship: A reexamination of the Kozeny-Carman equation based on a fractal pore-space geometry assumption, Geophys. Res. Lett., 33, L02318, https://doi.org/10.1029/2005GL025134, 2006.
Da Wang, Y., Blunt, M. J., Armstrong, R. T., and Mostaghimi, P.: Deep learning in pore scale imaging and modeling, Earth-Sci. Rev., 215, 103555, https://doi.org/10.1016/j.earscirev.2021.103555, 2021.
Delgado-Friedrichs, O., Robins, V., and Sheppard, A.: Morse theory and persistent homology for topological analysis of 3D images of complex materials, in: 2014 IEEE International Conference on Image Processing (ICIP), 27–30 October 2014, Paris, France, 4872–4876, 2014.
Durham, W. B., Bourcier, W. L., and Burton, E. A.: Direct observation of reactive flow in a single fracture, Water Res., 37, 1–12, https://doi.org/10.1029/2000WR900228, 2001.
Edelsbrunner, H., Letscher, D., and Zomorodian, A.: Topological persistence and simplification, in: Proceedings 41st Annual Symposium on Foundations of Computer Science, 12–14 November 2000, Redondo Beach, CA, USA, 454–463, 2000.
Ferer, M., Crandall, D., Ahmadi, G., and Smith, D. H.: Two-phase flow in a rough fracture: experiment and modeling, Phys. Rev. E, 84, 16316, https://doi.org/10.1103/PhysRevE.84.016316, 2011.
Filomena, C. M., Hornung, J., and Stollhofen, H.: Assessing accuracy of gas-driven permeability measurements: a comparative study of diverse Hassler-cell and probe permeameter devices, Solid Earth, 5, 1–11, https://doi.org/10.5194/se-5-1-2014, 2014.
Fischer, C., Dunkl, I., Eynatten, H. von, Wijbrans, J. R., and Gaupp, R.: Products and timing of diagenetic processes in Upper Rotliegend sandstones from Bebertal (North German Basin, Parchim Formation, Flechtingen High, Germany), Geol. Mag., 149, 827–840, https://doi.org/10.1017/S0016756811001087, 2012.
Frank, S., Heinze, T., Ribbers, M., and Wohnlich, S.: Experimental Reproducibility and Natural Variability of Hydraulic Transport Properties of Fractured Sandstone Samples, Geosciences, 10, 458, https://doi.org/10.3390/geosciences10110458, 2020.
Gutjahr, T., Hale, S., Keller, K., Blum, P., and Winter, S.: Quantification of Fracture Roughness by Change Probabilities and Hurst Exponents, Math. Geosci., 54, 679–710, https://doi.org/10.1007/s11004-021-09985-3, 2022.
Hale, S. and Blum, P.: Bestimmung der hydraulischen Durchlässigkeiten eines Sandsteins mithilfe eines Luftpermeameters, Grundwasser – Zeitschrift der Fachsektion Hydrogeologie, 27, 57–65, https://doi.org/10.1007/s00767-021-00504-z, 2022.
Hale, S., Naab, C., Butscher, C., and Blum, P.: Method Comparison to Determine Hydraulic Apertures of Natural Fractures, Rock Mech. Rock Eng., 53, 1467–1476, https://doi.org/10.1007/s00603-019-01966-7, 2020.
Hassanzadegan, A., Blöcher, G., Zimmermann, G., and Milsch, H.: Thermoporoelastic properties of Flechtinger sandstone, Int. J. Rock Mech. Min., 49, 94–104, https://doi.org/10.1016/j.ijrmms.2011.11.002, 2012.
Heidsiek, M., Butscher, C., Blum, P., and Fischer, C.: Small-scale diagenetic facies heterogeneity controls porosity and permeability pattern in reservoir sandstones, Environ. Earth Sci., 79, 425, https://doi.org/10.1007/s12665-020-09168-z, 2020.
Hiraoka, Y., Nakamura, T., Hirata, A., Escolar, E. G., Matsue, K., and Nishiura, Y.: Hierarchical structures of amorphous solids characterized by persistent homology, P. Natl. Acad. Sci. USA, 113, 7035–7040, https://doi.org/10.1073/pnas.1520877113, 2016.
Hong, J. and Liu, J.: Rapid estimation of permeability from digital rock using 3D convolutional neural network, Comput. Geosci., 24, 1523–1539, https://doi.org/10.1007/s10596-020-09941-w, 2020.
Huerta, N. J., Hesse, M. A., Bryant, S. L., Strazisar, B. R., and Lopano, C. L.: Experimental evidence for self-limiting reactive flow through a fractured cement core: implications for time-dependent wellbore leakage, Environ. Sci. Technol., 47, 269–275, https://doi.org/10.1021/es3013003, 2013.
Javadi, M., Sharifzadeh, M., and Shahriar, K.: A new geometrical model for non-linear fluid flow through rough fractures, J. Hydrol., 389, 18–30, https://doi.org/10.1016/j.jhydrol.2010.05.010, 2010.
Javanmard, H., Ebigbo, A., Walsh, S. D. C., Saar, M. O., and Vogler, D.: No-Flow Fraction (NFF) Permeability Model for Rough Fractures Under Normal Stress, Water Res., 57, e2020WR029080, https://doi.org/10.1029/2020WR029080, 2021.
Jiang, F., Tsuji, T., and Shirai, T.: Pore Geometry Characterization by Persistent Homology Theory, Water Res., 54, 4150–4163, https://doi.org/10.1029/2017WR021864, 2018.
Kling, T., Schwarz, J.-O., Wendler, F., Enzmann, F., and Blum, P.: Fracture flow due to hydrothermally induced quartz growth, Adv. Water Resour., 107, 93–107, https://doi.org/10.1016/j.advwatres.2017.06.011, 2017.
Kozeny, J.: Ueber kapillare Leitung des Wassers im Boden, Sitzungsber. Akad. Wiss., 271–306, 1927.
Louis, C.: Rock Hydraulics, in: Rock Mechanics, edited by: Müller, L., Springer Vienna, Vienna, 299–387, https://doi.org/10.1007/978-3-7091-4109-0_16, 1972.
Marchand, S., Mersch, O., Selzer, M., Nitschke, F., Schoenball, M., Schmittbuhl, J., Nestler, B., and Kohl, T.: A Stochastic Study of Flow Anisotropy and Channelling in Open Rough Fractures, Rock Mech. Rock Eng., 53, 233–249, https://doi.org/10.1007/s00603-019-01907-4, 2020.
Mehmani, Y. and Tchelepi, H. A.: Minimum requirements for predictive pore-network modeling of solute transport in micromodels, Adv. Water Resour., 108, 83–98, https://doi.org/10.1016/j.advwatres.2017.07.014, 2017.
Min, K.-B., Jing, L., and Stephansson, O.: Determining the equivalent permeability tensor for fractured rock masses using a stochastic REV approach: Method and application to the field data from Sellafield, UK, Hydrogeol. J., 12, 497–510, https://doi.org/10.1007/s10040-004-0331-7, 2004.
Moon, C., Mitchell, S. A., Heath, J. E., and Andrew, M.: Statistical Inference Over Persistent Homology Predicts Fluid Flow in Porous Media, Water Res., 55, 9592–9603, https://doi.org/10.1029/2019WR025171, 2019.
Muljadi, B. P., Blunt, M. J., Raeini, A. Q., and Bijeljic, B.: The impact of porous media heterogeneity on non-Darcy flow behaviour from pore-scale simulation, Adv. Water Resour., 95, 329–340, https://doi.org/10.1016/j.advwatres.2015.05.019, 2016.
Müller, C., Siegesmund, S., and Blum, P.: Evaluation of the representative elementary volume (REV) of a fractured geothermal sandstone reservoir, Environ. Earth Sci., 61, 1713–1724, https://doi.org/10.1007/s12665-010-0485-7, 2010.
New England Research Inc.: TinyPerm 3, Product information, White River Junction, VT, 2016.
Nikon Metrology NV: MCA II Articulated arms: Portable productivity, Product information, 2010.
Nikon Metrology NV: ModelMaker Handheld scanners, MCAx Articulated arms, Product information, 2018.
Novakowski, K. S. and Lapcevic, P. A.: Field measurement of radial solute transport in fractured rock, Water Res., 30, 37–44, https://doi.org/10.1029/93WR02401, 1994.
Obayashi, I., Nakamura, T., and Hiraoka, Y.: Persistent Homology Analysis for Materials Research and Persistent Homology Software: HomCloud, J. Phys. Soc. Jpn., 91, 091013, https://doi.org/10.7566/JPSJ.91.091013, 2022.
Oliveira, G. L. P., Ceia, M. A., Missagia, R. M., Lima Neto, I., Santos, V. H., and Paranhos, R.: Core plug and 2D/3D-image integrated analysis for improving permeability estimation based on the differences between micro- and macroporosity in Middle East carbonate rocks, J. Petrol. Sci. Eng., 193, 107335, https://doi.org/10.1016/j.petrol.2020.107335, 2020.
Patir, N. and Cheng, H. S.: An Average Flow Model for Determining Effects of Three-Dimensional Roughness on Partial Hydrodynamic Lubrication, Journal of Lubrication Technology, 100, 12–17, https://doi.org/10.1115/1.3453103, 1978.
Permann, C. J., Gaston, D. R., Andrš, D., Carlsen, R. W., Kong, F., Lindsay, A. D., Miller, J. M., Peterson, J. W., Slaughter, A. E., Stogner, R. H., and Martineau, R. C.: MOOSE: Enabling massively parallel multiphysics simulation, SoftwareX, 11, 100430, https://doi.org/10.1016/j.softx.2020.100430, 2020.
Pyrak-Nolte, L. J. and Morris, J. P.: Single fractures under normal stress: The relation between fracture specific stiffness and fluid flow, Int. J. Rock Mech. Min., 37, 245–262, https://doi.org/10.1016/S1365-1609(99)00104-5, 2000.
Robins, V., Saadatfar, M., Delgado-Friedrichs, O., and Sheppard, A. P.: Percolating length scales from topological persistence analysis of micro- CT images of porous materials, Water Res., 52, 315–329, https://doi.org/10.1002/2015WR017937, 2016.
Schädle, P.: SaintBernard: A MOOSE Application to model flow and transport through lower dimensional rough fractures, Zenodo [code], https://doi.org/10.5281/zenodo.3763869, 2020.
Sudakov, O., Burnaev, E., and Koroteev, D.: Driving digital rock towards machine learning: Predicting permeability with gradient boosting and deep neural networks, Comput. Geosci., 127, 91–98, https://doi.org/10.1016/j.cageo.2019.02.002, 2019.
Suzuki, A., Watanabe, N., Li, K., and Horne, R. N.: Fracture network created by 3-D printer and its validation using CT images, Water Res., 53, 6330–6339, https://doi.org/10.1002/2017WR021032, 2017.
Suzuki, A., Minto, J. M., Watanabe, N., Li, K., and Horne, R. N.: Contributions of 3D Printed Fracture Networks to Development of Flow and Transport Models, Transp. Porous Med., 129, 485–500, https://doi.org/10.1007/s11242-018-1154-7, 2019.
Suzuki, A., Miyazawa, M., Okamoto, A., Shimizu, H., Obayashi, I., Hiraoka, Y., Tsuji, T., Kang, P. K., and Ito, T.: Inferring fracture forming processes by characterizing fracture network patterns with persistent homology, Comput. Geosci., 143, 104550, https://doi.org/10.1016/j.cageo.2020.104550, 2020.
Suzuki, A., Miyazawa, M., Minto, J. M., Tsuji, T., Obayashi, I., Hiraoka, Y., and Ito, T.: Flow estimation solely from image data through persistent homology analysis, Sci. Rep., 11, 17948, https://doi.org/10.1038/s41598-021-97222-6, 2021.
Tatone, B. S. A. and Grasselli, G.: Quantitative Measurements of Fracture Aperture and Directional Roughness from Rock Cores, Rock Mech. Rock Eng., 45, 619–629, https://doi.org/10.1007/s00603-011-0219-5, 2012.
Tatone, B. S. A. and Grasselli, G.: An Investigation of Discontinuity Roughness Scale Dependency Using High-Resolution Surface Measurements, Rock Mech. Rock Eng., 46, 657–681, https://doi.org/10.1007/s00603-012-0294-2, 2013.
Thiele, S. T., Jessell, M. W., Lindsay, M., Ogarko, V., Wellmann, J. F., and Pakyuz-Charrier, E.: The topology of geology 1: Topological analysis, Journal of Structural Geology, 91, 27–38, https://doi.org/10.1016/j.jsg.2016.08.009, 2016.
Thörn, J. and Fransson, Å.: A new apparatus and methodology for hydromechanical testing and geometry scanning of a rock fracture under low normal stress, Int. J. Rock Mech. Min., 79, 216–226, https://doi.org/10.1016/j.ijrmms.2015.08.015, 2015.
Torskaya, T., Shabro, V., Torres-Verdín, C., Salazar-Tio, R., and Revil, A.: Grain Shape Effects on Permeability, Formation Factor, and Capillary Pressure from Pore-Scale Modeling, Transp. Porous Med., 102, 71–90, https://doi.org/10.1007/s11242-013-0262-7, 2014.
Tsang, C.-F. and Neretnieks, I.: Flow channeling in heterogeneous fractured rocks, Rev. Geophys., 36, 275–298, https://doi.org/10.1029/97RG03319, 1998.
Tsang, Y. W.: Usage of “Equivalent apertures” for rock fractures as derived from hydraulic and tracer tests, Water Res., 28, 1451–1455, https://doi.org/10.1029/92WR00361, 1992.
Vogler, D., Settgast, R. R., Annavarapu, C., Madonna, C., Bayer, P., and Amann, F.: Experiments and Simulations of Fully Hydro-Mechanically Coupled Response of Rough Fractures Exposed to High-Pressure Fluid Injection, J. Geophys. Res.-Sol. Ea., 123, 1186–1200, https://doi.org/10.1002/2017JB015057, 2018.
Wang, M., Chen, Y.-F., Ma, G.-W., Zhou, J.-Q., and Zhou, C.-B.: Influence of surface roughness on nonlinear flow behaviors in 3D self-affine rough fractures: Lattice Boltzmann simulations, Adv. Water Resour., 96, 373–388, https://doi.org/10.1016/j.advwatres.2016.08.006, 2016.
Wang, Q., Hu, X., Zheng, W., Li, L., Zhou, C., Ying, C., and Xu, C.: Mechanical Properties and Permeability Evolution of Red Sandstone Subjected to Hydro-mechanical Coupling: Experiment and Discrete Element Modelling, Rock Mech. Rock Eng., 54, 2405–2423, https://doi.org/10.1007/s00603-021-02396-0, 2021.
Watanabe, N., Hirano, N., and Tsuchiya, N.: Determination of aperture structure and fluid flow in a rock fracture by high-resolution numerical modeling on the basis of a flow-through experiment under confining pressure, Water Res., 44, W06412, https://doi.org/10.1029/2006WR005411, 2008.
Weede, M. and Hötzl, H.: Strömung und Transport in einer natürlichen Einzelkluft in poröser Matrix – Experimente und Modellierung, Grundwasser – Zeitschrift der Fachsektion Hydrogeologie, 10, 137–145, https://doi.org/10.1007/s00767-005-0090-y, 2005.
Wilkins, A., Green, C., and Ennis-King, J.: PorousFlow: a multiphysics simulation code for coupled problems in porous media, J. Open Source Softw., 5, 2176, https://doi.org/10.21105/joss.02176, 2020.
Wilkins, A., Green, C. P., and Ennis-King, J.: An open-source multiphysics simulation code for coupled problems in porous media, Comput. Geosci., 154, 104820, https://doi.org/10.1016/j.cageo.2021.104820, 2021.
Xiong, X., Li, B., Jiang, Y., Koyama, T., and Zhang, C.: Experimental and numerical study of the geometrical and hydraulic characteristics of a single rock fracture during shear, Int. J. Rock Mech. Min., 48, 1292–1302, https://doi.org/10.1016/j.ijrmms.2011.09.009, 2011.
Zomorodian, A. and Carlsson, G.: Computing Persistent Homology, Discrete Comput. Geom., 33, 249–274, https://doi.org/10.1007/s00454-004-1146-y, 2005.