the Creative Commons Attribution 4.0 License.
the Creative Commons Attribution 4.0 License.
 | 03 Apr 2024
Fast uplift in the southern Patagonian Andes due to long- and short-term deglaciation and the asthenospheric window underneath
Veleda A. P. Muller
Pietro Sternai
Christian Sue
An asthenospheric window underneath much of the South American continent increases the heat flow in the southern Patagonian Andes where glacial–interglacial cycles drive the building and melting of the Patagonian Icefields since the latest Miocene. The Last Glacial Maximum (LGM) was reached ∼26 000 yr BP (years before present). Significant deglaciation onsets between 21 000 and 17 000 yr BP were subject to an acceleration since the Little Ice Age (LIA), which was ∼400 yr BP. Fast uplift rates of up to 41±3 mm yr−1 are measured by global navigation satellite system (GNSS) around the Southern Patagonian Icefield and are currently ascribed to post-LIA lithospheric rebound, but the possible longer-term post-LGM rebound is poorly constrained. These uplift rates, in addition, are 1 order of magnitude higher than those measured on other glaciated orogens (e.g. the European Alps), which raises questions about the role of the asthenospheric window in affecting the vertical surface displacement rates. Here, we perform geodynamic thermo-mechanical numerical modelling to estimate the surface uplift rates induced by post-LIA and post-LGM deglaciation, accounting for temperature-dependent rheologies and different thermal regimes in the asthenosphere. Our modelled maximum post-glacial rebound matches the observed uplift rate budget only when both post-LIA and post-LGM deglaciation are accounted for and only if a standard continental asthenospheric mantle potential temperature is increased by 150–200 °C. The asthenospheric window thus plays a key role in controlling the magnitude of presently observed uplift rates in the southern Patagonian Andes.
- Article
(5902 KB) - Full-text XML
- BibTeX
- EndNote


Vertical displacements of the Earth's surface with respect to the geoid occur in response to the motion of crustal and mantle rock masses due to mantle dynamics, plate tectonics, and the redistribution of sediments, water, and ice by surface processes (e.g. Molnar and England, 1990; Watts, 2001; Champagnac et al., 2012; Sternai, 2023; Cloetingh et al., 2023). For instance, an excess of topography in orogenic regions due to convergence, crustal shortening, and magmatism deflects the lithosphere downward, whereas surface unloading by erosion and ice melting causes upward deflection of the lithosphere, known as “isostatic” adjustment (e.g. Peltier and Andrews, 1976; Peltier, 1996, 2004; Mitrovica and Forte, 1997; Butler and Peltier, 2000; Kaufman and Lambeck, 2002; Watts, 2001; Turcotte and Schubert, 2002; Sternai et al., 2016a). Glacial isostatic adjustment (GIA) models study the viscoelastic response of the solid Earth to the building and melting of regional ice sheets, and they commonly use GNSS and/or satellite-measured rock uplift rates in regions subject to deglaciation to estimate, for instance, the regional mantle rheology and sea-level changes (e.g. Peltier and Andrews, 1976; Peltier, 1996, 2004; Mitrovica and Forte, 1997; Kaufman and Lambeck, 2002; Stuhne and Peltier, 2015; van der Wal et al., 2015; Peltier et al., 2018; Whitehouse, 2018). Most of the GIA studies address the post-LGM (Last Glacial Maximum) around 21 000 yr BP (years before present) deglaciation as a trigger for increasing uplift rates in glaciated regions (e.g. Peltier, 2004; Whitehouse, 2018). The magnitude of uplift rates is set primarily by the lithosphere and asthenosphere viscosities, which depend, amongst other factors, on the thermal field at depth (McKenzie and Richter, 1981; McKenzie and Bickle, 1988; Gurnis, 1989; Ranalli, 1995, 1997; Kaufman et al., 1997; Watts, 2001; Turcotte and Schubert, 2002). While the GIA theory is well developed, few studies use thermo-mechanical visco-elasto-plastic (non-Newtonian Earth layers) geodynamic models to estimate uplift rates in response to surface load changes to be compared with GNSS data. Here, we use this approach to constrain the role of the solid Earth rheology in setting the rates of surface vertical displacement in southern Patagonia, which hosts the biggest continental ice sheets outside of Antarctica and presents ongoing very high rock uplift rates (Ivins and James, 2004; Dietrich et al., 2010; Lange et al., 2014; Richter et al., 2016; Lenzano et al., 2023).
The southern Patagonian Andes in the South American continent are located above a transition zone between the subducting Antarctic and Nazca plates and a wide asthenospheric window where hot buoyant asthenospheric mantle upwells (Fig. 1a; Cande and Leslie, 1986; Breitsprecher and Thorkelson, 2009; Russo et al., 2010, 2022; Dávila et al., 2018; Ávila and Dávila, 2018, 2020; Mark et al., 2022; Ben-Mansour et al., 2022). The Chile triple junction (CTJ) at ∼46° S delimits the surface tip of the asthenospheric window, which opened during the last ∼16 Myr from south to north (Ramos and Kay, 1992; Breitsprecher and Thorkelson, 2009). First-order effects of the asthenospheric flow on the surface continental geology are the inhibition of arc volcanism in favour of retroarc magmatism, reduction in shortening to null or very minor, and rock uplift and exhumation (Ramos and Kay, 1992; Ramos, 2005; Lagabrielle et al., 2004, 2010; Breitsprecher and Thorkelson, 2009; Guillaume et al., 2009, 2013; Scalabrino et al., 2010; Lange et al., 2014; Georgieva et al., 2016, 2019; Ávila and Dávila, 2020; Mark et al., 2022; Ávila et al., 2023; Muller et al., 2023). Rock uplift due to asthenospheric upwelling occurs through dynamic and thermal effects (Guillaume et al., 2009, 2013; Conrad and Husson, 2009; Flament et al., 2013; Sternai et al., 2016b; Dávila et al., 2018; Ávila and Dávila, 2020; Faccenna and Becker, 2020; Mark et al., 2022). Dynamic uplift occurs above zones of viscous convection of the asthenospheric mantle, generating long wavelength (>300 km) deformation of the lithosphere through vertical stresses (Hager and O'Connell, 1981; Flament et al., 2013, 2015; Sternai et al., 2016b; Ávila and Dávila, 2020; Faccenna and Becker, 2020). This effect is difficult to measure because vertical stresses in the lithosphere also occur due to lithospheric tectonics and to the surface mass redistribution of glaciers, lakes, and sediments (Lachenbruch and Morgan, 1990; Molnar and England, 1990; Watts, 2001). Dynamic uplift was estimated to be between 0.02 and 0.15 mm yr−1 in the last 3 Myr over an area of about 100 000 km2 around the CTJ latitude (Guillaume et al., 2009, 2013; Flament et al., 2015; Ávila and Dávila, 2020; Ávila et al., 2023). The thermal component is expressed by an increase in temperatures and by a shallowing of the lithosphere–asthenosphere boundary where asthenospheric mantle upwells (Ávila and Dávila, 2018, 2020; Russo et al., 2010, 2022; Mark et al., 2022; Ben-Mansour et al., 2022), decreasing the integrated elastic lithospheric thickness and generating uplift and a higher surface heat flow than in normal subduction zones (Ranalli, 1997; Flament et al., 2015; Ávila and Dávila, 2018, 2020; Ávila et al., 2023). The heat flow was calculated as >100 mW m−2 near the CTJ, ∼70–90 mW m−2 in the centre of the asthenospheric window (∼50° S), and 50–60 mW m−2 near its northern boundary (∼46° S) (Ávila and Dávila, 2018). Uplift due to lithospheric thinning was estimated to be ∼0.3 mm yr−1 since the middle Miocene in the southern Patagonian Andes (Pedoja et al., 2011; Ávila and Dávila, 2020; Ávila et al., 2023; Ding et al., 2023).
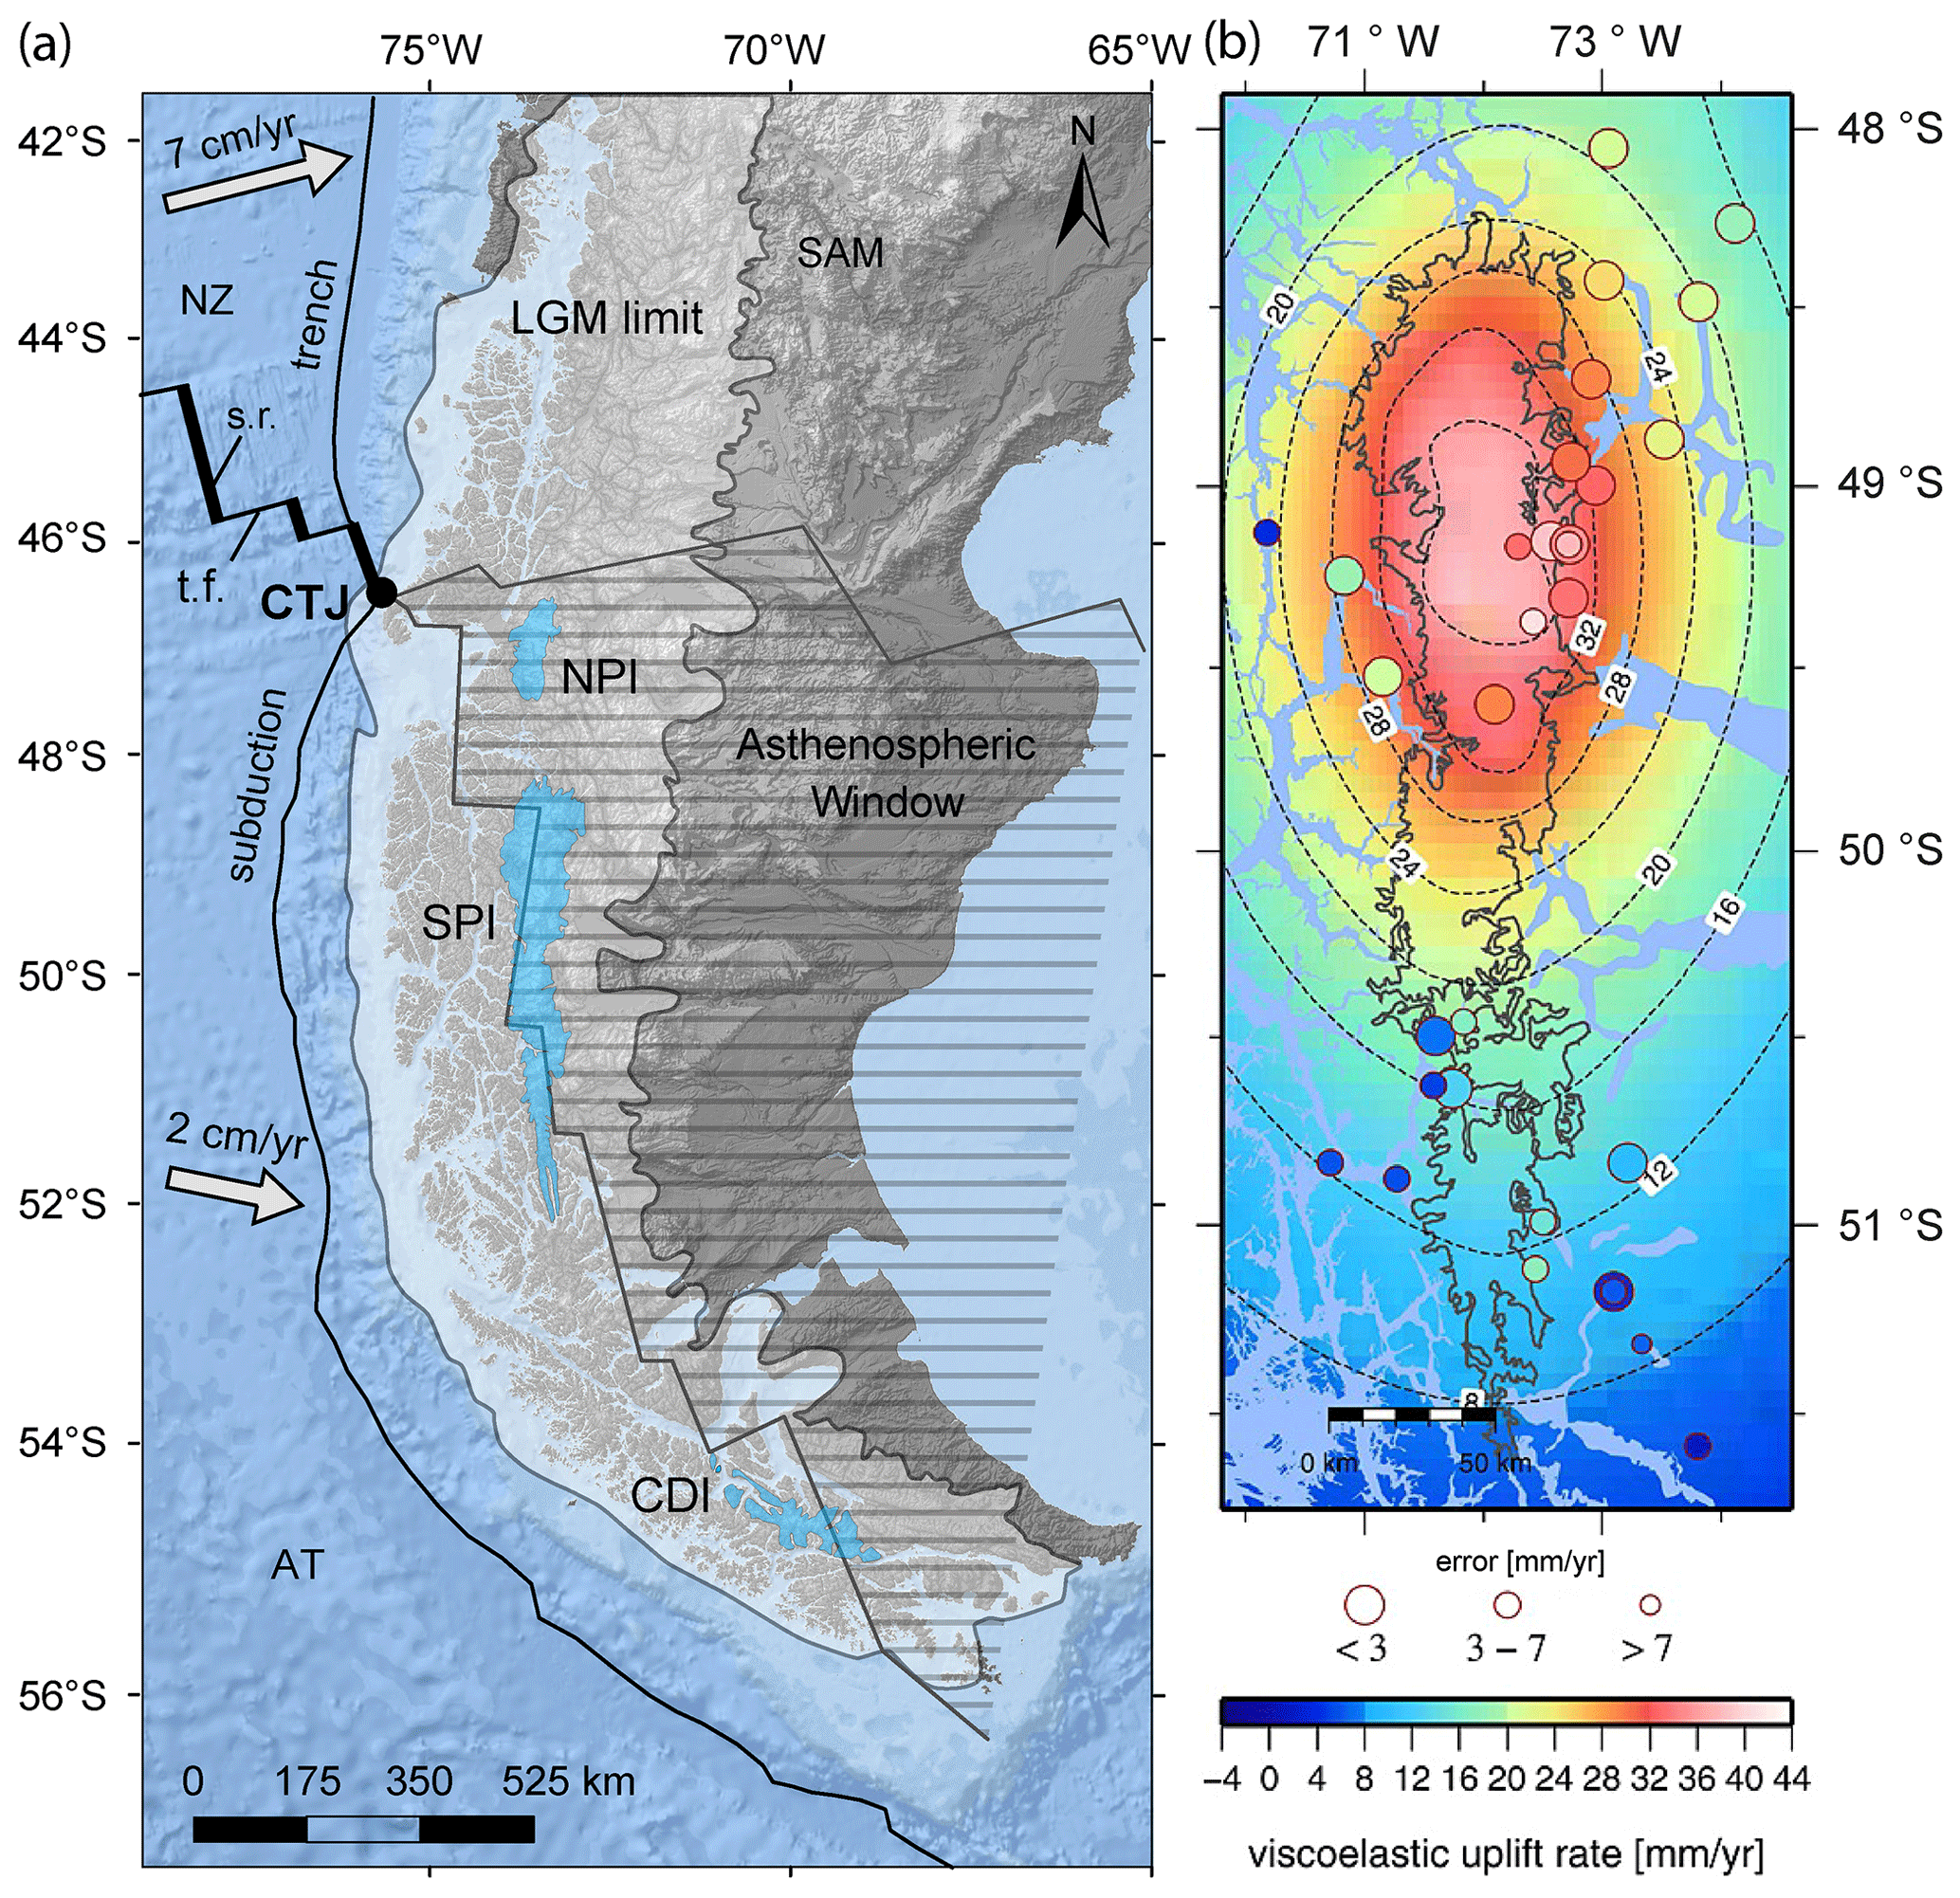
Figure 1Regional context and uplift rate data. (a) Map of southern Patagonia with the Southern Patagonian Icefield (SPI), Northern Patagonian Icefield (NPI), and the Cordillera Darwin Icefield (CDI) in light blue. The map also shows the approximate extension of the Patagonian Ice Sheet at the Last Glacial Maximum (LGM) (adapted from Thorndycraft et al., 2019) and the approximate extension of the present-day asthenospheric window (dashed region) beneath the South American (SAM) Continent (adapted from Breitsprecher and Thorkelson, 2009). In the Pacific Ocean, the spreading ridges (s.r.; thick-black lines) and transform faults (t.f.; thin-black lines) separate the Nazca (NZ) and the Antarctic (AT) plates. The subduction trench is also highlighted in black. The arrows show the approximate rate and direction of subduction of the oceanic plates (adapted from DeMets et al., 2010). (b) A zoomed-in view of the SPI with GNSS-measured rock uplift rates (colour-coded disks) used to estimate the viscoelastic uplift rates in Lange et al. (2014).
The Patagonian Ice Sheet covered the southern Patagonian Andes between ∼47 000 and ∼17 000 yr BP, extending from latitudes 38 to 55° S with an estimated area of ∼490 000 km2 (Fig. 1a); volume of ∼550 000 km3; and average and maximum thickness of 1100 and 2500 m, respectively, based on preserved glacial geomorphology, stratigraphy, palaeoecology, and geochronological data (Moreno et al., 1999, 2015; McCulloch et al., 2000, 2005; Hulton et al., 2002; Rabassa, 2008; Glasser et al., 2004, 2005, 2008, 2016; Glasser and Jansson, 2008; Hein et al., 2010; Boex et al., 2013; Strelin et al., 2014; Bourgois et al., 2016; Martinod et al., 2016; Kaplan et al., 2016; Bendle et al., 2017; Thorndycraft et al., 2019; Reynhout et al., 2019; Davies et al., 2020; Yan et al., 2022). The LGM in southern Patagonia is estimated around 26 000 yr BP, but the beginning of significant glacial retreat occurred between 21 000 and 17 000 yr BP (Hulton et al., 2002; Hein et al., 2010; Glasser et al., 2011; Davies and Glasser, 2012; Moreno et al., 2015; Bendle et al., 2017; Reynhout et al., 2019; Davies et al., 2020). The long-term ice loss rate is uncertain, but more than 75 % of ice was certainly lost since the LGM, and some models predicted more than 95 % of ice loss with separation between the Southern Patagonian Icefields (SPI) and the Northern Patagonian Icefields (NPI) in the first 5000 to 10 000 years of post-LGM deglaciation (McCulloch et al., 2000; Hulton et al., 2002; Boex et al., 2013; Bourgois et al., 2016; Thorndycraft et al., 2019; Davies et al., 2020). A glacial minimum must have been attained around 13 000 yr BP, but several glacial advances were recorded since that time, and the last recorded one was the Little Ice Age (LIA) with an apex around 1630 CE, well dated by terminal moraines around the present-day NPI and SPI (Ivins and James, 1999, 2004; McCulloch et al., 2000; Glasser et al., 2004, 2008, 2011; Davies and Glasser, 2012; Strelin et al., 2014; Kaplan et al., 2016; Reynhout et al., 2019; Davies et al., 2020). Recent mass balance measurements in the Patagonian Icefields – e.g. the Shuttle-Radar Topography Mission (SRTM) or Gravity Recovery and Climate Experiment (GRACE) – often present discrepancies but consistently show an increasing ice loss from ∼15 Gt yr−1 between ∼1940–2000 to ∼25 Gt yr−1 between ∼2000–2012 (Aniya, 1996; Aniya et al., 1997; Rignot et al., 2003; Chen et al., 2007; Ivins et al., 2011; Jacob et al., 2012; Willis et al., 2012; Gómez et al., 2022). Currently, the SPI covers an area of ∼13 219 km2 with a volume of 3632±675 km3, whereas the NPI covers an area of ∼3976 km2 with a volume of 1124±260 km3 (Fig. 1). The present-day ice thickness may reach up to ∼2000 m in deep glacial valleys (Millan et al., 2019).
GNSS-measured data show ongoing vertical rock uplift rates between 18±3 and 41±3 mm yr−1 in the northern part (18–50.5° S) of the SPI (Fig. 1b), decreasing to values between 2±6 and 17±5 mm yr−1 in its southern part (50.5–51.5° S) (Ivins and James, 2004; Dietrich et al., 2010; Lange et al., 2014; Richter et al., 2016; Lenzano et al., 2023). Such outstandingly high uplift rates, especially in the northern part of the SPI, are currently ascribed to the lithospheric viscoelastic GIA following the LIA, which was responsible for an ice loss of 503±101.1 km3 in the SPI (Glasser et al., 2011). To match the very high observed uplift rate budget, previous GIA studies infer a low asthenosphere viscosity (in the order of 1018 Pa s) and a thin elastic lithosphere (∼35 km thick) (Ivins and James, 1999, 2004; Klemann et al., 2007; Dietrich et al., 2010; Lange et al., 2014; Richter et al., 2016; Ávila and Dávila, 2020; Mark et al., 2022; Lenzano et al., 2023). Although this is consistent with abnormally high asthenospheric mantle temperatures, viscosity estimates from these previous studies are untied to the regional thermal regime, which prevents a more thorough characterisation of the role of the asthenospheric window underneath the SPI in affecting the observed uplift rates. In addition, the contribution of post-LGM deglaciation to present-day rock uplift rate was marginally addressed (Ivins and James, 1999, 2004; Klemann et al., 2007). Here, we perform fully coupled thermo-mechanical numerical geodynamic experiments forced by surface unloading scaled on post-LIA and post-LGM ice melting to evaluate their relative contribution to the observed regional uplift rates. Numerical experiments account for a range of positive thermal anomalies in the asthenosphere to further assess the role of the asthenospheric window in setting the mantle viscosity and associated post-glacial rebound. Focusing on the magnitude rather than on the pattern of the inferred surface uplift rates due to limited information on the spatial–temporal variations in the ice net mass balance and thickness since the LGM (e.g. Davies et al., 2020), we use the observed budget of rock uplift rate to constrain plausible thermal and viscosity structures at depth and the timing of post-glacial rebound.
As reference, we used the GNSS-derived data from 31 GPS stations installed at 380 km in north–south directions and 130 km in east–west directions around the SPI since 1996, published in Lange et al. (2014). The observed and estimated regional aseismic viscoelastic uplift rates presented in that study are shown in Fig. 1b. Details on the GPS data acquisition and analysis are given in the reference study (Lange et al., 2014).
2.1 Numerical model
We use a fully coupled thermo-mechanical, visco-elasto-plastic numerical geodynamic model to quantify the effect of thermal anomalies in the asthenospheric mantle on the magnitude of surface uplift rates due to deglaciation. We provide a short overview of the governing equations hereafter, while a detailed description of numerical technique can be found, for instance, in Gerya and Yuen (2007), Gerya (2019), Sternai (2020), Sternai et al. (2021), and Muller et al. (2022). The continuity equation allows for the conservation of mass during the displacement of a geological continuum:
where ρ is the local density, t is time, v is the velocity vector, and ∇ is the divergence operator. The momentum equation describes the changes in velocity of an object in the gravity field due to internal and external forces:
where σij is the stress tensor, xi and xj are spatial coordinates, and gi is the ith component of the gravity vector. The energy equation allows for the conservation of energy during advective and conductive heat transfer in the continuum:
where P is pressure; T is temperature; CP is specific heat capacity at a constant P; c is the thermal conductivity; and Hr, Hs, Ha, and Hl are the volumetric heat productions by radiogenic, shear, adiabatic, and latent heat, respectively. , , where is the deviatoric stress tensor and is the viscous deviatoric strain rate tensor. Ductile deformation is thermally activated generating viscous flow, which is calculated according to the material shear viscosity, η:
where is the second invariant of the deviatoric stress tensor, n is the stress exponent, Ad is the pre-exponential factor, Ea is the activation energy, Va is the activation volume, and R is the gas constant. is computed as
where δij is the Kronecker delta, is the bulk strain rate in response to irreversible volume changes, and ηbulk is the bulk viscosity. Recoverable deformation is defined by the elastic deviatoric strain rate tensor, , as
where μ is the shear modulus and is the objective co-rotational time derivative of the deviatoric stress tensor. The plastic deformation, brittle and localised, occurs at a low temperature when the absolute shear stress limit, σyield, is reached:
where C is cohesion and φ is the effective internal friction angle. The plastic strain rate tensor, , is defined as
where X is the plastic multiplier which satisfies the plastic yielding condition σII=σyield. The bulk strain rate tensor, , integrates the viscous, elastic, and plastic deformation:
2.2 Reference model setup and modelling approach
The model domain is 700 km wide and 120 km thick to account for realistic lithosphere and asthenospheric mantle thicknesses of South America at the latitudes of the SPI (Van der Meijde et al., 2013; Ávila and Dávila, 2018, 2020). From top to bottom, the model accounts for 10 km of “sticky” air, 30 km of continental crust (with rheology of quartzite, Ranalli, 1995), 30 km of lithospheric mantle, and 50 km of asthenospheric mantle (with rheology of dry dunite, Ranalli, 1995); this is in agreement with literature data (e.g. Van der Meijde et al., 2013; Ávila and Dávila, 2018, 2020). The initial geotherm is piecewise linear, resulting from an adiabatic temperature gradient of 0.5 °C km−1 in the asthenosphere (Turcotte and Schubert, 2002) and from thermal boundary conditions equal to 0 °C at the surface and 1327 °C at the bottom of the lithosphere, with a nil horizontal heat flux across the vertical boundaries. The rheologic and thermal structure of the reference model gives a lithospheric elastic thickness, Te (sensu Burov and Diament, 1995), of ∼30 km, comparable to previous estimates underneath the SPI based on GIA models (Ivins and James, 1999; Dietrich et al., 2010; Lange et al., 2014), heat flow data (Ávila and Dávila, 2018), waveform inversion (Robertson Maurice et al., 2003), and low-temperature thermochronology data (Thomson et al., 2010; Guillaume et al., 2013; Georgieva et al., 2016, 2019; Stevens Goddard and Fosdick, 2019; Ávila et al., 2023; Muller et al., 2023). Rocks' rheological properties are listed in Table 1.
Table 1Material properties used in the numerical experiments.
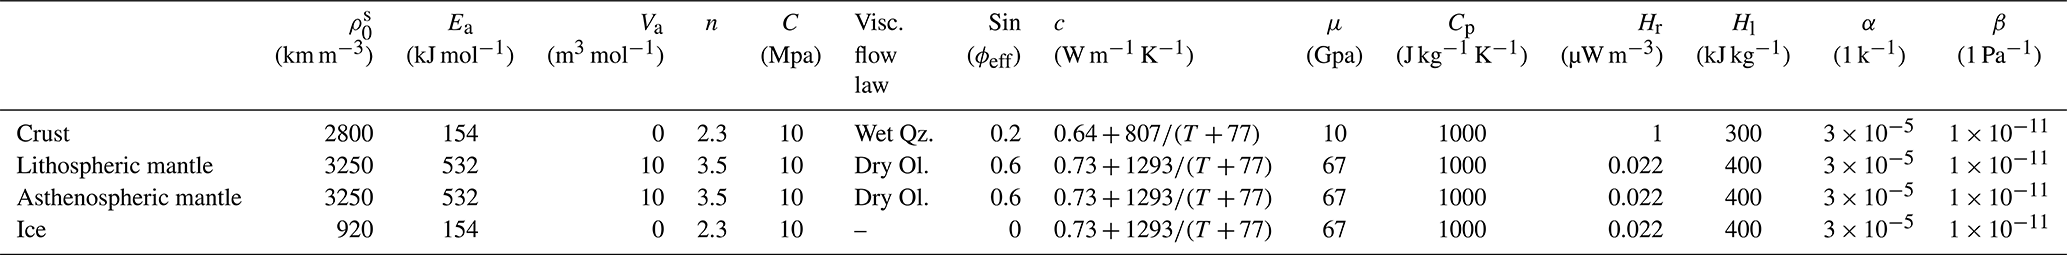
is the standard densities of solid rocks; Ea is the activation energy; Va is the activation volume; n is the stress exponent; C is cohesion; φeff is the effective internal friction angle; c is thermal conductivity; μ is the shear modulus; Cp is the specific heat capacity; Hr and Hl are the radiogenic and latent heat productions, respectively; α is thermal expansion; and β is compressibility. Qz and Ol are quartzite and olivine, respectively. All rheological and partial melting laws/parameters are based on experimental rock mechanics and petrology (Ranalli, 1995; Hirschmann, 2000; Johannes, 1985; Turcotte and Schubert, 2002).
The numerical model uses the finite differences with the marker-in-cell technique, resolved by 51×61 nodes in the horizontal, x, and vertical, y, directions, respectively, distributed on an Eulerian grid that accounts for a maximum resolution of 1 km along the y direction in the upper part of the model domain and ∼13 km in the x direction. Along the x and y dimensions, 400×400 Lagrangian markers are randomly distributed and used for advecting the material properties (Gerya and Yuen, 2007; Gerya, 2019). The material properties carried by Lagrangian markers are then interpolated onto the Eulerian grid via a fourth-order Runge–Kutta interpolation scheme. An internal free surface is simulated through the 10 km thick layer of sticky air. The velocity boundary conditions are free slip at all boundaries (x=0 and x=700 km; y=0 and y=120 km).
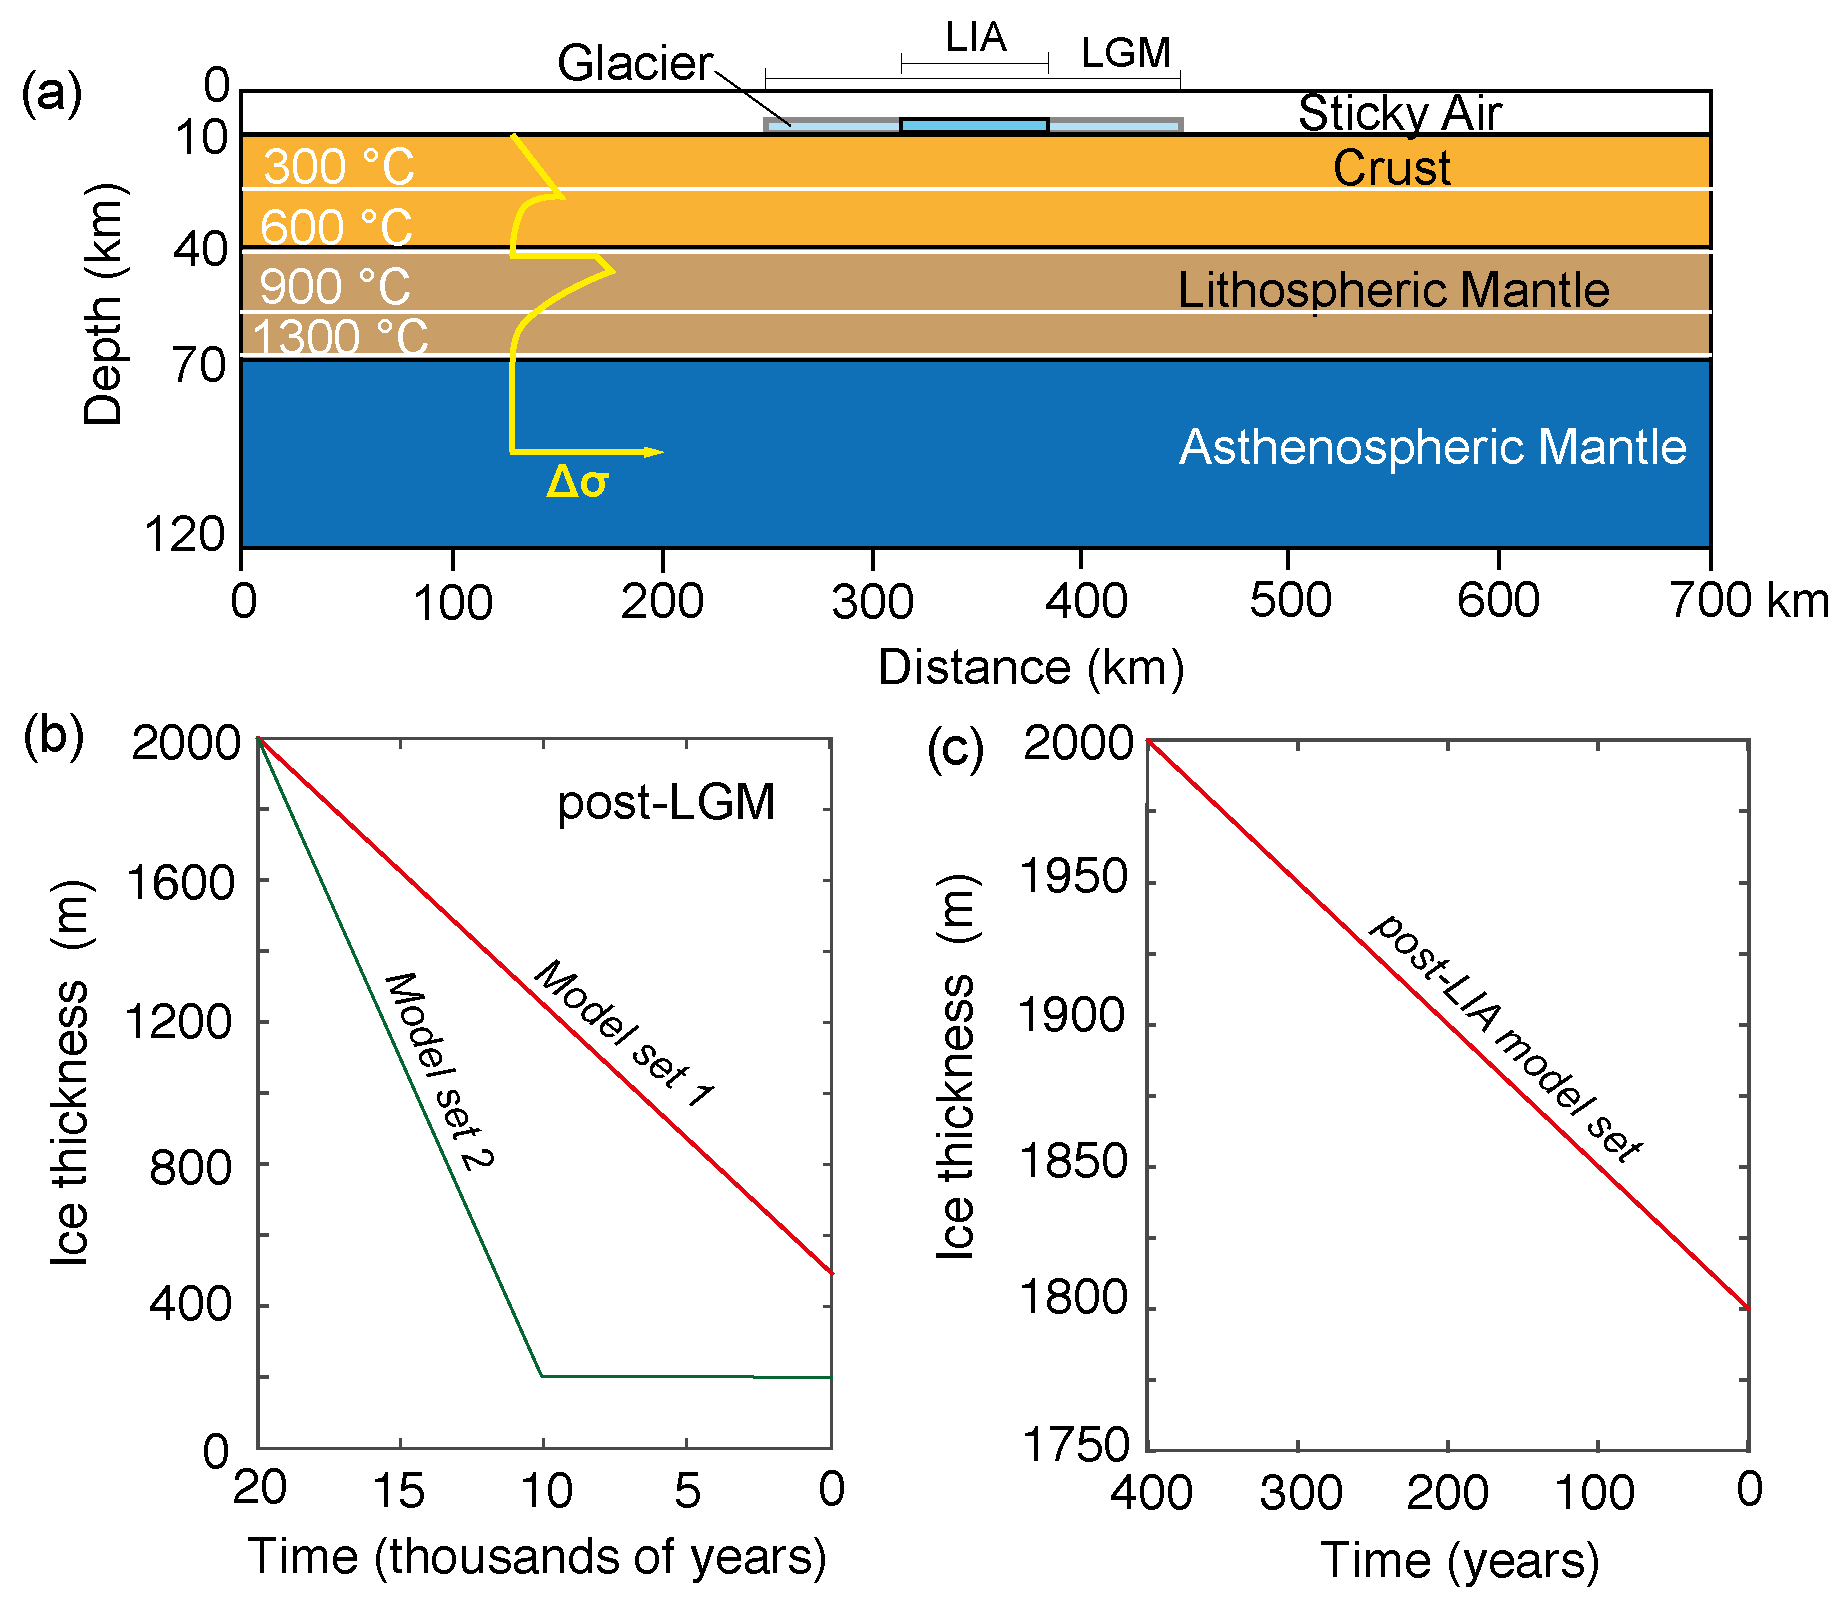
Figure 2Reference numerical model setup. (a) Thermo-mechanical numerical model domain with rheological layers (Table 1), isotherms (white lines), and yield strength () profile (yellow line). The yield strength (Δσ) profile is not scaled and aims to show the proportionality of the yield strength amongst the layers, dependent on the temperature and composition (Eq. 4). (b, c) Ice thickness vs. time used in the numerical models to simulate post-LGM deglaciation in two model sets (b) and in post-LIA deglaciation (c).
On the top of the crust and in the middle of the model domain we impose a 2 km thick pseudo-ice cap to simulate lithospheric unloading during deglaciation (Fig. 2a). The pseudo-ice cap has an initial density, ρice, of 920 kg m−3 (Harvey et al., 2017) (Table 1), and we compute the surface load through time, L, as
where g is the gravity acceleration and hice is the ice cap thickness. The load change due to the deglaciation occurs by gradually and uniformly reducing hice in time (Fig. 2b and c). We run two sets of experiments for post-LGM deglaciation. In Model set 1, 75 % of ice loss occurs in 20 000 years (i.e. 1500 m drop of ice thickness, Fig. 2b), thus assuming a conservative estimate of ice loss since the beginning of the LGM until the present day, simplifying the several glacial retreats and re-advances since the LGM (e.g. Glasser et al., 2004, 2008, 2011; Davies and Glasser, 2012; Strelin et al., 2014; Kaplan et al., 2016; Reynhout et al., 2019). In Model set 2, 95 % of ice loss occurs in 10 000 years (i.e. 1900 m drop of ice thickness, Fig. 2b), thus assuming faster deglaciation rates of the Patagonian Ice Sheet in the first half of post-LGM deglaciation (McCulloch et al., 2000; Hulton et al., 2002; Boex et al., 2013; Bendle et al., 2017; Thorndycraft et al., 2019; Davies et al., 2020). For the post-LIA deglaciation, we simulate 10 % of ice loss in 400 years (i.e. 200 m drop of ice thickness, Fig. 2c) using estimates of ice loss rates occurring since the nineteenth century (Aniya, 1996; Aniya et al., 1997; Rignot et al., 2003; Ivins and James, 1999, 2004; Chen et al., 2007; Dietrich et al., 2010; Ivins et al., 2011; Jacob et al., 2012; Willis et al., 2012). The pseudo-ice cap is 200 km wide for the post-LGM model sets 1 and 2, based on estimates of the LGM extent of the Patagonian Ice Sheet (e.g. McCulloch et al., 2000; Hein et al., 2010; Thorndycraft et al., 2018; Davies et al., 2020), and it is 70 km wide for the post-LIA model set, based on the estimates of the LIA maximum extent of the SPI (e.g. Glasser et al., 2011; Strelin et al., 2014; Kaplan et al., 2016; Reynhout et al., 2019) (Fig. 2a).
In the models, the lateral extent of the pseudo-ice cap does not change throughout the deglaciation. Although this simplification may affect the inferred pattern of post-glacial rebound, it greatly facilitates the simulation of deglacial lithospheric unloading without significantly affecting the magnitude of post-glacial rebound, which is the main focus here. All simulations account for some spin-up time before the deglaciation begins so that the lithosphere–asthenosphere system adjusts to the pseudo-ice cap's initial load. The uplift rate during the deglaciation is calculated through time as the surface elevation change which results from the modelled strain field divided by the viscoelastic time step (i.e. , where zcurr is the modelled topography at the considered time step, zprev is the modelled topography at the previous time step, and t is the viscoelastic time step duration). Given the geologically short time window investigated here, we neglect deformation related to longer-term tectonic forces (Breitsprecher and Thorkelson, 2009; Guillaume et al., 2013; Eagles and Scott, 2014; Muller et al., 2021). The parametric study focuses on the asthenospheric mantle potential temperature (sensu McKenzie and Bickle, 1988) which accounts for positive thermal anomalies, TA, of up to 200 °C in steps of 50 °C; this is then added to the reference asthenospheric mantle potential temperature of 1265 °C (McKenzie and Bickle, 1988; Currie and Hyndman, 2006; Ávila and Dávila, 2018, 2020; Sternai, 2020; Mark et al., 2022) to mimic the presence of a slab window at depth.
Results are shown in Table 2 and Figs. 4–7. In agreement with the theory of lithospheric flexure (e.g. Turcotte and Schubert, 2002), the deglaciation triggers uplift in the region covered by the melting pseudo-ice cap and subsidence in the neighbouring regions (Figs. 4–6). Overall, increasing the asthenospheric mantle potential temperature decreases the asthenospheric viscosity, with significant effects on the magnitude of the modelled surface velocity field. The asthenosphere viscosity ranges between 1022–1019 Pa s in simulations with TA equal to 0 (reference model), 50, and 100 °C and between 1019–1016 Pa s in simulations with TA equal to 150 and 200 °C (Fig. 3a–d). Lithospheric warming due to increasing asthenospheric mantle potential temperature also leads to a reduction in the lower lithosphere viscosity (from 1022 to 1020 Pa s), thereby decreasing the integrated lithospheric strength.
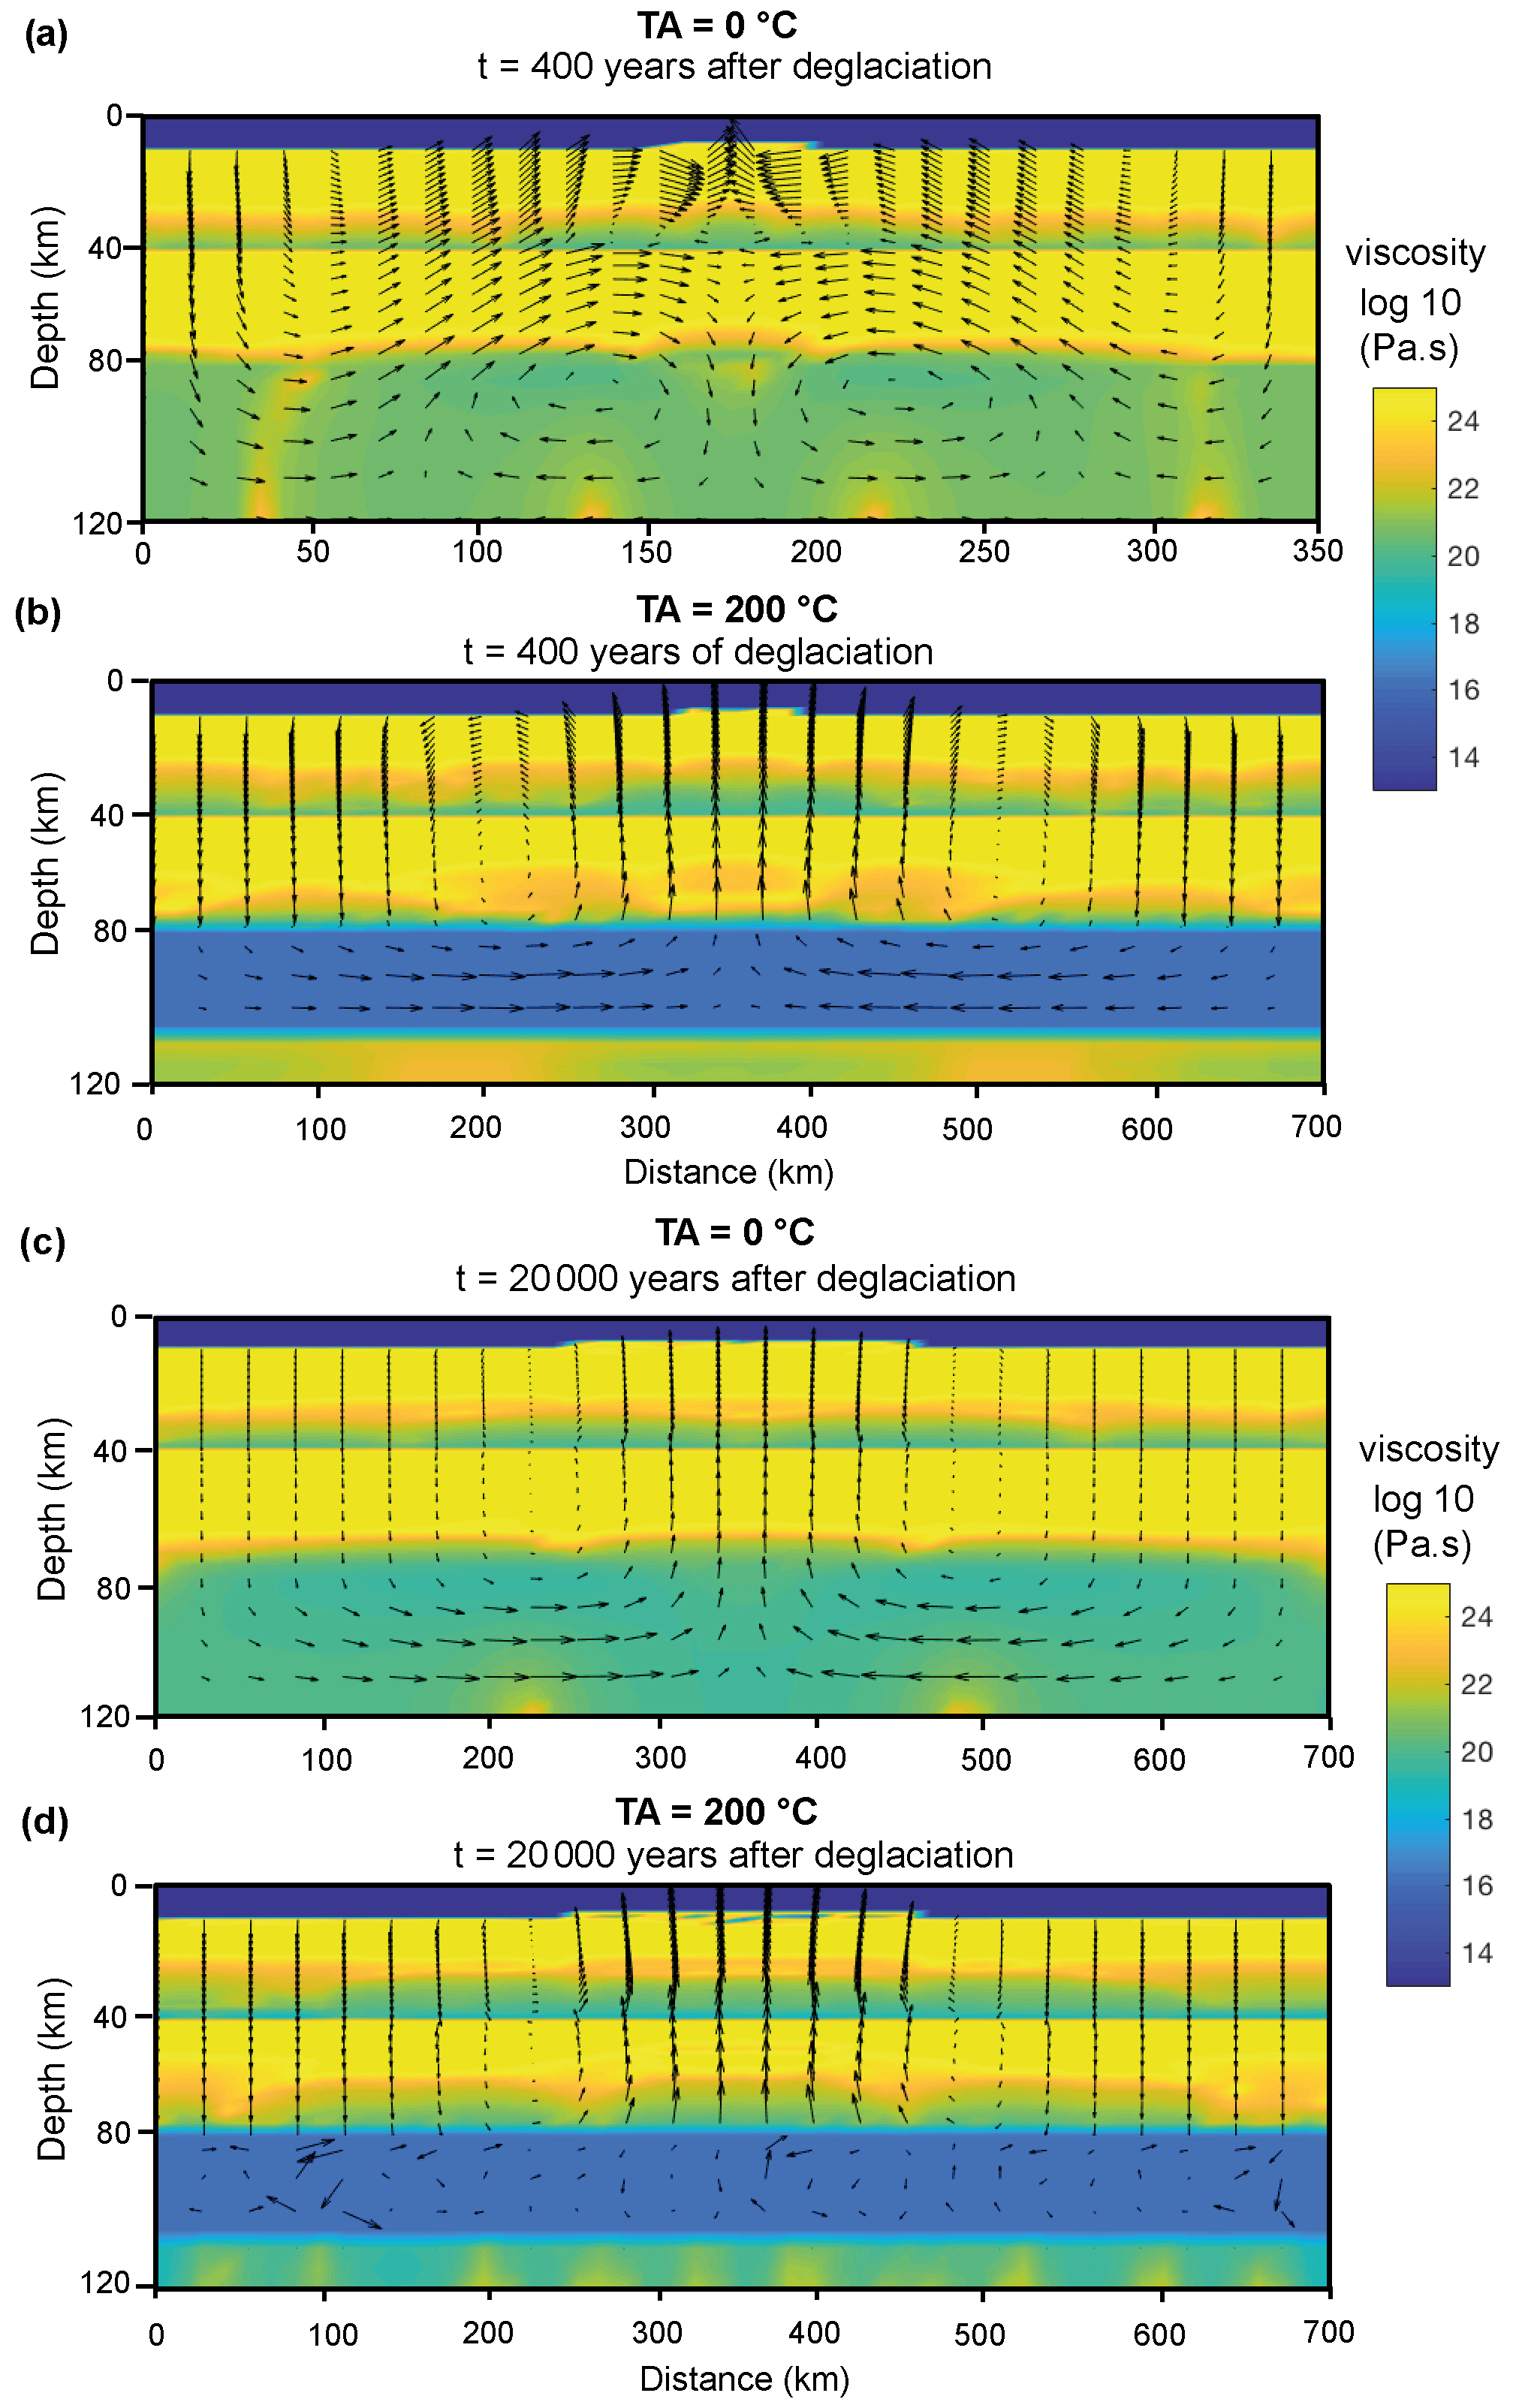
Figure 3Distribution of viscosity and velocity vectors in the numerical models. (a, c) Reference models without an asthenospheric thermal anomaly, TA = 0 °C, in the last time step of post-LIA deglaciation (a) and of Model set 1 of post-LGM deglaciation (c). (b, d) Model with the higher simulated asthenospheric thermal anomaly, TA = 200 °C, in the last time step of post-LIA deglaciation (b) and of Model set 1 of post-LGM deglaciation. Model set 2 has a very similar viscosity and velocity vectors distribution to Model set 1 in the last deglaciation time step. Velocity vectors do not have the same scaling and are only meant for visualisation purposes.
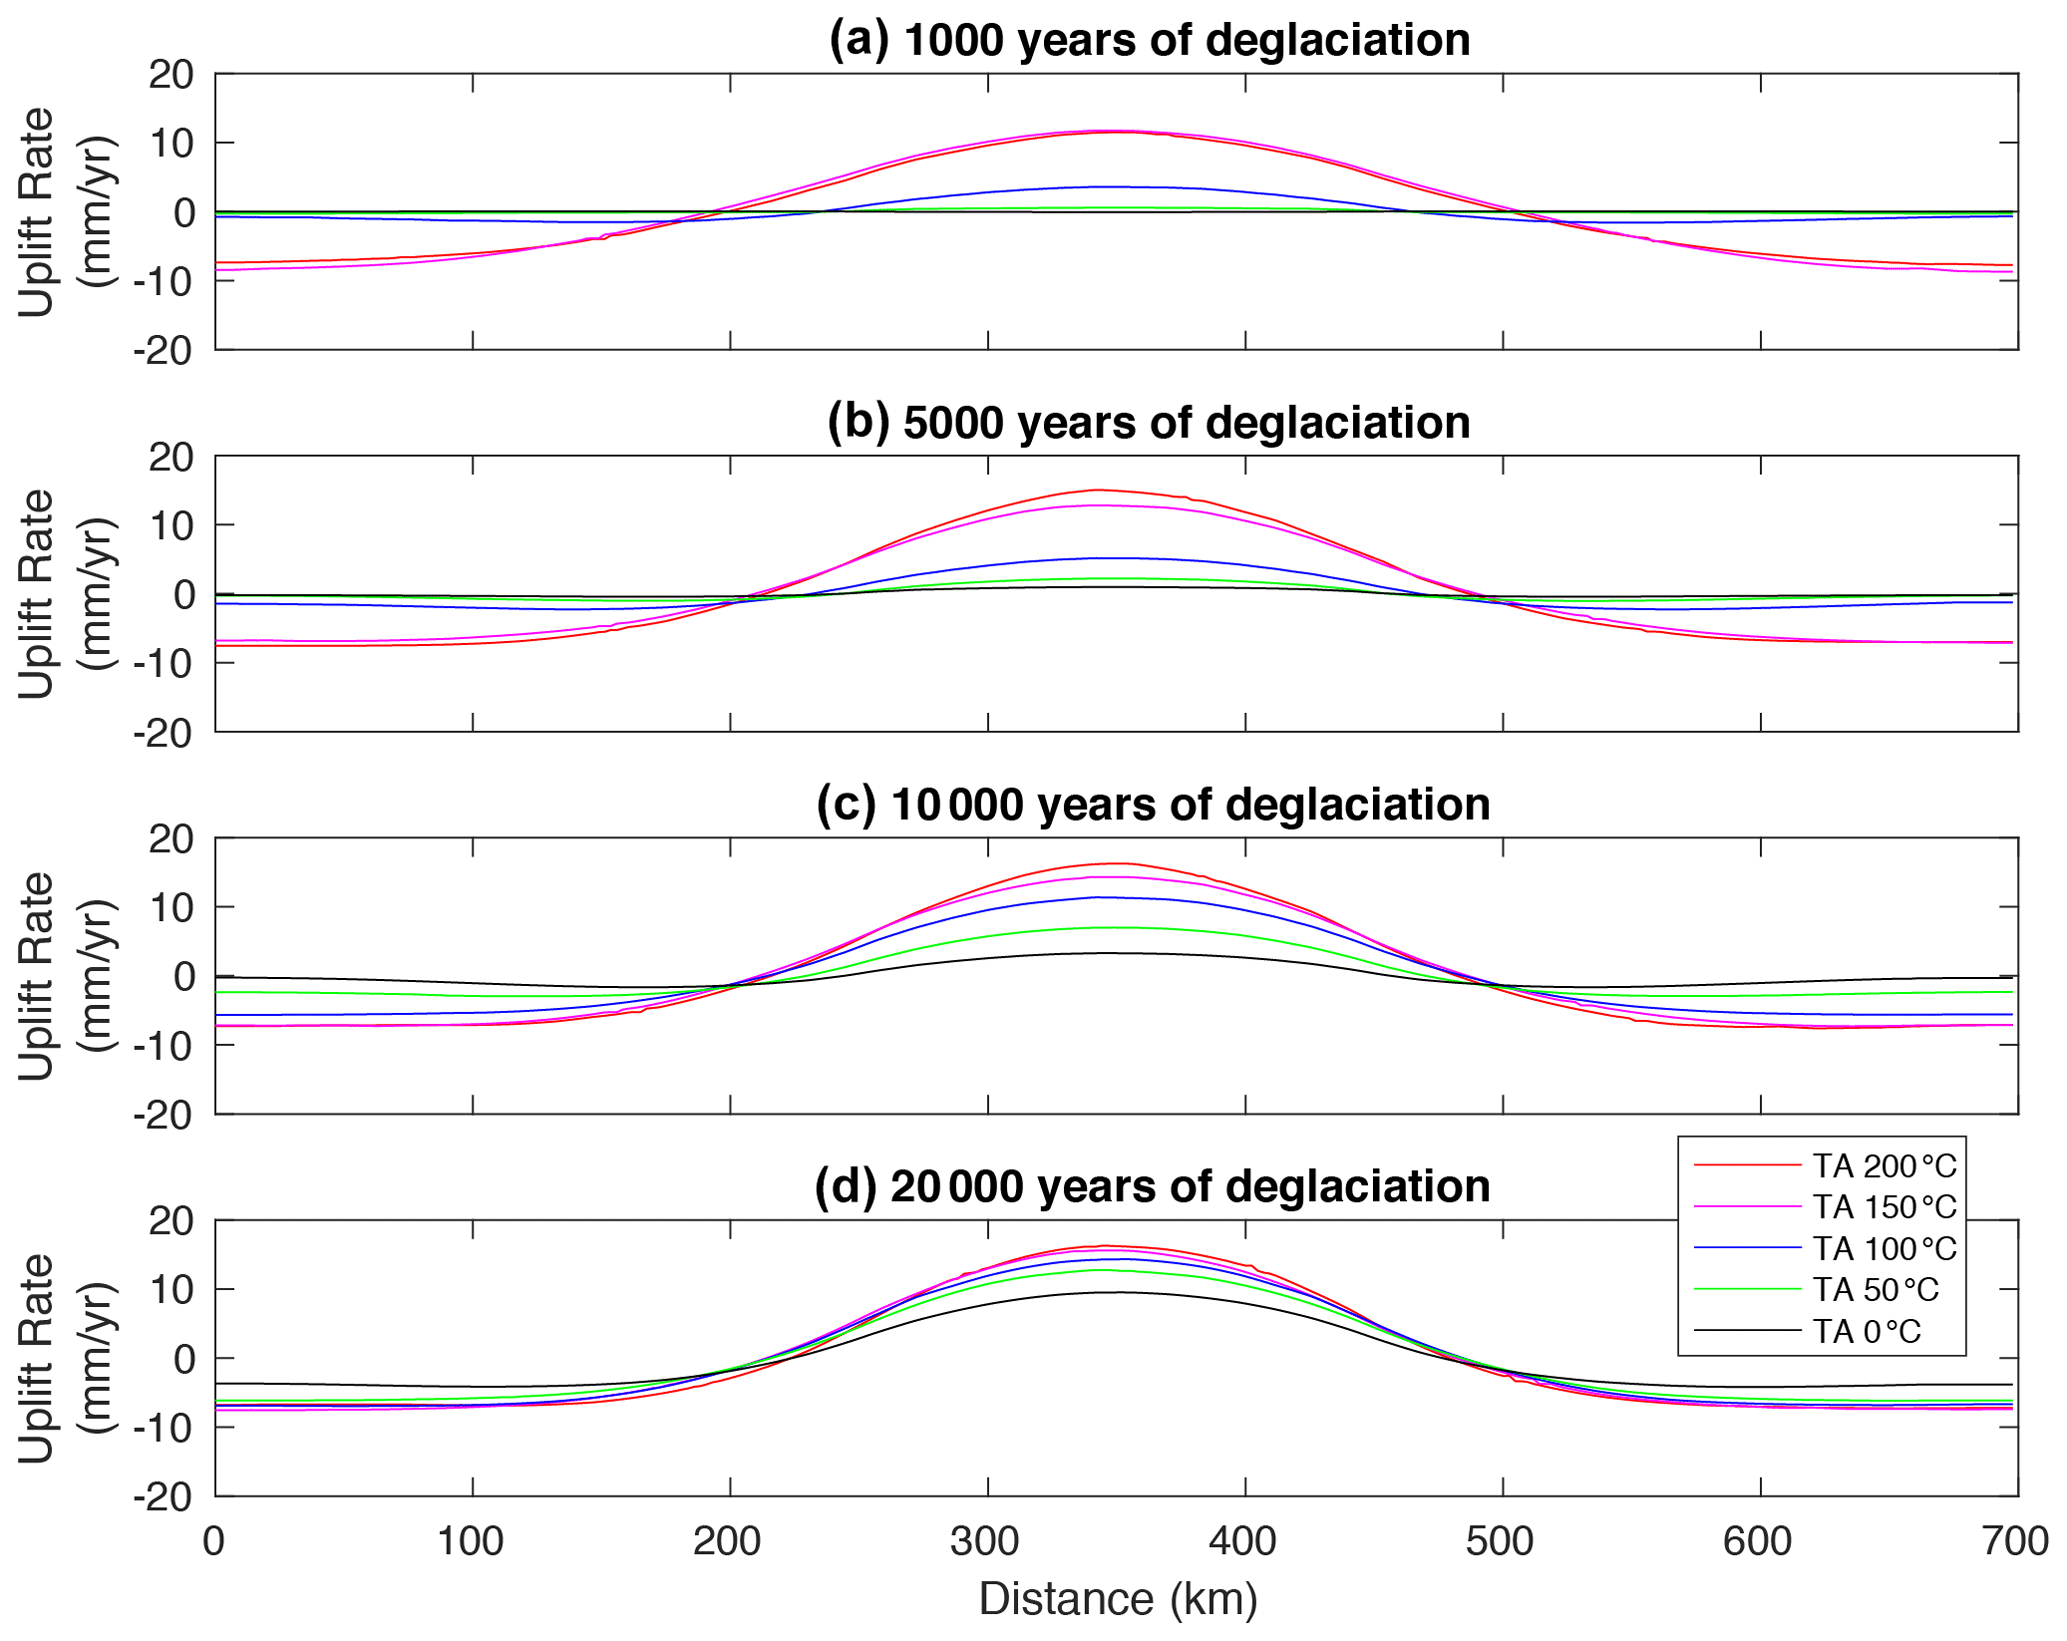
Figure 4Surface uplift rates vs. distance for Model set 1 of post-LGM deglaciation. Panel (a) shows t=1000 years of deglaciation, panel (b) shows t=5000 years of deglaciation, panel (c) shows t=10 000 years of deglaciation, and panel (d) shows 20 000 years of deglaciation. Different line colours correspond to different TA.
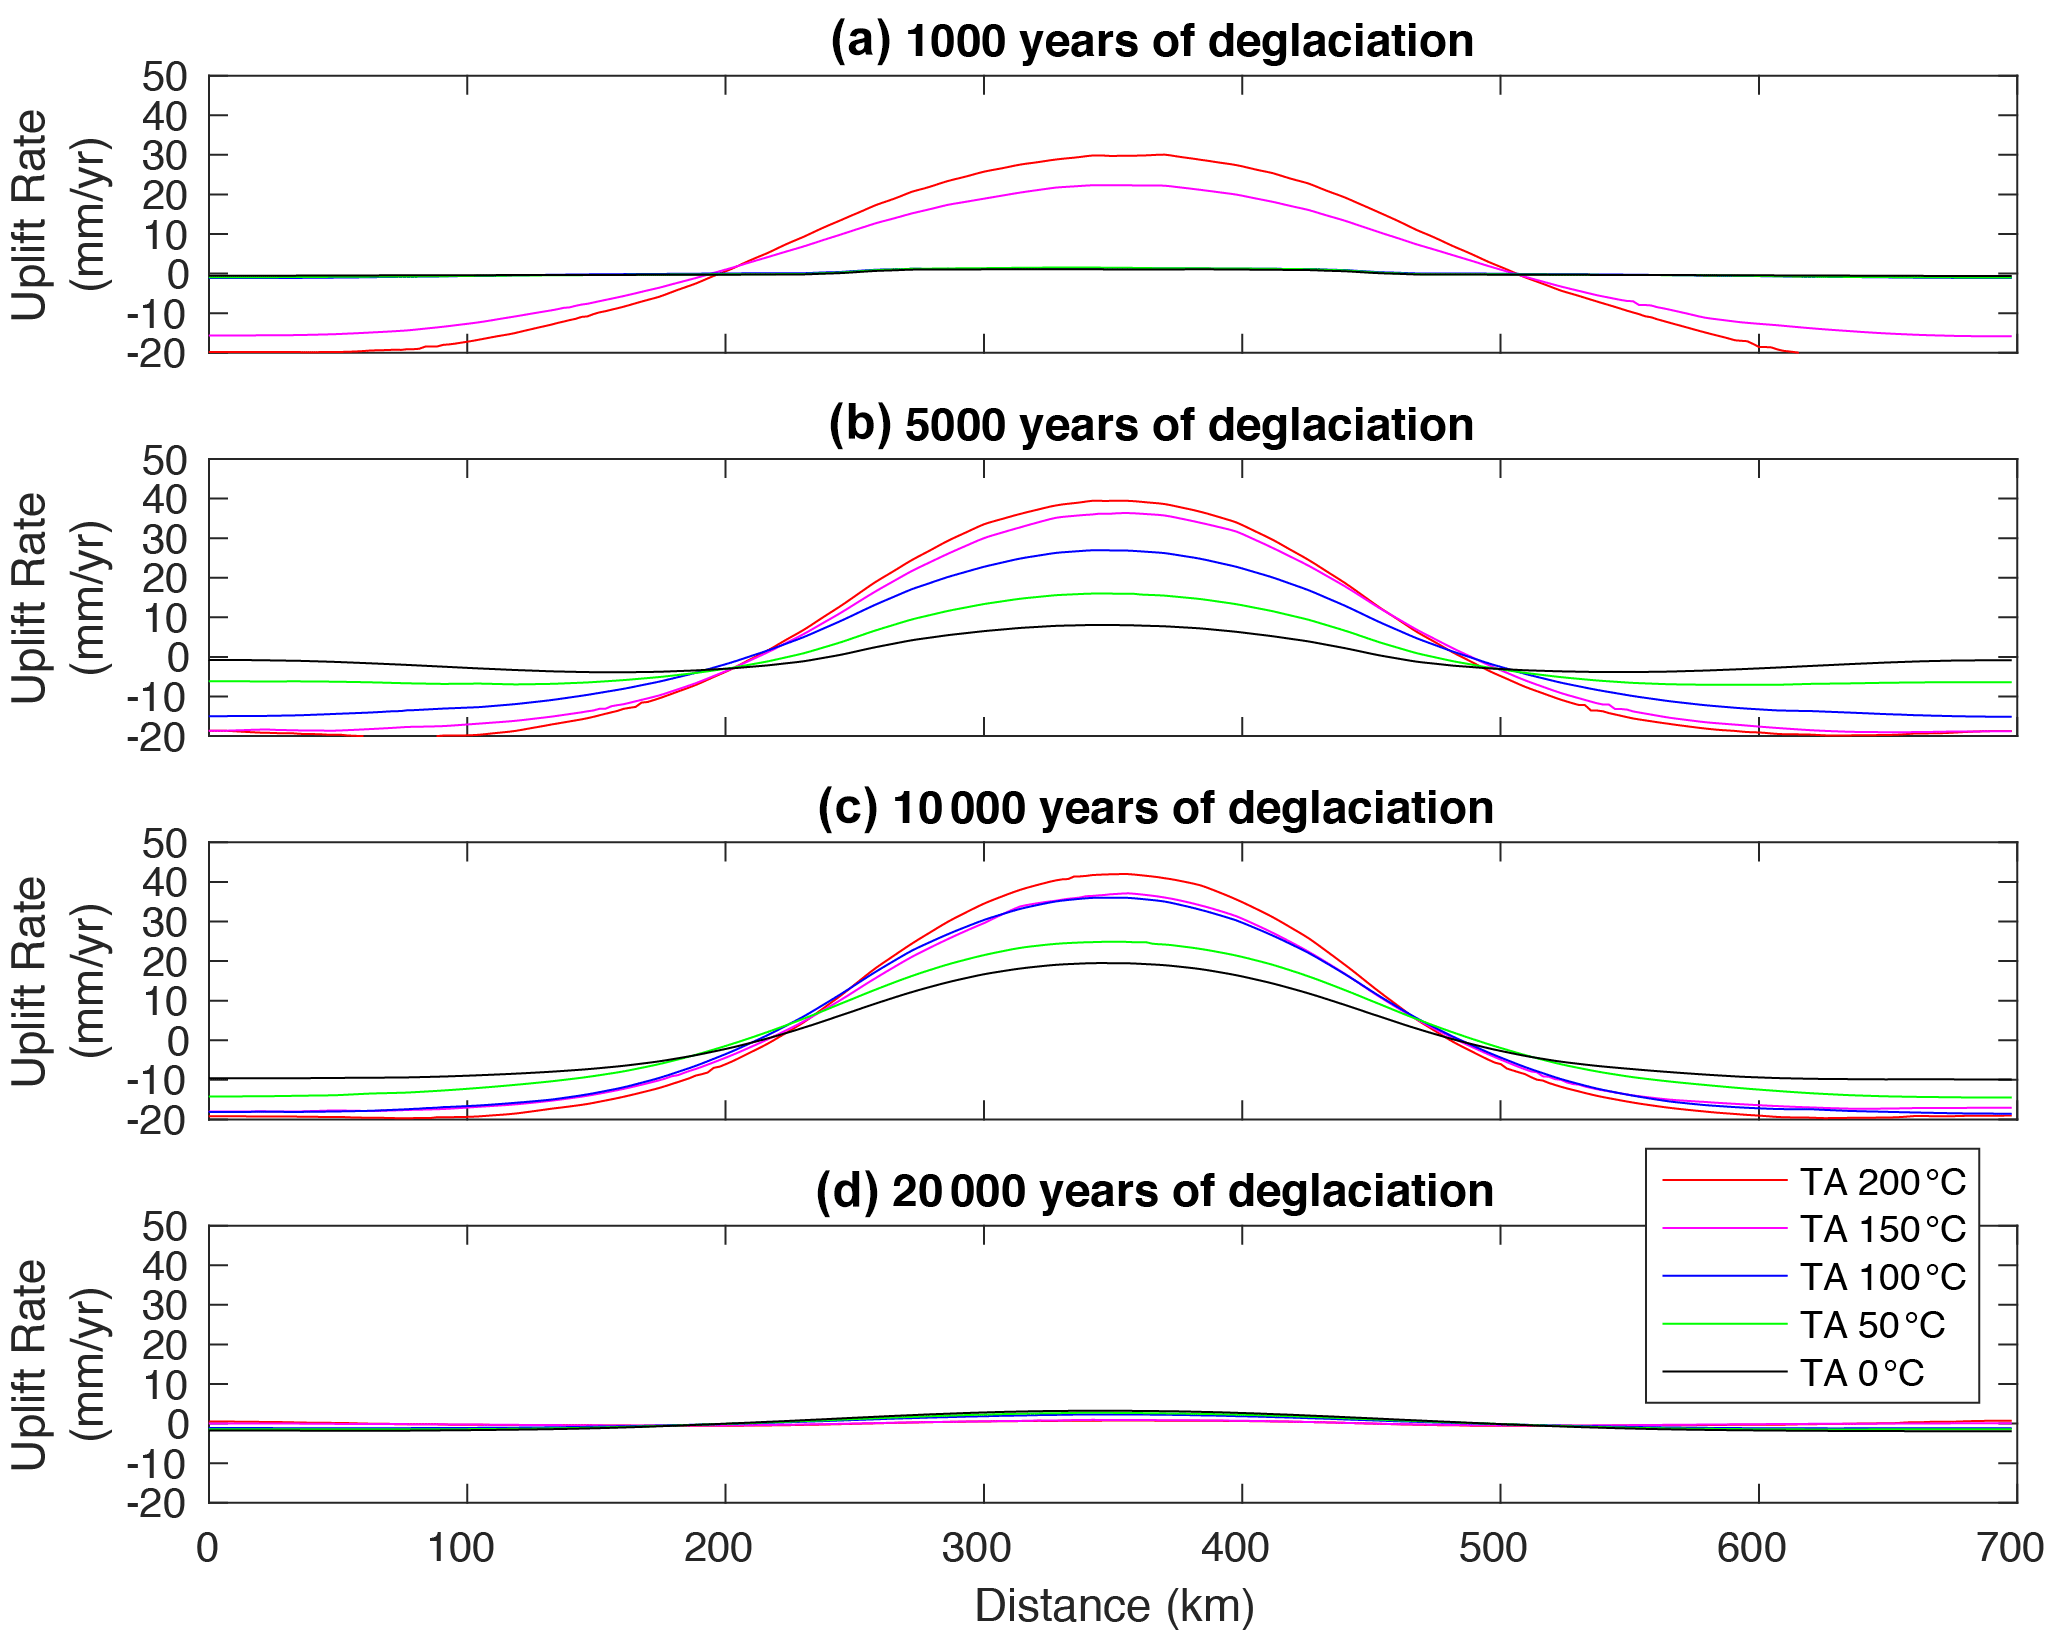
Figure 5Surface uplift rates vs. distance for Model set 2 of post-LGM deglaciation. Panel (a) shows t=1000 years of deglaciation, panel (b) shows t=5000 years of deglaciation, panel (c) shows t=10 000 years of deglaciation, and panel (d) shows 20 000 years of deglaciation. Different line colours correspond to different TA.
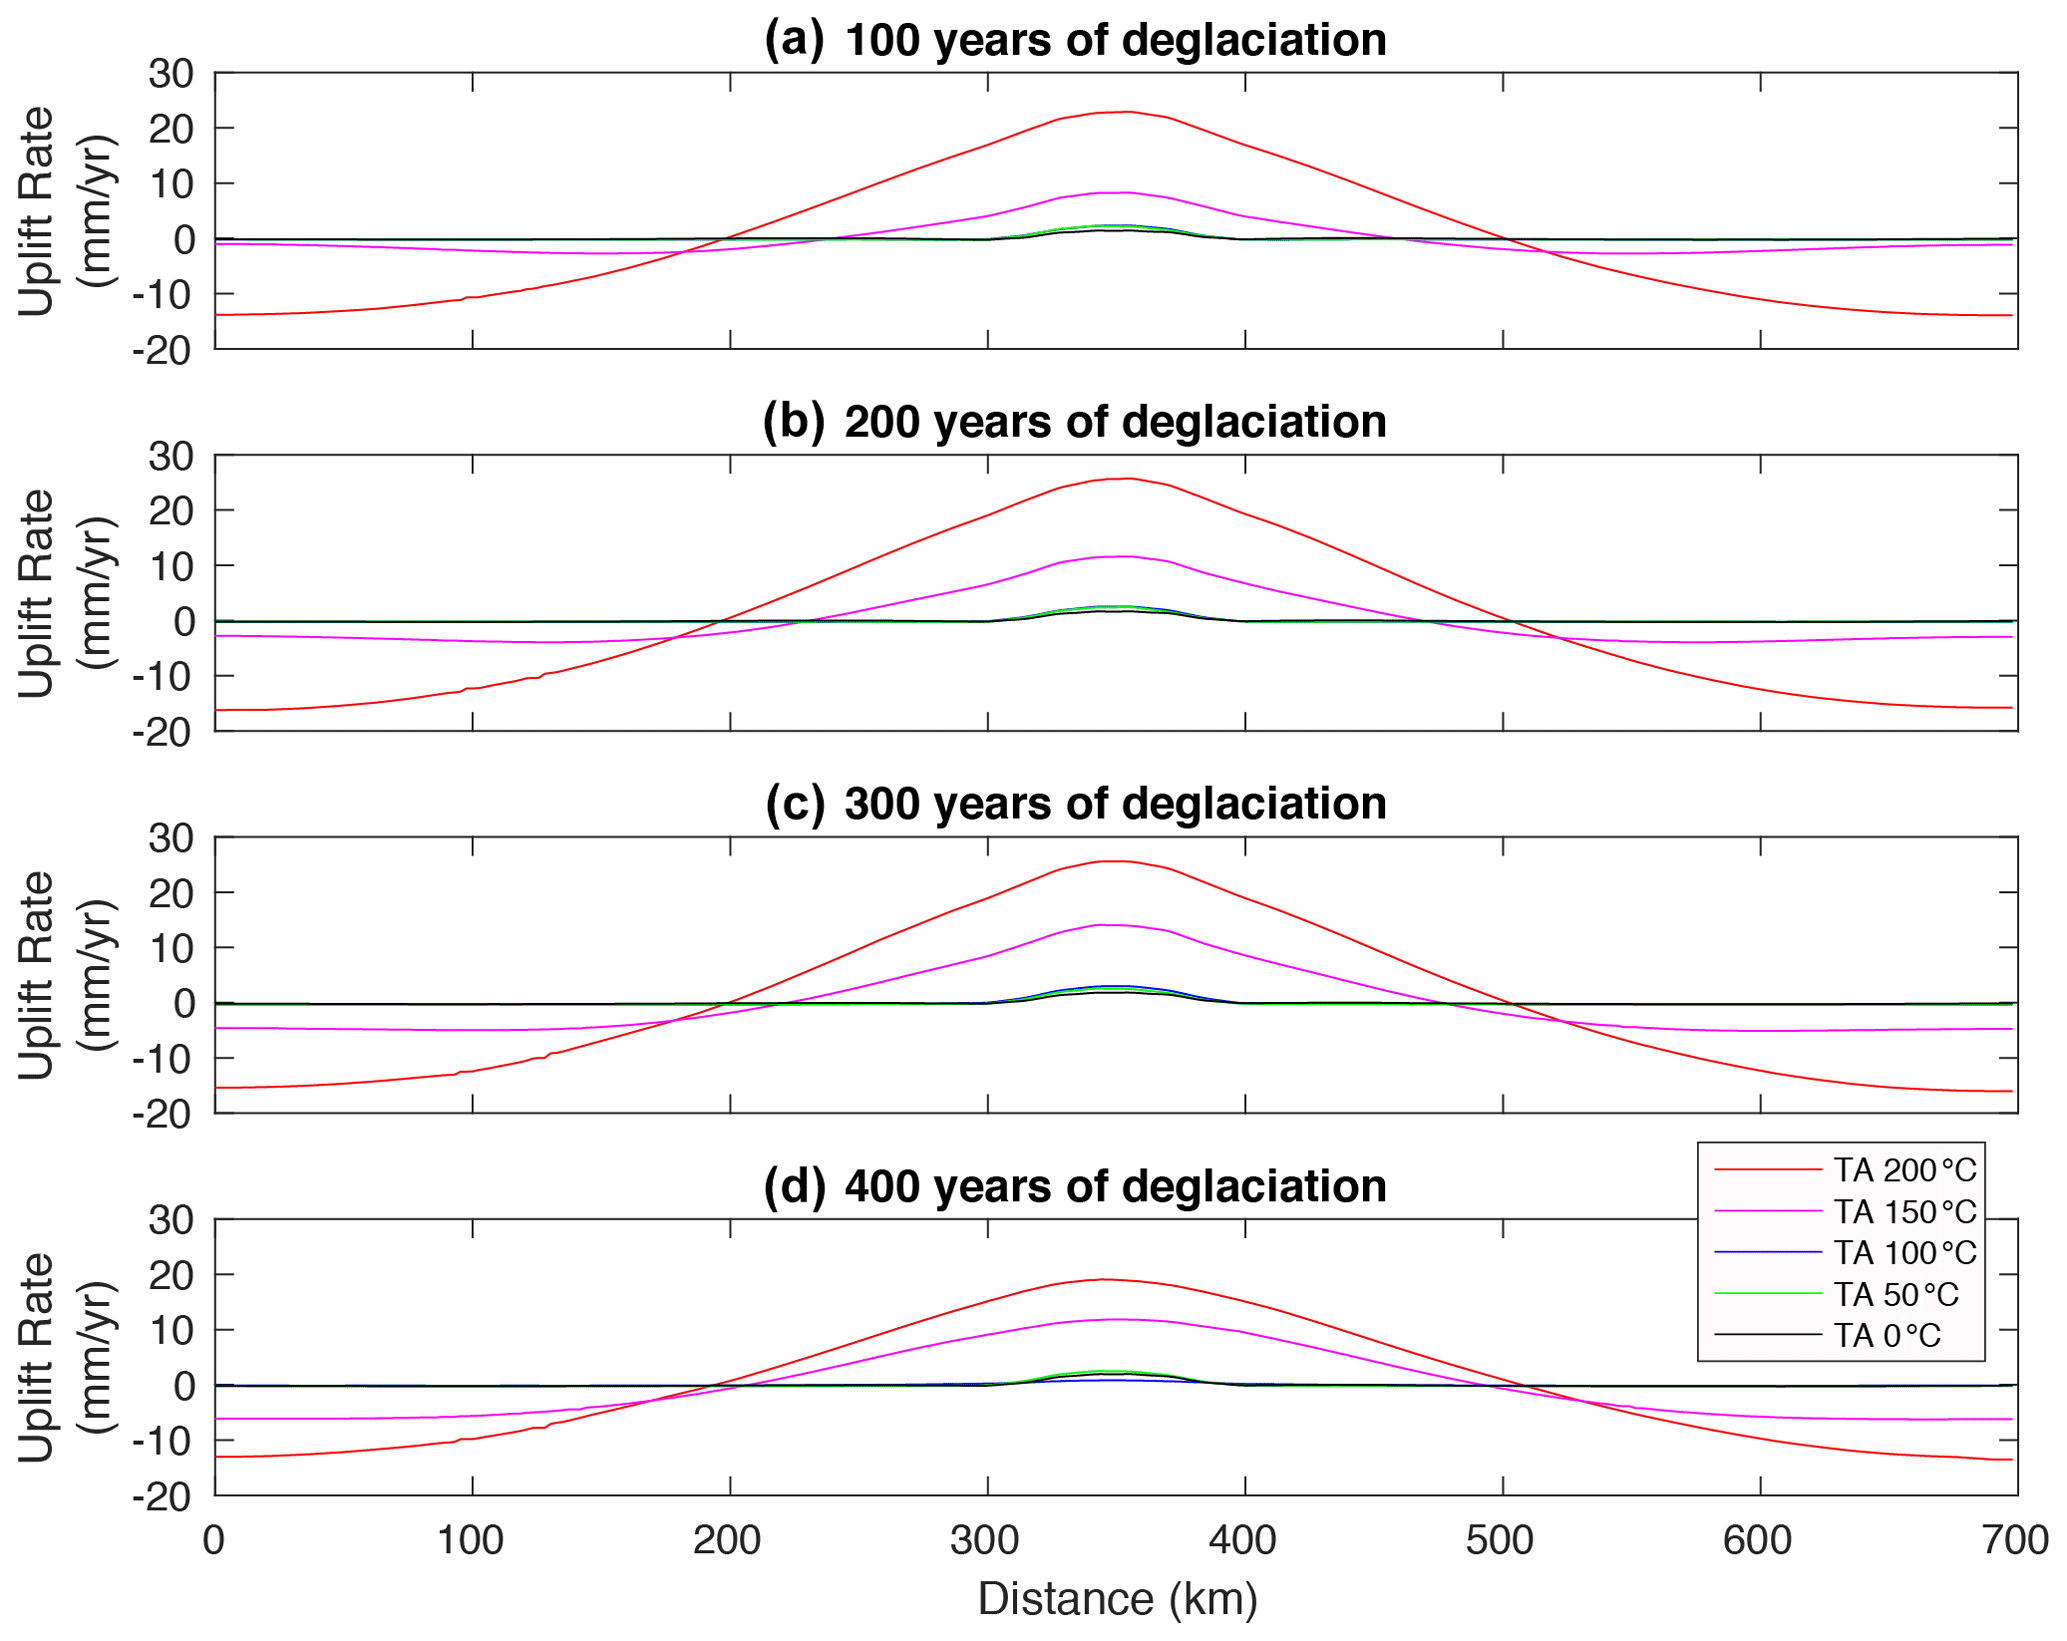
Figure 6Surface uplift rates vs. distance for the post-LIA deglaciation model set. Panel (a) shows t=100 years of deglaciation, panel (b) shows t=200 years of deglaciation, panel (c) shows t=300 years of deglaciation, and panel (d) shows 400 years of deglaciation. Different line colours correspond to different TA.
Table 2Maximum uplift rates derived from the numerical models with a thermal anomaly (TA) of 0, 50, 100, 150, and 200 °C for Model set 1 (a) and Model set 2 (b) of post-LGM deglaciation and the post-LIA deglaciation model set (c). The t=0 is the time step immediately before the beginning of deglaciation, and the other selected time steps show how the uplift rates change during the deglaciation until it is over for the post-LGM (a, b) and post-LIA (c) deglaciation intervals. Figure 7 is a plot of the maximum uplift rate vs. time calculated for each time step in all numerical models.
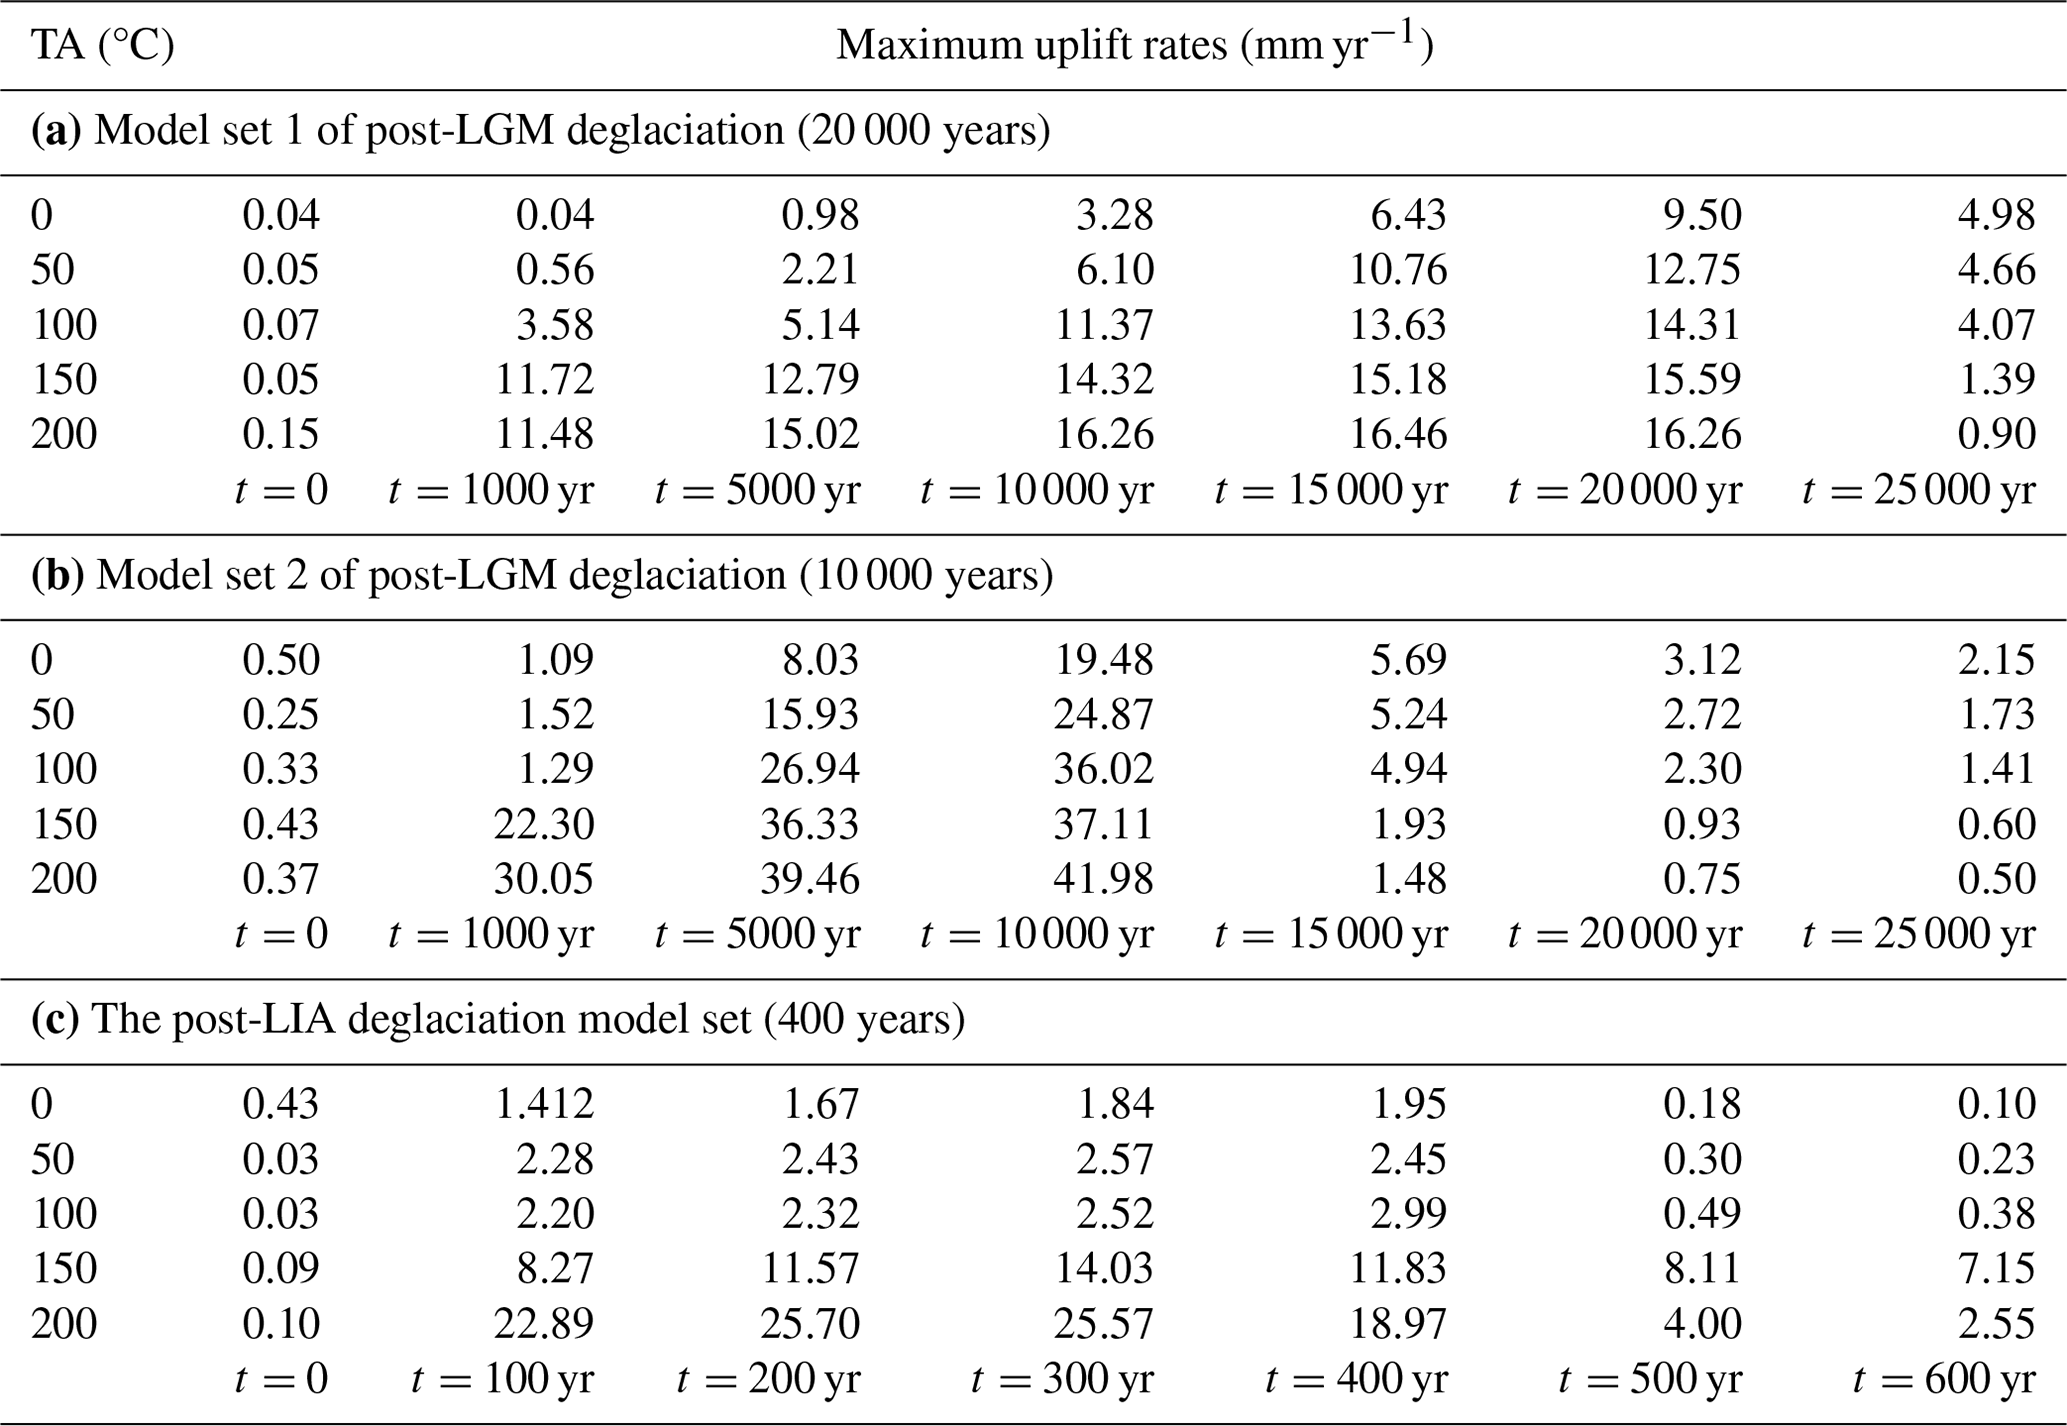
In Model set 1 for post-LGM deglaciation, when TA equals 0 (reference model) the maximum uplift rate is <1 mm yr−1 during the first 5000 years of the deglaciation, increasing gradually up to 9.5 mm yr−1 in the later stages of the deglaciation (i.e. 20 000 years, Fig. 4). When TA equals 50, 100, 150, and 200 °C, the maximum uplift rates can reach up to ∼2, ∼5, ∼12, and ∼15 mm yr−1, respectively, already in the first 1000 years of the deglaciation (Fig. 4a). When TA is 50 and 100 °C, the maximum uplift rate is subject to a protracted increase in time, reaching up to ∼12 and ∼14 mm yr−1 after 20 000 years of deglaciation (Figs. 4b–d and 7a). For TA equal to 150 and 200 °C, the maximum uplift rate reaches a plateau between 11 and 17 mm yr−1 during the 20 000 years of deglaciation (Figs. 4 and 7a, Table 2a). After the end of the deglaciation, the maximum uplift rate takes longer than about 5000 years to re-equilibrate to 0 mm yr−1 when TA ≤ 100 °C, whereas it drops to 0 mm yr−1 almost immediately when TA is 150 or 200 °C (Fig. 7a).
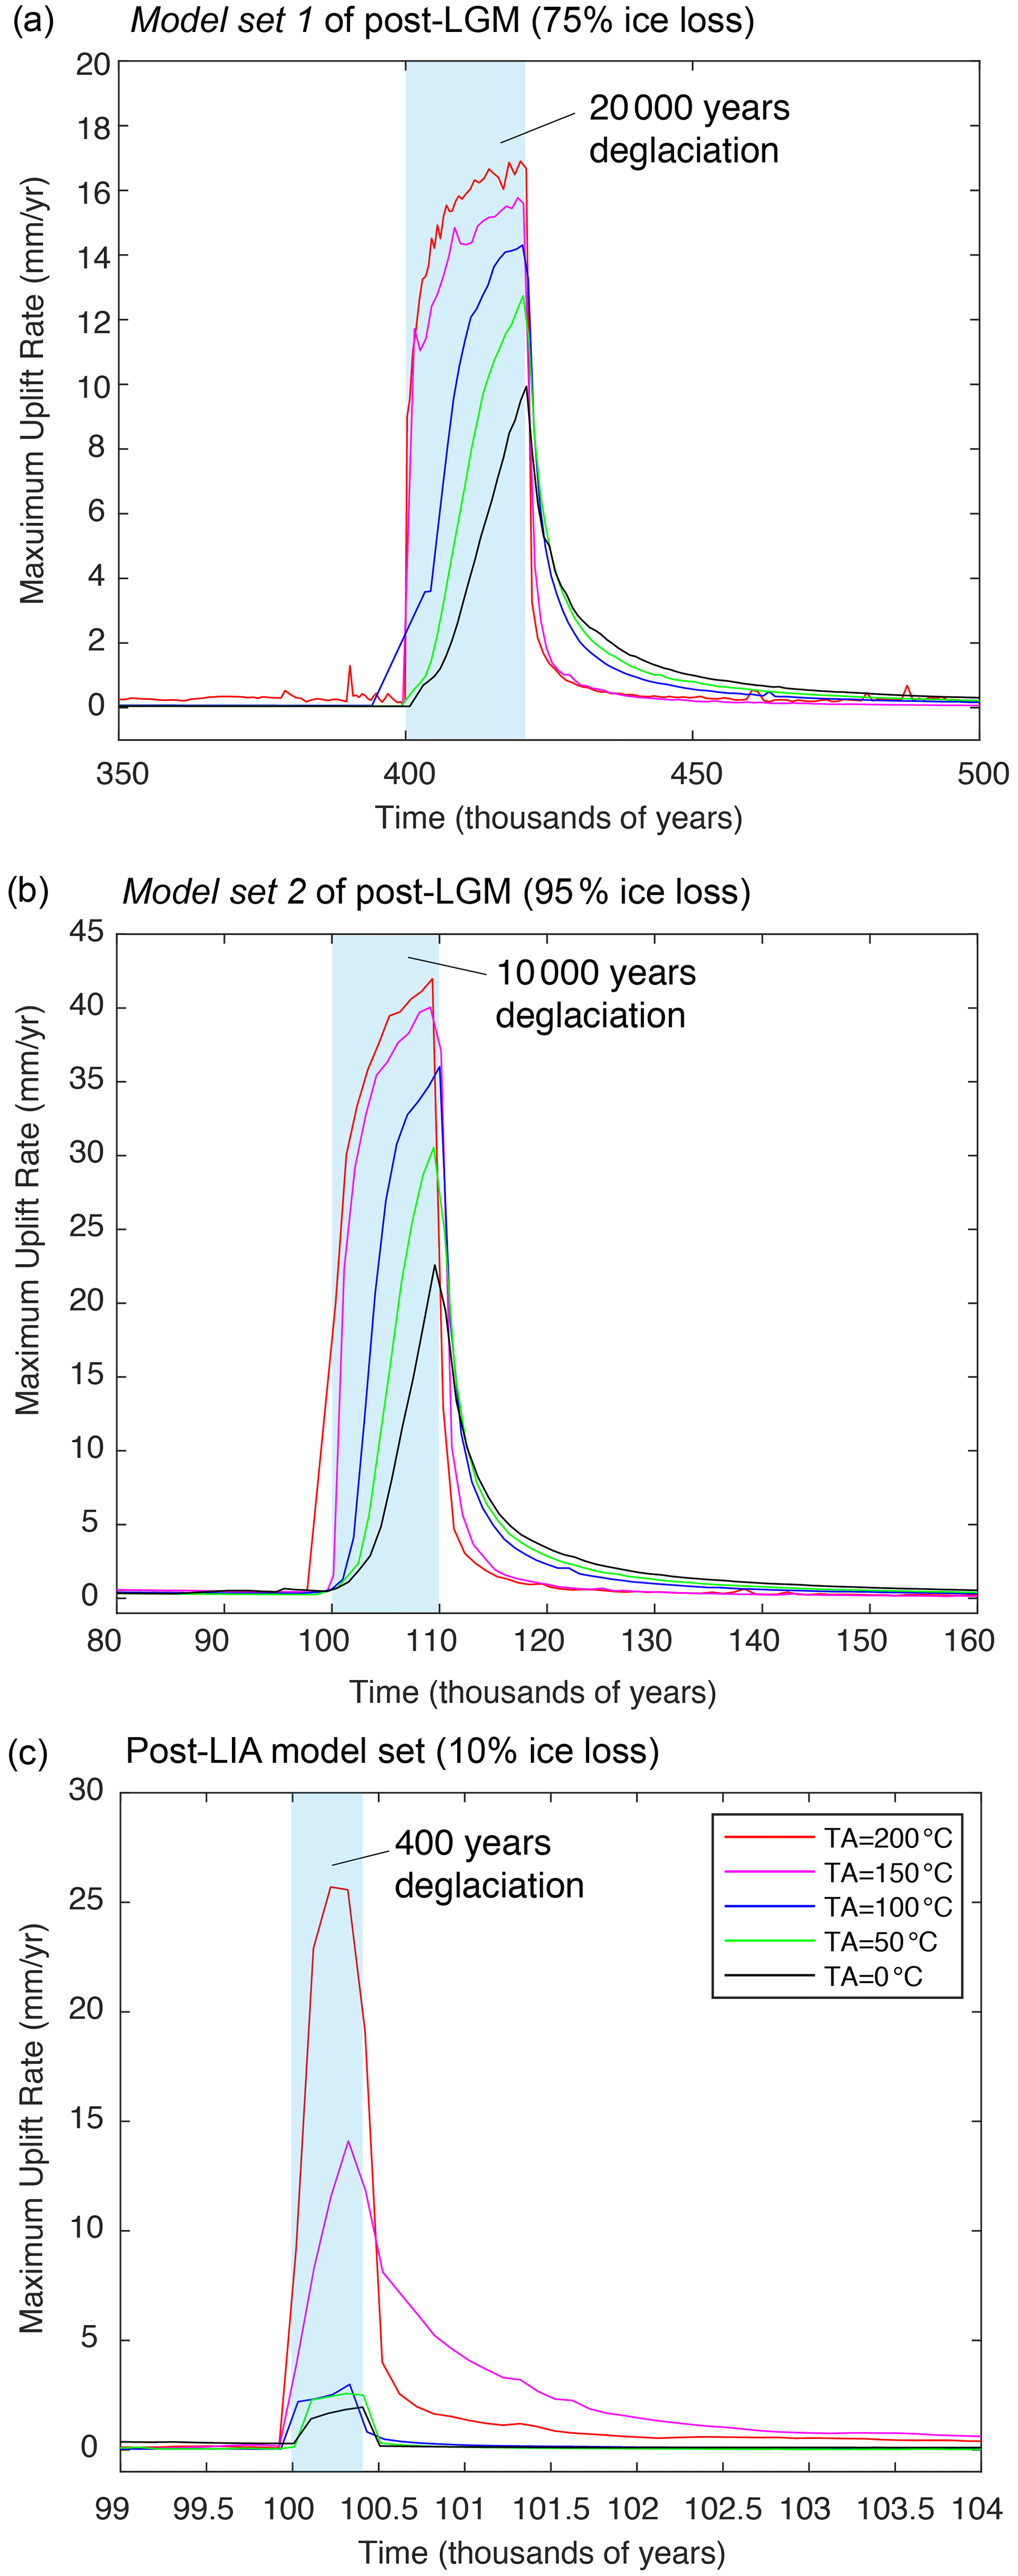
Figure 7Maximum uplift rates vs. time for model sets of deglaciation with different TA. (a) Model set 1 of post-LGM deglaciation accounting for 75 % of ice loss in 20 000 years; deglaciation starts at 400 000 years. (b) Model set 2 of post-LGM deglaciation accounting for 95 % of ice loss in 10 000 years; deglaciation starts at 100 000 years. (c) The post-LIA deglaciation model set accounting for 10 % of ice loss in 400 years (shaded-blue region); deglaciation starts at 100 000 years. Shaded-blue regions highlight the modelled deglaciation intervals. Please note that the time axis in (a), (b), and (c) are different, and the post-LGM models account for longer timescales.
In Model set 2 for post-LGM deglaciation, the maximum uplift rate is less than 2 mm yr−1 during the first 1000 years of deglaciation when TA is 0, 50, and 100 °C, whereas it reaches up to ∼22 and ∼30 mm yr−1 during the first 1000 years of deglaciation when TA is 150 and 200 °C (Figs. 5a and 7b, Table 2). Between 5000 and 10 000 years of deglaciation, the maximum uplift rate increases to ∼19, ∼25, and ∼36 mm yr−1, respectively, when TA is 0, 50, and 100 °C, whereas it reaches up to between 36 and 41 mm yr−1 between 50 000 and 1000 years of deglaciation when TA equal to 150 and 200 °C. The maximum uplift rate decreases slower if TA is 0, 50, and 100 °C, taking longer than 5000 year after the deglaciation to drop to values < 5 mm yr−1 (Fig. 7b and Table 2b), whereas it quickly drops to <2 mm yr−1 when the deglaciation is over and TA is 150 and 200 °C (Figs. 5b–d and 7b). Overall, a warmer and less viscous asthenosphere generates a higher magnitude and a fast-changing post-glacial rebound than a cooler and more viscous asthenosphere.
In the post-LIA model set, the maximum uplift rate is ∼1.4, ∼2.3, and ∼2.2 mm yr−1 during the first 100 years of deglaciation when TA is respectively 0, 50, and 100 °C, whereas it reaches ∼8.3 and ∼23 mm yr−1 during the same interval when TA is respectively 150 and 200 °C (Figs. 6a and 7c, Table 2c). Between 200 and 400 years of deglaciation, the maximum uplift rate reaches ∼1.9, ∼2.5, and ∼3 mm yr−1 when TA is equal to 0, 50, and 100 °C and ∼14 and ∼25.5 mm yr−1 when TA is 150 and 200 °C, respectively (Figs. 6c–d and 7c, Table 2c). When the deglaciation ends, the maximum uplift rate drops to ∼0 mm yr−1 in ∼100 years when TA ≤ 100 °C, whereas it takes longer than 1000 years when TA equals 150 or 200 °C (Fig. 7c). Overall, a warmer and less viscous asthenosphere generates a higher-magnitude post-glacial rebound which, however, takes much longer to re-equilibrate to 0 mm yr−1 after the end of the deglaciation than a cooler and more viscous asthenosphere.
Our modelling is simplistic in that we impose a linear and uniform ice loss instead of a more realistic ice sheet melting pattern in space and time (Fig. 2b and c). Although the stratigraphic and geochronologic record is fairly precise for the post-LGM ice extent (e.g. Lagabrielle et al., 2004; Rabassa, 2008; Glasser et al., 2011; Davis and Glasser, 2012; Strelin et al., 2014; Kaplan et al., 2016; Martinod et al., 2016; Bendle et al., 2017; Reynhout et al., 2019; Davies et al., 2020), information about melting velocities and associated ice thickness and redistribution of the surface masses is limited for the time windows investigated here. GNSS, SRTM, and GRACE data, constraining the net ice mass balance only during the last few decades, still showing some discrepancies (e.g. Aniya, 1996; Aniya et al., 1997; Rignot et al., 2003; Ivins and James, 1999, 2004; Chen et al., 2007; Dietrich et al., 2010; Ivins et al., 2011; Jacob et al., 2012; Lange et al., 2014; Willis et al., 2012; Richter et al., 2016; Gómez et al., 2022; Lenzano et al., 2023). Tracing back the post-LGM or Holocene ice loss rate from current measurements is difficult considering that climate was at least 6 °C colder during the LGM (Hulton et al., 2002; Sugden et al., 2002; Seltzer et al., 2021; Yan et al., 2022). As a result, previous models have assumed simple deglaciation histories as well (e.g. Ivins and James, 1999, 2004; Hulton et al., 2002; Klemann et al., 2007; Ivins et al., 2011; Boex et al., 2013). Measurements of regional erosion rates since the LGM are between 0.02 and 0.83 mm yr−1 (Fernandez et al., 2016). However, given the short time intervals investigated here, it seems reasonable to assume that the eroded material is still in the transport zone and therefore does not significantly contribute to unloading the surface of the orogen. If one refers to erosion rates from low-temperature thermochronology, even though these measures quantify erosion rates over millions of years and not millennia, Fosdick et al. (2013), Herman and Brandon (2015), Fernandez et al. (2016), and Muller et al. (2023) suggest using values between 0.1 and 1 mm yr−1 from 7 to 4 Ma, followed by a period of erosional quiescence (<0.1 mm yr−1) and a possible increase to 1 mm yr−1 in the last ∼2 Myr in the SPI region (Muller et al., 2023). Supposing that these erosion rates still apply in the last ∼20 000 years, this would translate into 2–20 m of rocks eroded on average since the LGM, leading to local unloading of approximately 60–600 kPa if one assumes a crustal density of 3000 kg m−3. Such stress change is approximately equivalent to the melting of about 6–60 m of ice, whereas we simulate the melting of 200–1500 m of ice in our simulations. The forcing of global cooling in increasing erosion rates during the Quaternary is, however, debated, and not widely quantified in Patagonia nor worldwide (Valla et al., 2012; Champagnac et al., 2014; Herman et al., 2013, 2018; Herman and Brandon, 2015; Fernandez et al., 2016; Georgieva et al., 2019; Yan et al., 2022). Even if long-term erosion rates contribute to present-day uplift rates (Herman et al., 2018), since they are comparable to those of the European Alps, for instance, we assume a similar contribution to regional uplift rates (i.e. generally a fraction of a mm yr−1; Sternai et al., 2019); this is a negligible contribution in the context of the southern Patagonian Andes. We also assume a homogeneous lithosphere and neglect lateral viscosity variations in the asthenosphere, despite the long-term southern Andean orogenic history (Cande and Leslie, 1986; Ramos, 2005; Breitsprecher and Thorkelson, 2009; Muller et al., 2021) and the suggested contribution from lateral rheological heterogeneities (Klemann et al., 2007; Richter et al., 2016). Overall, notwithstanding these limitations in the model, our fully coupled numerical thermo-mechanical geodynamic experiments provide realistic uplift rates (Figs. 4–7) that one can compare to current geodetic observations. Following the example of previous studies (Ivins and James, 1999, 2004; Klemann et al., 2007; Dietrich et al., 2010; Lange et al., 2014; Richter et al., 2016; Lenzano et al., 2023), we discuss our results assuming that GNSS-measured rock uplift rates are mostly related to the deglaciation history and only marginally controlled by the longer-term geodynamics (e.g. Ramos, 2005; Breitsprecher and Thorkelson, 2009; Eagles and Scott, 2014; Muller et al., 2021).
The elastic thickness of the lithosphere (Te) varies between the simulations according to the imposed asthenospheric thermal anomaly, but it is generally lower than 30 km, resulting in a decoupled lithospheric rheology (sensu e.g. Burov and Diament, 1995), as shown by the yield stress envelope in Fig. 2a. This results in predominant elastic deformation in the upper crust (below the ∼300 °C isotherm) and upper mantle lithosphere (below the ∼700 °C isotherm) and viscous deformation in the lower crust and lower lithospheric mantle and asthenosphere (Fig. 3). We remark that, when we impose higher temperatures in the asthenospheric mantle, shallower 300 and 700 °C isotherms decreases Te and increases the isostatic surface uplift rates. Lithospheric thinning due to the asthenospheric window underneath southern Patagonia thus affects the regional uplift rates as previously suggested (Ávila and Dávila, 2018, 2020; Mark et al., 2022; Ben-Mansour et al., 2022; and Avila et al., 2023).
The inferred maximum post-LIA uplift rate of up to a few mm yr−1 from experiments with or without a low asthenospheric thermal anomaly (TA ≤ 100 °C, Fig. 7c) is within the same order of magnitude of maximum uplift rates measured in collisional orogens such as the European Alps (Sue et al., 2007; Serpelloni et al., 2013; Walpersdorf et al., 2015; Sternai et al., 2019) and the Himalayas (Larson et al., 1999). Since these collisional orogens are characterised by a thicker lithosphere (Geissler et al., 2010; Ravikumar et al., 2020), they are likely less sensitive to mantle dynamics than the southern Patagonian Andes. When we consider lithospheric unloading due to post-LGM deglaciation of a wider ice sheet, however, the inferred maximum uplift rate via Model set 1 and Model set 2 reaches up to 10 mm yr−1 and 20 mm yr−1, respectively, even without an asthenospheric thermal anomaly (Fig. 7a and b). This suggests a likely contribution from a long-term post-glacial rebound to the present-day uplift rates measured in the SPI.
In the southern Patagonian Andes, GIA models estimated the regional asthenosphere viscosity to be between 1.6 and 8×10¹⁸ Pa s (Ivins and James, 1999, 2004; Dietrich et al., 2010; Willis et al., 2012; Lange et al., 2014; Richter et al., 2016; Lenzano et al., 2023). Similarly, the asthenosphere viscosity from our models when TA > 100 °C is <1019 Pa s, with the lowest viscosity value of 1016 Pa s imposed where partial melting, supported by the regional Holocene volcanism (Stern and Kilian, 1996) and by geophysical data (e.g. shear wave velocity data by Mark et al., 2022), occurs. Under these conditions, however, our experiments provide max uplift rates between 14 and 26 mm yr−1 toward the end of the LIA deglaciation (Fig. 7c). Even with a very low viscosity asthenosphere, the rebound due to short-term post-LIA deglaciation does not reach the presently observed maximum uplift rates of 41±3 mm yr−1. Experiments that account for a low viscosity asthenosphere and long-term post-LGM deglaciation lasting for 20 000 and 10 000 years reach up to ∼25 and ∼42 mm yr−1 of an uplift rate during the final stages of the deglaciation (Fig. 7a and b), respectively, which is comparable to present-day values. Results, therefore, indicate that the outstanding observational budget of rock uplift in the SPI is matched only when accounting for higher-than-normal asthenospheric mantle temperatures, thereby highlighting the relevance of the regional asthenospheric window. Consistently, even though the higher heat flow is currently further north from our study region near the CTJ (46–48° S) (Ramos, 2005; Breitsprecher and Thorkelson, 2009; Ávila and Dávila, 2018, 2020; Ben-Mansour et al., 2022), increased asthenospheric temperatures beneath southern Patagonia are highly supported by the geophysical data (e.g. Russo et al., 2010, 2022; Mark et al., 2022; Ávila and Dávila, 2018, 2020; Ben-Mansour et al., 2022).
Because of the limited knowledge regarding the timing and amount of ice loss since the LGM (e.g. Ivins and James, 1999, 2004; Hulton et al., 2002; Klemann et al., 2007; Boex et al., 2013; Davies et al., 2020), it is difficult to position in time present-day uplift rate measurements within the investigated deglaciation scenarios to assess the contribution of post-LGM, post-LIA, and present-day deglaciation to the maximum uplift rate budget. In the faster post-LGM deglaciation scenario (Model set 2) the observed maximum uplift rate budget is attained in about 10 000 years of deglaciation, but only minor residual rebound could be observed today regardless of the amount of ice loss (Fig. 7b). If post-LGM deglaciation occurred more slowly (Model set 1), this event may contribute up to 40 % to the present-day uplift rate budget (Fig. 7a). Although it is difficult to reconcile this scenario with the geomorphological and geochronological evidences (Hulton et al., 2002; Boex et al., 2013; Davis and Glasser, 2012; Martinod et al., 2016; Bendle et al., 2017; Thorndycraft et al., 2019; Davies et al., 2020), it appears that post-LIA rebound alone cannot cover the entire budget of the observed uplift rates even with the highest tested TA, which points to a non-negligible contribution from post-LGM deglaciation. This latter conclusion is reinforced by estimates of the mantle relaxation time, τr, as (Turcotte and Schubert, 2002)
where v is the asthenosphere viscosity, λ is the width of the ice sheet, and g is the gravity acceleration. Using 10 Pa s and λ=200 km leads to years, a time range considerably longer than the post-LIA deglaciation and including full Pleistocene glacial–interglacial cycles (Ruddiman et al., 1986). Although an increasingly negative ice mass balance in the last ∼50 years has contributed to the elastic lithospheric uplift rates (Dietrich et al., 2010; Lange et al., 2014), a longer-term contribution from the viscous lithosphere is necessary to explain the GNSS-measured uplift rates (Ivins and James, 2004; Dietrich et al., 2010; Lange et al., 2014; Richter et al., 2016; Lenzano et al., 2021).
As a final consideration, our models suggest that we shall measure regional uplift rates in the order of the tens of cm yr−1 in the next century if the currently observed ice loss rate of at least −20 Gt yr−1 in the SPI (Willis et al., 2012) will continue until the total meltdown of the ice sheet in ∼200 years.
We propose that rock uplift rates of up to 40 mm yr−1 in the southern Andes are due to both post-LIA and long-term post-LGM lithospheric rebound, as postulated for other glaciated orogens (e.g. the European Alps, Fennoscandia, and North America; Peltier et al., 2018). We also propose that currently observed uplift rates in the southern Andes are enhanced by a mantle thermal anomaly of at least 150 °C due to the regional asthenospheric window. Asthenospheric thermal anomalies higher than 200 °C are unlikely and would decrease the asthenospheric viscosities to unrealistic values (less than 1016 Pa s). Our thermo-mechanical visco-elasto-plastic forward modelling approach thus helps to constrain the increase in temperature in geodynamic asthenospheric upwelling contexts, such as in southern Patagonia (Russo et al., 2010, 2022; Ávila and Dávila, 2018, 2020; Mark et al., 2022; Ben-Mansour et al., 2022).
The codes used to perform this study are available in https://doi.org/10.5281/zenodo.10896122 (Muller et al., 2024).
The dataset used as a reference for this study is available in Lange et al. (2014).
VAPM contributed to the development of the initial scientific question and to building the modelling setup, analysis of the results and writing of the manuscript. PS contributed to the development of the initial scientific question and to building the modelling setup, analysis of the results and writing of the manuscript. CS contributed to the development of the initial scientific questions, analysis of the results and writing of the manuscript.
The contact author has declared that none of the authors has any competing interests.
Publisher's note: Copernicus Publications remains neutral with regard to jurisdictional claims made in the text, published maps, institutional affiliations, or any other geographical representation in this paper. While Copernicus Publications makes every effort to include appropriate place names, the final responsibility lies with the authors.
We acknowledge the enriching revisions of Federico Dávila, Joelle Nicolas, and one anonymous referee.
This research has been supported by the Fondazione Cariplo and Fondazione CDP (grant no. 2022-1546_001), and by the project Dipartimenti di Eccellenza 2018–2022, and project Dipartimenti di Eccellenza 2023–2027, TECLA, of the Department of Earth and Environmental Sciences at the University of Milano-Bicocca, funded by the Italian Ministry of Education, Universities and Research, MUR.
This paper was edited by Patrice Rey and reviewed by Federico Davila and one anonymous referee.
Aniya, M.: Holocene variations of Ameghino glacier, southern Patagonia, Holocene, 6, 247–252, https://doi.org/10.1177/095968369600600211, 1996.
Aniya, M., Sato, H., Naruse, R., Skvarca, P., and Casassa, G.: Recent glacier variations in the Southern Patagonia icefield, South America, Arct. Alp. Res., 29, 1–12, https://doi.org/10.1177/095968369600600211, 1997.
Ávila, P. and Dávila, F. M.: Heat flow and lithospheric thickness analysis in the Patagonian asthenospheric windows, southern South America, Tectonophysics, 747, 99–107, https://doi.org/10.1016/j.tecto.2018.10.006, 2018.
Ávila, P. and Dávila, F. M.: Lithospheric thinning and dynamic uplift effects during slab window formation, southern Patagonia (45–55° S), J. Geodynam., 133, 101689, https://doi.org/10.1016/j.jog.2019.101689, 2020.
Ávila, P., Ávila, M., Dávila, F. M., Ezpeleta, M., and Castellano, N. E.: Patagonian landscape modeling during Miocene to Present-day slab window formation, Tectonophysics, 862, 229971, https://doi.org/10.1016/j.tecto.2023.229971, 2023.
Bendle, J. M., Palmer, A. P., Thorndycraft, V. R., and Matthews, I. P.: High-resolution chronology for deglaciation of the Patagonian Ice Sheet at Lago Buenos Aires (46.5° S) revealed through varve chronology and Bayesian age modelling, Quaternary Sci. Rev., 177, 314–339, https://doi.org/10.1016/j.quascirev.2017.10.013, 2017.
Ben-Mansour, W., Wiens, D. A., Mark, H. F., Russo, R. M., Richter, A., Marderwald, E., and Barrientos, S.: Mantle flow pattern associated with the patagonian slab window determined from azimuthal anisotropy, Geophys. Res. Lett., 49, e2022GL099871, https://doi.org/10.1029/2022GL099871, 2022.
Boex, J., Fogwill, C., Harrison, S., Glasser, N. F., Hein, A., Schnabel, C., and Xu, S.: Rapid thinning of the late Pleistocene Patagonian Ice Sheet followed migration of the Southern Westerlies, Sci. Rep., 3, 1–6, https://doi.org/10.1038/srep02118, 2013.
Bourgois, J., Cisternas, M. E., Braucher, R., Bourlès, D., and Frutos, J.: Geomorphic records along the general Carrera (Chile)–Buenos Aires (Argentina) glacial lake (46–48° S), climate inferences, and glacial rebound for the past 7–9 ka, J. Geol., 124, 27–53, https://doi.org/10.1086/684252, 2016.
Breitsprecher, K. and Thorkelson, D. J.: Neogene kinematic history of Nazca–Antarctic–Phoenix slab windows beneath Patagonia and the Antarctic Peninsula, Tectonophysics, 464, 10–20, https://doi.org/10.1016/j.tecto.2008.02.013, 2009.
Burov, E. B. and Diament, M.: The effective elastic thickness (Te) of continental lithosphere: What does it really mean? J. Geophys. Res.-Solid, 100, 3905–3927, https://doi.org/10.1029/94JB02770, 1995.
Butler, S. L. and Peltier, W. R.: On scaling relations in time-dependent mantle convection and the heat transfer constraint on layering, J. Geophys. Res.-Solid, 105, 3175–3208, https://doi.org/10.1029/1999JB900377, 2000.
Cande, S. C. and Leslie, R. B.: Late Cenozoic tectonics of the southern Chile trench, J. Geophys. Res.-Solid, 91, 471–496, https://doi.org/10.1029/JB091iB01p00471, 1986.
Champagnac, J. D., Molnar, P., Sue, C., and Herman, F.: Tectonics, climate, and mountain topography, J. Geophys. Res.-Solid, 117, B02403, https://doi.org/10.1029/2011JB008348, 2012.
Champagnac, J.-D., Valla, P. G., and Herman, F.: Late-cenozoic relief evolution under evolving climate: A review, Tectonophysics, 614, 44–65, https://doi.org/10.1016/j.tecto.2013.11.037, 2014.
Chen, J. L., Wilson, C. R., Tapley, B. D., Blankenship, D. D., and Ivins, E. R.: Patagonia icefield melting observed by gravity recovery and climate experiment (GRACE), Geophys. Res. Lett., 34, L22501, https://doi.org/10.1029/2007GL031871, 2007.
Cloetingh, S., Sternai, P., Koptev, A., Ehlers, T. A., Gerya, T., Kovács, I., Oerlemans, J., Beekman, F., Lavallée, Y., Dingwell, D., Békési, E., Porkolàb, K., Tesauro, M., Lavecchia, A., Botsyun, S., Muller, V., Roure, F., Serpelloni, E., Matenco, L., Castelltort, S., Giovannelli, D., Brovarone, A.V., Malaspina, N., Coletti, G., Valla, P., and Limberger, J.: Coupled surface to deep Earth processes: Perspectives from TOPO-EUROPE with an emphasis on climate-and energy-related societal challenges, Global Planet. Change, 226, 104140, https://doi.org/10.1016/j.gloplacha.2023.104140, 2023.
Conrad, C. P. and Husson, L.: Influence of dynamic topography on sea level and its rate of change, Lithosphere, 1, 110–120, https://doi.org/10.1130/L32.1, 2009.
Currie, C. A. and Hyndman, R. D.: The thermal structure of subduction zone back arcs, J. Geophys. Res.-Solid, 111, B08404, https://doi.org/10.1029/2005JB004024, 2006.
Davies, B. J. and Glasser, N. F.: Accelerating shrinkage of Patagonian glaciers from the Little Ice Age (∼ AD 1870) to 2011, J. Glaciol., 58, 1063–1084, https://doi.org/10.3189/2012JoG12J026, 2012.
Davies, B. J., Darvill, C. M., Lovell, H., Bendle, J. M., Dowdeswell, J. A., Fabel, D., García, J.-L., Geiger, A., Glasser, N. F., Gheorghiu, D. M., Harrison, S., Hein, A. S., Kaplan, M. R., Martin, J. R. V., Mendelova, M., Palmer, A., Pelto, M., Rodés, A., Segredo, E. A., Smedley, R. K., Smellie J., and Thorndycraft, V. R.: The evolution of the Patagonian Ice Sheet from 35 ka to the present day (PATICE), Earth-Sci. Rev., 204, 103152, https://doi.org/10.1016/j.earscirev.2020.103152, 2020.
Dávila, F. M., Lithgow-Bertelloni, C., Martina, F., Ávila, P., Nóbile, J., Collo, G., Ezpeleta, M., Canelo, H., and Sánchez, F.: Mantle influence on Andean and pre-Andean topography, in: The Evolution of the Chilean-Argentinean Andes, edited by: Folguera, A., Contreras-Reyes, E., Encinas, A., Iannelli, S. B., Oliveros, V., Dávila, F. M., Collo, G., Giambiagi, L., Maksymowicz, A., Lllanos, M. P. I., Turienzo, M., Naipauer, M., Orts, D., Litvak, V. D., Alvarez, O., and Arraigada, C., Springer Earth System Sciences, 363–385, ISBN 978-3-319-67773-6, https://doi.org/10.1007/978-3-319-67774-3_15, 2018.
DeMets, C., Gordon, R. G., and Argus, D. F.: Geologically current plate motions, Geophys. J. Int., 181, 1–80, https://doi.org/10.1111/j.1365-246X.2009.04491.x, 2010.
Dietrich, R., Ivins, E. R., Casassa, G., Lange, H., Wendt, J., and Fritsche, M.: Rapid crustal uplift in Patagonia due to enhanced ice loss, Earth Planet. Sc. Lett., 289, 22–29, https://doi.org/10.1016/j.epsl.2009.10.021, 2010.
Ding, X., Dávila, F. M., and Lithgow-Bertelloni, C.: Mechanisms of subsidence and uplift of Southern Patagonia and offshore basins during slab window formation, Geochem. Geophy. Geosy., 24, e2022GC010844, https://doi.org/10.1029/2022GC010844, 2023.
Eagles, G. and Scott, B. G.: Plate convergence west of Patagonia and the Antarctic Peninsula since 61 Ma, Global Planet. Change, 123, 189–198, https://doi.org/10.1016/j.gloplacha.2014.08.002, 2014.
Faccenna, C. and Becker, T. W.: Topographic expressions of mantle dynamics in the Mediterranean, Earth-Sci. Rev., 209, 103327, https://doi.org/10.1016/j.earscirev.2020.103327, 2020.
Fernandez, R. A., Anderson, J. B., Wellner, J. S., Totten, R. L., Hallet, B., and Smith, R. T.: Latitudinal variation in glacial erosion rates from Patagonia and the Antarctic Peninsula (46° S–65° S), GSA Bull., 128, 1000–1023, https://doi.org/10.1130/B31321.1, 2016.
Flament, N., Gurnis, M., and Müller, R. D.: A review of observations and models of dynamic topography, Lithosphere, 5, 189–210, https://doi.org/10.1130/L245.1, 2013.
Flament, N., Gurnis, M., Müller, R. D., Bower, D. J., and Husson, L.: Influence of subduction history on South American topography, Earth Planet. Sc. Lett., 430, 9–18, https://doi.org/10.1016/j.epsl.2015.08.006, 2015.
Fosdick, J. C., Grove, M., Hourigan, J. K., and Calderon, M.: Retroarc deformation and exhumation near the end of the Andes, southern Patagonia, Earth Planet. Sc. Lett., 361, 504–517, https://doi.org/10.1016/j.epsl.2012.12.007, 2013.
Geissler, W. H., Sodoudi, F., and Kind, R.: Thickness of the central and eastern European lithosphere as seen by S receiver functions, Geophys. J. Int., 181, 604–634, https://doi.org/10.1111/j.1365-246X.2010.04548.x, 2010.
Georgieva, V., Melnick, D., Schildgen, T. F., Ehlers, T. A., Lagabrielle, Y., Enkelmann, E., and Strecker, M. R.: Tectonic control on rock uplift, exhumation, and topography above an oceanic ridge collision: Southern Patagonian Andes (47° S), Chile, Tectonics, 35, 1317–1341, https://doi.org/10.1002/2016TC004120, 2016.
Georgieva, V., Gallagher, K., Sobczyk, A., Sobel, E. R., Schildgen, T. F., Ehlers, T. A., and Strecker, M. R.: Effects of slab-window, alkaline volcanism, and glaciation on thermochronometer cooling histories, Patagonian Andes, Earth Planet. Sc. Lett., 511, 164–176, https://doi.org/10.1016/j.epsl.2019.01.030, 2019.
Gerya, T. (Ed.): Introduction to numerical geodynamic modelling, Cambridge University Press, ISBN 978-1-107-14314-2, 2019.
Gerya, T. V. and Yuen, D. A.: Robust characteristics method for modelling multiphase visco-elasto-plastic thermo-mechanical problems, Phys. Earth Planet. Inter., 163, 83–105, https://doi.org/10.1016/j.pepi.2007.04.015, 2007.
Glasser, N. and Jansson, K.: The glacial map of southern South America, J. Maps, 4, 175–196, https://doi.org/10.4113/jom.2008.1020, 2008.
Glasser, N. F., Harrison, S., Winchester, V., and Aniya, M.: Late Pleistocene and Holocene palaeoclimate and glacier fluctuations in Patagonia, Global Planet. Change, 43, 79–101, https://doi.org/10.1016/j.gloplacha.2004.03.002, 2004.
Glasser, N. F., Jansson, K. N., Harrison, S., and Rivera, A.: Geomorphological evidence for variations of the North Patagonian Icefield during the Holocene, Geomorphology, 71, 263–277, https://doi.org/10.1016/j.geomorph.2005.02.003, 2005.
Glasser, N. F., Jansson, K. N., Harrison, S., and Kleman, J.: The glacial geomorphology and Pleistocene history of South America between 38° S and 56° S, Quaternary Sci. Rev., 27, 365–390, https://doi.org/10.1016/j.quascirev.2007.11.011, 2008.
Glasser, N. F., Harrison, S., Jansson, K. N., Anderson, K., and Cowley, A.: Global sea-level contribution from the Patagonian Icefields since the Little Ice Age maximum, Nat. Geosci., 4, 303–307, https://doi.org/10.1038/ngeo1122, 2011.
Glasser, N. F., Jansson, K. N., Duller, G. A., Singarayer, J., Holloway, M., and Harrison, S.: Glacial lake drainage in Patagonia (13–8 kyr) and response of the adjacent Pacific Ocean, Sci. Rep., 6, 21064, https://doi.org/10.1038/srep21064, 2016.
Gómez, D. D., Bevis, M. G., Smalley Jr, R., Durand, M., Willis, M. J., Caccamise, D. J., Kendrick, E., Skvarca, P., Sobrero, F. S., Parra, H., and Casassa, G.: Transient ice loss in the Patagonia Icefields during the 2015–2016 El Niño event, Sci. Rep., 12, 9553, https://doi.org/10.1038/s41598-022-13252-8, 2022.
Guillaume, B., Martinod, J., Husson, L., Roddaz, M., and Riquelme, R.: Neogene uplift of central eastern Patagonia: dynamic response to active spreading ridge subduction?, Tectonics, 28, 2, https://doi.org/10.1029/2008TC002324, 2009.
Guillaume, B., Gautheron, C., Simon-Labric, T., Martinod, J., Roddaz, M., and Douville, E.: Dynamic topography control on Patagonian relief evolution as inferred from low temperature thermochronology, Earth Planet. Sc. Lett., 364, 157–167, https://doi.org/10.1016/j.epsl.2012.12.036, 2013.
Gurnis, M. A.: reassessment of the heat transport by variable viscosity convection with plates and lids, Geophys. Res. Lett., 16, 179–182, https://doi.org/10.1029/GL016i002p00179, 1989.
Hager, B. H. and O'Connell, R. J.: A simple global model of plate dynamics and mantle convection, J. Geophys. Res.-Solid, 86, 4843–4867, https://doi.org/10.1029/JB086iB06p04843, 1981.
Harvey, A. H.: Properties of Ice and Supercooled Water, in: CRC Handbook of Chemistry and Physics, 97th Edn., edited by: Haynes, W. M., Lide, D. R., and Bruno, T. J., CRC Press, Boca Raton, FL, ISBN 978-1-4987-5429-3, 2017.
Hein, A. S., Hulton, N. R., Dunai, T. J., Sugden, D. E., Kaplan, M. R., and Xu, S.: The chronology of the Last Glacial Maximum and deglacial events in central Argentine Patagonia, Quaternary Sci. Rev., 29, 1212–1227, https://doi.org/10.1016/j.quascirev.2010.01.020, 2010.
Herman, F. and Brandon, M.: Mid-latitude glacial erosion hotspot related to equatorial shifts in southern Westerlies, Geology, 43, 987–990, https://doi.org/10.1130/G37008.1, 2015.
Herman, F., Seward, D., Valla, P. G., Carter, A., Kohn, B., Willett, S. D., and Ehlers, T. A.: Worldwide acceleration of mountain erosion under a cooling climate, Nature, 504, 423–426, https://doi.org/10.1038/nature12877, 2013.
Herman, F., Braun, J., Deal, E., and Prasicek, G.: The response time of glacial erosion, J. Geophys. Res.-Earth, 123, 801–817, https://doi.org/10.1002/2017JF004586, 2018.
Hirschmann, M. M.: Mantle solidus: Experimental constraints and the effects of peridotite composition, Geochem. Geophy. Geosy., 1, 1042, https://doi.org/10.1029/2000GC000070, 2000.
Hulton, N. R., Purves, R. S., McCulloch, R. D., Sugden, D. E., and Bentley, M. J.: The last glacial maximum and deglaciation in southern South America, Quaternary Sci. Rev., 21, 233–241, https://doi.org/10.1016/S0277-3791(01)00103-2, 2002.
Ivins, E. R. and James, T. S.: Simple models for late Holocene and present-day Patagonian glacier fluctuations and predictions of a geodetically detectable isostatic response, Geophys. J. Int., 138, 601–624, https://doi.org/10.1046/j.1365-246x.1999.00899.x, 1999.
Ivins, E. R. and James, T. S. Bedrock response to Llanquihue Holocene and present-day glaciation in southernmost South America, Geophys. Res. Lett., 31, L24613, https://doi.org/10.1029/2004GL021500, 2004.
Ivins, E. R., Watkins, M. M., Yuan, D. N., Dietrich, R., Casassa, G., and Rülke, A.: On-land ice loss and glacial isostatic adjustment at the Drake Passage: 2003–2009, J. Geophys. Res.-Solid, 116, B02403, https://doi.org/10.1029/2010JB007607, 2011.
Jacob, T., Wahr, J., Pfeffer, W. T., and Swenson, S.: Recent contributions of glaciers and ice caps to sea level rise, Nature, 482, 514–518, https://doi.org/10.1038/nature10847, 2012.
Johannes, W.: The significance of experimental studies for the formation of migmatites, in: Migmatites, edited by: Ashworth, J. R., Blackie & Son Ltd, Chapman & Hall, USA, ISBN 978-1-4613-2347-1, https://doi.org/10.1007/978-1-4613-2347-1_2, 1985.
Kaplan, M. R., Schaefer, J. M., Strelin, J. A., Denton, G. H., Anderson, R. F., Vandergoes, M. J., Finkel, R. C., Schwartz, R., Travis, S. G., Garcia, J. L., Martini, M. A., and Nielsen, S. H. H.: Patagonian and southern South Atlantic view of Holocene climate, Quaternary Sci. Rev., 141, 112–125, https://doi.org/10.1016/j.quascirev.2016.03.014, 2016.
Kaufmann, G. and Lambeck, K.: Glacial isostatic adjustment and the radial viscosity profile from inverse modelling, J. Geophys. Res.-Solid, 107, 2280, https://doi.org/10.1029/2001JB000941, 2002.
Kaufmann, G., Wu, P., and Wolf, D.: Some effects of lateral heterogeneities in the upper mantle on postglacial land uplift close to continental margins, Geophys. J. Int., 128, 175–187, https://doi.org/10.1111/j.1365-246X.1997.tb04078.x, 1997.
Klemann, V., Ivins, E. R., Martinec, Z., and Wolf, D.: Models of active glacial isostasy roofing warm subduction: Case of the South Patagonian Ice Field, J. Geophys. Res.-Solid, 112, B09405 https://doi.org/10.1029/2006JB004818, 2007.
Lachenbruch, A. H. and Morgan, P.: Continental extension, magmatism and elevation; formal relations and rules of thumb, Tectonophysics, 174, 39–62, https://doi.org/10.1016/0040-1951(90)90383-J, 1990.
Lagabrielle, Y., Suárez, M., Rossello, E. A., Hérail, G., Martinod, J., Régnier, M., and de la Cruz, R.: Neogene to Quaternary tectonic evolution of the Patagonian Andes at the latitude of the Chile Triple Junction, Tectonophysics, 385, 211–241, https://doi.org/10.1016/j.tecto.2004.04.023, 2004.
Lagabrielle, Y., Scalabrino, B., Suarez, M., and Ritz, J. F.: Mio-Pliocene glaciations of Central Patagonia: New evidence and tectonic implications, Andean Geol., 37, 276–299, https://doi.org/10.5027/andgeoV37n2-a02, 2010.
Lange, H., Casassa, G., Ivins, E. R., Schröder, L., Fritsche, M., Richter, A., Groh, A., and Dietrich, R.: Observed crustal uplift near the Southern Patagonian Icefield constrains improved viscoelastic Earth models, Geophys. Res. Lett., 41, 805–812, https://doi.org/10.1002/2013GL058419, 2014.
Larson, K. M., Bürgmann, R., Bilham, R., and Freymueller, J. T.: Kinematics of the India-Eurasia collision zone from GPS measurements, J. Geophys. Res.-Solid, 104, 1077–1093, https://doi.org/10.1029/1998JB900043, 1999.
Lenzano, M. G., Rivera, A., Durand, M., Vacaflor, P., Carbonetti, M., Lannutti, E., Gende, M., and Lenzano, L.: Detection of Crustal Uplift Deformation in Response to Glacier Wastage in Southern Patagonia, Remote Sens., 15, 584, https://doi.org/10.3390/rs15030584, 2023.
Mark, H. F., Wiens, D. A., Ivins, E. R., Richter, A., Ben Mansour, W., Magnani, M. B., Marderwald, E., Adaros, R., and Barrientos, S.: Lithospheric erosion in the Patagonian slab window, and implications for glacial isostasy, Geophys. Res. Lett., 49, e2021GL096863, https://doi.org/10.1029/2021GL096863, 2022.
Martinod, J., Pouyaud, B., Carretier, S., Guillaume, B., and Hérail, G.: Geomorphic Records along the General Carrera (Chile)–Buenos Aires (Argentina) Glacial Lake (46°–48° S), Climate Inferences, and Glacial Rebound for the Past 7–9 ka: A discussion, J. Geol., 124, 631–635, https://doi.org/10.1086/687550, 2016.
McCulloch, R. D., Bentley, M. J., Purves, R. S., Hulton, N. R., Sugden, D. E., and Clapperton, C. M.: Climatic inferences from glacial and palaeoecological evidence at the last glacial termination, southern South America, J. Quaternary Sci., 15, 409–417, https://doi.org/10.1002/jqs.608, 2000.
McCulloch, R. D., Fogwill, C. J., Sugden, D. E., Bentley, M. J., and Kubik, P. W.: Chronology of the last glaciation in central Strait of Magellan and Bahía Inútil, southernmost South America, Geograf. Ann. A, 87, 289–312, https://doi.org/10.1111/j.0435-3676.2005.00260.x, 2005.
McKenzie, D. and Richter, F. M.: Parameterized thermal convection in a layered region and the thermal history of the Earth, J. Geophys. Res.-Solid, 86, 11667–11680, https://doi.org/10.1029/JB086iB12p11667, 1981.
McKenzie, D. A. N. and Bickle, M. J.: The volume and composition of melt generated by extension of the lithosphere, J. Petrol., 29, 625–679, https://doi.org/10.1093/petrology/29.3.625, 1988.
Millan, R., Rignot, E., Rivera, A., Martineau, V., Mouginot, J., Zamora, R., Uribe, J., Lenzano, G., De Fleurian, B., Li, X., Gim, Y., and Kirchner, D.: Ice thickness and bed elevation of the Northern and Southern Patagonian Icefields, Geophys. Res. Lett., 46, 6626–6635, https://doi.org/10.1029/2019GL082485, 2019.
Mitrovica, J. X. and Forte, A.: M. Radial profile of mantle viscosity: Results from the joint inversion of convection and postglacial rebound observables, J. Geophys. Res.-Solid, 102, 2751–2769, https://doi.org/10.1029/96JB03175, 1997.
Molnar, P. and England, P.: Late Cenozoic uplift of mountain ranges and global climate change: chicken or egg?, Nature, 346, 29–34, https://doi.org/10.1038/346029a0, 1990.
Moreno, P. I., Lowell, T. V., Jacobson Jr., G. L., and Denton, G. H.: Abrupt vegetation and climate changes during the last glacial maximum and last termination in the Chilean Lake District: a case study from Canal de la Puntilla (41° S), Geograf. Ann. A, 81, 285–311, https://doi.org/10.1002/jqs.801, 1999.
Moreno, P. I., Denton, G. H., Moreno, H., Lowell, T. V., Putnam, A. E., and Kaplan, M. R.: Radiocarbon chronology of the last glacial maximum and its termination in northwestern Patagonia, Quaternary Sci. Rev., 122, 233–249, https://doi.org/10.1016/j.quascirev.2015.05.027, 2015.
Muller, V. A. P., Calderón, M., Fosdick, J. C., Ghiglione, M. C., Cury, L. F., Massonne, H. J., Fanning, M. C., Warren, C. J., Ramírez de Arellano, C., and Sternai, P.: The closure of the Rocas Verdes Basin and early tectono-metamorphic evolution of the Magallanes Fold-and-Thrust Belt, southern Patagonian Andes (52–54° S), Tectonophysics, 798, 228686, https://doi.org/10.1016/j.tecto.2020.228686, 2021.
Muller, V. A. P., Sternai, P., Sue, C., Simon-Labric, T., and Valla, P. G.: Climatic control on the location of continental volcanic arcs, Sci. Rep., 12, 1–13, https://doi.org/10.1038/s41598-022-26158-2, 2022.
Muller, V. A. P., Sue, C., Valla, P., Sternai, P., Simon-Labric, T., Gautheron, C., Cuffey, K., Grujic, D., Bernet, M., Martinod, J., Ghiglione, M., Herman, F., Reiners, P., Shuster, D., Willett, C., Baumgartner, L., and Braun, J.: Geodynamic and climatic forcing on late-Cenozoic exhumation of the Southern Patagonian Andes (Fitz Roy and Torres del Paine massifs), ESS Open Archive, https://doi.org/10.22541/essoar.168332179.93378898/v1, 2023.
Muller, V. A. P., Sternai, P., and Sue, C.: Codes for Muller et al., Fast uplift in the Southern Patagonian Andes due to long and short term deglaciation and the asthenospheric window underneath, EGU Solid Earth, 2024 (https://github.com/psternai/Muller-et-al.-2024), Zenodo [code], https://doi.org/10.5281/zenodo.10896122, 2024.
Pedoja, K., Regard, V., Husson, L., Martinod, J., Guillaume, B., Fucks, E., Iglesias, M., and Weill, P.: Uplift of Quaternary shorelines in eastern Patagonia: Darwin revisited, Geomorphology, 127, 121–142, https://doi.org/10.1016/j.geomorph.2010.08.003, 2011.
Peltier, W. R.: Mantle viscosity and ice-age ice sheet topography, Science, 273, 1359–1364, https://doi.org/10.1126/science.273.5280.1359, 1996.
Peltier, W. R.: Global glacial isostasy and the surface of the ice-age Earth: the ICE-5G (VM2) model and GRACE, Annu. Rev. Earth Planet. Sci., 32, 111–149, https://doi.org/10.1146/annurev.earth.32.082503.144359, 2004.
Peltier, W. R. and Andrews, J. T.: Glacial-isostatic adjustment – I. The forward problem, Geophys. J. Int., 46, 605–646, https://doi.org/10.1111/j.1365-246X.1976.tb01251.x, 1976.
Peltier, W. R., Argus, D. F., and Drummond, R.: Comment on “An assessment of the ICE-6G_C (VM5a) glacial isostatic adjustment model” by Purcell et al., J. Geophys. Res.-Solid, 123, 2019–2028, https://doi.org/10.1002/2016JB013844, 2018.
Rabassa, J.: Late cenozoic glaciations in Patagonia and Tierra del Fuego, Dev. Quatern. Sci., 11, 151–204, https://doi.org/10.1016/S1571-0866(07)10008-7, 2008.
Ramos, V. A.: Seismic ridge subduction and topography: Foreland deformation in the Patagonian Andes, Tectonophysics, 399, 73–86, https://doi.org/10.1016/j.tecto.2004.12.016, 2005.
Ramos, V. A. and Kay, S. M.: Southern Patagonian plateau basalts and deformation: backarc testimony of ridge collisions, Tectonophysics, 205, 261–282, https://doi.org/10.1016/0040-1951(92)90430-E, 1992.
Ranalli, G.: Rheology of the Earth, Springer Science & Business Media, ISBN 0-412-54670-1, 1995.
Ranalli, G.: Rheology of the lithosphere in space and time, Geol. Soc. Lond. Spec. Publ., 121, 19–37, https://doi.org/10.1144/GSL.SP.1997.121.01.02, 1997.
Ravikumar, M., Singh, B., Pavan Kumar, V., Satyakumar, A. V., Ramesh, D. S., and Tiwari, V. M.: Lithospheric density structure and effective elastic thickness beneath Himalaya and Tibetan Plateau: Inference from the integrated analysis of gravity, geoid, and topographic data incorporating seismic constraints, Tectonics, 39, e2020TC006219, https://doi.org/10.1029/2020TC006219, 2020.
Reynhout, S. A., Sagredo, E. A., Kaplan, M. R., Aravena, J. C., Martini, M. A., Moreno, P. I., Rojas, M., Schwartz, R., and Schaefer, J. M.: Holocene glacier fluctuations in Patagonia are modulated by summer insolation intensity and paced by Southern Annular Mode-like variability, Quaternary Sci. Rev., 220, 178–187, https://doi.org/10.1016/j.quascirev.2019.05.029, 2019.
Richter, A., Ivins, E., Lange, H., Mendoza, L., Schröder, L., Hormaechea, J. L., Casassa, G., Marderwald, E., Fritsche, M., Perdomo, R., Horwath, M., and Dietrich, R.: Crustal deformation across the Southern Patagonian Icefield observed by GNSS, Earth Planet. Sc. Lett., 452, 206–215, https://doi.org/10.1016/j.epsl.2016.07.042, 2016.
Rignot, E., Rivera, A., and Casassa, G.: Contribution of the Patagonia Icefields of South America to sea level rise, Science, 302, 434–437, https://doi.org/10.1126/science.1087393, 2003.
Robertson Maurice, S. D., Wiens, D. A., Koper, K. D., and Vera, E.: Crustal and upper mantle structure of southernmost South America inferred from regional waveform inversion, J. Geophys. Res.-Solid, 108, 2038, https://doi.org/10.1029/2002JB001828, 2003.
Ruddiman, W. F., Raymo, M., and McIntyre, A.: Matuyama 41,000-year cycles: North Atlantic Ocean and northern hemisphere ice sheets, Earth Planet. Sc. Lett., 80, 117–129, https://doi.org/10.1016/0012-821X(86)90024-5, 1986.
Russo, R. M., Gallego, A., Comte, D., Mocanu, V. I., Murdie, R. E., and VanDecar, J. C.: Source-side shear wave splitting and upper mantle flow in the Chile Ridge subduction region, Geology, 38, 707–710, https://doi.org/10.1130/G30920.1, 2010.
Russo, R. M., Luo, H., Wang, K., Ambrosius, B., Mocanu, V., He, J., James, T., Bevis, M., and Fernandes, R.: Lateral variation in slab window viscosity inferred from global navigation satellite system (GNSS)-observed uplift due to recent mass loss at Patagonia ice fields, Geology, 50, 111–115, https://doi.org/10.1130/G49388.1, 2022.
Scalabrino, B., Lagabrielle, Y., Malavieille, J., Dominguez, S., Melnick, D., Espinoza, F., Suárez, M., and Rossello, E.: A morphotectonic analysis of central Patagonian Cordillera: Negative inversion of the Andean belt over a buried spreading center?, Tectonics, 29, 2, https://doi.org/10.1029/2009TC002453, 2010.
Seltzer, A. M., Ng, J., Aeschbach, W., Kipfer, R., Kulongoski, J. T., Severinghaus, J. P., and Stute, M.: Widespread six degrees Celsius cooling on land during the Last Glacial Maximum, Nature, 593, 228–232, https://doi.org/10.1038/s41586-021-03467-6, 2021.
Serpelloni, E., Faccenna, C., Spada, G., Dong, D., and Williams, S. D.: Vertical GPS ground motion rates in the Euro-Mediterranean region: New evidence of velocity gradients at different spatial scales along the Nubia-Eurasia plate boundary, J. Geophys. Res.-Solid, 118, 6003–6024, https://doi.org/10.1002/2013JB010102, 2013.
Stern, C. R. and Kilian, R.: Role of the subducted slab, mantle wedge and continental crust in the generation of adakites from the Andean Austral Volcanic Zone, Contrib. Mineral. Petrol., 123, 263–281, https://doi.org/10.1002/2013JB010102, 1996.
Sternai, P.: Surface processes forcing on extensional rock melting, Sci. Rep., 10, 1–13, https://doi.org/10.1038/s41598-020-63920-w, 2020.
Sternai, P.: Feedbacks between internal and external Earth dynamics, in: Dynamics of Plate Tectonics and Mantle Convection, edited by: Duarte, J., Elsevier, 271–294, ISBN 978-0-323-85733-8, 2023.
Sternai, P., Caricchi, L., Castelltort, S., and Champagnac, J.-D.: Deglaciation and glacial erosion: a joint control on the magma productivity by continental unloading, Geophys. Res. Lett., 43, 1632–1641, https://doi.org/10.1002/2015GL067285, 2016a.
Sternai, P., Avouac, J.-P., Jolivet, L., Faccenna, C., Gerya, T. V., Becker, T., and Menant, A.: On the influence of the asthenospheric flow on the tectonics and topography at collision-subduction transition zones: comparison with the eastern Tibetan margin, J. Geodynam., 100, 18–194, https://doi.org/10.1016/j.jog.2016.02.009, 2016b.
Sternai, P., Sue, C., Husson, L., Serpelloni, E., Becker, T. W., Willett, S. D., Faccenna, C., Di Giulio, A., Spada, G., Jolivet, L., Valla, P., Petit, C., Nocquet, J.-M., Walpersdorf, A., and Castelltort, S.: Present-day uplift of the European Alps: Evaluating mechanisms and models of their relative contributions, Earth-Sci. Rev., 190, 589–604, https://doi.org/10.1016/j.earscirev.2019.01.005, 2019.
Sternai, P., Muller, V. A. P., Jolivet, L., Garzanti, E., Corti, G., Pasquero, C., Sembroni, A., and Faccenna, C.: Effects of asthenospheric flow and orographic precipitation on continental rifting, Tectonophysics, 820, 229120, https://doi.org/10.1016/j.tecto.2021.229120, 2021.
Stevens Goddard, A. L. and Fosdick, J. C.: Multichronometer thermochronologic modeling of migrating spreading ridge subduction in southern Patagonia, Geology, 47, 555–558, https://doi.org/10.1130/G46091.1, 2019.
Strelin, J. A., Kaplan, M. R., Vandergoes, M. J., Denton, G. H., and Schaefer, J. M.: Holocene glacier history of the Lago Argentino basin, southern Patagonian Icefield, Quaternary Sci. Rev., 101, 124–145, https://doi.org/10.1016/j.quascirev.2014.06.026, 2014.
Stuhne, G. R. and Peltier, W. R.: Reconciling the ICE-6G_C reconstruction of glacial chronology with ice sheet dynamics: The cases of Greenland and Antarctica, J. Geophys. Res.-Earth, 120, 1841–1865, https://doi.org/10.1002/2015JF003580, 2015.
Sue, C., Delacou, B., Champagnac, J. D., Allanic, C., and Burkhard, M.: Aseismic deformation in the Alps: GPS vs. seismic strain quantification, Terra Nova, 19, 182–188, https://doi.org/10.1111/j.1365-3121.2007.00732.x, 2007.
Sugden, D. E., Hulton, N. R., and Purves, R. S.: Modelling the inception of the Patagonian icesheet, Quatern. Int., 95, 55–64, https://doi.org/10.1016/S1040-6182(02)00027-7, 2002.
Thomson, S. N., Brandon, M. T., Tomkin, J. H., Reiners, P. W., Vásquez, C., and Wilson, N. J.: Glaciation as a destructive and constructive control on mountain building, Nature, 467, 313–317, https://doi.org/10.1038/nature09365, 2010.
Thorndycraft, V. R., Bendle, J. M., Benito, G., Davies, B. J., Sancho, C., Palmer, A. P., Fabel, D., Medialdea, A., and Martin, J. R.: Glacial lake evolution and Atlantic-Pacific drainage reversals during deglaciation of the Patagonian Ice Sheet, Quaternary Sci. Rev., 203, 102–127, https://doi.org/10.1016/j.quascirev.2018.10.036, 2019.
Turcotte, D. L. and Schubert, G.: Geodynamics, Cambridge University Press, ISBN 978-0-521-66186-7, 2002.
Valla, P. G., van der Beek, P. A., Shuster, D. L., Braun, J., Herman, F., Tassan-Got, L., and Gautheron, C.: Late Neogene exhumation and relief development of the Aar and Aiguilles Rouges massifs (Swiss Alps) from low-temperature thermochronology modeling and 4He/3He thermochronometry, J. Geophys. Res.-Earth, 117, F01004, https://doi.org/10.1029/2011JF002043, 2012.
Van der Meijde, M., Julià, J., and Assumpção, M.: Gravity derived moho for south America, Tectonophysics, 609, 456–467, https://doi.org/10.1016/j.tecto.2013.03.023, 2013.
van der Wal, W., Whitehouse, P. L., and Schrama, E. J.: Effect of GIA models with 3D composite mantle viscosity on GRACE mass balance estimates for Antarctica, Earth Planet. Sc. Lett., 414, 134–143, https://doi.org/10.1016/j.epsl.2015.01.001, 2015.
Walpersdorf, A., Sue, C., Baize, S., Cotte, N., Bascou, P., Beauval, C., Collard, P, Daniel, G., Dyer, H., Grasso, J.-R., Hautecoeur, O., Helmstetter, A., Hok, S., Langlais, M., Menard, G., Mousavi, Z., Ponton, F., Rizza, M., Rolland, L., Souami, D., and Martinod, J.: Coherence between geodetic and seismic deformation in a context of slow tectonic activity (SW Alps, France), J. Geodynam., 85, 58–65, https://doi.org/10.1016/j.jog.2015.02.001, 2015.
Watts, A. B.: Isostasy and Flexure of the Lithosphere, Cambridge University Press, ISBN 0-521-62272, 2001.
Whitehouse, P. L.: Glacial isostatic adjustment modelling: historical perspectives, recent advances, and future directions, Earth Surf. Dynam., 6, 401–429, https://doi.org/10.5194/esurf-6-401-2018, 2018.
Willis, M. J., Melkonian, A. K., Pritchard, M. E., and Rivera, A.: Ice loss from the Southern Patagonian ice field, South America, between 2000 and 2012, Geophys. Res. Lett., 39, L17501, https://doi.org/10.1029/2012GL053136, 2012.
Yan, Q., Wei, T., and Zhang, Z.: Modeling the climate sensitivity of Patagonian glaciers and their responses to climatic change during the global last glacial maximum, Quaternary Sci. Rev., 288, 107582, https://doi.org/10.1016/j.quascirev.2022.107582, 2022.