the Creative Commons Attribution 4.0 License.
the Creative Commons Attribution 4.0 License.
 | 08 Jul 2024
Impact of stress regime change on the permeability of a naturally fractured carbonate buildup (Latemar, the Dolomites, northern Italy)
Onyedika Anthony Igbokwe
Jithender J. Timothy
Ashwani Kumar
Xiao Yan
Mathias Mueller
Alessandro Verdecchia
Günther Meschke
Adrian Immenhauser
Changing stress regimes control fracture network geometry and influence porosity and permeability in carbonate reservoirs. Using outcrop data analysis and a displacement-based linear elastic finite-element method, we investigate the impact of stress regime change on fracture network permeability. The model is based on fracture networks, specifically fracture substructures. The Latemar, predominantly affected by subsidence deformation and Alpine compression, is taken as an outcrop analogue for an isolated (Mesozoic) carbonate buildup with fracture-dominated permeability. We apply a novel strategy involving two compressive boundary loading conditions constrained by the study area's NW–SE and N–S stress directions. Stress-dependent heterogeneous apertures and effective permeability were computed in the 2D domain by (i) using the local stress state within the fracture substructure and (ii) running a single-phase flow analysis considering the fracture apertures in each fracture substructure. Our results show that the impact of the modelled far-field stresses at (i) subsidence deformation from the NW–SE and (ii) Alpine deformation from N–S increased the overall fracture aperture and permeability. In each case, increasing permeability is associated with open fractures parallel to the orientation of the loading stages and with fracture densities. The anisotropy of permeability is increased by the density and connectedness of the fracture network and affected by shear dilation. The two far-field stresses simultaneously acting within the selected fracture substructure at a different magnitude and orientation do not necessarily cancel each other out in the mechanical deformation modelling. These stresses affect the overall aperture and permeability distributions and the flow patterns. These effects – potentially ignored in simpler stress-dependent permeability – can result in significant inaccuracies in permeability estimation.
- Article
(17473 KB) - Full-text XML
- BibTeX
- EndNote


Naturally fractured reservoirs accommodate a significant share of the world's hydrocarbon resources, especially in carbonates that contain 50 % to 60 % of oil and gas reserves worldwide (Garland et al., 2012). These reservoirs also play an essential role in transitioning to a low-carbon energy future, especially in producing low- and high-enthalpy geothermal heat or sequestering CO2 (McNamara et al., 2015). However, these potentials have not been fully explored, partly because of the challenge of predicting and quantifying the contribution of fluid flow through fractures in naturally occurring complex fracture networks (Berkowitz, 2002; Narr et al., 2006). The challenge is primarily due to the sub-seismic heterogeneous characteristics of fractures, partially studied from core data or image logs (Laubach, 2003), and the lack of an understanding of the structural arrangement of the fracture networks as well as their 3D distribution and geometrical attributes. Given that core data or image logs (capturing small-scale or local information around a well) lack information on the spatial arrangement (Bourbiaux et al., 2005), outcrop analogues are often used for explicit descriptions of fracture distributions, including length, orientation, spacing, and aperture (Agosta et al., 2010; Bonnet et al., 2001; Hooker et al., 2013; Igbokwe et al., 2018, 2020; Wilson et al., 2011). Integrated and detailed outcrop studies provide constraints for understanding most fracture geometrical parameters because analogues have adequate resolution over a varied length scale of 10−1 to 104 m, even in three dimensions (Rotevatn et al., 2009; Igbokwe et al., 2020). Also, outcrop analogues can be extrapolated to reservoir-scale fracture models based on geomechanical relations as long as the data are accurately captured and corrected for sampling artefacts (Bisdom et al., 2016a; Narr et al., 2006).
In many natural reservoirs, the fractures act as the principal pathways for fluid or gas flow, particularly in low-matrix-permeability rocks. Fracture aperture is one of the main factors controlling fracture flow, as the aperture delineates fracture porosity and permeability (Bisdom et al., 2016b; Hooker et al., 2013). Minor variations in aperture have enormous implications on rock flow and transport properties (de Dreuzy et al., 2002; Matthäi, 2003; Matthäi and Belayneh, 2004), and obtaining a realistic aperture prediction from outcropping geometries is challenging. At depth, in situ stresses partly control the aperture, which influences permeability by either increasing or decreasing their order of magnitude (Lei et al., 2015, 2017; Zoback, 2007), but pressure relief during exhumation and meteoric diagenesis (specifically rainwater) may leach and even dissolve cement-occluded fractures and change the aperture. Thus, the outcropping aperture cannot be considered representative, except when these apertures are generated from veins that have not been reactivated during exhumation (e.g. Hooker et al., 2013, 2014). That said, preserved veins covering a large outcrop scale equivalent to a reservoir scale are rarely found in nature.
As an alternative, fracture aperture is modelled as a function of stress (shear-stress-induced dilations) using hydromechanical coupling based on linear elastic fracture mechanics (Bisdom et al., 2017; Lei et al., 2015; Min et al., 2004). These models require the local stress state, typically derived from finite-element (FE) models with explicit fracture representations (Bisdom et al., 2016a; Lei et al., 2017). The local state of stress can change the hydraulic properties and fluid pressure and vice versa in a rock domain. For stress-induced changes in hydraulic properties, permeability can be several orders of magnitude greater and irreversible under perturbations resulting from various natural activities. These natural activities can cause stress redistribution, such as in geothermal energy as well as oil and gas operations, where injections and extractions of fluids demand significant change in effective stresses in the subsurface (e.g. Chen and Lawrence, 2001; Min et al., 2004). Thus, investigating the impact of stress change on permeability becomes fundamental in understanding reservoirs' overall aperture distribution and flow pattern.
The effect of stress on the permeability of fractured rocks has been widely investigated using synthetic fracture networks and 2D fracture network models. For example, differential stress considerably impacted the magnitude and direction of rock mass permeability when the stress effects on the 2D permeability tensor of three sampled natural fracture networks were analysed (Zhang and Sanderson, 1996). Min et al. (2004) observed significant stress-induced flow enhancement along with connected shear fractures in a study of the stress dependency of rock mass permeability with the effects of nonlinear joint normal deformation and shear dilation. While Bisdom et al. (2016a) investigated the influence of in situ stress on the permeability of an outcrop-based fracture system, Lei et al. (2014) analysed the stress effect on the validity of synthetic fracture networks for representing a naturally fractured rock in terms of geomechanical and hydraulic properties.
These previous studies mainly considered the tectonic stress perturbation based on a single stress regime that scrutinizes the magnitude and orientation of principal stresses on a rock body differently. However, past studies did not necessarily consider the different tectonic episodes that build up different stress regimes and which may change in geological time. In nature, the stress in a rock body can exist in two forms: (i) the far-field stress impacting the rock from outside the body and (ii) the local state of stress domiciled inside the rock body. The far-field stress is of tectonic origin or related to lateral pressure changes affected by the lateral thickness and density variations (Pascal and Cloetingh, 2009). At the same time, the local state of stress is characterized by rotations and changes in principal stress orientations, magnitude, and other forces acting on the rock body. The local state of stress changes is linked to the impact of far-field stresses and the geometry, distribution, and density of fracture network characteristics. Therefore, investigating stress perturbation and its effects on the permeability of rock bodies needs a comprehensive approach that will capture the impact of the magnitude and orientation of the far-field stresses and the associated changes in the local state of stress in different tectonic episodes.
The difficulty primarily represents (i) the stress regime changes over time, (ii) the complex fracture system geometry having various orientations and lengths, and (iii) the complex mechanical deformation mechanism influencing the interactions between individual fractures in an FE mechanical model. Until now, a focused study dealing with the superposition of different magnitudes and directions of the far-field stresses, representing the major geological tectonic episodes in a given area in several FE mechanical models, has been hampered. In complex fractured rock, the interactions between the rock matrix and fractures present the primary challenge for FE in solving the hydromechanical coupling problem. The fractured rocks are generally assumed to be a continuum medium with dual porosity and permeability, while the real geometry and hydro-properties cannot be described accurately (Hoteit and Firooazbadi, 2006; Ren et al., 2017). This is in addition to the complicated mathematical calculation. As such, the overall impact of stress regime change on permeability remains poorly understood.
In this study, we investigate the influence of the superposition of two orthogonal far-field stresses derived from significant tectonic episodes on the permeability of carbonate rocks with different fracture distributions. The natural fracture geometry was utilized with multiple fracture sets and intersections from an outcrop analogue at the Latemar carbonate buildup. The two major tectonic events at Latemar are associated with subsidence-related deformation in Late Triassic and Early Jurassic times, shortly after the fractures were formed, and later Alpine compression during the Neogene. Although new fractures may have formed during these tectonic episodes, we assumed that new fractures did not form and/or grow in the model used in this study. Instead, already developed fractures were either opened or closed during these tectonic events. This enables us to study stress regime change effects on permeability, focusing on those issues related to the complexity of multiple fractures. The development of the Latemar fractures and their driving factors, including their geometries, connectivities, and crosscutting relationships, is beyond this paper's scope and has been discussed in detail in Igbokwe et al. (2022). We aim to draw general conclusions about the impact of stress regime change on permeability in complex fractured systems, which represent an analogue of subsurface reservoirs.
The main objectives of this paper are to (i) analyse the selected fracture network characteristics of the study area, (ii) evaluate the impact of stress regime change considering the overall tectonic episodes, (iii) compute the stress-induced fracture aperture in a FE model, and (iv) evaluate the changes in the effective permeability and permeability anisotropy. The implications of the central assumptions and the impact of the changing stress orientation and magnitude on effective permeability are discussed.
The Latemar carbonate buildup is one of the pre-volcanic Middle Triassic isolated carbonate platforms (Goldhammer and Harris, 1989; Preto et al., 2011) located in the southwestern part of the Dolomite mountain belt (northern Italy; Fig. 1) and neighboured by the Catinaccio and the Agnello platforms in the north and south, respectively (Fig. 1a). The outcrops of the Latemar are built predominantly by the Sciliar (Schlern) Formation (Fig. 1b), underlying the Contrin Formation, which is a regionally important carbonate bank in the Dolomite mountain belt (Gaetani et al., 1981; Jacquemyn et al., 2014). Between the late Anisian and late Ladinian (Middle Triassic), the Latemar buildup formed on topographic highs. Their buildups were separated by basinal areas where siliceous basinal carbonates were deposited (Fig. 1; Bosellini, 1984).
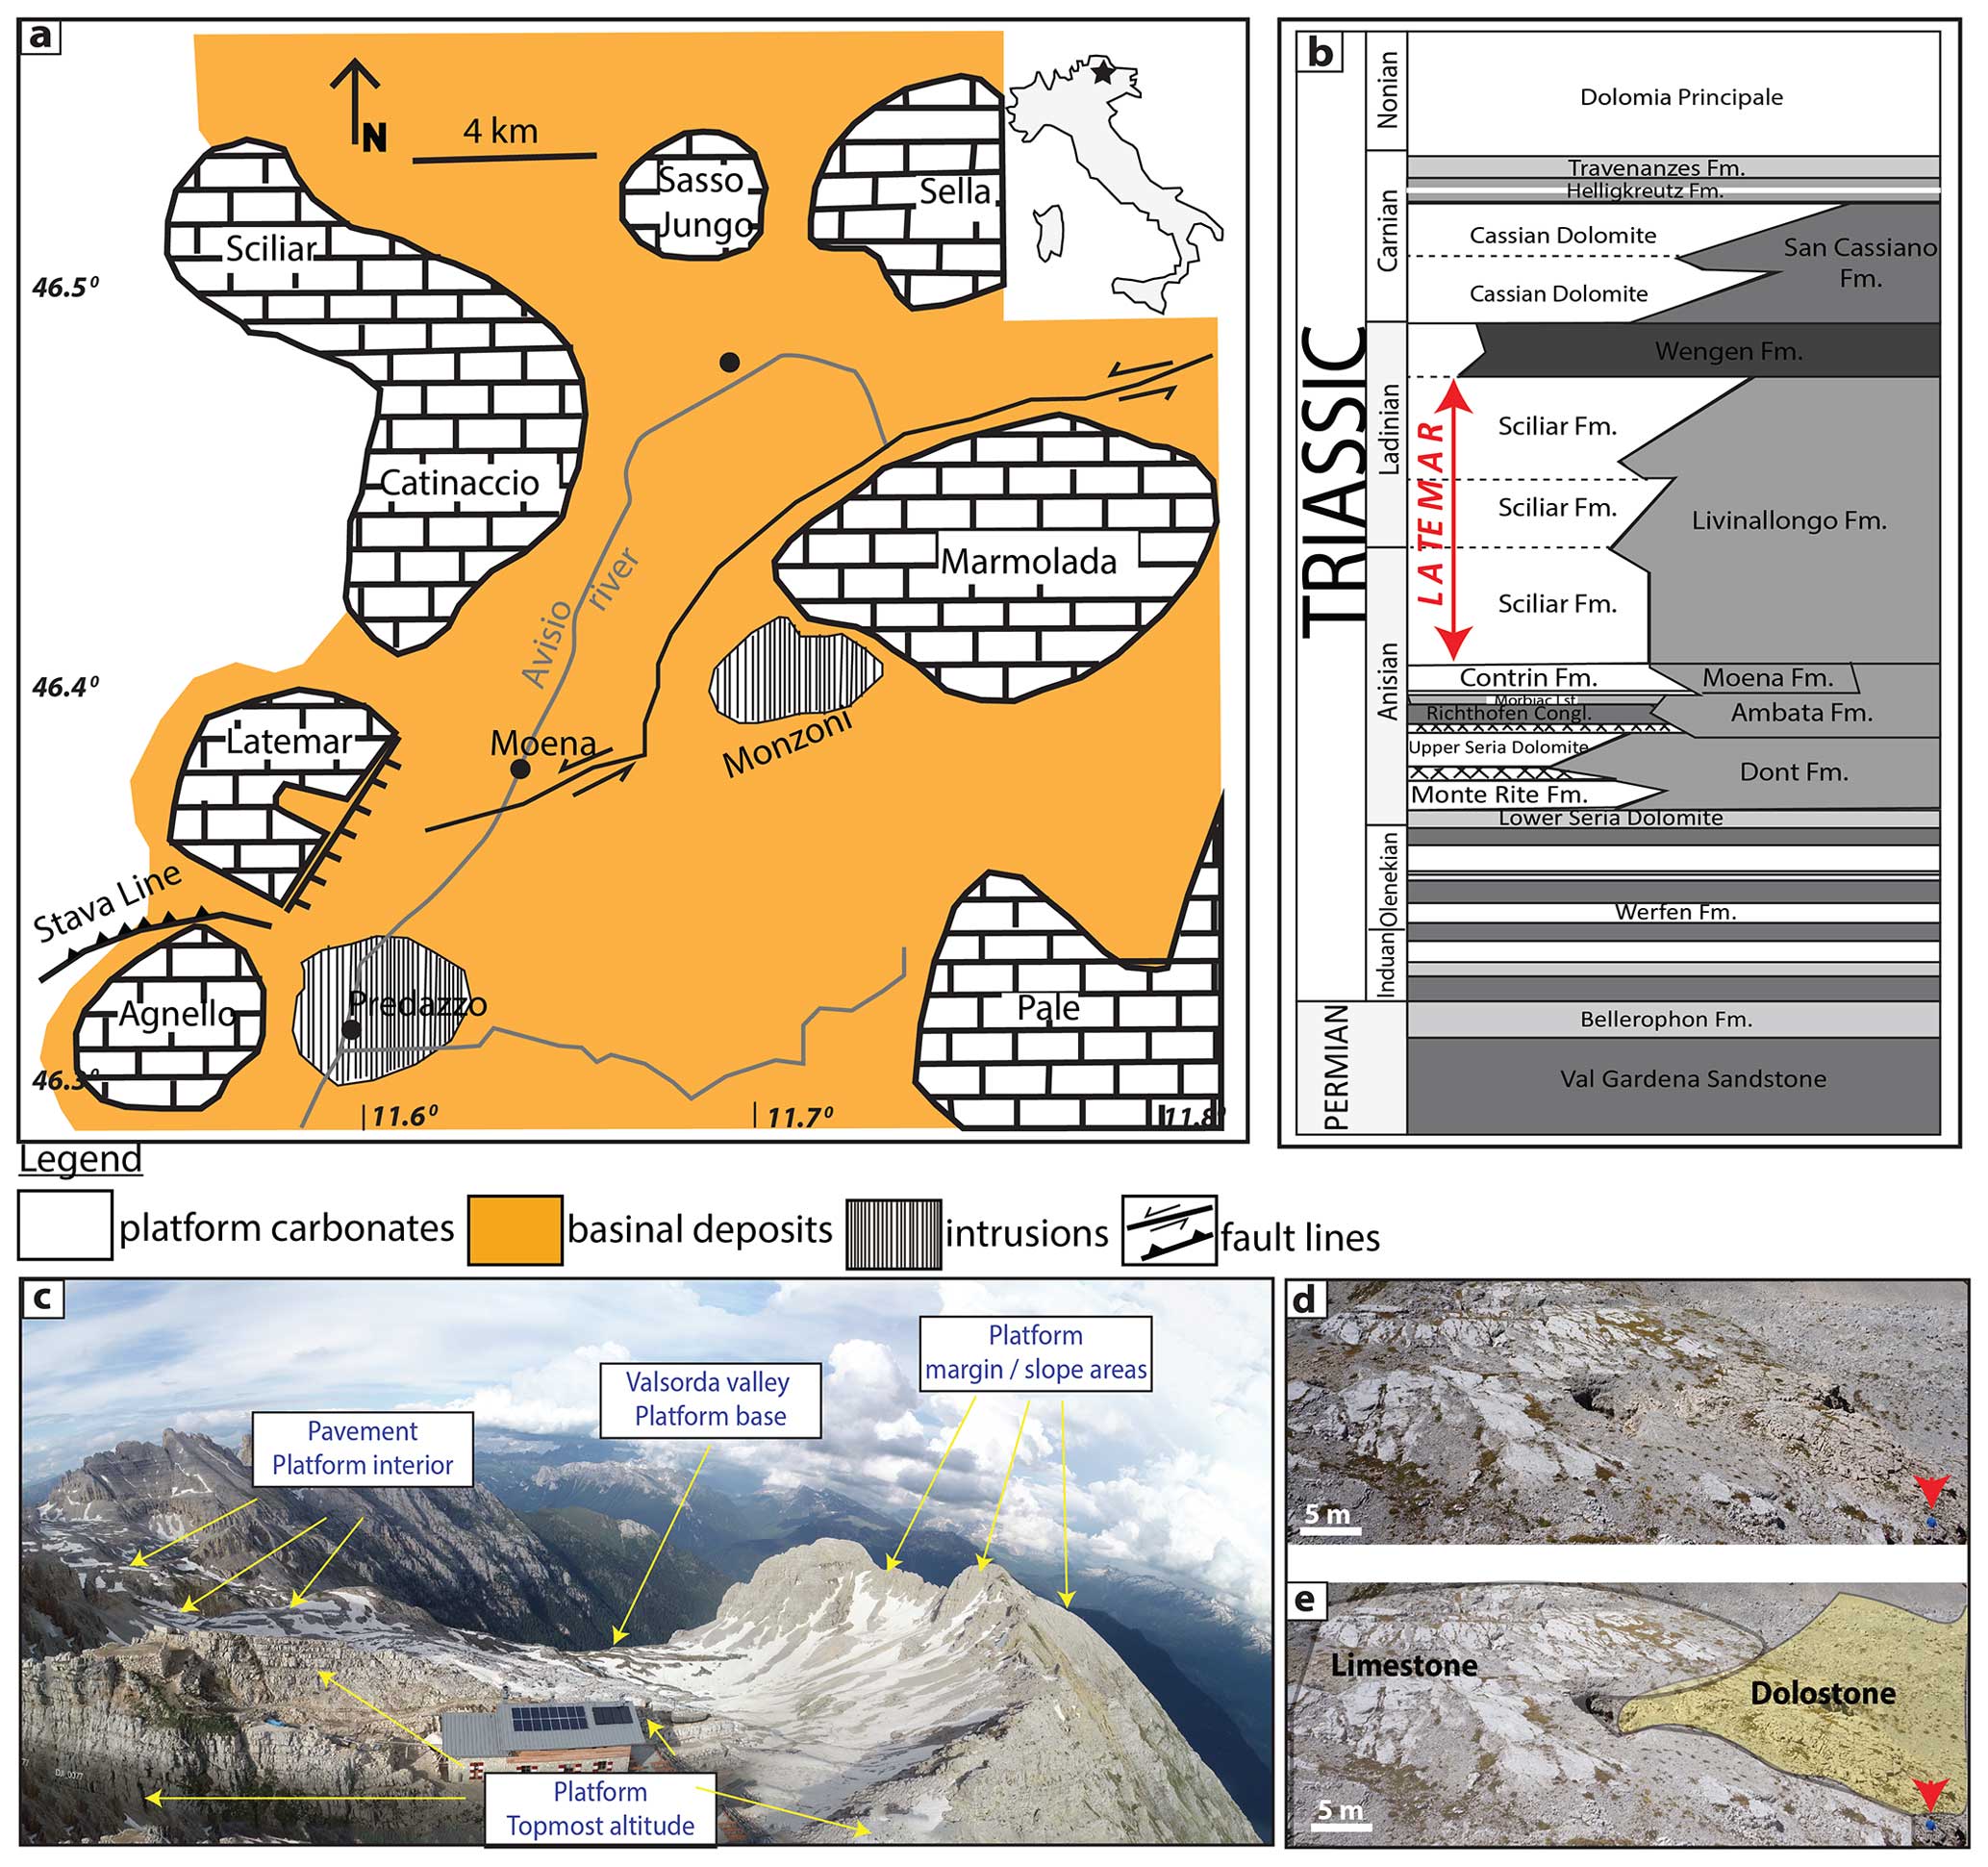
Figure 1(a) Overview of the Latemar and the neighbouring Ladinian carbonate buildups (or platforms) and upper Ladinian intrusions of the Dolomites (modified after Jacquemyn et al., 2014, 2015). (b) Simplified stratigraphic chart of the Dolomite Mountains, modified after Jacquemyn et al. (2014). (c) Drone image showing the general overview of the horseshoe shape of the Latemar buildups. The geometry and topology of the outcrops pointed out with arrows have been presented in Igbokwe et al. (2022). (d, e) Drone images acquired from the outcrop pavement at the platform interior. The red arrows show images of a person 2 m tall.
The Latemar has a maximum altitude of 2850 m, with high peaks exposing the platform margin, the slope, and the interior (Fig. 1c and d). While the preserved portions of the platform margin consist of reefal boundstones, microbial crust, and marine cement facies, the slope is characterized by massive breccia flows, including coarse and matrix-poor materials derived from the platform margin or platform interior (Egenhoff et al., 1999; Emmerich et al., 2005; Goldhammer and Harris, 1989; Harris, 1994; Marangon et al., 2011). The platform interior is arranged in decimetre- to metre-scale shallowing-upward cycles (Christ et al., 2012; Goldhammer et al., 1990), consisting of up to 750 m successions of subtidal and peritidal carbonate lagoonal deposits. The Latemar buildup was partly dolomitized due to fluid mobilization triggered by the Predazzo Volcanic–Plutonic Complex in the Middle Triassic. A recent review on the dolomitization and diagenesis of the Latemar buildup is given by Mueller et al. (2022).
The considered outcrop in the presented study area is a large, fractured pavement in the platform interior (Fig. 1c and d). The studied pavement (ca. 7.5×10² m2) consists of limestone and dolostone rock bodies, showing a gentle dip of less than 5° towards the north. Most structural features observed on the fractured pavements are fractures, veins, and stylolites, some of which are weathered.
Tectonic setting
The Latemar forms part of the southern Alps, part of the Mesozoic Adriatic plate, predominantly thrusting southward during the Alpine collision (e.g. Boro et al., 2013; Doglioni, 1988). Deposition in the Latemar began on a structural high (horst) generated by extensional tectonics, breaking up the widespread regional carbonate bank (Contrin Fm.). Subsequently, subsidence deformation and extensional synsedimentary tectonics controlled the geometry of the buildup, leading to faulting. Several fractures and/or faults crosscut the Latemar buildup, formed in conjugate pairs, and are related to deformation induced by Middle Triassic subsidence. Preto et al. (2011) documented the ENE–WSW and WNW–ESE faults linked to the Triassic trans-tensional regime as the oldest fault direction in the Latemar. The outcome is a buildup with a horseshoe shape and intraplatform basins (Fig. 1a and c; Preto et al., 2011). Dextral strike-slip reactivation, observed along magmatic dikes, reflects Neogene Alpine compressional tectonics in the Latemar.
Before the Neogene compressional tectonics, a regional magmatic–tectonic event in the late Ladininan to early Carnian triggered intense magmatic activity. These generated the intrusion of the Predazzo Volcanic–Plutonic Complex and Mt. Monzoni, which are associated with temporarily halting carbonate deposition at Latemar (Bellieni et al., 2010; Bosellini, 1984; Bosellini et al., 2003).
In the Latemar buildup, two principal far-field stresses affected the carbonate deposits, representing the two main phases of deformation, namely NW–SSE (Middle Triassic extensional or subsidence tectonics) and N–S (Alpine compressional tectonics) (Boro et al., 2013; Hardebol et al., 2015; Jacquemyn et al., 2015; Preto et al., 2011).
The methods applied in this study include a three-phase workflow: (i) fieldwork, including drone image acquisition and outcrop interpretation and digitization (Fig. 2a); (ii) meshing and geomechanical finite-element aperture modelling and calculations (Fig. 2b); and (iii) fluid flow modelling and effective permeability calculations for uncoupled hydromechanical conditions (Fig. 2c).

Figure 2Workflow for obtaining flow-base effective permeability using acquired drone images from outcropping fracture networks. (a) Drone imagery, photogrammetry (Phase 1.1), and (Phase 1.2) fracture interpretation and digitization (the illustration shown is a fracture substructure – FSS – with m dimension). (b) Simplifying and converting the interpreted fracture network geometry to element geometry (Phase 2.1) and then meshing, (Phase 2.2) local stress modelling, (Phase 2.21) loading and boundary conditions, and (Phase 2.3) geomechanical finite-element fracture aperture modelling and calculations. (c) Fluid flow modelling, considering “uncoupled” conditions (Phase 3.1) and (Phase 3.2) effective permeability calculations.
3.1 Field data and fracture network geometry
Field investigations of Latemar outcrops show widespread brittle deformation features with low-strain barren fractures and veins predominantly with subvertical dip as the dominant structure. These features, including bedding-parallel and bedding-perpendicular (tectonic) stylolites, were photographed, mapped, and structurally characterized within the exposed outcrop stations and, in general, are displayed as mode I and conjugate hybrid fractures.
By considering the prominent subvertical outcrops exposed at the base of the Latemar (in the Valsorda valley; Fig. 3) and subhorizontal (pavement) outcrops at the flat-topped Latemar buildup (Fig. 4), the arrangement orientations and the stress fields during the development of the fractures are documented. The stress state, constraining the deformation, is reconstructed from the fault-slip data, including the strike and dip of the fault plane, the orientation of the slip line, and the shear sense on the fault plane. This reconstruction is based on the assumption that the remote stress tensor is spatially uniform for the rock mass containing the faults and temporally constant over the history of faulting in the given region. The slip on each fault surface has the same direction and sense as the maximum shear stress resolved on that surface (Bott, 1959; Kaven et al., 2011). The inversion of these fault-slip data gives the principal stress axis parameters, σ1 (maximum compression), σ2 (intermediate compression), and σ3 (minimum compression; Delvaux and Sperner, 2003).

Figure 3Subvertical outcrops exposed at the base of the Latemar. Panels (a), (b), and (c) show a reverse conjugate fault with low-angle SSE- and ENE-dipping fractures and a horizontal intersection. In addition, panel (c2) shows reactivated stylolites, which acted as a fluid flow conduit. The stereoplots show bedding-perpendicular stylolites and σ1 striking approximately WSW–ENE and NW–SE to NNW–SSE, respectively.
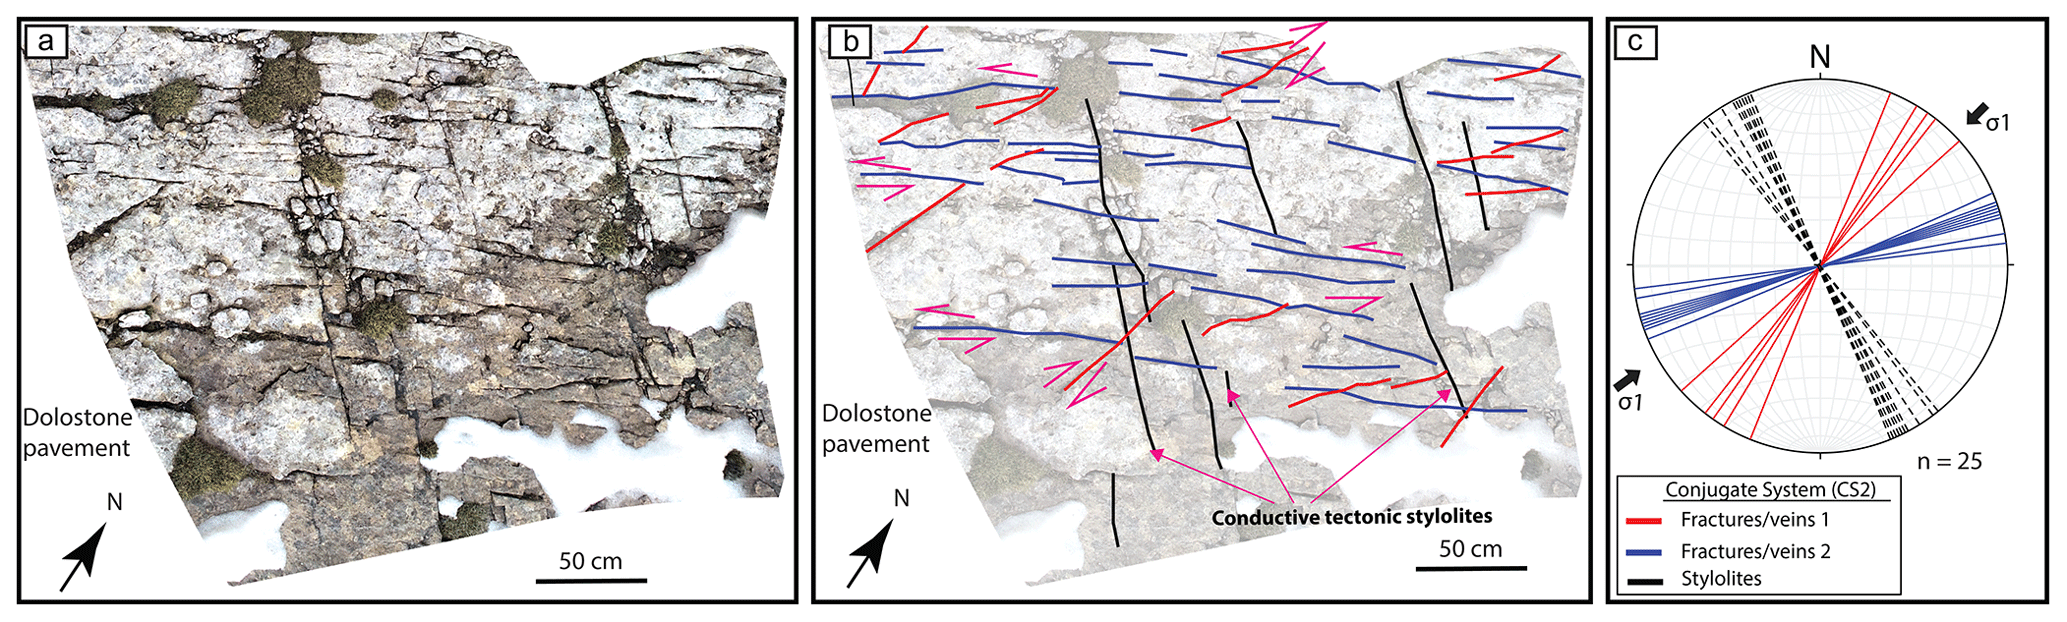
Figure 4Subhorizontal (pavement) outcrop exposed at the flat-topped Latemar. Panels (a) and (b) show high-resolution 2D outcrop orthorectified photographs and digitized (interpreted) fracture maps showing reactivated stylolites, which acted as a fluid flow conduit. (c) The stereoplots show σ1 striking approximately NW–SE to NNW–SSE.
In the Valsorda valley (Fig. 3), carbonate outcrops are affected by minor reverse conjugate faults dipping at a low angle (<30°) to bedding. These conjugate reverse faults strike between ca. 238° WSW–ENE and 250° SW–NE, accommodating low-angle SSE- and ENE-dipping fractures with a horizontal intersection. Their kinematic indicators and movements point to dip-slip motion. Besides the conjugate reverse fault, bedding-parallel and bedding-perpendicular stylolites were observed. The bedding-perpendicular stylolites are oriented primarily at ca. 230 to 250° NE–SW to ENE–WSW and strike perpendicular to the maximum subhorizontal stress. These stylolites, coupled with the orientation of low-angle conjugate reverse faults, determined an approximate NNW–SSE-trending subhorizontal σ1 stress (Fig. 3). Overall, the structural configurations documented in the Valsorda valley constrain the orientation of the principal stresses into subhorizontal σ1 (NNW–SSE) and σ2, as well as subvertical σ3.
On the other side, at the flat-topped Latemar, on the subhorizontal (pavement) outcrops, fractures also form conjugate patterns and, in most cases, exhibit dextral and sinistral displacements (Fig. 4). These fractures documented from the field and drone images highlight the NNW–SSE, NE–SW, and ENE–WSW orientations as the dominant fracture set and record an approximately NE–SW compression (Figs. 4 and 5b). The measured bedding-perpendicular stylolites show the primary orientation of WNW–ESE and strike perpendicular to the bisection planes of the observed conjugate systems (Fig. 4a and c). These bedding-perpendicular stylolites are treated as compressional stress field indicators, striking perpendicular to the maximum stress.
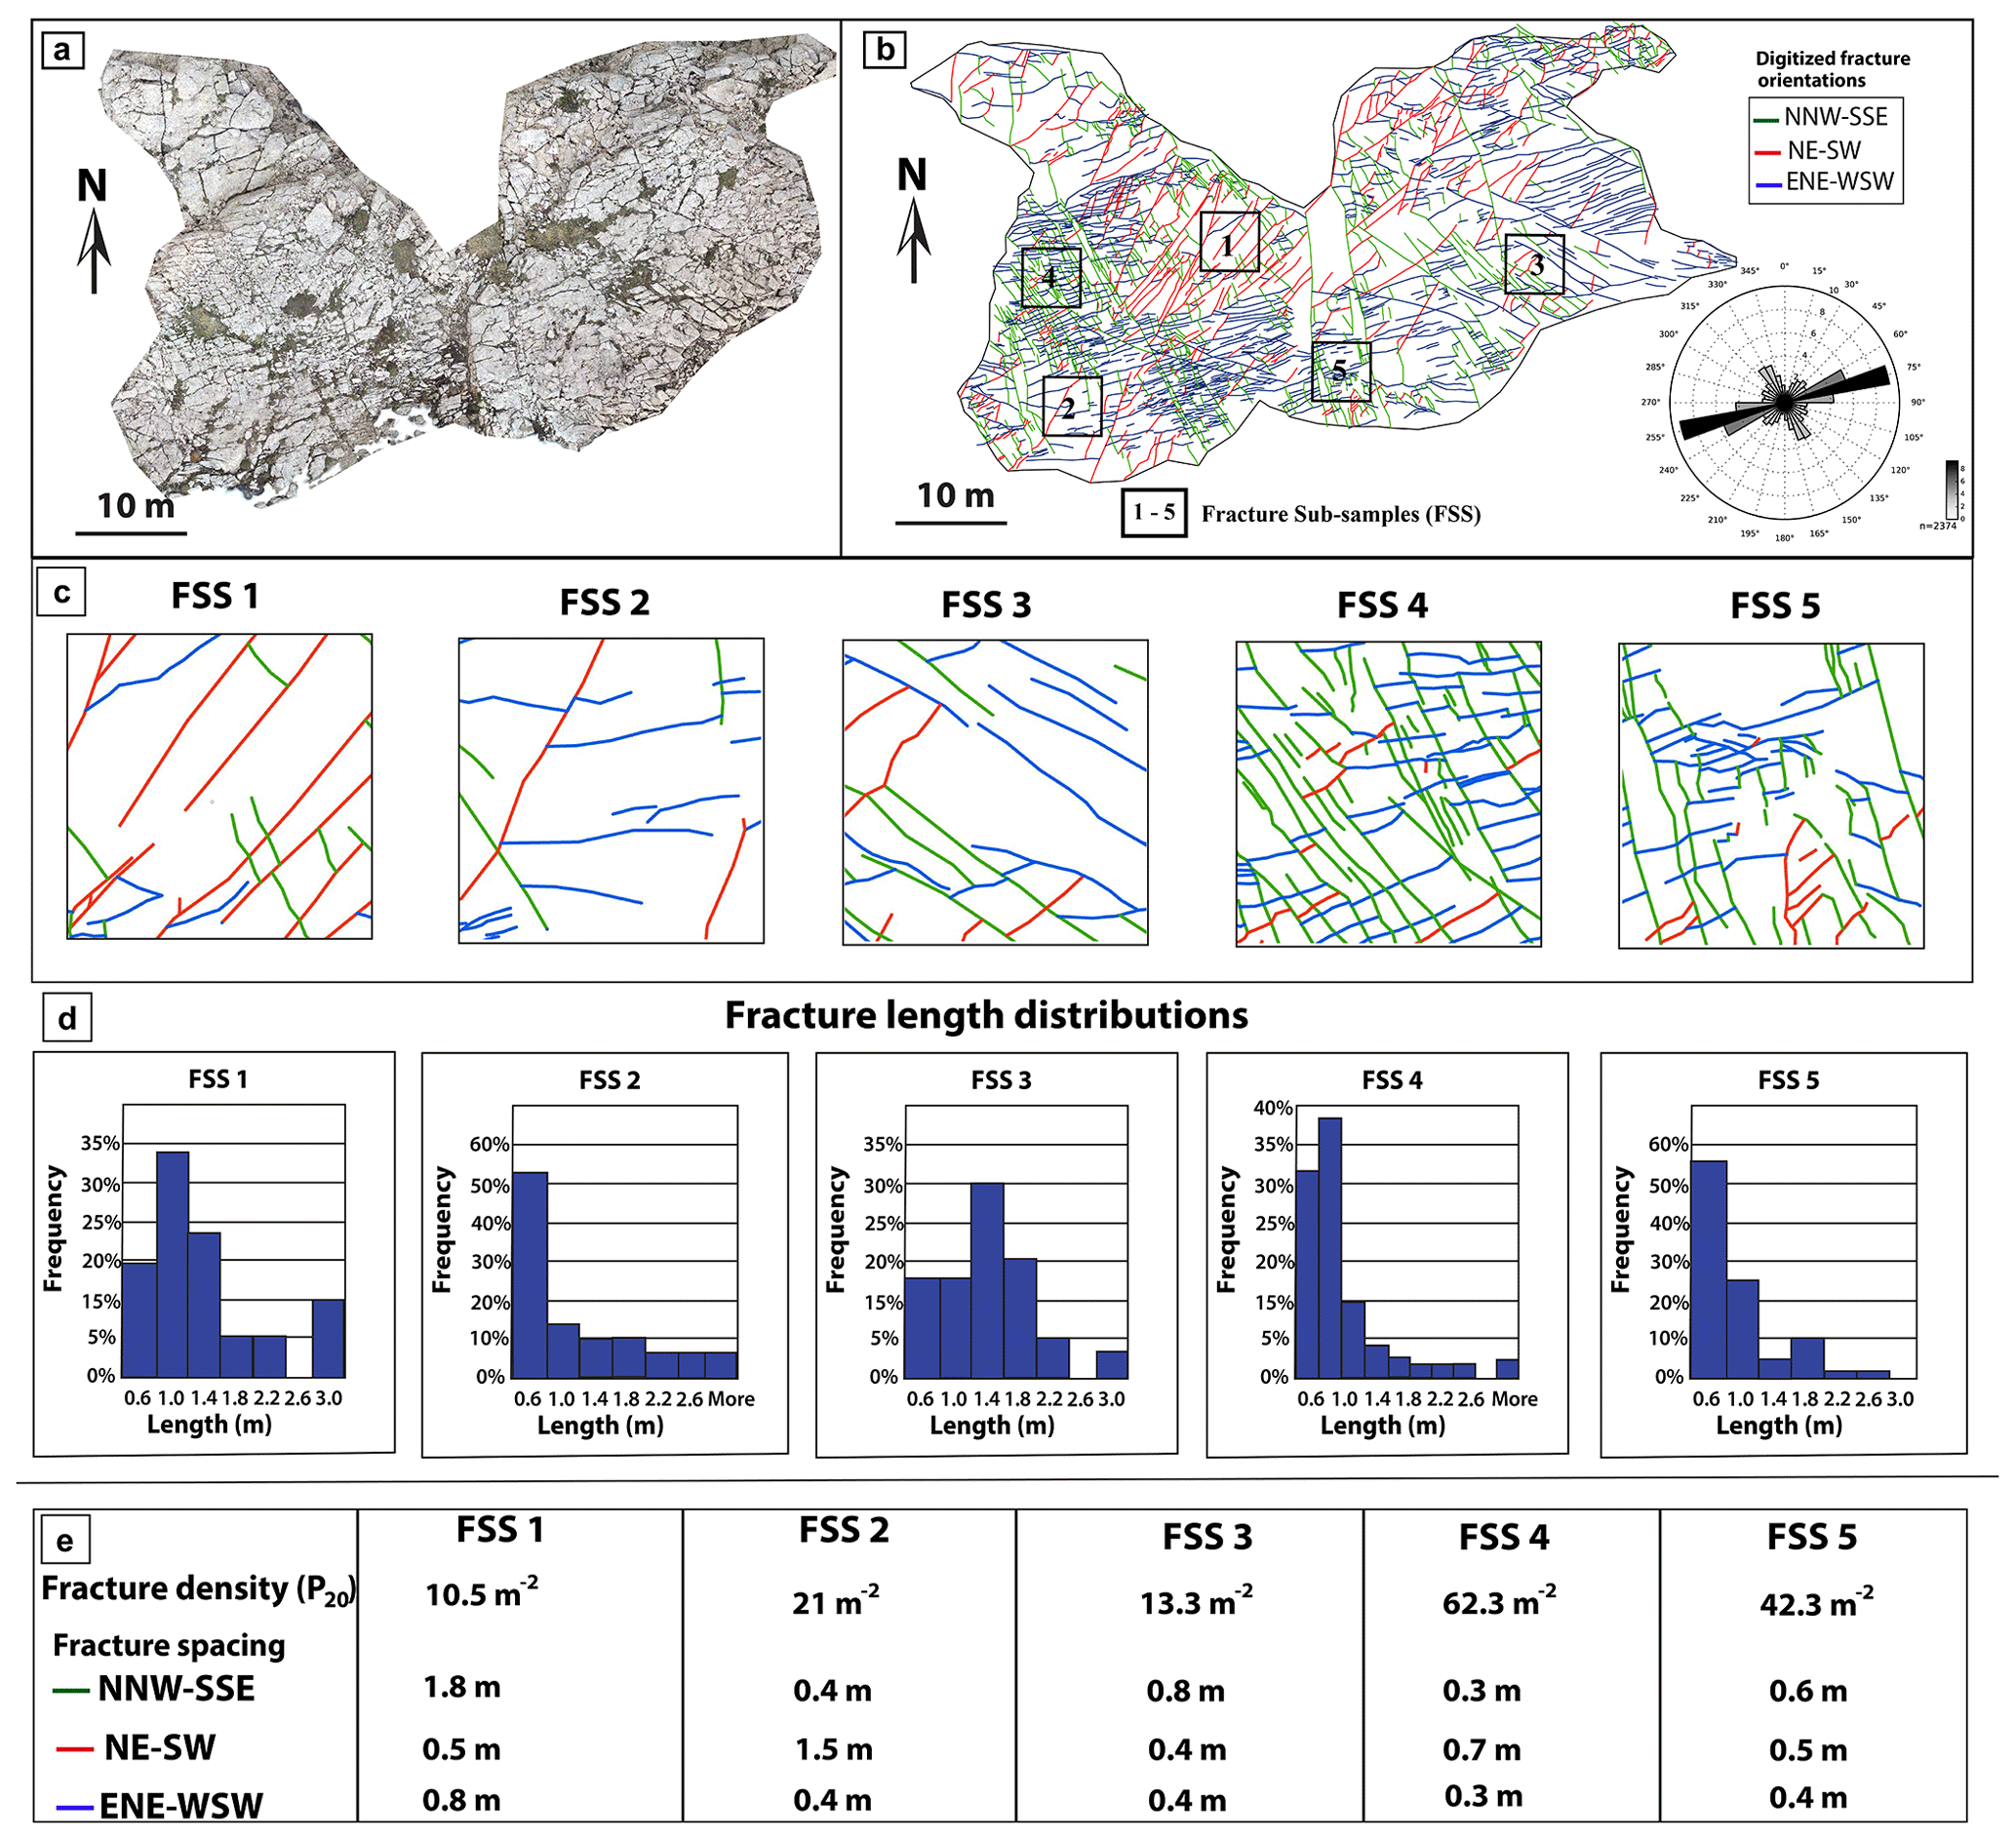
Figure 5Original outcrop model with interpreted fractures, from which the five FSSs were extracted. (a) High-resolution 2D outcrop orthorectified photograph. (b) Digitized subhorizontal (pavement) in the Latemar with the position of the five outcrop windows, including the stereoplot of more than 2000 fracture orientations. (c) The five fracture models. (d) Length distribution of the five fracture models. (e) Fracture geometry, including density and spacing values of the five outcrop models.
Lastly, three deformation phases with subhorizontal σ1 striking in different orientations were observed and documented in this field area: the reverse fault and strike-slip stress regimes with subhorizontal σ1 striking approximately NW–SE to NNW–SSE and NE–SW, respectively (Figs. 3 through 5), and a later compressive deformation stage with a stress regime showing N–S subhorizontal σ1. These stress regimes and orientations correlate well with the far-field subhorizontal σ1 observed for the Latemar mountains during the Middle to Late Triassic and Neogene times, representing the subsidence and Alpine deformation stages, respectively (Boro et al., 2013, 2014; Hardebol et al., 2015; Igbokwe et al., 2022). The orientations of these stress regimes, approximately NW–SE and N–S, were applied as the boundary loading directions defined in the modelling work presented here. The magnitudes of these stress regimes were assumed (i.e. idealistic; see Sect. 3.4 for the rationale) to describe the impact of stress on the permeability of the carbonate rocks. Also, during the modelling, we assumed that fractures did not grow, no new fractures were formed, and all fractures, including stylolites, could be re-used as fluid flow conduits. The observations in Figs. 3c and 4 show reactivated stylolites, which acted as a fluid flow conduit. We refer the reader to Igbokwe et al. (2022), another paper as part of this project, where fractures and the stylolites were analysed for their geometry, kinematics, and topology to delineate crosscutting relationships and the accompanying stress directions at the Latemar Carbonate Platform (northern Italy).
Outcrop acquisition and digitization
Fracture network patterns were acquired from the outcropping carbonate rocks, focussing on the subhorizontal pavements of the flat-topped Latemar interior (Figs. 4 and 5a). The acquired images were processed using Agisoft Metashape® and converted into georeferenced digital outcrop models using photogrammetry.
The observed fractures were interpreted and digitized using ArcGIS 10.5™ software, where fractures were traced and digitized with a polyline interpretation tool. Structural data such as length, orientation, and spacing were computed for each polyline. The high quality of the drone images allows interpretation of thousands of potential fractures. Over 2000 fractures were documented, albeit with limited sampling and truncation artefacts.
Within the 2D digitized fracture network of the subhorizontal outcrop, five representative fracture network areas, referred to as fracture substructures (or samples; FSSs), were selected and used to model stress heterogeneity and permeability. The dimensions of the individual FSSs are approximately 2×2 m. For each FSS, the fracture length distributions and frequencies were fetched from the digitized fractures and plotted in a histogram chart. The FSS areas are located in the same structural domain but display fracture networks with different spatial distributions. Further, fracture networks were commonly subvertical, splaying, curving, intersecting, and tipping adjacent to other fractures. Locally, the fractures are orthogonal and/or in a conjugate pattern with a small conjugate angle.
3.2 Deformation of the fractured rock
In the following, the equilibrium equation for modelling the deformation of the rock matrix and fractures is presented as follows:
where σ is the stress tensor and b is the body force vector.
In the 2D computational domain, the rock matrix is discretized with unstructured triangular elements. Using the linear elastic model, the deformation of the rock matrix is calculated. To capture the variation of the separation and slip of the fracture, a zero-thickness interface element is introduced to represent the displacement gap on the fracture (Fig. 6a).

Figure 6(a) Representation of a fractured rock using triangle elements and embedded zero-thickness interface elements in the solid model. (b) Calculation model of the effective permeability. Note: and represent fluid pressure, whereas q is the fluid flow rate.
Taking into account the closure and frictional behaviour of fractures, the contact condition is imposed on the fracture surfaces by satisfying the standard Karush–Kuhn–Tucker condition in the normal direction (Oliver et al., 2008) as follows:
where is the normal closure traction and [[un]] is the separated normal displacement of two nodes of the interface element, which could also be regarded as the aperture of the fracture.
When the fracture is in a closure condition and sufficient loading is acting in the tangential direction, the fracture may slip. The slip and stick conditions of the fracture are determined based on the classical Coulomb friction law (Oliver et al., 2008):
where is the tangential frictional traction and μ is the Coulomb friction coefficient.
Here, fractures are regarded as frictionless with the frictional coefficient equal to zero (Wei and De Bremaecker, 1995). f<0 implies that a stick situation governs the relative displacement between two contacting bodies and a slip situation between the two bodies in contact where the shear stress is restricted to the value satisfying f=0. The slip criterion dictates the dependency of the contact shear force on the contact normal force when the slip condition is satisfied.
3.3 Effective permeability of the fractured rock
The effective permeability keff for a fractured rock was estimated by conducting a single-phase flow simulation in two perpendicular directions using a computational homogenization (Leonhart et al., 2017) for an unperturbed and a perturbed fracture state in uncoupled hydromechanics processes. The permeability tensors of the deformed carbonates were obtained as
and are fluid pressure (). q is the fluid flow rate through the fractured rock. m is the number of Gauss points. L is the length of the domain of the numerical model. The dynamic viscosity is MPa s−1. When the pressures and are applied at the left and right boundaries and zero fluid flow conditions ( are applied at the top and bottom boundaries, the keff in the x direction (Fig. 6b) is expressed as kxx and the keff in the y direction as kxy. In contrast, when and are applied at the top and bottom boundaries and zero fluid flow conditions () are applied at the left and right boundaries, keff in the y direction is considered to be kyy.
The fluid flow is assumed to be in a steady-state condition for calculating the effective permeability. The flow in fractures and the rock matrix are both considered. To simulate and model the fluid flow, the unified pipe-interface-element model proposed by Yan et al. (2021) and Yan and Yu (2022) and Darcy's law were employed (Fig. 7), respectively. For a steady saturated incompressible fluid flow, the mass conservation equation in each node is expressed as (Ren et al., 2017)
Here, the subscript Ni denotes the number of pipes connecting to the node.
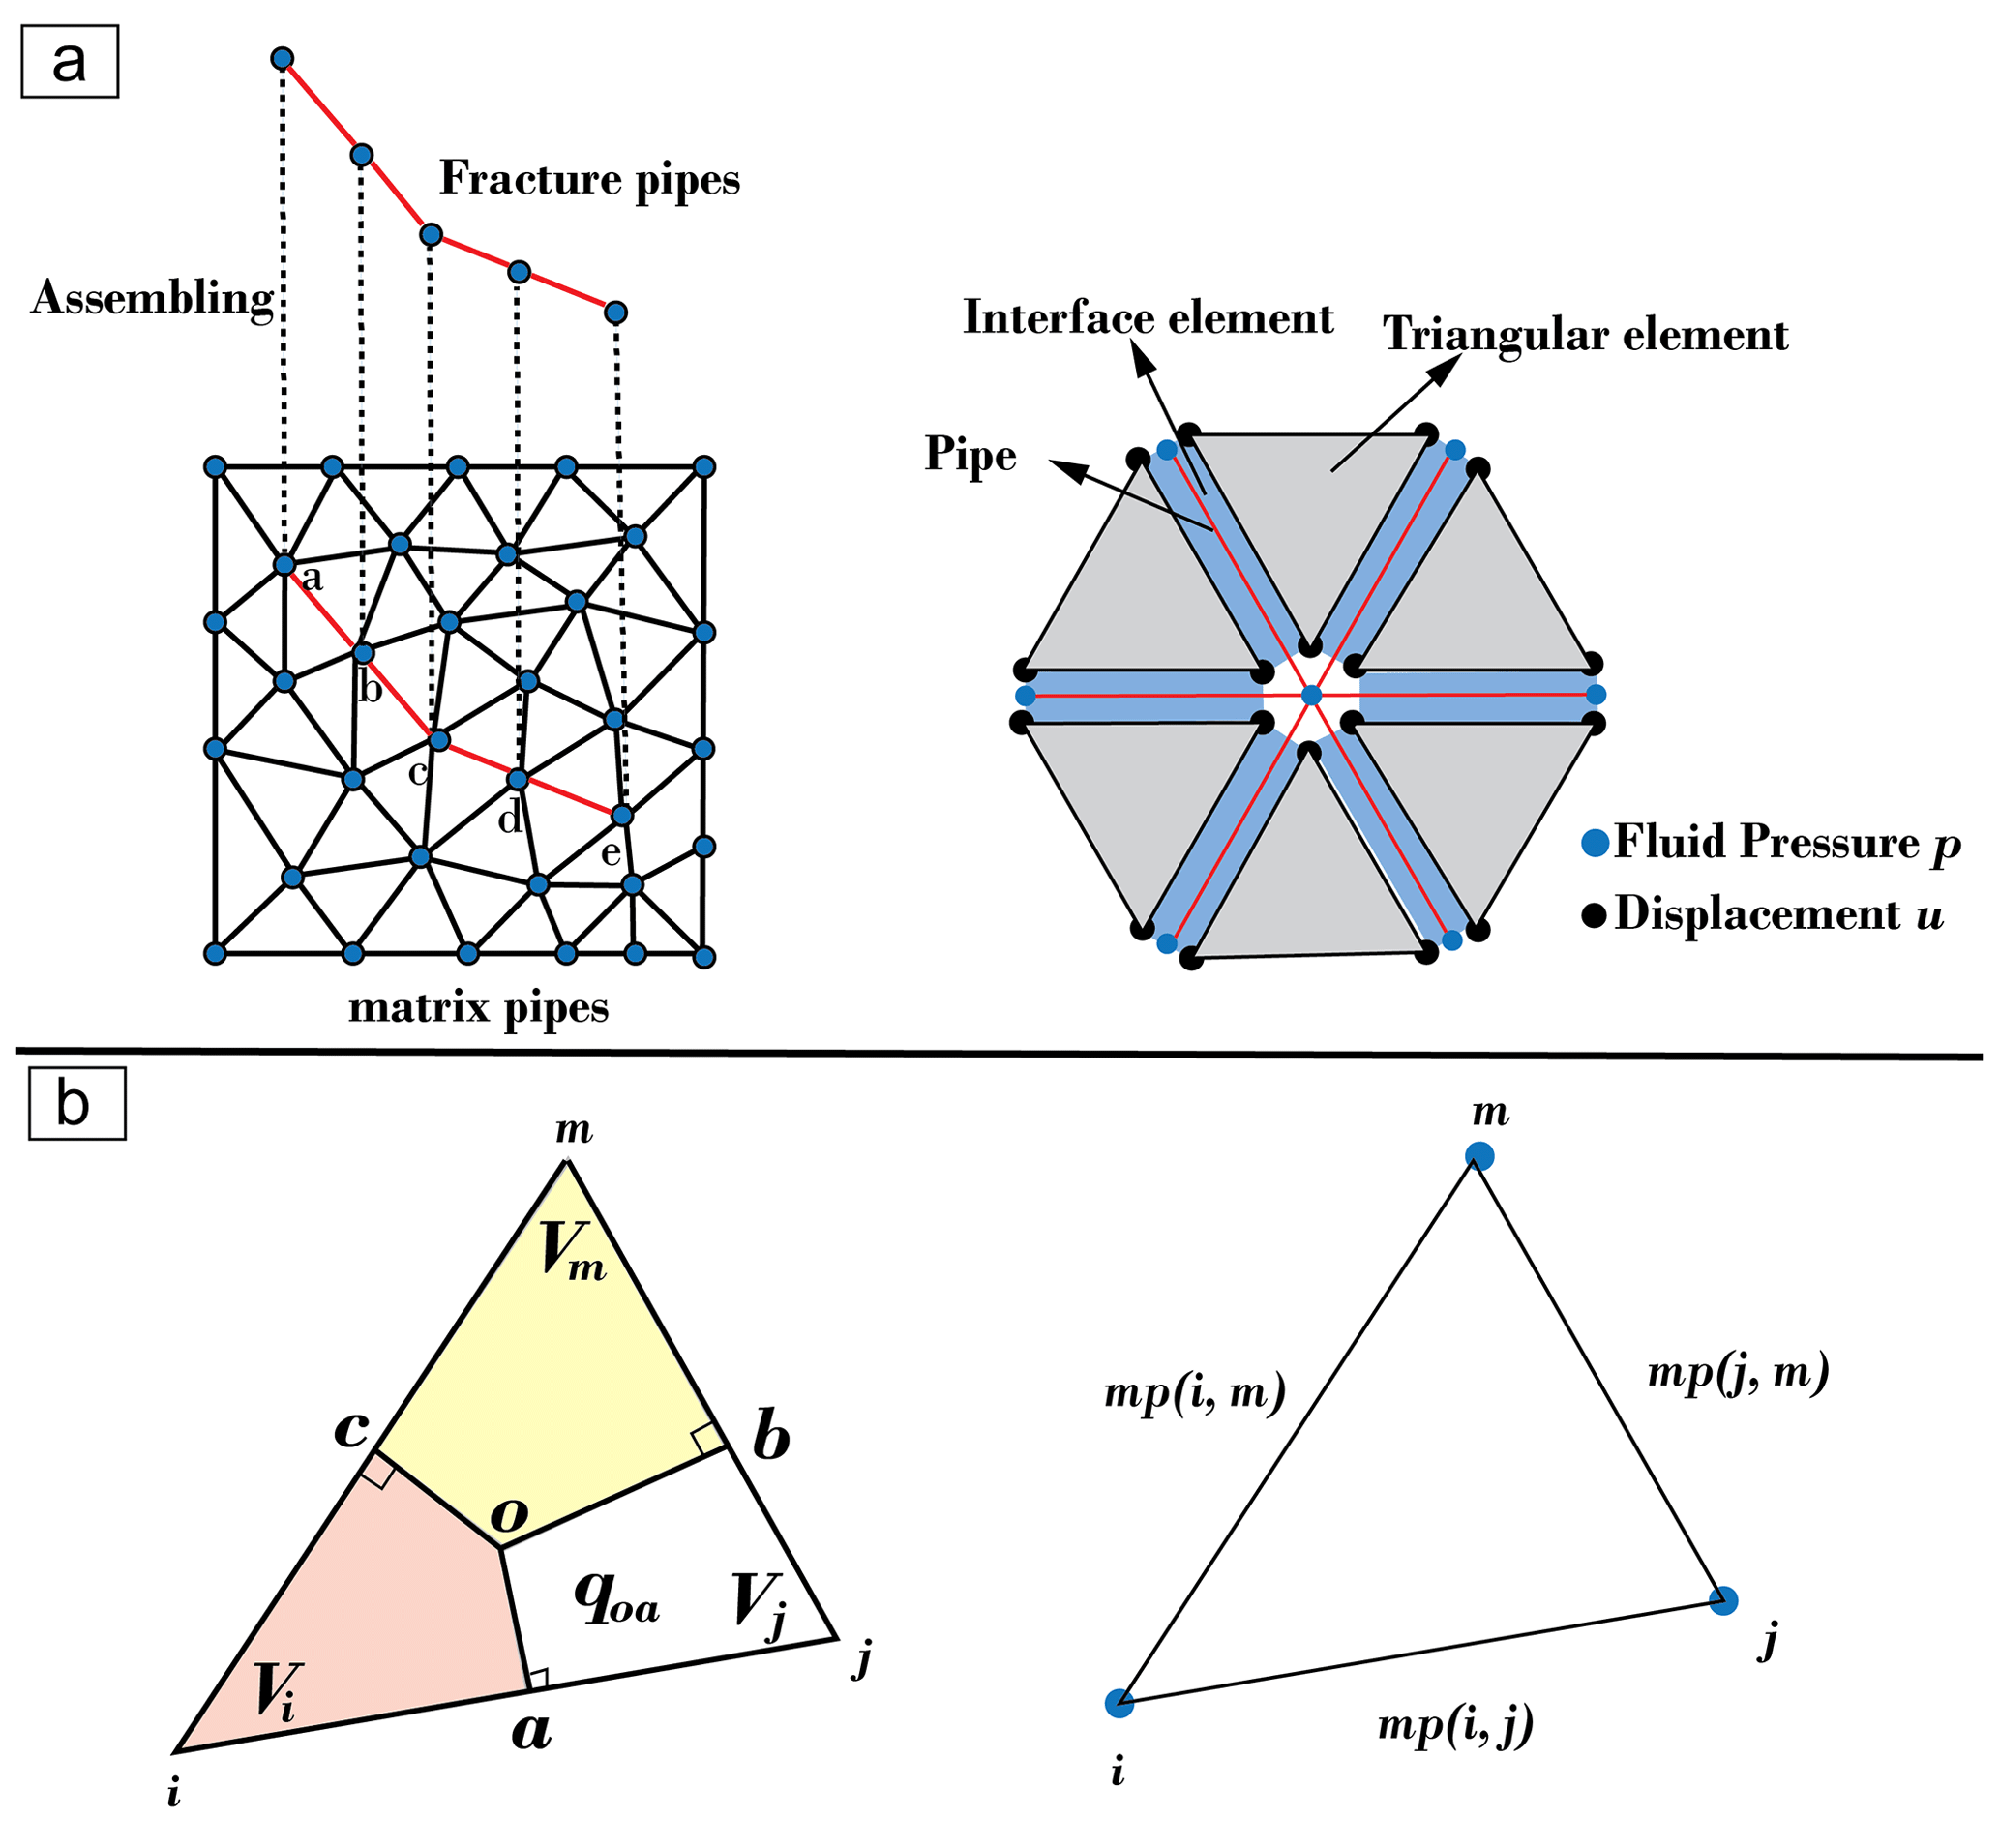
Figure 7(a) Scheme of matrix pipes for fluid flow; 2D computational model discretized with three-node triangular elements and six-node interface elements (points a–e are node nomenclature). (b) Pipe equivalence of rock matrix and fracture.
is the source term of the node i, and K is the conductance coefficient of the pipe. The detailed derivation of the conductance coefficient for fracture pipe and rock matrix pipe can be found in Yan et al. (2020).
For the fracture with an aperture [[un]], the conductance coefficient Kfp(i,j) could be calculated as
where lij is the length of the fracture segments.
As shown in Fig. 7a and b, each line between two nodes represents a pipe approximating the fluid flow through the rock matrix. The circumcentre of the triangle is used to derive the parameters of pipes forming a triangular mesh. The line linking the circumcentre and the mid-point of each edge is perpendicular to the edge, and these perpendicular bisectors divide the triangle into three parts. The matrix pipe ij represents the fluid transfer between domain and domain through their common face oa, and its flow rate is denoted as qoa. By making the flow rate qij in pipe mp(i,j) equivalent to the flow rate in the matrix qoa, the conductance coefficient Kmp(i,j) could be calculated as
We have adopted the matrix permeability value of m2 in Whitaker et al. (2014) drawn from the forward-coupled modelling of the sedimentary and diagenetic evolution in the Latemar carbonate buildup. We acknowledge that in some places, due to diverse (diagenetic) alterations (dissolution/precipitation), the matrix permeability of different lithologies of carbonate rocks can be very high, reaching up to 5 D, as noted in the simulated permeability values in some carbonate lithologies in Latemar (Whitaker et al., 2014). Also, previous studies in Latemar recorded matrix permeability in the Latemar margin and interior of the order of 1–30 mD for low-permeability end-members and up to 300 mD for high-permeability members (Whitaker et al., 2014; Hardebol et al., 2015). But, because carbonate rocks, in general, have very low matrix permeability with average values ranging from 1 to m2 (Hardebol et al., 2015), we have constrained our values to 2 mD, which is only an indicative approximation, meaning that changing the matrix permeability value will impact the final result. However, such a sensitivity analysis is beyond the scope of this study.
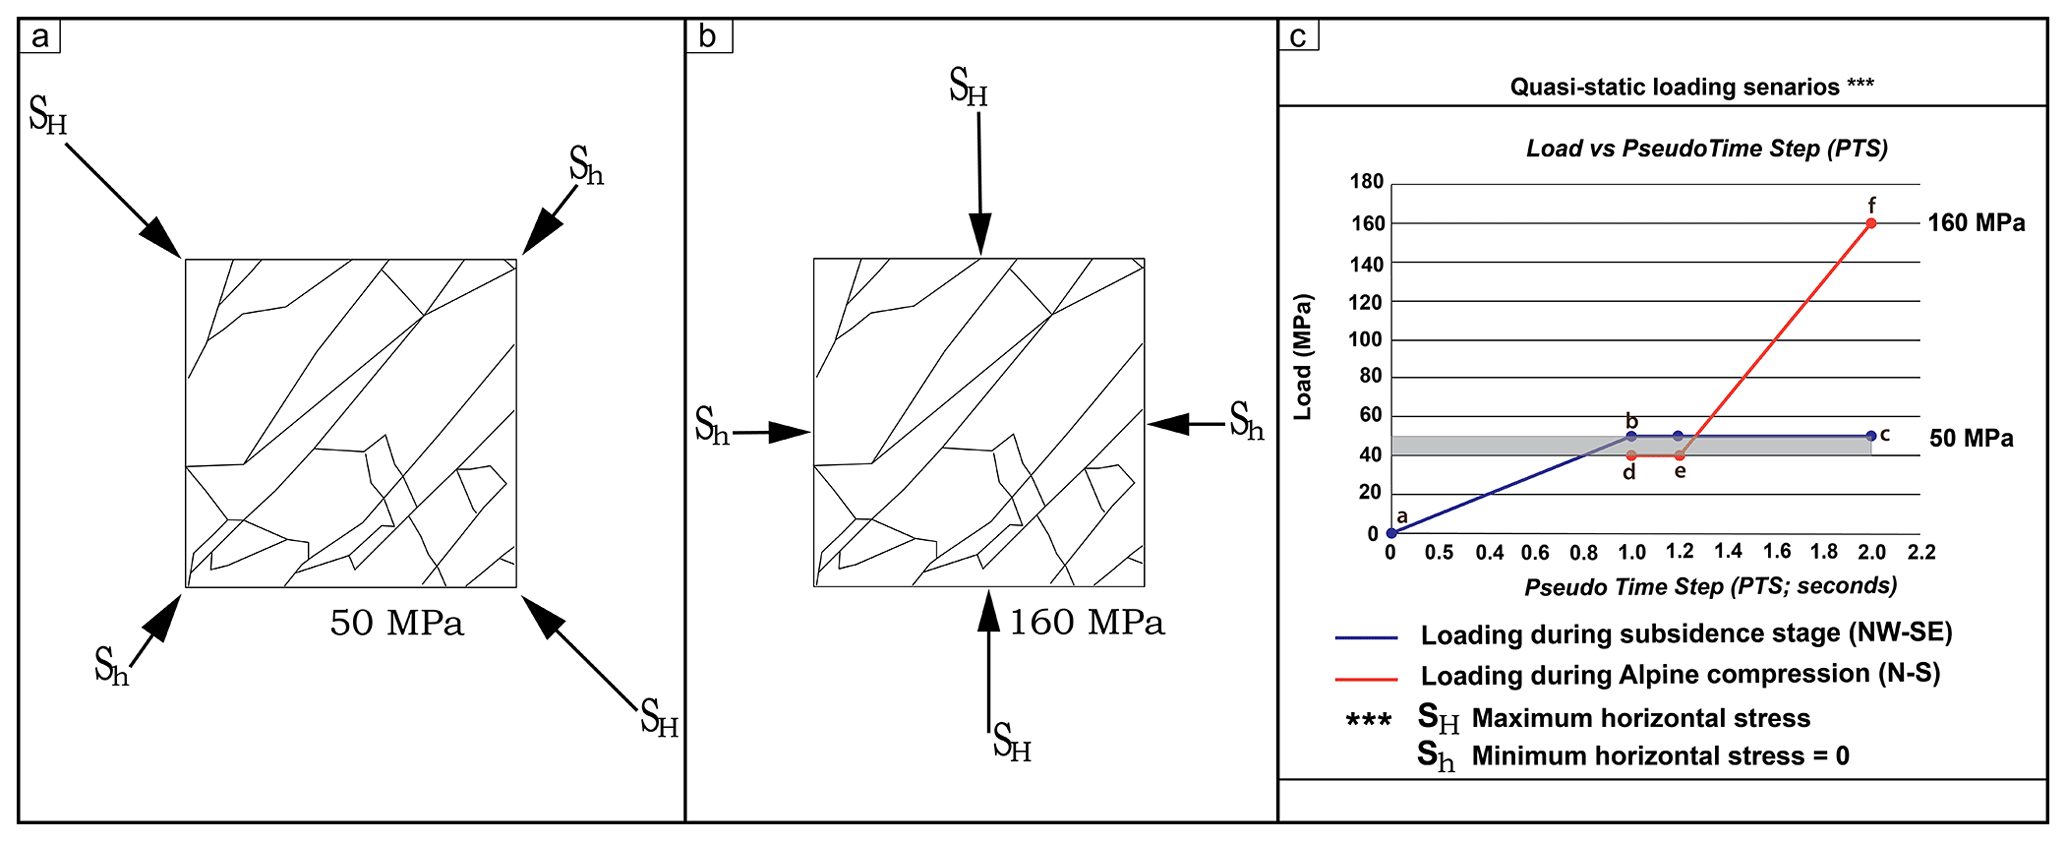
Figure 8Quasi-static loading scenarios of the two tectonic stresses. (a) The first stage loading reflects the subsidence deformation stress from the NW–SE direction and has a maximum load of 50 MPa. (b) The second stage loading, representing the Alpine deformation stress from the N–S direction, is applied (added), while the loading of 50 MPa is maintained until a maximum of 160 MPa is reached. (c) The plot of loads increased in discrete pseudo-time steps (PTSs). The first stage loading of 50 MPa corresponds to line a–b–c (blue curve), whereas the second stage loading of 160 MPa corresponds to line d–e–f (orange curve). The grey bar indicates that some stresses during the first loading were still active and became more significant during the second loading scenario.
3.4 Boundary conditions
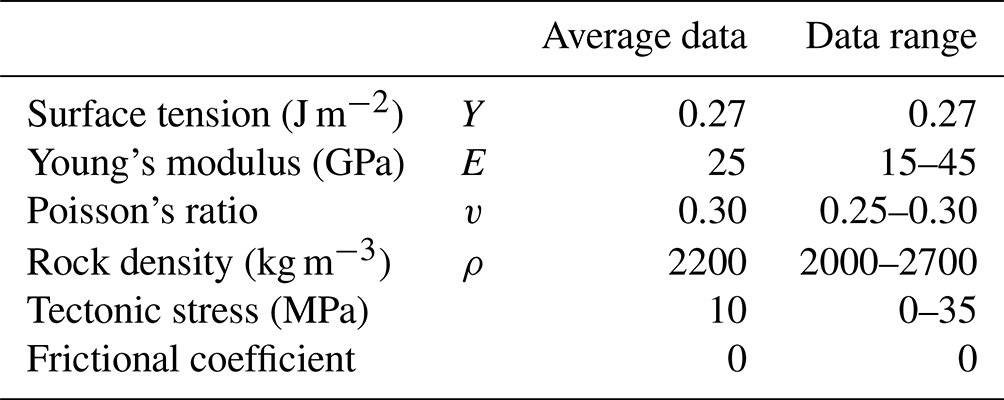
The boundary conditions are defined by two stages of far-field subhorizontal σ1 (stress) loading scenarios (Fig. 8) assumed to have acted on the studied carbonates forming the Latemar buildup during the subsidence-related and Alpine deformation stages. These tectonic episodes are constrained to the NW–SE and N–S shortening (compressive) directions, which is parallel to the current-day stress orientation that has been estimated from seismic and active fault data in Italy and the central Mediterranean (Pierdominic and Heidbach, 2012; Heidbach et al., 2018). The applied differential stresses are set at 50 MPa (SH=50 MPa, Sh=0 MPa; maximum magnitude) for the subsidence-related deformation stage in the NW–SE direction and 160 MPa (SH=160 MPa, Sh=0 MPa; maximum magnitude) for the Alpine deformation stage in the N–S direction. These values are close in range to the magnitude values for modelling compressive settings in carbonate platforms within similar geodynamic settings (e.g. Boresma et al. 2019). Further, we implement Poisson's ratio (v) of 0.30 and Young's modulus (E) of 25 GPa (see Table 1 for detailed parameters). These values are achievable for carbonate rocks under subsurface conditions (Bertotti et al., 2017). It should be noted that the influence of the overburden stresses was not taken into account, as the numerical modelling is in 2D, thus limiting the ability to consider the impact of lateral expansion on the fracture domain. In addition, the applied current-day stress orientation could be different to the palaeostress field during the formation of most parts of the Latemar platform. Therefore, we acknowledge that changing the applied stress directions and magnitudes will alter the modelled apertures and the final calculation of the effective permeability. Nevertheless, such a sensitivity analysis is outside the purview of this study.
Table 1Essential model parameters applied for stress calculations. Adapted from Bertotti et al. (2017).
KRATOS, open-source multi-physic finite-element software (Dadvand et al., 2013), was used to conduct the 2D linear elastic mechanical modelling by applying loads and/or displacement boundary conditions to the models (Fig. 2b; Phase 2.2). Due to the highly nonlinear behaviour of the fracture model, a linear elastic 2D plane-strain constitutive model was used for the rock matrix to keep simplicity in the simulation. A 2D plane-strain linear elastic isotropic matrix was assumed and used to treat all modelled fracture planes equally, especially on the z axis.
The stress distributions were analysed using triangular and interface elements corresponding to the rock matrix and fractures. The effects of the far-field stresses on the overall model and the relative displacement of the deformed and undeformed element geometries were stimulated. Given that all the representative FSSs are subhorizontal, the origin of the x and y axis is placed at the plane's centre. In other words, the centre of the FSS is to be fixed in both the x and the y axis so that translation and rotation are prevented. The loads are applied on the outer boundaries of FSS, as shown in Figs. 2 and 8.
The loading of the first tectonic episode, subsidence deformation, represented as first-stage loading, was applied from the NW–SE direction. This loading was increased in load steps, representing pseudo-time steps (PTSs), analogues to quasi-static loading, until a maximum magnitude of 50 MPa was reached at PTS 1 (Fig. 8a and c). After that, the loading of the second tectonic stage, Alpine compression, known as second-stage loading, was added (or applied) from the N–S direction, while the compressive loading corresponding to the first stage was active and/or maintained at 50 MPa. Analogous to stage 1 loading, the load values were increased in loading steps until a maximum value of 160 MPa in PTS 2 was attained (Figs. 2b and 8; Phase 2.2.1). Lines a–b–c (blue curve) and d–e–f (orange curve) depict these loading stages, and the grey bar in the graph of the load (MPa) in pseudo-time steps (Fig. 8c) represents the transition zone between the two loading scenarios. These applied boundary loadings are analogous to in situ stresses.
The essential model parameters are listed in Table 1. The modelled local state stresses and slips were used to calculate the local stress-induced aperture and their distributions, even as individual fractures open differently.
Figure 2 depicts the workflow used to model the aperture and permeability distributions through an outcropping network of fractures. Extracting five selected outcrops (e.g. FSS 1–FSS 5) from the fractured pavement, the outcrop models developed demonstrate in more detail the impact of the mechanical deformation (loading), change in stress regimes, and fracture geometry on modelled aperture and effective permeability. In addition, the flow anisotropy function is evaluated in response to the loading scenarios and orientation.
Figure 5b shows embedded five representative FSSs, each containing sufficient fracture heterogeneities to provide a representative value for properties such as fracture densities, spacing, and connectivity. Geometrical analysis of the outcrops indicates a varied average fracture length and density among the FSSs. For example, the average length of the selected FSS ranged from 0.5 to 3.5 m, whereas fracture density (P20) was comparable in FSS 1, FSS 2, and FSS 3 (10.5, 21, 13.3 m−2) but dissimilar in FSS 4 and FSS 5 (62.3 and 42.5 m−2; Fig. 5d, and e). The average fracture spacing (in each FSS) for each fracture orientation ranges between 0.7, 0.72, and 0.4 m for NNW–SSE, NE–SW, and ENE–WSW, respectively (Fig. 5e). The dihedral angles between the different fracture orientations measure between 18 and 60°.
4.1 Stress orientation effects and aperture distributions
The local distributions of stresses and the computed aperture distributions from the local state of stress are presented. The effects of changing stress regimes, from NW–SE- and N–S-directed stress cases, for each FSS domain are shown in Fig. 9, demonstrating the distributions of von Mises stress in all the FSSs due to applied loading conditions. At the onset of the subsidence stage, a uniform distribution of the local stress state at PTS 0.01 is observed. This uniform distribution of local stress increases gradually in discrete steps until PTS 1 is reached. At PTS 2 (Alpine deformation stage), the increasing loading in the N–S direction shows the dispersion of the uniform stress distribution with noticeable fluctuations in magnitudes, pointing to the varied change in the local state of stress caused by the heterogeneity of fractures (Fig. 9).
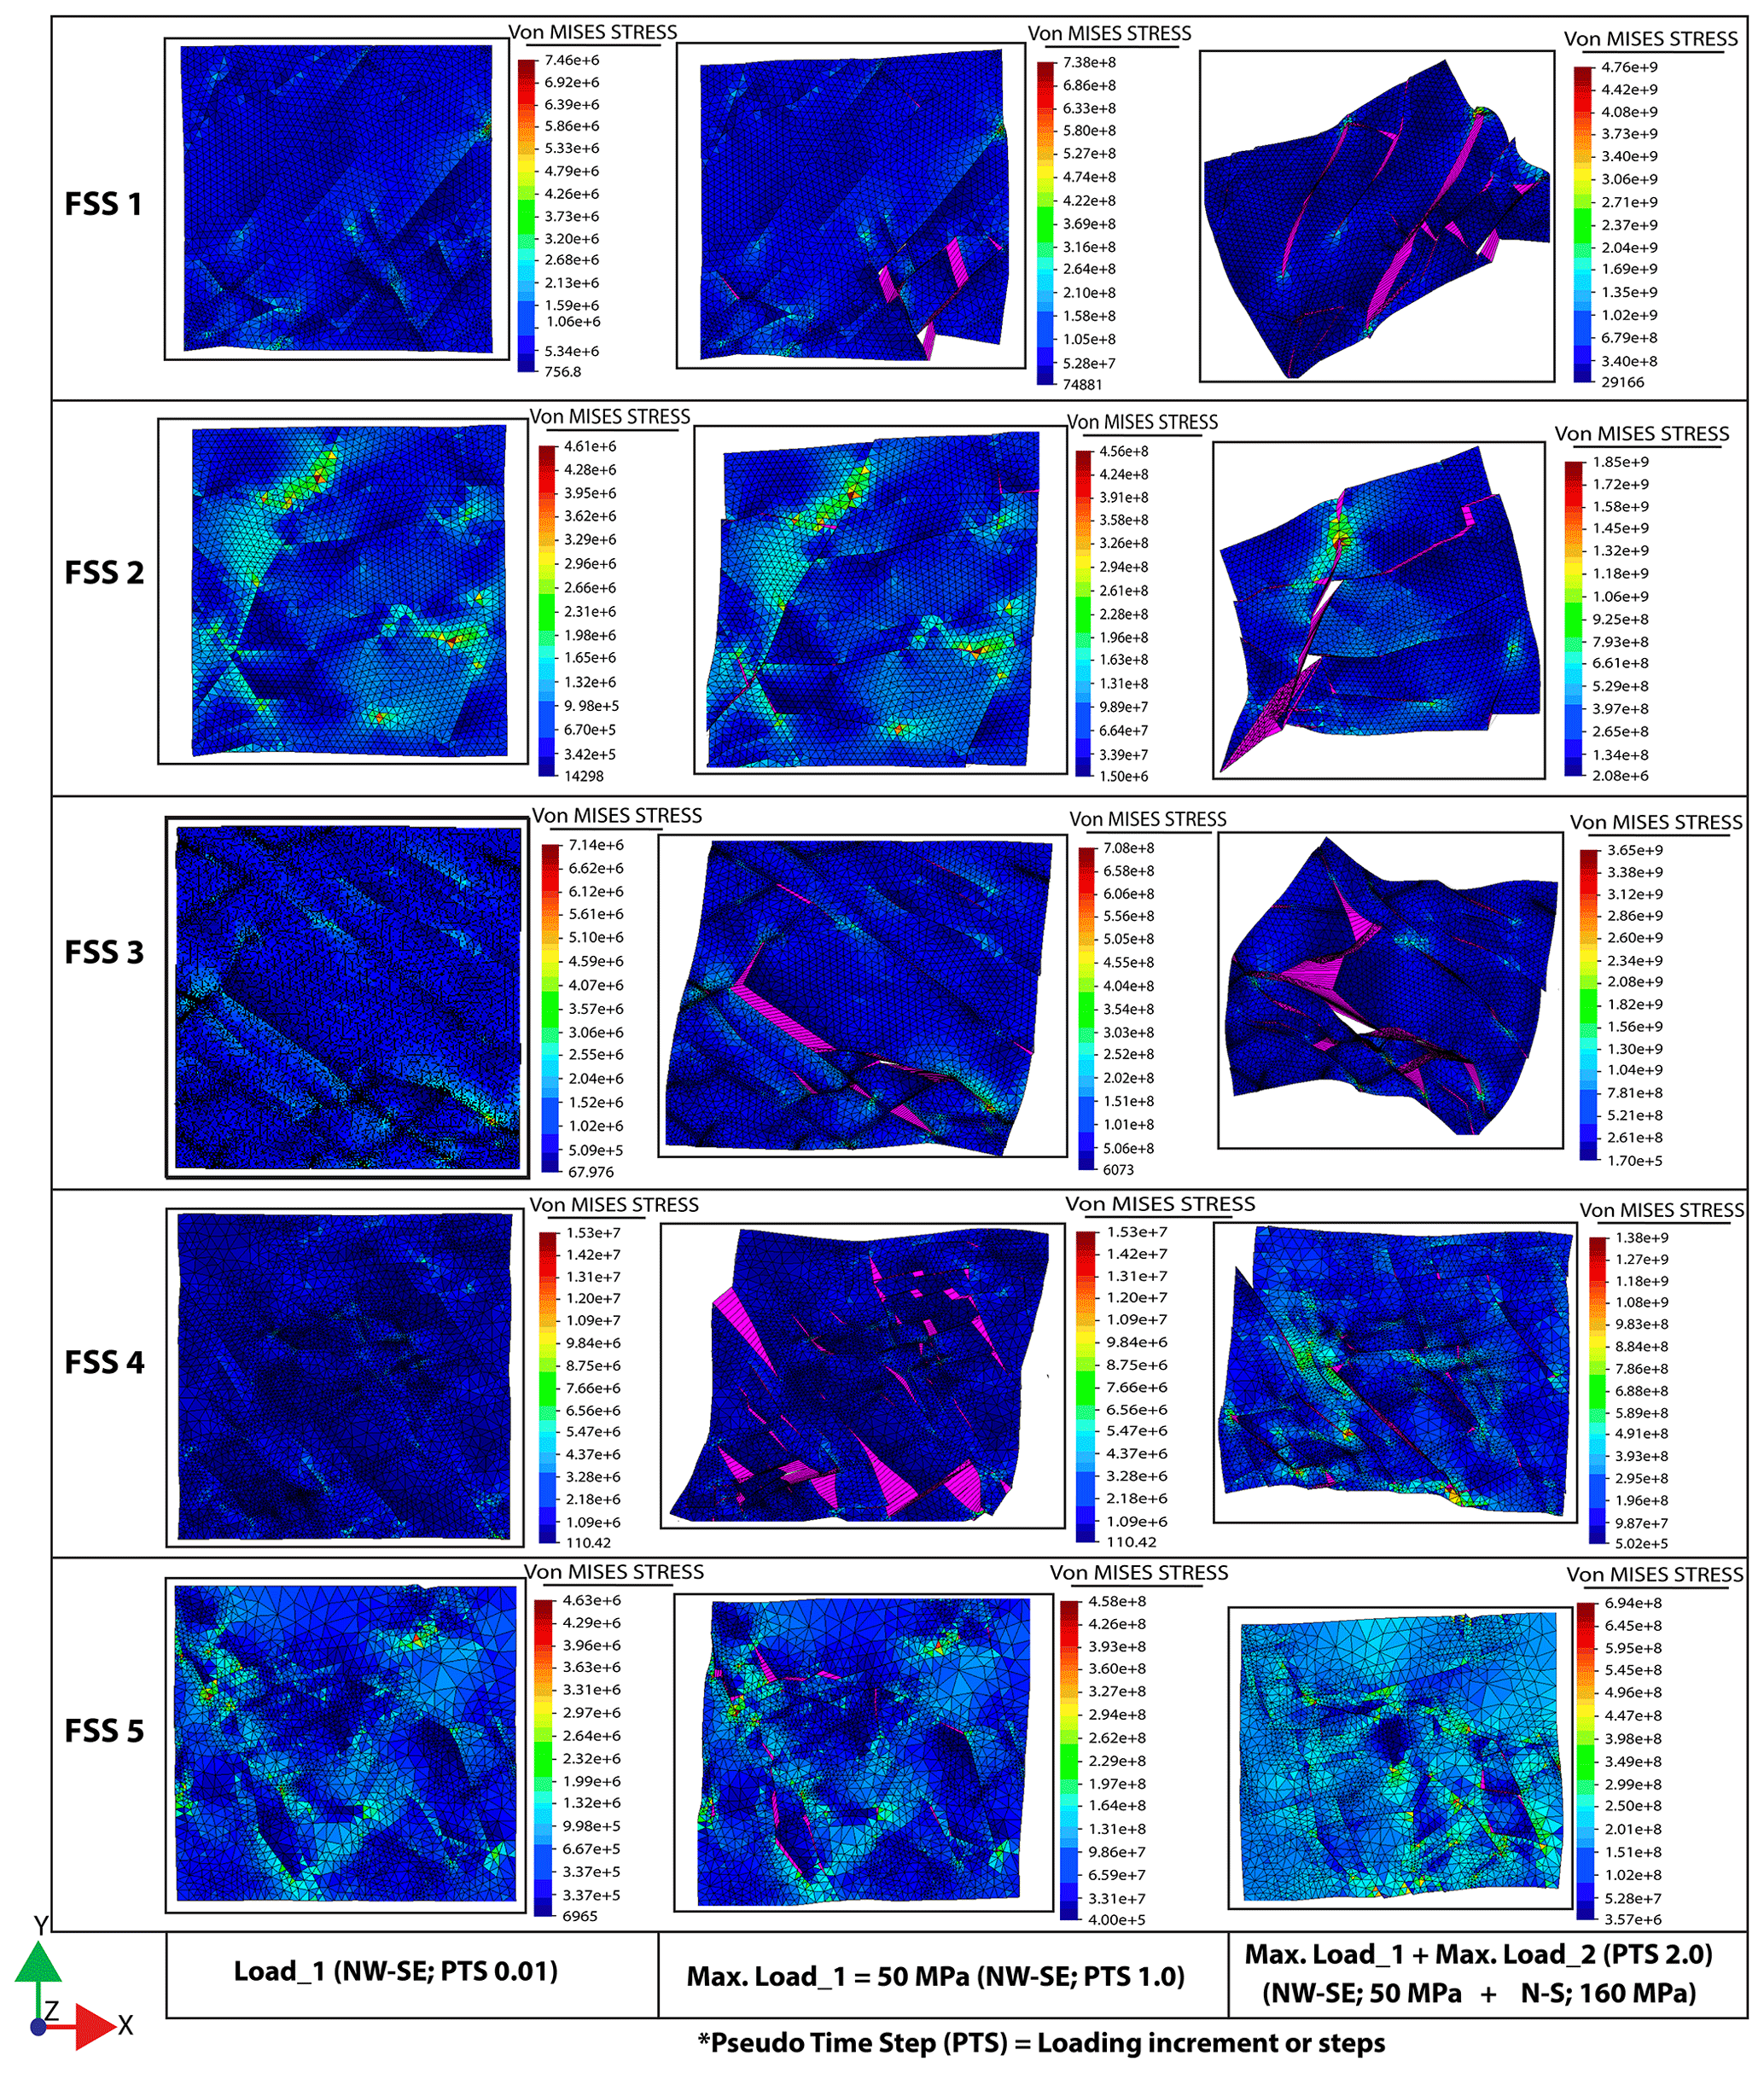
Figure 9Von Mises stress distribution (Pa) in the fractured rock domain (FSS 1 through FSS 5) under different loading conditions and orientations at pseudo-time steps (0.01, 1.0, and 2.0). Note that the deformation scale is ×10. The stress colour spectra are the same for all figures.
Figure 10 depicts the displacement magnitude distribution in each FSS when the loading conditions are at PTS 2. The observations in Figs. 9 and 10 show how changes in the magnitude of subhorizontal far-field stresses cause varied deformation and/or influence the individual fractured rock domain, the FSS. These changes, particularly in Fig. 10, are, however, quantified for each FSS, ranging from 0–0.012 m (FSS 1), 0–0.079 m (FSS 2), 0–0.080 m (FSS 3), 0–0.034 m (FSS 4), and 0–0.015 m (FSS 5). It is observed that the total displacement magnitude in the model increases with increased fracture density and connectivity. For example, FSS 2 and FSS 3 show a slight increase in the displacement magnitude due to increased fracture density and intersection (Figs. 5e and 10).
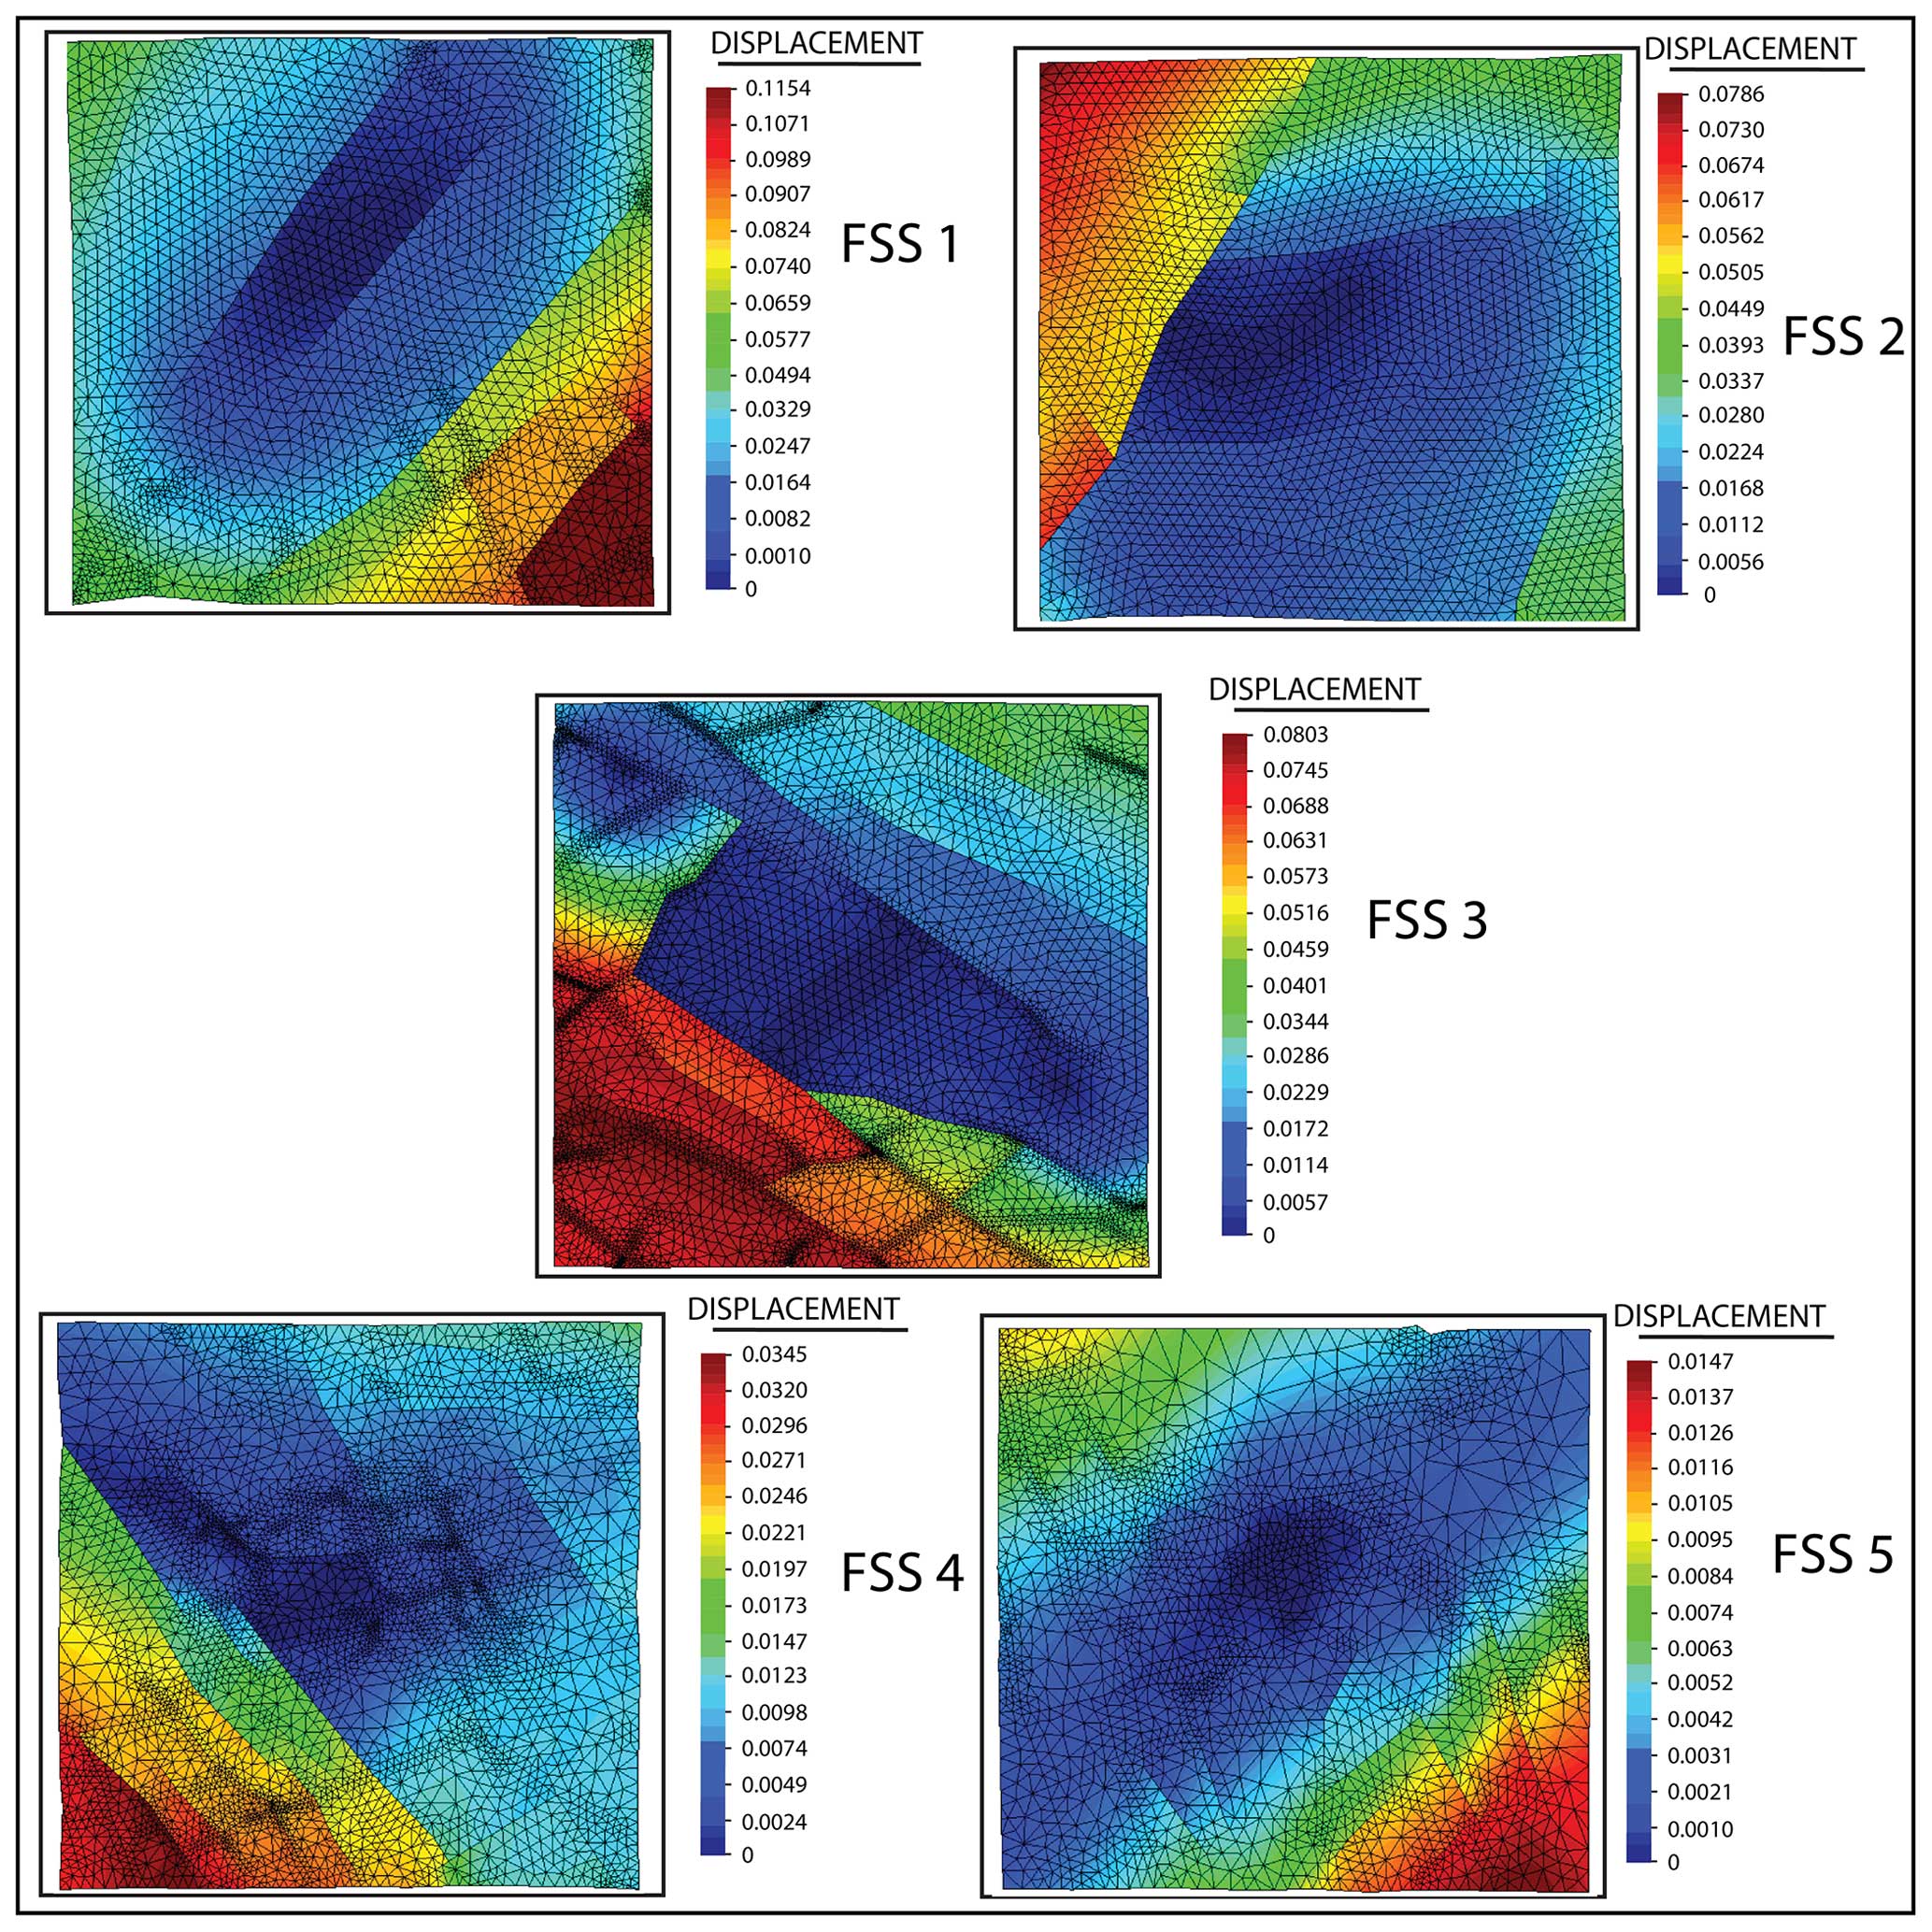
Figure 10Distribution of actual displacement magnitude under the two tectonic stress conditions for FSS 1 through FSS 5 when the pseudo-time step is 2. Units are in metres, and deformations are slightly magnified. Notice the varied displacements across the FSSs.
Depending on the magnitude and orientation of the loading scenarios, fractures open, close, and/or shear. The fracture openings (apertures) are constrained in varied sizes, varying between 2 and 60 mm, and their overall distributions against the number of fractures are shown in Fig. 11a. For each FSS, the numbers of fractures are plotted against their aperture values. These plots show distinct heterogeneous apertures of variable sizes within each FSS (Fig. 11a). Quantifying the changes in aperture as a function of increasing stress and changing stress orientations for each FSS, Fig. 11b shows the general trend of an average aperture, which is changing with the changing loading condition, inside each FSS. For instance, in each FSS, a rapid increase in aperture value was observed as the first loading in the NW–SE direction increased, and this value peaked at PTS 1 (at 50 MPa). The trend of aperture values changes at the second loading stage in the N–S direction. For example, in this case, FSS 1, 4, and 5, the aperture values initially decrease rapidly until PTS 1.3 is reached. After that, aperture trends remained constant for FSS 4 and 5, whereas FSS 1, 2, and 3 aperture values gradually increased until reaching their peak values at PTS 2 (160 MPa; Fig. 11b).
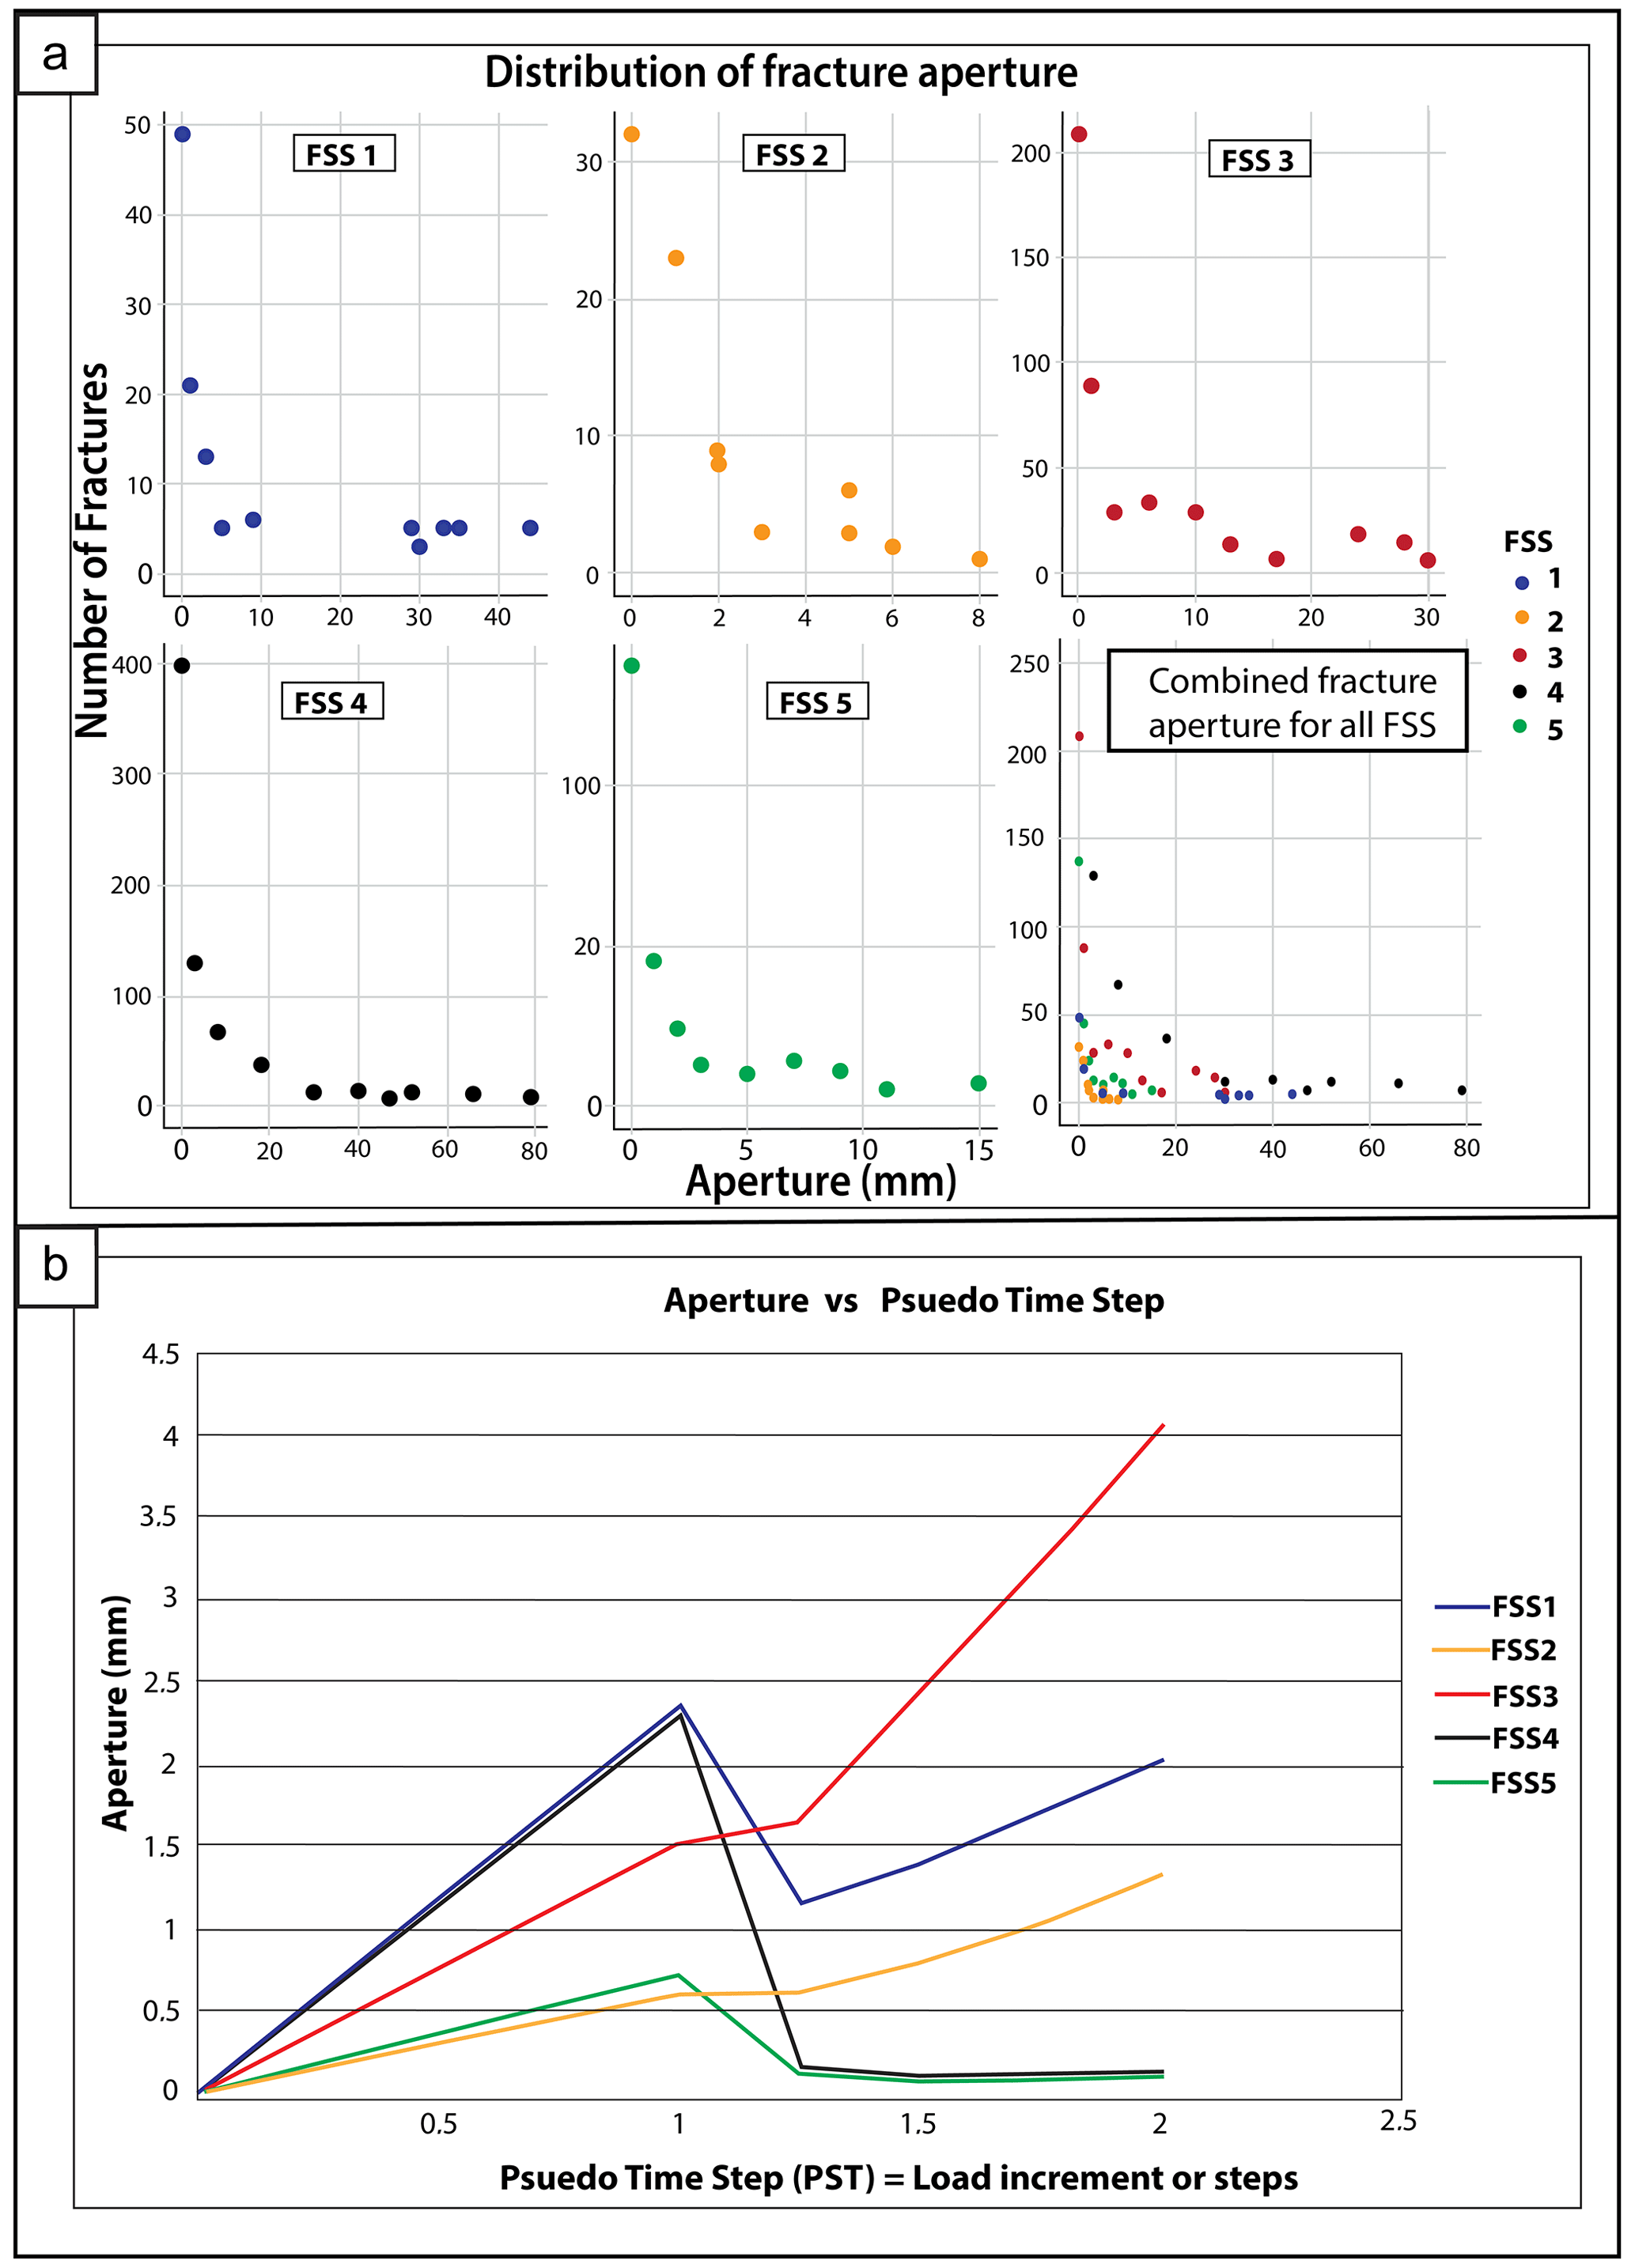
Figure 11(a) Distribution of fracture aperture under the two horizontal stress orientations. (b) The relationship between aperture and mechanical loading conditions. Note that the time is analogous to quasi-static loading conditions.
4.2 Effective permeability as a function of loading
The effective permeability in each FSS is presented as a function of the NW–SE and N–S loading scenarios. Fracture apertures mechanically generated were applied to the finite-element models, and by running the single-phase flow simulations, the effective permeabilities for each loading condition (stress orientation) were obtained. For a m2 matrix permeability, the flow is calculated based on the fracture densities and orientations in all the FSSs. The flow paths are linked to the areas where there is a high number of fractures. Figure 12 shows a nearly homogenous long-term steady-state fluid pressure distribution and gradients over the fractured rock domain (FSS) at the quasi-static loading at PTS 2 in the x and y directions. This result points to the steady-state condition of the pressure field, serving as the base from which the effective permeabilities of all the selected FSSs were computed.

Figure 12Contours of the fluid pressure gradient (Pa), obtained for a fluid pore pressure p at time step 2 (see Fig. 9 for the loading conditions), in the x and y directions. The matrix permeability is given as m2.
In addition, using the parameters in Table 1 and considering the initial fracture aperture to be zero, Fig. 13 shows the computed effective permeabilities in both x and y directions (the red curve is kxx and the black curve is kyy). Also, the components of the permeability tensor for each loading condition are shown in Table 2.

Figure 13The effective permeability values are plotted against the loading conditions for FSS 1 through FSS 5. The FSSs 1 through 3 show a significant “jump in permeability values” at pseudo-time step 1 when the second quasi-static loading commences.
Table 2Effective permeabilities, including the permeability tensor obtained in different loading scenarios.
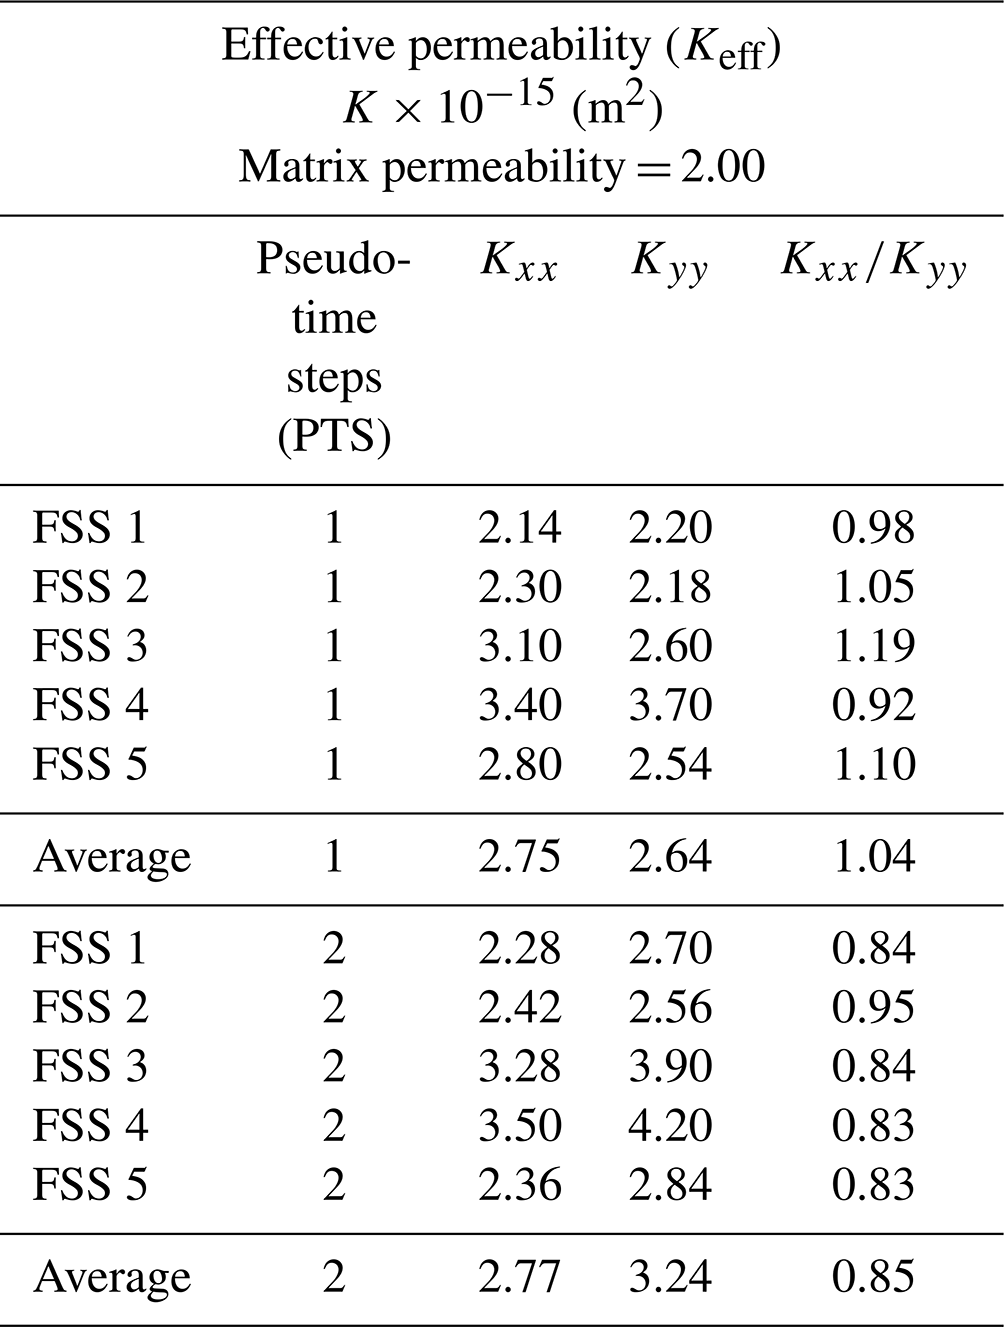
The results from the first loading stage (PTS 1, representing the subsidence deformation stage from the NW–SE direction) show a gradual increase in permeability beyond the matrix permeability within each FSS (Fig. 13). The increased permeability values correspond to increased aperture values in Fig. 11b, pointing to the initial opening of most fractures parallel to the NW–SE direction. On the other side, for the second loading stage (PTS 2), for which the loading is applied from the N–S while the first loading stage is active, the permeability values are seen to increase to varying degrees. While the close fractures have reduced aperture and permeability values, opened fractures exhibit increased permeability values (Figs. 11b and 13). Further, in both loading scenarios, a general observation shows that the permeability values are variable in each FSS, pointing to the random distribution of fractures, varied densities (Fig. 5), and varied aperture values (Fig. 11a). For instance, in loading stage 1 from the NW–SE orientation, the results in the permeability plots show that both the vertical and horizontal permeabilities increase gradually in FSS 1 through FSS 5 (Fig. 13).
Although FSS 1, FSS 2, and FSS 5 have their permeability values (in both x and y direction) close to the matrix permeability, FSS 3 and FSS 4 only show permeability values increased by 55 % and 70 % in comparison to the matrix permeability (Table 2). Nevertheless, with the second loading scenario from the N–S orientation, kxx and kyy maintained a relatively steady permeability value with a slight increase in FSS 3 through FSS 5. This is unlike FSS 1 and FSS 2, which recorded a sharp increase (a jump) in both kxx and kyy.
Quantitatively, the average permeability for all the FSSs is given as and m2 in the x and y direction for PTS 1 and and m2 in the x and y direction for PTS 2, respectively. When compared to the matrix permeability, these average permeability values, kxx and kyy, increased by 37.5 % and 32 % for PTS 1 (at the maximum magnitude of 50 MPa in the subsidence stage) and 38.5 % and 62 % for PTS 2 (at the maximum magnitude of 160 MPa during the Alpine deformation stage).
The results of the structural analysis and geomechanical (numerical) simulations show how stress regime change can impact the permeability of a naturally fractured carbonate rock. It also highlights the effect of changing stress magnitude and orientation on apertures at the fracture network scale quantified in the two-dimensional network. In addition, this process can be the first step toward using fractures (and faults) as a flow medium. This is especially true for the upscaling and larger-scale numerical simulations important for fluid flow in geothermal and hydrocarbon systems.
5.1 Subsidence and Alpine deformation: establishing a realistic loading condition for the Latemar buildup
Deformation in the carbonates of the Latemar buildup caused the development of different sets of fracture networks, including veins. As documented, these fracture networks formed during syn-sedimentary extension tectonics in the Middle Triassic, characterized by wholesale subsidence deformation and faulting tectonics (Boro et al., 2013; Preto et al., 2011). Other studies (e.g. Goldhammer and Harris, 1989; Emmerich et al., 2005) suggest that the subsidence deformation in Latemar may have continued until Late Triassic or Early Jurassic times. Subsequently, the Latemar buildup was affected by Alpine deformation between late Paleogene and early Neogene times. These tectonic episodes significantly impacted the hydraulic properties of fracture networks at the Latemar.
Given the complexities of the modelling work presented here, the studied fracture networks were assumed to have formed earlier, prior to the major tectonic episodes, as documented in Preto et al. (2011). Although both tectonic events may have developed new fractures, the modelled tectonic stresses in this study did not allow for further development of fractures but for fractures to open, shear, and/or close, depending on the magnitude and orientation of the stresses.
Our structural analysis results (Figs. 3 and 4) reveal the orientation of the principal stress fields affecting the fractures at the subsidence and extension tectonic stage, which is roughly NW–SE- to NNW–SSE-trending subhorizontal σ1 and a subvertical σ3. This compression is believed to have occurred relatively shallow or at an intermediate burial depth. Indirect evidence for this notion comes from the understanding that, in the presence of subhorizontal tectonic stress, a subvertical position of σ3 is compatible with low-angle reverse faults (or structures), forming at shallow to intermediate burial depth (e.g. Fig. 3; Bisdom et al., 2016c; Bertotti et al., 2020). This means that the overburden stress is the resultant far-field stress at the subsidence stage with an approximate NW–SE orientation and an assumed magnitude of 50 MPa.
On the other side, the main Alpine deformation in the Dolomite mountain belt (including the study area) involved maximum compressive stress (σ1) oriented approximately N–S with a magnitude estimated at 160 MPa (Peacock, 2009; Abbà et al., 2018). Because the observed correlation between the fractures (and their networks) and stress fields is largely clear, the magnitude of the two subhorizontal σ1 served as the input parameters for the numerical mechanical modelling phases, i.e. the mechanical loads used during the mechanical FE model setup. These mechanical loads captured the realistic compressive boundary condition, reflecting the tectonic episodes of the study area, unlike previous studies (e.g. Zhang and Sanderson, 1996), and are essential for the realistic computation of effective permeabilities, even at the subsurface.
Figure 8c reveals that the deformation caused by the first stress field (NW–SE shortening direction at subsidence stage) was still active as the second stress field (N–S subhorizontal σ1; Alpine deformation) was added. The gap (the grey bar Fig. 8c) between the two stresses in our model signifies that some stresses in the horizontal dimension due to subsidence deformation are present (active) at the Alpine deformation stage when they increase and become more extensive in the N–S direction. This is in contrast with previous studies, for example Stephansson et al. (1991) and Yale (2003), where modelling results (or model setup) utilize a homogenous stress regime that does not account for all other stress impacts around the fracture network. Each effect remains independent when all the stress regime changes are considered (Agheshlui et al., 2018; Bisdom et al., 2017). That is, the impact of the first or second stress field, as the case may be, is not kept active when the third or fourth stress field is implemented. Unique to our study, the orientation and magnitude of all the stress regimes, reflecting the major tectonic event over a geological period, are kept active and accounted for during the geomechanical modelling. Therefore, this makes the impact of stress irreversible in a given rock domain, and the consequence of the absence of these stresses can introduce considerable error when calculating the effective permeability, especially at the subsurface reservoir scale. This argument follows the proponent of representing realistic tectonic events affecting fracture networks in the geomechanical models, thus proposing that modelling the impact of different tectonic episodes (in our case, the subsidence and Alpine deformation) on a given rock domain (FSS, in the Latemar buildup) over geologic time (Triassic to Neogene) will significantly reduce uncertainties in computing the apertures and permeabilities, even at the reservoir scale.
Based on this, the loading conditions and the calculated permeabilities presented in Figs. 8 and 13 may reflect close occurrences of what is obtainable at the subsurface of a natural carbonate reservoir.
5.2 The link between heterogeneous aperture, fracture geometry, and the impact of stress and effective permeability
As a rule, the geomechanical models and flow simulations in fractured rocks have always depended on (i) the subsurface datasets, which are typically expensive, albeit with uncertainty ranges (Bourbiaux et al., 2002, 2005), and (ii) stochastic datasets (Khodaei et al., 2021; Timothy and Meschke, 2016), which are not realistic when considering the behaviour of a fracture network in a natural reservoir. In contrast to these studies, the presented investigation solely uses the outcropping network geometry as input for geomechanical and flow models, not considering the outcropping apertures. Instead, the geomechanical aperture sizes were modelled in a representative outcrop fracture network using computational homogenization (FE mechanical modelling) for unperturbed and perturbed fracture states. The natural fracture system is perturbed by applying mechanical load, analogous to in situ stress.
The combination of outcrop fracture geometries, mechanical loading, and aperture distribution results in models that are more representative of fractured reservoir permeability compared to analogue studies that use apertures of exhumed barren fractures or assume a constant aperture for the whole fracture network (Bisdom et al., 2017; Makedonska et al., 2016). Like most fractured reservoir models, the aperture is assumed to be constant per fracture or even per fracture set because generating a reservoir-scale 3D fracture model with mechanically controlled heterogeneous aperture distributions can be complex (Geiger and Matthäi, 2014). However, studies by Jonoud and Jackson (2008) and Cottereau et al. (2010) have given an upscaling alternative through arithmetic or harmonic averaging of the explicit fracture permeability model calculated per fracture node. That is, the mechanically controlled heterogeneous aperture, like the mechanically generated aperture in Fig. 11, can easily be upscaled to serve a more representative reservoir-scale fracture model.
Further, fracture networks, including intensely fractured zones, are believed to significantly influence the effective permeability and fluid flow patterns in a naturally fractured reservoir, particularly in tight carbonate reservoirs. These network areas show high porosities and permeabilities relative to the surrounding host rock (Bruhn et al., 2017; Matthäi, 2003). It is a widely held view that the extent to which the fracture networks impact flow lies in the fracture's structural arrangement and geometry, such as fracture orientations, spacing, and length (Bisdom et al., 2016a, c; Hardebol et al., 2015; Olson, 2003; Scholz, 2010). However, these views are limited to models that quantify aperture based on fracture length and spacing relations (Olson, 2003; Scholz, 2010). The results from our models (Figs. 11 and 13) indicate that aperture and effective permeability are not easily related to fracture geometrical parameters such as length or spacing. This is especially true because the linear functions of fracture lengths and spacing have little or no effect on the mechanically generated aperture distribution (Bisdom et al., 2016c), controlled by fracture orientation and the impact of stress.
Given these results, we suggest that the distribution of aperture and permeability (in the presented models) is influenced by the impact, magnitude, and direction of the stresses, as well as fracture orientation and shear displacement (Figs. 11 and 13). For the stress-induced aperture, the mechanical load opens individual fractures orthogonal to the direction of loading at different rates and simultaneously closes the fractures parallel to the loading direction (Heffer and Koutsabeloulis, 1995). Therefore, in a favourable orientation, i.e., the direction with significant stress components (of mechanical loading), which in our case is NW–SE for the subsidence deformation, the results show a considerable increase in permeability as the load increases (Fig. 11) before reaching a peak at PTS 1. The increased permeability – in both the x and y direction – exceeds the matrix permeability within all the FSSs by 37.5 % and 32 %, indicating a structural change. On the other side, permeability continues in an upward trajectory with varying degrees of increased values (Fig. 13) in the direction of more significant stress components (N–S) at the Alpine deformation stage for all the FSSs until a maximum loading value is reached. In this case, the average increased permeability is beyond the matrix permeability by up to 62 % in some of the FSSs, especially in the y direction. This suggests a substantial structural change in the fractures within the fracture network, further indicated by the varied aperture distribution.
The evolution of permeability values in x and y directions within the FSS indicates that the values of the permeability distribution are variable. These variabilities are linked to the varied fracture densities and aperture values (Fig. 5). In fractured reservoirs, apertures of natural fractures are highly heterogeneous and can contribute to the induced anisotropy in the permeability (Makedonska et al., 2016). In our case, for instance, FSS 1, FSS 3, and FSS 5 significantly differ in the evolution of the permeability values in the x and y directions and distinctly show induced anisotropy in the permeability within their rock domains (Fig. 13). This is demonstrated by the differences in the permeability values in x and y directions. The higher the difference in the permeability values of the x and y direction, the more significant the induced anisotropy. These differences are linked to the fracture connectivity and/or distributions (Fig. 5c and d) within each FSS.
Conversely, FSS 2 and FSS 4 show isotropy in permeability, as the differences in the permeability values of x and y directions are relatively small compared to those in FSS 1, FSS 3, and FSS 5. These behaviours can be explained as follows: initially, during the subsidence stage, when the far-field stress (or compressive loading) is in the NW–SE direction, the fractures parallel to this direction open while the fractures orthogonal to the NW–SE direction close. The opening of the NW–SE-directed parallel fractures increases the overall permeability in all FSSs (Fig. 13). However, at PTS 1, the second set of loading scenarios is gradually applied from the N–S direction at the onset of Alpine deformation. While the loading from the first stage is kept constant, the overall permeability at this stage continues with varying degrees of increase until PTS 2. This implies that the new loading opens the fractures parallel to the N–S direction and closes the fracture orientation in the E–W direction (Fig. 13). Hence, the second loading stage, in principle, opens the fractures that were previously closed by the first loading stage. This means that many fractures opened, resulting in larger permeability values. There is also a documented sharp jump (kink-style structure) in permeability values plotted for FSS 1, FSS 2, and FSS 3 (Fig. 13) at the beginning of the second loading stage. This sharp increase in the permeabilities may imply that fractures oriented slightly in the NE–SW and/or NW–SE directions (Fig. 5c) may have been opened by the N–S loading condition.
In addition, fracture density and/or the number of fractures in each rock domain, or FSS, may have played a considerable role in the sharp spike in permeability values. For example, in FSS 1 and FSS 2, where the quick jump in permeability values is predominant, fracture density is relatively lower than in FSS 4 and FSS 5, with high fracture density and no visible sharp increase. This explains the jump and the increase in permeability during the second loading stage. Recent studies have linked the fracture density, the number of fractures, and the stress orientation with an overall increase in the permeability values (e.g. Bisdom et al., 2016b, c; Furtado et al., 2022). Although some fractures may have been sheared and eventually opened during loading, we believe that the shearing of these fractures has minimal or no impact on the overall permeability of the rock domains.
One interesting observation in this research investigation is that the two far-field stresses acting within a rock domain simultaneously with different magnitude and orientation (for example, at PTS 2, in our case) anisotropically stressed the fracture network, which do not necessarily cancel each other out in the mechanical FE modelling phases. However, these stresses create new effects on the overall aperture and permeability distributions linked to fracture geometry, connectivity, and density. In our case, there is a general increase in the overall aperture and permeability values, respectively (Figs. 11b and 13), contingent on subsurface energy storage in carbonates.
5.3 Implications
All modelled features are assumed to be reactivated fractures that control the fluid flow in the presented numerical workflow. Because of the effects of weathering and exhumation, the distinction between open fractures, veins, stylolites, and shear fractures was not made. Although this assumption is widely used in reservoir modelling, complex features such as subvertical (tectonic) stylolites or partly cemented fractures can inhibit or enhance fluid flow (Bruna et al., 2019). Cemented fractures strongly constrain fluid flow, as cementation reduces the aperture of a fracture plane (Gale et al., 2010; Olson, 2007).
Although our study permits investigating the impact of stress regime change in detail, the results will broadly differ in complex and large-scale reservoirs since our model is orders of magnitude smaller than a subsurface reservoir. The studied fracture networks have relatively simple geometries on a small scale compared to what is usually observed in large-scale reservoirs. However, Matthäi and Nick (2009) and Bisdom et al. (2016a) upscaled heterogeneous aperture distribution to a single averaged aperture, which provided the same permeability distribution. This means that averaging and upscaling the permeability of small-scale fracture models can accurately describe permeability when most fracture contributes to flow. Otherwise, the small-scale models may not be representative.
Another issue is ignoring the influence of the overburden stress (pointed out in Sect. 3.4) on fracture aperture. Overburden stresses result in lateral expansion of rock layers, and in addition to the horizontal stresses, fracture apertures are strongly dependent on overburden stresses due to Poisson's effect (Agheshlui et al., 2018). Therefore, the numerical analysis in 2D constrains the effects of lateral expansion of the fractured rock domain, which can displace the rock body and increase the fracture aperture. This means that the results presented in our model may only provide indicative approximations.
Further, better knowledge of stress conditions and elastic parameters aids in predicting realistic aperture descriptions for reservoir models. Studies have noted the impact of these parameters on modelled stress-induced aperture such that stress orientations and the magnitude of differential stress largely influenced the resulting aperture distribution (Agheshlui et al., 2018; Bisdom et al., 2016a). The presented model assumed the magnitudes of the two stress regimes following the calculated palaeostress in other field areas with the same geodynamic conditions. The values of these magnitudes are debatable and subjective. In addition, the arbitrary choice of the 2×2 m FSS may not guarantee that this is an actual representative sample for calculating permeability. Therefore, changing the magnitude of these stress values and increasing the FSS size can affect this study's overall aperture and permeability distributions. Still, the workability of the model remains stable and can compute any given matter.
Lastly, the off-diagonal components of the permeability tensor were not calculated, and multi-field coupling methods, such as flipping the order of applied stresses, were not considered in this study. These, when considered, may affect the overall results and will be considered in detail in a forthcoming paper looking at the three-dimensional fracture network.
A detailed workflow is presented that applies a displacement-based linear elastic finite-element method (FEM) to model the impact of stress regime change on the permeability of carbonate rock. Considering the tectonic episodes (subsidence and Alpine deformations) and outcropping fracture network at the Latemar, the stress-induced heterogeneous aperture distribution was generated in the selected fracture substructure (or sample; FSS). The impact of stress regime change on flow was quantified regarding varied aperture and effective permeability. Although the studied fracture networks have relatively simple geometries compared to what is ordinarily observed at the reservoir scale, this permits investigating the impact of individual stress magnitude and stress regime change on permeability.
First, we presented the structural analysis and interpretation of fracture network geometry in the study area, considering the two major tectonic episodes: subsidence and Alpine deformation. Their stresses were considered far-field stresses (compressive loading), which informed the boundary conditions (two loading stages) in the geomechanical FE modelling. The first stage of loading acts from the NW–SE direction, representing the subsidence deformation, and gradually reaches a maximum loading condition at 50 MPa in pseudo-time steps (PTS 1), representing the load increment. In contrast, the second loading stage, the Alpine deformation, was superimposed on the first and gradually reached a maximum value of 160 MPa in PTS 2.
Second, it was shown that in the directions with less significant stress components (of mechanical loading), NW–SE, the overall permeability increased gradually, exceeding the matrix permeability in both the x and y direction, within all the FSSs by 37.5 % and 32 %, respectively, as the load increased before reaching a peak at PTS 1. In addition, the increase in permeability continues with the upward trajectory in the direction of more significant stress components (N–S) for all the FSSs as the load increases. The average increased permeability is beyond the matrix permeability by up to 62 %, especially in the y direction. Fracture density, the number of fractures, and the stress orientation play a critical role in the overall increase in the permeability values.
Finally, we conclude that the two superimposed mechanical loadings, simultaneously acting within a rock domain at a different magnitude and orientation, anisotropically stressed the fracture network. These mechanical loadings do not necessarily cancel each other out in the mechanical FE modelling phases. However, these mechanical loads create new effects in the overall aperture and permeability distributions. The new effects include, but are not limited to, average increased permeability values beyond the matrix permeability by up to 62 %, especially in the y direction. With these increased average permeability values, fracture geometry, connectivity, and density are implicated, and these can be complicated, depending on other numerous factors, including temperature and fluid pressure, in large subsurface reservoirs.
The code used in this study is proprietary and was developed in-house for research purposes. Due to institutional policies and ongoing development, the code is not publicly available. However, detailed descriptions of the algorithms and methodologies used are provided in the manuscript, and further technical details can be shared upon reasonable request.
The underlying dataset developed and used in this study can be accessed in the following data repository at https://doi.org/10.5281/zenodo.6606859 (Igbokwe et al., 2024). Drone images are processed using Agisoft PhotoScan® – a photogrammetry tool for which the workflow is publicly available in the published work of Bisdom et al. (2017).
The first author named is the lead and corresponding author. All other authors are listed according to their contributions. We describe contributions to the paper using Contribution Roles Taxonomy (CRediT) (accessed from https://www.elsevier.com/authors/policies-and-guidelines/credit-author-statement, last access: 20 September 2023) as follows. OAI: conceptualization, methodology, software, formal analysis, investigation, data curation, writing (original draft preparation), visualization, project administration. JJT: data curation, writing (reviewing and editing), validation. AK: investigation, software, resources, data curation. XY: software, validation, data curation, formal analysis. MM: resources, data curation. AV: resources, data curation. GM: supervision, project administration. AI: supervision, writing (reviewing and editing), validation, project administration.
The contact author has declared that none of the authors has any competing interests.
Publisher's note: Copernicus Publications remains neutral with regard to jurisdictional claims made in the text, published maps, institutional affiliations, or any other geographical representation in this paper. While Copernicus Publications makes every effort to include appropriate place names, the final responsibility lies with the authors.
The Petroleum Technology Development Fund (PTDF) of Abuja, Nigeria, is thanked for sponsoring the doctoral fellowship of the first author (grant number: OSS/PHD/IOA/843/16). The authors thank Giovanni Bertotti for discussing the tectonic significance of the fracture model and Nils Gründken and Simone Schurr for their assistance during the fieldwork. Thanks to Jennifer Dikachi-Igbokwe for her helpful comments, which helped improve this paper.
This research has been sponsored by the Petroleum Technology Development Fund (grant no. OSS/PHD/IOA/843/16), and the fieldwork component was supported by the Deutsche Forschungsgemeinschaft (grant no. DFG FOR 1644 to Adrian Immenhauser).
This paper was edited by Maria Mutti and reviewed by Frederic Amour and one anonymous referee.
Abbà, T., Breda, A., Massironi, M., Preto, N., Piccin, G., Trentini, T., Bondesan, A., Carton, A., Fontana, A., Mozzi, P., Surian, N., Zanoner, T., and Zampieri, D.: Pre-Alpine and Alpine deformation at San Pellegrino pass (Dolomites, Italy), J. Maps, 14, 683–691, https://doi.org/10.1080/17445647.2018.1536001, 2018.
Agheshlui, H., Sedaghat, M. H., and Matthai, S.: Stress Influence on Fracture Aperture and Permeability of Fragmented Rocks, J. Geophys. Res.-Solid, 123, 3578–3592, https://doi.org/10.1029/2017JB015365, 2018.
Agosta, F., Alessandroni, M., Antonellini, M., Tondi, E., and Giorgioni, M.: From fractures to flow: A field-based quantitative analysis of an outcropping carbonate reservoir, Tectonophysics, 490(, 197–213, https://doi.org/10.1016/j.tecto.2010.05.005, 2010.
Bellieni, G., Fioretti, A. M., Marzoli, A., and Visonà, D.: Permo-Paleogene magmatism in the eastern Alps, Rendi. Linc., 21, 51–71, https://doi.org/10.1007/s12210-010-0095-z, 2010.
Berkowitz, B.: Characterizing flow and transport in fractured geological media: A review, Adv. Water Resour., 25, 861–884, https://doi.org/10.1016/S0309-1708(02)00042-8, 2002.
Bertotti, G., de Graaf, S., Bisdom, K., Oskam, B., Hubert, V., Bezerra, F., Reijmer, J., and Cazarin, C.: Fracturing and fluid‐flow during post‐rift subsidence in carbonates of the Jandaíra Formation, Potiguar Basin, NE Brazil, Basin Res., 29, 836–853, https://doi.org/10.1111/bre.12246, 2017.
Bertotti, G., Audra, P., Auler, A., Bezerra, F., de Hoop, S., Pontes, C., Prabhakaran, R., and Lima, R.: The Morro Vermelho hypogenic karst system (Brazil): Stratigraphy, fractures, and flow in a carbonate strike-slip fault zone with implications for carbonate reservoirs, AAPG Bull., 104, 2029–2050, https://doi.org/10.1306/05212019150, 2020.
Bisdom, K., Bertotti, G., and Nick, H. M.: The impact of in-situ stress and outcrop-based fracture geometry on hydraulic aperture and upscaled permeability in fractured reservoirs, Tectonophysics, 690, 63–75, https://doi.org/10.1016/j.tecto.2016.04.006, 2016a.
Bisdom, K., Bertotti, G., and Nick, H. M.: The impact of different aperture distribution models and critical stress criteria on equivalent permeability in fractured rocks, J. Geophys. Res.-Solid, 121, 4045–4063, https://doi.org/10.1002/2015JB012657, 2016b.
Bisdom, K., Bertotti, G., and Nick, H. M.: The impact of in-situ stress and outcrop-based fracture geometry on hydraulic aperture and upscaled permeability in fractured reservoirs, Tectonophysics, 690, 63–75, https://doi.org/10.1016/j.tecto.2016.04.006, 2016c.
Bisdom, K., Nick, H. M., and Bertotti, G.: An integrated workflow for stress and flow modelling using outcrop-derived discrete fracture networks, Comput. Geosci., 103, 21–35, https://doi.org/10.1016/j.cageo.2017.02.019, 2017.
Boersma, Q., Prabhakaran, R., Bezerra, F. H., and Bertotti, G.: Linking natural fractures to karst cave development: A case study combining drone imagery, a natural cave network and numerical modelling, Petrol. Geosci., 25, 454–469, https://doi.org/10.1144/petgeo2018-151, 2019.
Bonnet, E., Bour, O., Odling, N. E., Davy, P., Main, I., Cowie, P., and Berkowitz, B.: Scaling of fracture systems in geological media, Rev. Geophys., 39, 347–383, https://doi.org/10.1029/1999RG000074, 2001.
Boro, H., Bertotti, G., and Hardebol, N. J.: Distributed fracturing affecting isolated carbonate platforms, the Latemar Platform Natural Laboratory (Dolomites, North Italy), Mar. Petrol. Geol., 40, 69–84, https://doi.org/10.1016/j.marpetgeo.2012.09.012, 2013.
Boro, H., Rosero, E., and Bertotti, G.: Fracture-network analysis of the Latemar Platform (northern Italy): integrating outcrop studies to constrain the hydraulic properties of fractures in reservoir models, Petrol. Geosci., 20, 79–92, https://doi.org/10.1144/petgeo2013-007, 2014.
Bosellini, A.: Progradation geometries of carbonate platforms: examples from the Triassic of the Dolomites, northern Italy, Sedimentology, 31, 1–24, https://doi.org/10.1111/j.1365-3091.1984.tb00720.x, 1984.
Bosellini, A., Gianolla, P., and Stefani, M.: Geology of the Dolomites, an introduction, Episodes, 26, 43, https://doi.org/10.18814/epiiugs/2003/v26i3/005, 2003.
Bott, M. H. P.: The mechanics of oblique slip faulting, Geol. Mag., 96, 109–117, https://doi.org/10.1017/S0016756800059987, 1959.
Bourbiaux, B., Basquet, R., Cacas, M. C., Daniel, J. M., and Sarda, S.: An integrated workflow to account for multi-scale fractures in reservoir simulation models: Implementation and benefits, in: Soc. Petr. Eng., International Petroleum Exhibition and Conference, 13–16 October 2002, Abu Dhabi, https://doi.org/10.2523/78489-ms, 2002.
Bourbiaux, B., Basquet, R., Daniel, J. M., Hu, L. Y., Jenni, S., Lange, G., and Rasolofosaon, P.: Fractured reservoirs modelling: a review of the challenges and some recent solutions, First Break, 23, 1365–2397, https://doi.org/10.3997/1365-2397.2005018, 2005.
Bruhn, C. H. L., Pinto, A. C. C., Johann, P. R. S., Branco, C. C. M., Salomão, M. C., and Freire, E.: Campos and Santos basins: 40 Years of reservoir characterization and management of shallow- to ultra-deep water, post- and pre-salt reservoirs – Historical overview and future challenges, OTC Brasil, 327–350, https://doi.org/10.4043/28159-ms, 2017.
Bruna, P. O., Lavenu, A. P. C., Matonti, C., and Bertotti, G.: Are stylolites fluid-flow efficient features?, J. Struct. Geol., 125, 270–277, https://doi.org/10.1016/j.jsg.2018.05.018, 2019.
Chen, H. and Lawrence, T.: Reservoir Stress Changes Induced by Production/Injection, in: SPE Rocky Mountain Petroleum Technology Conference, May 2001, Keystone, Colorado, https://doi.org/10.2118/71087-MS, 2001.
Christ, N., Immenhauser, A., Amour, F., Mutti, M., Preston, R., Whitaker, F. F., Peterhänsel, A., Egenhoff, S. O., Dunn, P. A., and Agar, S. M.: Triassic Latemar cycle tops – Subaerial exposure of platform carbonates under tropical arid climate, Sediment. Geol., 265–266, 1–29, https://doi.org/10.1016/j.sedgeo.2012.02.008, 2012.
Cottereau, N., Garcia, M. H., Gosselin, O. R., and Vigier, L.: Effective Fracture Network Permeability: Comparative Study of Calculation Methods, in: SPE Europec/Eage Annual Conference and Exhibition, June 2010, Barcelona, Spain, 1–31, https://doi.org/10.2118/131126-ms, 2010.
Dadvand, P., Rossi, R., Gil, M., Martorell, X., Cotela, J., Juanpere, E., Idelsohn, S., and Onate, E.: Migration of a generic multi-physics framework to HPC environments, Comput. Fluids, 80, 301–309, https://doi.org/10.1016/j.compfluid.2012.02.004, 2013.
de Dreuzy, J.-R., Davy, P., and Bour, O.: Hydraulic properties of two-dimensional random fracture networks following power law distributions of length and aperture, Water Resour. Res., 38, 121–129, https://doi.org/10.1029/2001WR001009, 2002.
Delvaux, D. and Sperner, B.: New aspects of tectonic stress inversion with reference to the tensor program, Geol. Soc. Lond., 212, 75–100, https://doi.org/10.1144/gsl.sp.2003.212.01.06, 2003.
Doglioni, C.: Examples of strike-slip tectonics on platform-basin margins, Tectonophysics, 156, 293–302, https://doi.org/10.1016/0040-1951(88)90066-2, 1988.
Egenhoff, S. O., Peterhänsel, A., Bechstädt, T., Zühlke, R., and Grötsch, J.: Facies architecture of an isolated carbonate platform: Tracing the cycles of the Latemar (Middle Triassic, northern Italy), Sedimentology, 46, 893–912, https://doi.org/10.1046/j.1365-3091.1999.00258.x, 1999.
Emmerich, A., Zamparelli, V., Bechstädt, T., and Zühlke, R.: The reefal margin and slope of a Middle Triassic carbonate platform: The Latemar (Dolomites, Italy), Facies, 50, 573–614, https://doi.org/10.1007/s10347-004-0033-6, 2005.
Furtado, C. P. Q., Medeiros, W. E., Borges, S. V., Lopes, J. A. G., Bezerra, F. H. R., Lima-Filho, F. P., Maia, R. P., Bertotti, G., Auler, A. S., and Teixeira, W. L. E.: The influence of subseismic-scale fracture interconnectivity on fluid flow in fracture corridors of the Brejões carbonate karst system, Brazil, Mar. Petrol. Geol., 141, 105689, https://doi.org/10.1016/j.marpetgeo.2022.105689, 2022.
Gaetani, M., Fois, E., Jadoul, F., and Nicora, A. L. D. A.: Nature and evolution of middle triassic carbonate buildups in the dolomites (Italy), Mar. Geol., 44, 25–57, https://doi.org/10.1016/0025-3227(81)90112-2, 1981.
Gale, J. F. W., Lander, R. H., Reed, R. M., and Laubach, S. E.: Modeling fracture porosity evolution in dolostone, J. Strut. Geol., 32, 1201–1211, https://doi.org/10.1016/j.jsg.2009.04.018, 2010.
Garland, J., Neilson, J., Laubach, S. E., and Whidden, K. J.: Advances in carbonate exploration and reservoir analysis, Geol. Soc. Lon. Spec. Publ., 370, 1–15, https://doi.org/10.1144/SP370.15, 2012.
Geiger, S. and Matthäi, S.: What can we learn from high-resolution numerical simulations of single- and multi-phase fluid flow in fractured outcrop analogues?, Geol. Soc. Lon. Spec. Publ., 374, 125–144, https://doi.org/10.1144/SP374.8, 2014.
Goldhammer, R. and Harris, M.: Eustatic controls on the stratigraphy and geometry of the Latemar buildup (Middle Triassic), the Dolomites of northern Italy, SEPM Soc. Sediment. Geol., https://doi.org/10.2110/pec.89.44.0323, 1989.
Goldhammer, R. K., Dunn, P. A., and Hardie, L. A.: Depositional cycles, composite sea-level changes, cycle stacking patterns, and the hierarchy of stratigraphic forcing: Examples from Alpine Triassic platform carbonates, Bull. Geol. Soc., 102, 535–562, https://doi.org/10.1130/0016-7606(1990)102<0535:DCCSLC>2.3.CO;2, 1990.
Hardebol, N. J., Maier, C., Nick, H., Geiger, S., Bertotti, G., and Boro, H.: Multiscale fracture network characterization and impact on flow: A case study on the Latemar carbonate platform, J. Geophys. Res.-Solid, 120, 8197–8222, https://doi.org/10.1002/2015JB012608, 2015.
Harris, M. T.: The foreslope and toe-of-slope facies of the Middle Triassic Latemar Buildup (Dolomites, Northern Italy), Sediment. Res., 132–145, 1994.
Heffer, K. J. and Koutsabeloulis, N. C.: Stress effects on reservoir flow: Numerical modelling used to reproduce field data, Geol. Soc. Spec. Publ., 84, 81–88, https://doi.org/10.1144/GSL.SP.1995.084.01.09, 1995.
Heidbach, O., Rajabi, M., Cui, X., Fuchs, K., Müller, B., Reinecker, J., Reiter, K., Tingay, Wenzel, F., Xie, F., Ziegler, M., and Zoback, M.: The World Stress Map database release 2016: Crustal stress pattern across scales, Tectonophysics, 744, 484–498, https://doi.org/10.1016/j.tecto.2018.07.007, 2018.
Hooker, J. N., Laubach, S. E., and Marrett, R.: Fracture-aperture sizedfrequency, spatial distribution, and growth processes in strata-bounded and non-strata-bounded fractures, cambrian mesón group, NW argentina, J. Strut. Geol., 54, 54–71, https://doi.org/10.1016/j.jsg.2013.06.011, 2013.
Hooker, J. N., Laubach, S. E., and Marrett, R.: A universal power-law scaling exponent for fracture apertures in sandstones, GSA Bull., 126, 1340–1362, https://doi.org/10.1130/B30945.1, 2014.
Hoteit, H. and Firoozabadi, A.: Compositional modeling by the combined discontinuous galerkin and mixed methods, SPE J., 11, 19–34, https://doi.org/10.2118/90276-PA, 2006.
Igbokwe, O. A., Mueller, M., Abah, O., Bertotti, G., and Immenhauser, A.: Morphological changes of carbonate deformed clasts in a neogene fault zone, in: 3rd EAGE Workshop on Naturally Fractured Reservoirs, February 2018, https://doi.org/10.3997/2214-4609.201800040, 2018.
Igbokwe, O. A., Mueller, M., Bertotti, G., Timothy, J. J., Abah, O., and Immenhauser, A.: Morphology and topology of dolostone lithons in the regional Carboneras Fault Zone, Southern Spain, J. Strut. Geol., 137, 104073, https://doi.org/10.1016/j.jsg.2020.104073, 2020.
Igbokwe, O. A., Bertotti, G., Mueller, M., Chima, K. I., and Immenhauser, A. Geometries, Driving Factors, And Connectivity Of Background Fractures At The Latemar Carbonate Platform (N. Italy): Relevance For Subsurface Reservoir Modelling, ESS Open Archive, https://doi.org/10.1002/ESSOAR.10511547.1, 2022.
Igbokwe, O. A., Verdecchia, A., Timothy, J. J., and Kumar, A.: Impact of stress regime change on the permeability of a naturally fractured carbonate buildup (Latemar, the Dolomites, northern Italy)_DATASET, Zenodo [data set], https://doi.org/10.5281/zenodo.6606859, 2024.
Jacquemyn, C., El Desouky, H., Hunt, D., Casini, G., and Swennen, R.: Dolomitization of the Latemar platform: Fluid flow and dolomite evolution, Mar. Petrol. Geol., 55, 43–67, https://doi.org/10.1016/j.marpetgeo.2014.01.017, 2014.
Jacquemyn, C., Huysmans, M., Hunt, D., Casini, G., and Swennen, R.: Multi-scale three-dimensional distribution of fracture-and igneous intrusion-controlled hydrothermal dolomite from digital outcrop model, Latemar platform, Dolomites, northern Italy, AAPG Bull., 99, 957–984, https://doi.org/10.1306/10231414089, 2015.
Jonoud, S. and Jackson, M. D.: New criteria for the validity of steady-state upscaling, Trans. Porous Med., 71, 53–73, https://doi.org/10.1007/s11242-007-9111-x, 2008.
Kaven, J. O., Maerten, F., and Pollard, D.: Mechanical analysis of fault slip data: Implications for paleostress analysis, J. Strut. Geol., 33, 78–91, https://doi.org/10.1016/j.jsg.2010.12.004, 2011.
Khodaei, M., Biniaz Delijani, E., Dehghan, A. N., Hajipour, M., and Karroubi, K.: Stress/strain variability in fractured media: a fracture geometric study, Geotech. Geol. Eng., 39, 5339–5358, https://doi.org/10.1007/s10706-021-01838-4, 2021.
Laubach, S. E.: Practical approaches to identifying sealed and open fractures, AAPG Bull., 87, 561–579, https://doi.org/10.1306/11060201106, 2003.
Lei, Q., Latham, J. P., Xiang, J., Tsang, C. F., Lang, P., and Guo, L.: Effects of geomechanical changes on the validity of a discrete fracture network representation of a realistic two-dimensional fractured rock, Int. J. Rock Mech. Min. Sci., 70, 507–523, https://doi.org/10.1016/j.ijrmms.2014.06.001, 2014.
Lei, Q., Latham, J. P., Xiang, J., and Tsang, C. F.: Polyaxial stress-induced variable aperture model for persistent 3D fracture networks, Geomech. Energ. Environ., 1, 34–47, https://doi.org/10.1016/j.gete.2015.03.003, 2015.
Lei, Q., Latham, J. P., and Tsang, C. F.: The use of discrete fracture networks for modelling coupled geomechanical and hydrological behaviour of fractured rocks, Comput. Geotech., 85, 151–176, https://doi.org/10.1016/j.compgeo.2016.12.024, 2017.
Leonhart, D., Timothy, J. J., and Meschke, G.: Cascade Continuum Micromechanics model for the effective permeability of solids with distributed microcracks: Comparison with numerical homogenization, Mech. Mater., 115, 64–75, https://doi.org/10.1016/j.mechmat.2017.09.001, 2017.
Makedonska, N., Hyman, J. D., Karra, S., Painter, S. L., Gable, C. W., and Viswanathan, H. S.: Evaluating the effect of internal aperture variability on transport in kilometer scale discrete fracture networks, Adv. Water Resour., 94, 486–497, https://doi.org/10.1016/j.advwatres.2016.06.010, 2016.
Marangon, A., Gattolin, G., Della Porta, G., and Preto, N.: The Latemar: A flat-topped, steep fronted platform dominated by microbialites and synsedimentary cements, Sediment. Geol., 240, 97–114, https://doi.org/10.1016/j.sedgeo.2011.09.001, 2011.
Matthäi, S. K.: Fluid flow and (reactive) transport in fractured and faulted rock, J. Geochem. Explor., 78–79, 179–182, https://doi.org/10.1016/S0375-6742(03)00094-3, 2003.
Matthäi, S. K. and Belayneh, M.: Fluid flow partitioning between fractures and a permeable rock matrix, Geophys. Res. Lett., 31, L07602, https://doi.org/10.1029/2003GL019027, 2004.
Matthäi, S. K. and Nick, H. M.: Upscaling two-phase flow in naturally fractured reservoirs, AAPG Bull., 93, 1621–1632, https://doi.org/10.1306/08030909085, 2009.
McNamara, D. D., Massiot, C., Lewis, B., and Wallis, I. C.: Heterogeneity of structure and stress in the Rotokawa Geothermal Field, New Zealand, J. Geophys. Res.-Solid, 120, 3782–3803, https://doi.org/10.1002/2014JB011480, 2015.
Min, K.-B., Rutqvist, J., Tsang, C. F., and Jing, L.: Stress-dependent permeability of fractured rock masses: A numerical study, Int. J. Rock Mech. Min. Sci., 41, 1191–1210, https://doi.org/10.1016/j.ijrmms.2004.05.005, 2004.
Mueller, M., Jacquemyn, C., Walter, B. F., Pederson, C. L., Schurr, S. L., Igbokwe, O. A., Jöns, N., Riechelmann, S., Dietzel, M., Strauss, H., and Immenhauser, A.: Constraints on the preservation of proxy data in carbonate archives – lessons from a marine limestone to marble transect, Latemar, Italy, Sedimentology, 69, 423–460, https://doi.org/10.1111/sed.12939, 2022.
Narr, W., Schechter, D. S., and Thompson, L. B.: Naturally Fractured Reservoir Characterization, SPE, 2nd Edn., Soc. Pet. Engr., 112 pp., ISBN 978-1-61399-961-52006, 2006.
Oliver, J., Huespe, A., and Cante, J.: An implicit/explicit integration scheme to increase computability of non-linear material and contact/friction problems, Comput. Meth. Appl. Mech. Eng., 197, 21–24, https://doi.org/10.1016/j.cma.2007.11.027, 2008.
Olson, J. E.: Sublinear scaling of fracture aperture versus length: An exception or the rule?, J. Geophys. Res.-Solid, 108, 2413, https://doi.org/10.1029/2001jb000419, 2003.
Olson, J. E.: Fracture aperture, length and pattern geometry development under biaxial: A numerical study with applications to natural, cross-jointed systems, Geol. Soc. Lond. Spec. Publ., 289, 123–142, https://doi.org/10.1144/SP289.8, 2007.
Pascal, C. and Cloetingh, S.: Gravitational potential stresses and stress field of passive continental margins: Insights from the south-Norway shelf, Earth Planet. Sc. Lett., 277, 464–473, https://doi.org/10.1016/j.epsl.2008.11.014, 2009.
Peacock, D. C. P.: A review of Alpine deformation and stresses in southern England, Boll. Del. Soc. Geol. Ita., 128, 307–316, https://doi.org/10.3301/IJG.2009.128.2.307, 2009.
Pierdominic, S. and Heidbach, O.: Stress field of Italy – Mean stress orientation at different depths and wave-length of stress pattern, Tectonophysics, 482, 139–149, https://doi.org/10.1016/j.tecto.2012.02.018, 2012.
Preto, N., Franceschi, M., Gattolin, G., Massironi, M., Riva, A., Gramigna, P., Bertoldi, L., and Nardon, S.: The Latemar: A Middle Triassic polygonal fault-block platform controlled by synsedimentary tectonics, Sediment. Geol., 234, 1–18, https://doi.org/10.1016/j.sedgeo.2010.10.010, 2011.
Ren, F., Ma, G., and Wang, Y.: Unified pipe network method for simulation of water flow in fractured porous rock, J. Hydrol., 547, 80–96, https://doi.org/10.1016/j.jhydrol.2017.01.044, 2017.
Rotevatn, A., Buckley, S. J., Howell, J. A., and Fossen, H.: Overlapping faults and their effect on fluid flow in different reservoir types: A LIDAR-based outcrop modeling and flow simulation study, AAPG Bull., 93, 407–427, https://doi.org/10.1306/09300807092, 2009.
Scholz, C. H.: A note on the scaling relations for opening mode fractures in rock, J. Strut. Geol., 32, 1485–1487, https://doi.org/10.1016/j.jsg.2010.09.007, 2010.
Stephansson, O., Ljunggren, C., and Jing, L.: Stress measurements and tectonic implications for Fennoscandia, Tectonophysics, 189, 317–322, https://doi.org/10.1016/0040-1951(91)90504-L, 1991.
Timothy, J. J. and Meschke, G.: Cascade Lattice Micromechanics Model for the Effective Permeability of Materials with Microcracks, J. Nanomech. Micromech., 6, 04016009, https://doi.org/10.1061/(asce)nm.2153-5477.0000113, 2016.
Wei, K. and De Bremaecker, J.: Fracture growth – I. Formulation and implementations, Geophys. J. Int., 122, 735–745, https://doi.org/10.1111/j.1365-246X.1995.tb06832.x, 1995.
Whitaker, F. F., Felce, G. P., Benson, G. S., Amour, F., Mutti, M., and Smart, P. L.: Simulating flow through forward sediment model stratigraphies: Insights into climatic control of reservoir quality in isolated carbonate platforms, Petrol. Geosci., 20, 27–40, https://doi.org/10.1144/petgeo2013-026, 2014.
Wilson, C. E., Aydin, A., Durlofsky, L. J., Sagy, A., Emily, E., Kreylos, O., and Kellogg, L. H.: From outcrop to flow simulation: Constructing discrete fracture models from a LIDAR survey, AAPG Bull., 11, 1883–1905, https://doi.org/10.1306/03241108148, 2011.
Yale, D. P.: Fault and stress magnitude controls on variations in the orientation of in situ stress, Geol. Soc. Spec. Publ., 209, 55–64, https://doi.org/10.1144/GSL.SP.2003.209.01.06, 2003.
Yan, X. and Yu, H.: Numerical simulation of hydraulic fracturing with consideration of the pore pressure distribution based on the unified pipe-interface element model, Eng. Fract. Mech., 275, 108836, https://doi.org/10.1016/j.engfracmech.2022.108836, 2022.
Yan, X., Sun, Z., and Li, S.: Evaluation of Effectiveness of CO2 Sequestration Using Portland Cement in Geological Reservoir Based on Unified Pipe-network Method, Energies, 13, 387, https://doi.org/10.3390/en13020387, 2020.
Yan, X., Sun, Z., and Dong, Q.: The unified pipe-interface element method for simulating the coupled hydro-mechanical grouting process in fractured rock with fracture propagation, Eng. Frac. Mech., 256, 107993, https://doi.org/10.1016/j.engfracmech.2021.107993, 2021.
Zhang, X. and Sanderson, D. J.: Effects of stress on the two-dimensional permeability tensor of natural fracture networks, Geophys. J. Int., 125, 912–924, https://doi.org/10.1111/j.1365-246X.1996.tb06034.x, 1996.
Zoback, M. D.: Reservoir Geomechanics, Cambridge University Press, Cambridge, UK, 449 pp., ISBN 0521146194, ISBN 9780521146197, 2007.