the Creative Commons Attribution 4.0 License.
the Creative Commons Attribution 4.0 License.
 | 23 Jul 2024
Naturally fractured reservoir characterisation in heterogeneous sandstones: insight for uranium in situ recovery (Imouraren, Niger)
Maxime Jamet
Gregory Ballas
Roger Soliva
Olivier Gerbeaud
Thierry Lefebvre
Christine Leredde
Didier Loggia
This study delves into the characterisation of a heterogenous reservoir, the Tchirezrine II sandstone unit in northern Niger. The characterisation is crucial for potential uranium in situ recovery (ISR) in a naturally fractured and faulted context. Employing a multifaceted approach, including well log data, optical borehole imagery, and hydrogeological tests, alongside satellite-based lineament analysis, this study provides a comprehensive understanding of the structures and their impact on fluid flow. Lineament analysis reveals scale-dependent patterns, consistent with spatially homogeneous joint networks restricted to mechanical units, as well as nearly scale-invariant patterns, better corresponding to spatially heterogeneous fault networks. Various deformation structures are detected from borehole imagery, including extensional fractures, cataclastic deformation bands, and brecciated–cataclastic fault cores. Based on well log data, the Tchirezrine II reservoir displays heterogeneous porosity and permeability related to its fluvial context. These data differ from the traditional porosity–permeability relationship obtained in a sandstone reservoir matrix but are instead consistent with Nelson's classification, emphasising the impact of deformation structures on such petrophysical properties. Hydrological tests have been implemented into a zone of E–W-trending deformation structures, revealing a strong permeability anisotropy. This strong E–W anisotropy is consistent with the presence of the observed E–W structures, i.e. with a draining behaviour of extensional open fractures and a sealing behaviour of both cataclastic bands and fault rocks. Considering implications for ISR mining, this study allows the discussion of the interplay between fractures, faults, and fluid flow properties. It suggests that a well pattern perpendicular to the main permeability orientation can attenuate channelled flow, thus improving the contact of the leach solution with the mineralised matrix. These results provide an integrated approach and a multi-scale characterisation of naturally fractured reservoir (NFR) properties in sandstone, offering a basis for the optimisation of NFR production such as ISR development.
- Article
(13577 KB) - Full-text XML
-
Supplement
(1789 KB) - BibTeX
- EndNote


Geological reservoirs have long played a crucial role in a variety of fields from water resources management (Keller et al., 2000) to oil and gas extraction (Barwis et al., 1990; Cubitt et al., 2004; Goodwin et al., 2014). Today, their importance extends to addressing environmental concerns, especially the transition to low-carbon energies (Evans et al., 2009), encompassing activities such as CO2 sequestration (Qi et al., 2023), hydrogen storage and production (Sambo et al., 2022), geothermal energy (Moeck, 2014), nuclear waste repository (Rempe, 2007), and in situ recovery (ISR) of metallic resources (Seredkin et al., 2016). Geological reservoirs are complex media, where petrophysical properties (porosity and permeability) control the capacity to contain and transport the fluids (Bear, 1972). These properties are affected by numerous and imbricated sedimentary–diagenetic and tectonic processes that makes the evaluation of reservoir quality a recurring challenge. This complexity is particularly evident in fractured and faulted environments, known as naturally fractured reservoirs (NFRs) (Narr et al., 2006; Nelson, 2001). The NFRs are classified by Nelson (2001), following the relative contribution of the fractures and the matrix to the porosity and permeability values. This classification was applied in numerous NFR characterisations (see Allan and Sun (2003), for a review), especially in tight matrix reservoirs (Evans and Lekia, 1990; Harstad et al., 1995; Lee and Hopkins, 1994; Northrop and Frohne, 1990; Olson et al., 2009). However, the application of such a classification remains a challenge in high-porosity matrix reservoirs and within polyphase tectonic settings. The multiple tectonic phases and associated processes in a such a setting can make the deformation structures more or less favourable or penalising for exploitation, in terms of petrophysical properties, by draining or compartmentalising the reservoir (Antonellini and Aydin, 1994; Aydin and Johnson, 1978; Ballas et al., 2015; Fossen et al., 2017; Wilkins et al., 2020). Structural and petrophysical properties of NFRs remain poorly constrained in reservoirs composed of both tight and porous sedimentary bodies (e.g. Doyle and Sweet, 1995). In such a context, it is essential to study the arrangement of deformation structures and quantify their respective petrophysical impact within the different parts of the reservoir (vertical and lateral variations in mechano-stratigraphic properties). A better understanding of the relationships between the matrix characteristics, the deformation arrangement and processes, and the petrophysical properties is fundamental to improve reservoir management in such heterogeneous geological systems (Sonntag et al., 2014). This issue is of first importance for potential ISR exploitation of metallic ore deposits, such as uranium, in mixed matrix – NFR context.
Fluvial sandstone sequences are highly heterogeneous reservoirs, providing a real challenge for the analysis of the great diversity of the structures they can contain and their role in fluid flow. These heterogeneities are characterised at several levels. First, sedimentological variations within sandstone bodies, encompassing both vertical and lateral dimensions, introduce complexities arising from porosity, permeability, grain size, sorting, shape variations, and mineral content (Gibling, 2006; Miall, 1988; Morad et al., 2010). Second, these factors introduce significant heterogeneity in petrophysical properties within reservoir units. These factors also significantly shape deformation mechanisms occurring in sandstone reservoirs (Aydin et al., 2006; Fossen et al., 2007), following the transition between the brittle and cataclastic deformation of such porous rocks (Wong et al., 1997; Wong and Baud, 2012). Third, extensional fracture or disaggregation structures are preferentially formed in low-porosity, fine-grained, and poorly sorted sandstones, whereas compactional shear deformation bands, with cataclastic behaviour, are favoured in highly porous, coarse-grained, and well-sorted ones (Ballas et al., 2015; Fossen et al., 2017; Schultz et al., 2010). Fourth, the shape and the composition of grains, especially the clay content (Antonellini et al., 1994; Fisher and Knipe, 2001; Gibson, 1998), also contribute to the initiation of various deformation structures. A precise characterisation of the host sandstone properties is then necessary to understand the typology of deformation mechanisms and evaluate their impact on the reservoir properties in such a context. Small-scale structures such as those previously mentioned are generally observed in NFR boreholes and are potentially linked to large-scale structures; they may also be totally independent of large-scale faults, such as joint sets and deformation band networks (e.g. Mayolle et al., 2019; Pollard and Aydin, 1988; Soliva et al., 2016). This diversity of structure and spatial organisation implies multi-scale transfer properties in NFR that are still poorly described and understood, especially regarding their impact on fluid flow (Warren and Root, 1963; Nelson, 2001). Due to the aforementioned reasons, characterisation of the role of such structures on fluid flow in sandstone NFR requires multi-scale and multi-method investigation.
In this paper, we use a multifaceted approach to constrain the properties of a reservoir in a context of heterogeneous fluviatile–sandstone and a polyphase tectonic area in northern Niger (Tchirezrine II reservoir). Our study is based on (i) statistical lineament analysis and interpretation based on satellite images of outcrop areas of the reservoir; (ii) in situ analysis with well log data, including optical borehole imagery and geophysical data (sonic porosity and nuclear magnetic resonance (NMR) permeability); and (iii) hydrogeological tests (dewatering and salt tracing test). The Tchirezrine II reservoir, at the Imouraren site, is presently studied for potential uranium ISR production that has never been completed in such a complex NFR context. Understanding fluid flow in such a NFR is crucial to optimise ISR production cells (i.e. several injection and pumping wells traditionally spaced 10 to 20 m apart), where channelised flow, carried by deformation structures, provides a potential bypass for a leaching solution, limiting its access to the uranium ore. The combined approach proposed here aims to provide an integrated comprehensive characterisation of a complex NFR, encompassing both subsurface and surface data. We interpret and discuss our findings in terms of (i) the spatial organisation and (ii) petrophysical properties of the structural network and of (iii) the resulting anisotropy of permeability driven by these structures. Based on our findings, we make recommendations concerning anisotropic flow management for potential ISR facilities.
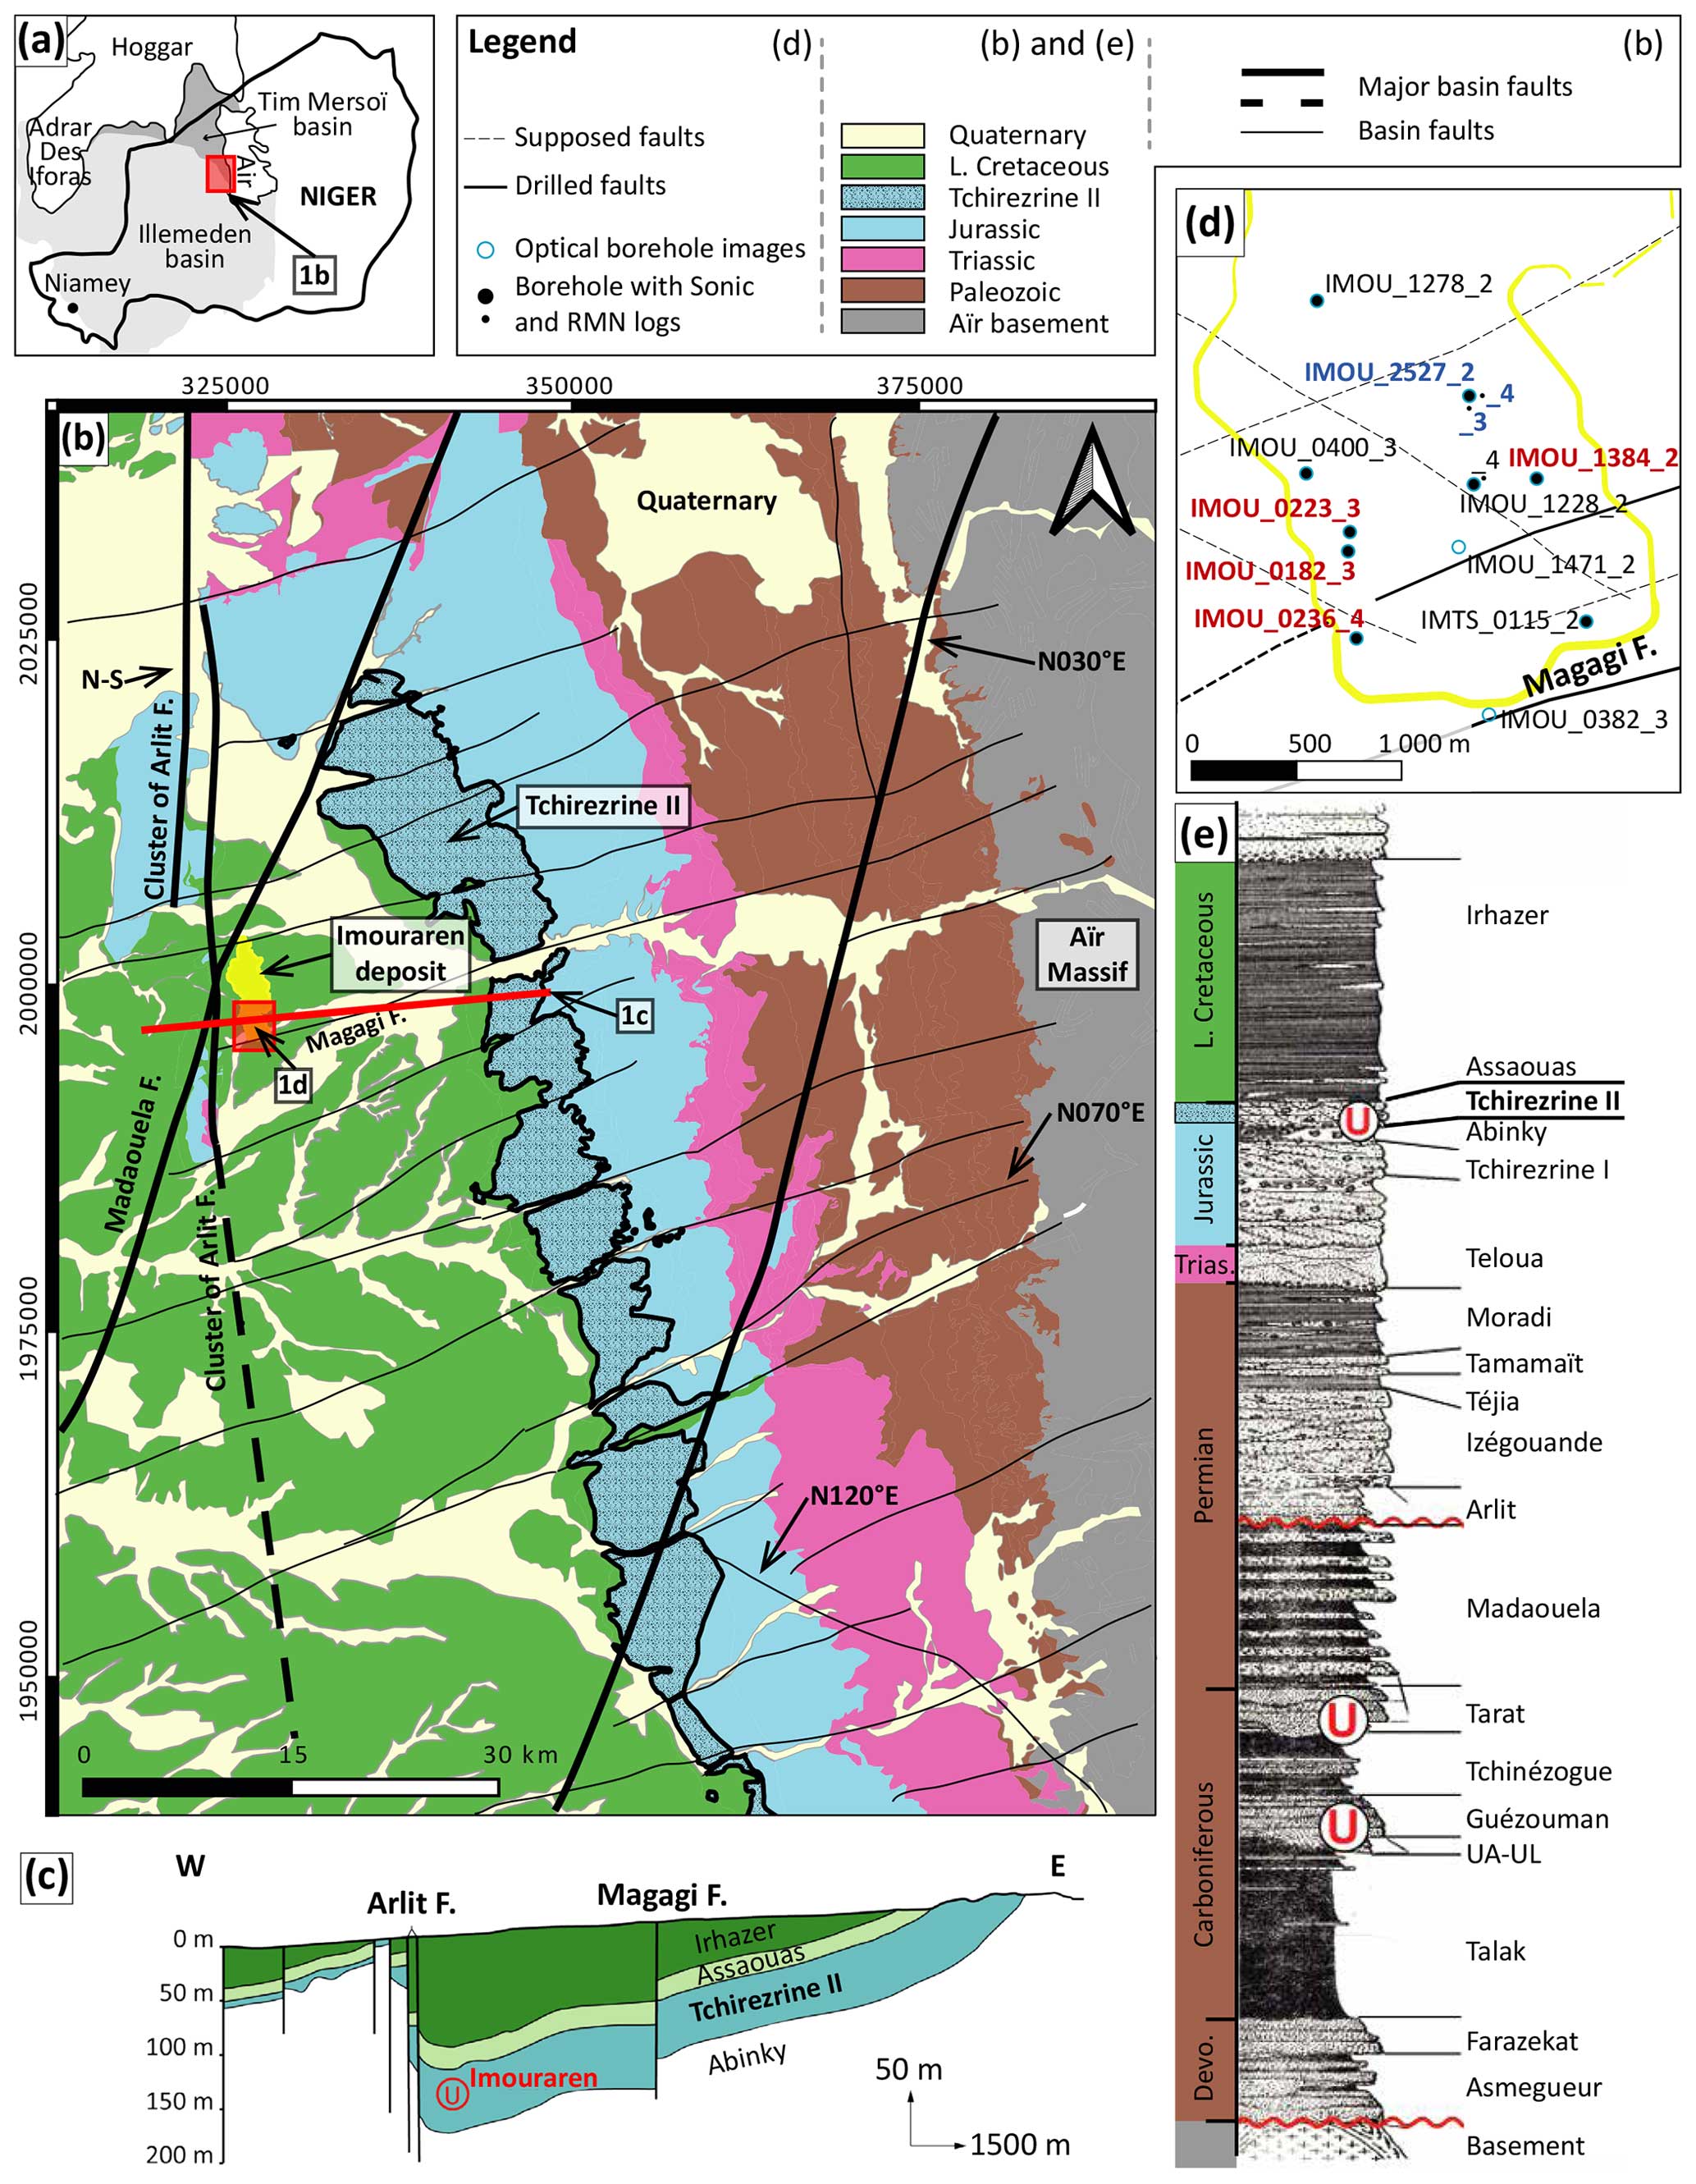
Figure 1(a) Location map of the Tim Mersoï Basin in northern Niger (modified from Gerbeaud, 2006). (b) Geological map of the study area showing the location of the Tchirezrine II outcrop and the Imouraren site. Modified from the Orano internal database. See Sect. 2.1 for the descriptions of the different sets of faults. (c) Cross section between the Arlit fault and Tchirezrine II outcrop (Orano internal report based on exploration drills). (d) Location of the studied wells within the Imouraren site; red wells are ones from Figs. 7d, 8d, and 10c, and blue wells are ones from aquifer testing (see Sect. 3.3; Figs. 9 and 11a). (e) Lithostratigraphy modified from Gerbeaud (2006).
2.1 Tectonic framework
The Tim Mersoï Basin (Niger) is the northern part of the Iullemeden Basin that covers a large part of western Niger in central North Africa (Fig. 1a). It is located at the intersection of the West African Craton and the East Saharan Craton and forms a north–south trench resting on the Adrar des Ifoghas Massif to the west, the Hoggar Massif to the north, and the Aïr Massif to the east. The basin has experienced a polyphase tectonic evolution with extensional phases during the Visean, the Lower Permian, and the Atlantic rifting (Sempere and Beaudoin, 1984; Valsardieu, 1971) and compressional phases during Hercynian orogeny and Late Cretaceous Alpine event (Gerbeaud, 2006; Guiraud et al., 1981; Yahaya and Lang, 2000). This complex tectonic evolution leads to the formation of various deformation structures affecting both the crystalline basement and the Devonian to Lower Cretaceous sediment infilling (Fig. 1b) (Gerbeaud, 2006; Guiraud et al., 1981; Valsardieu, 1971; Yahaya, 1992). These structures include N–S, N30°, N70–80°, and N140–150° fault systems (Gerbeaud, 2006; Valsardieu, 1971). This structural framework was reworked during the Late Cretaceous compressional event with the N30° faults in reverse motion, the dextral strike-slip motion of the N070° E faults, and the sinistral strike-slip reactivation of the N–S Arlit fault. The Imouraren U deposit is located in a syncline structure that borders the Arlit fault to the east (Fig. 1b and c). The Madaouela N030° E fault to the north and the Magagi N070° E fault to the south delimit the borders of the Imouraren site. Numerous small-scale faults and fractures are interpreted in the sedimentary reservoir hosting the Imouraren deposit, based on drilling data. There are few structural constraints on this fracture and fault system as the reservoir is buried beneath more than 100 m of Cretaceous mudstone (Fig. 1c). At the basin scale, regional faults are considered to have played a role in the transfer of mineralising fluids during the uranium ore deposition stage (Gerbeaud, 2006; Mamane Mamadou et al., 2022; Pagel et al., 2005).
2.2 Lithostratigraphy
The lithostratigraphic column of the Tim Mersoï Basin (Fig. 1e) is divided in three main sedimentary stages: a fluvio-deltaic period from the Devonian to Lower Permian, a continental sedimentation from the Permian to Jurassic, and a lacustrine sedimentation in the Lower Cretaceous (Valsardieu, 1971). Uranium mineralisation in the Imouraren deposit is hosted within the Tchirezrine II sandstone unit, corresponding to the Upper Jurassic part of the Agadez group. This unit shows an average thickness of 50 m and contains arkosic sandstones enriched with reworked analcime (i.e. diagenetic mineral classified as a zeolite and inherited from fine volcanic sediments) intraclasts, as well as massive analcimolite horizon. These sediments represent fluvial deposits in a braided system evolving into a meandering system (Mamane Mamadou, 2016; Valsardieu, 1971). This unit is carrying a confined aquifer. The Tchirezrine II unit overlies the argillaceous (+ analcime and fine-grained sandstones) Abinky formation (Upper Jurassic) and is overlaid by a 100 m thick series of Lower Cretaceous claystones (Assouas siltstone and Irhazer mudstone) above the Imouraren deposit.
3.1 Lineament study
In order to better constrain the geometrical organisation of the deformation structures affecting the Imouraren reservoir, part of this study involves an analysis of lineaments using satellite images. We focus our observations (i) at the basin scale to better constrain the structural context and (ii) at the reservoir scale to analyse the geometrical organisation of the Tchirezrine II structural network. Mainly because of the significant sand cover throughout the basin, we did not carry out an extensive analysis of the geometrical organisation of the basin's structural network.
3.1.1 Data acquisition
The coordinate reference system (CRS), with EPSG:32632 – WGS 84/UTM zone 32N, was used during this project. Images from the Google Earth Pro database have been used to digitise five different sets of fracture networks. Google, Landsat/Copernicus, CNES Airbus, and Maxar Technologies have an assembly of orthomosaics that was used to create a first-order (i.e. basin-scale) lineament map (1:3000) to reference large-scale structures affecting the Tim Mersoï Basin. This rectangular map (x = 312798; 392132 and y = 1940042; 2041469) covers a sampling area of 7500 km2 from the Aïr Massif to the Imouraren site from east to west, respectively. Google and Maxar Technologies have orthomosaics of 0.3 m pixel−1 resolution that have been used to sample second-order (i.e. reservoir-scale) lineaments (1:30) from four different sampling areas in the Tchirezrine II unit. We placed a circular sampling area in each site, following (Mauldon et al., 2001, and Watkins et al., 2015) recommendations to inhibit orientation bias. The size of each circle varies and ranges from 72.9 to 123 m radius in order to maximise the sampling area of each site (i.e. each outcrop area has been chosen to optimise the cleanest possible sampling surfaces and to limit the censoring bias). In addition, the size of these circular sample areas is of the same order of dimensions as a set of ISR cells.
We have digitised the lineament network using QGIS 3.24 (QGIS Development Team, 2020). Built-in functionalities from QGIS were used to extract topological parameters such as azimuth, length, intersection points (referred to as nodes), and censored lineaments (e.g. traces which cut the sampling windows). We have also manually labelled lineaments intersecting censored areas such as sand deposit coverage. Azimuth parameter was established for each lineament, considering the straight line between the starting and the end point. Length parameter was measured for each lineament from the addition of all segment lengths (i.e. a segment is here defined as a straight line between vertices, and lineaments are made up of a set of segments inter-connected by vertices). Further information on the topological analysis of lineament and fracture networks can be found in Dichiarante et al. (2020), Manzocchi (2002), Odling et al. (1999), Ovaskainen et al. (2022, 2023), Sanderson and Nixon (2015), and Watkins et al. (2015).
3.1.2 Fracture network characterisation
Azimuth sets
Azimuths from each sampled area were plotted in a length-weighted half-rose diagram, where bins represent 10° of azimuth, and the radius is the length-weighted frequency (Sanderson and Peacock, 2020). For the first-order lineament map (see Sect. 3.1.1), the rose diagram was compared to the large-scale structures described in the literature (Gerbeaud, 2006). This rose diagram is also useful to have an overview of the Tchirezrine II fracture networks within the large-scale structural context of the Tim Mersoï Basin. Rose diagrams of second-order lineaments (see Sect. 3.1.1) were used to identify different sets of lineaments at the reservoir scale. These sets can be analysed separately in order to characterise their similarities and differences (i.e. spacing, length distribution, and nature).
General network parameters
To describe the number of fractures, Dershowitz and Herda (1993) have introduced the fracture intensity (m−1) parameter (P21), which is calculated from the total fracture length (Σlength; m) divided by the sampled area (m2). The P21 parameter is also calculated for a specific azimuth set of lineaments, which allows a better comparison of their spatial distribution. We also consider the intersection node intensity (node m−2) parameter (INi), which is computed for each circular window from the number of intersection (nodes) of the whole lineament dataset, divided by the sampling area (m2). The INi parameters from sampled areas are then plotted against the P21 from different azimuth set, highlighting their potential relationships.
Spacing
Spacing analysis was done for second-order lineament sets in the circular sampling area. Each set of orientation was analysed individually by image processing. One binary image (black and white) by set of lineaments was extracted without the background Earth surface image and was rotated to position the average azimuth along the x axis of the image. Using the Analyze Line Graph tool in ImageJ software (Abràmoff et al., 2004), each pixel column along the y axis (normal to the x axis) was analysed to export the coordinates of each lineament intersecting the pixel column. For each column of pixels, we can therefore calculate the distance between two consecutive lineaments. To improve the representativity of the data, we manually checked the largest spacing values in places without censoring bias for each set of lineaments and ignored higher spacing values due to censoring by sand cover. In order to compare each set to each other, and to represent the distribution of the spacing values, we have plotted the values in boxplot graphs. The coefficient of variation (Cv), defined as the standard deviation divided by the mean spacing (Cox and Lewis, 1966), was used to discuss the spatial distribution of each set. According to Odling et al. (1999), if Cv < 1, the lineaments are regularly spaced, and if Cv≥ 1, the lineaments then show a random to more clustered distribution.
Length distribution
Length distribution analysis is commonly used to characterise the geometrical properties of a lineament set (Cowie et al., 1995; Jackson and Sanderson, 1992; Odling et al., 1999; Ovaskainen et al., 2023; Soliva and Schultz, 2008; Walsh et al., 1991). This can be done by plotting the lineament length versus the cumulative frequency in a log-log plot (Childs et al., 1990). From these plots, we have performed a least squares fit for the power and the exponential law and quantified the fit of the distribution trend with its least squares coefficient (R2). A power law distribution, which is commonly found in fault length distribution, can be described as scale-invariant (for an exponent close to 2; Berkowitz and Adler, 1998) in lineament length (Bonnet et al., 2001; Watterson et al., 1996; Yielding et al., 1996), whereas an exponential distribution characterises scale-dependence. Joint sets can show scale-dependent characteristics due to mechanical layering, i.e. lithological or structural boundaries (Bai et al., 2000) that limit the structure propagation (e.g. for lithological fault ending, see Soliva et al., 2006).
To perform a length distribution analysis, two geometrical biases are important to be determined. (i) Truncation bias affects the frequency of small lineaments due to the limited resolution of the orthophotography in which the lineaments are detected (i.e. the smallest fractures will be under-sampled due to the image resolution). This bias can be considered using a lineament size cut-off below which the lineaments are much too truncated and should not be included in the determination of the length distribution law (Heffer and Bevan, 1990; Odling, 1997). Considering the resolution (0.3 m pixel−1) of the image data, we have chosen a 6 m value for truncation cut-off in accordance with other studies (e.g. Bonnet et al., 2001; Soliva and Schultz, 2008). If we consider a reasonable margin of error of 2 pixels (0.6 m) when sampling the lineaments, then the length values are not truncated greater than of their real length, and this ratio decreases as the length of the lineaments increases. (ii) Censoring bias is the underestimation of the length of generally large lineaments caused by the limitation of the sampling window or by sand cover, in our specific case. Following a recommendation from Yielding et al. (1996), we have included lineaments that are affected by censoring in the determination of the length distribution law since excluding them gives more error in the scaling determination.
3.2 Well data
The dataset used for this study was collected from 12 vertical boreholes, including core descriptions and geophysical logging. The study focuses on boreholes drilled in the southern part of the Imouraren deposit, spaced from a 100 m to several kilometres apart (Fig. 1d). The dataset presented in this study comes mainly from the basal section of the reservoir, between 133 and 160 m depth, consistent with the scope of Orano's uranium ISR target.
3.2.1 Core description
Drill cores have been described in term of lithology (i.e. mainly the sandstone fluvial sequences) and deformation structures such as fractures, deformation bands, and faults. The sandstone granulometry is also specified, i.e. from very fine sandstone (VFS) to very coarse sandstone (VCS), using conventional grain diameter classes (Nichols, 2009). As this study focused on sandstones, data classified as VFS, showing a systematically high proportion of clay (Billon, 2014; Mamane Mamadou, 2016), were excluded from the structural analysis.
3.2.2 Optical borehole images
Optical borehole image data were acquired using the Advanced Logic Technology (ALT) probe called OBI40-2G. Deformation structures have been classified from analyses of OBI, based on colour and aspect, and cross-checked from drill core pictures based on apparent morphology (e.g. texture, shear displacement, aperture, and cataclasis). From these observations, the structures have been classified into three types: extensional fractures, deformation bands, and faults (following the glossary of Peacock et al., 2016). P10 density is calculated following Dershowitz (1984), corresponding to the number of fractures counted per metre (m−1) along a 1D scan line and corresponding here to the borehole.
Geometrical attributes of these structures, such as dip and azimuth, can be extracted from OBI by fitting a sinusoidal curve on unrolled and oriented images (Zemanek et al., 1970). Orientation data from picked structures have been analysed only with a strike in order to compare them with lineament data from 2D satellite images.
3.2.3 Geophysical logging and processing
Geophysical logging data from vertical boreholes (Fig. 1d) consist of (i) the wave slowness of the formation, as well as fluid slowness from the Fullwave Sonic Logging tool (acoustic data were acquired using a GeoVista probe called ASNC), allowing a porosity estimation (PHIS) based on Wyllie et al. (1956) (Eq. 1); (ii) a permeability log from nuclear magnetic resonance (NMR) logging tool (NMR data were acquired using NMRSA's QL40BMR-90 probe), allowing a permeability estimation (KSDR) based on the Schlumberger–Doll research equation (Eq. 2) (see Elsayed et al., 2022, and Hidajat et al., 2004, for additional information on the NMR theoretical background).
where Dtc is the formation slowness (µs m−1), Dtcm is the matrix slowness (µs m−1) set at 173µs m−1 for the study, and Dtcf is the fluid slowness (µs m−1).
where KSDR is the NMR permeability, a is a formation-dependent variable, T2LM is the logarithmic mean of the T2 relaxation time (ms), and TPOR is the total porosity from NMR measurement (%).
A sampling step of 0.1 m was used to recover both PHIS and KSDR across the reservoir. Each datum is associated with the lithological label defined from the core description and plotted in the porosity–permeability graph. We also used the derived Kozeny–Carman equation (Eq. 3) from Bear (1972) to model the theoretical evolution of permeability as a function of porosity for various homogenous grain size diameters. Different theoretical porosity–permeability curves corresponding to various grain size classes are used for comparison with the measured dataset.
where k is the permeability (Darcy), φ is the porosity (%), and d is the grain size diameter (m).
3.3 Aquifer testing
An aquifer testing has been realised on well IMOU_2527-2 in order to estimate the characteristics of a depression cone in a long-duration pumping operation. Two piezometers were drilled at 17 m from IMOU-2527-2 in the southern (IMOU_2527-3) and eastern (IMOU_2527-4) directions (Fig. 1d). During the pumping sequence, the piezometric level was measured manually every minute for the first 10 min and with an increasing sampling step to reach a measurement every 2 h after 72 h. The test was stopped after 830 h (∼ 35 d) of pumping. The final dewatering levels in the piezometers have been used to estimate the extension of the cone of depression in the eastern and southern directions by plotting these levels (m) versus the distance of the piezometers (m) in a logarithmic scale. A logarithmic trend line fit has been made to show the distance at which dewatering reaches 0 m (Kruseman and de Ridder, 2000).
Tracing involves injecting a tracer (NaCl brine) into a piezometer located in the drawdown cone of a pumped well into production and observing its recovery at the pumping well (see Taylor et al., 2010, for additional information). Forced-flow tracing was used, involving the injection of 1700 L of fresh water after the brine injection. Monitoring was carried out on the surface by installing an online conductivity meter on the discharge and by using an in situ resistivity log (resistivity data were acquired using GeoVista's DLL3 probe; the recording interval was 1 h for the duration of the tracing). Salt restitution, and in particular chloride restitution, is assessed by establishing a correlation line between [Cl−] vs. conductivity. The chloride restitution is then estimated over the time (additional information on tracing operations is given in Table S1 in the Supplement). Tracing was firstly performed on a N–S axis (from IMOU_2527_3 to IMOU_2527_2) and then on an E–W axis (from IMOU_2527_4 to IMOU_2527_2) after returning to the initial conductivity condition.
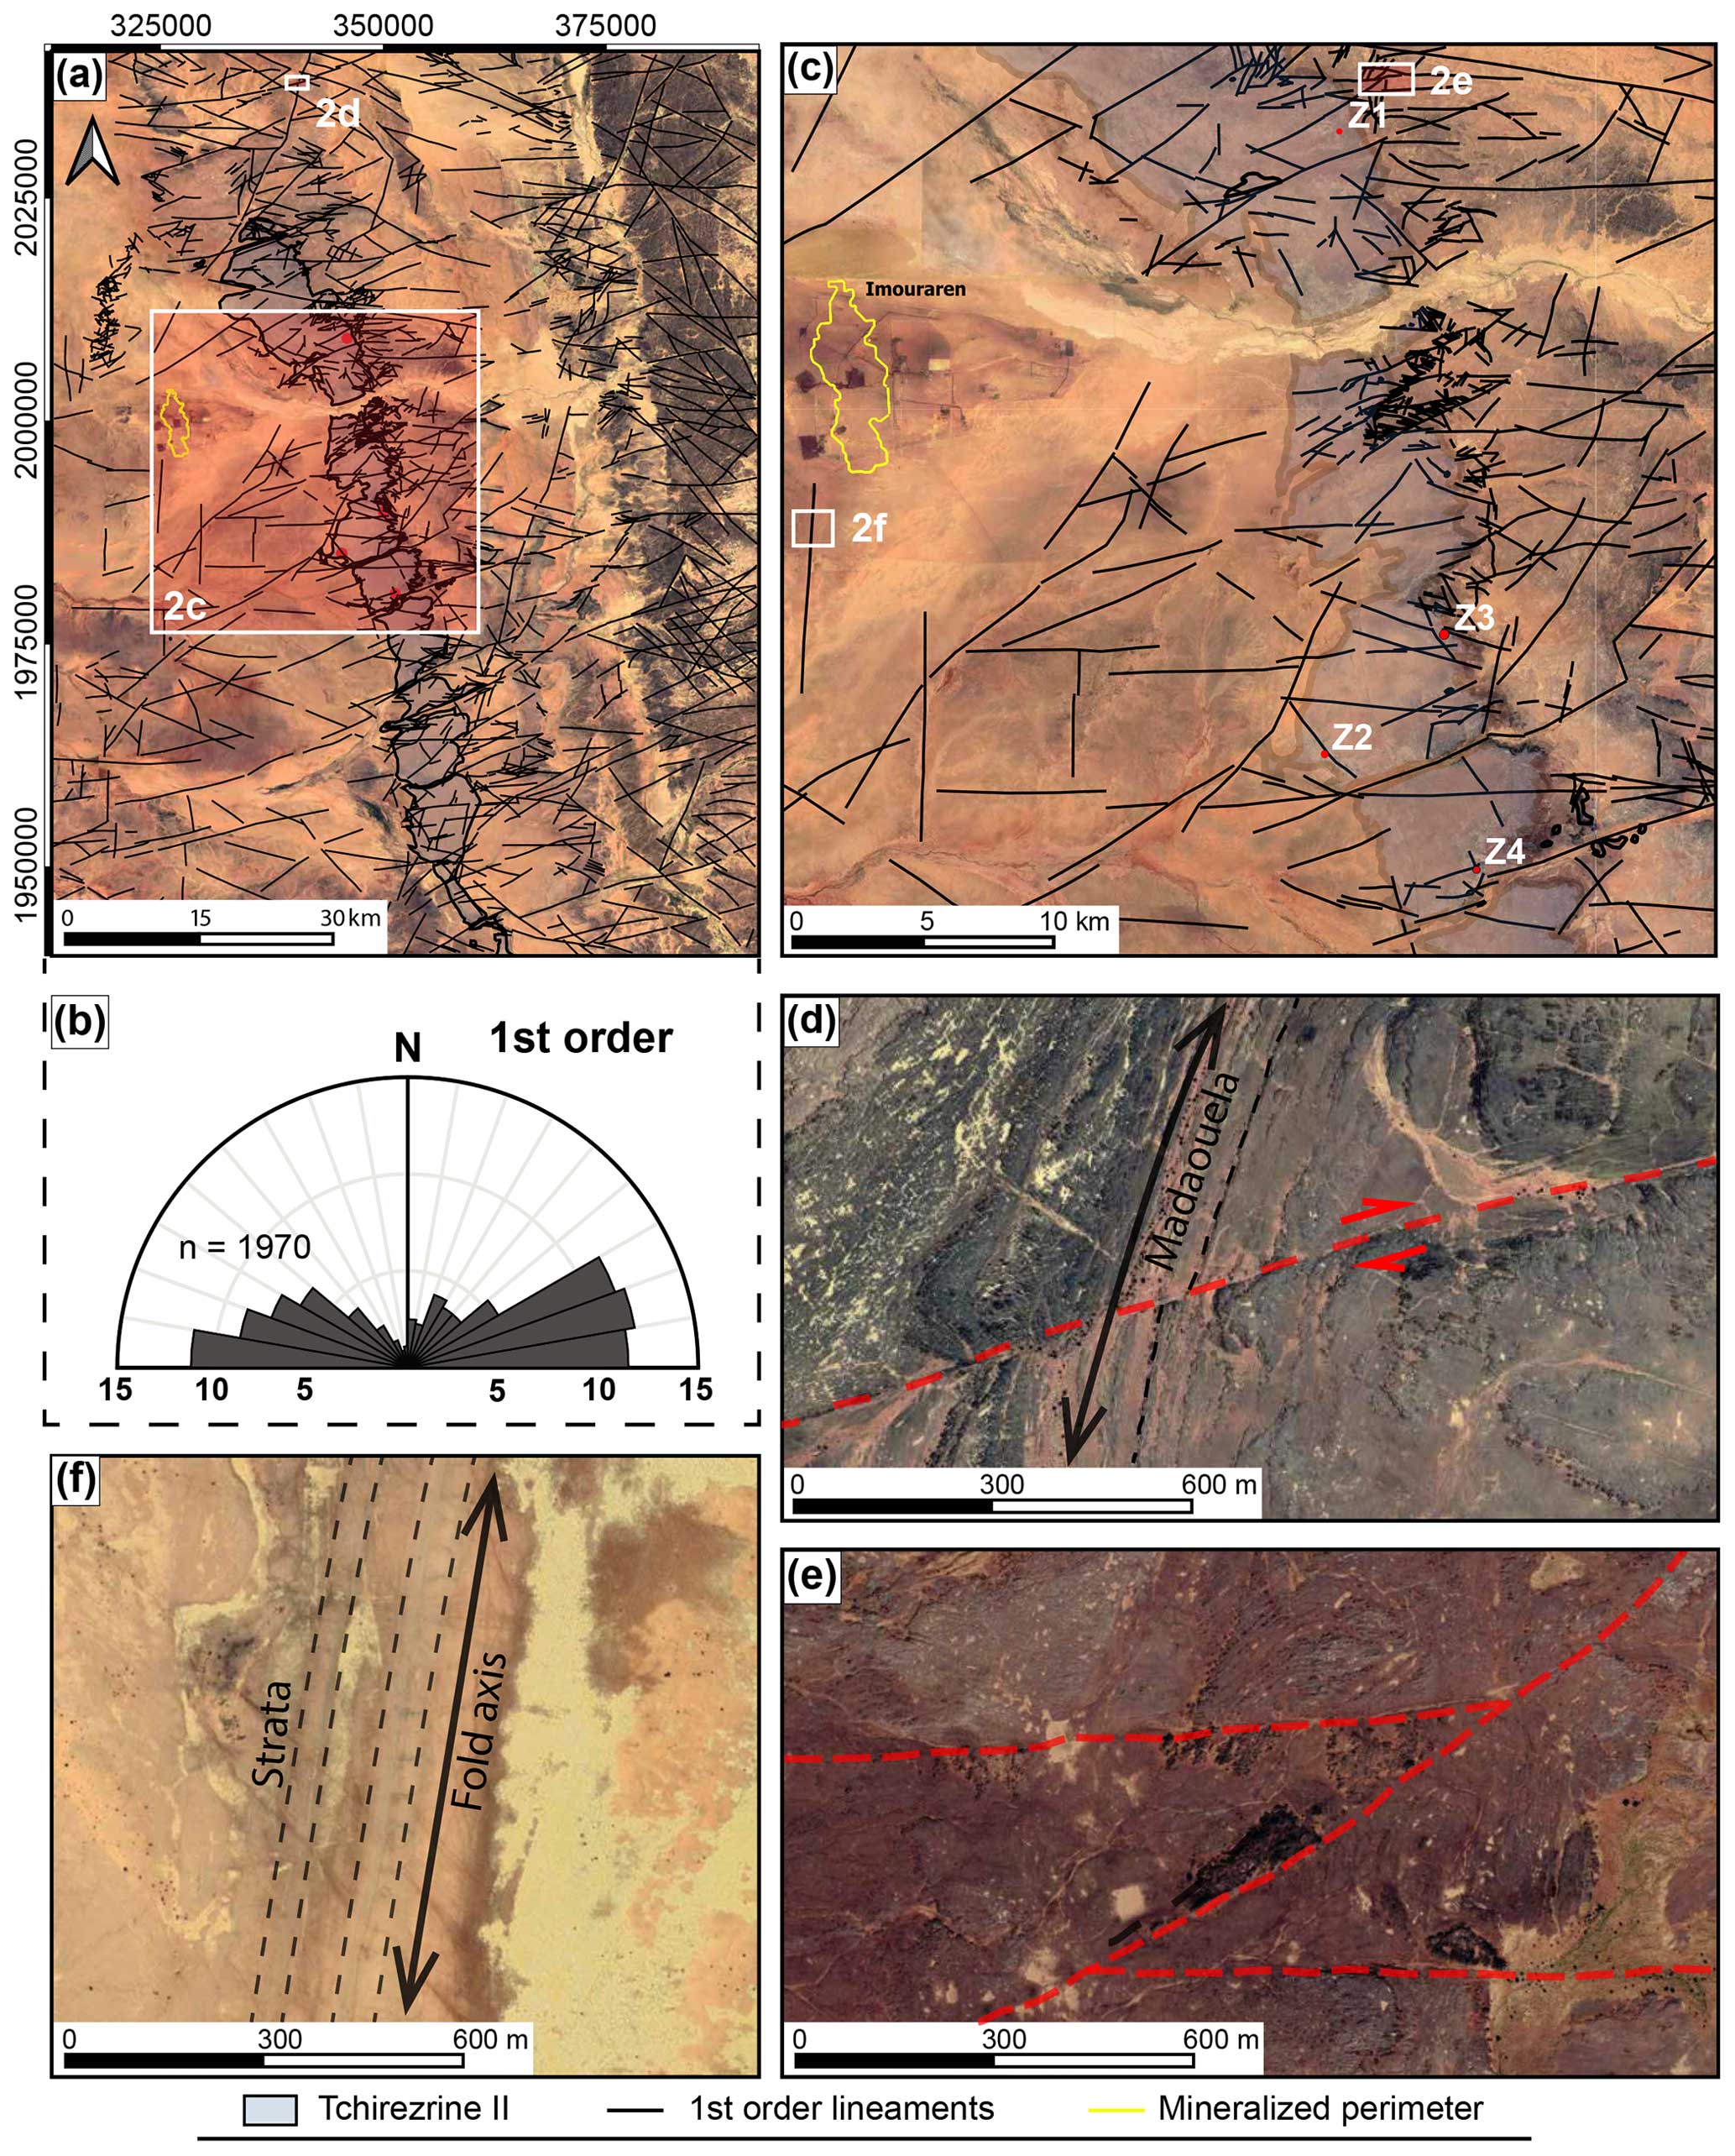
Figure 2Lineament map and their features observed at the basin scale. (a) Mapping of lineaments at the basin scale. (b) Rose diagram showing the length-weighted azimuth of mapped lineaments. (c) Detailed view of the large-scale map focusing on the area around the Imouraren site and the outcropping Tchirezrine II area. The locations of the Z1 to Z4 sampled areas are also reported on this map. (d) Example of the conjugate system of N070° E and N110° E strike-slip faults cutting across a N030° E-trending fold. (d) Example of E–W faults associated with a N060° E fault. (f) Example of N010° E-trending fold related to a segment of the Arlit cluster faults. Map data: © Google (a and c–f), © Landsat/Copernicus (a), © Airbus (c, d), © CNES/Airbus (c), and © Maxar Technologies (c, e and f).
4.1 Lineament analysis from satellite images
4.1.1 Basin-scale structures
At the basin scale, the lineaments are organised in four main sets of distinct orientations (Fig. 2a and b).
-
The N060° E–N080° E (ENE–WSW) set consists of lineaments with apparent dextral shear movement (Fig. 2d and e). These faults are distributed homogeneously across the sampling window, although they are sometimes difficult to observe because of the Quaternary sand cover (Fig. 2a and c). Some minor E–W-trending faults are commonly observed to be linked to these ENE–WSW faults (Fig. 2c and e).
-
The N110° E–130° E (ESE–WNW) set is composed of lineaments with an apparent sinistral shear movement (Fig. 2d and e). These faults are conjugate to the ENE–WSW dextral strike-slip set, as illustrated by their mutual crosscutting relationships (Fig. 2c and d).
-
The N170° E–N010° E (N–S) set is sub-parallel to the Arlit fault that borders the western part of the Imouraren deposit (Fig. 2f). This set is poorly outcropping because of the sedimentary cover (Irhazer claystone, as well as actual aeolian and alluvial deposits) and is frequently underlined by the presence of folds in the western part of the study area.
-
The set N010° E–N040° E (NNE–SSW) is mainly detected in the basement of the Aïr Massif. This set also affects the sedimentary cover but is generally expressed by kilometre-scale folds related to the faults. Two main structures named Madaouela (Figs. 2a (north one), d, 1b) and Adrar Emoles (Fig. 2a (south one)) are present in the study area. These structures have about 40 km of spacing and crosscut both the basin and the basement from the eastern part to the western part of the window. The Madaouela structure is also bordering the northern part of the Imouraren deposit and links to the Arlit N–S fault (Fig. 1b).
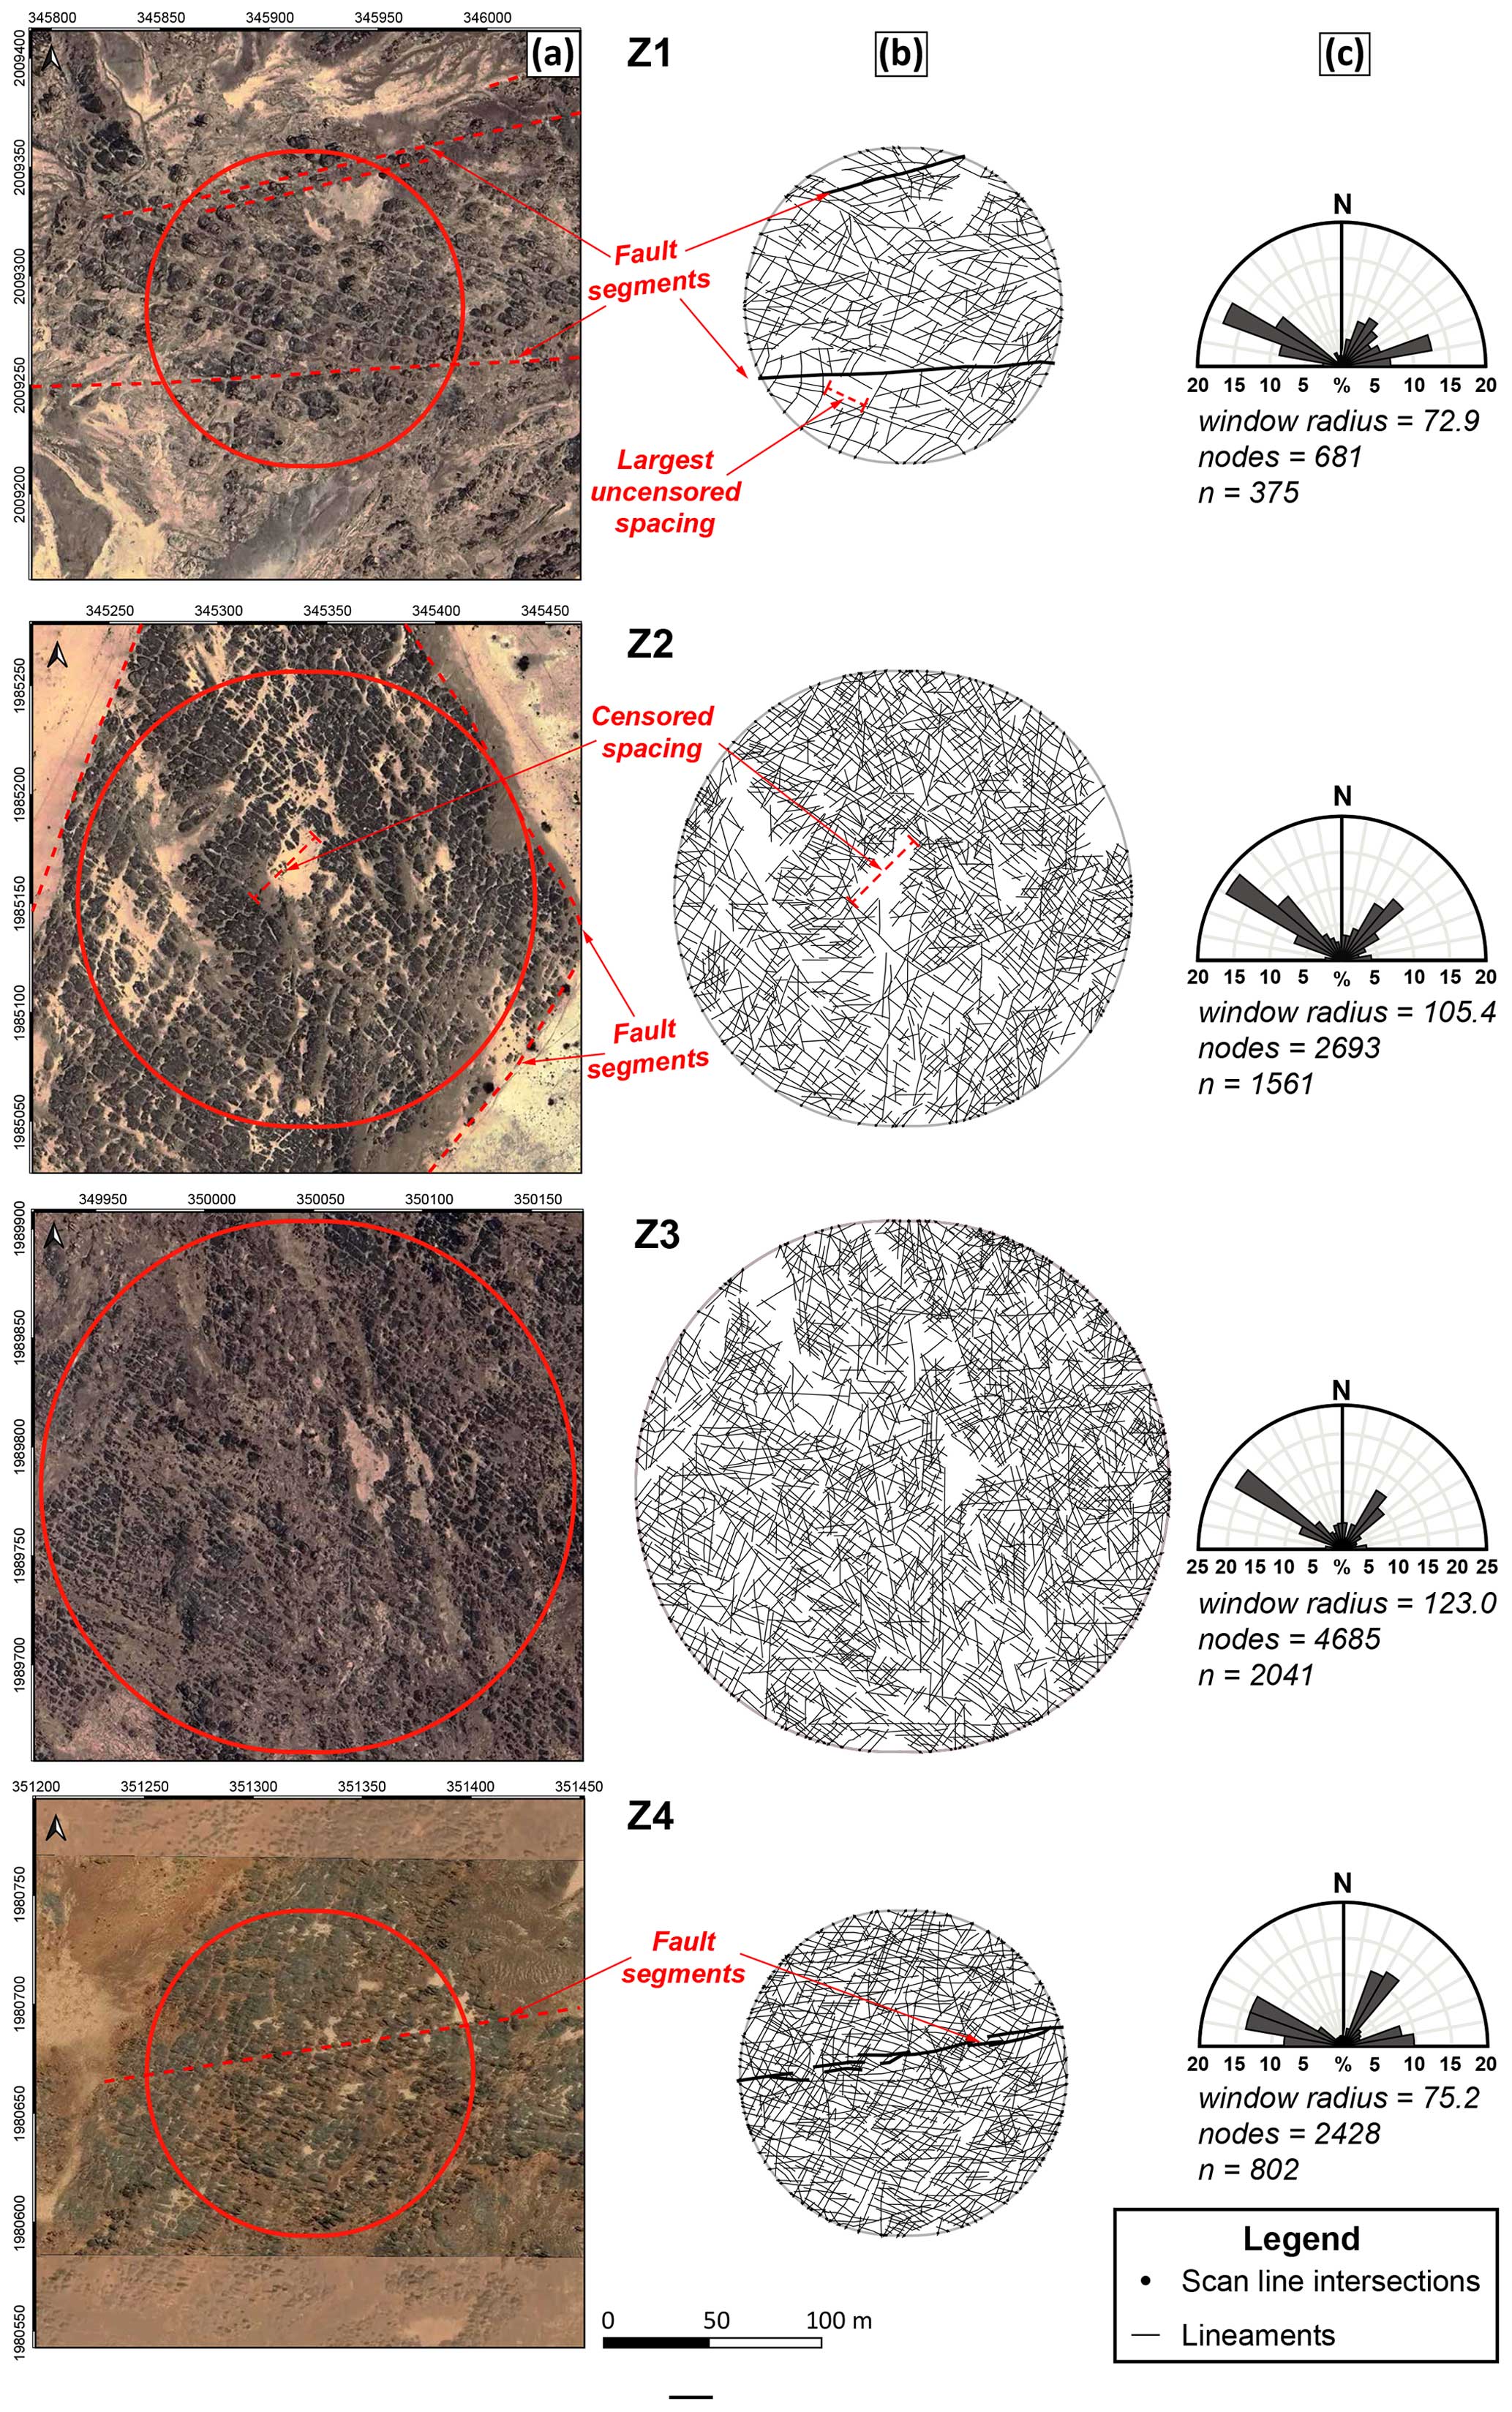
Figure 3Detailed description of the lineaments affecting the Tchirezrine II in the four circular sampling windows (Z1 to Z4). (a) Satellite images showing the sampling window in red. (b) Lineament traces inside the window (see Fig. S1 for a detailed version with intersection nodes and censored lineaments). (c) Length-weighted rose plot showing lineament azimuth distribution. n is for the number of lineaments. The red lineaments are censored at the boundary of the sampling window. See Fig. 2c for the location of the sampling windows in the study area. Satellite image data from © Google, © Airbus (Z1, Z2, and Z3), and © Maxar Technologies (Z4).
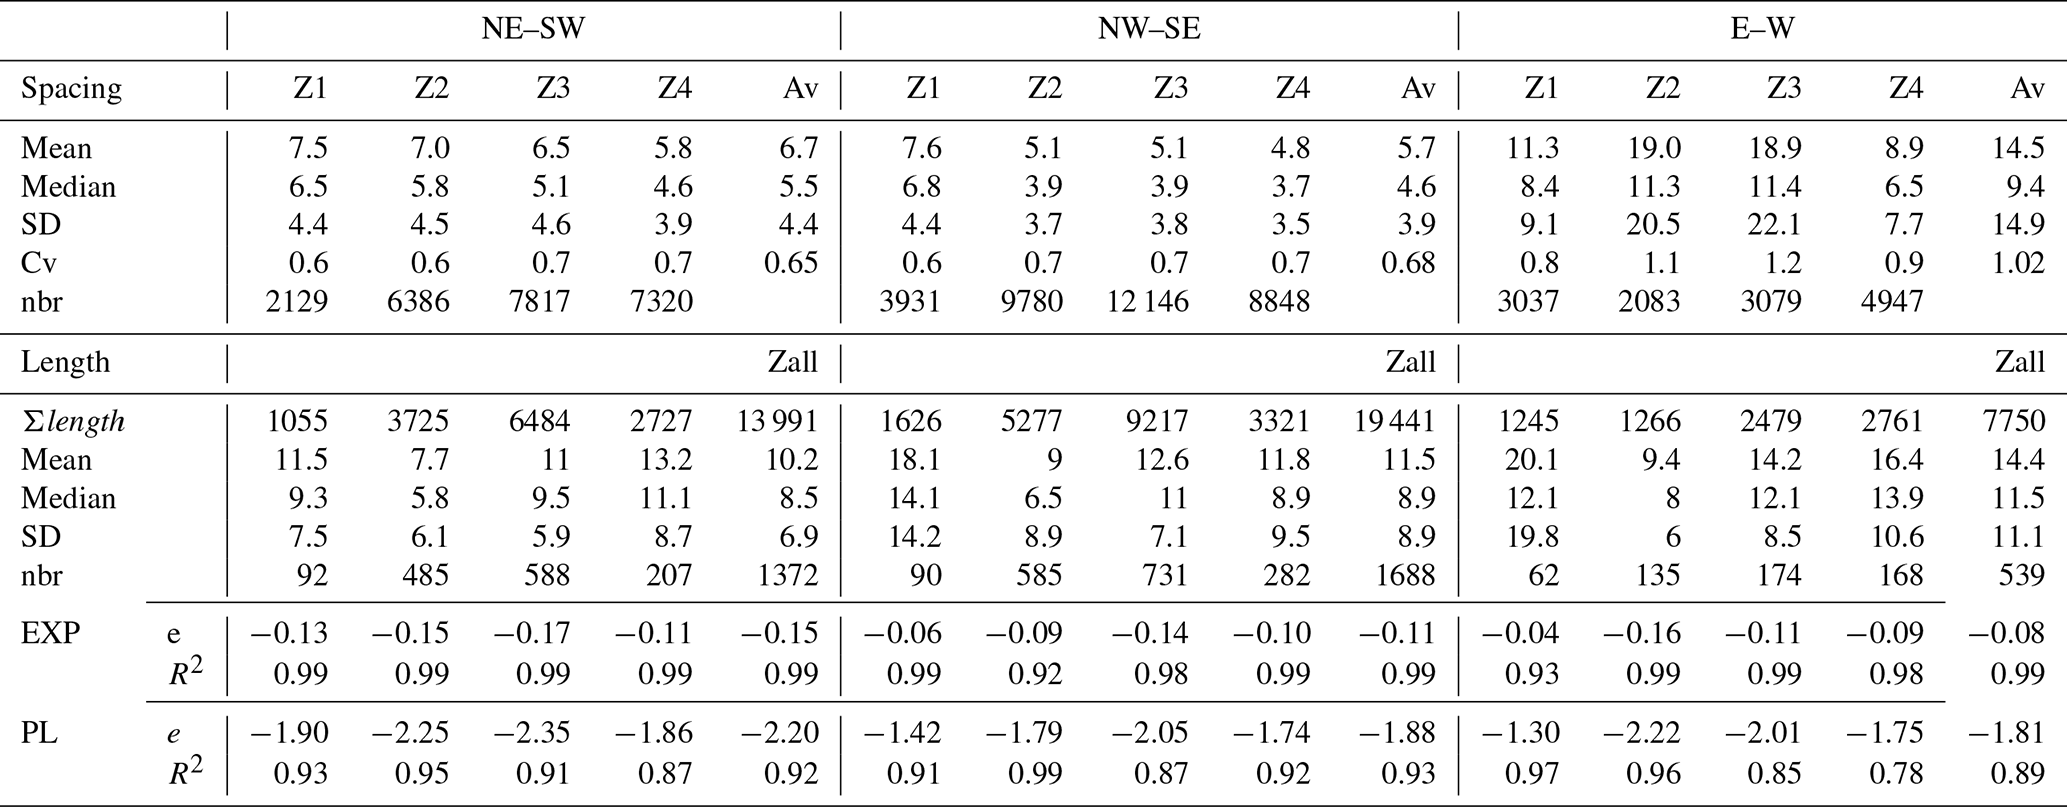
Table 1Lineament spacing (m) and length (m) attributes from statistical analysis. The average value (Av) is calculated from the mean value of each sampling window. Sd is for standard deviation, and nbr is for the number of the item (i.e. the number of the spacing and length data). Σlength is equal to the cumulative length of the set in the sampled window. “Zall” represents merged length datasets. Exponential (EXP) and power law (PL) distribution fits are specified with their exponent (e) and the coefficient of determination (R2). SD is for standard deviation, Cv is for the coefficient of variation, and nbr is for the number of the item (i.e. the number of the spacing and length data).
4.1.2 Detailed lineament networks in the Tchirezrine II
A total of 4779 lineaments were mapped from the four circular sampling windows selected in the Tchirezrine II (Fig. 3 and Table 1).
Azimuth sets
For all the studied circles, two main sets of lineaments trending (i) N030°–060° E (NE–SW) and (ii) N110°–140° E (SE–NW) are detected (Fig. 3b and c). These two almost orthogonal sets represent 24.8 % and 35.4 % of the total length-weighted trace azimuths, respectively. A third (iii) set trending N070°–100° E (E–W) is detected with a proportion of 13.7 %. However, this proportion is variable from one sampling area to another, i.e. high proportions of 21.8 % and 26.3 % in the Z1 and Z4 areas and low proportions of 8.9 % and 9.5 % in the Z2 and Z3 areas, respectively (Fig. 3c). A minor set trending N160°–010° E (N–S) is also detected in the Z3 area, with a proportion of 13.5 % (this set is not described in detail in the following section).
Spacing
All three azimuth sets of lineaments described above show high spacing values due to the extensive sand cover in the study area (see the sandy surfaces visible in Fig. 3a and b). For the two main sets (i.e. NE–SW and NW–SE), we found that the actual value of the largest spacing is close to 20 m in Z1, while for the E–W set, there is no censored spacing value that is larger than the largest uncensored spacing (see the Spacing section in Sect. 3.1.2).
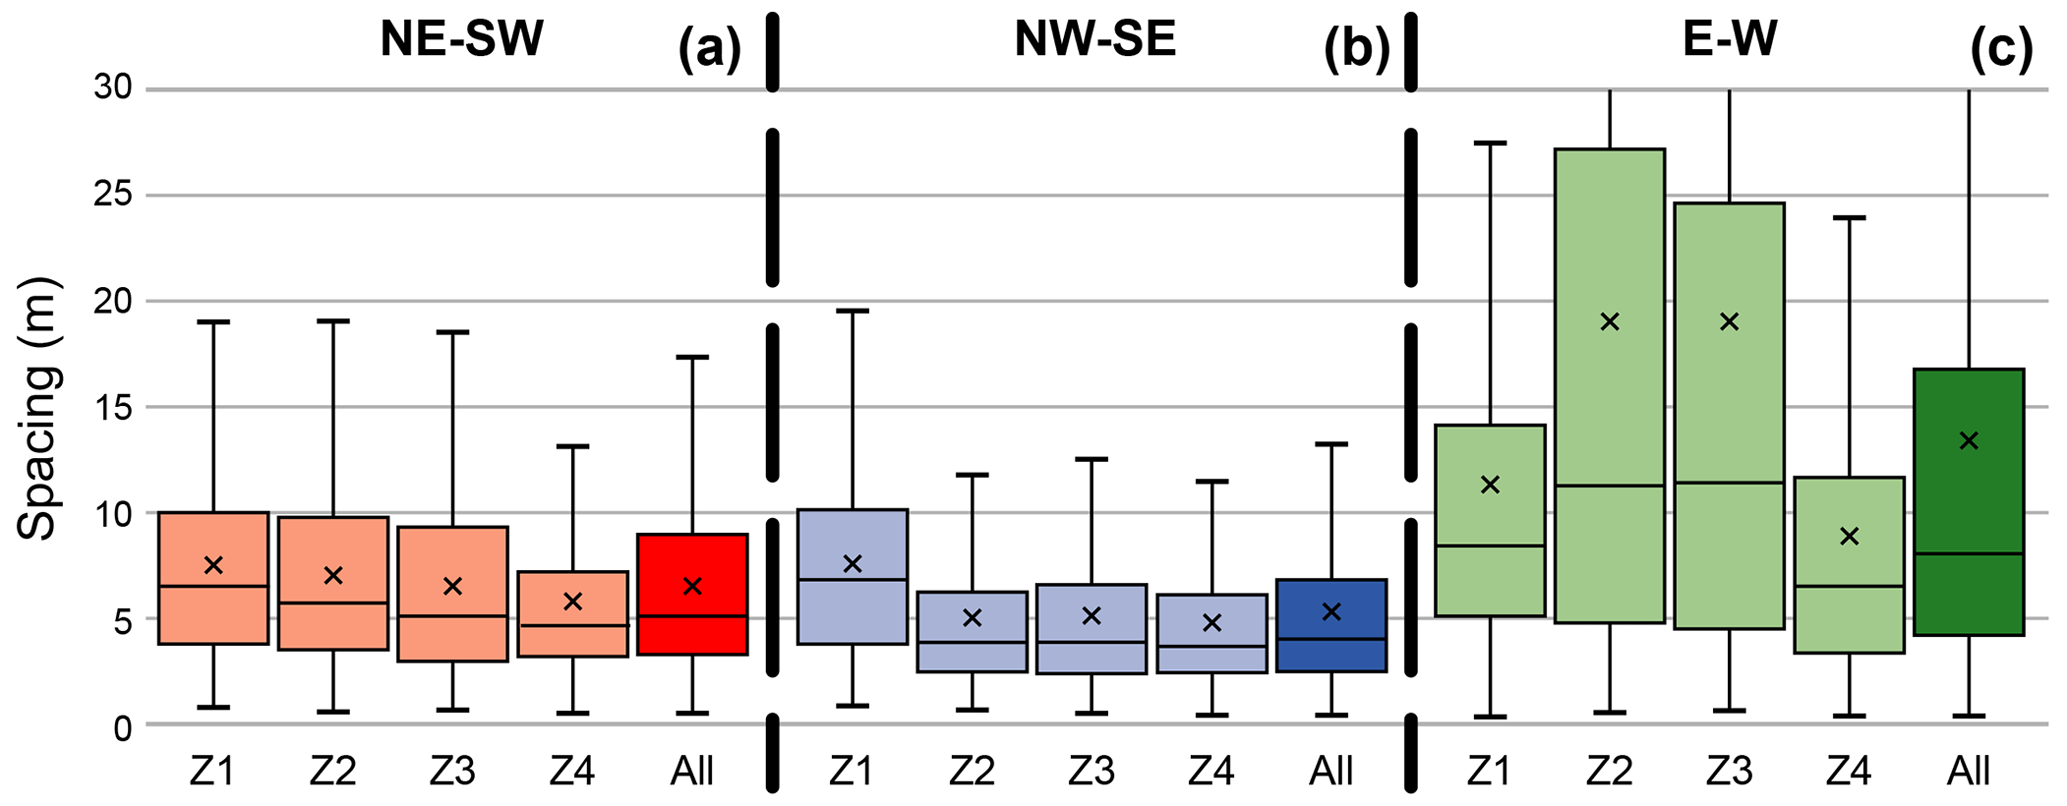
Figure 4Boxplots showing lineament spacing data from the NE–SW (a), NE–SW (b), and E–W (c) sets. Boxplots labelled “All” are representing merged datasets from all zones (Z1 to Z4). The bottom of a box is the first quartile, and the top is the third quartile. The horizontal line inside the box is the median value, and the cross is the mean value. Vertical lines represent the interval of 95 % of data.
The average median spacing of the NE–SW set is 5.5 m (Table 1) and ranges from 6.5 m for Z1 to 4.6 m for Z4 (Fig. 4a). The NW–SE set average median spacing is 4.6 m (Table 1) and ranges from 6.8 m for Z1 to 3.7 m for Z4 (Fig. 4b). Then, the NE–SW set shows higher median spacing values compare to NW–SE for all four sampling windows, with an average factor of 1.2. Spatial distributions for the two main sets are characterised by the coefficient of variation (Cv) that shows values between 0.6 and 0.7, which are correlated with regularly spaced lineaments (Odling et al., 1999). Compared to the two main sets, the spacing distribution of the E–W-trending set shows larger and more heterogeneous spacing values (Fig. 4c). Data from locations Z2 and Z3 show a median spacing ranging from 11.3 to 11.4 m, with a standard deviation ranging from 20.5 to 22.1, whereas data from locations Z1 and Z4 show median values of 8.4 and 6.5 m and a relatively low standard deviation of 9.1 and 7.7 (Table 1). This set shows an average coefficient of variation of 1.02 that is correlated with a random to clustered lineament pattern. For this azimuth set, Z1 and Z4 have Cv < 1, which indicates a more regularly spaced pattern of lineaments.
Length distributions
Considering the merged data from the four sampling windows, the best fit of the length distribution for the three different trending sets is an exponential law with high determination coefficients, i.e. R2 of 0.99 (Table 1 and Fig. 5). Some data from all sets are subject to censoring (Fig. S1 in the Supplement), which is especially true for the E–W set. For example, the fault segment from Z1, sampled with a length of 133 m, shows a minimum lateral continuity of 1080 m (Fig. 3a). Some of the longer E–W lineaments are censored, with over 28 % of the Σ length of the E–W merged set subject to censoring, more so than the NE–SW and NW–SE sets, which are at 23 % and 22 %, respectively.
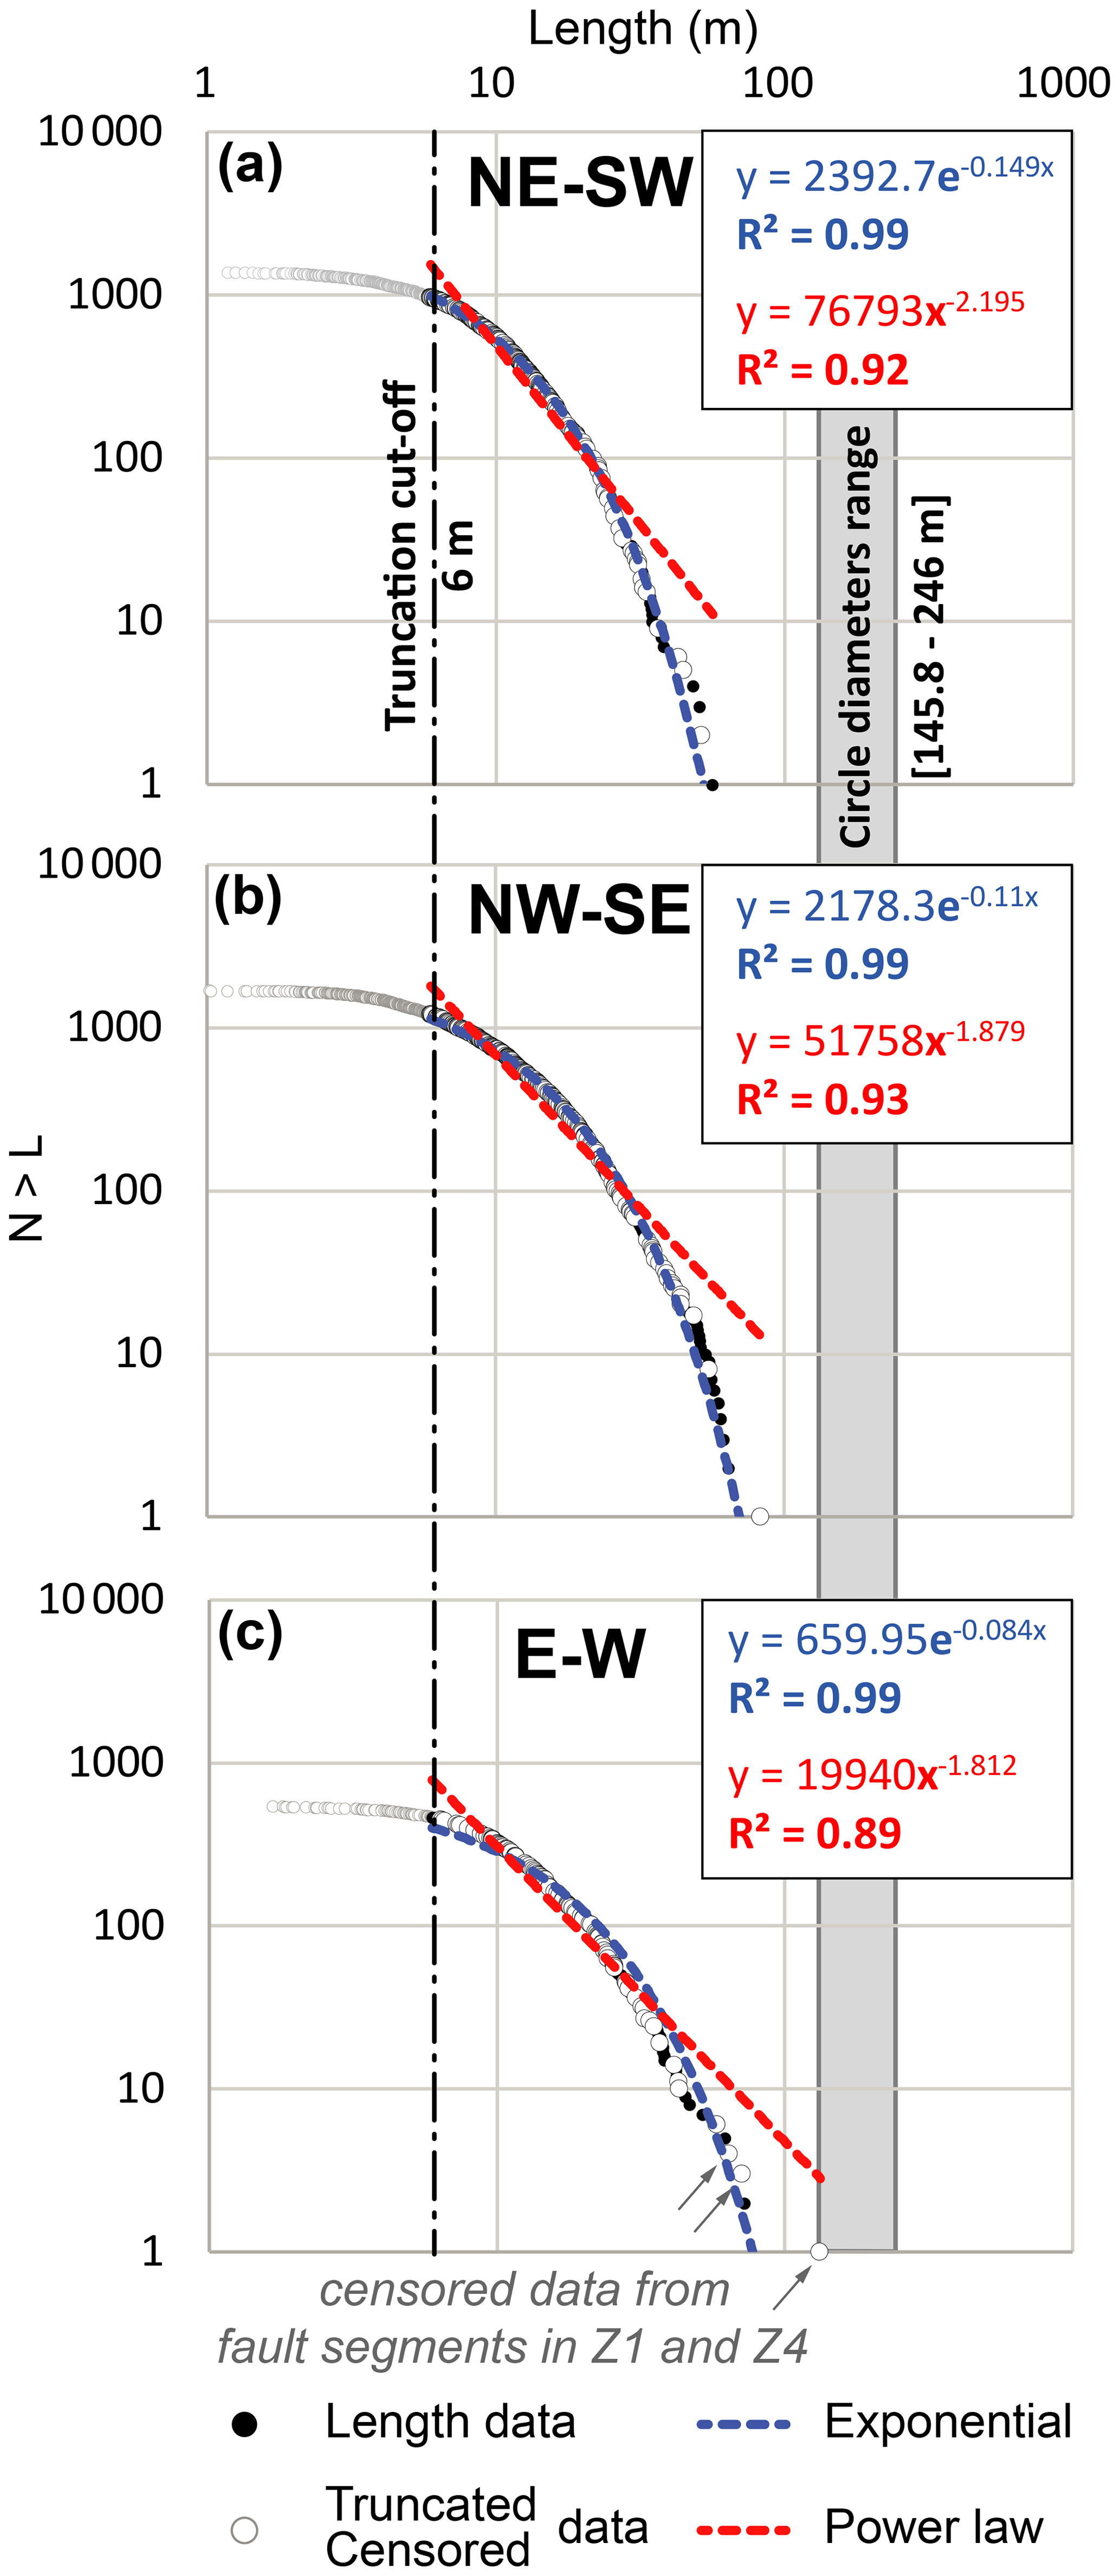
Figure 5Graphs showing the length distributions of lineaments from the NE–SW (a), NE–SW (b), and E–W (c) sets. These data are merged from Z1 to Z4 sampled areas. Truncation cut-off is represented by the dashed black line, whereas the exponential and power law best fits are drawn by a blue and a dashed red line, respectively.
The exponential exponent of the NE–SW merged set is −0.15, while that of the NW–SE set is −0.11 (Table 1). This difference in distribution shows that the maximum length values are larger for the NW–SE merged set. The exponential exponent of the E–W lineaments is −0.08, describing a much larger maximum length compared to the two main sets, with lineament length values closer to the window sizes (Table 1 and Fig. 5c). Note the linear shape of the data alignment at a larger scale on the log-log graph (Fig. 5c) and that these data are more censored than the two other sets (Fig. 5b and c), revealing more scale-invariance in this E–W set than the two others.
Considering the different zones separately allows us to highlight the impact of large-scale structures on the lineament length distribution. As shown above, the E–W set for the Z1 location (Fig. 3-Z1) shows a length distribution that is better at following the scale-invariant trend than the other sampled zones (Table 1). Similarly, the Z1 and Z2 locations are bordered by faults (Fig. 3a; Z1 and Z2) and show a length distribution of the NW–SE set that follows a scale-invariant trend with a large exponential exponent (Table 1, −0,06 and −0,09).
Fracture intensity and intersection node intensity
Considering the total dataset, the average fracture intensity P21 is 0.48 m−1, and the apparent INi is 0.09 nodes m−1. The maximum P21 value equals 0.59 m−1 in the Z4, and the minimum P21 value equals 0.34 m−1 in the Z1. The same repartition is observed for apparent INi with a maximum of 0.14 nodes m−1 in the Z4 and a minimum of 0.04 nodes m−1 in the Z1. Considering these parameters by trending sets separately, the NW–SE P21 is always higher than NE–SW P21 (0.04 to 0.05 m−1) for all zones. The average E–W P21 of 0.07 m−1 is lower than the other sets but is noticeably high in Z4 with 0.16 m−1.
INi is proportionally increasing with the P21 of the NE–SW and NW–SE sets, with an apparent linear trend for Z1, Z2, and Z3 (Fig. 6a and b). This relationship suggests that INi is dominated by these trending sets in these three sampling windows. Data from Z4 (Table 2) show a high INi of 0.14 that is not related to an increase in the P21 of the NE–SW and NW–SE lineaments. In this zone, the high E–W P21 value (0.16 m−1) significantly increases the INi.
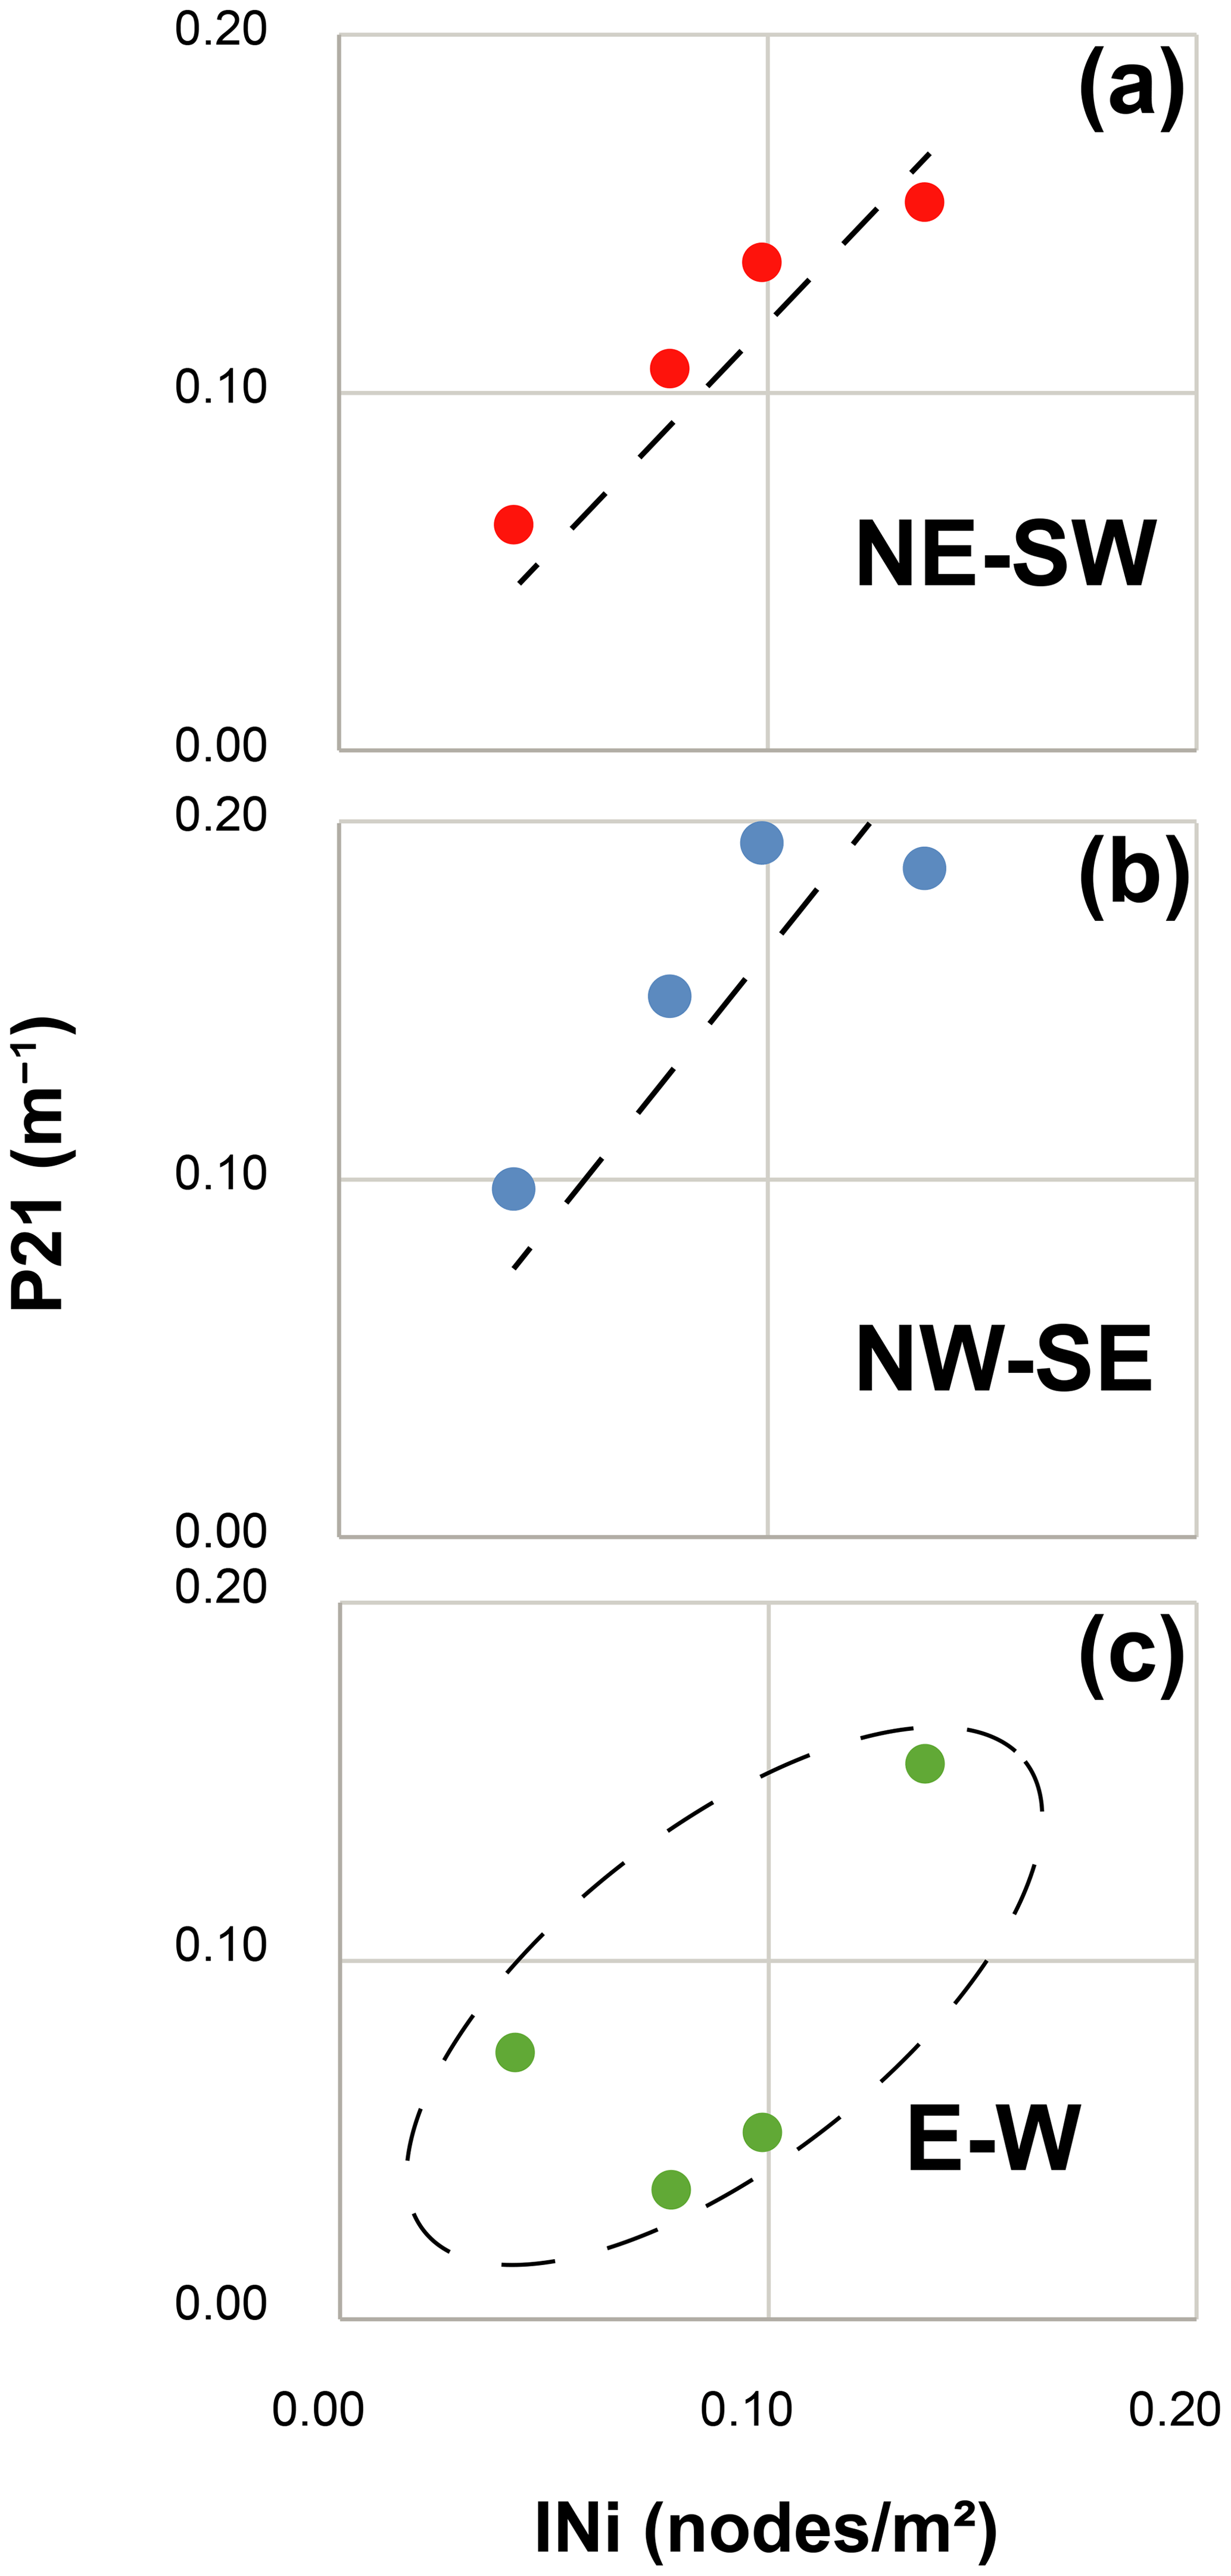
Figure 6Graphs of intersection node intensity (INi) (nodes m−2) versus fracture intensity (P21) (m−1) from the three trending sets for Z1 to Z4. General trends are highlighted by dashed black lines. (a) NE–SW sets, (b) NW-SW sets, and (b) E–W sets.
Table 2Intersection node intensity (INi) and fracture intensity (P21) for all sampling windows and merged datasets (Zall).
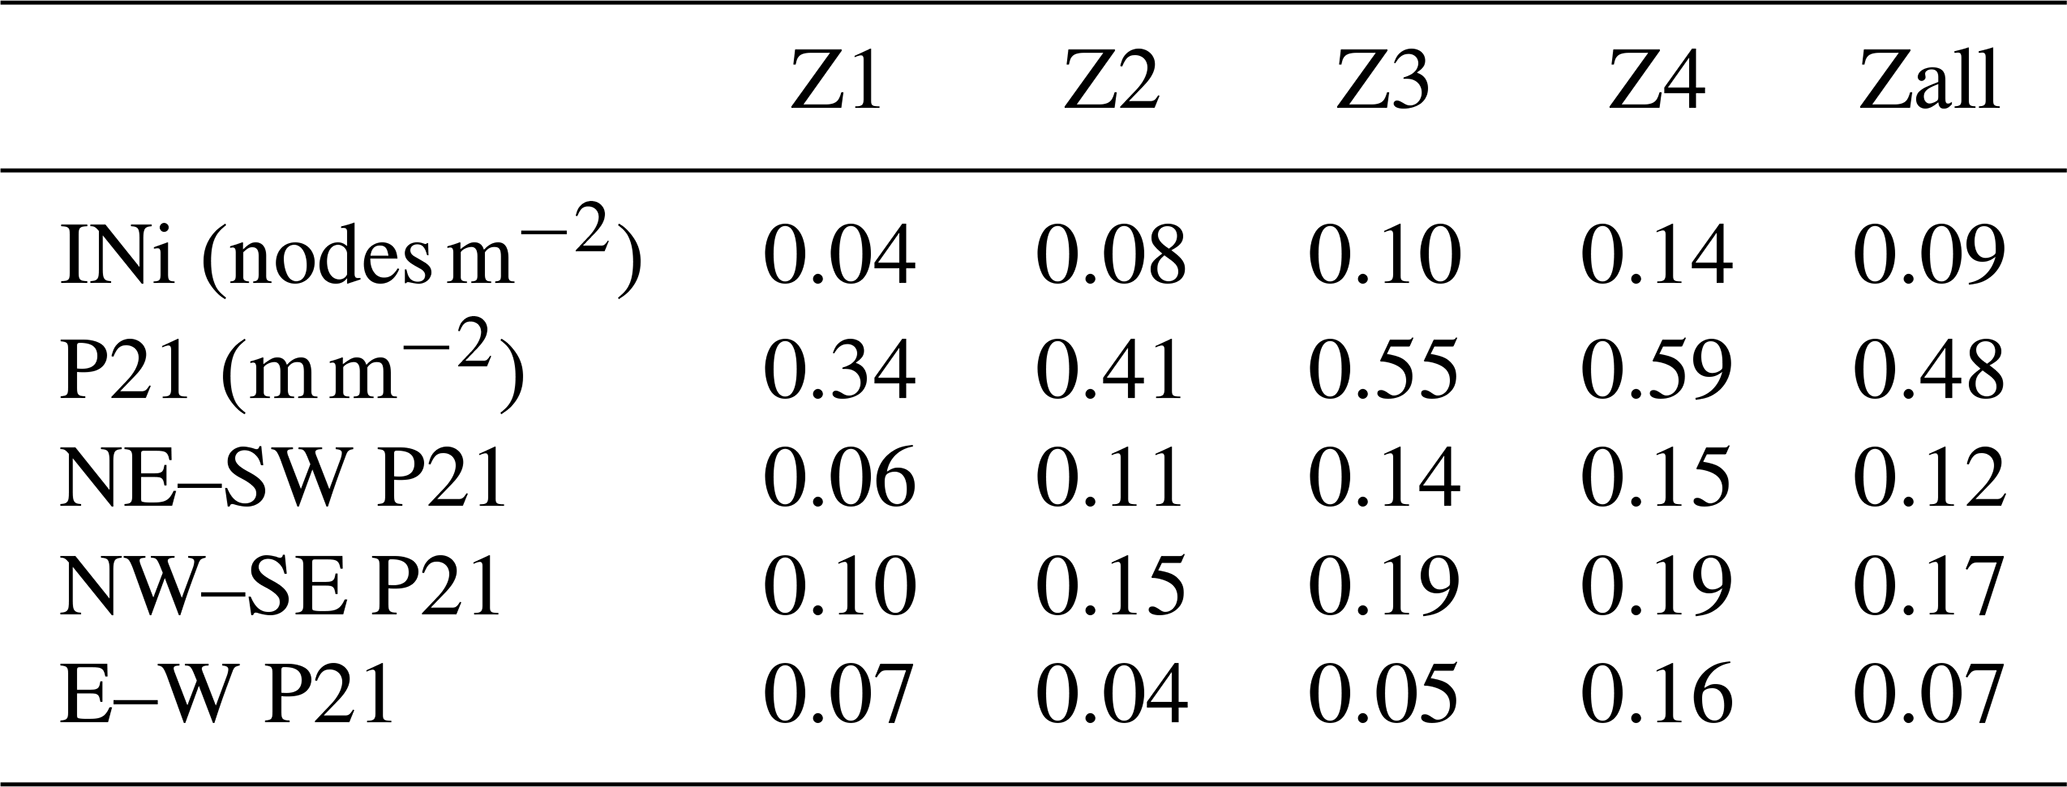
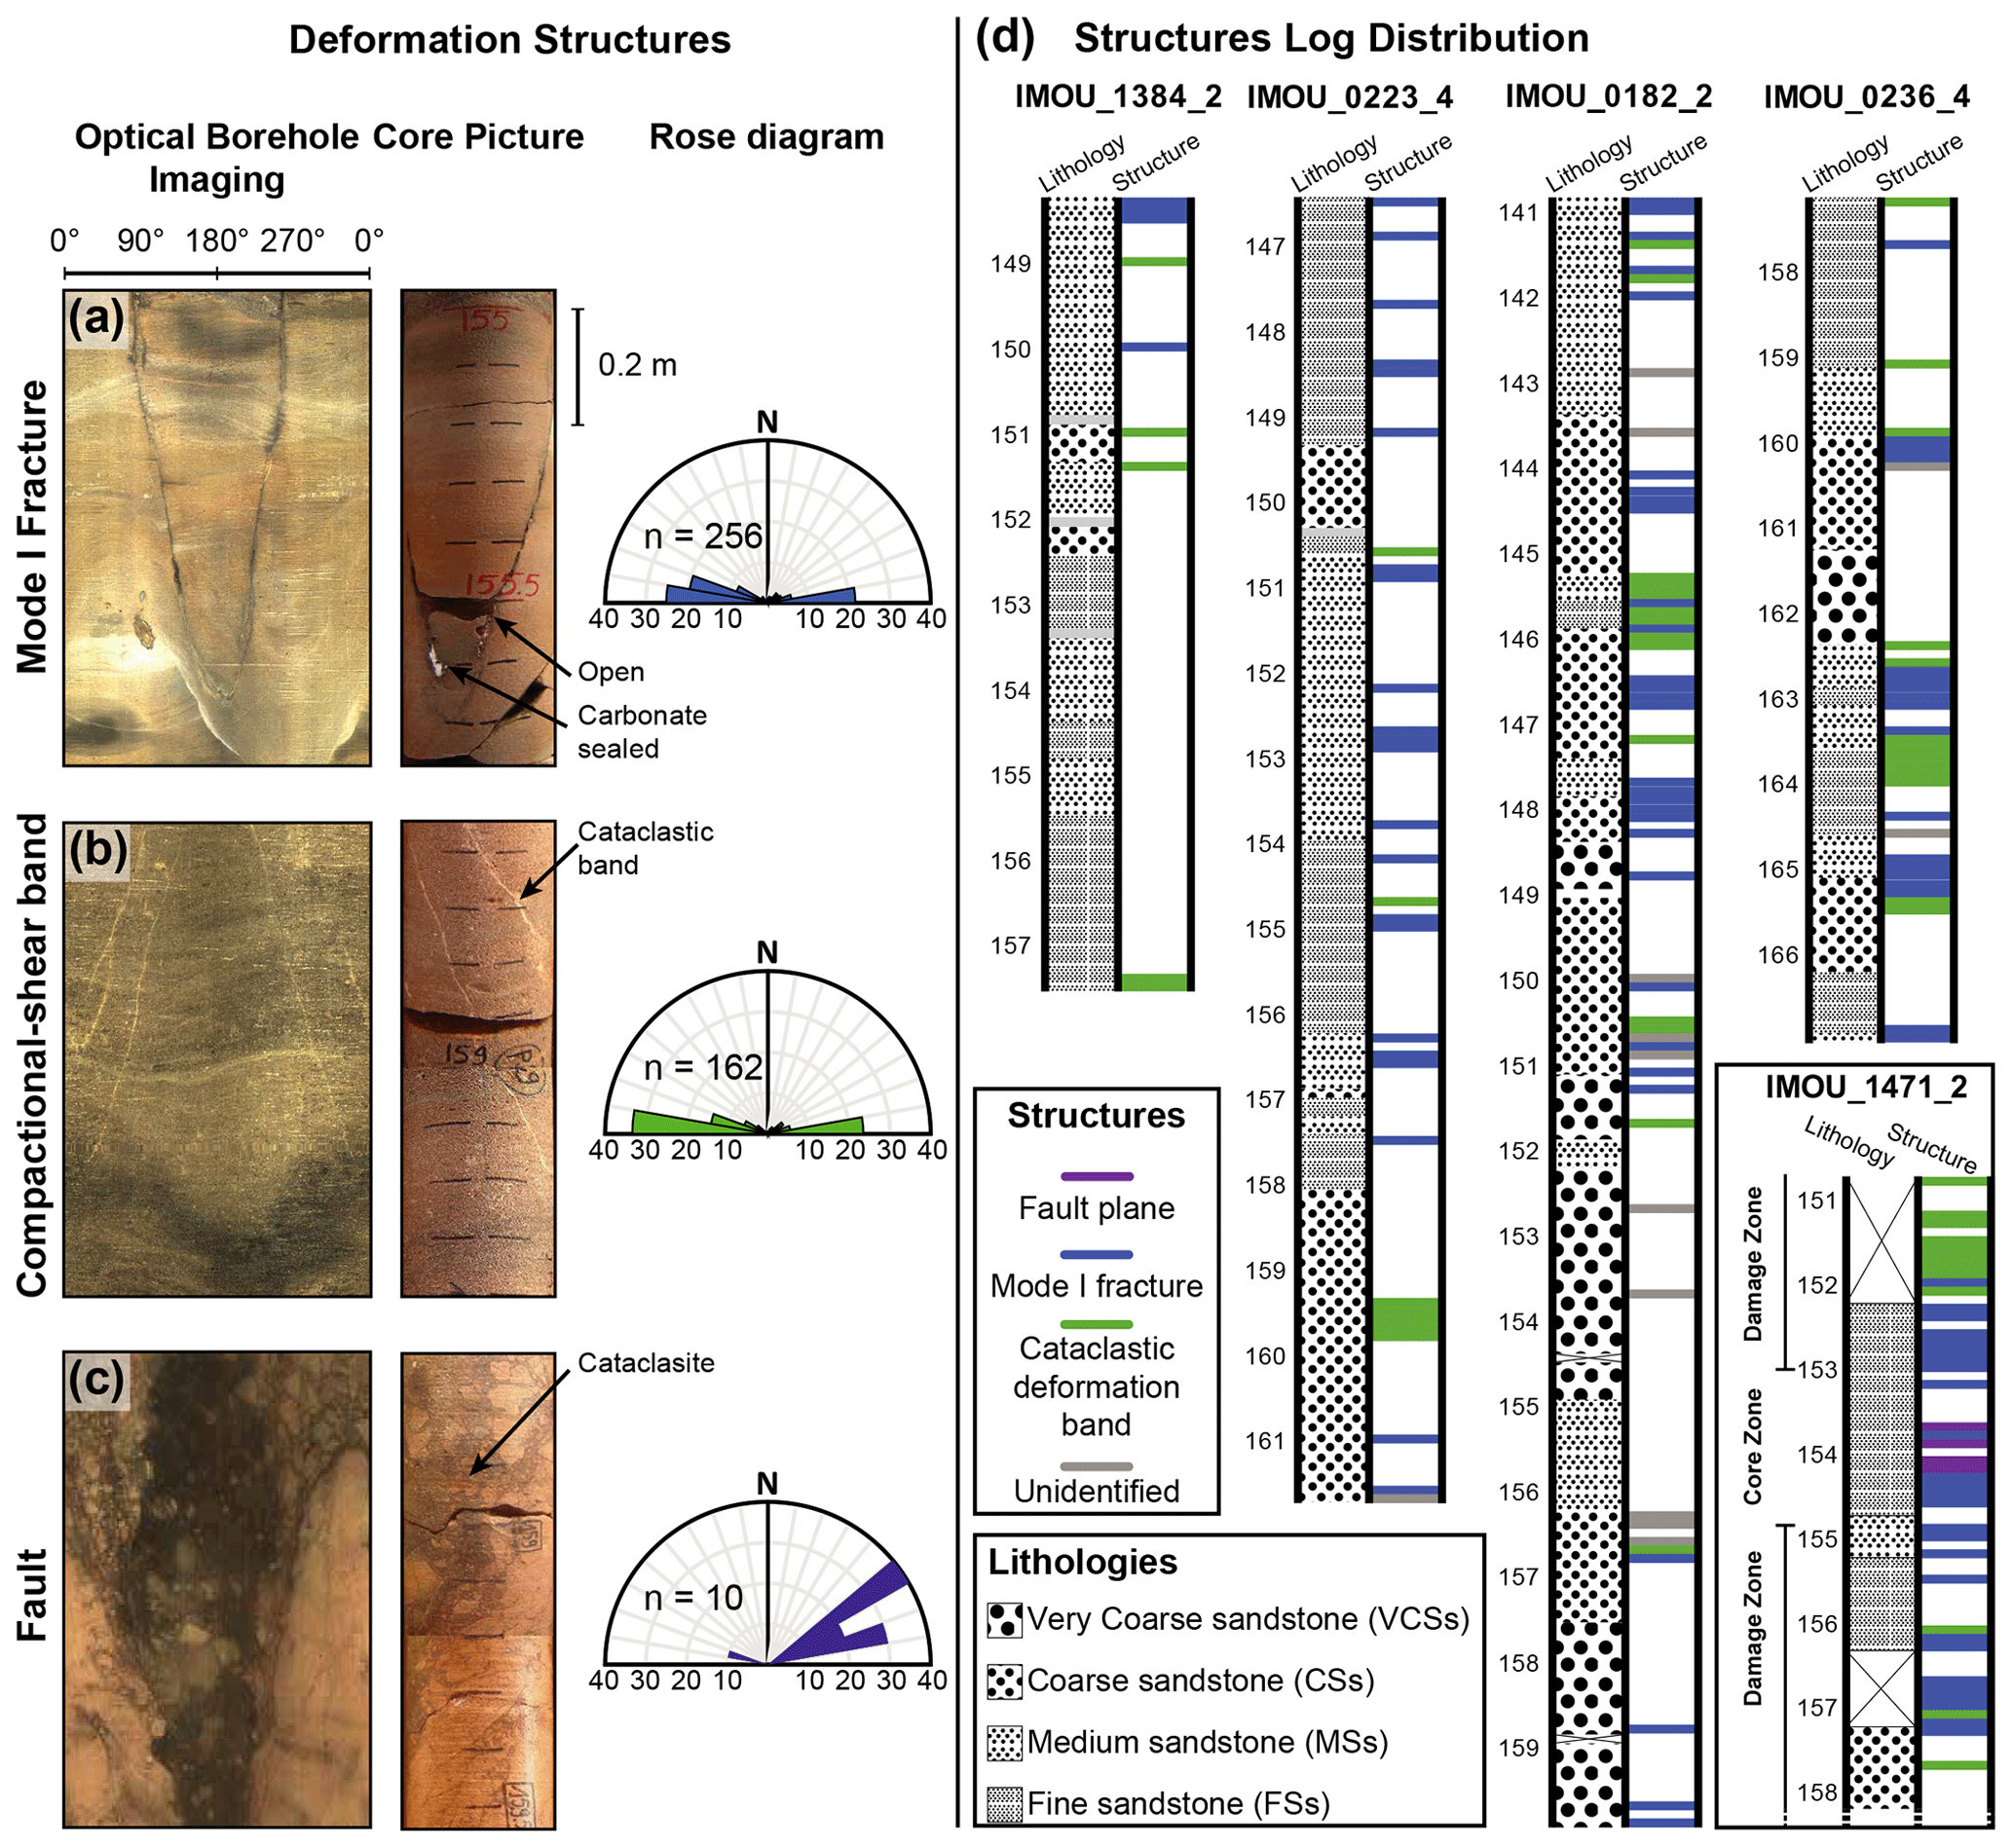
Figure 7Deformation structures detected from well data in the Tchirezrine II reservoir shown with a core sample image, OBI data, and a corresponding rose diagram for each type of structure. (a) Open or sealed extensional fractures. (b) Cataclastic compactional shear bands. (c) Fault core containing cataclasite or crushed breccia. (d) Detected structures from four wells with a low to high degree of fracturing. See the associated location, P10 density, and porosity–permeability distribution of these four wells in Fig. 1d, Table 3, and Fig. 8d, respectively. Also note the height density of fault-DZ-related structures in the IMOU_1471_2 log.
4.2 Structure description from wells
Deformation structures have been classified into three main types using both the OBI data and core description (see Figs. 7 and S2 in the Supplement for additional illustration of structures): (i) extensional fractures, (ii) deformation bands, and (iii) faults.
- i.
Extensional fractures are the most observed structures, with a total of 256 fractures picked on OBI data. They are mainly trending E–W, with 66 % of them in an azimuth range between N080° E and N110° E, and they dip sub-vertically to the north and south at an average angle of 78.9 ± 10.3°. These fractures show sharp cut edges and are open or sealed. Dark edges are observed for open fractures, whereas cements (observed from drill cores), generally clays or oxidised products, yellow uranium products, harmotome (barium silicate), or carbonate precipitation, are detected in sealed fractures (see Fig. 7a and Fig. S2 for additional examples).
- ii.
A total of 162 deformation bands are observed on OBI as white linear structures that are a few millimetres to a centimetre thick (Figs. 7b and S2 for additional examples). Crushed grains and cataclastic textures are observed inside these bands. They are composed of a single or several anastomosed strands. These bands are sometimes crosscut or open by extensional fractures. They can be classified as cataclastic compactional shear bands. They are mainly trending E–W, with 71 % of them in an azimuth range between N080° E and N110° E, and they dip sub-vertically to the north and south at an average angle of 77.7 ± 10.9°.
- iii.
Faults are observed as zones of cataclastic rock and crush breccia (Fig. 7c). These fault rocks are surrounded by zones with a high density of extensional fractures and cataclastic deformation bands representing the inner-fault damage zone (DZ). These faults are observed in two wells located in the southern part of the Imouraren site (Fig. 1d). A single fault core dipping to the south is observed in the IMOU_1471_2 well. The IMOU_0382_2 well shows three distinct fault cores, dipping to the north, over a more than 20 m thick fault zone. These faults picked on OBI show an azimuth ranging between N050° E and N080° E (Fig. 7c). Almost all of the extensional fractures and cataclastic deformation bands picked on OBI within these fault DZs are trending E–W. Scarce field observations are possible; they are consistent with the structures observed in OBI, although some extensional fractures and deformation bands are also observed trending N070° E on outcrop (Fig. S2).
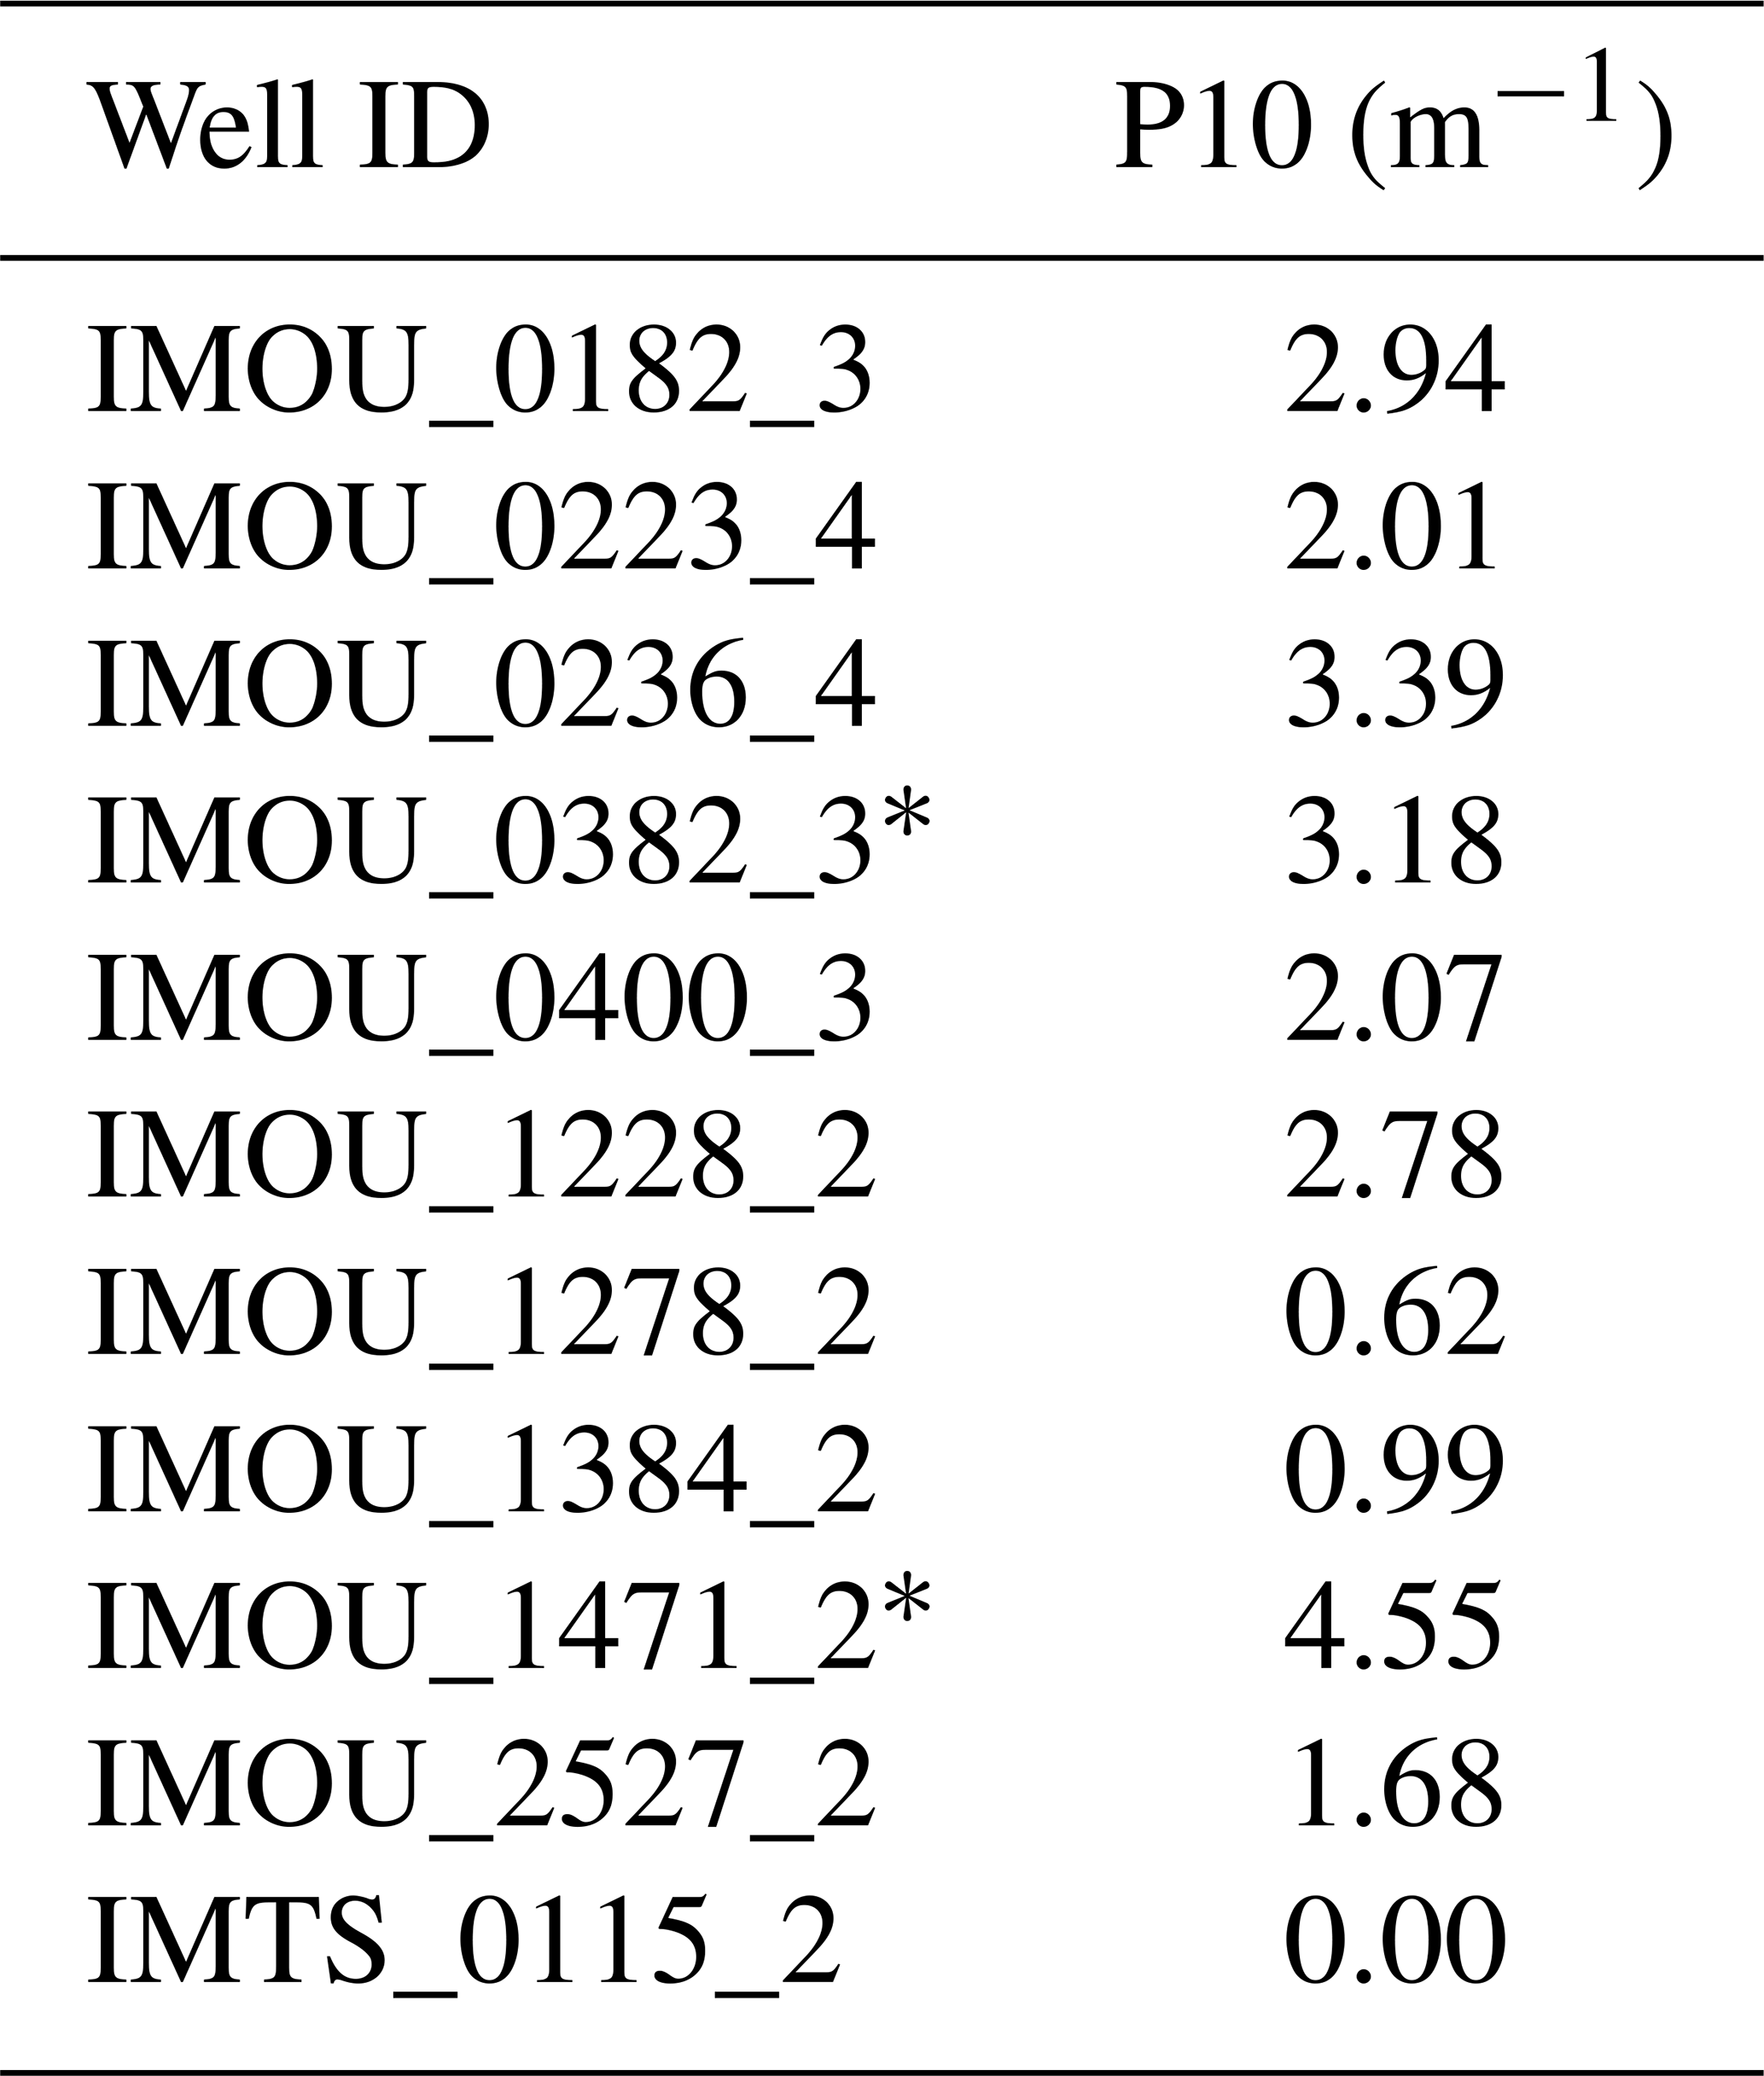
Table 3All types of structures with P10 density within wells with an optical borehole image (see Fig. 1d for the location of the wells). The asterisk (∗) indicates boreholes intercepting fault cores.
Both fractures and deformation bands are observed in nearly all sandstone facies; i.e. there is no significant correlation between facies and observed structure type (Fig. 7d). Rarely, a single structure can be observed across different facies. These rare cases reveal changes in morphological characteristics; e.g. deformation bands tend to be thicker in coarser sandstones and thinner in fine-grained sandstones but still show cataclastic deformation.
The P10 density of structures appears to be very heterogeneous from one borehole to the next (Fig. 7d), ranging from 0 to 4.55 m−1 (Table 3). Positions of the structures along boreholes are reported using the mean of OBI sinusoid. The highest densities of structures are observed in boreholes intersecting fault cores (Fig. 7c and d) or close to N070° E master faults (Fig. 1d), such as IMOU_0236_4 or IMOU_0182_3 (Table 3 and Fig. 7d). On the other hand, note that the borehole IMTS_0115_2 reported in Table 3 does not intersect any structures.
4.3 Porosity and permeability relationships
In this section, we present the porosity and permeability values obtained by the well log measurements from the in situ Imouraren reservoir (Fig. 8a). These values are, first, described considering the whole sonic porosity and NMR permeability dataset. These data are, second, described considering grain size of the corresponding sandstone layer defined during the core description, i.e. from fine sandstone (FS) to very coarse sandstone (VCS) (Fig. 8a). Reference curves calculated using Kozeny–Carman equation (Eq. 3) are plotted on the graphs in order to compare these trends with the logging data sorted by granulometry (Fig. 8b and c). Third, these data are described using four different wells selected as a function of the P10 density of the fractures described following OBI picking (Fig. 8d).
Table 4Summary of sonic porosity and NMR permeability values considering the total dataset. Sd is for standard deviation. The vertical sampling step is 0.1 m, with n as the number of samples. The cumulative thickness of sampled reservoir is 216.3 m from 12 wells. Note: 1 Darcy = 1 × 10⁻⁵ m s−1. SD is for standard deviation, and AllS is for all types of sandstone from fine sandstone to very coarse sandstone.
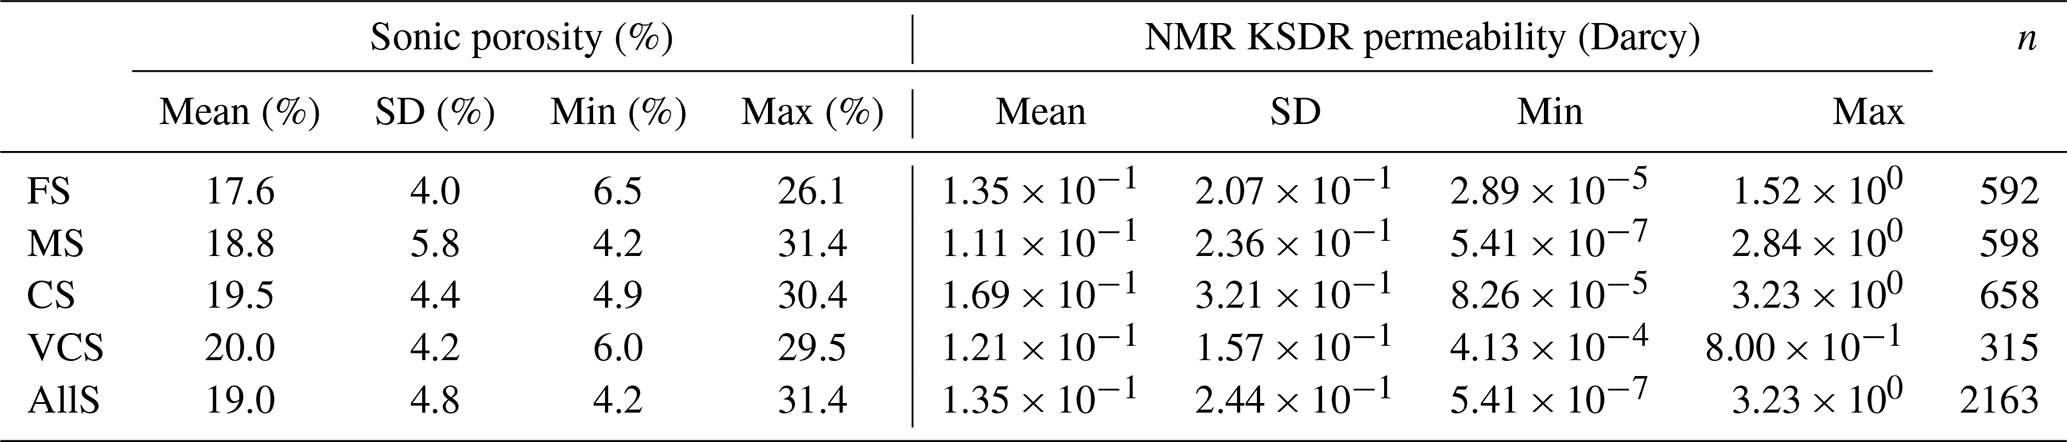
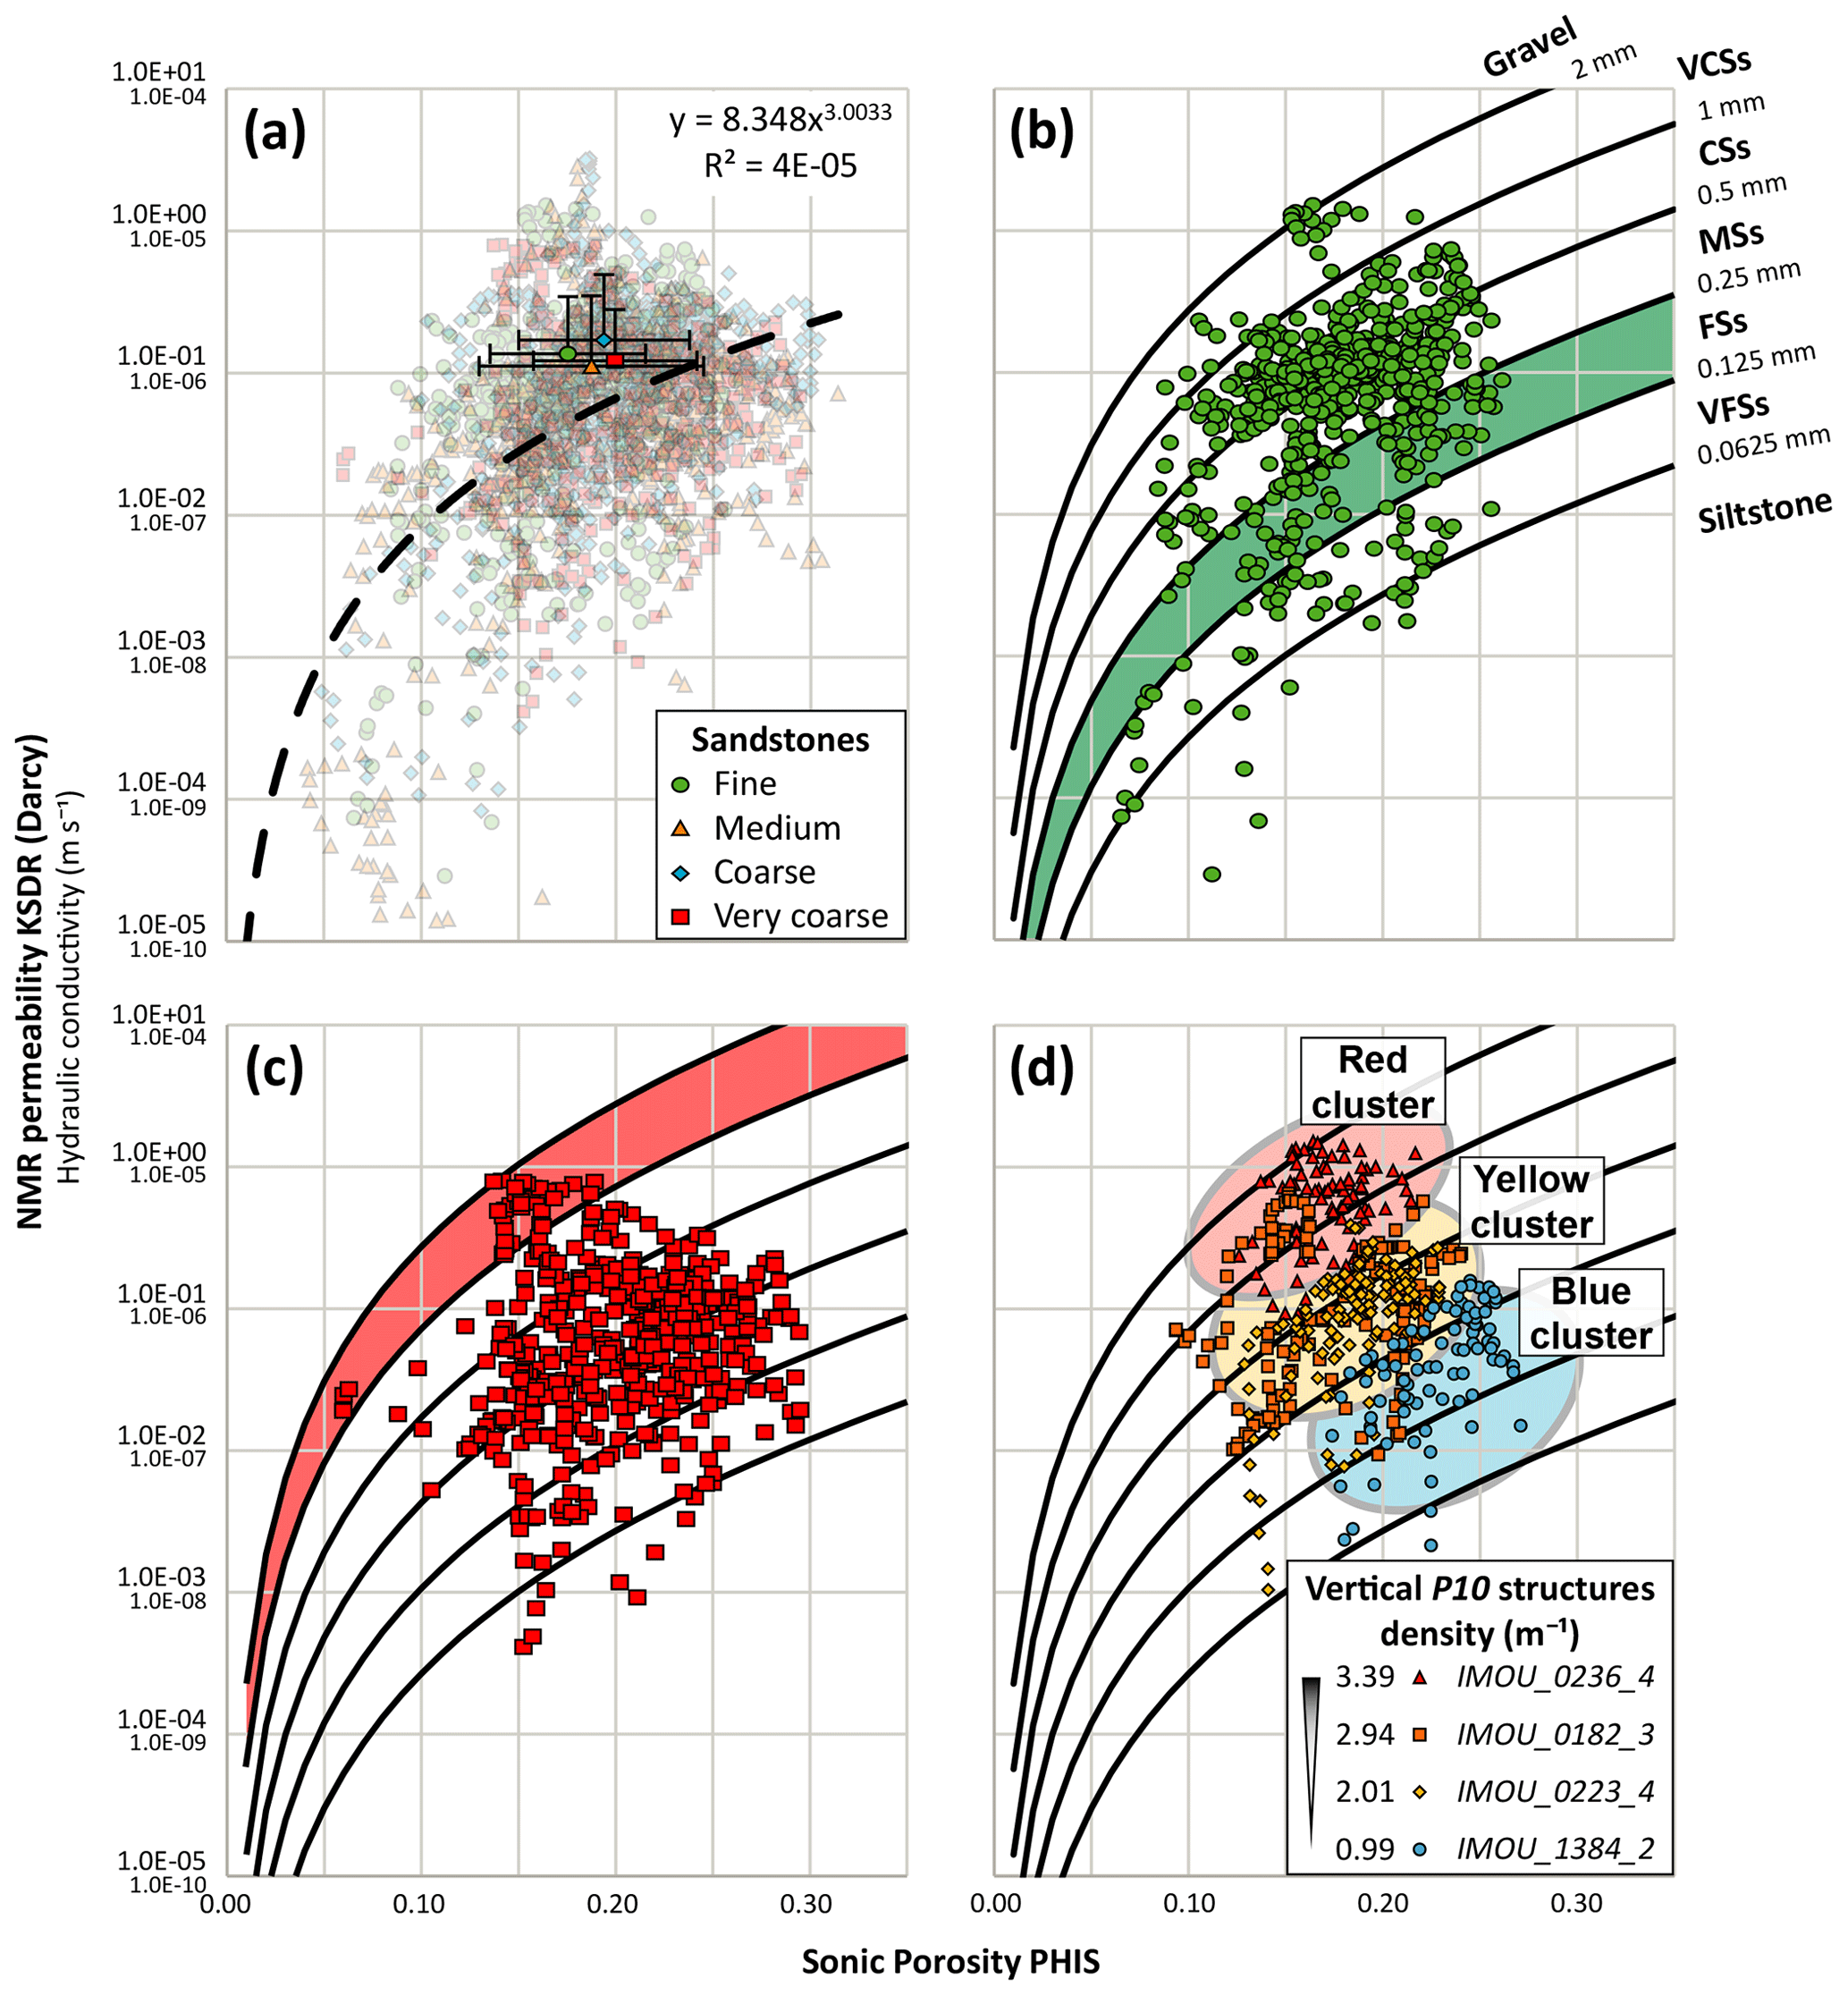
Figure 8Graphs of sonic porosity (PHIS) versus NMR permeability (KSDR) in the Imouraren reservoir. (a) Graphs showing the whole dataset from the 12 wells; data are sorted by grain size classes obtained from the core description, and the dashed black line represents the power law trend fit of the whole dataset. The four highlighted points are mean values for each grain size class, with the standard deviation shown as error bars. (b, c) Graphs showing data from fine-grained sandstones and very coarse-grained sandstones, respectively. Reference Kozeny–Carman relationships are plotted for various grain diameters (in mm); the grain size class corresponding to the plotted dataset (0.125–0.25 mm for FS and 1–2 mm for VCS) is coloured in green and red, respectively. (d) Graph showing data from four wells selected for their different vertical fracture occurrences (expressed by their average fracture P10 density in the legend of the graph; see Fig. 1d for the location of the wells, Fig. 7d for the structures distribution along borehole of these dataset, and Table 3 for all P10 data). Coloured areas are clusters of data showing the differences between high- and low-fracture occurrences. A vertical sampling step of 0.1 m is used for the whole dataset.
Considering the total dataset, the sonic porosity of this reservoir is ranging from 4 % to 31 % (Fig. 8a and Table 4). The average value is of 19 %, with a standard deviation of 4.8 % (Table 4). The NMR permeability of the Imouraren reservoir ranges over 5 orders of magnitude, i.e. from 0.01 mD to 3 D (1 × 10⁻¹⁰ to 3 × 10⁻⁵ m s−1) (Fig. 8a and Table 4). The average value is 135 mD (1.35 × 10⁻⁶ m s−1), with a standard deviation of 240 mD (2.4 × 10⁻⁶ m s−1) (Table 4). This dataset shows a poorly defined normal correlation between porosity and permeability values. Lower-permeability values (< 1 mD or 1 × 10⁻⁸ m s−1) are mainly obtained in low-porosity materials (< 15 %). In contrast, the largest permeability values (> 1 D or 1 × 10⁻⁵ m s−1) are reached in the material of only moderate porosity values (15 %–20 %). The highest-porosity values (> 25 %) are correlated with moderate permeability ones (5 to 500 mD or 5 × 10⁻⁸ to 5 × 10⁻⁶). The Kozeny–Carman relationship, describing the porosity–permeability relationships of homogeneous granular materials follows a power-law-like trend (Kozeny, 1927; Carman, 1937, 1956). For such a law, the dataset shows a least squares coefficient (R2) of only 4 × 10⁻⁵ (Fig. 8a).
A main observation of this dataset is that there is no relationship between the lithology (granulometry) and porosity–permeability (Fig. 8a). There is a slightly higher average porosity as a function of the granulometry increase from 17.6 % in fine-grained sandstones (FSs) to 20 % in very coarse-grained sandstones (VCSs) (Fig. 8a), but the range of porosity values is almost similar from one lithology to the other (i.e. from 6.5 % to 26.1 % for FSs and from 6 % to 29.5 % for VCSs; Table 4). Most of the data do not follow the expected trend of the porosity–permeability Kozeny–Carman trend relationship expressed by reference curves for each grain size class (Fig. 8b and c). For the FSs, only 13.3 % of porosity data range in the corresponding Kozeny–Carman area (green area in Fig. 8b), whereas 77 % of these data show higher permeability for a given porosity (Fig. 8b). These permeability values can surpass the theoretical curves by 1 or 2 orders of magnitude. For the VCSs, only 8.1 % of the data range in the corresponding Kozeny–Carman area (red in Fig. 8c), whereas 91.6 % of these data show lower permeability for a given porosity (Fig. 8c). These permeability values can be up to 3 orders of magnitude lower than the theoretical values expected for a very coarse-grained sandstone.
The second main observation about this dataset is that its permeability distribution is highly influenced by fracture density. Fracture P10 density is positively correlated to the permeability values, whereas no clear correlation is detected with porosity (Fig. 8d). The highest-permeability values are obtained for the wells showing a high fracture density (Fig. 8d; IMOU_0236_4 and part of the IMOU_0182_3), whereas the lowest-permeability values are obtained for the wells showing a low fracture density (Fig. 8d; IMOU_1384_2 and part of the IMOU_0223_4). The data from the well with the highest fracture density correspond to the area of Kozeny–Carman trends calculated for coarse-grained material (Fig. 8d – red cluster). On the other hand, the data from the well with the lowest fracture density correspond to the area of Kozeny–Carman trends calculated for fine-grained material (blue cluster). Consistently, data from wells with intermediate fracture density correspond to intermediate reference trends (yellow cluster).
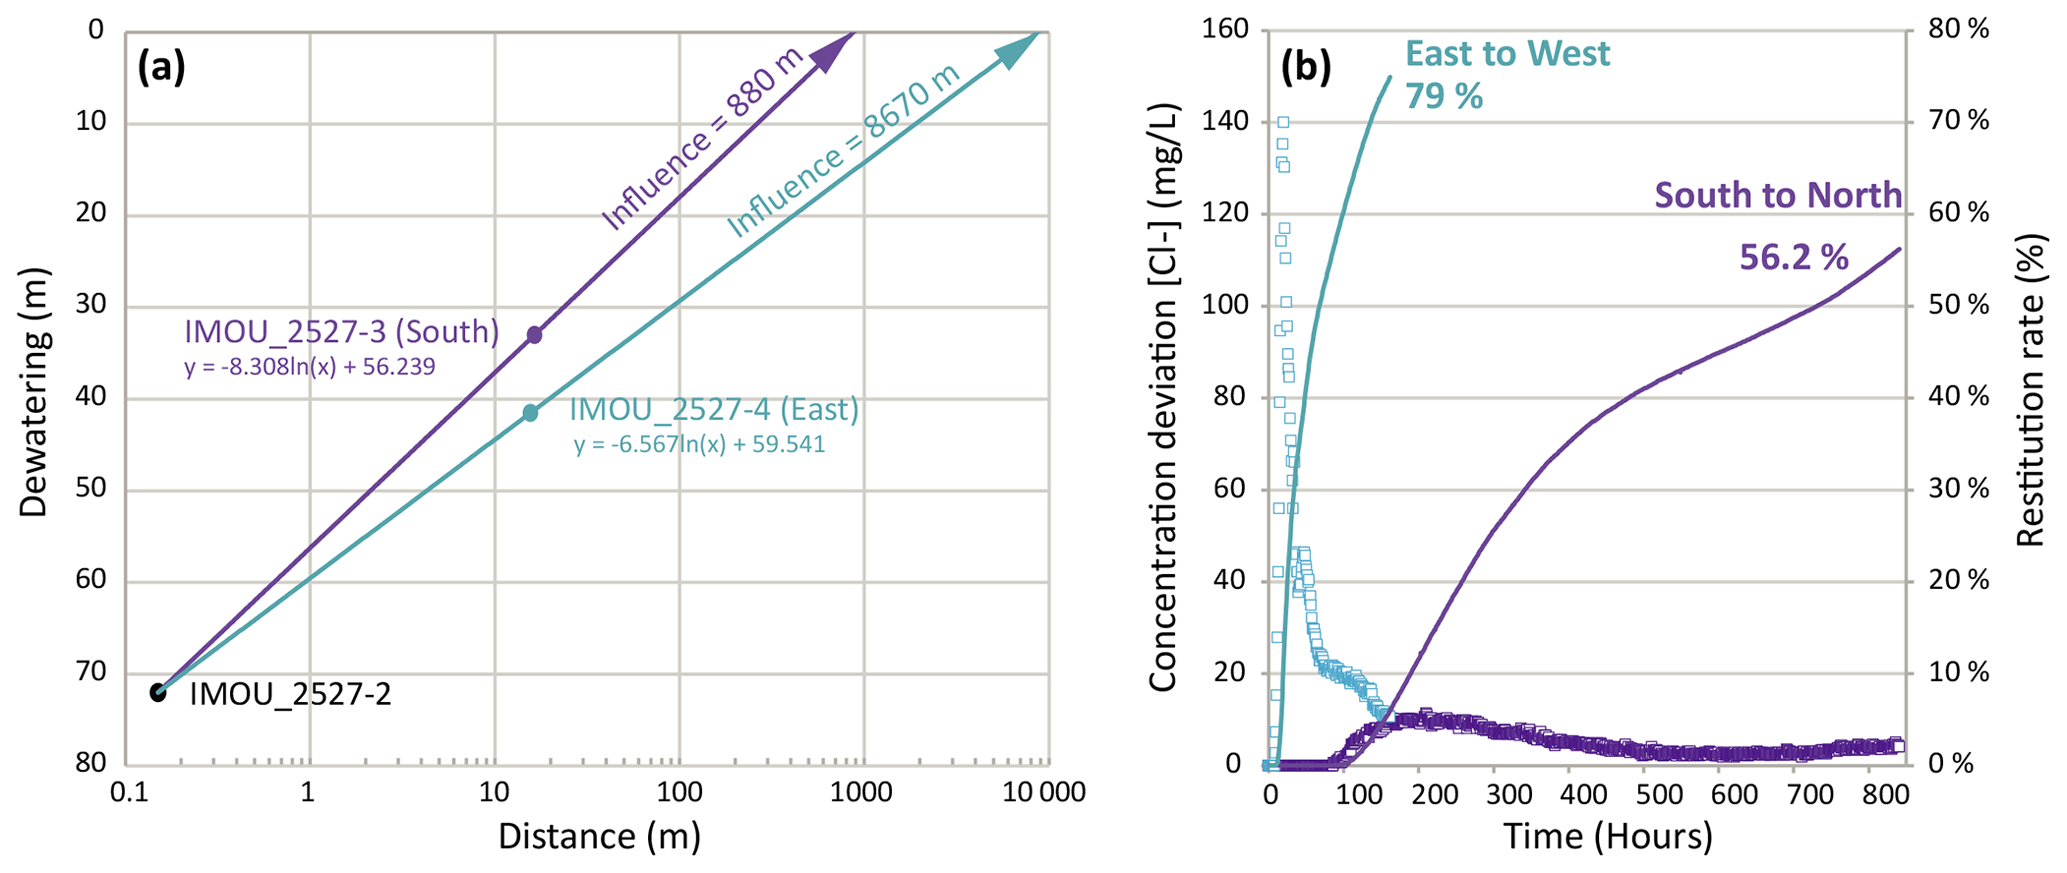
Figure 9(a) Graph with drawdown data at t = 830 h versus the distance of the piezometers in the log scale. Two logarithmic regression curves pass through the point of the well IMOU_2527-2 and go, respectively, towards the piezometer IMOU_2527-3 in purple and the IMOU_2527-4 in blue. (b) Chloride restitution curves over time for the two tracings: IMOU_2527_3 to IMOU_2527_2 (in purple) and IMOU_2527_4 to IMOU_2527_2 (in blue). Lines are shown for the cumulative restitution rate and squares for the deviation from the initial chloride concentration of the pumped water.
4.4 Aquifer testing
During the pumping phase, the response of the groundwater table is different in the eastern and southern piezometers by 3 to 12.1 min, respectively. At the end of the pumping test (t = 830 h), the aquifer table reaches a lowered level in the pumping well of 72 m (Fig. 9a). The dewatering in the eastern piezometer reaches 41.5 m, whereas only 33 m of dewatering is obtained in the southern one. Using a logarithmic fit, we estimate an influence of the pumping of 880 m in the southern direction and 8670 m in the eastern direction (Fig. 9a). This is approximatively a 1:10 ratio in the radius extension. This aquifer test revealed a significant anisotropy of the reservoir response following the direction, with a higher drainage pattern along the E–W direction compared to the N–S one.
The restitution curves for the two tracings (Fig. 9b) are very different. Tracing from south to north shows a very slow and diluted restitution, with the first arrivals observed after 87 h and a chloride deviation that does not exceed 11 mg L−1. Inversely, tracing from east to west shows a very rapid and concentrated restitution, with the first arrivals observed after 9 h and the peak of chloride deviation reaching almost 150 mg L−1 and occurring after 19 h.
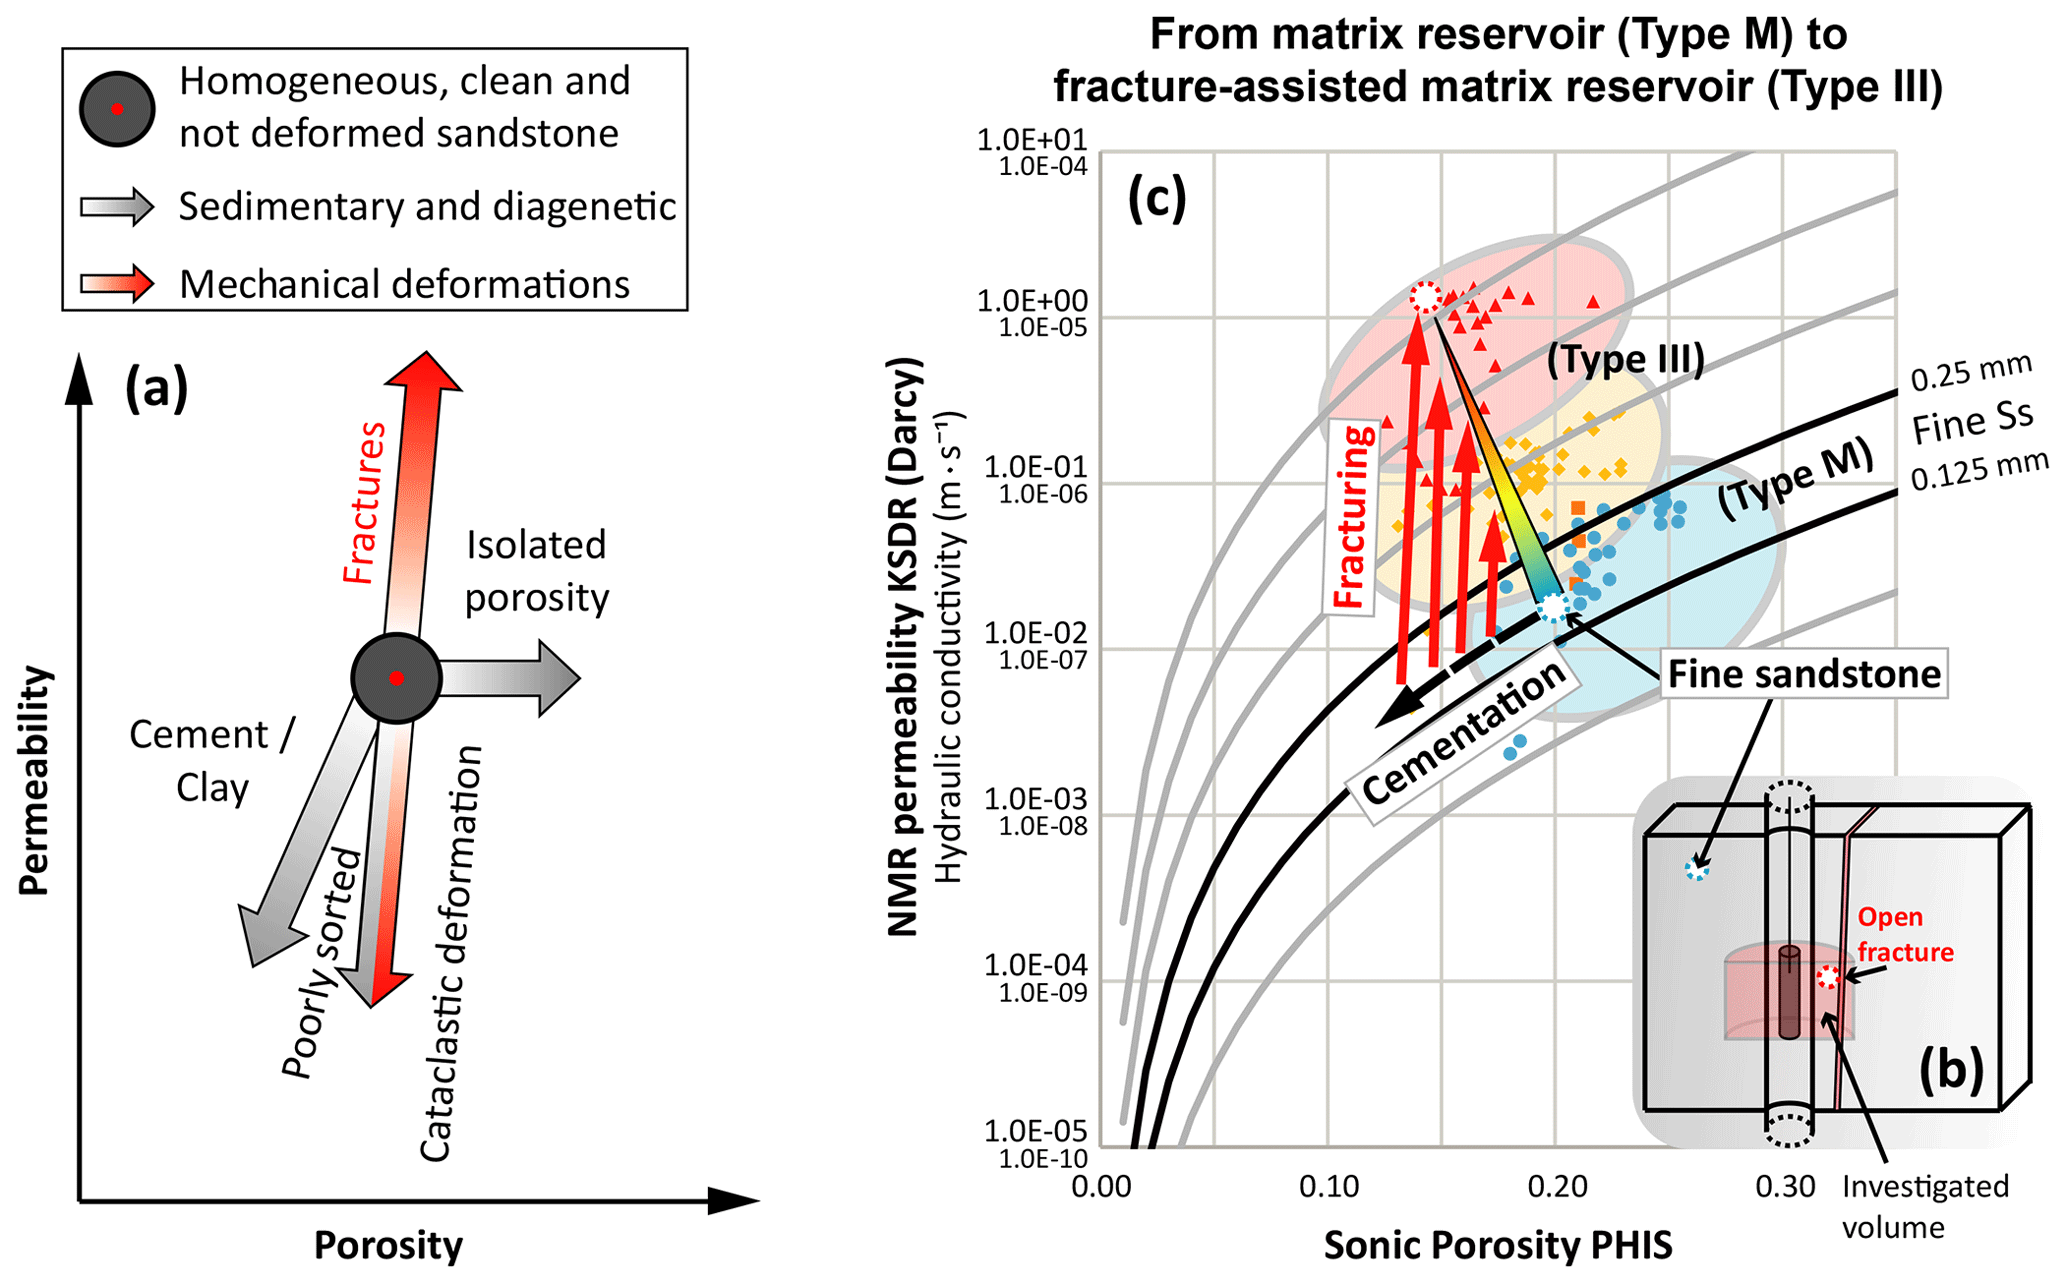
Figure 10Porosity–permeability relationship and triggering processes in the porous and fractured Imouraren reservoir. (a) Schematic graph showing the impact of various processes on the evolution of the porosity–permeability relationships (modified from Schön (2015), after Lucia (2007) and Nelson (2005)). (b) Scheme showing the potential influence of a fracture on the investigated volume of an NMR logging tool. (c) Application of the conceptual model to the porosity–permeability data from only the fine-grained sandstones of the Tchirezrine II sorted by fracture P10 density (see Fig. 8d for the legend). Arrows represent the evolution of the porosity–permeability relationship. Red arrows are for theoretical fracturing process, the black arrow is for theoretical cementation process, and the rainbow arrow illustrates the resulting evolution in the Imouraren reservoir.
5.1 Results and limitations
A multifaceted understanding of the characteristics and behaviour of the Tchirezrine II reservoir in Imouraren deposit has been obtained through this multidisciplinary approach and can be summarised in four key points with the related limitations. These results are then discussed in the following:
- i.
The orientation analysis of lineaments interpreted from satellite images revealed two main sets of lineaments (NE–SW and NW–SE) with sub-orthogonal trends and regularly spaced patterns (Figs. 3 and 4) and a third E–W set with a lower P21 density, together with the distribution of the length and spacing characteristics that reveal a rather heterogeneous pattern (see the second-order lineament from Sect. 4.1.2). The lineament INi increases significantly where the E–W set is well expressed (Fig. 6). It is worth mentioning that the exponential distributions of the lineament length of the NE–SW and NW–SE trend sets are real properties of the lineament network since they are not related to the censoring bias of the sampling windows (Fig. 5a and b; see Fig. S3). However, the censoring bias has a greater effect on the E–W trend (Fig. 5c) as it has a larger exponential exponent (Table 1) and therefore more scale-invariant behaviour. Also note that, on all the presented data, the truncation bias (Sect. 3.1.2) has little effect on the scaling properties since it is much lower than the main bend observed on the scaling law (Fig. 5a and b). It might be more significant on the E–W azimuth set in which the main trend of the curve is closer to the truncation limit (Fig. 5c). This is also consistent with the more scale-invariant behaviour of this lineament set (see Sect. 5.2 for an interpretation). It should be noted that the least squares fitting method used here can lead to misleading distribution trend results (see Clauset et al., 2009, for a discussion). These results should therefore be interpreted parsimoniously and solely for the purposes of comparison between sets of lineaments. In addition, the presence of undetected fractures, below the resolution of satellite images, may lead to a slight overestimation of the average spacing obtained in the present study without significantly affecting their distribution.
- ii.
The Tchirezrine II reservoir is affected by extensional fractures (still open or sealed), cataclastic deformation bands, and brecciated–cataclastic faults. The main structural trend observed in OBI, whatever the typology, is oriented E–W (Fig. 7a and b). This is fully consistent with the scale-independency mentioned before for the E–W azimuth set. Also note that these E–W structures are also observed in OBI in the DZs of N070° E faults (Figs. 1d and 7c). Few NE–SW and NW–SE extensional fractures are observed in OBI and are therefore in a much lower proportion compared to E–W structures. The vertical configuration of the wells implies a strong sampling bias of the fracture patterns that are almost sub-vertical (Terzaghi, 1965) and have large spacing values (i.e. spacing greater than well diameter). The spatial properties found in the azimuth sets (Figs. 4 and 5) may therefore have led to an under-sampling of the NE–SW and NW–SE lineament sets and oversampling of the E–W ones.
- iii.
The Tchirezrine II deposit is a reservoir with heterogeneous petrophysical properties (i.e. porosity spanning over 26 % and permeability over 5 orders of magnitude). The positive correlation observed between the P10 structures density and permeability suggests a dominant influence of the deformation structures on this petrophysical property scattering. Although there is no clear correlation between the grain size and porosity–permeability relationship, part of the scatter can be related to grain size and sorting (Fig. 10a). We, however, do not have enough data to summarise these effects. It is worth mentioning that these studied petrophysical properties estimated from logging tools potentially contain errors due to data treatment. For the sonic porosity estimation in water-saturated media, using the Wyllie et al. (1956) equation (Eq. 1), the rock matrix is supposed to be homogeneously made of quartz (i.e. the fraction of matrix wave velocity is directly correlated to the fraction of fluids within the porosity). However, the Tchirezrine II sandstones contain a variable fraction of clays and analcimes (Billon, 2014; Mamane Mamadou, 2016) which are less dense compared to quartz and lead to an overestimation of the porosity value. Concerning the NMR permeability, note that the calculation is based on an empirical equation (Eq. 2) in which the relaxation time (T2) is considered to be only related to the matrix pore space. The impact of open fractures on the T2 distribution remains poorly understood in the literature (see Golsanami et al., 2016, for a review on the application of the NMR technology for investigating fractures). It is, however, well known that the presence of open fractures increases the estimated permeability but also that the presence of magnetic minerals reduces the estimated permeability (Jácomo et al., 2018, 2020) but in ranges much lower that the main effect of fracture porosity. The fact that there is a clear correlation between the permeability and the P10 fracture density suggests that these effects are probably minor.
- iv.
The hydrogeological testing implemented in a zone of E–W-trending structures reveals a substantial anisotropy of flow with an influence that is 10 times greater in E–W direction compared to the N–S direction (Fig. 9a). The tracings show a significant contrast in brine restitution, highlighting fluid channelling in the E–W direction, as well as limited flow in the N–S direction. Also note that the maximum flow is observed in a direction (E–W) parallel to the main structural pattern observed in OBI at this site. However, the real anisotropy of flow cannot be more precisely defined since only two orthogonal monitoring piezometers were deployed during this preliminary aquifer testing. We must also note that other orientations of deformation structures, such as N–S or N070° E structures, which are scarcely observed in the studied area and not included in satellite image analysis (Fig. 3-Z3), may lead to permeability anisotropy that is different from the results shown for IMOU_2527_2. These results, obtained from only one site, containing heterogeneously distributed E–W structures (see (ii)), probably have a specific structural and sedimentological configuration and cannot be generalised to the entire Tchirezrine II reservoir. It, however, reveals the strong influence of the E–W-trending structures on fluid flow where they are present.
These different results reveal that the Tchirezrine II is a heterogeneous reservoir locally controlled by E–W deformation structures of variable spatial distribution and typology. The link between the reservoir anisotropy detected during the hydrogeological test and the structural network is discussed below.
5.2 Interpretations of lineament sets
The studied lineaments (from Sect. 4.1.2) probably correspond to different types of structures such as faults, extensional fractures, and deformation bands. The two main sets of detected lineaments, i.e. NE–SW- and NE–SW-trending sets, are characterised by a sub-orthogonal organisation (Fig. 3). Their spacing coefficient of variation (Cv < 1) reveals an overall regularly spaced pattern (Gillespie et al., 2001; Odling et al., 1999; Strijker et al., 2012; Watkins et al., 2015). The organisation of such sets is variable from one sampling window to another but evolves similarly for both sets. Their length distribution clearly shows that these lineaments are scale-dependent (negative exponential law). All of these observations are quite consistent with the pattern of extensional fractures mechanically restricted to layers of variable thickness (the so-called joint sets) (Bai et al., 2000; Bai and Pollard, 2000; Hu and Evans, 1989; Odling et al., 1999; Rives et al., 1992; Soliva et al., 2006; Soliva and Schultz, 2008). The mean spacing obtained for these sets and the relationship between the joint spacing and the thickness of the mechanical layers described in the literature (Gillespie et al., 2001; Ji et al., 2021; Strijker et al., 2012) suggest that these sets are contained by mechanical units of several metres in thickness. This is also consistent with the description of the Tchirezrine II deposit as having fluvial sequences ranging in thickness from a few decimetres to several metres (Orano; Emmanuelle Chanvry, personal communication, 2023). As mentioned before, the relatively large spacing observed, compared to data from the literature, is probably due to the truncation bias for lineament detection.
Faults are obviously also present in the detected lineaments (Fig. 2c–e). E–W lineaments have the Eq. (1) coefficient of variation in the spacing Cv≥ 1 (clustered spatial distribution); the Eq. (2) length distribution that is more censored than for the other sets (Sect. 4.1.2); and the Eq. (3) maximum lineament length that is significantly larger than the two other sets (L≥ 150 m), which is inconsistent with both the extensional fractures and deformation band length (Schultz et al., 2008). Although a component of this set is spatially distributed (negative exponential length distribution more consistent with fractures or deformation bands), these observations suggest that this E–W set is less scale-dependent (more scale-invariant) than the NE–SW and NE–SW sets and therefore more spatially heterogeneous. Also note that another lineament set oriented N°070E, much less present in the studied data compared to the other lineament sets, is also described as having faults (e.g. Sani et al., 2020; Figs. 2a, e and 3) and is observed together with E–W lineaments at the basin scale. Faults are generally described in the literature as clustered systems having a power law length distribution, i.e. scale-invariant (e.g. Bonnet et al., 2001; Torabi and Berg, 2011; Watterson et al., 1996; Yielding et al., 1996), suggesting that this E–W set corresponds better to a fault system. The fact that the E–W faults are more censored than the two other sets can explain part of the curvature on this graph and the apparent exponential distribution. In addition, it is known that fault systems can show hybrid behaviour (between the exponential and power law length distribution) in layered host rock conditions (e.g. Soliva and Schultz, 2008). This behaviour might be relevant to a fluviatile deposition context in which stratigraphy is heterogeneous, as described for the studied Tchirezrine II sandstone series. Eventually, it is worth considering that mechanical stratigraphy can have more influence on the growth of small-scale structures than large ones. Furthermore, small-scale structures such as extensional fractures and deformation bands can be inherent to fault DZs (Schueller et al., 2013) and to the background deformation formed during the fault system growth (Mayolle et al., 2023). If this is true in our case, part of the observed exponential distribution, in particular the curvature on the graph for a small lineament size, could be a real geometric property of this E–W set, highlighting both the subparallel DZ structures and background deformation, as well as fault traces.
5.3 Petrophysical properties and deformation structures
A complex interplay of geological parameters controls the petrophysical properties of NFR (Narr et al., 2006; Nelson, 2001) (Fig. 10a). Both the matrix and deformation structures impact the porosity and permeability values measured by logging tools (Fig. 10b). As discussed above, the Tchirezrine II reservoir exhibits a wide variety of structural features, including extensional fractures, cataclastic deformation bands, and faults that are known to have a contrasting impact on the reservoir's porosity and permeability properties.
- i.
Extensional fractures, when open, are characterised by their ability to slightly increase porosity (typically below 0.5 %; Nelson, 2001) and significantly enhance permeability (Sibson, 1996). Open fractures may form preferential pathways for fluid flow and may enhance the overall drainage of the rock matrix (Nelson, 2001; Warren and Root, 1963; Watkins et al., 2018). Where fractures are prevalent along the well, the dataset shows high permeability for relatively low porosity whatever the matrix grain size (Fig. 8d). Figure 10c, using data only from FSs of Fig. 8d, reveals the same dominant trend controlled by fracture density. Note that cemented and fine sandstones with observed fractures (yellow and red clusters) show relatively low porosity (< 20 %), which constitutes a favourable condition for extensional fracture formation and permeability enhancement (e.g. Wong et al., 1997; Nelson, 2001) and explains the inconsistency of porosity decrease as a function of fracture density (Fig. 10c). However, as mentioned before, borehole observations are not relevant to analyse any correlation between the high dipping structure density and lithology, especially when boreholes are nearly vertical.
- ii.
Cataclastic deformation bands induce a grain size reduction by crushing (comminution) and have a contrasting impact on the reservoir's porosity and permeability. These structures can form various kinds of sandstone granulometry since the porosity is higher than 15 %–20 % during their formation and tends to slightly reduce the overall porosity and decrease the permeability of the sandstone reservoirs but with different intensity as a function of various geological factors (e.g. initial porosity, stress regime, burial depth, and grain size of the host material; Ballas et al., 2015). In addition to cataclasis, cementation, both in extensional fractures, dilation bands, and cataclastic bands can significantly reduce reservoir and fault zone permeability and generate seals or transient barriers to fluid flow. As mentioned for extensional fractures, borehole observations are not relevant to analyse with respect to any correlation between their density and lithology.
- ii.
Faults can significantly affect reservoir permeability in two contrasting ways: increasing or reducing permeability, both in the fractured DZ and/or the fault core (Caine et al., 1996). The nature of the deformation process, i.e. disaggregation cataclasis, clay smearing, or cementation, and their in situ stress conditions will govern the capacity of these zones to form efficient permeable or seal structures (e.g. Aydin, 2000; Barton et al., 1995; Fisher and Knipe, 2001; Philit et al., 2019; Yielding et al., 1997).
Since the Tchirezrine II reservoir has 19 % of the average porosity and that fracture porosity in NFR is < 1 % (Nelson, 2001), it is obvious that a large part of the porosity comes from the matrix. In places with low P10 density, such as borehole data IMOU_1384_2 (Figs. 7d, 8d, and 10c), the reservoir exhibits Type M behaviour, following the Nelson (2001) classification; i.e. the matrix hosts 100 % of the reservoir porosity and permeability. In the case of higher P10 density (i.e. IMOU_0236_4; Figs. 7d, 8d, and 10c), the reservoir exhibits Type III behaviour, following the Nelson (2001) classification, where porosity is ∼ 100 % matrix, and permeability is significantly enhanced by open fractures. In places of the reservoir where the presence of deformation bands or sealed fractures has been identified, the reservoir is more likely to correspond to Type IV, in which porosity is 100 % matrix, and deformation structures reduce the porosity and permeability of the reservoir. It is worth mentioning that lateral and vertical variation in the sandstone facies can occur (i.e. porosity change) and may lead to transition zones with the presence of both cataclastic deformation bands and open fractures (Liu et al., 2021). Considering the scale of ISR production cells, different NFR types then coexist in the Tchirezrine II reservoir, consistent with the variabilities in the deformation features detected in this reservoir and the heterogeneities of the host sandstone unit.
5.4 Reservoir anisotropy and deformation patterns
In this section, we correlate the structural, petrophysical, and hydrogeological analysis and interpretations to constrain the reservoir behaviour and discuss the ISR application in NFRs context.
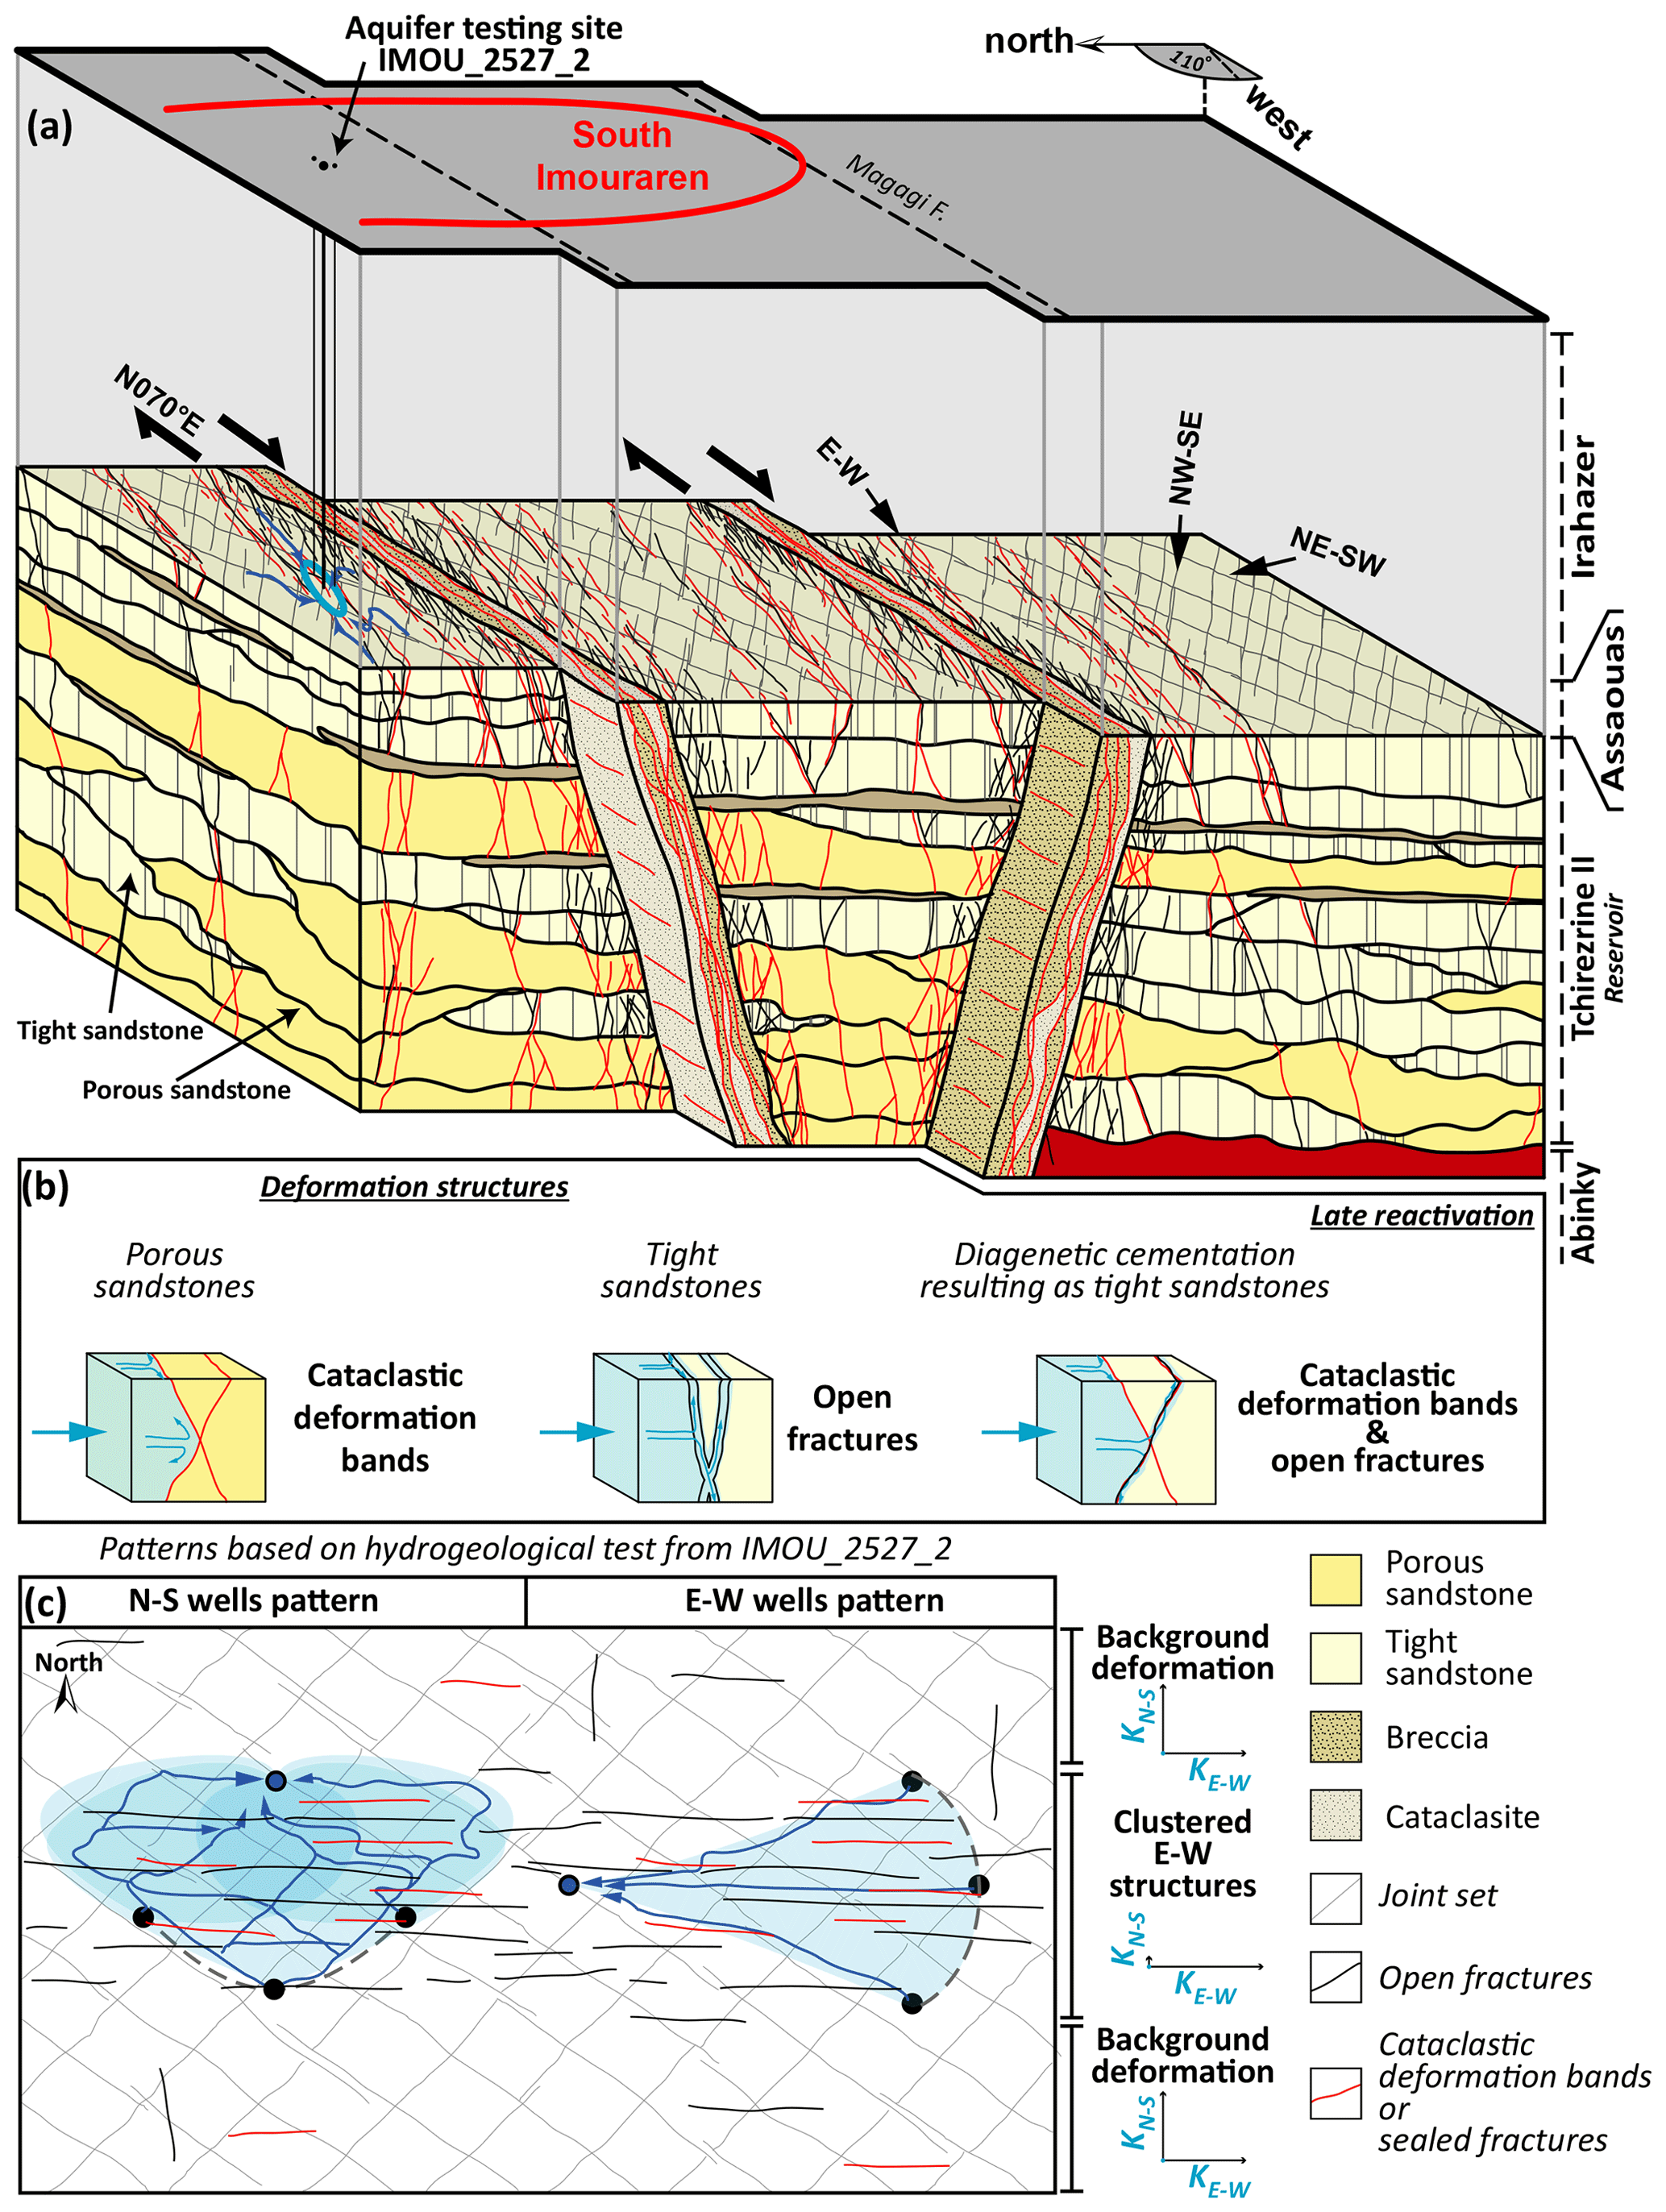
Figure 11Schematic view of the Tchirezrine II NFR at the Imouraren site. (a) 3D schematic block diagram summarising the pattern of deformation structures of the southern part of the Imouraren site. (b) Sketches illustrating the potential impact of deformation structures on the fluid flow for different mechanical behaviour contexts. (c) Two different well patterns for ISR mining, (N–S) where injectors and producer wells are perpendicular to the main permeability direction minimising channelled flow between wells and (E–W) where injectors and producer wells are subject to channelled flow. Scales are not representative.
In the configuration of the hydrogeological test (Fig. 11a), the approximate 1:10 ratio of the E–W extension of the drawdown cone reveals an anisotropic behaviour of permeability in the Tchirezrine II reservoir at least at a decametric scale and at a specific site (Fig. 9). Tracing in the E–W direction reveals a channelled flow with a high and rapid restitution rate, whereas tracing in the N–S direction reveals a dispersive flow with slow and low recovery (Fig. 11b). In this case, anisotropy cannot be linked to a specific sedimentary architecture since fluvial sandstone bodies are globally oriented N–S (Valsardieu, 1971). However, the lateral connectivity and continuity of the sandstone fluvial bodies remain important since sandstones facies and fluvial bodies are controlling the deformation structure typology and organisation (i.e. spacing, vertical, and lateral extension). This E–W anisotropy seems mainly controlled by the extensional fractures and cataclastic deformation bands, both with E–W azimuth as detected from OBI approach (Fig. 7). These deformations are consistent with the orientation and length distribution of the E–W set of lineaments and show a large density close to N070° E faults (see Sect. 4.2; Figs. 1d and 7d). The anisotropy of the Tchirezrine II reservoir appears then mainly controlled by the N070° E and E–W fault networks (Fig. 2a and b) and related damage zones. The crush breccias that are sometimes composing the fault cores (Fig. 7c) are mainly observed with clay infilling which probably forms E–W-trending seals. In fault DZ, or far from faults, open fractures must enhance drainage in the reservoir in the E–W direction, while sealed fractures and cataclastic deformation bands should have minor N–S permeability (Fig. 11b; e.g. Ballas et al., 2015; Bisdom et al., 2016). The vertical occurrence of brittle (fault and extensional fractures) vs. ductile structures (cataclastic deformation bands) mainly depends on the stress conditions applied and petrophysical properties of the host sandstone (see Sect. 5.3 and references therein) and, therefore, on the sedimentary architecture of the reservoir (Fig. 11a). This high-permeability anisotropy in the E–W direction is specific to areas with a high density of E–W deformation structures and should therefore be lower further away from these structures (Fig. 11c). Note that two other tracer tests were performed on site IMOU_1228_2 but are not presented in this study as their configurations are not relevant for a proper comparison (i.e. different tracer directions to those presented in this study). However, we observe faster N–S brine restitution than at the IMOU_2527_2 site, together with possible structural drainage. More generally, far from clustered fracture zones, we expect structurally more homogeneous behaviour and also behaviour controlled by sedimentary architecture.
For ISR mining purposes, the overall structural network and sub-networks of the sandstone bodies are critical, as traditional ISR mining cells are decametric in scale (Mudd, 2001). In such a well configuration, open fractures with a penalising orientation can link the injection wells to the recovery one and act as bypass, preventing the leaching solution from accessing the main ore volume located in the matrix far from the bypass (Figs. 9b and 11c). Conversely, cataclastic deformation bands, which generally are baffles to fluid flow, will prevent the leaching solution from fully accessing the matrix porosity. To inhibit the impact of bypass structures, an ISR well pattern perpendicular to the main permeability direction could be a coherent solution to minimise the channelled flow in open fractures (Odling et al., 2004) and force the solution through cataclastic bands (Fig. 11c; N–S well pattern). This scheme would significantly increase the spreading and travel time of the leaching solution, which is better for the kinetics of the leaching reaction than a shorter, channelled path. This can be illustrated by the E–W well pattern shown in Fig. 11c, where the leach solution is channelled directly to the production well, minimising the volume of the accessible matrix. Whatever the considered well pattern, the impact of faults and fractures on top and basal seals integrity is also decisive to prevent any potential leaks of the leaching solution. These proposed patterns are based on only one in situ hydrogeological test. Further tests could be carried out to gain a better understanding of the lateral anisotropy of the permeability and the impact of the mechanical stratigraphic partitioning on the fluid flow at the scale of an ISR production cell. Among other things, this study highlights the important parameters that need to be considered for ISR operations in fractured heterogeneous sandstone reservoirs. This reservoir characterisation can also serve as a starting point for future hydrogeological percolation modelling using equivalent porous medium or discrete fracture network methods (Collet et al., 2022; Medici and West, 2022; Sharifzadeh et al., 2018).
To characterise a NFR in the heterogeneous fluvial sandstone sequence of the Imouraren uranium deposit, we present an original integrated approach coupling the (i) lineament analysis from satellite image of the Tchirezrine II unit, (ii) deformation analysis from core and OBI, (iii) petrophysical properties analysis from well logging data, and (iv) aquifer testing. Three main points can be highlighted from our interpretations:
-
Sub-orthogonal azimuth sets (NE–SW and NW–SE) are scale-dependent in length distribution, widely and homogeneously distributed in the reservoir, but poorly observed in borehole. Conversely, E–W deformation structures (faults, extensional fractures, and cataclastic deformation bands) with better scale-invariant length distribution and therefore having spatially heterogeneous distribution are frequently observed in some boreholes. They appear to be clustered around faults and provide strong heterogeneity in the structural framework.
-
The porosity of the Tchirezrine II reservoir appears to be mainly hosted by the sandstone matrix. In tighter parts of the reservoir (low-porosity, fine-grained units), the permeability is enhanced by open extensional fractures as a function of their P10 density (reservoir Type III). Conversely, in coarse-grained and porous sandstone, the permeability is relatively low (i.e. compared to the theoretical Kozeny–Carman trend), potentially reduced by the presence of cataclastic deformation bands (reservoir Type IV). The different typologies of the deformation structures reveal the impact of the initial porosity of the host rock on deformation mechanisms and, ultimately, on the diversity of the reservoir properties.
-
Salt tracing and drawdown tests at IMOU_2527_2 reveal significantly higher fluid flow in the E–W direction than in the N–S direction, probably related to the observed E–W-trending deformation structures. These structures must impact water flow with preferential fluid pathways in open extensional fractures and/or guides to flows along transient seals. This site reveals that fluid flow can be highly anisotropic (ratio 1:10 of the drawdown cone) into zones of E–W-trending structures which are heterogeneously distributed in the reservoir. In these areas, strategies can be implemented to limit well-to-well bypass and globally improve uranium ISR mining in NFRs by integrating the general fracture network, its typology, and the permeability anisotropy. Far from these E–W structures, permeability anisotropy should be less pronounced.
The datasets in this article are available on request to the corresponding author only.
The supplement related to this article is available online at: https://doi.org/10.5194/se-15-895-2024-supplement.
MJ: conceptualisation, methodology, lineament data acquisition, data quality assurance and quality control (QAQC), formal analysis for lineament and well data, writing, and original draft preparation. GB: conceptualisation, formal analysis, and writing (reviewing and editing). RS: supervision, conceptualisation, lineament methodology and formal analysis, and writing (reviewing and editing). OG: Orano project administrator, structural data acquisition from OBI, reviewing, and editing. TL: data acquisition, data QAQC, formal analysis, interpretation, and reviewing for hydrogeological testing. CL: conceptualisation, formal analysis, and reviewing. DL: conceptualisation, formal analysis, and reviewing.
Maxime Jamet and Roger Soliva received research funding from Orano. Thierry Lefbvre and Olivier Gerbeaud are Orano employees. The contact author has declared that none of the authors has any known competing financial interests or personal relationships with Orano that might appear to influence the work reported in this article. The peer-review process was guided by an independent editor, and the authors also have no other competing interests to declare.
Publisher's note: Copernicus Publications remains neutral with regard to jurisdictional claims made in the text, published maps, institutional affiliations, or any other geographical representation in this paper. While Copernicus Publications makes every effort to include appropriate place names, the final responsibility lies with the authors.
The authors would like to thank Romain Mieszkalski, Youcef Bensedik, and Gregory Dufréchou from Orano for their help in processing the log data and for their advice. We would also like to thank Emanuelle Chanvry of Orano for her help in understanding the sedimentary context. Last, we would like to thank Giacomo Medici from the Solid Earth community, as well as Nikolas Ovaskainen and an anonymous referee, for the helpful comments and suggestions on the paper.
This research work has been funded by Orano (grant no. 211783-02) and the University of Montpellier.
This paper was edited by Stefano Tavani and reviewed by Nikolas Ovaskainen and one anonymous referee.
Abràmoff, M. D., Magalhaes, P. J., and Ram, S. J.: Image Processing with ImageJ, Biophotonics Int., 11, 36–42, 2004.
Allan, J. and Sun, S. Q.: Controls on Recovery Factor in Fractured Reservoirs: Lessons Learned from 100 Fractured Fields, in: All Days, SPE Annual Technical Conference and Exhibition, October 2003, Denver, Colorado, SPE-84590-MS, https://doi.org/10.2118/84590-MS, 2003.
Antonellini, M. and Aydin, A.: Effect of Faulting on Fluid Flow in Porous Sandstones: Petrophysical Properties, AAPG Bull., 78, 355–377, https://doi.org/10.1306/BDFF90AA-1718-11D7-8645000102C1865D, 1994.
Antonellini, M. A., Aydin, A., and Pollard, D. D.: Microstructure of deformation bands in porous sandstones at Arches National Park, Utah, J. Struct. Geol., 16, 941–959, https://doi.org/10.1016/0191-8141(94)90077-9, 1994.
Aydin, A.: Fractures, faults, and hydrocarbon entrapment, migration and fow, Mar. Pet. Geol., 17, 797–814, 2000.
Aydin, A. and Johnson, A. M.: Development of faults as zones of deformation bands and as slip surfaces in sandstone, Pure Appl. Geophys., 116, 931–942, https://doi.org/10.1007/BF00876547, 1978.
Aydin, A., Borja, R. I., and Eichhubl, P.: Geological and mathematical framework for failure modes in granular rock, J. Struct. Geol., 28, 83–98, https://doi.org/10.1016/j.jsg.2005.07.008, 2006.
Bai, T. and Pollard, D. D.: Fracture spacing in layered rocks: a new explanation based on the stress transition, J. Struct. Geol., 22, 43–57, https://doi.org/10.1016/S0191-8141(99)00137-6, 2000.
Bai, T., Pollard, D. D., and Gao, H.: Explanation for fracture spacing in layered materials, Nature, 403, 753–756, https://doi.org/10.1038/35001550, 2000.
Ballas, G., Fossen, H., and Soliva, R.: Factors controlling permeability of cataclastic deformation bands and faults in porous sandstone reservoirs, J. Struct. Geol., 76, 1–21, https://doi.org/10.1016/j.jsg.2015.03.013, 2015.
Barton, C. A., Zoback, M. D., and Moos, D.: Fluid flow along potentially active faults in crystalline rock, Geology, 23, 683–686, https://doi.org/10.1130/0091-7613(1995)023<0683:FFAPAF>2.3.CO;2, 1995.
Barwis, J. H., McPherson, J. G., and Studlick, J. R. J.: Sandstone Petroleum Reservoirs, Springer New York, New York, NY, 583 pp., https://doi.org/10.1007/978-1-4613-8988-0, 1990.
Bear, J.: Dynamics of Fluids in Porous Media, American Elsevier Publishing Co., 764 pp., ISBN 978-0-486-65675-5, 1972.
Berkowitz, B. and Adler, P. M.: Stereological analysis of fracture network structure in geological formations, J. Geophys. Res.-Sol. Ea., 103, 15339–15360, https://doi.org/10.1029/98JB01072, 1998.
Billon, S.: Minéraux argileux dans le gisement uranifère d'Imouraren (Bassin de Tim Mersoï, Niger): Implications sur la genèse du gisement et sur l'optimisation des processus de traitement du minerai, PhD thesis, Univérsité Poitiers, 340 pp., https://theses.fr/2014POIT2263 (last access: July 2024), 2014.
Bisdom, K., Bertotti, G., and Nick, H. M.: The impact of in-situ stress and outcrop-based fracture geometry on hydraulic aperture and upscaled permeability in fractured reservoirs, Tectonophysics, 69, 63–75, https://doi.org/10.1016/j.tecto.2016.04.006, 2016.
Bonnet, E., Bour, O., Odling, N. E., Davy, P., Main, I., Cowie, P., and Berkowitz, B.: Scaling of fracture systems in geological media, Rev. Geophys., 39, 347–383, https://doi.org/10.1029/1999RG000074, 2001.
Caine, J. S., Evans, J. P., and Forster, C. B.: Fault zone architecture and permeability structure, Geology, 24, 1025–1028, https://doi.org/10.1130/0091-7613(1996)024<1025:FZAAPS>2.3.CO;2, 1996.
Carman, P. C.: Fluid flow through granular beds, Inst. Chem. E., 150–166, https://doi.org/10.1016/S0263-8762(97)80003-2, 1937.
Carman, P. C.: Flow of Gases Through Porous Media, Academic Press, New York, 182 pp., https://books.google.fr/books?id=JBxRAAAAMAAJ (last access: July 2024), 1956.
Childs, C., Walsh, J. J., and Watterson, J.: A Method for Estimation of the Density of Fault Displacements below the Limits of Seismic Resolution in Reservoir Formations, in: North Sea Oil and Gas Reservoirs—II, edited by: Buller, A. T., Berg, E., Hjelmeland, O., Kleppe, J., Torsæter, O., and Aasen, J. O., Springer Netherlands, Dordrecht, https://doi.org/10.1007/978-94-009-0791-1_26, 309–318, 1990.
Clauset, A., Shalizi, C. R., and Newman, M. E. J.: Power-Law Distributions in Empirical Data, SIAM Rev., 51, 661–703, https://doi.org/10.1137/070710111, 2009.
Collet, A., Regnault, O., Ozhogin, A., Imantayeva, A., and Garnier, L.: Three-dimensional reactive transport simulation of Uranium in situ recovery: Large-scale well field applications in Shu Saryssu Bassin, Tortkuduk deposit (Kazakhstan), Hydrometallurgy, 211, 105873, https://doi.org/10.1016/j.hydromet.2022.105873, 2022.
Cowie, P. A., Sornette, D., and Vanneste, C.: Multifractal scaling properties of a growing fault population, Geophys. J. Int., 122, 457–469, https://doi.org/10.1111/j.1365-246X.1995.tb07007.x, 1995.
Cox, D. R. and Lewis, P. A. W.: The Statistical Analysis of Series of Events, Springer Netherlands, 285 pp., https://doi.org/10.1007/978-94-011-7801-3, 1966.
Cubitt, J. M., England, W. A., and Larter, S. R. (Eds.): Understanding petroleum reservoirs: towards and integrated reservoir engineering, The Geological Society, London, 395 pp., https://doi.org/10.1144/GSL.SP.2004.237, 2004.
Dershowitz, W. S.: Rock joint systems, PhD thesis, Massachusetts Institute of Technology, 918 pp., http://hdl.handle.net/1721.1/27939 (last access: July 2024), 1984.
Dershowitz, W. S. and Herda, H. H.: Interpretation of fracture spacing and intensity, The 33rd U. S. Symposium on Rock Mechanics (USRMS), Santa Fe, New Mexico, Int. J. Rock Mech. Min., A212, https://doi.org/10.1016/0148-9062(93)91769-F, 1993.
Dichiarante, A. M., McCaffrey, K. J. W., Holdsworth, R. E., Bjørnarå, T. I., and Dempsey, E. D.: Fracture attribute scaling and connectivity in the Devonian Orcadian Basin with implications for geologically equivalent sub-surface fractured reservoirs, Solid Earth, 11, 2221–2244, https://doi.org/10.5194/se-11-2221-2020, 2020.
Doyle, J. D. and Sweet, M. L.: Three-Dimensional Distribution of Lithofacies, Bounding Surfaces, Porosity, and Permeability in a Fluvial Sandstone–Gypsy Sandstone of Northern Oklahoma, AAPG Bull., 79, 70–96, https://doi.org/10.1306/8D2B14BC-171E-11D7-8645000102C1865D, 1995.
Elsayed, M., Isah, A., Hiba, M., Hassan, A., Al-Garadi, K., Mahmoud, M., El-Husseiny, A., and Radwan, A. E.: A review on the applications of nuclear magnetic resonance (NMR) in the oil and gas industry: laboratory and field-scale measurements, J. Pet. Explor. Prod. Technol., 12, 2747–2784, https://doi.org/10.1007/s13202-022-01476-3, 2022.
Evans, D., Stephenson, M., and Shaw, R.: The present and future use of `land' below ground, Land Use Policy, 26, 302–316, https://doi.org/10.1016/j.landusepol.2009.09.015, 2009.
Evans, R. D. and Lekia, S. D. L.: A Reservoir Simulation Study of Naturally Fractured Lenticular Tight Gas Sand Reservoirs, J. Energ. Resour.-ASME, 112, 231–238, https://doi.org/10.1115/1.2905763, 1990.
Fisher, Q. J. and Knipe, R. J.: The permeability of faults within siliciclastic petroleum reservoirs of the North Sea and Norwegian Continental Shelf, Mar. Petrol. Geol., 18, 1063–1081, https://doi.org/10.1016/S0264-8172(01)00042-3, 2001.
Fossen, H., Schultz, R. A., Shipton, Z. K., and Mair, K.: Deformation bands in sandstone: a review, J. Geol. Soc., 164, 755–769, https://doi.org/10.1144/0016-76492006-036, 2007.
Fossen, H., Soliva, R., Ballas, G., Trzaskos, B., Cavalcante, C., and Schultz, R. A.: A review of deformation bands in reservoir sandstones: geometries, mechanisms and distribution, Geol. Soc. Lond. Spec. Publ., 459, 9–33, https://doi.org/10.1144/SP459, 2017.
Gerbeaud, O.: Evolution structurale du bassin de Tim Mersoï: Déformation de la couverture sédimentaire, relations avec la localisation des gisements du secteur d'Arlit (Niger), PhD thesis, Université Paris XI, Orsay, 270 pp., 2006.
Gibling, M. R.: Width and Thickness of Fluvial Channel Bodies and Valley Fills in the Geological Record: A Literature Compilation and Classification, J. Sediment. Res., 76, 731–770, https://doi.org/10.2110/jsr.2006.060, 2006.
Gibson, R. G.: Physical character and fluid-flow properties of sandstone-derived fault zones, Geol. Soc. Lond. Spec. Publ., 127, 83–97, https://doi.org/10.1144/GSL.SP.1998.127.01.07, 1998.
Gillespie, P. A., Walsh, J. J., Watterson, J., Bonson, C. G., and Manzocchi, T.: Scaling relationships of joint and vein arrays from The Burren, Co. Clare, Ireland, J. Struct. Geol., 23, 183–201, https://doi.org/10.1016/S0191-8141(00)00090-0, 2001.
Golsanami, N., Sun, J., and Zhang, Z.: A review on the applications of the nuclear magnetic resonance (NMR) technology for investigating fractures, J. Appl. Geophys., 133, 30–38, https://doi.org/10.1016/j.jappgeo.2016.07.026, 2016.
Goodwin, A. R. H., Pirolli, L., May, E. F., and Marsh, K. N.: Conventional Oil and Gas, in: Future Energy, Elsevier, 19–52, https://doi.org/10.1016/B978-0-08-099424-6.00002-8, 2014.
Guiraud, R., Ousman, B., and Robert, J. P.: Mise en évidence de déformations traduisant un raccourcissement dans le Mésozoïque de la périphérie de l'Aïr (Niger), C. R. Accadémie Sci. Paris, 292, 753–756, 1981.
Harstad, H., Teufel, L. W., and Lorenz, J. C.: Characterization and Simulation of Naturally Fractured Tight Gas Sandstone Reservoirs, in: All Days, SPE Annual Technical Conference and Exhibition, October 1995, Dallas, Texas, SPE-30573-MS, https://doi.org/10.2118/30573-MS, 1995.
Heffer, K. J. and Bevan, T. G.: Scaling Relationships in Natural Fractures: Data, Theory, and Application, in: All Days, European Petroleum Conference, October 1990, the Hague, the Netherlands, SPE-20981-MS, https://doi.org/10.2118/20981-MS, 1990.
Hidajat, I., Mohanty, K. K., Flaum, M., and Hirasaki, G.: Study of Vuggy Carbonates Using NMR and X-Ray CT Scanning, SPE Reserv. Eval. Eng., 7, 365–377, https://doi.org/10.2118/88995-PA, 2004.
Hu, M. S. and Evans, A. G.: The cracking and decohesion of thin films on ductile substrates, Acta Metall., 37, 917–925, https://doi.org/10.1016/0001-6160(89)90018-7, 1989.
Jackson, P. and Sanderson, D. J.: Scaling of fault displacements from the Badajoz-Córdoba shear zone, SW spain, Tectonophysics, 210, 179–190, https://doi.org/10.1016/0040-1951(92)90321-V, 1992.
Jácomo, M., Trindade, R., De Oliveira, E., Leite, C., Montrazi, E., Andreeta, M., and Bonogamba, T.: Nuclear Magnetic Resonance and Pore Coupling in Clay-Coated Sandstones With Anomalous Porosity Preservation, Agua Grande Formation, Reconcavo Basin, Brazil, Petrophysics–SPWLA J. Form. Eval. Reserv. Descr., 59, 136–152, https://doi.org/10.30632/PJV59N2-2018A2, 2018.
Jácomo, M. H., Trindade, R. I. F., Lucas-Oliveira, E., and Bonagamba, T. J.: Magnetic matrix effects on NMR relaxation times in sandstones: A case study in Solimões Basin, J. Appl. Geophys., 179, 104081, https://doi.org/10.1016/j.jappgeo.2020.104081, 2020.
Ji, S., Li, L., and Marcotte, D.: Power-law relationship between joint spacing and bed thickness in sedimentary rocks and implications for layered rock mechanics, J. Struct. Geol., 150, 104413, https://doi.org/10.1016/j.jsg.2021.104413, 2021.
Keller, A. A., Sakthivadivel, R., and Seckler, D. W.: Water scarcity and the role of storage in development, International Water Management Institute, Colombo, Sri Lanka, 2000.
Kozeny, J.: Über kapillare Leitung des Wassers im Boden. (Aufstieg, Versickerung und Anwendung auf die Bewässerung), Sitzungsberichte der Akademie der Wissenschaften mathematisch-naturwissenschaftliche Klasse, 136, 271–306, 1927.
Kruseman, G. P. and de Ridder, N. A.: Analysis and evaluation of pumping test data, 2. edn. (completely rev.), reprint, International Institute for Land Reclamation and Improvement, Wageningen, 377 pp., 2000.
Lee, W. J. and Hopkins, C. W.: Characterization of Tight Reservoirs, J. Petrol. Technol., 46, 956–964, https://doi.org/10.2118/29091-PA, 1994.
Liu, Z., Fu, X., Deng, S., Meng, L., Wang, H., Sun, Y., and Chen, Z.: The critical control of arkosic sandstone porosity on deformation band formation: Insights from the Shulu across-fault borehole in the Bohai Bay Basin, China, J. Struct. Geol., 143, 104258, https://doi.org/10.1016/j.jsg.2020.104258, 2021.
Lucia, F. J.: Carbonate Reservoir Characterization, Springer Berlin Heidelberg, Berlin, Heidelberg, 336 pp., https://doi.org/10.1007/978-3-540-72742-2, 2007.
Mamane Mamadou, M.: Le système métallogénique des gisements d'uranium associés à la faille d'Arlit (Bassin de Tim Mersoï, Niger): diagenèse, circulations des fluides et mécanismes d'enrichissement en métaux (U, Cu, V), PhD thesis, Université Lorraine, 448 pp., https://theses.fr/2016LORR0231 (last access: July 2024), 2016.
Mamane Mamadou, M., Cathelineau, M., Deloule, E., Reisberg, L., Cardon, O., Vallance, J., and Brouand, M.: The Tim Mersoï Basin uranium deposits (Northern Niger): Geochronology and genetic model, Ore Geol. Rev., 145, 104905, https://doi.org/10.1016/j.oregeorev.2022.104905, 2022.
Manzocchi, T.: The connectivity of two-dimensional networks of spatially correlated fractures, Water Resour. Res., 38, 1162, https://doi.org/10.1029/2000WR000180, 2002.
Mauldon, M., Dunne, W. M., and Rohrbaugh, M. B.: Circular scanlines and circular windows: new tools for characterizing the geometry of fracture traces, J. Struct. Geol., 23, 247–258, https://doi.org/10.1016/S0191-8141(00)00094-8, 2001.
Mayolle, S., Soliva, R., Caniven, Y., Wibberley, C., Ballas, G., Milesi, G., and Dominguez, S.: Scaling of fault damage zones in carbonate rocks, J. Struct. Geol., 124, 35–50, https://doi.org/10.1016/j.jsg.2019.03.007, 2019.
Mayolle, S., Soliva, R., Dominguez, S., and Wibberley, C.: Normal fault damage zone growth in map view from analogue models, J. Struct. Geol., 176, 104975, https://doi.org/10.1016/j.jsg.2023.104975, 2023.
Medici, G. and West, L. J.: Review of groundwater flow and contaminant transport modelling approaches for the Sherwood Sandstone aquifer, UK; insights from analogous successions worldwide, Q. J. Eng. Geol. Hydroge., 55, qjegh2021-176, https://doi.org/10.1144/qjegh2021-176, 2022.
Miall, A. D.: Reservoir Heterogeneities in Fluvial Sandstones: Lessons from Outcrop Studies, AAPG Bull., 72, 682–697, https://doi.org/10.1306/703C8F01-1707-11D7-8645000102C1865D, 1988.
Moeck, I. S.: Catalog of geothermal play types based on geologic controls, Renew. Sust. Energ. Rev., 37, 867–882, https://doi.org/10.1016/j.rser.2014.05.032, 2014.
Morad, S., Al-Ramadan, K., Ketzer, J. M., and De Ros, L. F.: The impact of diagenesis on the heterogeneity of sandstone reservoirs: A review of the role of depositional facies and sequence stratigraphy, AAPG Bull., 94, 1267–1309, https://doi.org/10.1306/04211009178, 2010.
Mudd, G.: Critical review of acid in situ leach uranium mining: 1. USA and Australia, Environ. Geol., 41, 390–403, https://doi.org/10.1007/s002540100406, 2001.
Narr, W., Schechter, D. S., and Thompson, L. B.: Naturally Fractured Reservoir Characterization, Society of Petroleum Engineers, https://doi.org/10.2118/9781613999615, 2006.
Nelson, P. H.: Permeability, porosity, and pore-throat size? A three-dimensional perspective, Petrophysics–SPWLA J. Form. Eval. Reserv. Descr., 46, 452–455, 2005.
Nelson, R. A.: Geologic analysis of naturally fractured reservoirs, 2nd Edn., Gulf Professional Pub, Boston, ISBN 978-0-88415-317-7, 2001.
Nichols, G.: Sedimentology and Stratigraphy, second Edn., Wiley Desktop Editions, Wiley, ISBN 978-1-4051-9379-5, 2009.
Northrop, D. A. and Frohne, K.-H.: The Multiwell Experiment – A Field Laboratory in Tight Gas Sandstone Reservoirs, J. Petrol. Technol., 42, 772–779, https://doi.org/10.2118/18286-PA, 1990.
Odling, N. E.: Scaling and connectivity of joint systems in sandstones from western Norway, J. Struct. Geol., 19, 1257–1271, https://doi.org/10.1016/S0191-8141(97)00041-2, 1997.
Odling, N. E., Gillespie, P., Bourgine, B., Castaing, C., Chiles, J. P., Christensen, N. P., Fillion, E., Genter, A., Olsen, C., Thrane, L., Trice, R., Aarseth, E., Walsh, J. J., and Watterson, J.: Variations in fracture system geometry and their implications for fluid flow in fractured hydrocarbon reservoirs, Petrol. Geosci., 5, 373–384, https://doi.org/10.1144/petgeo.5.4.373, 1999.
Odling, N. E., Harris, S. D., and Knipe, R. J.: Permeability scaling properties of fault damage zones in siliclastic rocks, J. Struct. Geol., 26, 1727–1747, https://doi.org/10.1016/j.jsg.2004.02.005, 2004.
Olson, J. E., Laubach, S. E., and Lander, R. H.: Natural fracture characterization in tight gas sandstones: Integrating mechanics and diagenesis, AAPG Bull., 93, 1535–1549, https://doi.org/10.1306/08110909100, 2009.
Ovaskainen, N., Nordbäck, N., Skyttä, P., and Engström, J.: A new subsampling methodology to optimize the characterization of two-dimensional bedrock fracture networks, J. Struct. Geol., 155, 104528, https://doi.org/10.1016/j.jsg.2022.104528, 2022.
Ovaskainen, N., Skyttä, P., Nordbäck, N., and Engström, J.: Detailed investigation of multi-scale fracture networks in glacially abraded crystalline bedrock at Åland Islands, Finland, Solid Earth, 14, 603–624, https://doi.org/10.5194/se-14-603-2023, 2023.
Pagel, M., Cavellec, S., Forbes, P., Gerbaud, O., Vergely, P., Wagani, I., and Mathieu, R.: Uranium deposits in the Arlit area (niger), in: Mineral Deposit Research: Meeting the Global Challenge, edited by: Mao, J. and Bierlein, F. P., Springer, Berlin, Heidelberg, 303–305, https://doi.org/10.1007/3-540-27946-6_79, 2005.
Peacock, D. C. P., Nixon, C. W., Rotevatn, A., Sanderson, D. J., and Zuluaga, L. F.: Glossary of fault and other fracture networks, J. Struct. Geol., 92, 12–29, https://doi.org/10.1016/j.jsg.2016.09.008, 2016.
Philit, S., Soliva, R., Ballas, G., Chemenda, A., and Castilla, R.: Fault surface development and fault rock juxtaposition along deformation band clusters in porous sandstones series, AAPG Bull., 103, 2731–2756, https://doi.org/10.1306/01211917256, 2019.
Pollard, D. D. and Aydin, A.: Progress in understanding jointing over the past century, Geol. Soc. Am. Bull., 100, 1181–1204, https://doi.org/10.1130/0016-7606(1988)100<1181:PIUJOT>2.3.CO;2, 1988.
QGIS Development Team: QGIS Geographic Information System, Open Source Geospatial Foundation Project [software], https://qgis.org/ (last access: July 2024), 2020.
Qi, S., Zheng, B., Wang, Z., Zhao, H., Cui, Z., Huang, T., Guo, S., Fu, L., and Dong, P.: Geological evaluation for the carbon dioxide geological utilization and storage (CGUS) site: A review, Sci. China Earth Sci., 66, 1917–1936, https://doi.org/10.1007/s11430-022-1107-x, 2023.
Rempe, N. T.: Permanent underground repositories for radioactive waste, Prog. Nucl. Energ., 49, 365–374, https://doi.org/10.1016/j.pnucene.2007.04.002, 2007.
Rives, T., Razack, M., Petit, J.-P., and Rawnsley, K. D.: Joint spacing: analogue and numerical simulations, J. Struct. Geol., 14, 925–937, https://doi.org/10.1016/0191-8141(92)90024-Q, 1992.
Sambo, C., Dudun, A., Samuel, S. A., Esenenjor, P., Muhammed, N. S., and Haq, B.: A review on worldwide underground hydrogen storage operating and potential fields, Int. J. Hydrogen. Energ., 47, 22840–22880, https://doi.org/10.1016/j.ijhydene.2022.05.126, 2022.
Sanderson, D. J. and Nixon, C. W.: The use of topology in fracture network characterization, J. Struct. Geol., 72, 55–66, https://doi.org/10.1016/j.jsg.2015.01.005, 2015.
Sanderson, D. J. and Peacock, D. C. P.: Making rose diagrams fit-for-purpose, Earth-Sci. Rev., 201, 103055, https://doi.org/10.1016/j.earscirev.2019.103055, 2020.
Sani, A., Konaté, M., Karimou, D. H., and Wollenberg, P.: Polyphasic tectonic history of the N70° DASA Graben (northern, Niger), Glob. Journal Earth Environ. Sci., 5, 58–72, 2020.
Schön, J.: Physical properties of rocks: fundamentals and principles of petrophysics, 2nd Edn., Elsevier, Amsterdam, the Netherlands, ISBN 978-0-08-100404-3, 2015.
Schueller, S., Braathen, A., Fossen, H., and Tveranger, J.: Spatial distribution of deformation bands in damage zones of extensional faults in porous sandstones: Statistical analysis of field data, J. Struct. Geol., 52, 148–162, https://doi.org/10.1016/j.jsg.2013.03.013, 2013.
Schultz, R. A., Soliva, R., Fossen, H., Okubo, C. H., and Reeves, D. M.: Dependence of displacement–length scaling relations for fractures and deformation bands on the volumetric changes across them, J. Struct. Geol., 30, 1405–1411, https://doi.org/10.1016/j.jsg.2008.08.001, 2008.
Schultz, R. A., Okubo, C. H., and Fossen, H.: Porosity and grain size controls on compaction band formation in Jurassic Navajo Sandstone, Geophys. Res. Lett., 37, L22306, https://doi.org/10.1029/2010GL044909, 2010.
Sempere, T. and Beaudoin, B.: Discontinuites et sequences dans la formation de Tarat (Viseen superieur) et l'unite d'Arlit (Namuro-Westphalien) a Arlit (Niger); evolution sedimentaire, climatique et tectonique de la region au Carbonifere, B. Soc. Geol. Fr., S7-XXVI, 995–1014, https://doi.org/10.2113/gssgfbull.S7-XXVI.6.995, 1984.
Seredkin, M., Zabolotsky, A., and Jeffress, G.: In situ recovery, an alternative to conventional methods of mining: Exploration, resource estimation, environmental issues, project evaluation and economics, Ore Geol. Rev., 79, 500–514, https://doi.org/10.1016/j.oregeorev.2016.06.016, 2016.
Sharifzadeh, M., Aldrich, C., Ericson, E., and Sarmadivaleh, M.: A Methodology for Geomechanical Modelling of In Situ Recovery (ISR) in Fractured Hard Rocks, ISRM International Symposium – 10th Asian Rock Mechanics Symposium, October 2018, Singapore, ISRM-ARMS10-2018-081, ISBN 978-981-11-9003-2, 2018.
Sibson, R. H.: Structural permeability of fluid-driven fault-fracture meshes, J. Struct. Geol., 18, 1031–1042, https://doi.org/10.1016/0191-8141(96)00032-6, 1996.
Soliva, R. and Schultz, R. A.: Distributed and localized faulting in extensional settings: Insight from the North Ethiopian Rift-Afar transition area, Tectonics, 27, TC2003, https://doi.org/10.1029/2007TC002148, 2008.
Soliva, R., Benedicto, A., and Maerten, L.: Spacing and linkage of confined normal faults: Importance of mechanical thickness, J. Geophys. Res.-Sol. Ea., 111, B01402, https://doi.org/10.1029/2004JB003507, 2006.
Soliva, R., Ballas, G., Fossen, H., and Philit, S.: Tectonic regime controls clustering of deformation bands in porous sandstone, Geology, 44, 423–426, https://doi.org/10.1130/G37585.1, 2016.
Sonntag, R., Evans, J. P., La Pointe, P., Deraps, M., Sisley, H., and Richey, D.: Sedimentological controls on the fracture distribution and network development in Mesaverde Group sandstone lithofacies, Uinta Basin, Utah, USA, Geol. Soc. Lond. Spec. Publ., 374, 23–50, https://doi.org/10.1144/SP374.4, 2014.
Strijker, G., Bertotti, G., and Luthi, S. M.: Multi-scale fracture network analysis from an outcrop analogue: A case study from the Cambro-Ordovician clastic succession in Petra, Jordan, Mar. Petrol. Geol., 38, 104–116, https://doi.org/10.1016/j.marpetgeo.2012.07.003, 2012.
Taylor, R., Tindimugaya, C., Barker, J., Macdonald, D., and Kulabako, R.: Convergent Radial Tracing of Viral and Solute Transport in Gneiss Saprolite, Groundwater, 48, 284–294, https://doi.org/10.1111/j.1745-6584.2008.00547.x, 2010.
Terzaghi, R. D.: Sources of Error in Joint Surveys, Géotechnique, 15, 287–304, https://doi.org/10.1680/geot.1965.15.3.287, 1965.
Torabi, A. and Berg, S. S.: Scaling of fault attributes: A review, Mar. Petrol. Geol., 28, 1444–1460, https://doi.org/10.1016/j.marpetgeo.2011.04.003, 2011.
Valsardieu, C.: Cadres géologiques et paléogréographiques des minéaralisations de charbon, de cuivre et d'uranium de la région d'Agadès (République du Niger), PhD thesis, Université de Nice, 752 pp., https://www.sudoc.fr/115693742 (last access: July 2024), 1971.
Walsh, J., Watterson, J., and Yielding, G.: The importance of small-scale faulting in regional extension, Nature, 351, 391–393, 1991.
Warren, J. E. and Root, P. J.: The Behavior of Naturally Fractured Reservoirs, Soc. Petrol. Eng. J., 3, 245–255, https://doi.org/10.2118/426-PA, 1963.
Watkins, H., Bond, C. E., Healy, D., and Butler, R. W. H.: Appraisal of fracture sampling methods and a new workflow to characterise heterogeneous fracture networks at outcrop, J. Struct. Geol., 72, 67–82, https://doi.org/10.1016/j.jsg.2015.02.001, 2015.
Watkins, H., Healy, D., Bond, C. E., and Butler, R. W. H.: Implications of heterogeneous fracture distribution on reservoir quality; an analogue from the Torridon Group sandstone, Moine Thrust Belt, NW Scotland, J. Struct. Geol., 108, 180–197, https://doi.org/10.1016/j.jsg.2017.06.002, 2018.
Watterson, J., Walsh, J. J., Gillespie, P. A., and Easton, S.: Scaling systematics of fault sizes on a large-scale range fault map, J. Struct. Geol., 18, 199–214, 1996.
Wilkins, S. J., Davies, R. K., and Naruk, S. J.: Subsurface observations of deformation bands and their impact on hydrocarbon production within the Holstein Field, Gulf of Mexico, USA, Geol. Soc. Lond. Spec. Publ., 496, 223–252, https://doi.org/10.1144/SP496-2018-139, 2020.
Wong, T. and Baud, P.: The brittle-ductile transition in porous rock: A review, J. Struct. Geol., 44, 25–53, https://doi.org/10.1016/j.jsg.2012.07.010, 2012.
Wong, T., David, C., and Zhu, W.: The transition from brittle faulting to cataclastic flow in porous sandstones: Mechanical deformation, J. Geophys. Res.-Sol. Ea., 102, 3009–3025, https://doi.org/10.1029/96JB03281, 1997.
Wyllie, M. R. J., Gregory, A. R., and Gardner, L. W.: Elastic wave velocities in heterogeneous and porous media, GEOPHYSICS, 21, 41–70, https://doi.org/10.1190/1.1438217, 1956.
Yahaya, M.: Dynamique sédimentaire du Guézouman et des formations viséennes sous-jacentes en liaison avec la tectonique, le volcanisme et le climat, paléomilieux des gîtes uranifères d'Arlit (Niger), PhD thesis, Université de Bourgogne, 357 pp., https://theses.fr/1992DIJOS053 (last access: July 2024), 1992.
Yahaya, M. and Lang, J.: Évolution tectono-sédimentaire de l'unité d'Akokan au cours du Viséen dans le bassin de Tim Mersoï (région d'Arlit, Niger), J. Afr. Earth Sci., 31, 415–431, https://doi.org/10.1016/S0899-5362(00)00097-X, 2000.
Yielding, G., Needham, T., and Jones, H.: Sampling of fault populations using sub-surface data: a review, J. Struct. Geol., 18, 135–146, https://doi.org/10.1016/S0191-8141(96)80039-3, 1996.
Yielding, G., Freeman, B., and Needham, D. T.: Quantitative Fault Seal Prediction, AAPG Bull., 81, 897–917, https://doi.org/10.1306/522B498D-1727-11D7-8645000102C1865D, 1997.
Zemanek, J., Glenn, E. E., Norton, L. J., and Caldwell, R. L.: Formation evaluation by inspection with borehole televiewer, GEOPHYSICS, 35, 254–269, https://doi.org/10.1190/1.1440089, 1970.