the Creative Commons Attribution 4.0 License.
the Creative Commons Attribution 4.0 License.
 | 27 Oct 2025
Updating induced seismic hazard assessments during hydraulic stimulation experiments in underground laboratories: workflow and limitations
Valentin Samuel Gischig
Antonio Pio Rinaldi
Andres Alcolea
Falko Bethman
Marco Broccardo
Kai Bröker
Raymi Castilla
Federico Ciardo
Victor Clasen Repollés
Virginie Durand
Nima Gholizadeh Doonechaly
Marian Hertrich
Rebecca Hochreutener
Philipp Kästli
Dimitrios Karvounis
Xiaodong Ma
Men-Andrin Meier
Peter Meier
Maria Mesimeri
Arnaud Mignan
Anne Obermann
Katrin Plenkers
Martina Rosskopf
Francisco Serbeto
Paul Selvadurai
Alexis Shakas
Linus Villiger
Quinn Wenning
Alba Zappone
Jordan Aaron
Hansruedi Maurer
Domenico Giardini
Stefan Wiemer
Advancing technologies to harvest deep geothermal energy has seen backlash related to unacceptable levels of induced seismic hazard during hydraulic stimulations. A thorough analysis of induced seismic hazard before these operations has recently become standard practice in the last decade. Additionally, more process understanding of the underlying causes of induced seismicity as well as novel approaches to develop geomechanical reservoirs are being explored in controlled underground laboratory experiments worldwide. Here, we present a probabilistic analysis of the seismic hazard induced by the ongoing hectometre-scale stimulation experiments at the Bedretto Underground Laboratory for Geoenergies and Geosciences (BULGG). Our workflow allows for fast updates of the hazard computation as soon as new site-specific information on the seismogenic response (expressed primarily by the feedback afb value and the Gutenberg–Richter b value) and ground motion models (GMMs) become available. We present a sequence of hazard analyses corresponding to different project stages at the BULGG. These reveal the large uncertainty in a priori hazard estimations that only reduces once site-specific GMMs and information on the seismic response of specific stimulation stages are considered. The sources of uncertainty are (1) the large variability in the seismogenic response recorded across all stimulation case studies and (2) uncertain GMMs on the underground laboratory scale. One implication for large-scale hydraulic stimulations is that hazard computation must be updated at different project stages. Additionally, stimulations have to be closely accompanied by a mitigation scheme, ideally in the form of an adaptive traffic light system (ATLS), which reassesses seismic hazard in near-real time. Our study also shows that the observed seismogenic responses in underground laboratories differ from large-scale stimulations at greater depth in that the seismogenic response is substantially more variable and tends to be weaker. Reasons may be lower stress levels, but also smaller injected volumes accessing a more limited fracture network than large-scale stimulations. Controlled underground laboratory experiments can contribute to improving our understanding of the the physical reasons leading to such variable seismogenic responses. The presented analysis implied that such experiments may be limited in terms of upscaling but are likely to be safe in terms of induced seismic hazard.
- Article
(13747 KB) - Full-text XML
- BibTeX
- EndNote


Induced seismicity is well known to occur in various underground engineering operations (Kivi et al., 2023) such as hydrofracturing for unconventional gas extraction (Schultz et al., 2020a, b), wastewater disposal from hydrofracturing (Ellsworth, 2013), conventional gas extraction (van Thienen-Visser and Breunese, 2015), CO2 storage (IEAGHG, 2022; White and Foxall, 2016), mining (Lasocki and Orlecka-Sikora, 2008; Wesseloo, 2018) and geothermal projects (Buijze et al., 2019). Felt or even damaging induced seismic events have led to halting of various projects (e.g. Basel, Häring et al., 2008; St. Gallen; Diehl et al., 2017; Lee et al., 2019; Blackpool, UK, Kettlety et al., 2021; Vendenheim; Schmittbuhl et al., 2022) and compromised public support for such projects. Induced seismicity is one of the obstacles for the development of new geoenergy technologies (e.g. engineered geothermal systems (EGSs) or CO2 storage) that could potentially contribute to carbon-free energy generation. For geothermal energy projects, Trutnevyte and Wiemer (2017) proposed a semi-quantitative screening approach to assess the degree to which induced seismicity may be a concern for a proposed project (Kraft et al., 2025). Depending on the level of concern, the hazard posed by induced seismicity is recommended to be analysed with varying rigour. One rigorous approach follows the concept of probabilistic seismic hazard analysis (PSHA), which was originally developed for natural earthquakes (Cornell, 1968) and has been adapted for induced earthquakes (Baisch et al., 2009; Mignan et al., 2015; Bommer et al., 2015; Van Elk et al., 2017; Broccardo et al., 2020). A major difficulty of probabilistic induced seismic hazard assessment (PISHA) lies in forecasting induced seismicity a priori (i.e. before the project) because it would rely on (statistical or numerical) models with input parameters that are site-specific (Mignan et al., 2021) and largely unknown before the actual project has begun. Currently, there is no established framework that can deliver a reliable a priori seismicity forecast; while the underlying physical processes of induced seismicity are reasonably well understood in principle (Grigoli et al., 2017), the actual manifestation of these processes cannot readily be predicted from the properties of the target rock such as rock type, characteristics of the fracture network, mechanical properties of rock mass and fractures. Within the framework of PISHA, this lack of knowledge and all existing uncertainties are characterised quantitatively and transparently through an appropriate representation of the epistemic uncertainties and aleatory variability (Broccardo et al., 2020).
Given the difficulty in predicting the site-specific seismogenic response to injections, hazard mitigation schemes – usually termed traffic light systems (TLSs) – are often proposed to accompany deep stimulation operations to avoid unexpectedly high levels of seismicity. The concept of the TLS, initially proposed by Bommer et al. (2006) for the geothermal project in Berlìn, El Salvador, has been and is being applied to many injection operations worldwide (e.g. Helsinki, Ader et al., 2020; Pohang, Hofmann et al., 2018; Blackpool; Clarke et al., 2019; Basel, Häring et al., 2008; St Gallen, Diehl et al., 2017; Schultz et al., 2020b). In its original form, it requires thresholds of earthquake magnitude, ground motion and/or public reactions to distinguish different alert levels, each of which is associated with a set of actions (e.g. a reduction in injection rate or halt of the operations) that may mitigate unwanted levels of seismicity. These thresholds are typically derived based on expert judgement. A collection of magnitude-based thresholds for a range of cases is shown in Fig. 1, which expands on the collection by Bosman et al. (2016). The underlying idea is that the maximum magnitude observed up to a certain point increases with injected volume so that stopping at a lower-magnitude earthquake may effectively avoid larger-magnitude earthquakes that are felt or damaging. Statistical testing conducted by van der Elst et al. (2016) showed that the largest magnitude may not systematically increase with volume but rather with the number of induced earthquakes up to a certain time, which implies that the largest earthquake may occur anytime during or even after injection. Choosing these TLS thresholds thus requires anticipating that seismicity not only continues after stopping an injection but often reaches the maximum magnitude after injection (e.g. Basel, Pohang, Vendenheim). Verdon and Bommer (2021) summarise a range of injection-induced seismicity cases worldwide to explore this so-called seismicity trailing effect and to arrive at the recommendation that injection should be stopped at two magnitude levels below the magnitude that is to be avoided. While the effectiveness of such TLSs is controversial and debated (Baisch et al., 2019), a deficiency is seen in the fact that it is merely reactive and based on static thresholds that do not consider new information on seismicity that becomes available during injection (Clarke et al., 2019; Király-Proag et al., 2016). So-called adaptive traffic light systems (ATLSs), as an alternative to the classic static TLSs, are being developed to alleviate these drawbacks (Király-Proag et al., 2016, 2018; Mignan et al., 2017). They rely on the ability to forecast seismic hazard in near-real time by considering the incoming information on the seismogenic response as seismicity is being induced. The time-dependent seismic hazard estimates are cast in the probabilistic frameworks that are inherent to the aforementioned a priori PISHA.
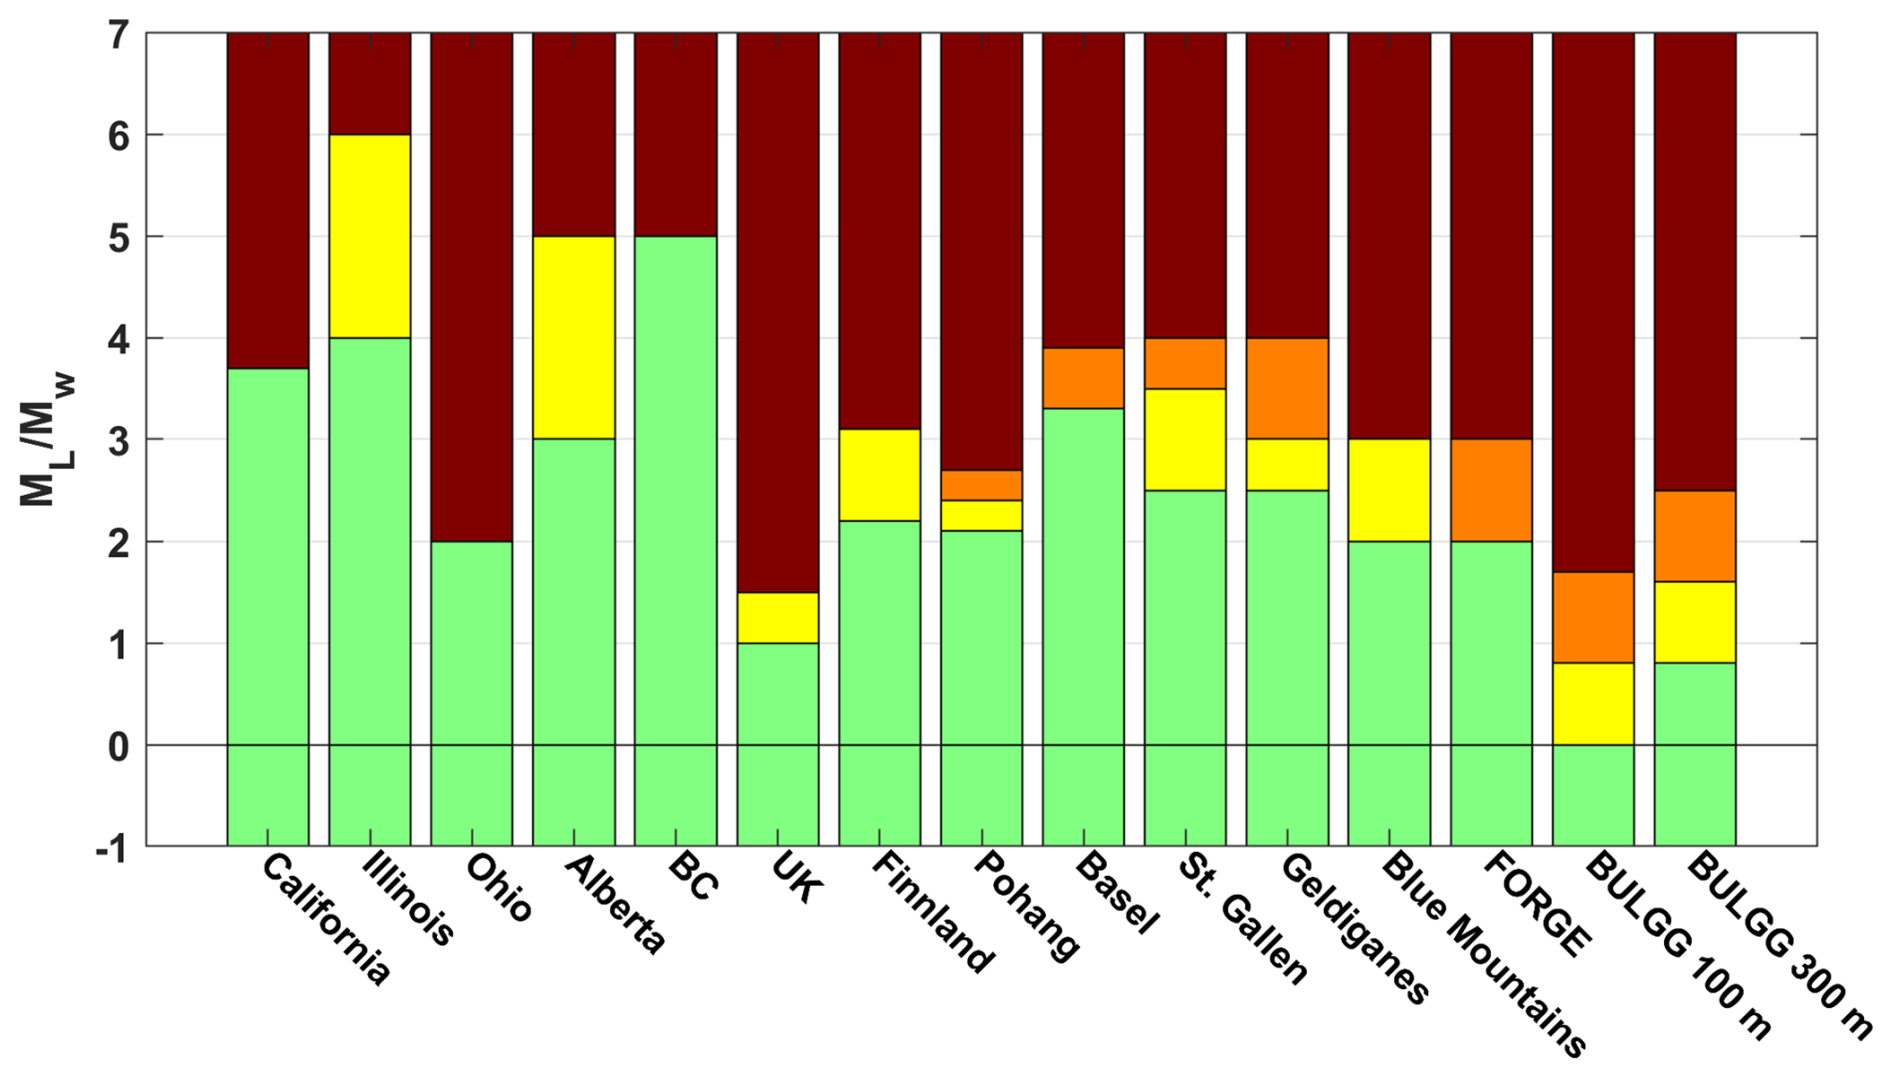
Figure 1TLS magnitude thresholds used in various cases expanding on the summary figure by Bosman et al. (2016). California, Illinois, Ohio, Alberta, British Columbia and the UK are examples of jurisdiction presented by Bosman et al. (2016). Helsinki: Ader et al. (2020); Pohang: Hofmann et al. (2018); Basel: Häring et al. (2008), St. Gallen: Diehl et al. (2017); Geldiganes: Broccardo et al. (2020); Blue Mountains: Norbeck and Latimer (2023); FORGE: EGI at the University of Utah (2020); BULGG: this study. Note that in some of the cases ground-motion-based thresholds were also used in combination with the magnitude-based thresholds. Also, the green, yellow, orange and red levels do not always imply the same operational consequences. The comparison is made for illustration.
While technological progress in the field of deep geothermics (and other geoenergy technologies) requires ways to govern induced seismic hazard, research is required to improve our capability of estimating seismic hazard prior to and during reservoir operations, as well as our understanding of the geomechanical processes during these operations. To this end, great value is seen in downscaled hydraulic stimulation experiments in underground laboratories. Many projects have been initiated worldwide in the last decade, such as the decametre hydrofracturing experiment in the Aspö underground laboratory, Sweden, in 2015 (Zang et al., 2024); the STIMTEC hydraulic stimulation experiment in 2018 (Reiche Zeche, Germany; Boese et al., 2022); the EGS Collab project in the USA (Sanford Underground Research Facility, USA; Schoenball et al., 2020; Kneafsey et al., 2025); the CO2 injection experiment at Mont Terri, Switzerland (Zappone et al., 2021); the hydraulic stimulation experiments at the Grimsel Test Site (GTS; Amann et al., 2018); and ongoing hectometre-scale experiments at the Bedretto Underground Laboratory for Geoenergies and Geosciences (BULGG; Ma et al., 2022; Obermann et al., 2024; Rosskopf et al., 2024a; Bröker et al., 2024a; Gholizadeh Doonechaly et al., 2024). The proximity to the stimulated rock volume allows high-resolution, multi-parametric monitoring of the stimulation processes based on dense instrumentation (Gischig et al., 2020; Shakas et al., 2020; Plenkers et al., 2023). Since the experiments are conducted at shallower depths and with total injected volume several orders of magnitude lower than for full-scale stimulations, the experimental conditions are not only more accessible and controllable, but likely also safer regarding induced seismic hazard. Nevertheless, the experimental equipment and crew are only a few tens to hundreds of metres away from the perturbed rock volume, and at BULGG in particular larger-volume injections into an extended fracture network were performed. Thus, it was necessary for the experiment at GTS and BULGG that a seismic hazard analysis be conducted similarly to the full-scale experiments (Gischig et al., 2016, 2019). However, the goal of these studies is not only to address the actual hazard to people and infrastructure but also to demonstrate to the public that hazard and risk analysis is an integral part of any stimulation project as much as it is stringent to full-scale stimulations at great depths. At the same time, the studies serve as a test bed for building and refining PISHA frameworks, in which difficulties and deficiencies can be identified and open research questions be highlighted.
With these goals in mind, we present here the methodology, strategies and results of the a priori PISHA study conducted for the BULGG (and GTS) experiments. We also demonstrate a strategy for gradually refining the PISHA study as new site-specific information or from similar underground laboratory experiments becomes available. We address the main sources of uncertainty and highlight how it can be reduced in a systematic, objective way once more site-specific or even interval-specific information is used. We describe knowledge and research gaps that must be filled to improve our capability to predict induced seismic hazard and risk at the 10–100 m laboratory scale, as well as on the scale of commercial projects. Thus, while rigorous PISHA has been conducted for mining-induced seismicity (Wesseloo, 2018), gas fields (TNO, 2020) and geothermal projects (Kraft et al., 2025; EGI at the University of Utah, 2020; Broccardo et al., 2020), among others, we present what is to our knowledge the first PISHA for hydraulic stimulations in underground laboratories.
The BULGG is in the Bedretto Tunnel in the Swiss Central Alps, which is a 5218 m long adit that connects the Furka railway tunnel with the Bedretto Valley (Fig. 2). Since construction in 1982, the Bedretto tunnel remained unlined and unpaved and was mostly used for ventilating and draining the Furka tunnel. In 2018, the Bedretto tunnel was made available by its owner (the railway operator “Matterhorn Gotthard Bahnen”) to ETH Zürich to conduct research related to geoenergy and other geoscientific topics (Ma et al., 2022). The tunnel runs from the north-west to south-east at an elevation of 1505 m a.s.l. at the junction with the Furka tunnel to 1480 m at the southern portal. The maximum overburden is ∼ 1593 m at tunnel metre (TM) 3100 measured from the south-east portal. At the laboratory level, which occupies a 100 m long enlarged section of the tunnel at TM 2000–2100, the overburden is about 1000 m. The host rock of the laboratory is a granitic body, the Rotondo granite, which has a boundary to metamorphic crystalline rock units at TM 1138 and reaches beyond the junction to the Furka tunnel (e.g. Lützenkirchen and Loew, 2011, Fig. 2 herein). The Rotondo granite exhibits subvertical, NE–SW-striking, weakly developed foliation as well as SW–NE-trending vertical ductile shear zones (Ceccato et al., 2024; Ma et al., 2022; Lützenkirchen, 2002), which often contain fault cores with gouge and cataclasites.
The tectonic seismic hazard in the BULGG region is generally low to moderate (Wiemer et al., 2023). The regional stress field around Bedretto, as estimated from focal mechanism solutions by Kastrup et al. (2004), is a transitional regime from strike-slip (predominant in the northern Alps and the foreland) to normal faulting (predominant in southern parts of the Swiss Alps). Local stress characterisation based on hydrofracturing between TM 1750 and TM 2250 (Bröker and Ma, 2022; Bröker et al., 2024b) confirms that the overburden stress is close to a principal stress direction (SV ∼ 25.7 MPa). The inferred maximum horizontal stress direction (SHmax) is approximately WNW–ESE. The estimated minimum horizontal stress magnitude ( MPa) and maximum horizontal stress magnitude ( MPa) suggest that the stress state in the vicinity of the Bedretto Lab is transitional between normal and strike-slip faulting conditions (). The static pore pressure of 2.0–5.6 MPa estimated in the stress measurement boreholes is below hydrostatic (maximum 9.8 MPa), implying that topographic effects as well as considerable tunnel drainage and pressure drawdown over the last 40 years have an effect on pore pressure.
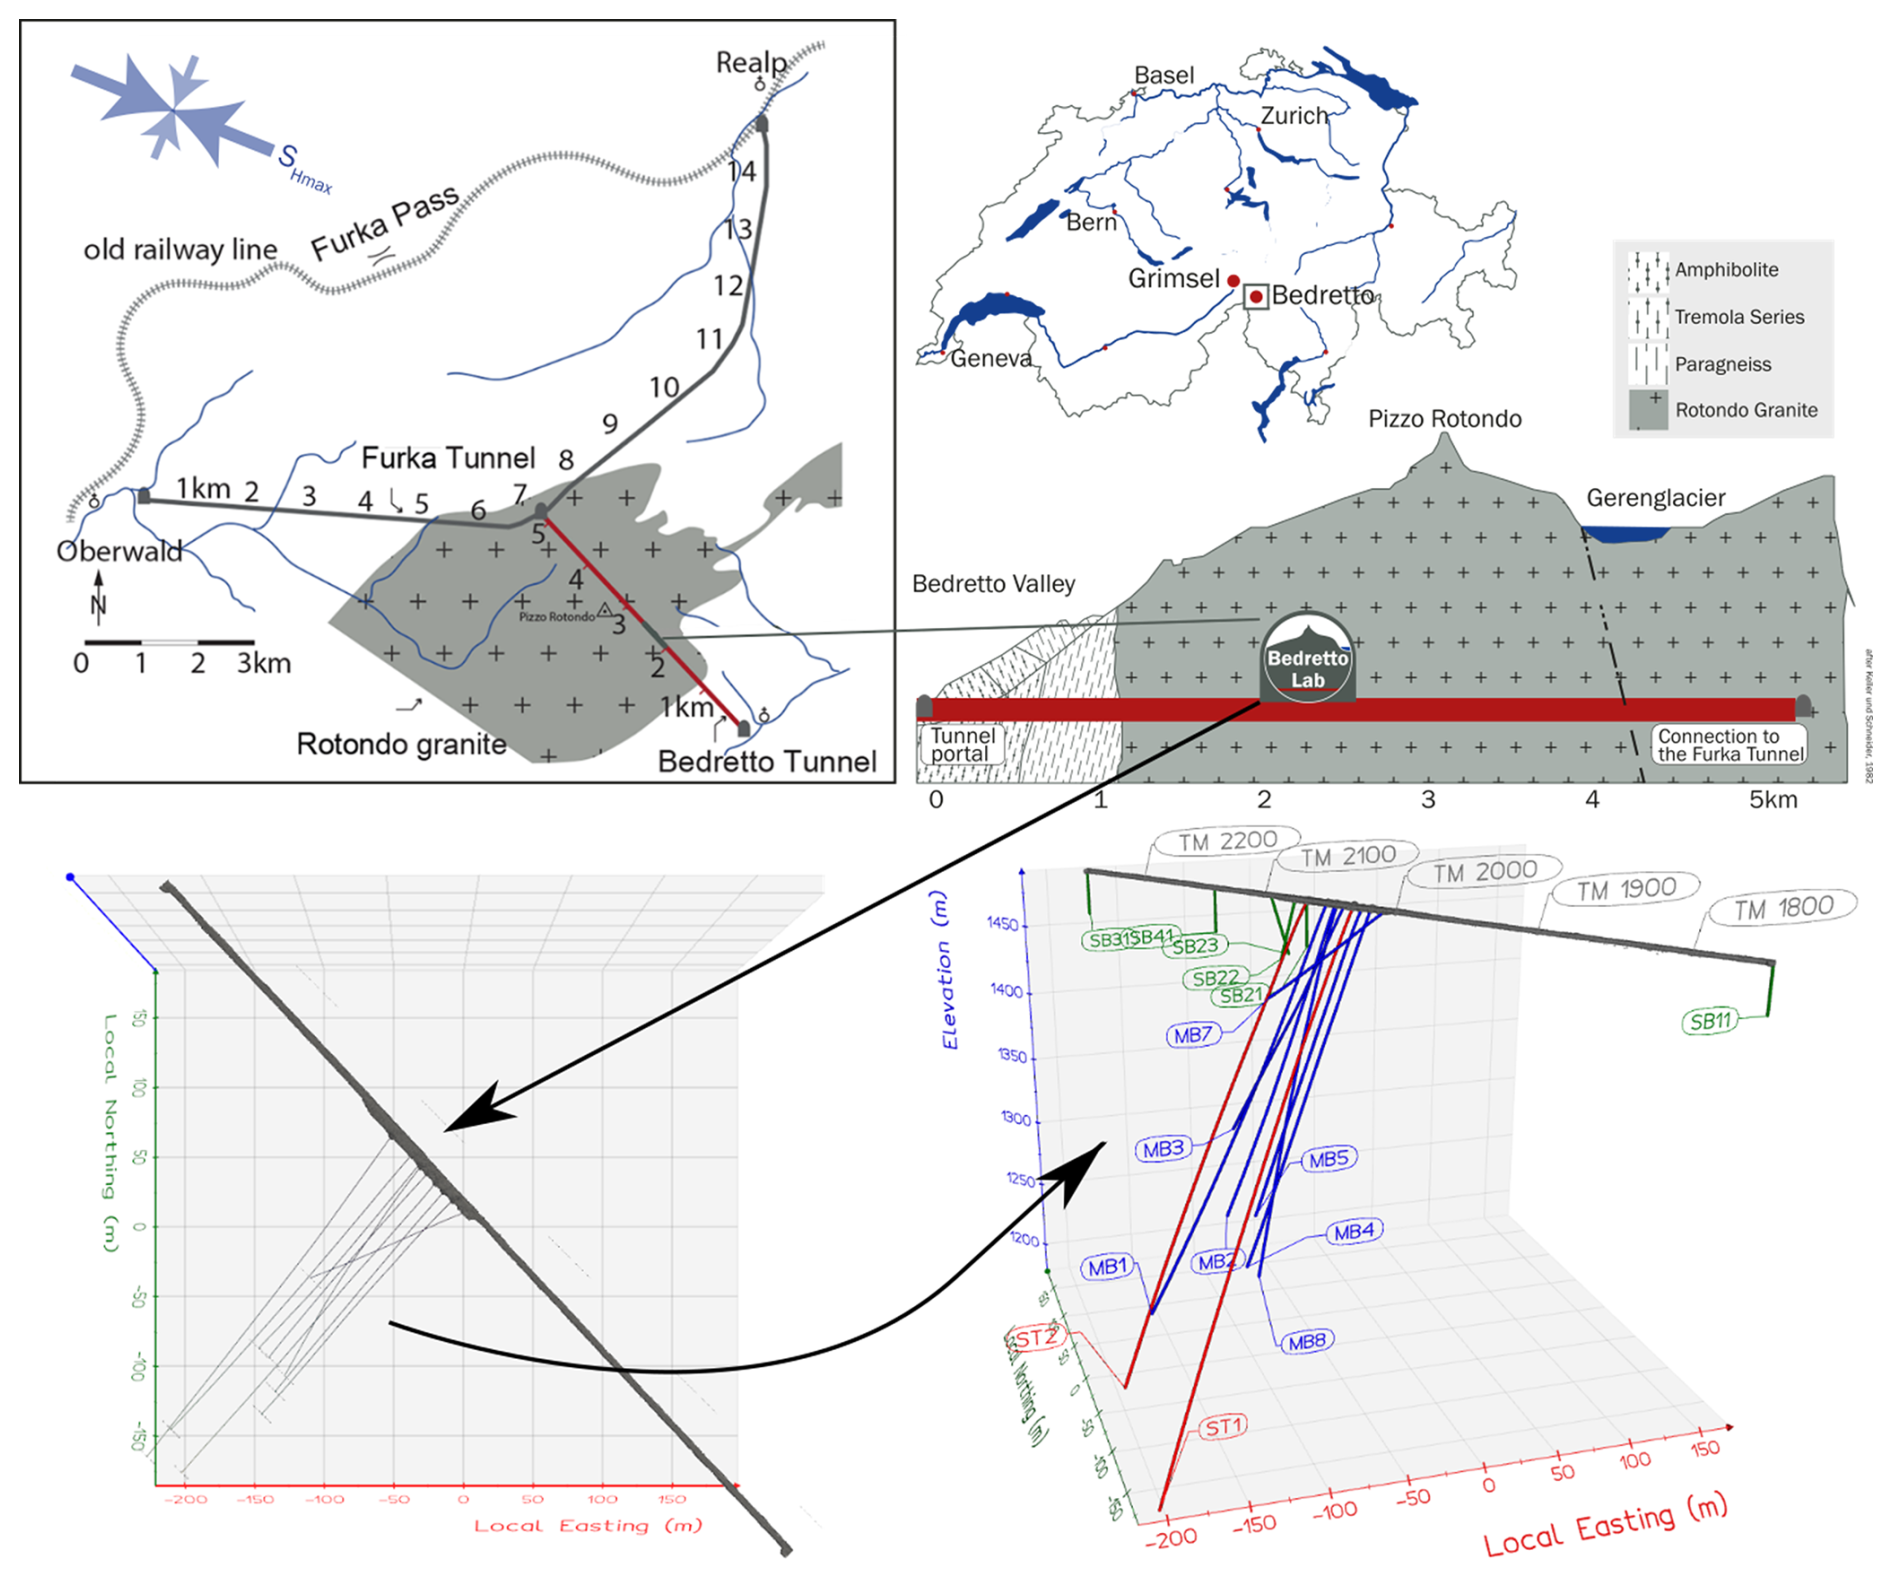
Figure 2Overview map and geological cross-section of the BULGG (adopted from Ma et al., 2022).
Experimental work in the BULGG between 2020 and 2024 included three projects related to geoenergy: VALTER, DESTRESS and ZoDrEx (Giardini et al., 2022; Meier and Christe, 2023). The goal of the VALTER and DESTRESS projects was to create a reservoir in crystalline rock so that geothermal energy can be extracted or stored by fluid circulation with a minimum induced seismic risk to population and infrastructure. In the ZoDrEx project, multi-stage stimulations using zonal isolation, innovative drilling and completion methods were tested. The hydraulic stimulation part of the DESTRESS project was monitored with a network of borehole seismic sensor chains, while those of the VALTER project were accompanied by a multi-sensor monitoring system (Plenkers et al., 2023; Obermann et al., 2024) that included diverse sensor networks, which allowed the inference of details of seismicity, deformation and pressure propagation during, before and after stimulation and foster understanding of the seismo-hydro-mechanical responses.
The first boreholes CB1, CB2 and CB3 were drilled in September 2019 (Ma et al., 2022), followed by the first two hydraulic stimulation tests with straddle packers in CB1 in February 2020 (264–298.5 m depth; see Fig. 3a and Table A1 in the Appendix; Shakas et al., 2020). These involved injection volumes of about 5 m3 each (Fig. 4a).
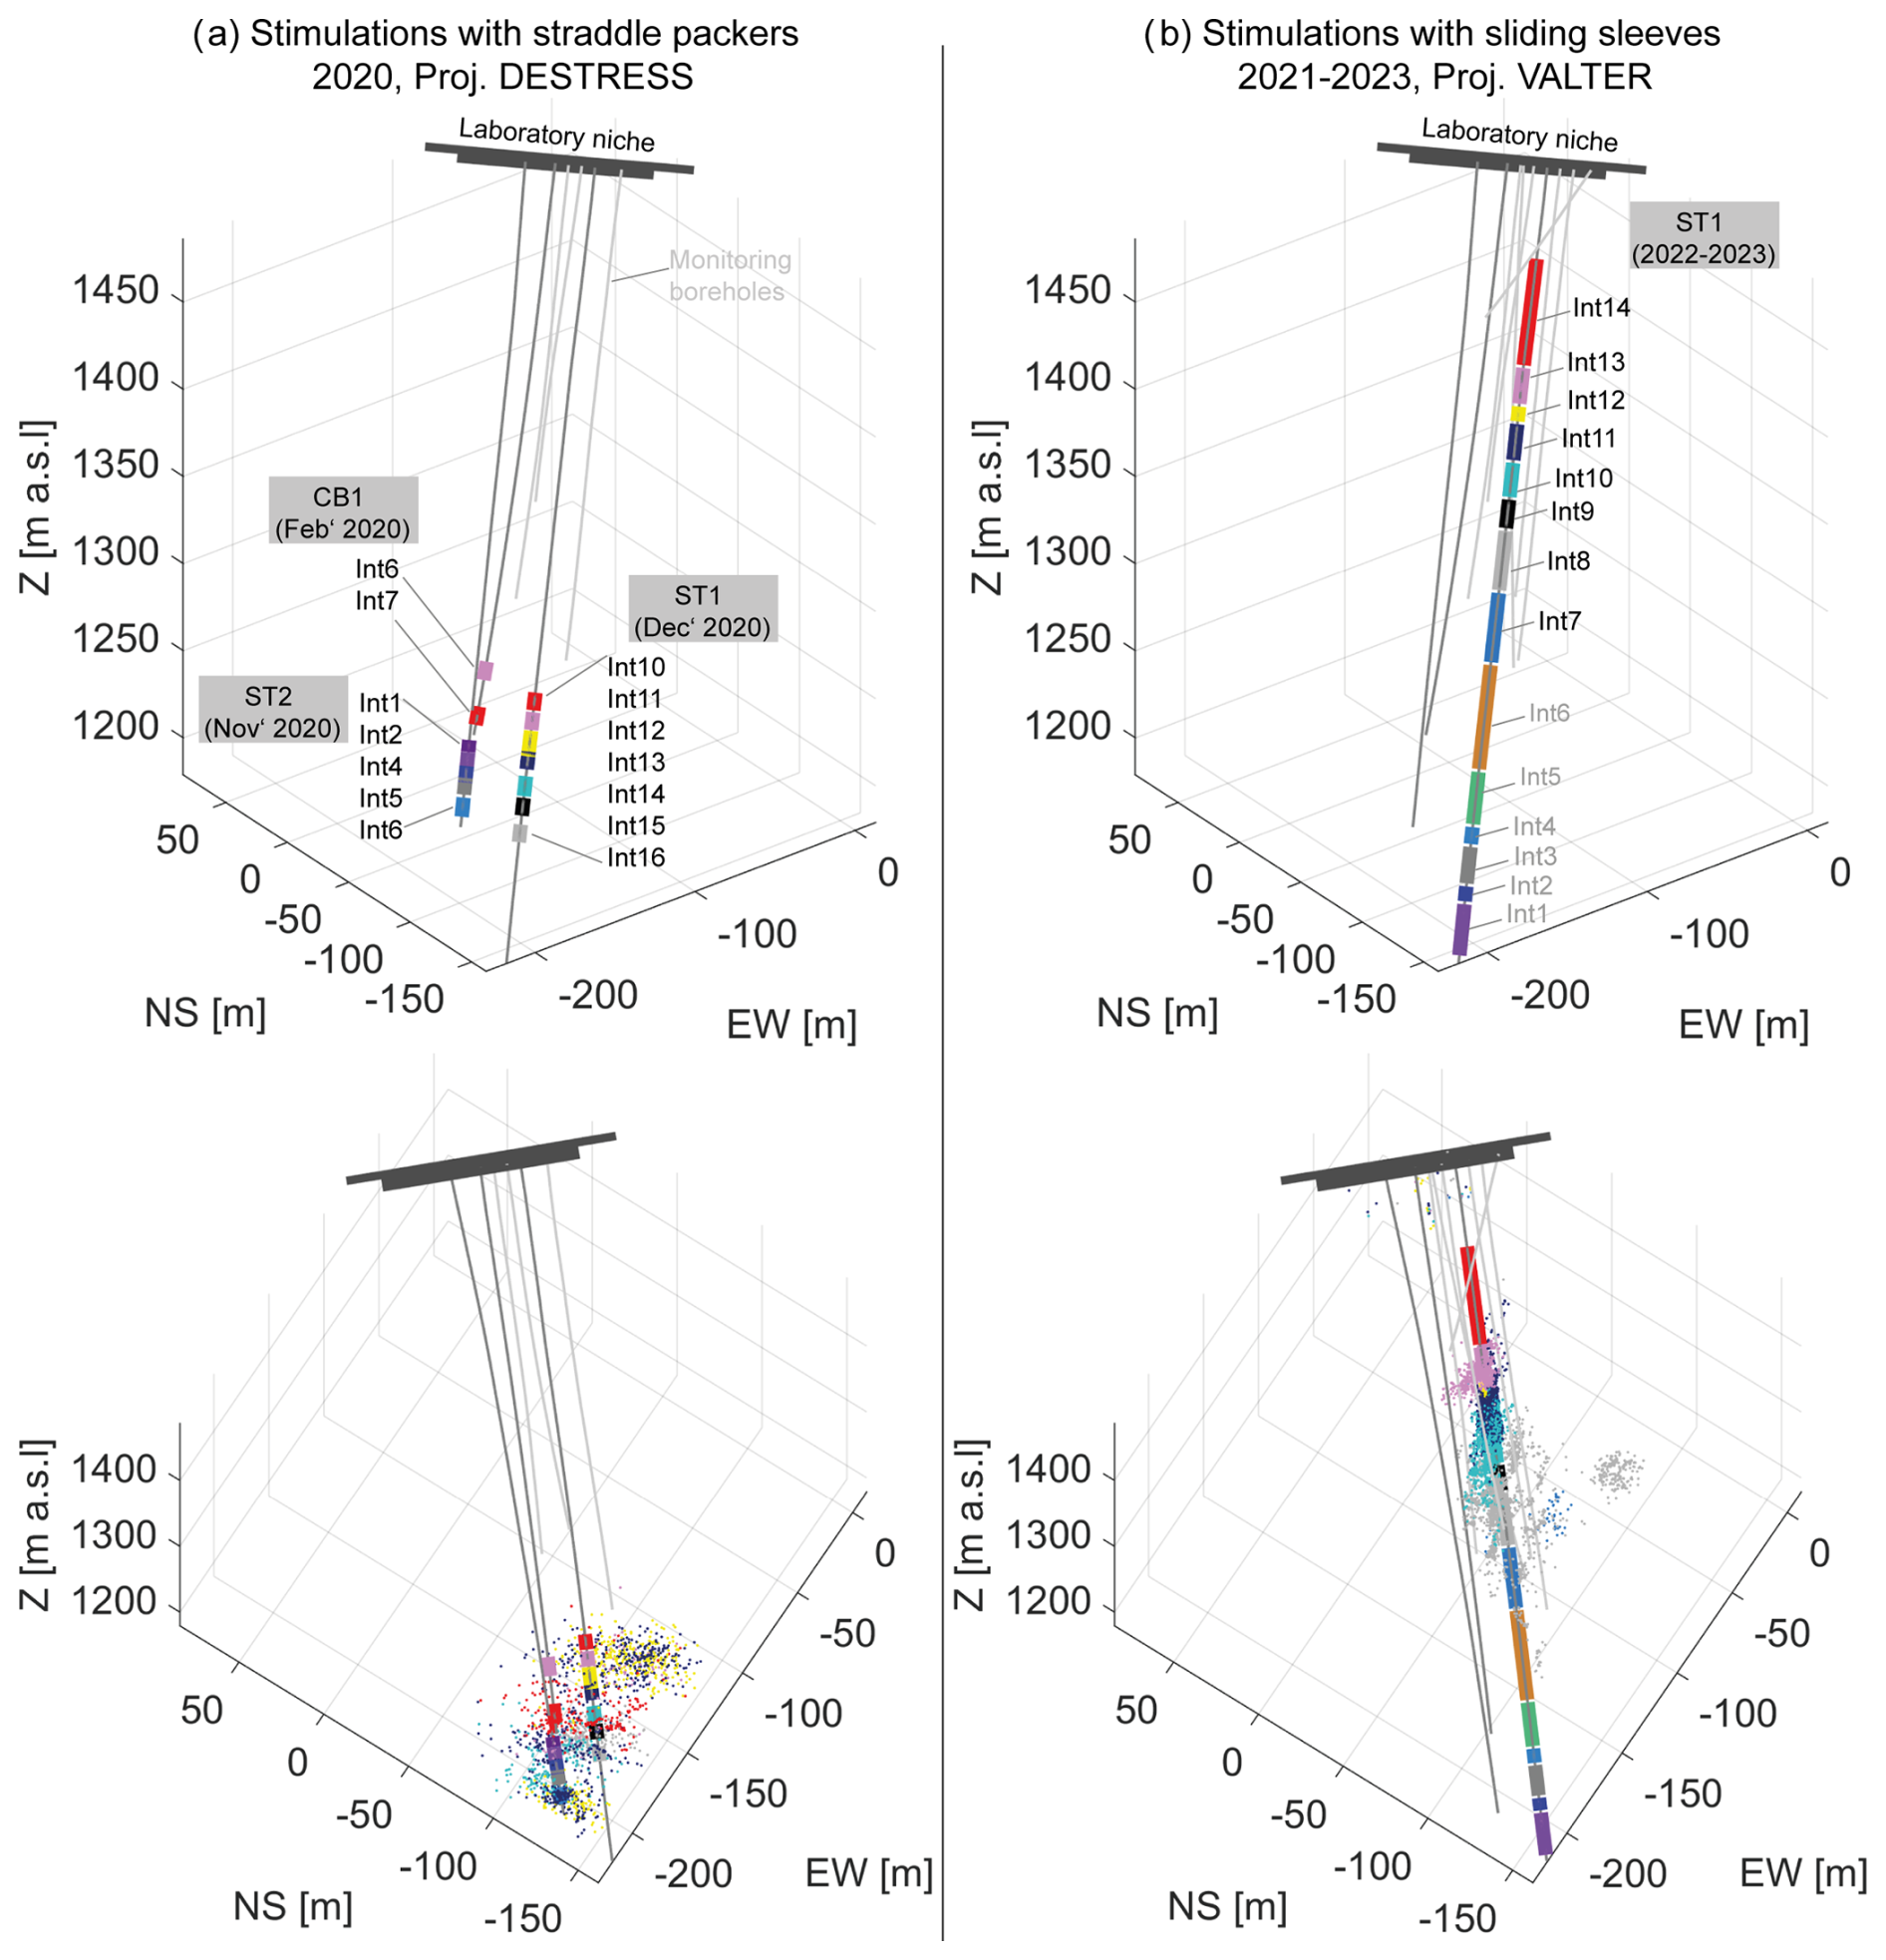
Figure 3Borehole configuration at the BULGG. (a) Injection and monitoring boreholes, injection intervals, and seismicity during the DESTRSS project. Injections were done with a movable straddle packer. (b) Injection and monitoring boreholes, intervals and seismicity during the VALTER project. Injections were done in fixed installed packers with sliding sleeves.
Later these boreholes were redrilled to enlarge their diameter and to transform them into monitoring boreholes and renamed MB1, MB2 and MB3, respectively. In May and June 2020, the injection/production boreholes ST1 and ST2 as well as MB4 were drilled. After instrumentation of MB1–MB4 between February and July 2020 (Plenkers et al., 2023; Golizadeh Doonechaly et al., 2024), the hydraulic stimulation experiments of the DESTRESS project were conducted in the lower parts of ST2 (five intervals between 306–345 m depth in November 2020, Fig. 4b) and of ST1 (seven intervals between 268–344 m depth in December 2020). These stimulations were done with hydraulic straddle packers by the company GeoEnergie Suisse (GES).
In early 2021, the borehole ST1 was completed with a multipacker system that allows access to individual intervals using sliding sleeves (Fig. 3b; part of the ZoDrEx project). In May 2021, hydraulic stimulations were performed by GES in intervals 1+2 (i.e. combined), 4 and 6 of the multipacker system (VALTER project) with pumps allowing injection at several hundreds of L min−1. The bottom part of borehole ST2 (332–345 m) was also stimulated as part of the ZoDrEx project with the goal of testing stimulations through notches in the casing at various depths.
Finally, between December 2021 and August 2023, further hydraulic stimulations by ETH Zürich were performed in intervals 7 to 14 in ST1 (Obermann et al., 2024). These stimulations benefited from the proximity to the monitoring boreholes that contain a dense network of various types of seismic sensors (Plenker et al., 2023). The stimulation programme included two phases. In Phase 1 (November 2021 to March 2022, Fig. 4c) intervals 7 to 14 were stimulated with a comparable injection protocol using two injection stages lasting a few hours each. The goal of these injections was to screen the seismic and hydromechanical responses of each interval. In Phase 2 (June 2022 to July 2023), selected intervals were revisited and either stimulated with larger volumes to access a larger rock volume (interval 8, 9+10) (Fig. 4d) or to test dedicated injection protocols (interval 11 and 12) (see Obermann et al., 2024, for further explanation).
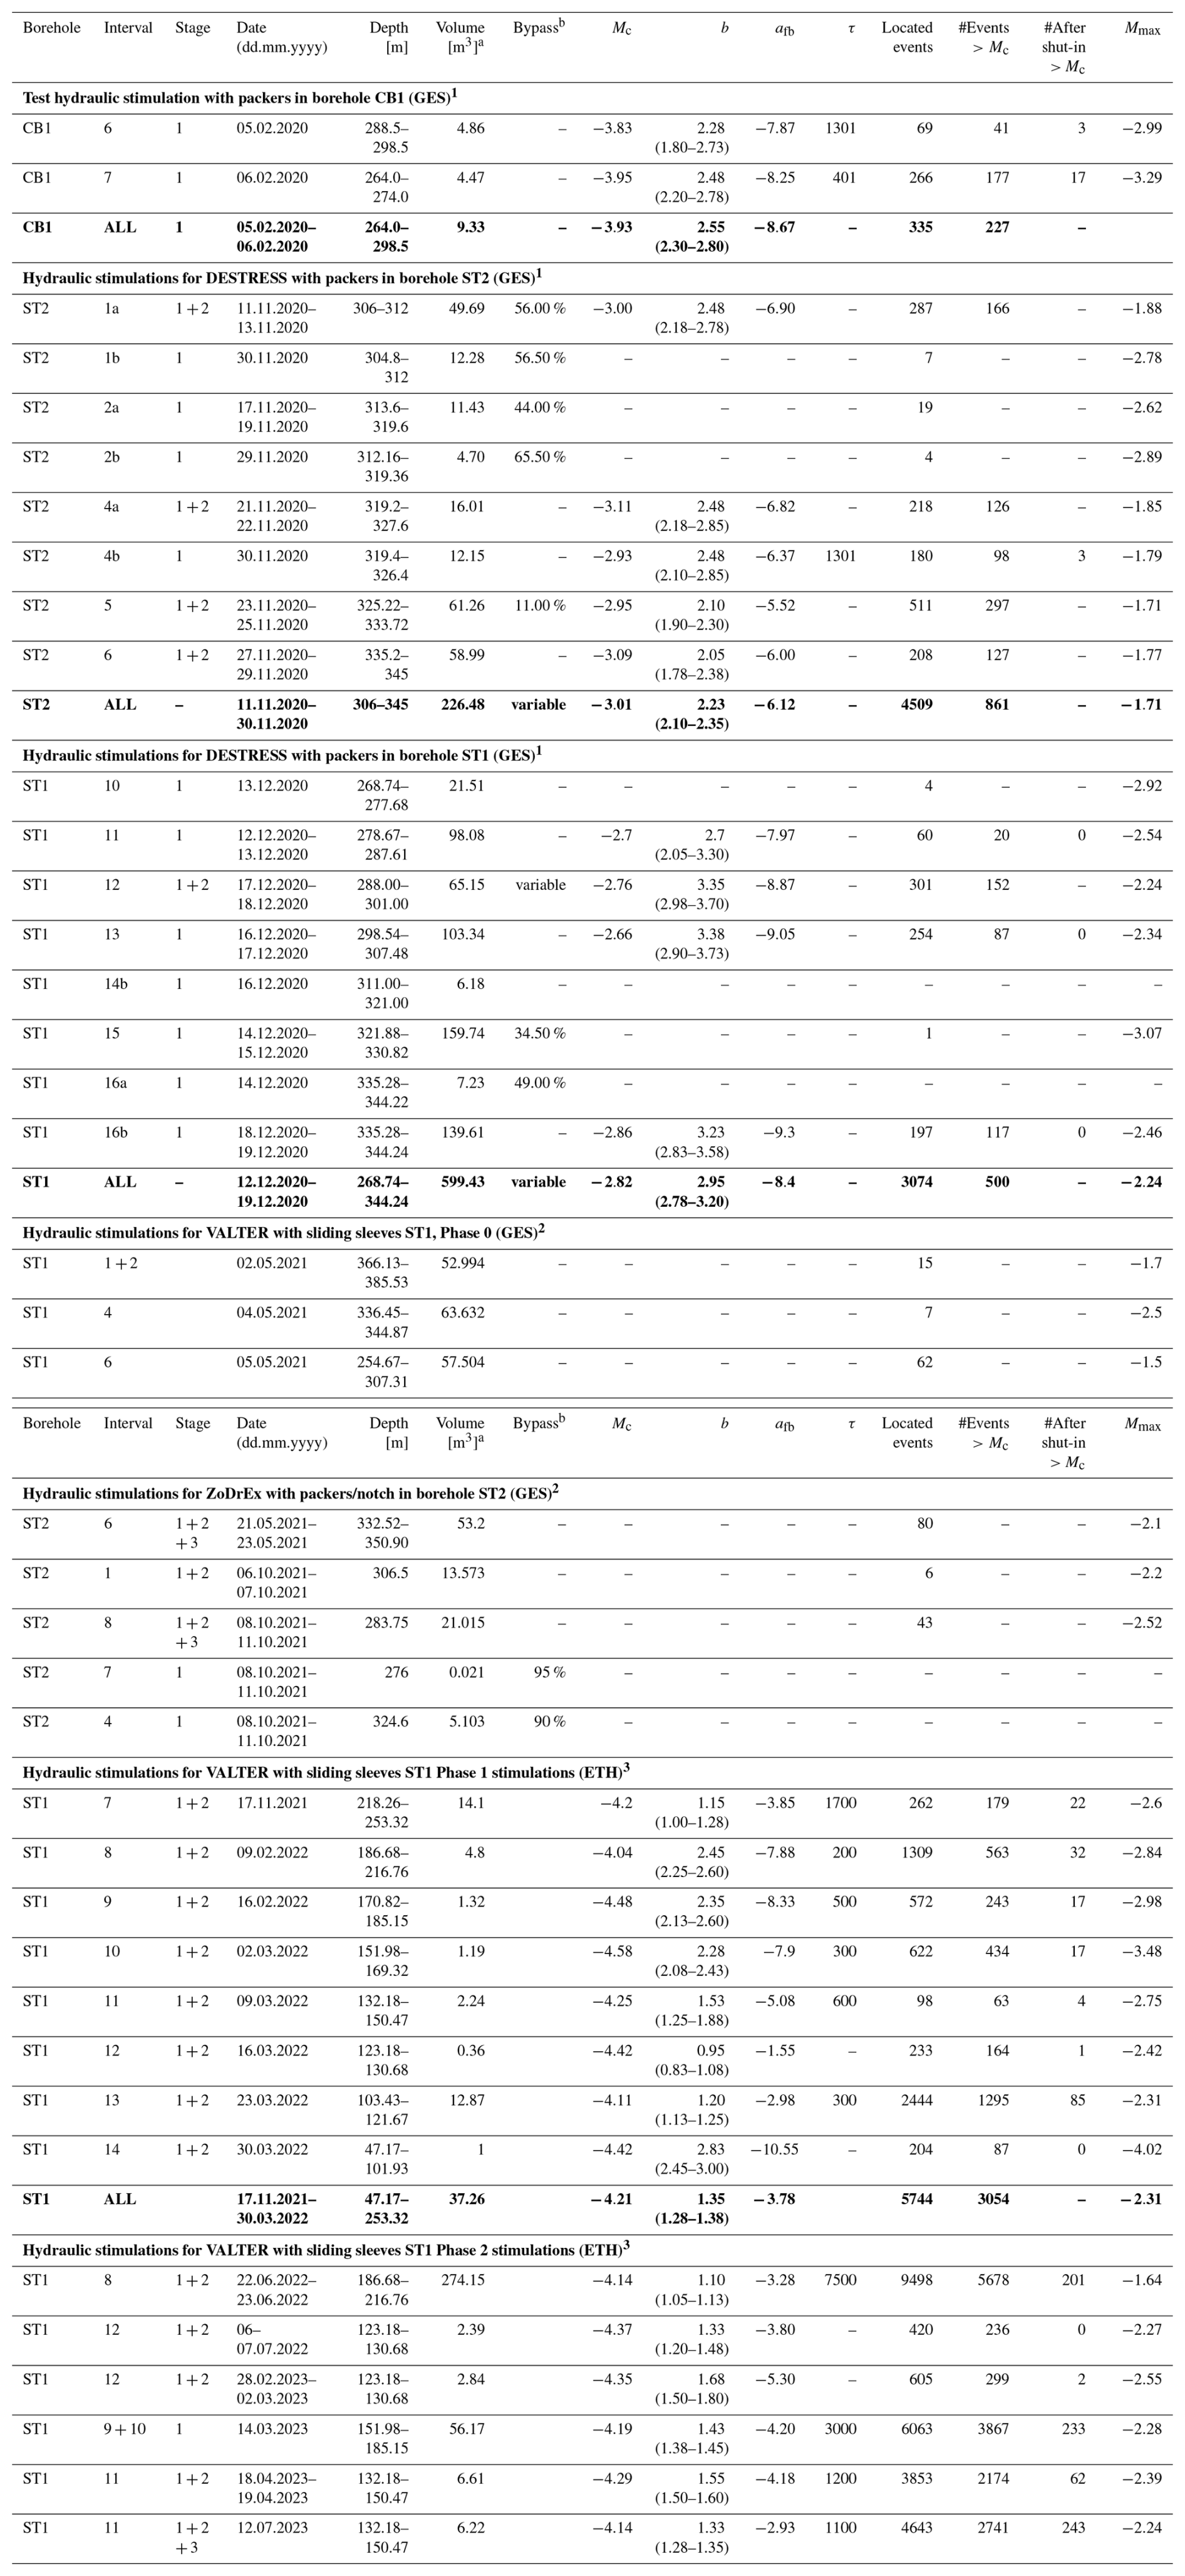
Table A2 in the Appendix summarises the results of all stimulations in terms of injected volume and seismicity characteristics. Note that the magnitudes reported here and used for the analysis are moment magnitude Mw.
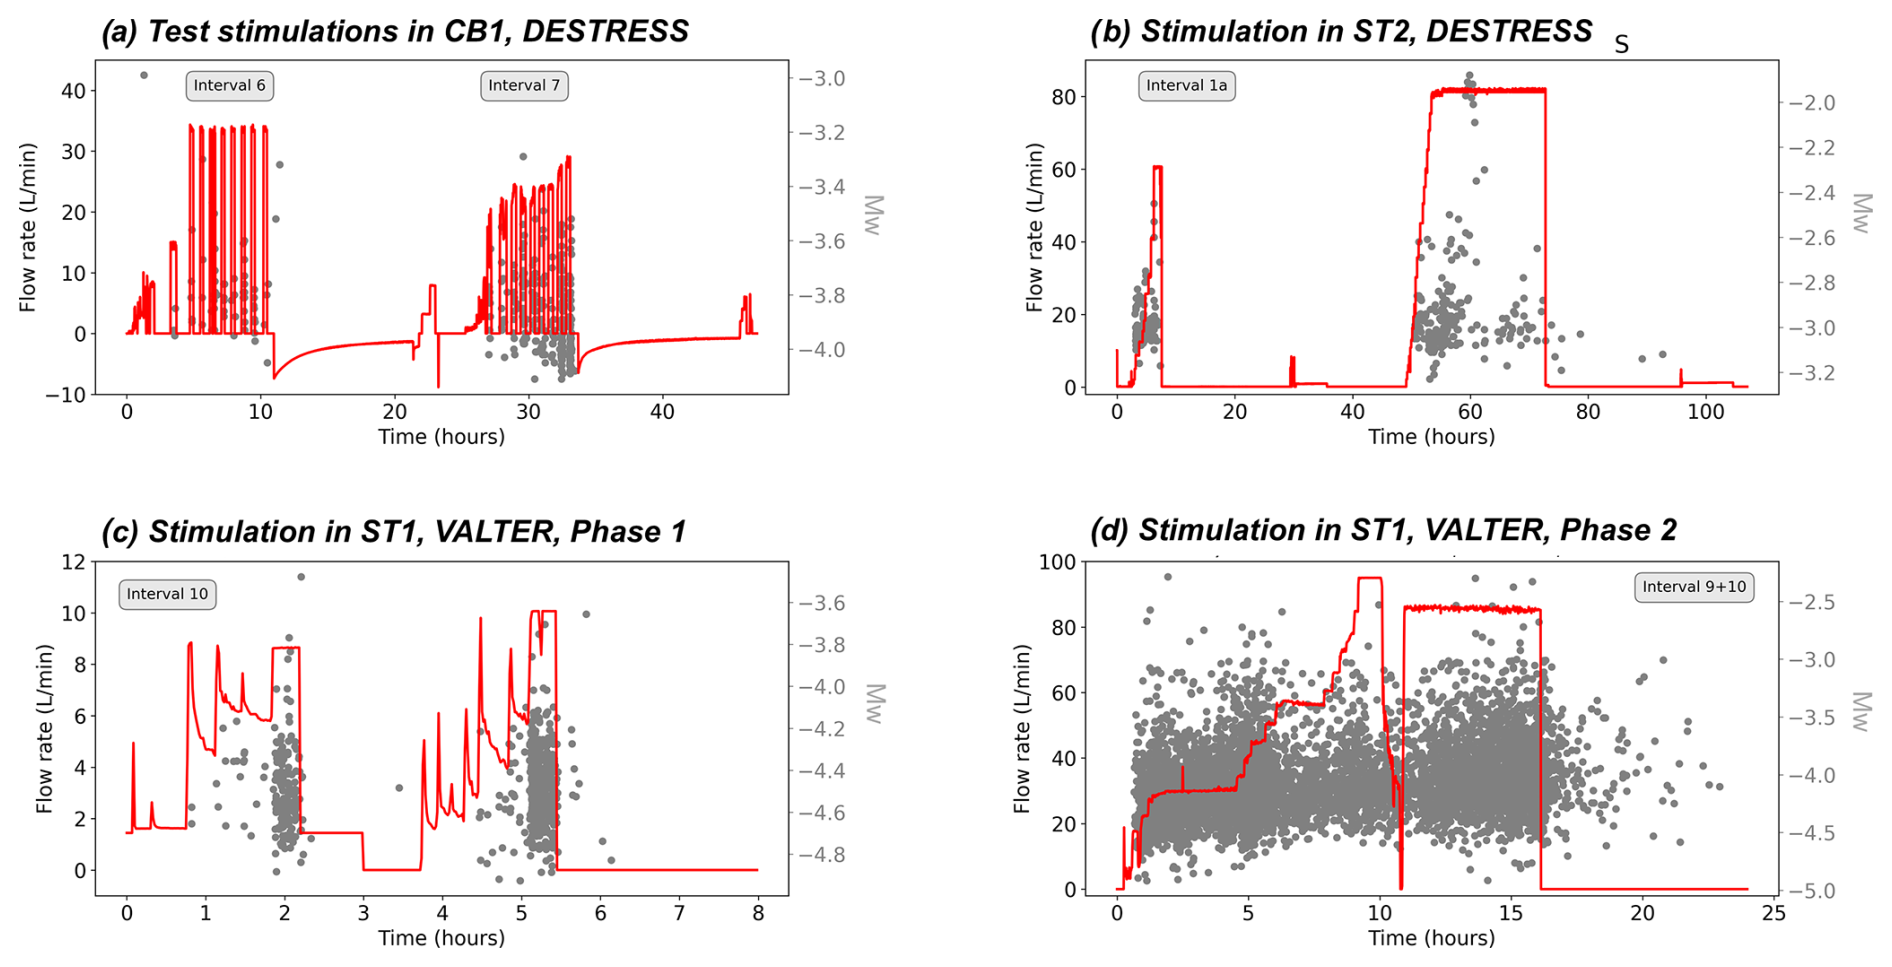
Figure 4Examples of hydraulic stimulations of different project phases: (a) initial test stimulation in CB1 as part of the DESTRESS project, (b) example of hydraulic stimulation of ST2 (DESTRESS) with hydraulic packers, (c) example of stimulation using fixed packers with sliding sleeves in ST1 as part of Phase 1 of the VALTER project (d) example of stimulation in ST1 as part of Phase 2 of the VALTER project.
As the subject of this article is not only the methodology of computing PISHAs for hydraulic stimulation but also how the PISHA results evolve as new and site-specific information becomes available, we present the following PISHA studies.
Study 1, GTS a priori (state 2016). Before conducting hydraulic stimulation experiments at the GTS in 2017 (Villiger et al., 2020; Krietsch et al., 2020), a first PISHA was performed using the information on seismogenic responses from different case studies worldwide because no information was available for the underground laboratory scale (Gischig et al., 2016).
Study 2, BULGG a priori (state 2019). A first PISHA for BULGG was conducted in May 2019 prior to any injection test and during the construction of the BULGG (Gischig et al., 2019). The analysis could benefit from experience with seismogenic responses from the GTS (Villiger et al., 2020) as well as from Aspö (Kwiatek et al., 2018). However, no site-specific information on BULGG was available.
Study 3, BULGG update 1 (state 2021). After the DESTRESS stimulations in boreholes CB1, ST1 and ST2, the PISHA was updated to include the new information on the seismogenic response in the lower part of the reservoir (Fig. 3a). Given the relatively low number of events per stimulation, all seismicity recorded per borehole was combined to compute estimates of the seismogenic response. Note that the uncertainties in seismic locations and magnitudes are larger than for the shallower part of the volume stimulated during VALTER because of the larger distance to a high-resolution seismic network.
Study 4, BULGG update 2 (state 2023). With the seismogenic responses estimated from VALTER stimulations, which are based on the high-resolution monitoring system, another update of the PISHA was made. The study can be seen as a generic study for the BULGG and allows the planning of experiments in the same rock volume (e.g. the M-zero experiment performed in April/May 2024 described below) or in other parts of the laboratory for which no site-specific information is available. Given the quality of seismicity catalogues from within the high-resolution part of the seismic monitoring network at shallower depth, the seismogenic responses of each interval individually have been used.
Study 5, BULGG M-zero. In preparation for the so-called M-zero experiment – an extended stimulation experiment with the goal of inducing an Mw0.0 event as part of the earthquake physics project FEAR (e.g. Volpe et al., 2023) – an experiment-specific PISHA was computed. Only parameters from VALTER intervals 8, 9 and 11 were used for this study (highlighted in Fig. 7c and d) because they are closest to the target interval 11, and seismicity showed that the same fracture network was activated (Obermann et al., 2024). Additionally, the parameter sets only included stimulations with injected volumes >5 m3 as they were deemed more representative of the planned M-zero experiment, which was designed to potentially reach up to 100 m3 injected volume.
Generally, probabilistic seismic hazard analysis (PSHA) requires a wide range of datasets, models and methods proposed by the larger technical community to be relevant to the hazard analysis to be considered (Cornell, 1968; McGuire and Arabasz, 1990; Bommer and Abrahamson, 2006). PSHA must appropriately represent the uncertainties in the assessment and represent the range of technically defensible interpretations. PSHA considers not only worst-case scenarios, but all possible outcomes, which allows a potential outcome to be defined based on different statistical metrics (e.g. an expected, mean or median outcome). Thus, PISHA (i.e. probabilistic induced seismic hazard analysis) itself must not be conservative in choosing the methods, models or model parameters. Conservatism comes in by defining an acceptable hazard level. For instance, acceptable hazard or risk may be chosen to be conservative in the design of buildings and infrastructure, for example, in the case of natural earthquakes or of hydraulic stimulations, traffic light systems, etc. in the case of induced earthquakes.
Here, we apply PISHA to assess the impact of injection-induced earthquakes during experiments at the BULGG for a range of possible injection volumes and distances. The approach is visualised with the logic tree in Fig. 5. The different models and parameter sets used in each logic tree branch represent the epistemic uncertainties. The aleatory variability is considered by assigning uncertainties to the model parameters. Each branch of the logic tree is sampled corresponding to an assigned weight, which has been defined through expert solicitation. Note that the weights vary for the different updates of the hazard computation, as is explained later.
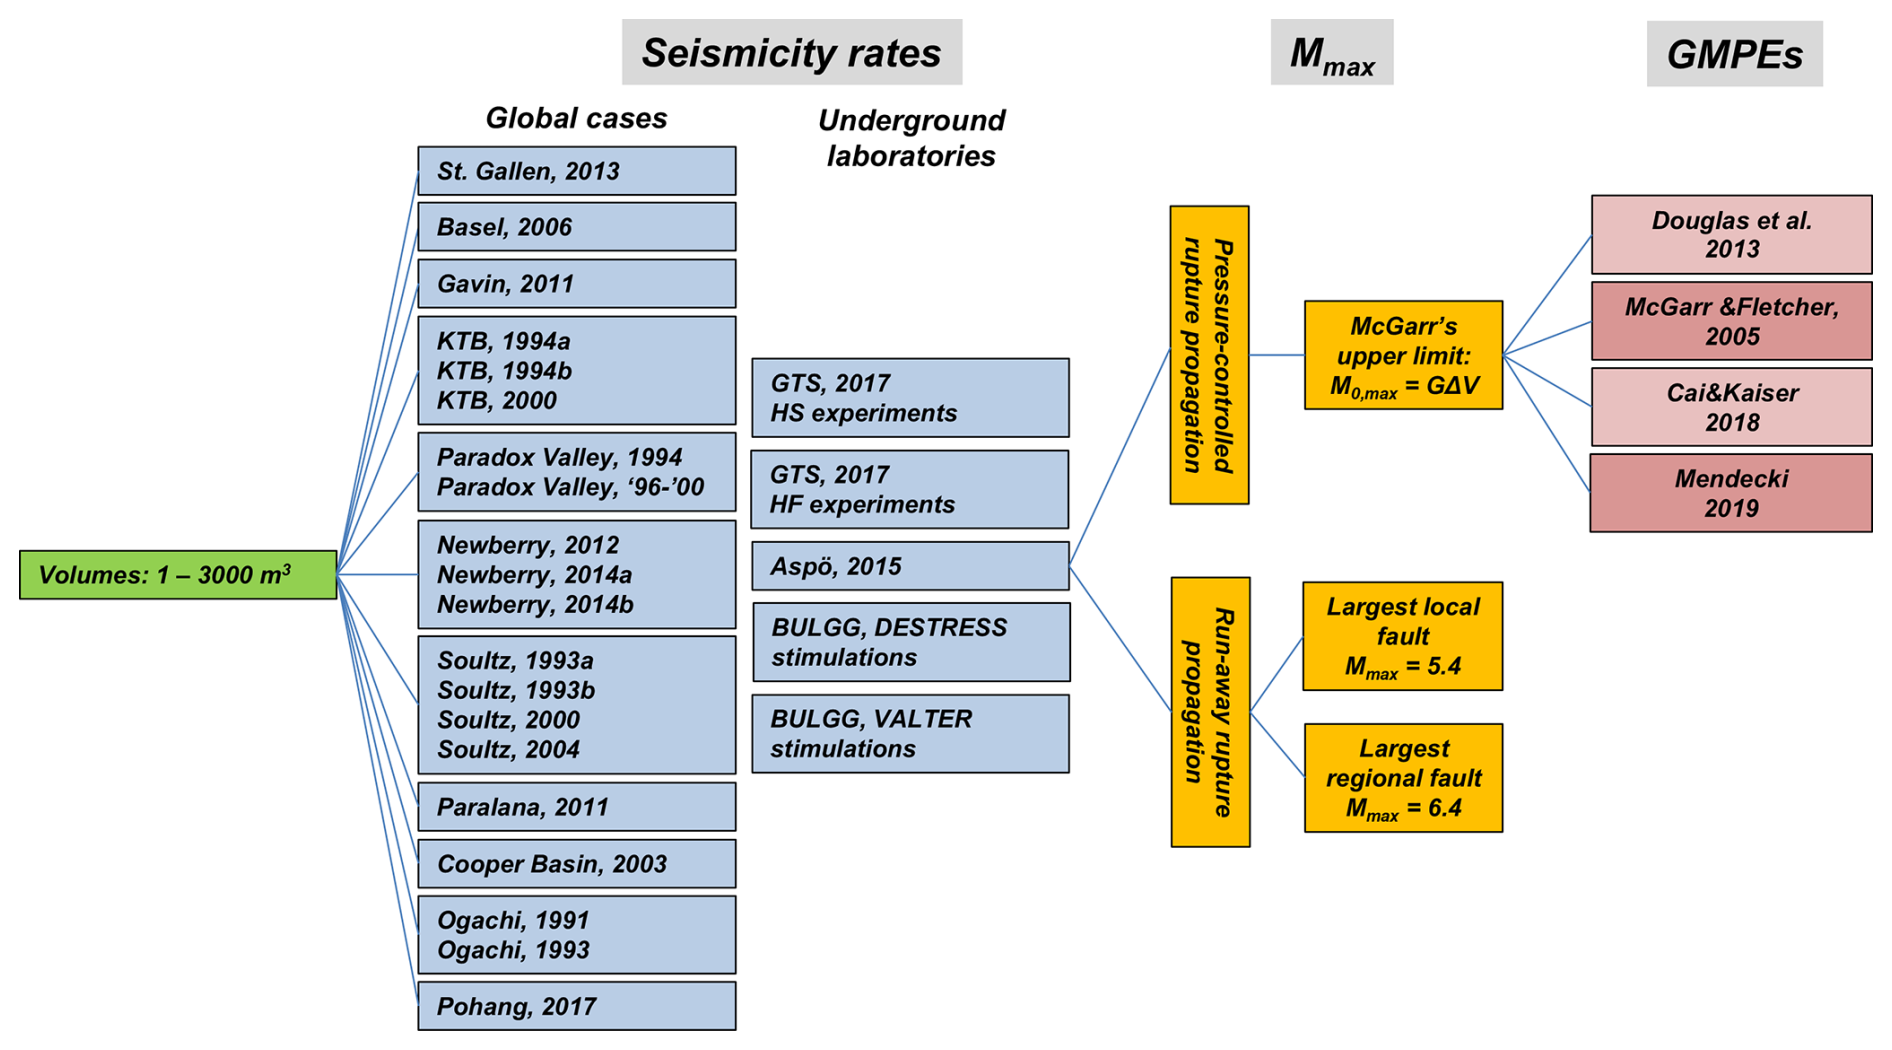
Figure 5Logic tree for the probabilistic induced seismic hazard analyses for the GTS and BULGG stimulation experiments.
5.1 Magnitude rates
In the first layer of the logic tree (Fig. 5), the volume-dependent magnitude rates are estimated. We build on the concept by Shapiro et al. (2010), who proposed a statistical seismicity model that gives an estimate of the cumulative number of earthquakes N exceeding a magnitude level Mi based on volume V(t) injected up to a time t and a site-specific parameter referred to as the seismogenic index. Mignan et al. (2017) refined the seismicity model with an alternative description of the post-shut-in seismicity decay and expressed it in terms of seismicity rate λ:
Analogous to the seismogenic index, they introduced the activation feedback parameter afb; b is the Gutenberg–Richter b value, and τ defines the decay of seismicity after a halt of injection (i.e. shut-in of the borehole). A catalogue of estimates from different cases are given by Mignan et al. (2021). In our case, an estimate of τ is not available for all considered case studies. Since we do not need to model the temporal decay of seismicity explicitly, it is sufficient to use the fraction of events that occurred after shut-in of the total number of events to account for the post-shut-in trailing effect. The approach relies on the simplifying assumption that the b value remains constant during injection and after shut-in. The uncertainty added by this assumption is accounted for by the aleatory uncertainty in the b value. Here we use 47 parameter sets of injections in 14 stimulation cases worldwide, at the GTS and the BULGG (Table A1). When an estimate afb was not available, we used the seismogenic index Σ reported in the references. Note that for cases for which a standard deviation of the b value was not available, we used a heuristically chosen nominal value of 0.05. The error in afb depends on the error in the b value; thus, for different realisations of the b value a corresponding afb value was computed. For cases for which the percentage of events after shut-in was not available, we used a heuristically chosen nominal value of 10 %.
In our sequence of hazard computation updates, the weighting of the parameter sets in Table A1 constitutes the main adjustment in the hazard estimates between each update (besides ground motion models, GMMs; see below). The weighting was determined based on an expert elicitation, in which scientists compare the similarity of each case study with the conditions at the BULGG in terms of rock type, depth, stress level and regime, injected volume, and the process of inducing seismicity. Additionally, the reliability of each parameter set based on the underlying magnitude estimates is rated. The numerical ratings are evaluated to arrive at a weight for each case study (Fig. 6). The weights of all three scientists are averaged. These correspond to the weights for the BULGG update 2.
In the sequence of our five hazard estimates the weights were adjusted (Fig. 6b). For the Grimsel experiments at the GTS, no parameters on the seismogenic response to injection were available for underground laboratories. Similarly, the parameters of Pohang were not available. Hence, we had to solely rely on the other worldwide sets. Note that this differs from the original GTS hazard study by Gischig et al. (2016), in which each parameter set received equal weight. The weights were adjusted here to conform to the later hazard computations for better comparability. The stimulation experiments at GTS and Aspö were conducted between 2015 and 2017. Thus, these datasets were included in the a priori hazard computation for BULGG. In the update before the VALTER stimulation starting in November 2021, the DESTRESS stimulations became available as well as information on the Pohang stimulations. Figure 6b illustrates how the weights for case studies outside of the BULGG receive stepwise smaller weights as underground laboratory experience or even site-specific experience becomes available. The parameter sets in Table A1 are shown in Fig. 7 together with an illustration of how the afb–b value field is sampled in the different hazard computations.
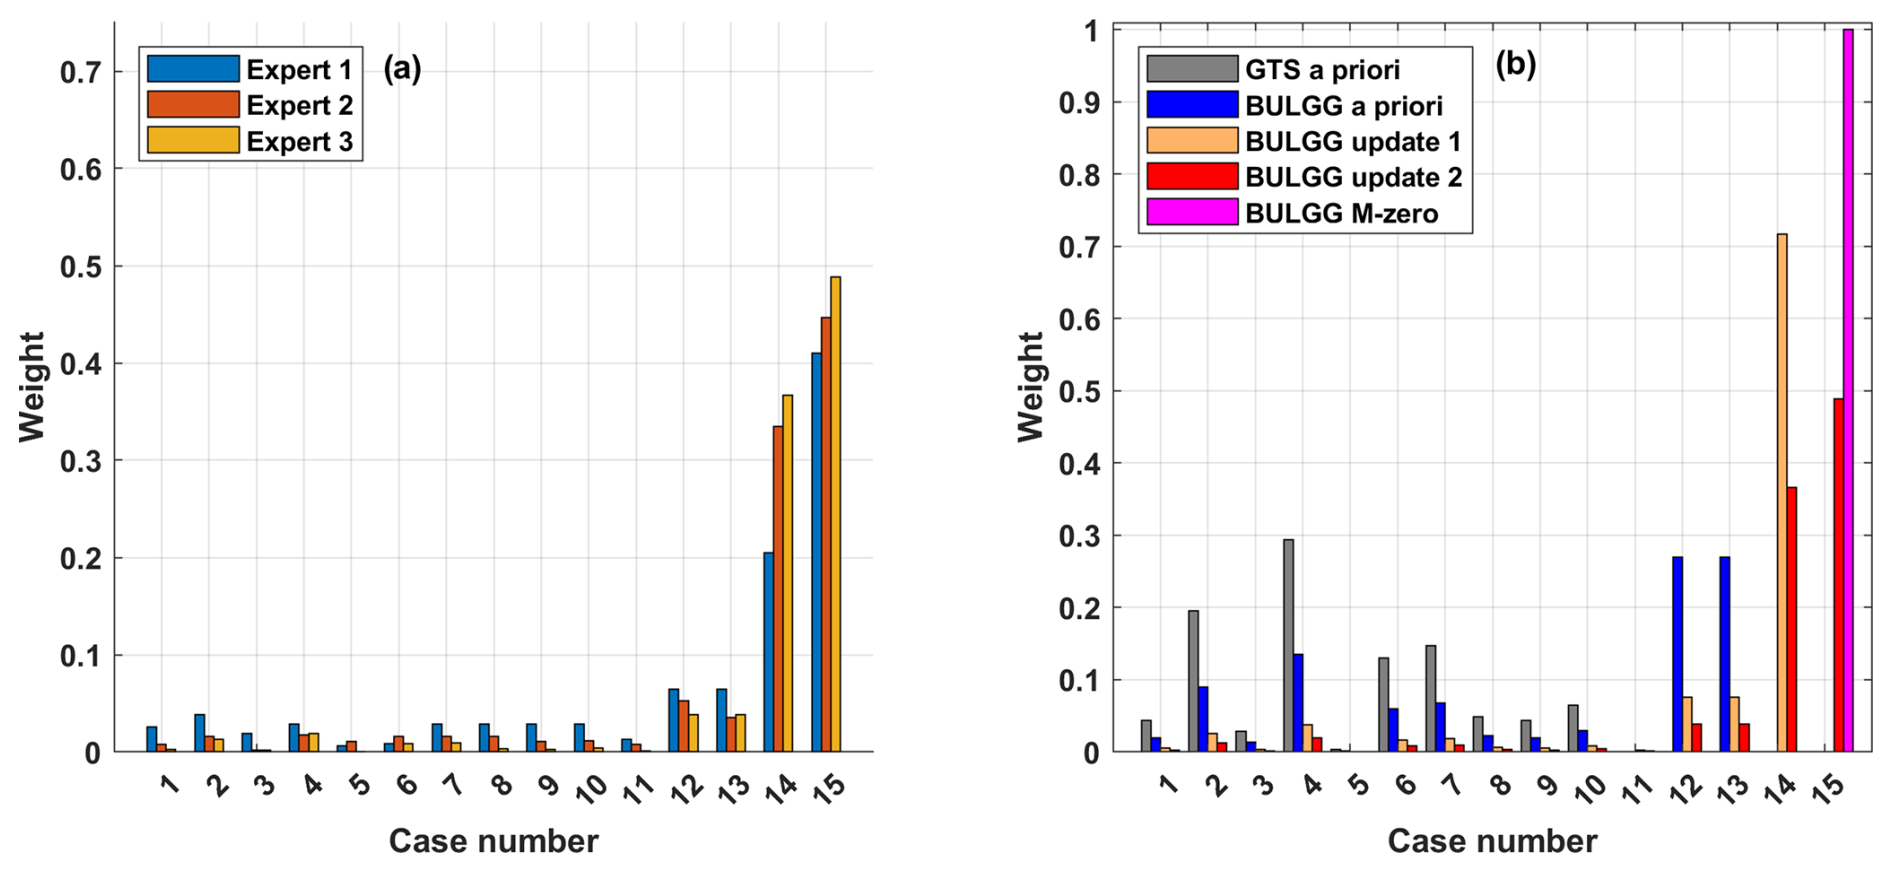
Figure 6(a) Weighting of case studies derived by comparing each case study with the conditions at the BULGG by four scientists. (b) Weights used for each update of the sequence of hazard computations.
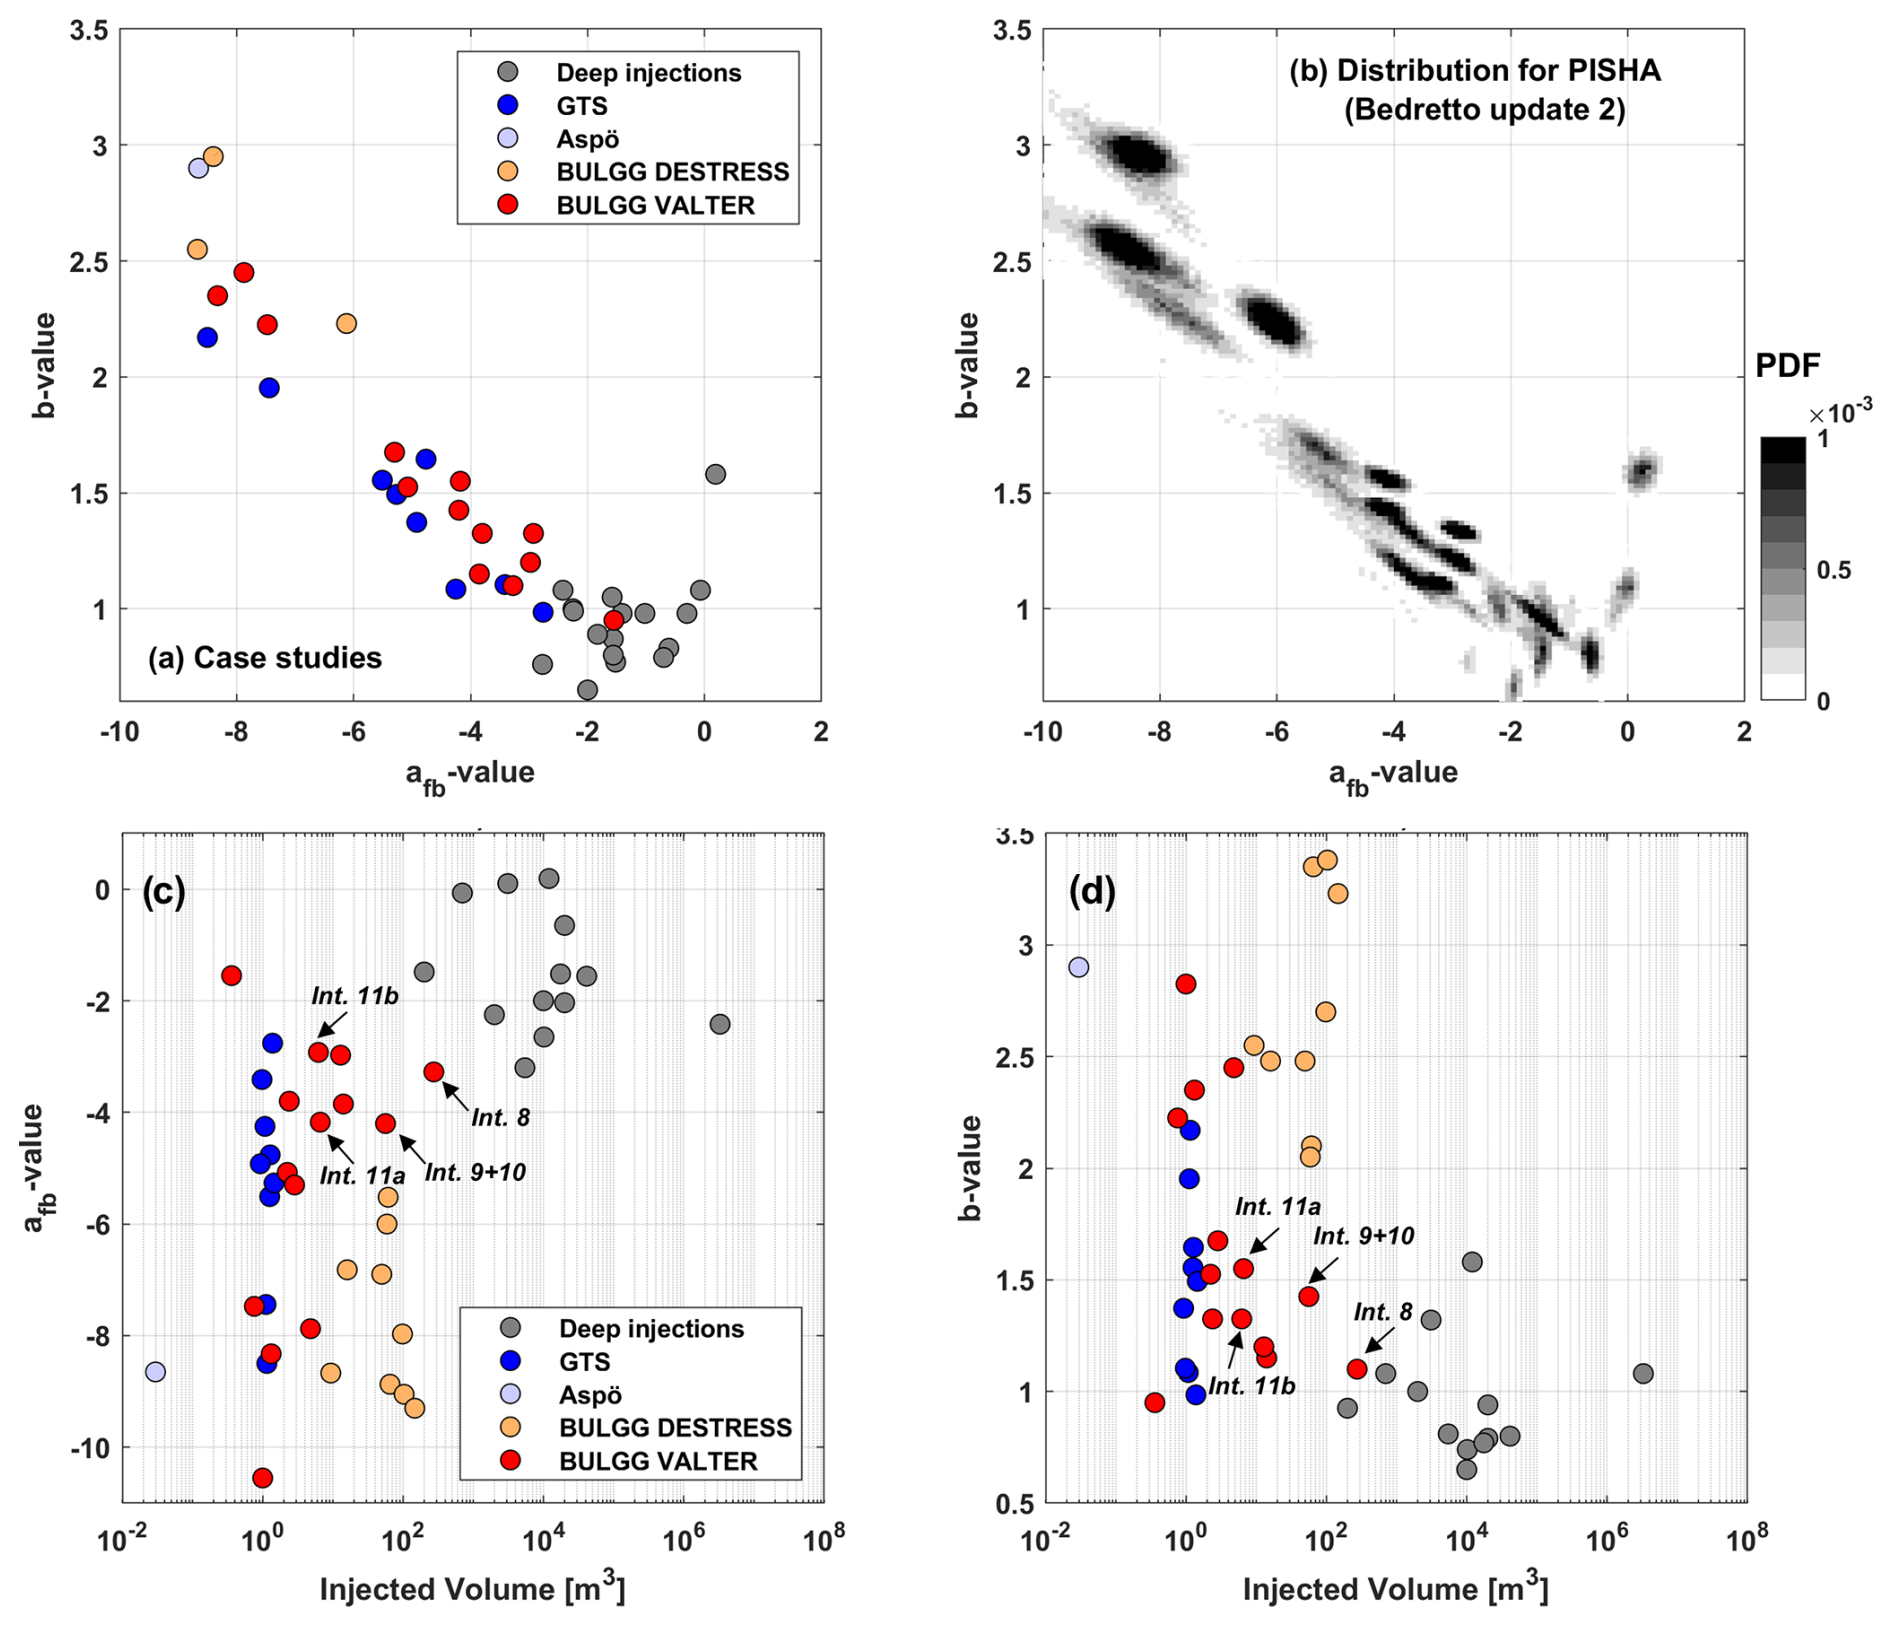
Figure 7(a) The afb and b values used considered in the PISHA. (b) Probability density function (PDF; grey scale) of the afb and b values chosen in the random realisations of the PISHA for the example of the BULGG update 2 analysis. (c) The afb values in relation to injected volume. (d) The b values in relations to injected volume.
5.2 Maximum possible magnitude
Equation (1) predicts a finite seismicity rate even for large unphysical magnitudes. Thus, the frequency–magnitude distributions (FMDs) have to be truncated at a maximum magnitude that can possibly occur based on physical or statistical/empirical considerations as described in the following. This maximum possible magnitude Mmax describes very extreme and rare events, i.e. the tail of a distribution, and is difficult to assess and typically very uncertain. Because Mmax values are very rare, and risk is usually dominated by smaller magnitudes occurring more often, it has a small impact on the risk for commercial-scale projects (Mignan et al., 2015, or Bommer and Verdon, 2024).
For the case of induced seismicity, the choice of maximum possible magnitude follows two different viewpoints that are discussed in the literature. (1) Some authors (e.g. McGarr, 2014) argue that there is a fixed upper threshold for a physically maximum possible magnitude that can be induced by fluid injection. The magnitude can be computed from the scalar seismic moment M0=GΣV, where G is the shear modulus of the medium (here G=20 GPa), and V is the total injected volume. Nonetheless, McGarr (2014) argues that larger magnitudes cannot be entirely excluded due to the uncertainty in the analysis and because a different triggering mechanism in addition to fluid injection may contribute. (2) Other authors (Atkinson et al., 2016; Eaton and Igonin, 2018) argue that Mmax is the same as for tectonic earthquakes. Thus, the FMDs can be extrapolated towards large magnitudes representing earthquakes that would occur if the largest fault in the region would rupture entirely. This viewpoint is supported by the recent hydraulic stimulation in Pohang, South Korea, which has likely induced a Mw 5.5 (Grigoli et al., 2017; Lee, 2019). For the case of Pohang, McGarr's (2014) estimated maximum possible magnitude for the injected volume of ca. 10 000 m3 was Mw 3.7 (Fig. 8).
A numerical analysis by Gischig (2015) using coupled rate-and-state frictional behaviour and hydromechanics (McClure and Horne, 2011) showed that a critically stressed fault (i.e. a fault verging on failure) may indeed rupture beyond the pressurised fault area and become an earthquake as large as a tectonic one (so-called runaway rupture propagation). However, if the fault is not critically stressed (e.g. not-optimally oriented in the stress field), rupture arrests at the pressure front (pressure-controlled rupture propagation). The former case implies a maximum possible magnitude corresponding to the tectonic one, while the latter implies that an upper threshold as suggested by McGarr (2014) is feasible. These outcomes confirm the results of slip-weakening fault models by Garagash and Germanovic (2012), who similarly distinguish between these two rupture propagation regimes. Recently, Ciardo and Rinaldi (2022) demonstrated that the ramp-up of the pressurisation may also have an important role in determining the maximum magnitude but again confirmed that for critically stressed faults a runaway rupture can occur. Galis et al. (2017) find that runaway rupture may occur, but most cases of induced seismicity exhibit maximum magnitudes that more closely correspond to pressure-controlled rupture sizes. Recent statistical analyses show that the maximum magnitude can be bound or unbound (Schultz, 2024).
The effective stress level that may play a role in how likely runaway ruptures occur increases to a first-order linearly with depth. It is thus plausible that injections at shallower depth trigger a different seismic response than at greater depths, which is also evident from the dependency of the a value and b value of tectonic events on faulting style and depth (e.g. Spada et al., 2013; Petruccelli et al., 2019). Likely, the depth dependencies of the afb values, b value and runaway rupture probabilities are coupled, yet limited data exist to define the dependencies.
In our view, the assumption that runaway ruptures are less likely at shallower depth is well captured by the Mmax branch based on McGarr's limit. Note that we consider the upper bound proposed by McGarr (2014) instead of that proposed by Galis et al. (2017) because they are more conservative at our scale (Fig. 8). Further, in the case of runaway ruptures, we consider two fault sizes. Thus, the epistemic uncertainty in the assessment of the maximum possible magnitude Mmax is computed as follows:
-
represents the mean maximum tectonically possible magnitude in the Swiss Alps following the national Swiss hazard assessment of 2015 (Wiemer et al., 2016). This would represent the case where a rupture is triggered on an unknown and critically pre-stressed large fault that extends into the basement (weight 25 %).
-
Mmax is defined by the largest fault in the region around the BULGG. In a study of brittle fault zones within the Gotthard Massif, Lützenkirchen (2002) maps a fault that intersects the Rotondo Granite at about 2 km distance from the lab. The length of the fault is mapped with 7 km. In this scenario, it is considered possible that an injection finds a pathway to the fault and can trigger the entire fault with a rupture area of 7×7 km. Assuming a stress drop of 3 MPa, which is a representative average value for a wide range of magnitudes (Cocco et al., 2016), results in . The values are roughly in agreement with the empirical scaling relationships reported by Thingbaijam et al. (2017) (weight 25 %).
-
Mmax is a function of injection volume following McGarr (2014) (weight 50 %).
We consider Mmax to be a random variable reflecting further epistemic uncertainty, i.e. our limited knowledge in the given exact upper bound. We consider a Gaussian distribution with a standard deviation of 0.3 (for McGarr's Mmax) and 0.8 (for the tectonic Mmax's). Note that in particular for the tectonic values this standard deviation includes both uncertainties related to the scaling relations (Thingbaijam et al., 2017; Cocco et al., 2016) and in the estimate of the potential rupture area. Figure 8 shows McGarr's (2014) relationship along with maximum observed magnitudes from case studies from various injection operations. Injections of 1 or 1000 m3 correspond to Mmax of M1.0 and M3.0, respectively.
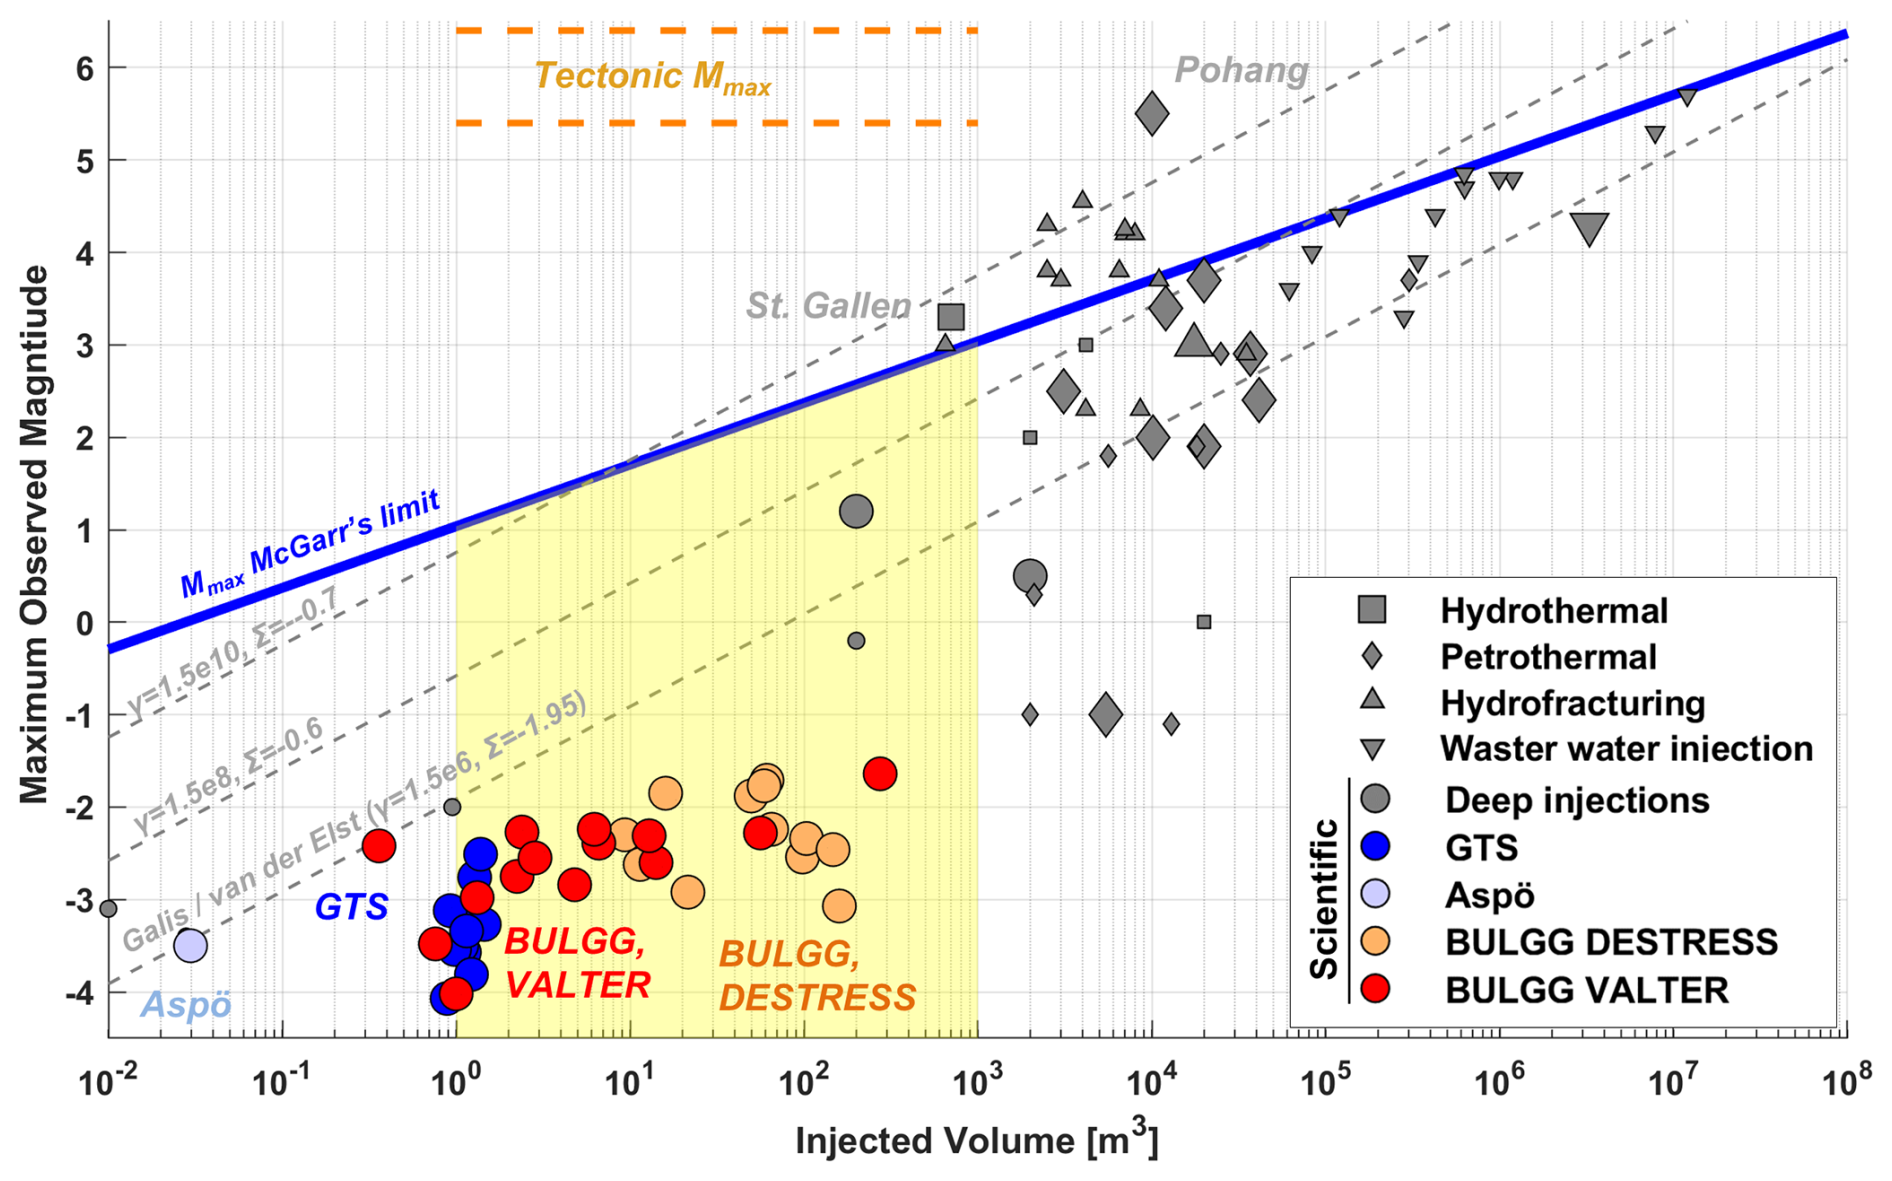
Figure 8Different versions of the maximum possible magnitude Mmax for the volume range considered in our study (1–1000 m3). Also shown are the observed maximum magnitudes during various injections (Villiger et al., 2020; Obermann et al., 2024). Large markers indicate case studies for which afb and b values are available to our analyses. The limit proposed by van der Elst et al. (2016) assumes a b value of 1 to be in agreement with the limits proposed by Galis et al. (2017).
5.3 Ground motion models
In the third layer of the logic tree, ground motion models (GMMs) have to be used to estimate actual ground motion (i.e. peak ground velocity, PGV, or peak ground acceleration, PGA) at a given distance R from the earthquake for an earthquake of magnitude Mw. Due to the short distances and the presumably small magnitudes in our case, we cannot use GMMs for tectonic earthquakes, which would be widely available in the literature. Also, unlike for tectonic seismic hazard estimates, which predominantly rely on PGA, here we use GMMs that rely on PGV. The main reason is that thresholds for damage scenarios deemed most relevant in our study (e.g. damage/cracking of rock or concrete, rockfall, rock burst) stem from mining literature (e.g. Cai and Kaiser, 2018) and are given in terms of PGV. Further, we aimed to define hazard thresholds (see next section) that are in accordance with the Swiss Norm 640 312a. Most GMMs from mining literature that are relevant for our magnitudes and distances predict PGV. In fact, the PSHA by Wesseloo (2018) computes hazard in terms of PGV.
Butler and Aswegen (1993) report GMMs from underground mines that depend on a local magnitude ML (range ML = 0.5–4.0, R = 150–10 000 m). Similarly, Hedley (1990) reports ML-based GMMs from underground mines. The equation by McGarr and Fletcher (2005) from mining-induced seismicity is expressed in terms of seismic moment and Mw (range Mw>1.0, R = 500–10 000 m). Cai and Kaiser (2018) propose to use equations that have the same functional form as the one reported by McGarr (1984) and give a possible range of constants derived from many case studies. Relying on these constants the model predicts somewhat larger ground motions compared to the McGarr and Fletcher (2005) model despite similarities in the functional form. The equations proposed by Mendecki (2019) differ in the functional form and in that potency is used instead of the seismic moment (range Mw > 0.2, R = 50–500 m). A GMM specifically for induced seismicity in the context of deep geothermal projects was proposed by Douglas et al. (2013) (range Mw > 1.0, R = 1500–50 000 m)
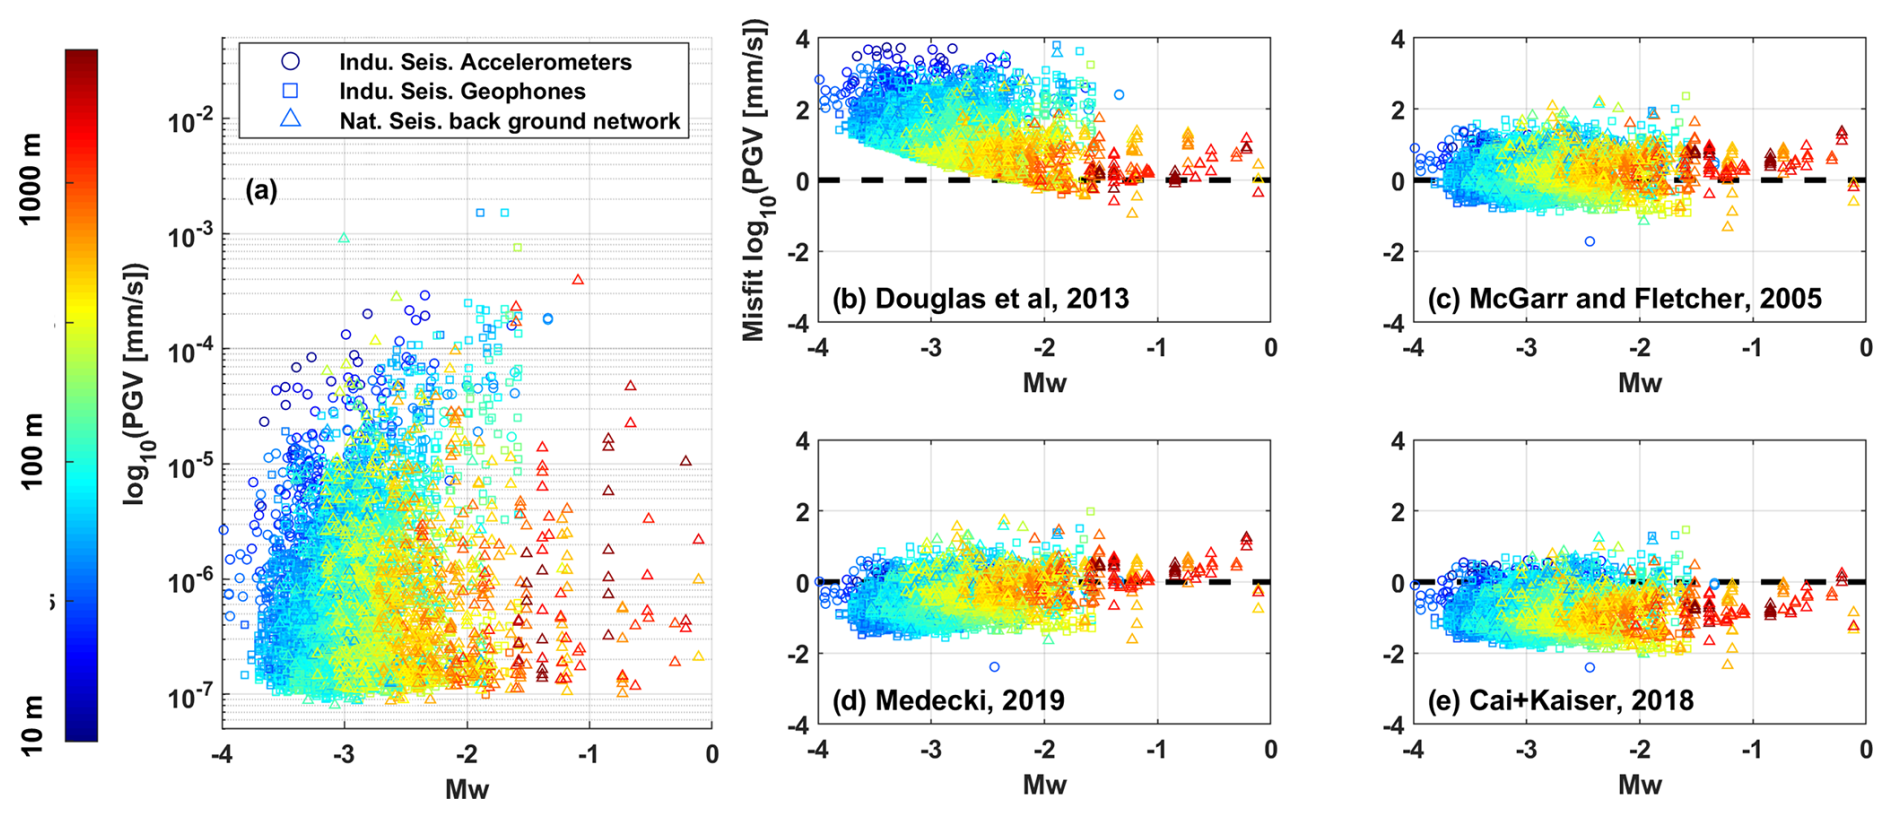
Figure 9(a) PGVs observed within and around the BULGG with the high-resolution monitoring network and the background network (Mesimeri et al., 2025). Ground motions recorded at accelerometers, borehole geophones, and tunnel and surface seismic stations were used. (b–e) Comparison of the GMMs by McGarr and Fletcher (2005), Cai and Kaiser (2018), Mendecki (2019), and Douglas et al. (2013) motion data that are available for these distances.
There is a consensus in these studies that GMMs must be derived from case-specific seismic data despite similarities in the functional form between sites (e.g. Cai and Kaiser, 2018; Mendecki, 2019). In our case, local seismicity data were not available before for the a priori analysis for GTS and BULGG. However, seismicity data became available once hydraulic stimulation started at the BULGG (Obermann et al., 2024; Rosskopf et al., 2024a; Mesimeri et al., 2025). Seismicity induced by hydraulic stimulations was recorded by a high-resolution seismic network based on highly sensitive acoustic emission sensors, accelerometers and borehole geophones (Plenkers et al., 2023). Waveforms recorded with the accelerometers and geophones provide estimates of PGV for induced earthquakes. In addition, seismic stations in the tunnel and on the ground surface as well as the borehole geophones recorded natural seismicity in the BULGG region (Mesimeri et al., 2025). Using values of PGV from a distance of 3 km around the BULGG, we can assess which of the ground motions best fit the local observations (Fig. 9).
Thus, for our PISHA sequence, we chose the following GMMs from the literature:
-
For the a priori GTS and a priori BULGG analyses, we chose the GMMs by McGarr and Fletcher (2005, Eq. 3 therein), Cai and Kaiser (2018, Eq. 2-2, p. 56), Mendecki (2019, Eq. 6 therein assuming shear modulus G = 20 GPa to translate potency to seismic moment), and et al. (2013, Table 2, based on corrected data therein). We did not consider the equations by Butler and Aswegen (1993) and Hedley (1990) because they rely on ML, and a conversion to Mw has not been derived for these datasets, while using other reported conversion equations (e.g. Deichmann, 2017; Edwards et al., 2015) would introduce further uncertainty. The four chosen GMMs were equally weighted (i.e. 25 % each) to account for the epistemic uncertainty.
-
For the BULGG update 1 and 2 and BULGG M-zero, we chose equations by McGarr and Fletcher (2005) and Mendecki (2019) with equal weight (50 % each) because they fit the observed PGVs best (Fig. 9b–e). We discarded the equations by Cai and Kaiser (2018) and Douglas et al. (2013) that systematically deviated from the observations.
Figure 10 shows the probability density function (PDF; grey shading) of the PGV as a function of magnitude at a distance of 150 m (representative distance of the BULGG cavern to stimulation experiments) and 2000 m (minimum distance to infrastructure at the tunnel portal as well as the Furka tunnel railway infrastructure). For this, the chosen GMMs were sampled randomly 105 times using the corresponding weights (epistemic uncertainties) and respective uncertainty in each equation (aleatoric uncertainty). If all four GMMs are combined (as is done for the a priori GTS and BULGG analyses), the 10 % and 90 % percentiles from this distribution cover more than 2 orders of magnitude. For example, at 150 m distance, a PGV of 30 mm s−1 is exceeded with an event of magnitude of about Mw 2.3, but with a range from Mw 1.4–3.8 (Fig. 10a). At 2000 m distance, the magnitude to exceed a PGV of 30 mm s−1 is 4.0, but with a range from Mw 3.0–5.0. However, once information on ground motions from the BULGG seismic network is considered, uncertainties reduce substantially. At 150 m distance, 30 mm s−1 is exceeded for Mw 2.4 (median) with a range of Mw 2.0–2.7 (10 % and 90 % percentiles)
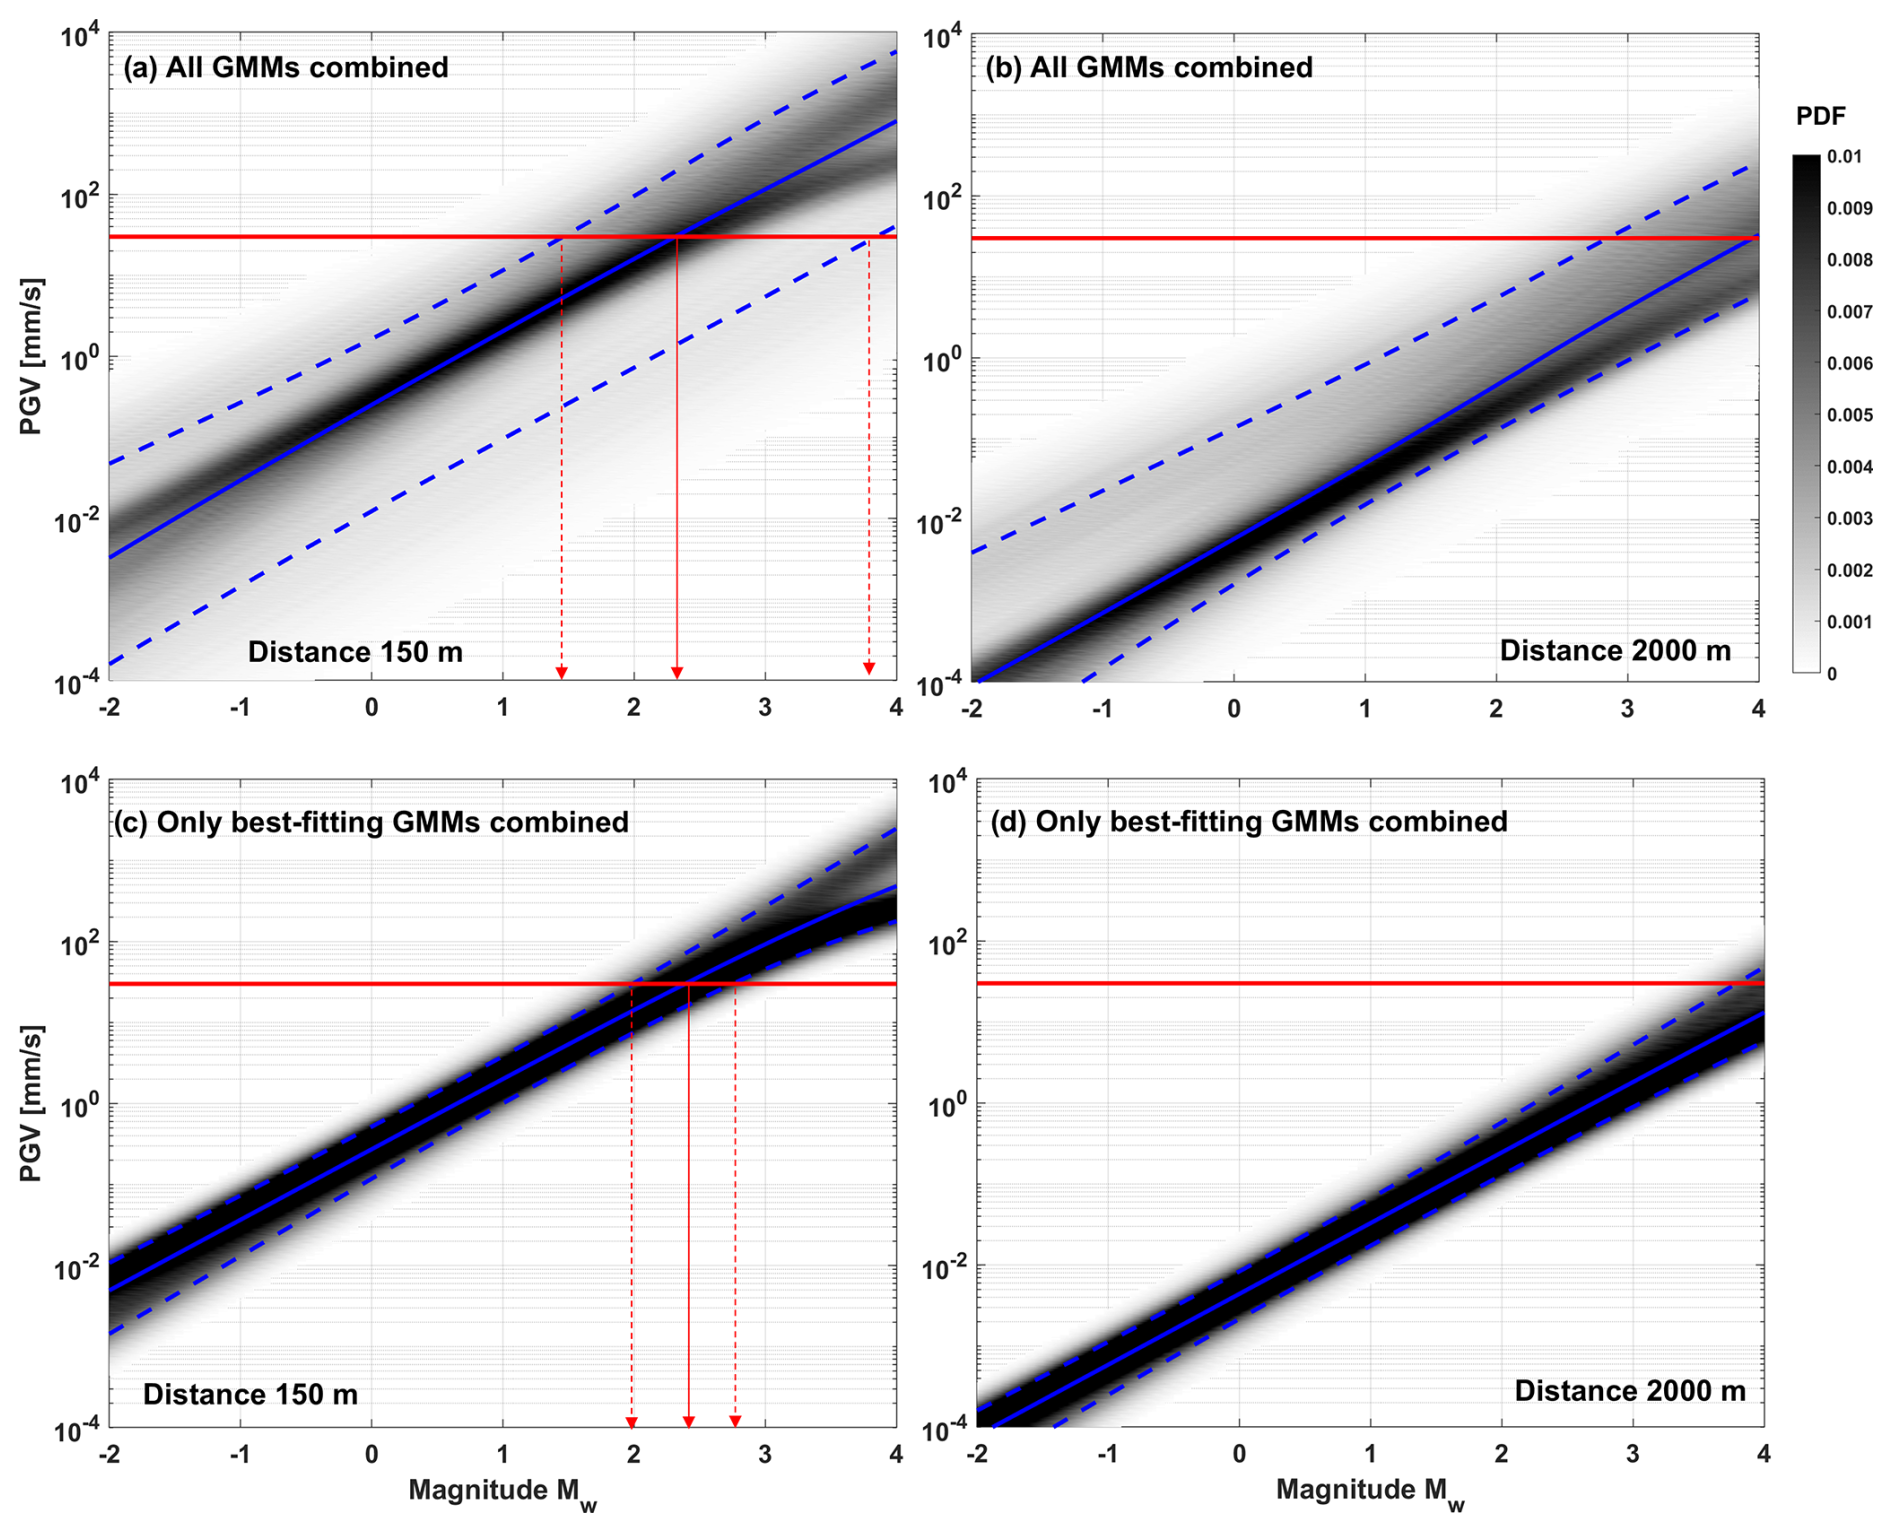
Figure 10(a) PGV at a distance of 150 m (representative distance to injections of VALTER) estimated based on all four GMMs, including their uncertainties. The grey shading in the background represents the probability density function. For this, the five equations are weighed equally and are sampled randomly with the corresponding uncertainties in the PGV estimates. (b) The same for a distance to the Furka railway tunnel infrastructure. (c,d) Same as panel (a) and panel (b) but only using best-fitting GMM.
5.4 Hazard thresholds
Induced earthquakes relevant to our context (typically Mw ≪ 2.0) have frequencies that are larger than 10 Hz. Thus, methods commonly used in earthquake engineering focusing on large, damaging earthquakes have limited applicability. Solutions can be found in mining literature or from norms dealing with vibrations from blasting, construction or traffic. The Swiss Norm SN 640 312a can be used to define thresholds at the tunnel levels. It defines three levels of the excitation frequency, i.e. how often it occurs: occasionally, frequently and permanently. Vibrations from blasting or, as assumed here, from small induced earthquakes occur occasionally. Further, the norm distinguishes buildings and infrastructure into four classes of vulnerability (or sensitivity): very low sensitivity, low sensitivity, normal sensitivity and high sensitivity. Although tunnels and caverns in hard rock are considered to be characterised by very low sensitivity, we prefer to classify the unsupported caverns of the BULGG to be in the class “low sensitivity” and the equipment and machinery as well as railway infrastructure of the Furka tunnel to be in the “normal sensitivity” class.
The threshold values for PGV for frequencies 8–30 Hz are 15 mm s−1 for normal sensitivity and 30 mm s−1 for low sensitivity. The norm states that damage becomes likely at values twice these thresholds (i.e. 30 and 60 mm s−1), while severe damage only occurs at a multiple of the values. In the following, we use 30 mm s−1 as the PGV threshold (e.g. Fig. 10). These threshold values are in agreement with the observations of damage in mines by Cai and Kaiser (2018, p. 81), who describe the following damage classes: (1) no damage – PGV < 50 mm s−1); (2) falls of loose rock – 50 < PGV < 300 mm s−1; (3) falls of ground – 300 < PGV < 600 mm s−1; (4) severe damage – PGV > 600 mm s−1. The threshold agrees with those discussed in other hazard analyses in the literature; for example, Ader et al. (2020) proposed 7.5 mm s−1 for cosmetic damage to buildings and 1 mm s−1 for human perception. Cremen and Werner (2020) use 15 mm s−1 as the threshold for cosmetic damage to buildings. Thus, the proposed threshold of 30 mm s−1 can be considered conservative regarding substantial damage.
6.1 Magnitude rates
Sampling the logic tree (Fig. 5) 100 000 times results in the full range of possible outcomes regarding the probability of exceeding a magnitude Mw. Figure 11 shows the multitude of probability curves (represented in grey shading as probability density function, PDF) for an injection volume of 100 m3 for each version of the hazard analysis. It is important to note that we refrain from normalising the probability to a timescale (i.e. annualisation; Wesseloo, 2018). The probability is understood as per stimulation experiment, which may typically last a few hours to a few days depending on the experimental design (injection volume, pressure and flow rate). For comparability with commonly acceptable annualised hazard or risk levels, one would normalise the probability with the duration of the stimulation experiment (e.g. at an experimental flow rate of 30 L min−1 injection rate and a volume of 100 m3 the experiment would last 55 h, excluding shut-in time).
The range of the curves – also represented by the 10 % and 90 % percentiles – is comparably narrow for the GTS a priori analysis, for which only parameters of deep injections and no underground laboratory parameters are considered. The outcome may be seen as the outcome of a generic a priori hazard analysis for deep injections. Once underground laboratories are included the range of outcomes spreads because the b and afb values from underground laboratories cover a range with much lower afb values and higher b values than the deep injections (Fig. 7). The 90 % percentile decreases towards smaller magnitudes for a given probability but to a much lesser degree than the median. The median changes substantially once the BULGG stimulations are available, and the given weight is much higher than for all other case studies (Fig. 6). For instance, the expected magnitude (i.e. the magnitude that occurs with a rate 1 or the equivalent exceedance probability of 0.63) drops from Mw1.75 (GTS a priori) to Mw−2.0 for the subsequent analyses. For the BULGG M-zero analysis, only the hydraulic stimulations deemed most representative of interval 11 are considered. Consequently, the range of hazard estimates collapses to a narrow range, and the expected magnitude (i.e. rate 1, probability 0.63) is Mw−1.3 (range −0.7 to −1.6).
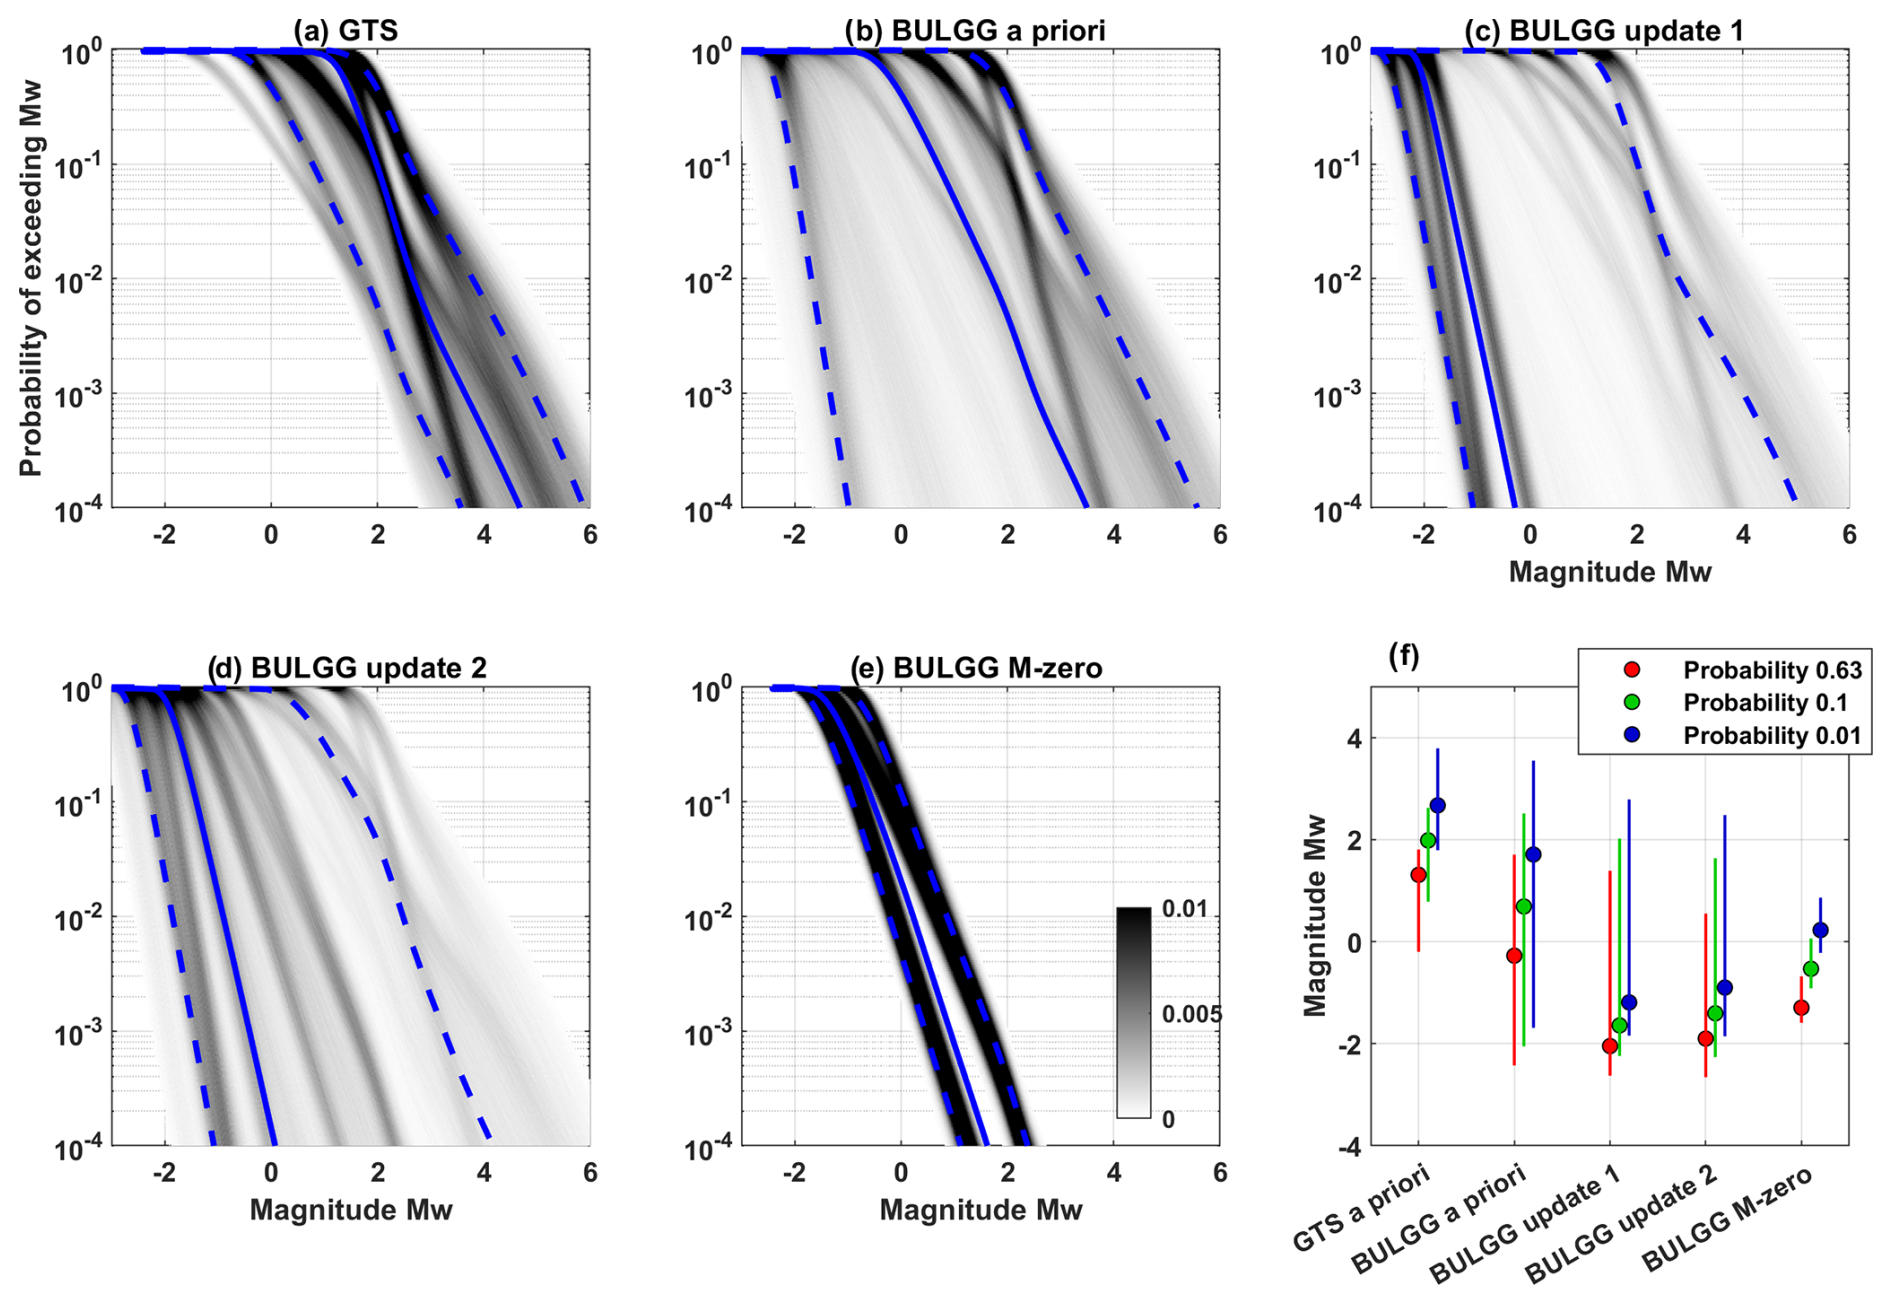
Figure 11Hazard curves expressed in terms of the probability of exceeding magnitude Mw for all hazard computations. Injection volume is 100 m3. (a) GTS a priori, (b) BULGG a priori, (c) BULGG update 1, (d) BULGG update 2, (e) BULGG M-zero. The grey shading represents the PDF, the solid blue line is the median, and the dashed blue lines are the 10 % and 90 % percentiles of all solutions. (f) Summary of all hazard computations for specific probability levels.
The outcomes of experiments at GTS and BLUGG in terms of the maximum induced magnitudes are compared against the corresponding predictions of the PISHA (i.e. probability of exceeding a magnitude Mw; Fig. 12). Because the GTS a priori analysis relies mostly on deep injections and not on underground laboratory experiments, the maximum observed magnitudes are far below what it predicted (Fig. 12a; note that the probability of 0.63 % corresponds to a rate of 1). Experience from the GTS experiments (Villiger et al., 2020) now considered in the BULGG a priori analysis still predicts the maximum magnitude induced during the DESTRESS stimulations (Fig. 12b). These experiments are considered in the BULGG update 1 with high weights (Fig. 6) and lead to much lower magnitude predictions, which are well in agreement with the maximum magnitude observed during the VALTER stimulations (Fig. 12c); the maximum observed magnitudes group around the 63 % and 10 % probability lines for volumes larger than 1 m3. The predictions of the BULGG update 2, now considering the VALTER stimulations, are comparable to the BULGG update 2. The expected magnitude Mw0.0 of the M-zero experiment corresponds to <0.1 % probability (Fig. 12d). If only data from stimulation at nearby intervals and at larger volumes (i.e. >5 m3) are considered, the magnitude Mw0.0 corresponds to the 1 % level (Fig. 12e).
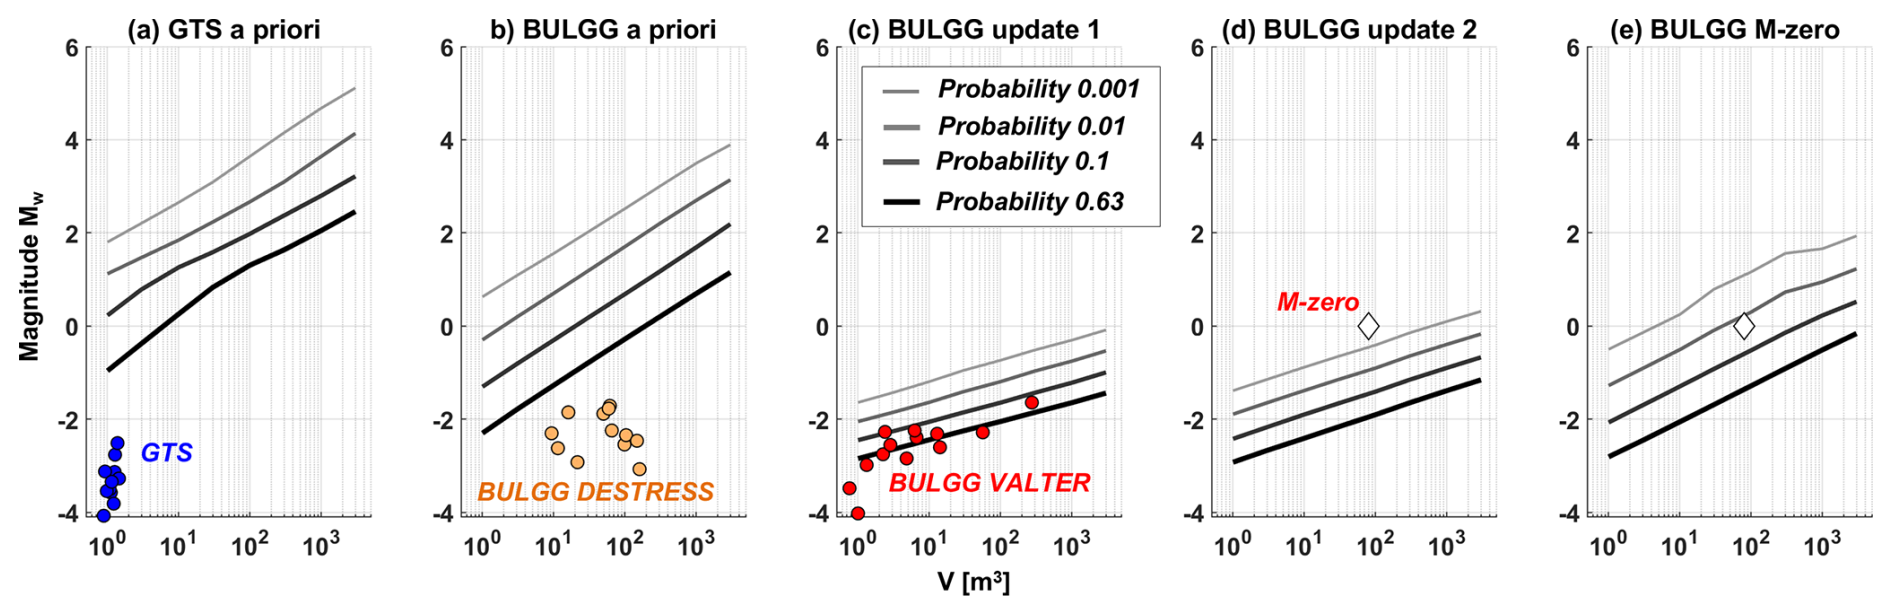
Figure 12Magnitude Mw that is exceeded at different probability levels for different injection volumes. (a) GTS a priori analysis along with maximum magnitudes induced during experiments at the GTS (Villiger et al., 2020). (b) BULGG a priori analysis along with the maximum magnitude induced during DESTRESS stimulations (Giardini et al., 2022, Fig. 3c). (c) BULGG update 1 along with maximum magnitudes induced during VALTER stimulations (Obermann et al., 2024, Fig. 3d). (d) BULGG update 2 and (e) BULGG Mzero, both along with maximum magnitude planned to be induced during the M-zero experiment.
6.2 Seismic hazard curves
The range of possible hazard curves becomes even larger when GMMs are used to compute the probability of exceeding a certain PGV (Fig. 13 for injection volume of 100 m3 and a distance from the source of 100 m). The hazard analysis for the GTS, not considering parameters of underground laboratory experiments, results in a range of 2–3 orders of magnitude between the 10 % and 90 % percentile (i.e. the PGV exceeded at a certain probability level; Fig. 13f). If parameter sets of underground laboratories are considered (BULGG a priori analysis), the range becomes unreasonably high and covers up to 6 orders of magnitude. Both the large range in magnitude probabilities (Fig. 11b) and the large uncertainties in the GMMs in the absence of site-specific estimates (Fig. 10a and b) result in an extreme span of hazard estimates. For the BULGG update 1 and 2 locally calibrated GMMs were used that have lower uncertainties (Fig. 10c and d). Yet, the range of possible hazard estimates remains high because the range in magnitude probabilities is already very high. The range of hazard estimates reduces only once locally calibrated GMMs are used along with afb and b values of only a few representative hydraulic stimulations, such as those used for the BULGG M-zero estimate.
The median strongly depends on the relative weighting of the parameter sets. The median of the expected PGV (i.e. the PGV exceeded with a probability of 0.63) decreases from 3 to 0.01 mm s−1 (i.e. factor of 300) comparing the GTS a priori to the BULGG updates 1 and 2. For the BULGG M-zero analysis, the median of the expected PGV is 0.04 mm s−1.
For the GTS a priori analysis, the probability of exceeding the threshold value of 30 mm s−1 is about 0.07 (range of to 0.76). For BULGG update 2, it ranges from to 0.03. For the BULGG M-zero, it is (range of to ).
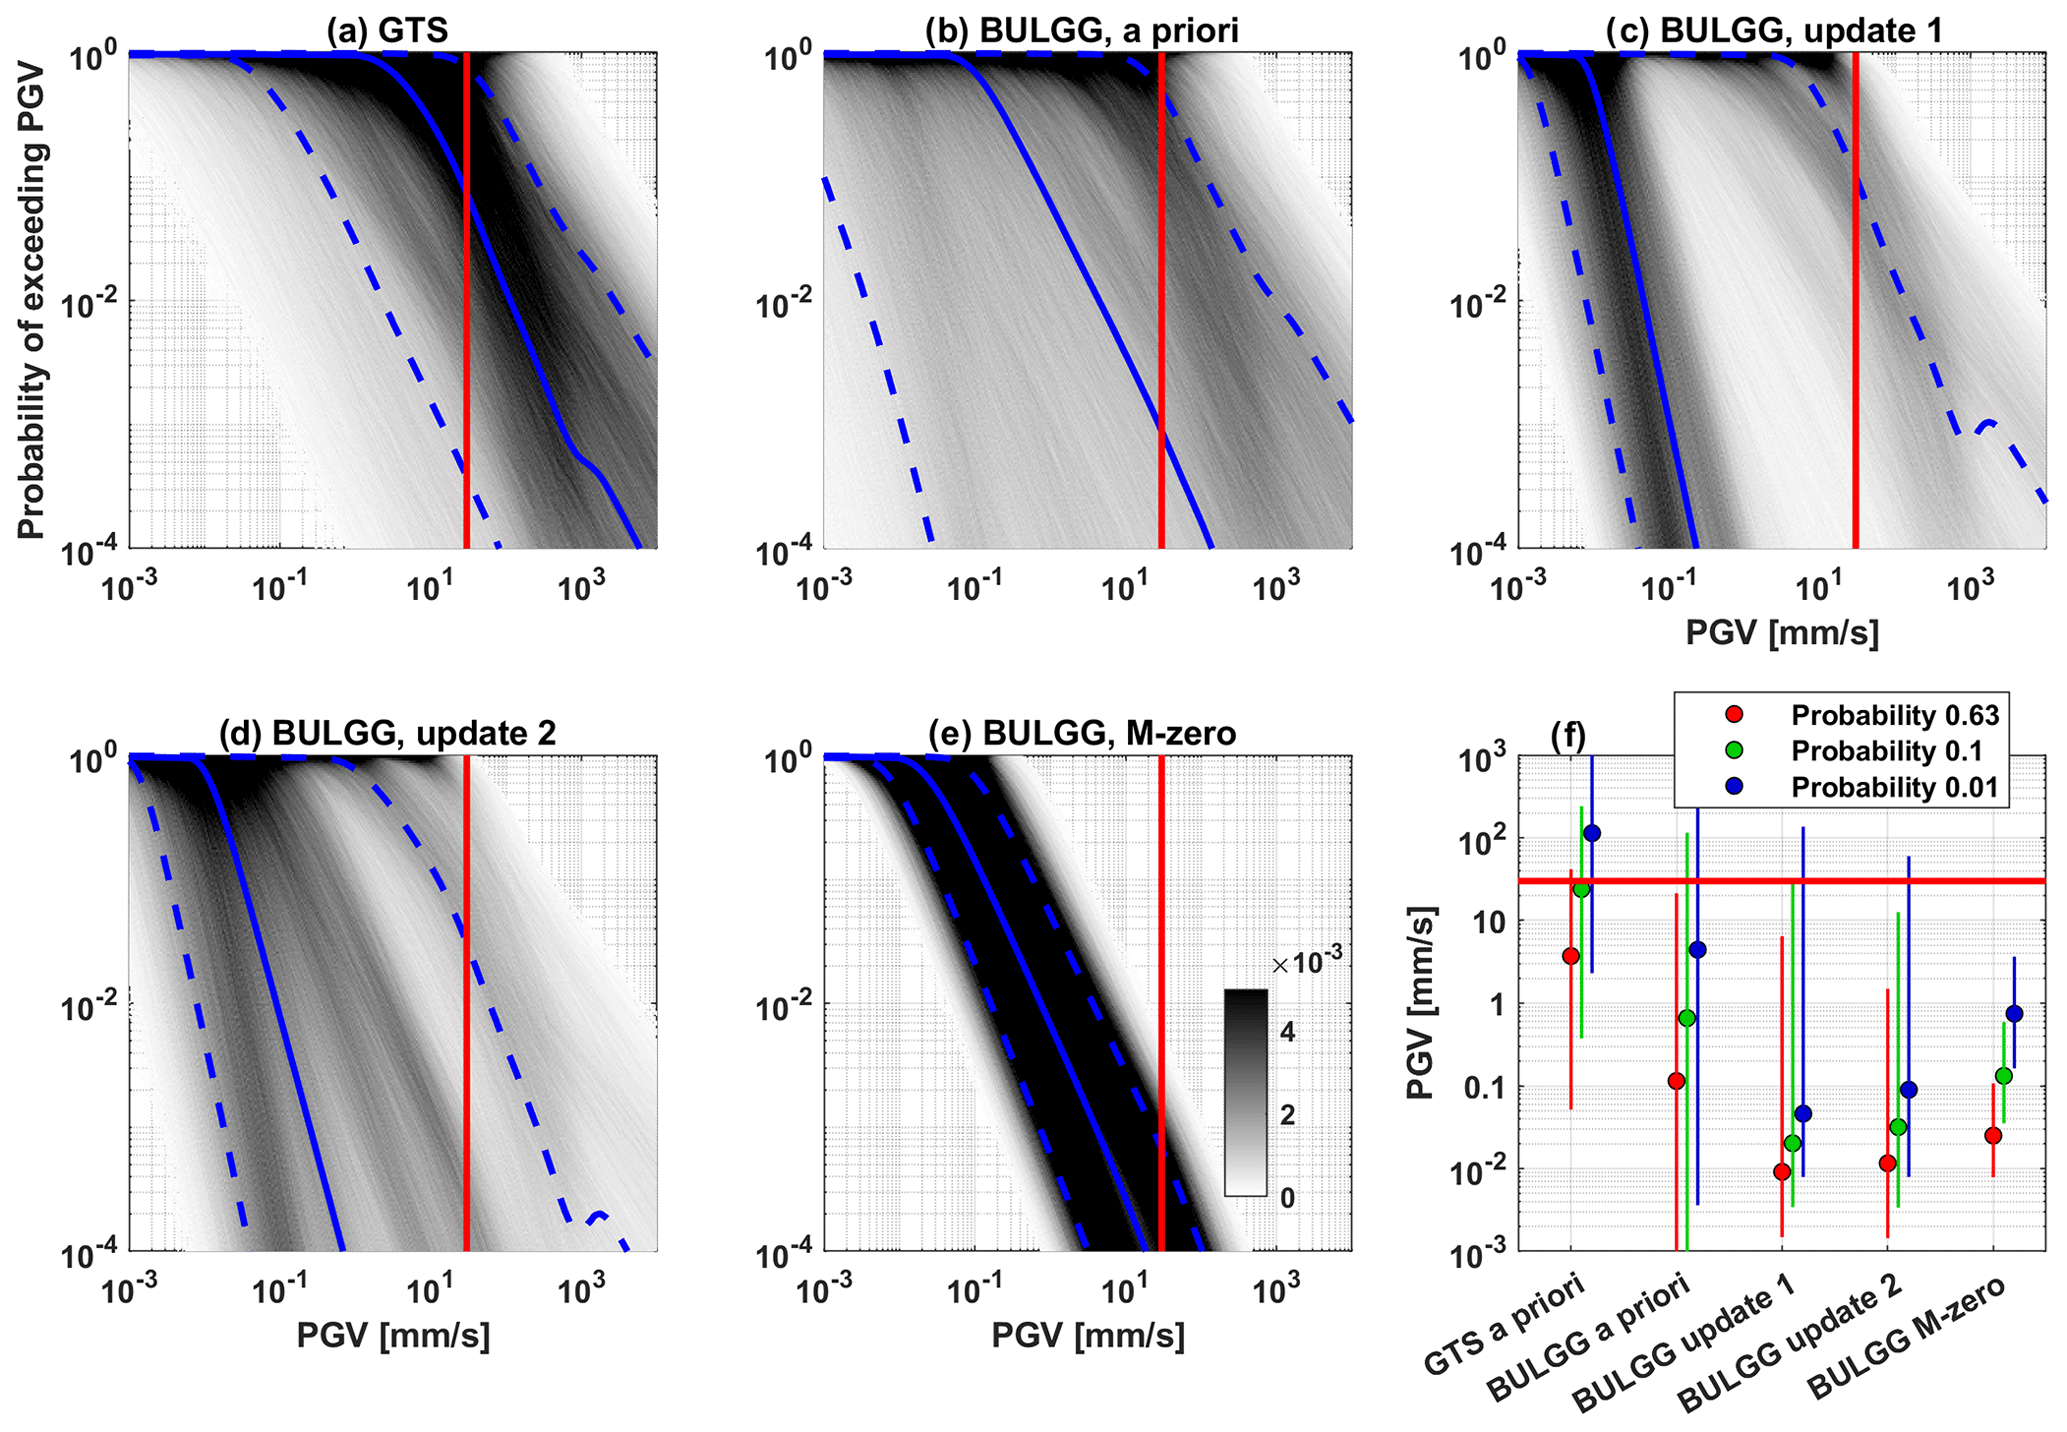
Figure 13Seismic hazard curves expressed in terms of probability of exceeding a certain PGV at a distance of 300 m from the injection. Injection volume is 100 m3. (a) GTS a priori, (b) BULGG a priori, (c) BULGG update 1, (d) BULGG update 2, (e) BULGG M-zero. The grey shading represents the PDF, the solid blue line is the median, and the dashed blue lines are the 10 % and 90 % percentiles of all solutions. The vertical red lines indicate the PGV threshold of 30 mm s−1. (e) Summary of all hazard computations for specific probability levels. (f) The horizontal red line corresponds to 30 mm s−1.
If hazard is computed for a range of injection volumes and distances (e.g. Cremen and Werner, 2020), the results may be used for designing stimulation experiments based on a map of PGV values that are exceeded at a predefined probability level as a function of distance and volume (Fig. 14). For instance, if a potentially damaging PGV of 30 mm s−1 must not be exceeded with a probability of 0.01, we find that the GTS a priori analysis indicates that injecting 1 m3 at 10–30 m distance may already exceed this level. Refining the analysis using underground laboratory experience, the injection volume may be much larger. In the case of the BULGG update 2, the threshold is not even reached for volumes up to 3000 m3, regardless of distance. Thus, also for the critical Furka tunnel railway infrastructure, seismic hazard is very small for volumes up to 3000 m3. Again, the situation is different if the 90 % percentile instead of the median of all solutions is considered; even for the BULGG update 2, the threshold is already exceeded with 30 m3 injected at 100 m distance. The difference between the median and 90 % percentile maps is smaller for the BULGG M-zero analysis. At 100 m distance, 30 mm s−1 is not exceeded for volumes below 1000 m3 (90 % percentile) or larger volumes (median).
A similar strategy is presented in a map of the probability of exceeding PGV = 30 mm s−1 as a function of injection volume and distance (Fig. 14). In this map, the probability contours of 0.63, 0.1, 0.01 and 0.001 are shown.
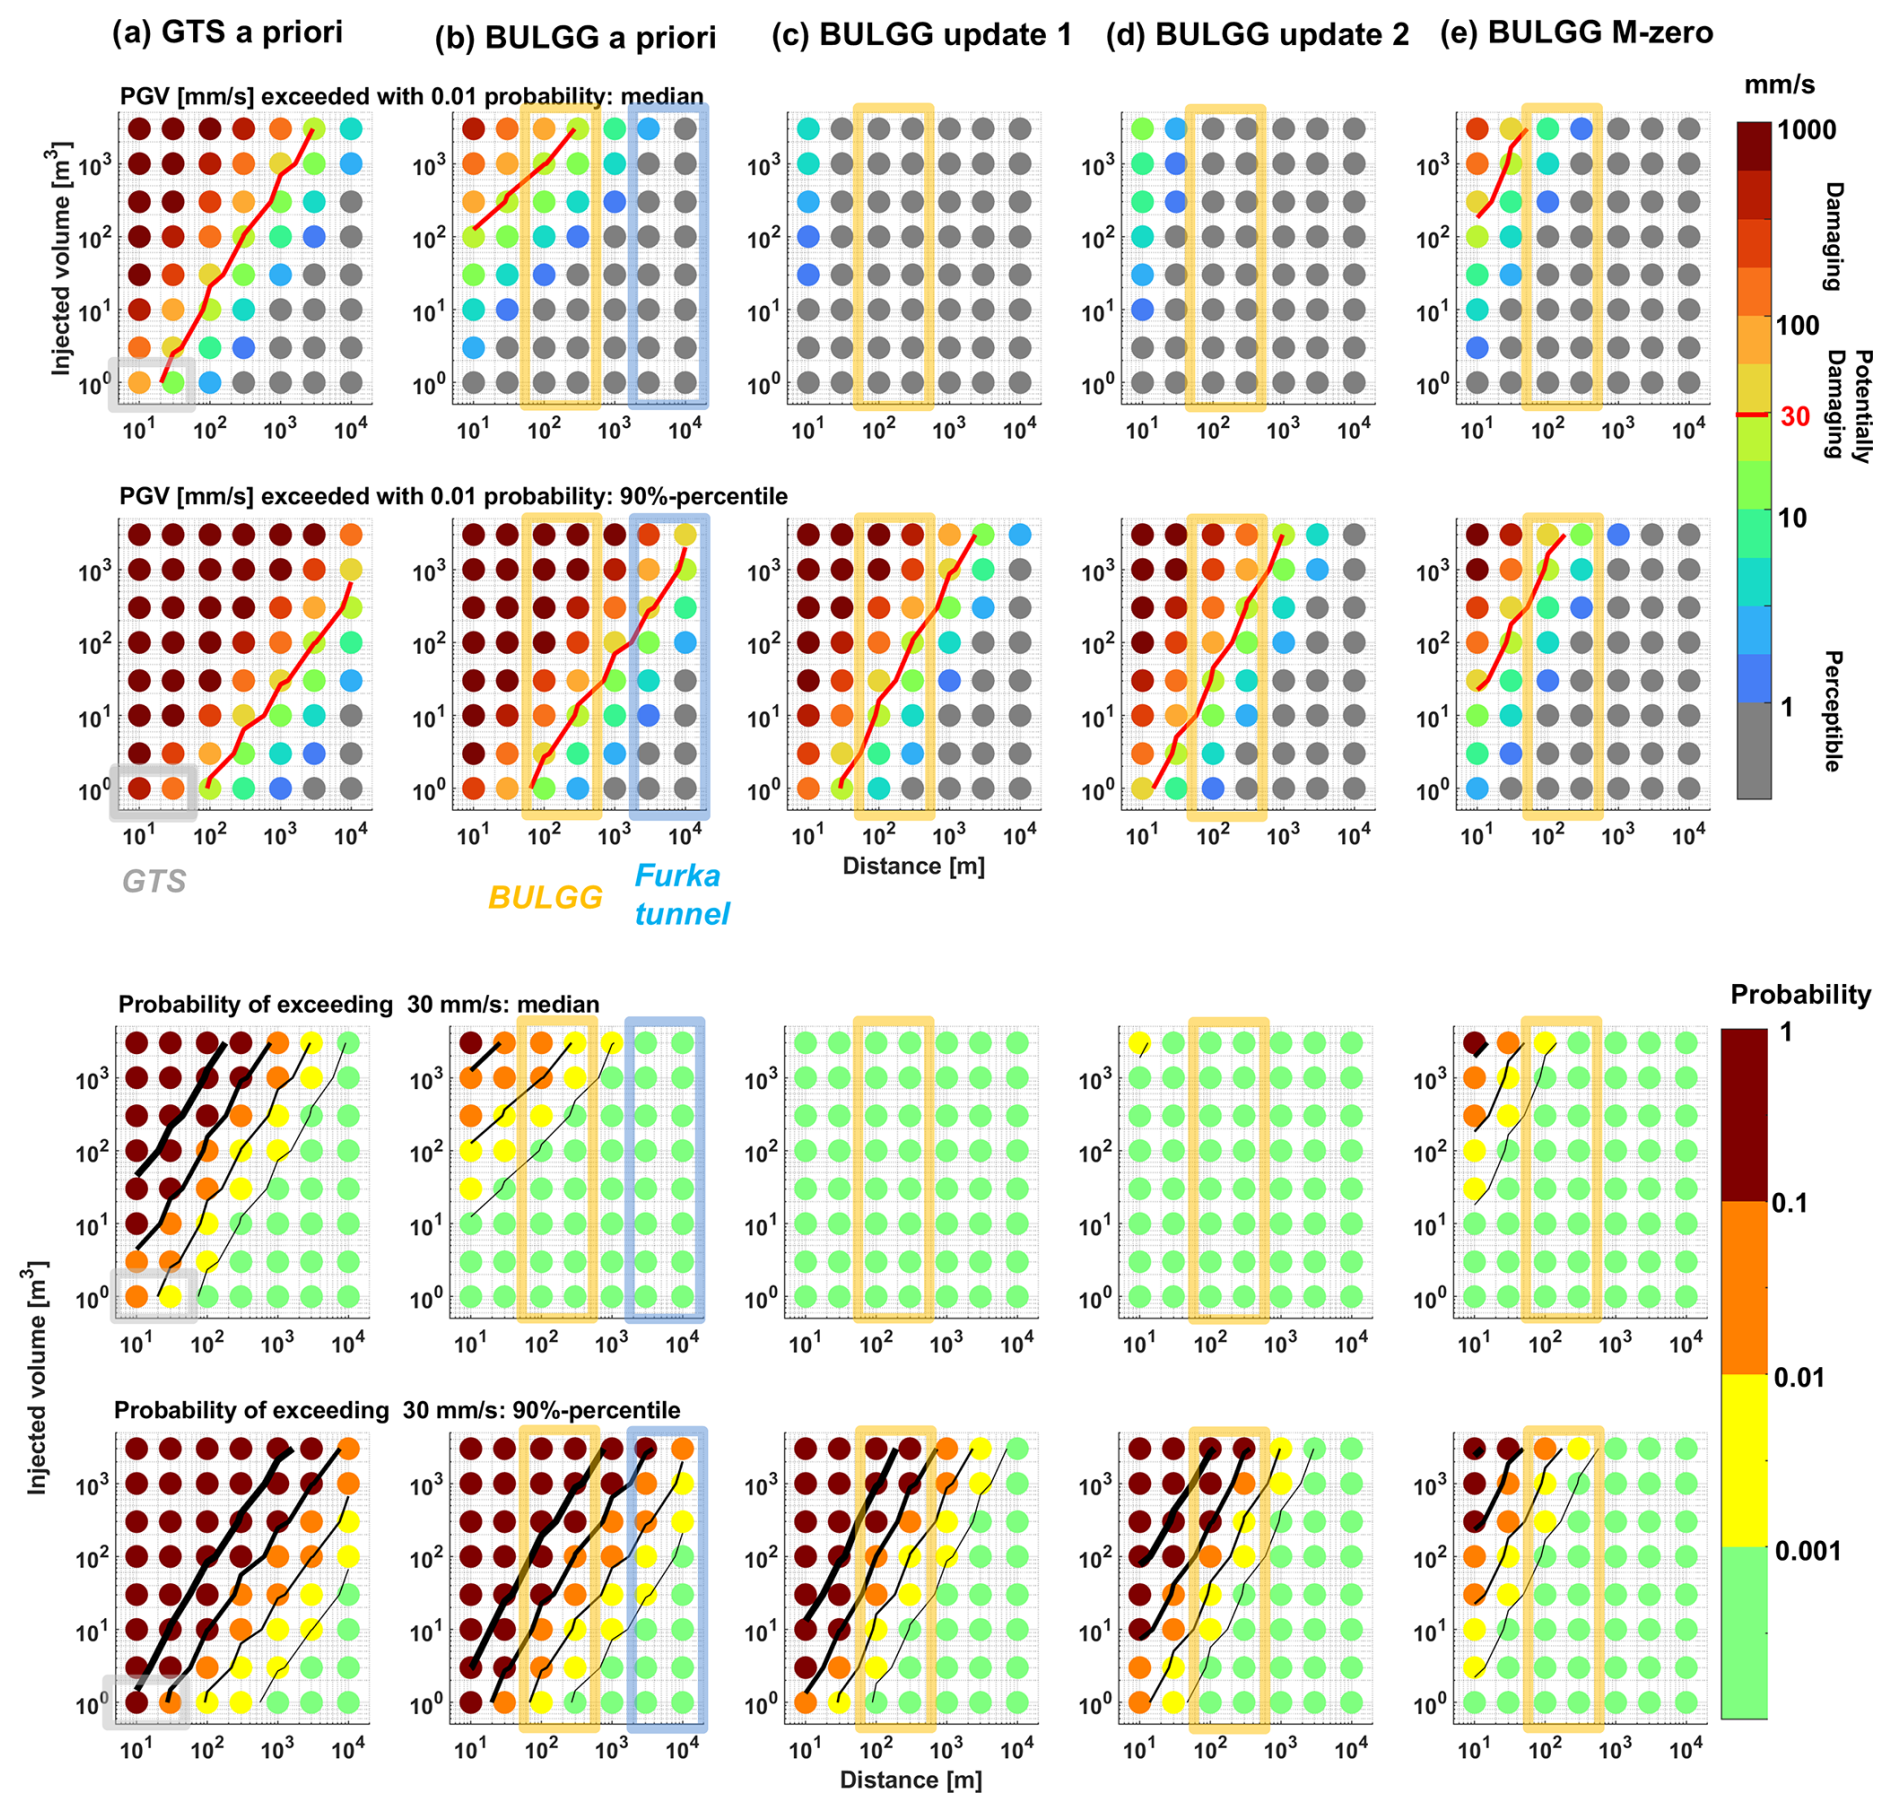
Figure 14Map of induced seismic hazard estimates as a function of distance and injection volume. Distances range from 10 to 10 000 m and volume from 1 to 3000 m3. (a) GTS a priori hazard computation, (b) the BULGG a priori, (c) the BULGG update 1 and (d) the BULGG update 2 hazard computation, (e) the BULGG M-zero update. In the columns of the figures the PGV exceeded with a probability of 0.01 based on the median and the 90 % percentile of the hazard estimate, as well the probability of exceeding 30 mm s−1 again based on the median and the 90 % percentile, is shown.
7.1 Sensitivities and uncertainties
Our seismic hazard computation for hydraulic stimulations in BULGG highlights the benefits of PISHA, which lies in the quantitative and transparent representation of the uncertainties by considering the experience of a wide range of induced seismicity cases. Additionally, the PISHA offers a framework that can flexibly be updated once more site-specific information becomes available. However, our PISHA also sheds light on the deficiency in our capability to predict induced seismic hazard, not only specifically for BULGG but also in general, i.e. also for full-scale geothermal projects. The wide spread of possible hazard estimates in Figs. 11 and 13 illustrates that drawing from parameter sets of worldwide induced seismicity datasets and from GMMs stemming from various contexts (mining, induced seismicity, etc.) does not produce converging hazard estimates but rather enlarges uncertainties. Note that this is in agreement with the PSHA of natural earthquakes, which exhibit a tendency of increasing hazard with consideration of more data and a successively improved representation of epistemic and aleatoric uncertainty (Bommer and Abrahamson, 2006; Gerstenberger et al., 2020).
The GMMs used before BULGG-specific observations of ground motions became available (Fig. 10a and b) predict possible PGV for a given magnitude that ranges over 2 orders of magnitude. The cause lies both in the epistemic uncertainty (here represented by using several possible GMMs) and in the aleatory uncertainty (represented by considering the inherent uncertainty in each GMM). Clearly, epistemic uncertainty is reduced by choosing GMMs based on local observations (Figs. 9, 10c and d); the massive uncertainty in the ground motion hazard curves of the BULGG a priori analysis (Fig. 13b) is reduced once the uncertainty in the GMMs reduces for the BULGG update 1 and 2 analyses (Fig. 13c and d). Thus, GMMs retrieved from local data would reduce uncertainty to some degree because the epistemic uncertainty is reduced. However, there is also an aleatory component to the uncertainties inherent to any ground motion estimate, which is related to source complexity (radiation pattern, stress drop, etc), to path effects and to effects close to the recording instrument. This source of uncertainty may produce an order-of-magnitude variability in the predicted PGV. Furthermore, the challenge in deriving local-scale GMMs for BULGG lies in covering a large range in terms of magnitude and distance, which may be addressed by combining induced seismicity data with data from active seismic experiments.
However, as the sequence of the PISHA studies in Fig. 11 shows, the primary uncertainty in the hazard computation lies in the range of seismogenic response represented primarily by the afb and b values. While the afb and b values of deep injections from typically larger volume injections cover a relatively small range (afb: −3.2 to 0.19; b: 0.65 to 1.58), the underground laboratory experiments cover a much larger range (afb: −10.5 to −1.6; b: 0.95 to 2.95). The challenge to integrate such variability in a probabilistic analysis comes down to assigning weights to the individual parameter sets, which must rely on expert judgement (Fig. 6). Adhering to the principles of PISHA, site-specific information may not replace but rather down-weight non-site-specific information. In the BULGG update 1 and 2, BULGG parameters receive 75 % weight, which makes them dominate the median hazard estimate. However, the weights have a strong impact on the median of the hazard estimates (Fig. 11f), but a much lesser impact on the 90 % percentile of the estimates. The enormous uncertainties in magnitude probabilities, which are even more pronounced for ground motion probabilities (Fig. 13f), only reduce once a limited range of seismogenic responses are considered (i.e. BULGG M-zero analysis).
In conclusion, we can state that uncertain afb and b values have by far the greatest impact on the uncertainties in the hazard computations. Uncertain GMMs are second in explaining the overall uncertainties. Mmax has a rather small impact in comparison, as has already been observed by Mignan et al. (2015).
7.2 Scale- and depth-dependent seismogenic response
The ranges of afb and b values in Fig. 7c and d raise the question of whether hazard computation across many orders of magnitude of injection volume is feasible, specifically if hazard estimates for underground laboratories from deep injections or vice versa are possible. Despite the limited amount of data in Fig. 7, there is a tendency for deep injections towards higher afb and lower b values, although the smaller-volume injections in underground laboratories overlap with this range but also contain low afb and high b values. Upscaling of underground laboratory experience may be limited because the smaller-volume injections access a more limited rock volume and sense a seismogenic response that is determined by local fracture network properties. In contrast, injecting larger volumes produces seismicity that is dominated by a stronger seismogenic response of the most critically stressed and most conductive fractures in the stimulated volume, which may otherwise be missed if smaller volumes are injected, and a more limited fracture network is accessed.
Additionally, lower stress levels at shallower depths of underground laboratories may also lead to more benign seismogenic responses. For tectonic earthquakes, a primary cause for variable b values is seen in the stress field (e.g. Petruccelli et al., 2019; Scholz, 2015). Typically, seismicity in the uppermost 3–4 km exhibits higher b values (e.g. Spada et al., 2013) than below and possibly lower a values as seismicity decreases towards shallow depths. Schorlemmer et al. (2005) and later Petruccelli et al. (2019) find that b values also depend on the stress regime, which might also be reflected in b values of induced seismic sequences. Scholz (2015), interpreting the depth dependence by Spada et al. (2013), suggested that b values depend on differential stress. Apart from the stress conditions, the frictional properties of faults influenced by their material and structural properties as well as their genesis (e.g. McClure and Horne, 2014) may additionally define the seismogenic response. Note, however, that not only variable b values, but also a breakdown of the Gutenberg–Richter distribution assuming constant b values has been observed for many cases (e.g. Villiger et al., 2020, 2021; Urban et al., 2016; Lee, 2019), which may be of mechanical origin. The importance of controlled underground experiments to shed light on these dependencies is highlighted by the fact that most studies on a and b values stem from tectonic earthquakes (i.e. greater depths and stress levels). The reason for more scatter and weaker seismogenic response in underground laboratory experiments deserves more investigation; if we understand the geological, hydromechanical or operational reasons for weaker seismogenic responses, this would open doors to safer stimulations in the deep underground.
However, the causes for the high b value and low afb values in Fig. 11 may not only be physical but could also be instrumental and thus apparent. Various studies on seismicity at magnitude levels much below Mw0.0 stress the difficulty of estimating reliable earthquake magnitudes (Kwiatek et al., 2011; Plenkers et al., 2022). The issue is also illustrated by the deviation between the moment magnitude Mw and local magnitude ML observed for magnitudes Mw < 2.0–3.0 (e.g. Bethmann et al., 2012). The deviation is associated with the relationship between source properties and attenuation properties and is held responsible for changing b values at different magnitude levels (Deichmann, 2017). Similarly, Wesseloo (2018) points out that the shape of the frequency–magnitude distribution (FMD) may be affected by the sensor bandwidth, with the FMD (i.e. apparent b value) becoming steeper if the sensor eigenfrequency cuts the spectrum above the corner frequencies at higher magnitudes. Thus, predicting seismicity with Mw > 0.0 from earthquake magnitude distributions of much smaller events requires source characterisation of these small earthquakes to be carefully considered and seismic attenuation at the relevant levels and the instrumental responses of sensors typically used at these levels to be taken into account. Again, underground laboratory experiments are the opportunity to overcome instrumental challenges and to eventually bridge the seismological scales (Gischig et al., 2020).
7.3 Traffic light system
While the median seismic hazard estimates represent the hazard level based on the wide range of possibilities, it is common practice to design engineering endeavours using the 90 % or 95 % percentile (or even the worst case) instead of the median (e.g. Cai and Kaiser, 2018). In our case, the BULGG update 2 gives clearance to any injection volumes (Fig. 14), but the 90 % percentile still indicates a chance of inducing a damaging event at 100 m distance. Although the median of the BULGG M-zero analysis is higher than for the BULGG update 2, the hazard represented by the 90 % percentile is lower and indicates that the chances for damaging events are very low even with high injection volumes of 3000 m3.
It is recommendable to incorporate both the median and 90 % percentile of the hazard curves in hazard-relevant decisions. By doing so, we acknowledge that induced seismicity can hold surprises (e.g. as the cases of Pohang and St. Gallen have shown) and that these have to be anticipated regardless of how thoroughly the hazard is estimated. The uncertainty in hazard estimates also highlights the importance of updating induced seismic hazard analysis as soon as site-specific information becomes available. This means not only between project phases (as done here) but preferably even in near-real time if a corresponding workflow in the framework of an adaptive traffic light system (ATLS) is in place (e.g. Király-Proag et al., 2018; Broccardo et al., 2019; Zhou et al., 2024; Ritz et al., 2024).
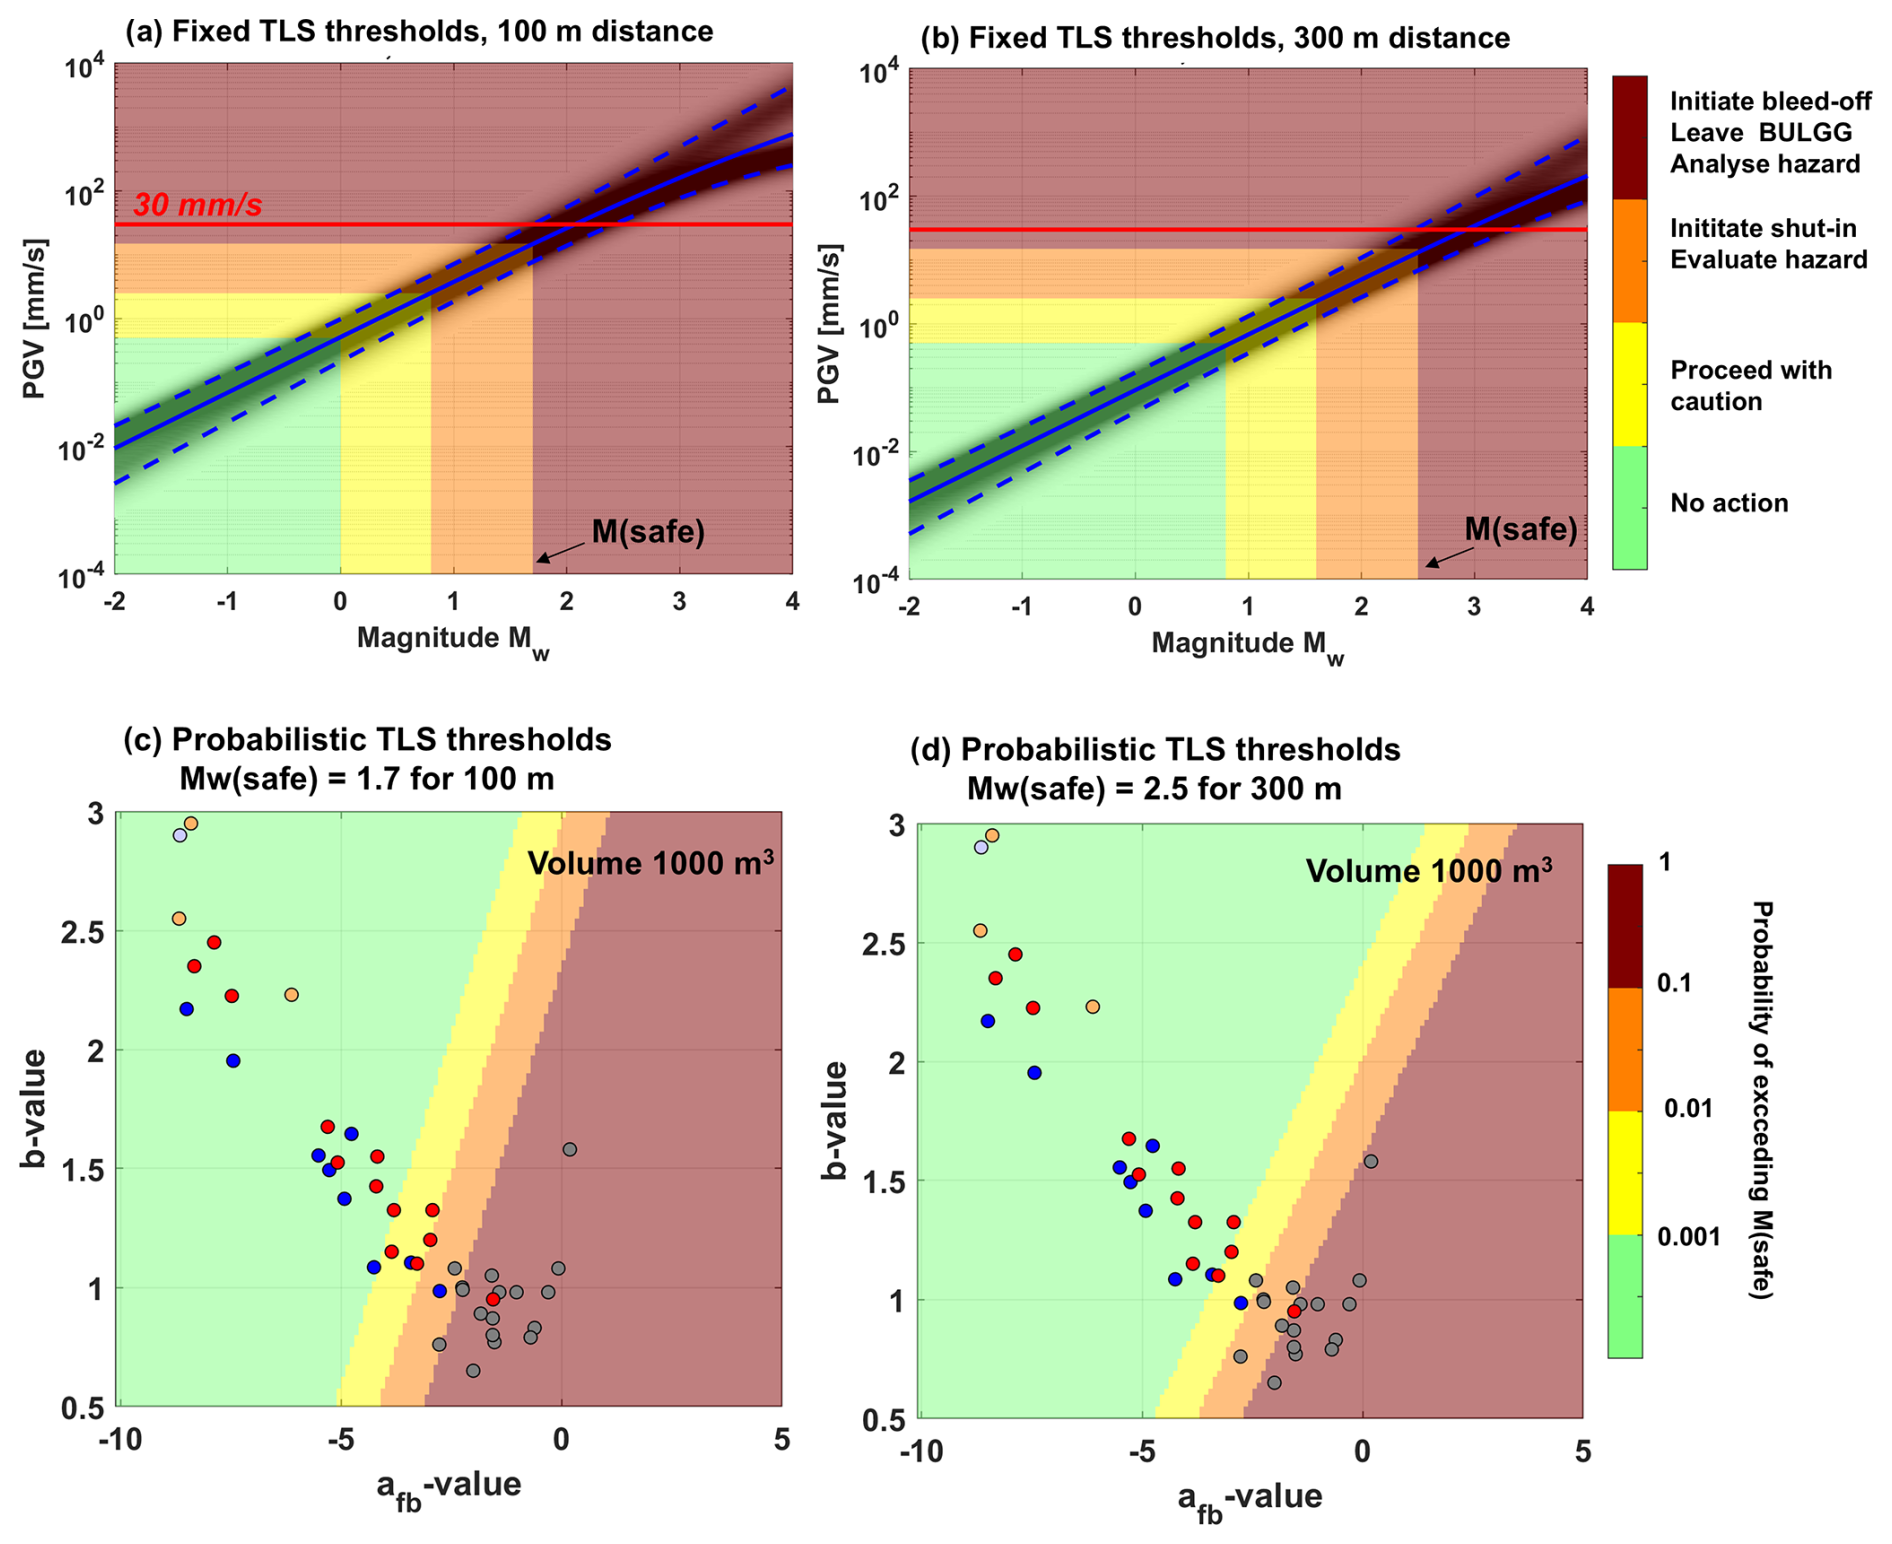
Figure 15(a, b) Fixed TLS thresholds shown with the GMMs at 100 and 300 m in the background. The blue lines are the median (solid) and the 10 % and 90 % percentiles (dashed). (c, d) Probabilistic TLS levels for 1000 m3 at a distance of 100 and 300 m. Colours indicate the probability of exceeding a predefined magnitude Mw (safe).
For hydraulic stimulation in the BULGG, a TLS with multiple layers is proposed (Fig. 15). The first layer consists of fixed thresholds in terms of PGV: green/yellow – 0.5 mm s−1; yellow/orange – 2.5 mm s−1; orange/red – 15 mm s−1. Note that the PGV of 15 mm s−1 still leaves a safety margin to the damaging threshold of 30 mm s−1. Using the GMMs in Fig. 10c and d, these translate into magnitude thresholds that depend on the distance of the hydraulic stimulation to the experiment cavern, which is the second TLS layer. At 100 m the corresponding thresholds are Mw 0.0, 0.8 and 1.7, and at 300 m they are Mw 0.8, 1.6 and 2.5 (Fig. 15a and b). These thresholds correspond to traditional TLSs reported in the literature (see Introduction). An alternative third layer (Fig. 15c and d) includes probabilistic thresholds similar to those proposed by Mignan et al. (2017). The concept relies on defining a threshold magnitude Mw(safe) that must not be exceeded. Here, we used the magnitudes at the orange/red threshold: Mw(safe) = 1.7 at 100 m and Mw(safe) = 2.5 at 300 m distance. Using a target injection volume of, for instance, 1000 m3, one can produce a map of the probability of exceeding Mw(safe) as a function of the afb and b values. The different traffic light colours correspond to the probability levels 0.001, 0.01 and 0.1. The probability map serves as the basis for an adaptive TLS, in which hazard can be evaluated as soon as the afb and b values of the induced seismic sequence are determined. This can be done during stimulations, provided that reliable magnitudes can be estimated (Mesimeri et al., 2025), or after different phases of the stimulation, for instance after a test stimulation with only a fraction of the target injection.
Here we propose a workflow for a probabilistic analysis of induced seismic hazard during hydraulic stimulations, which can be quickly updated as soon as new information becomes available. Resulting hazard estimates are presented in a series of diagnostic visualisations that support the design of hydraulic stimulations and the mitigation strategies for induced seismic hazard. For the ongoing stimulation experiments at the BULGG, our hazard computations show that injections of 100 m3 at distances of 100 to 300 m from the experimental cavern are acceptable, with a probability of exceeding a PGV of 30 mm s−1 being P(PGV > 30 mm s−1) < 0.001. The sequence of hazard computations, which include more site-specific information on the seismogenic response at the BULGG in a stepwise manner, also highlights the sensitivities of the hazard computation on the seismogenic response parameters and ground motion prediction equations. The range of possible seismogenic responses (expressed by afb and b values) documented for worldwide case studies seem to cover a different range to underground laboratory experiments at shallower depths. Together with uncertainties in GMMs, if they are not calibrated at the site, they produce an enormous spread of possible hazard estimates. This illustrates the importance of collecting site-specific data on both the seismogenic response and GMMs. Additionally, the weighting of different parameter sets regarding their relevance to our specific BULGG experiments results in additional uncertainty in the hazard estimates, highlighting that a more profound seismo-hydromechanical understanding is required for assessing induced seismic hazard a priori. Currently, uncertainties can only be addressed by re-evaluating the hazard at different project stages and by accompanying the stimulations themselves with a hazard mitigation scheme (e.g. a traffic lights system) that allows induced seismic surprises to be anticipated and appropriately acted upon. Ideally, the scheme adapts the concept of an ATLS that allows the processing of incoming new seismicity data as a basis of hazard computation in near-real time.
The stimulation experiments in underground laboratories (GTS, BULGG, Aspö, etc) indicate that the seismogenic response at depths of 500–1000 m may be substantially weaker compared to injections at depths of several kilometres. While this may question the transferability of underground laboratory research to full-scale operations, it also holds promise that if we understand the underlying cause of the weaker seismogenic response, it may lead the way to safer exploitation of geoenergy resources. In any case, underground laboratory experiments are a safe way to perform reservoir geomechanics research from a seismic hazard perspective.
Table A1Collection of model parameters for a range of different case studies. From 1 Mignan et al. (2017), re-estimated for this study; 2 Dinske and Shapiro (2013); 3 Király et al. (2014), re-estimated for this study; 4 Albaric et al. (2014); 5 Villiger et al. (2020); 6 Kwiatek et al. (2018); and 7 Broccardo et al. (2020). All others estimated for this study.
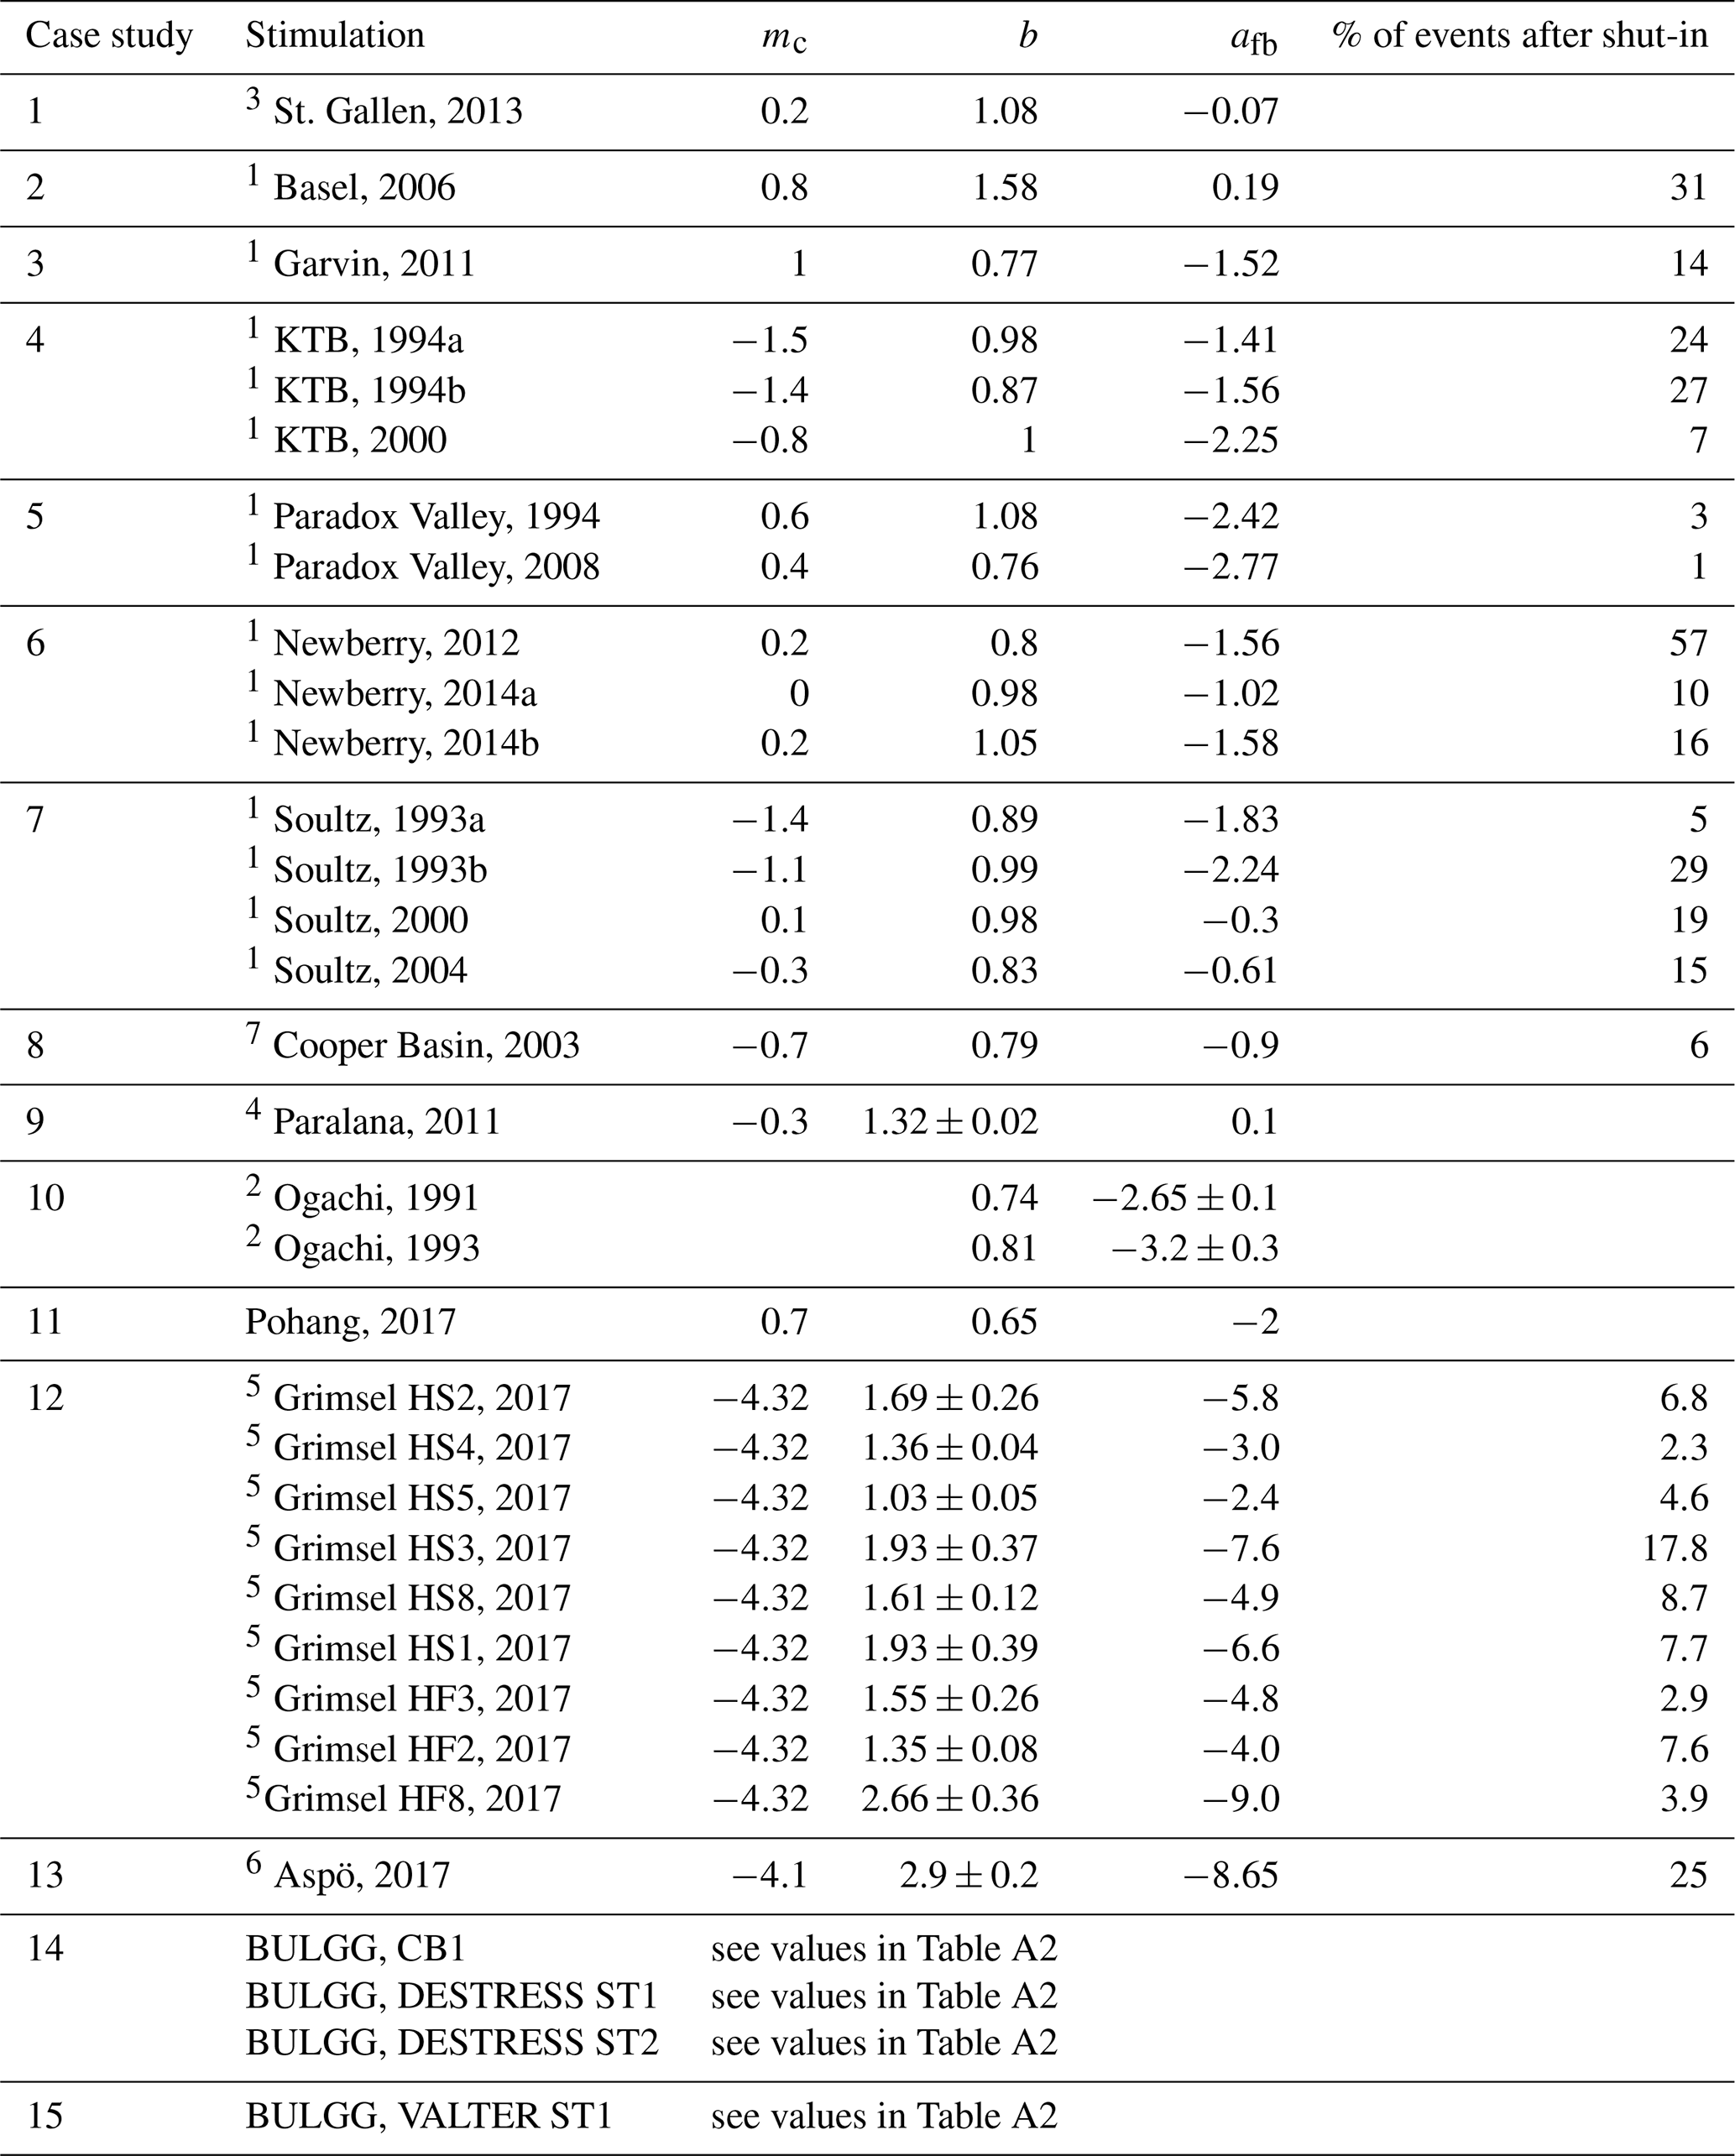
Table A2Summary of seismicity characteristics of all hydraulic stimulations in BULGG. a Volume refers to the volume that was injected into the fracture network, which is less than the total injected volume in the event that a bypassb along the packers has been identified. Details of the different stimulation procedures and projects can be found in the final report of VALTER1 (Giardini et al., 2022) and ZoDrEx2 (Meier and Christe, 2023) as well as and in Obermann et al. (2024)3.
Data derived from the seismic catalogues recorded at the BULGG are given in the Appendix. The seismicity catalogues and hydraulic data of the hydraulic stimulations of the VALTER project have been published by Rosskopf et al. (2024b) and are available under https://doi.org/10.3929/ethz-b-000658218. Seismicity catalogues along with hydraulic data of the hydraulic stimulation of the DESTRESS and ZoDrEx projects can be retrieved from https://doi.org/10.3929/ethz-c-000782806.
VSG, APR and SW conceptualised the study. VSG and APR performed the analysis and wrote the paper. MB, FC and AM contributed to the analysis, the parameters of case studies and the methodology. AA, FB, PM, RC, DK, FS and MH performed the DESTRESS and ZoDrEx experiments and contributed the seismic catalogues and hydraulic data. MH and RB enabled experimental work in the BULGG. KB, XM, VCR, NGD, VD, PK, KP, LV, QW, AZ, AO, MM, MR, AS, APR and MH contributed to instrumentation of the experiments, conceptualised and performed the hydraulic stimulations, analysed hydraulic data, and prepared seismic catalogues. PAS MAM, AO, MM, KB, LV, VSG and APR contributed to planning of the FEAR experiments. JA, HM, DG and SW supervised the projects.
The contact author has declared that none of the authors has any competing interests.
Publisher's note: Copernicus Publications remains neutral with regard to jurisdictional claims made in the text, published maps, institutional affiliations, or any other geographical representation in this paper. While Copernicus Publications makes every effort to include appropriate place names, the final responsibility lies with the authors.
In the “Bedretto Underground Laboratory for Geosciences and Geoenergies”, ETH Zürich studies in close collaboration with national and international partners techniques and procedures for a safe, efficient and sustainable use of geothermal heat and questions related to earthquake physics. The BedrettoLab is financed by the Werner Siemens Foundation, ETH Zürich and the Swiss National Science Foundation (SNSF). The research in this publication was conducted within the P&D BFE project VALTER (SI/501496-01), the EU project DESTRESS (691728), the Swiss part of the GEOTHERMICA project ZoDrEx (SI/501720), the SNSF multi-PhD project 200021_192151 and the ERC Synergy FEAR 856559. The BedrettoLab would like to thank Matterhorn Gotthard Bahn for providing access to the tunnel.
This research has been supported by the Schweizerischer Nationalfonds zur Förderung der Wissenschaftlichen Forschung, nccr – on the move (grant no. 200021_192151); the European Research Council; HORIZON EUROPE European Research Council (grant no. 856559); and the Bundesamt für Energie (grant nos. SI/501496-01 and SI/501720).
This paper was edited by CharLotte Krawczyk and reviewed by P. Martin Mai and Mauro Cacace.
Ader, T., Chendorain, M., Free, M., Saarno, T., Heikkinen, P., Malin, P. E., Leary, P., Kwiatek, G., Dresen, G., Bluemle, F., and Vuorinen, T.: Design and implementation of a traffic light system for deep geothermal well stimulation in Finland, J. Seismol., 24, 991–1014, https://doi.org/10.1007/s10950-019-09853-y, 2020.
Albaric, J., Oye, V., Langet, N., Hasting, M., Lecomte, I., Iranpour, K., Messeiller, M., and Reid, P.: Monitoring of induced seismicity during the first geothermal reservoir stimulation at Paralana, Australia, Geothermics, 52, 120–131, https://doi.org/10.1016/j.geothermics.2013.10.013, 2014.
Amann, F., Gischig, V., Evans, K., Doetsch, J., Jalali, R., Valley, B., Krietsch, H., Dutler, N., Villiger, L., Brixel, B., Klepikova, M., Kittilä, A., Madonna, C., Wiemer, S., Saar, M. O., Loew, S., Driesner, T., Maurer, H., and Giardini, D.: The seismo-hydromechanical behavior during deep geothermal reservoir stimulations: open questions tackled in a decameter-scale in situ stimulation experiment, Solid Earth, 9, 115–137, https://doi.org/10.5194/se-9-115-2018, 2018.
Atkinson, G. M., Eaton, D. W., Ghofrani, H., Walker, D., Cheadle, B., Schultz, R., Shcherbakov, R., Tiampo, K., Gu, J., Harrington, R. M., Liu, Y., Van Der Baan, M., and Kao, H.: Hydraulic Fracturing and Seismicity in the Western Canada Sedimentary Basin, Seismol. Res. Lett., 87, 631–647, https://doi.org/10.1785/0220150263, 2016.
Baisch, S., Carbon, D., Dannwolf, U., Delacou, B., Devaux, M., Dunand, F., Jung, R., Koller, M., Martin, C., Sartori, M., Secanell, R., and Vörös, R.: Deep Heat Mining Basel – Seismic Risk Analysis, SERIANEX Study Prepared for the Departement für Wirtschaft, Soziales und Umwelt des Kantons Basel-Stadt, Amt für Umwelt und Energie, https://www.wsu.bs.ch/dossiers/abgeschlossene-dossiers/geothermie.html (last access: July 2025), 2009.
Baisch, S., Koch, C., and Muntendam-Bos, A.: Traffic Light Systems: To What Extent Can Induced Seismicity Be Controlled?, Seismol. Res. Lett., 90, 1145–1154, https://doi.org/10.1785/0220180337, 2019.
Bethmann, F., Deichmann, N., and Mai, P. M.: Seismic wave attenuation from borehole and surface records in the top 2.5 km beneath the city of Basel, Switzerland: Seismic wave attenuation in thick sediments, Geophys. J. Int., 190, 1257–1270, https://doi.org/10.1111/j.1365-246X.2012.05555.x, 2012.
Boese, C. M., Kwiatek, G., Fischer, T., Plenkers, K., Starke, J., Blümle, F., Janssen, C., and Dresen, G.: Seismic monitoring of the STIMTEC hydraulic stimulation experiment in anisotropic metamorphic gneiss, Solid Earth, 13, 323–346, https://doi.org/10.5194/se-13-323-2022, 2022.
Bommer, J. J. and Abrahamson, N. A.: Why Do Modern Probabilistic Seismic-Hazard Analyses Often Lead to Increased Hazard Estimates?, B. Seismol. Soc. Am., 96, 1967–1977, https://doi.org/10.1785/0120060043, 2006.
Bommer, J. J. and Verdon, J. P.: The maximum magnitude of natural and induced earthquakes, Geomech. Geophys. Geo-Energy Geo-Resour., 10, 172, https://doi.org/10.1007/s40948-024-00895-2, 2024.
Bommer, J. J., Oates, S., Cepeda, J. M., Lindholm, C., Bird, J., Torres, R., Marroquín, G., and Rivas, J.: Control of hazard due to seismicity induced by a hot fractured rock geothermal project, Eng. Geol., 83, 287–306, https://doi.org/10.1016/j.enggeo.2005.11.002, 2006.
Bommer, J. J., Crowley, H., and Pinho, R.: A risk-mitigation approach to the management of induced seismicity, J. Seismol., 19, 623–646, https://doi.org/10.1007/s10950-015-9478-z, 2015.
Bosman, K., Baig, A., Viegas, G., and Urbancic, T.: Towards an improved understanding of induced seismicity associated with hydraulic fracturing, First Break, 34, https://doi.org/10.3997/1365-2397.34.7.86051, 2016.
Broccardo, M., Mignan, A., Grigoli, F., Karvounis, D., Rinaldi, A. P., Danciu, L., Hofmann, H., Milkereit, C., Dahm, T., Zimmermann, G., Hjörleifsdóttir, V., and Wiemer, S.: Induced seismicity risk analysis of the hydraulic stimulation of a geothermal well on Geldinganes, Iceland, Nat. Hazards Earth Syst. Sci., 20, 1573–1593, https://doi.org/10.5194/nhess-20-1573-2020, 2020.
Bröker, K. and Ma, X.: Estimating the Least Principal Stress in a Granitic Rock Mass: Systematic Mini-Frac Tests and Elaborated Pressure Transient Analysis, Rock Mech. Rock Eng., 55, 1931–1954, https://doi.org/10.1007/s00603-021-02743-1, 2022.
Bröker, K., Ma, X., Zhang, S., Gholizadeh Doonechaly, N., Hertrich, M., Klee, G., Greenwood, A., Caspari, E., and Giardini, D.: Constraining the stress field and its variability at the BedrettoLab: Elaborated hydraulic fracture trace analysis, Int. J. Rock Mech. Min. Sci., 178, 105739, https://doi.org/10.1016/j.ijrmms.2024.105739, 2024a.
Bröker, K., Ma, X., Gholizadeh Doonechaly, N., Rosskopf, M., Obermann, A., Rinaldi, A. P., Hertrich, M., Serbeto, F., Maurer, H., Wiemer, S., and Giardini, D.: Hydromechanical characterization of a fractured crystalline rock volume during multi-stage hydraulic stimulations at the BedrettoLab, Geothermics, 124, 103126, https://doi.org/10.1016/j.geothermics.2024.103126, 2024b.
Buijze, L., Van Bijsterveldt, L., Cremer, H., Paap, B., Veldkamp, H., Wassing, B. B. T., Van Wees, J.-D., Van Yperen, G. C. N., Ter Heege, J. H., and Jaarsma, B.: Review of induced seismicity in geothermal systems worldwide and implications for geothermal systems in the Netherlands, Neth. J. Geosci., 98, e13, https://doi.org/10.1017/njg.2019.6, 2019.
Butler, A. G. and van Aswegen, G.: Ground velocity relationships based on a large sample of underground measurements in two South African mining regions, Rockbursts and Seismicity in Mines, edited by: Young, R. P., ISBN 90 54103205, 1993.
Cai, M. and Kaiser, P. K.: Rockburst support reference book—volume I: rockburst phenomenon and support characteristics, Laurentian University, 284, ISBN 978-0-88667-096-2, 2018.
Ceccato, A., Behr, W. M., Zappone, A. S., Tavazzani, L., and Giuliani, A.: Structural Evolution, Exhumation Rates, and Rheology of the European Crust During Alpine Collision: Constraints From the Rotondo Granite – Gotthard Nappe, Tectonics, 43, e2023TC008219, https://doi.org/10.1029/2023TC008219, 2024.
Ciardo, F. and Rinaldi, A. P.: Impact of injection rate ramp-up on nucleation and arrest of dynamic fault slip, Geomech. Geophys. Geo-Energy Geo-Resour., 8, 28, https://doi.org/10.1007/s40948-021-00336-4, 2022.
Clarke, H., Verdon, J. P., Kettlety, T., Baird, A. F., and Kendall, J.: Real-Time Imaging, Forecasting, and Management of Human-Induced Seismicity at Preston New Road, Lancashire, England, Seismol. Res. Lett., https://doi.org/10.1785/0220190110, 2019.
Cocco, M., Tinti, E., and Cirella, A.: On the scale dependence of earthquake stress drop, J. Seismol., 20, 1151–1170, https://doi.org/10.1007/s10950-016-9594-4, 2016.
Cornell, C. A.: Engineering seismic risk analysis, B. Seismol. Soc. Am., 58, 1583–1606, https://doi.org/10.1785/BSSA0580051583, 1968.
Cremen, G. and Werner, M. J.: A novel approach to assessing nuisance risk from seismicity induced by UK shale gas development, with implications for future policy design, Nat. Hazards Earth Syst. Sci., 20, 2701–2719, https://doi.org/10.5194/nhess-20-2701-2020, 2020.
Deichmann, N.: Theoretical Basis for the Observed Break in ML / Mw Scaling between Small and Large Earthquakes, Bull. Seismol. Soc. Am., 107, 505–520, https://doi.org/10.1785/0120160318, 2017.
Diehl, T., Kraft, T., Kissling, E., and Wiemer, S.: The induced earthquake sequence related to the St. Gallen deep geothermal project (Switzerland): Fault reactivation and fluid interactions imaged by microseismicity, J. Geophys. Res.-Sol. Ea., 122, 7272–7290, https://doi.org/10.1002/2017JB014473, 2017.
Dinske, C. and Shapiro, S. A.: Seismotectonic state of reservoirs inferred from magnitude distributions of fluid-induced seismicity, J. Seismol., 17, 13–25, https://doi.org/10.1007/s10950-012-9292-9, 2013.
Douglas, J., Edwards, B., Convertito, V., Sharma, N., Tramelli, A., Kraaijpoel, D., Cabrera, B. M., Maercklin, N., and Troise, C.: Predicting Ground Motion from Induced Earthquakes in Geothermal Areas, B. Seismol. Soc. Am., 103, 1875–1897, https://doi.org/10.1785/0120120197, 2013.
Eaton, D. W. and Igonin, N.: What controls the maximum magnitude of injection-induced earthquakes?, Lead. Edge, 37, 135–140, https://doi.org/10.1190/tle37020135.1, 2018.
Edwards, B., Kraft, T., Cauzzi, C., Kastli, P., and Wiemer, S.: Seismic monitoring and analysis of deep geothermal projects in St Gallen and Basel, Switzerland, Geophys. J. Int., 201, 1022–1039, https://doi.org/10.1093/gji/ggv059, 2015.
EGI at the University of Utah: Utah FORGE Induced Seismicity Mitigation Plan, Report prepared for US Department of Energy, https://gdr.openei.org/submissions/1319 (last access: August 2024), 2020.
Ellsworth, W. L.: Injection-Induced Earthquakes, Science, 341, 1225942, https://doi.org/10.1126/science.1225942, 2013.
Galis, M., Ampuero, J. P., Mai, P. M., and Cappa, F.: Induced seismicity provides insight into why earthquake ruptures stop, Sci. Adv., 3, eaap7528, https://doi.org/10.1126/sciadv.aap7528, 2017.
Garagash, D. I. and Germanovich, L. N.: Nucleation and arrest of dynamic slip on a pressurized fault, J. Geophys. Res.-Sol. Ea., 117, 2012JB009209, https://doi.org/10.1029/2012JB009209, 2012.
Gerstenberger, M. C., Marzocchi, W., Allen, T., Pagani, M., Adams, J., Danciu, L., Field, E. H., Fujiwara, H., Luco, N., Ma, K.-F., Meletti, C., and Petersen, M. D.: Probabilistic Seismic Hazard Analysis at Regional and National Scales: State of the Art and Future Challenges, Rev. Geophys., 58, e2019RG000653, https://doi.org/10.1029/2019RG000653, 2020.
Gholizadeh Doonechaly, N., Reinicke, A., Hertrich, M., Plenkers, K., Obermann, A., Fischli, F., Maurer, H., Wiemer, S., and Giardini, D.: Multiphysics monitoring of cementation operation: implications for wellbore integrity and hydrogeological characterization, Environ. Earth Sci., 83, 146, https://doi.org/10.1007/s12665-024-11451-2, 2024.
Giardini, D., Wiemer, S., Maurer, H., Hertrich, M., Meier, P., Alcolea, A., Castilla, R., and Hochreutener, R.: Validation of Technologies for reservoir engineering (VALTER), ETH Zurich, https://doi.org/10.3929/ETHZ-B-000644092, 2022.
Gischig, V., Jalali, R., Amann, F., Krietsch, H., Klepikova, M., Esposito, S., Broccardo, M., Obermann, A., Mignan, A., Doetsch, J., and Madonna, C.: Impact of the ISC Experiment at the Grimsel Test Site – Assessment of Potential Seismic Hazard and Disturbances to Nearby Experiments and KWO Infrastructure, ETH Zurich, https://doi.org/10.3929/ETHZ-B-000189973, 2016.
Gischig, V., Bethmann, F., Hertrich, M., Wiemer, S., Mignan, A., Broccardo, M., Villiger, L., Obermann, A., and Diehl, T.: Induced seismic hazard and risk analysis of hydraulic stimulation experiments at the Bedretto Underground Laboratory for Geosciences and Geoenergies (BULGG), ETH Zurich, https://doi.org/10.3929/ETHZ-B-000384348, 2019.
Gischig, V. S.: Rupture propagation behavior and the largest possible earthquake induced by fluid injection into deep reservoirs, Geophys. Res. Lett., 42, 7420–7428, https://doi.org/10.1002/2015GL065072, 2015.
Gischig, V. S., Giardini, D., Amann, F., Hertrich, M., Krietsch, H., Loew, S., Maurer, H., Villiger, L., Wiemer, S., Bethmann, F., Brixel, B., Doetsch, J., Doonechaly, N. G., Driesner, T., Dutler, N., Evans, K. F., Jalali, M., Jordan, D., Kittilä, A., Ma, X., Meier, P., Nejati, M., Obermann, A., Plenkers, K., Saar, M. O., Shakas, A., and Valley, B.: Hydraulic stimulation and fluid circulation experiments in underground laboratories: Stepping up the scale towards engineered geothermal systems, Geomech. Energy Environ., 24, 100175, https://doi.org/10.1016/j.gete.2019.100175, 2020.
Grigoli, F., Cesca, S., Priolo, E., Rinaldi, A. P., Clinton, J. F., Stabile, T. A., Dost, B., Fernandez, M. G., Wiemer, S., and Dahm, T.: Current challenges in monitoring, discrimination, and management of induced seismicity related to underground industrial activities: A European perspective, Rev. Geophys., 55, 310–340, https://doi.org/10.1002/2016RG000542, 2017.
Häring, M. O., Schanz, U., Ladner, F., and Dyer, B. C.: Characterisation of the Basel 1 enhanced geothermal system, Geothermics, 37, 469–495, https://doi.org/10.1016/j.geothermics.2008.06.002, 2008.
Hedley, D. G. F.: Peak particle velocity for rockbursts in some Ontario mines, Rockbursts and seismicity in mines, Balkema, Rotterdam, 345–348, ISBN 9061911451, 1990.
Hofmann, H., Zimmermann, G., Zang, A., and Min, K.-B.: Cyclic soft stimulation (CSS): a new fluid injection protocol and traffic light system to mitigate seismic risks of hydraulic stimulation treatments, Geotherm. Energy, 6, 27, https://doi.org/10.1186/s40517-018-0114-3, 2018.
IEAGHG: Current State of Knowledge Regarding the Risk of Induced Seismicity at CO2 Storage Projects: 2022-02, https://ieaghg.org/publications/current-state-of-knowledge-regarding-the-risk-of-induced-seismicity-at-co2-storage-projects/, January 2022.
Kastrup, U., Zoback, M. L., Deichmann, N., Evans, K. F., Giardini, D., and Michael, A. J.: Stress field variations in the Swiss Alps and the northern Alpine foreland derived from inversion of fault plane solutions, J. Geophys. Res.-Sol. Ea., 109, 2003JB002550, https://doi.org/10.1029/2003JB002550, 2004.
Kettlety, T., Verdon, J. P., Butcher, A., Hampson, M., and Craddock, L.: High-Resolution Imaging of the ML 2.9 August 2019 Earthquake in Lancashire, United Kingdom, Induced by Hydraulic Fracturing during Preston New Road PNR-2 Operations, Seismol. Res. Lett., 92, 151–169, https://doi.org/10.1785/0220200187, 2021.
Király, E., Gischig, V., Karvounis, D., and Wiemer, S.: Validating models to forecasting induced seismicity related to deep geothermal energy projects, in: Proceedings of 39th Workshop on Geothermal Reservoir Engineering, SGP-TR-202, https://pangea.stanford.edu/ERE/pdf/IGAstandard/SGW/2014/Kiraly.pdf, 2014.
Király-Proag, E., Zechar, J. D., Gischig, V., Wiemer, S., Karvounis, D., and Doetsch, J.: Validating induced seismicity forecast models – Induced Seismicity Test Bench, J. Geophys. Res.-Sol. Ea., 121, 6009–6029, https://doi.org/10.1002/2016JB013236, 2016.
Király-Proag, E., Gischig, V., Zechar, J. D., and Wiemer, S.: Multicomponent ensemble models to forecast induced seismicity, Geophys. J. Int., 212, 476–490, https://doi.org/10.1093/gji/ggx393, 2018.
Kivi, I. R., Boyet, A., Wu, H., Walter, L., Hanson-Hedgecock, S., Parisio, F., and Vilarrasa, V.: Global physics-based database of injection-induced seismicity, Earth Syst. Sci. Data, 15, 3163–3182, https://doi.org/10.5194/essd-15-3163-2023, 2023.
Kneafsey, T., Dobson, P., Blankenship, D., Schwering, P., White, M., Morris, J. P., Huang, L., Johnson, T., Burghardt, J., Mattson, E., Neupane, G., Strickland, C., Knox, H., Vermuel, V., Ajo-Franklin, J., Fu, P., Roggenthen, W., Doe, T., Schoenball, M., Hopp, C., Tribaldos, V. R., Ingraham, M., Guglielmi, Y., Ulrich, C., Wood, T., Frash, L., Pyatina, T., Vandine, G., Smith, M., Horne, R., McClure, M., Singh, A., Weers, J., and Robertson, M.: The EGS Collab project: Outcomes and lessons learned from hydraulic fracture stimulations in crystalline rock at 1.25 and 1.5 km depth, Geothermics, 126, 103178, https://doi.org/10.1016/j.geothermics.2024.103178, 2025.
Kraft, T., Roth, P., Ritz, V., Antunes, V., Toledo Zambrano, T. A., and Wiemer, S.: Good-Practice Guide for Managing Induced Seismicity in Deep Geothermal Energy Projects in Switzerland, ETH Zurich, https://doi.org/10.3929/ETHZ-B-000714220, 2025.
Krietsch, H., Gischig, V. S., Doetsch, J., Evans, K. F., Villiger, L., Jalali, M., Valley, B., Löw, S., and Amann, F.: Hydromechanical processes and their influence on the stimulation effected volume: observations from a decameter-scale hydraulic stimulation project, Solid Earth, 11, 1699–1729, https://doi.org/10.5194/se-11-1699-2020, 2020.
Kwiatek, G., Plenkers, K., Dresen, G., and JAGUARS Research Group: Source Parameters of Picoseismicity Recorded at Mponeng Deep Gold Mine, South Africa: Implications for Scaling Relations, B. Seismol. Soc. Am., 101, 2592–2608, https://doi.org/10.1785/0120110094, 2011.
Kwiatek, G., Martínez-Garzón, P., Plenkers, K., Leonhardt, M., Zang, A., Von Specht, S., Dresen, G., and Bohnhoff, M.: Insights Into Complex Subdecimeter Fracturing Processes Occurring During a Water Injection Experiment at Depth in Äspö Hard Rock Laboratory, Sweden, J. Geophys. Res.-Sol. Ea., 123, 6616–6635, https://doi.org/10.1029/2017JB014715, 2018.
Lasocki, S. and Orlecka-Sikora, B.: Seismic hazard assessment under complex source size distribution of mining-induced seismicity, Tectonophysics, 456, 28–37, https://doi.org/10.1016/j.tecto.2006.08.013, 2008.
Lee, K.-K.: Summary Report of Korean Goverment Commission on Relations between the 2017 Pohang Earthquake EGS Project, The Geological Society of Korea, https://doi.org/10.22719/KETEP-20183010111860, 2019.
Lützenkirchen, V. and Loew, S.: Late Alpine brittle faulting in the Rotondo granite (Switzerland): deformation mechanisms and fault evolution, Swiss J. Geosci., 104, 31–54, https://doi.org/10.1007/s00015-010-0050-0, 2011.
Lützenkirchen, V. H.: Structural geology and hydrogeology of brittle fault zones in the central and eastern Gotthard massif, Switzerland, ETH Zurich, https://doi.org/10.3929/ETHZ-A-004522949, 2002.
Ma, X., Hertrich, M., Amann, F., Bröker, K., Gholizadeh Doonechaly, N., Gischig, V., Hochreutener, R., Kästli, P., Krietsch, H., Marti, M., Nägeli, B., Nejati, M., Obermann, A., Plenkers, K., Rinaldi, A. P., Shakas, A., Villiger, L., Wenning, Q., Zappone, A., Bethmann, F., Castilla, R., Seberto, F., Meier, P., Driesner, T., Loew, S., Maurer, H., Saar, M. O., Wiemer, S., and Giardini, D.: Multi-disciplinary characterizations of the BedrettoLab – a new underground geoscience research facility, Solid Earth, 13, 301–322, https://doi.org/10.5194/se-13-301-2022, 2022.
McClure, M. W. and Horne, R. N.: Investigation of injection-induced seismicity using a coupled fluid flow and rate/state friction model, Geophysics, 76, WC181–WC198, https://doi.org/10.1190/geo2011-0064.1, 2011.
McClure, M. W. and Horne, R. N.: Correlations between formation properties and induced seismicity during high pressure injection into granitic rock, Eng. Geol., 175, 74–80, https://doi.org/10.1016/j.enggeo.2014.03.015, 2014.
McGarr, A.: Scaling of ground motion parameters, state of stress, and focal depth, J. Geophys. Res. Solid Earth, 89, 6969–6979, https://doi.org/10.1029/JB089iB08p06969, 1984.
McGarr, A.: Maximum magnitude earthquakes induced by fluid injection: Limits on fluid injection earthquakes, J. Geophys. Res.-Sol. Ea., 119, 1008–1019, https://doi.org/10.1002/2013JB010597, 2014.
McGarr, A. and Fletcher, J. B.: Development of Ground-Motion Prediction Equations Relevant to Shallow Mining-Induced Seismicity in the Trail Mountain Area, Emery County, Utah, B. Seismol. Soc. Am., 95, 31–47, https://doi.org/10.1785/0120040046, 2005.
McGuire, R. K. and Arabasz, W. J.: An introduction to probabilistic seismic hazard analysis, Geotechnical and environmental geophysics, 1, 333–353, 1990.
Mendecki, A. J.: Simple GMPE for underground mines, Acta Geophys., 67, 837–847, https://doi.org/10.1007/s11600-019-00289-z, 2019.
Meier, P. and Christe, F.: ZoDrEx. Zonal Isolation, Drilling and Exploitation of EGS Projects, Final report: 9 March 2023, https://www.aramis.admin.ch/Grunddaten/?ProjectID=41464 (last access: 21 October 2025), 2023.
Mesimeri, M., Scarabello, L., Zimmermann, E., Haag, T., Zylis, E., Villiger, L., Kaestli, P., Meier, M.-A., Rinaldi, A. P., Obermann, A., Hertrich, M., Clinton, J., Giardini, D., and Wiemer, S.: Multiscale Seismic Monitoring in the Bedretto Underground Laboratory for Geosciences and Geoenergies (BULGG), Seismol. Res. Lett., 96, 182–191, https://doi.org/10.1785/0220240128, 2025.
Mignan, A., Landtwing, D., Kästli, P., Mena, B., and Wiemer, S.: Induced seismicity risk analysis of the 2006 Basel, Switzerland, Enhanced Geothermal System project: Influence of uncertainties on risk mitigation, Geothermics, 53, 133–146, https://doi.org/10.1016/j.geothermics.2014.05.007, 2015.
Mignan, A., Broccardo, M., Wiemer, S., and Giardini, D.: Induced seismicity closed-form traffic light system for actuarial decision-making during deep fluid injections, Sci. Rep., 7, 13607, https://doi.org/10.1038/s41598-017-13585-9, 2017.
Mignan, A., Broccardo, M., and Wang, Z.: Comprehensive Survey of Seismic Hazard at Geothermal Sites by a Meta-Analysis of the Underground Feedback Activation Parameter afb, Energies, 14, 7998, https://doi.org/10.3390/en14237998, 2021.
Norbeck, J. and Latimer, T.: Commercial-Scale Demonstration of a First-of-a-Kind Enhanced Geothermal System, Earth ArXiv, https://doi.org/10.31223/X52X0B, 20 July 2023.
Obermann, A., Rosskopf, M., Durand, V., Plenkers, K., Bröker, K., Rinaldi, A. P., Gholizadeh Doonechaly, N., Gischig, V., Zappone, A., Amann, F., Cocco, M., Hertrich, M., Jalali, M., Junker, J. S., Kästli, P., Ma, X., Maurer, H., Meier, M., Schwarz, M., Selvadurai, P., Villiger, L., Wiemer, S., Dal Zilio, L., and Giardini, D.: Seismic Response of Hectometer‐Scale Fracture Systems to Hydraulic Stimulation in the Bedretto Underground Laboratory, Switzerland, J. Geophys. Res. Solid Earth, 129, e2024JB029836, https://doi.org/10.1029/2024JB029836, 2024.
Plenkers, K., Reinicke, A., Obermann, A., Gholizadeh Doonechaly, N., Krietsch, H., Fechner, T., Hertrich, M., Kontar, K., Maurer, H., Philipp, J., Rinderknecht, B., Volksdorf, M., Giardini, D., and Wiemer, S.: Multi-Disciplinary Monitoring Networks for Mesoscale Underground Experiments: Advances in the Bedretto Reservoir Project, Sensors, 23, 3315, https://doi.org/10.3390/s23063315, 2023.
Petruccelli, A., Schorlemmer, D., Tormann, T., Rinaldi, A. P., Wiemer, S., Gasperini, P., and Vannucci, G.: The influence of faulting style on the size-distribution of global earthquakes, Earth Planet. Sci. Lett., 527, 115791, https://doi.org/10.1016/j.epsl.2019.115791, 2019.
Plenkers, K., Manthei, G., Kwiatek, G.: Underground In-situ Acoustic Emission in Study of Rock Stability and Earthquake Physics; in: Acoustic Emission Testing, edited by: C. U. Grosse, Ohtsu, M., Aggelis, D. G., and Shiotani, T., Springer Tracts in Civil Engineering, https://doi.org/10.1007/978-3-030-67936-1_16, 2022.
Ritz, V. A., Mizrahi, L., Clasen Repollés, V., Rinaldi, A. P., Hjörleifsdóttir, V., and Wiemer, S.: Pseudo-Prospective Forecasting of Induced and Natural Seismicity in the Hengill Geothermal Field, J. Geophys. Res.-Sol. Ea., 129, e2023JB028402, https://doi.org/10.1029/2023JB028402, 2024.
Rosskopf, M., Durand, V., Plenkers, K., Villiger, L., Giardini, D., and Obermann, A.: Accuracy of picoseismic catalogs in hectometer-scale in-situ experiments, 38 pp., ETH Zürich, https://doi.org/10.3929/ETHZ-B-000719147, 2024a.
Rosskopf, M., Durand, V., and Obermann, A.: Seismic Catalogs for the 2022–2023 Hydraulic Stimulation Experiments at the Bedretto Underground Laboratory, ETH Zürich, https://doi.org/10.3929/ethz-b-000658218, 9 February 2024b.
Schmittbuhl, J., Lambotte, S., Lengliné, O., Grunberg, M., Jund, H., Vergne, J., Cornet, F., Doubre, C., and Masson, F.: Induced and triggered seismicity below the city of Strasbourg, France from November 2019 to January 2021, C.R. Géosci., 353, 561–584, https://doi.org/10.5802/crgeos.71, 2022.
Schoenball, M., Ajo-Franklin, J. B., Blankenship, D., Chai, C., Chakravarty, A., Dobson, P., Hopp, C., Kneafsey, T., Knox, H. A., Maceira, M., Robertson, M. C., Sprinkle, P., Strickland, C., Templeton, D., Schwering, P. C., Ulrich, C., Wood, T., and The EGS Collab Team: Creation of a Mixed-Mode Fracture Network at Mesoscale Through Hydraulic Fracturing and Shear Stimulation, J. Geophys. Res.-Sol. Ea., 125, e2020JB019807, https://doi.org/10.1029/2020JB019807, 2020.
Scholz, C. H.: On the stress dependence of the earthquake b value, Geophys. Res. Lett., 42, 1399–1402, https://doi.org/10.1002/2014GL062863, 2015.
Schorlemmer, D., Wiemer, S., and Wyss, M.: Variations in earthquake-size distribution across different stress regimes, Nature, 437, 539–542, https://doi.org/10.1038/nature04094, 2005.
Schultz, R.: Inferring maximum magnitudes from the ordered sequence of large earthquakes, Philos. T. R. Soc. S.-A, 382, 20230185, https://doi.org/10.1098/rsta.2023.0185, 2024.
Schultz, R., Skoumal, R. J., Brudzinski, M. R., Eaton, D., Baptie, B., and Ellsworth, W.: Hydraulic Fracturing-Induced Seismicity, Rev. Geophys., 58, e2019RG000695, https://doi.org/10.1029/2019RG000695, 2020a.
Schultz, R., Beroza, G., Ellsworth, W., and Baker, J.: Risk-Informed Recommendations for Managing Hydraulic Fracturing–Induced Seismicity via Traffic Light Protocols, B. Seismol. Soc. Am., 110, 2411–2422, https://doi.org/10.1785/0120200016, 2020b.
Shakas, A., Maurer, H., Giertzuch, P.-L., Hertrich, M., Giardini, D., Serbeto, F., and Meier, P.: Permeability Enhancement From a Hydraulic Stimulation Imaged With Ground Penetrating Radar, Geophys. Res. Lett., 47, e2020GL088783, https://doi.org/10.1029/2020GL088783, 2020.
Shapiro, S. A., Dinske, C., Langenbruch, C., and Wenzel, F.: Seismogenic index and magnitude probability of earthquakes induced during reservoir fluid stimulations, Lead. Edge, 29, 304–309, https://doi.org/10.1190/1.3353727, 2010.
Spada, M., Tormann, T., Wiemer, S., and Enescu, B.: Generic dependence of the frequency-size distribution of earthquakes on depth and its relation to the strength profile of the crust, Geophys. Res. Lett., 40, 709–714, https://doi.org/10.1029/2012GL054198, 2013.
Thingbaijam, K. K. S., Martin Mai, P., and Goda, K.: New Empirical Earthquake Source‐Scaling Laws, Bull. Seismol. Soc. Am., 107, 2225–2246, https://doi.org/10.1785/0120170017, 2017.
TNO: Probabilistic Seismic Hazard and Risk Analysis in the TNO Model Chain Groningen, TNO2020 R11052, https://www.nlog.nl/en/public-shra-groningen (last access: August 2024), 2020.
Trutnevyte, E. and Wiemer, S.: Tailor-made risk governance for induced seismicity of geothermal energy projects: An application to Switzerland, Geothermics, 65, 295–312, https://doi.org/10.1016/j.geothermics.2016.10.006, 2017.
Urban, P., Lasocki, S., Blascheck, P., Do Nascimento, A. F., Van Giang, N., and Kwiatek, G.: Violations of Gutenberg–Richter Relation in Anthropogenic Seismicity, Pure Appl. Geophys., 173, 1517–1537, https://doi.org/10.1007/s00024-015-1188-5, 2016.
Van Der Elst, N. J., Page, M. T., Weiser, D. A., Goebel, T. H. W., and Hosseini, S. M.: Induced earthquake magnitudes are as large as (statistically) expected, J. Geophys. Res.-Sol. Ea., 121, 4575–4590, https://doi.org/10.1002/2016JB012818, 2016.
Van Elk, J., Doornhof, D., Bommer, J. J., Bourne, S. J., Oates, S. J., Pinho, R., and Crowley, H.: Hazard and risk assessments for induced seismicity in Groningen, Neth. J. Geosci., 96, s259–s269, https://doi.org/10.1017/njg.2017.37, 2017.
Van Thienen-Visser, K. and Breunese, J. N.: Induced seismicity of the Groningen gas field: History and recent developments, Lead. Edge, 34, 664–671, https://doi.org/10.1190/tle34060664.1, 2015.
Verdon, J. P. and Bommer, J. J.: Green, yellow, red, or out of the blue? An assessment of Traffic Light Schemes to mitigate the impact of hydraulic fracturing-induced seismicity, J. Seismol., 25, 301–326, https://doi.org/10.1007/s10950-020-09966-9, 2021.
Villiger, L., Gischig, V. S., Doetsch, J., Krietsch, H., Dutler, N. O., Jalali, M., Valley, B., Selvadurai, P. A., Mignan, A., Plenkers, K., Giardini, D., Amann, F., and Wiemer, S.: Influence of reservoir geology on seismic response during decameter-scale hydraulic stimulations in crystalline rock, Solid Earth, 11, 627–655, https://doi.org/10.5194/se-11-627-2020, 2020.
Volpe, G., Pozzi, G., Collettini, C., Spagnuolo, E., Achtziger-Zupančič, P., Zappone, A., Aldega, L., Meier, M. A., Giardini, D., and Cocco, M.: Laboratory simulation of fault reactivation by fluid injection and implications for induced seismicity at the BedrettoLab, Swiss Alps, Tectonophysics, 862, 229987, https://doi.org/10.1016/j.tecto.2023.229987, 2023.
Wesseloo, J.: The Spatial Assessment of the Current Seismic Hazard State for Hard Rock Underground Mines, Rock Mech. Rock Eng., 51, 1839–1862, https://doi.org/10.1007/s00603-018-1430-4, 2018.
White, J. A. and Foxall, W.: Assessing induced seismicity risk at CO2 storage projects: Recent progress and remaining challenges, Int. J. Greenh. Gas Control, 49, 413–424, https://doi.org/10.1016/j.ijggc.2016.03.021, 2016.
Wiemer, S., Danciu, L., Edwards, B., Marti, M., Fäh, D., Hiemer, S., Wössner, J., Cauzzi, C., Kästli, P., and Kremer, K.: Seismic Hazard Model 2015 for Switzerland (SUIhaz2015), Swiss Seismological Service, https://doi.org/10.12686/A2, 2016.
Wiemer, S., Philippe, R., Kästli, P., Danciu, L., Bazzurro, P., Fäh, D., Duvernay, B., Lestuzzi, P., Marti, M., Papadopoulos, A., Bergamo, P., Khodaverdian, A., Fagà, E., Odabasi, O., Cauzzi, C., Valenzuela Rodriguez, N., Schmid, N., Hammer, C., Panzera, F., Perron, V., Dallo, I., Zaugg, S. N., and Haslinger, F.: Earthquake Seismic Risk Model for Switzerland (ERM-CH23), SED, Swiss Seismological Service at ETH Zürich, https://doi.org/10.12686/A20, 2023.
Zang, A., Niemz, P., von Specht, S., Zimmermann, G., Milkereit, C., Plenkers, K., and Klee, G.: Comprehensive data set of in situ hydraulic stimulation experiments for geothermal purposes at the Äspö Hard Rock Laboratory (Sweden), Earth Syst. Sci. Data, 16, 295–310, https://doi.org/10.5194/essd-16-295-2024, 2024.
Zappone, A., Rinaldi, A. P., Grab, M., Wenning, Q. C., Roques, C., Madonna, C., Obermann, A. C., Bernasconi, S. M., Brennwald, M. S., Kipfer, R., Soom, F., Cook, P., Guglielmi, Y., Nussbaum, C., Giardini, D., Mazzotti, M., and Wiemer, S.: Fault sealing and caprock integrity for CO2 storage: an in situ injection experiment, Solid Earth, 12, 319–343, https://doi.org/10.5194/se-12-319-2021, 2021.
Zhou, W., Lanza, F., Grigoratos, I., Schultz, R., Cousse, J., Trutnevyte, E., Muntendam-Bos, A., and Wiemer, S.: Managing Induced Seismicity Risks From Enhanced Geothermal Systems: A Good Practice Guideline, Rev. Geophys., 62, e2024RG000849, https://doi.org/10.1029/2024RG000849, 2024.
- Abstract
- Introduction
- The Bedretto Underground Laboratory for Geosciences and Geoenergies (BULGG)
- Experiments between 2020 and 2024
- Sequence of induced seismic hazard studies
- Method
- Results
- Discussion
- Conclusions
- Appendix A
- Data availability
- Author contributions
- Competing interests
- Disclaimer
- Acknowledgements
- Financial support
- Review statement
- References