the Creative Commons Attribution 4.0 License.
the Creative Commons Attribution 4.0 License.
 | 27 Oct 2025
Dissolution–precipitation creep in polymineralic granitoid shear zones in experiments – Part 1: Strain localization mechanisms
Natalia Nevskaya
Alfons Berger
Holger Stünitz
Weijia Zhan
Markus Ohl
Oliver Plümper
Marco Herwegh
Dissolution–precipitation creep (DPC) is considered to be one of the main processes accommodating localized strain in polymineralic shear zones of the Earth's crust. Extensive field evidence for DPC in natural shear zones supports the importance of this process. The spatiotemporal evolution and the level of compositional heterogeneity that facilitate the nucleation of such polymineralic shear zones remain poorly understood. A series of new experiments was conducted on a granitoid fine-grained (average starting grain size ∼15 µm) ultramylonite to different strains at 650 °C and 1.2 GPa, with strain rates varying from 10−3 to 10−6 s−1. In Type I experiments, a fracture was induced (prior to reaching the pressure and temperature (P–T) conditions), whereas, in Type II experiments, no initial fracture was induced. Consequently, in the Type I experiments, viscous deformation localized strictly within the previous fracture in an ∼20 µm wide zone, with grain sizes being reduced to 150–10 nm. In the Type II experiments, viscous deformation was distributed in the sample, with grain size being reduced locally to 200–50 nm. This study supports two different hypotheses for shear zone nucleation in nature. In brittle-induced strain localization, DPC will be activated and lead to a rapid and strong strain localization, producing a very weak and fast-deforming high-strain zone. In viscously induced strain localization (without main fracture), deformation concentrates in zones distributed through the sample, requiring higher shear strains to reach mechanical and microstructural steady state at slower deformation rates compared to brittle-induced strain localization. In both end-member strain localization scenarios, the dominant viscous deformation mechanism in the shear zones is grain boundary sliding combined with pinning-assisted DPC. Our experiments indicate that chemical potentials in the microstructures in combination with different strain localization types may explain the often-observed concentration of strain in fine-grained polymineralic mylonites such as in granitoids but also other polymineralic rocks (e.g., peridotites, granulites etc.) in nature.
- Article
(13951 KB) - Full-text XML
- Companion paper
-
Supplement
(2019 KB) - BibTeX
- EndNote


Strain localization in the viscous part of the lithosphere is important for regional- and global-scale deformation, from local shear zones to mountain-building-scale processes (e.g., Bercovici and Karato, 2002; Ebert et al., 2007; Goncalves et al., 2016; Nibourel et al., 2021; White et al., 1980). Strain localization is critical for the initialization of plate boundaries (e.g., Bercovici and Ricard, 2014). The processes underlying the localization are still debated, and many models exist to explain them (e.g., Bercovici and Karato, 2002; Bercovici and Skemer, 2017; Gueydan et al., 2003; Platt and Behr, 2011; Rutter and Brodie, 1988; Schmid, 1982; Tullis and Yund, 1985; Wehrens et al., 2017). One basis for their understanding is the rheology of the rocks hosting the shear zones. The Earth's lithosphere consists mainly of polymineralic rocks (e.g., granitoid, peridotite, gabbro). While the rheology of monomineralic rocks is reasonably well understood, the rheology becomes increasingly difficult to understand with more mineral phases in the system.
For viscous deformation, two main end-member deformation mechanisms can be distinguished: diffusion creep and dislocation creep. In this study, we extend the term diffusion creep to include dissolution–precipitation creep (DPC), where nucleation (“neo-crystallization”) and growth of new grains may occur. This appears to be the most commonly observed deformation mechanism in polymineralic shear zones (e.g., Fitz Gerald and Stünitz, 1993; Herwegh and Jenni, 2001; Hippertt, 1998; Imon et al., 2002; Kilian et al., 2011; Mansard et al., 2018; Okamoto and Hiraga, 2022; Stünitz and Fitz Gerald, 1993).
While dislocation creep is a grain-size-insensitive process, a fine-grained material favors deformation through grain-size-sensitive diffusion creep due to the increase in grain and interphase surface areas. As diffusion creep implies lower stresses or faster strain rates of the deformation in comparison to dislocation creep, a switch in deformation mechanism from dislocation to diffusion creep has been regarded as an important process (e.g., Rutter and Brodie, 1988; Schmid, 1982) because the effect is a weaker deformational behavior that could explain strain localization in Earth's crust. Depending on the starting grain size, different deformation mechanisms may operate (Ranalli, 1982; Rybacki and Dresen, 2004). In coarse-grained (granitic or gabbro/peridotite) rocks, dislocation creep is probably the dominating deformation mechanism. The processes reducing the grain size and thereby potentially causing a transition from dislocation to diffusion creep are still a matter of debate, and many models exist to understand this transition. The main models include (1) initially reduced grain size through natural inhomogeneities or brittle fracturing (Mancktelow and Pennacchioni, 2005; Pennacchioni and Mancktelow, 2007; Wehrens et al., 2016); (2) reactions and formation of new phases, e.g., symplectites or phase transformations (Ceccato et al., 2018; Fitz Gerald and Stünitz, 1993; Menegon et al., 2008; Stünitz and Fitz Gerald, 1993; Stünitz and Tullis, 2001); (3) and a mixture of different deformation mechanisms, namely initially dynamic recrystallization switching to diffusion creep by subsequent phase mixing and inhibited grain growth through pinning (Bercovici and Skemer, 2017; Ebert et al., 2008; Herwegh et al., 2011; Herwegh and Jenni, 2001; Linckens et al., 2011, 2015; Olgaard and Evans, 1986; Ricard and Bercovici, 2009; Wehrens et al., 2017). The phase-mixing and pinning processes are key to constraining DPC in all three models and are most efficient in polymineralic rocks, highlighting the importance of polymineralic rocks for localized shear zones in the crust.
We performed experiments on natural fine-grained granitoid rocks in two series of experiments. A naturally banded ultramylonite with and without an initially induced fracture was deformed at 650 °C and 1.2 GPa confining pressure. Although coarse-grained granitic or monomineralic samples of quartz and feldspar at the same temperatures, pressures, and similar strain rates deform in a brittle to semi-brittle manner (e.g., Hirth and Tullis, 1994; Tullis and Yund, 1977), our granitoid ultramylonites deform viscously and are mechanically weak. We use samples with properties very close to what is found in nature: (1) low porosity as compared to gouge samples (e.g., Pec et al., 2016), (2) induced inhomogeneity as fracture in a closed system (Tullis et al., 1990), (3) natural inhomogeneity in terms of mylonitic bands (e.g., compared to aplite or granite studies by Tullis (2002), Tullis et al. (1990), and Tullis and Yund (1977)), and (4) relatively low experimental temperature (compilation of experiments in Ghosh et al., 2022). This allows us to study the role of different phases and phase mixing in the onset of viscous deformation in polymineralic rocks, estimate the strength of polymineralic shear zones at amphibolite facies metamorphic conditions, and infer different strain localization mechanisms in nature.
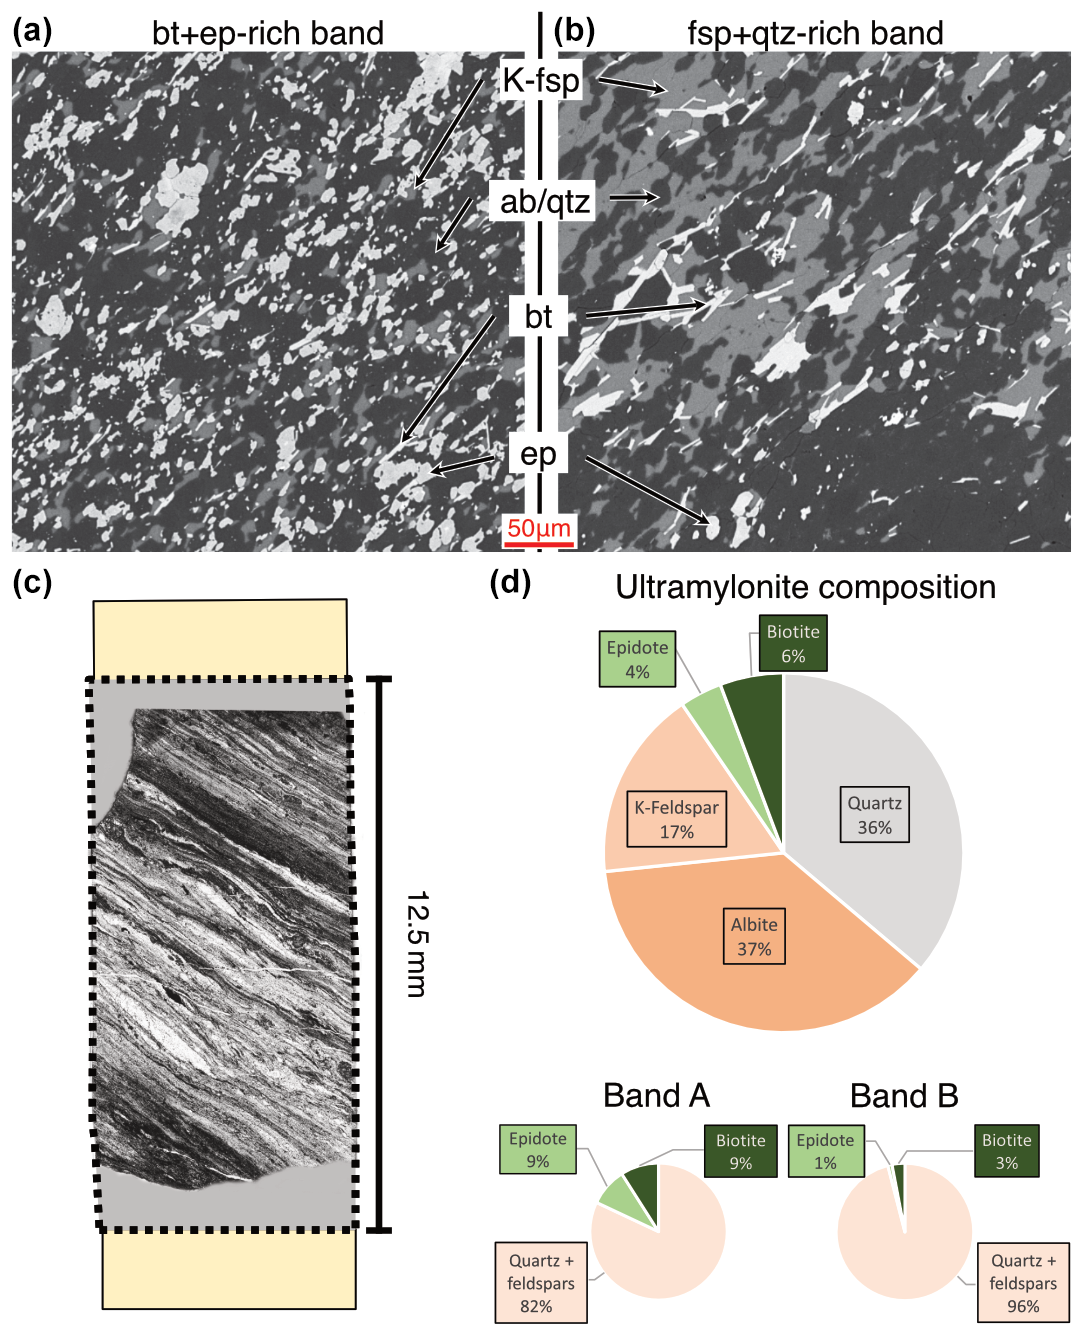
Figure 1Starting material characterization. Ultramylonite form the Central Aar granite from the Grimsel Test Site underground rock laboratory. (a, b) Two end-member mylonitic bands. Panel (a) shows an ep-/bt-rich band, very fine grained (<15 µm), displaying well-mixed phases. Panel (b) shows a feldspar(+qtz)-rich coarser band, where less phase mixing occurs. Panel (c) shows foliation and mylonitic bands in experiments, in a thin-section PPL image of an example from 634NN, loaded to experimental conditions and unloaded without imposing any additional strain to the mylonite. Panel (a) appears dark in PPL, and panel (b) appears bright in PPL. (d) Bulk composition of the ultramylonite, measured by XRD from the milled sample. py+/-wm+/-zircons appear as trace minerals. Compositions of the two band types from SEM images. For more details, see the text; see Wehrens et al. (2016) for detailed microstructural investigation of the starting material.
2.1 Starting material characterization
The starting material is a fine-grained granitoid ultramylonite from the Central Aar granite (Fig. 1) that was cored within the Grimsel Test Site, an underground rock laboratory in the Central Alps. Microstructures of this ultramylonite formed during Alpine peak metamorphic conditions at 450 °C and 600 MPa (Challandes et al., 2008; Goncalves et al., 2012) and were not overprinted afterwards, preserving the original microstructures. Additionally, the underground laboratory also allows the coring of fresh samples without any traces of weathering. Sample characterization was performed macroscopically and through both an optical and a scanning electron microscope (SEM) (Fig. 1). The bulk mineral composition (Fig. 1d) was measured by X-ray diffraction (XRD) from a milled representative portion of the sample, and further local chemistry was measured from gray value thresholding of SEM backscatter (BSE) images (Fig. 1d bottom).
The bulk mylonite consists of quartz (qtz) 36 wt %, albite (ab) 37 wt %, K-feldspar (K-fsp) 17 wt %, biotite (bt) 6 wt %, epidote (ep) 4 wt %, and traces of pyrite (py) and minor accessory minerals. It is foliated, and the bands are dominated by different minerals and grain sizes. Their widths range between ∼100 and ∼400 µm. From these mylonitic bands, we distinguish two end-member bands based on their grain size and composition. The most fine-grained (down to 2 µm) band is bt-/ep-rich, and the phases are very well mixed (Fig. 1a). The other end-member band is coarser, with grains >30 µm, and contains more fsp and qtz (Fig. 1b). The bt-/ep-rich bands appear macroscopically dark green and microscopically dark and pleochroic (Fig. 1c). Based on these optical characteristics, most fine-grained and homogeneous areas were targeted for the experiments such that the median grain size of the samples is ∼15 µm.
For the experiments, the ultramylonite was cored with a 6.33 mm drill bit such that the foliation was inclined 45° to the core axis. Then, each potential sample was scanned by X-ray computed micro-tomography (XRCT) in the Bruker SkyScan 1273 with 6 µm pixel size to validate that no drilling-induced fractures existed prior to the deformation. One sample (634NN) was brought to experimental conditions overnight (>8 h) to check whether no grain growth or changes in microstructures of the starting material occurred before deformation started. The microstructures in this sample did not differ significantly from the starting ultramylonite (see Fig. S5 in the Supplement).
The grain sizes of various zones were measured by manual segmentation and calculation of the area-equivalent circle diameter . A statistically relevant number of grains or a representative area could not always be measured due to constraints of resolution and grain size distributions. Therefore, a median grain size is usually given, with an additional range of measured grain sizes. The median is plotted with a number-weighted density distribution and correlates well with the peak of the curve in all samples, serving as a reasonable approximation for the grain sizes in the samples.
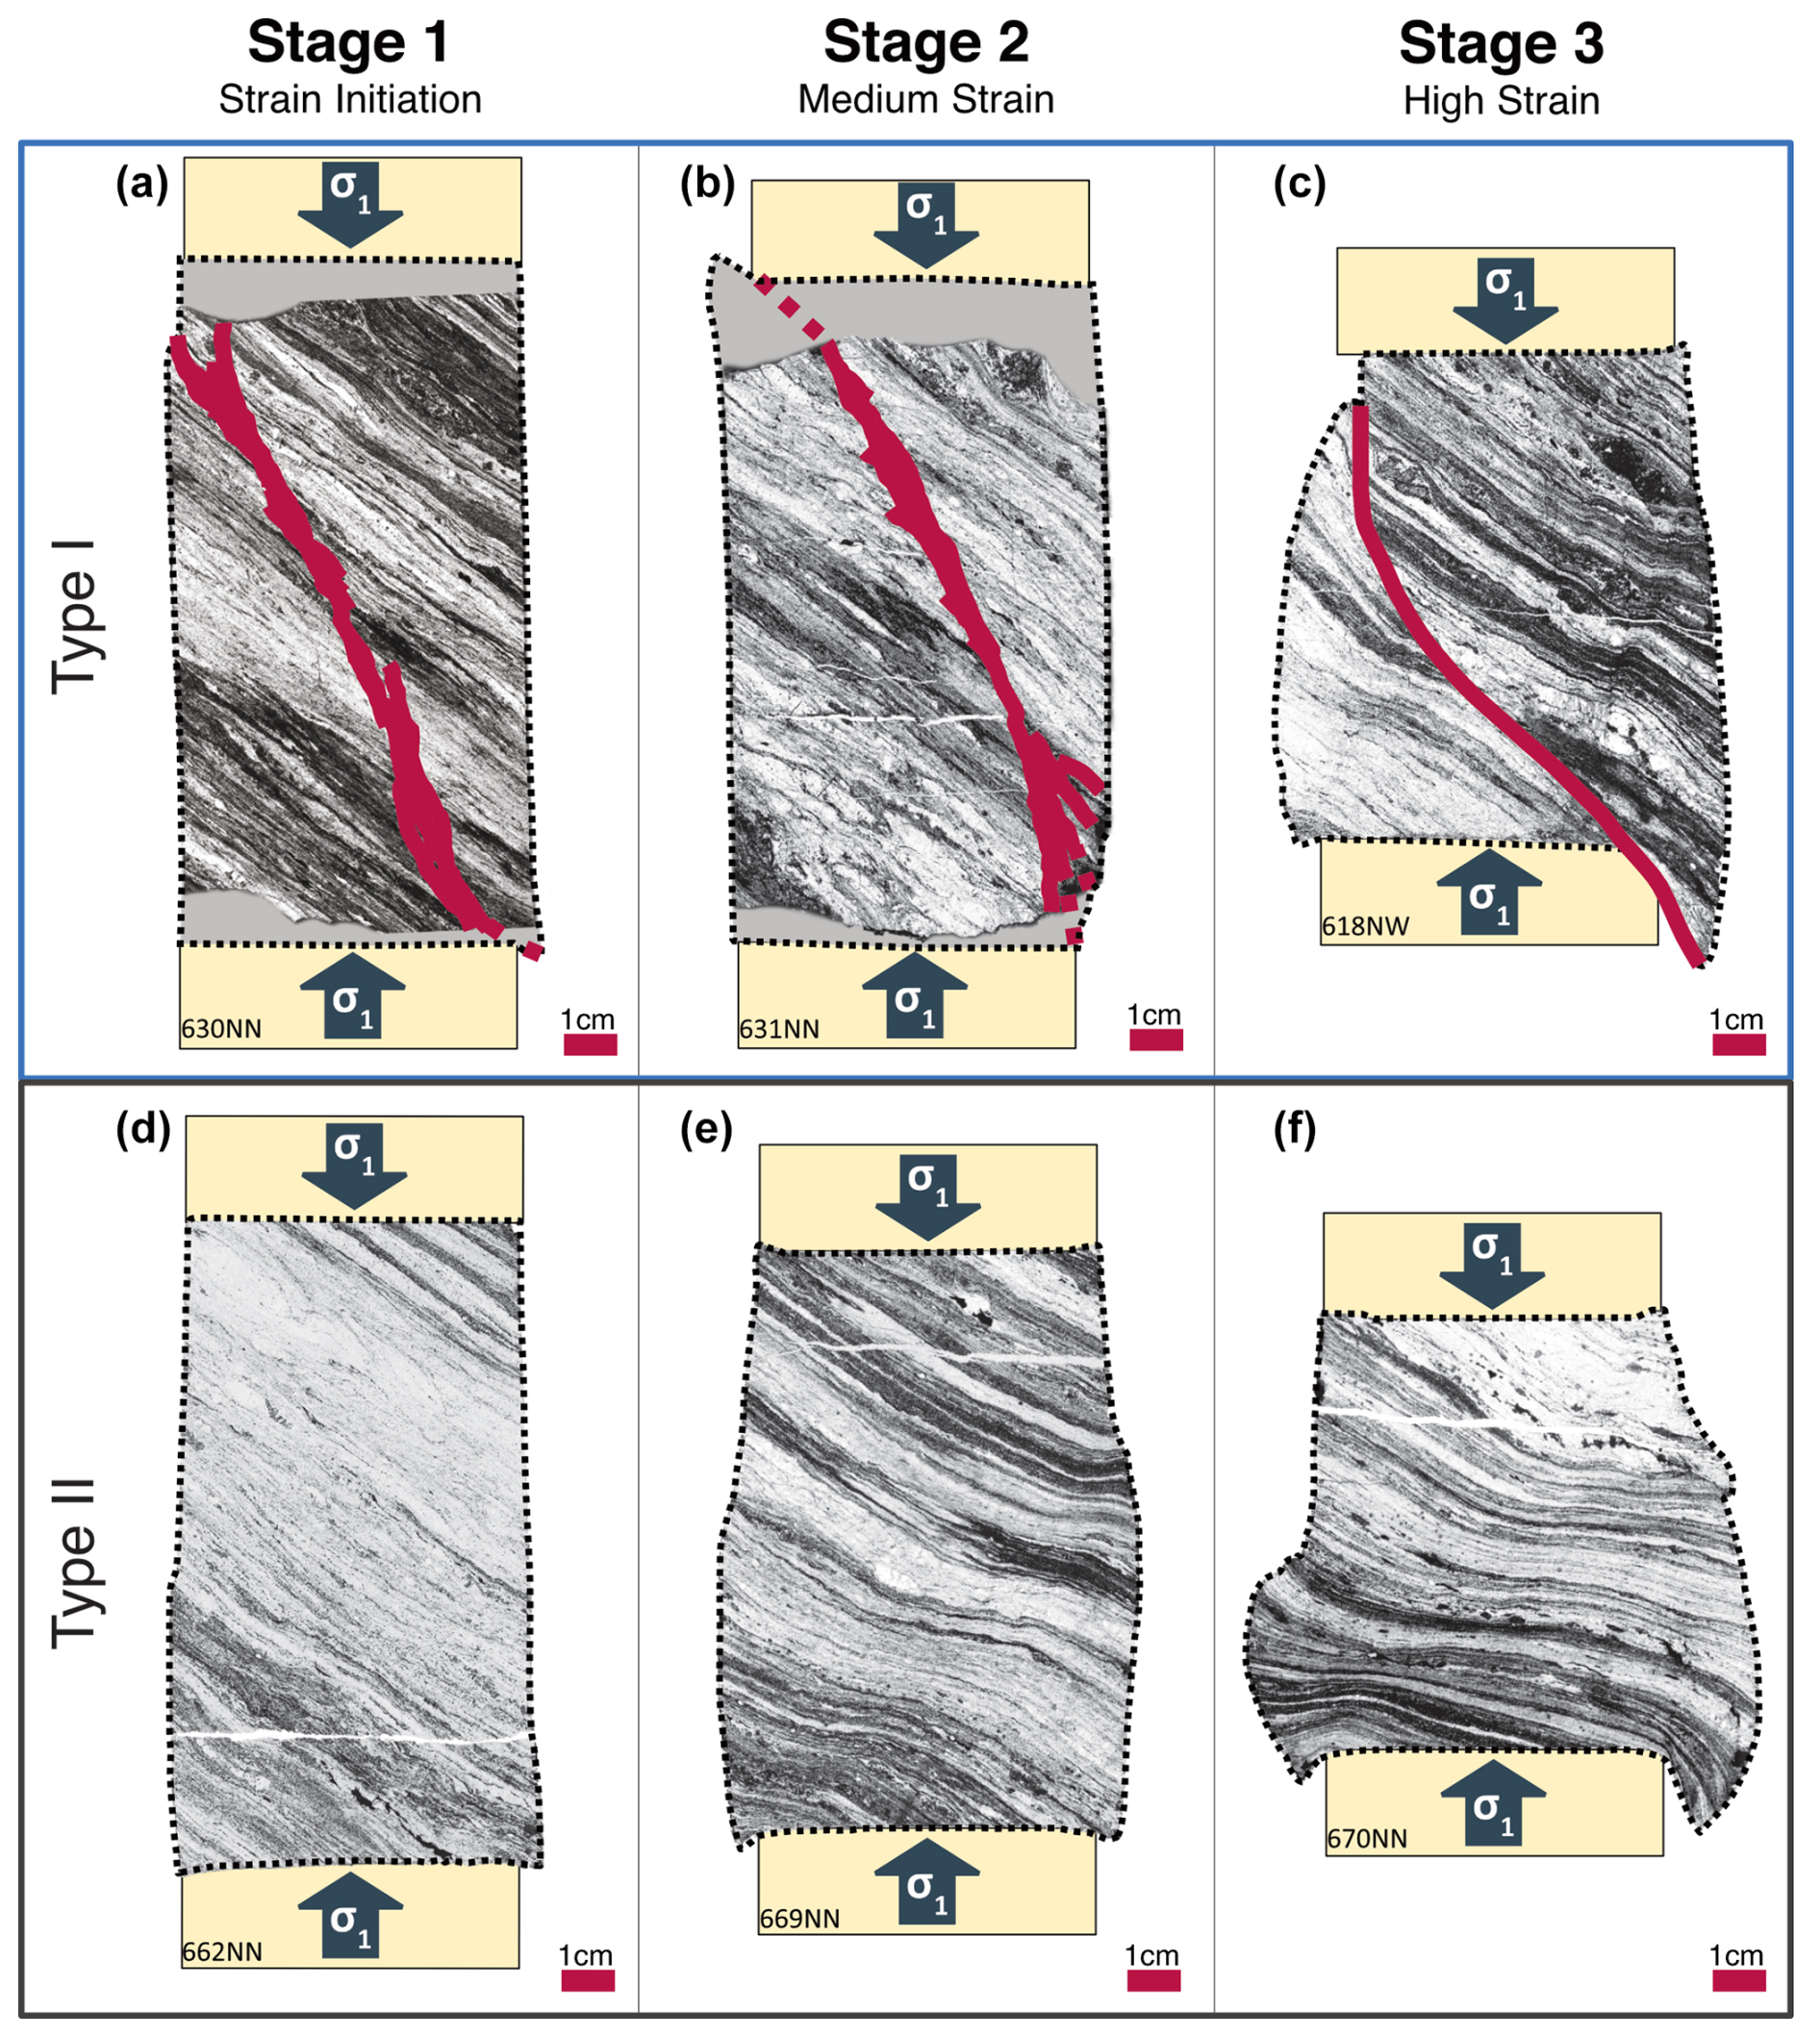
Figure 2Strain evolution of the two main experiment types as observed from experiments to different strains. PPL microscope images with the final sample geometry drawn manually around the samples. Shear zone orientation and localization in Type I experiments (a–c) in red; note the ∼30° angle in the initial localization crosscutting the initial foliation but dipping in the same direction. In Type II experiments (d–f), deformation is distributed, but most widening occurs at the lower of the sample. Some corner areas are missing due to damage during polishing (gray). More details in text.
2.2 Experimental setup
We used a Griggs-type apparatus at the rock deformation lab at Orléans University, calibrated by Pec (2014). NaCl was used as the confining medium for the inner and outer salt pieces. One K-type thermocouple was used to measure the temperature as input for the automated temperature control in the middle of the sample length. The samples were cut to 12±0.5 mm length and polished plane-parallel, then dried at 125 °C at least overnight and weighed dry. Welded Pt capsules were used for all experiments. 0.025 mm thick Ni foil was wrapped around 2–3 times, depending on the sample thickness inside the capsule. Then, a controlled amount of H2O (see Table 1) was added at the bottom of the Pt capsule before the sample was inserted, thereby minimizing the evaporation of water during closing and welding of the the capsule.
After the targeted pressure and temperature conditions were reached, the samples equilibrated for at least 1 h. Then, the motor advancing the σ1 piston was started at constant speed and moved through the top lead piece, thereby not deforming the sample significantly. The displacement, confining pressure, and load were recorded digitally in 1 s intervals and simultaneously recorded with an analog chart recorder. The hit point, when the piston touches the sample and actual deformation starts, was reached after ca. 12 h. The exact position was calculated from the intersection of two slopes before and after the hit point.
We performed experiments at 650 °C, 1.2 GPa, and a constant piston displacement rate of 10−8 m s−1 (Table 1). We have two types of experiments (Fig. 2). For Type I experiments, a brittle fracture was induced during pressurization, prior to reaching the experimental P–T conditions. For Type II experiments, pressurization of the sample to experimental P–T conditions was performed more slowly and carefully, to avoid creating loading-induced fractures. Then, a series of samples for both experiment types were deformed to different finite strains (Fig. 2), monitored by the recording of the load (Fig. 3).
The experiments were performed until peak stress, medium strain, or high strain was reached, to reconstruct the microstructural evolution. These stages refer to the different zones in the stress–strain curve (Fig. 3c): peak stress is the point of maximum stress, after initial sample loading and possible strain initiation; medium strain is where the sample underwent some strain but is not yet in the steady-state stress; high strain is the microstructure that forms at steady-state stress levels.
Due to the different geometries evolving during the experiment, stresses acting on the deforming zones were corrected differently. In the Type I experiments (blue curves in Fig. 3), all the stress is assumed to concentrate on the shear zone, and the experiments are corrected as general shear experiments (mostly simple shear with a small pure shear component). These samples are deforming 3 orders of magnitude faster than Type II experiments. The angle and width of the shear zone are considered for the calculation of shear stress and shear strain rate . An equivalent (coaxial) strain rate from the shear strain rate is calculated as (Sun and Pec, 2021). The acquired strain of these samples is calculated from the sample shortening as for coaxial shortening experiments, so their finite strain is lower than that of Type II samples despite their fast strain rates and high gamma values (Fig. 3). In Type II (gray curves in Fig. 3), without pre-fracture, stresses are assumed to be distributed throughout the whole cylindrical sample and are corrected as coaxial shortening experiments. A linear friction correction as in Pec (2014) and Sun and Pec (2021) was applied on all datasets. More details on the corrections are found in Part 2 (Nevskaya et al., 2025).
2.3 Imaging
Grain sizes ranging from >20 µm down to <10 nm required systematic investigation of our experiments though different scales with suitable instruments. Imaging of the samples was performed through the light microscope first, resolving grain scales of millimeters (mm) to micrometers (µm). Scanning electron microscope (SEM) analyses were performed on a Zeiss EVO50 SEM, using the backscatter (BSE) detector and energy dispersive X-ray spectroscopy (EDX) with the EDAX TEAM™ software, mostly at working distances of 8–9 mm and acceleration voltages of 10–20 kV, allowing the resolution of grains on a micrometer (µm) scale. Subsequently, a high-resolution field emission gun (FEG), Gemini SEM 450, was used at WD = 5 mm, acceleration voltages of 5–8 kV, and probe currents of 70–80 pA to resolve grains < 1 µm.
After careful area selection in the FEG-SEM, (scanning) transmission electron microscopy (STEM) was finally used to resolve nanometer-scale grains with the Thermo Fisher/FEI Helios Nanolab G3 (operator at Utrecht University, access through the EXCITE Network, 2024), requiring thin foils of selected sample areas. Two methods were used to cut the foils: classical cut with foils vertical to the thin-section surface and pyramidal cut (subsequently thinned) with the foils parallel to the thin-section surface. Three-dimensional information was thereby added to the grain orientation, shapes, and phase mixing. The highly strained and fine-grained material was difficult to prepare and broke out or bent during polishing. To avoid amorphization during ion beam treatment, the polishing was stopped, even though the target thickness of 100 nm on top and <300 nm at the bottom was not reached. Note that, under these circumstances, this led to an overlapping effect of minerals with grain sizes below the thickness of the samples.
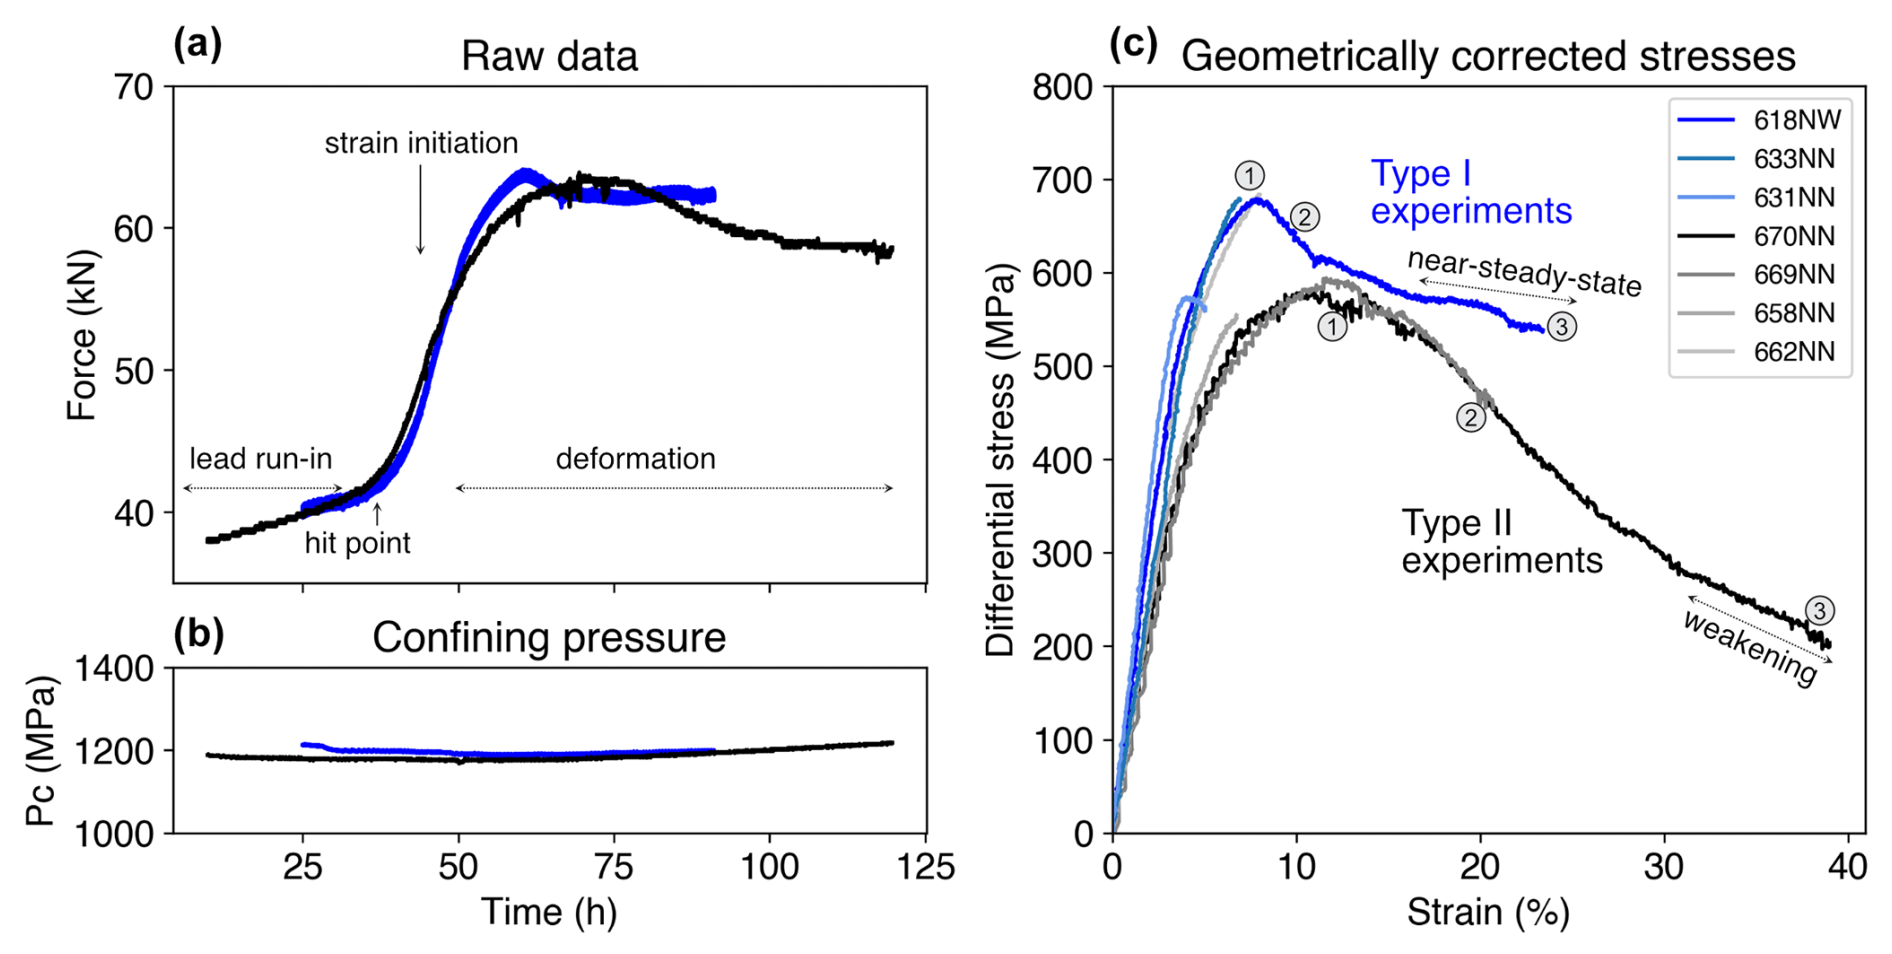
Figure 3Mechanical data of the presented samples. We show here the raw data of the high-strain samples, which represent the force acting on the experimental samples with the similar initial cylindrical cross-section (a) and the confining pressure (b). The corrected data for different sample geometries are displayed in panel (c). The onset of deformation in Griggs-type experiments initiates during the slope after the hit point in panel (a). In panel (c), we show the corrected data with the three deformation stages as used in this study are labeled with numbers: 1 is peak stress, 2 is medium strain, and 3 is high strain.
3.1 Mechanical data
The data shown in Fig. 3 compare the coaxial stress–strain evolution of both experiment types and show the force data before correcting for sample geometries. Both experiments have a very similar peak stress considering the force on the cylindrical samples. After correction for the different experimental geometries, the localized strain zones in pre-fractured Type I experiments are 3 orders of magnitudes faster than the coaxial shortening experiments (Type I s−1, Type II s−1; see also Table 1). The differential stresses at peak stress are <700 MPa in Type I experiments and <600 MPa in Type II experiments. In Type I experiments, weakening occurs after peak stress at coaxial strains of ∼7 %; then, an almost steady-state stress of ∼500 MPa is reached after >10 % coaxial strain. In Type II experiments, continuous weakening is observed with increasing strain to <200 MPa at 40 % shortening. The resulting strains in Type I experiments are up to γ=200, with slight variations due to varying localized shear zone widths (see Table 1). This is an advantage of this experimental setup because such large strains are commonly geometrically not feasible in Griggs-type experiments but are often necessary to reach a steady-state microstructure. Only torsion experiments in solid-medium apparatus could reach large strains to study phase mixing and strain localization, such as in the setups of Cross and Skemer (2017). Despite the complex geometries and sample inhomogeneities, there is a reasonable agreement between the experimental results.
Table 1Summary of experimental parameters. All experiments were deformed at 650 °C and 1.2 GPa confining pressure. The shear strain rates are calculated from final shear zone thicknesses after the experiment, as described in Materials and methods.
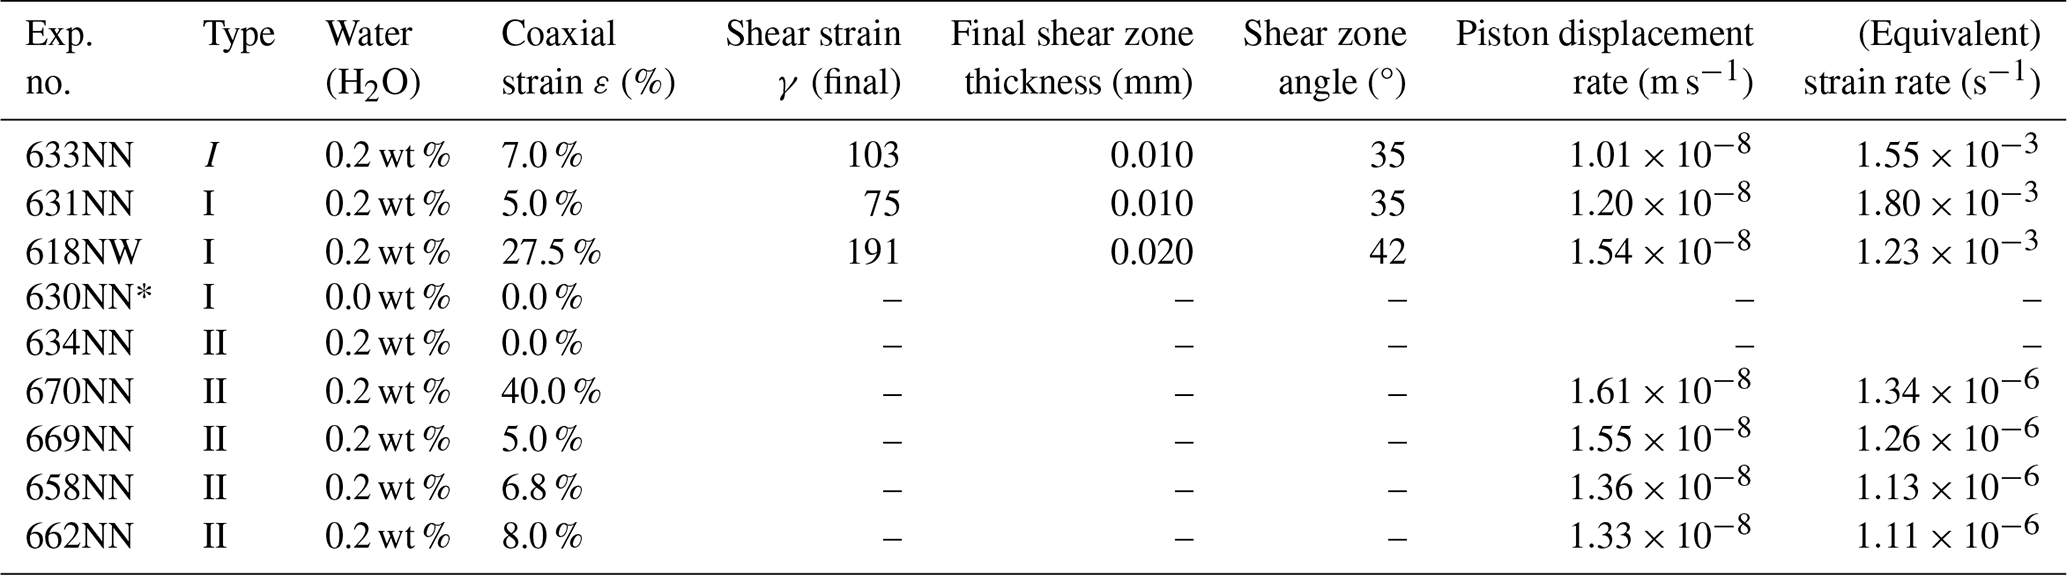
Last column: for Type I experiments, an equivalent (coaxial) strain rate is given; for Type II experiments, a coaxial strain rate is given. All experiments are at 650 °C and Pc = 1.2 GPa.
* Exception: was only loaded 1.5 kbar at 100 °C without reaching the final experimental P–T conditions.
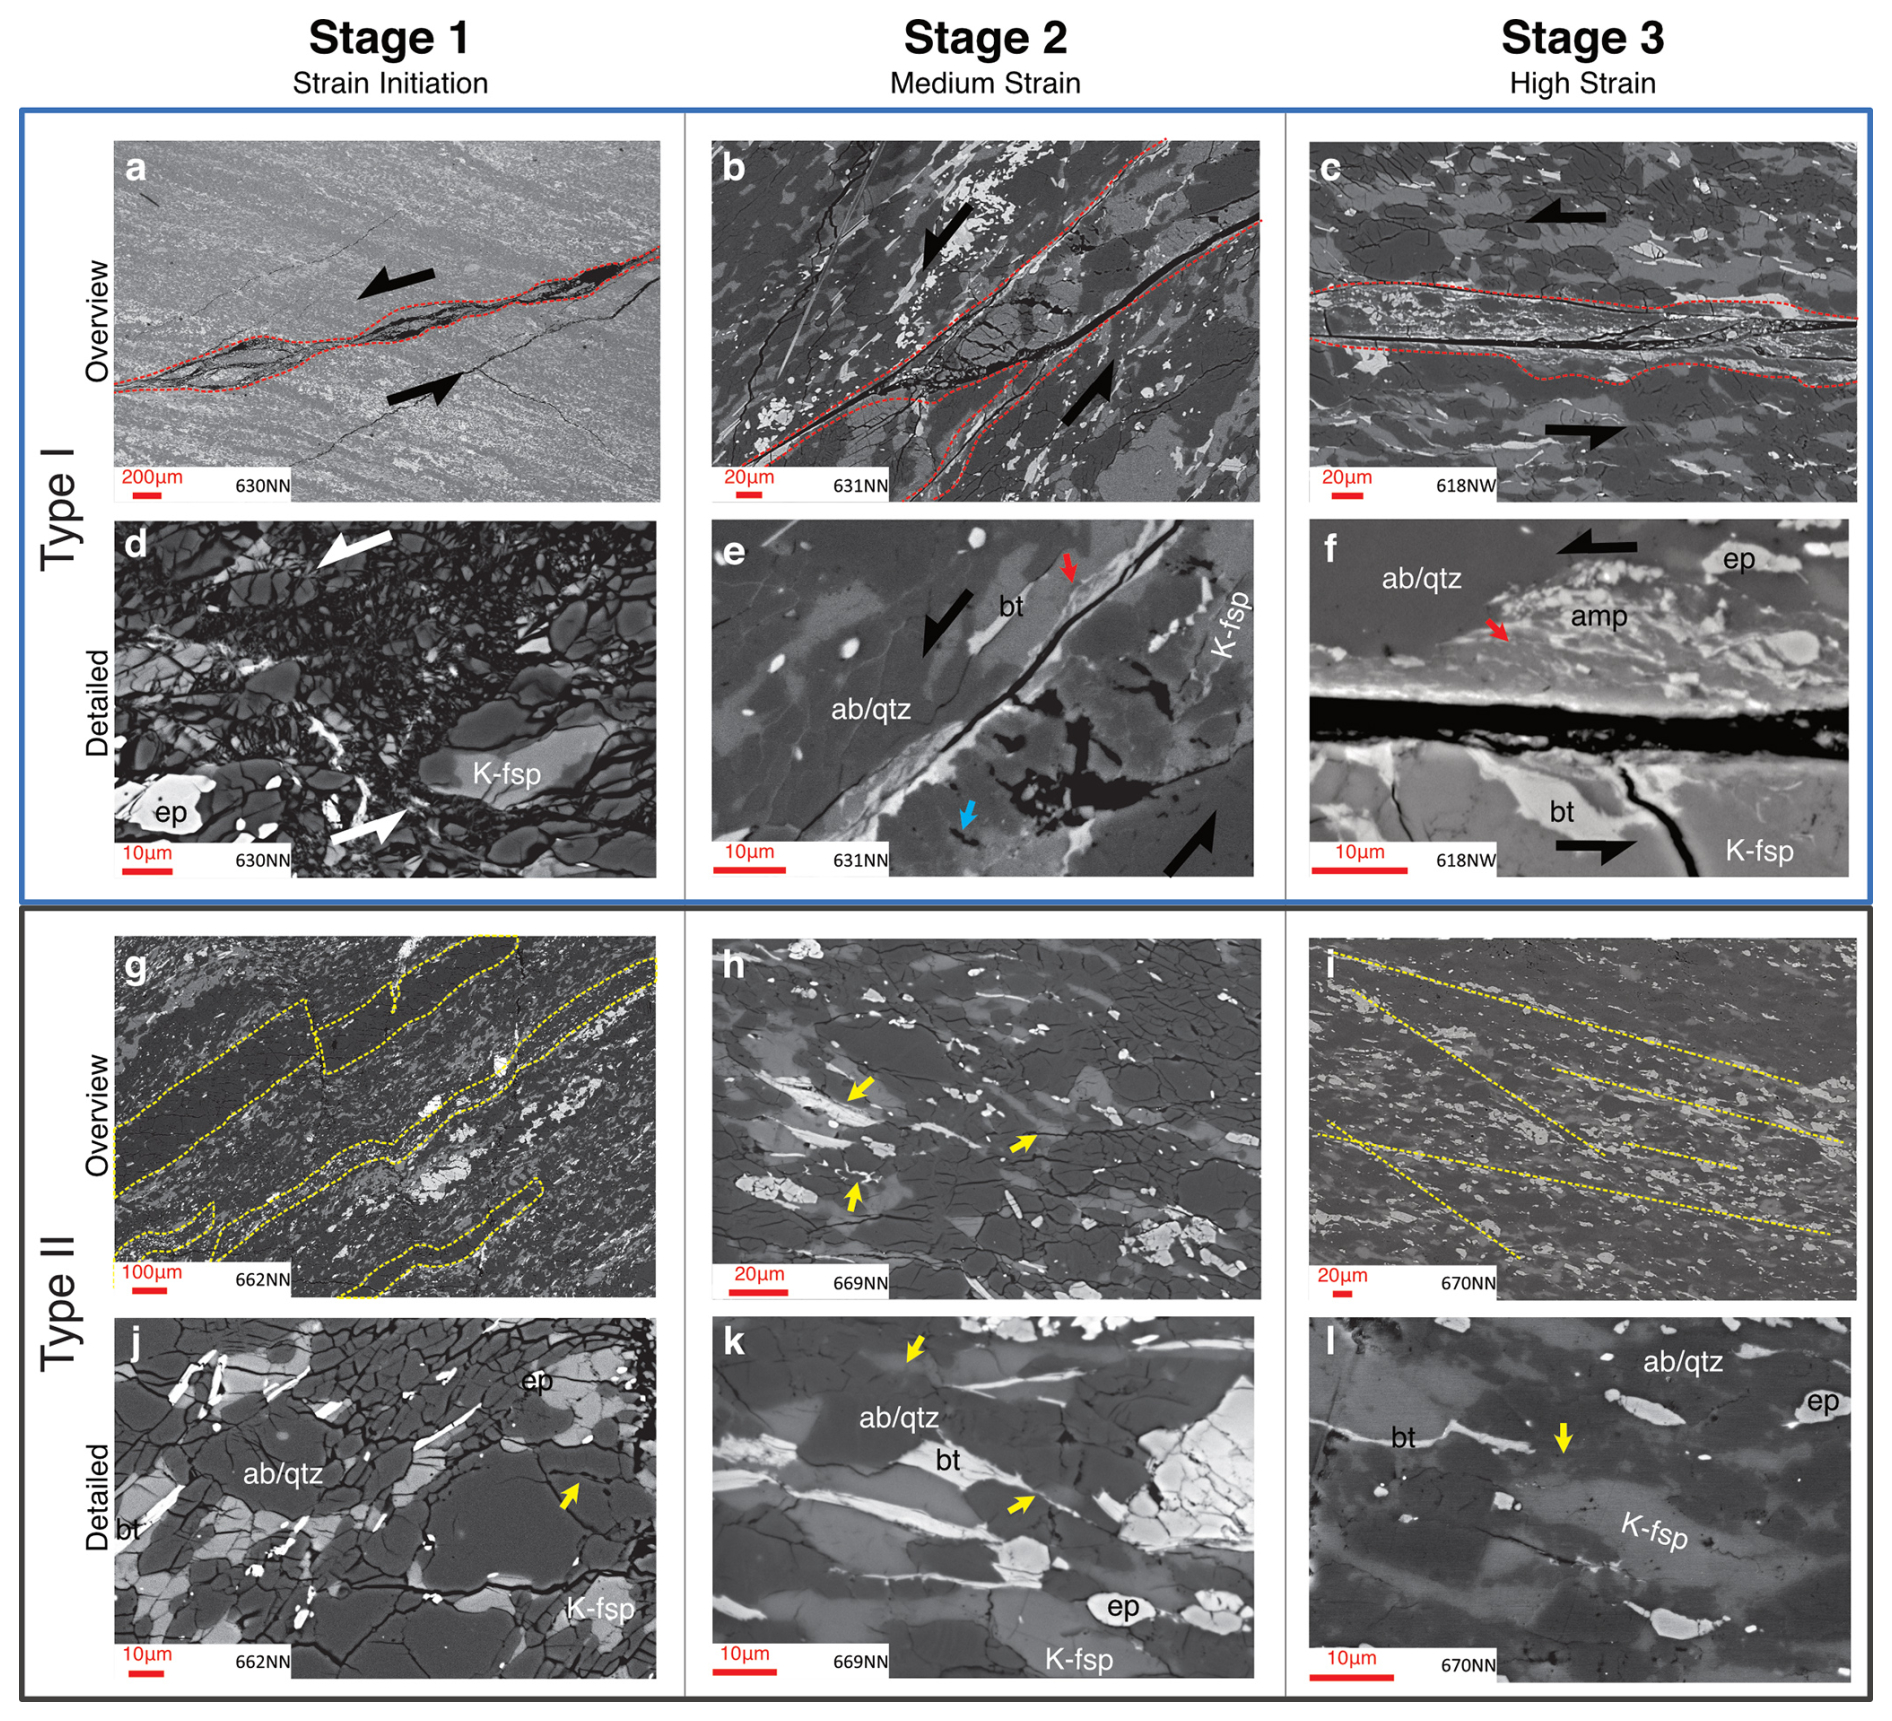
Figure 4Differences in strain evolution of the two main experiment types as observed from experiments on different finite strains. SEM images are at low magnification to highlight the different geometries of the shear zone in Type I (a–c) and II (g–i) experiments, and the details in high-magnification SEM images are below the corresponding overview. The blue arrow in panel (e) points at open porosity, and the red arrows in panels (e) and (f) point at newly neo-crystallized grains. The yellow arrow in panel (j) shows rounded pores at a grain boundary. Yellow arrows in panels (h), (k), and (l) point at newly formed grains at phase boundaries. The shear sense in Type I experiment images is indicated by arrows; for the shear zone angle, refer to Fig. 2. Compression direction is vertical in Type II experiment images. Black openings in exp. 662NN (j) occur during unloading and are relaxation cracks indicating stress concentration. Note that strain initiation in Type I experiments (a, d) occurs before the final experimental P–T conditions are reached, while strain initiation in Type II experiments (g, j) is at peak stress in the stress–strain evolution of the sample.
3.2 Microstructures – Type I experiments
In Type I experiments, the grain sizes are at first reduced in a localized fracture down to <0.5 µm, already before the experimental pressure and temperature (P–T) conditions are reached. The fracture crosscuts the initial foliation but follows the foliation direction separated by steps. Some portions are located along the foliation, and other portions are more vertical, connecting to the next inclined step (Fig. 4a, d). The resulting brittle zone is undulating, and its width varies between 10 and 100 µm (Fig. 4a). This zone has a cataclastic microstructure and high porosity (Fig. 4a, d). These basic geometric and mechanical features are reproducible and are observed in all four experiments (Table 1, Fig. 3).
Subsequently, viscous deformation localizes in these fine-grained, originally cataclastic, zones. Once the P–T conditions are reached and 5 %–7 % shortening is applied (exp. 631NN), the viscous shear zone has a dramatically reduced porosity (Fig. 4b), and its width narrows down to ∼20 µm. Grains are flattened and stretched, grain boundaries are more irregular, and a larger volume fraction of very fine grains develops (Fig. 4e). The surrounding host rock microstructures are identical to the starting material (e.g., slightly angular, same grain size; Fig. 4b). These microstructures indicate that the onset of viscous deformation was initiated within the fracture rather than in the unaffected host.
With increasing shear strain (exp. 618NW), porosity decreases further and evolving microstructures lead to further grain size reduction in such narrow zones (Fig. 4c, f). A throughgoing unloading crack (black) forms directly adjacent to the most highly localized deformation zone during decompression of the sample after deformation (Fig. 4f). In the viscous, very high strain zone, deformation has localized in an ∼2 µm to 200 nm wide zone (Figs. 4c, f and 5a, d).
On the SEM scale, we find elongated biotite/amphibole (bt/amp) grains in incompletely filled voids, indicating nucleation and growth (Fig. 5b). Rounded pores are observed at grain boundaries and triple junctions, often within albite (ab) and K-feldspar (K-fsp), and indicate dissolution or intergranular sliding processes (Fig. 5c; see Sect. 4). Feldspars display chemical changes through reaction (nucleation and growth) and thereby formation of smaller grains with different compositions adjacent to each other. By nucleation, the grain size is reduced and the feldspars become more mixed compared to the starting material (Fig. 5c). In the following, secondary minerals that grew during the experiments are indicated with a 2 after the abbreviation; e.g., secondary K-feldspar = K-fsp2 in contrast to primary K-feldspar = K-fsp1.
In many areas, reaction microstructures of primary biotites are observed (e.g., Fig. 5d, e), leading to reduced grain sizes and nucleating new grains (as verified by TEM). Primary epidotes (and biotites) are overgrown, with phases having a higher Z contrast in BSE images. These new phases can be characterized by Ca silicate with low Al content. These are most likely amphiboles, which cannot be identified with certainty due to their small grain sizes compared to the electron beam interaction volume (Fig. 5f), so mixed analyses are likely. They will be referred to as amphiboles (amp) below. No amphibole was contained in the starting material, and these new minerals must have formed during the experiment.
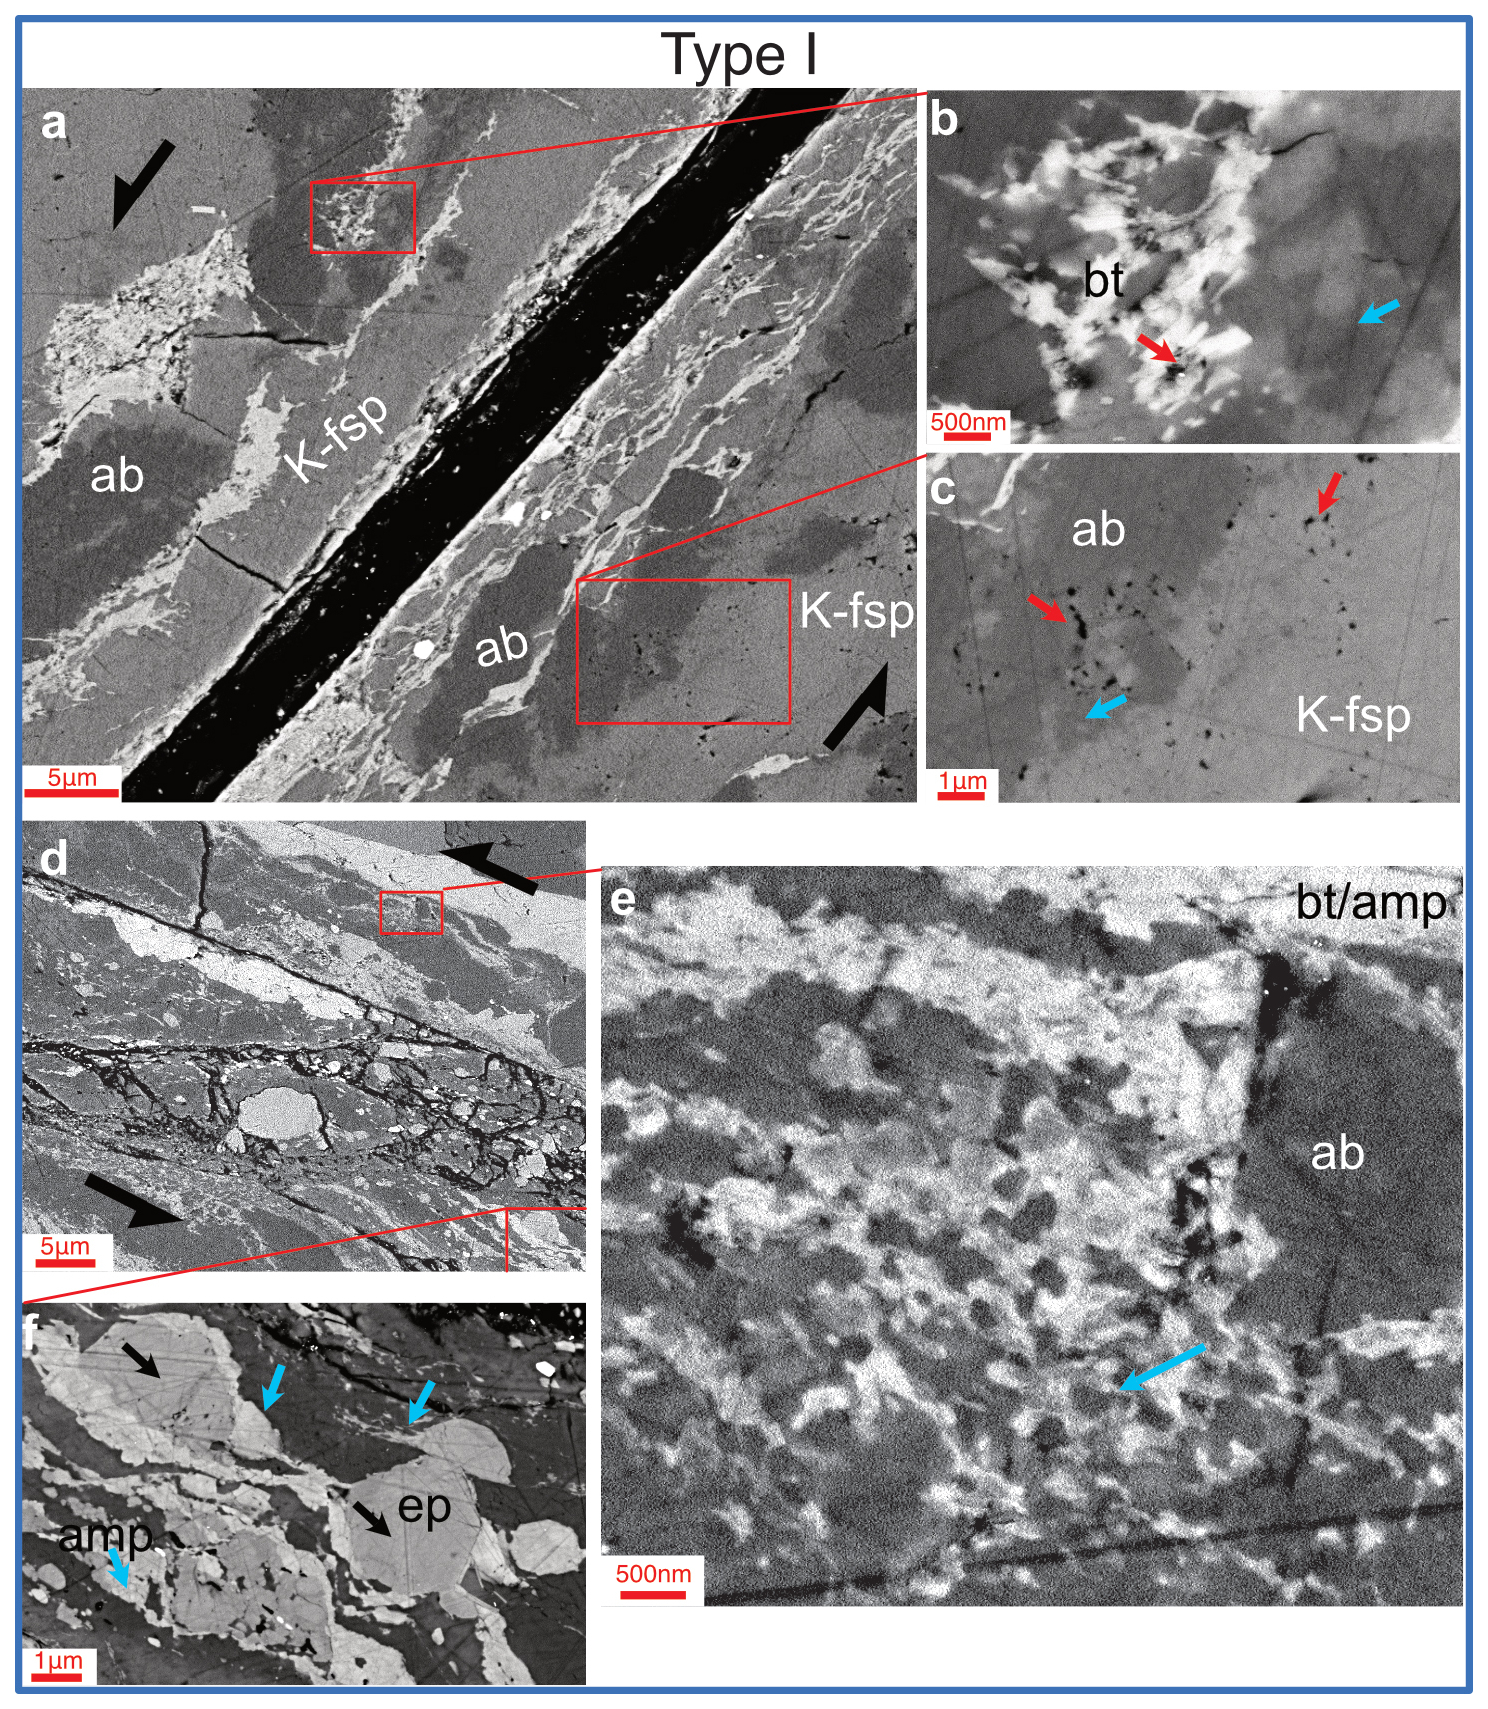
Figure 5Deformation microstructures in pre-cracked Type I experiments. SEM images from experiment 618NW. Panel (a) is an overview showing the locations of panels (b) and (c); panel (d) is an overview showing the locations of panels (e) and (f). Note the different BSE contrasts due to different SEM beam settings in panels (a) and (d). (b) Biotite grains with open porosity (red arrow) and patchy ab/K-fsp that cannot be resolved properly in SEM BSE images (blue arrow). (c) Porosity located in between small grains and grain boundaries within/between K-fsp and ab grains (red arrow); small fsp grains (blue arrow) and brighter-appearing ab/darker K-fsp are located between the parent grains. (e) Typical (symplectic) texture of bt and fsp, resulting in fine grains such as those indicated by the blue arrow. (f) Black arrows show ep1 overgrown by ep2/amp (blue arrows). The right-pointing blue arrow shows elongated amp forming a tail of previous ep.
The locations of TEM foils are marked in Fig. 6a–c, with (vertical) TEM foil in Fig. 6d for overview and a selection of TEM images in Fig. 6e–l. In TEM sections, extremely fine grains (∼50–200 nm) of bt, but also K-fsp, ab, qtz, ep, and amp, were observed. Most of such grains are dislocation-free. We see evidence for small, defect-poor grains of bt2 overgrowing bt1, while the lattice of bt1 is clearly strained with many dislocations (Fig. 6e). Other bt2 grains have idiomorphic crystal shapes, showing nucleation and growth. They often occur at grain boundaries of other phases (Fig. 6f, h). At the center of the shear zone, a thin nano-crystalline film is found (Fig. 6g). Despite the extremely fine gain size (2–15 nm), the zone is polymineralic and polycrystalline, as can be seen by the lattice fringes (Fig. 6g) and chemical maps (see Figs. S1–S4).
In contrast to the relatively defect-free new grains, some old grains still have high defect densities, for example, the >500 nm K-fsp in Fig. 6g. We assume that these grains are still primary K-fsp that was broken, most likely by the initial brittle crack (Figs. 2, 4a, d). Furthermore, these K-fsp1 relics are also characterized by their chemical inhomogeneity. This shows a depletion in K and enrichment in Na towards the rim.
A few small pores, mostly associated with feldspars, were observed (Fig. 6i), indicating that the fine-grained zones might not be as dense as they appear in SEM. In many areas, the different phases are well mixed, especially in fine-grained zones (Fig. 6j, k), but more monomineralic, fine-grained areas also exist locally. In those monomineralic areas, grain sizes are commonly >100 nm, whereas the very well mixed aggregates show grain sizes below 50 nm.
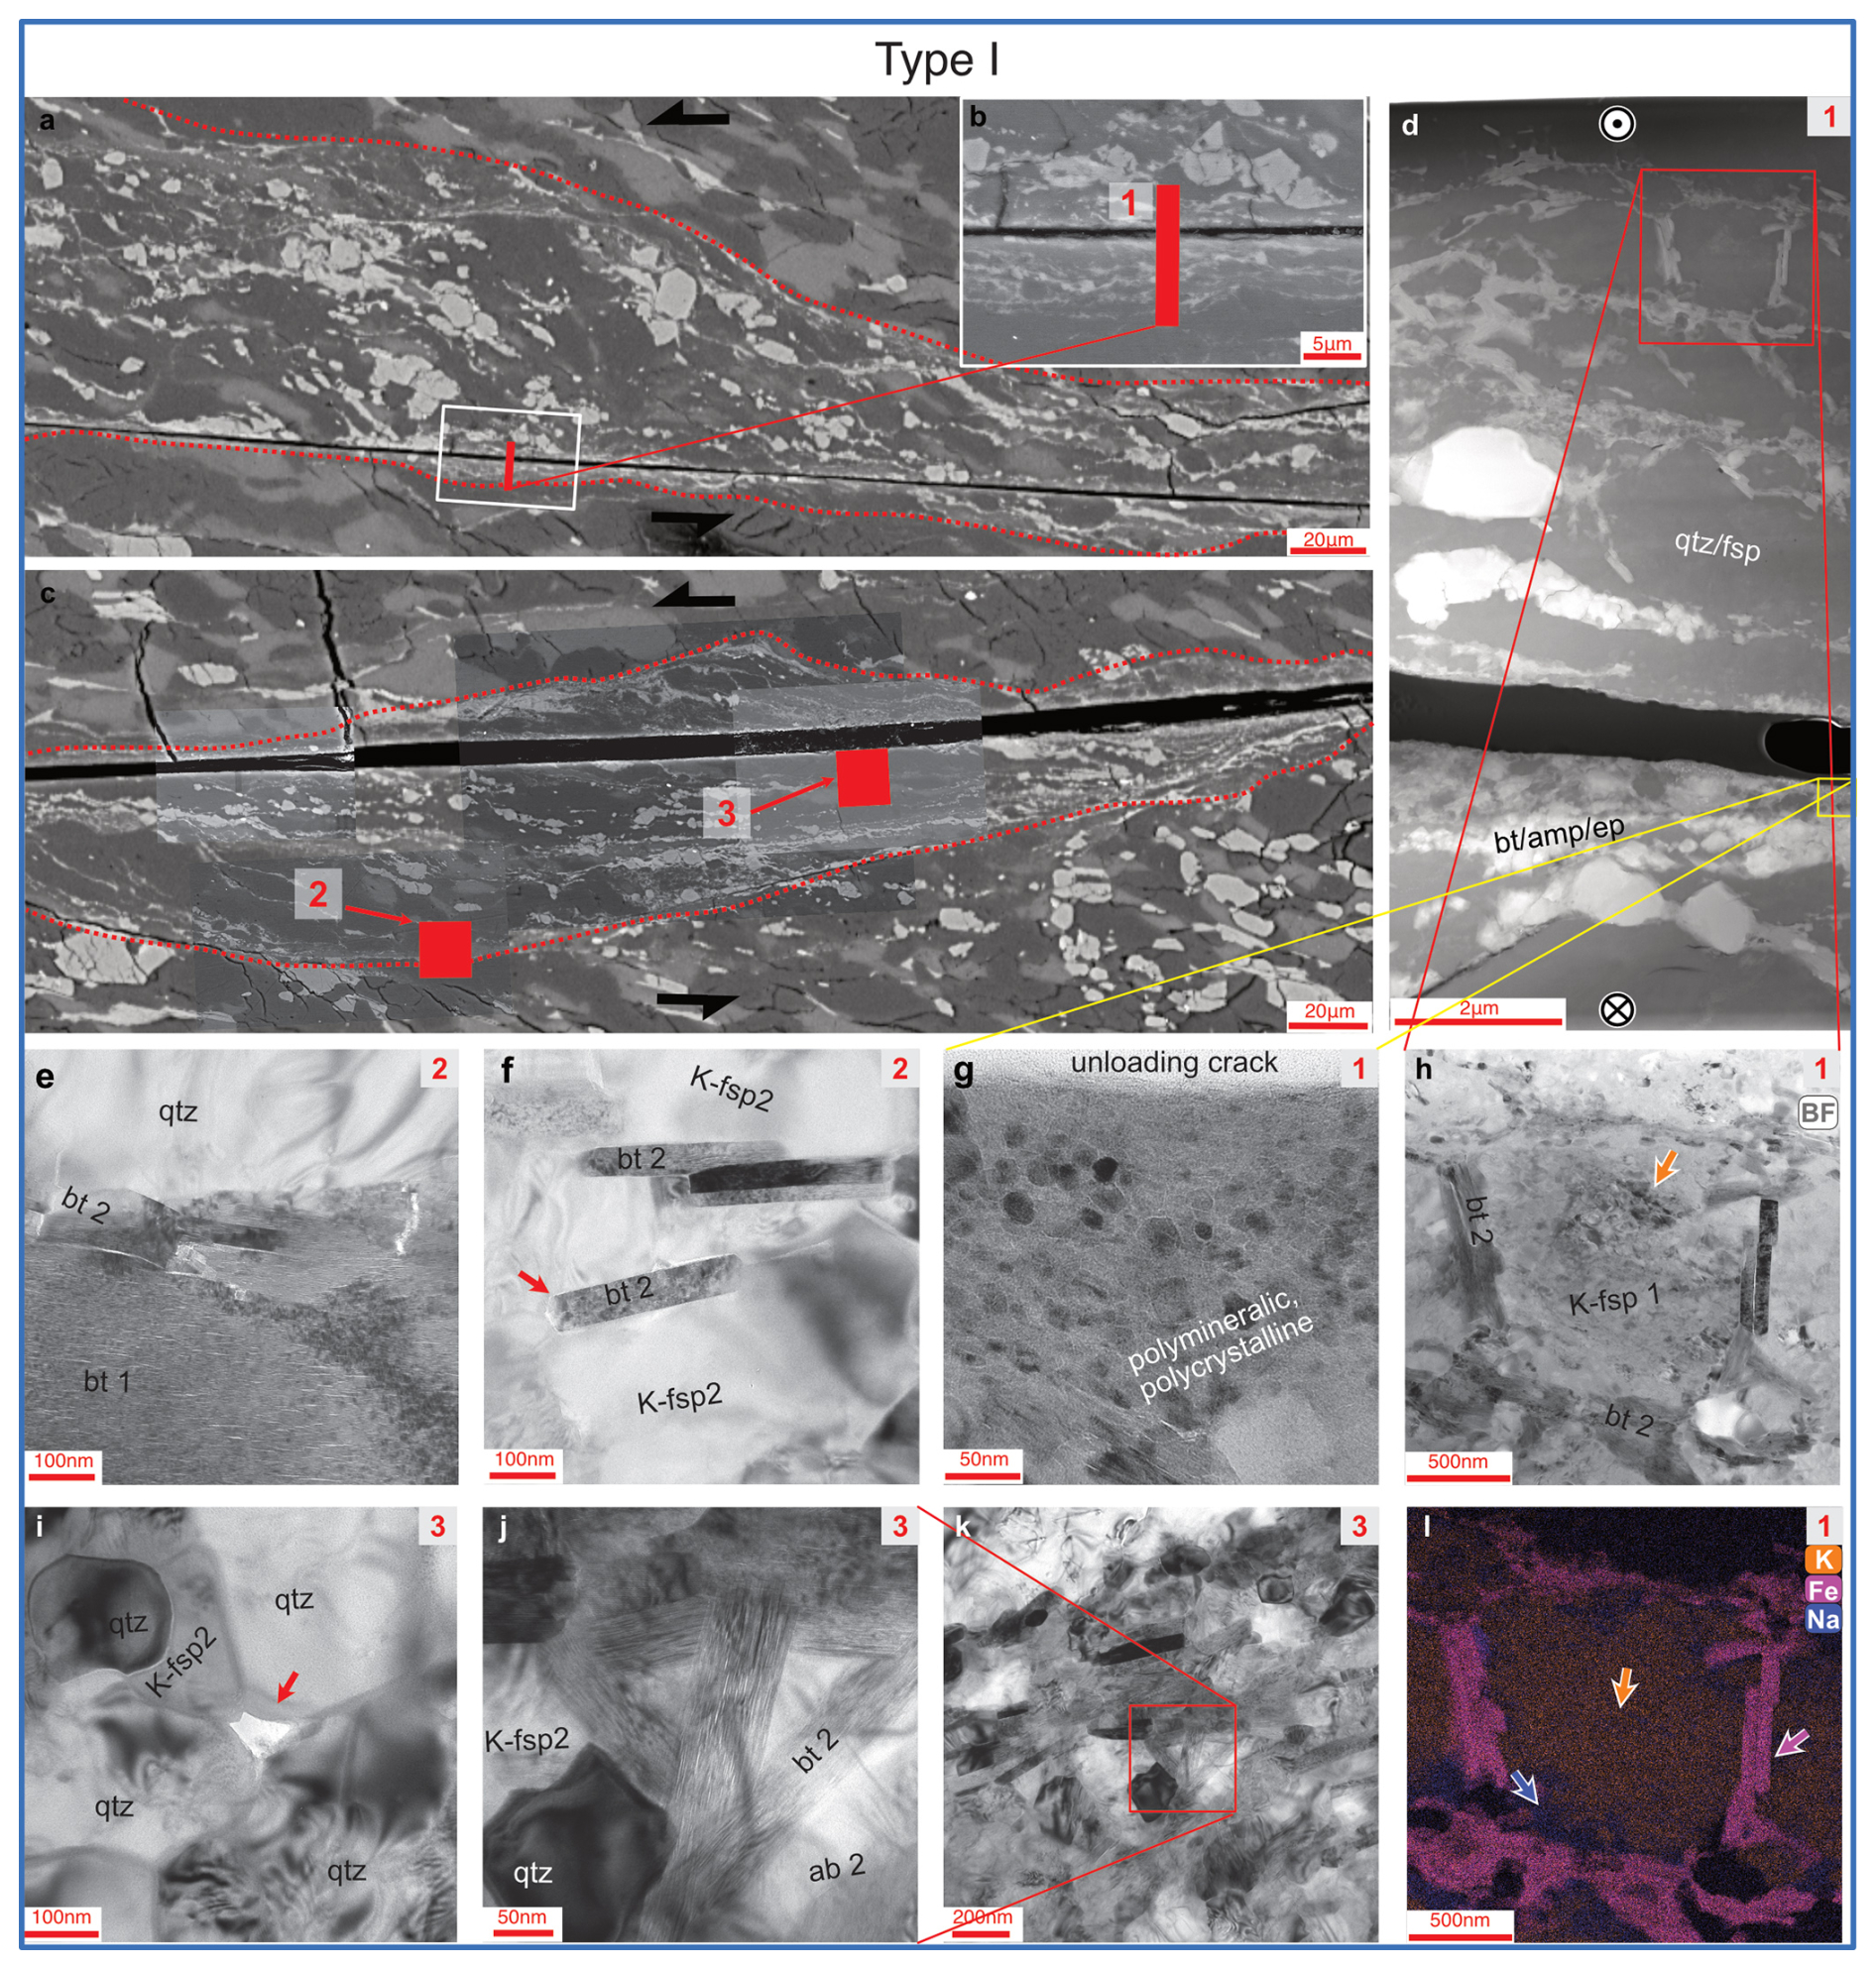
Figure 6TEM microstructural observations in Type I experiments. (a) SEM overview of locations for TEM sections within high-strain experiment 618NW. Rectangular sections are foils cut with a pyramidal technique to allow TEM sections parallel to the thin-section orientation. Elongated section 1 is a classical vertical foil, which was oriented perpendicular to the shear zone and direction (d). Numbers appearing in the top-right corners of panels (d)–(l) indicate the TEM section. Panels (d)–(g) and (i)–(k) are high-resolution TEM images, and panel (h) is an STEM BF image with a corresponding chemical element map in panel (l). Note the similar microstructures on the SEM (a–c) and TEM (d) scales. Panel (e) shows a typical overgrowth of primary bt1 by bt2. Panel (f) shows several bt2 grains growing between K-fsp grains. Note the habit of bt2 crystals. Panel (i) shows a pore with concave boundaries at a quadruple-grain junction (arrow). The qtz grains are partially dislocation-free and partially full of dislocations. Panel (j) shows the growth of bt2 grains between fsp and qtz. The qtz is completely dislocation-free. Panel (k) is an overview image for panel (j) and also shows phase mixing and a general alignment of elongated bt2/amp minerals. The locations of panels (g) and (h) are marked in panel (d), and a chemical map for panel (h) is shown in panel (l). Panel (g) is a highest-strain/most localized strain zone (overview in panel d). The light-gray area on the left is epoxy filling out the opening crack. Note the lattice fringes still visible in grains <15 nm. Just a few µm from panel (g) (see overview in panel d), a K-fsp grain (h, l) is overgrown by Fe-rich bt2 (pink arrow in panel l). The K-fsp has many dislocations (orange arrow in panel h). Note also the chemical zonation of the K-fsp (orange arrow) towards the Na-richer/K-poorer rim (blue arrow) (l).
Figure 7SEM images of Type II experiment 670NN with various DPC-characteristic microstructures. (a) Overview image, located in the center of the sample, shortening vertically. Panel (b) highlights nucleated bt2 at grain boundaries. Panel (c) shows ep1 (yellow arrow) overgrown by bt2 and/or amp (red arrow).
3.3 Microstructures – Type II experiments
In Type II experiments, the first stage of deformation occurs only after the final experimental P–T conditions have been reached and the sample is at differential stress (exp. 662NN versus 630NN). The first investigated stage is stopped at peak stress (exp. 662NN), with a slight barreling, which indicates that the strain is distributed preferentially in the lower part of the cylinder (Fig. 2d). SEM investigations show that there are conjugate shear bands developing. These are oriented ∼30° to the core axis (Fig. 4g) and are connected to the corners of the bottom piston. They offset the initial layering or foliation slightly (Fig. 4g), and the step-overs of the initial bands lead to openings, where porosity is induced. However, the orientations of some of the shear bands can be parallel to the preexisting mylonitic bands and do not follow crosscutting orientations in many parts of the sample (Fig. 4i, dashed yellow lines). Hence, these offsets do not define where deformation localizes. Additionally, rounded pores at grain boundaries appear (Fig. 4j).
With increasing strain, the barreling of the sample becomes stronger and deformation is distributed (Fig. 2e). At this stage, there is no geometric evidence for a finer-grained or bt-/ep-rich band to localize strain preferably with respect to a coarser or qtz-/fsp-rich band. Distributed across the whole sample, minerals appear more elongated (image analysis yields approximate grain aspect ratios of feldspar grains of 1:2.3; initial ratios were closer to 1:2). Grain boundaries of feldspars in particular show chemical exchange on a small scale, which leads to new composition at the sub-micron scale (Fig. 4h, k). Biotite grain boundaries are also becoming more irregular, and new grains (<100 nm) begin to form in their tails and at other mineral phase boundaries (Fig. 4h, k).
At high strains (bulk shortening 40 %, exp. 670NN), deformation further continues to be distributed in the lower part of the sample. The large amount of shortening also results in material that is being “squeezed” out over the edges of the bottom piston (Fig. 2f), and it is possible that these areas are most affected by external geometric conditions of our experimental setup. Therefore, we focus our microstructural observations on the central part of the sample only. There, the fsp and qtz grains are even more flattened than in the medium-strained sample (Fig. 4i, l; aspect ratio: ∼ 1:2.6). The shortening leads to rotation of the initial foliation, resulting in a shallower dipping angle than the initial 45°. The elongation of host grains marks two different foliations: one flat foliation ∼ 75° to the core axis/principal stress and one steeper foliation at ∼55° (Fig. 4i). The former, almost horizontal foliation resembles the preexisting foliation of the mylonite bands, while the latter 55° is related to the sample geometry (i.e., bottom pistons) and partially initially developed as conjugate shear zones. It is important to note that, at this stage in Type II experiments, there is no evidence for any localization in a narrow high-strain shear zone.
The boundaries of two feldspars are reacting, and it appears that these zones formed a fine-grained, mostly polymineralic mixture (Fig. 4l). Fine-grained, elongated minerals (bt2 and amp) also occur at grain boundaries of other phases (Fig. 7b). The size, orientation, and shape of the small bt2 indicate that these grains must have grown during the experiment. Just as in Type I experiments, primary bt1/ep1 grains are overgrown by small bt2/amp grains (Fig. 7c). This chemical change and growth also indicates that the grains must have formed during the experiment; i.e., they are synkinematic.
On the TEM scale, we chose one area in the maximum strained sample (exp. 670NN) to investigate the tail of an elongated K-feldspar grain and the transition into albite (see above; Fig. 8a). The primary K-fsp has an extremely high dislocation density (Fig. 8b), whereas, at its rim, new, small K-fsp and ab grains occur with partially no dislocations or very low dislocation density (Fig. 8b). The K-fsp and ab are only slightly mixed, but, in some areas, very fine grained ab is found within the initial and new K-fsp grains (Fig. 8b). Pores (∼50–60 nm) are observed at grain triple junctions and grain boundaries (Fig. 8c, d), and the finest observed grains have a similar grain size range (Fig. 8d). No significant changes in the chemical composition of the initial K-fsp towards the ab boundary were observed.
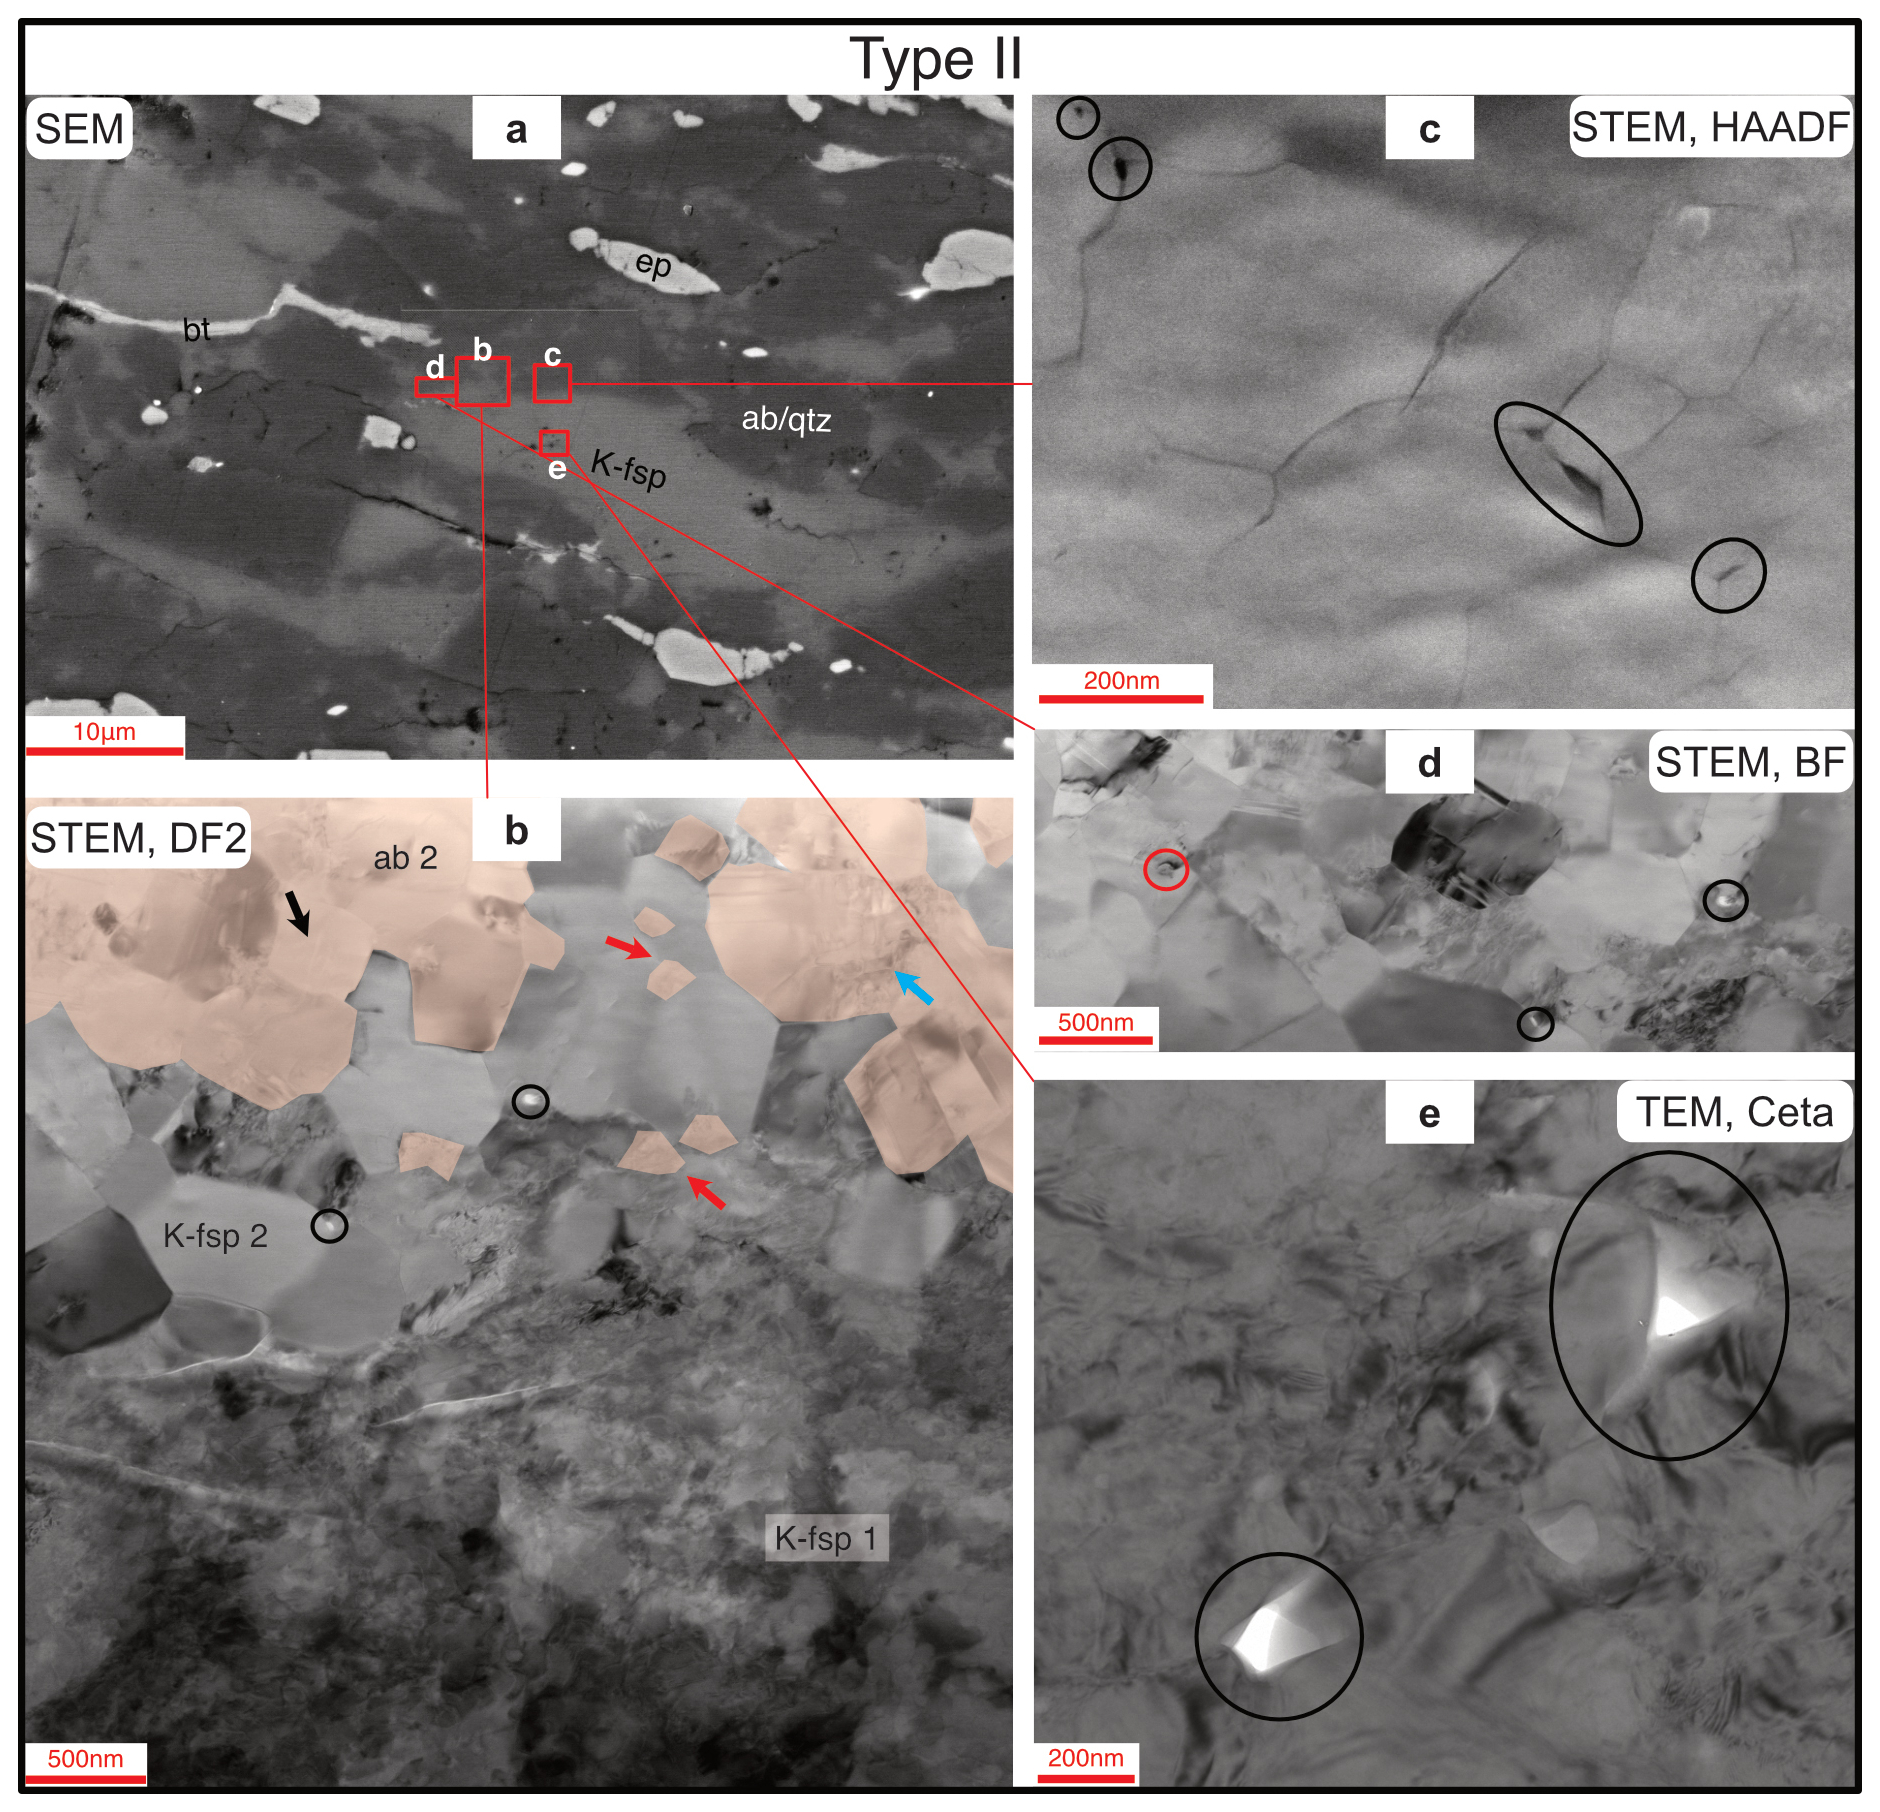
Figure 8TEM of the phase boundary between K-feldspar and albite in high-strain Type II experiment 670NN. (a) The SEM image shows the location of TEM foils at the rims of larger host grains. The K-fsp/ab interface does not appear sharp at this magnification, indicating that the resolution is not sufficient to resolve the grain sizes. (b) TEM foil, DF2 image with ab highlighted based on chemical maps (Figs. S1–S3). K-fsp1 shows a high dislocation density, while dislocation-free grains of K-fsp2 and ab2 (like the black arrow) occur at the phase boundary. The blue arrow points at dislocations inside of fine, newly formed ab2. Grains indicated by black or blue arrows are counted as large, and small, isolated grains of one fsp inside of another fsp phase (red arrows) are counted as small in the grain size analysis in Fig. 9. Black circles in panels (b), (c), (d), and (e) highlight open pores at triple grain junctions and grain boundaries. In panel (d), the red circle shows a nucleated grain with the same size as open pores in the same zone. Pores in panels (c) and (d) are in the polymineralic area containing K-fsp2 and ab2, while the pores in panel (e) are within the K-fsp1 host grain.
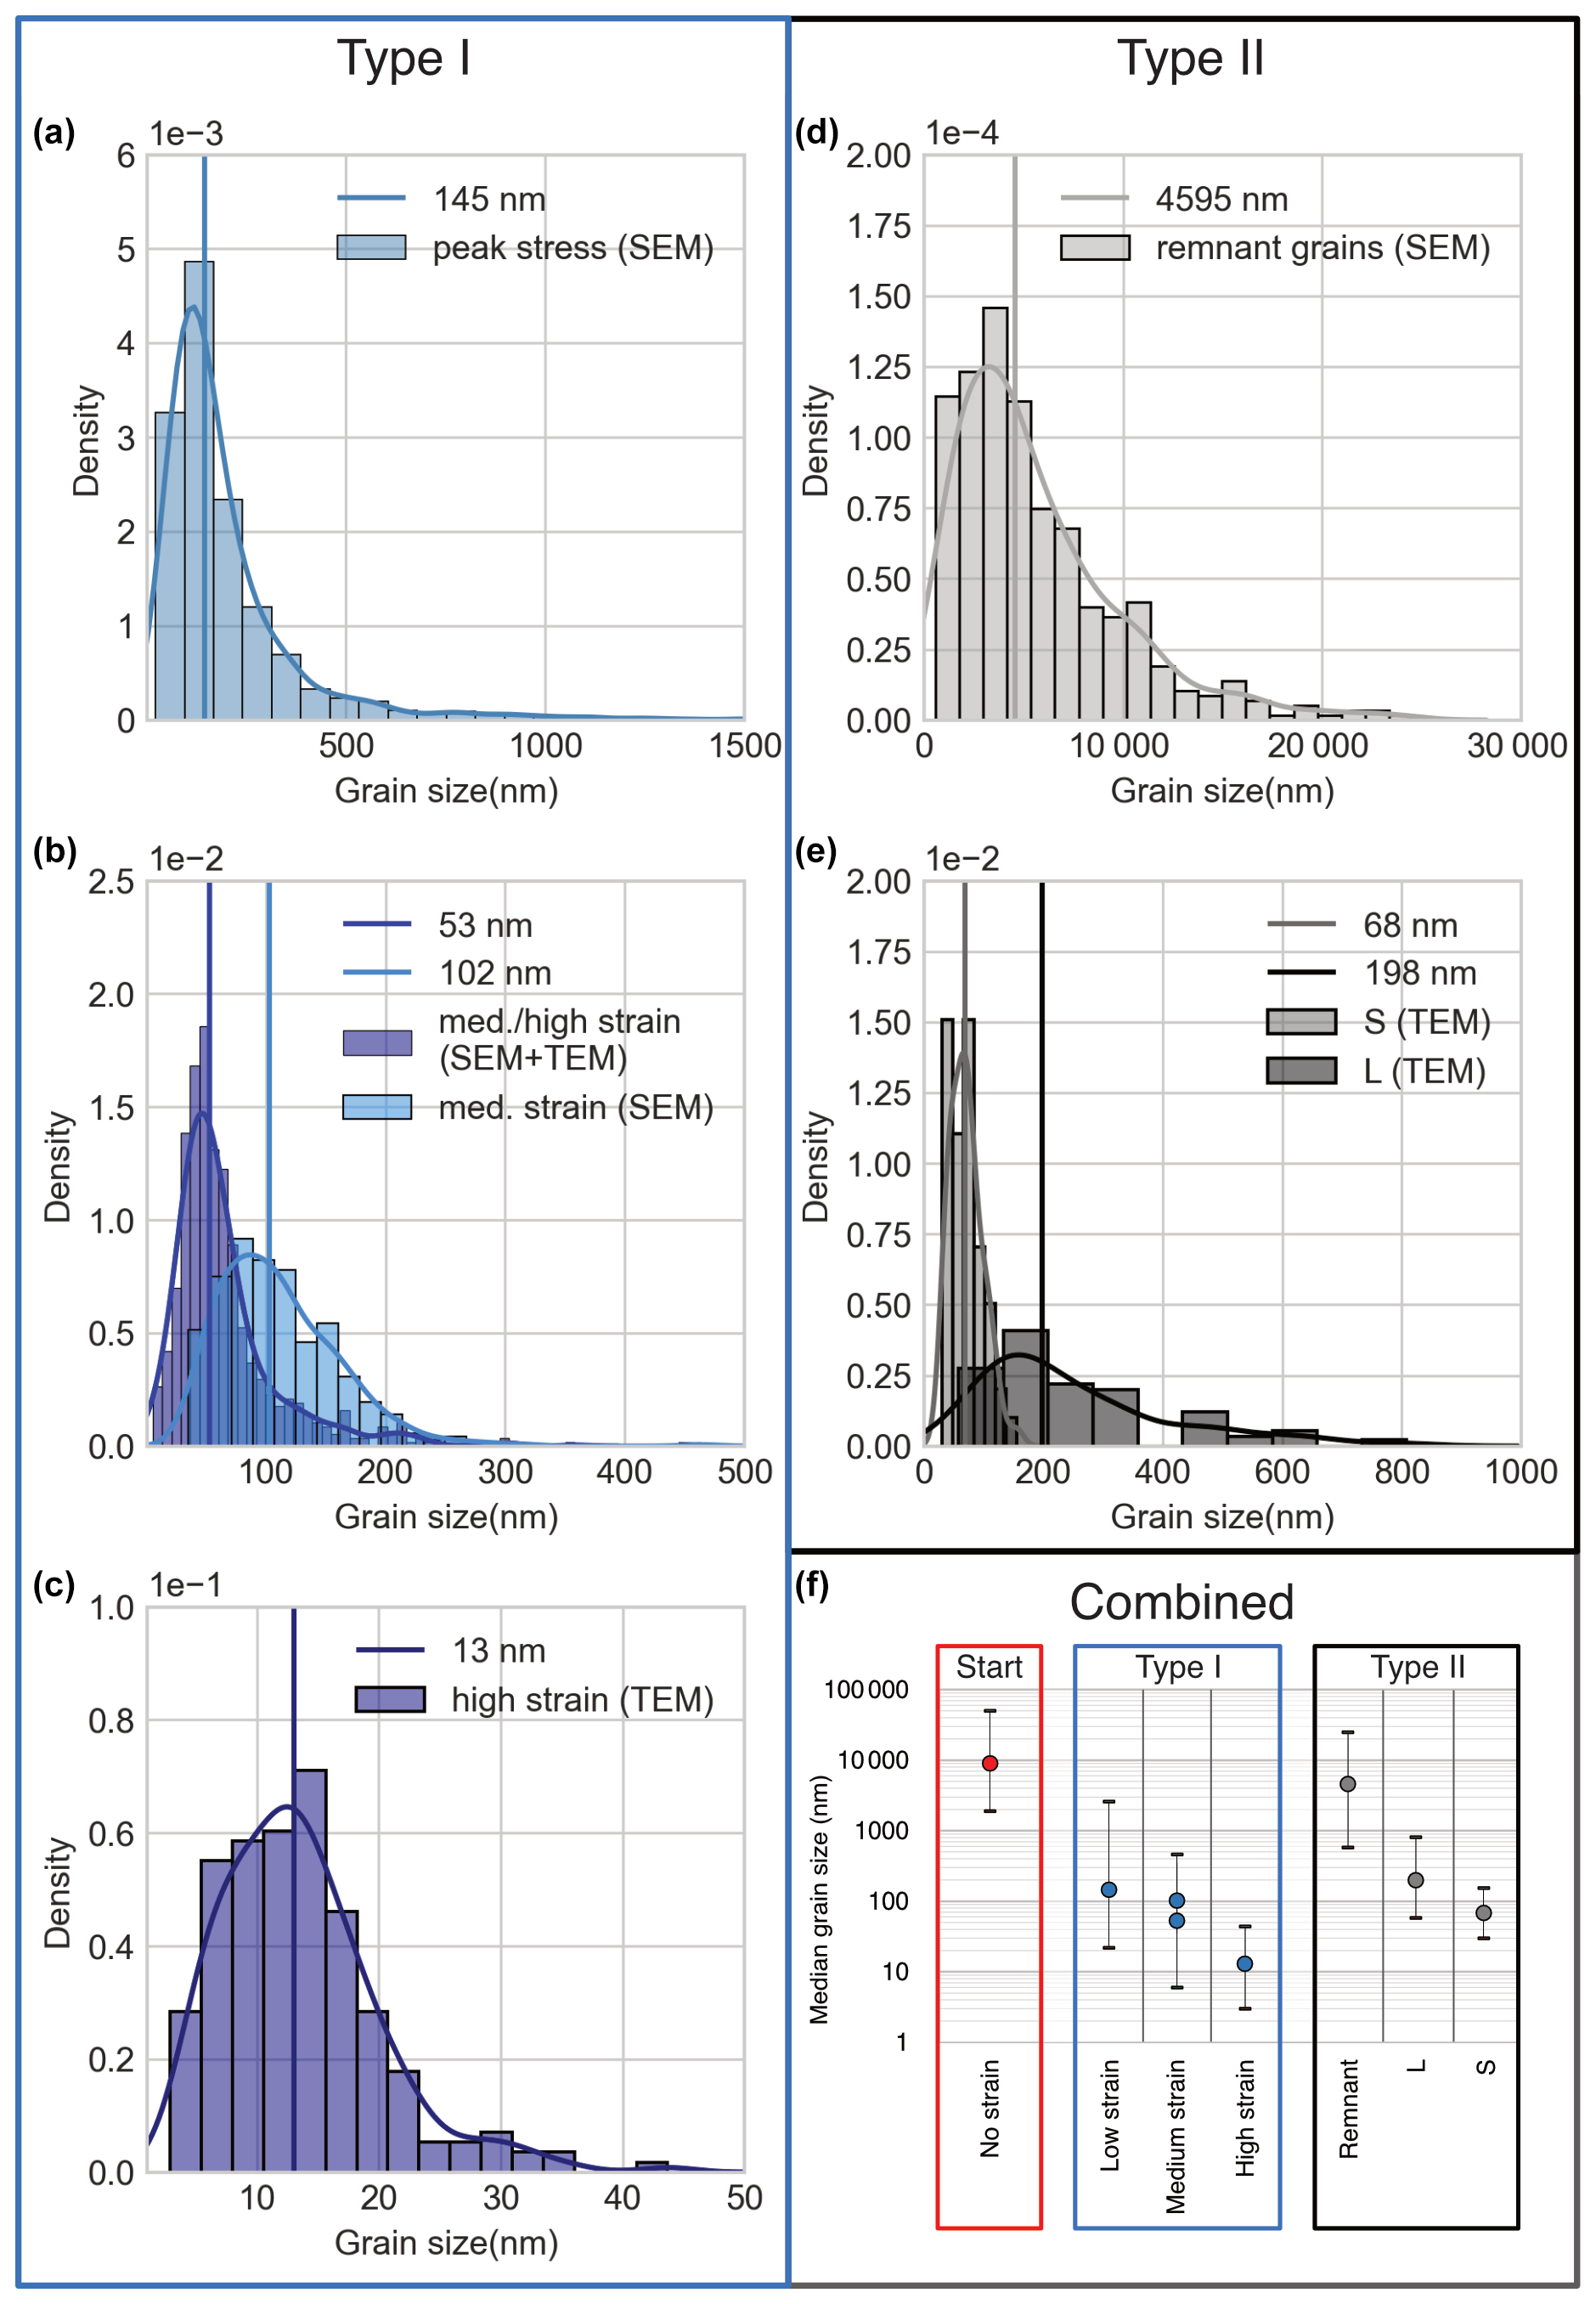
Figure 9Grain size distributions in pre-fractured (Type I) and non-pre-fractured experiments (Type II) and a comparison with the starting material. Grain size reduction in panel (a) occurs at peak stress, reduction in panel (b) occurs after shearing to medium strain, and reduction in panel (c) occurs only after shearing to very high strains. All these grain sizes are still present and were measured in the high-strain experiment 618NW. Panel (d) shows the grain size distribution of elongated large grains in high-strain sample 670NN, while panel (e) shows the measured grains in fine-grain zones between these grains. “S” refers to isolated small grains, while “L” refers to larger, often clustered grains (see Fig. 8). For a discussion on grains accommodating the strain, see the text. Grain size reduction is shown in two types of experiments on a logarithmic scale. The lines in the bar diagrams indicate median values. The dots in panel (f) represent the median grain size, while the error bars indicate the maximum and minimum grain sizes measured in the respective samples/zones. Type I grain sizes are measured in sample 618NW, and Type II grain sizes are measured in sample 670NN. All grain sizes are formed at different stages but still occur at the same time in the final experimental microstructure. See the text for definitions and further discussion on whether all grains still accommodate the strain in the final microstructure.
3.4 Grain size evolution in both experiment types
We investigated the grain sizes in both types of experiments and grouped these into differently strained zones based on the microstructural observations and spatial distributions (Fig. 9).
In Type I experiments, the grain sizes are measured in different zones of the localized shear zone of sample 618NW under the assumption that they represent the different stages of deformation (e.g., grain size gradients on SEM and TEM scales in Fig. 6). In Fig. 9a–c, we differentiate between peak-stress, medium-strain, and high-strain grain sizes. We assume that the corresponding grain sizes are formed at the respective strain stages. At peak stress in Type I experiments, the grain size in the deforming zone is reduced to a median grain size of 145 nm (equivalent to microstructures in Fig. 5b). There are still remnant grains from the initial brittle fracture (Fig. 5a) covering a nanometer (nm) to micrometer (µm) range (22 nm to 2.6 µm; Fig. 9a). Then, with increasing strain, grain sizes are reduced in these areas (e.g., as seen in Figs. 5e, 6e, f, h–l) to medians of 102 and 53 nm (measured by SEM and TEM, respectively; Fig. 9b). This grain size is at the lower limit of SEM resolution and upper limit of TEM resolution. Therefore, both together give a more indicative grain size range of 6 to 463 nm. The grain size in the narrow (<200 nm) zone in Fig. 5d, g reduces to a median of 13 nm with a range of 3 to 44 nm (Fig. 9c).
It is to be noted that, with each grain size reduction step, the zone in which the strain is accommodated also narrows (see Part 2, Nevskaya et al., 2025). As a result, with a constant vertical displacement, the actual strain rate accelerates, and the grain size reduces gradually. This relationship becomes relevant for the stress–strain evolution and grain size sensitivity of the samples which is discussed in detail in Part 2 (Nevskaya et al., 2025).
In Type II experiments, two types of grain sizes are differentiated. Very fine grains, which are difficult to resolve with the SEM, occur at phase boundaries of large feldspars. The large grain size is manually drawn in SEM images, and a median of 4.5 µm, with a range of 580 nm to 25 µm is obtained (Fig. 9d). These largest grains are only ∼50 % smaller than the starting grain size of the initial ultramylonite (see also Fig. 10) as opposed to the very fine grains. In the fine-grained zone between the remnant grains, two different grain sizes are differentiated: (1) small grains (named group “S”) are isolated phases between the other type of feldspar; (2) larger grains (named group “L”) represent monomineralic clusters of small grains (derived from one fsp). We measure median grain sizes of 198 nm in the “L” feldspars, with a range of 58–808 nm (darker histogram in Fig. 9e). The “S” grain size median is 68 nm with a range of 30 to 155 nm (brighter histogram in Fig. 9e).
4.1 Deformation mechanisms
4.1.1 Evidence for dissolution–precipitation creep
In both experiment types, after deformation, all phases of the starting material (qtz, both fsp, bt/ep) are still observed, even in fine-grained zones, but slight chemical changes occur as well as the formation of new amphibole. We measure chemical changes in the feldspars, too (e.g., Fig. 6h, l). Furthermore, some biotites have an Fe enrichment with respect to the previous biotites. In addition, the two groups (old and new grains) can be discriminated by high dislocation density versus almost dislocation-free grains. The chemical changes and gradients show that the grains must have reacted during the experiment, indicating the existence of local chemical potentials for ionic exchange at experimental P–T conditions.
With the low stresses measured for the deformation (far below the Goetze criterion σD≥ Pc), it is very unlikely that the extremely fine grains (observed in the high-strain samples in Figs. 6g, 9c) have formed by brittle processes. The elongated minerals are parallel to the shear plane (Fig. 6d, f, k) or filling gaps between grains as in Fig. 6h. Coupled with the densely packed phases, small grain size, and narrow size range and their distinct crystal habitus, this geometry suggests stress-oriented growth (Imon et al., 2004) rather than rigid body rotation of grains after fracturing.
In Type II experiments, three types of feldspar grains were identified, where relict grains have a high dislocation density, whereas L (large) and S (small) grains have distinctive low dislocation densities (as in Figs. 8 and 9). The newly formed L grains have a broad grain size range, while the S-grain size range is narrower, but there is an overlap in their distribution. The newly formed grains have only a very slight change in chemistry compared to their host grain/porphyroclast. (Slight) phase mixing between ab2 and K-fsp2 (Fig. 8b), dislocation-free grains, and partially well developed grain triple junctions (Fig. 8b) indicate nucleation and growth rather than dynamic recrystallization via subgrain or bulging recrystallization. The occurrence of pores along grain boundaries and grain triple junctions (while the nucleated grains “S” have a similar size compared to that of the pores) shows that the opening and filling of the pores occurs simultaneously through grain boundary sliding and rapid nucleation within the opened cavity (Ebert et al., 2007; Herwegh et al., 2011; Herwegh and Jenni, 2001; Linckens et al., 2011, 2015). The formation of these synkinematic boundary pores was first described for geomaterials by Etheridge et al. (1984) and for rock analog materials by Ree (1994). More recently, the process has been referred to as creep cavitation (Fusseis et al., 2009; Gilgannon et al., 2017, 2021).
All observations of mechanical data, chemical changes, dissolution and growth of minerals, and grain size reduction given above clearly demonstrate that the predominant deformation mechanism in both types of experiments is dissolution–precipitation creep (DPC) rather than dislocation creep or frictional flow. The chemical potential mentioned above promotes diffusive transport, while the opening of nanometer-scale voids in dense high-strain areas by grain boundary sliding serves as nucleation sites for new precipitates. Any DPC mechanism results in a polymineralic mixture, where phases are pinning each other, inhibiting/reducing grain growth (e.g., see Herwegh et al., 2011, and references therein), thereby enhancing the efficiency of DPC in fine-grained pinned parts of the polymineralic mixture. The pinning leads to a stable microstructure and differentiates the DPC process in our polymineralic rocks from DPC in monomineralic systems. Phase mixing and pinning may be the reason for the onset of DPC in our samples at considerably lower temperatures than, for example, observed in monomineralic quartz (e.g., Ghosh et al., 2022, 2024; Richter et al., 2018).
The DPC in our experimentally deformed polymineralic granitoid mylonites has far-reaching consequences. The occurrence of viscous deformation in our samples at 650 °C versus mostly frictional deformation in coarser granites in other experimental studies conducted at the same temperature (Pec et al., 2016; Pec and Al Nasser, 2021) demonstrates that the initial grain size is very important for a brittle to viscous transition (Sun and Pec, 2021). In our case, an ultramylonite with a median grain size of ∼10 µm is sufficient to activate DPC at relatively fast strain rates of 10−6 s−1 and locally even faster. At these experimental conditions, the onset of DPC cannot be predicted from monomineralic quartz flow laws (e.g., Fukuda et al., 2018; Ghosh et al., 2022; Hirth et al., 2001) and should also be investigated experimentally for other polymineralic rocks in the future.
4.1.2 Rate-limiting steps
The rate of DPC is controlled by the rate-limiting step of one of the major processes (dissolution, transport, precipitation; Gratier et al., 2013; Raj, 1982; Rutter, 1976). In monomineralic systems or in metals, transport (i.e., diffusion) is generally assumed to be rate-limiting. In these chemically and crystallographically simple systems, the dissolution and precipitation process is described by well-defined source and sink terms (e.g., Raj, 1982). Chemical potential differences exist in monomineralic systems as the consequence of different orientations of grain boundaries with respect to deviatoric stress (Raj and Ashby, 1971), but the quantification of localized values of the chemical potential is currently impossible to be determined for polymineralic systems. For example, in addition to local stresses, the chemical potentials are also dependent on the (metastable) equilibrium conditions of the mineral phases reacting with each other. It is observed that K-feldspar shows chemical gradients towards the rim (Fig. 6h, l) and that new phases with different composition nucleate in our samples – both in Type I and Type II experiments. Hence, the chemical potential gradient is a combination of local stresses and local chemical equilibrium of different phases and is very difficult to define. Consequently, a quantitative evaluation is not feasible. In the following section, we attempt to assess these parameters qualitatively.
In pressure solution or diffusion creep models, minerals dissolve at high-pressure sites and precipitate at low-pressure sites (Arzt et al., 1983; Elliott, 1973; Gratier et al., 2009; Niemeijer et al., 2002; Weyl, 1959; Wheeler, 1992). Often, the precipitates overgrow an existing grain, leading to a change in its shape. In polymineralic systems, as in this study, an extremely fine grained, partly equigranular, polymineralic mixture of phases indicates that the precipitates preferably nucleate and grow, as this mixture could not have formed though dynamic recrystallization (Ebert et al., 2007; Herwegh et al., 2005, 2011; Linckens et al., 2011, 2015). Another component during dissolution and precipitation is the transport of the material from source to nucleation site. This transport is assumed to be diffusive along grain boundaries. The phase mixing in the fine-grained zones indicates that the diffusion length scale typically exceeds at least one grain size length in the deforming zone (largest grains being ∼200 nm). K-fsp1-ab1 phase boundaries in Type II experiments do not show much phase mixing or transport of, e.g., bt2 or amp into the fsp. Similar observations were made in the lower strain areas in Type I. Hence, the diffusive transport length is at least the grain size and is influenced by porosity/permeability. Therefore, the transport of elements through the system might be more efficient than in classical pressure solution (Wheeler, 1992) and is enhanced by initial porosity from the initial brittle fracture and phase mixing as in Type I experiments. By applying synchrotron-based scanning small-angle X-ray scattering for the natural starting material of our experiments, Schrank et al. (2025) demonstrated the occurrence of nano-porosity and a substantial pore volume for this dynamic nano-porosity. All these observations imply that the fluid advection through initial porosity plays an important role in driving DPC both in nature and in the experiment (see Sect. 4.1.4).
The growth of grains, as it is typically observed in monomineralic systems, is inhibited/reduced through pinning by other phases. Brodhag et al. (2011) demonstrated that, under static conditions, coupled grain coarsening occurs, where the aggregate coarsening depends on growth kinetics and on the amount, size, and spatial distribution of the slow-growing phase (Herwegh et al., 2011). Ebert et al. (2008), Herwegh et al. (2005, 2011), and Linckens et al. (2011, 2015) showed that coupled grain coarsening also occurs in naturally deformed polymineralic mylonites, with grain sizes being indicative for specific physical deformation conditions. Based on our new experimental insights, we infer that the dissolution rate of minerals is enhanced by a high dislocation density in parent grains and at the same time assisted by chemical driving potentials. Fast dissolution rates may counteract grain growth if newly nucleated grains are being dissolved as well. In the case of our granitoid mylonites, the combination of the three key parameters leads to more efficient strain accommodation than in coarse or monomineralic samples, accommodating fast strain rates of s−1 (see Part 2, Nevskaya et al., 2025).
In high-strain samples of Type I experiments, there is no evidence for one of the phases being an inhibiting factor in the overall dissolution and precipitation cycle, since all the phases, including quartz, are observed in the highly localized zone. Hence, instead of a single volumetrically dominating matrix phase with small amounts of a second phase (Herwegh et al., 2011), in our experiments, the pinning of all phases (see quantities above) by each other leads to a locally stable microstructure in a small-scale micro-chemo-mechanical equilibrium that is specific to the polymineralic assemblage. The dominant operation of DPC because of a stable small grain size results in a weak rheology and viscous behavior for all phases in the system at low temperatures but fast strain rates, which would not be possible in monomineralic systems. This is supported by extrapolation to natural conditions and comparison with various quartz and feldspar flow laws in Part 2 (Nevskaya et al., 2025).
4.1.3 Role of feldspars for dissolution–precipitation creep
With stable and coexisting qtz, K-fsp, ab, ep/bt, and amp, our polymineralic system is too complex and our current knowledge too limited to combine the role of the growth/dissolution kinetics and spatial distribution of individual minerals quantitatively. However, we can focus on the feldspar system, given its volumetric dominance in our samples, which is ∼54 wt % (albite 37 wt % and K-feldspar 17 wt %). Especially at the interface of K-fsp and ab grains in Type II experiments, the role of reactions between feldspars towards their stable end-member composition becomes important (e.g., Fig. 8). As known for the different solvi in feldspars (e.g., Fuhrman and Lindsley, 1988), the K-fsp component in the Na-fsp and the ab component in the K-fsp are increasing with temperature. Figure 10 shows the expected feldspar compositions for starting material and experiment in a calculated binary phase diagram. In our samples, we see this change in compositions qualitatively, for example, in Fig. 6l. Owing to this exchange, we observe in SEM images the backscatter contrast of albite becoming higher in areas of contact between K-fsp and ab, where compositions approach equilibrium compositions. Hence, in our granitic system at 650 °C and 1.2 GPa, chemically induced driving potentials for dissolution and precipitation of feldspars become important, especially in fsp-rich areas such as band type B (Fig. 1b, d).
It has been inferred by various studies from the field and from experiments how the reactivity of feldspars might lead to enhanced solubility and efficient grain size reduction (Fitz Gerald and Stünitz, 1993; Hippertt, 1998; Marti et al., 2018; Stünitz and Fitz Gerald, 1993; Stünitz and Tullis, 2001). This is also supported by the very fine grains nucleating at the phase boundaries between K-fsp and ab in Type II experiments (Fig. 8). The observed microstructural evolution is very similar to the feldspar-rich polymineralic experimental samples of Marti et al. (2018) or the natural examples of Behrmann and Mainprice (1987), Lee et al. (2022), or Menegon et al. (2008), where DPC accommodated or accompanied by mineral reactions is inferred, pointing to an applicability of our observations beyond granitic systems. This focuses the key parameters needed to activate the observed type of DPC to fine grain sizes, phase mixing, and chemically induced driving potential.
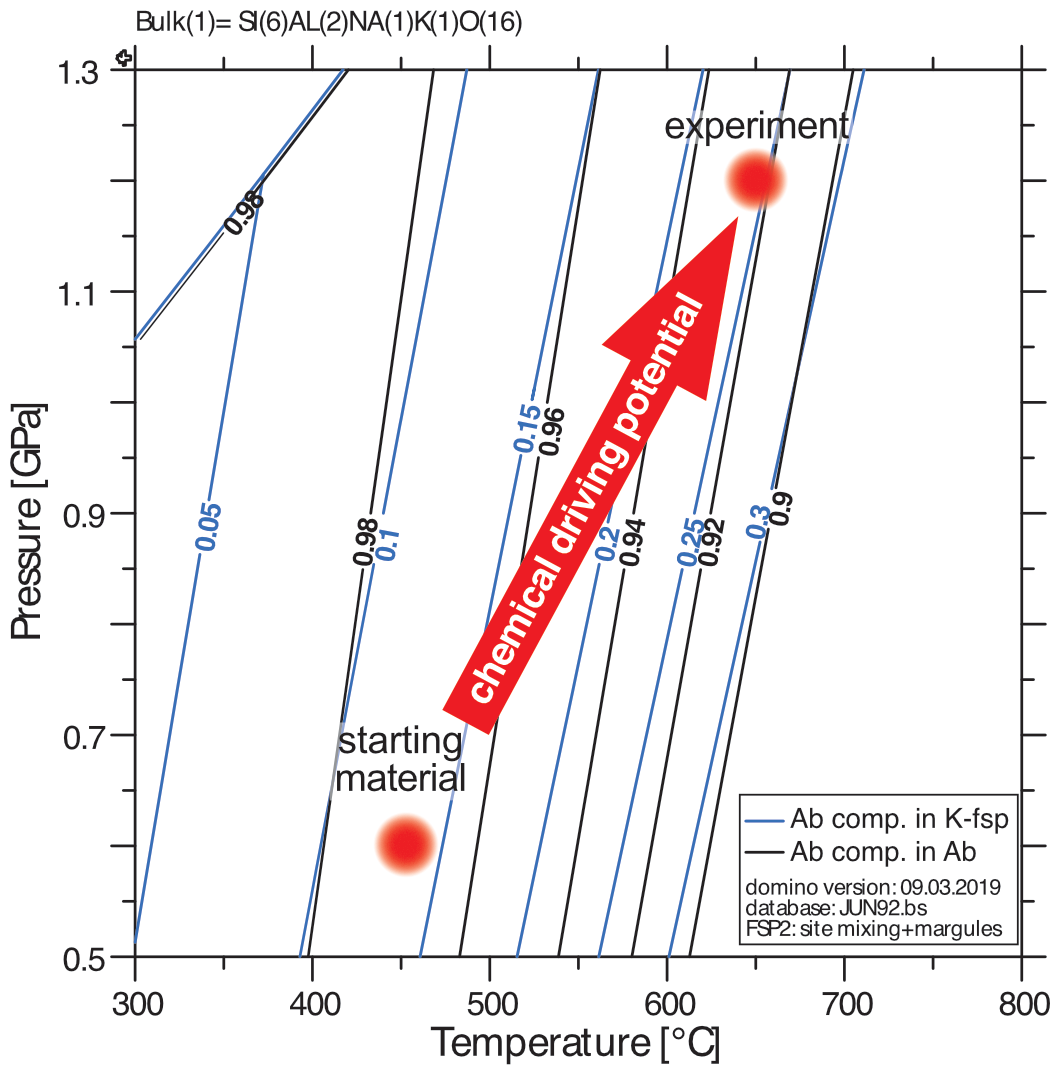
Figure 10Pressure–temperature phase diagram calculated for a two-feldspar system of K-feldspar (K-fsp) and albite (ab). The difference in feldspar composition between the starting material and the experimental condition induces a chemical driving potential towards the stable composition at experimental P–T conditions, where ab incorporates more K-fsp component and K-fsp incorporates more ab component.
4.1.4 Role of porosity
The observed DPC differs from classical diffusion creep (Nabarro–Herring creep or Coble creep) by possible advective transport of fluid and/or diffusional transport in a local bulk fluid or distributed fluid film. Porosity and permeability affect the deformation processes by enhancing fluid pathways. Therefore, fluid pathways and porosity are important parameters to evaluate and compare between experiments. In our experiments, two types of porosity are observed: (1) brittle dilatation forming during loading or at peak stress and (2) shearing-induced creep cavities forming during DPC.
The first type of porosity is observed in Type I experiments, where the initial fracture formation results in the creation of a significant quantity of localized porosity (Fig. 4). This porosity and permeability permits the migration of fluid to the comminuted grains. In conjunction with the fine grain size, this porosity is instrumental in achieving near-steady-state conditions in an efficient manner. With increasing viscous deformation, the grain size decreases further, the fractured aggregates compact, and the porosity decreases. With increasing strain, local stress differences may allow new phases to grow in between stretched and separated grains, like the K-fsp1 in Fig. 6d and h with bt2 growing around it. Especially at highest strain, the original fracture-induced porosity is almost entirely lost through the compaction and growth of minerals (Figs. 4–6).
In Type II experiments, conjugate shear zones form, as seen in low-strain experiments, where locally minor porosity is created. The deformation does not localize in these zones, but this local porosity might serve as fluid pathways. At high strains, these openings are closed (Fig. 4). The main shear plane follows the primary mylonitic foliation and is partially influenced by sample geometry (e.g., bottom piston) and does not follow these initial openings. Hence, the role of the initial porosity is negligible, especially compared to pre-fractured samples.
The second type of porosity forms during the deformation at triple grain boundaries and grain boundaries (Fig. 8) and is a result of grain boundary sliding. New grains nucleate in these cavities (Fig. 8d). Indications for these creep cavities (Fusseis et al., 2009) are observed in both types of experiments (Figs. 5c, 6i, 8). In both experiment types, only very little of this type of porosity remains because nucleation and growth rapidly and efficiently fill any cavity formed during DPC and grain boundary sliding. Hence, this porosity is highly dynamic, where individual pores are created while others disappear, resulting in a dynamic permeability. As the pores appear isolated, diffusive mass transport must occur along grain and interphase boundaries. This process is likely to be accommodated by grain boundary sliding in a manner similar to the granular fluid pump during creep cavitation (Fusseis et al., 2009). By applying synchrotron-based scanning small-angle X-ray scattering for the natural starting material of our experiments, Schrank et al. (2025) demonstrated the occurrence of nano-porosity and a substantial associated pore volume for this dynamic nano-porosity, indicating the importance of nano-porosity for DPC and mass transfer. Note that our experiments indicate that relatively small fluid quantities and their continuous recycling in the deforming polymineralic aggregates are sufficient, not necessarily requiring open systems with large fluid quantities migrating through shear zones.
4.2 Applications to nature: the role of grain size and preexisting fracture for the onset of DPC in polymineralic shear zones
4.2.1 (Steady-state) grain sizes and flow stresses
An important point for reconstructing the shear zone evolution in natural rocks is whether the grain size is stable at certain strain rates, pressures, and temperatures. One key factor for models will be the surface energy of a system that is increased by grain size reduction or reduced by grain growth. The grain growth and grain size reduction rates may balance each other at steady state. From such an assumption, combined with internal energy contributions (i.e., dislocation density), grain size piezometers Derby, 1991; Twiss, 1977), and P–T- and strain-rate-sensitive paleowattmeters (Austin and Evans, 2007, 2009) are developed. Our experiments show that an additional parameter for the total energy budget of the shear zone in both settings is the chemical driving potential of constituent phases (e.g., feldspars and biotites). The chemical driving potential of metastable phases enhances the dissolution rate in samples during DPC and thus may contribute to enhancing the strain rate. In any case, the metastability needs to be considered in the energy balance for potential steady-state conditions. At the same time, pinning inhibits the grain growth, leading to a mechanically weak stable microstructure. Many case studies estimate stresses and strain rates from grain sizes calibrated for dislocation creep regimes in monomineralic systems that lack chemical driving and pinning components. Consequently, neither piezometers nor paleowattmeters are thought to be applicable to DPC in polymineralic rocks.
In some recent studies, paleowattmeter have been applied to diffusion creep systems or compared to systems where a diffusion creep component might be contributing to the deformation (Ruh et al., 2024; Tokle and Hirth, 2021), but chemical driving potentials, nucleation rates, or other diffusion parameters and polymineralic chemistry are not included. It is implied that feldspar grain size reduction leads to a very fine grain size, resulting in deformation in the diffusion creep regime, while quartz remains deformed by dislocation creep. Tokle and Hirth (2021) calibrated the paleowattmeter to match quartz experiments. To evaluate the applicability of paleowattmeters to the granitoid system at our experimental conditions, we firstly need to assess the representative stable grain size at corresponding stresses and strain rates in our experiments.
Provided the strain is progressively localizing in narrower zones during the whole deformation history, the strain rate is increasing in the narrowing deforming zone. In Type I experiments, we assume that, at peak stress, the coarse, earlier formed grains were predominantly accommodating strain in the originally wider zone. During subsequent stages, the near-steady-state stress is accommodated within the more localized zones consisting of smaller grains. We hence obtain two systems in the same experiment, with two stresses (peak and flow stress) and two different grain sizes and strain rates. This technique gives parameters to evaluate a potential strain rate and grain size sensitivity in these rocks, which we also used to estimate approximate grain size exponents for a constitutive equation in Part 2 (Nevskaya et al., 2025).
Although strain in the non-pre-cracked Type II experiments is more distributed, the observed mechanical weakening and localized grain size reduction at grain/phase boundaries indicate that these experiments have not reached steady-state microstructures yet. The strain rate is not homogeneous, and two end-member strain rates are active at the same time: a slower strain rate for the large grains and a fast strain rate for the narrow fine-grained zones in between. If mostly the fine grains are accommodating the strain (interconnected weak layers; e.g., Handy, 1994a), the bulk strain rate will underestimate the actual strain rate of these fine-grained zones.
The DPC of Type II shear zones is distributed over larger regions of the samples, and there a large volume of primary grains is still preserved. From observations of the pores, we infer that “S” grains represent the grain size of newly nucleated grains, followed by grain growth to a grain size of “L” grains. This grain size reduction achieved through nucleation during DPC and grain boundary sliding is very efficient and leads to grain sizes comparable to “medium-strain” stages in Type I experiments (Fig. 9). The continuous deformation of a non-pre-fractured rock would lead either to a homogeneous sample with L grain sizes or to localizing in throughgoing narrower shear zones, where the grain size will decrease after sufficient strain and further grain size reduction by nucleation and phase mixing.
Tokle and Hirth (2021) showed that the calibrated piezometer would overestimate the grain size of other grain growth laws if they are based on microstructures where pinning with secondary phases occurs (i.e., Wightman et al., 2006). Indeed, inserting approximate values from our experiments into the paleowattmeter calibrated by Tokle and Hirth (2021) results in grain sizes of ∼260 nm for 500 MPa differential stress and 10−3 s−1 strain rate (as in Type I experiments) or ∼2 µm for 200 MPa differential stress and 10−6 s−1 (as in Type II experiments), which is 1 order of magnitude larger than the observed grain sizes developed through DPC in our experiments. Even if a faster strain rate is assumed in the localized zones, the piezometer overestimates the grain size or would underestimate the actual stresses in natural polymineralic mylonites, where DPC is the dominant deformation mechanism.
Despite the lack of a grain-growth-inhibiting term and a term for chemical driving potential or nucleation rates, the original paleowattmeter (Austin and Evans, 2007) predicts grain sizes of ∼20 nm in Type I experiments and ∼150 nm in Type II experiments as flow stresses and strain rates of monomineralic quartz aggregates. Surprisingly, these values are in agreement with the range of grain sizes observed during the experiments: 150–10 nm in Type I and 200–50 nm in Type II. Therefore, our study introduces the question of whether in some cases the paleowattmeter could predict the stresses from grain sizes in polymineralic shear zones that formed through DPC. In this case, pinning in polymineralic rocks must be counterbalanced by very efficient/fast nucleation and growth rates leading to the self-sustaining and balanced system with a stable grain size. It should be mentioned, though, that creep data of quartz for these grain sizes and strain rates are not available from experiments, so the extrapolation goes way out of the existing data range. More experiments are needed to confirm this observation and to improve corresponding flow laws used to build the paleowattmeters.
For a quartzo-calcitic polymineralic system (calcareous shales), Gratier et al. (2023) recently published a flow law including the diffusive and grain boundary sliding parameters. It is to be noted that, for granitoid rocks, a flow law is still required, which considers reaction kinetics, chemical driving forces, diffusion pathway lengths, and other rate-limiting steps to quantitatively describe the stress/grain size relationships.
4.2.2 Strain localization mechanisms
Under natural greenschist facies metamorphic conditions, ample evidence exists that, in the middle to upper granitoid crust, deformation is strongly localized in fine-grained polymineralic ultramylonites being surrounded by coarse-grained low- to moderate-strain domains (Choukroune and Gapais, 1983; Fitz Gerald and Stünitz, 1993; Marquer et al., 1985; Stünitz and Fitz Gerald, 1993; Wehrens et al., 2016). Two general types of strain localization have been observed: (i) classical gradual strain localization across strain gradients and (ii) quasi-abrupt changes along sharp contacts from non-/weakly localized to highly localized deformation. Item (ii) has been interpreted as strain localization via brittle precursor microfractures (e.g., Fitz Gerald and Stünitz, 1993), followed by a viscous deformation that may or may not follow a mesoscopic brittle fracture (e.g., Fitz Gerald and Stünitz, 1993; Stünitz and Fitz Gerald, 1993; Mancktelow and Pennacchioni, 2005; Pennacchioni and Mancktelow, 2007; Wehrens et al., 2016). The mesoscopic fracture may be absent, indicating that the important features for the initiation of viscous deformation are the microfractures (which may accompany the mesoscopic fracture as a damage zone). In contrast, item (i) evolved as a progressive ductile strain localization (e.g., Choukroune and Gapais, 1983; Marquer et al., 1985; Wehrens et al., 2016). In the case of the Aar Massif (basement outcrops in Central Switzerland), Wehrens et al. (2016) observed a tendency for item (i) and (ii) localization in plutonites with granitic and granodioritic compositions, respectively. An increased content of interconnected sheet silicates by ∼ 5 vol %–10 vol % in the latter case is thought to promote a viscous strain localization behavior.
Despite having been performed in amphibolite metamorphic conditions, our new Type I and II experiments can now contribute substantially to an improved knowledge on the difference between these two end-member strain localization behaviors observed in nature under greenschist to amphibolite facies metamorphic conditions. Besides extrapolation to classical long-term viscous crustal strain rates, our experiments might also give insights into more episodic deformation styles, as is inferred, for example, for slow slip events or the viscous precursors of seismic runaway cycles. Note that, for some of such cases, our chosen experimental conditions (e.g., temperature, strain rate) may be identical or at least close to the natural ones not requiring extrapolations over orders of magnitudes between experiment and nature. Our experiments demonstrate that a definite relationship between bulk and localized strain rates, grain size evolution, and the role of grain size, porosity, and local phase composition exists for DPC in polymineralic rocks: owing to its grain size sensitivity, diffusion/dissolution–precipitation creep (DPC) is known to dominate as the deformation mechanism in fine-grained rocks at elevated temperature conditions, resulting in a weak rheology of the deforming rock. In the case of granitoid rocks with grain sizes in the range of millimeters to centimeters, grain sizes are too large to allow an efficient deformation by DPC. Hence, to activate DPC in an initially coarse-grained natural rock, some precursor mechanism reducing the grain size is always required (leading to phase mixing and subsequent activation of DPC), e.g., (1) a brittle grain size comminution (Bürgmann and Dresen, 2008; Fitz Gerald and Stünitz, 1993; Menegon et al., 2013), (2) the initiation of dynamic recrystallization (dislocation creep) until a fine grain size is reached (Bercovici and Skemer, 2017; Ricard and Bercovici, 2009; Rutter and Brodie, 1988; Schmid, 1982), or (3) reaction with nucleation of small-sized new phases (Ceccato et al., 2018; Fitz Gerald and Stünitz, 1993; Mansard et al., 2020a, b; Marti et al., 2017, 2018; Menegon et al., 2008; Stünitz and Tullis, 2001).
Similarly to the observed end-member localization behaviors in nature, our experiments show two types of grain-size-reducing mechanisms in granitoid polymineralic rocks: (1) brittle fracturing, which reduces the grain size significantly (Fig. 4d); (2) reaction of different phases due to chemical driving potentials when being exposed to a differential stress (Figs. 5, 6, 7, 11). Accompanying grain boundary sliding, DPC is directly activated at phase boundaries in the latter case. This relationship of processes demonstrates that initial brittle deformation at the microscale, combined with other processes, is one end-member precursor to localize strain. Similar microstructures have been observed in many natural settings, e.g., by Bürgmann and Dresen (2008, and references therein) and Fitz Gerald and Stünitz (1993). Mesoscopic fractures may or may not be associated with such brittle microscale grain comminution (Goncalves et al., 2016; Mancktelow and Pennacchioni, 2005; Pennacchioni and Mancktelow, 2007), but reaction weakening can also be very effective instead, as also observed on natural faults (by e.g., Ceccato et al., 2018; Menegon et al., 2008). Hence, both strain localization and more distributed strain may form in granitoids in nature. In both cases, the stresses are decreasing or strain rates are increasing due to an increased activity of DPC. In terms of the rheological behavior of the two end-member localization mechanisms in nature, our results indicate that fracture-induced strain localization reaches weaker DPC rheologies after lower acquired strains compared to the purely viscous strain localization. Therefore, the lower the deformation temperature in granitoid rocks, the more efficient fracture-induced initiation of DPC-assisted strain localization is. At high finite strains, the mechanical strength of both localization types might be rather similar once polymineralic DPC steady-state microstructures evolved, as can also be inferred from the grain size evolution (Fig. 9f).
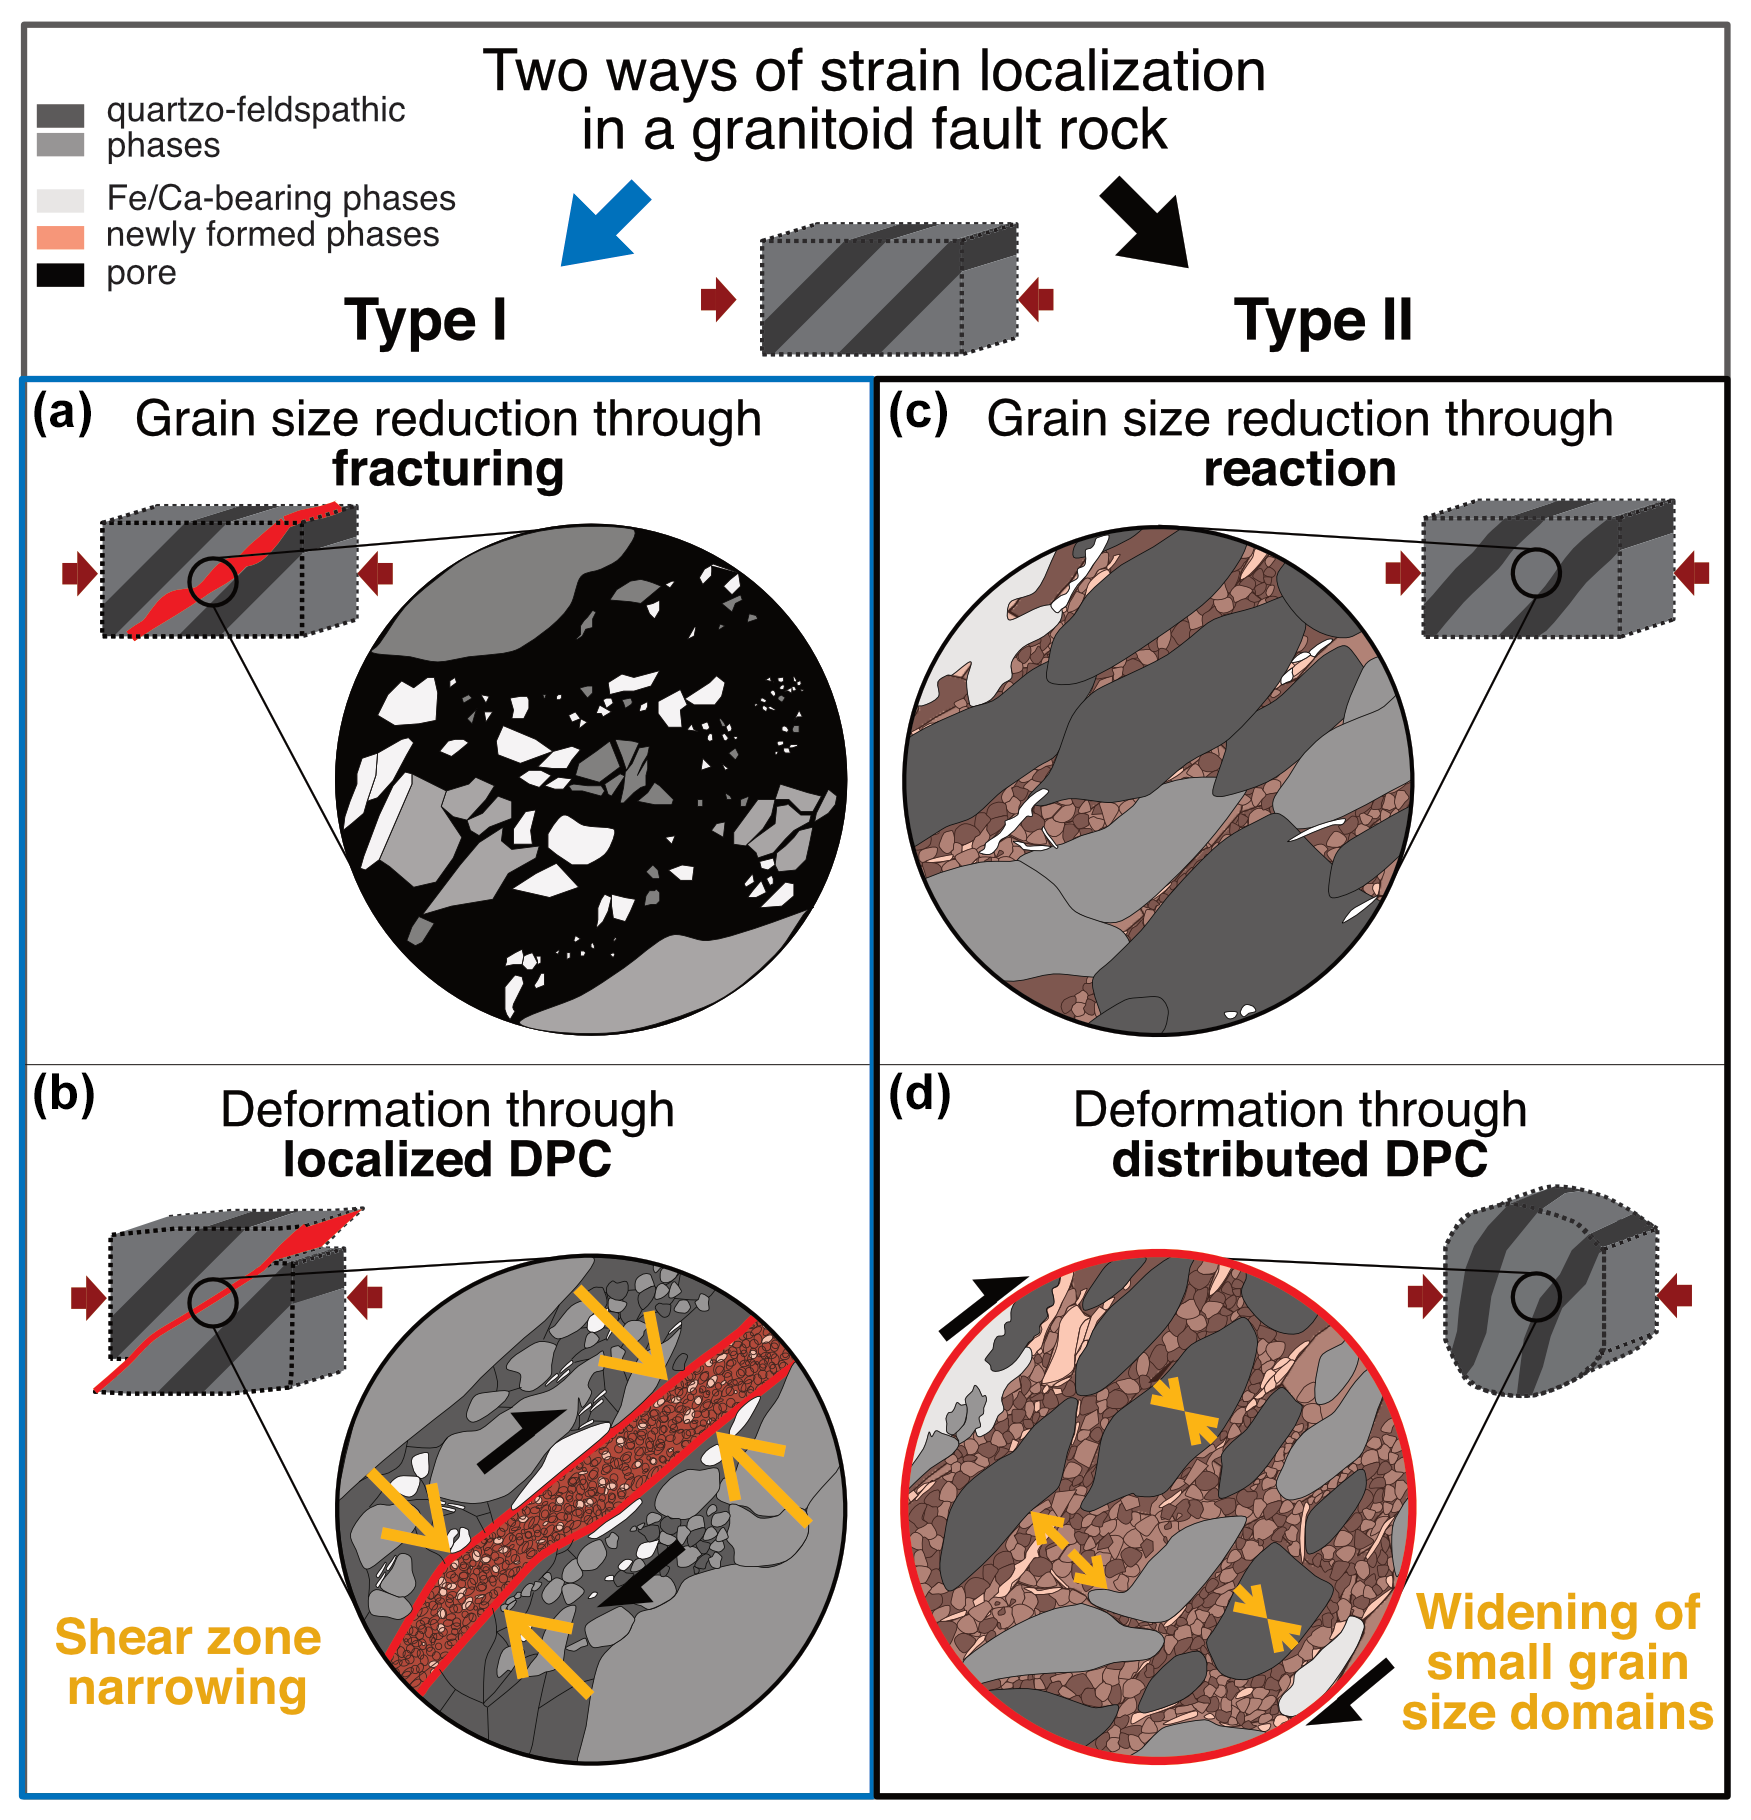
Figure 11Summary of the different grain size reduction and strain localization mechanisms. The schematic microstructures are drawn as seen in SEM images. Independent of the initial grain-size-reducing mechanism, grain boundary sliding accommodated by dissolution–precipitation creep (DPC) is accommodating the strain in granitoid fine-grained rocks. Pinning of grain growth leads to a stable microstructure. If a fracture is created (a) that reduces the grain size, then the deformation will localize within the fracture and deform in a very narrow, very fine-grained zone deforming by DPC (bound by red lines in panel b). If no fracture exists, reactions between minerals will lead to grain size reduction (c) and subsequent activation of DPC. In this case, the deformation is distributed (red circle in panel d).
An important parameter which is still poorly understood in natural shear zones is the level of inhomogeneity needed to efficiently support localization of strain (Ceccato et al., 2022). In our experimental conditions, brittle grain size reduction initiates DPC in a very narrow zone and is always leading to strain localization. The less localized deformation in Type II experiments, i.e., no localized deformation of more fine-grained or more mixed mylonitic bands compared to initial fsp-qtz-rich bands, indicates that the rheological contrast between the mylonitic bands was not sufficient for strain localization. Thus, not every inhomogeneity in a granitoid rock may serve as an agent for strain localization, so the rheological evolution of the granitoid system may vary (as in Sect. 4.1.2). The key differences between the deforming systems are the initial grain sizes and porosity. More experiments are necessary to further estimate the influence of phase mixing, porosity, and grain size, e.g., by gradually modifying grain sizes and compositions.
As outlined above, pre-fractured shear zones are narrow, while deformation in the non-pre-fractured sample is widely distributed. The high-strain zones in Type I experiments do not widen during sample deformation. Instead, they stay highly localized despite being subjected to the same piston displacement rates as in Type II experiments. The reason for this variation in strain partitioning must be related to how deformation energy is distributed within the deforming sample cylinders. The rapid grain size reduction processes in Type I experiments allow the initiation of DPC. Given the small shear zone width in Type I experiments (10–20 µm), deformation energy is distributed in a small volume. At the very fine grain sizes, the grain size sensitivity of DPC results in fast strain rates. The opposite is the case for the non-pre-fractured Type II experiments.
Commonly, a strain energy for natural samples can be calculated from the stress and strain of a sample, following (paleo)piezometric/paleowattmeter relationships (e.g., Austin and Evans, 2007, 2009; Giraud and Giraud-Audine, 2019; Regenauer-Lieb and Yuen, 2003). The defined sample size and strain rate allow us to estimate an energy flux for both types of experiments, which is the total energy dissipated in the sample per time. Eflux (in J s−1) is a function of (shear/differential) stress σ (in Pa), (shear/coaxial) strain rate ( (in s−1), and unit volume V (in m3) (Handy, 1994b):
In fact, when comparing the energy flux values for experiments 618NW (Type I) and 670NW (Type II), the total energy flux in those would be in the same order of magnitude: J s−1 (618NW, Type I) and J s−1 (670NW, Type II) (using values from Table 1 and calculations with Eq. 1 and in Table S1 in the Supplement). Moreover, Type I experiments show near-steady-state stresses, while Type II experiments show continuous strain weakening (Fig. 3). Classically, shear zone widening is observed when strain hardening occurs, while shear zone narrowing is the consequence of strain-softening processes (e.g., Hull, 1988; Mitra, 1992; Means, 1995). In this context, Type I experiments are interpreted to be microstructurally energetically optimized, resulting in more or less constant shear stress without the need for large changes in shear zone width. Our experiments therefore suggest that two energetically stable microstructures exist (Type I and Type II experiments), and it is the grain size evolution path that defines which of the two microstructures determines the strain rate and shear zone width. Here we can again link to nature, with the occurrence of both (see summary Fig. 14 in Wehrens et al., 2016) the fracture-induced, highly localized granitoid shear zones with abrupt grain size refinements (e.g., Fitz Gerald and Stünitz, 1993) and the classical ductile strain gradients with progressive grain size reduction and the classical transition from proto-mylonites to ultramylonites (e.g., Fig. 9 in Wehrens et al., 2016).
Two types of experiments on a natural granitoid ultramylonite were performed at 650 °C and 1.2 GPa confining pressure. In Type I experiments, an early induced brittle fracture served as a precursor for the initiation of localized deformation through dissolution and precipitation creep (DPC). The final deformation required only low differential stresses of ∼ 500 MPa at fast strain rates of s−1. In coaxial Type II experiments, deformation initiated through reactions at phase boundaries and led to distributed DPC. The distributed strain resulted in continuous strain weakening to <200 MPa at strain rates of s−1.
Evaluation of the strain evolution in the experiments highlights that grain sizes, porosity, and chemical driving potential are important driving forces for the activation of DPC and localization of strain. During deformation, grain growth is inhibited through phase mixing and pinning, which results in continuous deformation in the DPC field. However, the initial grain size and porosity define whether the deformation localizes directly or if distributed small grain size domains are created and are continuously widened. Chemical gradients caused by mineral metastability, in combination with the distribution of the minerals/phases at given physico-chemical deformation conditions, may play an important role for both the localization processes and the preservation of microstructural steady state. Comparisons with other polymineralic studies indicate that these processes are applicable to a broad range of mineral assemblages.
All images and data are included in the article and Supplement or are referenced in the text.
The supplement related to this article is available online at https://doi.org/10.5194/se-16-1181-2025-supplement.
NN, MH, and AB: conceptualization. NN: writing (original draft). MH and AB: funding acquisition, supervision, and project administration. NN, HS, MH, and AB: methodology and investigation. NN and WZ joined training at the experimental machines by HS and performed experimental data acquisition (five experiments together, then NN alone). MO: (S)TEM operator at the EM Centre, where OP was the facility manager. MH, AB, HS, OP, and WZ: writing (review and editing). NN: writing (final draft).
The contact author has declared that none of the authors has any competing interests.
Publisher's note: Copernicus Publications remains neutral with regard to jurisdictional claims made in the text, published maps, institutional affiliations, or any other geographical representation in this paper. While Copernicus Publications makes every effort to include appropriate place names, the final responsibility lies with the authors.
This project has received funding from the European Union's Horizon 2020 research and innovation program through the EXCITE Network (http://www.excite-network.eu, last access: 13 September 2024) under grant no. 101005611 for Transnational Access conducted at the EM Centre. We thank Matej Pec and Alberto Ceccato for their constructive and thorough reviews that helped improve the quality of this article. We gratefully acknowledge the Swiss National Science Foundation for funding this research under grant number 192124 to Marco Herwegh.
This work has been funded by the Swiss National Science Foundation (SNSF) (grant no. 192124) to Marco Herwegh.
This paper was edited by Florian Fusseis and reviewed by Matej Pec and Alberto Ceccato.
Arzt, E., Ashby, M. F., and Verrall, R. A.: Interface controlled diffusional creep, Acta Metall. Mater., 31, 1977–1989, https://doi.org/10.1016/0001-6160(83)90015-9, 1983.
Austin, N. J. and Evans, B.: Paleowattmeters: A scaling relation for dynamically recrystallized grain size, Geol, 35, 343, https://doi.org/10.1130/G23244A.1, 2007.
Austin, N. J. and Evans, B.: The kinetics of microstructural evolution during deformation of calcite, J. Geophys. Res., 114, B09402, https://doi.org/10.1029/2008JB006138, 2009.
Behrmann, J. H. and Mainprice, D.: Deformation mechanisms in a high-temperature quartz-feldspar mylonite: evidence for superplastic flow in the lower continental crust, Tectonophysics, 140, 297–305, https://doi.org/10.1016/0040-1951(87)90236-8, 1987.
Bercovici, D. and Karato, S.-I.: Theoretical Analysis of Shear Localization in the Lithosphere, Reviews in Mineralogy and Geochemistry, 51, 387–420, https://doi.org/10.2138/gsrmg.51.1.387, 2002.
Bercovici, D. and Ricard, Y.: Plate tectonics, damage and inheritance, Nature, 508, 513–516, https://doi.org/10.1038/nature13072, 2014.
Bercovici, D. and Skemer, P.: Grain damage, phase mixing and plate-boundary formation, J. Geodyn., 108, 40–55, https://doi.org/10.1016/j.jog.2017.05.002, 2017.
Brodhag, S. H., Herwegh, M., and Berger, A.: Grain coarsening in polymineralic contact metamorphic carbonate rocks: The role of different physical interactions during coarsening, J. Struct. Geol., 33, 698–712, https://doi.org/10.1016/j.jsg.2010.12.003, 2011.
Bürgmann, R. and Dresen, G.: Rheology of the Lower Crust and Upper Mantle: Evidence from Rock Mechanics, Geodesy, and Field Observations, Annu. Rev. Earth Planet. Sci., 36, 531–567, https://doi.org/10.1146/annurev.earth.36.031207.124326, 2008.
Ceccato, A., Menegon, L., Pennacchioni, G., and Morales, L. F. G.: Myrmekite and strain weakening in granitoid mylonites, Solid Earth, 9, 1399–1419, https://doi.org/10.5194/se-9-1399-2018, 2018.
Ceccato, A., Goncalves, P., and Menegon, L.: On the petrology and microstructures of small-scale ductile shear zones in granitoid rocks: An overview, J. Struct. Geol., 161, 104667, https://doi.org/10.1016/j.jsg.2022.104667, 2022.
Challandes, N., Marquer, D., and Villa, I. M.: P-T-t modelling, fluid circulation, and 39Ar-40Ar and Rb-Sr mica ages in the Aar Massif shear zones (Swiss Alps), Swiss J. Geosci., 101, 269–288, https://doi.org/10.1007/s00015-008-1260-6, 2008.
Choukroune, P. and Gapais, D.: Strain pattern in the Aar Granite (Central Alps): Orthogneiss developed by bulk inhomogeneous flattening, J. Struct. Geol., 5, 411–418, https://doi.org/10.1016/0191-8141(83)90027-5, 1983.
Cross, A. J. and Skemer, P.: Ultramylonite generation via phase mixing in high-strain experiments, J. Geophys. Res.-Sol. Ea., 122, 1744–1759, https://doi.org/10.1002/2016JB013801, 2017.
Derby, B.: The dependence of grain size on stress during dynamic recrystallisation, Acta Metall. Mater., 39, 955–962, https://doi.org/10.1016/0956-7151(91)90295-C, 1991.
Ebert, A., Herwegh, M., Evans, B., Pfiffner, A., Austin, N., and Vennemann, T.: Microfabrics in carbonate mylonites along a large-scale shear zone (Helvetic Alps), Tectonophysics, 444, 1–26, https://doi.org/10.1016/j.tecto.2007.07.004, 2007.
Ebert, A., Herwegh, M., Berger, A., and Pfiffner, A.: Grain coarsening maps for polymineralic carbonate mylonites: A calibration based on data from different Helvetic nappes (Switzerland), Tectonophysics, 457, 128–142, https://doi.org/10.1016/j.tecto.2008.05.007, 2008.
Elliott, D.: Diffusion Flow Laws in Metamorphic Rocks, Geol. Soc. Am. Bull., 84, 2645, https://doi.org/10.1130/0016-7606(1973)84<2645:DFLIMR>2.0.CO;2, 1973.
Etheridge, M. A., Wall, V. J., Cox, S. F., and Vernon, R. H.: High fluid pressures during regional metamorphism and deformation: Implications for mass transport and deformation mechanisms, J. Geophys. Res., 89, 4344–4358, https://doi.org/10.1029/JB089iB06p04344, 1984.
EXCITE Network: https://excite-network.eu/, last access: 13 September 2024.
Fitz Gerald, J. D. and Stünitz, H.: Deformation of granitoids at low metamorphic grade. I: Reactions and grain size reduction, Tectonophysics, 221, 269–297, https://doi.org/10.1016/0040-1951(93)90163-E, 1993.
Fuhrman, M. L. and Lindsley, D. H.: Ternary-feldspar modeling and thermometry, Am. Mineral., 73, 201–215, 1988.
Fukuda, J., Holyoke III, C. W., and Kronenberg, A. K.: Deformation of Fine-Grained Quartz Aggregates by Mixed Diffusion and Dislocation Creep, J. Geophys. Res.-Sol. Ea., 123, 4676–4696, https://doi.org/10.1029/2017JB015133, 2018.
Fusseis, F., Regenauer-Lieb, K., Liu, J., Hough, R. M., and De Carlo, F.: Creep cavitation can establish a dynamic granular fluid pump in ductile shear zones, Nature, 459, 974–977, https://doi.org/10.1038/nature08051, 2009.
Ghosh, S., Stünitz, H., Raimbourg, H., and Précigout, J.: Quartz rheology constrained from constant-load experiments: Consequences for the strength of the continental crust, Earth Planet. Sc. Lett., 597, 117814, https://doi.org/10.1016/j.epsl.2022.117814, 2022.
Ghosh, S., Stünitz, H., Raimbourg, H., Précigout, J., Di Carlo, I., Heilbronner, R., and Piani, L.: Importance of grain boundary processes for plasticity in the quartz-dominated crust: Implications for flow laws, Earth Planet. Sc. Lett., 640, 118767, https://doi.org/10.1016/j.epsl.2024.118767, 2024.
Gilgannon, J., Fusseis, F., Menegon, L., Regenauer-Lieb, K., and Buckman, J.: Hierarchical creep cavity formation in an ultramylonite and implications for phase mixing, Solid Earth, 8, 1193–1209, https://doi.org/10.5194/se-8-1193-2017, 2017.
Gilgannon, J., Waldvogel, M., Poulet, T., Fusseis, F., Berger, A., Barnhoorn, A., and Herwegh, M.: Experimental evidence that viscous shear zones generate periodic pore sheets, Solid Earth, 12, 405–420, https://doi.org/10.5194/se-12-405-2021, 2021.
Giraud, F. and Giraud-Audine, C.: Chapter Two – Dynamic modeling of piezoelectric media, in: Piezoelectric Actuators: Vector Control Method, edited by: Giraud, F. and Giraud-Audine, C., Butterworth-Heinemann, 43–94, https://doi.org/10.1016/B978-0-12-814186-1.00006-5, 2019.
Goncalves, P., Oliot, E., Marquer, D., and Connolly, J. A. D.: Role of chemical processes on shear zone formation: an example from the Grimsel metagranodiorite (Aar massif, Central Alps): SHEAR ZONE FORMATION, J. Metamorph. Geol., 30, 703–722, https://doi.org/10.1111/j.1525-1314.2012.00991.x, 2012.
Goncalves, P., Poilvet, J.-C., Oliot, E., Trap, P., and Marquer, D.: How does shear zone nucleate? An example from the Suretta nappe (Swiss Eastern Alps), J. Struct. Geol., 86, 166–180, https://doi.org/10.1016/j.jsg.2016.02.015, 2016.
Gratier, J., Guiguet, R., Renard, F., Jenatton, L., and Bernard, D.: A pressure solution creep law for quartz from indentation experiments, J. Geophys. Res., 114, 2008JB005652, https://doi.org/10.1029/2008JB005652, 2009.
Gratier, J., Menegon, L., and Renard, F.: Pressure Solution Grain Boundary Sliding as a Large Strain Mechanism of Superplastic Flow in the Upper Crust, J. Geophys. Res.-Sol. Ea., 128, e2022JB026019, https://doi.org/10.1029/2022JB026019, 2023.
Gratier, J.-P., Dysthe, D. K., and Renard, F.: The Role of Pressure Solution Creep in the Ductility of the Earth's Upper Crust, in: Advances in Geophysics, vol. 54, Elsevier, 47–179, https://doi.org/10.1016/B978-0-12-380940-7.00002-0, 2013.
Gueydan, F., Leroy, Y. M., Jolivet, L., and Agard, P.: Analysis of continental midcrustal strain localization induced by microfracturing and reaction-softening: CONTINENTAL MIDCRUSTAL STRAIN LOCALIZATION, J. Geophys. Res., 108, https://doi.org/10.1029/2001JB000611, 2003.
Handy, M. R.: Flow laws for rocks containing two non-linear viscous phases: A phenomenological approach, J. Struct. Geol., 16, 287–301, https://doi.org/10.1016/0191-8141(94)90035-3, 1994a.
Handy, M. R.: The energetics of steady state heterogeneous shear in mylonitic rock, Mat. Sci. Eng. A-Struct., 175, 261–272, https://doi.org/10.1016/0921-5093(94)91065-0, 1994b.
Herwegh, M. and Jenni, A.: Granular flow in polymineralic rocks bearing sheet silicates: new evidence from natural examples, Tectonophysics, 332, 309–320, https://doi.org/10.1016/S0040-1951(00)00288-2, 2001.
Herwegh, M., de Bresser, J. H. P., and ter Heege, J. H.: Combining natural microstructures with composite flow laws: an improved approach for the extrapolation of lab data to nature, J. Struct. Geol., 27, 503–521, https://doi.org/10.1016/j.jsg.2004.10.010, 2005.
Herwegh, M., Linckens, J., Ebert, A., Berger, A., and Brodhag, S. H.: The role of second phases for controlling microstructural evolution in polymineralic rocks: A review, J. Struct. Geol., 33, 1728–1750, https://doi.org/10.1016/j.jsg.2011.08.011, 2011.
Hippertt, J. F.: Breakdown of feldspar, volume gain and lateral mass transfer during mylonitization of granitoid in a low metamorphic grade shear zone, J. Struct. Geol., 20, 175–193, https://doi.org/10.1016/S0191-8141(97)00083-7, 1998.
Hirth, G. and Tullis, J.: The brittle-plastic transition in experimentally deformed quartz aggregates, J. Geophys. Res., 99, 11731–11747, https://doi.org/10.1029/93JB02873, 1994.
Hirth, G., Teyssier, C., and Dunlap, J. W.: An evaluation of quartzite flow laws based on comparisons between experimentally and naturally deformed rocks, Int. J. Earth Sci., 90, 77–87, https://doi.org/10.1007/s005310000152, 2001.
Hull, J.: Thickness-displacement relationships for deformation zones. Journal of Structural Geology, 10, 431–435, ISSN 0191-8141, https://doi.org/10.1016/0191-8141(88)90020-X, 1988.
Imon, R., Okudaira, T., and Fujimoto, A.: Dissolution and precipitation processes in deformed amphibolites: an example from the ductile shear zone of the Ryoke metamorphic belt, SW Japan, Journal Metamorphic Geology, 20, 297–308, https://doi.org/10.1046/j.1525-1314.2002.00367.x, 2002.
Imon, R., Okudaira, T., and Kanagawa, K.: Development of shape- and lattice-preferred orientations of amphibole grains during initial cataclastic deformation and subsequent deformation by dissolution–precipitation creep in amphibolites from the Ryoke metamorphic belt, SW Japan, J. Struct. Geol., 26, 793–805, https://doi.org/10.1016/j.jsg.2003.09.004, 2004.
Kilian, R., Heilbronner, R., and Stünitz, H.: Quartz grain size reduction in a granitoid rock and the transition from dislocation to diffusion creep, J. Struct. Geol., 33, 1265–1284, https://doi.org/10.1016/j.jsg.2011.05.004, 2011.
Lee, A. L., Stünitz, H., Soret, M., and Battisti, M. A.: Dissolution precipitation creep as a process for the strain localisation in mafic rocks, J. Struct. Geol., 155, 104505, https://doi.org/10.1016/j.jsg.2021.104505, 2022.
Linckens, J., Herwegh, M., Müntener, O., and Mercolli, I.: Evolution of a polymineralic mantle shear zone and the role of second phases in the localization of deformation, J. Geophys. Res., 116, B06210, https://doi.org/10.1029/2010JB008119, 2011.
Linckens, J., Herwegh, M., and Müntener, O.: Small quantity but large effect – How minor phases control strain localization in upper mantle shear zones, Tectonophysics, 643, 26–43, https://doi.org/10.1016/j.tecto.2014.12.008, 2015.
Mancktelow, N. S. and Pennacchioni, G.: The control of precursor brittle fracture and fluid–rock interaction on the development of single and paired ductile shear zones, J. Struct. Geol., 27, 645–661, https://doi.org/10.1016/j.jsg.2004.12.001, 2005.
Mansard, N., Raimbourg, H., Augier, R., Précigout, J., and Le Breton, N.: Large-scale strain localization induced by phase nucleation in mid-crustal granitoids of the south Armorican massif, Tectonophysics, 745, 46–65, https://doi.org/10.1016/j.tecto.2018.07.022, 2018.
Mansard, N., Stünitz, H., Raimbourg, H., and Précigout, J.: The role of deformation-reaction interactions to localize strain in polymineralic rocks: Insights from experimentally deformed plagioclase-pyroxene assemblages, J. Struct. Geol., 134, 104008, https://doi.org/10.1016/j.jsg.2020.104008, 2020a.
Mansard, N., Stünitz, H., Raimbourg, H., Précigout, J., Plunder, A., and Nègre, L.: Relationship between microstructures and resistance in mafic assemblages that deform and transform, Solid Earth, 11, 2141–2167, https://doi.org/10.5194/se-11-2141-2020, 2020b.
Marquer, D., Gapais, D., and Capdevila, R.: Comportement chimique et orthogneissification d'une granodiorite en faciès schistes verts (Massif de l'Aar, Alpes centrales), bulmi, 108, 209–221, https://doi.org/10.3406/bulmi.1985.7869, 1985.
Marti, S., Heilbronner, R., Stuenitz, H., Pluemper, O., and Drury, M.: Solution-mass transfer and grain boundary sliding in mafic shear zones; comparison between experiments and nature, Geophys. Res. Abstr., 19, Abstract EGU2017-3203, https://meetingorganizer.copernicus.org/EGU2017/EGU2017-3203.pdf, 2017.
Marti, S., Stünitz, H., Heilbronner, R., Plümper, O., and Kilian, R.: Syn-kinematic hydration reactions, grain size reduction, and dissolution–precipitation creep in experimentally deformed plagioclase–pyroxene mixtures, Solid Earth, 9, 985–1009, https://doi.org/10.5194/se-9-985-2018, 2018.
Means, W. D.: Shear zones and rock history, Tectonophysics, 247, 157–160, https://doi.org/10.1016/0040-1951(95)98214-H, 1995.
Menegon, L., Pennacchioni, G., and Spiess, R.: Dissolution-precipitation creep of K-feldspar in mid-crustal granite mylonites, J. Struct. Geol., 30, 565–579, https://doi.org/10.1016/j.jsg.2008.02.001, 2008.
Menegon, L., Stünitz, H., Nasipuri, P., Heilbronner, R., and Svahnberg, H.: Transition from fracturing to viscous flow in granulite facies perthitic feldspar (Lofoten, Norway), J. Struct. Geol., 48, 95–112, https://doi.org/10.1016/j.jsg.2012.12.004, 2013.
Mitra, P. P. and Sen, P. N.: Effects of microgeometry and surface relaxation on NMR pulsed-field-gradient experiments: Simple pore geometries, Phys. Rev. B, 45, 143–156, https://doi.org/10.1103/PhysRevB.45.143, 1992.
Nevskaya, N., Berger, A., Stünitz, H., Ohl, M., Plümper, O., and Herwegh, M.: Dissolution–precipitation creep in polymineralic granitoid shear zones in experiments – Part 2: Rheological parameters, Solid Earth, 16, 1205–1226, https://doi.org/10.5194/se-16-1205-2025, 2025.
Nibourel, L., Berger, A., Egli, D., Heuberger, S., and Herwegh, M.: Structural and thermal evolution of the eastern Aar Massif: insights from structural field work and Raman thermometry, Swiss J. Geosci., 114, 9, https://doi.org/10.1186/s00015-020-00381-3, 2021.
Niemeijer, A. R., Spiers, C. J., and Bos, B.: Compaction creep of quartz sand at 400–600 °C: experimental evidence for dissolution-controlled pressure solution, Earth Planet. Sc. Lett., 195, 261–275, https://doi.org/10.1016/S0012-821X(01)00593-3, 2002.
Okamoto, A. and Hiraga, T.: A Common Diffusional Mechanism for Creep and Grain Growth in Polymineralic Rocks: Experiments, J. Geophys. Res.-Sol. Ea., 127, e2022JB024638, https://doi.org/10.1029/2022JB024638, 2022.
Olgaard, D. L. and Evans, B.: Effect of Second-Phase Particles on Grain Growth in Calcite, J. Am. Ceram. Soc., 69, C-272–C–277, https://doi.org/10.1111/j.1151-2916.1986.tb07374.x, 1986.
Pec, M.: Experimental Investigation on the Rheology of Fault Rocks, PhD Thesis, Basel University, 210 pp., 2014.
Pec, M. and Al Nasser, S.: Formation of Nanocrystalline and Amorphous Materials Causes Parallel Brittle-Viscous Flow of Crustal Rocks: Experiments on Quartz-Feldspar Aggregates, J. Geophys. Res.-Sol. Ea., 126, e2020JB021262, https://doi.org/10.1029/2020JB021262, 2021.
Pec, M., Stünitz, H., Heilbronner, R., and Drury, M.: Semi-brittle flow of granitoid fault rocks in experiments, J. Geophys. Res.-Sol. Ea., 121, 1677–1705, https://doi.org/10.1002/2015JB012513, 2016.
Pennacchioni, G. and Mancktelow, N. S.: Nucleation and initial growth of a shear zone network within compositionally and structurally heterogeneous granitoids under amphibolite facies conditions, J. Struct. Geol., 29, 1757–1780, https://doi.org/10.1016/j.jsg.2007.06.002, 2007.
Platt, J. P. and Behr, W. M.: Grainsize evolution in ductile shear zones: Implications for strain localization and the strength of the lithosphere, J. Struct. Geol., 33, 537–550, https://doi.org/10.1016/j.jsg.2011.01.018, 2011.
Raj, R. and Ashby, M. F.: On grain boundary sliding and diffusional creep, Metall Trans 2, 1113–1127, https://doi.org/10.1007/BF02664244, 1971.
Raj, R.: Creep in polycrystalline aggregates by matter transport through a liquid phase, J. Geophys. Res., 87, 4731–4739, https://doi.org/10.1029/JB087iB06p04731, 1982.
Ranalli, G.: Deformation maps in grain-size-stress space as a tool to investigate mantle rheology, Phys. Earth Planet. In., 29, 42–50, https://doi.org/10.1016/0031-9201(82)90136-4, 1982.
Ree, J.-H.: Grain boundary sliding and development of grain boundary openings in experimentally deformed octachloropropane, J. Struct. Geol., 16, 403–418, https://doi.org/10.1016/0191-8141(94)90044-2, 1994.
Regenauer-Lieb, K. and Yuen, D. A.: Modeling shear zones in geological and planetary sciences: solid- and fluid-thermal–mechanical approaches, Earth-Sci. Rev., 63, 295–349, https://doi.org/10.1016/S0012-8252(03)00038-2, 2003.
Ricard, Y. and Bercovici, D.: A continuum theory of grain size evolution and damage, J. Geophys. Res., 114, 2007JB005491, https://doi.org/10.1029/2007JB005491, 2009.
Richter, B., Stünitz, H., and Heilbronner, R.: The brittle-to-viscous transition in polycrystalline quartz: An experimental study, J. Struct. Geol., 114, 1–21, https://doi.org/10.1016/j.jsg.2018.06.005, 2018.
Ruh, J., Behr, W., and Tokle, L.: Effect of Grain-Size and Textural Weakening in Polyphase Crustal and Mantle Lithospheric Shear Zones, tekt, 2, https://doi.org/10.55575/tektonika2024.2.1.68, 2024.
Rutter, E. H.: A Discussion on natural strain and geological structure - The kinetics of rock deformation by pressure solution, Phil. Trans. R. Soc. Lond. A, 283, 203–219, https://doi.org/10.1098/rsta.1976.0079, 1976.
Rutter, E. H. and Brodie, K. H.: The role of tectonic grain size reduction in the rheological stratification of the lithosphere, Geol. Rundsch., 77, 295–307, https://doi.org/10.1007/BF01848691, 1988.
Rybacki, E. and Dresen, G.: Deformation mechanism maps for feldspar rocks, Tectonophysics, 382, 173–187, https://doi.org/10.1016/j.tecto.2004.01.006, 2004.
Schmid, S. M.: Microfabric studies as indicators of deformation mechanisms and flow laws operative in mountain building, Mountain Building Processes, 95–110, 1982.
Schrank, C., Bishop, N., Jones, M., Berger, A., Herwegh, M., Paterson, D., Manni, L. S., and Kirby, N.: Nanopores enable fluid flux in mylonites and ultramylonites – novel insights from Scanning Small-angle X-ray Scattering and X-ray Fluorescence Microscopy, EGU General Assembly 2025, Vienna, Austria, 27 Apr–2 May 2025, EGU25–7433, https://doi.org/10.5194/egusphere-egu25-7433, 2025.
Stünitz, H. and Fitz Gerald, J. D.: Deformation of granitoids at low metamorphic grade. II: Granular flow in albite-rich mylonites, Tectonophysics, 221, 299–324, https://doi.org/10.1016/0040-1951(93)90164-F, 1993.
Stünitz, H. and Tullis, J.: Weakening and strain localization produced by syn-deformational reaction of plagioclase, Int. J. Earth Sci., 90, 136–148, https://doi.org/10.1007/s005310000148, 2001.
Sun, H. and Pec, M.: Nanometric flow and earthquake instability, Nat. Commun., 12, 6779, https://doi.org/10.1038/s41467-021-26996-0, 2021.
Tokle, L. and Hirth, G.: Assessment of Quartz Grain Growth and the Application of the Wattmeter to Predict Quartz Recrystallized Grain Sizes, J. Geophys. Res.-Sol. Ea., 126, e2020JB021475, https://doi.org/10.1029/2020JB021475, 2021.
Tullis, J.: Deformation of Granitic Rocks: Experimental Studies and Natural Examples, Reviews in Mineralogy and Geochemistry, 51, 51–95, https://doi.org/10.2138/gsrmg.51.1.51, 2002.
Tullis, J. and Yund, R. A.: Experimental deformation of dry westerly granite, J. Geophys. Res., 82, 5705–5718, https://doi.org/10.1029/JB082i036p05705, 1977.
Tullis, J. and Yund, R. A.: Dynamic recrystallization of feldspar: A mechanism for ductile shear zone formation, Geol., 13, 238, https://doi.org/10.1130/0091-7613(1985)13<238:DROFAM>2.0.CO;2, 1985.
Tullis, J., Dell'Angelo, L., and Yund, R. A.: Ductile shear zones from brittle precursors in feldspathic rocks: The role of dynamic recrystallization, in: Geophysical Monograph Series, vol. 56, edited by: Duba, A. G., Durham, W. B., Handin, J. W., and Wang, H. F., American Geophysical Union, Washington, D. C., 67–81, https://doi.org/10.1029/GM056p0067, 1990.
Twiss, R. J.: Theory and applicability of a recrystallized grain size paleopiezometer, Pure and Applied Geophysics (PAGEOPH), Birkhäuser Verlag, Basel, 115, https://doi.org/10.1007/BF01637105, 1977.
Wehrens, P., Berger, A., Peters, M., Spillmann, T., and Herwegh, M.: Deformation at the frictional-viscous transition: Evidence for cycles of fluid-assisted embrittlement and ductile deformation in the granitoid crust, Tectonophysics, 693, 66–84, https://doi.org/10.1016/j.tecto.2016.10.022, 2016.
Wehrens, P., Baumberger, R., Berger, A., and Herwegh, M.: How is strain localized in a meta-granitoid, mid-crustal basement section? Spatial distribution of deformation in the central Aar massif (Switzerland), J. Struct. Geol., 94, 47–67, https://doi.org/10.1016/j.jsg.2016.11.004, 2017.
Weyl, P. K.: Pressure solution and the force of crystallization: a phenomenological theory, J. Geophys. Res., 64, 2001–2025, https://doi.org/10.1029/JZ064i011p02001, 1959.
Wheeler, J.: Importance of pressure solution and coble creep in the deformation of polymineralic rocks, J. Geophys. Res., 97, 4579, https://doi.org/10.1029/91JB02476, 1992.
White, S. H., Burrows, S. E., Carreras, J., Shaw, N. D., and Humphreys, F. J.: On mylonites in ductile shear zones, J. Struct. Geol., 2, 175–187, https://doi.org/10.1016/0191-8141(80)90048-6, 1980.
Wightman, R. H., Prior, D. J., and Little, T. A.: Quartz veins deformed by diffusion creep-accommodated grain boundary sliding during a transient, high strain-rate event in the Southern Alps, New Zealand, J. Struct. Geol., 28, 902–918, https://doi.org/10.1016/j.jsg.2006.02.008, 2006.