the Creative Commons Attribution 4.0 License.
the Creative Commons Attribution 4.0 License.
 | 27 Oct 2025
Dissolution–precipitation creep in polymineralic granitoid shear zones in experiments – Part 2: Rheological parameters
Natalia Nevskaya
Alfons Berger
Holger Stünitz
Markus Ohl
Oliver Plümper
Marco Herwegh
The transition from strong to weak mechanical behavior in the Earth's continental middle crust is always caused by an initiation of viscous deformation. Microstructural evidence from field examples indicates that viscously deforming polymineralic shear zones represent the weakest zones in the crust and may dominate mid-crustal rheology. The results of recent experiments (as in Part 1, Nevskaya et al., 2025) demonstrate that the observed weak behavior is due to the activation of dissolution–precipitation creep (DPC). Formation of fine-grained material and efficient pinning of grain growth are important prerequisites for the formation of a stable deforming microstructure. However, available rheological parameters for fine-grained polymineralic rocks deforming by DPC are insufficient. A series of three types of experiments was conducted on a granitoid fine-grained ultramylonite to different strains at 650–725 °C, 1.2 GPa, with strain rates varying from 10−3 to 10−6 s−1. Type I and II experiments are solid natural samples, providing key microstructural evidence for DPC. Type III experiments are general shear experiments performed on coarse- and fine-grained ultramylonite powder. All experiments were combined to estimate rheological parameters for such polymineralic shear zones. A stress exponent n≈1.5 and grain size exponent , with uncertainties, were estimated and coupled with microstructural observations. Extrapolations indicate that, at slow natural strain rates, DPC in polymineralic granitoid fault rocks can occur at lower temperatures than monomineralic quartz. A deformation mechanism map is proposed, indicating a transition in the deformation mechanism from dislocation creep in monomineralic quartz to DPC in weaker polymineralic fine-grained granitoids, based on strain rate and grain size. Most importantly, the polymineralic composition is the determining factor in achieving the fine grain sizes necessary for DPC to become activated. This is due to the presence of additional chemical driving potentials and phase mixing, both of which are absent in monomineralic systems.
- Article
(9483 KB) - Full-text XML
- Companion paper
-
Supplement
(1051 KB) - BibTeX
- EndNote


In the Earth's middle and lower crust, the switch from frictional to viscous deformation is often accompanied by a transition from seismic to aseismic deformation. Consequently, the study of the onset of viscous deformation in nature is crucial for advancing our understanding of earthquake mechanics. Hence, as a broader implication of this study, an understanding of viscous deformation in the middle continental crust is of great importance for the amplification of local stresses and the localization of deep earthquakes, as evidenced by the findings of Campbell et al. (2020).
The rheological behavior of rocks is commonly estimated from experiments on monomineralic or synthetic simplified rocks. In these experiments, rheology is constrained by intrinsic parameters, such as the rock's composition, grain sizes, and anisotropies, and by extrinsic parameters, such as temperature, confining pressure, pore fluid pressure, and strain rate. Particularly in monomineralic polycrystalline aggregates, two general viscous end-member deformation mechanisms are distinguished: diffusion and dislocation creep, where the former is grain-size-sensitive (GSS) creep and the latter is grain-size-insensitive (GSI) creep.
The Earth's continental crust consists mostly of feldspar-dominated lithologies, which are usually modeled or represented by granitoid rocks (e.g., Burov, 2011; Burov and Watts, 2006; Fossen, 2016; Kohlstedt et al., 1995). These are a mixture of quartz, feldspars, and micas, among which each mineral has a different temperature (related to pressure and strain rate) for the onset of viscous deformation when deformed in monomineralic aggregates. The initial grain size of granitoids is quite large when compared to the deformed rocks, ranging from sub-millimeter to centimeter scale (e.g., Berger and Stünitz, 1996; Ceccato et al., 2022; Fitz Gerald and Stünitz, 1993; Kilian et al., 2011; Stünitz and Fitz Gerald, 1993; Wehrens et al., 2016).
In terms of viscous deformation, in general, grain-size-insensitive (GSI) and grain-size-sensitive (GSS) creep are the two end-members, where stress and strain rate do not and do depend on the grain size of the deforming aggregates, respectively (e.g., Nabarro, 1967; Poirier, 1985; Raj and Ashby, 1971). In terms of specific deformation mechanisms, the terms dislocation creep (GSI) and diffusion creep (GSS) are often found in the literature when dealing with the viscous deformation of monomineralic aggregates such as quartz (e.g., Hirth and Tullis, 1992; Rutter and Brodie, 2004a). Of all granitoid mineral phases, quartz is considered to be the weakest in monomineralic experiments and typically deforms through GSI creep at grain sizes of the starting granitoid at mid-crustal extrinsic conditions (i.e., greenschist to amphibolite facies P–T conditions) (e.g., Hirth et al., 2001; Hirth and Tullis, 1992; Richter et al., 2018). For this reason, there have been numerous studies to explore GSI and GSS rheology of quartz (e.g., den Brok, 1992; Fukuda et al., 2018; Ghosh et al., 2022; Gleason and Tullis, 1995; Hirth et al., 2001; Hirth and Tullis, 1992; Richter et al., 2018; Rutter and Brodie, 2004b, a). Such studies investigating GSS and GSI creep also exist for feldspars (e.g., Rybacki et al., 2006, 2008; Rybacki and Dresen, 2000, 2004). Extrapolation to nature indicates that quartz is mechanically weaker than GSI creep of feldspars in the Earth's middle crust (e.g., Bürgmann and Dresen, 2008). Note that such a generalized statement might not always be true, particularly if GSS creep is the dominating deformation mechanism, as is the case for many fine-grained tectonites (e.g., Ceccato et al., 2022; Imon et al., 2002; Marti et al., 2018; Stokes et al., 2012) or the presence of large amount of mica (e.g., Tullis and Wenk, 1994). Due to observations of GSI in natural monomineralic or coarse-grained rocks, the GSI creep for quartz representing the weakest phase is mostly used for modeling crustal strength (Arnold et al., 2001; Brace and Kohlstedt, 1980; Burov, 2003, 2011; Kohlstedt et al., 1995).
However, there are many studies of natural rocks indicating that the strength of polymineralic fault rocks may be weaker than predicted by pure quartz GSI creep laws, due to the activation of GSS creep mechanisms through continuous grain size reduction (e.g., Fitz Gerald and Stünitz, 1993; Gratier et al., 2013; Stünitz et al., 2020; Stünitz and Fitz Gerald, 1993; Stünitz and Tullis, 2001; Wheeler, 1992). To make extrapolations to nature, it is therefore of utmost importance to link the rheology of fine-grained polymineralic granitoid rocks to the formation and evolution of shear zones in the Earth's middle crust.
Few experimental studies exist that attempt to confirm the field observations of polymineralic rocks by investigating the viscous behavior of fault rocks (e.g., Pec et al., 2012, 2016; Stesky et al., 1974; Sun and Pec, 2021; Tullis et al., 1990; Tullis and Yund, 1977). Many of these experiments use synthetic, initially fine-grained material as an analog for fault rocks or pre-cut a rock to simulate a fracture/fault plane. Common conditions for viscous deformation in the lower to middle crust are amphibolite facies (e.g., Okudaira et al., 2010; Pennacchioni and Mancktelow, 2007), but most experiments investigating the viscous processes are conducted at higher temperatures and/or lower pressures to scale natural and experimental conditions (see compilation of high-temperature quartz experiments in Ghosh et al., 2022).
Our aim is to understand the rheology of polymineralic fine-grained shear zones in the Earth's middle to lower crust. This is why, in this study, we deform a natural, initially fine-grained granitoid ultramylonite at 650–725 °C, 1.2 GPa confining pressure, and shear strain rates of 10−3 to 10−5 s−1, with strain rates for general shear of 10−6 s−1. To capture the complexity of natural samples, we use three different experimental geometries for this ultramylonite. Our setup allows us to reach fairly high strains at experimental conditions and activate viscous deformation in polymineralic fine-grained zones even at faster strain rates than observed in other coarse granitic or monomineralic studies (see Part 1, Nevskaya et al., 2025). We investigate the importance of grain size reduction leading to substantial weakening of polymineralic rocks. In the present study, we estimate the parameters describing stress and grain size sensitivity for a flow law to finally compare to data in the literature and to extrapolate the experimental findings and observations to shallower crustal levels. Our results have direct implications for the onset of viscous deformation and the rheology of polymineralic shear zones.
2.1 Starting material characterization and preparation
This study was performed on a granitoid ultramylonite from the Central Aar granite in the Central Alps. Peak metamorphic conditions of this ultramylonite were estimated at 450 °C and 600 MPa (Challandes et al., 2008; Goncalves et al., 2012). The structures were not overprinted afterwards, leaving the original mylonitic structures unmodified. Coring from an underground test laboratory (Grimsel test site) provided fresh sample material devoid of any weathering features.
The granitoid ultramylonite consists of quartz, feldspars, biotite, and epidote. It is strongly foliated through mylonitic bands (qtz:ab:K-fsp:bt:ep = 37:38:11:8:6 wt %). Mylonitic bands were carefully investigated and characterized. Bands are ∼ 100–400 µm wide and have varying mineralogical composition and grain size (see Part 1, Nevskaya et al., 2025). Microstructural analysis of the starting material was performed on thin sections with both a petrographic microscope and a scanning election microscope (SEM). The mylonitic bands have a grain size range of <10 µm (even down to 2 µm) to >600 µm in proto-mylonitic zones. The most fine-grained and homogeneous zones with a median of ∼ 15 µm were targeted for our experiments. In such zones, micas are well mixed with feldspars, quartz, and epidote.
2.2 Deformation experiments
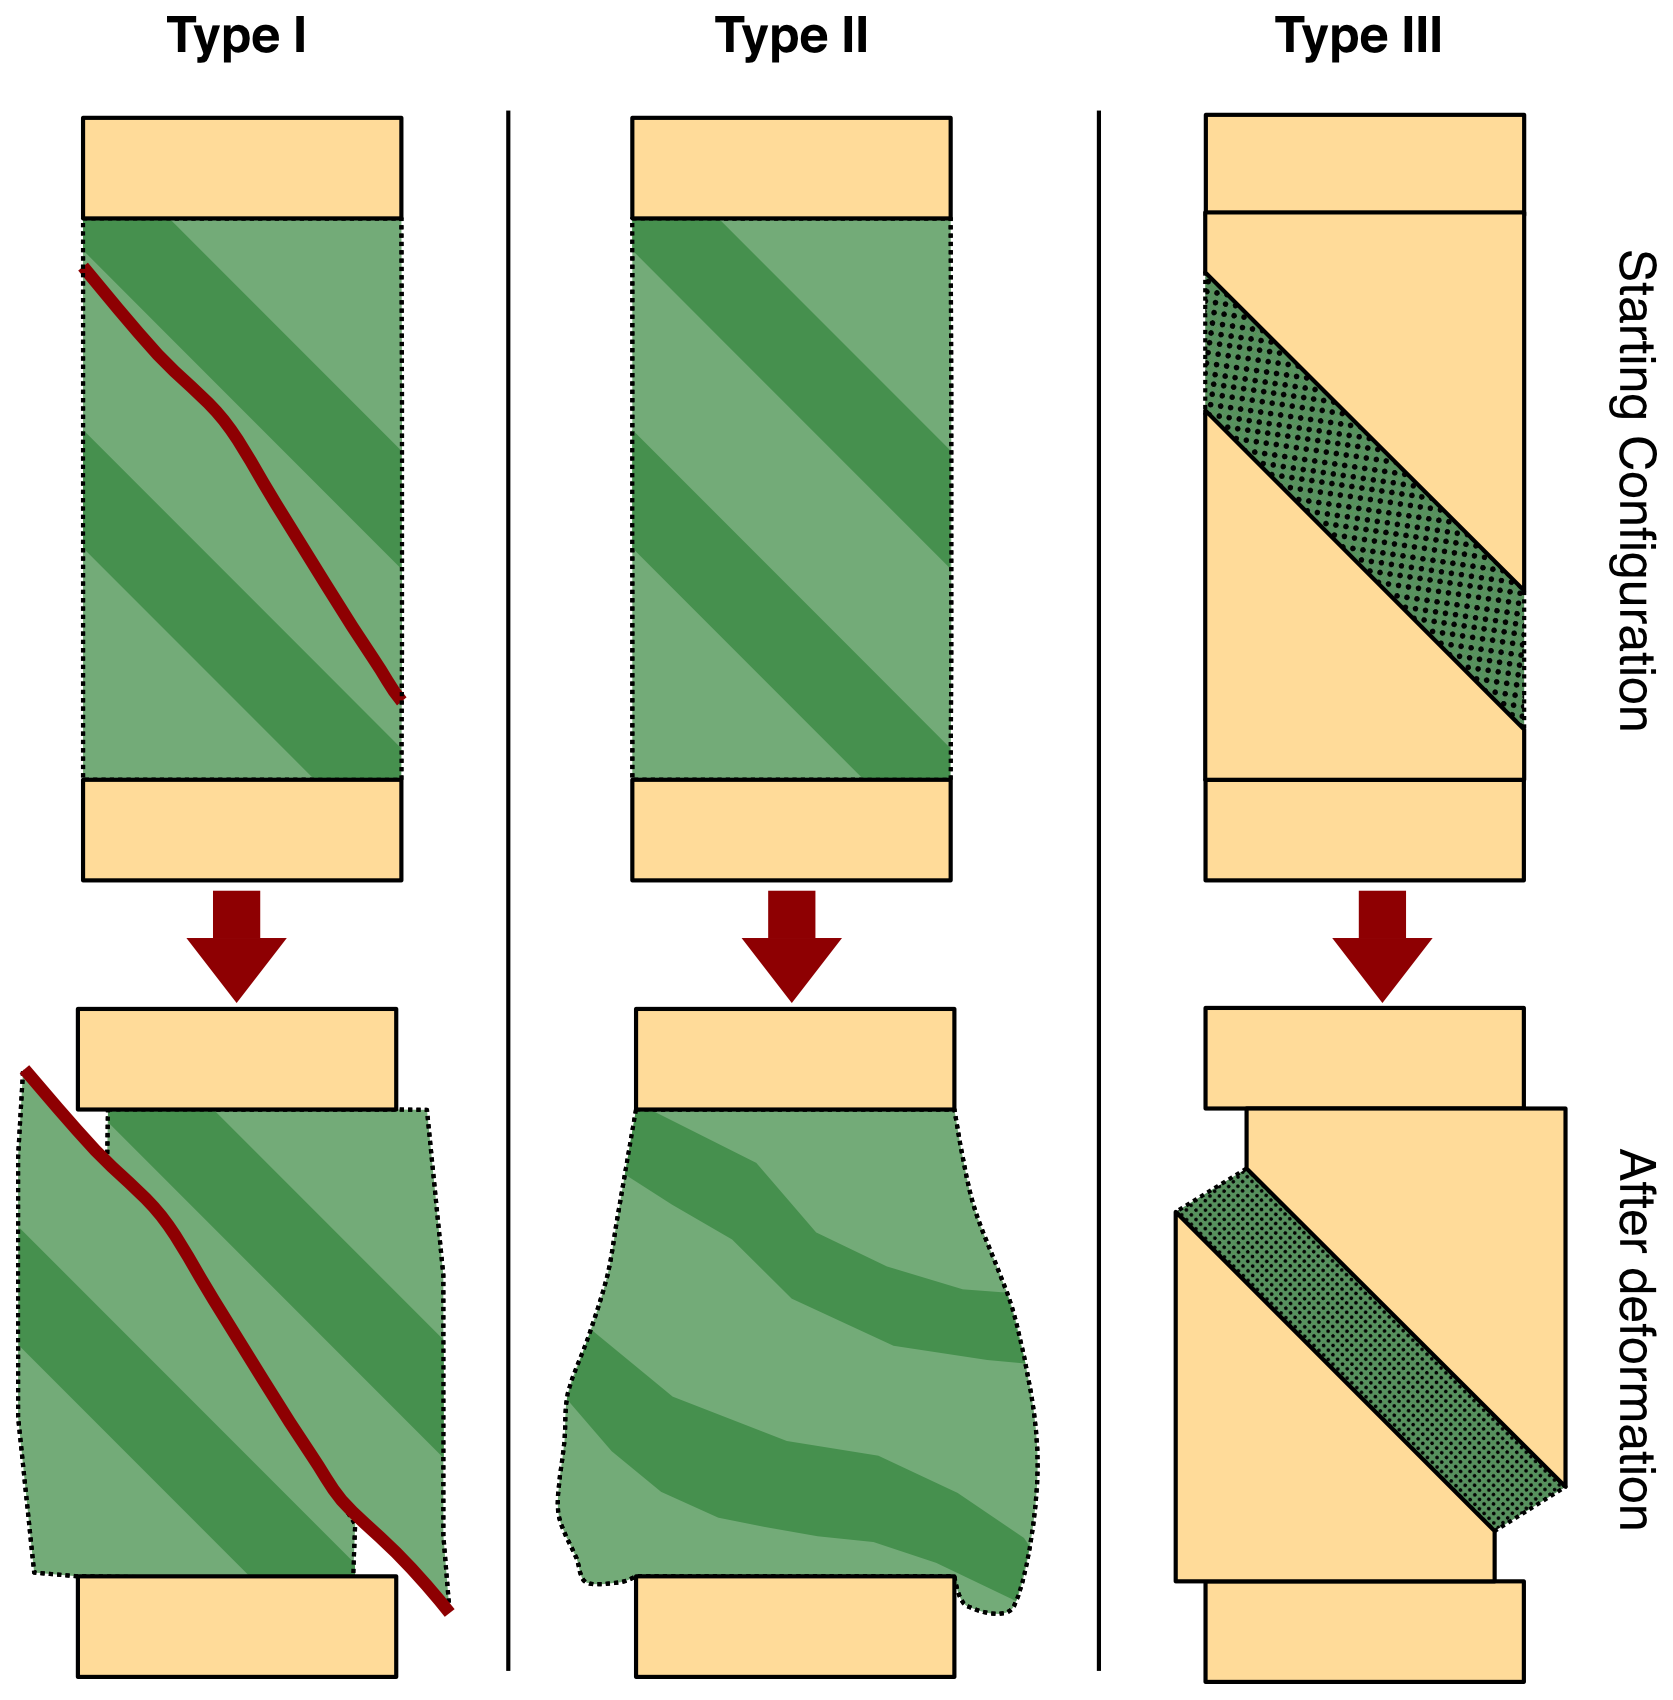
We deformed the granitic ultramylonite in a Griggs-type apparatus at the University of Orléans at confining pressures of 1.2 GPa and temperatures between 650 and 725 °C. We used three different experimental setups, in which the samples were deformed at varying strain rates and to different strains. These different types of experiments bring different insights to strain evolution and deformation mechanisms that can be used for extrapolation to nature (see Fig. 1):
-
Type I: Shear experiments using natural samples, where strain localization in fractures results in dominant simple shear deformation.
-
Type II: Coaxial shortening experiments using natural samples where deformation is more homogeneously distributed.
-
Type III: General shear experiments using coarse-grained (cg) and fine-grained (fg) powders obtained from a natural sample between alumina pistons.
All three experiments were performed on the same starting material; only the sample preparation was different. For Type I and II, the ultramylonite was cored with a 6.3 mm diameter diamond drill, such that the foliation was inclined 45° with respect to the piston axis. These cylindrical samples were carefully investigated macroscopically and with a micro-CT scanner (Skyscan) prior to experimental deformation to ensure that the most homogeneous and fine-grained zone was targeted and that no drilling-induced fractures existed. For Type III, one portion of the ultramylonite was disintegrated using the in-house SELFRAG Lab (high-voltage pulse machine; https://www.selfrag.com/, last access: July 2024; Gnos et al., 2006; Regis et al., 2014) and further milled by hand and in a ball mill (McCrone corundum ball mill). Material from each step was sieved several times to obtain grain sizes below 125 µm, maximizing disintegrated grains and minimizing the damage of grains from the milling process. This material was used directly for Type III-cg (cg: coarse-grained) experiments. From this milled sample batch, a small part was used to perform XRD measurements to obtain a chemical composition of the bulk rock material. For Type III-fg experiments (fg: fine-grained), a second batch of powder was prepared by milling the <125 µm samples with the McCrone mill and further by hand. After several milling cycles, Atterberg cylinder sedimentation was performed to separate a grain size fraction <2.8 µm. For sedimentation times, a Troom of 19.9 °C (climatized), a column height of 28 cm, a particle density of 2.75 g cm−3, and H2O as the suspension medium were considered. The grain size distribution of the gouge samples was measured by laser diffraction in a Mastersizer 3000 (see distribution in Fig. S1 in the Supplement). To avoid clustering in the clay grain size fraction, the dried powder with a droplet of ethanol was homogenized with a pestle and mortar until dry again.
Brittle fractures in sample Type I experiments are typically formed before reaching experimental P–T conditions during the compression stage, by advancing the pistons quickly at low temperatures (≈100 °C). We term these cataclastic shear zones in a coherent sample as pre-fractured microstructures (for more details, see Part 1, Nevskaya et al., 2025). The grain sizes are reduced in a brittle manner down to <0.5 µm from ∼ 15 µm initially. One benefit of the Type I experiments is the large shear strains that can be obtained in the thin zones (up to γ=200), resulting in microstructures that are close to steady-state conditions (see also Microstructures in Part 1, Nevskaya et al., 2025). Furthermore, these zones simulate the evolution of natural faults from brittle to viscous behavior. In the literature, this type of experiment has rarely been used for mechanical tests so far because of its difficulty in correcting the stress measurements. Exceptions are the experiments of Stesky et al. (1974) and Tullis et al. (1990), but some experimental conditions were different (mostly frictional properties in the case of Stesky et al., 1974). Most importantly, their shear stress and shear strain rate were calculated in a different manner compared to our approach (see Sect. 2.4, Corrections of raw data). Type II samples represent a more common setup of coaxial shortening experiments and can be used reliably to understand strain evolution and deformation mechanisms (Dell'Angelo and Tullis, 1988; Ghosh et al., 2022, 2024; Stipp and Tullis, 2003). Type III experiments represent a commonly used Griggs rig simple shear setup (e.g., Fukuda et al., 2018; Okazaki and Hirth, 2016; Richter et al., 2018; Stünitz and Tullis, 2001). These experiments are affected by boundary conditions, such as friction of the forcing blocks against the actuator, compaction of initial porosity, and maximum possible shear straingamma values of 3–4. Type III experiments, however, allow us to compare the influence of different starting grain sizes (<2.8 and <125 µm in our case) and to perform strain rate and temperature stepping with a controlled sample geometry and grain size. As shown below, the extraction of microstructural and mechanical information benefits from the use of all three approaches.
2.3 Grain size analysis
Coarser-grained microstructural domains ( µm) were mapped with a small (500–1000×) magnification on stitched SEM images, where the image sequence was taken as a cross-section perpendicular to the shear zone. For the small scale (∼ 1000–50 nm), grain sizes were measured on high-magnification (5000–30 000×) FEG-SEM backscatter electron detector images by drawing the grain boundaries manually. Automated image analysis techniques would have required larger data sets on which to be trained and better-defined grain boundaries. However, in our samples, these conditions were not met, and for each grain it was decided manually whether it was a grain or not. This method was limited to areas where phases were mixed because many grain boundaries were not visible in monophase regions. More reliable and smaller-scale grain size analysis (∼ 500–10 nm) was performed on TEM sections. This validation shows that FEG-SEM images were sufficient to resolve grain sizes that were confirmed through TEM down to <50 nm. Number-weighted densities and medians from outlined grains in Fiji ImageJ were calculated for large and fine grain sizes for the bulk aggregate by calculating the diameter d of the area A of equivalent circles:
This workflow allows us to capture the broad range of grain size distributions from nanometer (nm) to micrometer (µm) scale in our experimentally deformed samples, where grain size reduction at grain boundaries and initial grain size influence the strength equally, as shown below.
Limitations of resolution in regions of extremely fine-grained material and restriction to observations of phase boundaries instead of grain boundaries (measuring several grains as a single one) will result in an upper limit of the actual grain sizes (e.g., Berger et al., 2011; Heilbronner and Keulen, 2006). Hence, the median of corresponding ranges will overestimate the grain sizes and should be used with caution. Despite these limitations, it is demonstrated that, in our experiments, grain sizes are reduced by orders of magnitude from the starting material, which results in grain size data making it possible to draw conclusions about the shear zone evolution.
2.4 Corrections of raw data
In terms of mechanical data, each type of experiment requires different corrections for different sample geometries. At this point, it is already noted that the parameters calculated in this study are estimated to allow extrapolations and comparisons with the literature and nature. However, more experiments are necessary to determine these parameters precisely for a ready-to-use flow law. In Type I experiments, the shear strain rate is calculated from the thickness of the zone and the vertical displacement of the piston depending on the angle of the shear zone with the shortening direction. It is a standard procedure resulting in shear strain rates . Conversion of shear strain rates of the Type I and Type III experiments to equivalent strain rates is done by following Eq. (2) (e.g., Kohlstedt and Hansen, 2015; Sun and Pec, 2021):
Note that this is considered directly comparable with the calculated of Type II experiments.
In Type I and Type III experiments, differential and shear stress are calculated considering the inclined area on which the measured force acts; in Type II experiments, differential stress is calculated. While, in shear zones forming at 45°, a conversion from shear stress to differential stress is simply by a factor of 2, the shear stress τ for other angles α of the shear zone is calculated as in Eq. (3):
To capture the complexity of our experiments, we used equivalent strain rate . We also calculated the angle-dependent shear stress τα for our stress exponent calculations. However, comparison with differential stress calculations shows that the calculated values for stress and grain size dependence do not change significantly for the observed range of values. For comparison with data in the literature, we therefore use differential stress for stress dependence, as the equivalent shear strain rate already contains the shear zone angle.
Additionally, corrections of the Griggs-type apparatus internal friction were performed, and, furthermore, a friction increase of 1.3 kN mm−1 was subtracted from the load data (see calibrations and “friction correction” by Pec, 2014, and Tarantola et al., 2012). As the samples are very fine-grained, compaction occurs very early during the experiment (during pressurization and very early in the slope section of the loading curve), and a compaction correction is neglected, to reach γ values similar to the ones measured in the thin section by hand. A detailed description of the different calibrations and corrections can be found in Holyoke and Kronenberg (2010), Pec (2014), and Tarantola et al. (2012). The uncertainty resulting from the different corrections is displayed in Fig. 2. The HK molten salt cell correction (Holyoke and Kronenberg, 2010) was tested on the data set, and we found the calculated parameters did not change significantly (see Sect. S3). However, as we use a solid salt cell, this correction would require subtraction of another 48 MPa, which would lead to negative differential stress values at slow-strain-rate steps of Type III experiments. This would imply extension experiments, which were not performed;therefore we do not implement the Holyoke and Kronenberg correction to our experiments. As shown in Sect. S3, the range of possible n values from different corrections is not very large. Hence, stresses are shown as only friction-corrected without any further corrections applied.
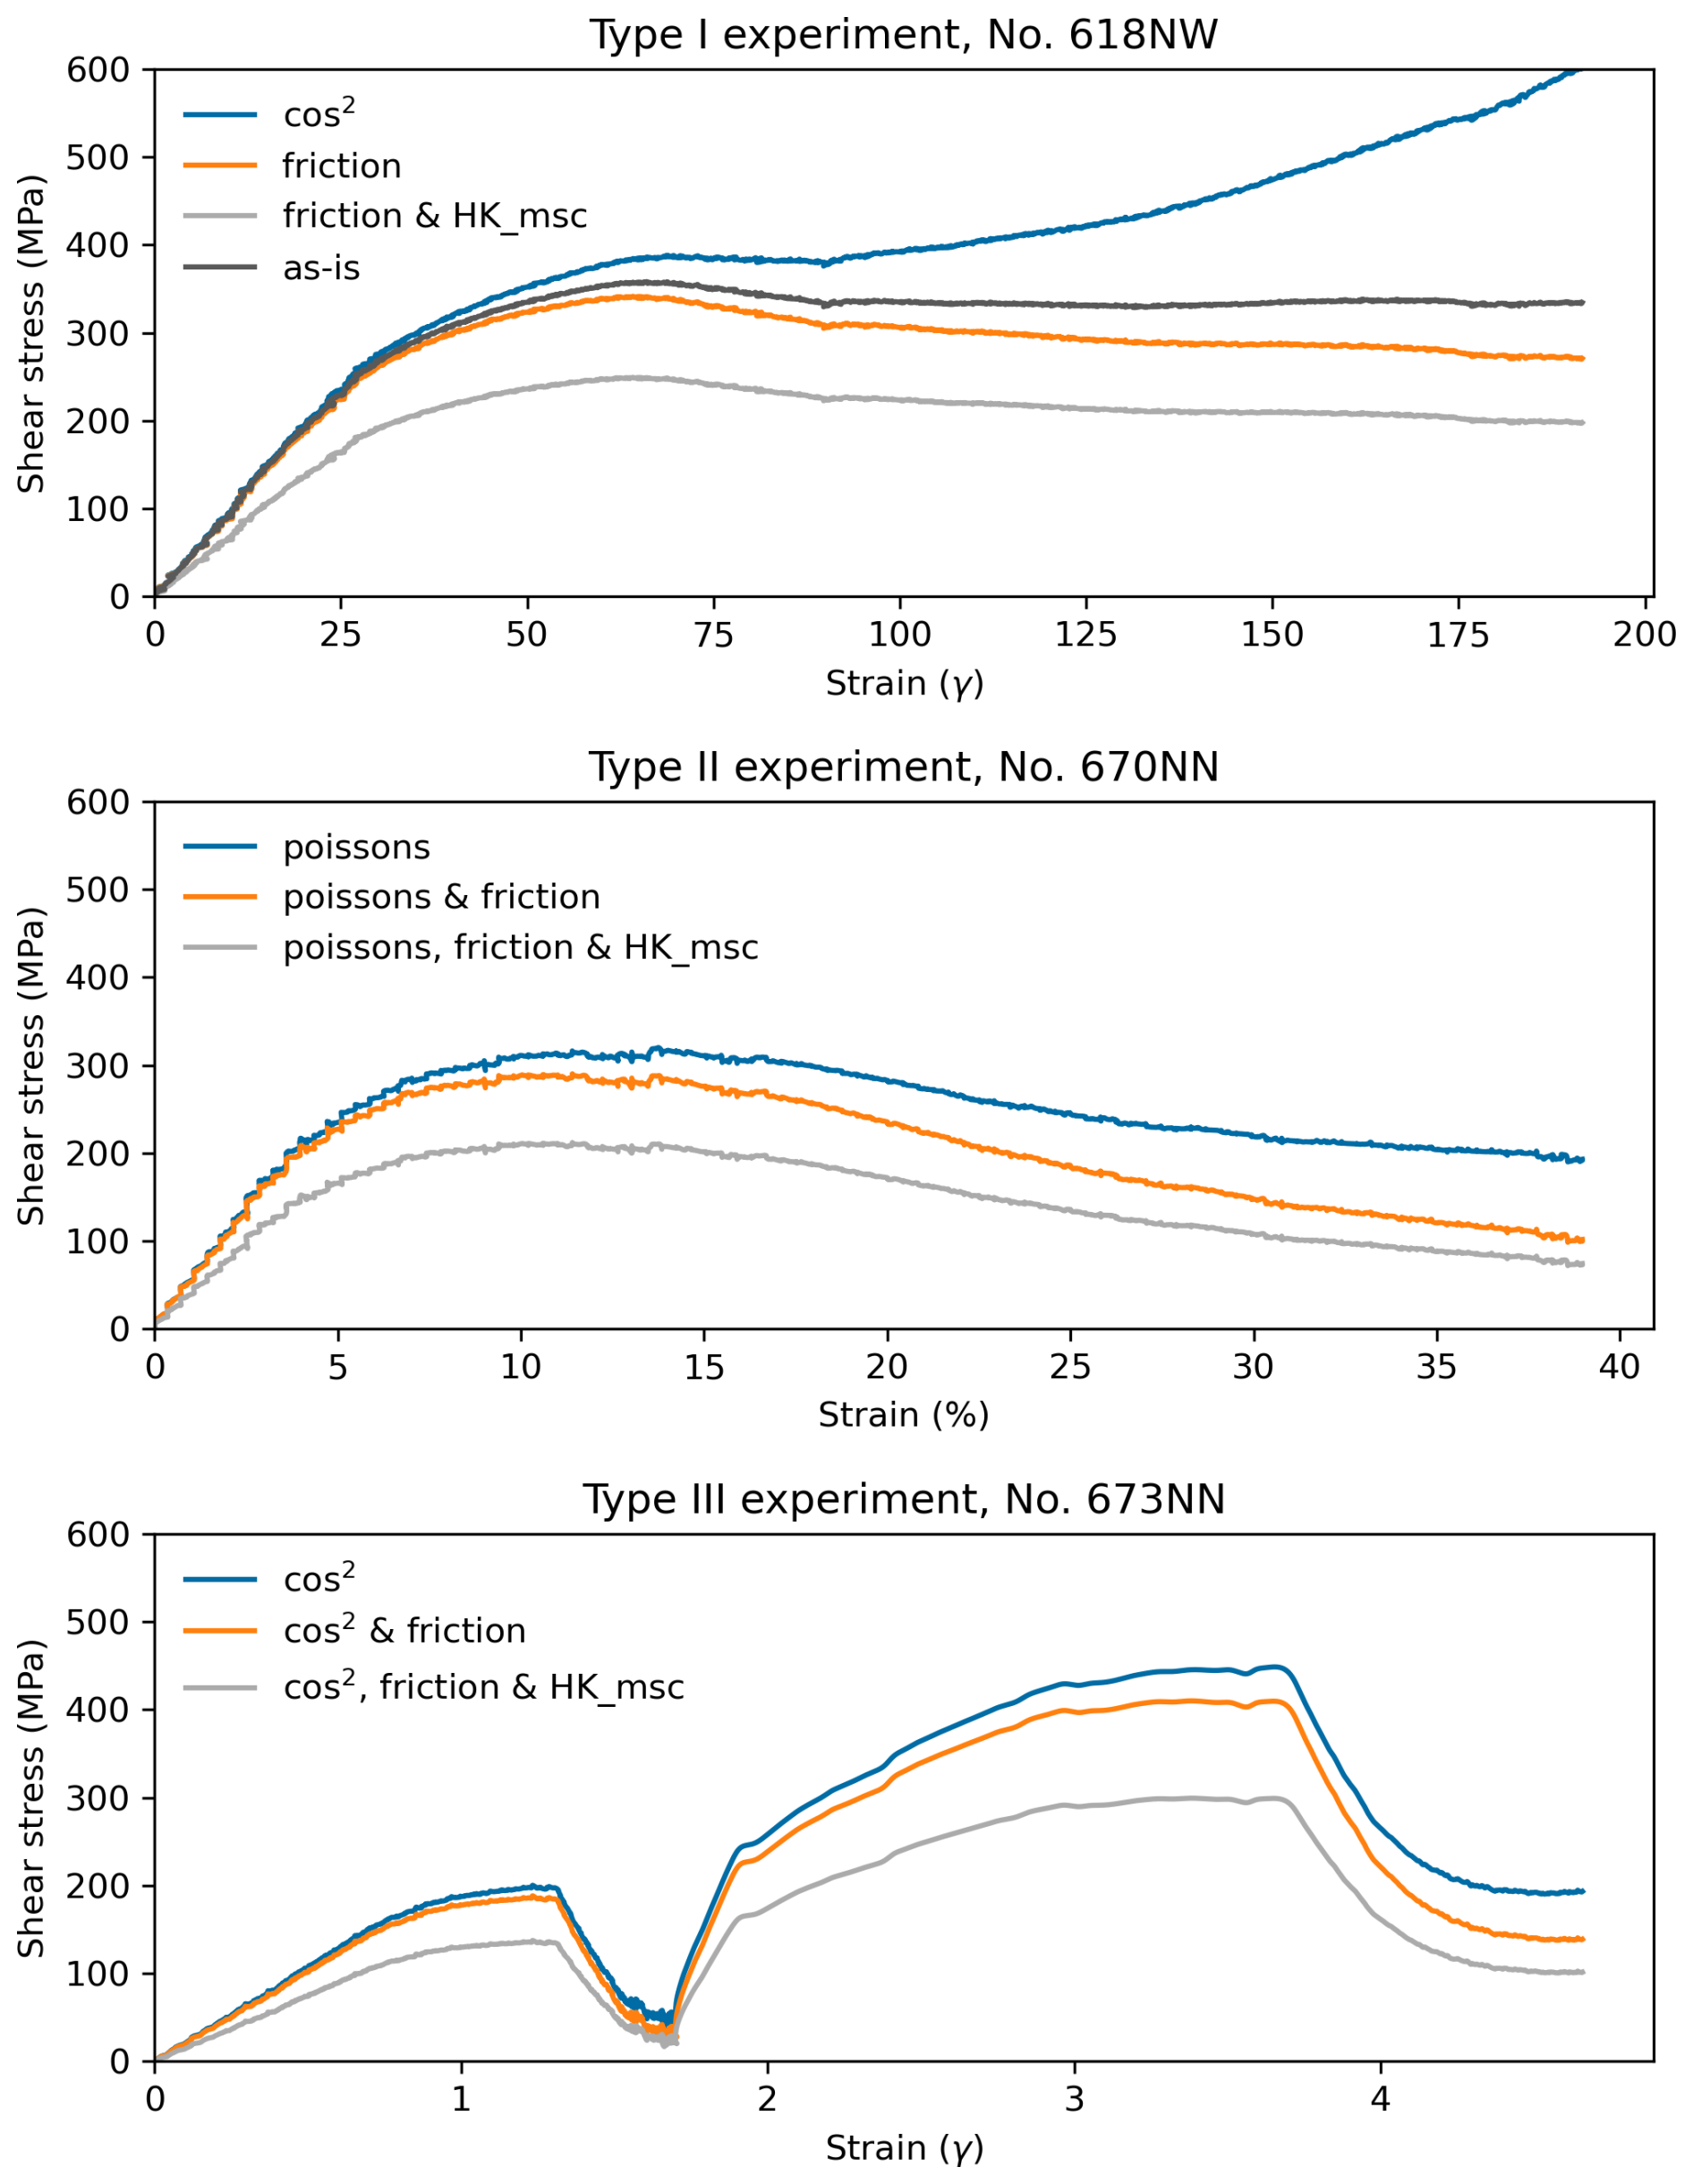
Figure 2Different corrections for recorded data. For more details on each correction, see text. Abbreviations: as-is = only corrected for the stiffness of the machine, etc., with no geometric corrections; cos2 = cosine-squared correction developed by Renee Heilbronner; friction = additionally, machine friction was corrected; HK_msc = Holyoke and Kronenberg (2010) correction as for a molten salt cell (modified slope, no modification of offset); poissons = corrected for Poisson's ratio.
During shear experiments, the area on which the force acts changes continuously, and the recorded load data must be corrected for obtaining shear stress values. In the case of localized shear zones, in Type I and III experiments, there is a decreasing overlap area, resulting in increasing stress values with progressive shear strain. We use the cos2 approximation for the decreasing overlap area for Type III experiments (Heilbronner et al., 2020). In the case of Type I experiments, the strain is beyond the applicability of this correction (should only be applied up to γ<4; Holger Stünitz and Renee Heilbronner, personal communication, 2021), and the correction is therefore omitted. During coaxial shortening, barreling of the sample occurs and leads to an increased cross-sectional area on which the force acts. We assume constant volume to correct Type II experiments for the increasing area with a Poisson ratio correction of 0.5, as described by Pec (2014). This effect is not considered in the correction of Type I experiments, where we use only the friction corrections. A compilation of different corrections and their effect on the mechanical data can be found in Fig. 2.
A major uncertainty of our Type I experiment samples is their geometry. We assume that the defined zone deforms homogeneously rather than as a composite of deformation events and different rates, and we measure its width in a transect in the center of the sample perpendicular to the shear zone. We measure an averaged shear zone width at several points of the cross-section and use this value for calculations. The calculated shear stress is not affected by this error. However, it does influence the shear strain rate significantly (see Sect. S3, Table S1): a 10-fold increase in shear zone thickness (e.g., from 10 to 100 µm) leads to a calculated strain rate that is 1000-fold slower. This highlights the importance of the Type III experiments having a reliable stress and strain rate measure.
2.5 Extrapolation parameters
To be able to extract the parameters determining the strength of our samples across all experimental conditions and geometries, we use the constitutive equation of a common (GSS) diffusion creep flow law (Eq. 4):
where is the equivalent strain rate in s−1, σ is the differential stress in MPa (σ=σ1–σ3) with stress exponent n, d is the grain size in µm with stress exponent m, Q is the activation energy in J mol−1, T is the temperature in K, R is the universal gas constant, and A is a pre-exponential term in MPa−n µmm s−1. We chose the general form of a grain-size-sensitive (i.e., diffusion creep) flow law, as the inferred deformation mechanism in Part 1 (Nevskaya et al., 2025) is grain-size-sensitive dissolution–precipitation creep (DPC), and we aim to correlate the microstructural observations with mechanical data.
To estimate the exponential factors n, m, and Q in Eq. (4), linear regression fits are made in log10 plots for each modified parameter (see Sect. 3.2, 3.3, and 3.4). The stress exponent is the most important parameter for inferring deformation mechanisms and for extrapolation to natural conditions because it is the best-constrained parameter, as shown below. The grain size exponent and subsequent parameters are only to be taken as rough estimates and not precise measurements. Nevertheless, they serve as a guideline for natural conditions close to our experimental conditions and as a parameter for comparison with data in the literature.
3.1 Strain rates and grain sizes
We performed 14 relevant experiments in total, of which 6 were Type I, 5 were Type II, and 3 were Type III experiments at shear strain rates of 10−3 to 10−5 s−1 and coaxial strain rates of 10−6 s−1 (see Table 1). The shear strain rates were calculated based on final shear zone thickness measurements after deformation. Figure 3 summarizes the microstructures serving as a base for our interpretations (see more details for microstructures in Part 1). Two samples were loaded and unloaded without deformation to compare the starting microstructures: one with a fracture created at 100 °C and 1.5 kbar and one without a fracture and set to experimental P–T (650 °C, 1.2 GPa) overnight (630NN and 634NN, respectively; see Table 1 and Fig. 3).
Table 1Summary of experimental parameters. The shear strain rates are calculated from final shear zone thicknesses after the experiment, as described in the text.
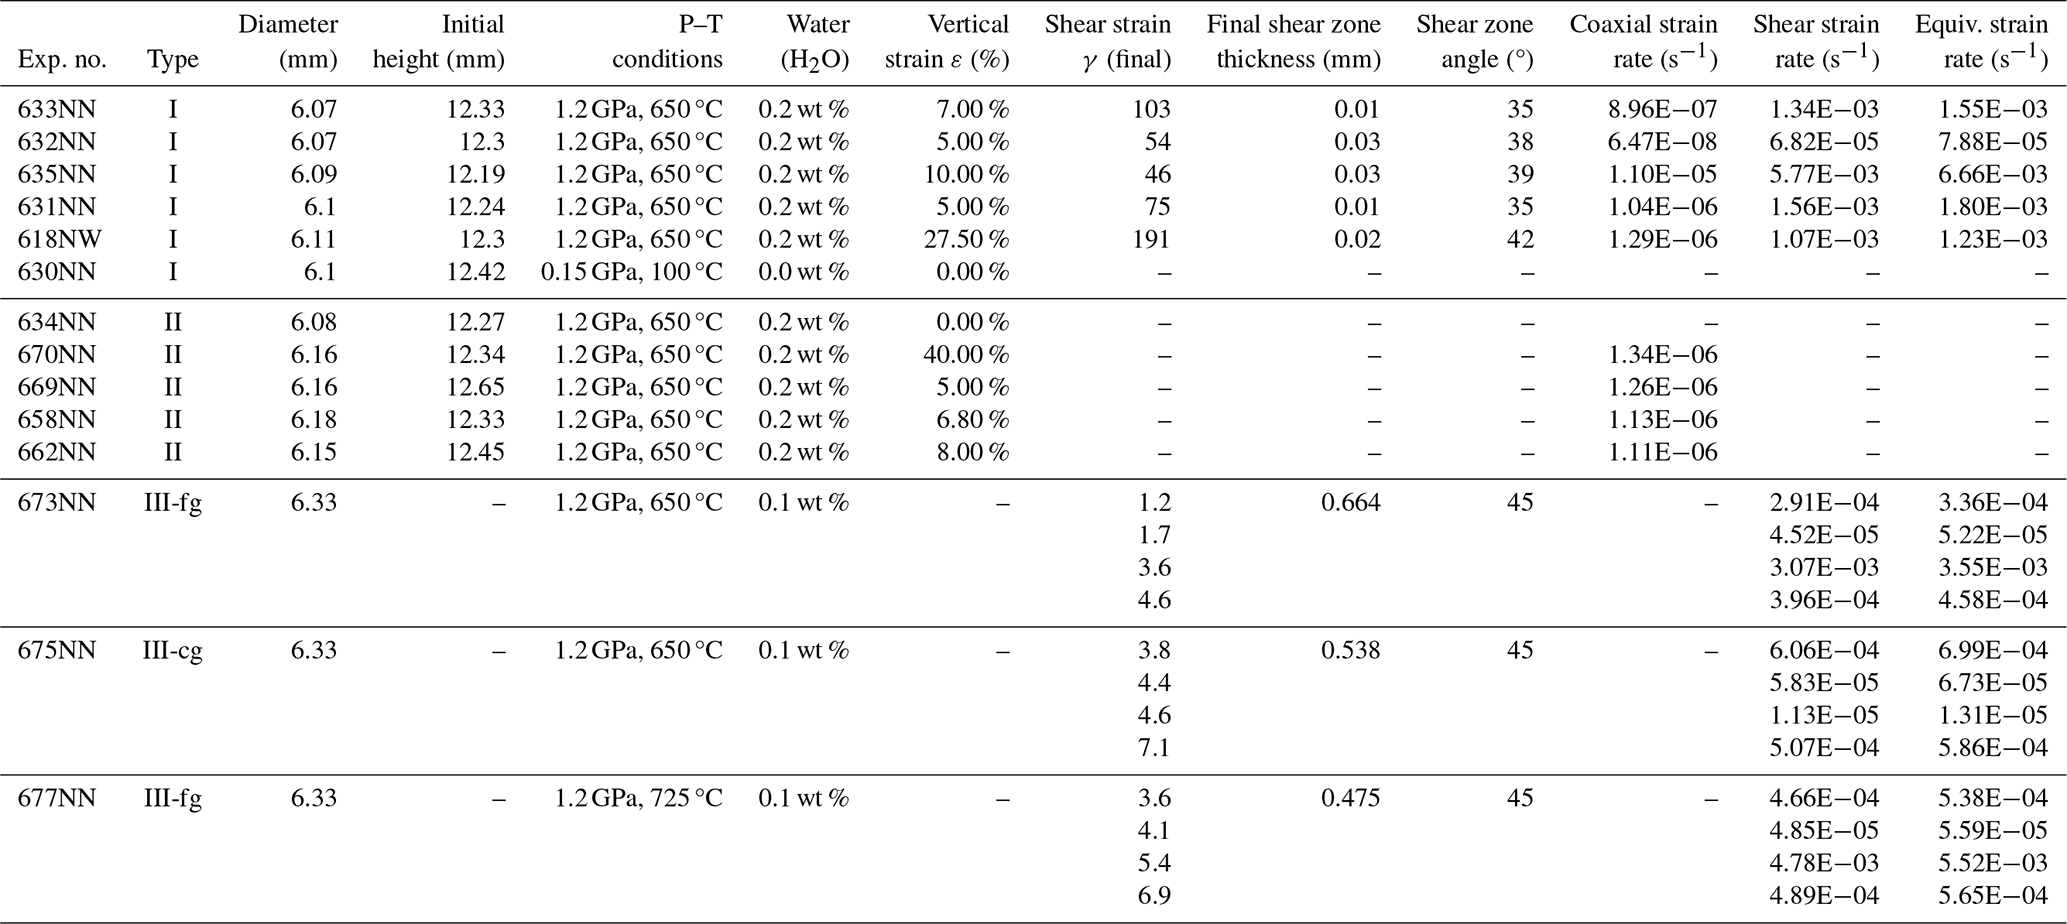
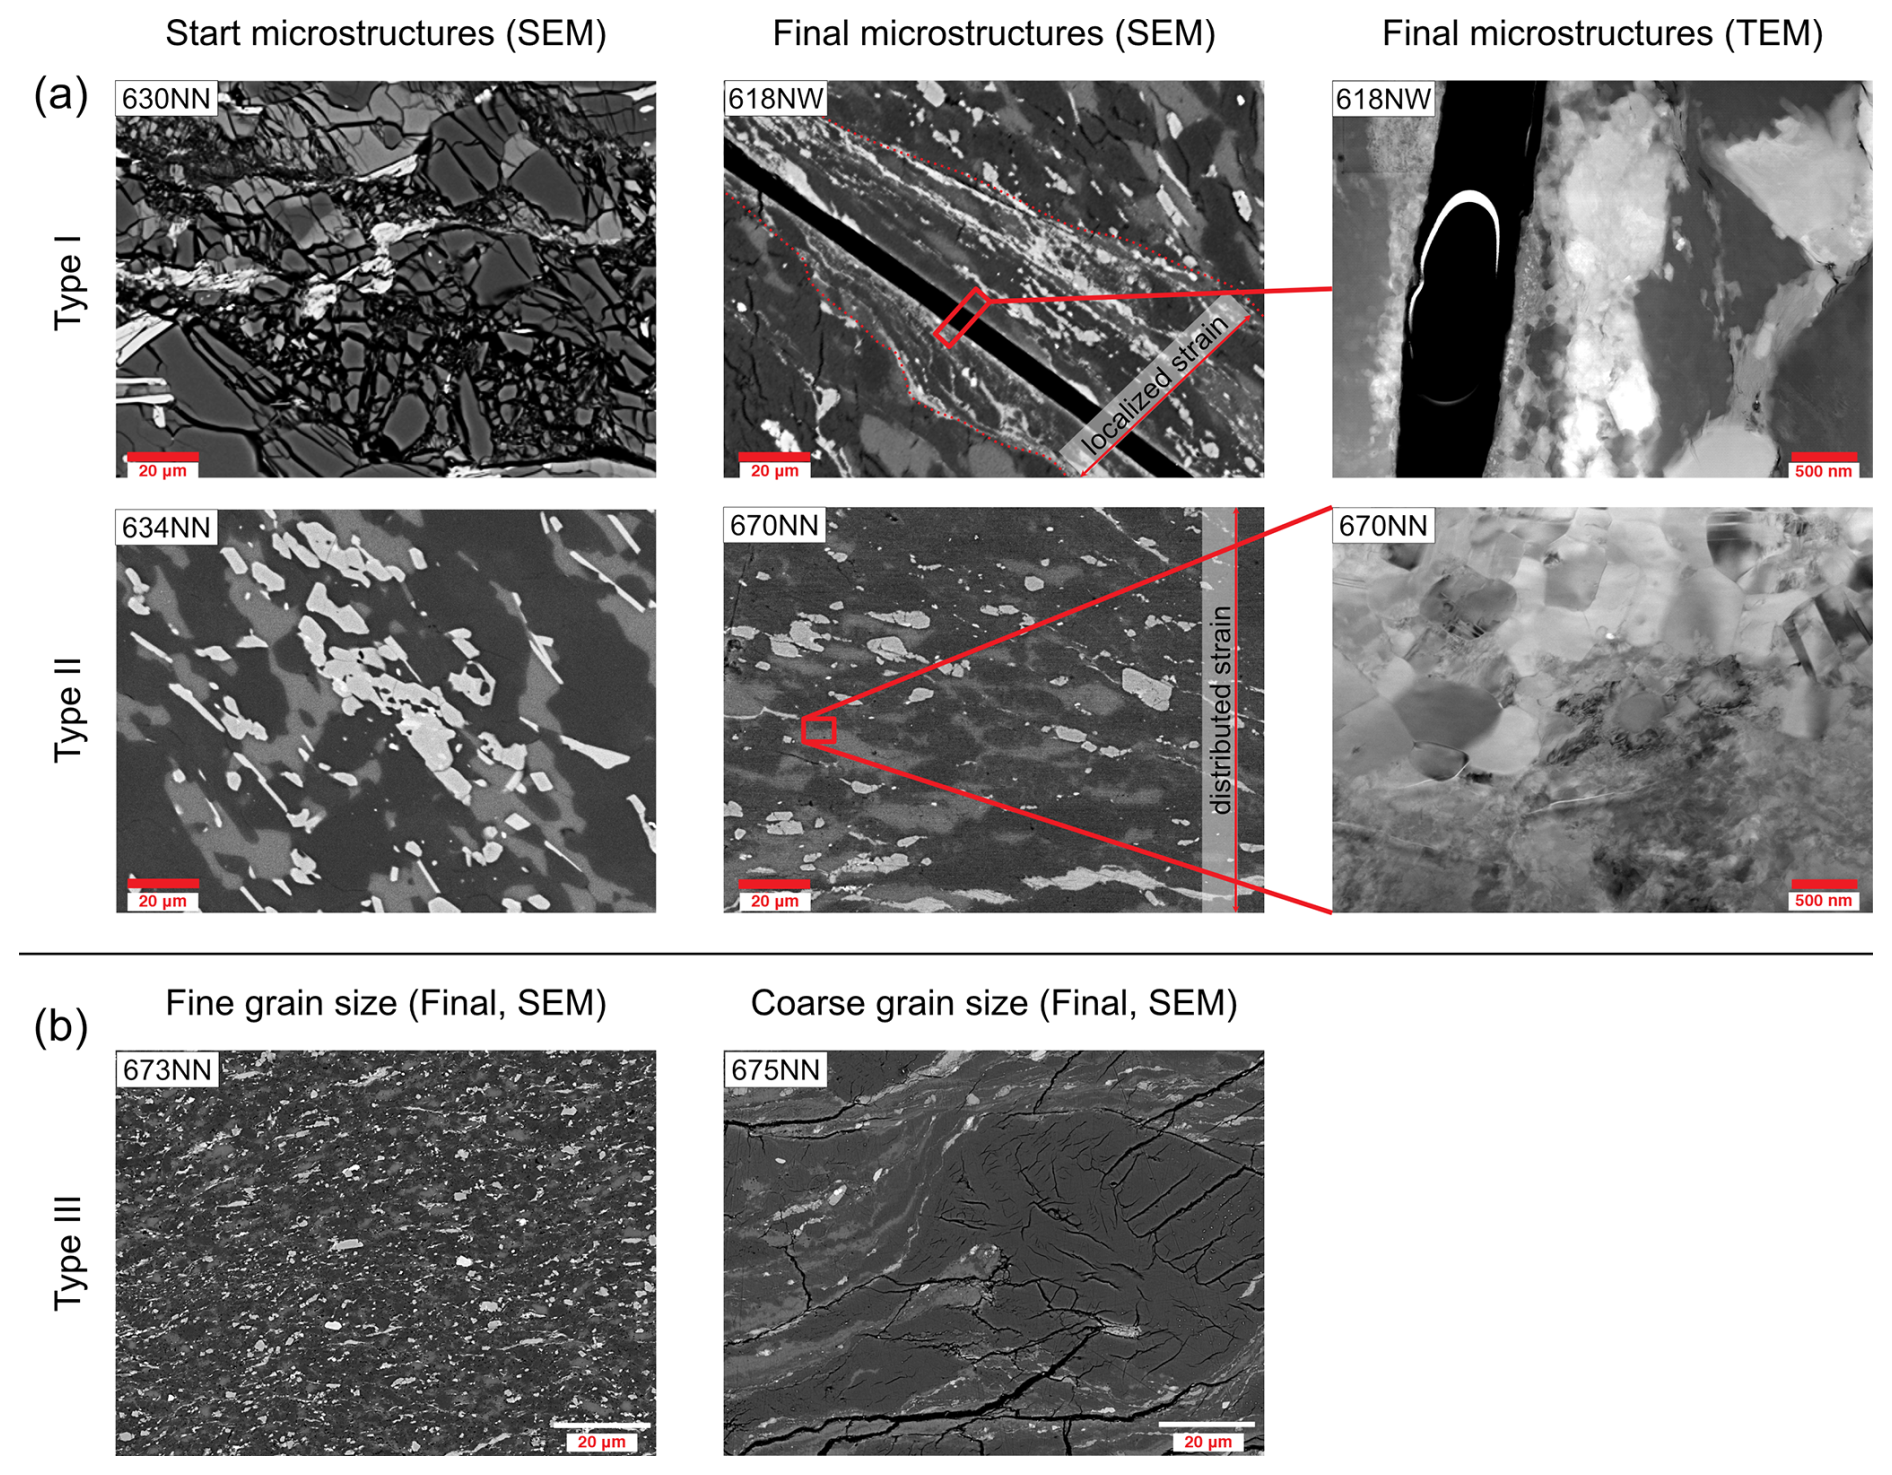
Figure 3Summary of starting and steady-state key microstructures highlighting the different experimental geometries and the strain localization mechanisms of all three experimental types. For Type III, only final microstructures were investigated. All SEM images were recorded using the backscatter electron detector: bright phases (bt + ep), medium-gray phases (K-fsp), dark-gray phases (ab + qtz). Note the same scale in the first two columns. Type I TEM section is a vertical slice through the highest-strain zone with an unloading crack in the middle. Type II TEM shows the phase boundaries between ab (a) and K-fsp (b). Type III highlights the homogeneous strain and grain size distribution for a fine starting grain size and a bimodal grain size distribution for a coarse starting grain size, with a big quartz grain in the center. Note the very similar grain size in the fine-grained area of the coarse experiment and the fine-grained experiment.
In Type III experiments, we performed strain rate stepping and the final shear zone width varied between 475 and 664 µm. Each of the experiments was deformed with four strain rate steps – always 1 order of magnitude faster/slower than the previous. We used a slower strain rate by 1 order of magnitude for the coarser starting material experiment (unlike in the fine-grained material), since a fast strain rate of 10−3 s−1 led to high differential stresses causing jacket rupture (see all experimental parameters in Table 1 and all experiments in Fig. 4). The first and last strain rate steps were set to the same speed, to test for stable microstructures and mechanical data over all strain rate steps. In Type III-fg experiments, after reaching a peak shear stress, the samples directly deformed at steady-state stress; in Type III-cg, weakening occurred at the first strain rate step before reaching a steady-state flow stress (Fig. 4.). In Type III-fg, the whole zone deforms homogeneously. Type III-cg is inhomogeneous and shows strain partitioning and a bimodal grain size distribution (see Results, Fig. 7).
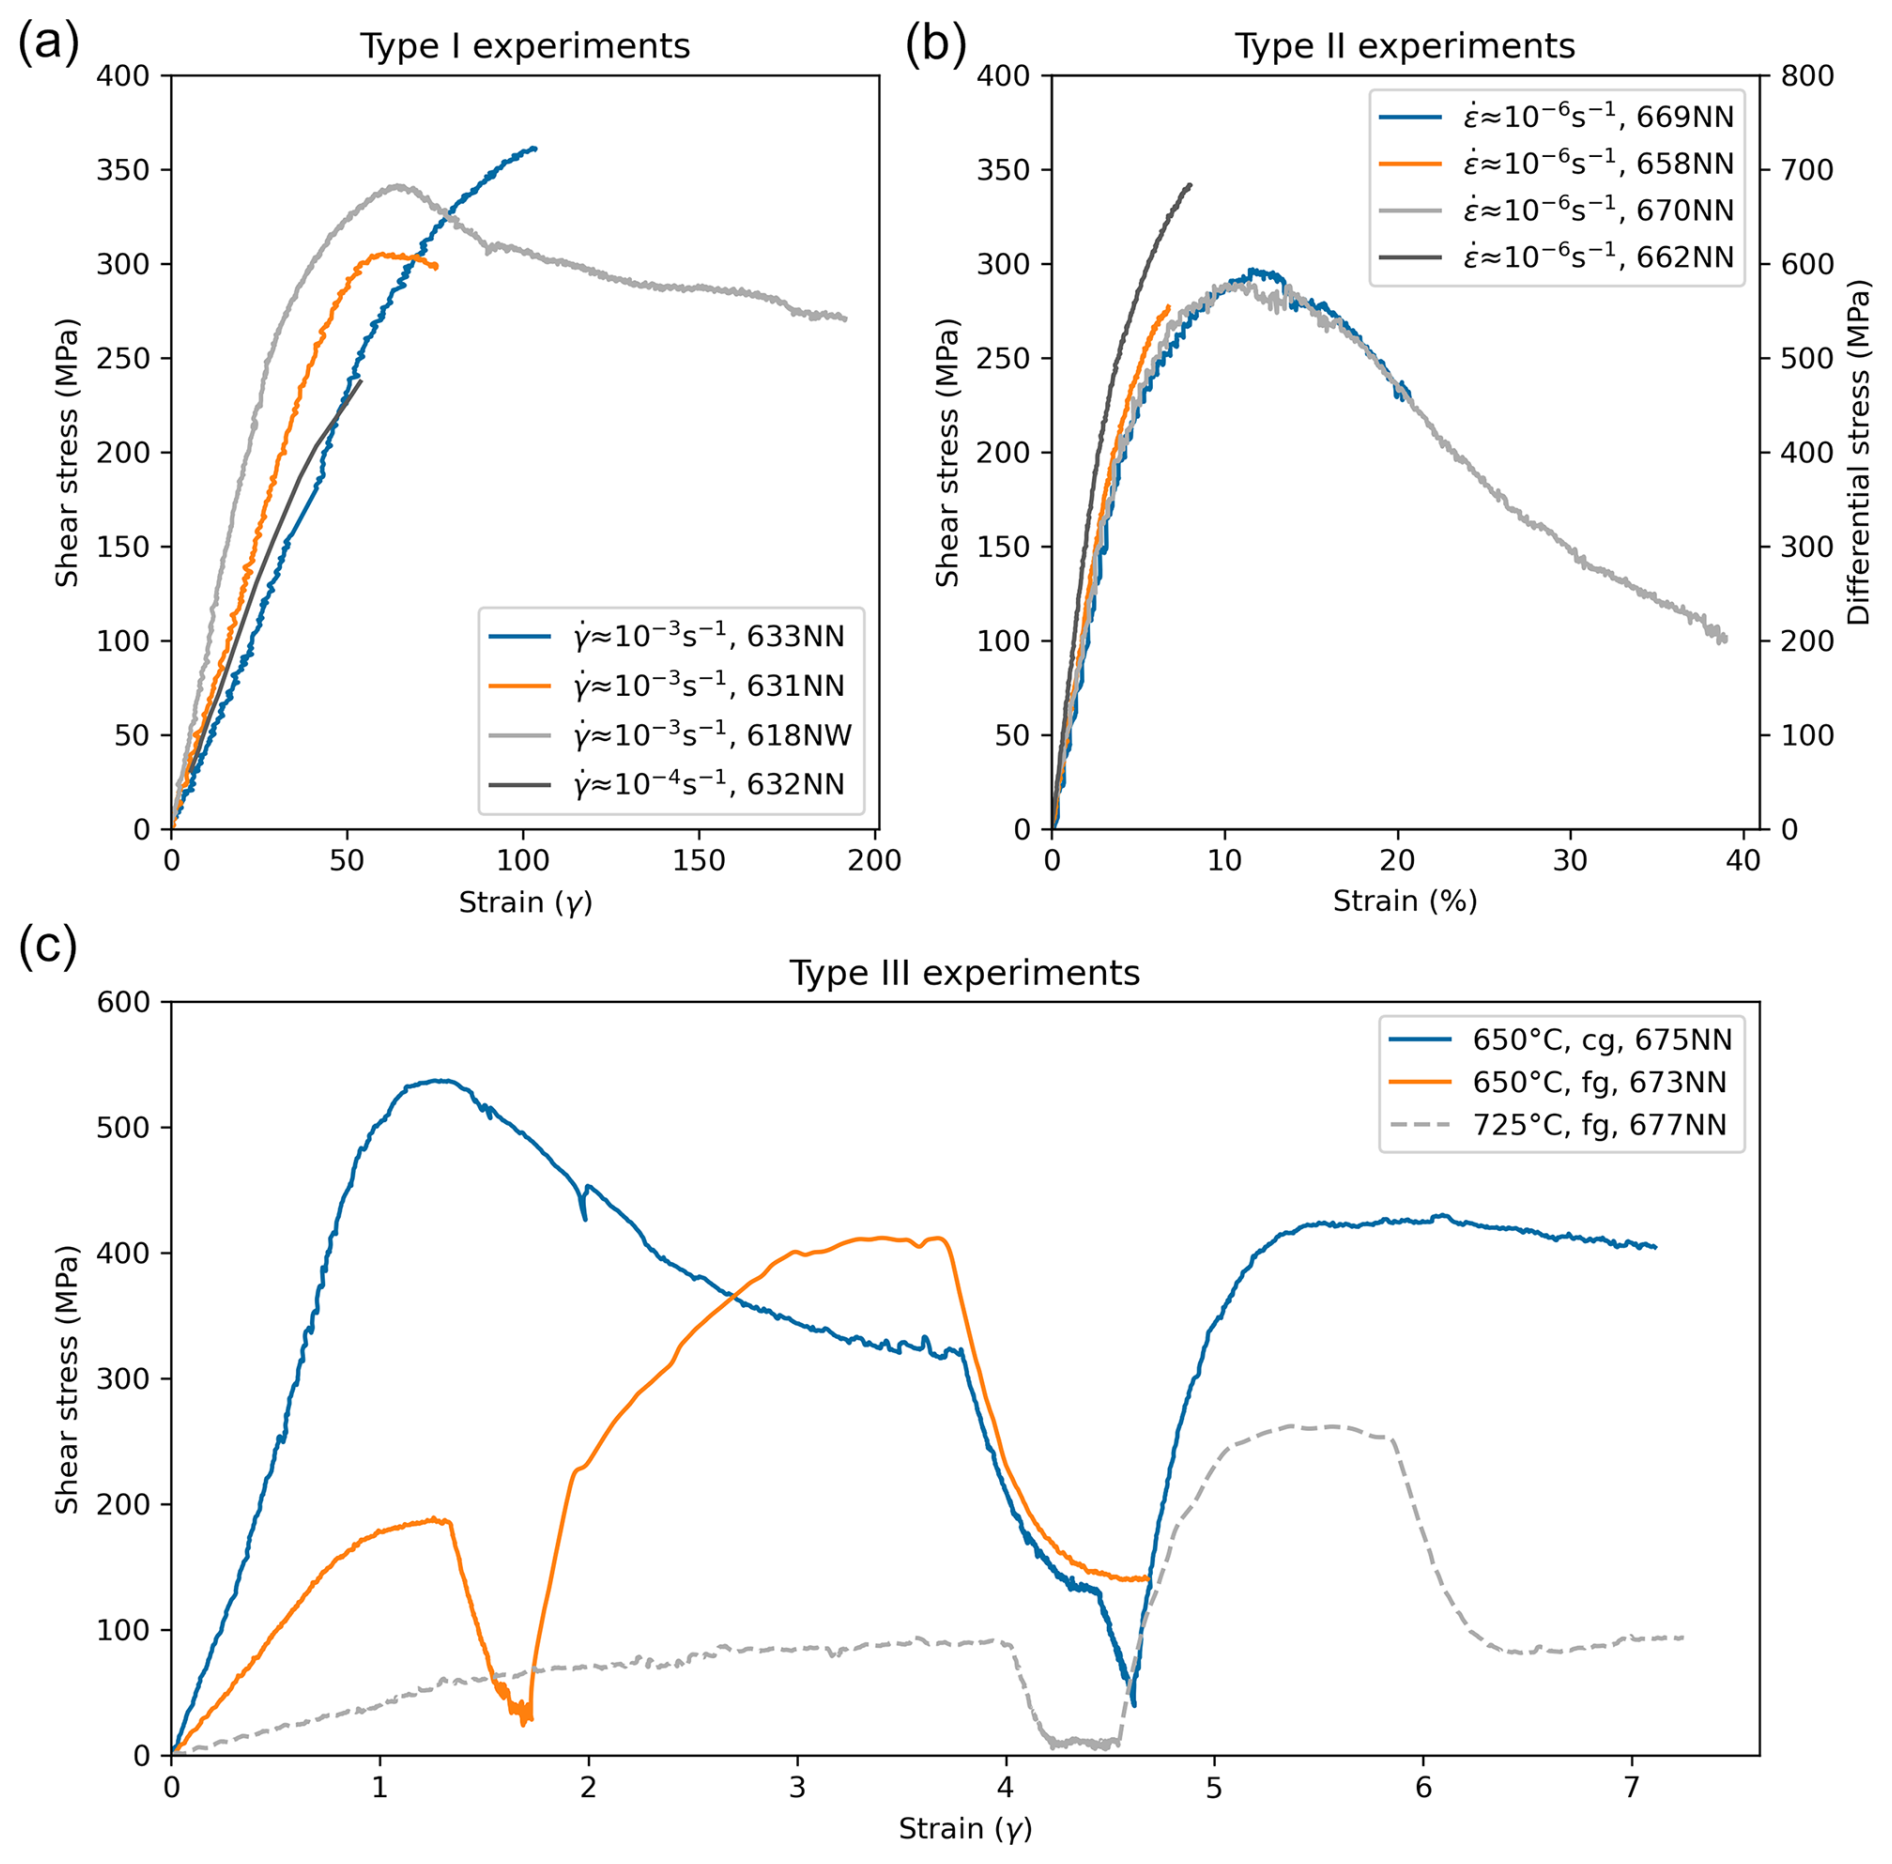
Figure 4Experiments used in this study as stress–strain diagrams. Corresponding experimental parameters can be found in Table 1. Note that, for Type I experiments (a), the initial slope appears not to match; however, this effect is caused by the different shear zone widths leading to different strain calculations at the same vertical displacements. Type II experiments (b) were all performed in the same conditions to different strains. Slight variations in peak stress may be due to compositional changes. Type III experiments (c) are performed with fine-grained (fg) and coarse-grained (cg) material, with varying temperature, and with strain rates in steps. As a result, each increment in the slopes is caused by a change in strain rate according to the rates in Table 1.
In Type II experiments, we calculate the bulk strain as a coaxial shortening strain. It is observed that typically the lower third to two-thirds of the sample is deformed, whereas the upper part remains weakly formed or undeformed (schematic in Fig. 1). These samples show a continuous weakening (see Fig. 4) and do not reach steady-state conditions.
In Type I experiments, the angle of the shear zone to the shortening direction varied between 35 and ∼ 42°, and the maximum thickness of the localized zone was 0.01 to 0.02 µm. In each case, the pre-existing mylonitic fabric is not exploited as a deformation fabric despite its favorable orientation for shear. The stress recording shows a peak stress, then slight weakening, and reaches nearly steady-state conditions after a shear strain of gamma ≈70 (Fig. 4). One sample (630NN) was pressurized to brittle failure, to obtain the starting microstructures before reaching experimental P–T conditions. A slow-strain-rate experiment (632NN) lasted only until peak stress and is therefore not considered for the flow law calculations.
In addition, in Type I experiments, the shear zone evolution was considered, and (shear) strain rate calculations were therefore carried out after microstructural observation (Part 1, Nevskaya et al., 2025) and measurements of the shear zone width. We use observations from the shear zone evolution in terms of shear stress and strain localization for shear zone widths and corresponding grain sizes (see Fig. 5). As described in Part 1 (and summarized in Fig. 5), the deformation starts with a wider shear zone (20 µm) and coarser grain size (median ∼ 150 nm) at peak stress and subsequently localizes in narrower (2 µm–200 nm), extremely fine-grained (median 53–13 nm), and slightly weaker zones at ∼ steady-state stress. All grain size ranges are assumed to be preserved in the final microstructures (Part 1, Nevskaya et al., 2025). At the same time, the shear zone is localizing and further narrowing (Fig. 5); hence, at constant vertical displacement rate, the actual strain rate becomes incrementally faster. These values give the range for strain rates with corresponding stresses and the grain size sensitivity.
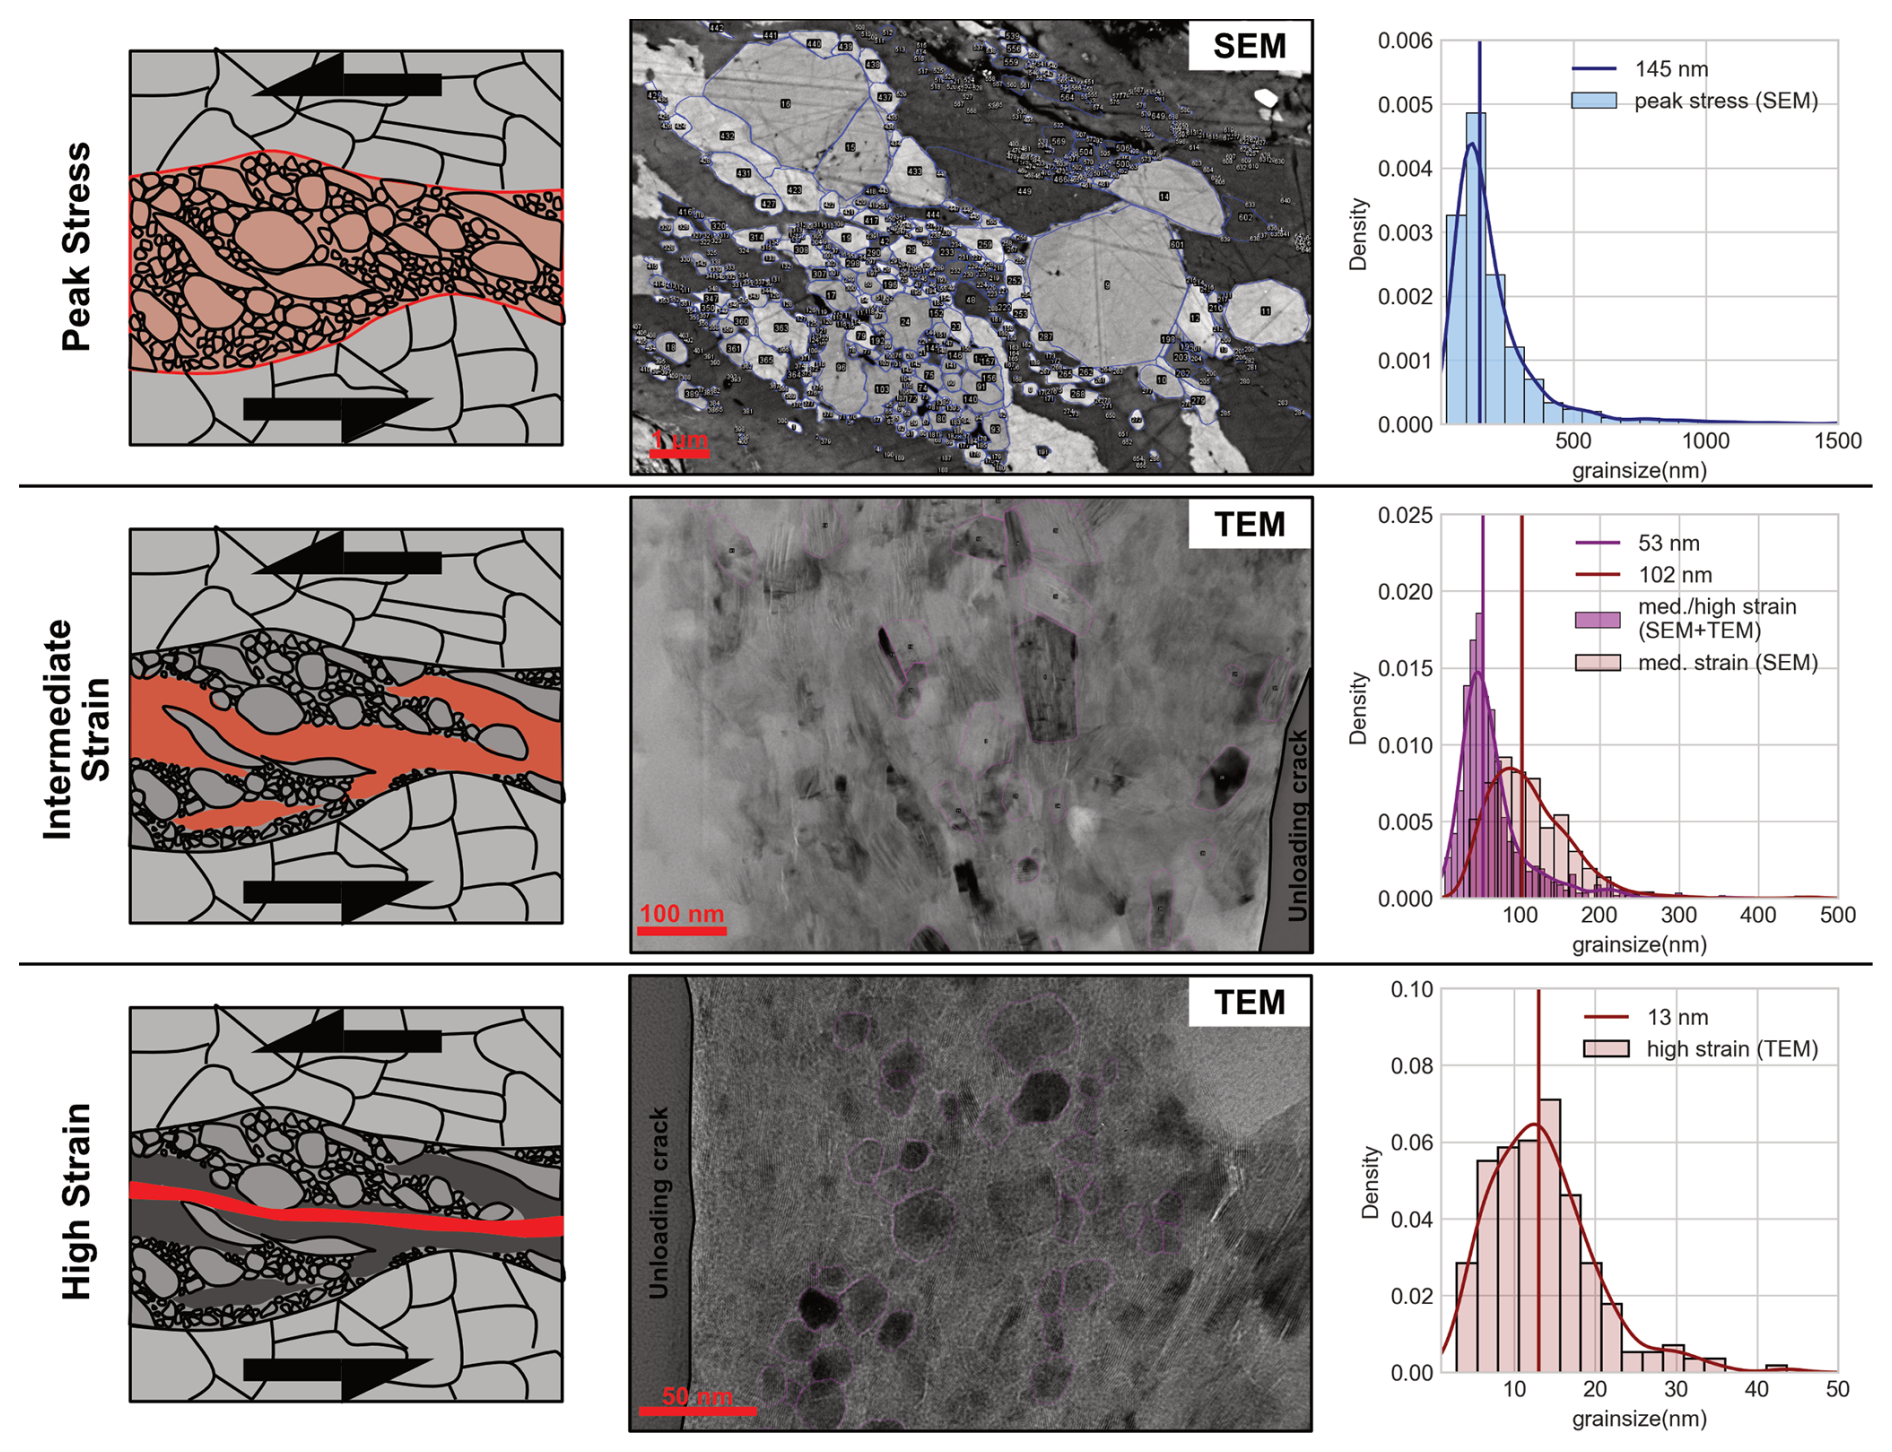
Figure 5Shear zone evolution in terms of strain localization and grain sizes for experiment 618NW as an example of Type I experiments. Red areas in the schematic drawings show the distribution of the deforming zone. Note the varying scale for the grain size distribution, which was chosen to display the dramatic grain size reduction from peak stress to high-strain/steady-state stress zones. Blue and pink lines (for better resolution, see Fig. S2) in the SEM/TEM images are manually drawn for grain size measurements in Fiji ImageJ. The grain size distributions compile measured grains not only from the displayed images, but also from similar comparable microstructural domains.
The grain sizes in Type III-fg experiments and the peak stress of Type I and high-strain regions of Type III-cg develop towards similar median grain size values ranging from ∼ 145 to ∼250 nm. Type II experiments exhibit a bimodal grain size distribution (similarly to Type III-cg), where newly formed grains occur at phase boundaries of feldspars. There, we observe median grain sizes of 270 nm in the boundaries of starting feldspars, with a range of 58–808 nm.
We repeated experiments under the same conditions but with different strains to show the reproducibility and understand the geometric, mechanical, and microstructural evolution of the samples (see Fig. 4). In the following, we show that the data are consistent despite the natural complexity of the starting material and the use of different experimental setups.
3.2 Stress–strain rate dependence (stress exponent n)
To compile the dependence of stress on strain rate, we used data from strain rate stepping (Type III) and localized shear experiments (Type I), grouping them by grain size and temperature. The log10 of the differential stress (friction-corrected) is plotted against the log10 of equivalent strain rate (calculated with the shear zone angle and shear zone width; Fig. 6). A slope for each group was calculated by linear regression. The given error is based on the misfit of the regression line, and the R2 is given next to the corresponding slope. As can be seen in Fig. 4, Type II experiments especially are very consistent with each other. The slopes defining the stress–strain rate relationship are based on the stepping experiments of Type III and can be fitted reasonably (Fig. 6). The slope calculated from Type III stepping experiments was used to construct the slopes for the single-value experiments of Type I and II.
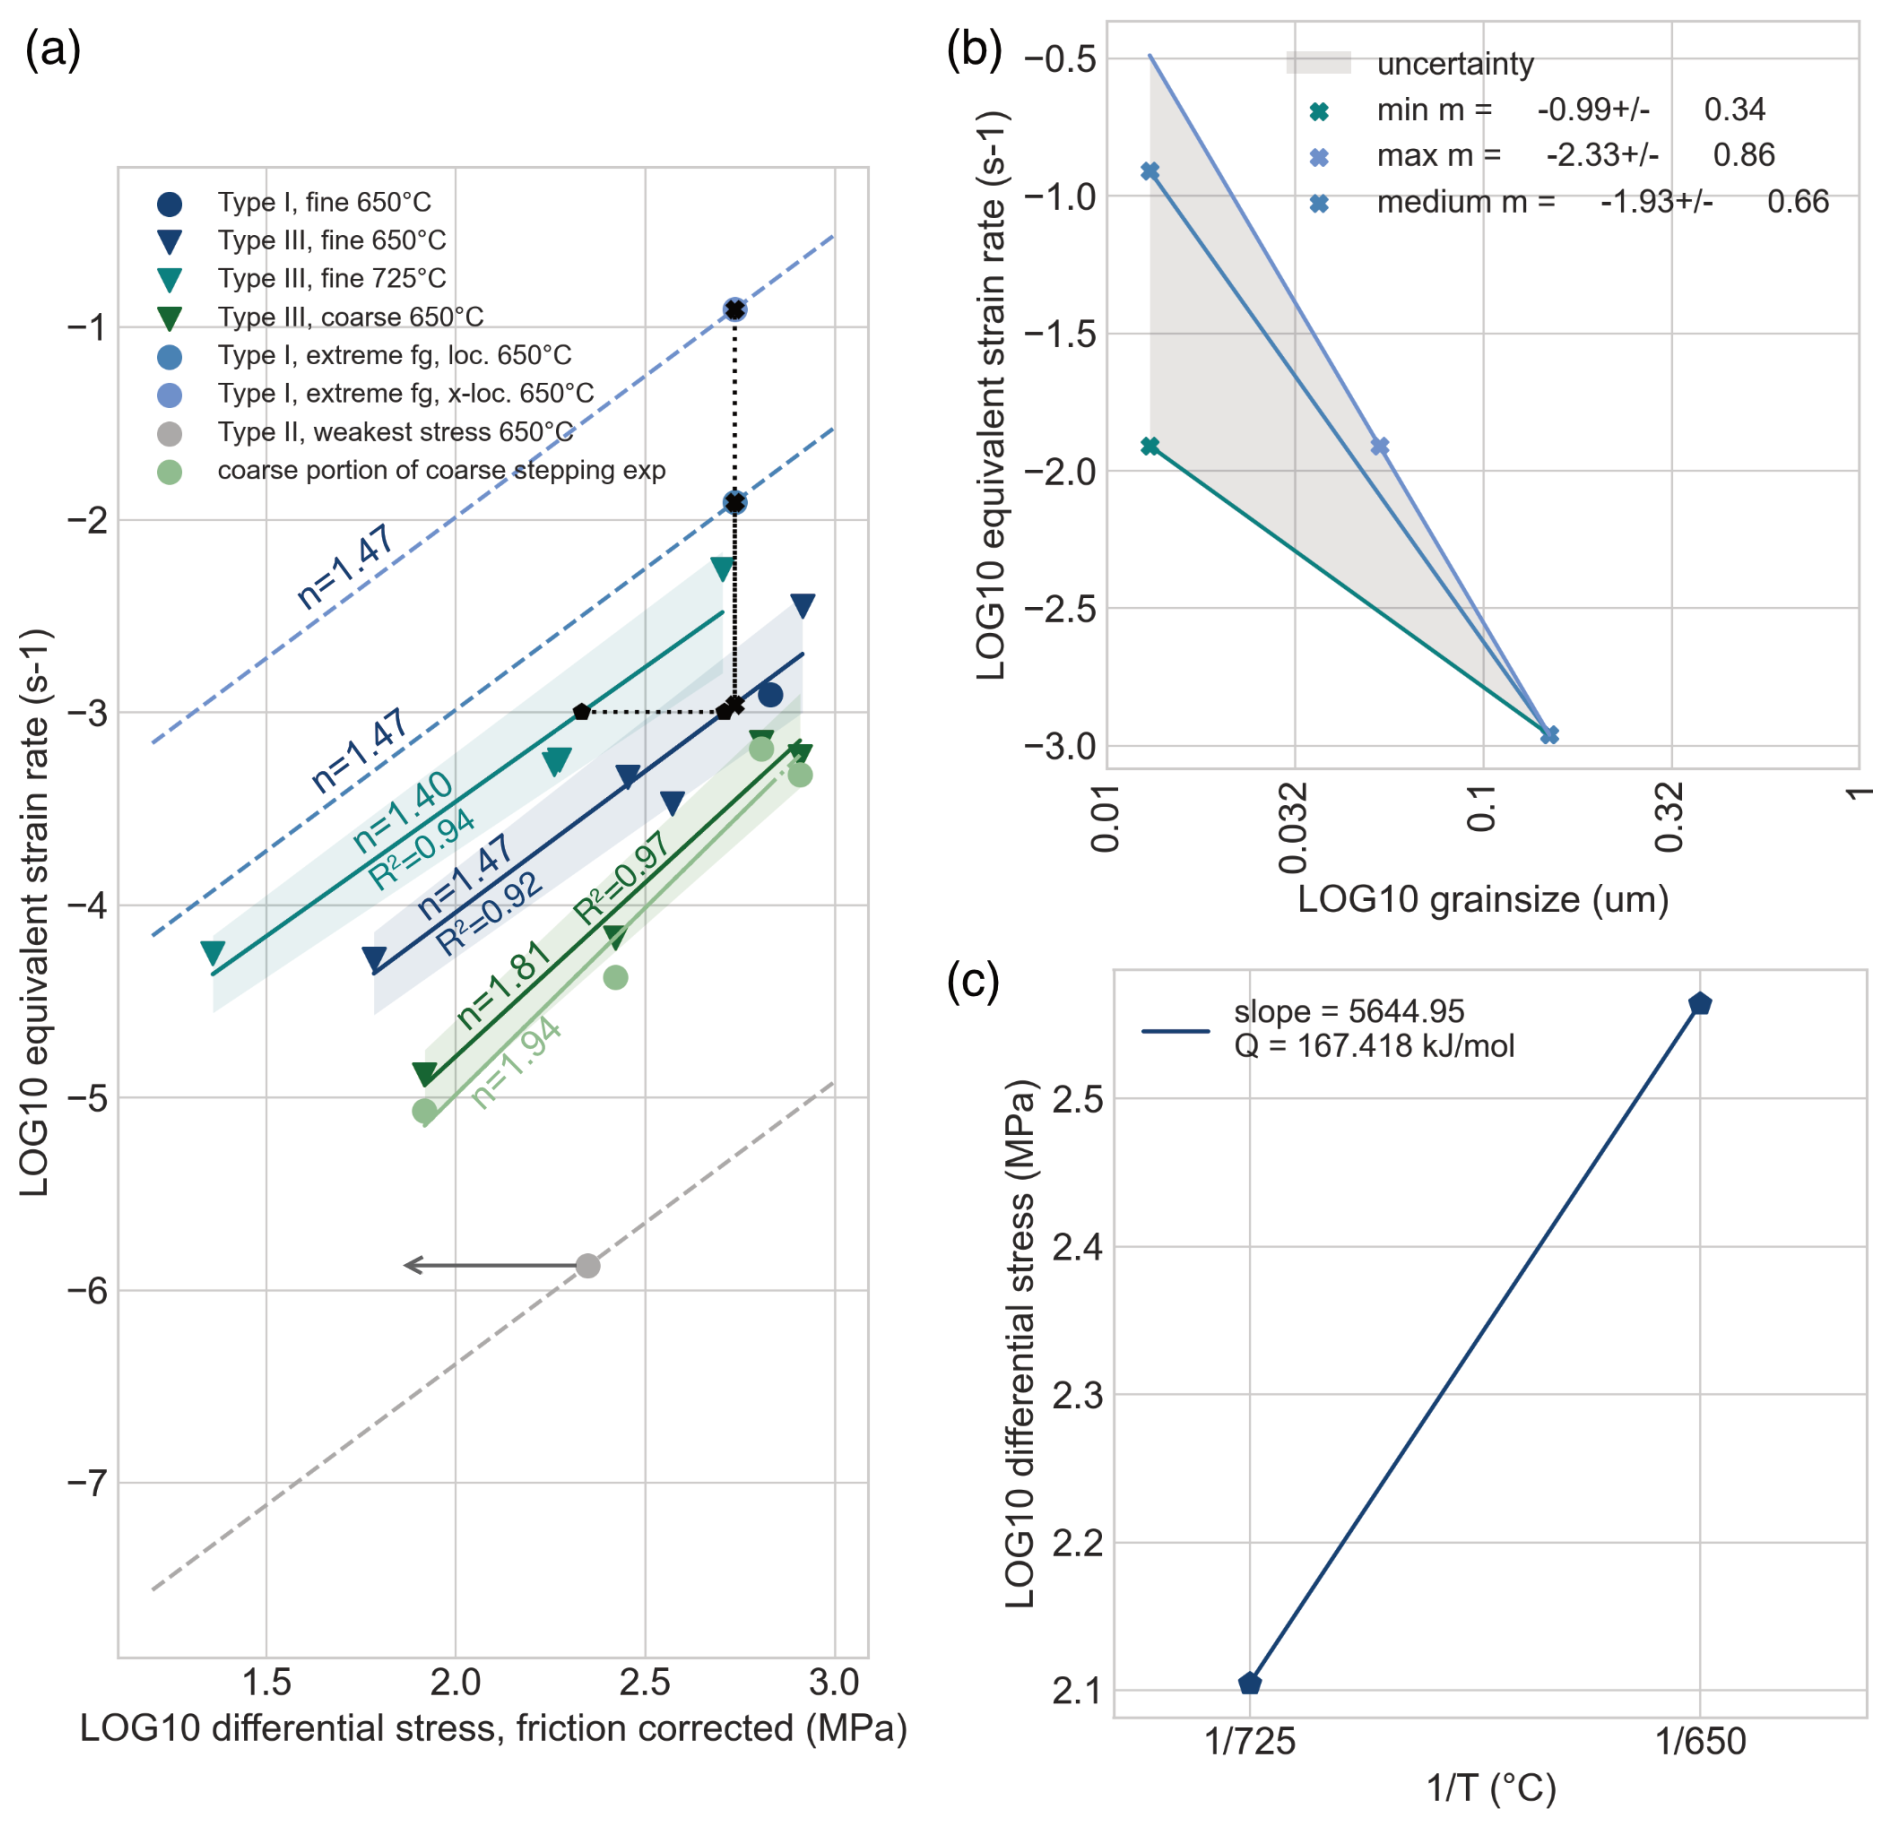
Figure 6Calculations of rate, grain size, and temperature dependencies for interpretations and extrapolations. (a) n-value calculations based on mostly Type III experiments taken from steady-state/highest strain value. For assumptions and extrapolations, see text. The gray arrow indicates that this Type II experiment has not reached steady-state stress yet and therefore might continue to weaken. Furthermore, its strain rate is a minimum value; however, localization might mean strain rates to up to 10−4 s−1. (b) Minimum and maximum grain size dependency taken at the points marked with a cross in panel (a). (c) Temperature dependence/activation energy calculations based on the pentagon points in panel (a), taking into account several experiments and experimental data points. The calculated parameters are verified in Sect. S5 and Fig. S4.
For fine-grained experiments, we obtain at 650 °C and at 725 °C (Fig. 6). In the case of our polymineralic samples, Type I and Type III experiments are very valuable to understand the deformation mechanisms in polymineralic rocks. However, the geometries and boundary conditions induce a large error in the stress measurements. On the other hand, the Type II experiments have a well-constrained geometry and show more consistent mechanical data (Fig. 4). By combining data sets of all experiments, we try to improve the interpretations of deformation mechanisms based on observed microstructures and mechanical data and improve corrections to build a better data set for extrapolations.
For coarse-grained experiments of Type III at 650 °C, a stress exponent of was calculated. This differs from the previously observed and consistently reported value of n=1.4 to 1.47. The discrepancy in the calculated stress exponent is attributed to the microstructural variations and the presence of bimodal grain size distributions, as detailed in Part 1, Nevskaya et al. (2025). Consequently, this stress exponent is not incorporated into the flow law. The influence of grain sizes on the observed stresses and strain rates is elaborated upon in Sect. 4.3.
3.3 Grain size dependence (grain size exponent m)
As previously described, the Type I experiments show a grain size reduction and strain localization evolution (Fig. 5, Sect. 3.1), which were used to calculate a grain size exponent m (Fig. 6). At peak stress, the shear zone width and corresponding grain sizes are well defined (Fig. 5a). These grain sizes and strain rates also correlate well with the grain sizes and strain rates measured in the Type III fine-grained experiments. Subsequently, strain localization occurs accompanied by weakening towards a more steady-state stress. In the microstructures, we differentiate two types of shear zones gradually evolving and deforming at different strain rates: (1) a 2 µm wide zone with grain sizes of 50 nm (Fig. 5b) and (2) a 200 nm wide zone with grain sizes of 13 nm (Fig. 5c). It is not clear whether both zones are active at the steady-state stress or if only the second, very localized zone is active (see discussion in Part 1, Nevskaya et al., 2025). Hence, we evaluate the range of the grain size exponent based on these two end-members. The resulting exponent lies between m=0.99 and 2.33, which is a large range indicating a huge uncertainty (see Fig. 6). This uncertainty is not surprising given the crude data set due to natural sample inhomogeneities. In the following, we assume an average m=1.66. Still, it is to be noted that the values and range are lower than the m=3 predicted for grain boundary diffusion-controlled GSS creep.
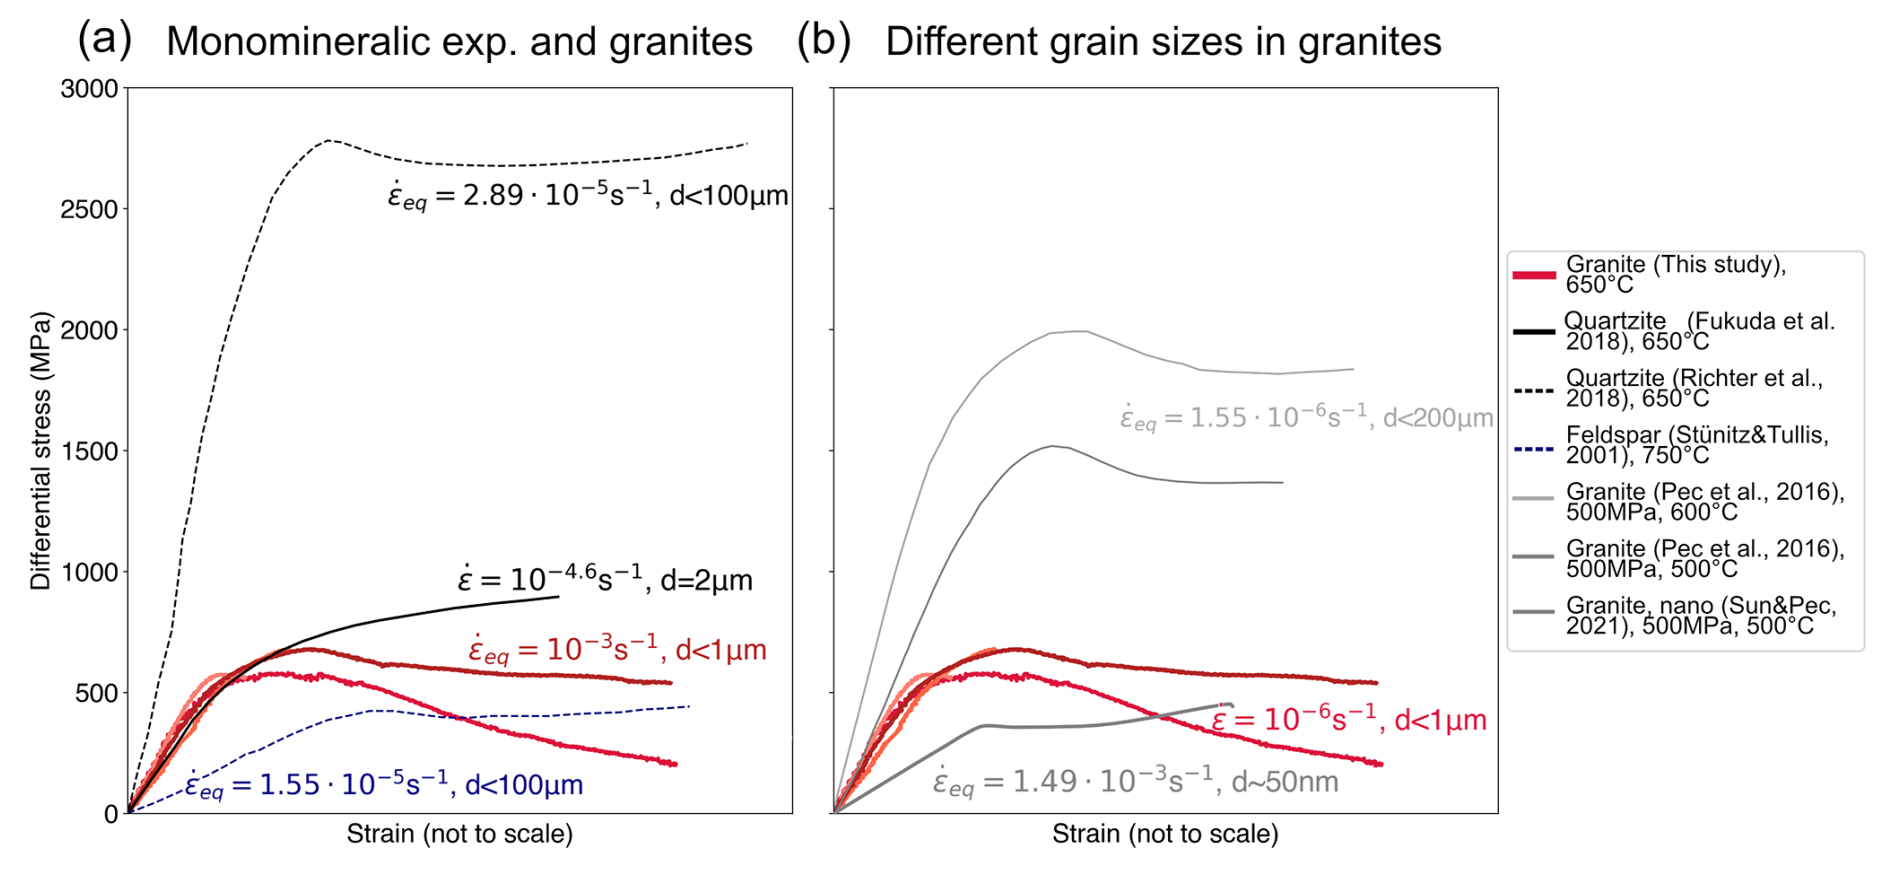
Figure 7Direct comparison of our experiments with different materials at similar experimental conditions. Since pure shear and simple shear experiments are compared and our experiments reach much higher γ values, the x axis is not to scale, and we compare just the differential stresses among the different studies. The corresponding grain sizes and strain rates are noted next to the stress–strain curves. (a) Comparison with monomineralic quartz and feldspar, where our fine-grained granite experiments are much weaker than coarse quartz, while feldspar at higher temperatures is comparably weak. (b) Comparison of different granite experiments with different grain sizes highlighting the grain size effect on the strength.
3.4 Temperature dependence (activation energy Q)
In order to approximate a flow law (Eq. 4), a temperature-dependent activation energy also needs to be calculated. We have only very limited data that are insufficient to directly calculate the slopes of the Q values from versus log10(differential stress) diagrams. Therefore, we use the interpolated lines from the n-value calculations for fine-grained samples at 650 and 725 °C at an equivalent strain rate of 10−3 s−1 (see Fig. 6a, c). These are the most reliable data of our data set, even though the temperature difference is rather small (Fig. 6a). The fit we use connects only two data points, so it can only be considered a rough and preliminary estimate. However, as each point used for calculating Q at each is based on calculations from regression through several experiments, the two data points contain more convincing data than just two points from two directly compared experiments would have. Taking into account the large error on the value, uncertainties regarding the temperature (as for example in Tullis and Yund, 1977) are negligible.
The resulting Q∼167 kJ mol−1 is not consistent with previous experimental results of Q=16 kJ mol−1 (Sun and Pec, 2021) for nanocrystalline granitoid material or experiments on quartz (Fukuda et al., 2018; Ghosh et al., 2022, 2023, 2024) but lies more in the range of activation energies for feldspar diffusion creep Q=170 kJ mol−1 (Rybacki and Dresen, 2000).
3.5 The rest (pre-exponential term A)
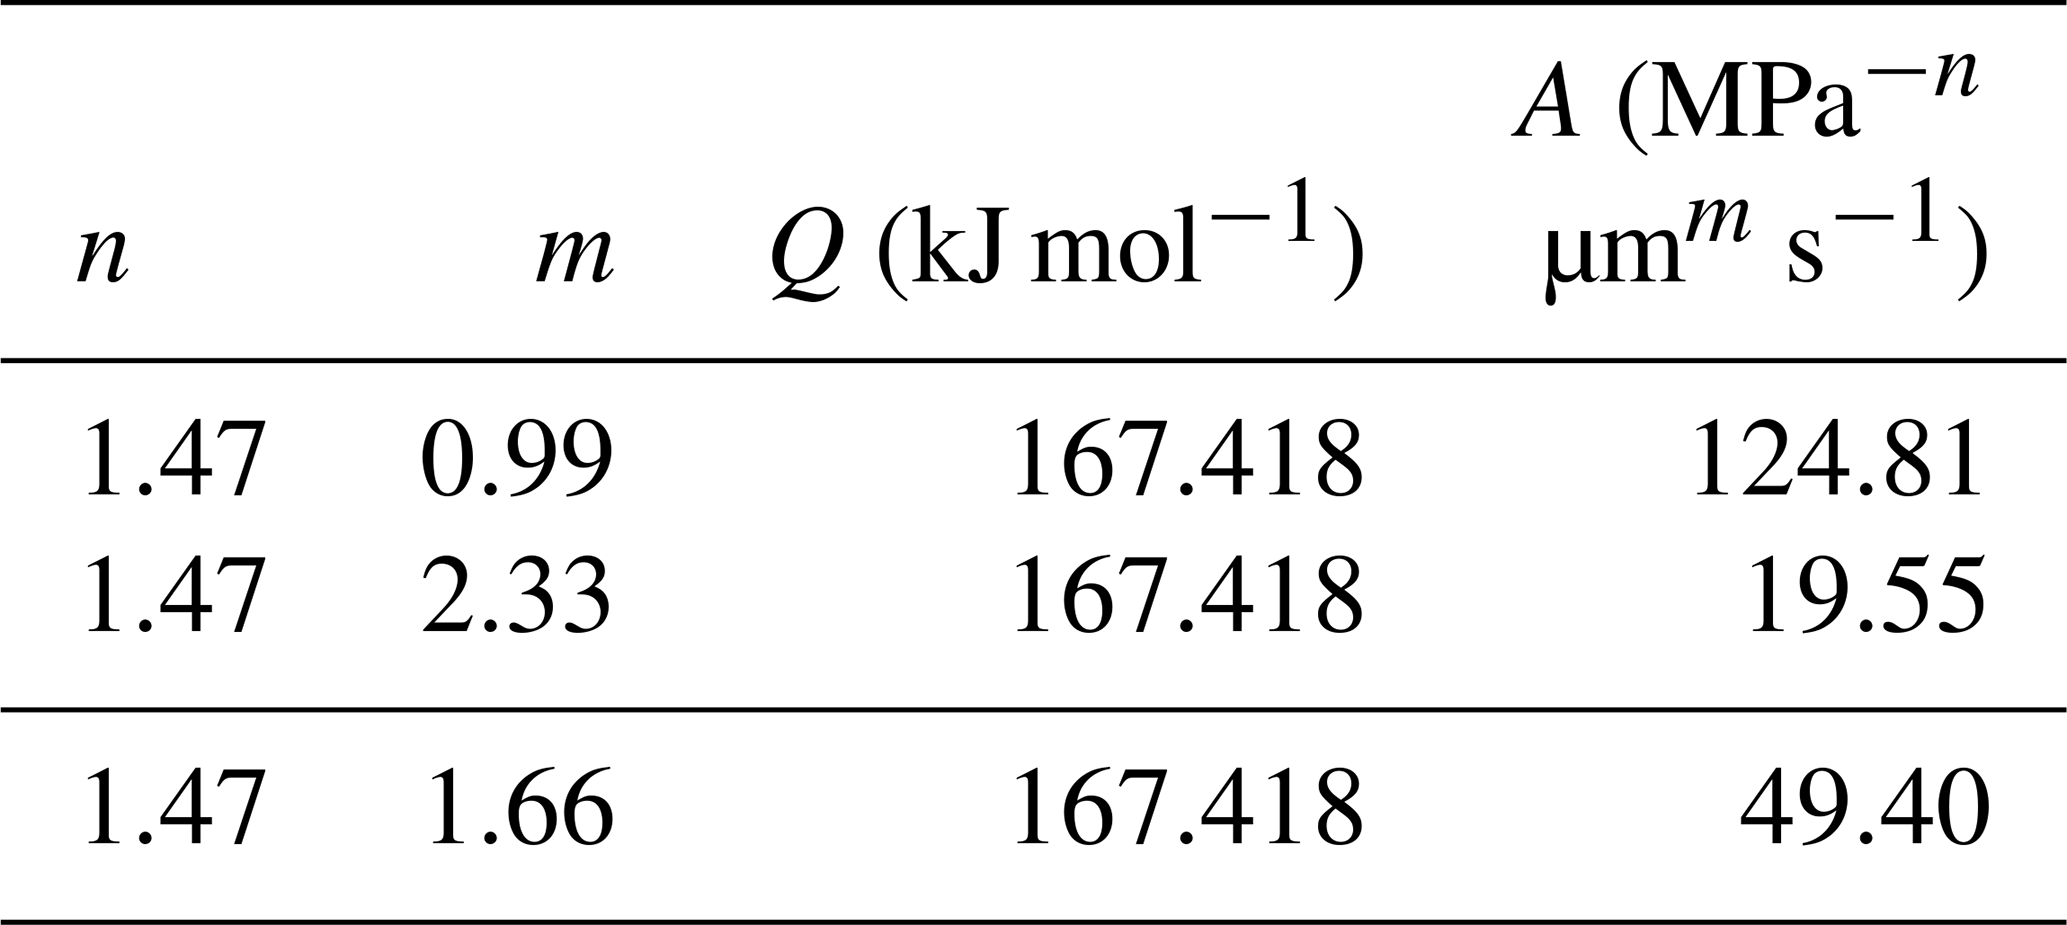
The A value is calculated from solving Eq. (4) for A and averaging over all our input experiments. For such a procedure, the flow law can be obtained for the experimental data set (see verification in Sect. S5, Fig. S4). The largest uncertainties lie in the m and Q values, which result in different A values of Am0.99=124.81 MPa−n µmm s−1 and Am2.33=19.55 MPa−n µmm s−1 for the given Q value of 167 kJ mol−1 (see Table 2). Thus, we have to consider an uncertainty in A of at least 1 order of magnitude.
We performed experiments on fine-grained granitic ultramylonites in a temperature range of 650–725 °C and strain rates –10−3 s−1 in three different experimental setups and with varying grain sizes (see Table 2). We obtained stress exponents (n≈1.5) and grain size exponents (m=0.99 to 2.33) indicating grain-size-sensitive deformation mechanisms in our experimental range and fitted Q and A values to obtain a first-order guess of flow law parameters for granitoid mylonites (Eq. 3). The purpose of this approach is to compare our results with other studies and try to extrapolate the experimental observations to natural tectonic rates and settings.
We have shown that granitic fine-grained rocks deform through GSS creep at experimental conditions of relatively low temperature (650 °C) and fast strain rates ( of up to 10−3 s−1).
4.1 Comparison with literature and extrapolation
Conventionally, quartz is assumed to be the weakest mechanical phase in the middle crust. Therefore, many numerical studies on the rheology of the Earth's crust use quartz flow laws as a first-order approximation (Afonso and Ranalli, 2004; Burov and Watts, 2006; Fossen, 2016; Ranalli and Murphy, 1987; Schmalholz and Duretz, 2015). However, direct comparison between our experiments and previous experiments shows that, at the chosen experimental T and conditions, monomineralic quartz is considerably stronger than samples of polymineralic granitoid or monomineralic feldspar compositions, if flow law parameters are calculated for our experimental conditions (Fig. 7).
For example, the presented quartz/novaculite experiments are all stronger than our fine-grained granitoids, even at µm grain sizes (Fig. 7). In all of these quartz experiments, a brittle/frictional component is observed (because of the imposed strain rates at low temperatures). In addition, deformation by GSI creep is inferred. Both aspects explain the strong behavior of the quartz samples tested. (Wet) quartzite is deformed in a partially frictional manner at experimental temperatures below 700 °C at experimental strain rates of to 10−6 s−1 (Richter et al., 2018). At >800 °C, fine-grained quartzite is fully viscous at strain rates of to 10−6 s−1 and deforms by a combination of dislocation glide and recovery by dissolution–precipitation processes including grain boundary sliding processes (Fukuda et al., 2018; Ghosh et al., 2023, 2024).
Table 2Calculated flow law parameters from our experiments. The largest uncertainty comes from the grain size exponent m, also leading to different A parameters. We show a minimum, maximum, and average m value.
In contrast, the deformation mechanism in our polymineralic granitoid samples at considerably lower temperatures of 650 °C is completely viscous (see Part 1, Nevskaya et al., 2025), and the active GSS creep mechanisms render our samples considerably weaker than quartzites (Fig. 7). Furthermore, the grain size sensitivity of polymineralic rocks is highlighted by comparing experimental studies of granites with different grain sizes to our ultramylonites (Fig. 7; Pec et al., 2016; Sun and Pec, 2021). It is to be noted that our experiments are faster than many other experimental studies, underlining the strength difference between studies and the strong relationship of grain size and strain rate for strength.
There are not many studies performed at lower temperatures (<750 °C) but high confining pressures (>1 GPa) on quartz/quartzite or feldspars because, below these temperatures, at experimental strain rates, brittle behavior was observed (Pec et al., 2016; Richter et al., 2018). Hence, the fact that our deformed polymineralic granitoid samples allow dominantly viscous deformation at such low temperatures indicates that their mechanically weak character originates from the very small grain sizes obtained during early stages in the experiment. For any direct comparison with the literature in terms of mechanical data, it is therefore important to keep in mind the different experimental setups, corrections applied on recorded data, and the resulting grain sizes and strain rates in experiments.
To account for the experimental differences, we compare experimental studies in more detail by extrapolating already existing flow laws (see Table 3) to conditions of our experiments (see Fig. 8). There are no studies showing GSS creep at experimental strain rates and “low” temperatures of 650 °C in quartz at differential stresses <1000 MPa. The GSS and GSI quartz flow laws of Rutter and Brodie (2004a, b) are widely used, but their data overestimate crustal strength and do not show viscous deformation at temperatures of 300 °C, where it is observed in nature (e.g., as shown by Ghosh et al., 2022). Therefore, we focus our comparisons with quartz (Figs. 8, 9) on the most commonly used dislocation creep flow law of Hirth et al. (2001) and the weakest quartz flow law to date, which also includes a grain size sensitivity (Fukuda et al., 2018) and a GSS flow law of feldspar in Figs. 8, 9.
Table 3Flow law parameters of studies we used to compare rheological behavior. n= stress exponent; grain size exponent; r= fugacity exponent (for water) (see Eq. 4).
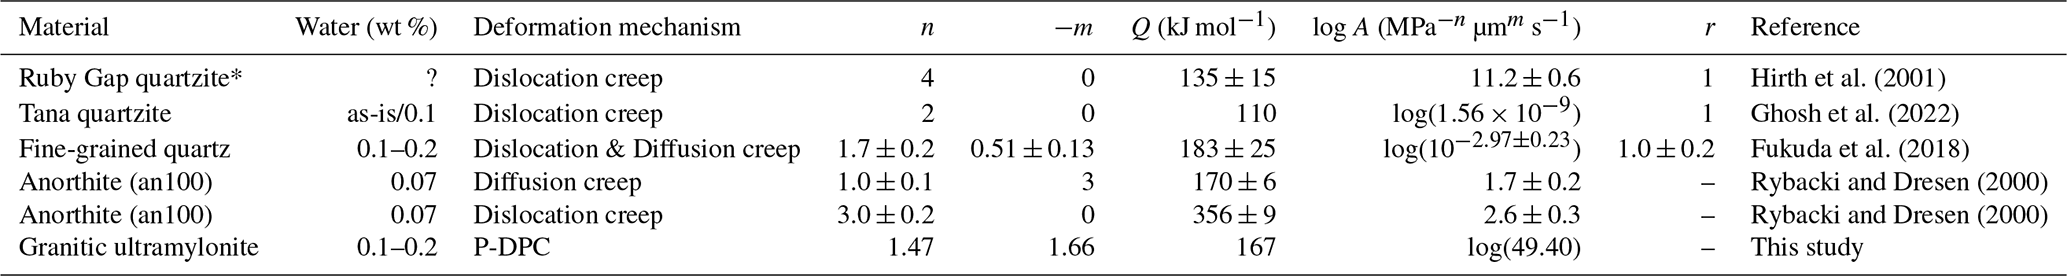
∗ Comparison and fit of different flow laws to match observed microstructures in the Ruby Gap quartzite. Based on flow laws of Gleason and Tullis (1995) and Paterson and Luan (1990).
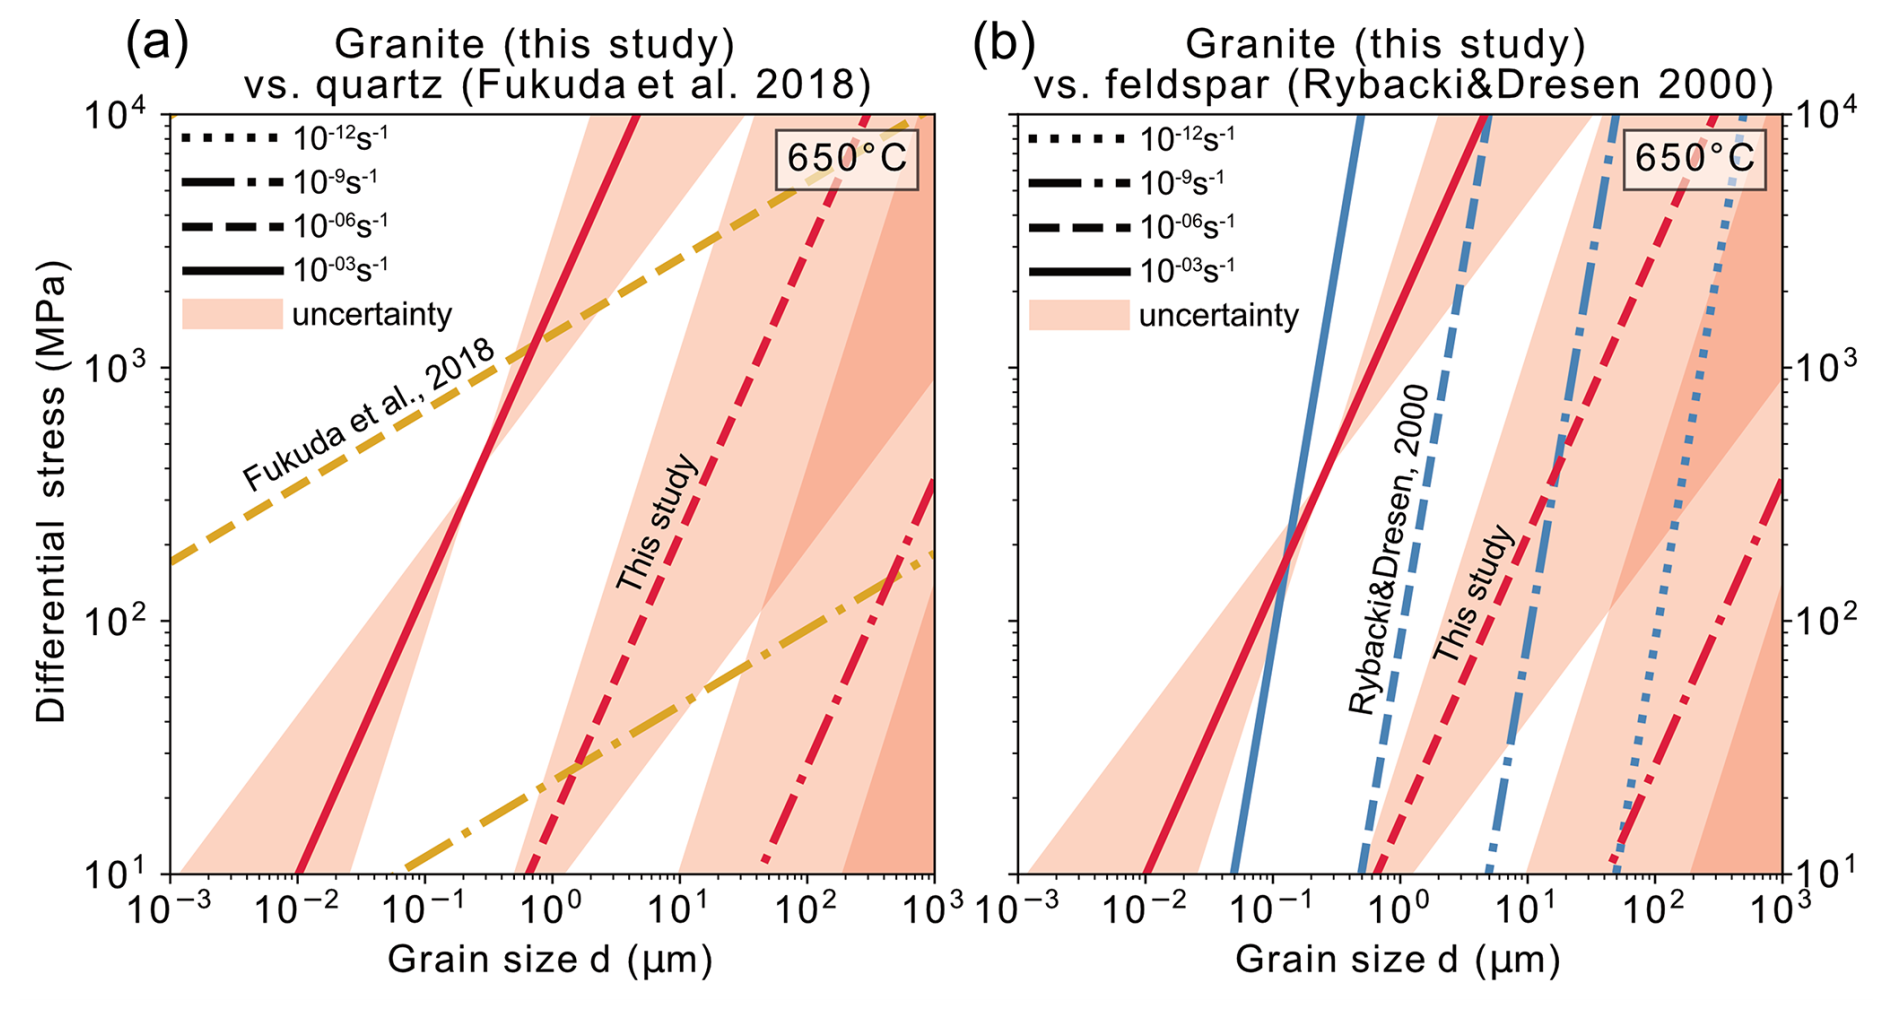
Figure 8Comparison of quartz (a) and feldspar (b) flow laws with our experiments at 650 °C with variable strain rates. It is to be noted that the flow law of Fukuda et al. (2018) (a) has a much lower grain size sensitivity, but there are intersection points where, at a larger grain size, the same grain size in Fukuda et al. (2018) would be weaker than in this study. Still, this study is mostly weaker than Fukuda et al. (2018) at fine grain sizes and at the same strain rates (a). The Rybacki and Dresen (2000) feldspar diffusion creep and the granitoid of this study, however, are very similar (b). The granitoid of this study appears slightly weaker at the same grain sizes and strain rates, but this difference may lie within the uncertainty of the flow law calculations. For more discussion, see the text.
In GSI quartz flow laws, an additional fugacity term exists, with r being the fugacity exponent, which is also implemented in the plots below (see Table 3). The flow law from Eq. (4) then changes to , and, if there is no grain size sensitivity, m=0; therefore . Note that it has been shown by Ghosh et al. (2024) that fine-grained novaculite is weaker than coarse-grained quartzite, thereby proving that, even though not directly implemented in the same form of flow law, a grain size sensitivity exists.
For our fine-grained experiments, we use the best-constrained n=1.47. This value is consistent with neither classical n=1 for GSS creep nor n=3 for GSI creep (Coble, 1963; Herring, 1950; Nabarro, 1948; Rutter and Brodie, 2004a; Rybacki and Dresen, 2000). However, similar stress–strain rate sensitivities have been observed in microcrystalline quartz/novaculite (Fukuda et al., 2018; Ghosh et al., 2022, 2023, 2024; Richter et al., 2018) or nanocrystalline granites (Sun and Pec, 2021). Our grain size exponent has a wide range of m=0.99 to 2.33. The smallest value indicates a linear grain size sensitivity, which is not expected for GSS creep (Rutter and Brodie, 2004a; Rybacki and Dresen, 2000), but similar values have been obtained by Fukuda et al. (2018) and Richter et al. (2018). In order to use an intermediate value of our m-value range, we use m=1.66 and the corresponding A value (see Table 2 for our extrapolations in Figs. 8–10).
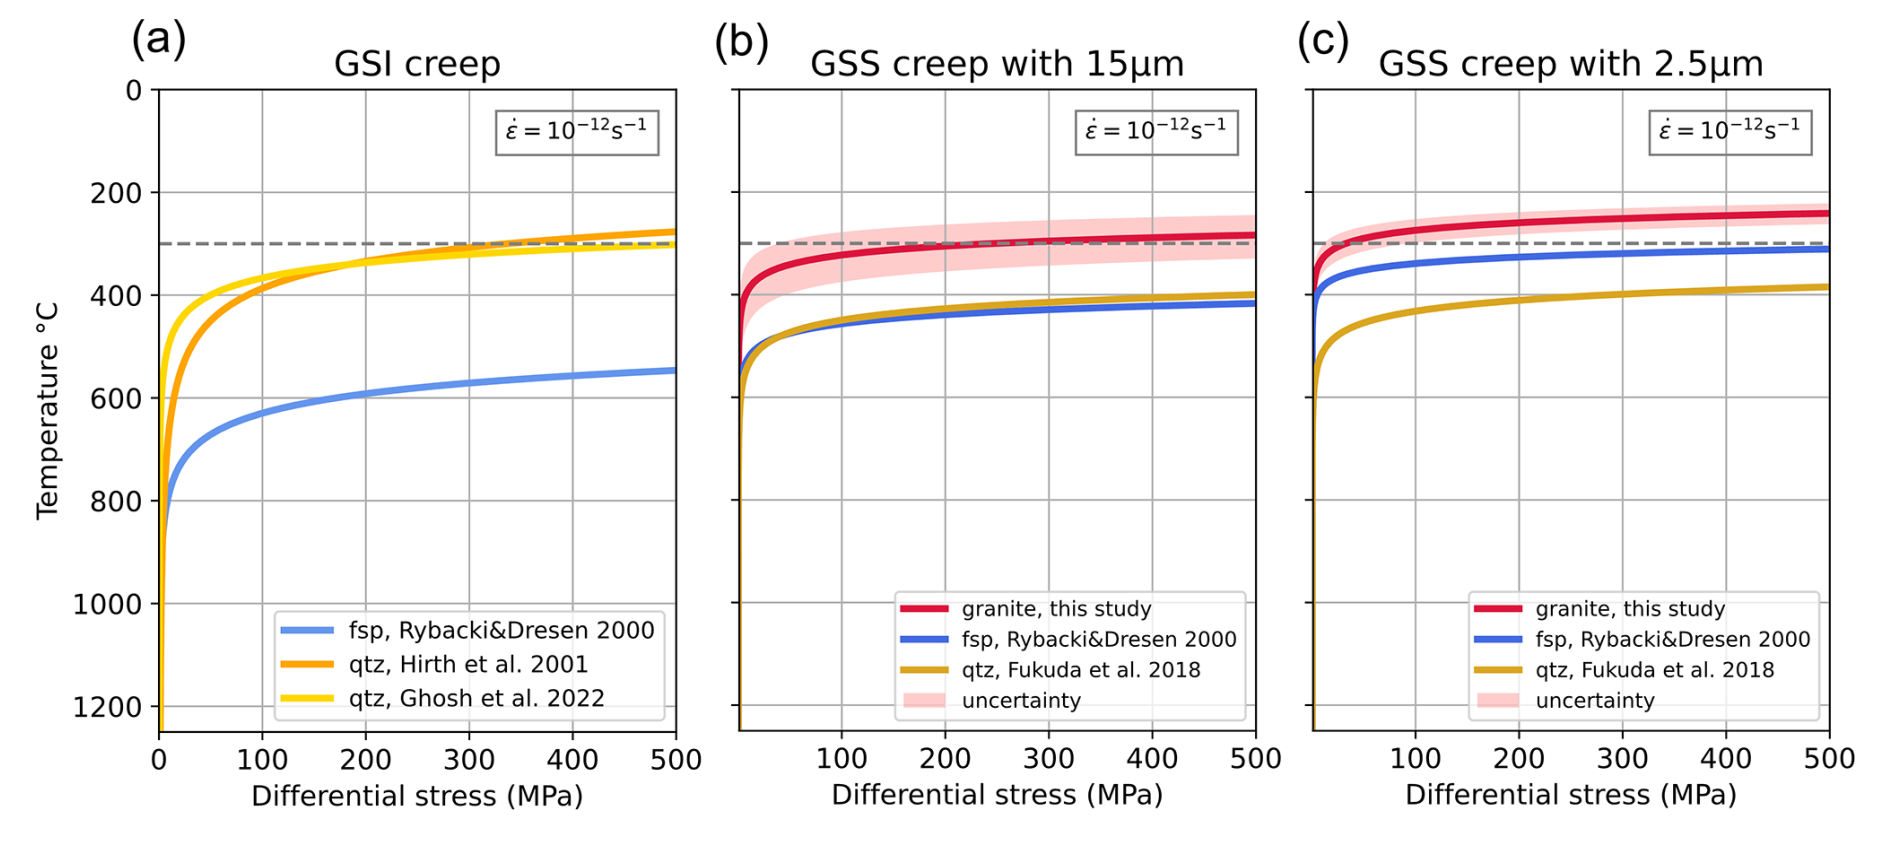
Figure 9Comparison of deformation mechanisms of qtz, fsp, and granite at common viscous strain rates of 10−12 s−1. Panel (a) shows GSI creep, where quartz is the weakest rheology, and panels (b) and (c) show GSS creep with 15 and 2.5 µm, where fsp and granite become weaker than quartz GSS with 15 µm and even weaker than qtz GSI creep at 2.5 µm. The 300 °C line across all plots points at the observed onset of GSS creep in nature.
Extrapolation from quartz flow laws to 650 °C (Fig. 8) highlights once more that the deformation through GSS creep occurs in quartz at strain rates that are orders of magnitude slower than observed in our granitoid samples. GSS creep in feldspars (Rybacki and Dresen, 2000), however, appears to occur at similar conditions to our granitoid fine-grained samples at the given temperatures.
When extrapolated to nature, these temperature and pressure conditions (650–725 °C, ∼1 GPa) correspond to amphibolite facies metamorphic conditions. Amphibolite conditions have been reported in many tectonic settings (e.g. Ceccato et al., 2022; Goncalves et al., 2016; Imon et al., 2002; Pennacchioni and Mancktelow, 2007). We can confirm that many field observations compare well with those of our microstructures and observed deformation mechanisms (see Part 1, Nevskaya et al., 2025). Hence, we can apply the implications from the mechanical data to constrain stresses and strain rates of fine-grained, polymineralic viscous shear zones forming in amphibolite conditions, particularly for fast-deformation conditions such as those carried out in our experiments.
We can confirm through the mechanical data that shear zones in polymineralic rocks at these conditions will localize in precursor structures that have reduced the grain size initially (e.g., Fitz Gerald and Stünitz, 1993). Granitoid rocks deform viscously in the lower to middle crust; after an uplift, brittle overprint at the surface might occur and vice versa, and brittle fractures can serve as precursors for viscous deformation. This cyclic deformational behavior related to burial and uplift of the crust may be common, leading to mesoscopic inhomogeneities in the rock that can serve as weak zones to localize strain (Fitz Gerald et al., 2006; Mancktelow and Pennacchioni, 2005; Pennacchioni and Mancktelow, 2007). It has been shown that, even in a freshly formed granite not undergoing any previous deformation cycle, there are microscopic local inhomogeneities/precursors that can localize strain and weaken the rock (Pennacchioni and Mancktelow, 2007). The operating process that causes the initial weakening is the micro-scale comminution of grains, which is most efficient in feldspars (Fitz Gerald and Stünitz, 1993; Keulen et al., 2007; Tullis and Yund, 1985).
Although, in our experiments, a precursor fracture (Type I) or existing shear zone (Type III) is necessary to localize the strain, we can infer that a mylonite, such as our experimental starting material inside a coarse host rock, may be sufficient to activate the same processes we observe in the experiments and thereby localize strain within. A key to localizing strain is therefore the rheological contrast between host rock and shear zone. Overall, the grain size reduction is far less efficient in Type II samples; therefore the GSS deformation mechanisms initiate less efficiently. This information is important for understanding the evolution of natural shear zones and the applicability of our experiments.
Once the grain size is reduced, polymineralic fine-grained zones will deform through GSS creep and, as a result, will be weaker than quartz and the surrounding coarse-grained rocks. One likely micromechanical mechanism of the GSS creep is dissolution–precipitation creep (DPC). The processes of DPC in feldspars in granitoid systems are already reported from nature (e.g., Menegon et al., 2008). Furthermore, we infer that, at very fine grain sizes, such polymineralic shear zones can deform viscously by very fast strain rates (up to 10−2 s−1 at 650 °C, as in our experiments). The combination of weak zones localizing the strain and the very fast deformation rates explains how the lower to middle granitoid crust (∼10 km depth) can be deforming in very narrow localized shear zones rather than distributed homogeneously (e.g., Wehrens et al., 2016). By current geophysical monitoring devices, detection of strain rates at sufficient spatial resolution at depths of amphibolite conditions is not possible. However, the occurrence of slow slip events and seismicity at these depths may indicate that our new mechanical data might be highly relevant for such conditions and potentially even contribute to an improved parameterization of the seismic cycle.
Our experimental samples may not have reached steady-state microstructures yet, especially as observed in Type II and Type III coarse-grained samples. If grain comminution continues, the shear zone is expected to become weaker with progressive strain (increasing the strain rate at constant load). This progression might lead to the acceleration of slip movement of shear zones at mid-crustal conditions at comparable P–T and strain rates to our experiments and might upscale to shallower and colder levels, representing the brittle–viscous transition. At the tips of the shear zones, stress concentrations will develop, causing more grain comminution by potentially brittle processes (Pec et al., 2016) and leading to seismic rupture.
Furthermore, we extrapolate the flow laws to natural strain rates of 10−12 s−1 and investigate the flow strengths of various deformation mechanisms with temperature as a proxy of depth (Fig. 9). For fugacity calculations in GSI creep (Fig. 9a) (implementing code from Tony Withers Fugacity Calculator, https://www.uwo.ca/earth/people/faculty/withers.html, last access: July 2024), we assume a lithostatic pressure increase (density of 2.7 g cm−3) together with a temperature gradient of 25 °C km−1.
We extrapolate GSS creep to grain sizes of 15 µm (Fig. 9b), just as observed in our starting material and other common fault rocks/ultramylonites, and we also extrapolate GSS creep to an even finer grain size of 2.5 µm (Fig. 9c), as can be observed in other ultramylonitic shear zones (Hiraga et al., 1999; Kerrich et al., 1980) or in shear zones with precursor pseudotachylites (Menegon et al., 2017) or cataclasites (Takagi et al., 2000). Furthermore, it cannot be excluded that deformation in nature occurs at finer grain sizes than preserved today, due to post-deformational static recrystallization or grain coarsening (Evans et al., 2001; Heilbronner and Tullis, 2002). We assume strain rates and differential stresses as reported from natural shortening rates/shear zones (10−12 s−1, 300 MPa) for extrapolations. A key observation is that, while quartz GSI creep is active at 300 °C (Fig. 9a), feldspar and granitoid GSS creep with a significantly small grain size becomes active as well and even weaker than the quartz (Fig. 9b, c).
Still, at larger grain sizes than 15 µm, especially coarse, undeformed granites with grain sizes of >1 mm, will be stronger than quartz. We therefore investigate the transition from quartz GSI to feldspar/granitoid GSS creep in a conceptual, two-phase deformation mechanism map (Fig. 10). Usually, in these grain size vs. stress maps, different deformation regimes for one material are plotted (e.g., as in Rybacki and Dresen, 2004). We assume that, in a granitic rock, taken as the deforming material, different deformation regimes that are dependent on the grain size will be active and will also switch the dominant mechanisms between minerals.
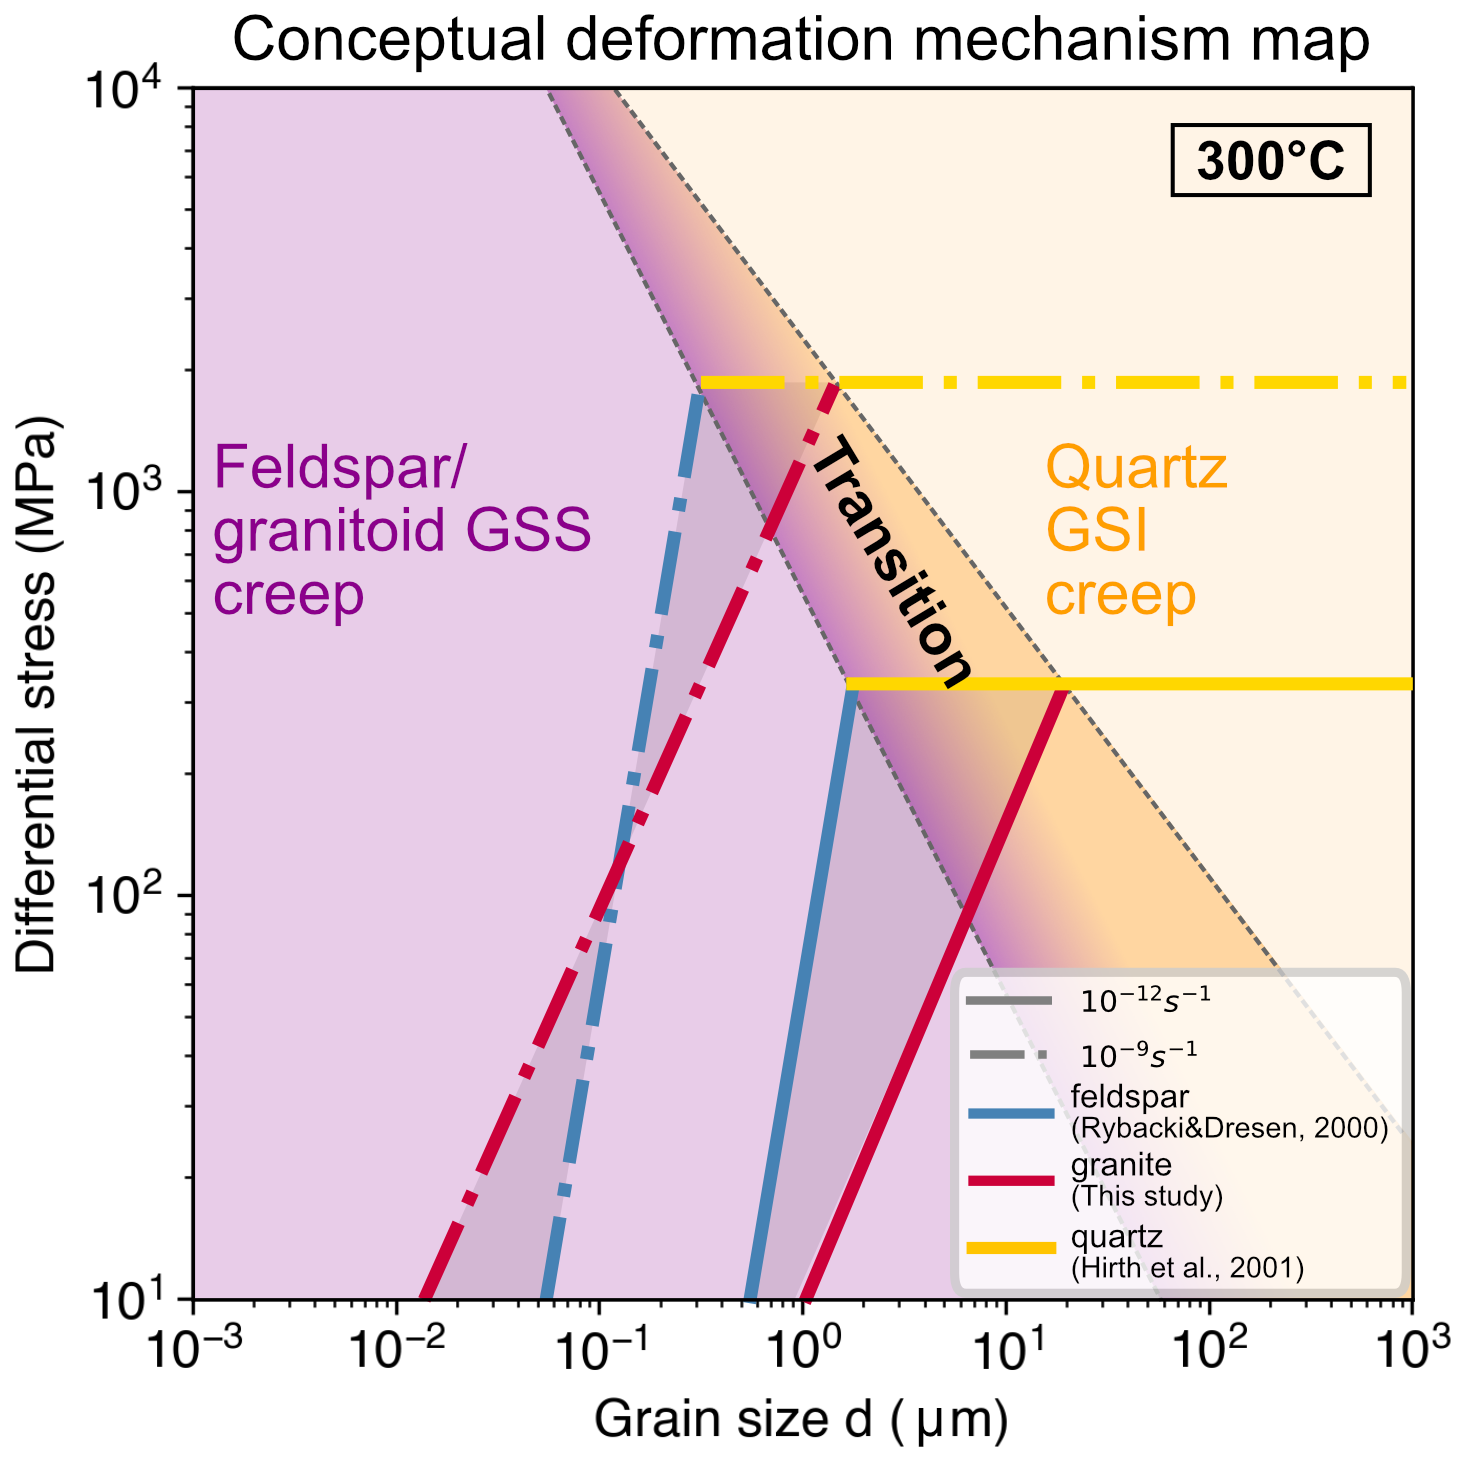
Figure 10Conceptual model for deformation in granitoid rocks. We infer that, in granitoid rocks, not only the deformation mechanism but also the deforming material will change. At strain rates of 10−12 s−1, the deformation will be dominated by qtz GSI creep in grain sizes above 10 µm and transition into GSS creep in the polymineralic mixture of fsp and bt (DPC).
Based on this concept (Fig. 10), we propose two different paths of shear zone formation and flow strength in polymineralic rocks: (1) With large starting grain sizes, quartz GSI creep is the rheology dominating mechanism. GSI creep will result in grain size reduction with continuous deformation. The fine-grained polymineralic mixture will reach the transition grain size (e.g., 10 µm at strain rates 10−12 s−1) and move into the GSS creep regime, where dissolution–precipitation creep will be active and lead to very weak flow stresses. The polymineralic mixture will lead to inhibited grain growth through pinning. (2) A shear zone, which already has grain sizes that are in the grain-size-sensitive field in the diagram (Fig. 10), will directly deform through GSS (dissolution–precipitation) creep. Larger grains in this mixture might still deform through GSI (e.g., dislocation creep/glide), but, also there, grain size reduction combined with phase mixing will finally lead to a fine-grained, homogeneously deforming weak shear zone. The microstructural evolution is described in more detail in Part 1 (Nevskaya et al., 2025).
Most evidence in nature is found for concept (2), e.g., as in Goncalves et al. (2016), Imon et al. (2002), Kilian et al. (2011), Menegon et al. (2017), and Stokes et al. (2012). However, in our Type II experiments, we already observe that the grain size reduction and phase mixing (as described in Part 1, Nevskaya et al., 2025) lead to substantial weakening in the mylonite (see Fig. 4). As in Tullis and Yund (1992, 1985), a high content of feldspar is expected to contribute to weakening. Additionally, reactions of feldspars are forming stable minerals in the conditions of deformation (Fitz Gerald and Stünitz, 1993; Mansard et al., 2020a, b; Marti et al., 2017, 2018; Stünitz and Fitz Gerald, 1993).
If only the reaction kinetics are the driving forces for the low stresses and efficient grain size reduction, an important question remains as to whether our experimental observations and flow law parameters could be transferred to shallower depths and lower temperatures than the experimental conditions. Here we assume that, at almost all P–T conditions, whether lower or higher than the peak metamorphic conditions of the rock, phases such as feldspars or biotites will be in a disequilibrium. This chemical disequilibrium will enhance the efficiency of the pressure solution (e.g., Stünitz et al., 2020). Hence, the extrapolation of the observed microstructures and interpretation is possible beyond greenschist facies and experimental conditions.
The consequences of the calculated flow law are very similar to those of the GSS (diffusion) creep of wet anorthite in Rybacki and Dresen (2000), even though the individual flow law parameters, other than Q, differ (see Table 3, Fig. 8). This leads to the impression that feldspar as the dominant phase in our samples might be the material defining the rheology. There have been studies implying that reactions in at least two types of feldspars would enhance reactivity in rocks and thereby weaken the rock through activation of GSS creep (Fitz Gerald and Stünitz, 1993; Mansard et al., 2020a, b; Marti et al., 2017, 2018; Stünitz and Fitz Gerald, 1993; Stünitz and Tullis, 2001; Tullis et al., 1990). This means that, if feldspar is dominating the composition in the rock, at a given grain size, feldspars would become the weakest phases and define the rheology. We cannot exclude this important contribution of the feldspar minerals in the rheology of our samples.
However, based on the microstructural observations in our samples (see Part 1, Nevskaya et al., 2025), we still infer that, although the feldspar flow law appears to be a good approximation for the rheology in polymineralic fine-grained granitoids, a feldspar GSS creep flow law would be an oversimplification. The polymineralic mixture allows the (feldspar) grain size to remain small and active at or even below the boundary between GSI and GSS creep through phase mixing, chemical driving forces, and pinning. The microstructures indicate that the deformation through reactions is weakening the rock even further, (1) allowing the activation of pinning-assisted dissolution–precipitation creep (DPC) (Part 1, Nevskaya et al., 2025) and (2) possibly enhancing the deformation. Therefore, the presented flow law parameters might overestimate the strength in granitoid (fault) rocks.
The uncertainty of parameters estimated in this study is high, due to a limited number of experiments at different steady-state flow stresses, different corrections applied between each experiment, and inhomogeneities in the natural starting material. However, the complexity of observations from our experiments is important, as monomineralic microstructures are different to polymineralic microstructures. This is why further experiments with complex systems such as these are necessary to understand the rheology of polymineralic mylonites. It is important to investigate the influence of water content on the pinning-assisted DPC processes. Furthermore, the influence of the volumetric proportion of feldspars and biotite versus quartz on the dominant deformation mechanism is still not understood and could be modified in future experiments.
4.2 Pure shear samples – Type II experiments and flow law
For the flow law calculations, we did not use any of the Type II experiments. However, the minimum strain rate and minimum stress of experiment 670NN are plotted in the same stress–strain rate diagram as the experiments used for the calculations above (Fig. 6). Although it does not appear to fit with our other experimental data sets, it is to be considered that the grain sizes in this experiment have a large range and that local strain rates (of material with different sizes) may be orders of magnitude faster, if we assume only phase boundaries deform (by grain boundary sliding) (see deformation mechanisms in Part 1, Nevskaya et al., 2025). The arrow also indicates that weakening is still continuing (see mechanical data Fig. 4), assuming that the grain size reduction in these experiments is still ongoing. In this sense, the microstructural and mechanical evolution are in line with the observations made by Type I and III experiments and support those results.
4.3 Bimodal grain size distributions and “bimodal” strain rates
It is to be noted that a change in the n slope from 1.40 or 1.47 (≈1.5) in fine-grained Type III samples to for the Type III coarse-grained sample (Fig. 6) occurs. This change in slope indicates a combination and contribution of different deformation mechanisms and must be explained by the microstructures. Initially, coarse-grained Type III samples (<125 µm) exhibit a complex microstructure with at least bimodal grain size distribution (medians of coarse grains 4.5 µm and finer grains with complex distribution ranging ≈30–800 nm; see Part 1, Nevskaya et al., 2025), foliation development, and strain localization in shear bands. We mapped out the different deformation domains in the sample 675NN (see Fig. 11), where we distinguish five different zones. (1) and (4) are low- to medium-strain features, and (5) shows high-strain zones with extremely reduced grain size, where flow textures are similar to those in Type III fine-grained experiments. The bimodal grain size distribution may indicate two different deformation mechanisms that are active at the same time in the coarse- and fine-grained regions, which is in accordance with the two different n values.
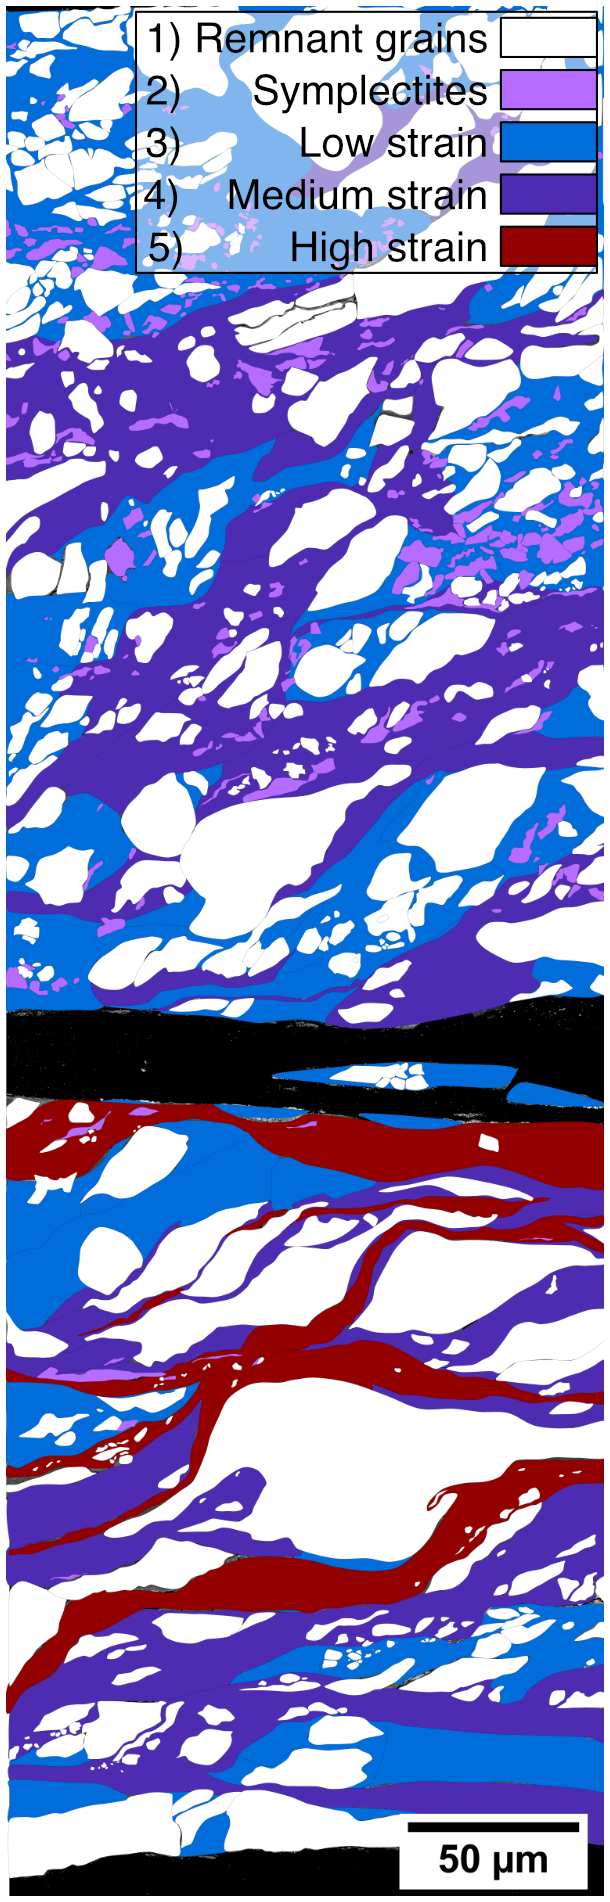
Figure 11Schematic overlay of strain localization in Type III-cg experiment 675NN. An SEM-BSE image of large clast from the bottom surrounded by high-strain grains is displayed in Fig. 3.
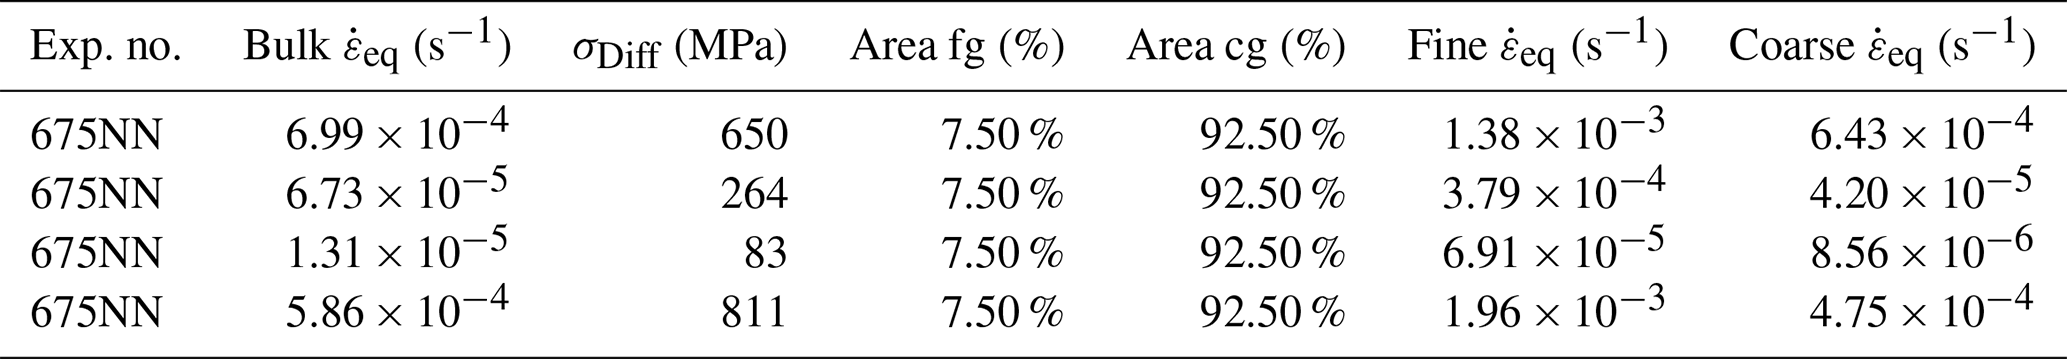
Table 4Calculations of contributions of strain rates in fine- and coarse-grained zones at a constant stress.
Commonly, for determining a bulk rheology, limiting assumptions are made that either the stress or the strain rate is rate-limiting within an aggregate (Voigt, 1910). It has already been shown by Handy (1994) (and references therein) that such an approach is an oversimplification of the complexity of bulk rock deformation, as the stress and strain partitions differently between stronger and weaker phases. Similar composite flow law approaches were made by Herwegh et al. (2005) and Ter Heege et al. (2002), where, at constant stress, the bulk strain rate is a sum of each discrete group weighted by its volume:
and, analogously, at constant strain rate, the bulk stress becomes a composite of all stresses in the system:
A further complication in such a system is the progressive evolution of parameters with increasing strain leading to a change in rheology. This complication is neglected in this approach. To obtain the contribution of each grain size group/deformation mechanism in Type III coarse-grained experiments affecting the strain rate/stress, we use Eq. (5). Under the assumption that a fine-grained zone (5) in sample Type III-cg, as in Fig. 11, can be described by Type III fine-grained experiments and that the stress is at steady state in the sample, we calculate the strain rate of the coarse portion of the coarse grains. In our case, we use the area fraction instead of the volume fraction for the calculations. We use the strain rates of a regression line (see n-value slope in Fig. 6) through Type III fine-grained experiments and Type I experiments at the corresponding stress.
The results of these calculations (Table 4) show that the fine grain sizes that have formed only account for ∼ 10 % of the sample. Therefore, the bulk strength and the coarse grains are still dominating the microstructure of the sample and thus the rheology. However, the microstructures also indicate that the sample is not yet at steady-state conditions and that the grain size reduction (and weakening) will continue at higher strains.
From n calculations on the coarse-grained portion of our samples, we can use the microstructural observations of the different deformation mechanisms that appear to be active at the same time: most importantly, we observe that the coarse-grained portion of the sample 675NN has a stress exponent of n=1.94 ± 0.17 (Fig. 6), supporting the idea that the deformation mechanism in this part of the sample is possibly more affected by GSI creep components (e.g., dislocation glide). This value is also comparable to the flow law parameters of Hansen and Carter (1983) for (coarse) wet Westerly granite.
Overall, in terms of strain localization and bulk rheology, these coarse experiments therefore point to the fact that, in coarser starting materials, it becomes necessary to view a combination of deformation mechanisms. In this sense, these Type III-cg experiments are a good analog for deformation to higher strains of Type II experiments.
To understand the rheology of fine-grained polymineralic (fault) rocks, three different types of experiments on a granitic ultramylonite at T=650–725 °C, Pconf=1.2 GPa, and strain rates of –10−3 s−1 were performed. They were used to approximate parameters in a grain-size-sensitive (GSS) flow law to be able to compare our results to other flow parameters and in order to extrapolate to natural conditions. For fine-grained rocks, we obtained n≈1.5, to −2.3, Q≈170 kJ mol−1, and A≈20(125) MPa−n µmm s−1 with large uncertainties. In coarse samples, a mixed flow law in terms of deformation mechanisms describes the stress sensitivity depending on two grain size ranges well: grains larger than ∼10 µm deform with a grain-size-insensitive (GSI) creep component (n ≈2), while a fine-grained fraction deforms with grain-size-sensitive creep (n≈1.5) simultaneously. The flow law parameters have a large error and are not intended to be applied to granitoid rocks ubiquitously but only to serve as an aid in understanding and comparing the rheology of polymineralic shear zones with other data in the literature.
In connection with microstructural observations from Part 1 (Nevskaya et al., 2025), we confirm field observations that polymineralic fine-grained rocks deform through GSS creep (dissolution, nucleation, and growth, coupled with pinning – DPC). At amphibolite conditions, fine-grained polymineralic rocks are deforming up to 6 orders of magnitude faster than quartz at the same differential stress. While feldspar GSS flow laws seem to result in comparable strengths to fine-grained granitoids in this study, it is implied that pinning and chemical driving forces will aid initiating GSS creep in granitoids, showing that our estimated flow law parameters might still overestimate the flow strength in fine-grained polymineralic rocks.
Further extrapolations to lower temperatures of 300 °C show that grain size is key for weakening granitoid fault rocks by activating GSS creep. Until the rock reaches a fine grain size, quartz with GSI creep is still the rheology-defining weakest phase (e.g., µm, coarse intact granite, at s−1). At a reduced grain size through progressive grain size reduction during deformation, the polymineralic mixture deforms by GSS creep (pinning-assisted DPC), weakening the polymineralic shear zones dramatically. The onset of viscous deformation at lower temperatures implies that the brittle–viscous transition of granitoid shear zones can occur at a shallower crustal level than estimated from quartz. Furthermore, the strain rate in localized shear zones will be underestimated, possibly explaining stress buildups and stress concentrations in the middle crust leading to earthquakes. The latter process would represent a change from viscous deformation to brittle at stress concentrations and may thus present a potential earthquake mechanism that is a runaway process induced by viscous deformation.
All images and data are included in the article and Supplement or referenced in the text.
The supplement related to this article is available online at https://doi.org/10.5194/se-16-1205-2025-supplement.
NN, MH, and AB: conceptualization. NN: writing (original draft). MH and AB: funding acquisition, supervision, and project administration. NN, HS, MH, and AB: methodology and investigation. NN: training at the experimental machines by HS and experimental data acquisition. MO: operator (S)TEM at EM Centre, where OP is the facility manager. MH, AB, HS, and OP: writing (review and editing). NN: writing (final draft).
The contact author has declared that none of the authors has any competing interests.
Publisher's note: Copernicus Publications remains neutral with regard to jurisdictional claims made in the text, published maps, institutional affiliations, or any other geographical representation in this paper. While Copernicus Publications makes every effort to include appropriate place names, the final responsibility lies with the authors. Views expressed in the text are those of the authors and do not necessarily reflect the views of the publisher.
This project has received funding from the European Union's Horizon 2020 research and innovation program, the EXCITE Network (https://excite-network.eu/, last access: 17 October 2025), under grant no. 101005611 for Transnational Access conducted at the EM Centre. We thank the EGU Solid Earth editor Florian Fusseis for handling this article and the reviewers Andreas Kronenberg and Subhajit Ghosh for their thorough reviews and comments which helped us to improve this article. We gratefully acknowledge the Swiss National Science Foundation for funding this research under grant number 192124 to Marco Herwegh.
This research has been supported by the Schweizerischer Nationalfonds zur Förderung der Wissenschaftlichen Forschung (grant no. 192124).
This paper was edited by Florian Fusseis and reviewed by Andreas Kronenberg and Subhajit Ghosh.
Afonso, J. C. and Ranalli, G.: Crustal and mantle strengths in continental lithosphere: is the jelly sandwich model obsolete?, Tectonophysics, 394, 221–232, https://doi.org/10.1016/j.tecto.2004.08.006, 2004.
Arnold, J., Jacoby, W. R., Schmeling, H., and Schott, B.: Continental collision and the dynamic and thermal evolution of the Variscan orogenic crustal root Ð numerical models, Journal of Geodynamics, 31, https://doi.org/10.1016/S0264-3707(00)00023-5, 2001.
Berger, A. and Stünitz, H.: Deformation mechanisms and reaction of hornblende: examples from the Bergell tonalite (Central Alps), Tectonophysics, 257, 149–174, https://doi.org/10.1016/0040-1951(95)00125-5, 1996.
Berger, A., Herwegh, M., Schwarz, J.-O., and Putlitz, B.: Quantitative analysis of crystal/grain sizes and their distributions in 2D and 3D, Journal of Structural Geology, 33, 1751–1763, https://doi.org/10.1016/j.jsg.2011.07.002, 2011.
Brace, W. F. and Kohlstedt, D. L.: Limits on lithospheric stress imposed by laboratory experiments, J. Geophys. Res., 85, 6248–6252, https://doi.org/10.1029/JB085iB11p06248, 1980.
den Brok, B.: An experimental investigation into the effect of water on the flow of quartzite, The effect of water on the flow of quartzite, Geologica Ultraiectina, 95, https://doi.org/10.3929/ethz-a-000684352, 1992.
Bürgmann, R. and Dresen, G.: Rheology of the Lower Crust and Upper Mantle: Evidence from Rock Mechanics, Geodesy, and Field Observations, Annu. Rev. Earth Planet. Sci., 36, 531–567, https://doi.org/10.1146/annurev.earth.36.031207.124326, 2008.
Burov, E. B.: The upper crust is softer than dry quartzite, Tectonophysics, 361, 321–326, https://doi.org/10.1016/S0040-1951(02)00608-X, 2003.
Burov, E. B.: Rheology and strength of the lithosphere, Marine and Petroleum Geology, 28, 1402–1443, https://doi.org/10.1016/j.marpetgeo.2011.05.008, 2011.
Burov, E. B. and Watts, A. B.: The long-term strength of continental lithosphere: “jelly sandwich” or “crème brûlée”?, Gsa Today, 16, 4, https://doi.org/10.1130/1052-5173(2006)016<4:TLTSOC>2.0.CO;2, 2006.
Campbell, L. R., Menegon, L., Fagereng, Å., and Pennacchioni, G.: Earthquake nucleation in the lower crust by local stress amplification, Nat Commun, 11, 1322, https://doi.org/10.1038/s41467-020-15150-x, 2020.
Ceccato, A., Goncalves, P., and Menegon, L.: On the petrology and microstructures of small-scale ductile shear zones in granitoid rocks: An overview, Journal of Structural Geology, 161, 104667, https://doi.org/10.1016/j.jsg.2022.104667, 2022.
Challandes, N., Marquer, D., and Villa, I. M.: P-T-t modelling, fluid circulation, and 39Ar-40Ar and Rb-Sr mica ages in the Aar Massif shear zones (Swiss Alps), Swiss J. Geosci., 101, 269–288, https://doi.org/10.1007/s00015-008-1260-6, 2008.
Coble, R. L.: A Model for Boundary Diffusion Controlled Creep in Polycrystalline Materials, Journal of Applied Physics, 34, 1679–1682, https://doi.org/10.1063/1.1702656, 1963.
Dell'Angelo, L. N. and Tullis, J.: Experimental deformation of partially melted granitic aggregates, J Metamorph Geol, 6, 495–515, https://doi.org/10.1111/j.1525-1314.1988.tb00436.x, 1988.
Evans, B., Renner, J., and Hirth, G.: A few remarks on the kinetics of static grain growth in rocks, Int J Earth Sci, 90, 88–103, https://doi.org/10.1007/s005310000150, 2001.
Fitz Gerald, J. D. and Stünitz, H.: Deformation of granitoids at low metamorphic grade. I: Reactions and grain size reduction, Tectonophysics, 221, 269–297, https://doi.org/10.1016/0040-1951(93)90163-E, 1993.
Fitz Gerald, J. D., Mancktelow, N. S., Pennacchioni, G., and Kunze, K.: Ultrafine-grained quartz mylonites from high-grade shear zones: Evidence for strong dry middle to lower crust, 34, 369–372, https://doi.org/10.1130/G22099.1, 2006.
Fossen, H.: Structural Geology, Cambridge University Press, https://doi.org/10.1017/9781107415096, 2016.
Fukuda, J., Holyoke III, C. W., and Kronenberg, A. K.: Deformation of Fine-Grained Quartz Aggregates by Mixed Diffusion and Dislocation Creep, Journal of Geophysical Research: Solid Earth, 123, 4676–4696, https://doi.org/10.1029/2017JB015133, 2018.
Ghosh, S., Stünitz, H., Raimbourg, H., and Précigout, J.: Quartz rheology constrained from constant-load experiments: Consequences for the strength of the continental crust, Earth and Planetary Science Letters, 597, 117814, https://doi.org/10.1016/j.epsl.2022.117814, 2022.
Ghosh, S., Stünitz, H., Raimbourg, H., and Précigout, J.: Rheology and Deformation Processes of Fine-grained Quartz Aggregate, EGU General Assembly 2023, Vienna, Austria, 24–28 Apr 2023, EGU23-15832, https://doi.org/10.5194/egusphere-egu23-15832, 2023.
Ghosh, S., Stünitz, H., Raimbourg, H., Précigout, J., Di Carlo, I., Heilbronner, R., and Piani, L.: Importance of grain boundary processes for plasticity in the quartz-dominated crust: Implications for flow laws, Earth and Planetary Science Letters, 640, 118767, https://doi.org/10.1016/j.epsl.2024.118767, 2024.
Gleason, G. C. and Tullis, J.: A flow law for dislocation creep of quartz aggregates determined with the molten salt cell, Tectonophysics, 247, 1–23, https://doi.org/10.1016/0040-1951(95)00011-B, 1995.
Gnos, E., Kurz, D. and Eggenberger, U.: Elelectrodynamic disaggregation of geologic material, 4th Swiss Geoscience Meeting, Bern, https://geoscience-meeting.ch/sgm2006/SGM06_abstracts/08_OS_Min_Pet/Gnos_Edwin_Poster.pdf (last access: October 2025), 2006.
Goncalves, P., Oliot, E., Marquer, D., and Connolly, J. A. D.: Role of chemical processes on shear zone formation: an example from the Grimsel metagranodiorite (Aar massif, Central Alps): SHEAR ZONE FORMATION, Journal of Metamorphic Geology, 30, 703–722, https://doi.org/10.1111/j.1525-1314.2012.00991.x, 2012.
Goncalves, P., Poilvet, J.-C., Oliot, E., Trap, P., and Marquer, D.: How does shear zone nucleate? An example from the Suretta nappe (Swiss Eastern Alps), Journal of Structural Geology, 86, 166–180, https://doi.org/10.1016/j.jsg.2016.02.015, 2016.
Gratier, J.-P., Dysthe, D. K., and Renard, F.: The Role of Pressure Solution Creep in the Ductility of the Earth's Upper Crust, in: Advances in Geophysics, Vol. 54, Elsevier, 47–179, https://doi.org/10.1016/B978-0-12-380940-7.00002-0, 2013.
Handy, M. R.: Flow laws for rocks containing two non-linear viscous phases: A phenomenological approach, Journal of Structural Geology, 16, 287–301, https://doi.org/10.1016/0191-8141(94)90035-3, 1994.
Hansen, F. D. and Carter, N. L.: Semibrittle Creep Of Dry And Wet Westerly Granite At 1000 MPa, The 24th U.S. Symposium on Rock Mechanics (USRMS), ARMA-83-0429, http://onepetro.org/armausrms/proceedings-pdf/arma83/all-arma83/arma-83-0429/2033491/arma-83-0429.pdf (last access: 17 October 2025), 1983.
Heilbronner, R. and Keulen, N.: Grain size and grain shape analysis of fault rocks, Tectonophysics, 427, 199–216, https://doi.org/10.1016/j.tecto.2006.05.020, 2006.
Heilbronner, R. and Tullis, J.: The effect of static annealing on microstructures and crystallographic preferred orientations of quartzites experimentally deformed in axial compression and shear, SP, 200, 191–218, https://doi.org/10.1144/GSL.SP.2001.200.01.12, 2002.
Heilbronner, R., Stunitz, H., Précigout, J., and Raimbourg, H.: The solid medium deformation apparatus – reloaded, EGU General Assembly 2020, Online, 4–8 May 2020, EGU2020-9859, https://doi.org/10.5194/egusphere-egu2020-9859, 2020
Herring, C.: Diffusional Viscosity of a Polycrystalline Solid, Journal of Applied Physics, 21, 437–445, https://doi.org/10.1063/1.1699681, 1950.
Herwegh, M., de Bresser, J. H. P., and ter Heege, J. H.: Combining natural microstructures with composite flow laws: an improved approach for the extrapolation of lab data to nature, Journal of Structural Geology, 27, 503–521, https://doi.org/10.1016/j.jsg.2004.10.010, 2005.
Hiraga, T., Nagase, T., and Akizuki, M.: The structure of grain boundaries in granite-origin ultramylonite studied by high-resolution electron microscopy, Physics and Chemistry of Minerals, 26, 617–623, https://doi.org/10.1007/s002690050226, 1999.
Hirth, G. and Tullis, J.: Dislocation creep regimes in quartz aggregates, Journal of Structural Geology, 14, 145–159, https://doi.org/10.1016/0191-8141(92)90053-Y, 1992.
Hirth, G., Teyssier, C., and Dunlap, J. W.: An evaluation of quartzite flow laws based on comparisons between experimentally and naturally deformed rocks, Int J Earth Sci, 90, 77–87, https://doi.org/10.1007/s005310000152, 2001.
Holyoke, C. W. and Kronenberg, A. K.: Accurate differential stress measurement using the molten salt cell and solid salt assemblies in the Griggs apparatus with applications to strength, piezometers and rheology, Tectonophysics, 494, 17–31, https://doi.org/10.1016/j.tecto.2010.08.001, 2010.
Imon, R., Okudaira, T., and Fujimoto, A.: Dissolution and precipitation processes in deformed amphibolites: an example from the ductile shear zone of the Ryoke metamorphic belt, SW Japan, Journal Metamorphic Geology, 20, 297–308, https://doi.org/10.1046/j.1525-1314.2002.00367.x, 2002.
Kerrich, R., Allison, I., Barnett, R. L., Moss, S., and Starkey, J.: Microstructural and chemical transformations accompanying deformation of granite in a shear zone at Miéville, Switzerland; with implications for stress corrosion cracking and superplastic flow, Contr. Mineral. and Petrol., 73, 221–242, https://doi.org/10.1007/BF00381442, 1980.
Keulen, N., Heilbronner, R., Stünitz, H., Boullier, A.-M., and Ito, H.: Grain size distributions of fault rocks: A comparison between experimentally and naturally deformed granitoids, Journal of Structural Geology, 29, 1282–1300, https://doi.org/10.1016/j.jsg.2007.04.003, 2007.
Kilian, R., Heilbronner, R., and Stünitz, H.: Quartz grain size reduction in a granitoid rock and the transition from dislocation to diffusion creep, Journal of Structural Geology, 33, 1265–1284, https://doi.org/10.1016/j.jsg.2011.05.004, 2011.
Kohlstedt, D. L. and Hansen, L. N.: Constitutive Equations, Rheological Behavior, and Viscosity of Rocks, in: Treatise on Geophysics, Elsevier, 441–472, https://doi.org/10.1016/B978-0-444-53802-4.00042-7, 2015.
Kohlstedt, D. L., Evans, B., and Mackwell, S. J.: Strength of the lithosphere: Constraints imposed by laboratory experiments, J. Geophys. Res., 100, 17587–17602, https://doi.org/10.1029/95JB01460, 1995.
Mancktelow, N. S. and Pennacchioni, G.: The control of precursor brittle fracture and fluid–rock interaction on the development of single and paired ductile shear zones, Journal of Structural Geology, 27, 645–661, https://doi.org/10.1016/j.jsg.2004.12.001, 2005.
Mansard, N., Stünitz, H., Raimbourg, H., Précigout, J., Plunder, A., and Nègre, L.: Relationship between microstructures and resistance in mafic assemblages that deform and transform, Solid Earth, 11, 2141–2167, https://doi.org/10.5194/se-11-2141-2020, 2020a.
Mansard, N., Stünitz, H., Raimbourg, H., and Précigout, J.: The role of deformation-reaction interactions to localize strain in polymineralic rocks: Insights from experimentally deformed plagioclase-pyroxene assemblages, Journal of Structural Geology, 134, 104008, https://doi.org/10.1016/j.jsg.2020.104008, 2020b.
Marti, S., Stünitz, H., Heilbronner, R., Plümper, O., and Drury, M.: Experimental investigation of the brittle-viscous transition in mafic rocks – Interplay between fracturing, reaction, and viscous deformation, Journal of Structural Geology, 105, 62–79, https://doi.org/10.1016/j.jsg.2017.10.011, 2017.
Marti, S., Stünitz, H., Heilbronner, R., Plümper, O., and Kilian, R.: Syn-kinematic hydration reactions, grain size reduction, and dissolution–precipitation creep in experimentally deformed plagioclase–pyroxene mixtures, Solid Earth, 9, 985–1009, https://doi.org/10.5194/se-9-985-2018, 2018.
Menegon, L., Pennacchioni, G., and Spiess, R.: Dissolution-precipitation creep of K-feldspar in mid-crustal granite mylonites, Journal of Structural Geology, 30, 565–579, https://doi.org/10.1016/j.jsg.2008.02.001, 2008.
Menegon, L., Pennacchioni, G., Malaspina, N., Harris, K., and Wood, E.: Earthquakes as Precursors of Ductile Shear Zones in the Dry and Strong Lower Crust, Geochem Geophys Geosyst, 18, 4356–4374, https://doi.org/10.1002/2017GC007189, 2017.
Nabarro, F. R. N.: Deformation of Crystals by Motion of Single Ions, Conference on the Strength of Solids (Bristol, U.K.), The Physical Society, London, 75–90, 1948.
Nabarro, F. R. N.: Steady-state diffusional creep, The Philosophical Magazine: A Journal of Theoretical Experimental and Applied Physics, 16, 231–237, https://doi.org/10.1080/14786436708229736, 1967.
Nevskaya, N., Berger, A., Stünitz, H., Zhan, W., Ohl, M., Plümper, O., and Herwegh, M.: Dissolution–precipitation creep in polymineralic granitoid shear zones in experiments – Part 1: Strain localization mechanisms, Solid Earth, 16, 1181–1204, https://doi.org/10.5194/se-16-1181-2025, 2025.
Okazaki, K. and Hirth, G.: Deformation experiment on quartz aggregates with high porosity and high water contents at high pressure and temperature., American Geophysical Union Fall Meeting, 2016, Abstract T21D-2870, 2016.
Okudaira, T., Ogawa, D., and Michibayashi, K.: Grain-size-sensitive deformation of upper greenschist- to lower amphibolite-facies metacherts from a low-P/high-T metamorphic belt, Tectonophysics, 492, 141–149, https://doi.org/10.1016/j.tecto.2010.06.002, 2010.
Paterson, M. and Luan, F.: Quartzite rheology under geological conditions, Geological Society, London, Special Publications, 54, 299–307, https://doi.org/10.1144/GSL.SP.1990.054.01.26, 1990.
Pec, M.: Experimental Investigation on the Rheology of Fault Rocks, PhD thesis, Basel University, 210 pp., https://doi.org/10.5451/unibas-006285679, 2014.
Pec, M., Stünitz, H., and Heilbronner, R.: Semi-brittle deformation of granitoid gouges in shear experiments at elevated pressures and temperatures, Journal of Structural Geology, 38, 200–221, https://doi.org/10.1016/j.jsg.2011.09.001, 2012.
Pec, M., Stünitz, H., Heilbronner, R., and Drury, M.: Semi-brittle flow of granitoid fault rocks in experiments, Journal of Geophysical Research: Solid Earth, 121, 1677–1705, https://doi.org/10.1002/2015JB012513, 2016.
Pennacchioni, G. and Mancktelow, N. S.: Nucleation and initial growth of a shear zone network within compositionally and structurally heterogeneous granitoids under amphibolite facies conditions, Journal of Structural Geology, 29, 1757–1780, https://doi.org/10.1016/j.jsg.2007.06.002, 2007.
Poirier, J.-P.: Creep of Crystals: High-temperature Deformation Processes in Metals, Ceramics, and Minerals, Cambridge University Press, 280 pp., ISBN 9780521278515, 1985.
Raj, R. and Ashby, M. F.: On grain boundary sliding and diffusional creep, Metall Trans, 2, 1113–1127, https://doi.org/10.1007/BF02664244, 1971.
Ranalli, G. and Murphy, D. C.: Rheological stratification of the lithosphere, Tectonophysics, 132, 281–295, https://doi.org/10.1016/0040-1951(87)90348-9, 1987.
Regis, D., Rubatto, D., Darling, J., Cenki-Tok, B., Zucali, M., and Engi, M.: Multiple Metamorphic Stages within an Eclogite-facies Terrane (Sesia Zone, Western Alps) Revealed by Th–U–Pb Petrochronology, Journal of Petrology, 55, 1429–1456, https://doi.org/10.1093/petrology/egu029, 2014.
Richter, B., Stünitz, H., and Heilbronner, R.: The brittle-to-viscous transition in polycrystalline quartz: An experimental study, Journal of Structural Geology, 114, 1–21, https://doi.org/10.1016/j.jsg.2018.06.005, 2018.
Rutter, E. H. and Brodie, K. H.: Experimental grain size-sensitive flow of hot-pressed Brazilian quartz aggregates, Journal of Structural Geology, 26, 2011–2023, https://doi.org/10.1016/j.jsg.2004.04.006, 2004a.
Rutter, E. H. and Brodie, K. H.: Experimental intracrystalline plastic flow in hot-pressed synthetic quartzite prepared from Brazilian quartz crystals, Journal of Structural Geology, 26, 259–270, https://doi.org/10.1016/S0191-8141(03)00096-8, 2004b.
Rybacki, E. and Dresen, G.: Dislocation and diffusion creep of synthetic anorthite aggregates, J. Geophys. Res., 105, 26017–26036, https://doi.org/10.1029/2000JB900223, 2000.
Rybacki, E. and Dresen, G.: Deformation mechanism maps for feldspar rocks, Tectonophysics, 382, 173–187, https://doi.org/10.1016/j.tecto.2004.01.006, 2004.
Rybacki, E., Gottschalk, M., Wirth, R., and Dresen, G.: Influence of water fugacity and activation volume on the flow properties of fine-grained anorthite aggregates, J. Geophys. Res., 111, 2005JB003663, https://doi.org/10.1029/2005JB003663, 2006.
Rybacki, E., Wirth, R., and Dresen, G.: High-strain creep of feldspar rocks: Implications for cavitation and ductile failure in the lower crust, Geophysical Research Letters, 35, 2007GL032478, https://doi.org/10.1029/2007GL032478, 2008.
Schmalholz, S. M. and Duretz, T.: Shear zone and nappe formation by thermal softening, related stress and temperature evolution, and application to the Alps, Journal of Metamorphic Geology, 33, 887–908, https://doi.org/10.1111/jmg.12137, 2015.
Stesky, R. M., Brace, W. F., Riley, D. K., and Robin, P.-Y. F.: Friction in faulted rock at high temperature and pressure, Tectonophysics, 23, 177–203, https://doi.org/10.1016/0040-1951(74)90119-X, 1974.
Stipp, M. and Tullis, J.: The recrystallized grain size piezometer for quartz, Geophysical Research Letters, 30, https://doi.org/10.1029/2003GL018444, 2003.
Stokes, M. R., Wintsch, R. P., and Southworth, C. S.: Deformation of amphibolites via dissolution–precipitation creep in the middle and lower crust, Journal Metamorphic Geology, 30, 723–737, https://doi.org/10.1111/j.1525-1314.2012.00989.x, 2012.
Stünitz, H. and Fitz Gerald, J. D.: Deformation of granitoids at low metamorphic grade. II: Granular flow in albite-rich mylonites, Tectonophysics, 221, 299–324, https://doi.org/10.1016/0040-1951(93)90164-F, 1993.
Stünitz, H. and Tullis, J.: Weakening and strain localization produced by syn-deformational reaction of plagioclase, Int J Earth Sci, 90, 136–148, https://doi.org/10.1007/s005310000148, 2001.
Stünitz, H., Neufeld, K., Heilbronner, R., Finstad, A. K., Konopásek, J., and Mackenzie, J. R.: Transformation weakening: Diffusion creep in eclogites as a result of interaction of mineral reactions and deformation, Journal of Structural Geology, 139, 104129, https://doi.org/10.1016/j.jsg.2020.104129, 2020.
Sun, H. and Pec, M.: Nanometric flow and earthquake instability, Nat Commun, 12, 6779, https://doi.org/10.1038/s41467-021-26996-0, 2021.
Takagi, H., Goto, K., and Shigematsu, N.: Ultramylonite bands derived from cataclasite and pseudotachylyte in granites, northeast Japan, Journal of Structural Geology, 22, 1325–1339, https://doi.org/10.1016/S0191-8141(00)00034-1, 2000.
Tarantola, A., Diamond, L. W., Stünitz, H., Thust, A., and Pec, M.: Modification of fluid inclusions in quartz by deviatoric stress. III: Influence of principal stresses on inclusion density and orientation, Contrib Mineral Petrol, 164, 537–550, https://doi.org/10.1007/s00410-012-0749-1, 2012.
Ter Heege, J. H., De Bresser, J. H. P., and Spiers, C. J.: The influence of dynamic recrystallization on the grain size distribution and rheological behaviour of Carrara marble deformed in axial compression, SP, 200, 331–353, https://doi.org/10.1144/GSL.SP.2001.200.01.19, 2002.
Tullis, J. and Wenk, H.-R.: Effect of muscovite on the strength and lattice preferred orientations of experimentally deformed quartz aggregates, Materials Science and Engineering: A, 175, 209–220, https://doi.org/10.1016/0921-5093(94)91060-X, 1994.
Tullis, J. and Yund, R.: Chapter 4 The Brittle-Ductile Transition in Feldspar Aggregates: An Experimental Study, in: International Geophysics, vol. 51, edited by: Evans, B. and Wong, T., Academic Press, 89–117, https://doi.org/10.1016/S0074-6142(08)62816-8, 1992.
Tullis, J. and Yund, R. A.: Experimental deformation of dry westerly granite, Journal of Geophysical Research (1896–1977), 82, 5705–5718, https://doi.org/10.1029/JB082i036p05705, 1977.
Tullis, J. and Yund, R. A.: Dynamic recrystallization of feldspar: A mechanism for ductile shear zone formation, Geol, 13, 238, https://doi.org/10.1130/0091-7613(1985)13<238:DROFAM>2.0.CO;2, 1985.
Tullis, J., Dell'Angelo, L., and Yund, R. A.: Ductile shear zones from brittle precursors in feldspathic rocks: The role of dynamic recrystallization, in: Geophysical Monograph Series, Vol. 56, edited by: Duba, A. G., Durham, W. B., Handin, J. W., and Wang, H. F., American Geophysical Union, Washington, D. C., 67–81, https://doi.org/10.1029/GM056p0067, 1990.
Voigt, W.: Lehrbuch der Kristallphysik: mit Ausschluss der Kristalloptik, B.G.Teubner, Leipzig, https://doi.org/10.1007/978-3-663-15884-4, 1910.
Wehrens, P., Berger, A., Peters, M., Spillmann, T., and Herwegh, M.: Deformation at the frictional-viscous transition: Evidence for cycles of fluid-assisted embrittlement and ductile deformation in the granitoid crust, Tectonophysics, 693, 66–84, https://doi.org/10.1016/j.tecto.2016.10.022, 2016.
Wheeler, J.: Importance of pressure solution and coble creep in the deformation of polymineralic rocks, J. Geophys. Res., 97, 4579, https://doi.org/10.1029/91JB02476, 1992.