the Creative Commons Attribution 4.0 License.
the Creative Commons Attribution 4.0 License.
 | 11 Nov 2025
Deformation and exhumation in thick continental crusts induced by valley incision of elevated plateaux
Thomas Geffroy
Philippe Yamato
Philippe Steer
Benjamin Guillaume
Thibault Duretz
Surface processes such as erosion and sedimentation play a critical role in crustal deformation, particularly in actively deforming orogenic belts. While these processes have been extensively studied in large-scale erosive and tectonically active regions, the specific effects of valley incision on crustal deformation, especially in tectonically inactive regions, remain poorly understood. In this study, we hypothesize that crustal deformation induced by valley incision is primarily governed by three parameters: incision velocity, crustal thickness, and the elevation difference between the plateau and the valley base level. Using two-dimensional (2D) thermomechanical models, we investigate the influence of valley incision on crustal deformation and exhumation by varying these parameters. Our results show that valley incision alone can induce significant crustal deformation, associated with lateral viscous flow in the lower crust leading to near-vertical channel flow and extensional brittle deformation in the upper crust below the valley. This deformation leads to lower-crust exhumation, within a 10 Myr time frame, if crustal thickness is greater than 50 km, the initial plateau elevation is greater than or equal to 2 km, and the long-term effective erosion rate exceeds 0.5 mm yr−1. Furthermore, while the onset of lower-crust exhumation is primarily controlled by the initial plateau elevation, the total amount of exhumed lower crust after 10 Myr strongly increases with the initial thickness of the lower crust which favors viscous flow. Moreover, natural systems that exhibit the required crustal thickness, plateau elevation, and erosion rates for lower-crustal exhumation, as highlighted in our models, also demonstrate active lower-crustal exhumation, as is the case in regions such as Nanga Parbat and Namcha Barwa. These findings offer new insights into the coupling between surface processes and deep crustal dynamics, highlighting the potential for valley incision to drive substantial crustal deformation and promote lower-crustal exhumation.
- Article
(5233 KB) - Full-text XML
-
Supplement
(3009 KB) - BibTeX
- EndNote


Surface processes represent a pivotal element in the evolution of mountain ranges (e.g., Beaumont et al., 1992; Koons, 1990). While tectonic forces increase topographic relief and slope, numerous modeling studies have shown that surface processes and the associated mass redistribution exert a significant influence on tectonic processes (Avouac and Burov, 1996; Braun and Yamato, 2010; Steer et al., 2014; Sternai et al., 2019; Thieulot et al., 2014; Vernant et al., 2013; Willett, 1999; Wolf et al., 2022). Previous studies have demonstrated the critical role of erosion in controlling deformation within active orogens (e.g., Thieulot et al., 2014; Wolf et al., 2022), triggering complex feedback mechanisms, such as isostatic rebound (e.g., Sternai et al., 2019), or the setting up of large lower-crustal flow (Beaumont et al., 2001), involving mechanical, thermal, and time-dependent processes. These mechanisms enhance strain localization through intensified erosion, which in turn promotes increased rock uplift and accentuates orogen asymmetry (e.g., Braun and Yamato, 2010; Thieulot et al., 2014; Wolf et al., 2022). However, these studies specifically focused on active orogens, which limits a comprehensive understanding of the isolated influence of erosion on crustal deformation, particularly in regions without active tectonics. Moreover, these studies do not specifically focus on the impact of valley incision on crustal deformation.
Nevertheless, some studies demonstrate that valley incision can significantly influence topography through the response of lithosphere deformation to erosion (Montgomery and Stolar, 2006; Simpson, 2004; Zeitler et al., 2001). Baiadori et al. (2024) show that, even in the absence of regional deformation, the incision of fluvial valleys can lead to lithospheric bending and significant change in landscape dynamics. However, these studies have not explored the role of valley incision on large-amplitude deformation, accounting for visco-elasto-plastic rheologies, over timescales relevant for orogen building. Recently, Yang et al. (2023) proposed that the erosion of wide valleys (50 km) could drive significant crustal deformation, leading to the development of substantial relief (1–2 km) and, in extreme cases, the exhumation of lower-crustal material. While this study presents important findings, the inclusion of a horizontal shortening rate of approximately 1.6 mm yr−1 limits our ability to isolate the effects of valley incision on crustal deformation.
If rivers influence crustal deformation, different river systems should exert distinct impacts depending on various parameters, such as incision velocity, crustal thickness, or base level. Specifically, when considering a plateau in a non-convergent setting, we expect the difference in altitude between the plateau and the base level (what we refer to as “erosion potential” hereinafter) to be a main controlling factor of the induced tectonic response. Indeed, we hypothesize that a river with a low erosion potential would have a limited impact on crustal deformation, whereas a river on a high plateau, implying a high erosion potential, could induce larger crustal deformation (Fig. 1). We expect the deformation to be accommodated by a flow of the viscous lower crust, leading to the formation of high relief and, in extreme cases, to the exhumation of lower-crustal material at the surface (Fig. 1).
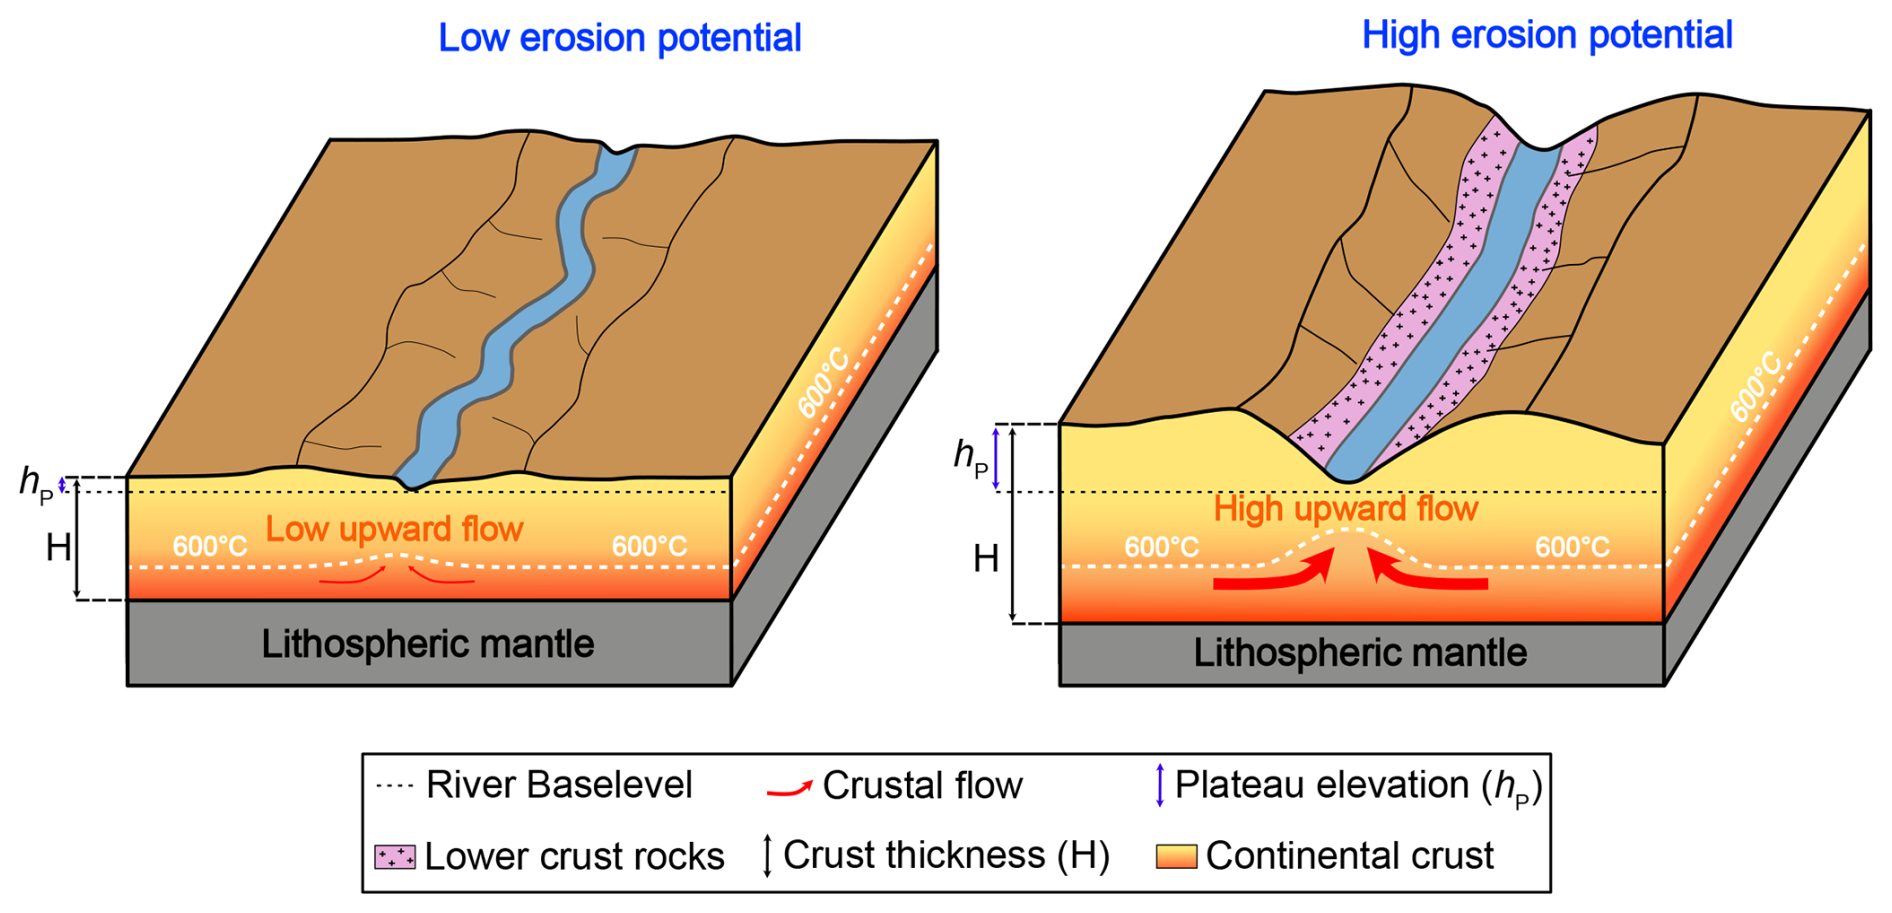
Figure 1Schematic representation of the impact of a valley incision on crustal deformation, depending on the erosion potential (see text for details).
The potential for valley incision to drive the exhumation of lower-crustal material has previously been debated in specific natural settings, such as the Nanga Parbat–Haramosh massif and the Namcha Barwa massif (Zeitler et al., 2001). However, the tectonic complexity of these regions makes the distinction between erosionally and tectonically driven exhumation difficult.
In this study, we therefore focus on a scenario in which regional tectonic forces are absent, ensuring that all observed crustal deformation results solely from valley incision. This does not imply that our models are limited to inactive tectonic settings (thick continental crust indeed generally requires important shortening). However, as our objective is to isolate the specific impact of valley incision on crustal deformation, we voluntarily imposed fixed horizontal velocity boundary conditions set to nearly 0 (i.e., 0.015 mm yr−1). Applying convergence would modify our model behavior and would make it difficult to quantify what is due solely to the effect of the river incision. To systematically investigate the impact of valley incision on crustal deformation and exhumation and their feedback on valley morphology, we employ a two-dimensional (2D) thermomechanical numerical model incorporating a visco-elasto-plastic rheology and surface processes consisting of a simple erosion law coupling a source term for river incision with diffusion (see Sect. 2.1). Our objective is to gain a deeper understanding of the mechanical response of the lithosphere to valley incision and evaluate the potential for this process to drive the exhumation of lower-crustal material, along with whether such exhumation can occur within a geological time frame of less than 10 Myr. This value of 10 Myr was chosen as representative for the upper limit of river persistence at a fixed location over geological timescale. Examples of rivers maintaining the same course for more than 10 Myr are indeed extremely rare in nature (see Sect. 4.3). Moreover, natural examples of valley incision associated with lower-crust exhumation indicate that such exhumation typically occurs within less than 10 Myr (e.g., Nanga Parbat and Namcha Barwa; Zeitler et al., 2001). Therefore, we assume that, if this process does not take place within a 10 Myr time frame in our model, it is unlikely to be geologically realistic.
2.1 Code description
Numerical simulations are performed using the 2D thermomechanical code MDoodz (Duretz et al., 2021; Yamato et al., 2015). This numerical code was applied to the study of grain-scale (e.g., Luisier et al., 2023; Yamato et al., 2019) to lithospheric-scale (e.g., Auzemery et al., 2022; Candioti et al., 2022; Poh et al., 2020; Porkoláb et al., 2021) geological processes. It accounts for visco-elasto-plastic rheologies (Duretz et al., 2020) and a true free surface (Duretz et al., 2016). Based on the marker-in-cell method (Gerya and Yuen, 2003; Harlow and Welch, 1965), MDoodz employs the finite difference method to solve the governing equations of momentum (1), mass conservation (2), and heat (3) on a staggered grid. These equations are expressed as follows:
where τij is the deviatoric stress tensor, xi and xj are the spatial coordinates, P is the pressure (Pa), ρeff is the effective density (kg m−3), gi is the gravity acceleration in the direction i (here, gx=0 and ), vi is the velocity component in the direction i (m s−1), is the effective heat capacity (J kg−1 K−1), t is time (s), T is the temperature (K), k is the thermal conductivity (W m−1 K−1), Qr is the radiogenic heat production (W m−3), and QSH describes the production of heat by viscoplastic dissipation (shear heating). In Eqs. (1) and (3), the rock's effective density (ρeff) and heat capacity () can indeed change when the partial melting of rocks is involved (see Appendix B).
Material properties are stored on particles that are advected through time using a fourth-order Runge–Kutta scheme. The evolution of the density field is described by the following equation:
where ρ0 is the reference density, α is the thermal expansivity, β is compressibility, and T0 and P0 are the reference temperature and pressure, set to 0 °C and 105 Pa, respectively. The initial temperature field is obtained by solving the equilibrium heat equation using the reference thermal parameters (Table 1), except for the lithospheric mantle, for which the conductivity has been artificially set to a very high value to obtain an adiabatic asthenosphere. The Courant condition is set at 0.25 for all the simulations.
To prevent numerical instabilities, we impose a minimum viscosity threshold of 1018 Pa s in the model and use a free surface stabilization algorithm (Duretz et al., 2011). This threshold is set to avoid viscosity variations exceeding 7 orders of magnitude within the model. It should be noted that 1018 Pa s is still higher than the viscosity of magmas (∼ 102–1014 Pa s; e.g., Dingwell, 2006) or partially molten rocks (∼ 1017–1018 Pa s; e.g., Molitor et al., 2024).
To account for a visco-elasto-plastic rheology, the deviatoric strain rate tensor is additively decomposed, such as
where the exponents v, e, and p correspond to the viscous, elastic, and plastic (frictional) components. We detail each component of the strain rate in Appendix A. Partial melting is also included in the numerical code (see Appendix B).
At a specific location, the vertical erosion of a plateau can occur through river or glacier incision, modulated by climatic conditions, upstream conditions (e.g., water and sediment fluxes), and local slope. In addition, the lateral erosion of the valley wall can occur through multiple processes, including river lateral mobility and hillslope destabilization, mass wasting processes, periglacial processes, soil production, and creep (e.g., Brocard and van der Beek, 2006; Hancock and Anderson, 2002; Martin et al., 2011). Accounting for all these different and interrelated processes in a single numerical model represents a challenge, clearly out of the scope of this article. Instead, we rely on the use of a simple erosion law that combines a constant incision velocity imposed at the top of the lithosphere, to simulate vertical incision by glaciers or rivers, with a topographic diffusion coefficient to simulate lateral valley erosion and sedimentation. In our models, the incision rate (Vi) remains constant as long as the valley floor remains above the river base level, set at 0 km elevation. Once this base level is reached, Vi is set to 0 and remains so unless the elevation increases above this base level. In the following, we impose a prescribed valley incision velocity Vi at the model center over an initial width Wi. In addition, diffusion is applied to surface, considering a constant diffusivity coefficient (K). After advection of the free surface following visco-elasto-plastic deformation, we impose a phase of evolution of the elevation h of the free surface due to surface processes:
2.2 Reference model design
To define the reference model setup, we firstly compiled global data on crustal thickness (Crust 1.0 model; Laske et al., 2013) and Earth continental surface elevation (ETOPO1; NOAA, 2009). Based on these datasets, we constructed a diagram illustrating the correlation between both parameters (Fig. 2a). The reference model was then selected to represent an intermediate position in the observed distribution.
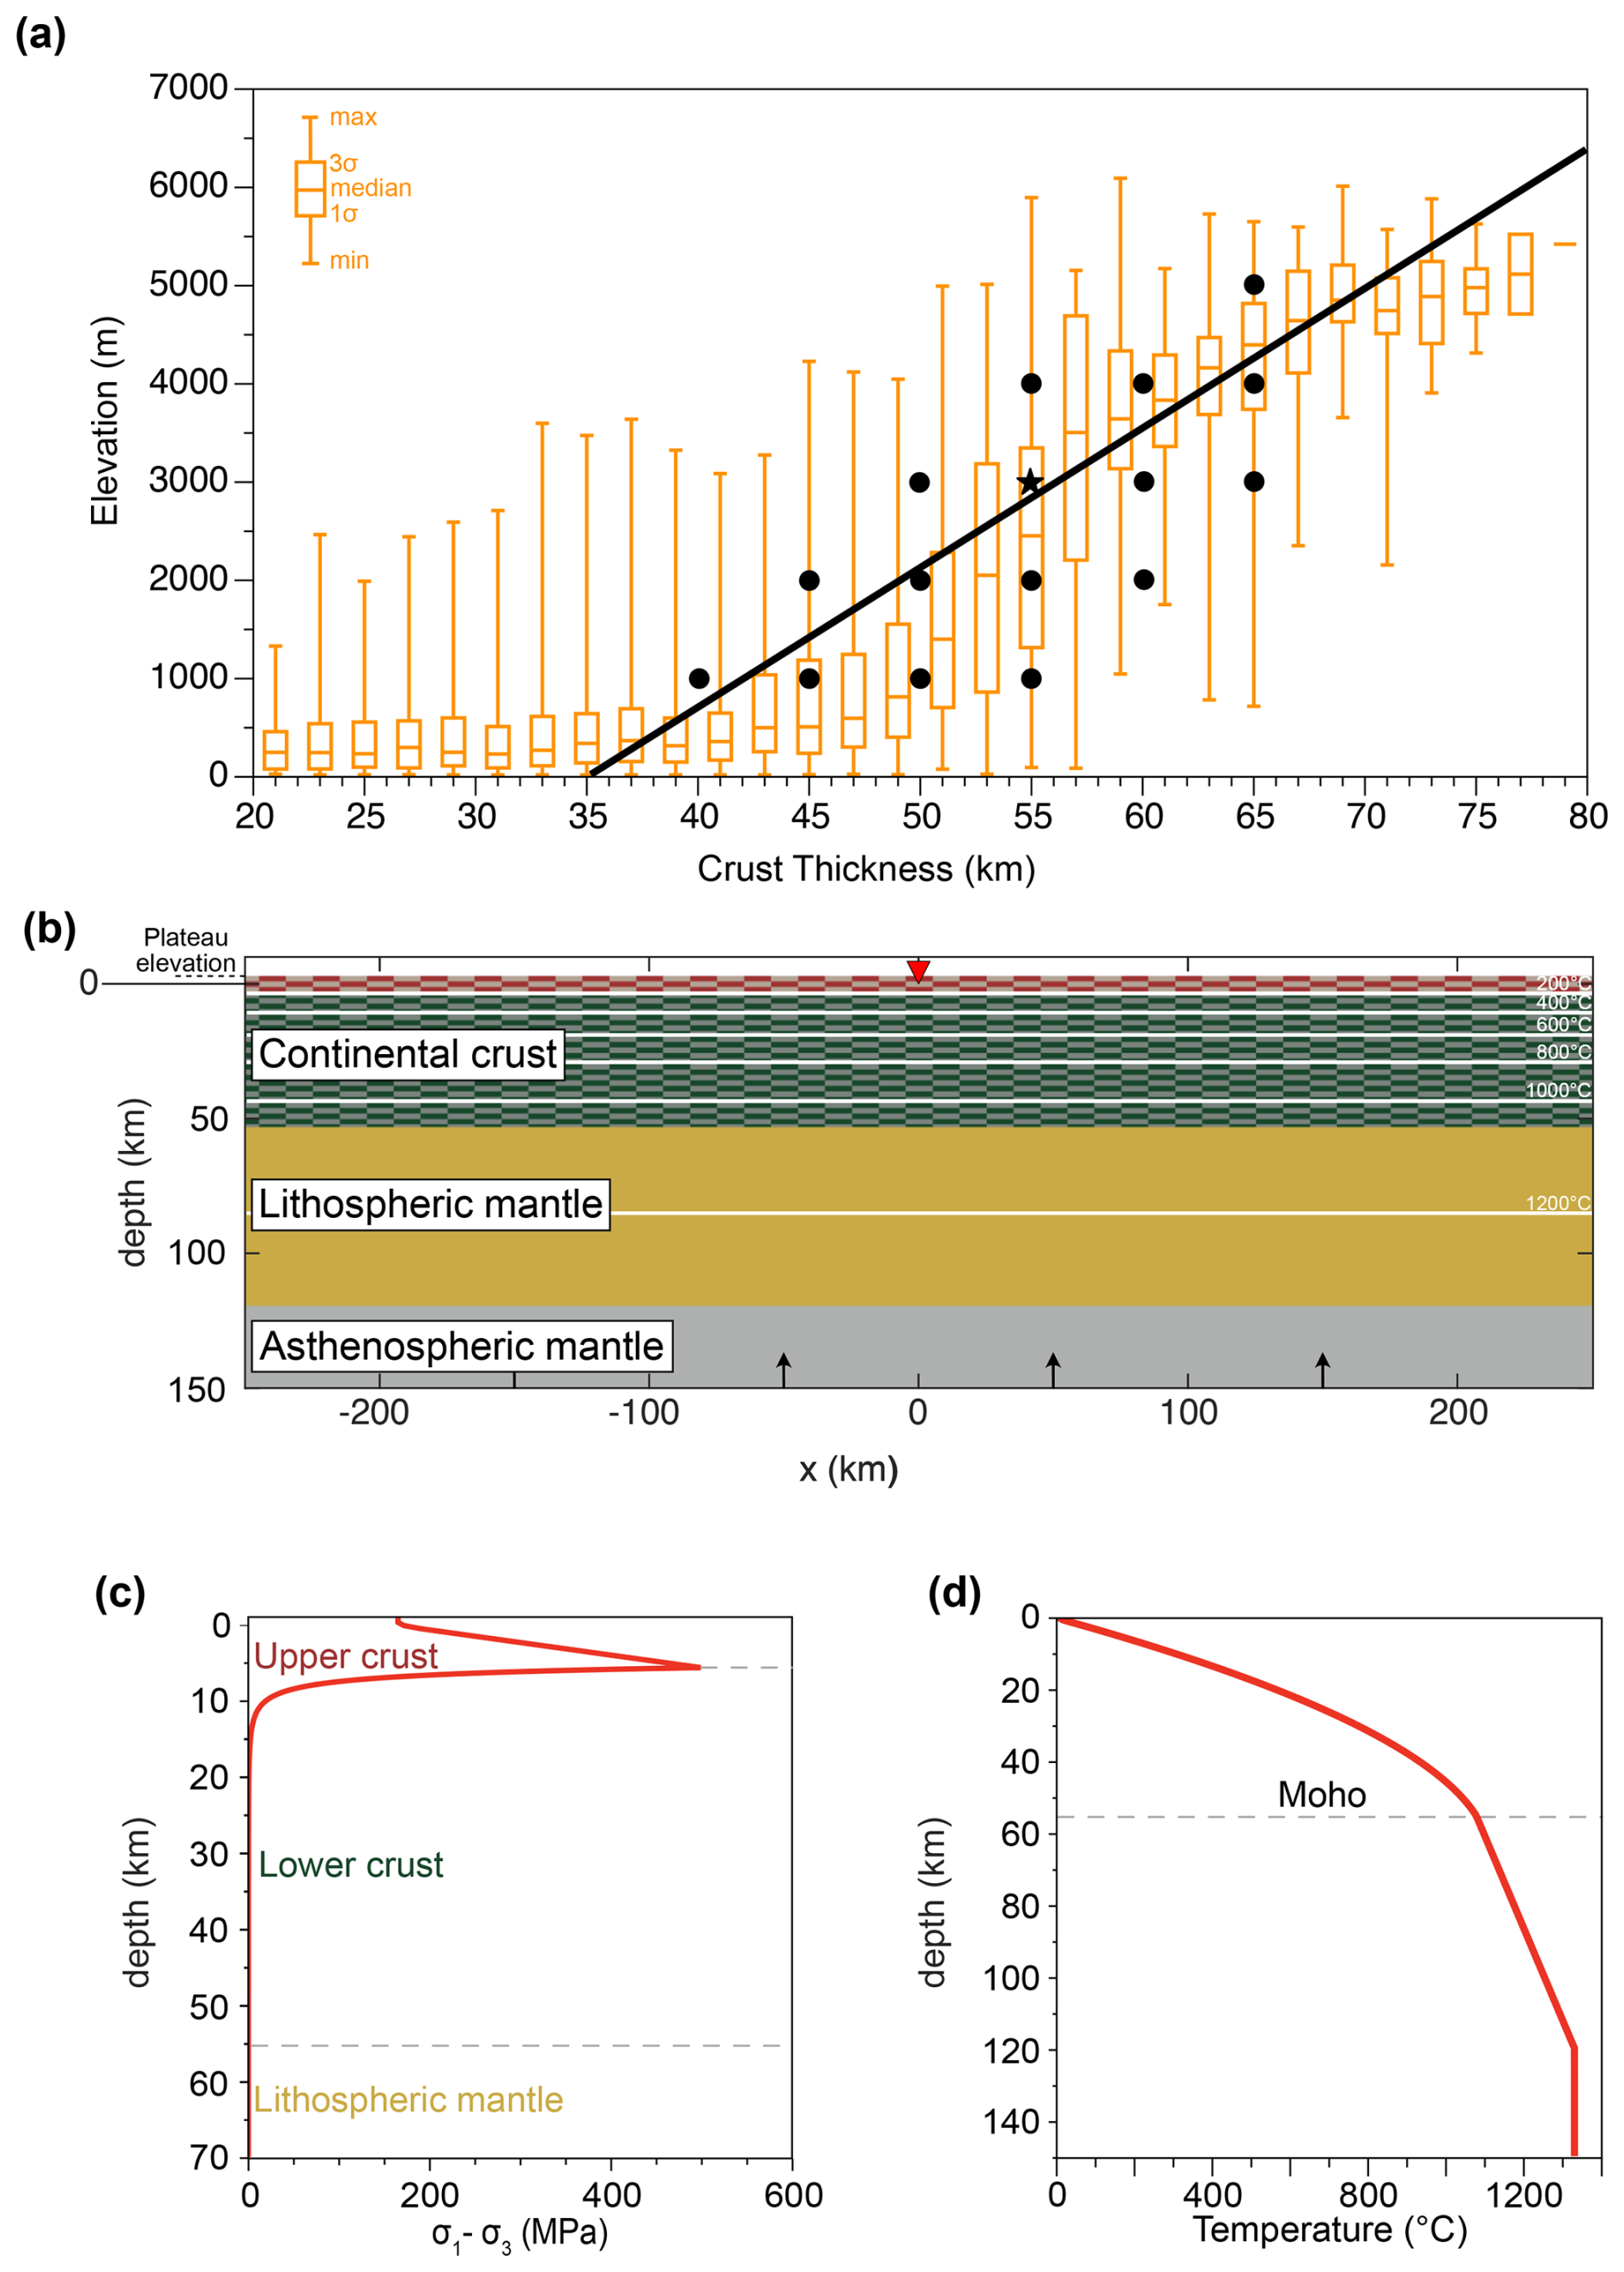
Figure 2(a) Continental crustal thickness vs. elevation from natural data. Data for crustal thickness are from the Crust 1.0 model (Laske et al., 2013). Data for global earth altitude are from ETOPO1 (NOAA, 2009). Black points represent the combination of plateau elevation and crustal thickness used in the parametric study, and the black star represents the reference model. The black line represents the linear relationship between crustal thickness and elevation assuming that this relationship is only driven by isostasy and using the material properties of our models (see Table 1). (b) Initial model setup for the reference model. The horizontal limit between the red and green layers in the continental crust corresponds to the depth of the initial peak of strength in the crust that we define as the limit between the upper crust and the lower crust (considering a homogeneous strain rate of 10−18 s−1). White lines represent each 200 °C isotherm. Black arrows indicate the input of material to balance the amount of material removed by the valley incision (see text for details). Initial topography (plateau elevation) is set here to 3 km, and the valley base level is at 0 km. (c) Yield strength profile from the surface to 70 km depth, considering a homogeneous strain rate of 10−18 s−1. (d) Temperature profile from the surface to 150 km depth.
The reference model includes a crust with a thickness (H) of 55 km and an initial plateau elevation (hP) of 3 km (Fig. 2a). The model domain used in this study is 500 km wide and 160 km deep. The reference model therefore includes a continental lithosphere made of a 55 km thick continental crust resting on top of a 65 km thick lithospheric mantle and 30 km of asthenospheric mantle (Fig. 2b). We perform simulations at 1 km resolution for the full parametric study, as resolution tests show good convergence for resolutions lower than 1 km (see Fig. S1 in the Supplement).
The incision width Wi in our study has been set at a constant value of 1 km. In the reference model, we apply an incision velocity (Vi) of 30 mm yr−1 and a topographic diffusion coefficient (K) of m2 s−1. The value of K lies in the range of previous numerical modeling studies involving surface processes (e.g., Avouac and Burov, 1996; Munch et al., 2022; Yamato et al., 2008). To avoid material loss, we compensate the volume loss due to the incision of the free surface by the addition of asthenospheric mantle material evenly distributed across the model base. The bottom, right, and left boundaries are free-slip boundaries.
The temperature at the top and lithosphere–asthenosphere boundaries are maintained at 0 and 1330 °C, respectively. The asthenosphere is assumed to be adiabatic. Heat flux is set to zero at the right and left boundaries of the model (Neumann boundary conditions). The initial brittle–ductile transition occurs at 6 km depth for the reference model (Fig. 2b). We define the boundary between the upper and lower crust based on the brittle–ductile transition of the Westerly Granite rheology. In our models, the lower crust corresponds to the portion of the crust located beneath this transition zone (represented in green in Fig. 2b) and is considered to be the ductile portion of the crust.
The parametrization of the reference model leads to conditions favorable to crustal convection, with a Rayleigh number of ∼ 1×10⁵.
All material parameters are presented in Table 1 for the reference model.
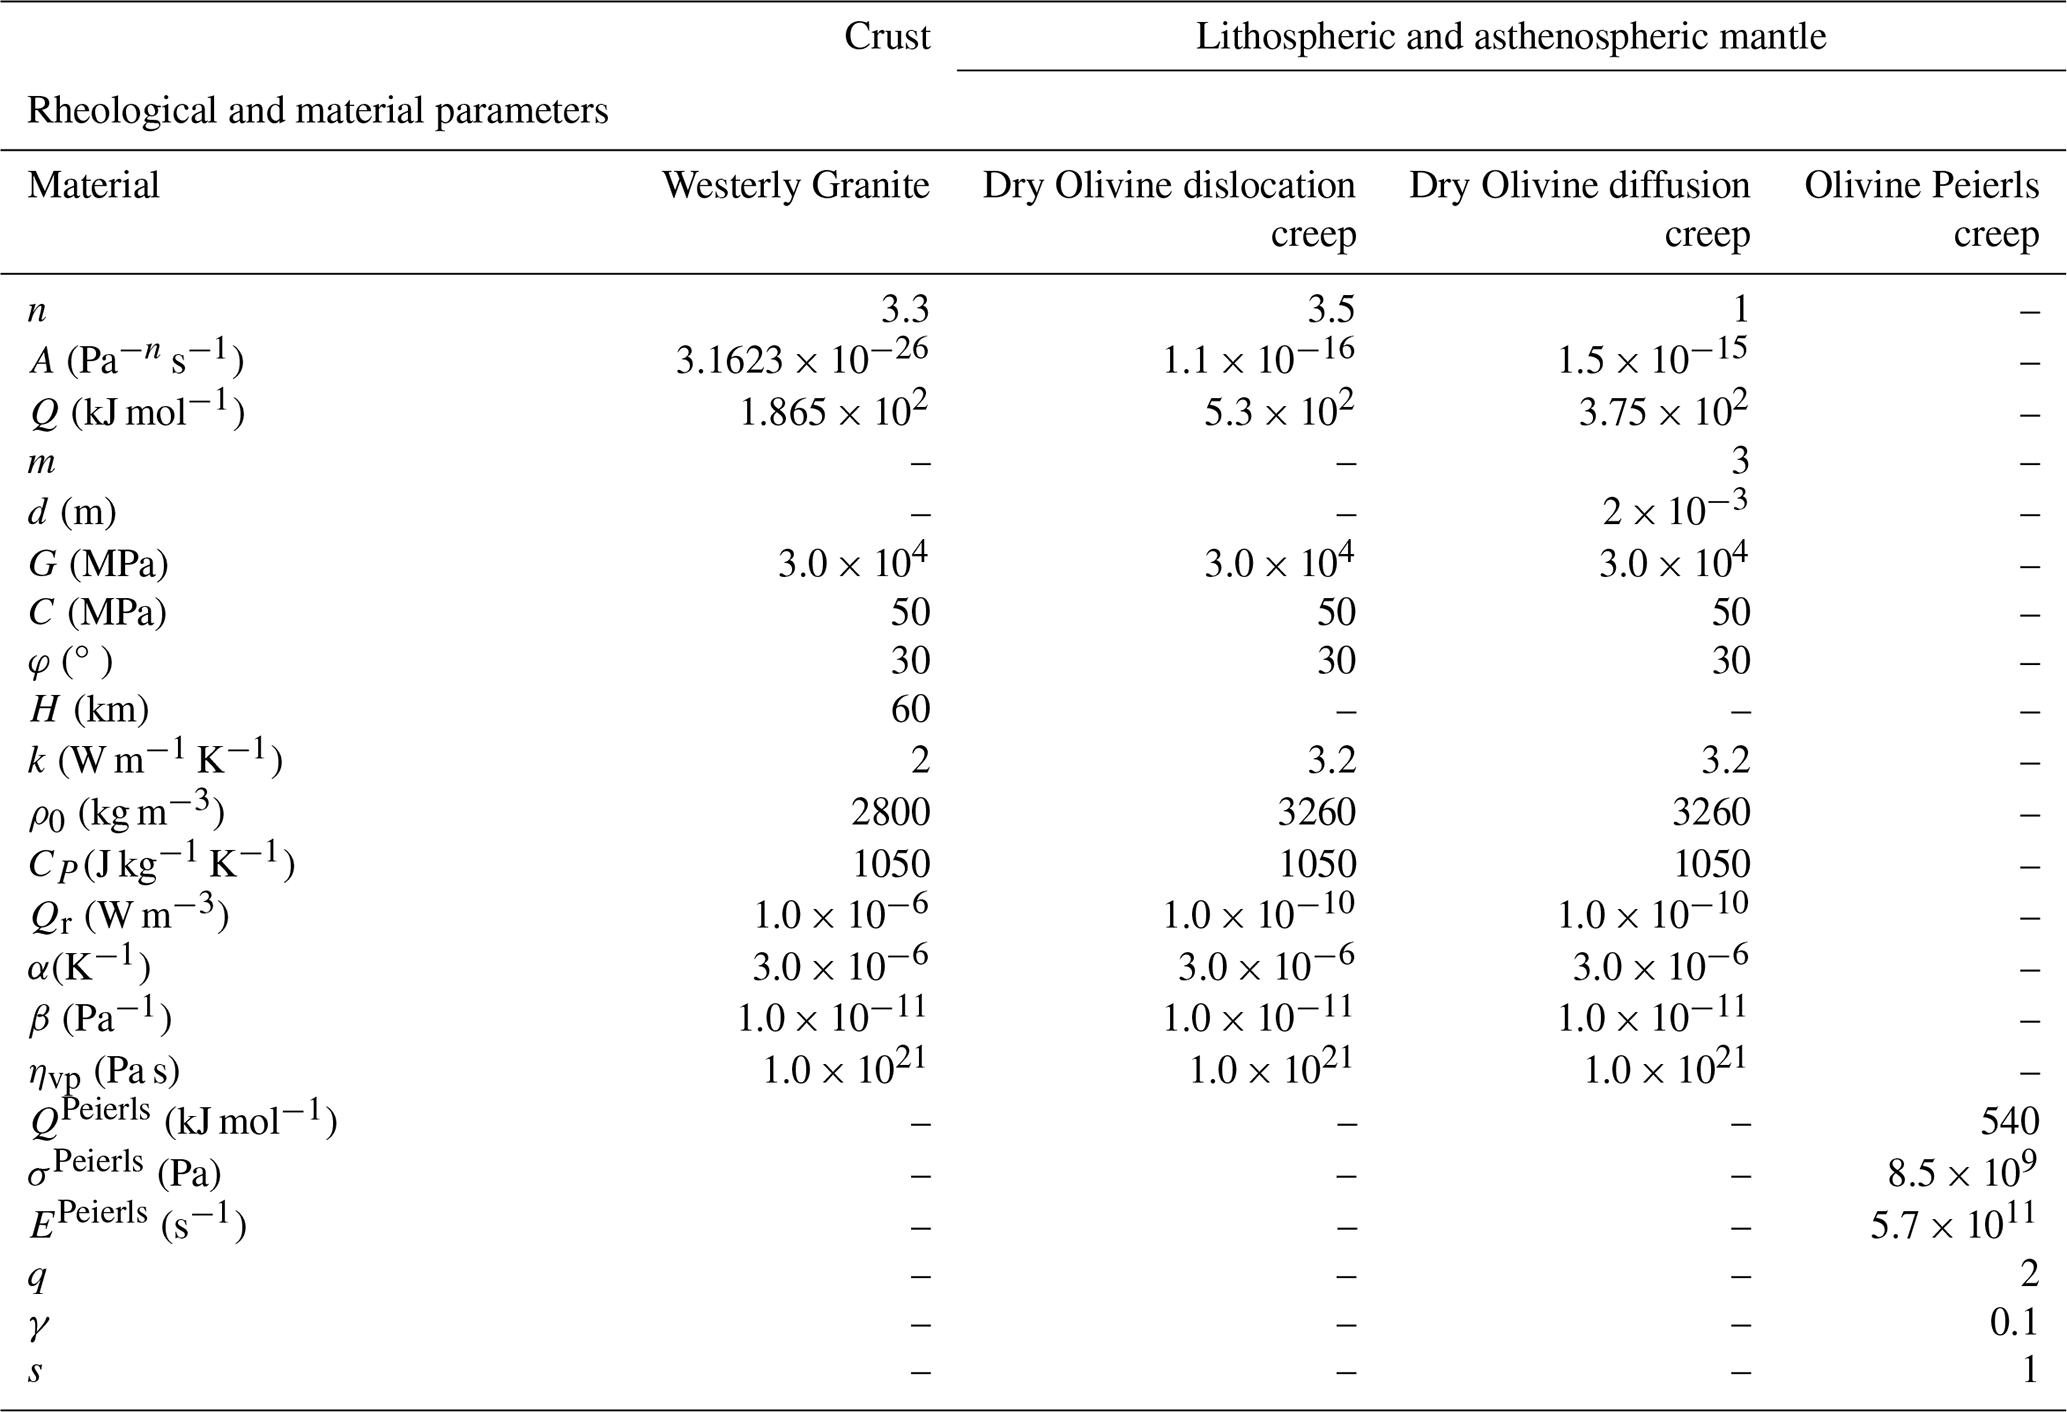
Table 1Rheological and material parameters values used in our study for the reference model. The dislocation creep parameters used for the crust are those for Westerly Granite (Hansen and Carter, 1983). For the lithospheric and asthenospheric mantle, the chosen dislocation and diffusion creep parameters are those for Dry Olivine (Hirth and Kohlstedt, 2003), and the chosen Peierls creep are those for Olivine (Evans and Goetze, 1979; Kameyama et al., 1999). For elasticity, the shear modulus G is 30 GPa for all materials, which is in the range of values proposed for natural rocks at lithospheric depths (e.g., Turcotte and Schubert, 2002). Friction angle (φ) and cohesion (C) are set to be representative of Byerlee's law (Byerlee, 1978). Values of Qr are from Jaupart and Mareschal (2021) and Rudnick and Gao (2003).
2.3 Parametric analysis
Two different systematic studies were performed from this reference model.
-
We systematically vary (i) crustal thickness (H) from 40 to 65 km (5 km increments) and (ii) initial plateau elevation (hP) from 1 to 5 km (1 km increments), following their observed natural correlation (Fig. 2a). We assume that, by using constant crustal and mantle densities and excluding horizontal velocities at the lateral boundaries of our models, isostasy imposes a linear correlation between crustal thickness and plateau elevation. This relationship implies that a single plateau elevation corresponds to each crustal thickness (Fig. 2a). However, to explore a broader range of geodynamic scenarios and to capture the diversity of natural systems, we deliberately extend our models beyond this constraint. This approach allows us to simulate configurations where thick crust is associated with anomalously low/high plateau elevations, cases that cannot be explained by isostasy alone. Relying strictly on the isostatic relationship would prevent us from independently assessing the roles of crustal thickness and plateau elevation. Nonetheless, most of our models, particularly the reference model, remain close to this linear relationship (Fig. 2a).
We use the same incision velocity (Vi) of 30 mm yr−1 used for the reference model.
-
We perform models with two different incision velocities (Vi) of 10 and 50 mm yr−1 considering the same combination of crustal thickness and initial elevation as for the previous systematic study.
A total of 48 models were performed. All models with their respective parameters are available in Table S1 in the Supplement.
2.4 Model metrics
For each model, we design a set of metrics to quantify their evolution in terms of mechanical strength, temperature, exhumation, and topography. To characterize valley morphology, we compute the valley maximum relief (Δh), corresponding to the difference between the maximum (hmax) and minimum (hmin) elevation of the model surface (Fig. 3a and 3b). We also compute the effective erosion rate (Eeff) in the center of the valley by calculating the time required to remove successive 2 km thick layers of material eroded by valley incision at the center of the valley. From this, we deduce the cumulative amount of vertical exhumation at different time steps in the center of the valley. Because of lateral topographic diffusion, the incision velocity Vi does not directly correspond to the effective erosion velocity in the center of the valley, as Eeff depends on both Vi and K. Hence, in the reference model, for instance (with Vi= 30 mm yr−1), the mean Eeff value in the center of the valley is 0.8 ± 0.25 mm yr−1 between 1 and 10 Myr of model simulations (Fig. 3c).
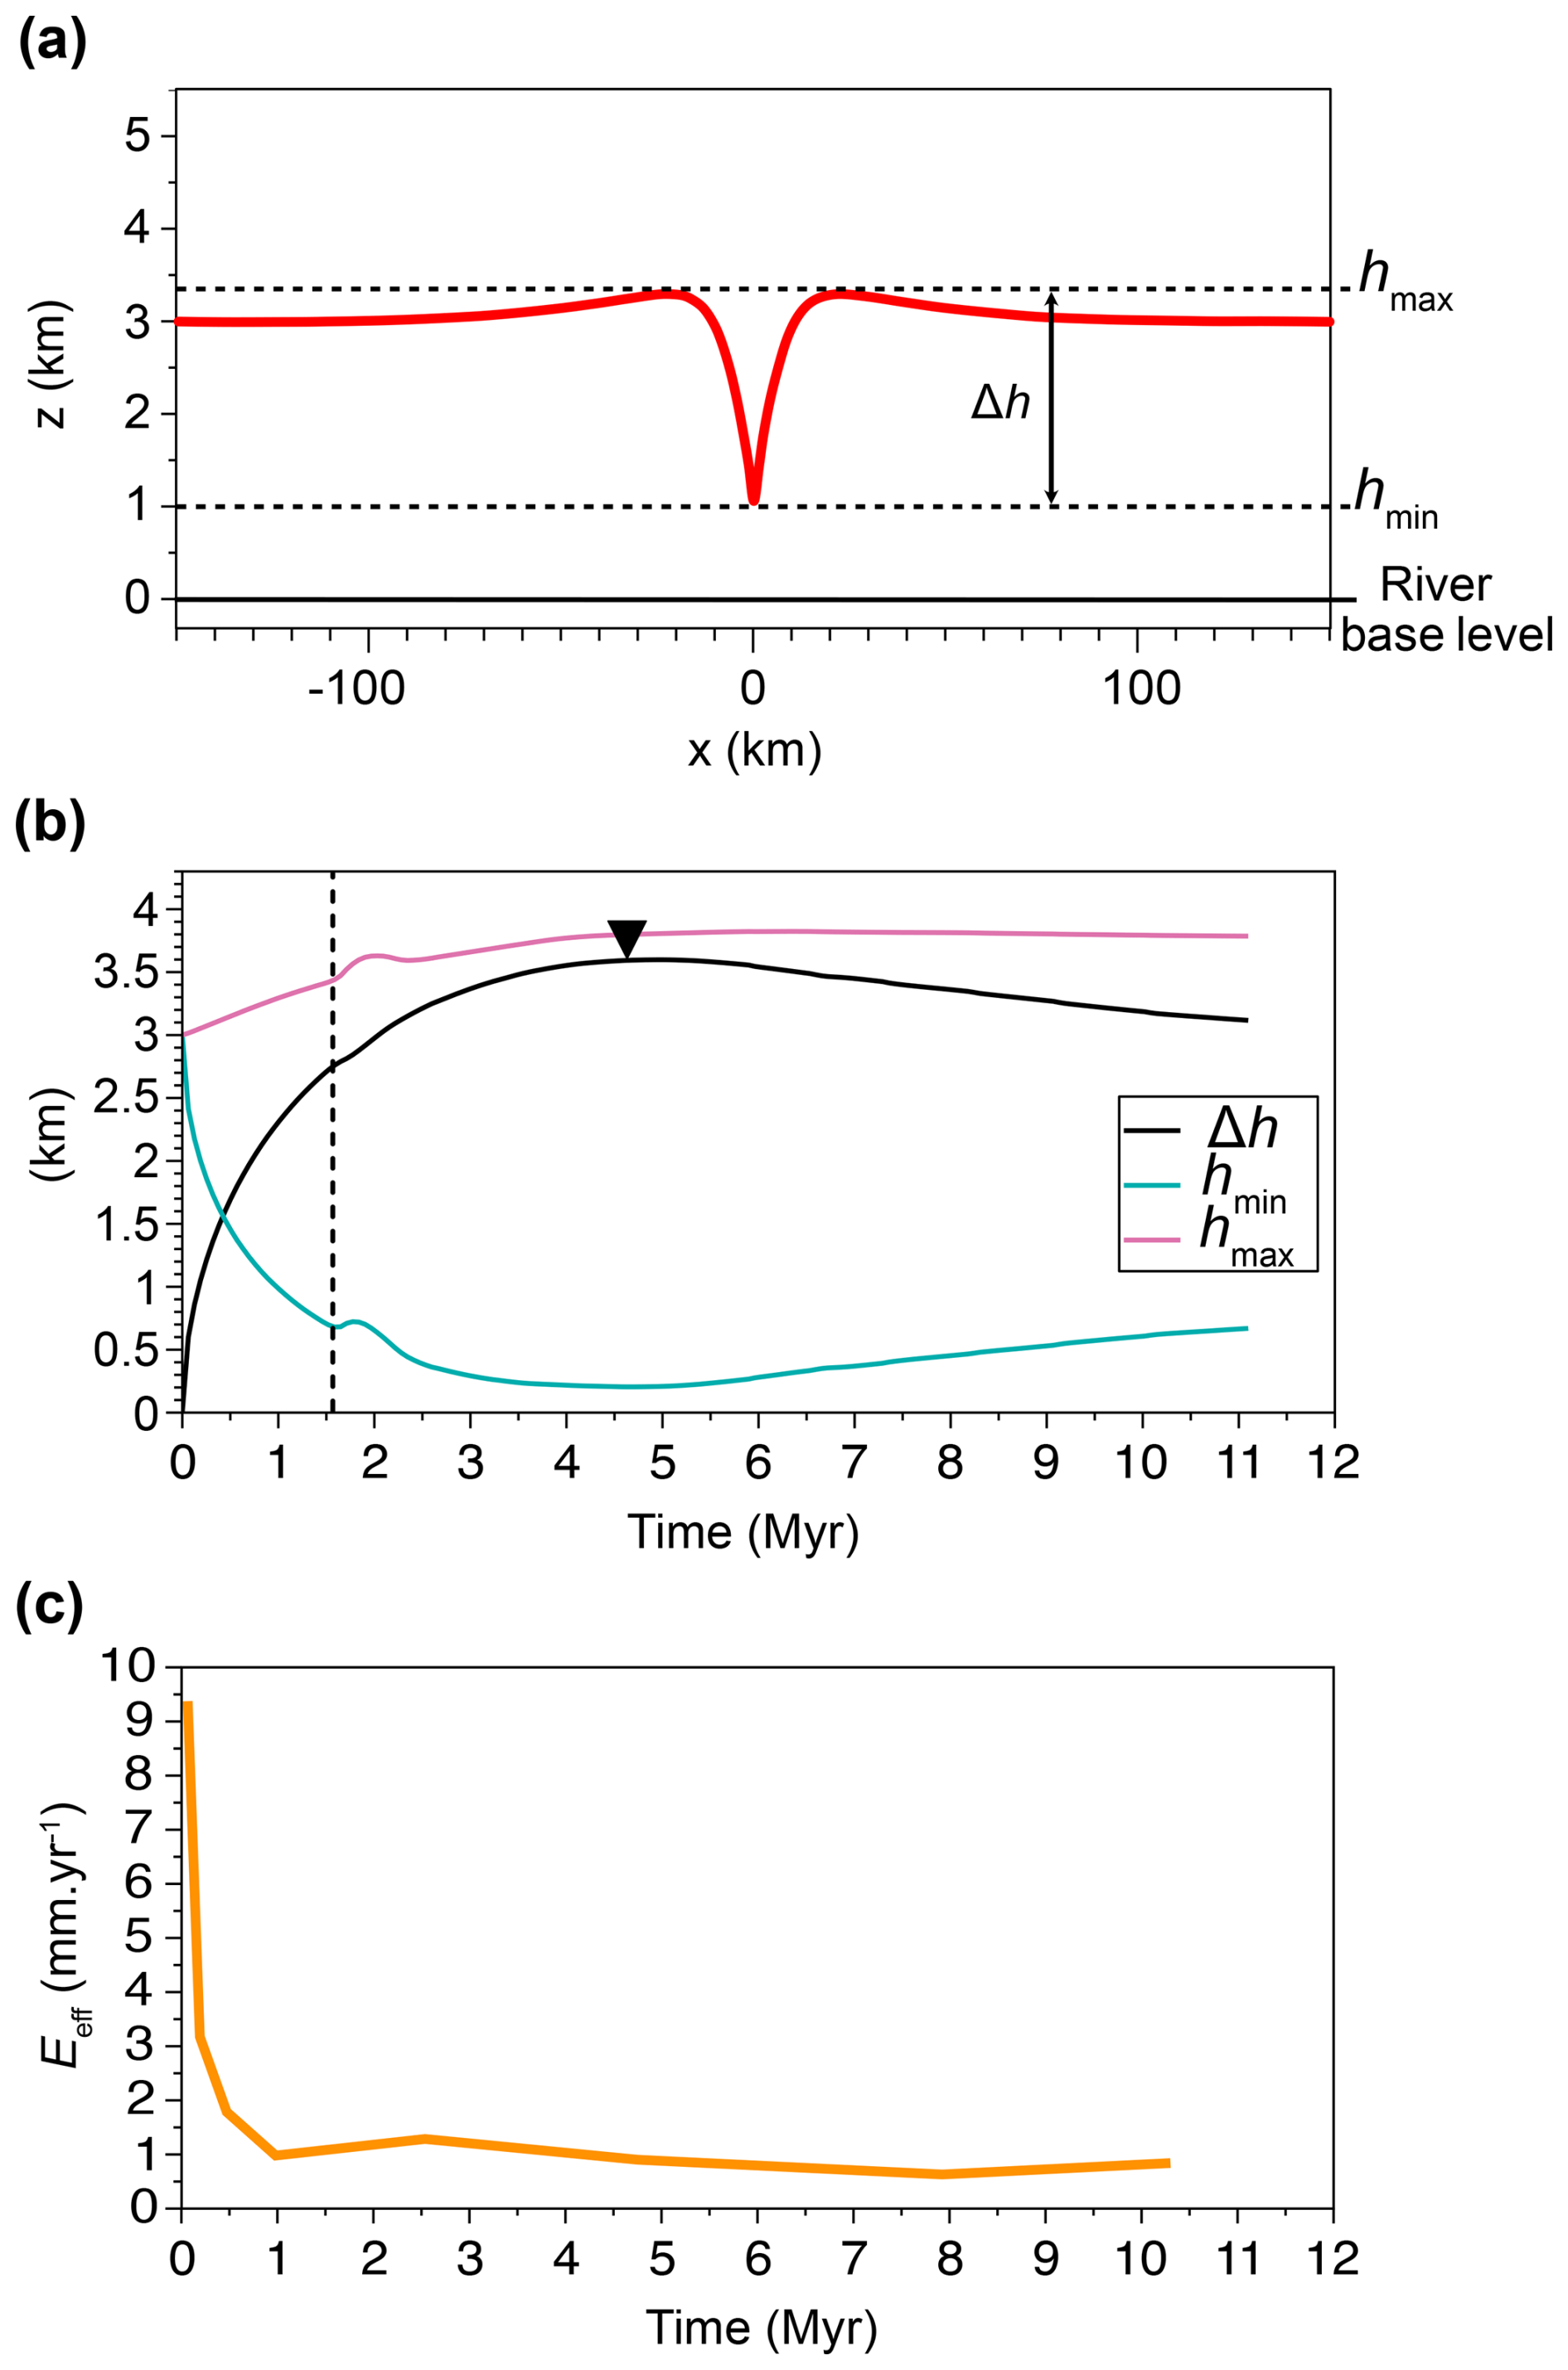
Figure 3(a) Topographic profile of the reference model after 1 Myr of simulation. Measurement of the relief (Δh) and of the maximum (hmax) and minimum (hmin) altitude are indicated on the profile. (b) Time evolution of Δh, hmax, and hmin for the reference model. The black triangle represents the moment when the lower crust is exhumed to the surface. The vertical dotted line represents when the initiation of the crustal convection starts. (c) Time evolution of the effective erosion rate at the center of the valley (Eeff) for the reference model.
3.1 Reference model
3.1.1 Valley morphology and effective erosion
The valley relief (Δh) evolves over time, reaching a maximum value of 3.5 km after 4.5 Myr (Fig. 3b). After this peak, Δh decreases almost linearly until the end of the simulation, reaching 3.2 km after 10 Myr. Notably, half of the total relief increase occurs within the first 1 Myr, emphasizing the transient nature of the topographic evolution under a prescribed incision rate. The primary driver of relief development is the decrease in hmin, which decreases by 2.8 km after 4.5 Myr, rather than an increase in hmax, which rises by only 700 m over the initial plateau elevation during the same period (Fig. 3b).
After a sharp decrease during the first 1 Myr, hmin decreases gradually, particularly between 1.5 and 3 Myr. Between 3 and 5 Myr, hmin stabilizes at approximately 200 m before increasing again, reaching 600 m by the end of the simulation (10 Myr). In contrast, hmax increases almost linearly over the first 3 Myr, reaching 3.6 km, before gradually rising to a stable value of 3.8 km after 6 Myr (Fig. 3b).
A bump of 100 to 200 m appears in both hmin and hmax curves after ∼ 1.5 Myr, corresponding to the initiation of crustal convection (Fig. 4), which temporarily increases both values (Fig. 3b).
The effective erosion rate (Eeff) follows a different evolution. It starts at ∼ 9.5 mm yr−1 during the first 100 kyr, rapidly decreases to reach ∼ 1 mm yr−1 after 1 Myr, and remains nearly constant at ∼ 0.8 mm yr−1 afterwards (Fig. 3c).
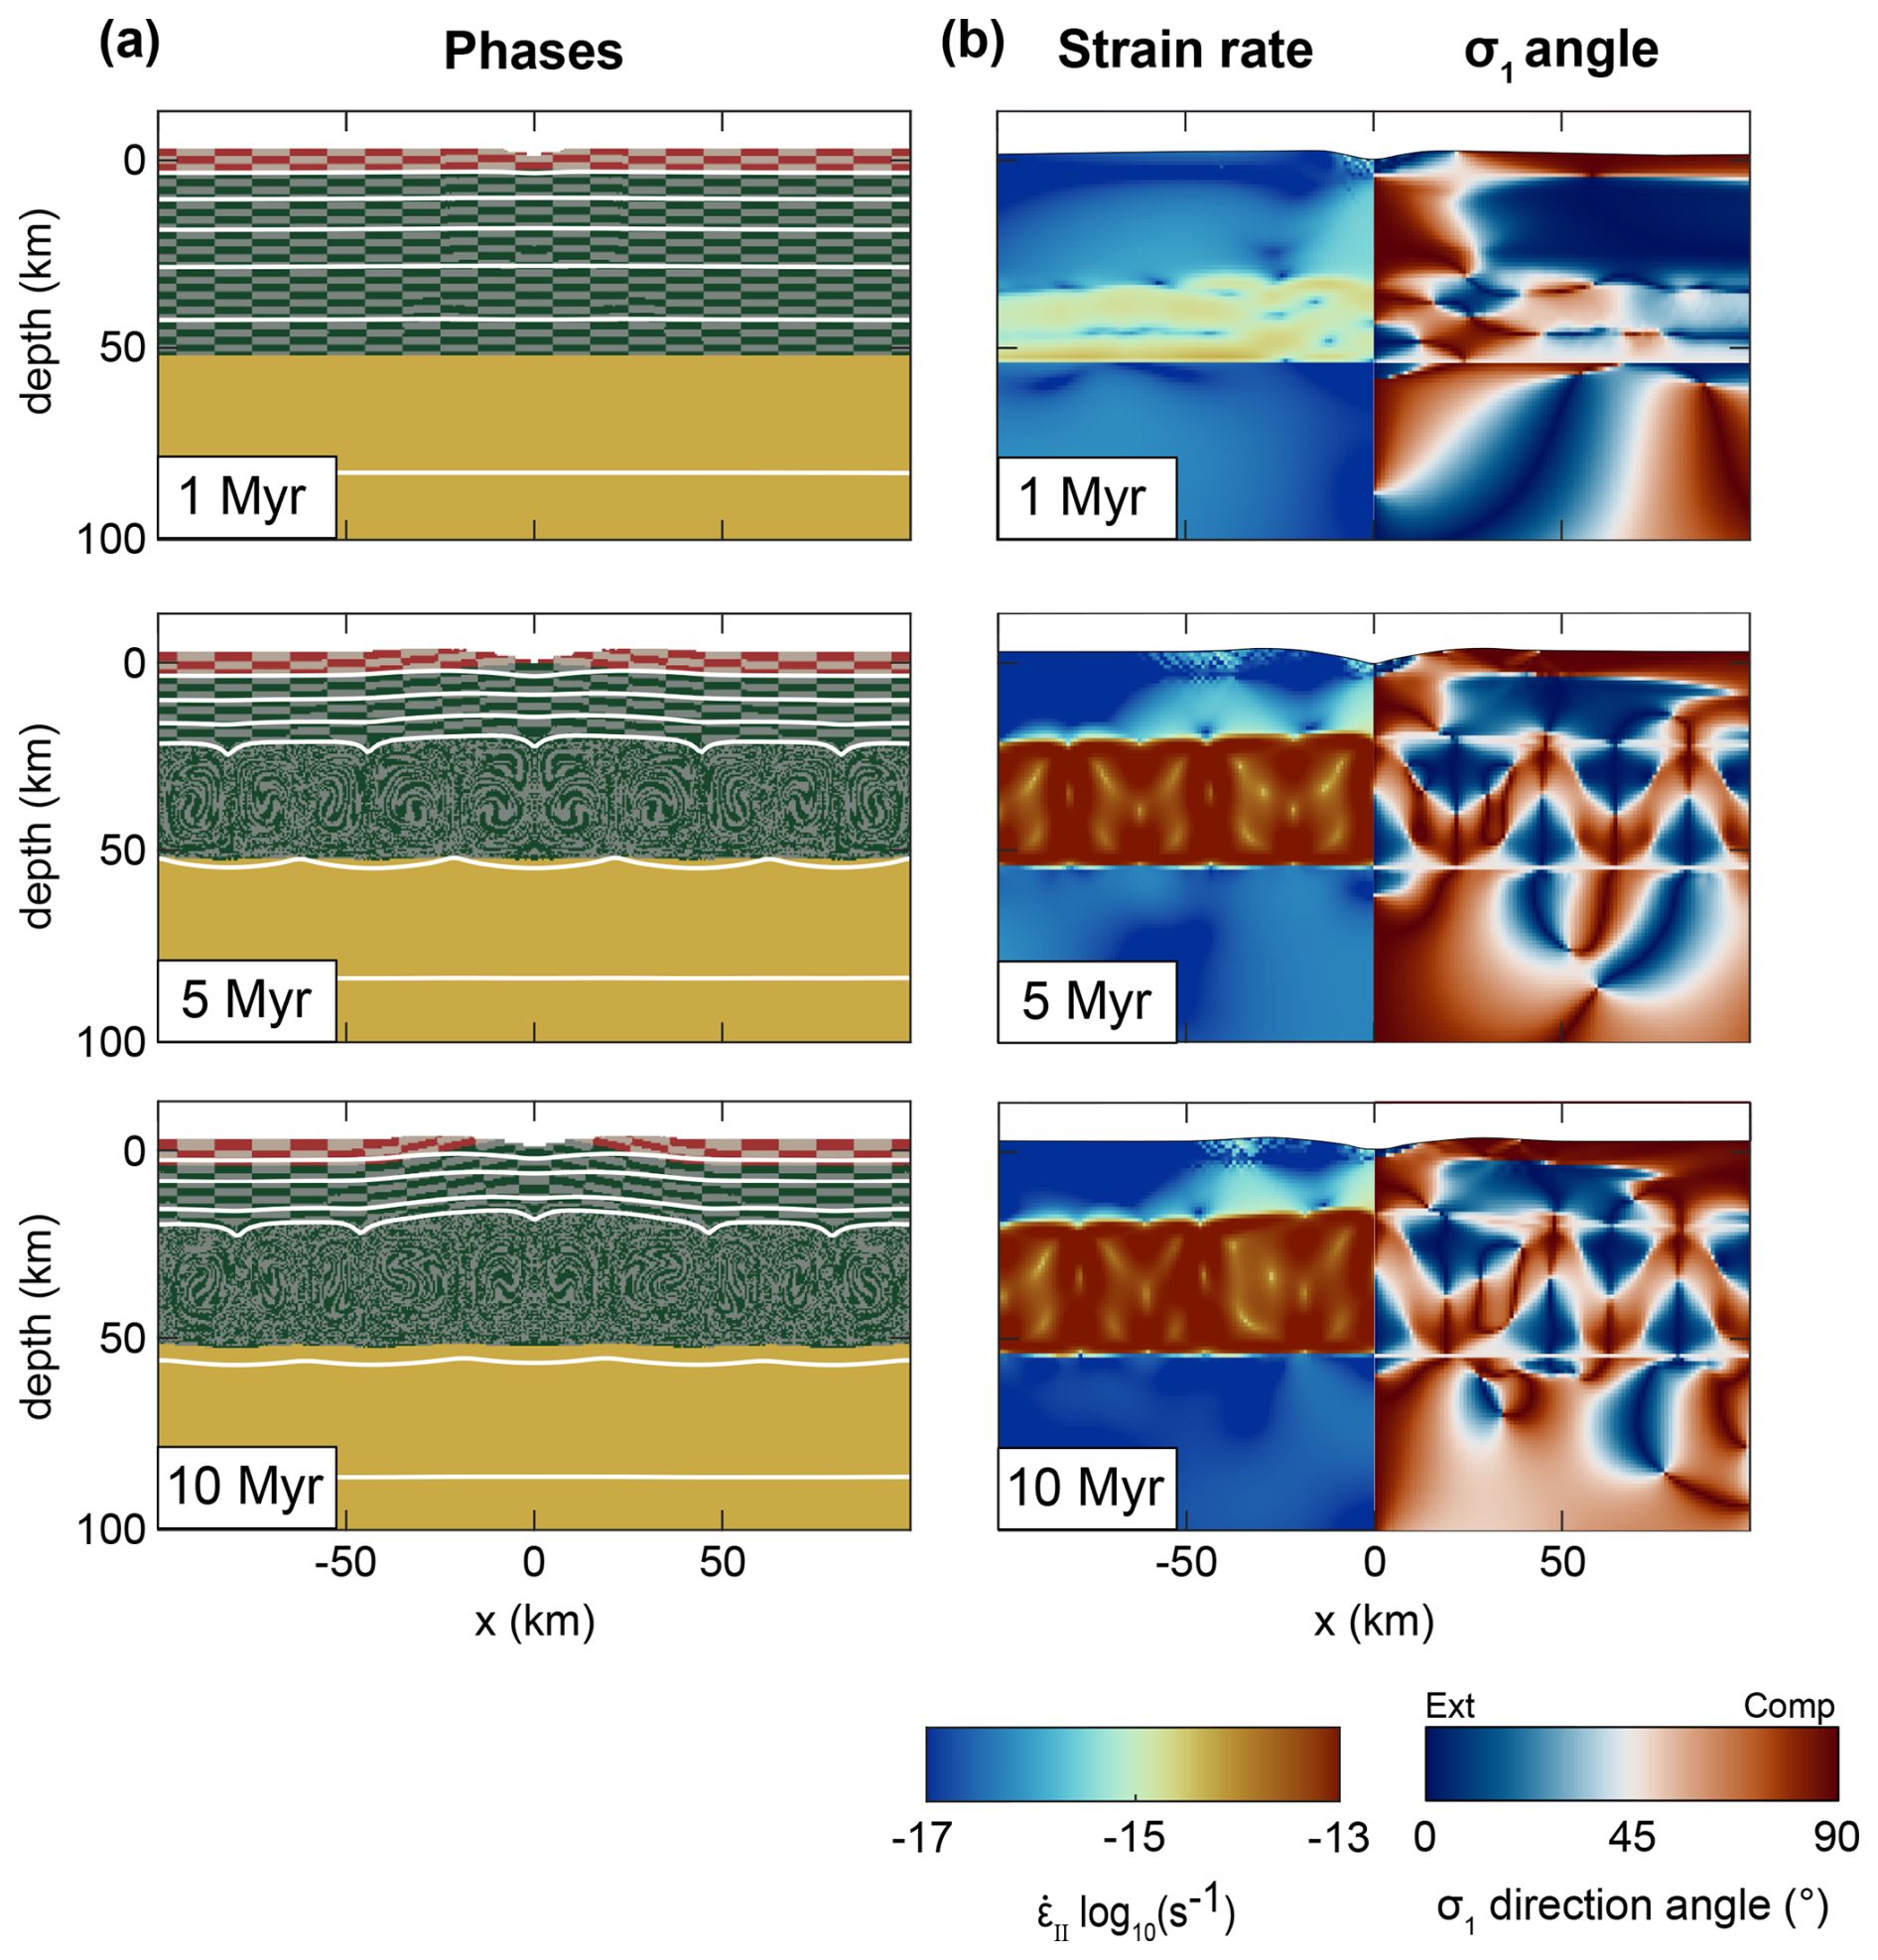
Figure 4Time evolution of the reference model after 1, 5, and 10 Myr. (a) material and thermal evolution. White lines represent each 200 °C isotherm. The color legend is the same as in Fig. 2b. (b) Left: evolution of the second invariant of the strain rate. Right: evolution of the angle between the maximum principal stress (σ1) and the vertical axis.
3.1.2 Crustal deformation and exhumation
Due to the presence of crustal convection, which obscures a clear visualization of the deformation patterns, our analysis focuses exclusively on the upper-crustal layers unaffected by convective motion. Valley incision induces crustal deformation and alters crustal strength. Over the 10 Myr of the simulation, the reference model exhibits significant upward motion of the lower crust, with 3.5 km of exhumation to the surface (Fig. 4a). The lower crust reaches the surface after 4.6 Myr (Fig. 3b). The upward motion of the lower crust is accompanied by the upward advection of isotherms, at a slower rate due to heat diffusion (Figs. 4a and S2a). Throughout the simulation, the Moho depth remains largely stable, with only minor variations associated with the onset of crustal convection.
Crustal motions result in a non-uniform spatial distribution of strain rates (Fig. 4b, left). Over time, strain rates remain largely diffuse within the non-partially melted portion of the crust. However, zones of elevated strain rates (> 10−16 s−1) develop within the viscous part of the non-melted crust, particularly beneath the center of the valley. After 5 Myr, this zone of localized high strain rates (up to 10−15 s−1) reaches a width of approximately 10 km (Fig. 4b. This high-strain-rate zone in the viscous part of the crust is associated with brittle deformation in the upper crust (i.e., above 6 km of depth), exhibiting similar spatial dimensions and strain rate values (Fig. 4b).
The analysis of the stress field and of the direction of the maximum principal stress (σ1) suggests that the brittle deformation in the center of the valley corresponds to extensional deformation, whereas the brittle zones further away from the valley center experience compressional deformation (Fig. 4b, right). In the viscous part of the crust, this is the opposite, with compressional deformation below the valley and extensional deformation 20–30 km away from the valley center (Fig. 4b, right). As the simulation progresses, the region of viscous compressional deformation beneath the valley center migrates upward, reducing the extent of extensional deformation near the surface (Fig. 4b, right). Elsewhere in the crust, the deformation pattern remains stable, with compressional deformation at the surface and extensional deformation at greater depths.
Partial melting is also important in the crust, as seen with the convection cells, and can reach values up to 60 % of rocks melted in this lower part of the crust (Fig. S2b). This fraction tends to decrease to 40 % after 10 Myr of simulation.
3.2 Parametric study
3.2.1 Individual impact of crustal thickness and plateau elevation
Although crustal thickness (H) and plateau elevation (hP) are closely linked, a given crustal thickness can correspond to different plateau elevations and vice versa (Fig. 2a).
Varying crustal thickness while maintaining a constant plateau elevation of 3 km has only a minor impact on the evolution of relief (Δh) (Fig. 5a). The main difference lies in the maximum relief, which reaches 3900 m for the thinner-crust model (H= 50 km) and 3300 m for the thicker-crust model (H= 60 km). This difference of 600 m is partly due to differences in the evolution of hmin. Indeed, in the thinner-crust model, the river reaches its base level after 5.5 Myr, whereas, in the thicker-crust model, hmin only decreases down to 400 m after 3.5 Myr (Fig. 5b).
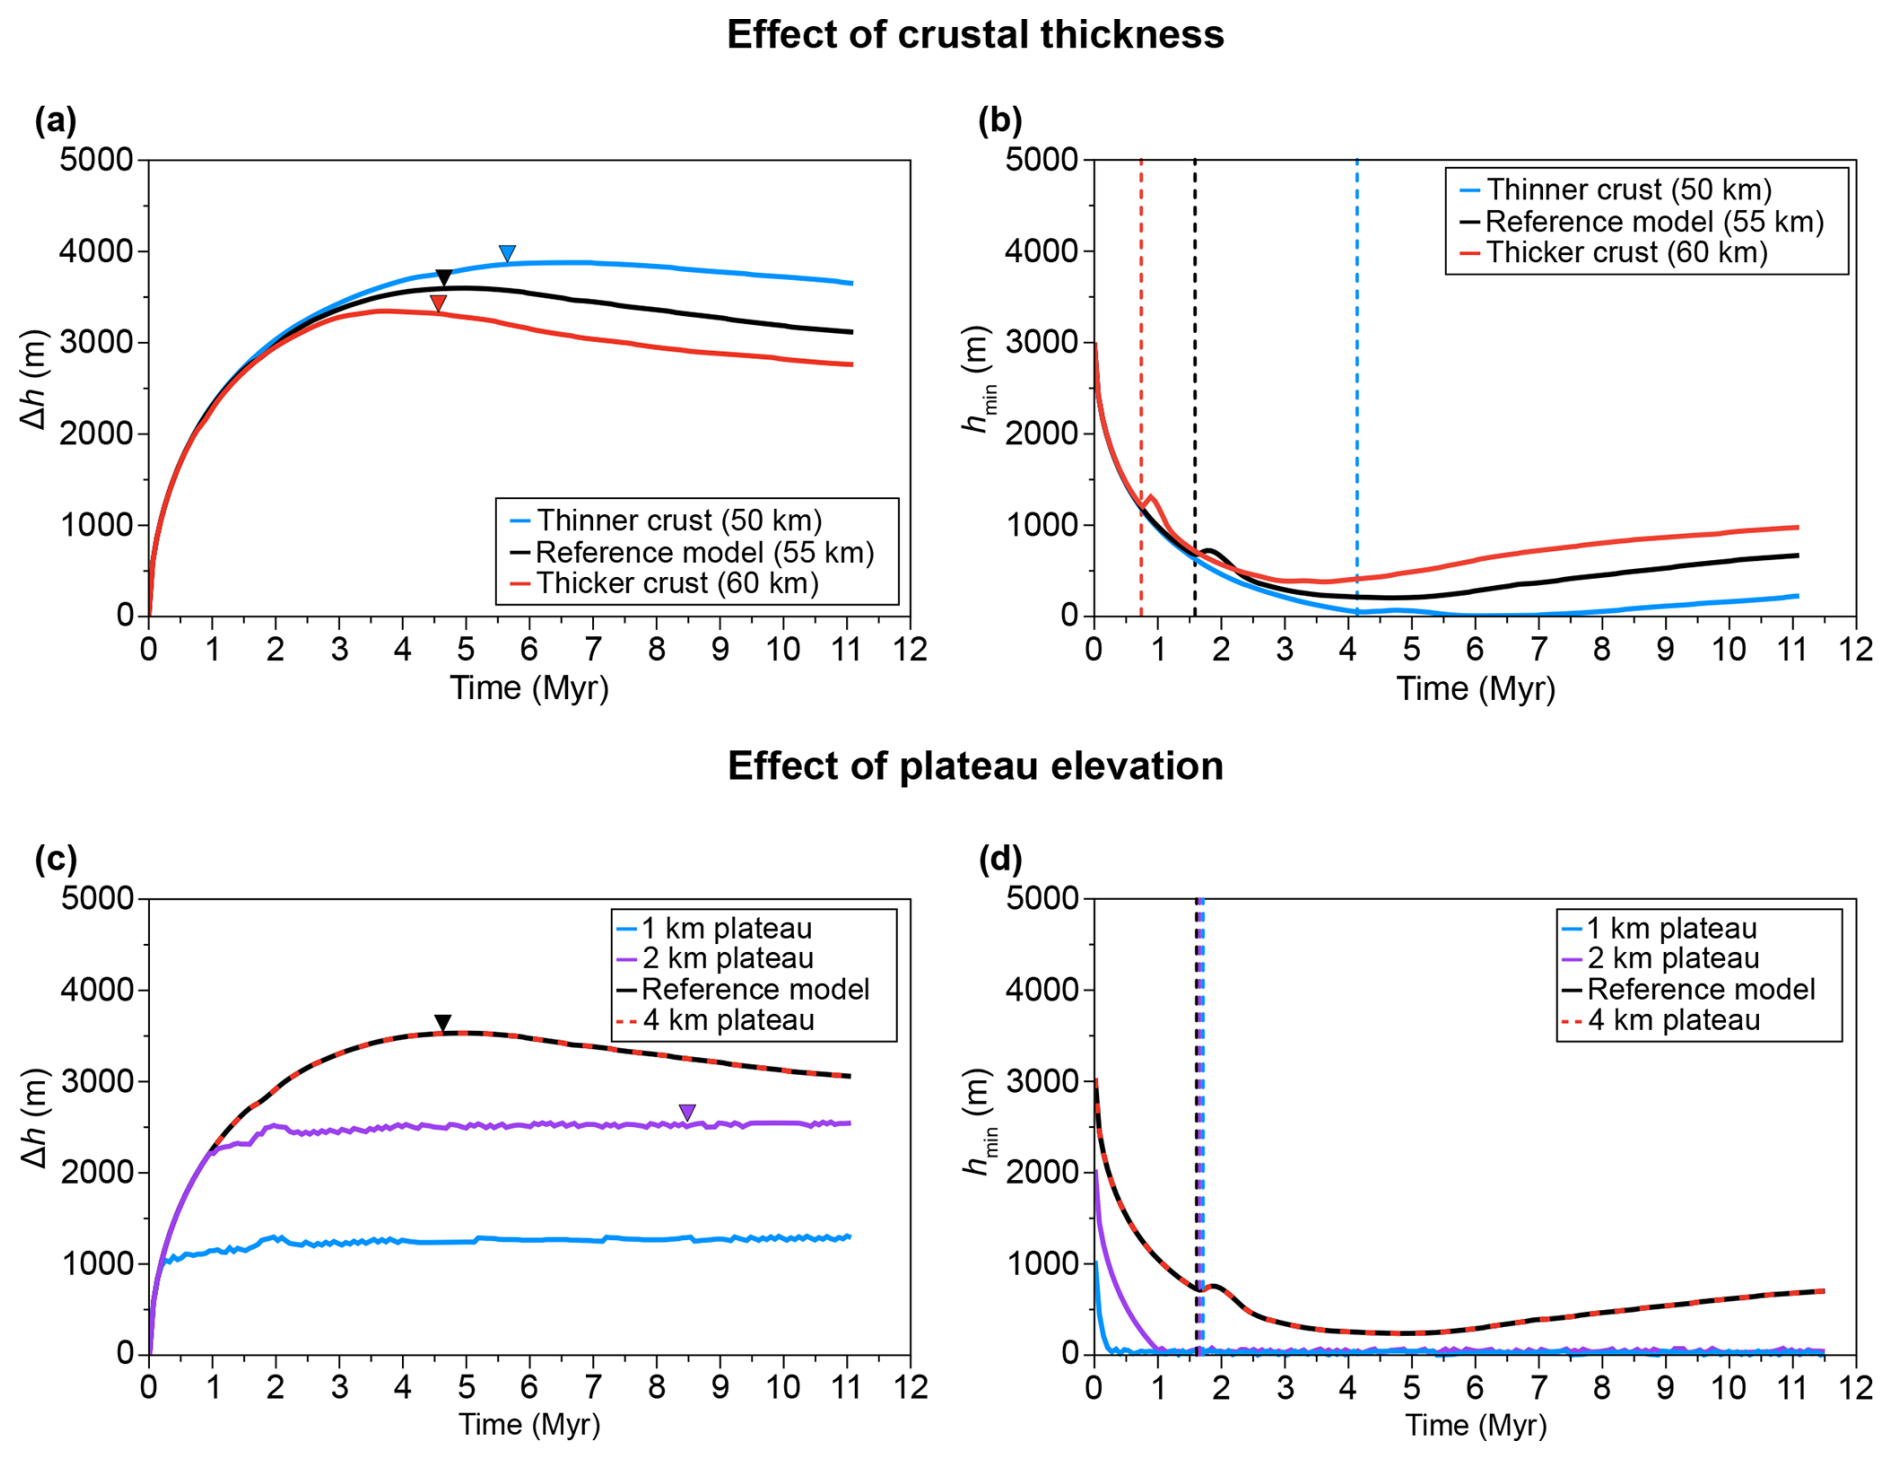
Figure 5Time evolution of Δh (left) and hmin (right) for models with different values of H (a, b) or different values of hP (c, d). For all models, the incision velocity (Vi) is fixed at 30 mm yr−1. Downward triangles represent the time when the lower crust is exhumed to the surface if it happens. Vertical dotted lines represent the time of the convection initiation within the crust.
Compared to the reference model, a model involving a thicker crust leads to a lower value of Δh. In such a model, the onset of exhumation to the surface of the lower crust is slightly earlier (4.6 Myr), and the river does not reach its base level (Fig. 5a and 5b). In contrast, the presence of a thinner crust has the opposite effect, leading to higher Δh values, a delayed onset of lower-crust exhumation to the surface (5.7 Myr), and a river reaching its base level (Fig. 5a and b).
Instead, varying the initial plateau elevation, and hence the erosion potential, while maintaining a constant crustal thickness of 55 km results in larger differences. Firstly, plateau elevation plays a key role in valley morphology. Models with a lower hP value enable the river to reach the base level (Fig. 5c and d). When hP= 1 km, the river reaches its base level in 200 kyr and remains at this altitude throughout the entire simulation (Fig. 5d). This has a major impact on the relief, with Δh not exceeding 1.2 km and remaining at this value for the duration of the simulation (Fig. 5c). A similar pattern is observed for the model where hP= 2 km, with differences in timing (the river reaches its base level at 1.1 Myr) and in the maximum Δh value, reaching 2.4 km. For hP≥ 3 km (i.e., including the reference model), the models behave identically, with the river being unable to reach its base level (Fig. 5c and d). Consequently, increasing the plateau elevation above 3 km, while keeping the same combination of incision velocity and crustal thickness (i.e., 30 mm yr−1 and 55 km), produces the same outcome (Figs. 5c, d and S3b).
In addition, the initial plateau elevation also significantly impacts lower-crust exhumation. In the model where hP= 1 km, the exhumation of the lower crust to the surface does not occur within the 10 Myr of the simulation (Fig. 5c). In the model where hP= 2 km, lower-crust exhumation is possible but occurs at 8.5 Myr. This is later than in the reference model (hP= 3 km) or for models with a higher plateau elevation (hP > 3 km), which all show the onset of lower-crust exhumation at 4.6 Myr.
3.2.2 Combined impact of crustal thickness and plateau elevation
Looking at the entire parametric study conducted for an incision velocity of 30 mm yr−1, the timing of lower-crust exhumation appears to be mostly influenced by the initial plateau elevation rather than the crustal thickness (Fig. 6a). Indeed, for models with hP≥ 4 km, exhumation occurs at 4.6–4.7 Myr, while models with hP < 1 km do not exhume lower crust over 10 Myr of simulation time. For intermediate hP of 2–3 km, we observe an abrupt change in the timing of lower-crust exhumation, with a certain sensitivity to crustal thickness as well (i.e., a thinner crust leading to a delayed exhumation time). For instance, at hP= 2 km, exhumation time varies from more than 10 to 6.9 Myr, by varying H from 45 to 60 km. A similar trend can be depicted at hP= 3 km, with a range of 5.7 to 4.6 Myr when varying H between 50 and 65 km.
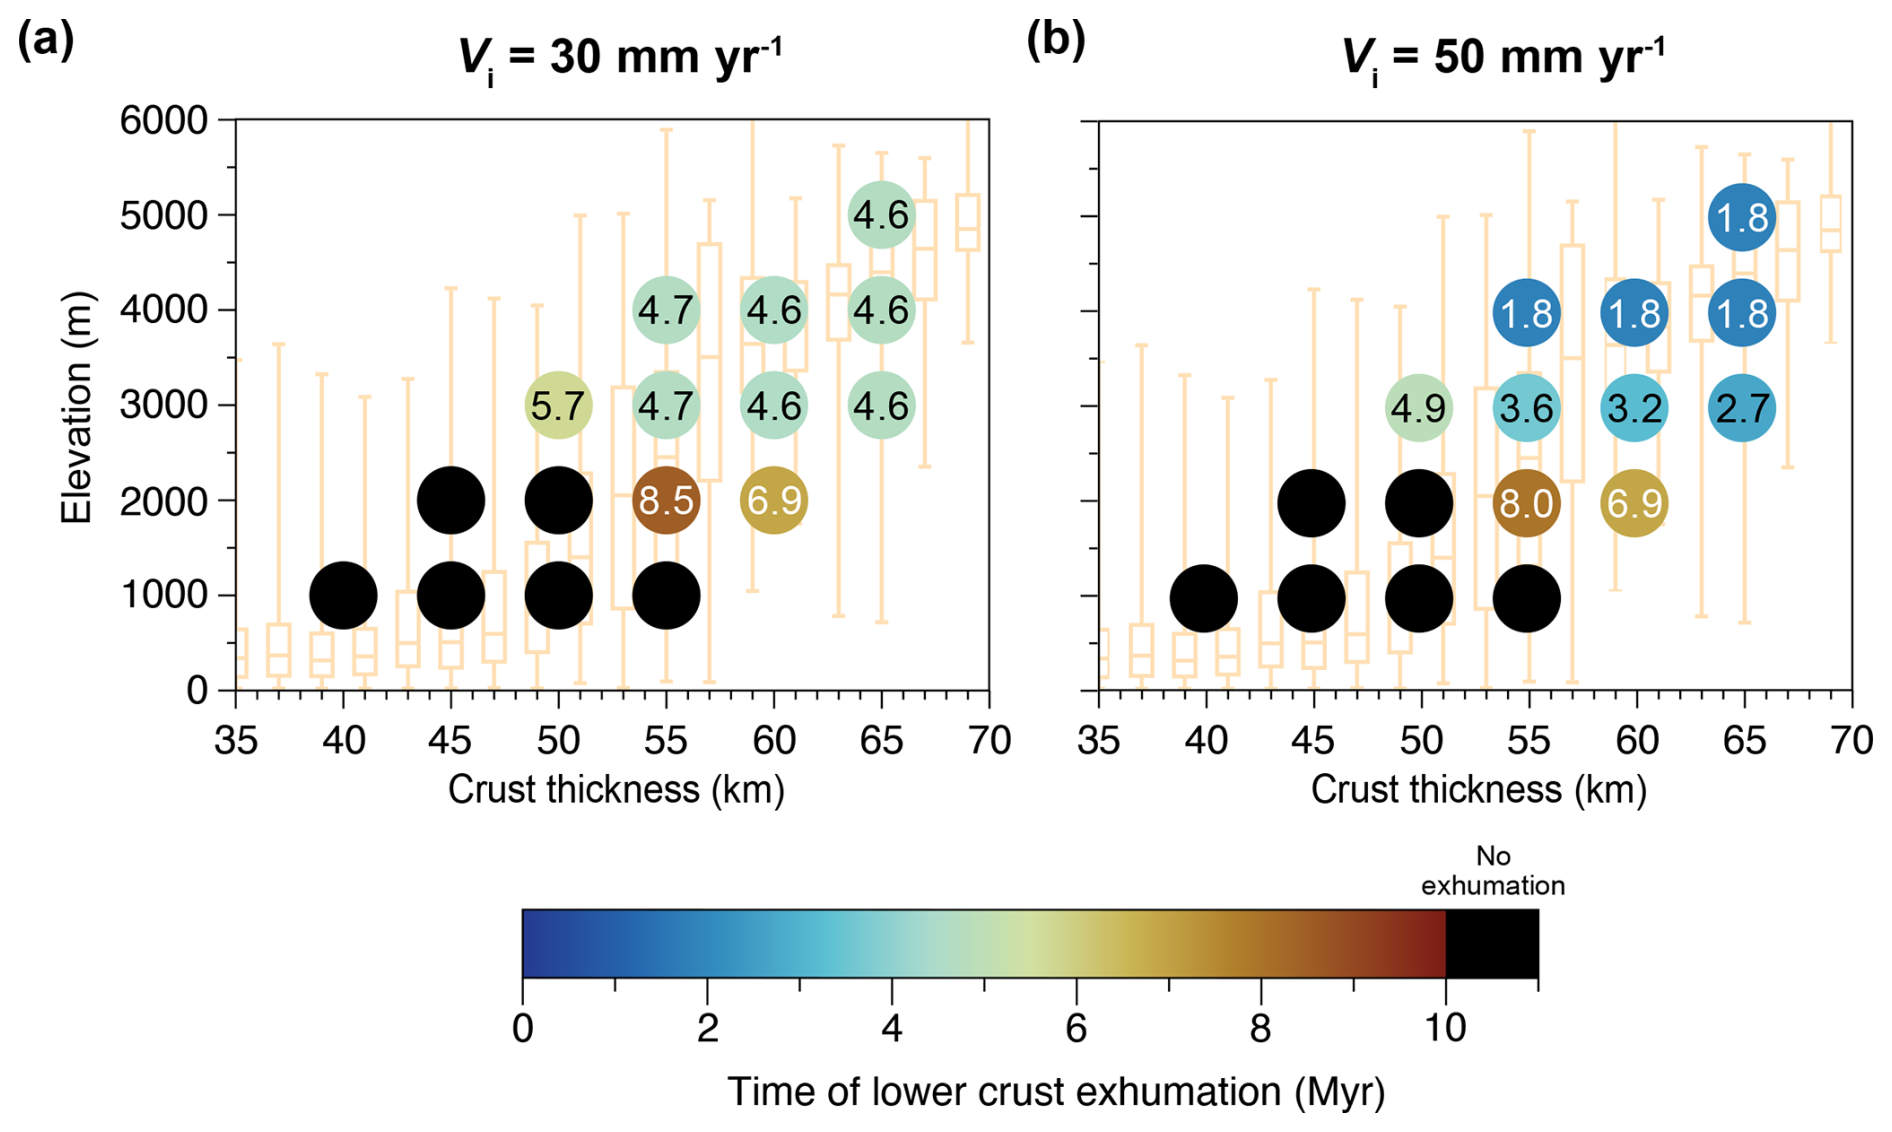
Figure 6Time for the exhumation to the surface of lower crust, with (a) Vi= 30 mm yr−1 and (b) Vi= 50 mm yr−1. Values presented inside the circles are in Myr. The models with Vi= 10 mm yr−1 are not presented due to the absence of lower-crust exhumation in all models in the 10 Myr time frame.
Apart from this difference in timing of the lower-crust exhumation, the overall dynamics of the models are similar to those in the reference model for the tested values of hP and H (Figs. S4 and S5). In terms of strain rate patterns, changes in crustal thickness or plateau elevation do not significantly alter the results either. The primary effect is a variation in strain rate magnitude that increases with an increase in crustal thickness and an increase in the initial plateau elevation (Figs. S4 and S5).
3.2.3 Individual impact of the imposed incision velocity
Two different incision velocities (10 and 50 mm yr−1) were tested on the same set of model combinations as in the previous section with 30 mm yr−1. Results show that the observed strain rate pattern and the deformation regime of the model remain almost the same as in the reference model (Fig. S6).
Incision velocity also plays a crucial role in the timing of lower-crust exhumation to the surface. With an incision velocity of 10 mm yr−1, no exhumation occurs within the 10 Myr time frame. With an incision velocity of 50 mm yr−1, the conditions leading to lower-crust exhumation to the surface within the 10 Myr time frame (Fig. 6b) remain similar to those obtained for an incision velocity of 30 mm yr−1 , even if exhumation of the lower crust occurs systematically earlier.
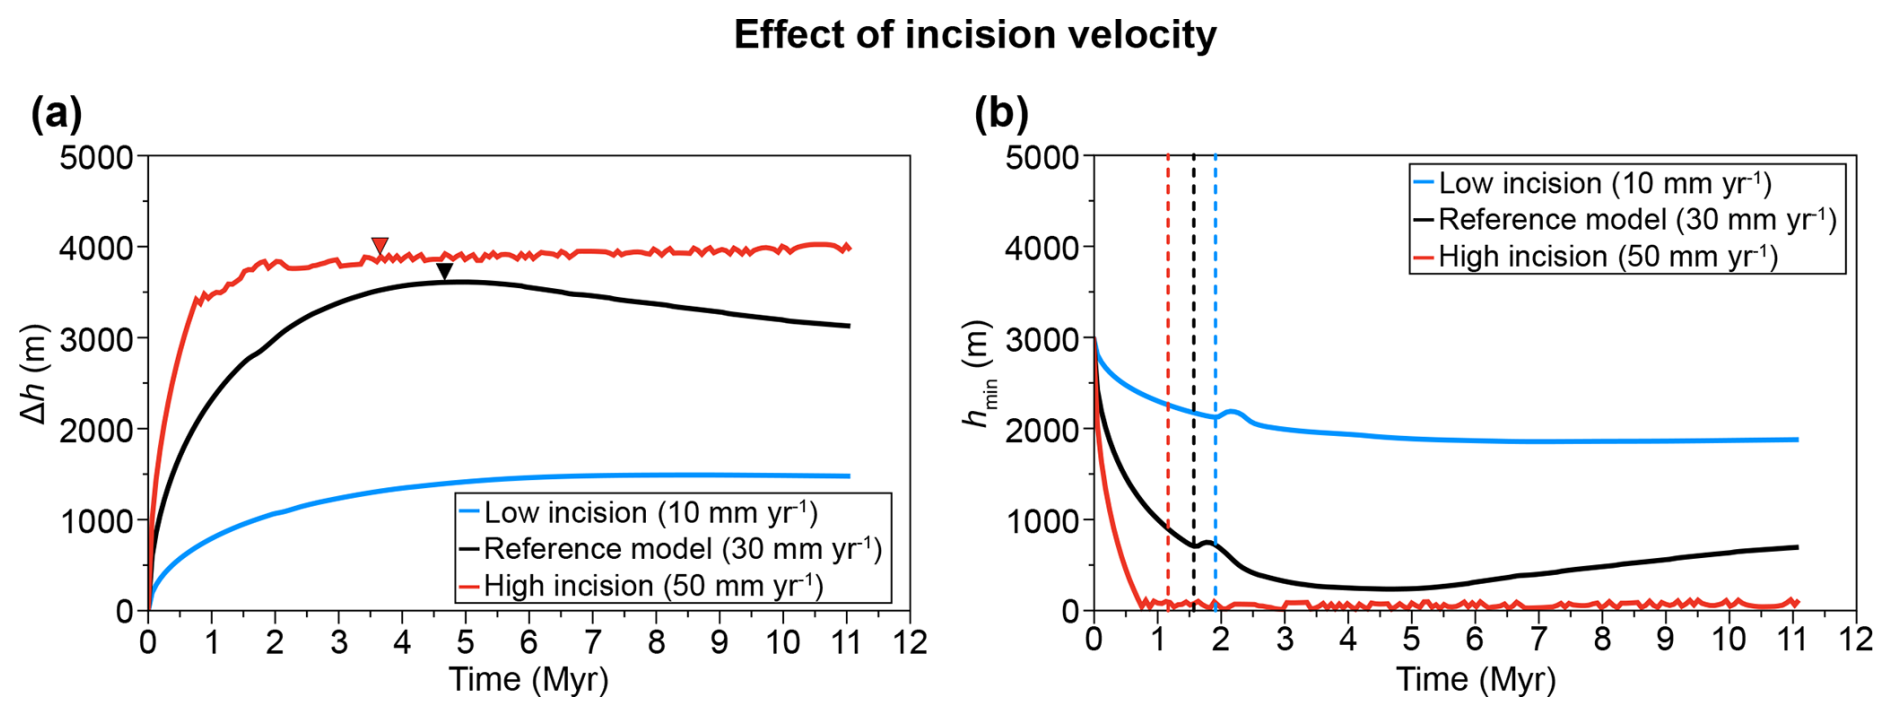
Figure 7Time evolution of Δh (a) and hmin (b) for models with different initial incision velocity. For all models, the values of hP and Hare fixed at 3 and 55 km, respectively. Downward triangles represent the time when the lower crust is exhumed to the surface if it happens. Vertical dotted lines represent the time of the convection initiation within the crust.
Incision velocity also has a significant impact on valley morphology and lower-crust exhumation (Fig. 7a). As expected, incision velocity directly influences the river's ability to reach its base level. Keeping the same combination of crustal thickness and plateau elevation to that in the reference model, the river fails to reach its base level in both the low-incision and reference models, whereas it successfully reaches its base level in the high-incision model (Fig. 7b). Consequently, the evolution of Δh is closely tied to the capacity for the river to reach its base level. In the high-incision model, Δh reaches a plateau after around 1 Myr, which roughly corresponds to the time when the valley floor reaches the base level (Fig. 7b). Thereafter, Δh remains nearly stable over time, exhibiting only a slight increase accompanied by minor oscillations, which correspond to fluctuations in hmin. In contrast, for the other two models, Δh evolution is therefore not limited by the river base level and evolves according to the combination of imposed surface processes and crustal response (Fig. 7a).
Incision velocity also plays a crucial role in the timing of lower-crust exhumation to the surface. In the low-incision model, no exhumation occurs within the 10 Myr time frame, whereas, in the high-incision model, exhumation begins earlier (at 3.6 Myr) than in the reference model.
4.1 Effective erosion and comparison to natural river erosion
As explained in Sect. 2.5, the incision velocity does not directly correspond to the calculated effective erosion. The evolution of effective erosion can be divided into two distinct phases (Fig. S7): (1) the initial phase (<1 Myr), when most models exhibit a rapid decrease in Eeff (Figs. S7 and 3c), and (2) a stabilization phase (>1 Myr), when effective erosion values tend to a steady state (Figs. S7 and 3c).
During the initial phase, the mean value of Eeff, ranging from 2 to 10 mm yr−1, is highly dependent on the imposed incision velocity, between 10 and 50 mm yr−1, for hP= 3 km and H= 55 km. This phase derives from two different behaviors of our models: (i) for models that do not reach the base level within 1 Myr (see Fig. S3), the observed decrease in Eeff is mainly driven by the action of topographic diffusion. In addition, this timescale of 1 Myr roughly corresponds to the diffusion timescale , ranging between 0.6 and 1.6 Myr for a valley width (W) varying between 30 and 50 km, respectively. Importantly, the decrease in effective erosion due to the topographic diffusion does not change the total volume of eroded material over time. (ii) For models in which the valley reaches the valley base level in less than 1 Myr (see Fig. S3), the decrease in Eeff is primarily controlled by the base level. Once the valley reaches the base level, incision can no longer proceed, leading to a significant reduction in effective erosion. During this initial phase, the tectonic response to incision can be considered negligible with respect to the decrease in effective erosion.
During the stabilization phase, the mean Eeff values range from 0.1 to 2 mm yr−1 (Fig. 8). This steady-state phase results from the tectonic response to incision. The development of a vertical crustal flow beneath the valley brings deeper crustal material to the surface, uplifting the river above the base level and enabling its incision to persist. Therefore, while Vi remains a key factor, hP and H also influence long-term effective erosion values (Fig. 8).
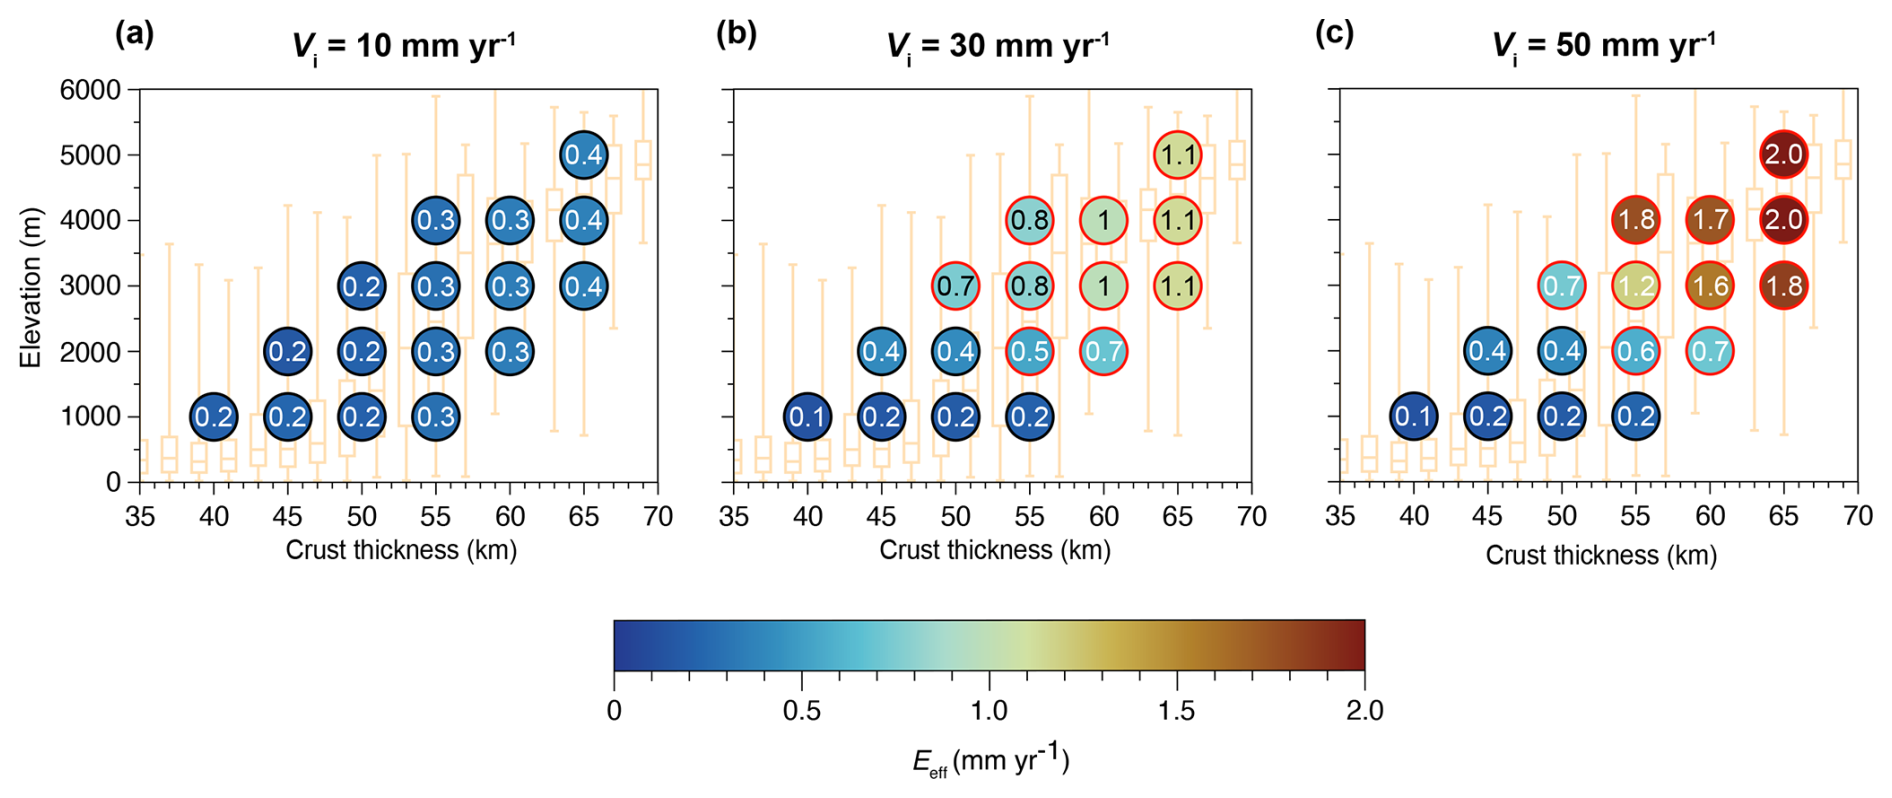
Figure 8Mean values of the effective erosion velocity (Eeff) between 1 and 10 Myr for each model, with (a) Vi= 10 mm yr−1, (b) Vi = 30 mm yr−1 , and (c) Vi= 50 mm yr−1. Values presented inside the circles are in mm yr−1. Black contours represent models with no exhumation of the lower crust in the 10 Myr time frame. Red contours represent models presenting lower-crust exhumation in the 10 Myr time frame.
Natural valley incision rates can vary significantly due to differences in environmental settings, such as climatic conditions, drainage basin area, or lithology. Another factor contributing to these variations is the timescale over which incision rates are calculated or observed, as shorter- or longer-term measurements can lead to different estimates of incision rates (e.g., Finnegan et al., 2014; Gallen et al., 2015, 2015; Mills, 2000). Recent studies have explored the relationship between incision rate values and the timescales over which they are measured, using datasets of river incision rates from various locations on Earth (Nativ and Turowski, 2020). This relationship indicates that, for timescales shorter than 1 Myr, incision rates range from 0.01 to 5 mm yr−1, with an average of 0.4 mm yr−1. For timescales exceeding 1 Myr, incision rates range from 0.01 to 1 mm yr−1, with an average of 0.08 mm yr−1.
In our models, during the first Myr, effective erosion rates tend to be slightly higher than those observed in natural settings for this timescale. Notably, models with incision velocities of 50 mm yr−1 yield mean effective erosion rates of 10 mm yr−1 (Fig. S7). Beyond 1 Myr, our models rarely produce effective erosion rates exceeding a threshold of 1.1 mm yr−1 (Fig. 8). Only a limited number of simulations with an incision velocity of 50 mm yr−1 exceed this threshold (Fig. 8c).
4.2 Crustal deformation and lower-crust exhumation
Using visco-elasto-plastic models, Vernant et al. (2013) investigated the role of isostatic rebound induced by erosion in low-convergent mountain ranges. In their study, they performed some models without imposing tectonic boundary conditions and demonstrated that, in this context, erosion can induce regional uplift and contribute to maintaining mountain elevation. More importantly, the deformation regime observed in their models is very close to that obtained in our simulations, with erosion leading to horizontal extension in the uppermost kilometers of the crust and to horizontal compression at greater depths (Fig. 4). This superficial extensional deformation is associated with plastic deformation and faulting in both models. Furthermore, the spatial pattern of crustal motion in both studies is similar, with intense vertical flow concentrated in the center of the model where erosion is applied, decreasing progressively away from the erosion zone and ultimately leading to downward (negative) vertical flow at greater distances (Fig. 9b). This vertical crustal flow is associated with the isostatic rebound induced by erosion, as mantle flow patterns in their study also highlight a vertical component. Similarly, our models show that valley incision can generate substantial vertical crustal flow, reaching values of nearly 0.8 mm yr−1 at the center of the valley in the reference model (Fig. 9a). An interesting feature observed in our models is that surface uplift can be decoupled from the lithospheric response and that crust–mantle decoupling explains why the Moho remains stable while the lower crust migrates toward zones of lower pressure. This result can potentially explain the low effective elastic thickness (EET) often inferred from the isostatic response of the lithosphere to surface processes (Champagnac et al., 2007). At the global scale, EET values typically range between 30 and 80 km, reflecting a coupled mantle–crust system (e.g., Tesauro et al., 2012). However, in orogenic settings, EET values used to model uplift induced by erosion are generally significantly lower, often around 10 km (Champagnac et al., 2007). These low EET values likely reflect the mechanical behavior of the crust alone, rather than that of the entire lithosphere. This discrepancy helps to explain why erosion-induced uplift in orogens is best matched by low EET values. In such settings, the lower crust is fully ductile, enabling it to accommodate surface unloading without requiring a whole-lithosphere isostatic adjustment.
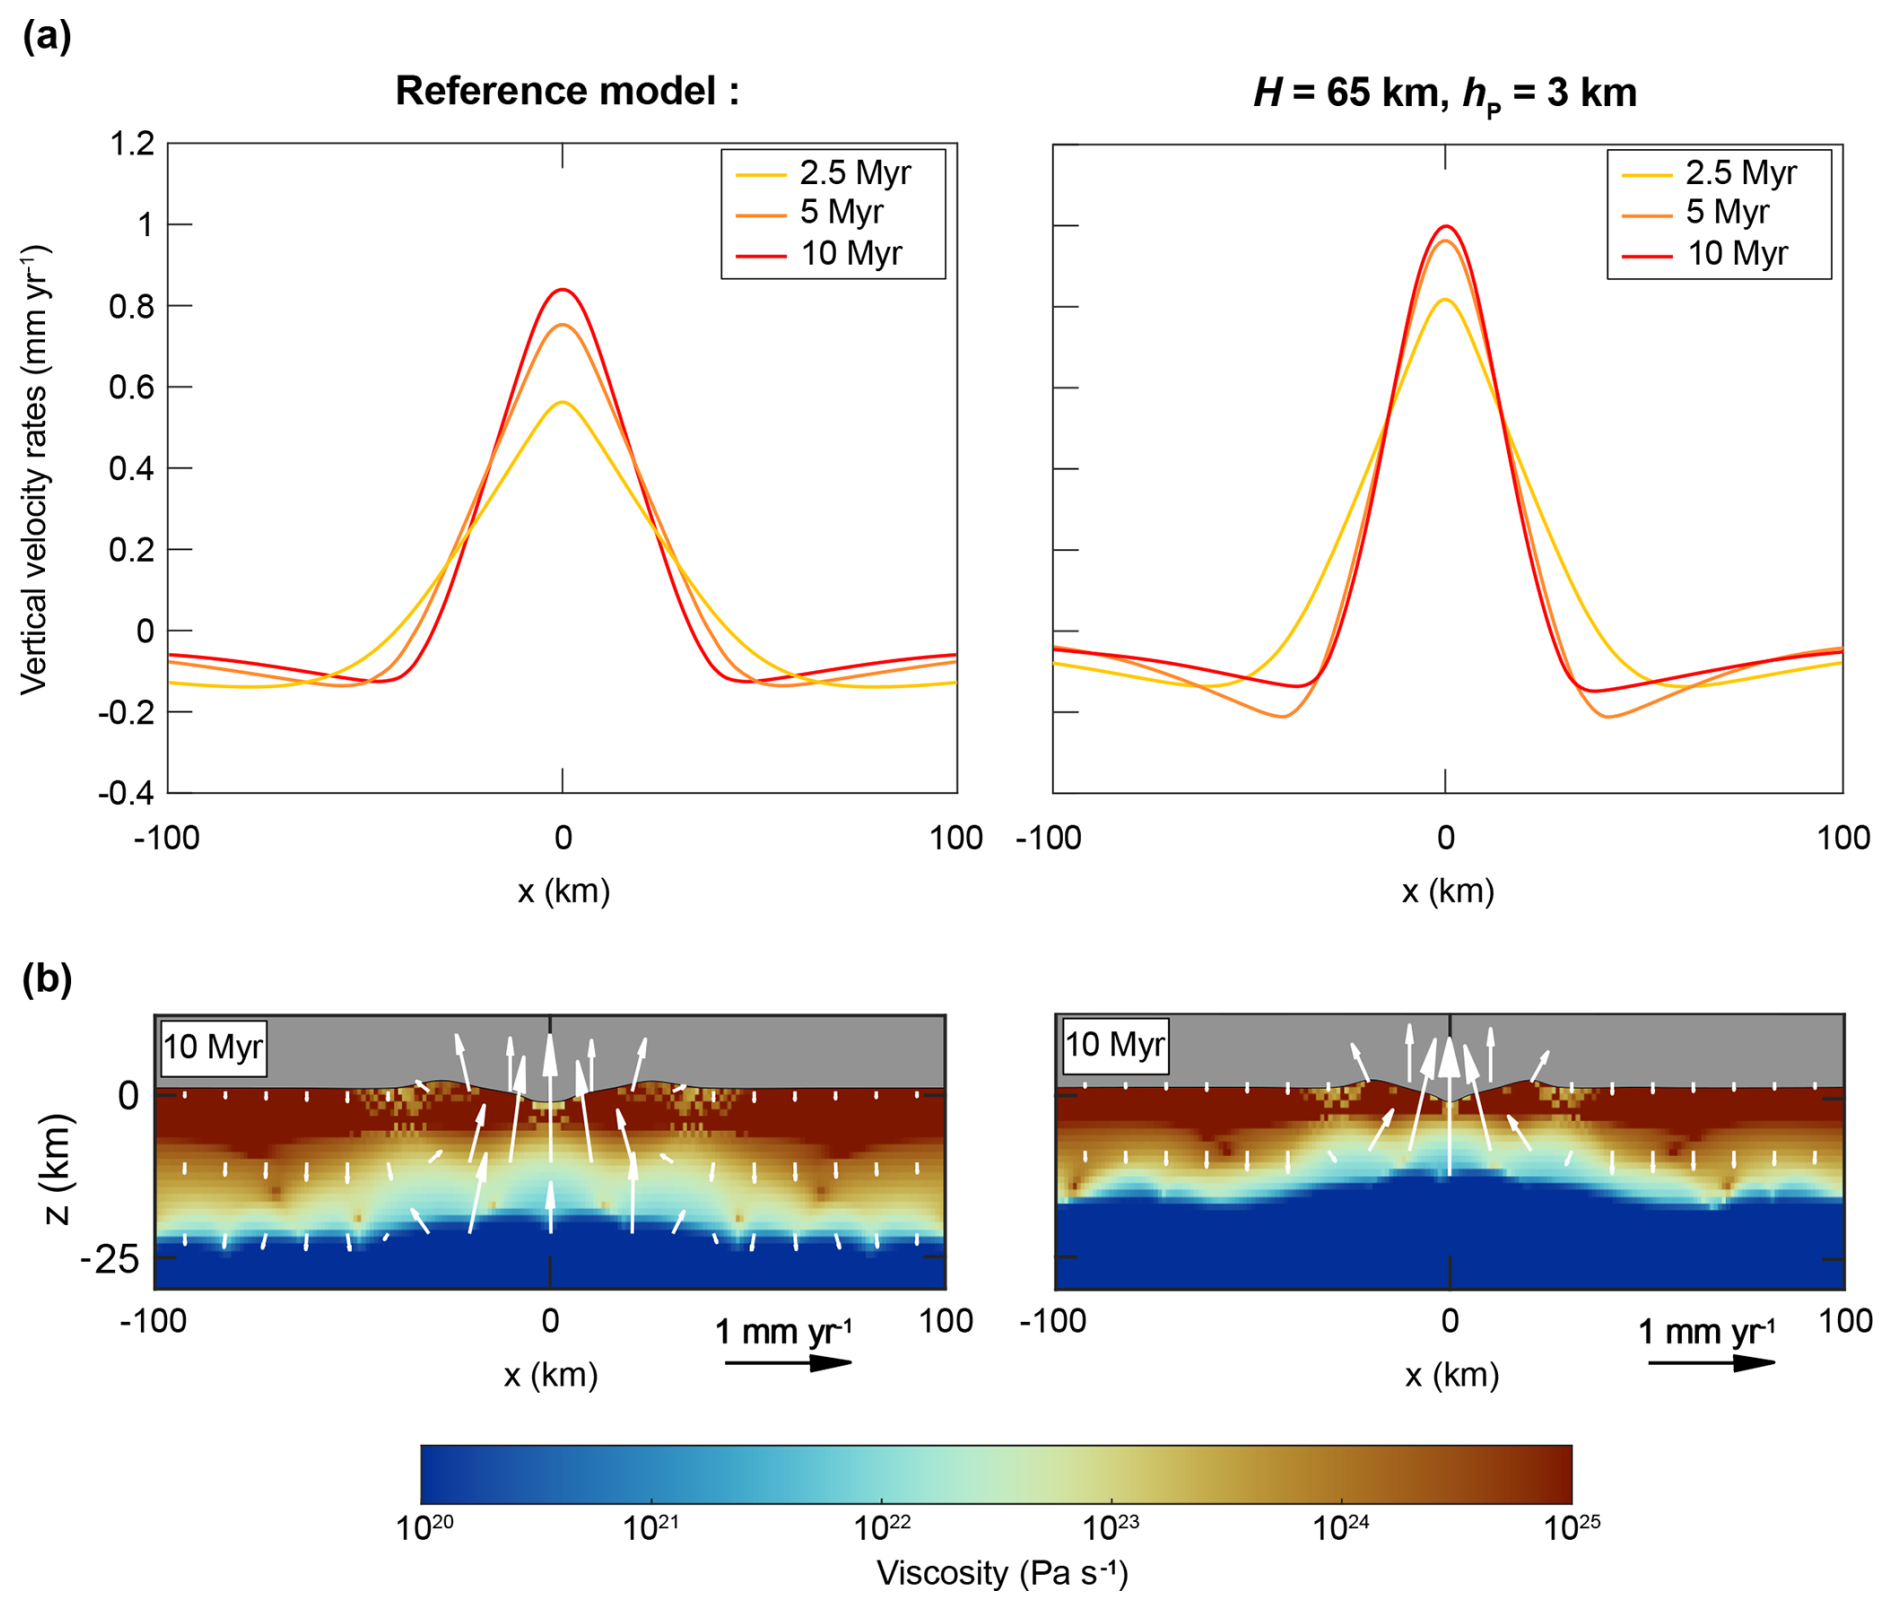
Figure 9(a) Vertical velocity at z= -5 km for different time steps for the reference model with H= 55 km (left) and for the model with H= 65 km (right). (b) Viscosity distribution for the reference model (left) and for the model with H= 65 km (right) after 10 Myr. White arrows represent the velocity field. We only show velocity field within the non-partially melted part of the crust to enhance visibility and clarity.
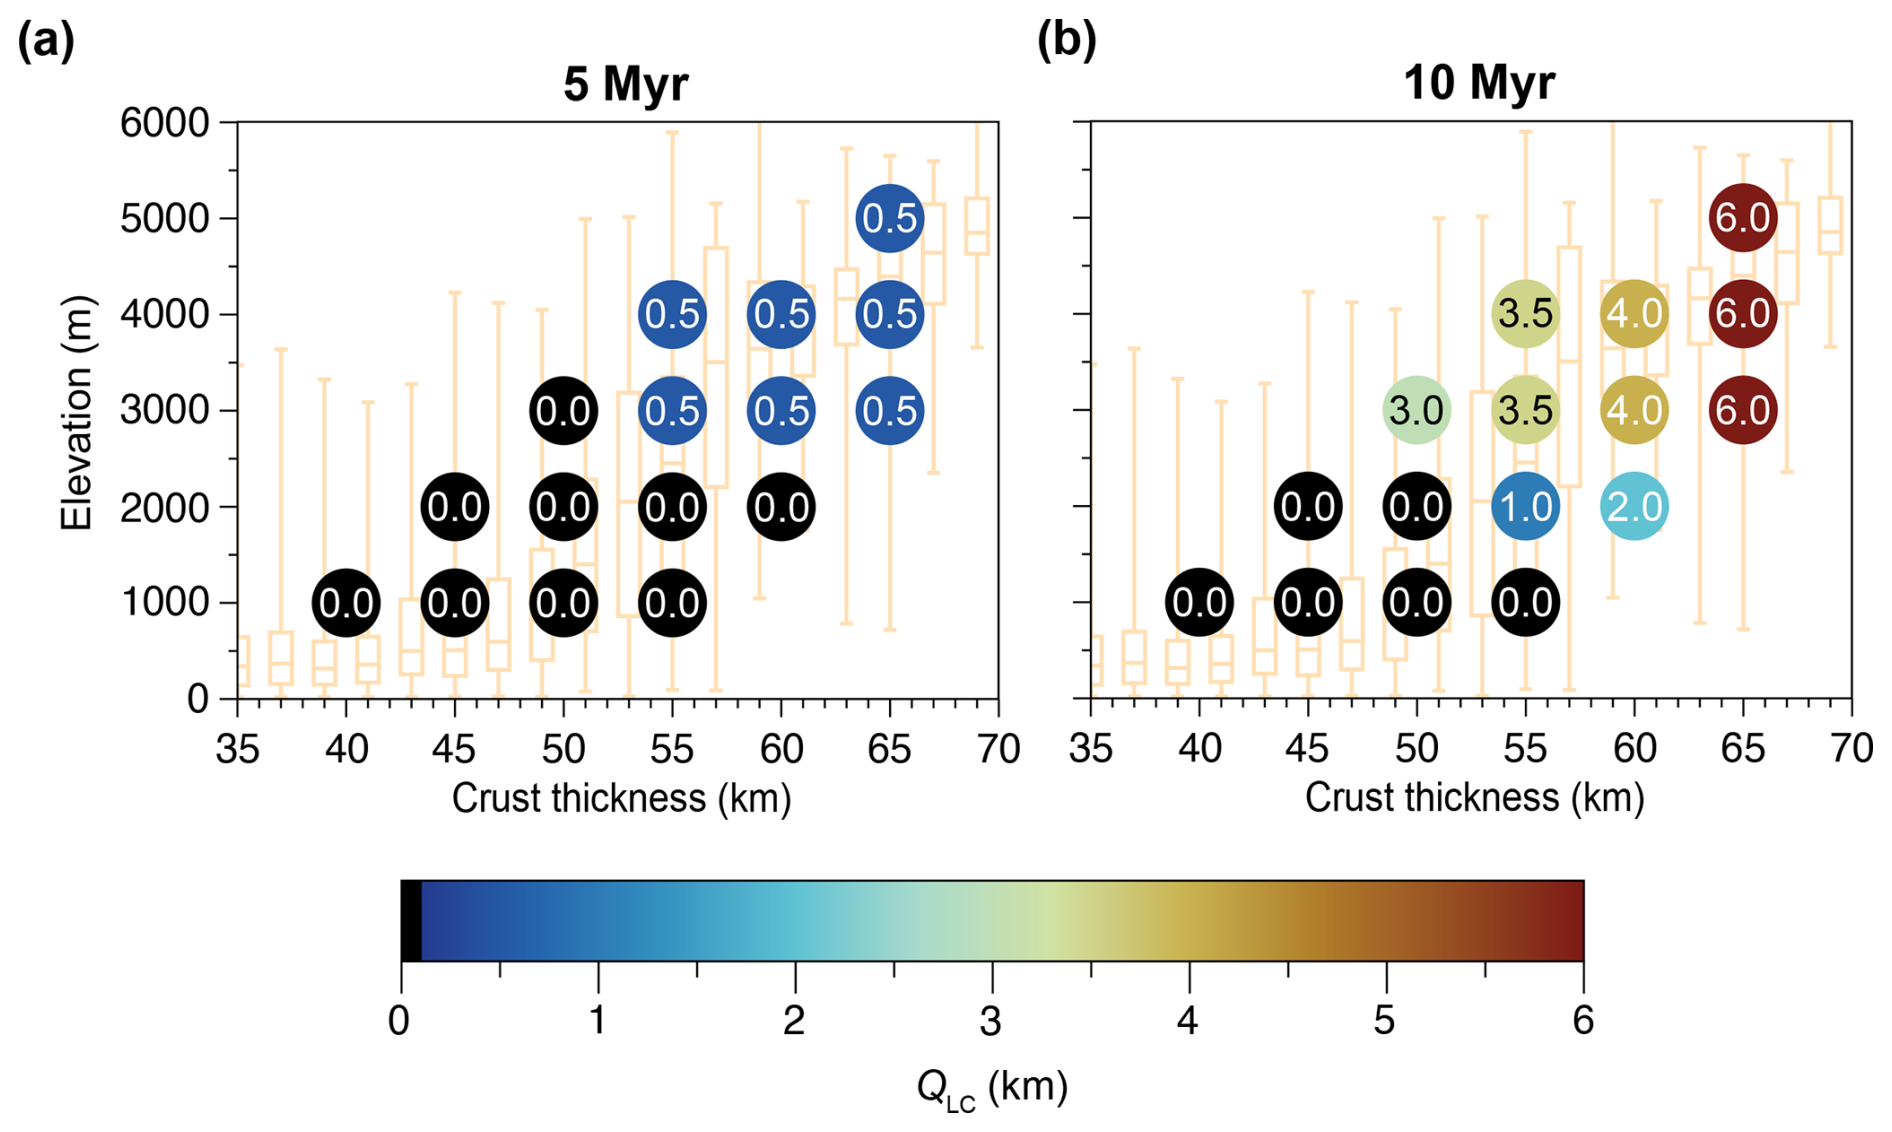
Figure 10Amount of exhumed lower crust in the center of the valley (QLC) for the models with Vi= 30 mm yr−1 after (a) 5 Myr and (b) 10 Myr of simulation. Values presented inside the circles are in km.
This vertical motion of the crust promotes the rise of low-viscosity material toward the surface (Fig. 9b). Despite some differences in the processes responsible for initiating crustal motion, these similarities suggest that, whether erosion is applied to an already elevated mountain range (Vernant et al., 2013) or results from localized valley incision (as in our case), the resulting crustal deformation exhibits comparable patterns. In the former case, erosion contributes to maintaining mountain elevation, while, in our models, it promotes valley relief development and lower-crust exhumation.
The amount of exhumed lower crust at the center of the valley (referred to as QLC hereafter) is highly sensitive to the input parameters of our models (Fig. 10). Indeed, exhumation of the lower crust, reaching 6 km of depth below the model surface, firstly depends on vertical incision of the valley bottom. Lower-crust exhumation is firstly favored by the incision velocity Vi and the effective erosion rate Eeff but is bounded by plateau elevation hP, which sets the erosion potential. For instance, models with a 5 km high plateau relative to base level can exhume over 6 km of depth simply by erosion. To reach lower-crust material, valley incision is therefore not sufficient, and a vertical uplift of the valley bottom above the base level is required to continue erosion. This second process, as previously discussed, depends on the upward velocity of viscous flow below the valley and, in turn, on the effective viscosity of the lower crust. All other things being equal, increasing crustal thickness H, and in turn the ductile lower-crust thickness, decreases this viscosity and increases the velocity of the upward flow (Fig. 9b). A more rapid upward flow increases effective erosion rates and shortens the time required to exhume lower-crust material. To illustrate the importance of the ductile lower-crust thickness, we performed two additional models. In the first one, we reduced the radiogenic heat production of the crust, resulting in an initially colder thermal structure (i.e., 800 °C at the Moho). In the second one, we applied a different rheology for the lower crust, using the Maryland Diabase flow law (Mackwell et al., 1998) (see Figs. S8 and S9 for thermal and rheological parameters). Both configurations result in a stronger/thicker upper crust and a thinner, ductile lower crust (Figs. S8a and S9a). These models show that lower-crustal exhumation is significantly reduced under these conditions, with exhumation occurring only after approximately 50 Myr of simulation time at best (Figs. S8b and S9b). These results emphasize the critical role of the ductile lower-crustal thickness in enabling exhumation: a thinner ductile layer substantially delays lower-crustal exhumation or, in some cases, inhibits it entirely.
Therefore, if hP and Vi mostly control the onset of lower-crust exhumation, in particular for the most elevated plateaux, the amount of lower-crust exhumation after a few million years is tightly linked to viscous flow of the lower crust in response to incision and, in turn, to H and the ductile lower-crust thickness.
4.3 Application to natural settings: the conditions required for valley incision to exhume lower crust
Our models allow us to determine the conditions leading to the exhumation of lower-crust material when a continental crust is submitted to valley incision only. In this configuration, exhumation of lower crust is only possible
-
for high initial plateau elevation (i.e., for a value of hP≥ 2 km over a 10 Myr time frame). Over a 5 Myr time frame, this threshold increases to 3 km.
-
for high crustal thickness (i.e., if H > 50 km over 10 Myr). Over 5 Myr, the threshold increases to 55 km.
-
for an erosion rate above 0.5 mm yr−1 over 10 Myr, with a threshold increasing to 0.8 mm yr−1 over 5 Myr.
Using these criteria, we can compare our findings to natural river systems on Earth associated or not associated with lower-crust exhumation (Fig. 11). We emphasize that no natural setting perfectly matches the boundary conditions and setup of our models, which in turn leads to a certain degree of interpretation when comparing models with data.
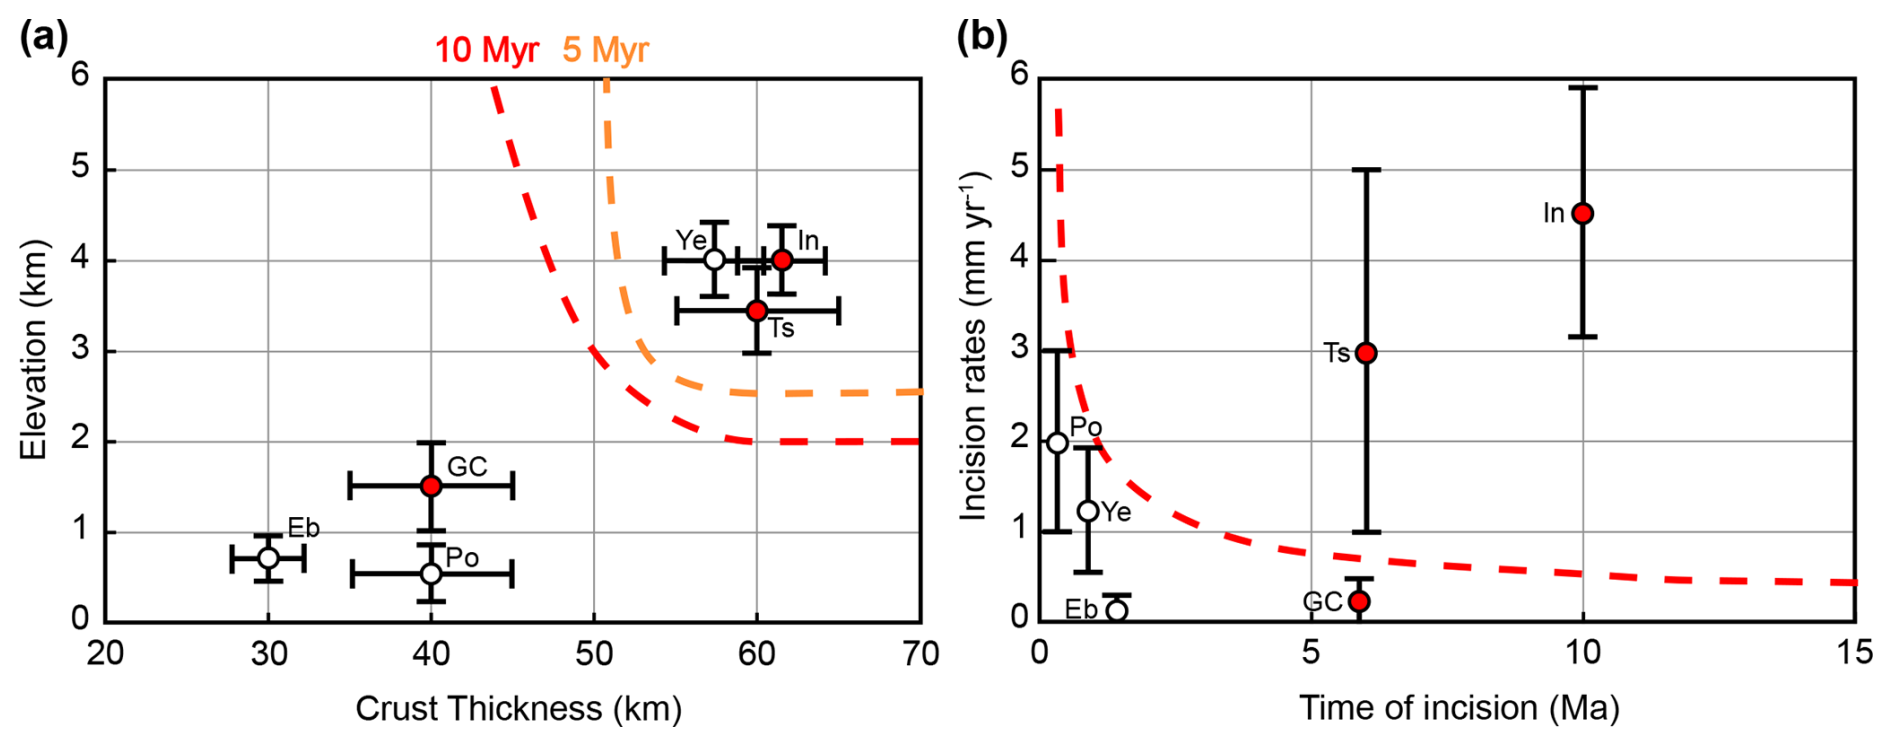
Figure 11Comparison of our models to natural river systems for (a) elevation and crustal thickness and (b) incision rates and time of incision. The dotted red and orange lines represent the limit between models exhuming or not exhuming lower crust in the 10 and 5 Myr time frame, respectively. Red points represent river systems with lower-crust exhumation. Different river systems and references used are Eb = Ebro River (Regard et al., 2021); Po = Potomac River (Reusser et al., 2004); GC = Grand Canyon (Darling et al., 2012; Karlstrom et al., 2021; Pederson et al., 2002); Ts = Tsangpo River (near Namcha Barwa) (Finnegan et al., 2014; Koons et al., 2022; Wang et al., 2017); Ye = Yellow River (Tongde) (Harkins et al., 2007; Wang et al., 2022); In = Indus River (near Nanga Parbat) (Ali and De Boer, 2010; Burbank et al., 1996; Zeitler et al., 2001). Data of elevation and crustal thickness are from the ETOPO1 (NOAA, 2009) and Crust 1.0 models (Laske et al., 2013), respectively.
Rivers such as the Ebro and Potomac do not exhibit lower-crust exhumation, which aligns well with our models when considering crustal thickness, elevation, incision rates, and duration of incision (Fig. 11).
The Tsangpo and Indus rivers also align with our model predictions, as lower-crust exhumation is observed in Namcha Barwa and Nanga Parbat (Fig. 11). However, given the intense tectonic forcing in these regions, with important convergence, we acknowledge that lower-crust exhumation may also result from additional processes beyond valley incision. Nonetheless, our models provide a well-founded hypothesis regarding lower-crust exhumation in these areas. A dedicated modeling study including horizontal convergence would be necessary to confirm this hypothesis, but such an investigation lies beyond the scope of this study.
The Yellow River, despite having crustal thickness and elevation within the predicted range for exhumation (Fig. 11a), does not exhibit lower-crust exhumation. This discrepancy is likely due to the short duration of incision, which began only 1.25 Myr ago (Wang et al., 2022) (Fig. 11b). This underscores the critical role of incision duration in determining whether a river can induce lower-crust exhumation.
Finally, the Grand Canyon is an outlier. It shows lower-crust exhumation despite not meeting the required crustal thickness and plateau elevation predicted by our models (Fig. 11a). The Grand Canyon presents a complex case, and its formation remains debated, with some studies suggesting that regional uplift driven by mantle dynamics – known as epeirogeny – may have contributed to its development (Karlstrom and Timmons, 2012). Epeirogenic uplift corresponds to the vertical rise of large crustal regions without significant tilting, folding, or thrusting. This additional uplift, which is not accounted for in our models, could have contributed to increasing the plateau elevation, thereby enhancing the erosion potential. Moreover, the presence of a Proterozoic basement beneath the sedimentary cover (Karlstrom and Timmons, 2012; Shufeldt et al., 2010) suggests that the eroded lower-crustal material in the Grand Canyon was potentially already located near the surface prior to the onset of incision, which would have facilitated its exhumation. Indeed, such a regional uplift, and the presence of old lower-crust material close to the surface, could have enabled the Grand Canyon to exhume lower-crustal material without necessarily meeting the specific crustal thickness, plateau elevation, and incision rates required in our models.
Our models demonstrate that valley incision into continental crust can result in recognizable crustal deformation. In scenarios with the highest erosion potential, this deformation manifests as plastic strain within the upper kilometers of the crust. Notably, our models reveal a deformation regime associated with this plastic deformation, primarily extensional in the central part of the valley (Fig. 4b). This insight opens the possibility of comparing model-predicted deformation with that observed in natural incised valleys. However, such a comparison is not straightforward. Natural examples chosen in this study exhibiting the largest erosion potential (Indus, Tsangpo, and Yellow rivers) are located in tectonically active regions. As a result, these valleys do not display extensional deformation at their centers, due to the overriding influence of convergent tectonic settings. Conversely, rivers such as the Ebro and Potomac have relatively low erosion potential, likely insufficient to induce observable incision-related surface deformation as observed in our models (Fig. S3). Finally, while the Grand Canyon does feature extensional faults in its center (Billingsley et al., 2019), these faults predate the onset of Colorado River incision and therefore cannot be attributed to the valley formation. Consequently, the shallow deformation observed in these natural settings cannot be unequivocally interpreted as a consequence of the incision of their valleys.
We performed a series of thermomechanical numerical models, including surface processes, to investigate the deformation and exhumation of a thick continental crust subjected to valley incision into an elevated plateau. Our results show that the incision of a single localized, but wide, valley is sufficient to generate significant crustal deformation, ultimately leading, for some specific conditions, to the exhumation of lower-crustal material. This exhumation is enabled by the development of an upward crustal flow beneath the valley center, which facilitates the rise of low-viscosity material towards the surface and promotes lower-crustal exhumation.
Our results indicate that lower-crustal exhumation is only possible within a 10 Myr time frame if favorable conditions are met, such as a high elevation plateau (≥ 2 km), a thick crust (> 50 km), and a long-term erosion rate (> 0.5 mm yr−1). Achieving exhumation within 5 Myr requires more restrictive conditions, with an elevation plateau over 3 km, a crustal thickness over 55 km, and a long-term effective erosion over 0.8 mm yr−1.
We also show that the parameters controlling the onset of lower-crustal exhumation differ from those governing the final amount of exhumed material. While the onset of exhumation is primarily driven by the initial plateau elevation, the final amount of exhumed lower crust is largely controlled by the initial crustal thickness. An increase in crustal thickness leads to a thicker lower crust, which enhances the upward flow of material and ultimately increases the volume of exhumed lower crust.
Lastly, we show that our models can be informative when compared to natural examples, even though our model setup does not perfectly replicate natural examples, particularly regarding regional tectonic boundary conditions. These first-order results demonstrate that our model outcomes are broadly consistent with observations from natural systems.
This appendix details the equation of each component of the strain rate solved in the 2D thermomechanical code MDoodz.
The viscous strain rate accounts for the dislocation, the diffusion, and the Peierls creep mechanism, represented by dis, dif, and Peierls exponents, respectively. The dislocation and diffusion creep strain rate () can be expressed as
where n, A, and Q are the dislocation creep parameters of the material (see Table 1); a is a melt-weakening factor set to 0 in the lithospheric and asthenospheric mantle and 50 in the crust for the partial melting models; M is the melt fraction; and R is the universal gas constant (R= 8.314510 J K−1 mol−1). The subscript II indicates that this is the second invariant of the considered tensor. fdis,dif corresponds to the correction factor (e.g., Schmalholz and Fletcher, 2011) for invariant formulation relative to the type of experiment used for calibration (here uniaxial compression), such as
Peierls strain rate is written as
with
s is the effective stress exponent (T-dependent), QPeierls is the activation energy, σPeierls is the Peierls stress, EPeierls is s−1, q (= 2.0), and γ (= 0.1) (Evans and Goetze, 1979) (Table 1). Peierls creep stress is computed using a regularized formulation (Kameyama et al., 1999).
Elastic strain rate is expressed following Hooke's law as
where Gis the shear modulus (see Table 1) and is the Jaumann derivative of the deviatoric stress.
The 2D simulations include the effect of frictional rheology. To this end, a viscoplastic Drucker–Prager rheological model is employed. The yield function is expressed as
where τII is the deviatoric second stress invariant, P is the pressure, C is the cohesion, and ϕ is the friction angle. The viscoplastic parameter ηvp is set such that the overstress () is on the order of 1 MPa (i.e., ηvp= 1021 Pa s) in our simulations.
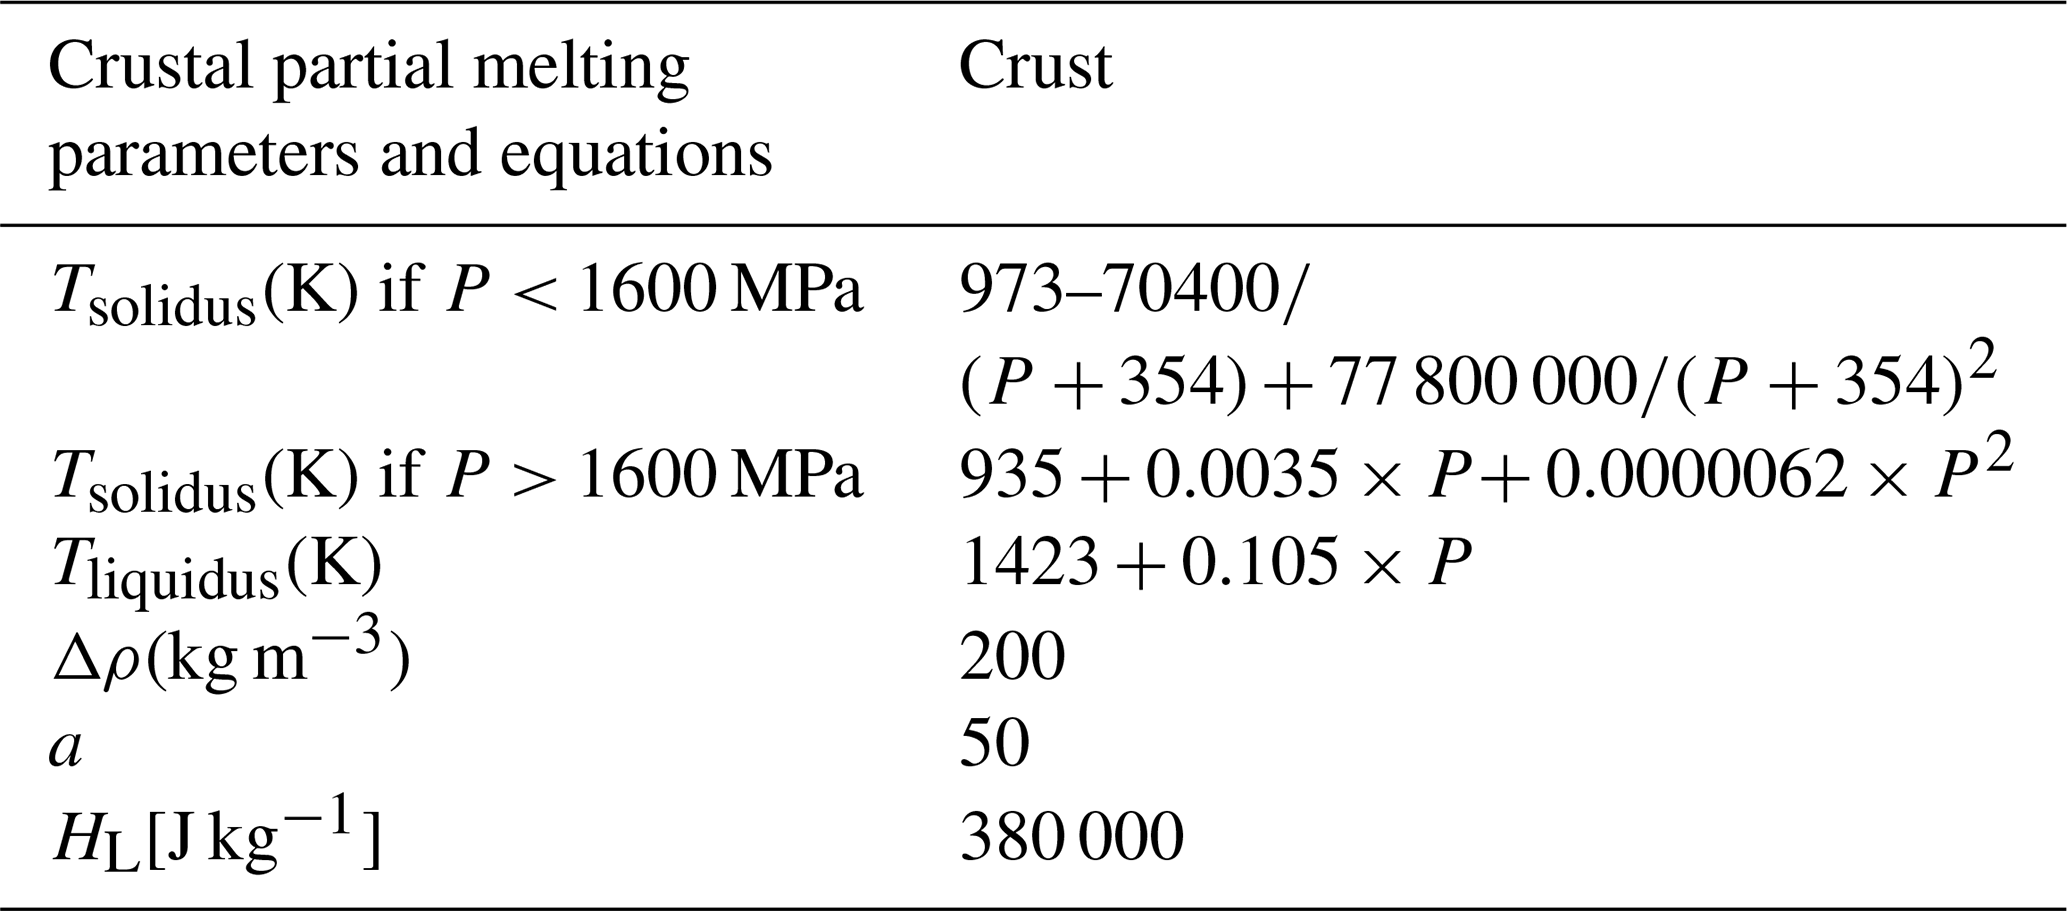
This appendix details the partial melting equation solved in the 2D thermomechanical code MDoodz. In partial melting models, latent heat (QL) can be significant during partial melting or crystallization events. During melting, QL acts as a heat sink (QL<0), whereas crystallization results in heat production (QL>0). In models including partial melting, this process is incorporated through (i) a decrease in density with increasing melt fraction, (ii) the modification of effective viscosity, and (iii) the consideration of the thermal impacts associated with melting/crystallization (Stüwe, 1995). The volumetric fraction of melt M is assumed to increase linearly with temperature, according to these relationships (Burg and Gerya, 2005; Gerya and Yuen, 2003):
where Tsolidus and Tliquidus are the wet solidus and dry liquidus temperatures of the rocks under consideration, respectively. The volumetric fraction of melt affects the effective density (ρeff) of the partially molten rocks as follows:
where and (see Table 1).
Other processes associated with partial melting, such as solid–melt segregation and melt extraction, are neglected. The effect of latent heating due to equilibrium melting or crystallization is included implicitly by increasing the effective heat capacity () and the thermal expansion (αeff) of the partially molten rocks ()(Burg and Gerya, 2005). QL is the latent heat of melting of the considered rocks.
Table B1Equations and parameters used to implement crustal partial melting. Equations for the liquidus and solidus temperatures are from Schmidt and Poli (1998) and Poli and Schmidt (2002), where P corresponds to the pressure in MPa. The value for the latent heat of melting (HL) is in line with standard values used for crustal material (e.g., Gerya, 2019; Turcotte and Schubert, 2002). The value of the change in density due to partial melting (Δρ) is in line with standard values, assuming a drop in density of 5 %–10 % for partially melted granite (e.g., Philpotts and Ague, 2009). The a value used in Eq. A1 is set to produce a drop in viscosity of 3 orders of magnitude for 10 % of partial melting.
The data of this study have been generated by using the code MDoodz7.0. This code is freely accessible, and all the information needed to install the code and use it is available on Zenodo (Geffroy et al., 2025a; https://doi.org/10.5281/zenodo.15241965), including the updated files of the code specifically written for this study. The MATLAB file used to read the output files and produce the figures of this paper is also given in Geffroy et al. (2025a; https://doi.org/10.5281/zenodo.15241965).
All output data of the reference are available on Zenodo (Geffroy et al., 2025b; https://doi.org/10.5281/zenodo.15241946).
The supplement related to this article is available online at https://doi.org/10.5194/se-16-1289-2025-supplement.
TD and PY developed the model code, and TG performed the simulations. TG prepared the article with contributions from all co-authors.
The contact author has declared that none of the authors has any competing interests.
Publisher's note: Copernicus Publications remains neutral with regard to jurisdictional claims made in the text, published maps, institutional affiliations, or any other geographical representation in this paper. While Copernicus Publications makes every effort to include appropriate place names, the final responsibility lies with the authors. Views expressed in the text are those of the authors and do not necessarily reflect the views of the publisher.
This research has been supported by the Université de Rennes, CNRS, the H2020 European Research Council (grant no. 803721), and the Institut Universitaire de France (IUF). Philippe Yamato would particularly like to thank Jean Van Den Driessche for the discussions that initiated this work several years ago. Clément Cholet is also thanked here for having produced the first models of this type using MDoodz during his Master 2 internship. We also want to sincerely thank the two reviewers, Carole Petit and Guillaume Duclaux, for their insightful comments that provided valuable guidance in improving our study.
This work was supported by the Institut Universitaire de France (IUF).
This paper was edited by Jacqueline Reber and reviewed by Carole Petit and Guillaume Duclaux.
Ali, K. F. and De Boer, D. H.: Spatially distributed erosion and sediment yield modeling in the upper Indus River basin, Water Resources Research, 46, https://doi.org/10.1029/2009WR008762, 2010.
Auzemery, A., Yamato, P., Duretz, T., Willingshofer, E., Matenco, L., and Porkoláb, K.: Influence of magma-poor versus magma-rich passive margins on subduction initiation, Gondwana Research, 103, 172–186, https://doi.org/10.1016/j.gr.2021.11.012, 2022.
Avouac, J. P. and Burov, E. B.: Erosion as a driving mechanism of intracontinental mountain growth, Journal of Geophysical Research: Solid Earth, 101, 17747–17769, https://doi.org/10.1029/96JB01344, 1996.
Baiadori, F., Sacek, V., Freitas, B., and Almeida, R.: Evidence of crustal flexure induced by fluvial incisions, Tectonophysics, 877, 230292, https://doi.org/10.1016/j.tecto.2024.230292, 2024.
Beaumont, C., Fullsack, P., and Hamilton, J.: Erosional control of active compressional orogens, in: Thrust Tectonics, edited by: McClay, K. R., Springer Netherlands, Dordrecht, 1–18, https://doi.org/10.1007/978-94-011-3066-0_1, 1992.
Beaumont, C., Jamieson, R. A., Nguyen, M. H., and Lee, B.: Himalayan tectonics explained by extrusion of a low-viscosity crustal channel coupled to focused surface denudation, Nature, 414, 738–742, https://doi.org/10.1038/414738a, 2001.
Billingsley, G. H., Goodwin, G., Nagorsen, S. E., Erdman, M. E., and Sherba, J. T.: Geologic field photograph map of the Grand Canyon region, 1967–2010, No. 189, US Geological Survey, https://doi.org/10.3133/gip189, 2019.
Braun, J. and Yamato, P.: Structural evolution of a three-dimensional, finite-width crustal wedge, Tectonophysics, 484, 181–192, https://doi.org/10.1016/j.tecto.2009.08.032, 2010.
Brocard, G. Y. and van der Beek, P. A.: Influence of incision rate, rock strength, and bedload supply on bedrock river gradients and valley-flat widths: Field-based evidence and calibrations from western Alpine rivers (southeast France), in: Tectonics, Climate, and Landscape Evolution, edited by: Willett, S. D., Hovius, N., Brandon, M. T., and Fisher, D. M., Geological Society of America, https://doi.org/10.1130/2006.2398(07), 2006.
Burbank, D. W., Leland, J., Fielding, E., Anderson, R. S., Brozovic, N., Reid, M. R., and Duncan, C.: Bedrock incision, rock uplift and threshold hillslopes in the northwestern Himalayas, Nature, 379, 505–510, https://doi.org/10.1038/379505a0, 1996.
Burg, J.-P. and Gerya, T. V.: The role of viscous heating in Barrovian metamorphism of collisional orogens: thermomechanical models and application to the Lepontine Dome in the Central Alps, Journal of Metamorphic Geology, 23, 75–95, https://doi.org/10.1111/j.1525-1314.2005.00563.x, 2005.
Byerlee, J.: Friction of rocks, Pure and applied geophysics, 116, 615–626, 1978.
Candioti, L. G., Duretz, T., and Schmalholz, S. M.: Horizontal Force Required for Subduction Initiation at Passive Margins With Constraints From Slab Detachment, Front. Earth Sci., 10, https://doi.org/10.3389/feart.2022.785418, 2022.
Champagnac, J. D., Molnar, P., Anderson, R. S., Sue, C., and Delacou, B.: Quaternary erosion-induced isostatic rebound in the western Alps, Geology, 35, 195, https://doi.org/10.1130/G23053A.1, 2007.
Darling, A. L., Karlstrom, K. E., Granger, D. E., Aslan, A., Kirby, E., Ouimet, W. B., Lazear, G. D., Coblentz, D. D., and Cole, R. D.: New incision rates along the Colorado River system based on cosmogenic burial dating of terraces: Implications for regional controls on Quaternary incision, Geosphere, 8, 1020–1041, https://doi.org/10.1130/GES00724.1, 2012.
Dingwell, D. B.: Transport Properties of Magmas: Diffusion and Rheology, Elements, 2, 281–286, https://doi.org/10.2113/gselements.2.5.281, 2006.
Duretz, T., May, D. A., Gerya, T. V., and Tackley, P. J.: Discretization errors and free surface stabilization in the finite difference and marker-in-cell method for applied geodynamics: A numerical study, Geochemistry, Geophysics, Geosystems, 12, https://doi.org/10.1029/2011GC003567, 2011.
Duretz, T., May, D. A., and Yamato, P.: A free surface capturing discretization for the staggered grid finite difference scheme, Geophys. J. Int., 204, 1518–1530, https://doi.org/10.1093/gji/ggv526, 2016.
Duretz, T., de Borst, R., Yamato, P., and Le Pourhiet, L.: Toward Robust and Predictive Geodynamic Modeling: The Way Forward in Frictional Plasticity, Geophysical Research Letters, 47, e2019GL086027, https://doi.org/10.1029/2019GL086027, 2020.
Duretz, T., de Borst, R., and Yamato, P.: Modeling Lithospheric Deformation Using a Compressible Visco-Elasto-Viscoplastic Rheology and the Effective Viscosity Approach, Geochemistry, Geophysics, Geosystems, 22, e2021GC009675, https://doi.org/10.1029/2021GC009675, 2021.
Evans, B. and Goetze, C.: The temperature variation of hardness of olivine and its implication for polycrystalline yield stress, Journal of Geophysical Research: Solid Earth, 84, 5505–5524, 1979.
Finnegan, N. J., Schumer, R., and Finnegan, S.: A signature of transience in bedrock river incision rates over timescales of 104–107 years, Nature, 505, 391–394, https://doi.org/10.1038/nature12913, 2014.
Gallen, S. F., Pazzaglia, F. J., Wegmann, K. W., Pederson, J. L., and Gardner, T. W.: The dynamic reference frame of rivers and apparent transience in incision rates, Geology, 43, 623–626, https://doi.org/10.1130/G36692.1, 2015.
Geffroy, T., Yamato, P., Steer, P., Guillaume, B., and Duretz, T.: Files relative to MDoodz7.0 code used in Geffroy et al. paper entitled “Deformation and exhumation in thick continental crusts induced by valley incision of elevated plateaus”, Zenodo [code], https://doi.org/10.5281/zenodo.15241965, 2025a.
Geffroy, T., Yamato, P., Steer, P., Guillaume, B., and Duretz, T.: Output files of the reference model from Geffroy et al. paper entitled “Deformation and exhumation in thick continental crusts induced by valley incision of elevated plateaus” Zenodo [data set], https://doi.org/10.5281/zenodo.15241946, 2025b.
Gerya, T.: Introduction to Numerical Geodynamic Modelling, Cambridge University Press, 487 pp., https://doi.org/10.1017/9781316534243, 2019.
Gerya, T. V. and Yuen, D. A.: Rayleigh–Taylor instabilities from hydration and melting propel `cold plumes' at subduction zones, Earth and Planetary Science Letters, 212, 47–62, https://doi.org/10.1016/S0012-821X(03)00265-6, 2003.
Hancock, G. S. and Anderson, R. S.: Numerical modeling of fluvial strath-terrace formation in response to oscillating climate, GSA Bulletin, 114, 1131–1142, https://doi.org/10.1130/0016-7606(2002)114<1131:NMOFST>2.0.CO;2, 2002.
Hansen, F. D., and Carter, N. L.: Semibrittle creep of dry and wet Westerly granite at 1000 MPa, in: ARMA US Rock Mechanics/Geomechanics Symposium, ARMA-83, ARMA, June, https://onepetro.org/ARMAUSRMS/proceedings-abstract/ARMA83/ARMA83/ARMA-83-0429/129467 (last access: 2025), 1983.
Harkins, N., Kirby, E., Heimsath, A., Robinson, R., and Reiser, U.: Transient fluvial incision in the headwaters of the Yellow River, northeastern Tibet, China, Journal of Geophysical Research: Earth Surface, 112, https://doi.org/10.1029/2006JF000570, 2007.
Harlow, F. and Welch, J.: Numerical calculation of time-dependent viscous incompressible flow of fluid with free surface, Physics of Fluids, https://doi.org/10.1063/1.1761178, 1965.
Hirth, G. and Kohlstedt, D.: Rheology of the upper mantle and the mantle wedge: A view from the experimentalists, Geophysical monograph series, 138, 83–105, 2003.
Jaupart, C. and Mareschal, J.-C.: Radiogenic Heat Production in the Continental Crust, in: Encyclopedia of Solid Earth Geophysics, edited by: Gupta, H. K., Springer International Publishing, Cham, 1298–1303, https://doi.org/10.1007/978-3-030-58631-7_243, 2021.
Kameyama, M., Yuen, D. A., and Karato, S.-I.: Thermal-mechanical effects of low-temperature plasticity (the Peierls mechanism) on the deformation of a viscoelastic shear zone, Earth and Planetary Science Letters, 168, 159–172, https://doi.org/10.1016/S0012-821X(99)00040-0, 1999.
Karlstrom, K., Crossey, L., Matthis, A., and Bowman, C.: Telling time at Grand Canyon National Park: 2020 update, National Park Service, https://doi.org/10.36967/nrr-2285173, 2021.
Karlstrom, K. E. and Timmons, J. M.: Faulting and uplift in the Grand Cany on region, in: Grand Canyon Geology: Two Billion Years of Earth's History, Geological Society of America, https://doi.org/10.1130/2012.2489(06), 2012.
Koons, P. O.: Two-sided orogen: Collision and erosion from the sandbox to the Southern Alps, New Zealand, Geology, 18, 679, https://doi.org/10.1130/0091-7613(1990)018<0679:TSOCAE>2.3.CO;2, 1990.
Koons, P. O., Hallet, B., Zeitler, P. K., and Meltzer, A. S.: Tectonic aneurysm: A culmination of tectonic and geomorphic cooperation in mountain building, Academic Press, https://doi.org/10.1016/B978-0-12-818234-5.00179-6, 2022.
Laske, G., Masters, G., Ma, Z., and Pasyanos, M.: Update on CRUST1.0 – A 1-degree Global Model of Earth's Crust, Geophysical Research Abstracts, https://ui.adsabs.harvard.edu/abs/2013EGUGA..15.2658L (last access: 2025), 2013.
Luisier, C., Tajčmanová, L., Yamato, P., and Duretz, T.: Garnet microstructures suggest ultra-fast decompression of ultrahigh-pressure rocks, Nat. Commun, 14, 6012, https://doi.org/10.1038/s41467-023-41310-w, 2023.
Mackwell, S. J., Zimmerman, M. E., and Kohlstedt, D. L.: High-temperature deformation of dry diabase with application to tectonics on Venus, Journal of Geophysical Research: Solid Earth, 103, 975–984, https://doi.org/10.1029/97JB02671, 1998.
Martin, J., Cantelli, A., Paola, C., Blum, M., and Wolinsky, M.: Quantitative Modeling of the Evolution and Geometry of Incised Valleys, Journal of Sedimentary Research, 81, 64–79, https://doi.org/10.2110/jsr.2011.5, 2011.
Mills, H. H.: Apparent increasing rates of stream incision in the eastern United States during the late Cenozoic, Geology, 28, 955–957, https://doi.org/10.1130/0091-7613(2000)28<955:AIROSI>2.0.CO;2, 2000.
Molitor, Z., Mittal, T., and Jagoutz, O.: The viscosity of a partially molten layer in a paleo-orogenic plateau, Earth and Planetary Science Letters, 648, 119060, https://doi.org/10.1016/j.epsl.2024.119060, 2024.
Montgomery, D. R. and Stolar, D. B.: Reconsidering Himalayan river anticlines, Geomorphology, 82, 4–15, https://doi.org/10.1016/j.geomorph.2005.08.021, 2006.
Munch, J., Ueda, K., Schnydrig, S., May, D. A., and Gerya, T. V.: Contrasting influence of sediments vs surface processes on retreating subduction zones dynamics, Tectonophysics, 836, 229410, https://doi.org/10.1016/j.tecto.2022.229410, 2022.
Nativ, R. and Turowski, J. M.: Site Dependence of Fluvial Incision Rate Scaling With Timescale, Journal of Geophysical Research: Earth Surface, 125, e2020JF005808, https://doi.org/10.1029/2020JF005808, 2020.
NOAA: ETOPO1 1 Arc-Minute Global Relief Model, National Centers for Environmental Information, https://doi.org/10.7289/V5C8276M, 2009.
Pederson, J., Karlstrom, K., Sharp, W., and McIntosh, W.: Differential incision of the Grand Canyon related to Quaternary faulting – Constraints from U-series and Ar Ar dating, Geology, 30, 739–742, https://doi.org/10.1130/0091-7613(2002)030<0739:DIOTGC>2.0.CO;2, 2002.
Philpotts, A. R. and Ague, J. J.: Principles of Igneous and Metamorphic Petrology, Cambridge University Press, 669 pp., https://doi.org/10.1017/9781108631419, 2009.
Poh, J., Yamato, P., Duretz, T., Gapais, D., and Ledru, P.: Precambrian deformation belts in compressive tectonic regimes: A numerical perspective, Tectonophysics, 777, 228350, https://doi.org/10.1016/j.tecto.2020.228350, 2020.
Poli, S. and Schmidt, M. W.: Petrology of subducted slabs, Annual Review of Earth and Planetary Sciences, 30, 207–235, 2002.
Porkoláb, K., Duretz, T., Yamato, P., Auzemery, A., and Willingshofer, E.: Extrusion of subducted crust explains the emplacement of far-travelled ophiolites, Nat. Commun., 12, 1499, https://doi.org/10.1038/s41467-021-21866-1, 2021.
Regard, V., Vacherat, A., Bonnet, S., Mouthereau, F., Nørgaard, J., and Knudsen, M. F.: Late Pliocene-Pleistocene incision in the Ebro Basin (North Spain), BSGF – Earth Sci. Bull., 192, 30, https://doi.org/10.1051/bsgf/2021020, 2021.
Reusser, L. J., Bierman, P. R., Pavich, M. J., Zen, E., Larsen, J., and Finkel, R.: Rapid Late Pleistocene Incision of Atlantic Passive-Margin River Gorges, Science, 305, 499–502, https://doi.org/10.1126/science.1097780, 2004.
Rudnick, R. and Gao, S.: Composition of the Continental Crust. Treatise Geochem 3:1-64, Treatise on Geochemistry, 3, 1–64, https://doi.org/10.1016/B0-08-043751-6/03016-4, 2003.
Schmalholz, S. M. and Fletcher, R. C.: The exponential flow law applied to necking and folding of a ductile layer: Exponential flow law applied to folding and necking, Geophysical Journal International, 184, 83–89, https://doi.org/10.1111/j.1365-246X.2010.04846.x, 2011.
Schmidt, M. W. and Poli, S.: Experimentally based water budgets for dehydrating slabs and consequences for arc magma generation, Earth and Planetary Science Letters, 163, 361–379, 1998.
Shufeldt, O. P., Karlstrom, K. E., Gehrels, G. E., and Howard, K. E.: Archean detrital zircons in the Proterozoic Vishnu Schist of the Grand Canyon, Arizona: Implications for crustal architecture and Nuna supercontinent reconstructions, Geology, 38, 1099–1102, https://doi.org/10.1130/G31335.1, 2010.
Simpson, G.: Role of river incision in enhancing deformation, Geology, 32, 341, https://doi.org/10.1130/G20190.2, 2004.
Steer, P., Simoes, M., Cattin, R., and Shyu, J. B. H.: Erosion influences the seismicity of active thrust faults, Nat. Commun., 5, 5564, https://doi.org/10.1038/ncomms6564, 2014.
Sternai, P., Sue, C., Husson, L., Serpelloni, E., Becker, T. W., Willett, S. D., Faccenna, C., Di Giulio, A., Spada, G., Jolivet, L., Valla, P., Petit, C., Nocquet, J.-M., Walpersdorf, A., and Castelltort, S.: Present-day uplift of the European Alps: Evaluating mechanisms and models of their relative contributions, Earth-Science Reviews, 190, 589–604, https://doi.org/10.1016/j.earscirev.2019.01.005, 2019.
Stüwe, K.: Thermal buffering effects at the solidus. Implications for the equilibration of partially melted metamorphic rocks, Tectonophysics, 248, 39–51, https://doi.org/10.1016/0040-1951(94)00282-E, 1995.
Tesauro, M., Kaban, M. K., and Cloetingh, S. A. P. L.: Global strength and elastic thickness of the lithosphere, Global and Planetary Change, 90–91, 51–57, https://doi.org/10.1016/j.gloplacha.2011.12.003, 2012.
Thieulot, C., Steer, P., and Huismans, R. S.: Three-dimensional numerical simulations of crustal systems undergoing orogeny and subjected to surface processes, Geochemistry, Geophysics, Geosystems, 15, 4936–4957, https://doi.org/10.1002/2014GC005490, 2014.
Turcotte, D. L. and Schubert, G.: Geodynamics, Cambridge University Press, 484 pp., https://doi.org/10.1017/CBO9780511843877, 2002.
Vernant, P., Hivert, F., Chery, J., Steer, P., Cattin, R., and Rigo, A.: Erosion-induced isostatic rebound triggers extension in low convergent mountain ranges, Geology, 41, https://doi.org/10.1130/G33942.1, 2013.
Wang, X., Hu, G., Saito, Y., Ni, G., Hu, H., Yu, Z., Chen, J., Wang, M., Yuan, X., Wang, L., Hu, Z., Nie, J., and Pan, B.: Did the modern Yellow River form at the Mid-Pleistocene transition?, Science Bulletin, 67, 1603–1610, https://doi.org/10.1016/j.scib.2022.06.003, 2022.
Wang, Y., Zhang, H., Zheng, D., von Dassow, W., Zhang, Z., Yu, J., and Pang, J.: How a stationary knickpoint is sustained: New insights into the formation of the deep Yarlung Tsangpo Gorge, Geomorphology, 285, 28–43, https://doi.org/10.1016/j.geomorph.2017.02.005, 2017.
Willett, S. D.: Orogeny and orography: The effects of erosion on the structure of mountain belts, Journal of Geophysical Research: Solid Earth, 104, 28957–28981, https://doi.org/10.1029/1999JB900248, 1999.
Wolf, S. G., Huismans, R. S., Braun, J., and Yuan, X.: Topography of mountain belts controlled by rheology and surface processes, Nature, 606, 516–521, https://doi.org/10.1038/s41586-022-04700-6, 2022.
Yamato, P., Burov, E., Agard, P., Le Pourhiet, L., and Jolivet, L.: HP-UHP exhumation during slow continental subduction: Self-consistent thermodynamically and thermomechanically coupled model with application to the Western Alps, Earth and Planetary Science Letters, 271, 63–74, https://doi.org/10.1016/j.epsl.2008.03.049, 2008.
Yamato, P., Duretz, T., May, D. A., and Tartèse, R.: Quantifying magma segregation in dykes, Tectonophysics, 660, 132–147, https://doi.org/10.1016/j.tecto.2015.08.030, 2015.
Yamato, P., Duretz, T., and Angiboust, S.: Brittle/Ductile Deformation of Eclogites: Insights From Numerical Models, Geochemistry, Geophysics, Geosystems, 20, 3116–3133, https://doi.org/10.1029/2019GC008249, 2019.
Yang, J., Cao, W., Yuan, X., and Yang, J.: Erosion-Driven Isostatic Flow and Crustal Diapirism: Analytical and Numerical Models With Implications for the Evolution of the Eastern Himalayan Syntaxis, Southern Tibet, Tectonics, 42, e2022TC007717, https://doi.org/10.1029/2022TC007717, 2023.
Zeitler, P. K., Koons, P. O., Bishop, M. P., Chamberlain, C. P., Craw, D., Edwards, M. A., Hamidullah, S., Jan, M. Q., Khan, M. A., Khattak, M. U. K., Kidd, W. S. F., Mackie, R. L., Meltzer, A. S., Park, S. K., Pecher, A., Poage, M. A., Sarker, G., Schneider, D. A., Seeber, L., and Shroder, J. F.: Crustal reworking at Nanga Parbat, Pakistan: Metamorphic consequences of thermal-mechanical coupling facilitated by erosion, Tectonics, 20, 712–728, https://doi.org/10.1029/2000TC001243, 2001.
- Abstract
- Introduction
- Materials and methods
- Results
- Discussion
- Conclusions
- Appendix A: Rheological model
- Appendix B: Partial melting implementation
- Code availability
- Data availability
- Author contributions
- Competing interests
- Disclaimer
- Acknowledgements
- Financial support
- Review statement
- References
- Supplement