the Creative Commons Attribution 4.0 License.
the Creative Commons Attribution 4.0 License.
 | 12 Dec 2025
Seismic data acquisition to combine high-resolution seismic reflection and full-waveform inversion – a case study for overdeepened valleys
Daniel Köhn
Matthias Körbe
Gerald Gabriel
Johannes Großmann
Gustav Firla
Markus Fiebig
In the context of the ICDP-project “Drilling Overdeepened Alpine Valleys”, the integration of high-resolution seismic reflection (HRSR) and full waveform inversion (FWI) is used to enhance detailed near-surface imaging in heterogeneous glacial and post-glacial environments. To meet the specific requirements of both methods, dense P-wave and S-wave datasets were acquired over an overdeepened basin in the northern Alpine foreland, using a combination of vibratory and explosive seismic sources, as well as different receivers. Analysis of the datasets, as well as separate application of HRSR and FWI demonstrates the suitability of the acquired data. The FWI workflow applied to the P-wave data fits the recorded waveforms and converged successfully, yielding a consistent and physically reasonable model that correlates well with the HRSR images. These datasets are the basis for future methodological development of combining HRSR and FWI.
The HRSR images reveal important information about the geology of the overdeepened basin near the town Schäftlarn (Germany). Using standard processing workflows, P-wave HRSR delineates detailed subsurface structures, including the base of the basin, intra-basin discontinuities, and subtle stratigraphic variations. Additional S-wave data provides superior resolution in imaging Quaternary basin sediments down to 200 m depth compared to P-waves and thus offers complementary information.
- Article
(12352 KB) - Full-text XML
- BibTeX
- EndNote


Near-surface seismic methods are highly effective in subsurface imaging, particular for detecting stratigraphic features and geological discontinuities (Wang et al., 2025). However, seismic imaging in heterogeneous near-surface environments, such as glacial and post-glacial deposits, remains challenging (Maraio et al., 2018). Even in such complex settings, high-resolution seismic reflection method (HRSR) can provide detailed structural information through the analysis of the reflected wavefield (e.g., Dehnert et al., 2012; Malehmir et al., 2013; Maries et al., 2017). Depending on survey parameters, HRSR is capable of resolving subsurface structure from depths of only a few metres – with sub-metre resolution – to several kilometres, albeit with decreasing resolution. The use of S-waves, instead of conventional P-waves, can further enhance resolution (Pugin et al., 2009; Burschil and Buness, 2020; Pertuz and Malehmir, 2023). The degree of subsurface complexity largely determines the extent of seismic data processing required to achieve optimal imaging quality. In geologically complex settings, advanced processing approaches – such as true-amplitude processing using common reflection surfaces or prestack-depth migration – may be superior to simpler workflows and reveal geological features that remain undetected after standard processing. Examples in the context of the overdeepened structures include allochthonous Molasse blocks at the base of the sedimentary succession (Burschil et al., 2018) and cuspate-lobate folding of shallow diamict (Buness et al., 2022).
Full-waveform inversion (FWI) further enhances seismic imaging (Tarantola, 1986; Virieux and Operto, 2009) by enabling a detailed and quantitative reconstruction of subsurface properties (e.g., Operto et al., 2013; Mecking et al., 2021; Singh et al., 2022; Beraus et al., 2024). In addition, elastic FWI is able to estimate S-wave velocities from P-wave data (Pan et al., 2019; Roodaki et al., 2024). Both methods, however, have their limitations. HRSR relies on impedance contrasts and shallow reflections may be masked by near-surface scattering (Frei et al., 2015; Sloan et al., 2016). In contrast, FWI is computationally demanding (Ren and Liu, 2015) and its success depends strongly on high-quality field data and accurate initial models, including both P- and S-wave velocity distributions (Vigh et al., 2018; Zhang et al., 2025). Despite these challenges, combining HRSR and FWI has the potential to significantly improve near-surface imaging, yielding higher resolution, accuracy, and interpretational reliability. The two approaches impose different requirements on the acquired data. HRSR benefits from a broad bandwidth of the source signal to produce sharp reflections (Brodic et al., 2021), whereas state-of-the-art FWI workflows iteratively invert the data in multiple stages, starting from a low frequency band to avoid cycle skipping (Dokter et al., 2017; Vigh et al., 2018; Köhn et al., 2019). These complementary demands make the design of field-data acquisition challenging, when aiming for an integrated application of both methods.
To overcome these challenges, a variety of land seismic sources can be used, each with distinct advantages and disadvantages in generating seismic waves. Vibratory sources are frequently used because they provide highly repeatable signals and emit energy over an extended time period. While the total emitted energy accumulates, the instantaneous emitted energy released at any moment remains low, minimizing ground impact and preventing damage to land or infrastructure. The high repeatability of signals with identical frequency content is particularly beneficial for vertical stacking, as it improves signal coherency and reduces random noise (Brodic et al., 2021). The peak force of a seismic vibrator refers to the maximum force exerted on the ground during operation (Sallas, 1984). The emitted sweep signal, defined by its frequency band, is correlated with the recorded traces, producing a zero-phase Klauder-wavelet through self-correlation (Lines and Clayton, 1977). In addition to these technical benefits, vibrators are often preferred for economic reasons, fewer regulatory constraints, and ease of approval. However, they are technically limited in that they cannot generate low-frequency signals (Wei and Phillips, 2011). In contrast, impulsive sources release seismic energy instantaneously and often contain low frequency components. Yet, the achievable imaging depth depends on the total emitted energy. Commonly-used impulsive sources are sledgehammers, drop weights, and explosives with variable charge sizes. While sledgehammers and drop weights result in limited penetration depth, explosives, deployed in boreholes, can be used for shallow and deep imaging (Denny and Johnson, 1991). Nevertheless, the use of explosive sources is restricted in certain environments, such as urban areas.
On the receiver side, geophones have been used since the early 20th Century to record ground motion (Dragoset, 2005). Their sensitivity decreases toward lower frequencies, depending on the damping and resonance frequency of the sensor (Krohn, 1984). Cabled systems allow a direct monitoring of ground motion and, consequently, immediate quality control during acquisition. In recent years, autonomous recording systems have become increasingly affordable and reliable, making it possible to maintain a high fold, even if a few percent of receivers fail or are lost (e.g., Manning et al., 2019; Ourabah and Chatenay, 2022).
To obtain suitable datasets for the methodological development of combining HRSR and FWI, we acquired field data using various source-receiver combinations. Explosive sources were employed to generate low frequencies, whereas vertical vibrators provided signals with a broad bandwidth. Densely-spaced vertical geophones recorded the ground motion, while additional autonomous three-component geophones with lower resonance frequencies and sparser spacing captured the low-frequency content. Horizontally-oriented vibrators and receivers complement the dataset, supplying the initial S-wave velocity model for FWI.
The first objective of this study is to present the acquired field datasets and demonstrate that they meet the requirements for both HRSR and FWI. The results obtained from separately processed datasets – HRSR using P- and S-wave, and FWI – provide insights into the data quality and confirm their suitability for future methodological development, combining both approaches for imaging overdeepened valleys. The second objective is to image the structure of an overdeepened basin near the town Schäftlarn (Germany). The study area lies in the Alpine foreland, approximately 30 km south of Munich, and is part of a complex system of overdeepened valleys and basins that are widespread across the European Alps (Preusser et al., 2010). It is also one of the study sites of the ICDP project, Drilling Overdeepened Alpine Valleys (DOVE).
The ICDP project Drilling Overdeepened Alpine Valleys (Anselmetti et al., 2022) investigates glacially-overdeepened structures on a pan-Alpine basis using drill cores and geophysical surveys. The pinpoint information gained by the cores is extrapolated by the geophysical surveys into 2-D and 3-D. Previous investigations focused on overdeepened structures were limited to local/regional scope. DOVE aims to gather a comprehensive picture of overdeepened structures on the scale of a whole mountain range. The core research questions to be investigated revolve around the timing and extent of Middle Pleistocene glaciations and the sedimentary dynamics associated with them.
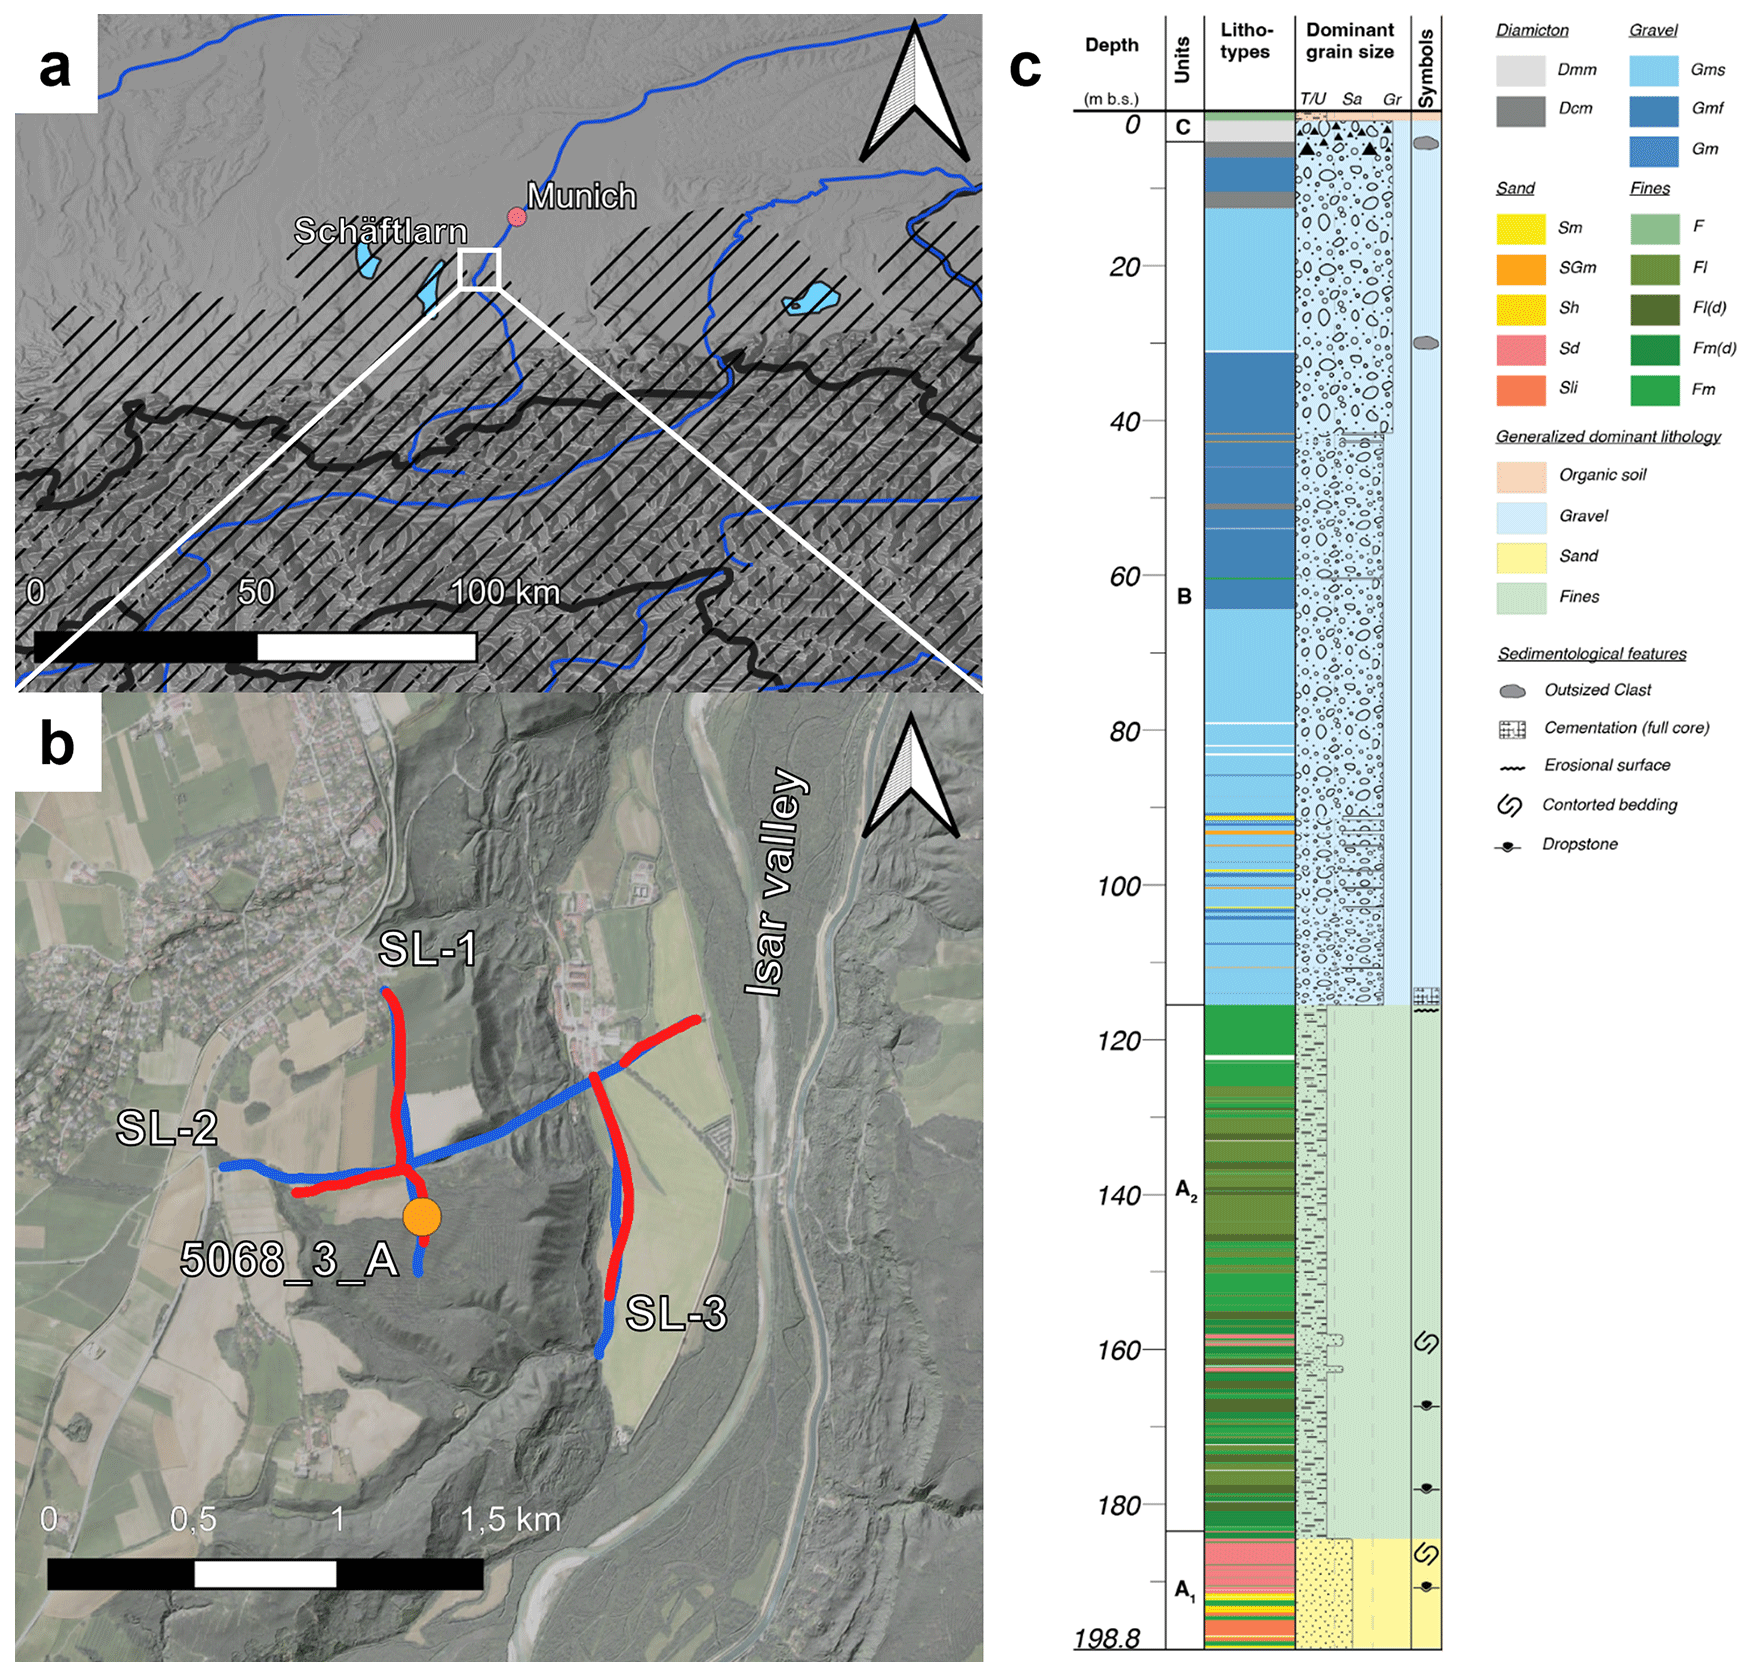
Figure 1Study area. (a) Overview map showing the location at the margin of the LGM ice extent (hashed area; Ehlers et al., 2011) and (b) location map with borehole ICDP 5068_3_A (orange) and seismic P-wave (blue) and S-wave (red) profiles. (c) Core description of borehole 5068_3_A after Firla et al. (2024). Source: Agency for Digitisation, High-Speed Internet and Surveying – https://www.geodaten.bayern.de (last access: 31 October 2025).
Glacial erosion sculpted not only the high Alpine regions but also the foreland. The study site is located in the northern Alpine foreland that was influenced by repeated Pleistocene glaciations (Preusser et al., 2010). About 30 km south of Munich (Germany), the former Isar–Loisach glacier lobe excavated an overdeepened basin, which Jerz (1979) described as a branch basin of the Wolfratshausen Basin to the south. The overdeepened basin is located at the morphologically defined ice-marginal position of the Last Glacial Maximum (LGM; Fig. 1a). The local bedrock consists of Upper-Freshwater Molasse sediments and the basin is filled with Quaternary sediments. To the west of the study site, Lake Starnberg and Lake Ammersee provide examples of overdeepened basins that are not entirely filled by sediments. The study site is located on the southern margin of the Munich gravel plain (“Münchner Schotterebene”; Jerz, 1993). The western area of the study site is elevated approximately 100 m above the recent incision of the Isar valley to the east (Fig. 1b). The Molasse bedrock has been identified in outcrops at the base of the Isar valley slope (Jerz, 1987).
At the DOVE site Schäftlarn (ICDP site 5068_3), the Bavarian Environment Agency drilled a research borehole (5068_3_A) in 2017 and conducted a seismic refraction survey in 2018. The 198.8 m long drill-core (Fig. 1c) shows the sedimentary sequence from bottom to top: (A1/A2) ∼ 83 m of fine-grained sediments, (B) ∼ 111 m of coarse-grained sediments, and (C) ∼ 4 m of diamictic sediments. Remnants of a basal diamict were recovered, but the bedrock was not reached (Firla et al., 2024). The refraction survey did not image beneath the coarse-grained sediments.
Table 1Specifications of seismic profiles, including the number of vibrator (VP) and explosive (SP) shot points, and receiver points (RP).
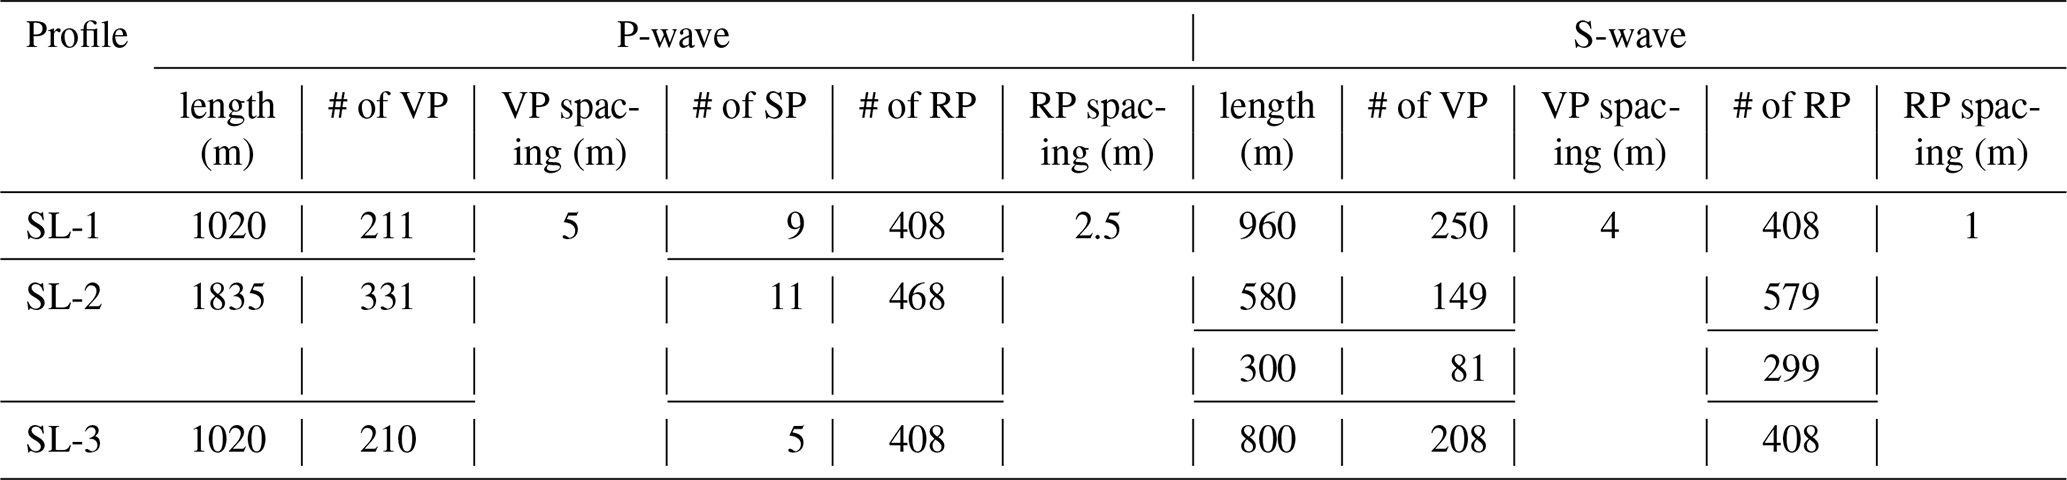
At the study site, three seismic profiles (SL-1 to SL-3) were acquired using both P- and S-waves (Table 1; Fig. 1b). The layout was designed to image the internal basin structure as well as its base, which is estimated to lie approximately 200 m below the surface. For each seismic line, an additional suffix indicates the wave type: “P” for P-waves and “S” for S-waves (e.g. SL-1P and SL-1S). Profile SL-2S consists of two parts, because the central section of SL-2 was inaccessible for the S-wave survey.
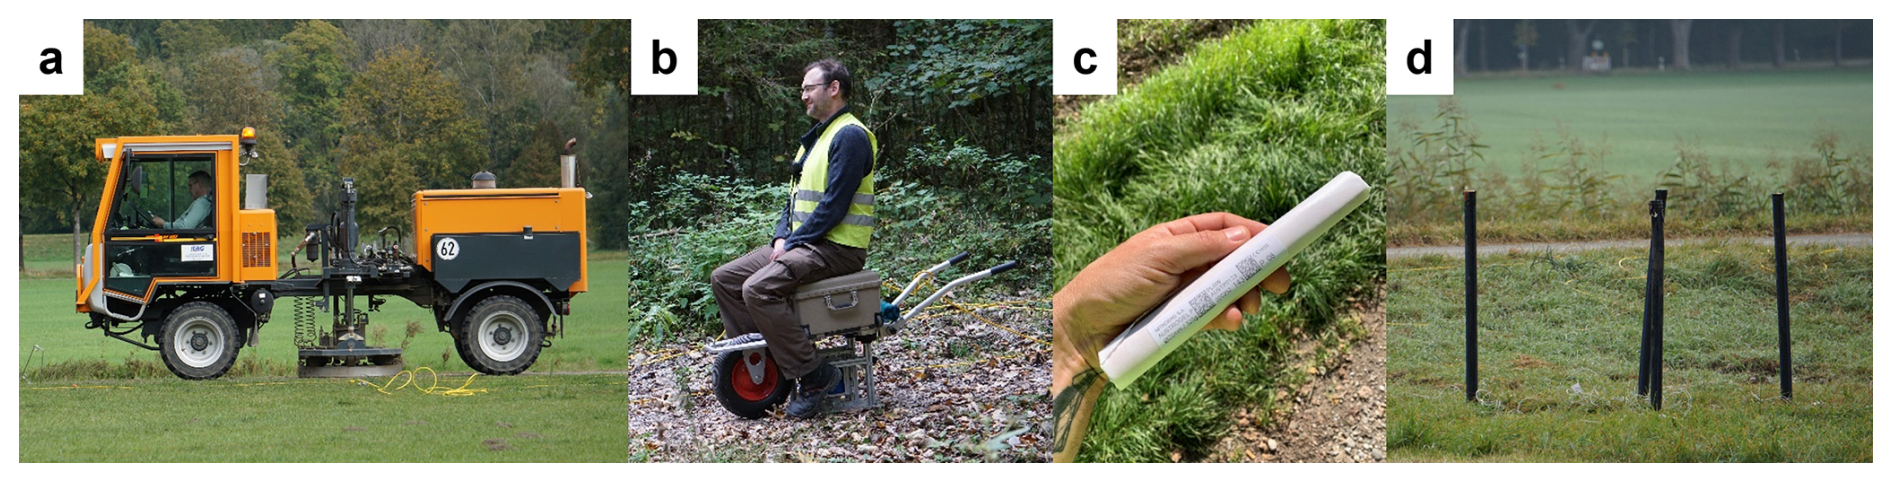
Figure 2Seismic sources. (a) Vibrators MHV4P, (b) ELVIS-7, (c) explosive charge, and (d) boreholes prepared for charging.
3.1 Seismic sources
To generate P-waves, we employed the 4 t hydraulically driven vibrator MHV4P (Fig. 2a) from the LIAG Institute for Applied Geophysics, which has a vertical shaking unit (Burschil et al., 2021). This vibrator has a peak force of 30 kN and is limited to a minimum frequency of 20 Hz. In areas inaccessible to vehicles, such as the central part of SL-2P, the electrodynamic vibrator ELVIS-7 (Wadas et al., 2016) with a vertical shaking unit was used (Fig. 2b). This wheelbarrow-mounted source, with a 1 kN peak force, can also be deployed along challenging paths. For both sources, a dense vibrator point spacing of 5 m was applied, which corresponds to twice the receiver spacing of 2.5 m. This configuration has been shown to be effective for shallow investigations in previous studies (e.g., Tanner et al., 2015; Wadas et al., 2016; Burschil et al., 2018). A 12 s sweep with linearly increasing frequencies of 20–200 Hz was used. In addition, explosive sources with 1 kg charge per shot point were deployed in four 2 m deep boreholes per location (Fig. 2c and d). Boreholes were created by pushing a 2 m-long metal rod into the ground with a hydraulic breaker mounted on a mid-sized excavator. A 1 m × 1 m metal plate jig was used for positioning. Due to logistical and financial constraints, only 26 explosive shot points were feasible. For S-wave excitation, the ELVIS-7 vibrator with a horizontally oriented shaking unit, positioned perpendicular to the profile, was used. The nominal vibrator point spacing was 4 m (4 times the receiver spacing of 1 m), which represents a compromise between fold and measuring efficiency. A 12 s linear sweep with frequencies of 20–120 Hz was applied for the S-wave surveys.
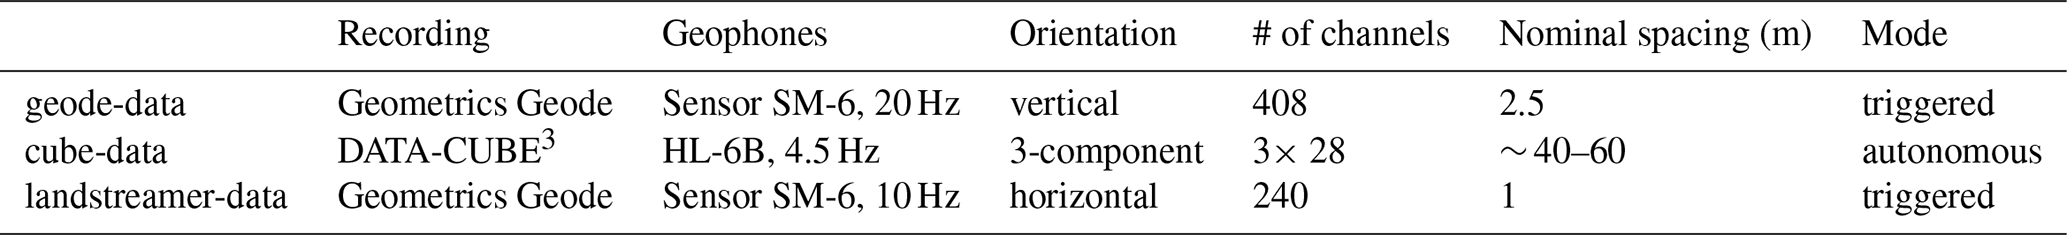
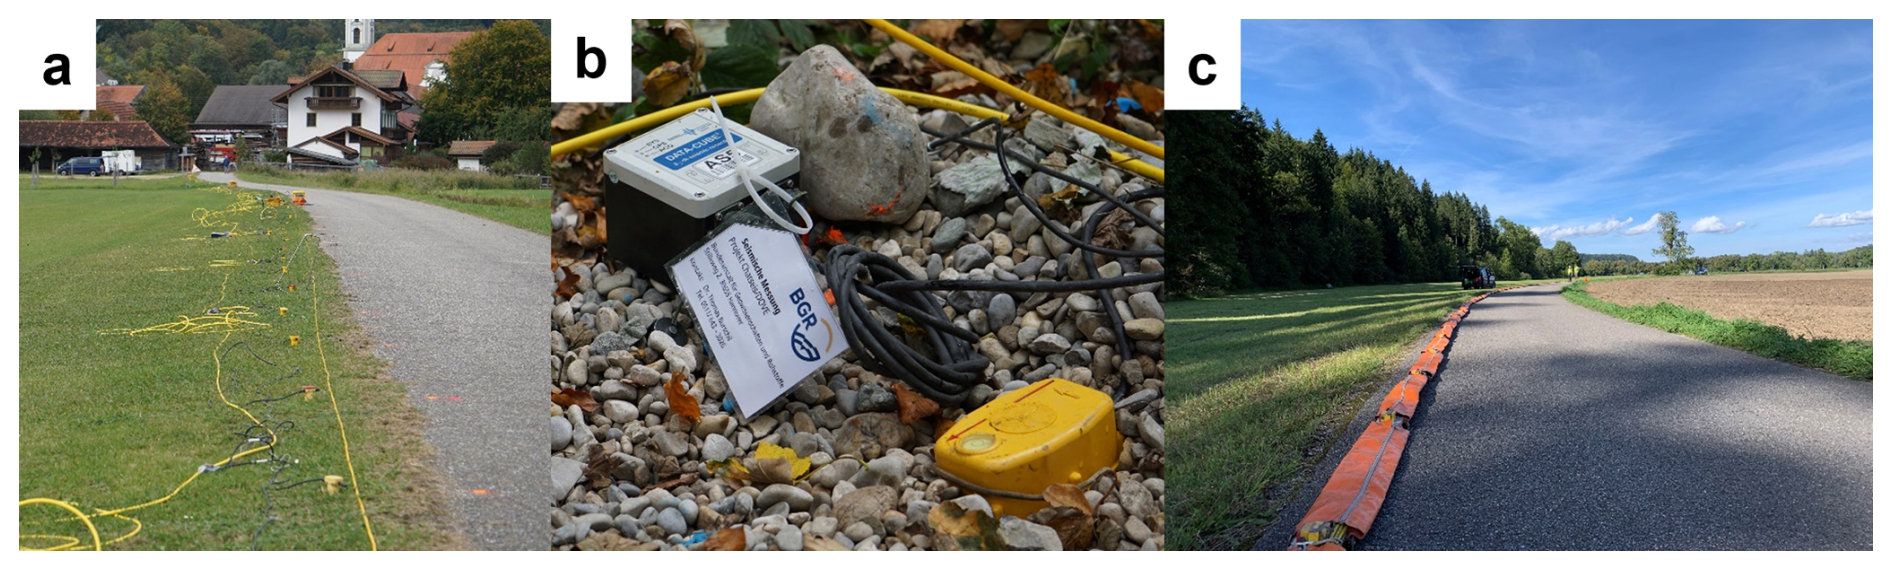
Figure 3Seismic receivers. (a) Planted vertical geophones connected by cable, (b) 3-component geophone and DATA-CUBE3 , and (c) landstreamer with horizontal geophones.
3.2 Recording, receivers, and layout
For the P-wave surveys, 17 Geometric Geodes with 24 channels each were used for recording (Table 2). As receivers, 408 vertical single-component 20 Hz geophones were deployed and connected via cable to the Geodes (Fig. 3a). Each Geode correlated the signal using a pilot sweep and transferred the digitized data to the recording vehicle via a wired network. The nominal receiver spacing was 2.5 m, ensuring dense coverage and a CMP bin size of < 2.5 m to avoid spatial aliasing (cf. Buness et al., 2022). A single spread layout was applied for SL-1P and SL-3P, whereas a split-spread layout with roll-along geometry was used for SL-2P. The roll-along distance was chosen such that the maximum offset was sufficient to image the expected basin depth of approximately 200 m (cf. Burschil, 2024 for more details).
In addition, 28 autonomous Omnirecs DATA-CUBE3 units were deployed along the P-wave profiles (Fig. 3b). Each unit was connected to a three-component 4.5 Hz geophone to record lower frequencies more efficiently than the 20 Hz geophones. The DATA-CUBE3 receivers were placed at 40–60 m intervals in a single-spread configuration.
For the S-wave survey, 10 Geometric Geodes were connected to two landstreamers for recording (Fig. 3c). Each landstreamer consisted of 120 horizontal 10 Hz geophones with 1 m spacing, oriented perpendicular to the profile direction. A split-spread roll-along geometry, as used in previous surveys (Burschil and Buness, 2020), was applied.
We refer to these datasets on the receiver side as geode-data, cube-data, and landstreamer-data, respectively.
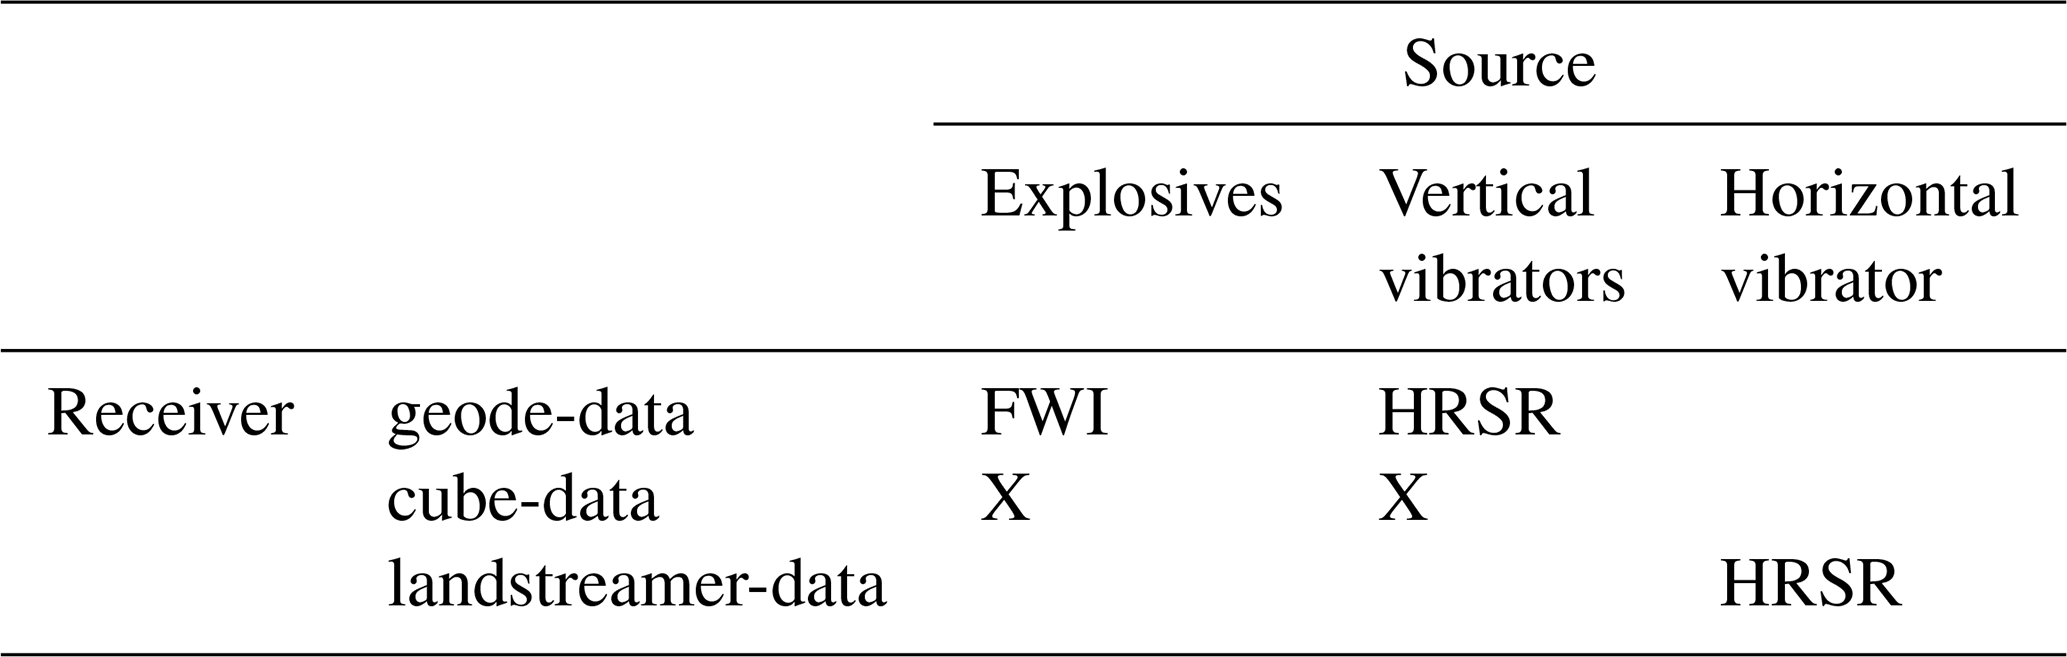
To date, HRSR processing and FWI were performed for different datasets (Table 3). In a future step, the cube-data will contribute to combining HRSR and FWI.
Table 3Processing of different datasets. The cube-data are not processed yet.
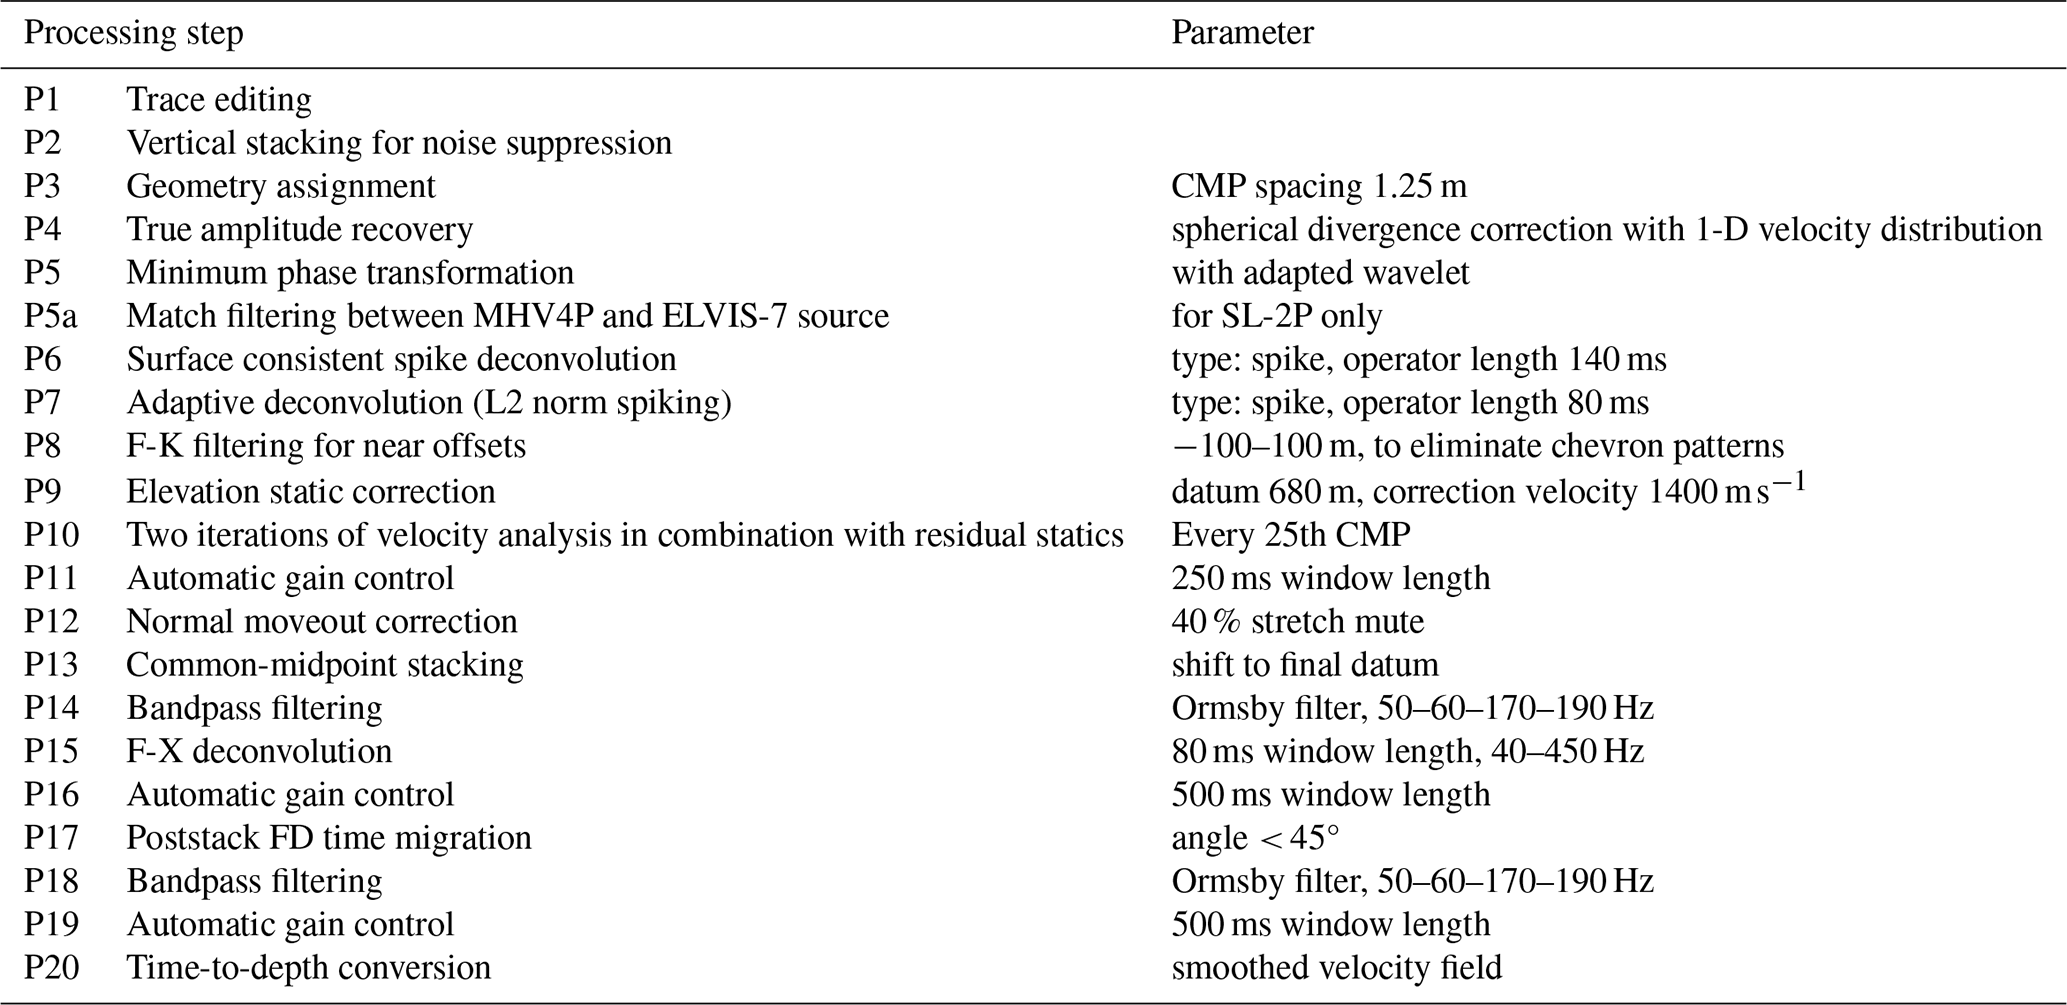
4.1 HRSR processing
P-wave data were processed using Landmark ProMAX/SeisSpace. The same processing workflow and parameters were applied to all profiles, comprising several processing steps, as summarized in Table 4. Step P5a was applied only to profile SL-2P. The combination of elevation static correction and residual statics proved sufficient so that no refraction static correction was required. Step P10 yielded a stacking velocity field every 25th CMP, which was subsequently converted and adapted for migration (step P17) and time-to-depth conversion (step P20).
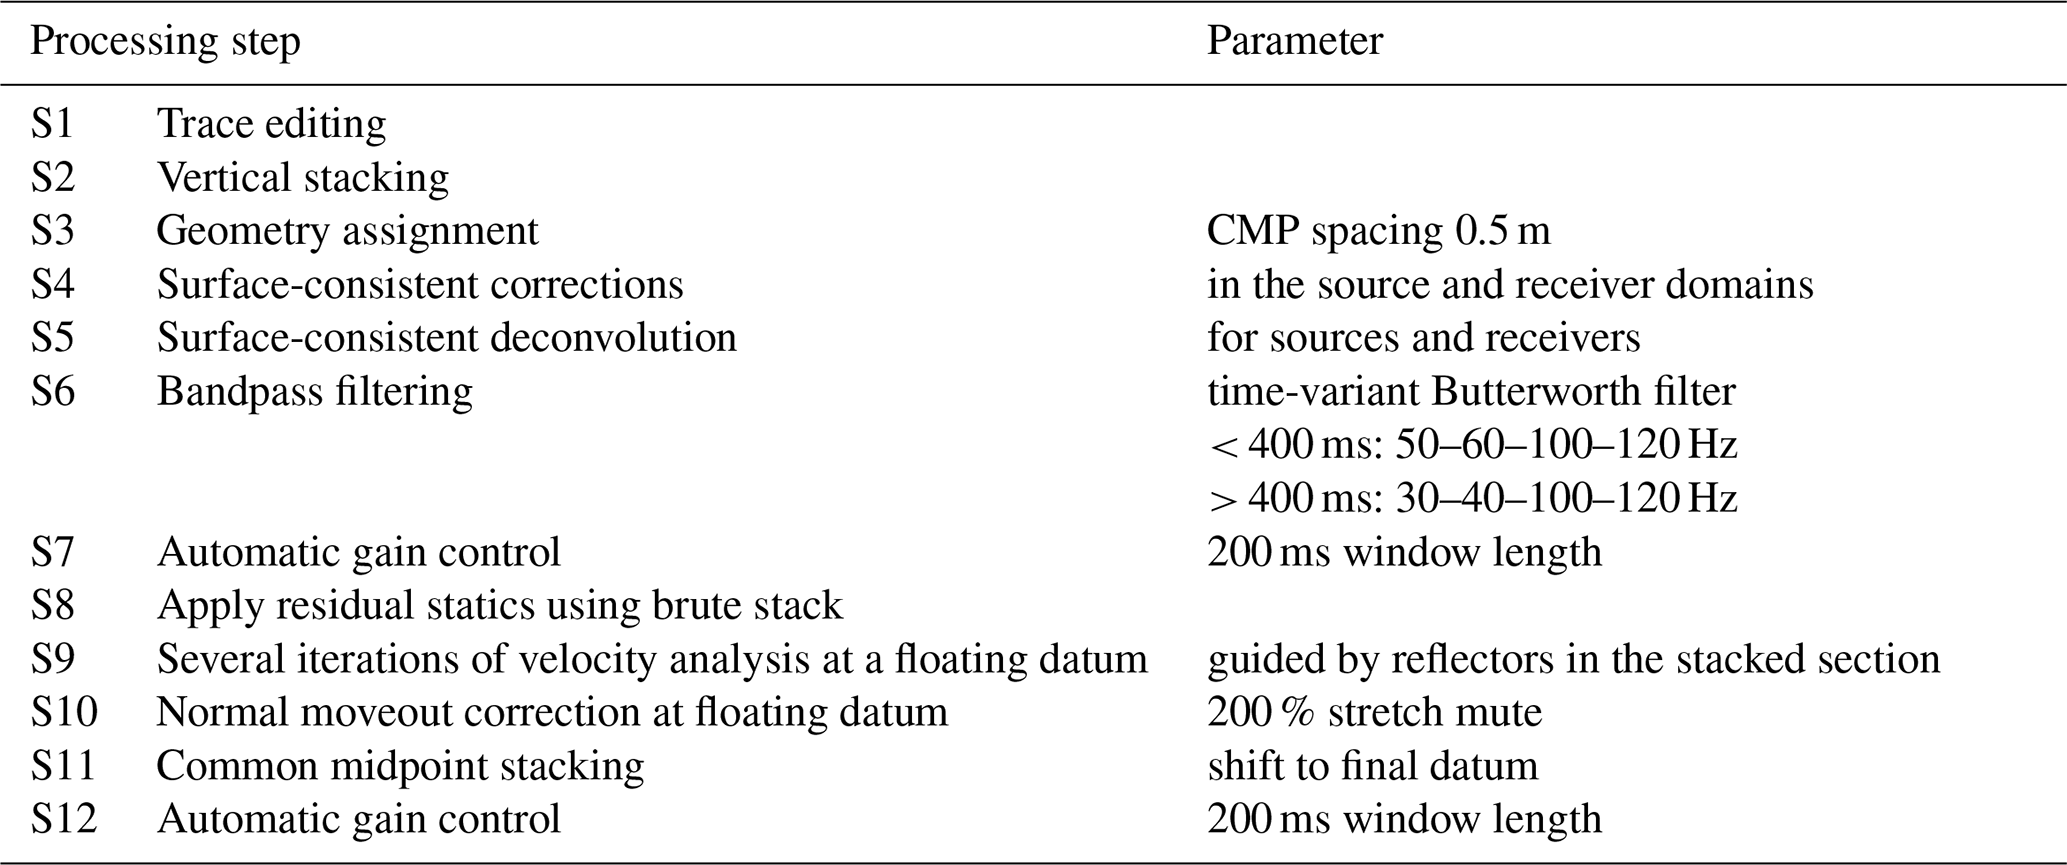
S-wave processing of horizontal-vibrator and landstreamer-data was adapted from the workflow described in Burschil and Buness (2020) and carried out using Shearwater Reveal. The same processing sequence was applied to all profiles, the individual steps are summarized in Table 5. Step S9 provided the stacking velocities, which were analyzed at intervals of at least 50 m, then smoothed and converted to interval velocities using the Dix equation (Sheriff and Geldart, 1995). For step S10, a 200 % stretch mute was applied during NMO correction to account for the low velocities of the S-waves. Migration was omitted to avoid migration artifacts.
4.2 Full waveform-inversion
For FWI, the latest version of DENISE Black Edition (Köhn et al., 2012, 2025) was used. This multiparameter FWI simultaneously optimizes the P- and S-wave velocities as well as the density, employing adjoint state gradients within the L-BFGS optimization method (Liu and Nocedal, 1989). As input data for the first FWI, we used the geode-data from the explosive sources. The raw data were preprocessed with a 30 Hz high-cut filter. The initial P-wave model was constructed as a 1-D gradient model based on first-arrival analysis. The initial S-wave velocity model vS was estimated from the P-wave velocities vP using the relation:
The initial density model ρ is derived from the empirical relation by Ulugergerli and Uyanik (2007):
Analysis of the Rayleigh surface waves, compared to the P-wave first arrivals, revealed a significant influence of damping, so that a visco-elastic modelling approach was adopted. To mitigate the non-linearity of the inverse problem, a sequential inversion was performed, inverting field data in frequency bands up to 7, 10, 15, 20, 25, and 30 Hz, in this order. The source wavelet for each source gather was estimated by a stabilized Wiener deconvolution. An anisotropic, spatial 2-D Gaussian filter imposed smoothness constraints on the adjoint state gradients; its length was scaled to the local P- and S-wavelengths, applied 1× the local wavelength in the x-direction and 0.5× in the y-direction. Parameter cross-talk was mitigated by using quasi-Newton L-BFGS optimization with parameter scaling, where density updates were reduced by a factor of 0.5 compared to the velocity updates. Finally, a global correlation norm was employed as an objective function to minimize source-receiver coupling effects.
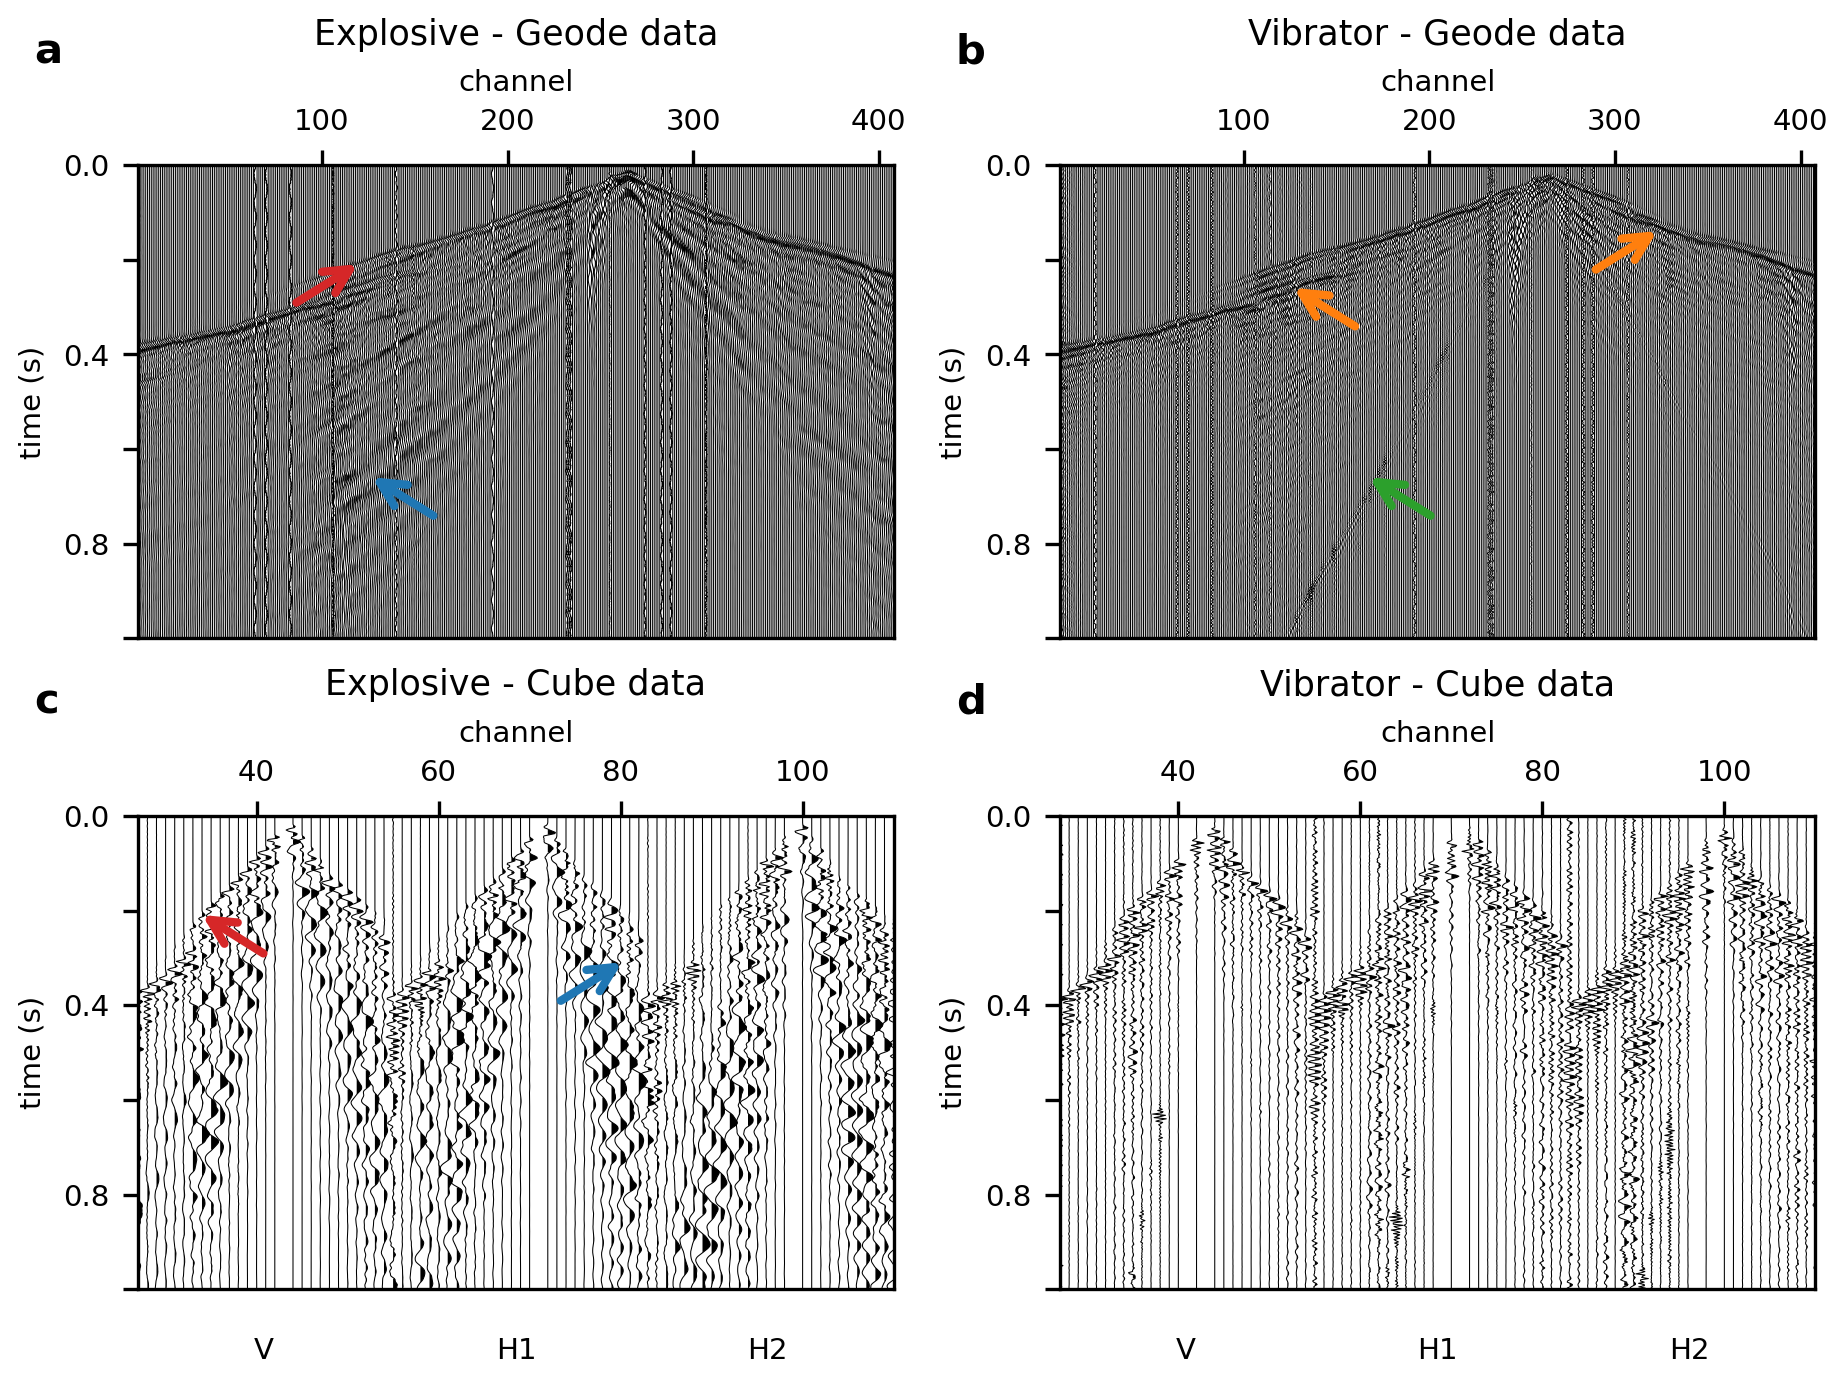
Figure 4Records for one source location (corresponding power spectral density in Fig. 5). (a) Explosive source and geode-data (20 Hz geophones), (b) vibratory source and geode-data (20 Hz geophones), (c) explosive source and cube-data (3-component 4.5 Hz geophones), (d) vibratory source and cube-data (3-component 4.5 Hz geophones). Note the strong surface waves (blue arrows) and the clear first arrivals (red arrows) in the explosive data, the high frequency reflections (orange arrows) in the vibratory data, as well as the air blast (green arrows).
5.1 Field data and spectral composition
The acquired data exhibit excellent quality across all source and receiver configurations (Fig. 4). Explosive sources provided strong ground coupling and sufficient penetration depth. The dense receiver spacing of the geode-data ensures distinct first P-wave arrival (red arrows in Fig. 4), which is essential to construct the initial P-wave model for FWI. In contrast, the explosive data show strong surface waves, which appear aliased in the sparsely spaced cube-data (blue arrows). The MHV4P vibrator source produced high-quality reflections (orange arrows) and generated less surface waves than the explosive source data. Air wave noise is also visible in the data (green arrow).
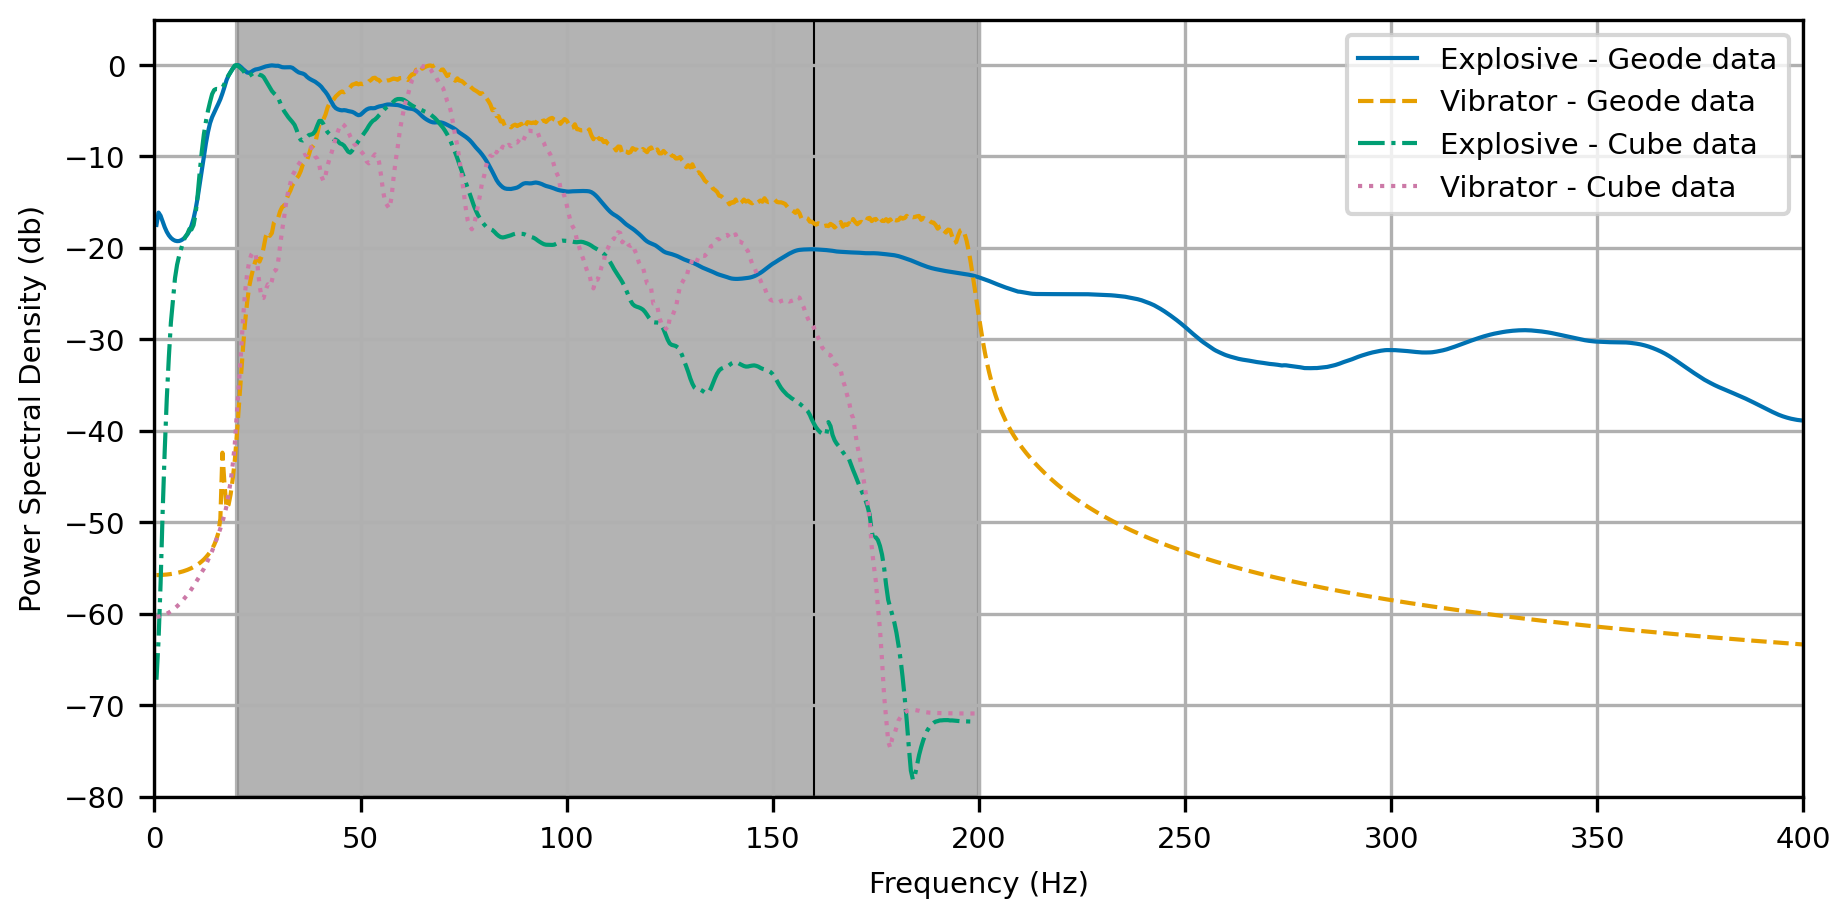
Figure 5Power spectral density for one record at profile SL-1P (corresponding record in Fig. 4). Explosive source and 20 Hz geophones (blue solid line), vibratory source MHV4P and 20 Hz geophones (orange dashed line), explosive source and vertical component of 4.5 Hz geophones (green dash-dotted line), vibratory source and vertical component of 4.5 Hz geophones (red dotted line). The sweep frequency range is shaded (gray).
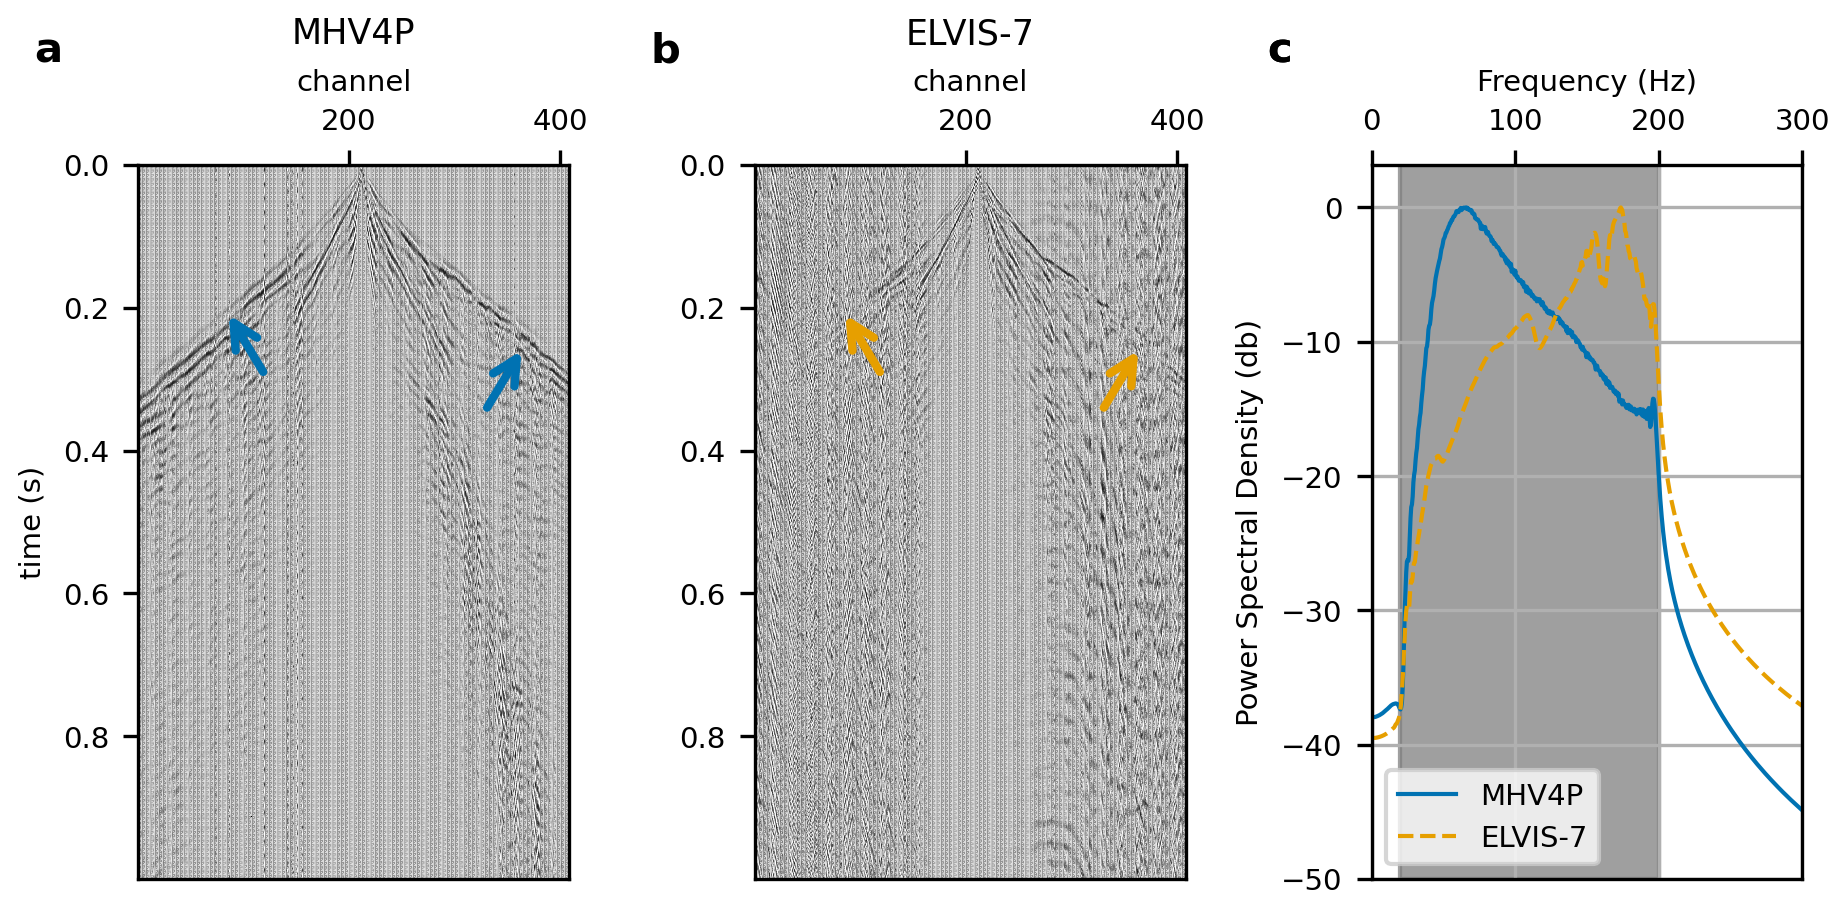
Figure 6Records of geode data for neighbouring source locations for vibrators: (a) MHV4P and (b) ELVIS-7, and (c) corresponding power spectral density for vibrators MHV4P (blue) and ELVIS-7 (orange); the sweep frequency range is shaded (gray). The different source strength can be observed by first arrivals that are visible along the entire profile for MHV4P (blue arrows), but not for ELVIS-7 (orange arrows).
The frequency content of the P-wave data varies among the different source-receiver configurations (Fig. 5). The vibrator-source geode-data (20 Hz geophones) display the full sweep frequency range of 20–200 Hz. The corresponding cube-data (4.5 Hz geophones) reproduce the same lower frequency ramp but exhibit a high-frequency cut-off near 160 Hz. This limitation arises from a built-in anti-alias filter of the DATA-CUBE3, which operates at approximately 80 % of the Nyquist frequency (160 Hz; T. Ryberg, private communication, 2025), given by the maximum sampling interval of 2.5 ms (400 Hz). For the explosive sources, frequencies below 20 Hz are clearly observed in all datasets. Even the geode-data with 20 Hz geophones contain a significant amount of energy below their nominal resonance frequency, showing a low-frequency spectrum similar to the cube-data. However, the baseline level at these frequencies is considerably lower for the cubed data than for the geode-data.
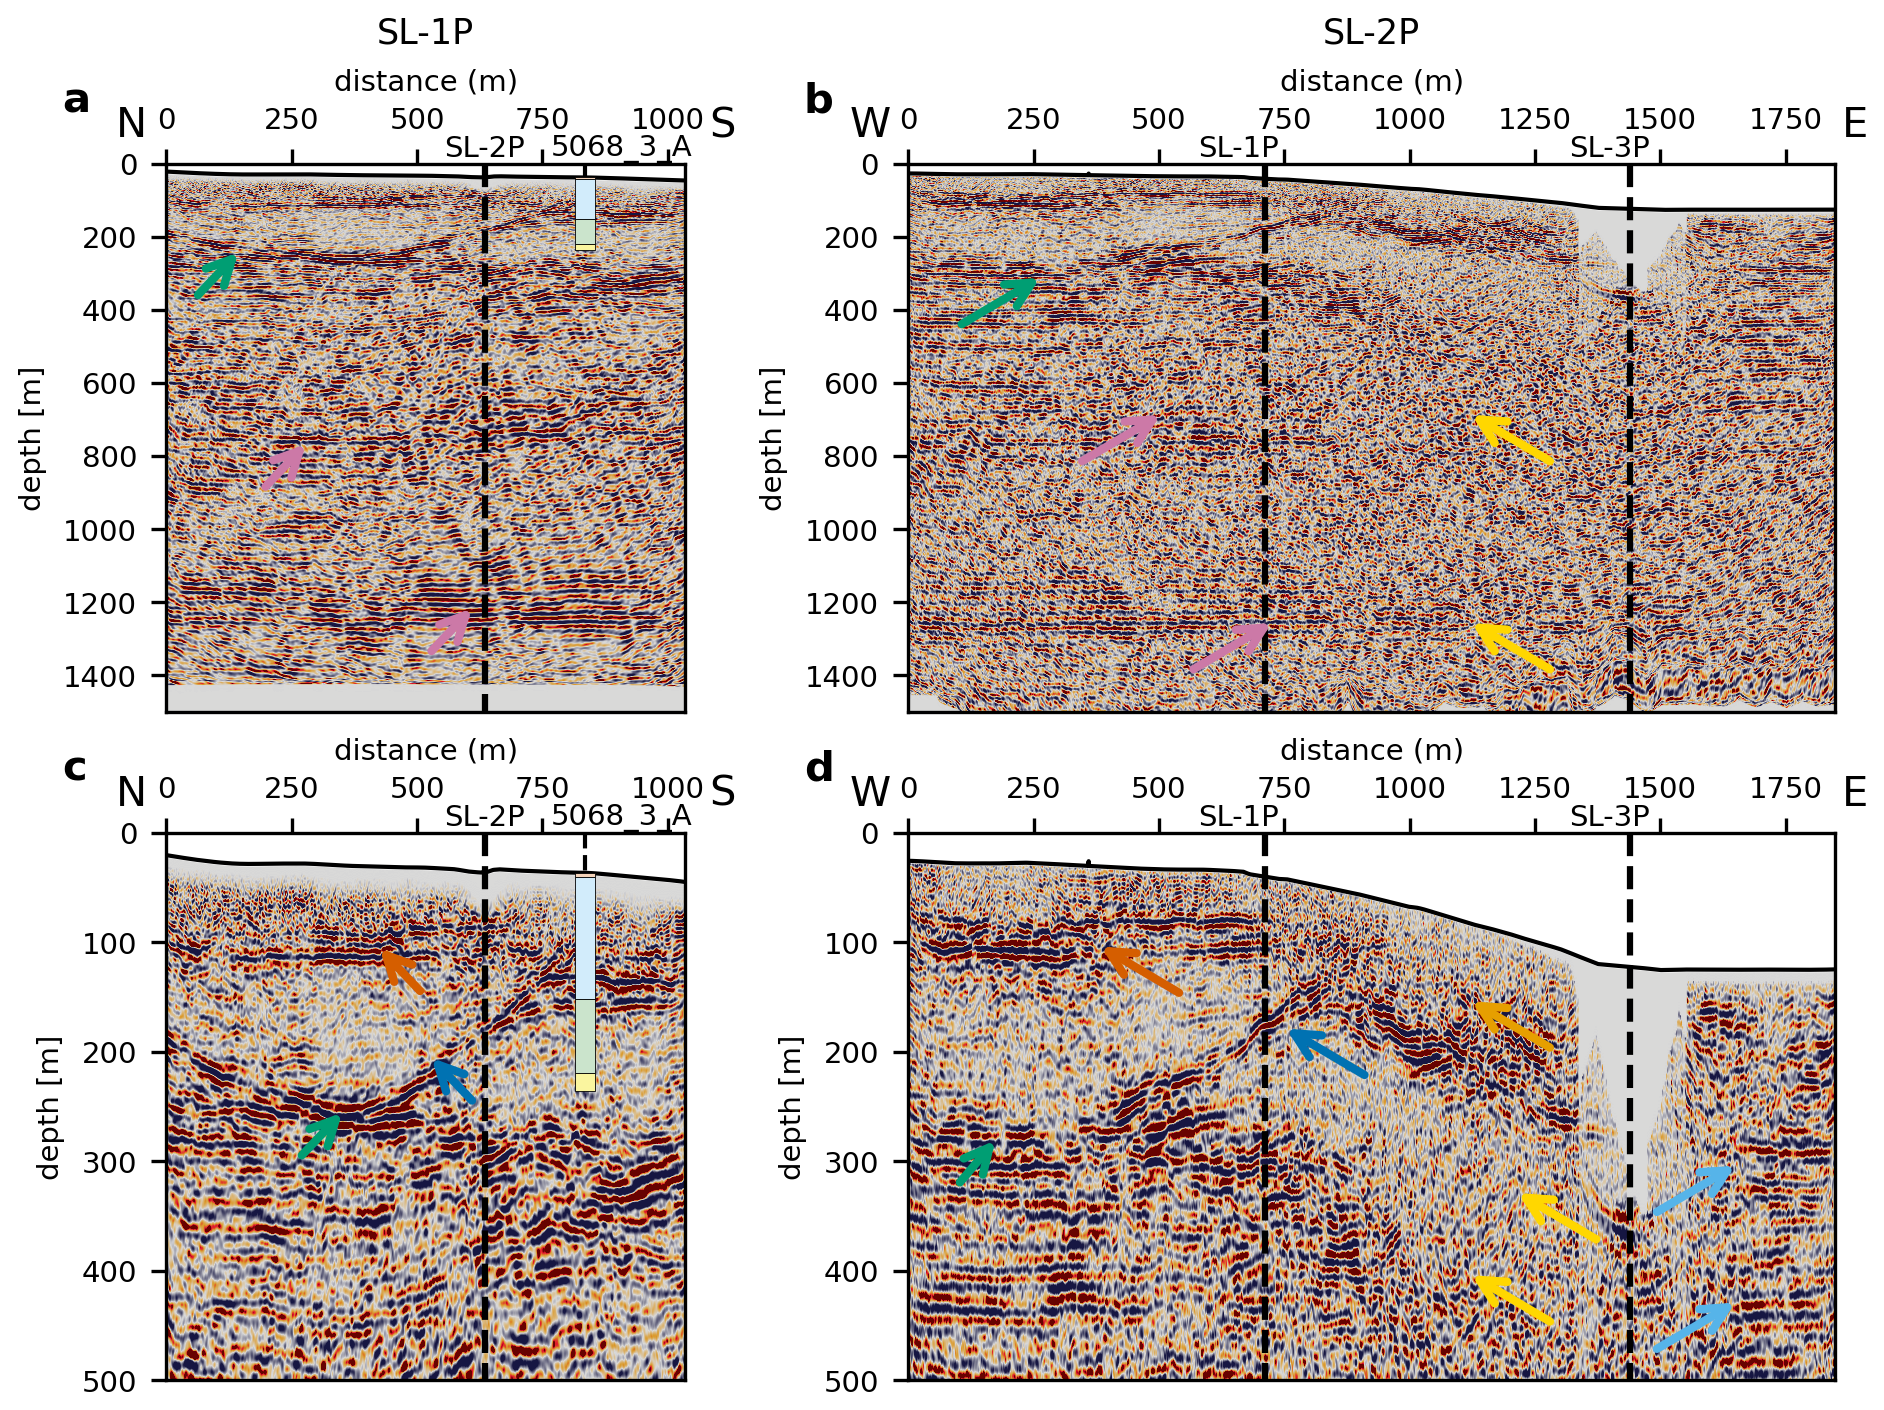
Figure 7Migrated stacks of (a) SL-1P and (b) SL-2P and close-up of the first 500 m in the same profiles with 1.6 × vertical exaggeration (c, d). Highlighted by arrows are horizontal Molasse reflectors (red), shallow Molasse reflectors (pink), basin base (green), unconformity of bipartitioning (blue), basin internal reflectors (purple), shallow reflectors (orange), and areas with less penetration (yellow). The ELVIS-7 source was deployed on SL-2P only, between SL-1P and SL-3P. The log of borehole 5068_3_A (cf. Fig. 1c) shows the generalized dominant lithology: organic soil (orange), gravel (blue), fines (green), and sand (yellow).
In the central part of profile SL-2P, we used ELVIS-7 vibrator source (peak force of ∼ 1 kN) that emitted substantially less energy than the 4 t hydraulic vibrator MHV4P (peak force of 30 kN), which can be observed clearly in the data (Fig. 6). While first arrivals from the MHV4P can be clearly traced across the entire receiver spread (blue arrows in Fig. 6), those from ELVIS-7 are only visible at offsets below 250 m (orange arrows). The emitted energy of the ELVIS-7 source is less than the energy of the MHV4P, as we directly observe in the data. Nevertheless, both sources produced a frequency content for the entire sweep from 20–200 Hz above the background noise level (Fig. 6c).
Similar to the presented P-wave data, S-wave data show a good data quality (not shown). First arrivals and reflections can be observed on most records.
5.2 HRSR P-wave stacks
The newly-acquired data utilizing the vibrator sources and geode-data are able to image the basin base and internal reflectors (Fig. 7). The eastern profile SL-3P shows only horizontal reflectors, similar to the eastern end of SL-2P, and is therefore not shown. On all profiles, we observe horizontal reflectors below 300 m final datum that we interpret as Molasse units (red arrows). These reflectors can also be found at a shallower depth of the eastern part of SL-2P (pink arrows) and on the entire profile SL-3P (not shown). Thus, we infer that in the eastern part of the study site no basin is present, but that it is dominated by Molasse units. We interpret strong reflectors (green arrow) as basal till at the basin base. A dipping reflector within the basin (blue arrows) separates two generations of basin fill, which was previously unknown. Further internal reflectors are visible as well (purple arrows). The log of borehole 5068_3_A fits the reflectors and supports the interpretation. Unfortunately, the borehole can only support the interpretation for one part of the bipartitioned basin. In the part of SL-2P where we deployed the weaker ELVIS-7 source (between SL-1P and SL-3P in Fig. 7b and d), we observe shallow reflections (orange arrow), but cannot trace the deeper reflectors (yellow arrows) due to less penetration. Therefore, the eastern rim of the basin, that is the transition of the basal basin (green arrows) towards the shallow Molasse reflectors (pink arrows), is not imaged.
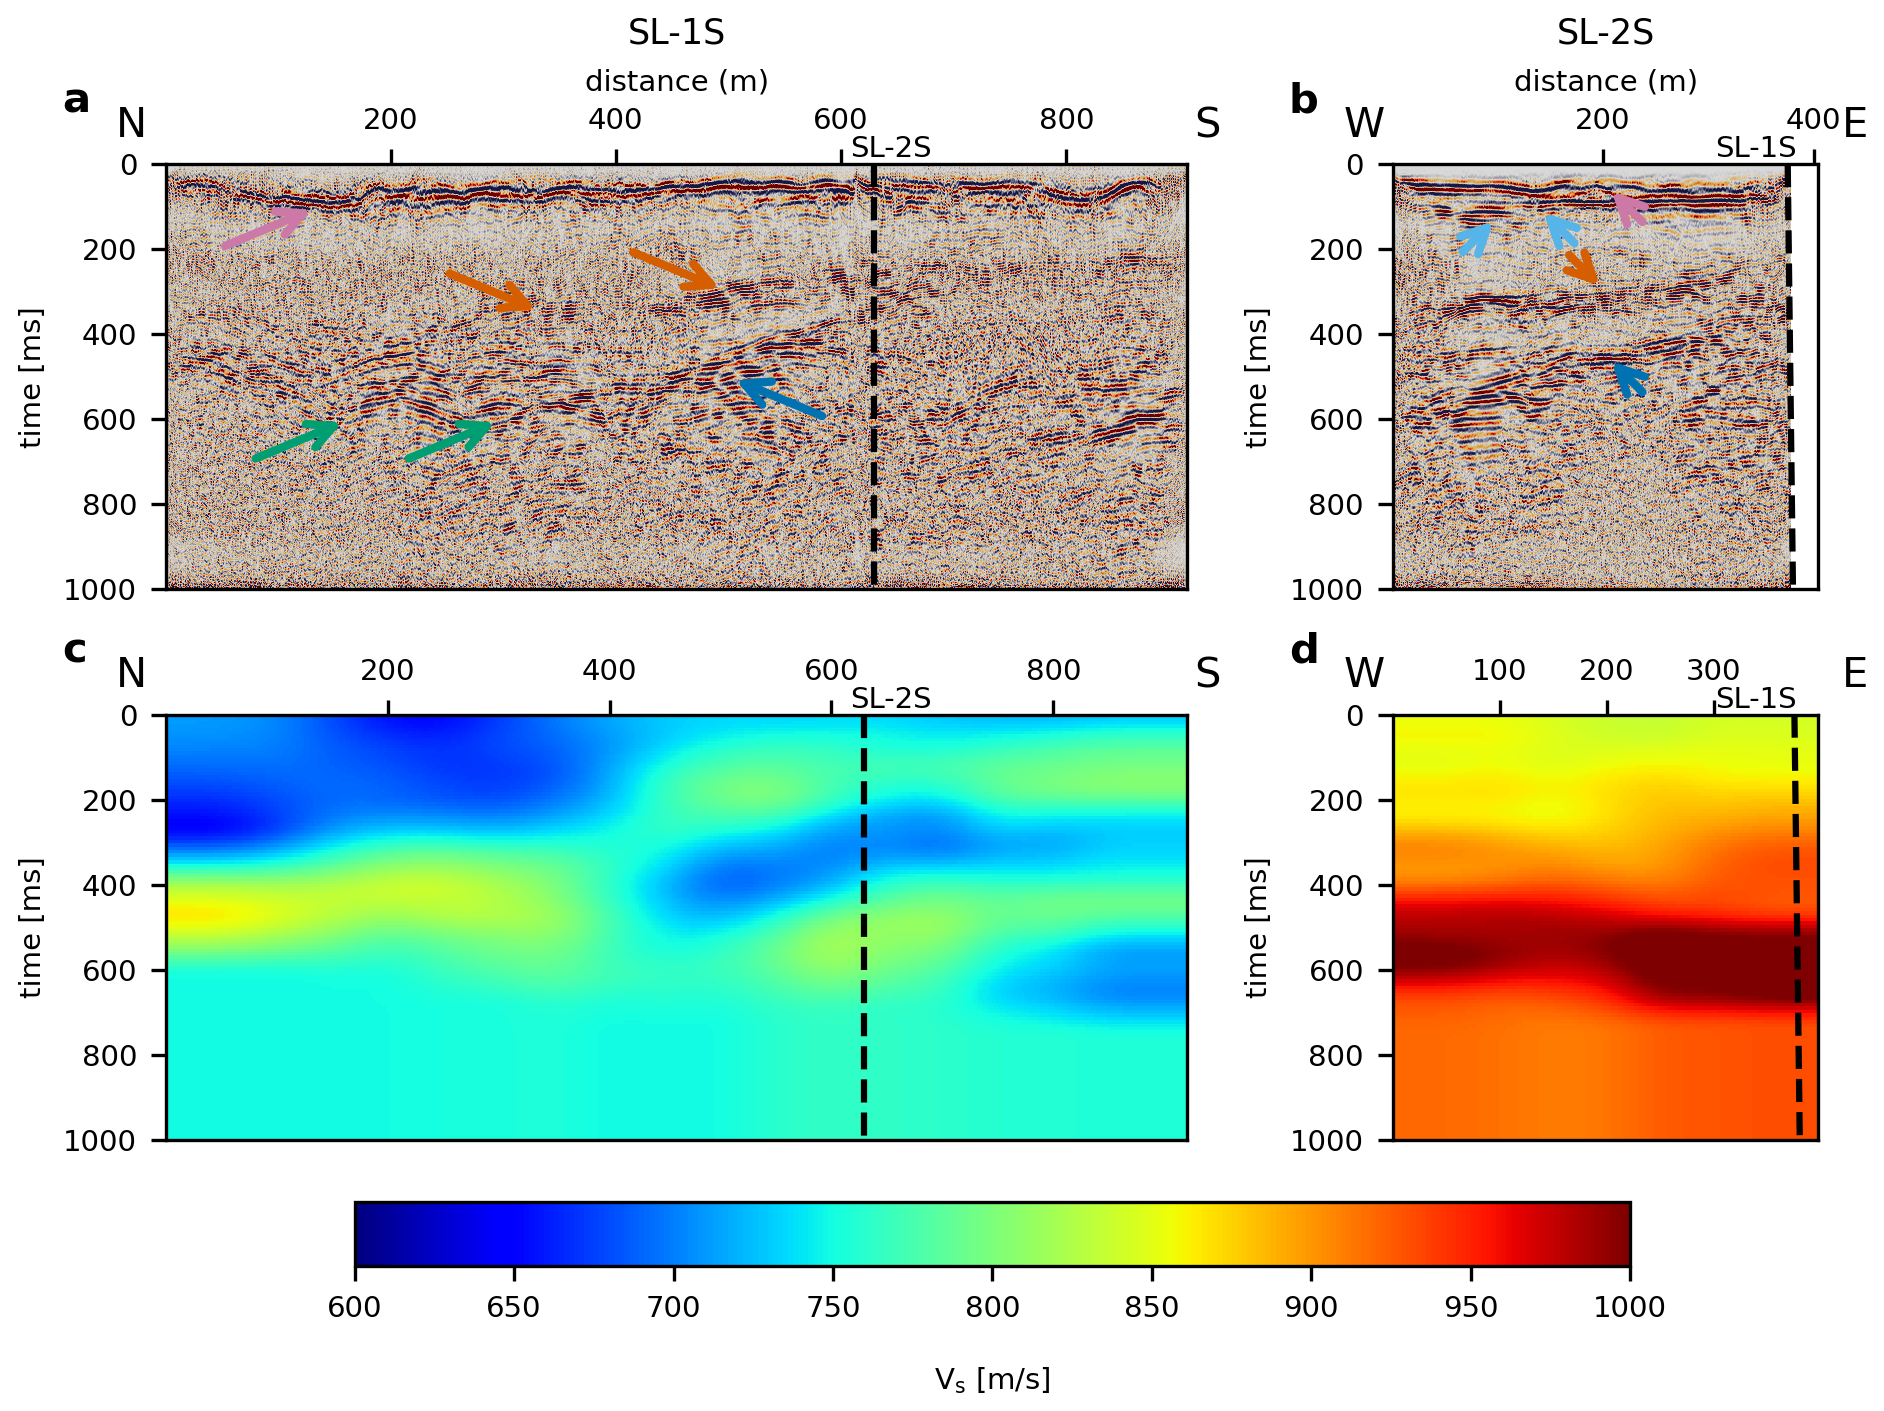
Figure 8Stacks of (a) SL-1S and (b) the western part of SL-2S and S-wave interval velocities of (c) SL-1S and (d) the western part of SL-2S. Highlighted by arrows are: basin base (green), basin-internal reflectors (purple), intra-basin discontinuity (blue), shallow reflections (red), and shallow discontinuity (pink).
5.3 S-wave stacks and velocities
Stacks of the S-wave data show reflections from a few ms to about 700 ms two-way traveltime, generated by a small-scale ELVIS-7 source. The sections show a similar structural image of the subsurface but with some differences (Fig. 8a and b) compared to the P-wave images (Fig. 7):
- 1.
The reflections are less continuous compared to the P-wave data.
- 2.
S-wave data have less penetration depth than P-wave data.
- 3.
S-wave data show a much higher resolution than the P-wave data.
In detail, we interpret a strong reflection (green arrows) as basal till at the basin base. This reflection shows an undulation that cannot be seen in the P-wave data. A reflection separates the bipartioned basin infills, as seen in the P-wave data (blue arrows). This also exhibits more details than the P-wave data, but is also less continuous. A basin-internal reflection is visible in the S-wave data (purple arrows) that is not present in the P-wave data. In the very shallow part, we observe a continuous reflection (red arrows) with a second reflection directly underneath (pink arrows). Both can be seen in the P-wave data as well, but S-wave data clearly show an overlap of this reflection (pink arrows) that is not visible in the P-wave data. The high resolution of the S-wave data enables detailed interactive velocity picking. S-wave interval velocities (Fig. 8c and d), calculated from the stacking velocities, show lateral variations that match the overall geology.
5.4 Full-waveform inversion
The different stages of inversion of the explosive source and geode-data show a successful updating of the velocity and density distributions from the initial 1-D gradient models to the most detailed model of the last stage, inverting frequencies from 7 to 30 Hz (Fig. 9). Distributions of changes of the last stage compared to the initial model reveal the potential of FWI. The P-wave velocity distribution (Fig. 10a) reveals an undulation in the velocities, which represents small-scale lateral variations in the velocity distribution (red arrows). The velocities fit the reflectors of the stacked section (Fig. 10b; purple arrow). However, the FWI results contain details up to 30 Hz, while the stacked section contains data up to 170 Hz. The P-wave velocities of the FWI are in the similar range of the P-wave migration velocity field, derived from HRSR processing (Fig. 10c).
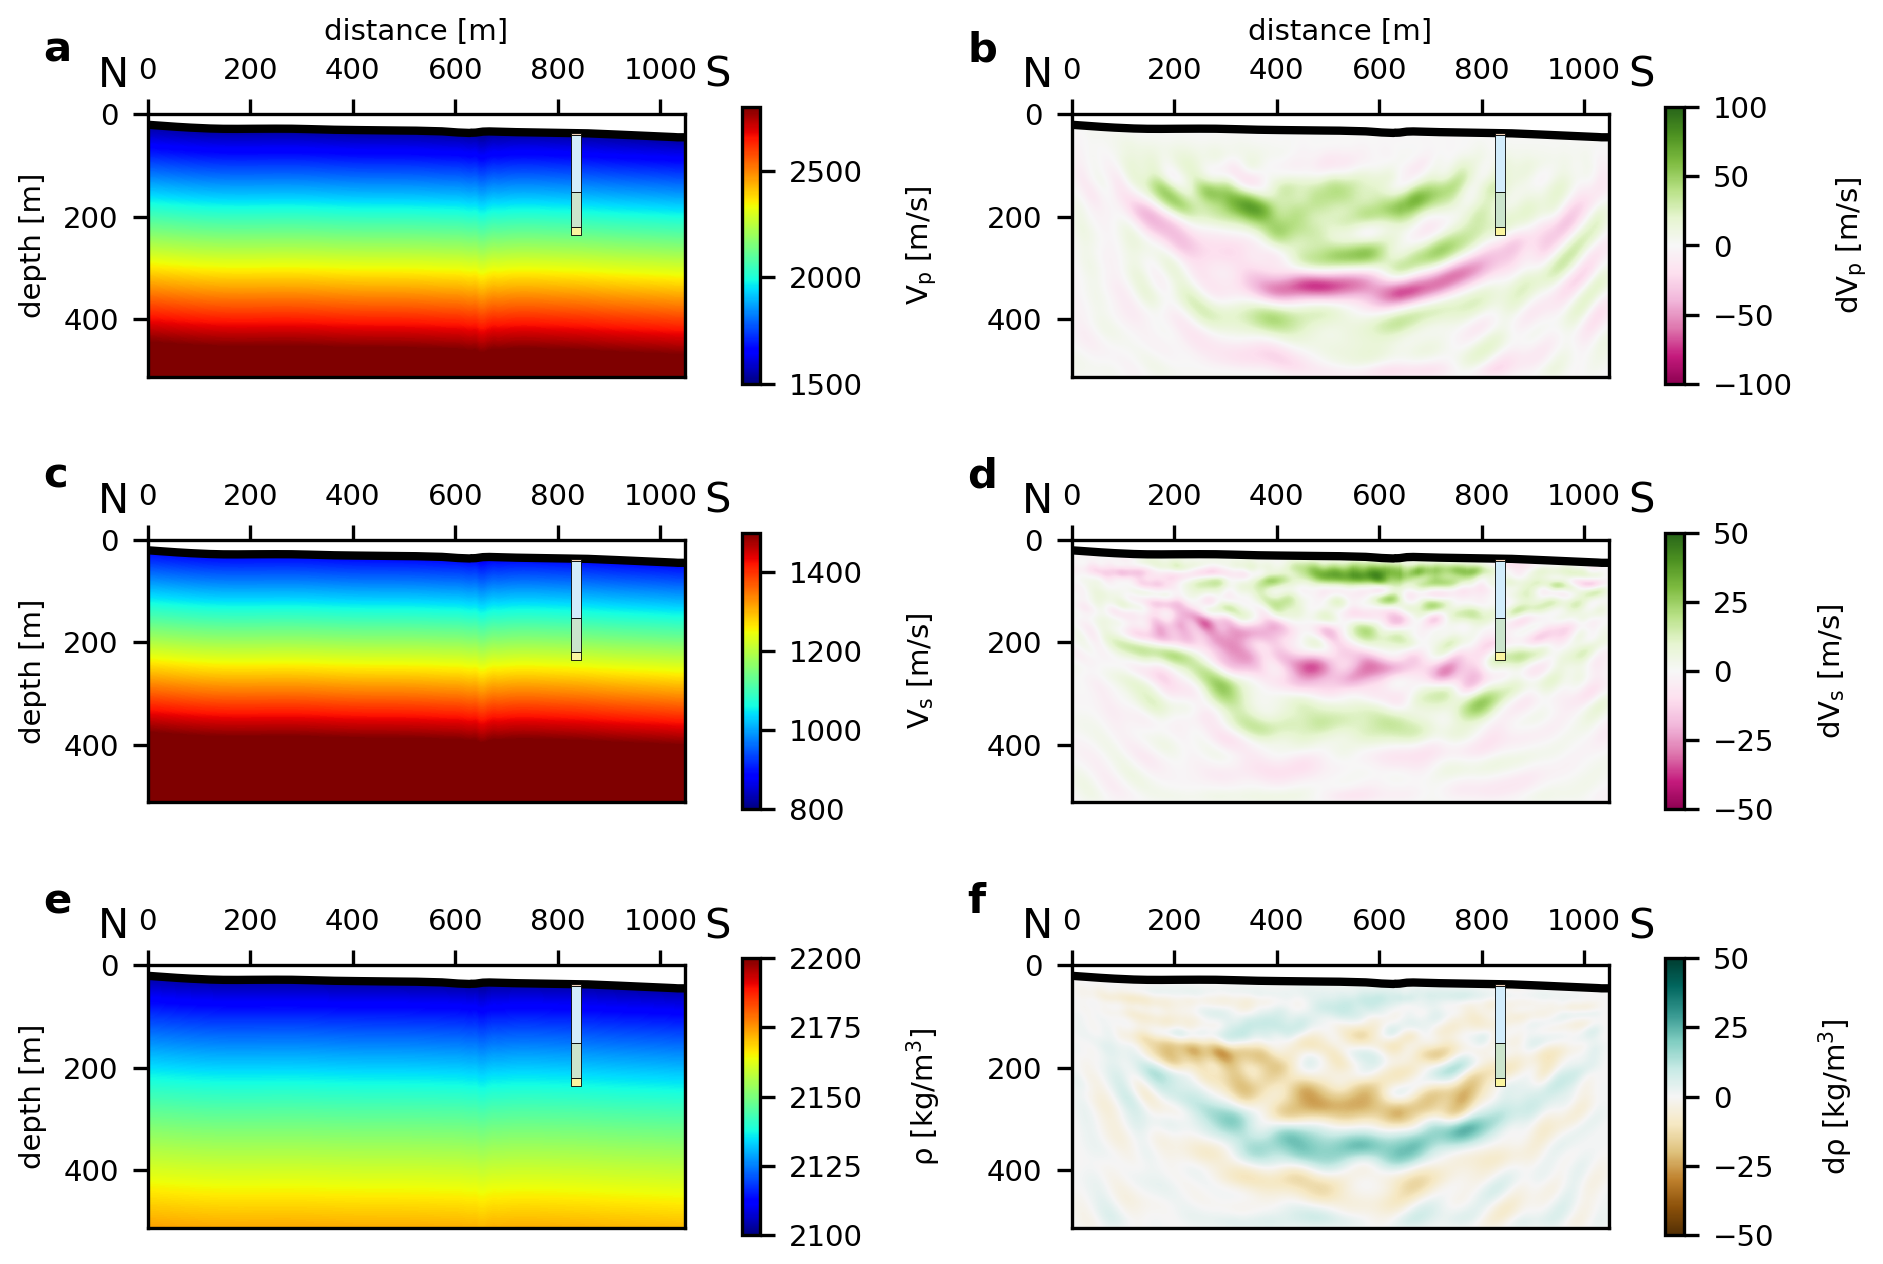
Figure 9Initial models and changes of the FWI of SL-1P to the initial model for (a, b) P-wave velocity, (c, d) S-wave velocity, and (e, f) density.
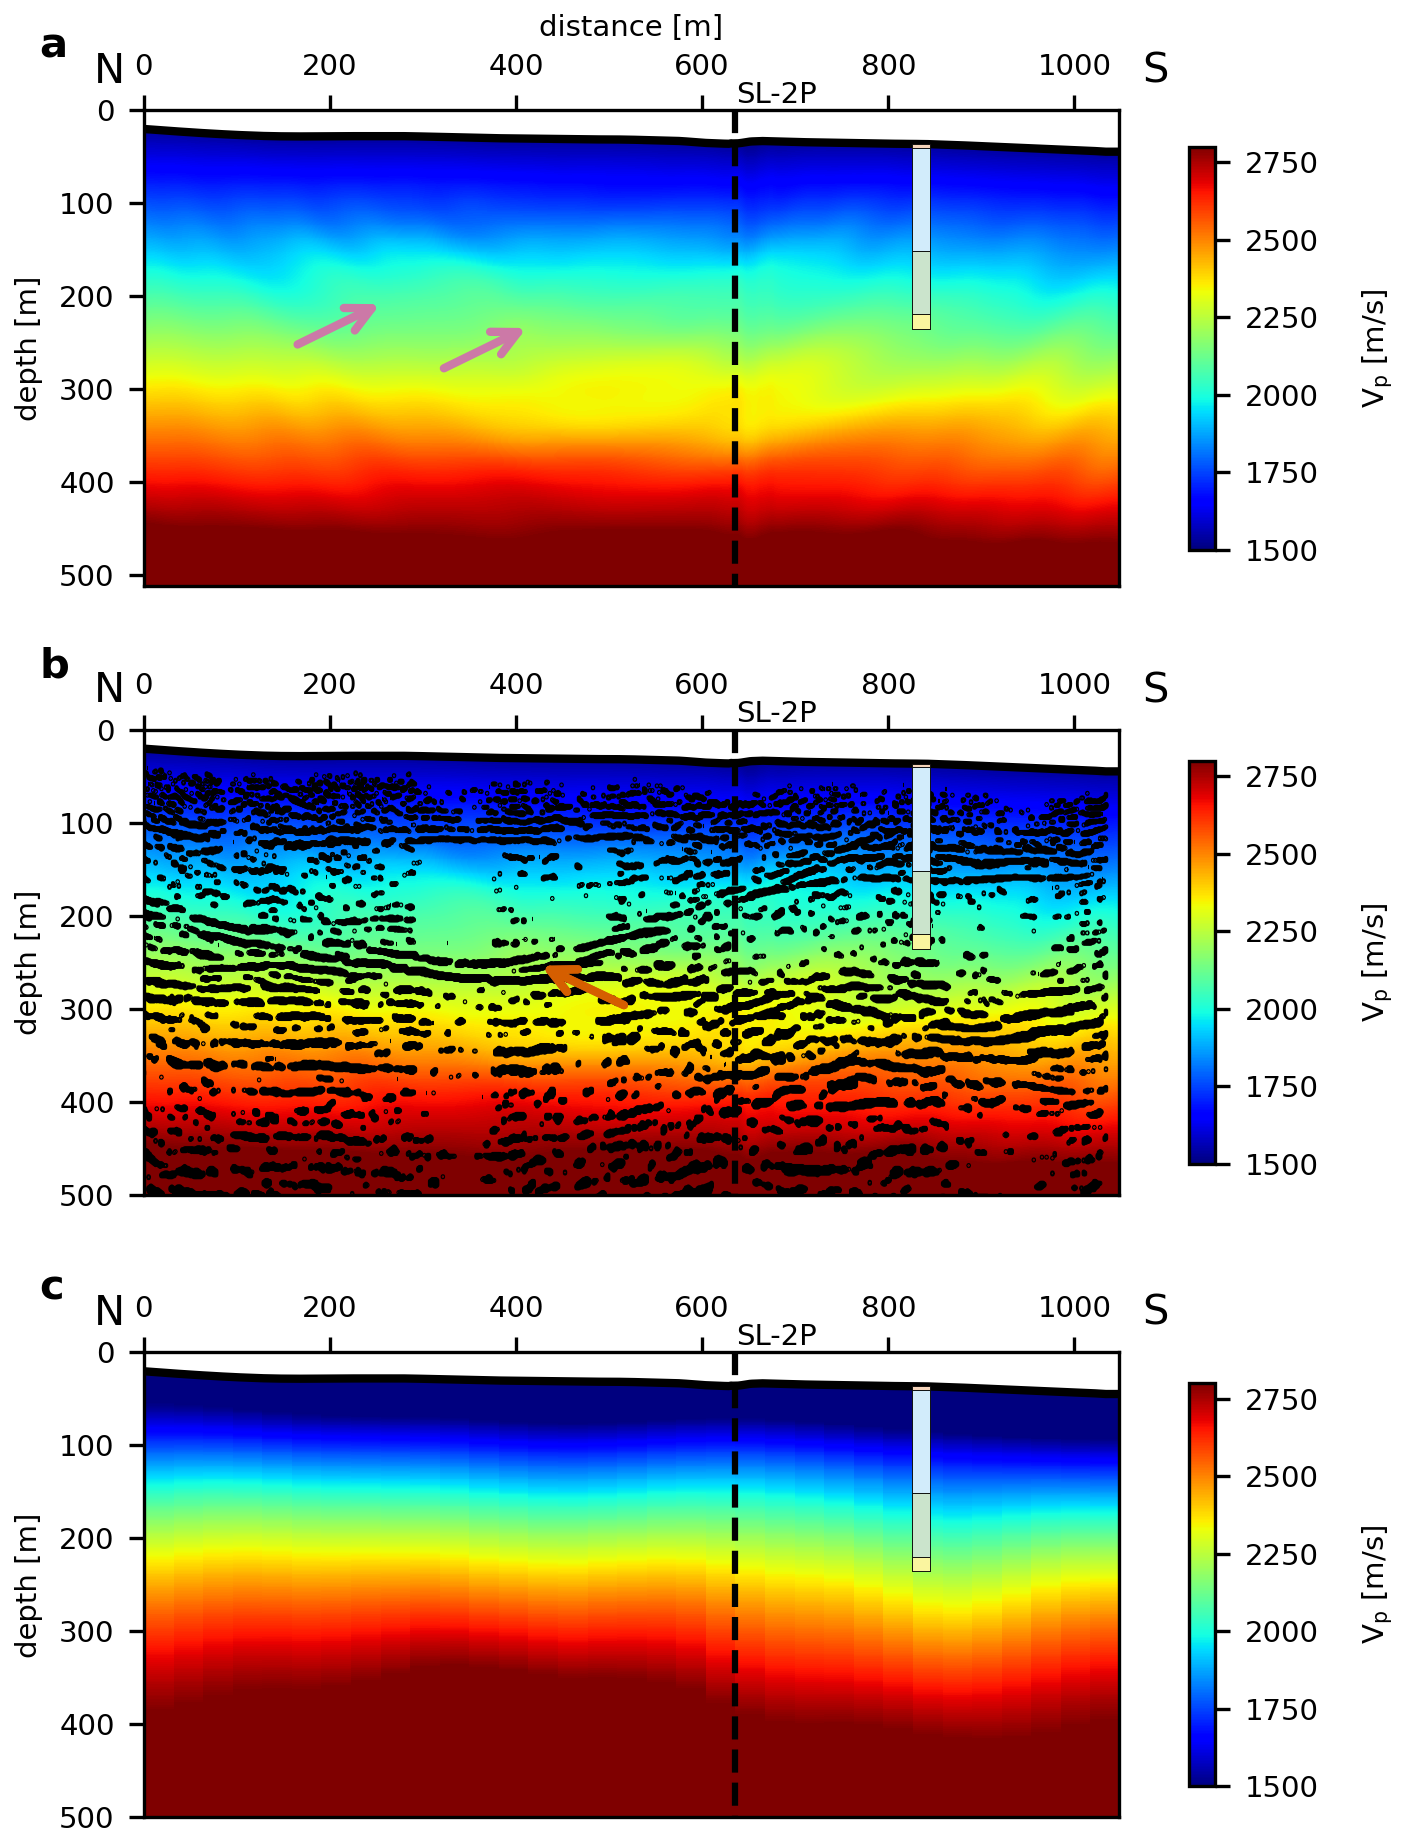
Figure 10Distributions from (a) the last stage of FWI of SL-1P for P-wave velocity, (b) FWI P-wave velocity with superimposed seismic section, and (c) P-wave velocity from HRSR processing. Highlighted by arrows are: undulations (red arrows) and matching with reflectors in the seismic P-wave section (purple arrow).
The datasets provide a valuable basis to develop the combination of HRSR and FWI for near-surface seismic imaging. The survey parameters were chosen to cover both requirements for HRSR as well as FWI analysis. For HRSR, we used parameters that worked well in Quaternary environments in the past (e.g., Burschil et al., 2018; Buness et al., 2022). The lower sweep frequency of the vibrator data was determined from the technical limits of the available MHV4P vibrator. We chose the upper sweep frequency (200 Hz) due to damping and thus limited benefit of higher frequencies. The charge of the explosives was specified by the blaster. The previous refraction survey of the Bavarian Environment Agency in 2018 used charges of 250 g, but they were not able to penetrate through the coarse-grained sediments. For this reason, we increased the charge to 1 kg. The blaster split the 1 kg charge into four 250 g charges per borehole to avoid blowouts.
The lower frequency content of the cube-data is a valuable contribution to the further development of combining HRSR and FWI for the explosive sources. However, the geode-data (20 Hz geophones) show a similar frequency content for the vibrator source as the cube-data (4.5 Hz geophones). Therefore, the effort for this setup is questionable if only vibrator sources are available.
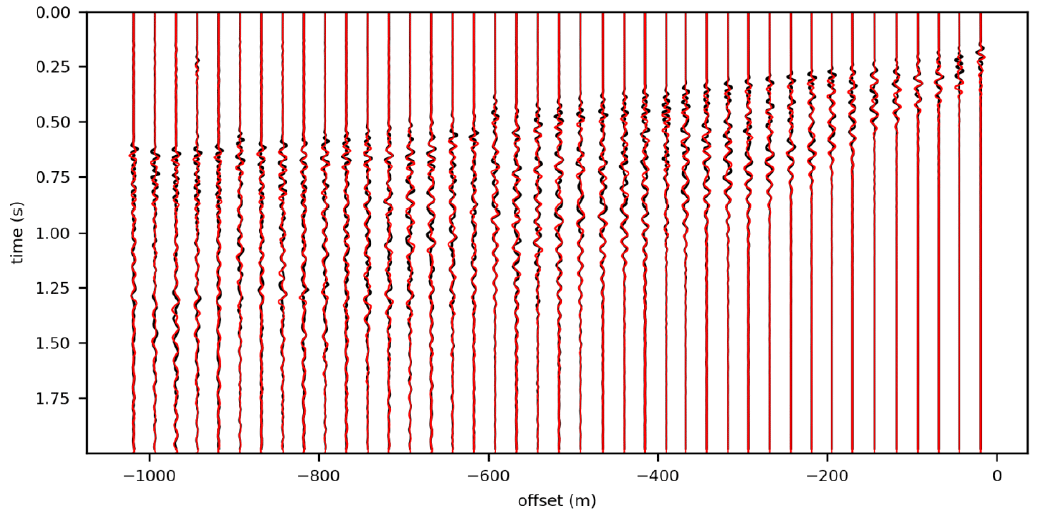
Figure 11Example of field data (black lines) and forward modelled data of the last stage (red lines) of one record. Modelled traces match the field data.
A first attempt with explosive sources and the geode-data (20 Hz geophones) shows the potential of FWI to image sedimentary deposits in these environments. The forward-modelled data of the last stage match the field data without cycle skipping (Fig. 11), so that the FWI works sufficiently for the acquired data. However, FWI is often applied to marine data, which often have a better signal-to-noise ratio. Land studies sporadically show the successful application of FWI (e.g., Köhn et al., 2012). On land, horizontally-polarized S-wave data are often inverted to simplify the inversion problem (e.g., Schwardt et al., 2020; Köhn et al., 2019; Mecking et al., 2021). The penetration depth of the Rayleigh wave is ca. one local S-wavelength (Sheriff and Geldart, 1995). For an average S-wave velocity of 1300 m s−1, we get a maximum penetration depth of ∼ 43 m at 30 Hz and ∼ 185 m at 7 Hz. However, as can be seen in the waveform comparison of the records (Fig. 11), the waveforms of first arrival refraction and diving waves can also be fitted, so the maximum resolution depth extends to ∼ 0.5 × maximum offset of the acquisition geometry (∼ 400–500 m). The applied staged FWI workflow of this study converges successfully, provides a consistent and physically reasonable solution, and matches the HRSR results.
A preliminary interpretation of the P-wave data shows detailed structure within the basin fill. Our interpretation fits the interpretation of the seismic sections, boreholes, and luminescence data by Firla et al. (2024) at the same site. In general, the sedimentary sequence of glacial and post-glacial deposits is typical for these environments (e.g., Schaller et al., 2023; Schuster et al., 2024). The interpretation suits the reflection pattern that is similar to the seismic facies interpretation of the Tannwald Basin (Burschil et al., 2018), consisting of different lithological units. The S-wave data show very detailed results, imaging the entire basin fill in very good quality, even using the small-scale source. The images show a much higher resolution than those derived from the P-wave data and reveal reflectors that were not observed in the P-wave data. This is in accordance with results from other studies (e.g., Pugin et al., 2009; Brodic et al., 2018; Burschil and Buness, 2020; Pertuz and Malehmir, 2023), even though P-waves have been commonly used to image Quaternary sediments for decades (e.g., Hunter et al., 1984; Büker et al., 1998; Maries et al., 2017).
The acquired datasets demonstrate that they meet the requirements for the methodical development of combining HRSR and FWI. Careful integration of complementary source-receiver configurations is essential, with vibrator sources providing broad-bandwidth data for HRSR imaging and explosive sources generating low-frequency signals necessary for FWI. The dense receiver spacing enhances both reflection imaging and inversion stability, while autonomous low-frequency receivers can supplement, but may not significantly improve, the vibrator-based surveys under certain conditions. Separate analyses of HRSR as well as FWI of different datasets exhibit that each method provides detailed images in the complex glacially-influenced environment of the overdeepened basin.
The HRSR results highlight the potential to resolve both basin structures and internal reflectors in complex, glacially overdeepened settings, such as the study site near Schäftlarn. The identification of a previously unknown bipartioning of the basin demonstrates the need for HRSR in obtaining a detailed structural characterization. Furthermore, S-wave data provide higher resolution within the basin infill than P-wave data, emphasizing the value of integration both wave types for imaging heterogeneous geological settings.
Acquired data are available under DOI: https://doi.org/10.25928/960y-8w55 (Burschil, 2023). DENISE Black edition is available at https://doi.org/10.5281/zenodo.17791223 (Köhn et al., 2025).
TB managed the project Chatseis, including fieldwork organization, data acquisition, processing of S-waves, seismic interpretation, and preparation of the manuscript. DK organized the DATA-CUBE3 and performed FWI. MK processed the P-wave data. GG organized LIAG fieldwork, and JG organized LfU fieldwork and explosive sources. GF and MF conducted the geological interpretation. All authors contributed to the manuscript.
The contact author has declared that none of the authors has any competing interests.
Publisher's note: Copernicus Publications remains neutral with regard to jurisdictional claims made in the text, published maps, institutional affiliations, or any other geographical representation in this paper. While Copernicus Publications makes every effort to include appropriate place names, the final responsibility lies with the authors. Views expressed in the text are those of the authors and do not necessarily reflect the views of the publisher.
This article is part of the special issue “Seismic imaging from the lithosphere to the near surface”. It is a result of the Seismix 2024 conference, Uppsala, Sweden, 24 to 28 June 2024.
The project Chatseis is affiliated with the ICDP project Drilling Overdeepened Alpine Valleys (DOVE) and funded by the Deutsche Forschungsgemeinschaft (DFG, German Research Foundation) – 497340281. Particular thanks go to our team at BGR, LIAG, and LfU, especially the blasters Christian Veress and Brian Kröner, during the surveys, as well as the support of the municipality of Schäftlarn and the Schäftlarn Monastery.
This research has been supported by the Deutsche Forschungsgemeinschaft (grant no. 497340281).
This paper was edited by Christopher Juhlin and reviewed by Samuel Zappalá and Marta Cyz.
Anselmetti, F. S., Bavec, M., Crouzet, C., Fiebig, M., Gabriel, G., Preusser, F., Ravazzi, C., and DOVE scientific team: Drilling Overdeepened Alpine Valleys (ICDP-DOVE): quantifying the age, extent, and environmental impact of Alpine glaciations, Sci. Dril., 31, 51–70, https://doi.org/10.5194/sd-31-51-2022, 2022.
Beraus, S., Köhn, D., Bohlen, T., Buness, H., Burschil, T., and Gabriel, G.: High-Resolution Shear Wave Crosshole Full-Waveform Inversion, in: Third EAGE Conference on Seismic Inversion, October 2024, Volume 2024, p. 1–5, Naples, Italy, https://doi.org/10.3997/2214-4609.202438039, 2024.
Brodic, B., Malehmir, A., Pugin, A., and Maries, G.: Three-component seismic land streamer study of an esker architecture through S-and surface-wave imaging, Geophysics, 83, B339–B353, https://doi.org/10.1190/geo2017-0747.1, 2018.
Brodic, B., Ras, P., de Kunder, R., Drijkoningen, G., and Malehmir, A.: Seismic imaging using an e-vib—A case study analyzing the signal properties of a seismic vibrator driven by electric linear synchronous motors, Geophysics, 86, B223-B235, https://doi.org/10.1190/geo2020-0181.1, 2021.
Buness, H., Tanner, D. C., Burschil, T., Gabriel, G., and Wielandt-Schuster, U.: Cuspate-lobate folding in glacial sediments revealed by a small-scale 3-D seismic survey, Journal of Applied Geophysics, 200, 104614, https://doi.org/10.1016/j.jappgeo.2022.104614, 2022.
Büker, F., Green, A. G., and Horstmeyer, H.: Shallow seismic reflection study of a glaciated valley, Geophysics, 63, 1395–1407, https://doi.org/10.1190/1.1444441, 1998.
Burschil, T.: Chatseis: Seismische Daten Schäftlarn, Geoportal der Bundesanstalt für Geowissenschaften und Rohstoffe [data set], https://doi.org/10.25928/960y-8w55, 2023.
Burschil, T.: Seismic measurements, DOVE site 5068_3 (Schäftlarn), Project Chatseis: Survey report, Federal Institute for Geosciences and Natural Resources, Hannover, Germany, Report, https://doi.org/10.25928/pet1-6838, 26 pp., 2024.
Burschil, T. and Buness, H.: S-wave seismic imaging of near-surface sediments using tailored processing strategies, Journal of Applied Geophysics, 173, 103927, https://doi.org/10.1016/j.jappgeo.2019.103927, 2020.
Burschil, T., Buness, H., Tanner, D. C., Wielandt-Schuster, U., Ellwanger, D., and Gabriel, G.: High-resolution reflection seismics reveal the structure and the evolution of the Quaternary glacial Tannwald Basin, Near Surface Geophysics, 16, 593–610, https://doi.org/10.1002/nsg.12011, 2018.
Burschil, T., Buness, H., Leineweber, P., and Polom, U.: Results of Performance Tests of Electrodynamic Vibratory Seismic Sources, in: NSG2021 27th European Meeting of Environmental and Engineering Geophysics, August 2021, Volume 2021, No. 1, p. 1–5, Hybrid, https://doi.org/10.3997/2214-4609.202120061, 2021.
Dehnert, A., Lowick, S. E., Preusser, F., Anselmetti, F. S., Drescher-Schneider, R., Graf, H. R., Heller, F., Horstmeyer, H., Kemna, H. A., Nowaczyk, N. R., and Furrer, H.: Evolution of an overdeepened trough in the northern Alpine Foreland at Niederweningen, Switzerland, Quaternary Science Reviews, 34, 127–145, https://doi.org/10.1016/j.quascirev.2011.12.015, 2012.
Denny, M. D. and Johnson, L. R.: The explosion seismic source function: Models and scaling laws reviewed, Explosion Source Phenomenology, 65, 1–24, https://doi.org/10.1029/GM065p0001, 1991.
Dokter, E., Köhn, D., Wilken, D., De Nil, D., and Rabbel, W.: Full waveform inversion of SH- and Love-wave data in near-surface prospecting, Geophysical Prospecting, 65, 216–236, https://doi.org/10.1111/1365-2478.12549, 2017.
Dragoset, B.: A historical reflection on reflections, Leading Edge, 24, S46–S71, https://doi.org/10.1190/1.2112392, 2005.
Ehlers, J., Gibbard, P. L., and Hughes, P. D. (Eds.): Quaternary Glaciations – Extent and Chronology, Elsevier, Amsterdam, Netherlands, ISBN: 9780444534477, 1126 pp., 2011.
Firla, G., Lüthgens, C., Preusser, F., and Fiebig, M.: Unravelling the chronology of the infill of glacially overdeepened structures in the northern foreland of the European Alps, in: 37th International Geological Congress, Busan, Republic of Korea, 25–31 August 2024, 2024.
Frei, W., Bauer, R., Corboz, P., and Martin, D.: Pitfalls in processing near-surface reflection-seismic data: Beware of static corrections and migration, Leading Edge, 34, 1382–1385, https://doi.org/10.1190/tle34111382.1, 2015.
Hunter, J. A., Pullan, S. E., Burns, R. A., Gagne, R. M., and Good, R. L.: Shallow seismic reflection mapping of the overburden-bedrock interface with the engineering seismograph—Some simple techniques, Geophysics, 49, 1381–1385, https://doi.org/10.1190/1.1441766, 1984.
Jerz, H.: Das Wolfratshausener Becken: seine glaziale Anlage und Übertiefung, E&G Quaternary Science Journal, 29, 63–70, https://doi.org/10.3285/eg.29.1.06, 1979.
Jerz, H.: Geologische Karte von Bayern 1:25 000 – 8034 Starnberg Süd, Map, Bayerisches Geologisches Landesamt, Augsburg, Germany, 1987.
Jerz, H.: Das Eiszeitalter in Bayern – Erdgeschichte, Gesteine, Wasser, Boden. – Geologie von Bayern, 2, E. Schweizerbart'sche Verlagsbuchhandlung oHG, Stuttgart, Germany, 243 pp., ISBN 9783510651573, 1993.
Köhn, D., De Nil, D., Kurzmann, A., Przebindowska, A., and Bohlen, T.: On the influence of model parametrization in elastic full waveform tomography, Geophysical Journal International, 191, 325–345, https://doi.org/10.1111/j.1365-246X.2012.05633.x, 2012.
Köhn, D., Wilken, D., De Nil, D., Wunderlich, T., Rabbel, W., Werther, L., Schmidt, J., Zielhofer, C., and Linzen, S.: Comparison of time-domain SH waveform inversion strategies based on sequential low and bandpass filtered data for improved resolution in near-surface prospecting, Journal of Applied Geophysics, 160, 69–83, https://doi.org/10.1016/j.jappgeo.2018.11.001, 2019.
Köhn, D., Kazei, V., Ovcharenko, O., Shuo, Z., and Wehner, D.: daniel-koehn/DENISE-Black-Edition: Release of DENISE Black-Edition v1.5, Version v1.5, Zenodo [software], https://doi.org/10.5281/zenodo.17791223, 2025.
Krohn, C. E.: Geophone ground coupling, Geophysics, 49, 722–731, https://doi.org/10.1190/1.1441700, 1984.
Lines, L. R. and Clayton, R. W.: A new approach to vibroseis deconvolution, Geophysical Prospecting, 25, 417–433, https://doi.org/10.1111/j.1365-2478.1977.tb01179.x, 1977.
Liu, D. C. and Nocedal, J.: On the limited memory BFGS method for large scale optimization, Mathematical Programming, 45, 503–528, https://doi.org/10.1007/BF01589116, 1989.
Malehmir, A., Saleem, M. U., and Bastani, M.: High-resolution reflection seismic investigations of quick-clay and associated formations at a landslide scar in southwest Sweden, Journal of Applied Geophysics, 92, 84–102, https://doi.org/10.1016/j.jappgeo.2013.02.013, 2013.
Manning, T., Ablyazina, D., and Quigley, J.: The nimble node – Million-channel land recording systems have arrived, Leading Edge, 38, 706–714, https://doi.org/10.1190/tle38090706.1, 2019.
Maraio, S., Bruno, P. P. G., Picotti, V., Mair, V., and Brardinoni, F.: High-resolution seismic imaging of debris-flow fans, alluvial valley fills and hosting bedrock geometry in Vinschgau/Val Venosta, Eastern Italian Alps, Journal of Applied Geophysics, 157, 61–72, https://doi.org/10.1016/j.jappgeo.2018.07.001, 2018.
Maries, G., Ahokangas, E., Makinen, J., Pasanen, A., and Malehmir, A.: Interlobate esker architecture and related hydrogeological features derived from a combination of high-resolution reflection seismics and refraction tomography, Virttaankangas, southwest Finland, Hydrogeology Journal, 25, 829–845, https://doi.org/10.1007/s10040-016-1513-9, 2017.
Mecking, R., Köhn, D., Meinecke, M., and Rabbel, W.: Cavity detection by SH-wave full-waveform inversion—A reflection-focused approach, Geophysics, 86, WA123-WA137, https://doi.org/10.1190/geo2020-0349.1, 2021.
Operto, S., Gholami, Y., Prieux, V., Ribodetti, A., Brossier, R., Métivier, L., and Virieux, J.: A guided tour of multiparameter full-waveform inversion with multicomponent data: From theory to practice, Leading Edge, 32, 1040–1054, https://doi.org/10.1190/tle32091040.1, 2013.
Ourabah, A. and Chatenay, A.: Unlocking ultra-high-density seismic for CCUS applications by combining nimble nodes and agile source technologies, Leading Edge, 41, 27–33, https://doi.org/10.1190/tle41010027.1, 2022.
Pan, Y., Gao, L., and Bohlen, T.: High-resolution characterization of near-surface structures by surface-wave inversions: from dispersion curve to full waveform, Research Report/Preprint, Karlsruher Institut für Technologie (KIT), Karlsruhe, Germany, https://doi.org/10.5445/IR/1000089310, 22 pp., 2019.
Pertuz, T. and Malehmir, A.: Ultrahigh-resolution shear-wave reflection imaging of vertical-component data in a quick-clay prone to landslide area in southwest Sweden, Geophysics, 88, B121-B133, https://doi.org/10.1190/geo2021-0832.1, 2023.
Preusser, F., Reitner, J. M., and Schlüchter, C.: Distribution, geometry, age and origin of overdeepened valleys and basins in the Alps and their foreland, Swiss Journal of Geosciences, 103, 407–426, https://doi.org/10.1007/s00015-010-0044-y, 2010.
Pugin, A. J. M., Pullan, S. E., and Hunter, J. A.: Multicomponent high-resolution seismic reflection profiling, Leading Edge, 28, 1248–1261, https://doi.org/10.1190/1.3249782, 2009.
Ren, Z. and Liu, Y.: Elastic full-waveform inversion using the second-generation wavelet and an adaptive-operator-length scheme, Geophysics, 80, R155-R173, https://doi.org/10.1190/geo2014-0516.1, 2015.
Roodaki, A., Janot, L., Peiro, M., Jiang, H., Gao, W., Prigent, H., Yu, Z., Masmoudi, N., Ratcliffe, A., Dhelie, P. E., Danielsen, V., Straith, K. R., and Kvilhaug, A.: Increasing P-wave and S-wave velocity resolution with FWI—a North Sea shallow water case study, First Break, 42, 37–42, https://doi.org/10.3997/1365-2397.fb2024037, 2024.
Sallas, J. J.: Seismic vibrator control and the downgoing P-wave, Geophysics, 49, 732–740, https://doi.org/10.1190/1.1441701, 1984.
Schaller, S., Buechi, M. W., Schuster, B., and Anselmetti, F. S.: Drilling into a deep buried valley (ICDP DOVE): a 252 m long sediment succession from a glacial overdeepening in northwestern Switzerland, Sci. Dril., 32, 27–42, https://doi.org/10.5194/sd-32-27-2023, 2023.
Schuster, B., Gegg, L., Schaller, S., Buechi, M. W., Tanner, D. C., Wielandt-Schuster, U., Anselmetti, F. S., and Preusser, F.: Shaped and filled by the Rhine Glacier: the overdeepened Tannwald Basin in southwestern Germany, Sci. Dril., 33, 191–206, https://doi.org/10.5194/sd-33-191-2024, 2024.
Schwardt, M., Köhn, D., Wunderlich, T., Wilken, D., Seeliger, M., Schmidts, T., Brücknet, H., Başaran, S., and Rabbel, W.: Characterization of silty to fine-sandy sediments with SH waves: full waveform inversion in comparison with other geophysical methods, Near Surface Geophysics, 18, 217–248, https://doi.org/10.1002/nsg.12097, 2020.
Sheriff, R. E. and Geldart, L. P.: Exploration seismology, 2nd edn., Cambridge University Press, Cambridge, UK, ISBN 9781139168359, https://doi.org/10.1017/CBO9781139168359, 592 pp., 1995.
Singh, B., Malinowski, M., Górszczyk, A., Malehmir, A., Buske, S., Sito, Ł., and Marsden, P.: 3D high-resolution seismic imaging of the iron oxide deposits in Ludvika (Sweden) using full-waveform inversion and reverse time migration, Solid Earth, 13, 1065–1085, https://doi.org/10.5194/se-13-1065-2022, 2022.
Sloan, S. D., Tyler Schwenk, J., and Stevens, R. H.: An example of extreme near-surface variability in shallow seismic reflection data, Interpretation, 4, SH1–SH9, https://doi.org/10.1190/INT-2015-0215.1, 2016.
Tanner, D. C., Musmann, P., Wawerzinek, B., Buness, H., Krawczyk, C. M., and Thomas, R.: Salt tectonics of the eastern border of the Leinetal Graben, Lower Saxony, Germany, as deduced from seismic reflection data, Interpretation, 3, T169–T13, https://doi.org/10.1190/INT-2014-0221.1, 2015.
Tarantola, A.: A strategy for nonlinear elastic inversion of seismic reflection data, Geophysics, 51, 1893–1903, https://doi.org/10.1190/1.1442046, 1986.
Ulugergerli, E. U. and Uyanik, O.: Statistical correlations between seismic wave velocities and SPT blow counts and the relative density of soils, Journal of Testing and Evaluation, 35, 187–191, https://doi.org/10.1520/JTE100159, 2007.
Vigh, D., Cheng, X., Jiao, K., Xu, Z., and Sun, D.: Essential steps for successful full-waveform inversion using land data, in: SEG Technical Program Expanded Abstracts 2018, Society of Exploration Geophysicists, 1128–1132, https://doi.org/10.1190/segam2018-2995966.1, 2018.
Virieux, J. and Operto, S.: An overview of full-waveform inversion in exploration geophysics, Geophysics, 74, WCC1–WCC26, https://doi.org/10.1190/1.3238367, 2009.
Wadas, S. H., Polom, U., and Krawczyk, C. M.: High-resolution shear-wave seismic reflection as a tool to image near-surface subrosion structures – a case study in Bad Frankenhausen, Germany, Solid Earth, 7, 1491–1508, https://doi.org/10.5194/se-7-1491-2016, 2016.
Wang, Z., Juhlin, C., Lü, Q., Ruan, X., Liu, Z., Yu, C., and Chen, M.: High-resolution seismic reflection surveying to delineate shallow subsurface geological structures in the karst area of Shenzhen, China, Solid Earth, 16, 761–773, https://doi.org/10.5194/se-16-761-2025, 2025.
Wei, Z. and Phillips, F.: Analysis of vibrator performance at low frequencies, First Break, 29, https://doi.org/10.3997/1365-2397.2011020, 2011.
Zhang, Q., Cheng, S., Chen, W., and Mao, W.: Generating Reliable Initial Velocity Models for Full-waveform Inversion with Well and Structural Constraints, arXiv [preprint], https://doi.org/10.48550/arXiv.2503.02815, 4 March 2025.