the Creative Commons Attribution 4.0 License.
the Creative Commons Attribution 4.0 License.
 | 19 May 2025
The 3D QP model of the China Seismic Experimental Site (CSES-Q1.0) and its tectonic implications
Mengqiao Duan
Ying Fu
Yanru An
Jingqiong Yang
Xiaodong Zhang
The Chuan–Dian (Sichuan–Yunnan) region is located in the southeastern part of the geologically complex and seismically active Tibetan Plateau. Since 2008, the Chuan–Dian region has experienced several major earthquakes, including the Wenchuan MS 8.0, Lushan MS 7.0, and Jiuzhaigou MS 7.0 earthquakes, making it one of the areas with the most severe earthquake disasters. The China Seismic Experimental Site (CSES) under construction in this area will deepen the understanding of the preparation for and generation of earthquakes and the disaster mechanisms, which can further enhance the defense capability against earthquake risks. To build a world-class seismic experimental field, it is necessary to establish high-precision medium structure models. Currently, several institutions have established high-resolution three-dimensional (3D) velocity models in the CSES, but there is still a lack of high-resolution 3D attenuation (∝1/Q) structure models. Using the local seismic tomography method, we obtain the highest-resolution 3D QP model in the CSES to date. Combining the existing velocity models in the CSES with other geophysical and geochemical observations by predecessors, this study shows that the QP value anomalies along large fault zones and some basin areas are low, reflecting the high degree of medium fragmentation in these areas with thick sedimentary layers or rich in fluids. The high-attenuation anomaly of the upper crust dipping westward in the Tengchong volcanic area characterizes the possible upward flow of deep-seated magma from west to east. This study also reveals that most earthquakes above magnitude 6 occurred in low-attenuation zones or the boundary areas of high- to low-attenuation anomalies. The source areas of the 2008 Wenchuan MS 8.0 earthquake and the 2013 Lushan MS 7.0 earthquake were separated by a low-attenuation area, and there is still a risk of major earthquakes in the future. The 3D attenuation model constructed in this study will provide a high-resolution reference model for seismological and earthquake disaster research in the CSES.
- Article
(12648 KB) - Full-text XML
- BibTeX
- EndNote


The China Seismic Experimental Site (CSES) started construction in 2018 (regional range: 21–32° N, 97.5–105.5° E), with a total area of approximately 780 000 km2. The regional scope includes the Chuan–Dian (Sichuan–Yunnan) block (CDB) located on the southeastern Tibetan Plateau and its surrounding areas, with a complex tectonic environment and various fault systems such as compression, shear, and tension. Multiple large thrust and strike-slip active fault zones have developed in the region, such as the Xianshuihe, Zemuhe, Xiaojiang, Red River, Longmenshan, Huayingshan, and Lijiang–Xiaojinhe fault zones. They divide the Chuan–Dian area into multiple active blocks, such as the Chuan–Dian block, the western Yunnan block, and the southern Yunnan block. (Zhang et al., 2003) (Fig. 1a). The collision and continuous convergence of the Indian and Eurasian plates led to strong crustal deformation and rapid surface uplift. This region is also one of the regions with the most frequent seismicity in the Chinese mainland, including both interplate and intraplate earthquakes. In the past 50 years, there have been an average of 14 earthquakes with a magnitude of 6.0 or above and 3 earthquakes with a magnitude of 7.0 or above every 10 years (Fig. 1b). Among them, the Wenchuan magnitude 8.0 earthquake on 12 May 2008, the Lushan magnitude 7.0 earthquake on 20 April 2013, the Ludian magnitude 6.5 earthquake on 3 August 2014, the Yangbi magnitude 6.4 earthquake on 21 May 2021, and the Luding magnitude 6.8 earthquake on 5 September 2022 all caused serious casualties and property losses. The seismogenic environment and mechanism in this region have always been a hot topic of discussion among scholars. Previously, various geophysical observations, such as low wave velocity (Yao et al., 2008; Yang et al., 2012, 2020; Bao et al., 2015; Zhang et al., 2020; Liu et al., 2021), high conductivity (Bai et al., 2010; Li et al., 2019), high heat flow (Hu et al., 2000; Jiang et al., 2019), strong attenuation (Zhao et al., 2013), and strong radial anisotropy (Bao et al., 2020), revealed the morphology and genesis of channel flows in the middle and lower crust. Among them, research on 3D velocity tomography is dominant, including 3D velocity structures based on body waves (Wu et al., 2013; Deng et al., 2021; Wang et al., 2015; Huang et al., 2018). Three dimensional VS structure of the crust to upper mantle based on surface waves and background noise (Wang and Gao, 2014; Yao et al., 2008; Shen et al., 2016; Fu et al., 2017; Qiao et al., 2018; Zheng et al., 2019; Yang et al., 2020).
To investigate the high-resolution subsurface medium structure of the CSES and understand the mechanisms of strong earthquakes in the region, seismologists have constructed various velocity models for the CSES using various data, including body waves, surface waves, and ambient noise surface waves. For instance, Xin et al. (2019) and Han et al. (2022) successively used the inversion method of body waves and the joint inversion method of body and surface waves to establish high-resolution lithospheric velocity structures for the Chinese mainland (USTClitho1.0, USTClitho2.0), with horizontal resolutions in the CSES ranging from 0.5 to 1°. Liu et al. (2021) and (2023) utilized a joint body-wave and surface-wave travel-time inversion method to establish two community velocity models for the CSES (SWChinaCVM-1.0, SWChinaCVM-2.0), with the maximum horizontal resolution of 0.2–0.3°, providing high-resolution community velocity models for geophysics research in the CSES area. The most recent study, based on the joint inversion of receiver functions and surface waves, constructed a 3D VP and VS model for the CSES (CSES-VM1.0) with a maximum horizontal resolution of 0.25° (Wu et al., 2024). However, the velocity structure mainly reflects the elastic structure of the medium and lacks constraints on important inelastic properties during earthquake nucleation.
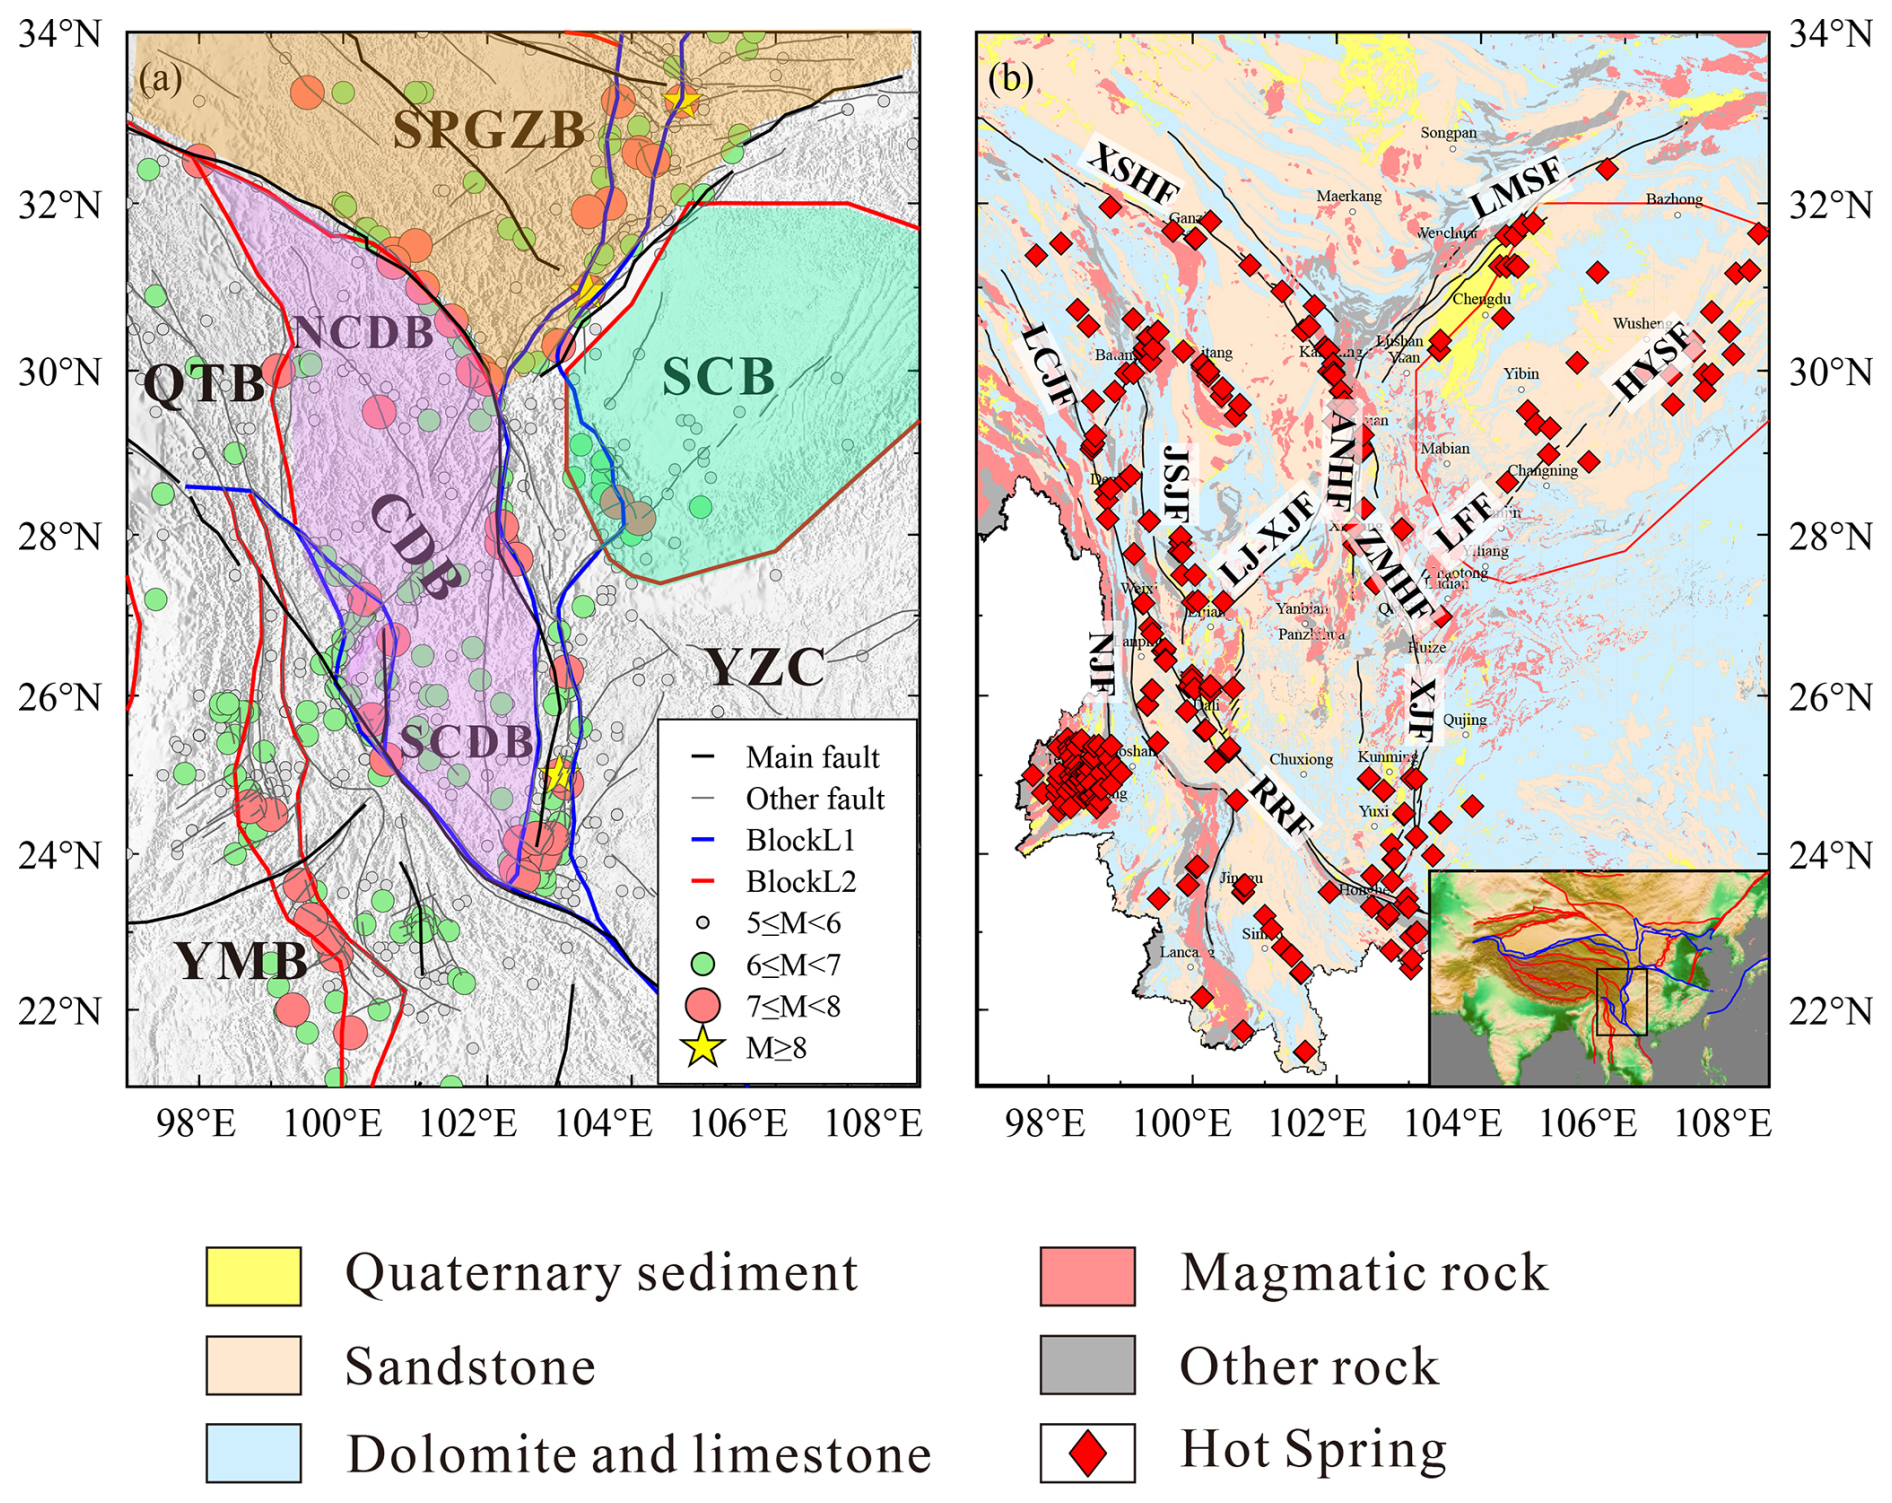
Figure 1The distribution map of tectonic structures, historical earthquakes, and lithology in the study area. (a) Map of the tectonic structures and spatial distribution of earthquakes that occurred from 780 BCE to July 2023 in the CSES. SPGZB, Songpan-Ganzi block; QTB, Qiangtang block; CDB, Chuan–Dian block; NCDB, northern Chuan–Dian block; SCDB, southern Chuan–Dian block; YMB, Yunnan–Myanmar block; SCB, Sichuan basin; YZC, Yangtze craton. (b) Map of the spatial distribution of lithology and hot springs in the CSES. XSHF, Xianshuihe fault; LMSF, Longmenshan fault; ANHF, Anninghe fault; ZMHF, Zemuhe fault; XJF, Xiaojiang fault; HYSF, Huayingshan fault; LFF, Lianfeng fault; JSJF, Jinshajiang fault; LJ-XJHF, Lijiang–Xiaojinhe fault; LCJF, Lancangjiang fault; NJF, Nujiang fault.
Seismic-wave attenuation is an important parameter reflecting the inelastic properties of the medium. Seismic-wave attenuation is typically extracted from the amplitudes of seismic waves (Pei et al., 2009) and is inversely proportional to the quality factor Q. The state of fractures, fluid migration, and thermal material upwelling in the medium can all cause variations in Q (Yang et al., 2007; Zhu et al., 2013; Wang et al., 2017; Chen et al., 2021). Compared to seismic-wave velocities, seismic-wave attenuation is more sensitive to changes in fluids and temperature (Lin, 2014; Guo and Thurber, 2022). It can provide better constraints on the physical state of the medium and more important information for the thermal structure and dynamics of the lithosphere (Deng et al., 2021), as well as help us infer the permeability range of fluids and the heterogeneity of thermal structures. Studies have also found that most moderate and strong earthquakes (magnitude 6 and above) in the Chuan–Dian region occur at the boundaries of high-attenuation or high- to low-attenuation anomalies (Zhou et al., 2008; Zhou et al., 2020). Therefore, attenuation structures can also provide scientific reference for the determination of the locations of large earthquakes.
At present, most attenuation models in the Chuan–Dian region are two-dimensional models of Lg waves or surface waves, which cannot accurately reveal the characteristics of attenuation in depth (Zhou et al., 2008; Zhao et al., 2013; Wei and Zhao, 2019; Zhou et al., 2020). There are few published studies on 3D attenuation structures in the CSES and surrounding areas. Dai et al. (2020) only obtained a 3D body-wave attenuation model for the southeastern part of the Chuan–Dian block, with low resolution. Tang et al. (2023) inverted a 3D shear-wave attenuation model below a depth of 30 km, lacking the 3D attenuation structure of the upper and middle crust. Liu et al. (2024) used teleseismic direct P waves to obtain the crustal and upper-mantle attenuation structure beneath the southeastern Tibetan Plateau, but there are only two layers at a depth of 100 and 200 km. Therefore, the CSES still lacks a high-precision crustal 3D attenuation model.
This paper collects a large number of seismic waveforms in the CSES for the past decade and uses local earthquake tomography to construct a high-resolution 3D P-wave attenuation model for the CSES. Combined with the existing 3D velocity models in the CSES, we can better understand the medium properties and seismogenic environment in the CSES. It will provide a scientific basis for the crustal medium properties of the Tibetan Plateau, the mechanism of crustal material migration, and the assessment of the risk of large earthquakes.
2.1 Data
This study collates seismic catalogs, phase reports, and seismic waveforms from earthquakes with magnitudes greater than 1.5, recorded by a total of 582 stations from the Sichuan and Yunnan seismic networks within the study area (21–34° N, 97–108° E) since 2013. We select events that include at least six P and S phases and picked phases with travel-time residuals within ±2 s based on the travel-time curves, and a total of 79 619 events from Sichuan and 39 668 events from Yunnan are selected. Due to the fact that earthquakes in Sichuan are more frequent and mainly concentrated around the Longmenshan fault zone, the difference in ray density may result in significant variations in ray weights across different grids. To ensure the resolution of the Q model and to uniformly cover the entire study area with rays, we clustered earthquakes in the Sichuan region, retaining only one earthquake within a 0.5 km range centered on each earthquake. Finally, we organized waveforms for 17 290 earthquakes in Sichuan and 18 488 earthquakes in Yunnan, with a total of 288 695 P-wave rays. The distribution of earthquakes before and after clustering in the region is shown in Fig. 2.
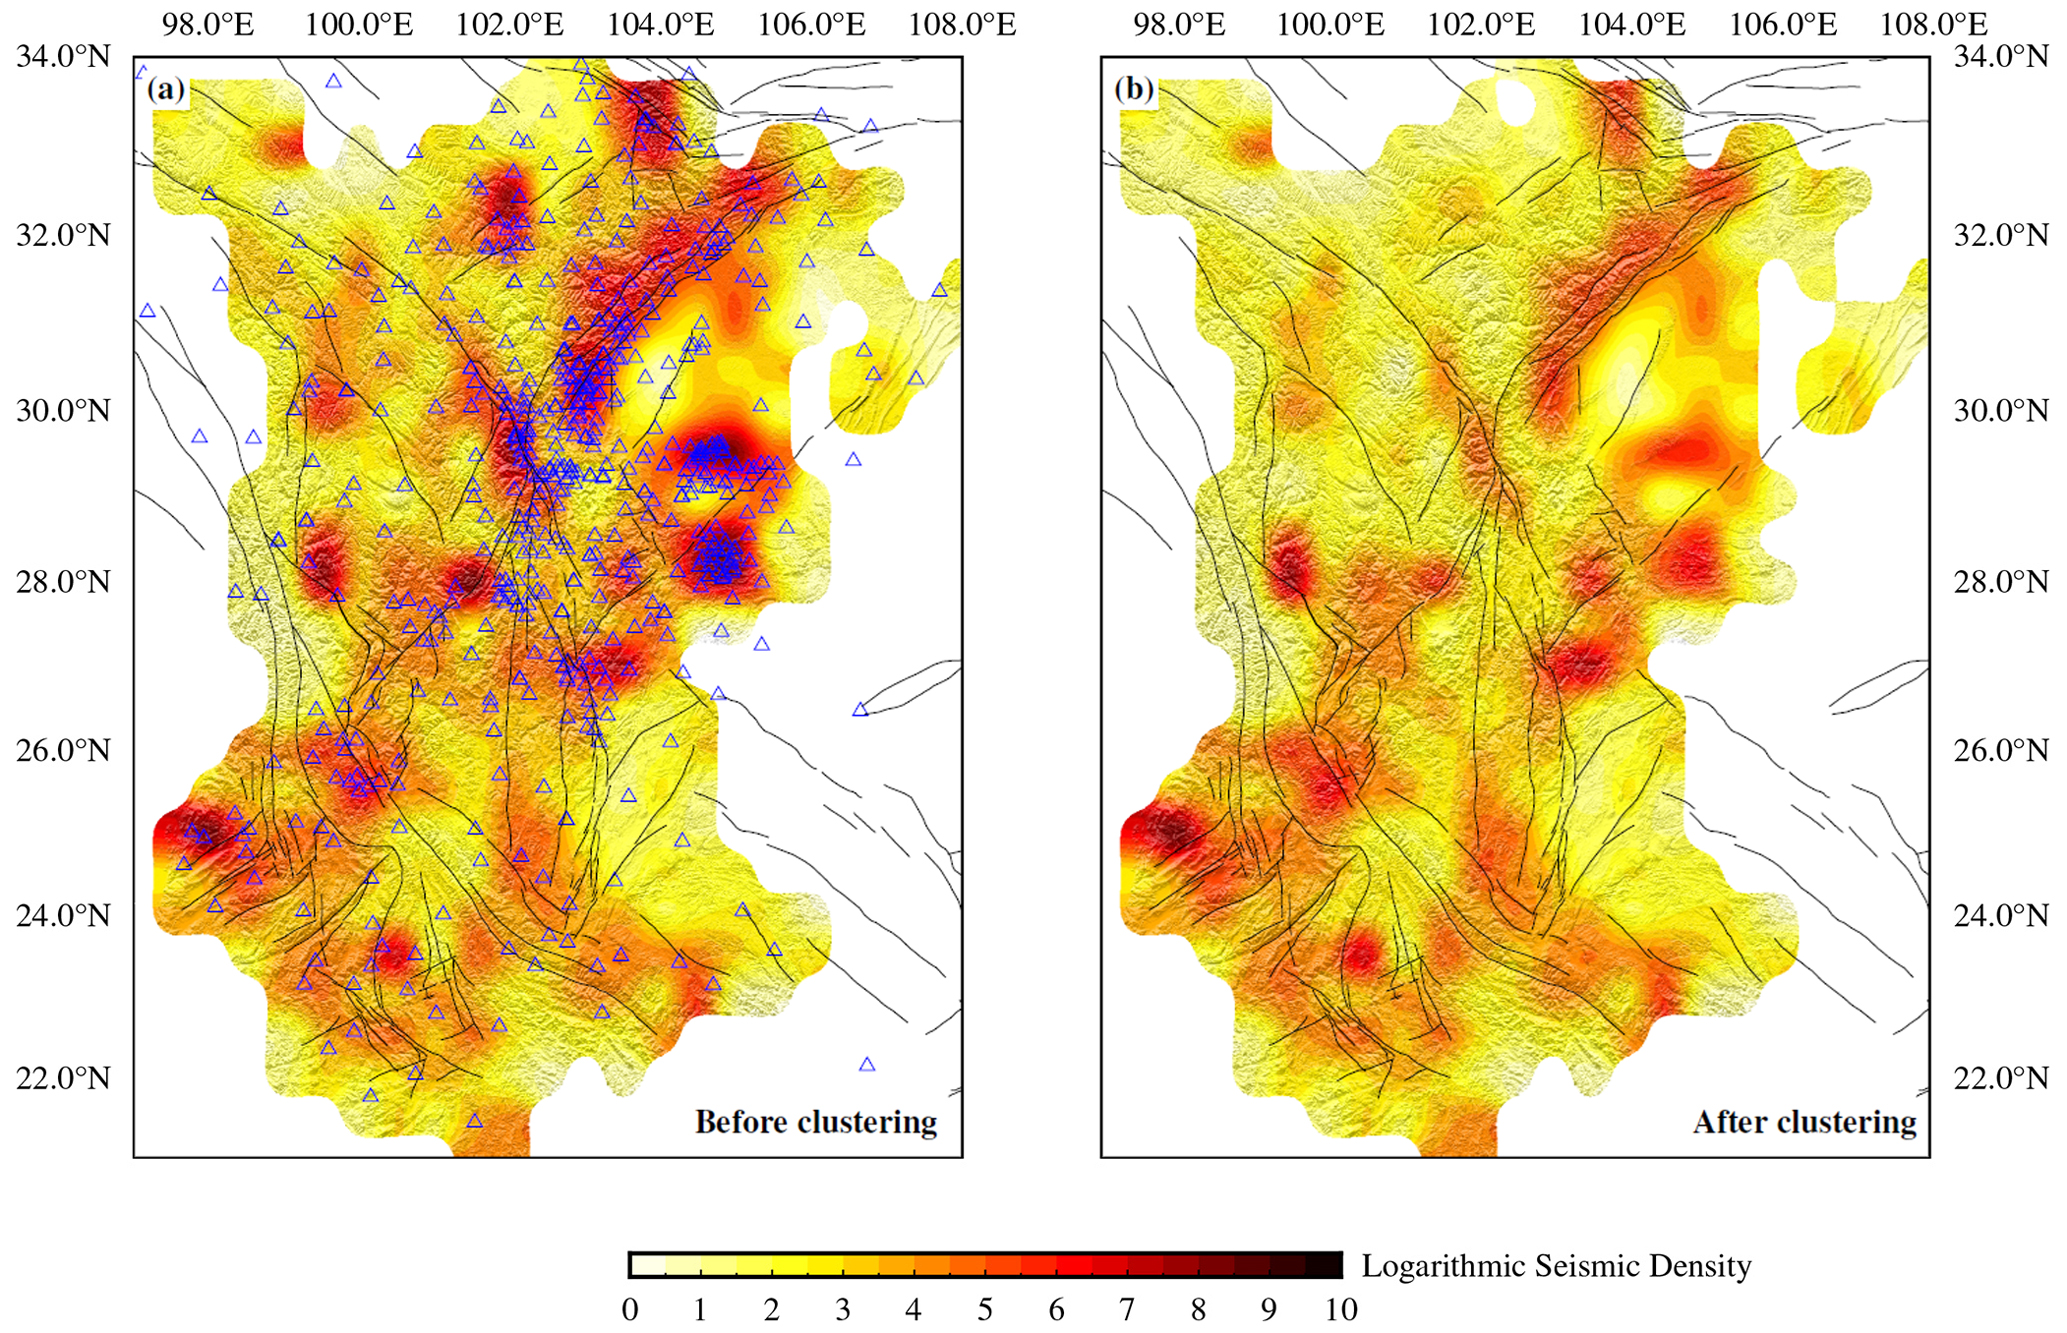
Figure 2Spatial distribution of logarithmic seismic density in the study area before (a) and after (b) clustering. The blue-framed triangles represent stations.
2.2 Method
The seismic-wave attenuation conforms to the ω2 model (Brune, 1970), whose velocity amplitude spectrum can be expressed as follows:
where Ω0ij is the spectral level at low frequency of the ith earthquake recorded by the jth station, is the whole path attenuation term , and fci is the corner frequency of the event i. Many laboratory and empirical studies found Q=Q0fα (Karato and Spetzler, 1990; McNamara, 2000; Stachnik et al., 2004), where the frequency-dependent factor α is usually in the range from 0 to 1. Some studies have found that the frequency-independent Q images are quite similar to the frequency-dependent Q images (Liu and Zhao, 2015; Wang et al., 2017). In this paper, we cannot solve for α, referring to the method of Eberhart-Phillips and Chadwick (2002), and we assume the Q value is frequency-independent (α=0). The following steps are used to extract the t∗ within the frequency range of 2–20 Hz. (1) A flexible window method is used to cut the signal and noise windows of P waves (Zhou et al., 2011). For the P wave, the vertical component recording is selected. We have referenced several studies which show that t∗ estimation often used the fixed time window such as 2.56 s after the P-wave onset to calculate the observed velocity spectra of P waves and fit t∗ (Lees and Lindley, 1994; Eberhart-Phillips and Chadwick, 2002; Hauksson and Shearer, 2006). Some earthquakes have epicentral distances of less than 20 km, and the S–P travel-time differences are less than 2.56 s. When the S–P arrival-time difference is less than or equal to 2.56 s, the S–P arrival-time difference is used as the signal window of the P wave, and the records whose S–P arrival-time difference between is less than 0.5 s are removed. When the S–P arrival-time difference is greater than 2.56 s, 2.56 s is selected as the signal window of the P wave, and the noise window is set to 2.56 s before the P-wave arrival time. (2) After removing the instrument response, the velocity spectra of the signal and noise are calculated, and the records with a signal-to-noise ratio greater than 2 are selected. (3) For all records of an event, we use a grid search method within a certain frequency range to solve for the corner frequency of each event fci. Specifically, from 2 to 20 Hz at intervals of 0.1 Hz, we continuously increase the value of fci and calculate the theoretical velocity spectrum Dij(f). We assume an initial value of of 0.02, a fixed fci, and an estimated value of , and we use the following formula to calculate the zero-frequency spectral value Ω0ij:
where Aij(f) is the theoretical velocity spectrum and Dij(f) is the observed velocity spectrum. (4) By fixing Ω0ij and fci, a better can be obtained:
An iterative algorithm is used to fit Ω0ij and . Repeating steps (3) and (4) for n iterations, each iteration obtains a new and recalculates Ω0ij. The corner frequency fci for the event i is determined by the frequency that minimizes the fitting error between the theoretical and the observed velocity spectrum. The expression for the fitting error is
The t∗ values are also weighted at a total of 5 levels (0, 1, 2, 3, and 4) according to the fitting quality, in which 0, 1, 2, and 3 represent the fit values with a fitting error of less than 0.1, 0.2, 0.3, and 0.4, respectively. Ultimately, we retain data with less than four t∗ levels and ensure that each event has at least three t∗ data values. We obtained a total of 176 105 t∗ data values for P waves. Below is an example of t∗ fitting (Fig. 3).
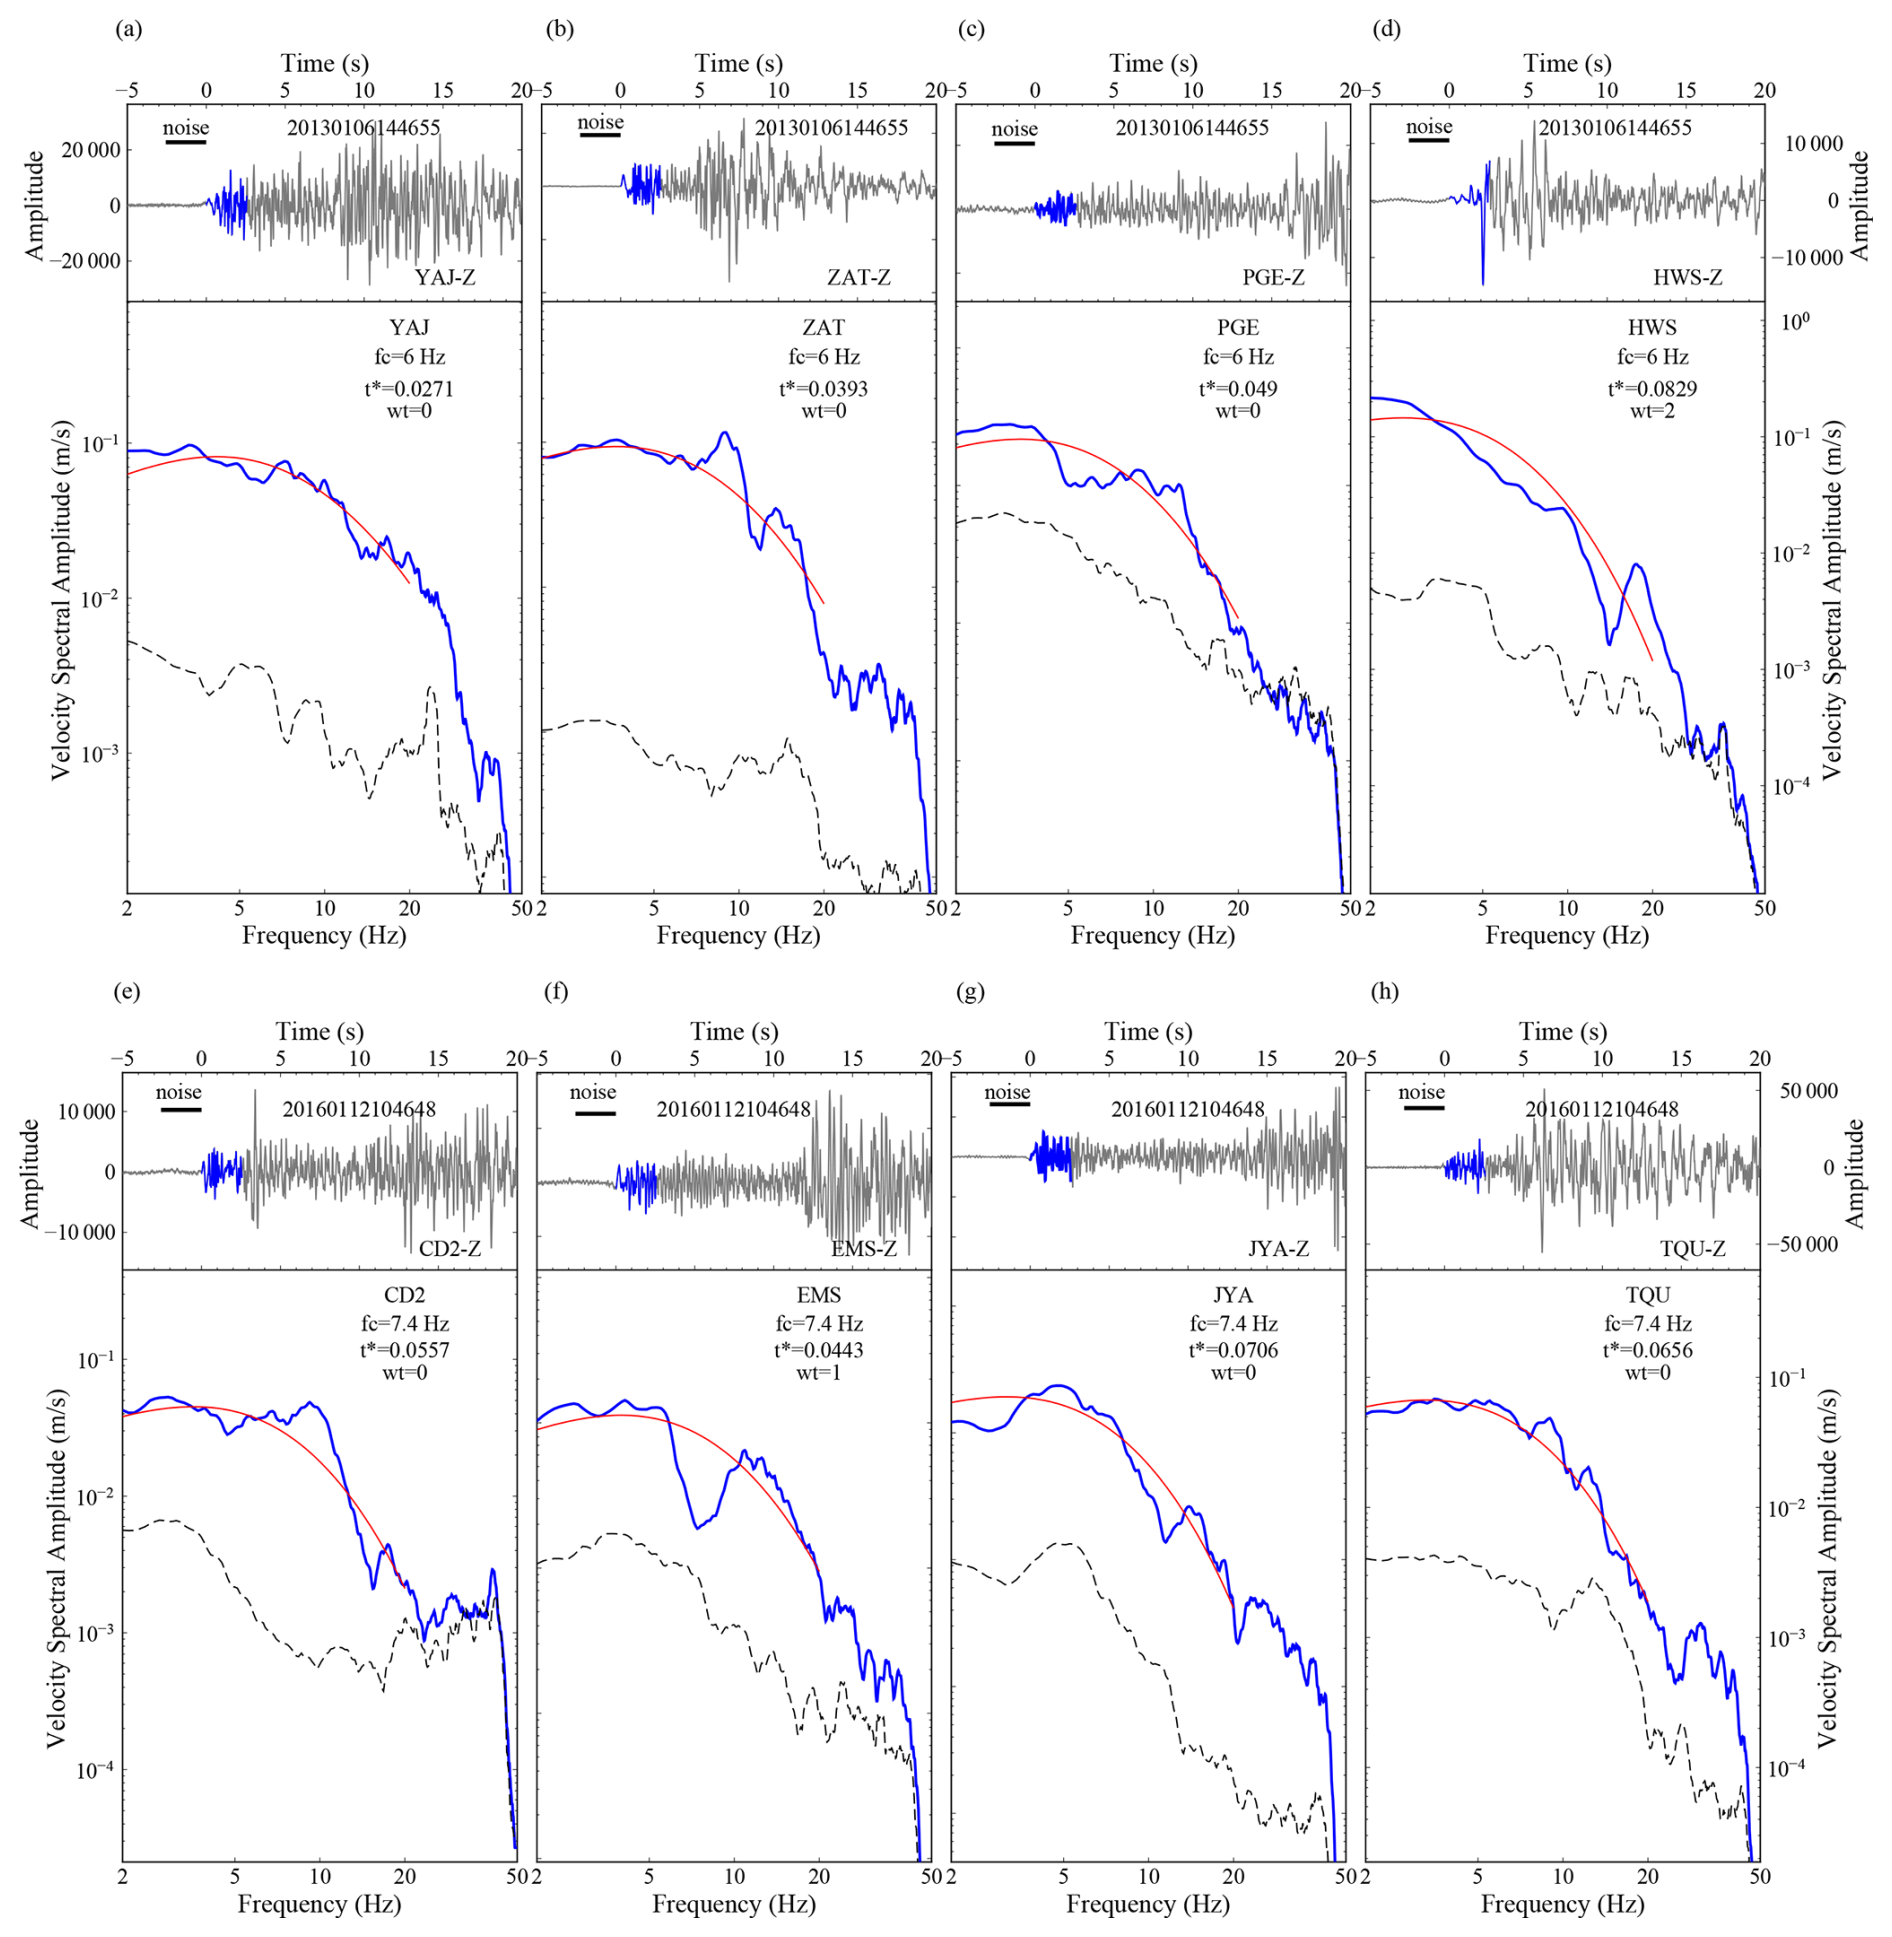
Figure 3t∗ fitting example. The fitting maps of P-wave t∗ at different stations for the Yunnan–Yiliang ML 3.4 earthquake on 6 January 2013 (a–d) and the Lushan ML 3.4 earthquake on 12 January 2016 (e–h). t∗ fitting results of the P wave. In the upper panels, the wavy black lines represent waveforms at different stations from 5 s before to 20 s after the original time, the wavy blue lines represent the P-wave signal windows, and the short horizontal black lines represent the P-wave noise windows. In the lower panels, the blue lines represent the signal velocity spectra, the dotted black lines represent the noise velocity spectra, and the red lines represent the fitted curves. The legends in each panel from top to bottom represent the station name, corner frequency (fc), t∗ values (t∗), and weights (wt).
Then we select the VP model of SWChinaCVM-1.0 constructed by Liu et al. (2021) to further invert the 3D QP model of the region by using the iterative least squares algorithm and SIMUL2000 program (Eberhart-Phillips, 1986; Thurber, 1993; Evans et al., 1994; Eberhart-Phillips and Michael, 1998).
We set the maximum number of iterations to 10 to perform inversions with Q values between 50 and 650. According to the minimum value of data variance, the initial value of QP was set to 350 with 9 iterations. Then, according to the trade-off curve between the model variance and the data variance from the inversion with a single iteration, the optimal damping value of QP tomography was set to 0.1. During the inversion, the weight of the P wave with an epicentral distance within 50 km is 1, the weight of the P wave with an epicentral distance between 50 and 200 km linearly changes from 1 to 0, and the weight of the P wave above 200 km is 0. After 6 iterations, the data variance decreased by 46 %. The resolution of the final QP model also needs to be comprehensively evaluated in combination with checkerboard tests and the spread function (SF) values based on the full resolution matrix. The latter is a better way to identify the resolution than solely examining the diagonal element because diagonal resolution is strongly dependent on the grid spacing and the damping (Reyners et al., 1999).
3.1 Checkerboard tests
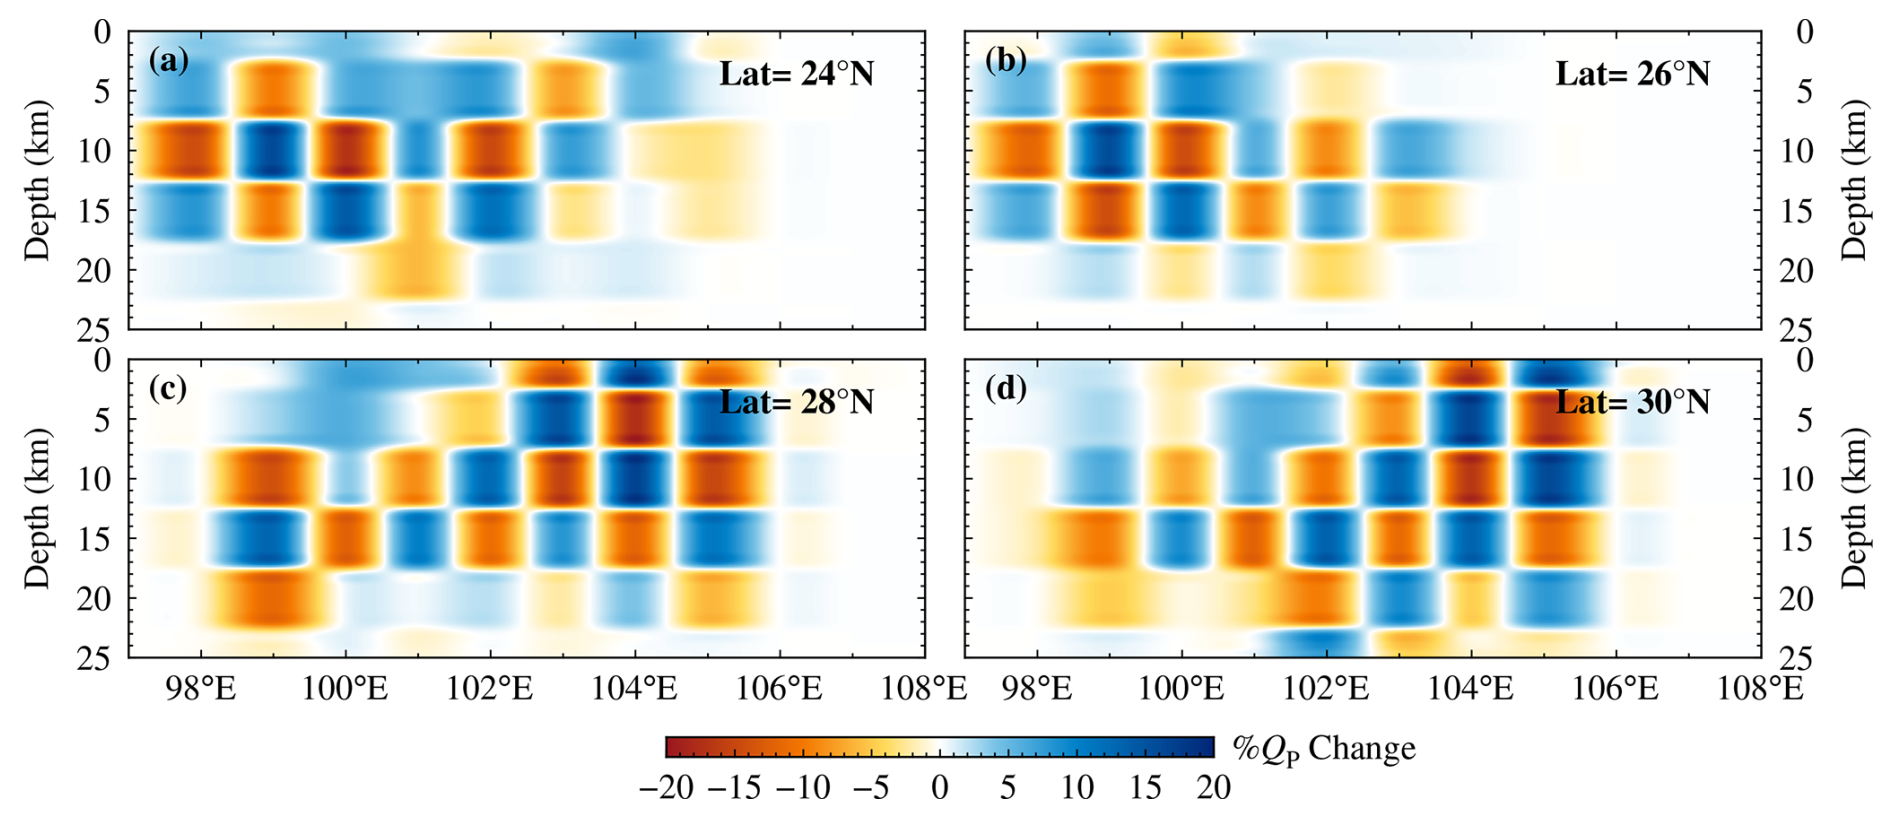
We divide the study area into 0.25° × 0.25° grids with depth layers of 0, 5, 10, 15, 20, 25, and 30 km. The initial velocity values of the corresponding grid points are obtained by interpolation based on SWChinaCVM-1.0. We first evaluate the resolution of the QP model based on the checkerboard test method. We add 5 % random noise to the data and add ±20 % perturbation to the initial Q value. The checkerboard test results show that the checkerboard with a grid of 50 km × 50 km only recovers well at a depth of 10 km, with the QP model in the Changning area of the Sichuan basin and western Yunnan reaching a lateral resolution of 50 km at a depth of 10 km. The checkerboard test results of a 100 km × 100 km grid (Fig. 4) show that the QP model recovers well in the Sichuan basin at a depth of 5 km, and overall it recovers well in the study area at depths of 10 and 15 km. The resolution is poor below 0 and 20 km. The vertical profiles of QP models along different latitudes (Fig. 5) show that the QP model in Sichuan can recover well within a depth of 20 km, while the QP model in Yunnan can recover well within a depth of 18 km. Therefore, the horizontal resolution of the 3D QP model established in this paper for the CSES is 100 km, and the vertical resolution is 5 km.
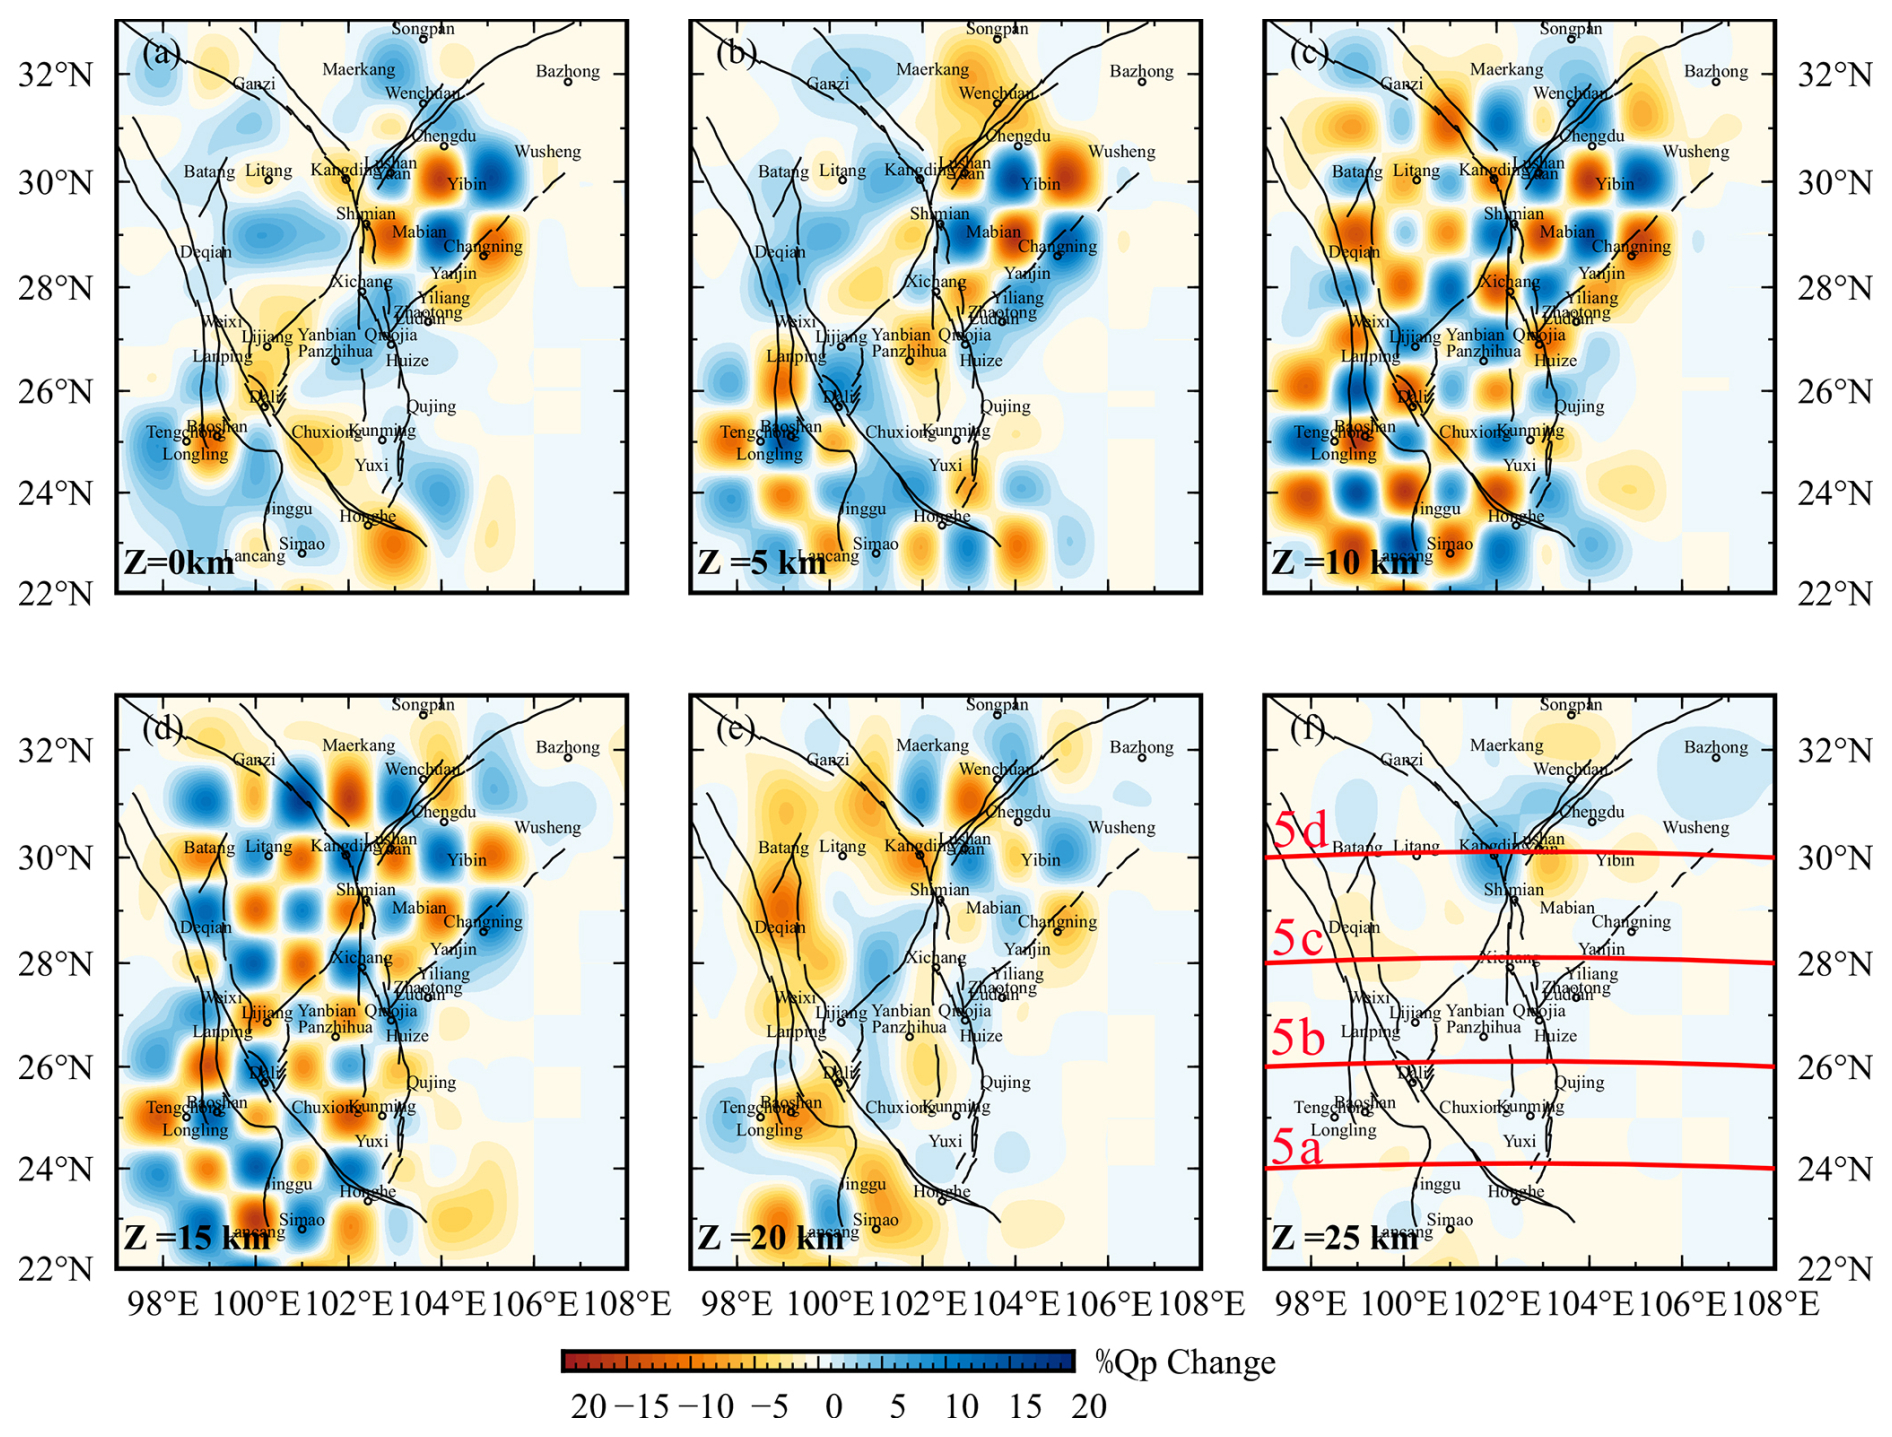
Figure 4Checkerboard test results of the layered QP model. The solid red lines in panel (f) correspond to each profile in Fig. 5, and the red labels correspond to the panels in Fig. 5.
3.2 Resolution tests
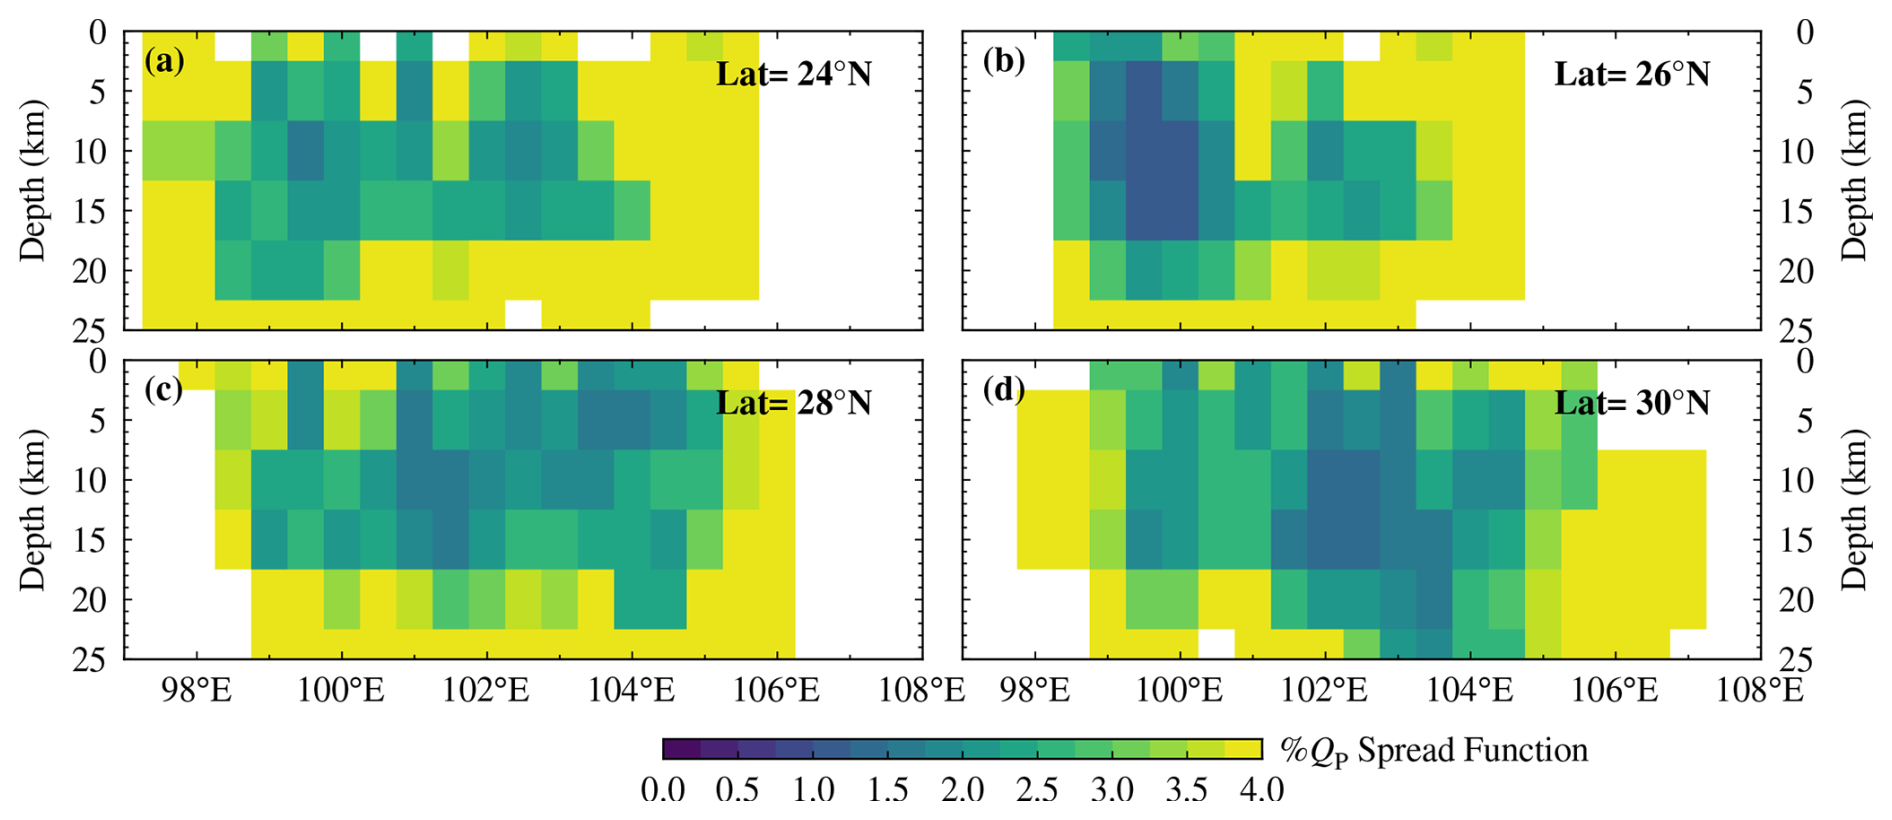
Referring to the practices of previous researchers (Eberhart-Phillips et al., 2008; Zhou et al., 2018; Duan et al., 2024), we further calculate the SF values for each grid point from all the elements of the corresponding row of the resolution matrix to better evaluate the model resolution. Toomey and Foulger (1989) explain that the spread functions does not depend on grid spacing and damping. The quality of resolution is inversely proportional to the SF value, and SF ≤4 is generally used to indicate regions of acceptable Q model quality (Eberhart-Phillips and Michael, 1998). If SF > 4, it indicates that the Q model resolution is low and can only present rough features. We fix the QP value of grid points with a number of rays of less than 5 and obtain the layered SF image of the QP model. The results show (Fig. 6) that, except for the Yangtze block, the SF values in most areas at depths of 5, 10, and 15 km are less than 3, indicating that the Chuan–Dian region has better resolution at depths of 10 and 15 km. At depths of 0 km, the southwestern Sichuan region has good resolution. At a depth of 20 km, the Sichuan basin and western Yunnan region have good resolution. The SF profile of the QP model along the latitude direction (Fig. 7) shows that the resolution of the QP model is relatively high in most areas of Sichuan and western Yunnan at depths of about 23 km.
Integrating the results of the checkerboard test and the SF values for multiple resolution evaluations, we believe that the Q model with SF < 4 in the study area is reliable. SF ≥4 indicates little or no information, and the associated Q model is close to the initial model. The following will focus on the QP model with SF < 4 within a depth range of 5–20 km.
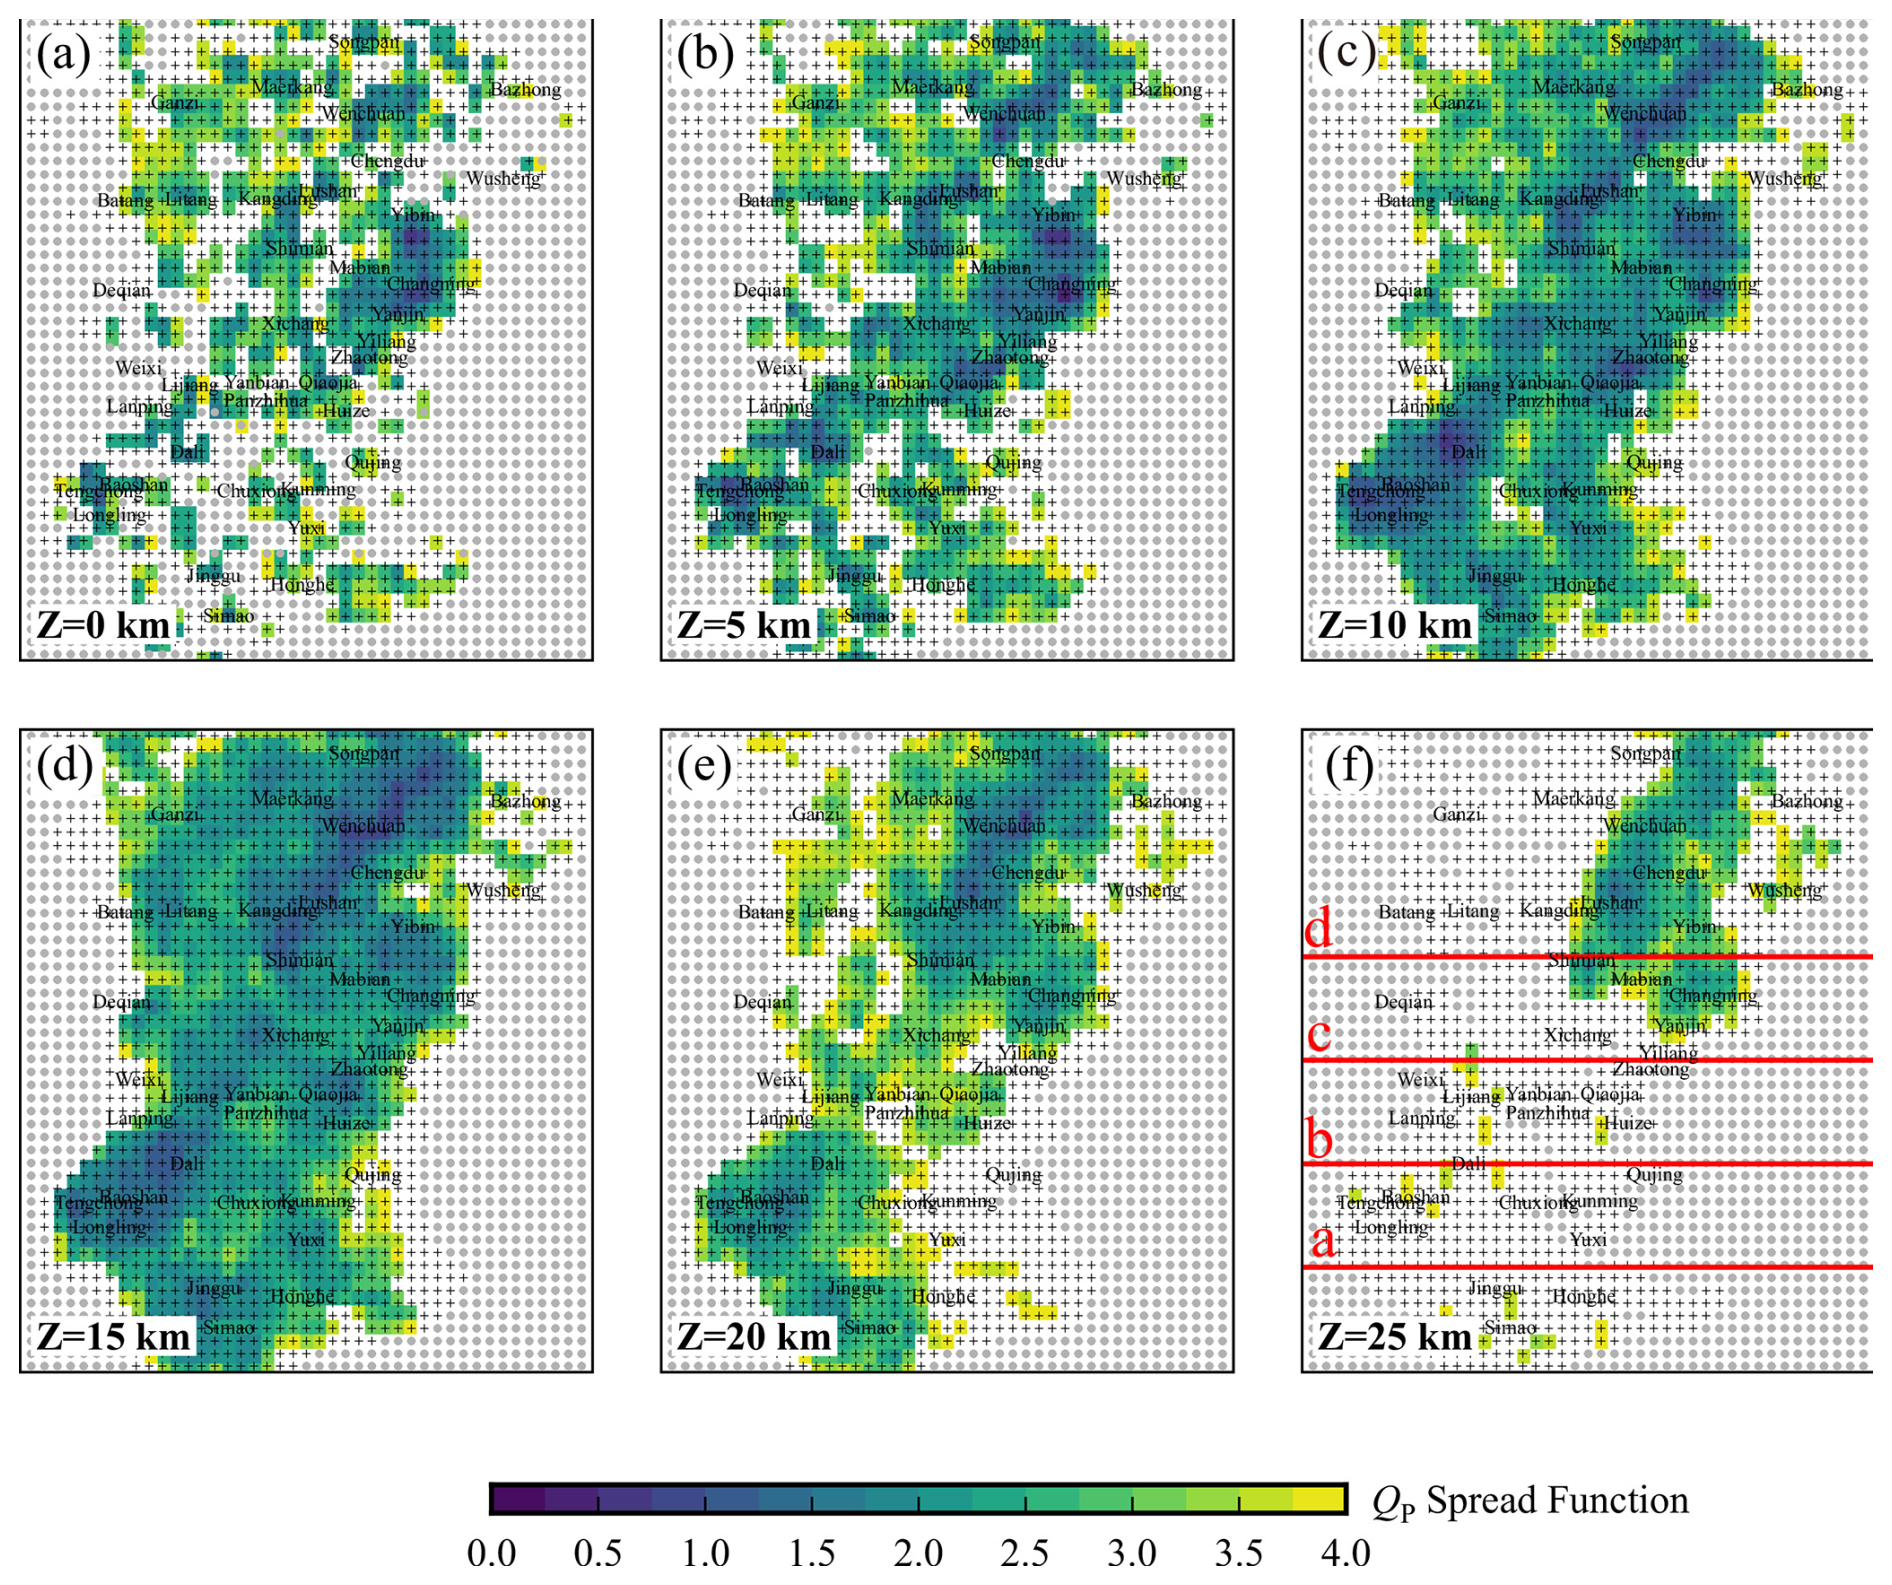
Figure 6The spread function distribution of the layered QP model (SF < 4). The black plus sign represents the grid points, and the gray filled circle represents the grid that does not participate in the inversion. The solid red lines in panel (f) correspond to each profile in Fig. 5, and the red labels correspond to the panels in Fig. 7.
3.3 3D QP model in the CSES
The layered QP model (Fig. 8) shows that the attenuation structure of the CSES exhibits significant lateral heterogeneity. The main fault zones at depths of 0 and 5 km are dominated by low QP values (high attenuation), and there are high-QP anomalies (low attenuation) in the Songpan-Ganzi block (SPGZB) and the Chuan–Dian block (CDB). Hot springs are developed along the main fault zones (Fig. 8a), which correspond well with the shallow high-attenuation anomalies, indicating that the shallow layers of the main fault zones are rich in fluids. The study area at a depth of 10 km is mainly characterized by high-QP anomalies, while low-QP anomalies are mainly distributed in the middle section of the Xiaojiang fault (XJF) and the Simao basin. At a depth of 15 km, high-QP anomalies are predominant, distributed in the N–S direction, while low-QP anomalies are mainly found in the Sichuan basin (SCB) and areas such as Qujing and Simao. At a depth of 20 km, low-QP anomalies are predominant, while high-QP anomalies are distributed on both sides of the Longmenshan fault zone. At a depth of 25 km, high-QP anomalies still dominate along the Longmenshan fault zone.
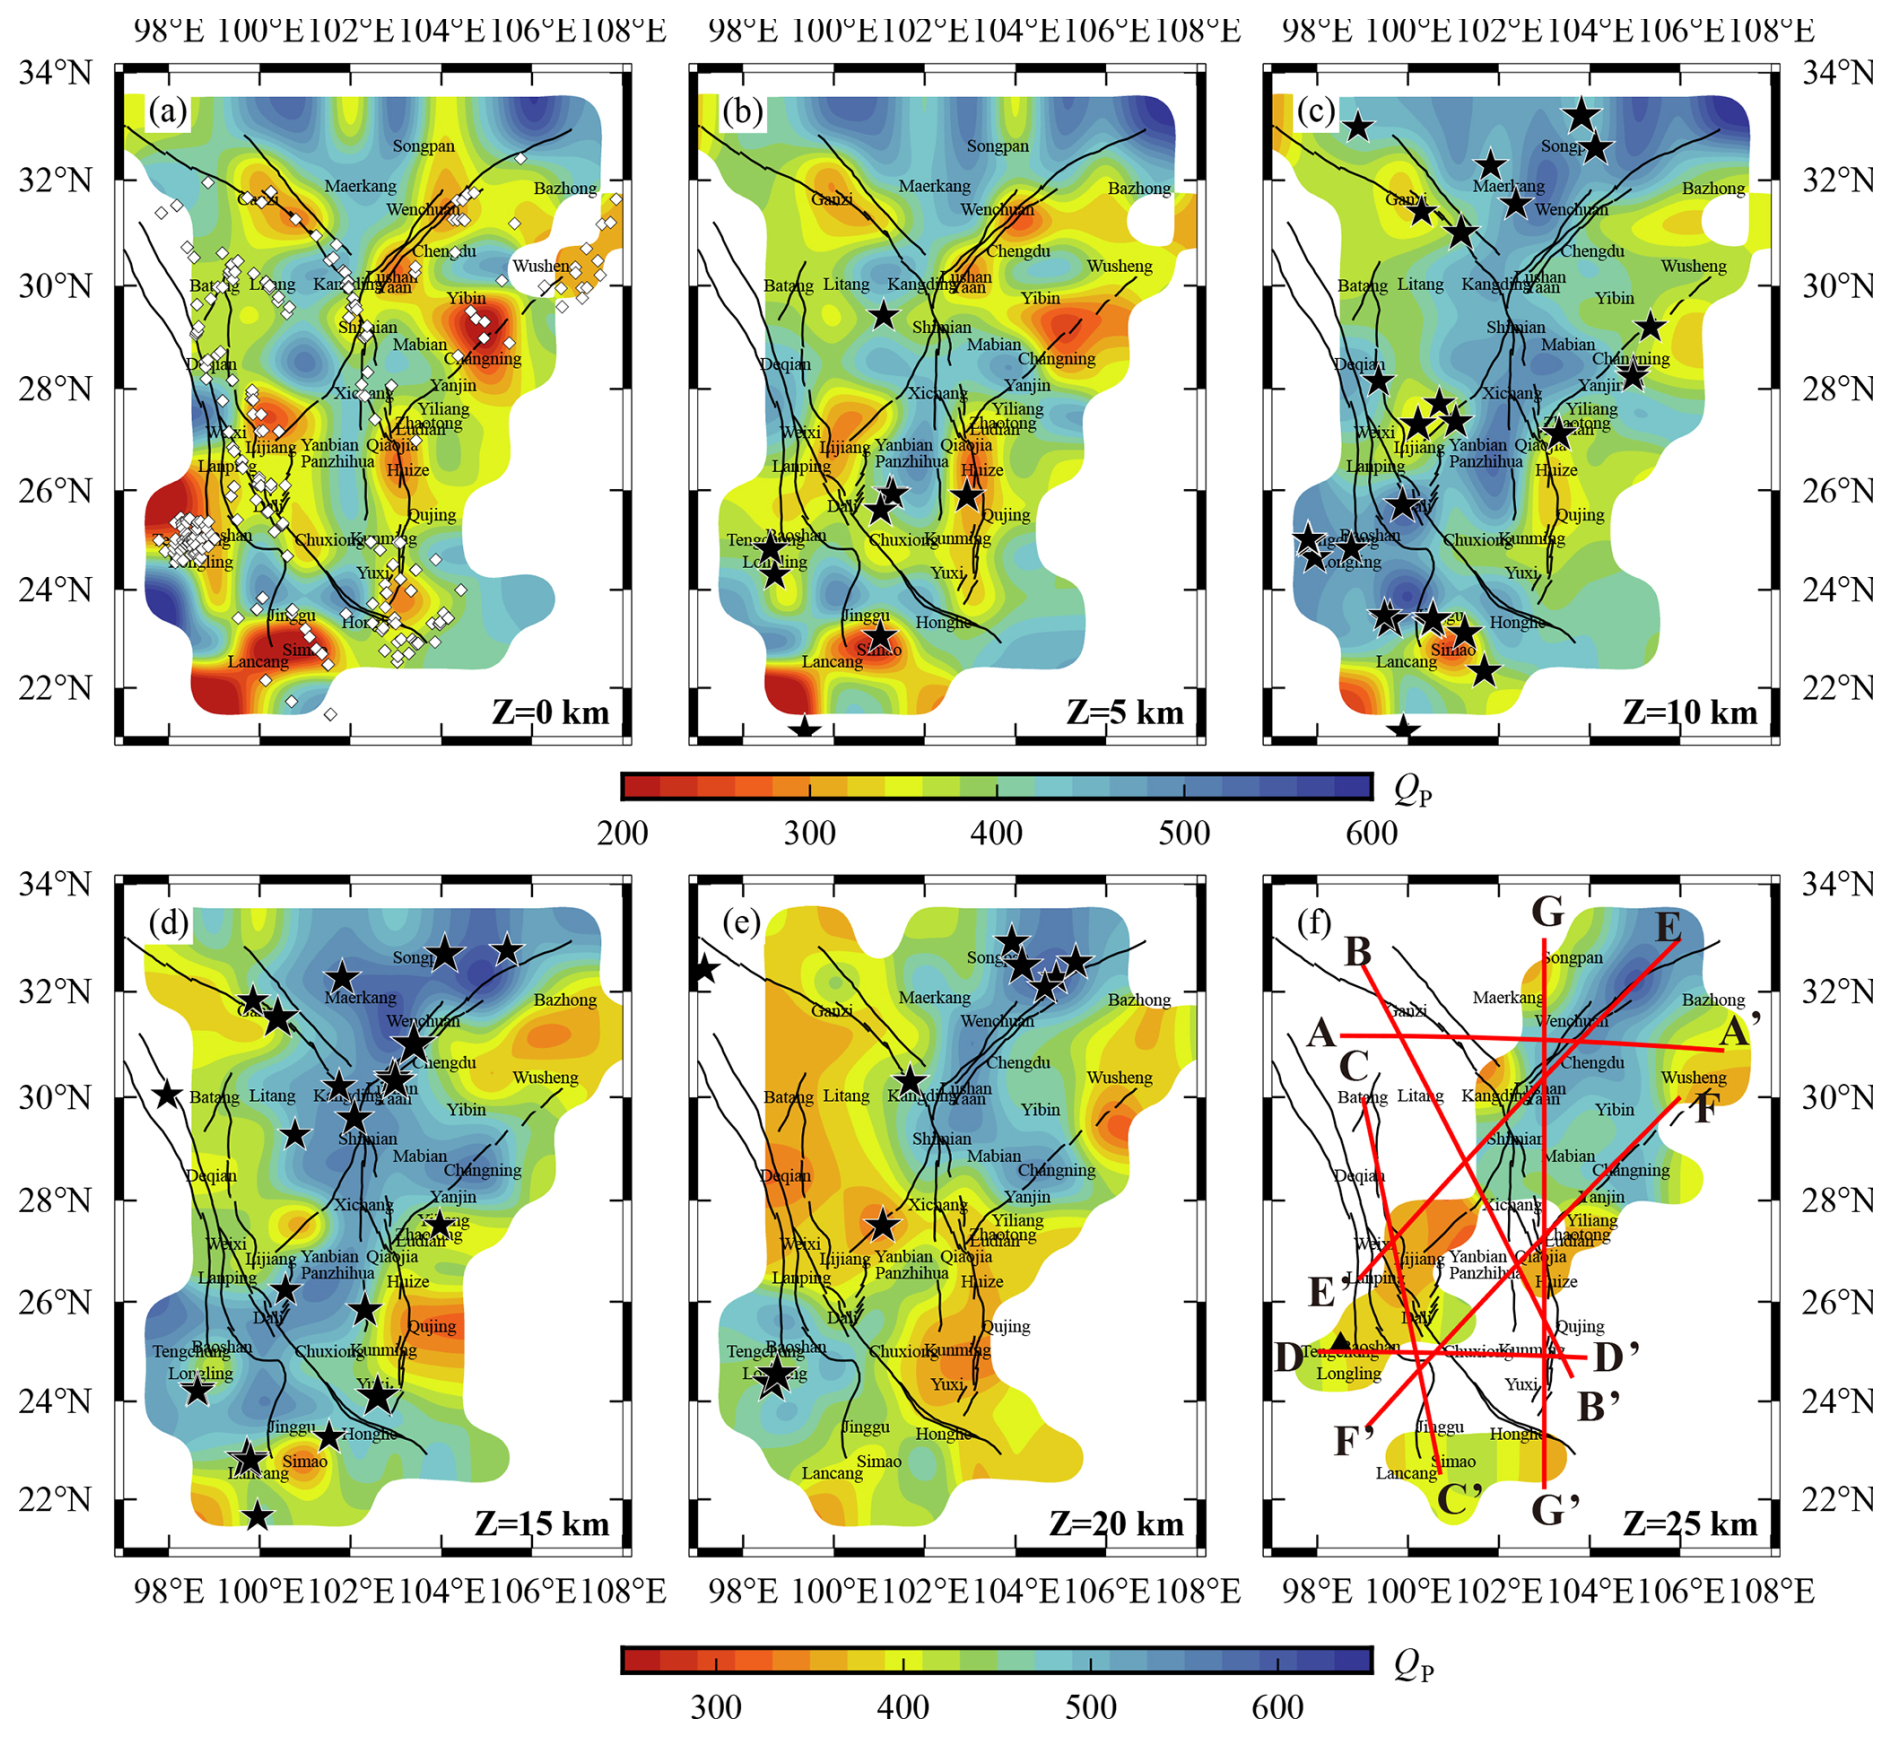
Figure 8Layered QP model (SF < 4). (a) White diamonds represent the distribution of hot springs (Zhang et al., 2021). (b–e) Black stars indicate earthquakes of magnitude 6 or greater since 1970 within a 2.5 km depth range for each. The size of the symbols is proportional to the magnitude of the earthquakes. (f) Solid red lines represent the profiles, with letters denoting the names of the profiles.
To better study the distribution characteristics of the medium structure in depth, we plot seven QP profiles (Fig. 8f). At the same time, the VP models of SWChinaCVM-1.0 and SWChinaCVM-2.0 established by previous researchers are compared to facilitate the comprehensive analysis of velocity and attenuation structure. The previous two versions of VP models and the QP model obtained in this paper generally exhibit low-value anomalies in the shallow layers and high-value anomalies in the deep layers. However, there are significant differences in the patterns of QP anomalies obtained in this paper and VP anomalies from previous studies. In basin areas such as Sichuan and Simao basins, the middle and upper crust exhibit obvious low-QP anomalies (Fig. 9a, c). Within the CDB enclosed by multiple large active faults, the NW and SE ends exhibit low-QP characteristics throughout the upper and middle crust, while VP shows low-value anomalies only within 10 km (Fig. 9b). Beneath some large fault zones, such as the Jinshajiang fault (JSJF), Longmenshan fault (LMSF), and XJF, there are obvious low-QP anomalies in the entire upper and middle crust, with low-VP anomalies distributed at depths within 10 km (Fig. 9e, g). There are also some large fault zones, such as the Huayingshan fault (HYSF), Red River fault (RRF), Daliangshan fault (DLSF), and the southern end of the Zemuhe fault (ZMHF), with low-VP and low-QP anomalies at depths within 10 km and high-VP and high-QP anomalies below 10 km (Fig. 9c, f, g). Notably, both sides of the northern RRF and the junction of the southern segment of the RRF with the XJF exhibit a clear low-QP anomaly within 10 km (Fig. 9c, g). In the Tengchong volcanic area, the upper and middle crust exhibit a low-QP anomaly that dips to the east (Fig. 9d), while VP shows a low-value anomaly only within 5 km. In addition, there are high-QP anomalies below the Lancangjiang fault (LCJF) (Fig. 9c, d), while the Lianfeng fault (LFF) is mainly characterized by high-VP and high-QP anomalies in the upper and middle crust (Fig. 9f). The southern section of the Anninghe fault (ANHF) exhibits high-QP anomalies (Fig. 9b, f). From the LMSF southward to the XJF, the upper crust shows high-VP and high-QP anomalies (Fig. 9g). The differences in the distribution of low-QP anomalies and low-VP anomalies in different regions obtained in this article indicate that the QP model obtained in this paper can supplement the physical properties of the medium not revealed by the VP models. In the following, we will analyze and discuss the medium's properties and the seismogenic environment for moderate and strong earthquakes by integrating the characteristics of VP and QP in the CSES.
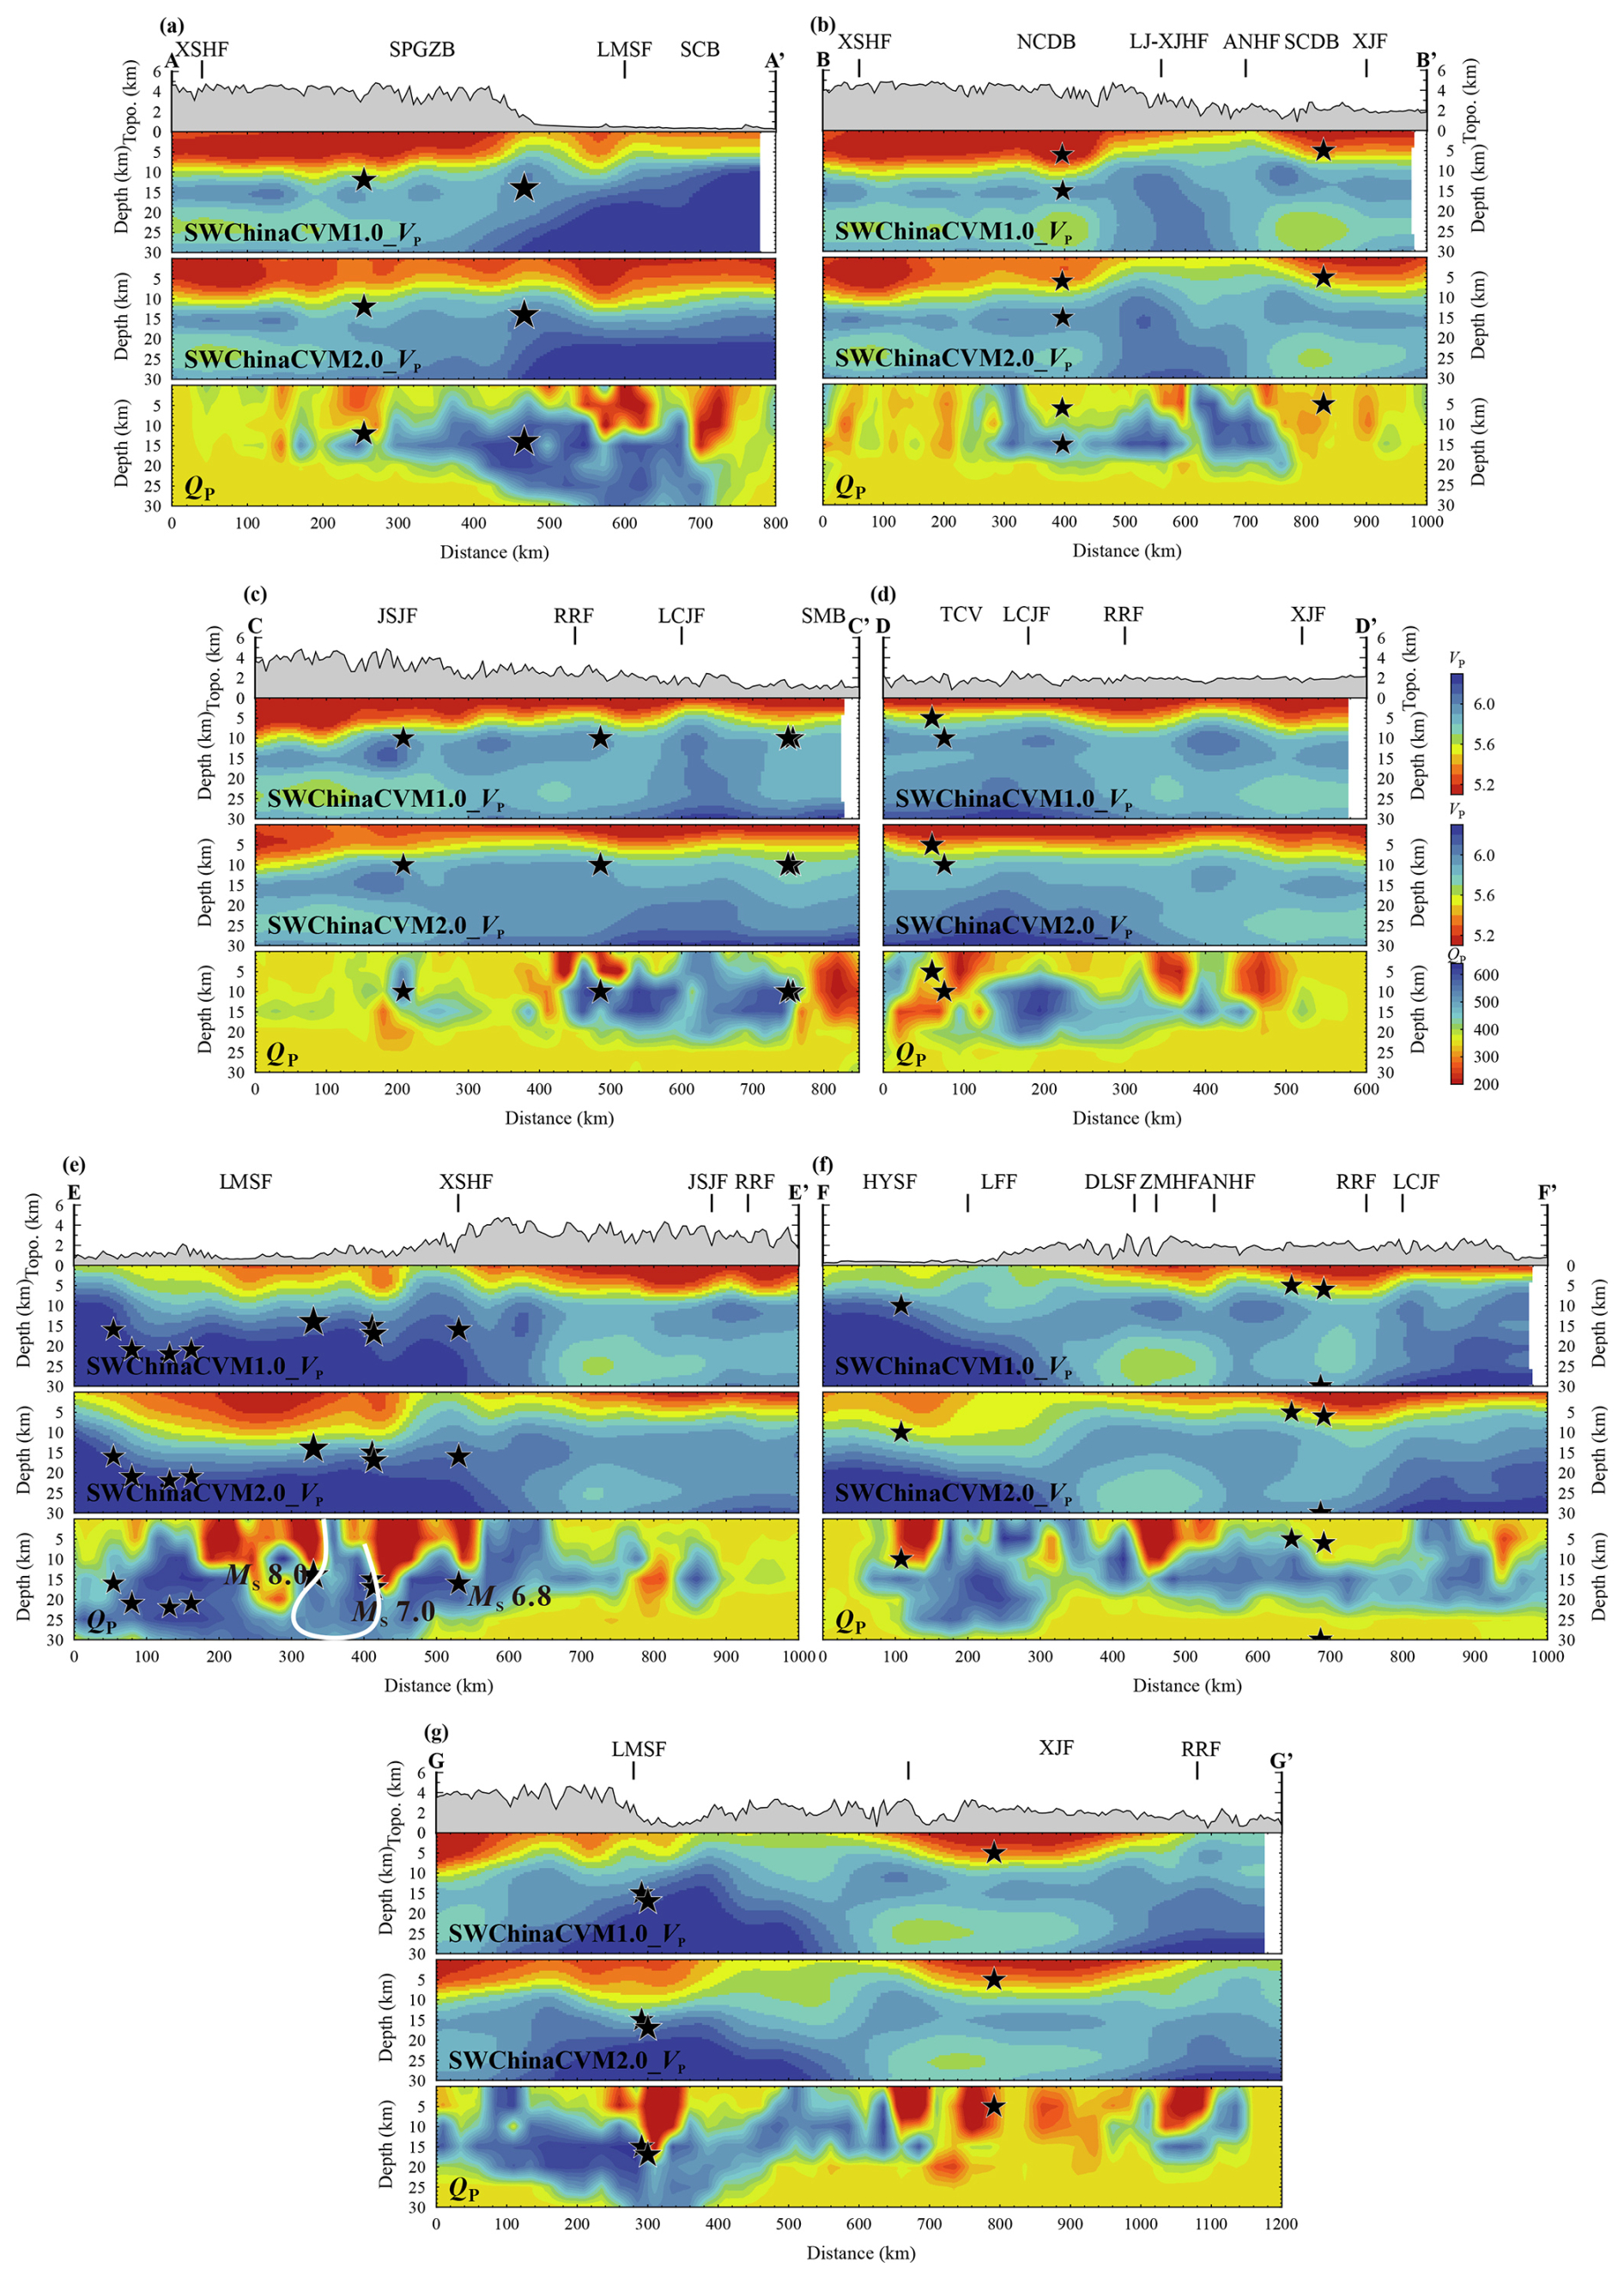
Figure 9VP and QP models of various profiles. Each subplot from top to bottom represents the VP results of SWChinaCVM1.0 and 2.0, as well as the QP results obtained in this paper. The vertical lines on the top of the topographic map represent the locations of the faults. The characters directly above the vertical lines represent the corresponding fault names. If the characters are between two vertical lines or between the starting/ending points of the profile and the vertical lines, such as SPGZB in panel (a), NCDB and SCDB in panel (b), JSJF and SMB in panel (c), TVC in panel (d), LMSF in panel (e), HYSF and LFF in panel (f), and XJF in panel (g), they represent the fault zones or place names within the corresponding ranges.. Black stars represent earthquakes with M≥6 within 25 km on both sides of the profile since 1970. The size of the symbols is proportional to the magnitude of the earthquakes. The white outline in panel (e) encloses the low-attenuation area between the 2008 Wenchuan MS 8.0 earthquake and the 2013 Lushan MS 7.0 earthquake. Other symbols are the same as in Fig. 8.
4.1 Spatial distribution characteristics of media structure in typical structural areas
The VP results of SWChinaCVM-1.0 and SWChinaCVM-2.0 reveal that the low-VP anomaly beneath the SPGZB extends to greater depths than that beneath the SCB (Fig. 9a). In contrast, the QP model shows that within 10 km of the shallow layer, the SPGZB exhibits low-attenuation anomalies, while the SCB shows high-attenuation anomalies (Fig. 9a), which is consistent with the VS model and the thickness of the sedimentary layers obtained by Yang et al. (2023), as well as the VP and VS models obtained by CSES-VM1.0. We believe that the distinct low-VP, low-VS, and low-QP anomalies in the shallow layers of the SCB reflect the presence of several kilometers of Cenozoic–Mesozoic sedimentary rocks in the SCB.
The NW-trending BB' profile across the CDB reveals that the northwestern and southeastern segments of the CDB exhibit high-attenuation characteristics in the upper and middle crust, while the central region is predominantly characterized by low-attenuation features. The low-attenuation feature between the Lijiang–Xiaojinhe fault (LJ-XJHF) and the ANHF corresponds to the high-velocity anomalies obtained by CSES-VM1.0 along the similar profile. The BB' profile crosses the inner zone of the Emeishan large igneous province (ELIP), which is primarily composed of flood basalts, accompanied by mafic and felsic intrusive rocks (Ren et al., 2022). Various geophysical studies have indicated that the inner zone of the ELIP is a rigid region with high VP, high VS, high Poisson ratio, high density, and high resistivity (Bao et al., 2015; Xu et al., 2015; Li et al., 2020; Zhang et al., 2020), which coincides with the high-QP anomalies obtained in this study in the CDB. Therefore, the high-QP anomalies reflect the basalt characteristics of the inner zone of the ELIP. At a depth of 20 km, the high-attenuation anomalies of the CDB are connected near Xichang (Fig. 8e), which is similar to the 2 Hz QLg model obtained by Zhou et al. (2008) in the Sichuan–Yunnan region. However, it differs from the QLg model (0.2–2.0 Hz) in the Tibetan Plateau obtained by Zhao et al. (2013). Previous velocity models have also shown (Yao et al., 2008; Bao et al., 2015; Yang et al., 2020, 2023; Liu et al., 2021, 2023; Wu et al., 2024) that the low-velocity zone located in the northwestern CDB and the low-velocity zone along the Xiaojiang fault are separated by the ELIP. Among them, the VS model obtained by Yang et al. (2023) shows that in the middle and lower crust at a depth of 20–30 km, the low-velocity anomalies of western Sichuan and the XJF are significantly separated by a high-velocity body, which extends continuously from the east side of the SCB, crosses the ANHF, and terminates at the central Yunnan block. Since the QP model obtained in this study in the CDB has no resolution below 20 km, it is not possible to determine the characteristics of QP in the middle and lower crust of the CDB, and it is not possible to accurately describe the distribution of flow in the middle and lower crust of the Tibetan Plateau.
Significant low-velocity and high-attenuation anomalies are observed in the shallow layers along the LMSF (Fig. 9e), and the range of high-attenuation anomalies is deeper. Between the LMSF and the XSHF, two distinct high-attenuation zones are present in the upper crust, corresponding to the 2008 Wenchuan MS 8.0 earthquake and the 2013 Lushan MS 7.0 earthquake source areas, respectively. The main rupture of the Wenchuan earthquake occurred near Yingxiu on the Beichuan fault, with both the Beichuan fault and the Pengguan fault experiencing severe ruptures, with rupture lengths reaching 240–300 and ∼ 90 km, respectively (Zhang et al., 2009a). These two major earthquakes have significantly fragmented the medium along the Longmenshan fault. Additionally, a series of complex rock bodies (757–805 Ma) are exposed along the Longmenshan fault from north to south, including the Nanba complex, Pengguan complex, Baoxing complex, and Kangding complex (Zhang et al., 2009b). Therefore, the high-attenuation anomaly may partly reflect strong medium inhomogeneity, leading to scattering attenuation. The high-attenuation anomaly above the epicenter of the Wenchuan MS 8.0 earthquake is consistent with the QP and QS models obtained by Zhou (2016) and the low-resistivity anomaly characteristics reported by Zhao et al. (2012). Zhao et al. (2012) suggested that the high-conductivity body beneath the LMSF in the Wenchuan earthquake source area may reflect an increase in fluid content. We believe that the two high-attenuation zones in the shallow layers of the LMSF indicate the presence of mechanically weak zones along the fault. Considering the development of hot springs along the LMSF, these mechanically weak zones are likely influenced by fluids in the upper crust. The occurrence of the Wenchuan MS 8.0 earthquake and the Lushan MS 7.0 earthquake may be related to the role of fluids.
The Xiaojiang fault (XJF) is the southeastern boundary of the CDB and extends over 400 km from the north of Qiaojia to the southeast of Jianshui. The fault zone is situated in a high-heat-flow area of 85 mW m−2 (Yuan et al., 2006), along which more than 20 basins with different scales and hot springs have developed. The north–south-trending GG' profile reveals (Fig. 9g) that the entire upper and middle crust along the XJF is dominated by significant low-QP anomalies, which terminate at the southern end of the Red River fault (RRF). These low-QP anomalies are in good agreement with the QLg models at different frequencies (Zhou et al., 2008; Zhao et al., 2013) and the QP model obtained by previous studies (Dai et al., 2020). The resolution of the QP model along the XJF in this study is superior to that of Dai et al. (2020) at depths of 5 and 15 km. The low-QP anomalies obtained in this study also show good consistency with the low-VP anomalies reported by previous studies (Wu et al., 2013, 2024). The electrical resistivity structure along the similar profile shows an alternating pattern of high and low anomalies (Yu et al., 2022), and the low-resistivity anomalies in the upper and middle crust may reflect the presence of saline fluids and highly conductive minerals. Geochemical studies also indicate that the XJF is dominated by crustal heat flow (Zhang et al., 2021). Therefore, the low-velocity and high-attenuation anomalies in the upper and middle crust of the XJF reflect abundant fluids in the fault zone. The prominent high-attenuation anomalies are concentrated at the northern and southern ends of the XJF. Geochemical research also shows that the relatively high temperatures and ion concentrations of hot-spring water, as well as the relatively high fluxes of soil radon and carbon dioxide gas, are concentrated in the northern and southern segments of the XJF, which corresponds to the spatial distribution of seismicity and fault slip rates (He et al., 2023). Shi and Wang (2017) shows that the permeability is higher in the northern and southern segments of the XJF. In summary, we suggest that the low-velocity, low-resistivity, and high-attenuation anomalies in the upper crust of the XJF reflect the presence of fluids and highly conductive minerals beneath the fault zone. Intense fault activity in the southern and northern segments leads to a high degree of crustal medium fragmentation, which may also enhance permeability and accelerate the water–rock interaction and soil gas emission within the fault zone. The XJF has experienced multiple tectonic movements, with acidic and basic magmatic intrusions during the Jinning, Caledonian, and Hercynian periods, causing large amounts of basalt and ultrabasic rock bodies to be exposed along the fault (Li, 1993). The high attenuation observed along the fault may also be due to scattering attenuation caused by the inhomogeneity of these unconsolidated rocks.
4.2 Low-QP anomaly in the western Yunnan region
The CC' profile along the Jinsha River fault (JSJF) shows that (Fig. 9c) the fault is predominantly characterized by low-QP anomalies, and high-QP anomalies are dominant in the south of the Red River fault (RRF). Zhou et al. (2020) found that the He in the hot-spring gases in the JSJF–RRF is mainly from the crust, and the high values of H2 concentration and He isotopic ratios appear at three fracture junctions of the JSJF with the Batang fault, the Zhongdian fault with the RRF, and the southern section of the RRF with the XJF, respectively, which has a good corresponding relationship with the high-attenuation anomalies obtained in different depths in this paper, especially in the intersection area of the Zhongdian fault and RRF (Fig. 9c) and the intersection area of the southern section of the RRF and XJF (Fig. 9g). The Simao basin exhibits low-QP anomalies. It is a Mesozoic–Cenozoic sedimentary basin, mainly composed of mudstone and sandstone. There are many hot springs and salt springs in the basin. The obvious high-attenuation anomalies in the basin reflect it being fluid-rich in the upper crust.
The Tengchong volcano (TCV), located in the southeastern Tibetan Plateau, is one of the largest active volcanoes in China (Fig. 1a). The TCV is characterized by a large amount of magmatic gas (carbon dioxide and sulfide) emissions (Zhao et al., 2011, 2012), an active hydrothermal cycle (Jiang et al., 2019), high surface heat flow (≥90 mW m−2), and strong earthquakes during the Holocene (Zhao et al., 2020) and volcanic activity (Wang et al., 2007; Zou et al., 2014). The measurement of hot-spring fluids also shows that there are a large number of hot-spring fluids in the TCV (Fig. 8a), indicating that the TCV is rich in thermal materials and fluids. Previous inversion of the crust beneath Tengchong volcano yielded low-VS anomalies (Shen et al., 2022; Yang et al., 2023; Lin et al., 2024). The DD' profile across the TCV shows a high-attenuation anomaly that dips to the west beneath the TCV (Fig. 9d). Zhao et al. (2021) found the low-VS anomaly at the depth of 20–35 km to the west of the TCV, which revealed a large basaltic magma reservoir and a melt fraction of 2 %–4.5 %. The high-attenuation anomaly obtained in the middle and upper crust of the TCV in this paper is likely connected to the low-VS anomaly obtained in the middle and lower crust by previous researchers. The westward-dipping high-attenuation anomaly in the upper and middle crust of the TCV depicts the possible upwelling of deep magma from west to east, which is also a direct reflection of partial melting and fluids.
4.3 Seismogenic mechanism of moderate and strong earthquakes
Most of the historical earthquakes in Fig. 1 lacked depth information before 1970. Therefore, we only consider the relationship between earthquakes with M≥6 and the QP model in the CSES after 1970. Some studies have found that large crustal earthquakes often occur in high-velocity-anomaly areas (Liu et al., 2023; Huang and Zhao, 2004; Sun et al., 2021). They believe that the high-velocity-anomaly area may be the asperity of the fault, with high stress accumulation, resulting in large earthquakes. Other studies have found that moderate and strong earthquakes with M≥6 often occur in high-attenuation areas or at the boundaries of high and low attenuation (Zhou et al., 2008; Pei et al., 2009; Liu and Zhao, 2015; Zhou et al., 2020). These results show that fluids increase the pore pressure of faults and promote earthquake nucleation. In this paper, the earthquakes within 2.5 km of each depth layer are projected onto the layered QP model, and the earthquakes with M≥6 within 25 km on both sides of each profile are projected onto the QP model (Figs. 8, 9). The results show that, compared with the velocity models, the relationship between earthquakes above M 6 and the attenuation model is closer (Fig. 9). Earthquakes with M≥6 in western Yunnan are distributed in the low-attenuation area and the boundary area of high- and low-attenuation anomalies (Fig. 9c). Two major earthquakes in the TCV occurred in the high-attenuation area (Fig. 9d). Earthquakes with M≥6 along the northeastern segment of the Longmenshan fault (LMSF) are aftershocks of the 2008 Wenchuan MS 8.0 earthquake, which all occurred in the low-attenuation area or the boundary area of high and low attenuation (Fig. 9e). The major earthquakes in the southwest section of the LMSF are the 2008 Wenchuan MS 8.0 earthquake, the 2013 Lushan MS 7.0 earthquake, the 2022 Lushan MS 6.1 earthquake, and the 2022 Luding MS 6.8 earthquake from the northeast to the southwest, which all occurred at the boundary of high- to low-attenuation anomalies or the low-attenuation area (Fig. 9e, g), similar to the VP imaging results obtained by previous studies (Li et al., 2013; Pei et al., 2014; Liu et al., 2023). Earthquakes with M≥6 along the Huayingshan fault occurred at the boundary of high and low attenuation (Fig. 9f). Our result shows that earthquakes with M≥6 in the CSES generally occur in the low-attenuation area or the boundary area of high- and low-attenuation anomalies. The low-attenuation zone may represent the asperity with high mechanical strength, which is conducive to stress accumulation. The boundary of high- and low-attenuation anomalies corresponds to the gradient zone of stress change, which is more prone to sudden change in stress. Both cases promote the rupture of faults and trigger large earthquakes.
Our result also shows that the source area of the Lushan earthquake and the Wenchuan earthquake is separated by a low-attenuation zone (Fig. 9e). The results of body-wave velocity imaging showed that the Wenchuan–Lushan seismic gap is located in the low-velocity-anomaly area (Li et al., 2013; Pei et al., 2014). These studies believed that the intensity of this area is low and not enough to generate strong earthquakes. Wang et al. (2015) observed an obvious seismic moment deficit in the seismic gap through GPS velocity data, suggesting its potential to host strong earthquakes. Wang et al. (2018) found that the microseismic activity in the seismic gap is relatively weak compared to the north and south sides, indicating that the possibility of accumulated stress and strain being released through microseisms is very small. Diao et al. (2018) studied the post earthquake mechanism of the Wenchuan earthquake and found that there is almost no afterslip distribution in the gap, and it is still accumulating strain based on GPS observation, suggesting that the gap has a relatively large seismic risk. In addition, based on the study of Coulomb stress, it was found that the Wenchuan earthquake and Lushan earthquake have greatly enhanced the stress in the gap, thus greatly increasing the possibility of strong earthquakes (Guo et al., 2020). The low-attenuation-anomaly region in the seismic gap between the two strong earthquakes studied by this paper suggests that the strength of the medium in this region is high, and it is still accumulating stress. Contrary to the low-velocity characteristics, it is consistent with the observation results of GPS. Therefore, we agree that the seismic gap poses a danger of major earthquakes in the future.
In this study, we collect and sort out the earthquake catalog, phase reports, and seismic waveforms of magnitude 1.5 or above recorded by 582 stations in the China Seismic Experimental Site from 2013 to 2023. Through seismic clustering and phase quality control, we select 35 778 high-quality seismic waveforms. The high-resolution 3D QP model of the CSES is obtained by using SIMUL2000 program. The horizontal resolution of the model is 50 km, and the vertical resolution is 5 km. Combined with other geophysical inversion results, as well as geochemical observation and geological structure data, this paper has the following understanding of the medium environment of the middle and upper crust of the CSES.
-
At the depth of 5 km along the large fault zone in the Chuan–Dian region, the QP model exhibits low-value anomalies, which correspond well with the characteristics of hot-spring development around the fault zone, reflecting the strong tectonic movement of major active fault zones leading to a highly fragmented and fluid-rich shallow medium. The QP model in the upper and middle crust of the Sichuan basin and Simao basin also shows low-value anomalies, reflecting the characteristics of thicker sedimentary layers in these areas.
-
The high-attenuation anomalies obtained in the upper and middle crust of Tengchong volcano are likely to be connected with the low-VS anomaly in the middle and lower crust. The westward-dipping high-attenuation anomalies in the upper and middle crust depict the upwelling pattern of magma rising up from west to east.
-
There are two obvious high-attenuation-anomaly areas under the Longmenshan fault, which are located above the epicenter of the 2008 Wenchuan MS 8.0 earthquake and 2013 Lushan MS 7.0 earthquake. The fluids in the upper crust may promote the nucleation of the two large earthquakes. The two seismic source areas are separated by a low-attenuation area, which may have high stress accumulation and may still have a risk of large earthquakes in the future.
-
The Xiaojiang fault shows high-attenuation anomalies in the middle and upper crust, and the anomalies at the north and south ends are more obvious. The high-attenuation anomaly at the intersection of the southern end and the Red River fault corresponds well to the high H2 and He isotopic content in hot springs, indicating that the Xiaojiang fault is rich in fluid and high-conductivity minerals in the upper and middle crust. The strong fault activity in the southern and northern segments leads to a high degree of crustal media fragmentation and enhances the permeability of the fault zone.
-
Most moderate and strong earthquakes with M≥6 in the CSES occur in the low-attenuation areas or the boundary area of high- to low-attenuation anomalies, which is similar to the spatial relationship between earthquakes and velocity anomalies. This paper considers that such an abnormal area is conducive to stress accumulation and sudden change in stress, which is prone to large earthquakes.
The earthquake catalogs and phase reports are provided by the China Earthquake Networks Center, the National Earthquake Data Center at http://data.earthquake.cn (CENC, 2025), the Sichuan Earthquake Administration, and the Yunnan Earthquake Administration. The inverted 3D QP models are available at https://doi.org/10.5281/zenodo.13994425 (Zhou and Duan, 2024). Version 1 of the SIMUL2000 program used for 3D seismic tomography is archived at https://doi.org/10.5281/zenodo.5547889 and available via Thurber and Eberhart-Phillips (2021). All figures were made with the Generic Mapping Tools (GMT) version 6 (Wessel et al., 2019) and CorelDRAW 2020 (© 2020 Corel Corporation) from https://www.corel.com/ (Corel, 2020).
LZ wrote, reviewed, and edited the manuscript. MD wrote the original manuscript. YF provided data for Sichuan Province. YA supplemented the data for Sichuan and Yunnan provinces. JY provided data for Yunnan Province. LZ and XZ provided project funding for this research.
The contact author has declared that none of the authors has any competing interests.
Publisher's note: Copernicus Publications remains neutral with regard to jurisdictional claims made in the text, published maps, institutional affiliations, or any other geographical representation in this paper. While Copernicus Publications makes every effort to include appropriate place names, the final responsibility lies with the authors.
This article is part of the special issue “Seismic imaging from the lithosphere to the near surface”. It is not associated with a conference.
We extend our sincere gratitude to Shaolin Liu and the anonymous reviewer for their valuable comments and suggestions. This study was jointly funded by the National Key R&D Program (2021YFC3000704), the National Natural Science Foundation of China (42174066), and the Central Public-interest Scientific Institution Basal Research Fund (CEAIEF20240405).
This research has been jointly funded by the National Key R&D Program (grant no. 2021YFC3000704), the National Natural Science Foundation of China (grant no. 42174066), and the Central Public-interest Scientific Institution Basal Research Fund (grant no. CEAIEF20240405).
This paper was edited by Puy Ayarza and reviewed by Shaolin Liu and one anonymous referee.
Bai, D., Unsworth, M. J., Meju, M. A., Ma, X., Teng, J., Kong, X., Sun, Y., Sun, J., Wang, L., Jiang, C., Zhao, C., Xiao, P., and Liu, M.: Crustal deformation of the eastern Tibetan plateau revealed by magnetotelluric imaging, Nat. Geosci., 3, 358–362, https://doi.org/10.1038/ngeo830, 2010.
Bao, X., Sun, X., Xu, M., Eaton, D. W., Song, X., Wang, L., Ding, Z., Mi, N., Li, H., Yu, D., Huang, Z., and Wang, P.: Two crustal low-velocity channels beneath SE Tibet revealed by joint inversion of Rayleigh wave dispersion and receiver functions, Earth Planet. Sci. Lett., 415, 16–24, https://doi.org/10.1016/j.epsl.2015.01.020, 2015.
Bao, X., Song, X., Eaton, D. W., Xu, Y., and Chen, H.: Episodic Lithospheric Deformation in Eastern Tibet Inferred From Seismic Anisotropy, Geophys. Res. Lett., 47, e2019GL085721, https://doi.org/10.1029/2019GL085721, 2020.
Brune, J. N.: Tectonic stress and the spectra of seismic shear waves from earthquakes, J. Geophys. Res., 75, 4997–5009, https://doi.org/10.1029/JB075i026p04997, 1970.
CENC: The earthquake catalogues and phase reports. China Earthquake networks center, National Earthquake Data Center, http://data.earthquake.cn (last access: January 2025), 2025.
Chen, Y., Gu, Y. J., Mohammed, F., Wang, J., Sacchi, M. D., Wang, R., and Nguyen, B.: Crustal attenuation beneath western North America: Implications for slab subduction, terrane accretion and arc magmatism of the Cascades, Earth Planet. Sci. Lett., 560, 116783, https://doi.org/10.1016/j.epsl.2021.116783, 2021.
Corel: CorelDRAW Official Website, https://www.corel.com/ (last access: January 2020), 2020.
Dai, A., Tang, C.-C., Liu, L., and Xu, R.: Seismic attenuation tomography in southwestern China: Insight into the evolution of crustal flow in the Tibetan Plateau, Tectonophysics, 792, 228589, https://doi.org/10.1016/j.tecto.2020.228589, 2020.
Deng, Y., Byrnes, J. S., and Bezada, M.: New Insights Into the Heterogeneity of the Lithosphere-Asthenosphere System Beneath South China From Teleseismic Body-Wave Attenuation, Geophys. Res. Lett., 48, e2020GL091654, https://doi.org/10.1029/2020GL091654, 2021.
Diao, F., Wang, R., Wang, Y., Xiong, X., and Walter, T. R.: Fault behavior and lower crustal rheology inferred from the first seven years of postseismic GPS data after the 2008 Wenchuan earthquake, Earth Planet. Sci. Lett., 495, 202–212, https://doi.org/10.1016/j.epsl.2018.05.020, 2018.
Duan, M., Zhou, L., Zhao, C., Liu, Z., and Zhang, X.: High-Resolution 3D QP and QS Models of the Middle Eastern Boundary of the Sichuan–Yunnan Rhombic Block: New Insight into Implication for Seismogenesis, Seismol. Res. Lett., 95, 1759–1775, https://doi.org/10.1785/0220230232, 2024.
Eberhart-Phillips, D.: Three-dimensional velocity structure in northern California Coast Ranges from inversion of local earthquake arrival times, Bull. Seismol. Soc. Am., 76, 1025–1052, 1986.
Eberhart-Phillips, D. and Chadwick, M.: Three-dimensional attenuation model of the shallow Hikurangi subduction zone in the Raukumara Peninsula, New Zealand, J. Geophys. Res., 107, 2033–2050, https://doi.org/10.1029/2000JB000046, 2002.
Eberhart-Phillips, D. and Michael, A. J.: Seismotectonics of the Loma Prieta, California, region determined from three-dimensional Vp, and seismicity, J. Geophys. Res., 103, 21099–21120, https://doi.org/10.1029/98JB01984, 1998.
Eberhart-Phillips, D., Chadwick, M., and Bannister, S.: Three-dimensional attenuation structure of central and southern South Island, New Zealand, from local earthquakes, J. Geophys. Res., 113, B05308–B05308, https://doi.org/10.1029/2007JB005359, 2008.
Evans, J. R., Eberhart-Phillips, D., and Thurber, C.: User's manual for SIMULPS12 for imaging Vp and : A derivative of the “Thurber” tomographic inversion SIMUL3 for local earthquakes and explosions, USGS, https://doi.org/10.3133/ofr94431, 1994.
Fu, Y. V., Gao, Y., Li, A., Li, L., and Chen, A.: Lithospheric structure of the southeastern margin of the Tibetan Plateau from Rayleigh wave tomography: Lithospheric Velocity Structure of SE Tibet, J. Geophys. Res., 122, 4631–4644, https://doi.org/10.1002/2016JB013096, 2017.
Guo, H. and Thurber, C.: Temporal Changes in Seismic Velocity and Attenuation at The Geysers Geothermal Field, California, From Double-Difference Tomography, J. Geophys. Res., 127, e2021JB022938, https://doi.org/10.1029/2021JB022938, 2022.
Guo, R., Zheng, Y., and Xu, J.: Stress modulation of the seismic gap between the 2008 M8.0 Wenchuan earthquake and the 2013 M7.0 Lushan earthquake and implications for seismic hazard, Geophys. J. Int., 221, 2113–2125, 2020.
Han, S., H. Zhang, H. Xin, W. Shen, and H. Yao: USTClitho2.0: Updated Unified Seismic Tomography Models for Continental China Lithosphere from Joint Inversion of Body-Wave Arrival Times and Surface-Wave Dispersion Data, Seismol. Res. Lett. 93, 201–215, https://doi.org/10.1785/0220210122, 2022.
Hauksson, E. and Shearer, P. M.: Attenuation models (QP and QS) in three dimensions of the southern California crust: Inferred fluid saturation at seismogenic depths, J. Geophys. Res. 111, B05302–B05322, https://doi.org/10.1029/2005JB003947, 2006.
He, H., Chen, Z., Liu, Z., Gao, Z., Hu, L., Lu, C., Shao, J., and Li, Y.: Geochemical features of fluid in Xiaojiang fault zone, Southeastern Tibetan plateau: Implications for fault activity, Appl. Geochem., 148, 105507, https://doi.org/10.1016/j.apgeochem.2022.105507, 2023.
Hu, S., He, L., and Wang, J.: Heat flow in the continental area of China: a new data set, Earth Planet. Sci. Lett., 179, 407–419, 2000.
Huang, J. and Zhao, D.: Crustal heterogeneity and seismotectonics of the region around Beijing, China, Tectonophysics, 385, 159–180, 2004.
Huang, Z., Wang, L., Xu, M., and Zhao, D.: P Wave Anisotropic Tomography of the SE Tibetan Plateau: Evidence for the Crustal and Upper-Mantle Deformations, J. Geophys. Res., 123, 8957–8978, https://doi.org/10.1029/2018JB016048, 2018.
Jiang, G., Hu, S., Shi, Y., Zhang, C., Wang, Z., and Hu, D.: Terrestrial heat flow of continental China: Updated dataset and tectonic implications, Tectonophysics, 753, 36–48, https://doi.org/10.1016/j.tecto.2019.01.006, 2019.
Karato, S. and H. A. Spetzler: Defect microdynamics in minerals and solid-state mechanisms of seismic wave attenuation and velocity dispersion in the mantle, Rev. Geophys., 28, 399–421, 1990.
Lees, J. M. and Lindley, G. T.: Three-dimensional attenuation tomography at Loma Prieta: Inversion of t∗ for Q, J. Geophys. Res. 99, 6843–6863, https://doi.org/10.1029/93JB03460, 1994.
Li, P.: The Xianshuihe-Xiaojiang fault zone: Part I: Regional Tectonic Background, Seismological Press, Beijing, 284 pp., ISBN7-5028-0987-2/P⋅607, 1993 (in Chinese).
Li, X., Bai, D., Ma, X., Chen, Y., Varentsov, I. M., Xue, G., Xue, S., and Lozovsky, I.: Electrical resistivity structure of the Xiaojiang strike-slip fault system (SW China) and its tectonic implications, J. Asian Earth Sci., 176, 57–67, https://doi.org/10.1016/j.jseaes.2019.01.031, 2019.
Li, X., Ma, X., Chen, Y., Xue, S., Varentsov, I. M., and Bai, D.: A plume-modified lithospheric barrier to the southeastward flow of partially molten Tibetan crust inferred from magnetotelluric data, Earth Planet. Sci. Lett., 548, 116493, https://doi.org/10.1016/j.epsl.2020.116493, 2020.
Li, Z., Tian, B., Liu, S., and Yang, J.: Asperity of the 2013 Lushan earthquake in the eastern margin of Tibetan Plateau from seismic tomography and aftershock relocation, Geophys. J. Int., 195, 2016–2022, https://doi.org/10.1093/gji/ggt370, 2013.
Lin, G.: Three-dimensional compressional wave attenuation tomography for the crust and uppermost mantle of Northern and central California, J. Geophys. Res., 119, 3462–3477, https://doi.org/10.1002/2013JB010621, 2014.
Lin, Y., Liu, S., Dinghui, Y., Xiwei, X., Shuxin, Y., and Wenshuai, W.: A multiscale magma system beneath the Tengchong volcano in western Yunnan revealed by ambient noise tomography, Geophys. J. Int., 236, 1828–1839, 2024.
Liu, H., Pei, S., Liu, W., Xue, X., Li, J., Hua, Q., and Li, L.: Crustal and Upper Mantle Attenuation Structure Beneath the Southeastern Tibetan Plateau and Its Implications on Plateau Outgrowth, J. Geophys. Res. 129, e2023JB026977, https://doi.org/10.1029/2023JB026977, 2024.
Liu, X. and Zhao, D.: Seismic attenuation tomography of the Southwest Japan arc: new insight into subduction dynamics, Geophys. J. Int., 201, 135–156, https://doi.org/10.1093/gji/ggv007, 2015.
Liu, Y., Yao, H., Zhang, H., and Fang, H.: The Community Velocity Model V.1.0 of Southwest China, Constructed from Joint Body- and Surface-Wave Travel-Time Tomography, Seismol. Res. Lett., 92, 2972–2987, https://doi.org/10.1785/0220200318, 2021.
Liu, Y., Yu Z., Zhang Z., Yao H., Wang W., Zhang H., Fang H., and Fang L.: The high-resolution community velocity model V2.0 of southwest China, constructed by joint body and surface wave tomography of data recorded at temporary dense arrays, Sci. China Earth Sci., 66, 2368–2385, https://doi.org/10.1007/s11430-022-1161-7, 2023.
McNamara, D. E.: Frequency dependent Lg attenuation in southcentral Alaska, Geophys. Res. Lett., 27, 3949–3952, 2000.
Pei, S., Cui, Z., Sun, Y., Toksoz, M. N., Rowe, C. A., Gao, X., Zhao, J., Liu, H., He, J., and Morgan, F. D.: Structure of the Upper Crust in Japan from S-Wave Attenuation Tomography, Bull. Seismol. Soc. Am., 99, 428–434, https://doi.org/10.1785/0120080029, 2009.
Pei, S., Zhang, H., Su, J., and Cui, Z.: Ductile Gap between the Wenchuan and Lushan Earthquakes Revealed from the Two-dimensional Pg Seismic Tomography, Sci. Rep., 4, 6489, https://doi.org/10.1038/srep06489, 2014.
Qiao, L., Yao, H., Lai, Y.-C., Huang, B.-S., and Zhang, P.: Crustal Structure of Southwest China and Northern Vietnam From Ambient Noise Tomography: Implication for the Large-Scale Material Transport Model in SE Tibet, Tectonics, 37, 1492–1506, https://doi.org/10.1029/2018TC004957, 2018.
Reyners, M., Eberhart-Phillips, D., and Stuart, G.: A three-dimensional image of shallow subduction: crustal structure of the Raukumara Peninsula, New Zealand, Geophys. J. Int. 137, 873–890. https://doi.org/10.1046/j.1365-246x.1999.00842.x, 1999.
Ren, Y., Lu, Z. W., Zhang, X., Xue, S., and Wang, G.: Crustal structure of the Emeishan large igneous province inner zone revealed by deep seismic reflection profile. Chinese J. Geophys., 65, 484–494, https://doi.org/10.6038/cjg2022P0196, 2022 (in Chinese).
Shen, W., Ritzwoller, M. H., Kang, D., Kim, Y., Lin, F.-C., Ning, J., Wang, W., Zheng, Y., and Zhou, L.: A seismic reference model for the crust and uppermost mantle beneath China from surface wave dispersion, Geophys. J. Int., 206, 954–979, https://doi.org/10.1093/gji/ggw175, 2016.
Shen, W., Liu, S., Yang, D., Wang, W., Xu, X., and Yang, S.: The crustal and uppermost mantle dynamics of the Tengchong–Baoshan region revealed by P -wave velocity and azimuthal anisotropic tomography, Geophys. J. Int., 230, 1092–1105, https://doi.org/10.1093/gji/ggac105, 2022.
Shi, Z. and Wang, G.: Evaluation of the permeability properties of the Xiaojiang Fault Zone using hot springs and water wells, Geophys. J. Int., 209, 1526–1533, https://doi.org/10.1093/gji/ggx113, 2017.
Stachnik, J. C., Abers, G. A., and Christensen, D. H.: Seismic attenuation and mantle wedge temperatures in the Alaska subduction zone, J. Geophys. Res. 109, B10304, https://doi.org/10.1029/2004JB003018, 2004.
Sun, Q., Pei, S., Cui, Z., Chen, Y. J., Liu, Y., Xue, X., Li, J., Li, L., and Zuo, H.: Structure-controlled asperities of the 1920 Haiyuan M 8.5 and 1927 Gulang M 8 earthquakes, NE Tibet, China, revealed by high-resolution seismic tomography, Sci. Rep., 11, 5090, https://doi.org/10.1038/s41598-021-84642-7, 2021.
Tang, Z., Yang, D., Pan, W., Dong, X., Wang, N., and Xia, J.: Adjoint Attenuation Tomography of Sichuan–Yunnan Region, Seismol. Res. Lett., 94, 898–912, https://doi.org/10.1785/0220220189, 2023.
Thurber, C. H.: Local earthquake tomography: velocities and -theory, Phys. Earth Planet. Inter., 75, 55–62, 1993.
Thurber, C. and Eberhart-Phillips, D.: SIMUL codes for local earthquake tomography, Zenodo [code], https://doi.org/10.5281/zenodo.5547889, 2021.
Toomey, D. R. and Foulger, G. R.: Tomographic inversion of local earthquake data from the Hengill-Grensdalur Central Volcano Complex, Iceland, J. Geophys. Res., 94, 17497–17510, https://doi.org/10.1029/JB094iB12p17497, 1989.
Wang, C., Liang, C., Deng, K., Huang, Y., and Zhou, L.: Spatiotemporal Distribution of Microearthquakes and Implications Around the Seismic Gap Between the Wenchuan and Lushan Earthquakes, Tectonics, 37, 2695–2709, https://doi.org/10.1029/2018TC005000, 2018.
Wang, F., Wang, M., Wang, Y., and Shen, Z.-K.: Earthquake potential of the Sichuan-Yunnan region, western China, J. Asian Earth Sci., 107, 232–243, https://doi.org/10.1016/j.jseaes.2015.04.041, 2015.
Wang, Q. and Gao, Y.: Rayleigh wave phase velocity tomography and strong earthquake activity on the southeastern front of the Tibetan Plateau, Sci. China Earth Sci. 57, 2532–2542, https://doi.org/10.1007/s11430-014-4908-2, 2014.
Wang, Y., Zhang, X., Jiang, C., Wei, H., and Wan, J.: Tectonic controls on the late Miocene–Holocene volcanic eruptions of the Tengchong volcanic field along the southeastern margin of the Tibetan plateau, J. Asian Earth Sci., 30, 375–389, https://doi.org/10.1016/j.jseaes.2006.11.005, 2007.
Wang, Z., Zhao, D., Liu, X., Chen, C., and Li, X.: P and S wave attenuation tomography of the Japan subduction zone, Geochem. Geophys. Geosy., 18, 1688–1710, https://doi.org/10.1002/2017gc006800, 2017.
Wei, Z. and Zhao, L.: Lg-Q model for Sichuan and Yunnan region, Earth Planet. Phys., 3, 526–536, https://doi.org/10.26464/epp2019054, 2019.
Wessel, P., Luis, J., Uieda, L., Scharroo, R., Wobbe, F., Smith, W., and Tian, D.: The Generic Mapping Tools Version 6, Geochem. Geophy. Geosys. 20, 5556–5564, https://doi.org/10.1029/2019GC008515, 2019.
Wu, J., Cai, Y., Wang, wei, Wang, weilai, Wang, C., Fang, L., Liu, Y., and Liu, J.: Three dimensional velocity model and its tectonic implications at China Seismic Experimental Site, eastern margin of the Tibetan Plateau, Sci. China Earth Sci., 54, 2304–2326, 2024.
Wu, J. P., Yang, T., Wang, W. L., Ming, Y. H., and Zhang, T. Z.: Three dimensional P-wave velocity structure around Xiaojiang fault system and its tectonic implications, Chin. J. Geophys. Chin. Engl. Abstr., 56, 2257–2267, 2013.
Xin, H., Zhang, H., Kang, M., He, R., Gao, L., and Gao, J.: High-Resolution Lithospheric Velocity Structure of Continental China by Double-Difference Seismic Travel-Time Tomography, Seismol. Res. Lett. 90, 229–241, https://doi.org/10.1785/0220180209, 2019.
Xu, T., Zhang, Z., Liu, B., Chen, Y., Zhang, M., Tian, X., Xu, Y., and Teng, J.: Crustal velocity structure in the Emeishan large igneous province and evidence of the Permian mantle plume activity, Sci. China Earth Sci., 58, 1133–1147, https://doi.org/10.1007/s11430-015-5094-6, 2015.
Yang, X., Luo, Y., Jiang, C., Yang, Y., Niu, F., and Li, G.: Crustal and Upper Mantle Velocity Structure of SE Tibet From Joint Inversion of Rayleigh Wave Phase Velocity and Teleseismic Body Wave Data, J. Geophys. Res., 128, e2022JB026162, https://doi.org/10.1029/2022JB026162, 2023.
Yang, Y., Forsyth, D. W., and Weeraratne, D. S.: Seismic attenuation near the East Pacific Rise and the origin of the low-velocity zone, Earth Planet. Sci. Lett., 258, 260–268, https://doi.org/10.1016/j.epsl.2007.03.040, 2007.
Yang, Y., Yao, H., Wu, H., Zhang, P., and Wang, M.: A new crustal shear-velocity model in Southwest China from joint seismological inversion and its implications for regional crustal dynamics, Geophys. J. Int., 1379–1393, https://doi.org/10.1093/gji/ggz514, 2020.
Yang, Y. J., Ritzwoller, M. H., Zheng, Y., Shen, W. S., Levshin, A. L., and Xie, Z. J.: A synoptic view of the distribution and connectivity of the mid-crustal low velocity zone beneath Tibet, J. Geophys. Res.-Sol. Ea., 117, B04303, https://doi.org/10.1029/2011JB008810, 2012.
Yao, H., Beghein, C., and van der Hilst, R. D.: Surface wave array tomography in SE Tibet from ambient seismic noise and two-station analysis – II. Crustal and upper-mantle structure, Geophys. J. Int., 173, 205–219, https://doi.org/10.1111/j.1365-246X.2007.03696.x, 2008.
Yu, N., Wang, X., Li, D., Li, X., Wang, E., Kong, W., and Li, T.: The mechanism of deep material transport and seismogenic environment of the Xiaojiang fault system revealed by 3-D magnetotelluric study, Sci. China Earth Sci., 65, 1128–1145, https://doi.org/10.1007/s11430-021-9914-3, 2022.
Yuan, Y., Ma, Y., Hu, S., Guo, T., and Fu, X.: Present day geothermal characteristics in South China, Chinese J. Geophys., 49, 1118–1126, 2006 (in Chinese).
Zhang, M., Guo, Z., Xu, S., Barry, P. H., Sano, Y., Zhang, L., Halldórsson, S. A., Chen, A.-T., Cheng, Z., Liu, C.-Q., Li, S.-L., Lang, Y.-C., Zheng, G., Li, Z., Li, L., and Li, Y.: Linking deeply-sourced volatile emissions to plateau growth dynamics in southeastern Tibetan Plateau, Nat. Commun., 12, 4157, https://doi.org/10.1038/s41467-021-24415-y, 2021.
Zhang, P., Deng, Q., Zhang, G., Ma, J., Gan, W., Min, W., Mao, F., and Wang, Q.: Strong earthquake activity and active blocks in China mainland, Sci. China Earth Sci., 46, 13–24, https://doi.org/10.1360/03dz0002, 2003.
Zhang, Y., Feng, W. P., Xu, L. S., Zhou, C. H., and Chen, Y. T.: Spatio-temporal rupture process of the 2008 great Wenchuan earthquake, Sci. China Earth Sci., 52, 145–154, https://doi.org/10.1007/s11430-008-0148-7, 2009a.
Zhang, Z., Wang, Y., Chen, Y., Houseman, G. A., Tian, X. B., Wang, E., and Teng, J. W.: Crustal structure across Longmenshan fault belt from passive source seismic profiling, Geophys. Res. Lett., 36, L17310, https://doi.org/10.1029/2009GL039580, 2009b.
Zhang, Z., Yao, H., and Yang, Y.: Shear wave velocity structure of the crust and upper mantle in Southeastern Tibet and its geodynamic implications, Sci. China Earth Sci., 63, 1278–1293, https://doi.org/10.1007/s11430-020-9625-3, 2020.
Zhao, C., Ran, H., and Chen, K.: Present-day temperatures of magma chambers in the crust beneath Tengchong volcanic field, southwestern China: Estimation from carbon isotopic fractionation between CO2 and CH4 of free gases escaped from thermal springs, Acta Petrol. Sin., 27, 2883–2897, 2011.
Zhao, C., Ran, H., and Wang, Y.: Present-day mantle-derived helium release in the Tengchong volcanic field, Southwest China: Implications for tectonics and magmatism, Acta Petrol. Sin., 28, 1189–1204, 2012.
Zhao, G., Unsworth, M. J., Zhan, Y., Wang, L., Chen, X., Jones, A. G., Tang, J., Xiao, Q., Wang, J., Cai, J., Li, T., Wang, Y., and Zhang, J.: Crustal structure and rheology of the Longmenshan and Wenchuan Mw 7.9 earthquake epicentral area from magnetotelluric data, Geology, 40, 1139–1142, https://doi.org/10.1130/G33703.1, 2012.
Zhao, L. F., Xie, X. B., He, J. K., Tian, X. B., and Yao, Z. X.: Crustal flow pattern beneath the Tibetan Plateau constrained by regional Lg-wave Q tomography, Earth Planet. Sci. Lett., 383, 113–122, https://doi.org/10.1016/j.epsl.2013.09.038, 2013.
Zhao, Y., Guo, L., Guo, Z., Chen, Y. J., Shi, L., and Li, Y.: High resolution crustal model of SE Tibet from joint inversion of seismic P-wave travel-times and Bouguer gravity anomalies and its implication for the crustal channel flow, Tectonophysics, 792, 228580, https://doi.org/10.1016/j.tecto.2020.228580, 2020.
Zhao, Y., Guo, Z., Wang, K., and Yang, Y. J.: A Large Magma Reservoir Beneath the Tengchong Volcano Revealed by Ambient Noise Adjoint Tomography, J. Geophys. Res., 126, e2021JB022116, https://doi.org/10.1029/2021JB022116, 2021.
Zheng, X., Zhao, C., Zheng, S., and Zhou, L.: Crustal and upper mantle structure beneath the SE Tibetan Plateau from joint inversion of multiple types of seismic data, Geophys. J. Int., 217, 331–345, https://doi.org/10.1093/gji/ggz027, 2019.
Zhou, L.: Attenuation tomography of the earth media, PhD Thesis, Institute of Geophysics, China Earthquake Administration, Beijing, 161–174, 2016 (in Chinese).
Zhou, L. and Duan, M.: The High-resolution 3D QP Model of the China Seismic Experiment Site, Zenodo [data set], https://doi.org/10.5281/zenodo.13994425, 2024.
Zhou, L., Zhao, C., Xiu, J., and Chen, Z.: Tomography of QLg in Sichuan-Yunnan Zone, Chinese J. Geophys., 51, 1745–1752, 2008 (in Chinese).
Zhou, L., Zhao, C., Zheng, X., Chen, Z., and Zheng, S.: Inferring water infiltration in the Longtan reservoir area by three-dimensional attenuation tomography, Geophys. J. Int., 186, 1045–1063, https://doi.org/10.1111/j.1365-246X.2011.05124.x, 2011.
Zhou, L., Zhao, C., Luo, J., and Chen, Z.: A Detailed Insight into Fluid Infiltration in the Three Gorges Reservoir Area, China, from 3D VP, , QP, and QS Tomography, Bull. Seismol. Soc. Am., 108, 3029–3045, https://doi.org/10.1785/0120170361, 2018.
Zhou, L., Song, X., Yang, X., and Zhao, C.: Rayleigh Wave Attenuation Tomography in the Crust of the Chinese Mainland, Geochem. Geophys. Geosy., 21, e2020GC008971, https://doi.org/10.1029/2020GC008971, 2020.
Zhu, H., Bozdağ, E., Duffy, T. S., and Tromp, J.: Seismic attenuation beneath Europe and the North Atlantic: Implications for water in the mantle, Earth Planet. Sci. Lett., 381, 1–11, https://doi.org/10.1016/j.epsl.2013.08.030, 2013.
Zou, H., Shen, C.-C., Fan, Q., and Lin, K.: U-series disequilibrium in young Tengchong volcanics: Recycling of mature clay sediments or mudstones into the SE Tibetan mantle, Lithos, 192–195, 132–141, https://doi.org/10.1016/j.lithos.2014.01.017, 2014.