the Creative Commons Attribution 4.0 License.
the Creative Commons Attribution 4.0 License.
 | 19 Jun 2025
Seismic noise characterization for the Buddusò–Ala dei Sardi wind park (Sardinia, Italy) and its impact on the Einstein Telescope candidate site
Giovanni Diaferia
Irene Molinari
Marco Olivieri
Fabio Di Felice
Andrea Contu
Domenico D'Urso
Luca Naticchioni
Davide Rozza
Jan Harms
Alessandro Cardini
Rosario De Rosa
Matteo Di Giovanni
Valentina Mangano
Fulvio Ricci
Lucia Trozzo
Carlo Murineddu
Carlo Giunchi
Wind turbines generate considerable seismic noise and interfere with sensitive instruments, such as permanent and temporary seismic sensors installed nearby, hampering their detection capabilities. This study investigates the seismic noise emission from one of Italy's largest wind farms, consisting of 69 turbines (2 MW each), located in northeastern Sardinia. Characterizing the noise emission from this wind farm is of particular importance due to its proximity to the Italian candidate site for hosting the Einstein Telescope (ET), the third-generation observatory for gravitational waves. We run a passive seismic experiment, “Wind turbIne Noise assEsSment in the Italian site candidate for Einstein Telescope” (WINES), using a linear array of nine broadband stations, installed at increasing distances from the wind farm. Spectral analysis, based on the retrieval of spectrograms and power spectral densities at all stations, shows a significant increase in noise amplitude when the wind farm is in operation. The reconstruction of noise polarization points out that the noise wavefield originates from a direction consistent with the wind farm's location. We recognize four dominant fixed spectral peaks at 3.4, 5.0, 6.8, and 9.5 Hz, corresponding to the modes of vibration of the wind turbine towers. While decreasing in amplitude with distance, the 3.4 Hz peak remains detectable up to 13 km from the nearest turbine. Assuming an amplitude decay model of the form r−α, where r is the distance, we estimate a damping factor of α∼2, which remains rather constant for each of the four main peaks, an observation that we relate to the good geomechanical characteristics of the local terrain, consisting of granitoid rocks. To better evaluate the possible impact of the wind farm noise emission on the ET, we also analyze the seismic data from two permanent stations bordering the ET candidate site area, each equipped with both a surface sensor and a borehole sensor at approximately 250 m depth. Power spectral density analysis for the surface and borehole sensors exhibits similar results and very low noise levels. When the wind farm operates at full capacity, the borehole sensors show an effective noise suppression at depth in the frequency range of interest (1–10 Hz). However, small residual spectral peaks at 3.4 Hz and between 4–6 Hz remain detectable.
- Article
(11214 KB) - Full-text XML
-
Supplement
(473 KB) - BibTeX
- EndNote


The exploitation of wind energy is of paramount importance for the transition to green energy for the mitigation of CO2 emissions. As a consequence, the installation of wind farms has increased in the last decades. Site selection strongly depends on wind speed and persistence over the year to maximize energy production. To minimize the impact on the local communities, wind farms are often installed in remote areas given their low population density. Such areas, commonly characterized by low anthropogenic noise, are also ideal for installing sensitive scientific instruments (e.g., seismic stations) to minimize any disturbances on the measurements. Given such competing interests between the scientific community and the wind farm operators, adequate initiatives are necessary. For example, the state of Bavaria in Germany imposed a buffer radius around permanent seismic stations (Windenergie-Erlass – BayWEE, 2016) to preserve the detection capabilities of the local seismic network. Several studies have targeted wind turbine installations to quantify and characterize the emitted seismic noise (Saccorotti et al., 2011; Stammler and Ceranna, 2016; Flores Estrella et al., 2017; Neuffer and Kremers, 2017; Neuffer et al., 2019; Zieger et al., 2018; Gaßner and Ritter, 2023). The wind turbine tower vibrates with several bending and torsional modes, mainly due to the wind pressure and blade motion (Lerbs et al., 2017). Vibrational modes are effectively propagated to the ground and translate into seismic noise through surface waves. The noise generated by wind turbines has been observed for distances greater than 10 km (Schofield, 2001; Saccorotti et al., 2011), and, while all studies agree on a typical exponential decay of the seismic noise with distance, the damping factor shows a large variability (Stammler and Ceranna, 2016; Flores Estrella et al., 2017; Zieger et al., 2018; Neuffer and Kremers, 2017; Neuffer et al., 2019). This suggests that the geological characteristics of the site, together with the local topography and spatial layout of the installed wind turbines (Lerbs et al., 2017; Limberger et al., 2022), make a large contribution to controlling the propagation and damping of the emitted seismic wavefield. Therefore, the impact of the noise produced by an installed (or perspective) wind farm is strongly site-specific and must be carefully evaluated with dedicated geophysical studies.
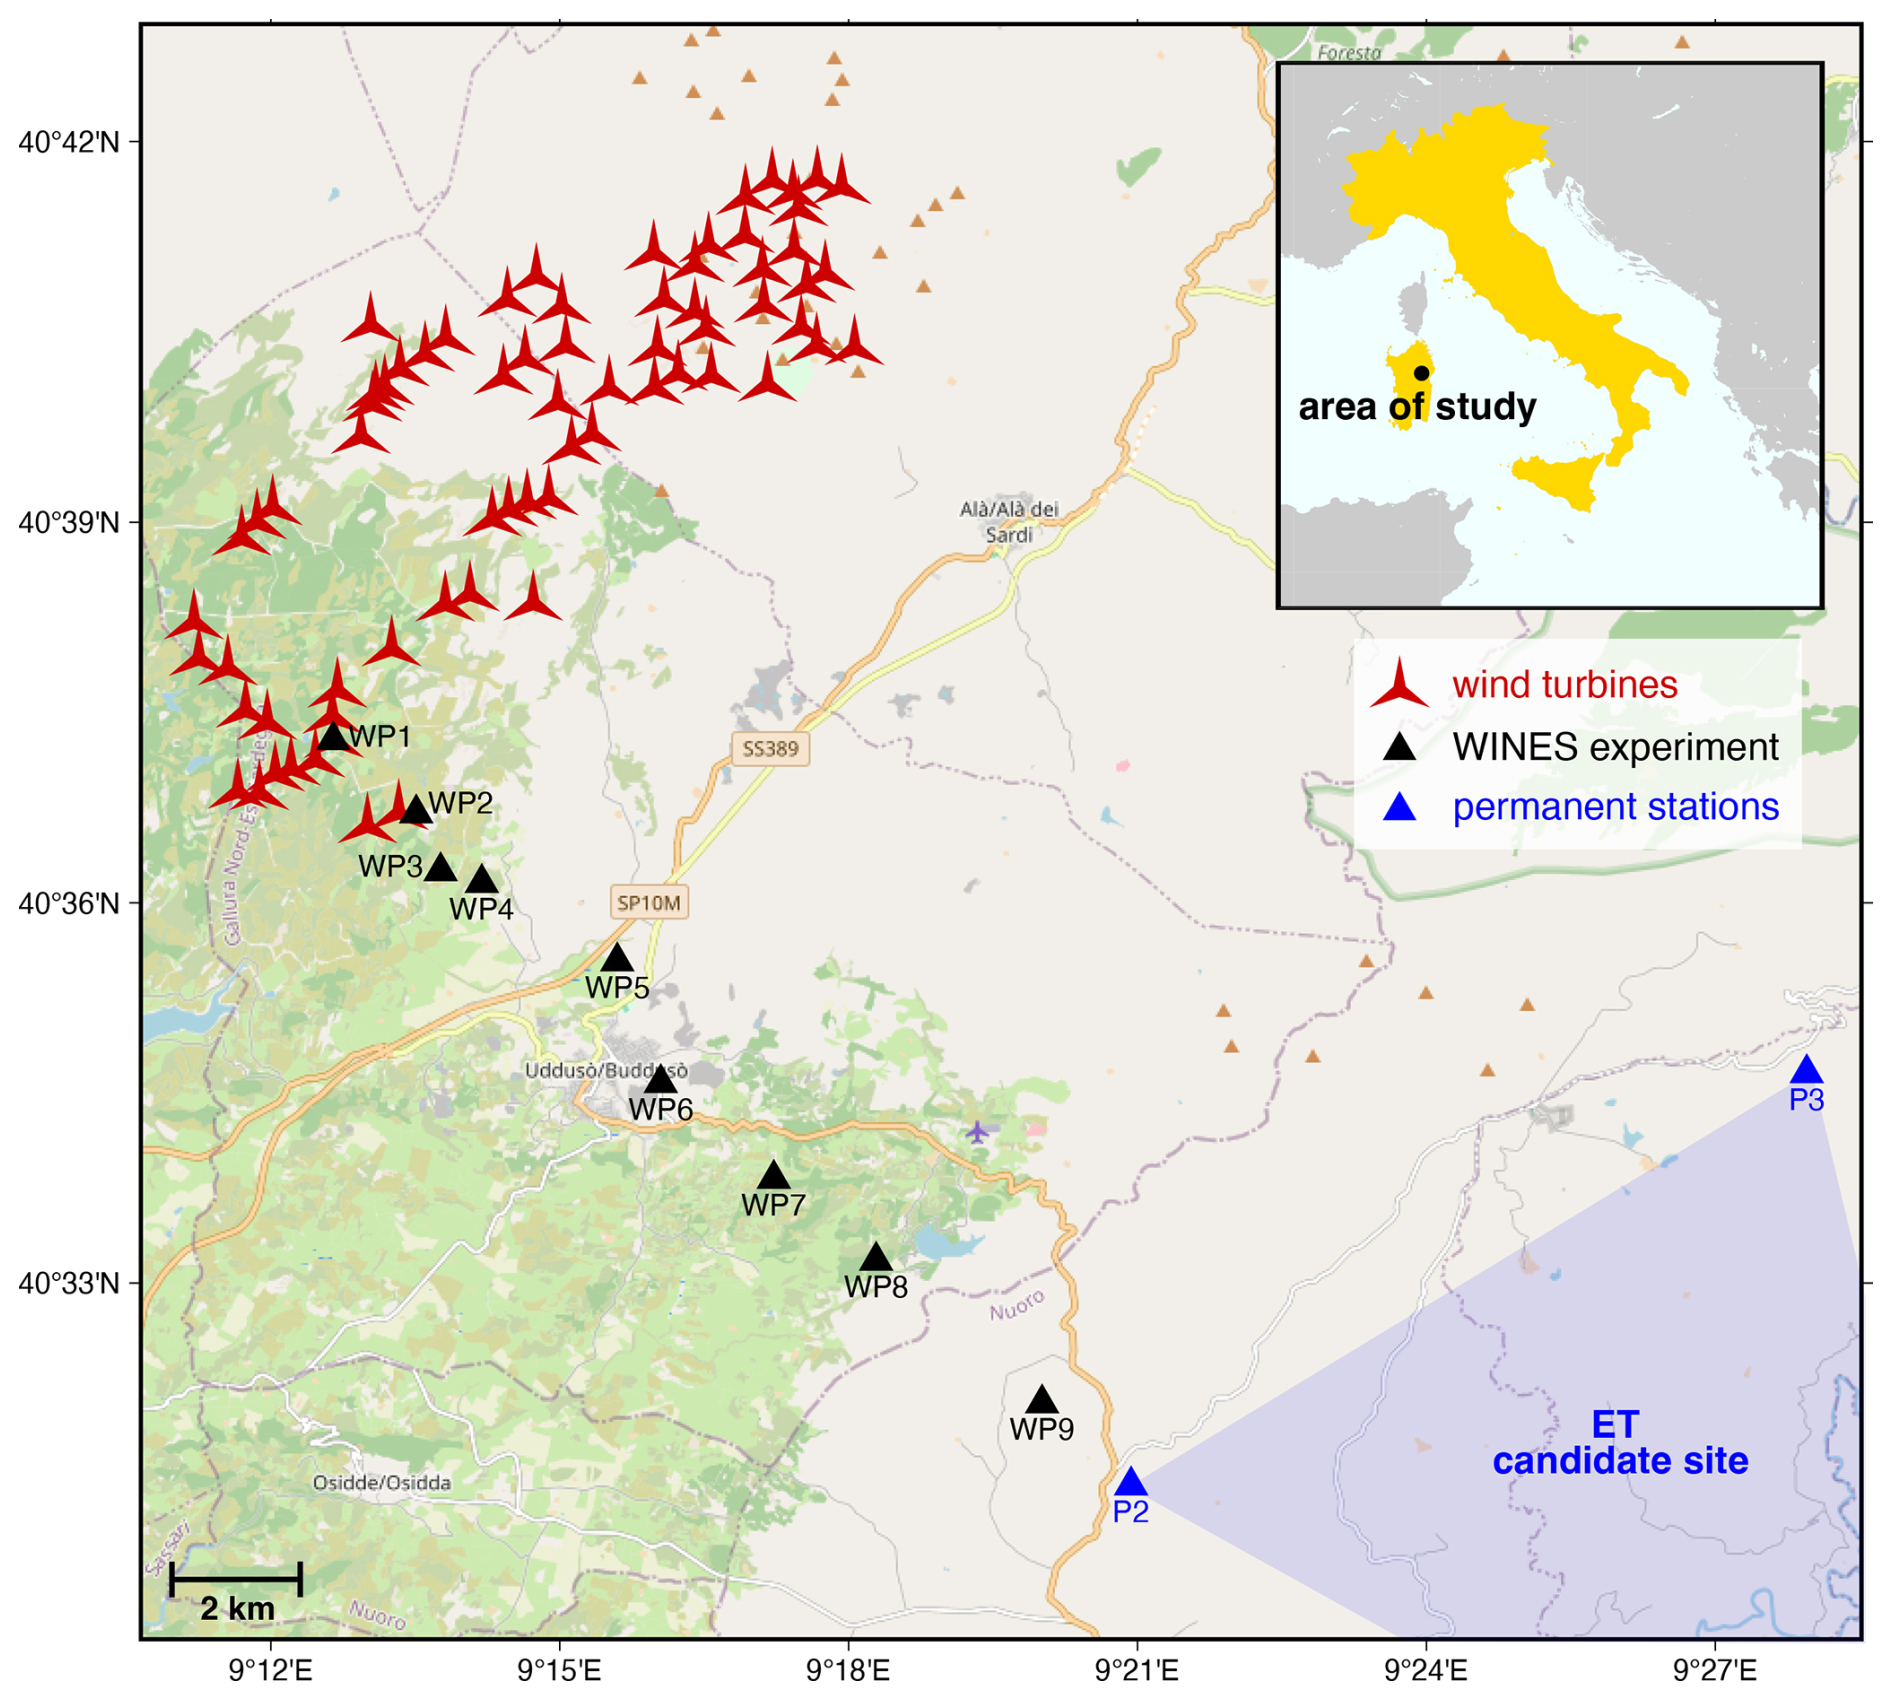
Figure 1Map of the study area. The turbines of the BAS wind park are in red. Black triangles indicate the location of the seismic stations installed within the WINES experiment. P2 and P3 (in blue) indicate the permanent stations located at two of the three vertices of the ET candidate site. The map tile is from © OpenStreetMap contributors 2024, distributed under the Open Data Commons Open Database License (ODbL) v1.0.
The Buddusò–Ala dei Sardi wind park (Sardinia, Italy) and the Einstein Telescope candidate site
In the northeastern part of Sardinia (Italy), a large wind farm (Buddusò–Ala dei Sardi wind park, hereinafter referred to as BAS) is installed in an area of about 40 km2 in the municipality of Buddusò (see Fig. 1), characterized by persistent windy conditions and low anthropization. The wind farm consists of 69 closely spaced 2 MW wind turbines that are 58 m tall (Enercon E70/2000) for a total installed power of 138 MW (Nadara Italy Spa, 2025). This wind farm merits scientific attention for two reasons. Firstly, the BAS wind park (despite the relatively limited height of the turbines) is among the largest in Italy, settled on a roughly homogeneous crystalline terrain in one of the most seismically quiet regions of the world in the frequency band 1–10 Hz (commonly dominated by anthropogenic noise). Such peculiarities can lead to a more detailed characterization of the noise generated by a wind park and its propagation. Secondly, the BAS wind farm is about 13 km NW from the candidate area for hosting the “Einstein Telescope” (ET), the third-generation gravitational wave observatory (Punturo et al., 2010). The ET will consist of a set of 10–15 km long laser interferometers installed in an underground research infrastructure at 200–300 m depth on average for optimal suppression of seismic, acoustic, and electromagnetic noise (Hutt et al., 2017). Given its particular and unique configuration, the ET is expected to provide a 10-fold increase (ET Steering Committee Editorial Team, 2020) in the detection of cosmological events that generate gravitational waves (Einstein, 1916) by pushing the frequency range of such phenomena down to 1 Hz (as opposed more than 10 Hz in current detectors such as Virgo and LIGO). Such an improvement will allow us to observe the universe in its early stage, before the emergence of stars, improving our understanding of the origins and evolution of the universe and its relation to dark energy and dark matter. The almost-absent natural seismicity, low seismic hazard (Woessner et al., 2015), and low population density make the Sardinian site a very good candidate to satisfy the requirements for installation and operation of the ET (Naticchioni et al., 2014, 2020; Di Giovanni et al., 2021). In fact, the long-term average of seismic noise at this site was shown to be extremely low, approaching Peterson's new low-noise model (NLNM; Peterson, 1993) for a wide range of frequencies, with a minimal diurnal and annual variation (Di Giovanni et al., 2023). In the context of the ET installation, the potential noise contribution of the nearby BAS wind park raises particular concern because the target frequency range of the ET interferometers (1–10 Hz) overlaps with the typical frequencies excited by wind parks. This work aims at characterizing the seismic noise produced by the BAS wind park, using the ground motion recorded by a temporary linear array of nine seismic stations that cover the distance between the BAS wind park and the ET candidate site (Fig. 1). We compute spectrograms and power spectral densities (PSDs) in order to analyze the spectral content and its relation to wind speed and mean blade rotation rate (BRR; measured in rpm) at the wind park. Through polarization analysis, we estimate the direction of the incoming wavefield and also derive a decay law for the noise amplitude at different frequencies and for different ranges of BRR. We then provide a discussion of the results in the context of the existing literature and the possible impact on the ET site.
The “Wind turbIne Noise assEsSment in the Italian site candidate for Einstein Telescope” (WINES) experiment consisted of a linear array of nine seismic stations (named WP1–9) that covered the distance between the BAS wind park and the station P2, bordering the ET candidate area (Fig. 1). The station spacing was variable (due to some terrain inadequacy and inaccessibility), ranging from 600 to 3000 m, for a total array length of ∼ 15 km. Station WP1 was installed 10 m NW from one of the turbines, while all other stations were positioned at increasing distances, with WP9 being the farthest from the BAS wind park. The sensors consisted of Trillium Compact 20 s broadband seismometers, except for WP1, which was equipped with a Trillium Compact 120 s. All sensors were buried with a soil coverage of at least 20–40 cm to prevent infrasonic and thermal contamination of the recorded ground motion. The sampling rate was set to 100 Hz for all stations. The seismic recording was about 8 weeks long, from 8 March until 30 April 2023. We integrated the seismic recordings with those from the permanent stations P2 and P3 (Fig. 1) to spatially extend the observation coverage within the ET candidate area. These stations, installed in 2021 by the Istituto Nazionale di Fisica Nucleare (INFN), are equipped with a pair of surface (named P2.00 and P3.00, respectively) and borehole (named P2.01 and P3.01, respectively) seismometers placed at similar depth (264 m for the case of P2 and 252 m for P3). In this study, all the data from the WINES array and the stations P2 and P3 underwent the same pre-processing steps, being demeaning, detrending, and deconvolution of the instrument response.
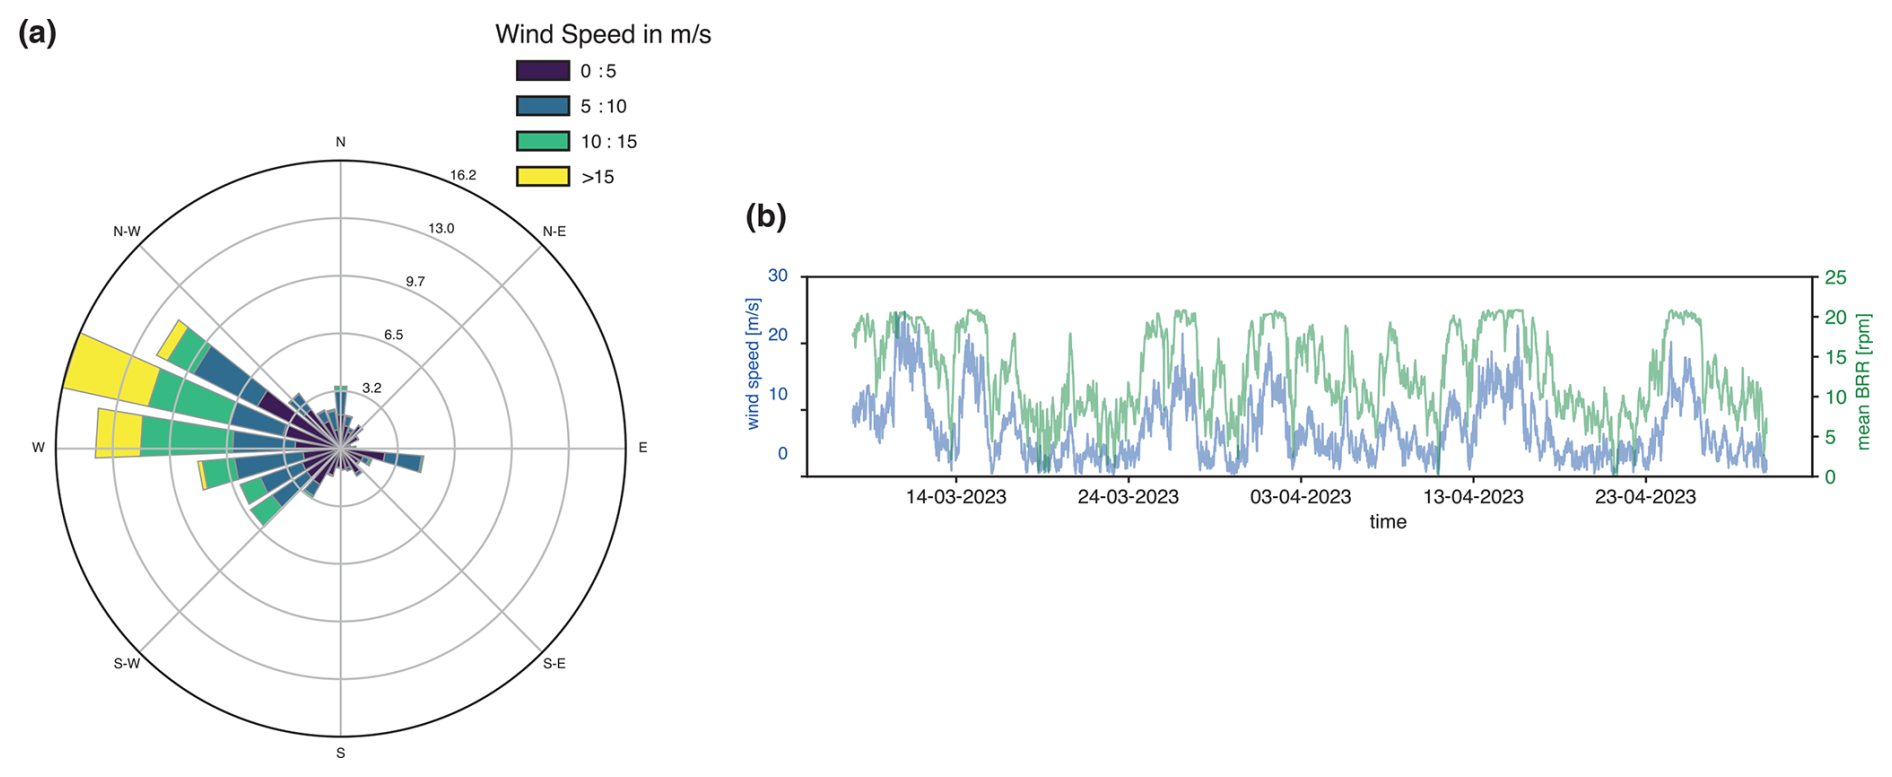
Figure 2(a) Histogram of wind velocity and wind direction during the WINES experiment (8 March–30 April 2023), recorded by the “Met Mast” station, a meteorological station located approximately in the center of the BAS wind park. (b) Time series of wind speed (blue) and average BRR (green) across the 69 wind turbines of the BAS wind farm.
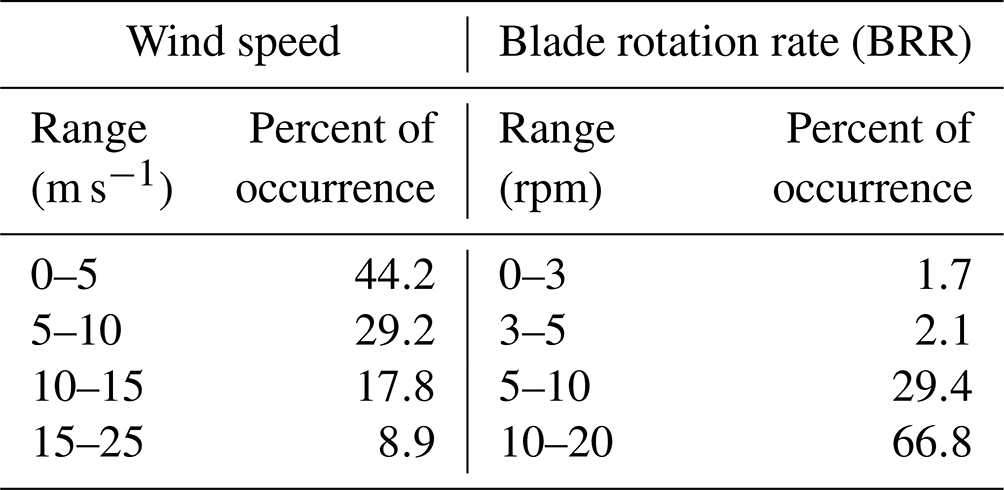
The seismic records are complemented with the data provided by Nadara Spa, including the BRR of each turbine and the wind speed and direction, measured by a high-quality meteorological station named “Met Mast” and located approximately at the center of the wind farm. Wind speed and direction are measured 64 m from the ground. For both wind conditions and BRR, the sampling rate is 10 min. According to the statistics on the recorded direction and strength of the wind (see Fig. 2a), conditions of absent or light wind (<3 m s−1) were particularly infrequent. On the contrary, wind was persistent, with velocities commonly above 5–10 m s−1 and a dominant incoming direction between SW and NW. As shown in Fig. 2b, there is a direct correlation between the recorded wind speed (blue curve) and the mean BRR across the 69 turbines (green curve). For convenience, we subdivide the recorded wind speed and BRR into four arbitrary, partially overlapping, classes that cover the min–max excursion for each dataset. For wind speed, we choose 0–5, 5–10, 10–15, and 15–25 m s−1, while, for the BRR, the classes are 0–3, 3–5, 5–10, and 10–25 rpm. The classes and their percentage of occurrence are given in Table 1. During the WINES experiment, the highest range of blade rotation (10–25 rpm) is reached ∼67 % of the time, even though high to very high wind speed (10–25 m s−1) is reached about one-quarter of the time (∼27 %). Moreover, the wind speed in the low to medium range (0–10 m s−1) is by far the most common condition (73 %). This implies that high blade rotation rates are reached even for relatively low wind speeds.
Table 1Selected classes and percent of occurrence for the recorded wind speed and blade rotation rate (BRR) during the WINES experiment
2.1 Noise polarization
Polarization analysis allows us to estimate the direction (i.e., the backazimuth) from which the seismic signal originates with respect to a recording station, i.e., the backazimuth. Based on the evidence that most of the noise emitted from wind farms propagates in the form of Rayleigh waves (Westwood and Styles, 2017), we derive the direction of the incoming noise along the array by exploiting the elliptical and retrograde particle motion of Rayleigh waves. Given a source with unknown backazimuth θ, the vertical (z(t)) and radial rθ(t) components show an (ideal) 90° phase shift (Claerbout, 1976), which can be compensated for by taking the Hilbert transform of the radial component H[rθ(t)] (Stachnik et al., 2012; Ensing and Wijk, 2019; Magrini et al., 2020). To determine the backazimuth θ, we iterate the rotation of the horizontal components by θi and calculate H[rθi(t)] in order to find the value θi for which the cross-correlation with the vertical component z(t) is maximized:
Here we perform such backazimuth estimation on data chunks of 10 min, iterating with 2° steps over the full circle.
2.2 Power spectral density (PSD)
We evaluate the spectral content of the recorded data through the estimation of the power spectral density (PSD), which is the Fourier transform of the time-averaged signal autocorrelation P(τ) (Aki and Richards, 2002):
where ω is the frequency and τ is the time integration variable. Following the algorithm from McNamara and Buland (2004), we divide the seismic records into 10 min long data chunks (which is the same sampling interval of the BRR and wind speed time series). For each chunk, the PSD is estimated with Welch's method (Welch, 1967), using 50 % overlapping windows of 12 800 samples to assure a good resolution for high-frequency signals. PSD amplitude is given in terms of meters per second (m s−1) per squared unit of frequency (Hz) and is averaged across all windows.
2.3 Estimation of amplitude damping
The cylindrical nature of a surface wave implies that the amplitude damping due to geometrical spreading at a distance r is proportional to r−α with (Novotny, 1999). However, a surface wave is damped with a higher factor α, due to the attenuation and scattering that depend on the local geology and soil conditions (Stammler and Ceranna, 2016; Zieger et al., 2018). We empirically estimate the damping factor α by tracking the amplitude of spectral peaks along the array and for different ranges of BRR to evaluate the consistency of the decay rate with respect to the operational regime of the wind farm. It is worth noting that, by considering the four highest spectral peaks in the PSD, which are visible at almost all stations, we are assured that the picked amplitude does not suffer from the possible infrasonic to seismic conversion due to its expected minor contribution on the overall generated noise. To properly evaluate the decay rate in a scenario of multiple aerially scattered noise sources, we compensate for the simultaneous contribution of all the 69 wind turbines. It can be assumed that the turbines act as quasi-random noise sources that add in quadrature rather than in phase (Schofield, 2001; Saccorotti et al., 2011; Neuffer et al., 2019); i.e., N equal turbines produce times the noise of a single turbine. Thus, we divide the amplitude of each spectral peak by , with N being the total number of turbines within a certain threshold radius, which we set at 15 km. For each station along the array, the average station–turbine distance is calculated in terms of a harmonic mean to underweight the contribution of isolated turbines (Neuffer and Kremers, 2017). Finally, with a non-linear least-squares method (Morè, 2006), we derive the optimal value of the decay rate α (and its uncertainty σ), assuming an exponential decay law of the type , where A is the amplitude of the frequency peak and rH is the harmonic average station–turbine distance.

Figure 3(a) The 10 d long seismic recording (z component) and spectrogram for stations WP1, WP3, and WP9. (b) Time series of wind speed recorded at the “Met Mast” station.
For a first appraisal of the spectral characteristics of the recorded signal across the array, we compute the spectrograms for a total of 10 d (from 8 March 2023 until 18 March 2023), covering the 1–20 Hz frequency range. In Fig. 3, for stations WP1, WP3, and WP9, we display the resulting spectrogram paired with the seismogram for the vertical component (velocity). Panel (b) of the same figure shows the recorded wind speed at the “Met Mast” meteorological station (considered representative of the wind speed velocities across the BAS wind park). The period covered includes intervals of calm and very light wind (e.g., 13–14 March 2023) and days with strong wind, reaching 20 m s−1 (see 10–12 March 2023 and 14–16 March 2023). Station WP1 shows, both in the seismogram and in the spectrogram, a high degree of noise contamination in the entire 1–20 Hz range during the intervals of sustained wind. Well-defined, narrow-banded monochromatic signals can be recognized at several fixed frequencies, which persist across the selected time interval, except for the few calm days (e.g., 13–14 March 2023). Though the installation is underneath the soil surface, we cannot exclude that WP1 is also partially contaminated by infrasonic noise. However, the evaluation of the degree of contamination is challenging due to the complexity of the pressure wave at the air–soil interface into seismic noise (Gortsas et al., 2017). The amplitude of the observed monochromatic signals appears to be modulated by the wind speed, thus increasing with increasing wind speed and vice versa. The spectrogram for WP3, about 2.5 km distant from WP1, shows a lower amplitude of the noise signal (note the change in the colormap scale with respect to WP1). Here, we note again that seismic noise contaminates the entire 1–20 Hz band but is predominantly confined in the same narrow-banded monochromatic signals as in WP1. The signals above 10 Hz appear to be strongly damped with respect to WP1, suggesting a higher damping effect with distance in this frequency range. Lastly, station WP9 (13 km away from WP1) does not show the narrow-band signals observed in WP1 and WP3. However, WP9 has a stronger noise contamination than WP3 (note the same colormap scale), likely induced by particular conditions of the local site or poor shielding from the wind action.
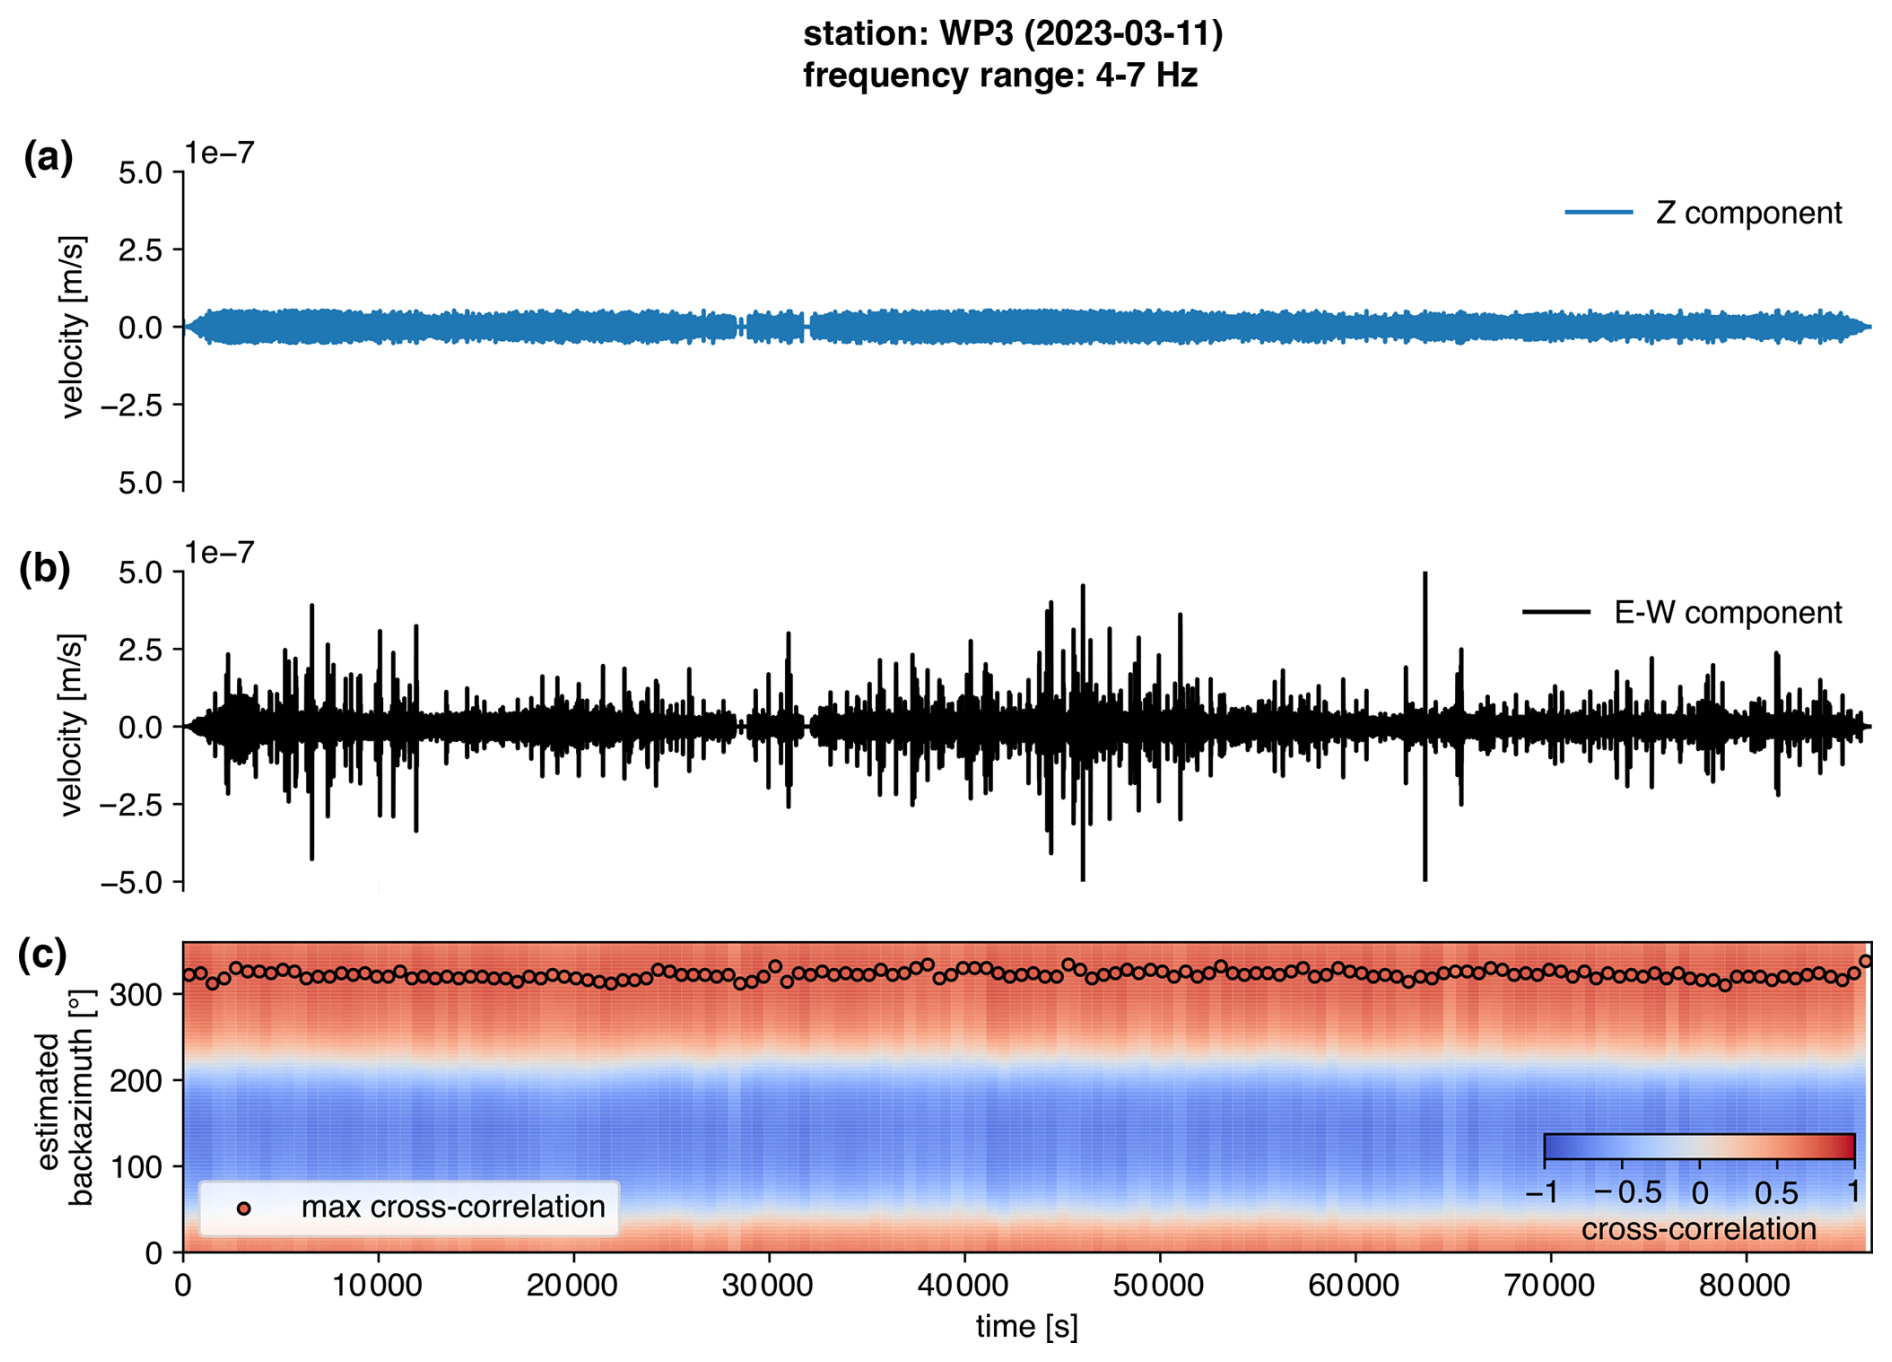
Figure 4Noise direction estimation for station WP3 using the 24 h long seismic recording of 11 March 2023. In panels (a) and (b), the vertical and E–W components of the seismic record are plotted. (c) Estimation of the backazimuth of the incoming seismic noise over 10 min long data chunks, based on the cross-correlation of the vertical component and the Hilbert-transformed radial component. Time windows are 10 min long.
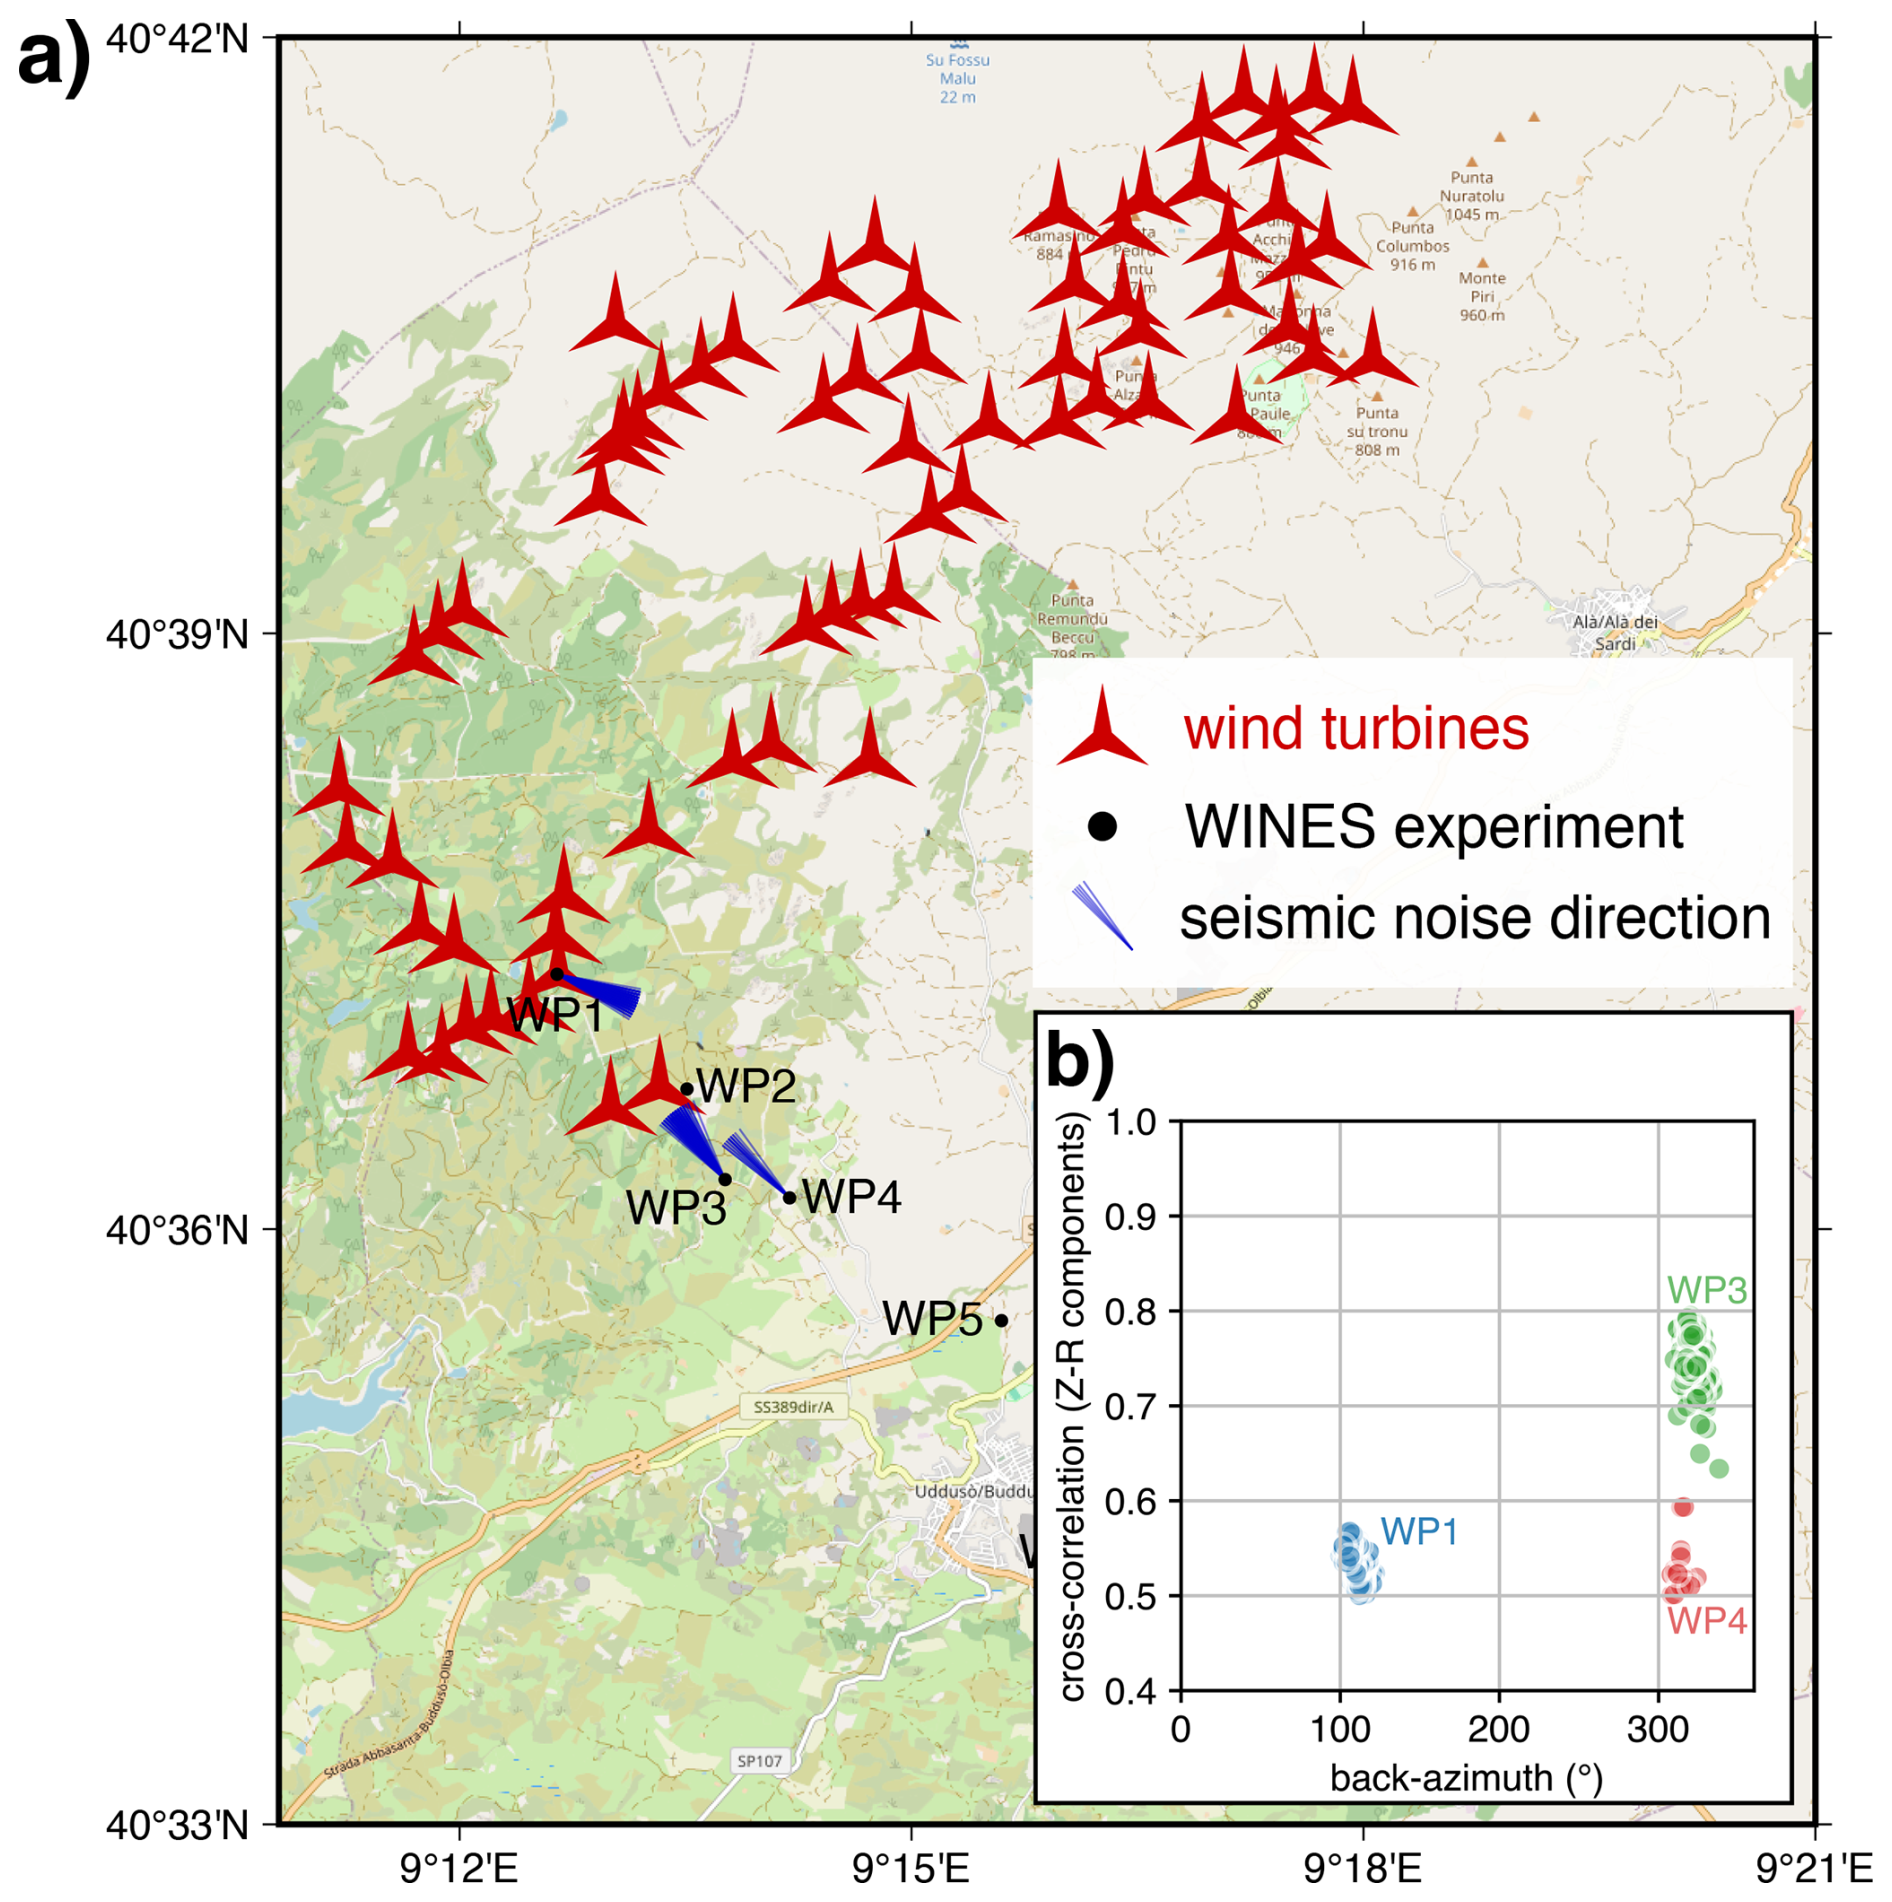
Figure 5(a) Map showing the reconstructed backazimuth of the incoming seismic noise (blue lines) at stations WP1, WP3, and WP4. (b) Plot of the cross-correlation value vs. backazimuth for stations WP1, WP3, and WP4. The map tile is from © OpenStreetMap contributors 2024, distributed under the Open Data Commons Open Database License (ODbL) v1.0.
3.1 Noise source direction
We select 1 d (11 March 2023) that falls in the 10–25 m s−1 wind speed class and is characterized by a high level of seismic noise, as shown in the spectrograms of WP1 and WP3 in Fig. 3. We estimate the direction of the incoming noise using the method described in Sect. 2.1. We tried different bandpass filters, 1–10, 2–6, 4–7, and 5–10 Hz, that comprise several of the narrow bands observed in Fig. 3. Only the 4–7 Hz band pass allowed the recovery of the noise source backazimuth with a sufficiently high cross-correlation value (0.5) between the vertical and radial components of the Rayleigh wave. In Fig. 4, we provide an example of the polarization analysis for station WP3. The vertical and E–W components are plotted in panels (a) and (b), respectively, while panel (c) shows the value of cross-correlation between the vertical and radial components as a function of the backazimuth, calculated in each 10 min long data chunk on the x axis. The maxima of cross-correlation indicate a stable noise source with an average backazimuth of 322±4.8°, and the maxima of cross-correlation reach a value of 0.8, indicating a well-constrained estimate of the source origin. In Fig. 5a, we show on the map the reconstructed backazimuth (blue lines) for stations WP1, WP3, and WP4. At WP1, with a cross-correlation value between 0.5 and 0.6 (Fig. 5b), a noise source is recovered at an average backazimuth of 110±4.4°, which is compatible with the position of the nearby wind turbine at a few tens of meters. Lastly, WP4 shows a reconstructed backazimuth that averages to 314±4.1°, similar to the nearby WP3 but with lower cross-correlation values (0.5–0.6). For the other stations of the array, the polarization analysis suffered from weaker constraints, as indicated by cross-correlation values constantly lower than the threshold set at 0.5. This can be explained by the loss in signal coherence when distant and sparse sources generate a diffuse wavefield, lacking a predominant noise source direction to be estimated.
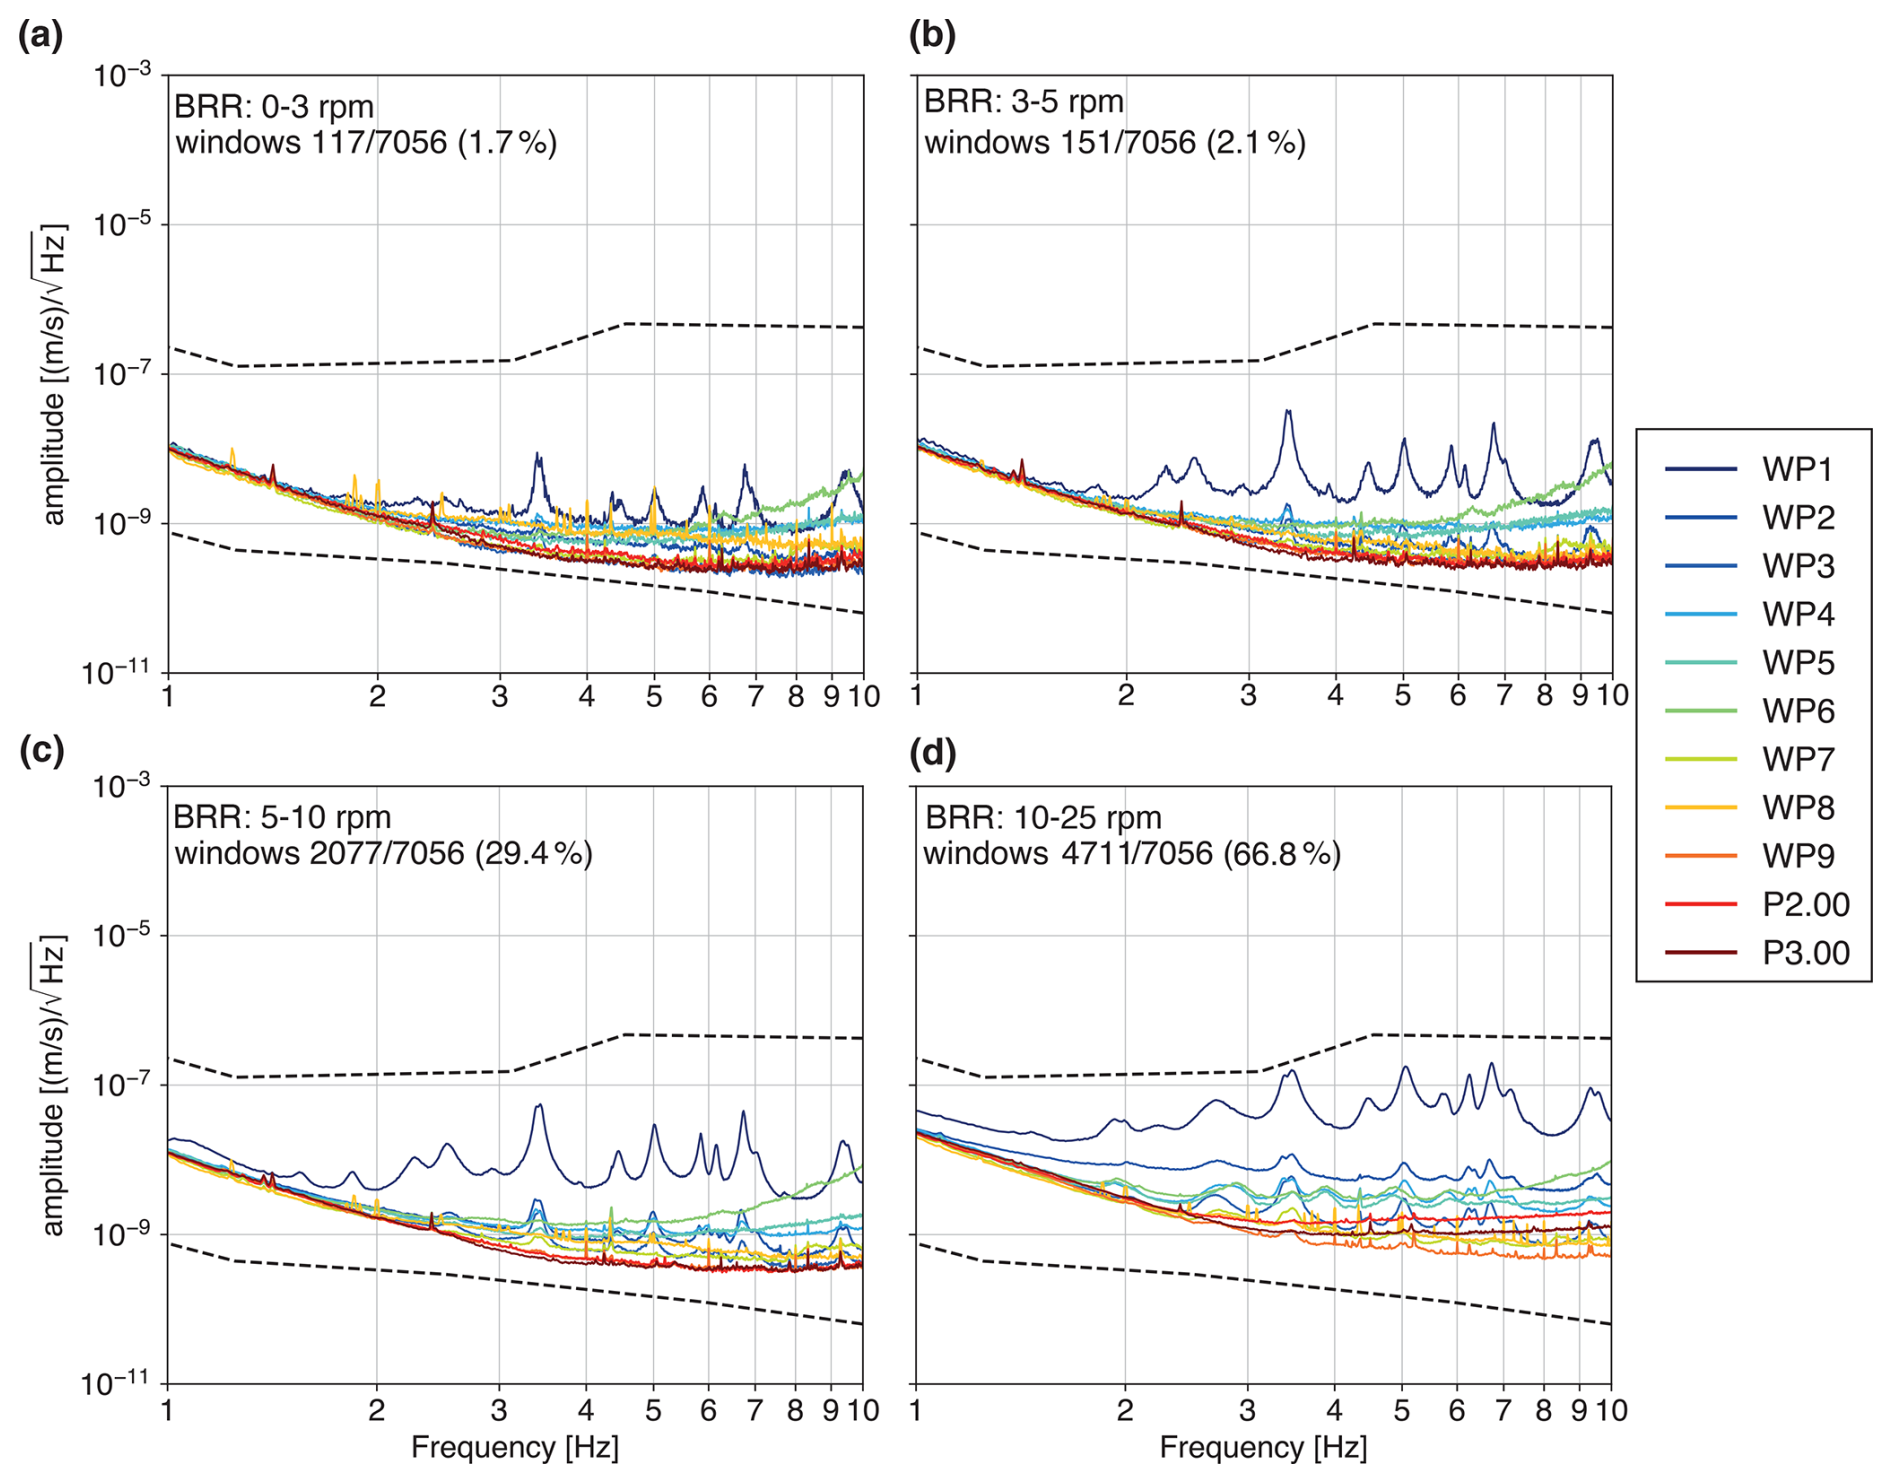
Figure 6Power spectral densities (PSDs) for the seismic stations of the WINES experiment and for the permanent surface sensor (P2.00 and P3.00) bordering the ET candidate site. PSDs are computed for different ranges of BRR across the wind park, ranging from 0–3 rpm (a) to 10–25 rpm (d). The plotted PSD curves correspond to the median value of the PSDs over 10 min long time windows, covering the entire duration of the experiment. The dashed lines indicate Peterson's new high-noise model (NHNM) and Peterson's new low-noise model (NLNM) (Peterson, 1993).
3.2 Spectral characterization of seismic noise
To better evaluate the spectral characteristics of the noise recorded during the WINES experiment, we compute the PSDs for the entire array, covering the whole recording period. We employ the method described in Sect. 2.2, focusing solely on the 1–10 Hz frequency range. This choice stems from the observation that (i) the spectrograms (see Fig. 3) already show strong damping for signals above 10 Hz 2.5 km from the wind farm (see Fig. 3) and that (ii) 1–10 Hz will be the operational frequency range of the ET interferometers. We create four subsets of PSDs, corresponding to different classes of BRR at the BAS wind farm (see Table 1). The resulting PSDs are displayed in Fig. 6 for the stations WP1–9 and for the sensors P2.00 and P3.00. In the 0–3 rpm range (Fig. 6a), all stations show a comparable noise level, except for WP1, which shows the highest noise contamination and distinct frequency peaks. The main ones are centered at 3.4, 5.0, 6.8, and 9.5 Hz and correspond to those observed in the spectrograms (see Fig. 3). In the 3–5 and 5–10 rpm ranges (Fig. 6b–c), we observe a general increase in the noise level at all stations, except for P2.00 and P3.00. All the frequency peaks already observed at WP1 also appear at the farther stations. When BRR is between 10–25 rpm (Fig. 6d), we observe the highest degree of noise contamination at all stations, and all the frequency peaks at 3.4, 5.0, 6.8, and 9.5 Hz become visible at almost all stations. Moreover, a clear decrease in noise magnitude becomes appreciable when moving farther from the wind park. The peak at 3.4 Hz is visible up to WP9, 13 km away from the closest turbine. P2.00 and P3.00, which have a stable level of noise amplitude until 10 rpm with higher BRR (Fig. 6d), show a small increase in spectral amplitude in the 4–10 Hz range.
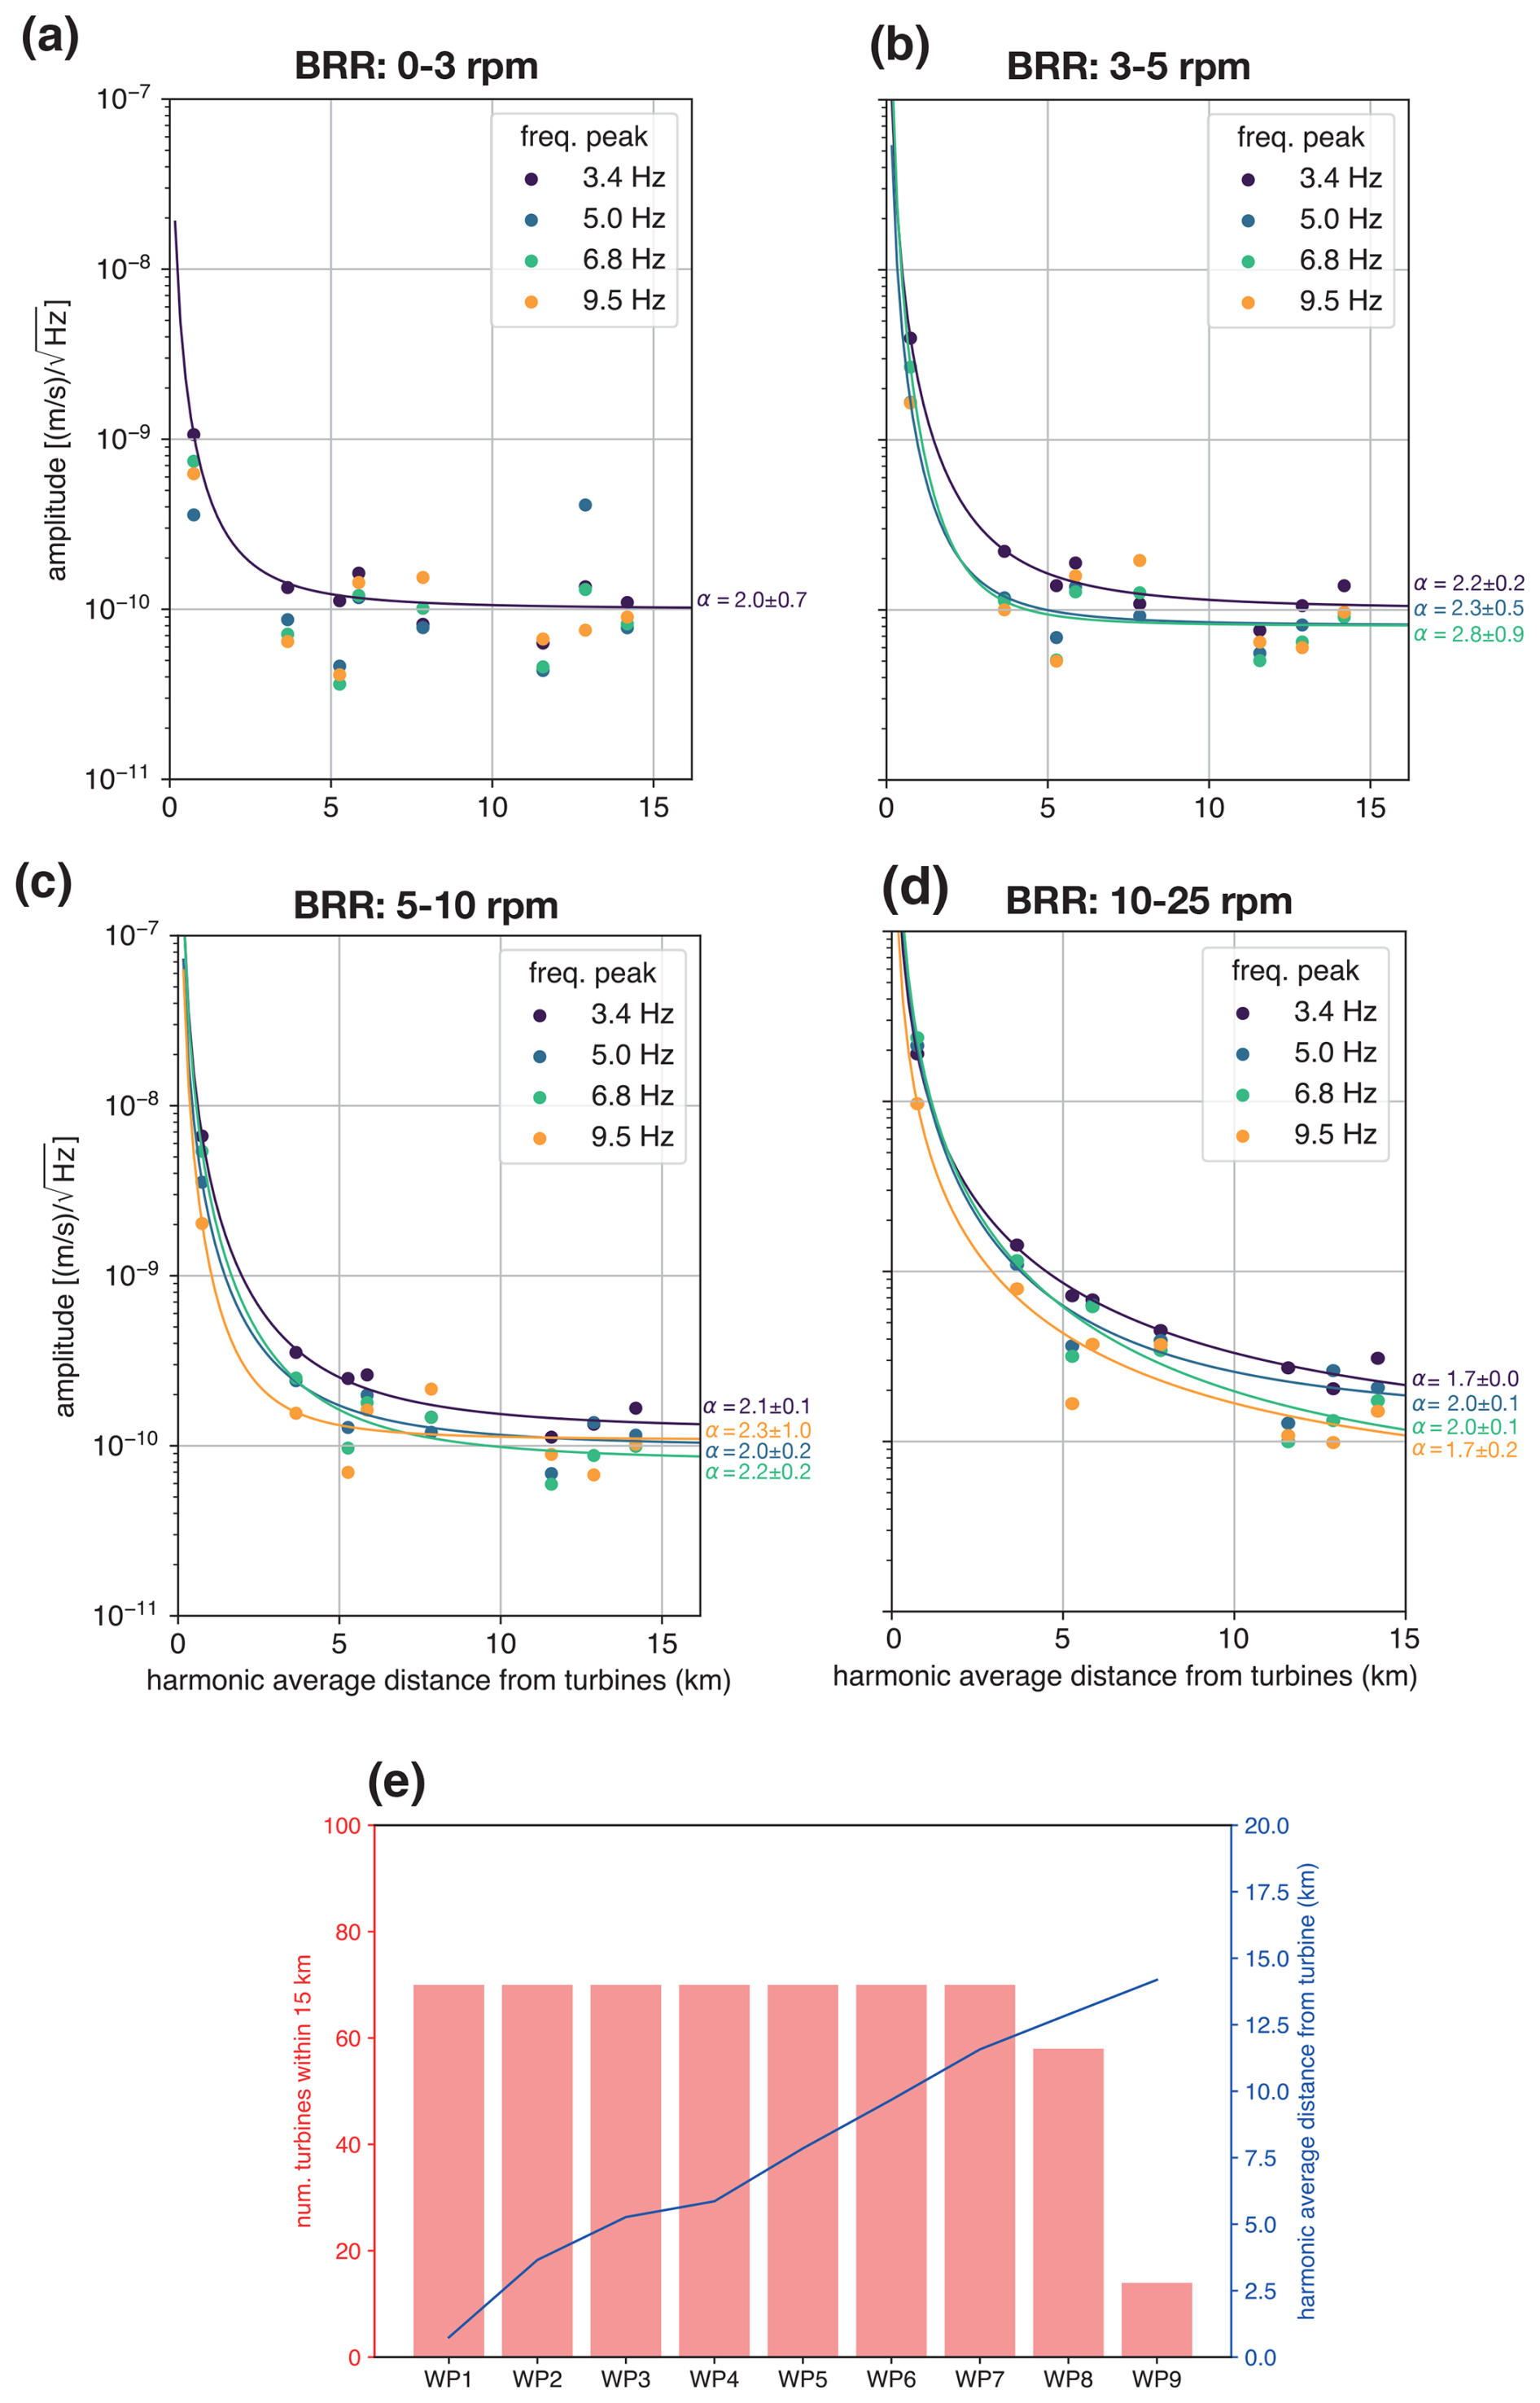
Figure 7(a–d) Decay of spectral amplitudes of the frequency peaks at 3.4, 5.0, 6.8, and 9.5 Hz as a function of harmonic average (rH) from wind turbines in different BRR ranges across the wind park. The fitted curves follow the expression . (e) In red, the number of wind turbines in a 15 km radius of each station of the WINES experiment. In blue, the values of harmonic average distance from each station to the turbines. The histogram represents the number of turbines within 15 km of each station.
3.3 Amplitude decay with distance
By leveraging the linear layout of the WINES array, we estimate the amplitude decay with distance and its dependency on frequency. We use the method presented in Sect. 2.3, applied to the amplitude of the spectral peaks at 3.4, 5.0, 6.8, and 9.5 Hz tracked along the seismic array. From our analysis, we exclude station WP6 due to its relatively higher level of noise (see Fig. 6), probably due to unfavorable conditions of installation and/or a local source of noise. In Fig. 7a–c, we show the results of the analysis of amplitude decay. For BRR in the 0–3 rpm range (Fig. 7a), the amplitudes of the PSD peaks are rather small and do not show a clear variation with distance. The amplitudes of the frequency peak at 3.4 Hz represent the only exception and can be fitted with . In the range 3–5 rpm (Fig. 7b), the peaks at 5.0 and 6.8 Hz also show an exponential decay with distance, with α now ranging from 2.2±0.2 (at 3.4 Hz) to 2.8±0.9 (at 6.8 Hz). For BRR in the 5–10 rpm range, all frequency peaks closely follow a well-behaved exponential decay, with a slight increase in α for increasing frequencies (Fig. 7c). Lastly, the case of the wind park running at full capacity (10–25 rpm; Fig. 7d) provides more reliable amplitude data along the array, resulting in a better constraint of the damping factor α, thus suffering from lower uncertainties overall. Despite the small variability in α, which is between 1.5 and 2, it shows a statistically significant difference across the four considered frequencies (t test with p value = 0.05). In Fig. 7e, we show the number of turbines within 15 km from each station along the array and their average harmonic distance from the turbines. Stations WP1–7 are within 15 km from each of the 69 turbines, resulting in a harmonic mean distance between ∼1 km (WP1) and ∼11 km (WP7) range, while, for WP9, the mean harmonic mean distance is ∼14 km from 12 turbines.
In this study, we characterize the noise emission from a large wind farm in NE Sardinia (Italy) using the recordings from an array of nine broadband seismic stations deployed for 8 weeks in combination with two permanent stations located in the vicinity. For the closest stations to the wind park (WP1, WP3, and WP4), the reconstruction of noise polarization in the frequency range 4–7 Hz indicates a source backazimuth compatible with the position of the closest turbines, confirming that the main source of noise in the selected frequency range is the wind park itself. Possible explanations for the inability to estimate the noise direction in other frequency bands are (i) the complexity of the recorded time series due to the superposition of several signals when the bandpass filter is too wide (e.g., 1–10 Hz) and/or (ii) the overall poor coherence of the seismic wavefield at high frequency (e.g., 5–10 Hz), complicated by the simultaneous emissions of multiple noise sources and by the local seismic velocity structure and topography. Spectrograms computed for a representative selection of 10 recording days (Fig. 3) show a strong noise contamination, with the highest noise amplitudes becoming evident when wind speed exceeds 10 m s−1. The closest analyzed stations (WP1 and WP3) show a predominance of seismic noise in the form of narrow-banded signals at fixed frequencies, only disappearing in the case of almost absent wind, such as late 13 March 2023 and early 16 March 2023 (see Fig. 3b). Narrow-banded signals constitute a typical spectral feature (Nagel et al., 2021) that has been extensively observed in the vicinity of wind turbines (Saccorotti et al., 2011; Stammler and Ceranna, 2016; Flores Estrella et al., 2017; Neuffer and Kremers, 2017; Neuffer et al., 2019, 2021; Zieger et al., 2018; Gaßner and Ritter, 2023). Commonly, the signal components above 20 Hz have a central frequency which is a multiple of the (variable) BRR (Nagel et al., 2021; Neuffer et al., 2021; Gaßner and Ritter, 2023). Contrarily, the components below 20 Hz are typically found at fixed frequencies, with variable amplitude depending on BRR. These components correspond to the several monochromatic signals emerging in the spectrograms at WP1 and WP3 (Fig. 3), related to a mixture of fundamental and higher vibration modes (both oscillatory and torsional) of the tower structure (Nagel et al., 2019; Lerbs et al., 2017; Zieger et al., 2020), resulting from a complex pattern of tower resonance and blade motion. The analysis of the PSDs provides a complete overview of the spectral imprint of the wind farm. In the 1–10 Hz range, which is the interval of our interest, we recognize four main frequency peaks at 3.4, 5.0, 6.8, and 9.5 Hz. The variation in BRR does not affect their central frequencies but clearly modulates their amplitudes. When the wind farm runs at medium to low regime (<10 rpm, 33 % of the time), all spectral peaks are visible in the WP1 spectrum and the signal of 3.4 Hz is visible up to WP7, which is 7.8 km away from the closest turbine. With the BAS running at full regime (10–25 rpm corresponding to ∼67 % of the examined time period), the signal at 3.4 Hz is the strongest; approaches Peterson's new high-noise model (NHNM) at WP1; and becomes visible at the farthest station (WP9), 13 km away from the closest turbine. Such distances fall within the ranges that are commonly found in the literature. As an example, Saccorotti et al. (2011) showed that the frequency peak at 1.7 Hz persists up to 11 km at the seismic station near the Virgo gravitational wave observatory in Italy (Caron et al., 1997). Schofield (2001) tracked the 4.3 Hz signal generated by a wind park up to 18 km. However, shorter distances (<5 km) are also found (Neuffer et al., 2019; Zieger et al., 2018), demonstrating that such discrepancies reflect the wide range of variability in the local geological conditions, the type of installed wind turbine, the areal arrangement, and the type of soil foundation. Moreover, turbine height (generally called hub height) is the most relevant factor affecting the seismic noise emission. A taller hub vibrates with lower frequencies (Neuffer and Kremers, 2017), generating a low-frequency noise that can travel longer distances due to the usually lower damping. We estimate the rate of amplitude decay at different frequencies and ranges of BRR, fitting an empirical power law r−α, with r being the distance and α being the damping factor. Overall, the damping factor shows small variability with respect to BRR, with a value averaging ∼2, resulting in a 2-fold implication. Firstly, it confirms that the method employed for estimating α based on the scaling of the spectral amplitudes (on the assumption of in-quadrature noise sources) correctly accounts for the simultaneous contribution of multiple turbines. Secondly, it confirms that α is thus solely controlled by the local site conditions. If we focus on the range 10–25 rpm (in which the curve fitting is affected by the lowest uncertainties), the estimated value of α shows some statistical difference. However, the range of variability in the damping factor α is rather limited and averages a value of 1.77, implying that both low and high frequencies undergo similar seismic damping. This evidence can be explained by the specific characteristics of the local terrain consisting of a compact, crystalline Paleozoic basement with quartzite, orthogneiss, and granitoid rocks (Carmignani et al., 2012) with good geomechanical characteristics. A similar frequency-independent damping factor (α∼2.6) is found in Neuffer and Kremers (2017) for the entire 1–10 Hz band. Contrarily, a dependency of α with frequency is observed in Neuffer et al. (2019), ranging from ∼2.3 at around 3 Hz to ∼5 around 6 Hz, implying a much stronger attenuation of higher frequencies with distance. A similar frequency-dependent behavior is also observed in Lerbs et al. (2017), for an area with loess and other unconsolidated sediments. Across the literature, the discrepancies in the retrieved values of α and its possible dependency on frequency can primarily be explained by the large variability in the geological characteristics of the site examined. Moreover, topography can also play a secondary but non-negligible role in affecting the amplitude decay with distance. In fact, the numerical modeling in Limberger et al. (2022) shows amplification and reduction in peak ground velocity (PGV) in the order of ±30 % even in the case of a mildly rough, hilly environment. Given the complex interplay of both topography and subsurface geology, in addition to the wide range of possible types, numbers, and spatial configurations of turbines in a wind farm, any generalizations on the characteristics of the emitted noise and its propagation should be avoided. However, to ensure that the variability in the observed amplitude damping is due to the local characteristics rather than the method employed, a homogenized strategy for the decay estimation should be sought, allowing a better comparison between different studies and thus site conditions. As an example, in Zieger et al. (2018), the damping factor is substantially lower (α<1) than in this study, in Neuffer and Kremers (2017), and in Neuffer et al. (2019). The occurrence of such a low value, despite the presence of unconsolidated Cenozoic (thus highly damping) sediments, could be explained by the absence of an appropriate scaling of noise amplitude that overlooks the simultaneous noise emission of multiple wind turbines.
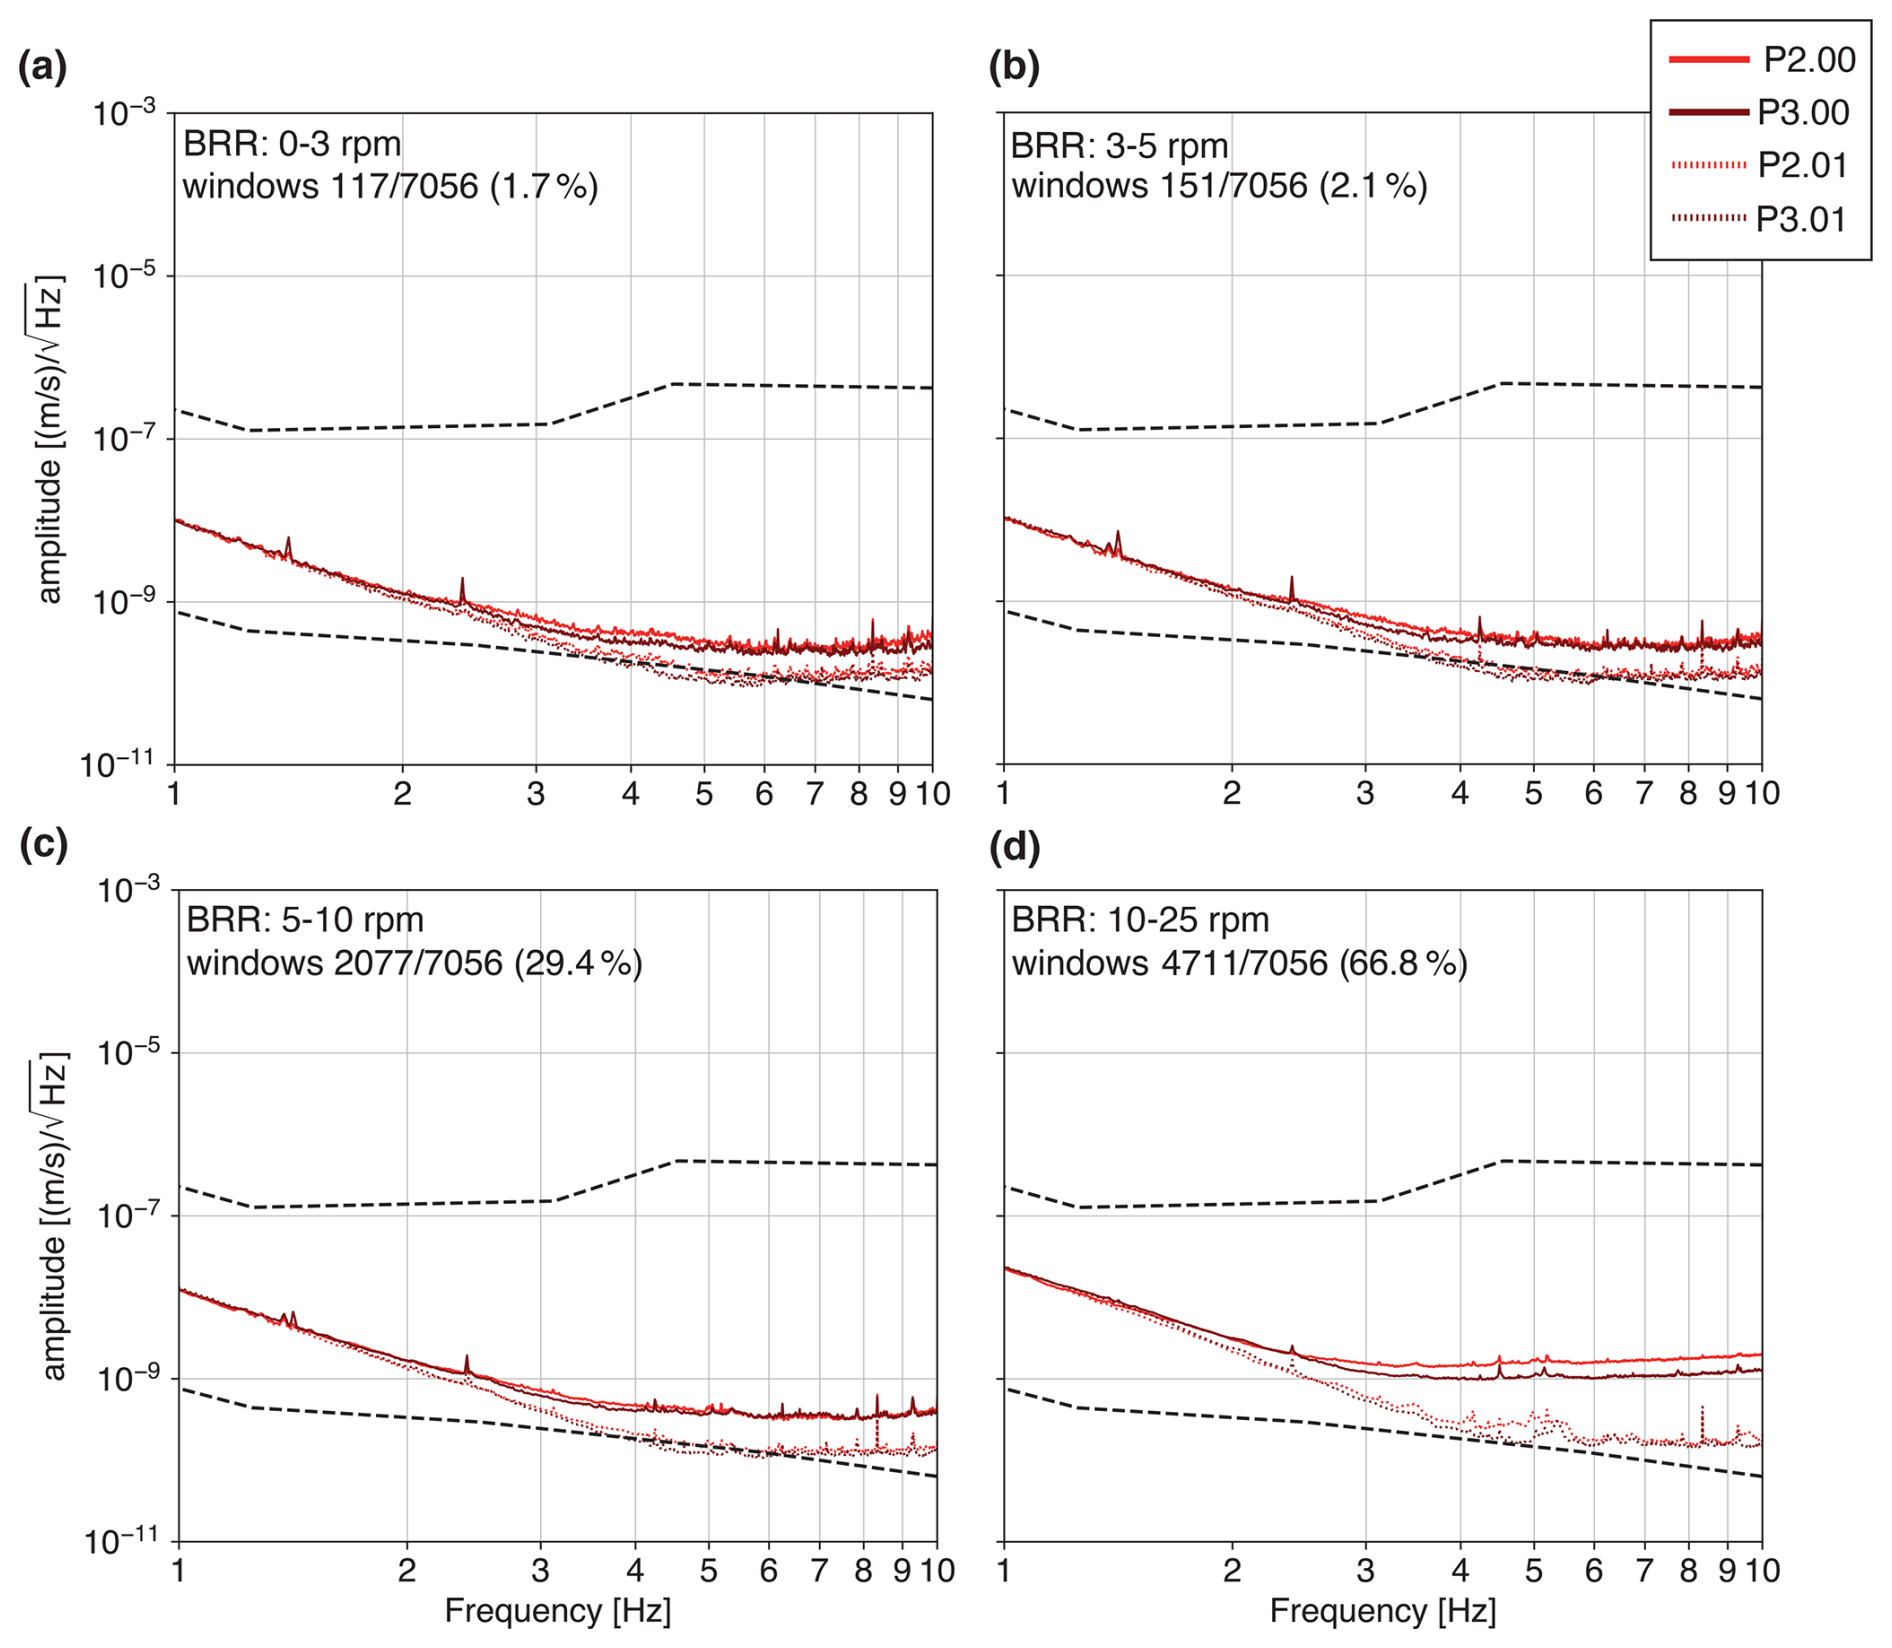
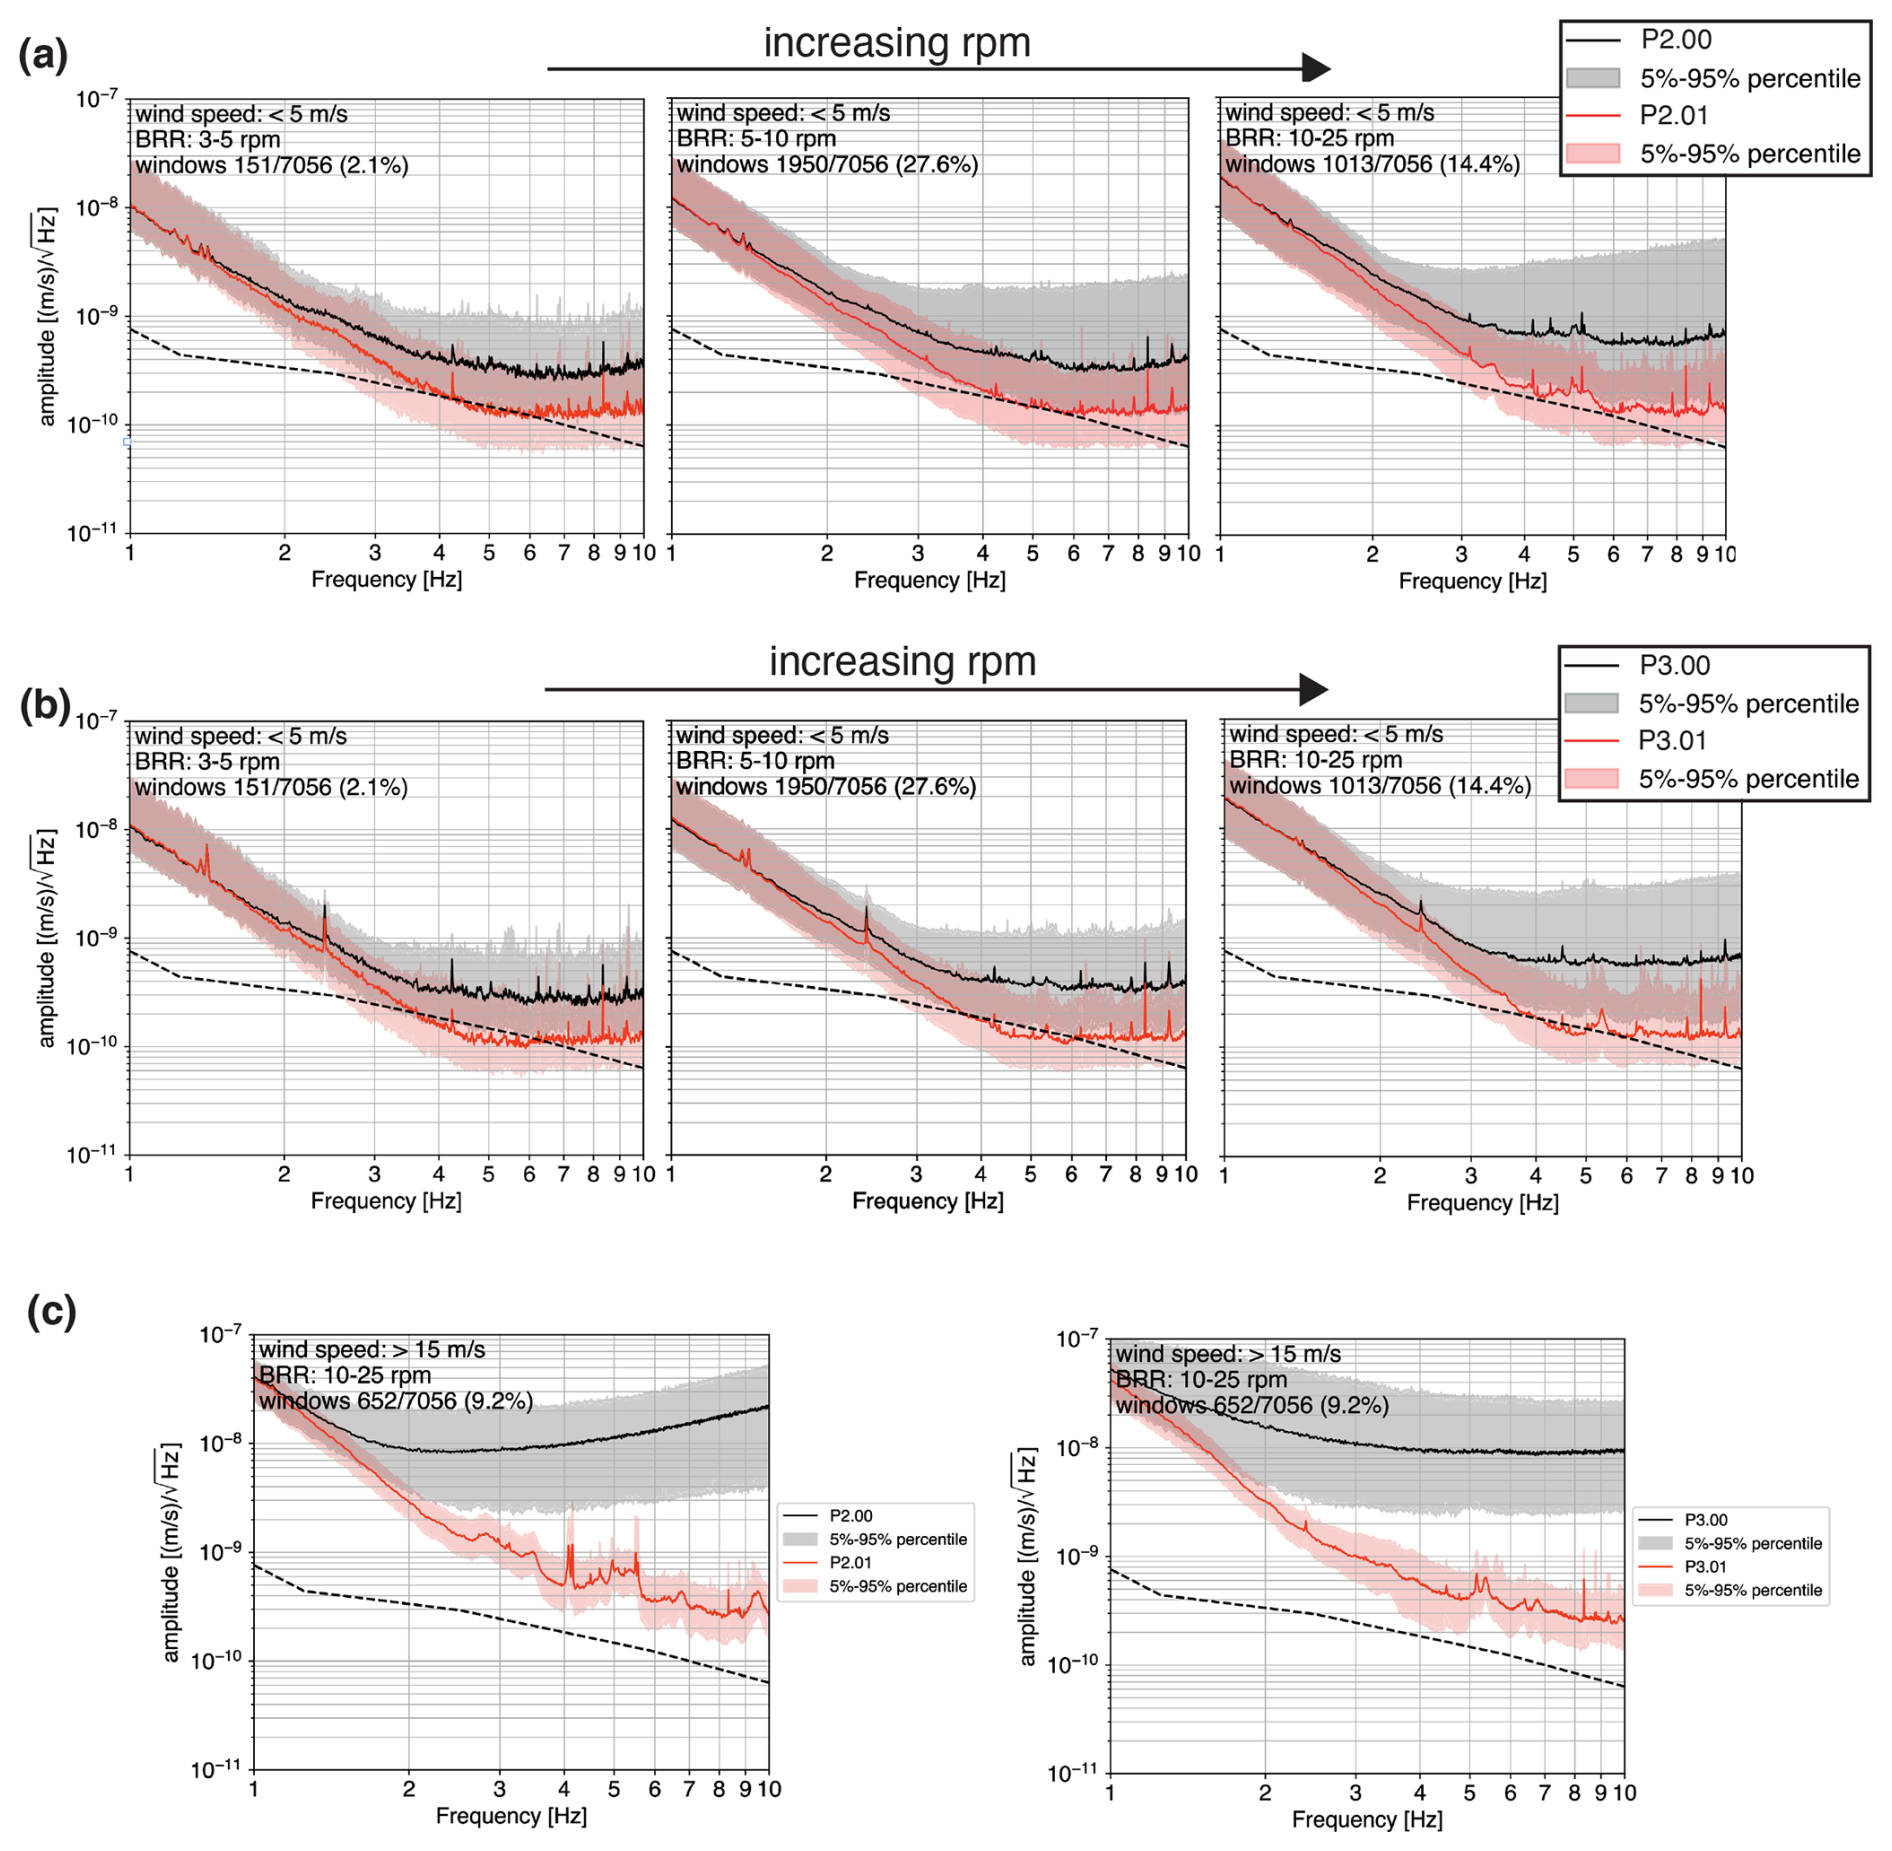
Figure 9PSDs for the permanent stations P2 (a) and P3 (b) for increasing BRR at the BAS wind park and in conditions of low wind speed (<5 m s−1). (c) PSDs for stations P2 and P3 in conditions of high BRR (10–25 rpm) and high wind speed (>15 m s−1). All PSDs are represented in terms of median values (solid line) and 5th–95th percentiles. The dashed line indicates Peterson's new low-noise model (NLNM) (Peterson, 1993).
4.1 BAS wind park and the possible impact at the Einstein Telescope candidate site
In the conditions of a medium-high operational regime at the wind park, the spectrum at WP9 (13 km apart from the wind park) shows a clear signal at 3.4 Hz. Such evidence demonstrates that the ground vibrations generated by wind parks can travel at long distances and with limited damping as a consequence of the specific geomechanical characteristics of the local terrain. Stations P2 and P3, equipped with both surface and borehole sensors (see Sect. 2), allow a direct evaluation of the possible impact of the BAS wind park even at depth. Figure 8 shows the PSDs for stations P2 and P3 for different ranges of BRR regime, referred to as the surface (solid line) and borehole (dashed line) sensors. If BRR is <10 rpm (Fig. 8a–c), the surface and borehole spectra overlap at both stations, close to Peterson's NLNM. Only for BRR >10 rpm (Fig. 8d) do the surface spectra show a higher noise amplitude, surpassing the level of 10−9 m s−1 Hz in the entire 3–10 Hz range. For lower frequencies (<2 Hz), the borehole and surface spectra still overlap, implying that the borehole installation provides no suppression of seismic noise in this frequency range. The persistence of such frequencies at depth can be explained by the high shear wave velocities associated with the crystalline basement in the area, causing rather large, high-penetrating wavelengths λ for frequencies lower than 2–3 Hz (e.g., λ=1000 m assuming VS=2000 m s−1 at 2 Hz). This is supported by the numerical modeling in Limberger et al. (2023), showing that the wavefield around 1 Hz undergoes almost no damping even at greater depths (e.g., 600 m) for high shear wave velocities. We point out that several small monochromatic peaks persist in the surface spectra at 1.3, 2.4, 8.4, and 9.3 Hz, showing no amplitude dependence with respect to varying BRR. This observation suggests that such signals are likely unrelated to the activity of the wind park. Given the remoteness of the area and the lack of other major sources of anthropogenic noise (e.g., main roads, railroads, industry, quarry) in the vicinity of P2 and P3 (within <10 km), these can be regarded as weak remnants of seismic noise generated from (unknown) sources at greater distance. Interestingly, when BRR >10 rpm (Fig. 8d), small spectral peaks between 4–6 Hz can be observed at both P2.01 and P3.01, despite the overall low noise amplitude of the spectra. In order to untangle the possible contribution to the wind farm from other local, wind-related noise sources near these stations, we show in Fig. 9a–b the surface (black curve) and borehole (red curve) spectra, together with their 5th–95th percentiles, for increasing BRR and for wind speed below 5 m s−1. At both P2 and P3, while the median borehole spectra and their percentile intervals remain unchanged as BRR increases, the 4–6 Hz peaks only appear for the highest BRR. Figure 9c shows the spectra for the same BRR range but for the highest wind speed (a condition that occurred for 9 % of the period of study). Here, the borehole spectra detach from the NLNM and approach the 10−9 m s−1 Hz level, with the spectral peaks in the 4–6 Hz range becoming more pronounced if compared to conditions of low wind speed. Moreover, a 3.4 Hz peak appears here, which is the same signal dominating the PSDs of all stations along the WINES array. These observations suggest that, when the wind park approaches its maximum regime, the seismic noise emitted by the BAS wind park can be recorded even at the borehole sensors of P2 and P3 (∼250 m depth), at more than 17 km distance (i.e., the distance between P3 and the closest turbine). The emergence of such spectral peaks is observed only for 67 % of the observed time, while, for the remaining 33 %, the PSDs show no effect induced by the nearby wind park. Consequently, on a long-term (i.e., yearly) timescale, the P2 and P3 stations confirm the seismic quietness of the area (Naticchioni et al., 2024) and its adequacy as a candidate site for hosting the ET. In particular, the occurrence of the 4–6 Hz spectral peaks can be explained with two contributing factors: (i) the exceptionally low level of seismic noise in the study area, which allows the identification of weak seismic signal produced at distance, and (ii) the rather low damping of the compact, high-velocity crystalline basement in the area. As an opposite example, in a site with poorly consolidated sediments and/or with higher background noise, the impact of the wind farm would hardly be detectable at such a distance. Therefore, in the attempt to promote the coexistence of highly sensitive scientific installations with wind energy production, regulators should be discouraged from applying stringent fixed-radius buffer zones, as these could be too cautionary for some areas but inadequate for others. In-depth geophysical studies for the characterization of the local geology, noise monitoring, and numerical modeling of the emitted wavefield should be carried out, leading to the estimation ad hoc zone of respect for the specific scientific instrumentation to be placed or already installed. Another strategy for minimizing the impact of wind energy production on sensitive instruments would primarily consist of the reduction in the emitted seismic noise. Some mitigation measures have been proposed for perspective wind farms, such as physical barriers (i.e., trenches) that could be placed around the turbines, confining the noise wavefield through multiple reflections (Abreu et al., 2022). Moreover, mass dampers (Zhang et al., 2019) and/or piezoelectric materials (Awada et al., 2021) could be used for counteracting the induced vibration. For wind farms already in place, Bertagnolios et al. (2023) proposed a strategy based on the active controls of blade angle, rotation rate, and nacelle tilt to reduce the produced seismic emission. Lastly, Calderaro et al. (2007) and Kipchirchir et al. (2022) suggest a method based on the real-time, precise tuning of all the operational parameters at each turbine (BRR; tilt and roll angles of the nacelle; and the yaw, tilt, and pitch of the blades) for producing an out-of-phase noise at each turbine, diminishing the resulting wavefield by destructive interference. However, to our knowledge, all the aforementioned strategies are currently at an early stage of development, requiring further studies for the assessment of any practical applicability.
4.2 Limitations and future work
The spectral content, its spatiotemporal variation, and its correlation with the operational activity of the BAS wind park are solid evidence that it is the sole contributor to the seismic noise recorded in the study area. This is further supported by the absence of any relevant anthropogenic noise source that could otherwise explain the observed data. In our analysis, we mainly concentrate on the vertical component of the noise source, based on the evidence from numerical modeling (Gortsas et al., 2017) that most emitted noise propagates as Rayleigh waves. This assumption might not be completely valid, since a portion of the emitted wavefield might travel as Love waves. The prediction of energy partitioning into Rayleigh and Love waves remains challenging, as it depends on the considered frequency and the relative position of the recording station with respect to each turbine and to the instantaneous wind direction (Neuffer et al., 2021). A major source of uncertainty in the estimation of the damping factor α originates from the assumption that each wind turbine acts as a simultaneous quasi-random noise source generating the same noise amplitude. In our case, the turbines all share the same technical characteristics; therefore this assumption may be regarded as valid at first order. However, second-order effects on the estimation of amplitude decay can arise from a heterogeneous noise emission due to different soil–turbine coupling and variability in BRR across the wind park. In general, we suggest that more effort should be devoted to evaluating uncertainties when retrieving the damping factor α. In fact, while α is solely dependent on the local site condition, its estimation could be biased by the spatial arrangement of turbines, topography, and geology and by the phase and amplitude variability in the noise emitted by each turbine across the wind farm. To evaluate the possible bias introduced by infrasonic contamination at WP1 in the estimation of α, we repeated the power law fit discussed in Sect. 2.3 for the sole case of BRR 10–25 rpm with the exclusion of WP1 amplitudes. Results show consistency of the two obtained models within the error bars. We can regard this as a proof of the negligible role of the infrasonic contamination. We also evaluated the effect of the scaling in the estimation of the damping factor (see Fig. S1 in the Supplement), concluding that the retrieved valued α does not appreciably deviate whether the scaling is applied or not. This is likely due to the clustered rather than scattered layout of the wind turbines with respect to the linear array. Regarding the noise recorded at P2 and P3, we observed that the noise related to the wind park is effectively suppressed at depth. However, some minor disturbances occur at the borehole spectra, which are likely induced by the local wind. In this regard, the collection of dedicated meteorological data at P2 and P3 would be beneficial, helping to decouple the contribution of the wind farm from the wind itself.
A passive seismic experiment was carried out near the Buddusò–Ala dei Sardi (BAS) wind park to characterize the emitted noise and its possible impact on the noise budget of the nearby candidate site of the ET, the third-generation gravitational wave detector. The analysis of the data, retrieved from a 13 km long linear array of nine broadband stations, led to the following observations:
-
Given the remoteness and seismic quietness of the study area, the BAS wind park can be regarded as the sole contributor to the recorded noise in the frequency band above 1 Hz. This is substantiated by the analysis of Rayleigh wave polarization, which a direction of the incoming seismic noise which is fully compatible with the relative position of the wind park with respect to the array. Signal coherence lessens at greater distances (from WP5 to WP9) as a consequence of the complex noise superposition from multiple turbines.
-
The spectrograms and PSDs show that the noise by the BAS wind park is mainly confined to the 1–10 Hz frequency range and is dominated by several monochromatic signals. The main spectral picks are found at 3.4, 5.0, 6.8, and 9.5 Hz and are recognizable, at the closest stations, even for low blade rotation rates (BRRs). The strongest one, found at 3.4 Hz, can be tracked up to 13 km distance from the wind park.
-
While the amplitudes of such spectral peaks increase with increasing BRR, their frequency remains unaffected. These are typical characteristics of the noise corresponding to the fundamental and higher modes of vibration (torsion and oscillation) of the tower structure, whose size is compatible with the 1–10 Hz range.
-
The amplitudes of the spectral peaks at 3.4, 5.0, 6.8, and 9.5 Hz, tracked along the entire length of the array, led to the estimation of the damping factor α under the assumption of an exponential decay model with distance. Across different ranges of BRR and for four different frequencies, α shows a limited variability, averaging a value of ∼2. This suggests that the geomechanical characteristics of the local terrain cause both the low frequency and the higher frequency to be almost equally damped with distance.
-
We use the data recorded at P2 and P3, two permanent stations equipped with surface and borehole sensors at ∼250 m depth, for evaluating the possible impact of the BAS wind park at the depth of the prospective Einstein Telescope. When BRR <10 rpm, no increase in the noise budget is observed at these stations, with the surface and borehole sensors showing similar spectra, near Peterson's NLNM. When BRR >10 rpm, the spectra for the surface seismometers slightly increase and reach (at P3) and surpass (at P2) the level of 10−9 m s−1 Hz. The borehole sensors show an effective suppression of most of the emitted seismic noise. However, small spectral peaks appear at 3.4 Hz and in the 4–6 Hz range for both P2 and P3. We explain their occurrence with a combination of low damping characteristics of the local terrain with the exceptionally low level of seismic noise at the site. As confirmed by the long-term yearly averaged PSDs at P2 and P3 (Naticchioni et al., 2024), the presence of the wind park does not cause any disruption of the seismic quietness of the area.
Our work demonstrates the relevance of the characterization of seismic noise for an adequate evaluation of the disturbance of wind farms on sensitive scientific installations that are negatively affected by seismic noise. These observations should provide the regulators with adequate and ad hoc measures for preserving seismic quietness around these infrastructures, depending on the specific conditions of the local terrain and the target sensitivity of the scientific instrumentation.
ObsPy (https://github.com/obspy/obspy Beyreuther et al., 2010) was used for the processing of seismic data. Figures were made with PyGMT (https://doi.org/10.5281/zenodo.7772533; Uieda et al., 2023) and the Python library Matplotlib. Seismic recordings of the WINES experiment and those from station P2 and P3 are currently unavailable to the public; data access is granted only to members of the ET scientific collaboration.
The supplement related to this article is available online at https://doi.org/10.5194/se-16-441-2025-supplement.
The WINES experiment was carried out by a collaboration between INGV, INFN, and UniSS that include all authors. GD, CG, MO, and IM are responsible for the conceptualization and methodology. GD is responsible for data analysis, software, validation, visualization, and writing the original draft. The remaining authors contributed to the production and availability of datasets employed in this study.
The contact author has declared that none of the authors has any competing interests.
Publisher's note: Copernicus Publications remains neutral with regard to jurisdictional claims made in the text, published maps, institutional affiliations, or any other geographical representation in this paper. While Copernicus Publications makes every effort to include appropriate place names, the final responsibility lies with the authors.
This study was conducted within the framework agreement between Istituto Nazionale di Fisica Nucleare (INFN) and Istituto Nazionale di Geofisica e Vulcanologia (INGV). The study was financed by INFN in the collaboration agreement with INGV “Accordo di Programma per la Conduzione di Studi e Ricerche Finalizzati alla Caratterizzazione Geofisica e Sismica del Sito di Sos Enattos (NU)”, thanks to the Protocollo di Intesa tra Ministero dell'Università e della Ricerca, the Regione Autonoma della Sardegna, the Istituto Nazionale di Fisica Nucleare, and the University of Studi di Sassari. Funding was also received from the Università degli Studi di Sassari, thanks to the “Accordo di Programma tra la Regione Autonoma della Sardegna, Università degli Studi di Sassari, l'Istituto Nazionale di Fisica Nucleare, l'Istituto Nazionale di Geofisica e Vulcanologia, l'Università degli Studi di Cagliari e l'IGEA S.P.A.”. We thank Geopower and Nadara Spa for kindly providing all the data on the wind park activity and wind speed, and we thank ARPAS Sardegna and Enrico Giuseppe Cadau for sharing meteorological data in the early stages of this work. We also thank Luigi Fodde and the operators of the Sos Enattos underground mine for their valuable help in supporting the preparation of the temporary array.
This research has been supported by NextGenerationEU (NRRP-MEET, Monitoring Earth's Evolution and Tectonics; grant no. CUPD53C22001400005); SARGRAV (grant no. FSC 2014-2020), Patto per lo sviluppo della Regione Sardegna, Fondo di Ateneo per la ricerca 2019 and 2020; and Fondazione di Sardegna (project 2022–2023, grant no. CUPJ83C21000060007).
This paper was edited by Simone Pilia and reviewed by Klaus Stammler and one anonymous referee.
Abreu, R., Peter, D., and Thomas, C.: Reduction of wind-turbine-generated seismic noise with structural measures, Wind Energ. Sci., 7, 1227–1239, https://doi.org/10.5194/wes-7-1227-2022, 2022. a
Aki, K. and Richards, P.: Quantitative seismology, Geophys. J. Int., 64, 802–806, https://doi.org/10.1093/gji/64.3.802, 2002. a
Awada, A., Younes, R., and Ilinca, A.: Review of vibration control methods for wind turbines, Energies, 14, 3058, https://doi.org/10.3390/en14113058, 2021. a
BayWEE: Hinweise zur Planung und Genehmigung von Windenergieanlagen (WEA) (Windenergie-Erlass – BayWEE), https://www.stmwi.bayern.de/fileadmin/user_upload/stmwi/publikationen/pdf/Windenergie-Erlass_2016.pdf (last access: June 2025), 2016. a
Beyreuther, M., Barsch, R., Krischer, L., Megies, T., Behr, Y., and Wassermann, J.: ObsPy: A Python toolbox for seismology, Seismol. Res. Lett., 81, 530–533, https://doi.org/10.1785/gssrl.81.3.530, 2010 (code available at: https://github.com/obspy/obspy, last access: June 2025). a
Bertagnolio, F., Fischer, A., Feng, J., Nyborg, C., Vignaroli, A., Madsen, H., Hansen, K., Peña, A., Shen, W., Hansen, T., and Andreas, F.: DecoWind: Development of low-noise and cost-effective wind farm control technology, INTER-NOISE And NOISE-CON Congress And Conference Proceedings, 265, 6014–6025, https://doi.org/10.3397/IN_2022_0894, 2023. a
Calderaro, V., Galdi, V., Piccolo, A., and Siano, P.: Design and implementation of a fuzzy controller for wind generators performance optimisation, 2007 European Conference On Power Electronics And Applications, 2–7 September 2007, Aalborg, Denmark, 1–10, https://doi.org/10.1109/EPE.2007.4417212, 2007. a
Carmignani, L., Conti, P., Funedda, A., Oggiano, G., and Pasci, S.: La geologia della Sardegna, Geological Field Trips, 4, 1–104, 2012 a
Caron, B., Dominjon, A., Drezen, C., Flaminio, R., Grave, X., Marion, F., Massonnet, L., Mehmel, C., Morand, R., Mours, B., Sannibale, V., Yvert, M., Babusci, D., Bellucci, S., Candusso, S., Giordano, G., Matone, G., Mackowski, J.-M., Pinard, L., Barone, F., Calloni, E., Di Fiore, L., Flagiello, M., Garuti, F., Grado, A., Longo, M., Lops, M., Marano, S., Milano, L., Solimeno, S., Brisson, V., Cavalier, F., Davier, M., Hello, P., Heusse, P., Mann, P., Acker, Y., Barsuglia, M., Bhawal, B., Bondu, F., Brillet, A., Heitmann, H., Innocent, J.-M., Latrach, L., Man, C. N., Pham-Tu, M., Tournier, E., Taubmann, M., Vinet, J.-Y., Boccara, C., Gleyzes, Ph., Loriette, V., Roger, J.-P., Cagnoli, G., Gammaitoni, L., Kovalik, J., Marchesoni, F., Punturo, M., Beccaria, M., Bernardini, M., Bougleux, E., Braccini, S., Bradaschia, C., Cella, G., Ciampa, A., Cuoco, E., Curci, G., Del Fabbro, R., De Salvo, R., Di Virgilio, A., Enard, D., Ferrante, I., Fidecaro, F., Giassi, A., Giazotto, A., Holloway, L., La Penna, P., Losurdo, G., Mancini, S., Mazzoni, M., Palla, F., Pan, H.-B., Passuello, D., Pelfer, P., Poggiani, R., Stanga, R., Vicere', A., Zhang, Z., Ferrari, V., Majorana, E., Puppo, P., Rapagnani, P., and Ricci, F.: The virgo interferometer, Classical Quant. Grav., 14, 1461, https://doi.org/10.1016/S0920-5632(97)00109-6, 1997. a
Claerbout, J.: Fundamentals of geophysical data processing, Citeseer, https://www.osti.gov/biblio/5417212 (last access: June 2025), 1976. a
Di Giovanni, M., Giunchi, C., Saccorotti, G., Berbellini, A., Boschi, L., Olivieri, M., De Rosa, R., Naticchioni, L., Oggiano, G., Carpinelli, M., D'Urso, D., Cuccuru, S., Sipala, V., Calloni, E., Di Fiore, L., Grado, A., Migoni, C., Cardini, A., Paoletti, F., Fiori, I., Harms, J., Majorana, E., Rapagnani, P., Ricci, F., and Punturo, M.: A Seismological Study of the Sos Enattos Area – the Sardinia Candidate Site for the Einstein Telescope. Seismol. Res. Lett., 92, 352–364, https://doi.org/10.1785/0220200186, 2021 a
Di Giovanni, M., Koley, S., Ensing, J. X., Andric, T., Harms, J., D'Urso, D., Naticchioni, L., De Rosa, R., Giunchi, C., Allocca, A., Cadoni, M., Calloni, E., Cardini, A., Carpinelli, M., Contu, A., Errico, L., Mangano, V., Olivieri, M., Punturo, M., Rapagnani, P., Ricci, F., Rozza, D., Saccorotti, G., Trozzo, L., Dell'Aquila, D., Pesenti, L., Sipala, V., and Tosta e Melo, I.: Temporal variations of the ambient seismic field at the Sardinia candidate site of the Einstein Telescope, Geophys. J. Int., 234, 1943–1964, https://doi.org/10.1093/gji/ggad178, 2023. a
Einstein, A.: Näherungsweise Integration der Feldgleichungen der Gravitation, Sitzungsberichte Der Königlich Preußischen Akademie Der Wissenschaften, 688–696, https://doi.org/10.1002/3527608958.ch7, 1916. a
Ensing, J. and Wijk, K.: Estimating the orientation of borehole seismometers from ambient seismic noise, B. Seismol. Soc. Am., 109, 424–432, https://doi.org/10.1785/0120180118, 2019. a
ET Steering Committee Editorial Team: Design report update 2020 for the Einstein Telescope, https://apps.et-gw.eu/tds/ql/?c=15662 (last access: June 2025), 2020. a
Flores Estrella, H., Korn, M., and Alberts, K.: Analysis of the influence of wind turbine noise on seismic recordings at two wind parks in Germany, J. Geosci. Environ. Protect., 5, 76–91, https://doi.org/10.4236/gep.2017.55006, 2017. a, b, c
Gaßner, L. and Ritter, J.: Ground motion emissions due to wind turbines: observations, acoustic coupling, and attenuation relationships, Solid Earth, 14, 785–803, https://doi.org/10.5194/se-14-785-2023, 2023. a, b, c
Gortsas, T., Triantafyllidis, T., Chrisopoulos, S., and Polyzos, D.: Numerical modelling of micro-seismic and infrasound noise radiated by a wind turbine, Soil Dyn. Earthq. Eng., 99, 108–123, 2017. a, b
Hutt, C., Ringler, A., and Gee, L.: Broadband seismic noise attenuation versus depth at the Albuquerque Seismological Laboratory, B. Seismol. Soc. Am., 107, 1402–1412, https://doi.org/10.1785/0120160187, 2017. a
Kipchirchir, E., Do, M. H., Njiri, J. G., and Söffker, D.: Adaptive robust observer-based control for structural load mitigation of wind turbines, Wind Energ. Sci. Discuss. [preprint], https://doi.org/10.5194/wes-2021-143, 2022. a
Lerbs, N., Zieger, T., Ritter, J., and Korn, M.: Wind turbine induced seismic signals: the large-scale SMARTIE1 experiment and a concept to define protection radii for recording stations, Near Surf. Geophys., 18, 467–482, https://doi.org/10.1002/nsg.12109, 2020. a, b, c, d
Limberger, F., Rümpker, G., Lindenfeld, M., and Deckert, H.: Development of a numerical modelling method to predict the seismic signals generated by wind farms, Sci. Rep., 12, 15516, https://doi.org/10.1038/s41598-022-19799-w,2022. a, b
Limberger, F., Rümpker, G., Lindenfeld, M., and Deckert, H.: The impact of seismic noise produced by wind turbines on seismic borehole measurements, Solid Earth, 14, 859–869, https://doi.org/10.5194/se-14-859-2023, 2023. a
Magrini, F., Diaferia, G., Boschi, L., and Cammarano, F.: Arrival-angle effects on two-receiver measurements of phase velocity, Geophys. J. Int., 220, 1838–1844, https://doi.org/10.1093/gji/ggz560, 2020. a
McNamara, D. and Buland, R.: Ambient noise levels in the continental United States, B. Seism. Soc. Am., 94, 1517–1527, 2004. a
Moré, J.: The Levenberg-Marquardt algorithm: implementation and theory, Numerical Analysis, Proceedings Of The Biennial Conference, Dundee, 28 June–1 July 1977, 105–116, https://doi.org/10.1007/BFb0067700, 2006. a
Nadara Italy Spa, https://nadara.com/, last access: 21 January 2025. a
Nagel, S., Zieger, T., Luhmann, B., Knödel, P., Ritter, J., and Ummenhofer, T.: Erschütterungsemissionen von windenergieanlagen, Stahlbau, 88, 559–573, https://doi.org/10.1002/stab.201900039, 2019. a
Nagel, S., Zieger, T., Luhmann, B., Knödel, P., Ritter, J., and Ummenhofer, T.: Ground motions induced by wind turbines, Civil Engineering Design, 3, 73–86, https://doi.org/10.1002/stab.201900039, 2021. a, b
Naticchioni, L., Perciballi, M., Ricci, F., Coccia, E., Malvezzi, V., Acernese, F., Barone, F., Giordano, G., Romano, R., Punturo, M., De Rosa, R., Calia, P., and Loddo, G.: Microseismic studies of an underground site for a new interferometric gravitational wave detector, Classical Quant. Grav., 31, 105016, https://doi.org/10.1088/0264-9381/31/10/105016, 2014. a
Naticchioni, L., Boschi, V., Calloni, E., Capello, M., Cardini, A., Carpinelli, M., Cuccuru, S., D'Ambrosio, M., De Rosa, R., Di Giovanni, M., D'Urso, D., Fiori, I., Gaviano, S., Giunchi, C., Majorana, E., Migoni, C., Oggiano, G., Olivieri, M., Paoletti, F., Paratore, M., Perciballi, M., Piccinini, D., Punturo, M., Puppo, P., Rapagnani, P., Ricci, F., Saccorotti, G., Sipala, V., and Tringali, M. C.: Characterization of the Sos Enattos site for the Einstein Telescope, J. Phys. Conf. Ser., 1468, 012242, https://doi.org/10.1088/1742-6596/1468/1/012242, 2020. a
Naticchioni, L., Allocca, A., Boschi, V., Cadeddu, M., Cadoni, M., Calloni, E., Cardello, G.L., Cardini, A., Carpinelli, M., Cittadino, D., Contu, A., D'Ambrosio, M., D'Onofrio, L., D'Urso, D., Davari, N., De Rosa, R., Di Fiore, L., Di Giovanni, M., Dordei, F., Fiori, I., Giunchi, C., Harms, J., Koley, S., Longo, V., Mangano, V., Marsella, M., Migoni, C., Molinari, I., Olivieri, M., Paoletti, F., Puppo, P., Rapagnani, P., Razzano, M., Ricci, F., Rozza, D., Saccorotti, G., Schillaci, G., Sipala, V., Tringali, M. C., Trozzo, L., and Tuver, M.: Characterizing the Sardinia candidate site for the Einstein Telescope, Pos Proceedings Of Science, 441, https://doi.org/10.22323/1.441.0110, 2024. a, b
Neuffer, T. and Kremers, S.: How wind turbines affect the performance of seismic monitoring stations and networks, Geophys. J. Int., 211, 1319–1327, https://doi.org/10.1093/gji/ggx370, 2017. a, b, c, d, e, f, g
Neuffer, T., Kremers, S., and Fritschen, R.: Characterization of seismic signals induced by the operation of wind turbines in North Rhine-Westphalia (NRW), Germany, J. Seismol., 23, 1161–1177, https://doi.org/10.1007/s10950-019-09866-7, 2019. a, b, c, d, e, f, g
Neuffer, T., Kremers, S., Meckbach, P., and Mistler, M.: Characterization of the seismic wavefield radiated by a wind turbine, J. Seismol., 25, 825–844, https://doi.org/10.1007/s10950-021-10003-6, 2021. a, b, c
Novotny, O.: Seismic surface waves, Bahia, Salvador: Instituto De Geociencias, 61, 217–295, https://doi.org/10.1016/B978-0-12-460811-5.50010-6, 1999. a
Peterson, J.: Observations and modeling of seismic background noise, US Geological Survey, Open-File Report 93-322, https://doi.org/10.3133/ofr93322, 1993. a, b, c, d
Punturo, M., Abernathy, M., Acernese, F., Allen, B., Andersson, N., Arun, K., Barone, F., Barr, B., Barsuglia, M., Beker, M., Beveridge, N., Birindelli, S., Bose, S., Bosi, L., Braccini, S., Bradaschia, C., Bulik, T., Calloni, E., Cella, G., Chassande Mottin, E., Chelkowski, S., Chincarini, A., Clark, J., Coccia, E., Colacino, C., Colas, J., Cumming, A., Cunningham, L., Cuoco, E., Danilishin, S., Danzmann, K., De Luca, G., De Salvo, R., Dent, T., De Rosa, R., Di Fiore, L., Di Virgilio, A., Doets, M., Fafone, V., Falferi, P., Flaminio, R., Franc, J., Frasconi, F., Freise, A., Fulda, P., Gair, J., Gemme, G., Gennai, A., Giazotto, A., Glampedakis, K., Granata, M., Grote, H., Guidi, G., Hammond, G., Hannam, M., Harms, J., Heinert, D., Hendry, M., Heng, I., Hennes, E., Hild, S., Hough, J., Husa, S., Huttner, S., Jones, G., Khalili, F., Kokeyama, K., Kokkotas, K., Krishnan, B., Lorenzini, M., Lück, H., Majorana, E., Mandel, I., Mandic, V., Martin, I., Michel, C., Minenkov, Y., Morgado, N., Mosca, S., Mours, B., Müller-Ebhardt, H., Murray, P., Nawrodt, R., Nelson, J., O'Shaughnessy, R., Ott, C. D., Palomba, C., Paoli, A., Parguez, G., Pasqualetti, A., Passaquieti, R., Passuello, D., Pinard, L., Poggiani, R., Popolizio, P., Prato, M., Puppo, P., Rabeling, D., Rapagnani, P., Read, J., Regimbau, T., Rehbein, H., Reid, S., Rezzolla, L., Ricci, F., Richard, F., Rocchi, A., Rowan, S., Rüdiger, A., Sassolas, B., Sathyaprakash, B., Schnabel, R., Schwarz, C., Seidel, P., Sintes, A., Somiya, K., Speirits, F., Strain, K., Strigin, S., Sutton, P., Tarabrin, S., Thüring, A., van den Brand, J., van Leeuwen, C., van Veggel, M., van den Broeck, C., Vecchio, A., Veitch, J., Vetrano, F., Vicere, A., Vyatchanin, S., Willke, B., Woan, G., Wolfango, P., and Yamamoto, K.: The Einstein Telescope: a third-generation gravitational wave observatory, Classical Quant. Grav., 27, 194002, https://doi.org/10.1088/0264-9381/27/19/194002, 2010. a
Saccorotti, G., Piccinini, D., Cauchie, L., and Fiori, I.: Seismic noise by wind farms: a case study from the Virgo Gravitational Wave Observatory, Italy, B. Seismol. Soc. Am., 101, 568–578, https://doi.org/10.1785/0120100203, 2011 a, b, c, d, e
Schofield, R.: Seismic measurements at the stateline wind project, Rept No LIGO T020104, Laser Interferometer Gravitational Wave Observatory, https://dcc-llo.ligo.org/public/0027/T020104/000/T020104-00.pdf (last access: June 2025), 2001. a, b, c
Stachnik, J., Sheehan, A., Zietlow, D., Yang, Z., Collins, J., and Ferris, A.: Determination of New Zealand ocean bottom seismometer orientation via Rayleigh-wave polarization, Seismol. Res. Lett., 83, 704–713, https://doi.org/10.1785/0220110128, 2012. a
Stammler, K. and Ceranna, L.: Influence of wind turbines on seismic records of the Gräfenberg array, Seismol. Res. Lett., 87, 1075–1081, https://doi.org/10.1785/0220160049, 2016. a, b, c, d
Uieda, L., Tian, D., Leong, W. J., Schlitzer, W., Grund, M., Jones, M., Fröhlich, Y., Toney, L., Yao, J., Magen, Y., Tong, J.-H., Materna, K., Belem, A., Newton, T., Anant, A., Ziebarth, M., Quinn, J., and Wessel, P.: PyGMT: A Python interface for the Generic Mapping Tools (v0.9.0), Zenodo [code], https://doi.org/10.5281/zenodo.7772533, 2023. a
Welch, P.: The use of fast Fourier transform for the estimation of power spectra: a method based on time averaging over short, modified periodograms, IEEE T. Acoust. Speech, 15, 70–73, https://doi.org/10.1109/TAU.1967.1161901, 1967. a
Westwood, R. and Styles, P.: Assessing the seismic wavefield of a wind turbine using polarization analysis, Wind Energy, 20, 1841–1850, https://doi.org/10.1002/we.2124, 2017. a
Woessner, J., Danciu, L., Giardini, D., and the SHARE consortium: The 2013 European Seismic Hazard Model: key components and results, Bull. Earthq. Eng., 13, 3553–3596, https://doi.org/10.1007/s10518-015-9795-1, 2015. a
Zhang, R., Zhao, Z., and Dai, K.: Seismic response mitigation of a wind turbine tower using a tuned parallel inerter mass system, Eng. Struct., 180, 29–39, https://doi.org/10.1016/j.engstruct.2018.11.020, 2019. a
Zieger, T. and Ritter, J.: Influence of wind turbines on seismic stations in the upper rhine graben, SW Germany, J. Seismol., 22, 105–122, https://doi.org/10.1007/s10950-017-9694-9, 2018. a, b, c, d, e, f
Zieger, T., Nagel, S., Lutzmann, P., Kaufmann, I., Ritter, J., Ummenhofer, T., Knödel, P., and Fischer, P.: Simultaneous identification of wind turbine vibrations by using seismic data, elastic modeling and laser Doppler vibrometry, Wind Energy, 23, 1145–1153, https://doi.org/10.1002/we.2479, 2020. a