the Creative Commons Attribution 4.0 License.
the Creative Commons Attribution 4.0 License.
 | 22 Jan 2025
Modelling the thermal evolution of extensional basins through lithosphere stretching factors: application to the NW part of the Pannonian Basin
Eszter Békési
Jan-Diederik van Wees
Kristóf Porkoláb
Mátyás Hencz
Márta Berkesi
The reconstruction of thermal evolution in sedimentary basins is a key input for constraining geodynamic processes and geo-energy resource potential. We present a methodology to reproduce the most important transient thermal footprints accompanying basin formation: lithosphere extension and sedimentation. The forward model solving the transient heat equation is extended with an inversion workflow to constrain models with temperature measurement, providing estimates on model parameters, most importantly the amount of lithosphere stretching. We apply the methodology to the NW part of Hungary. We test the effect of variations in model input parameters on the resulting temperature estimates and discuss the uncertainties and limitations of the modelling technique. Realistic past and present-day temperature predictions for the entire lithosphere are achieved for a carefully assessed set of input parameters, suggesting the strong attenuation of the mantle lithosphere through extension and relatively small variations in the present-day thermal lithosphere thickness. The new temperature model can be used to constrain geodynamic processes and lithosphere structure and rheology, and it can serve as a first-order boundary condition for geothermal exploration.
- Article
(6278 KB) - Full-text XML
- BibTeX
- EndNote


Understanding the thermal state and thermal evolution of the lithosphere of sedimentary basins is crucial both for constraining fundamental geodynamic, geological, and geochemical processes and observations on the lithosphere scale and for geo-energy perspectives such as geothermal and hydrocarbon exploration and resource characterization (e.g. Cloetingh et al., 2010; Ranalli and Rybach, 2005). Extensional sedimentary basins, through their formation, exhibit a typical thermal evolution pattern. During the active rifting phase, the surface heat flow, lithosphere temperature, and geothermal gradient rise are governed by the thinning of the lithosphere and consequent rise of the asthenosphere (e.g. Buck et al., 1988; Royden and Keen, 1980). Subsequently, the thermal relaxation of the lithosphere begins through conductive cooling and thermal subsidence. The duration of both the syn- and post-rift phases varies significantly; however, reaching equilibrium (steady state) typically takes several tens to hundreds of million years (Van Wees et al., 2009; Xie and Heller, 2009; Petersen et al., 2015).
In this paper, we present a new methodology that accounts for the most important thermal effects that accompany basin formation, such as lithosphere extension, sedimentation/erosion, and changes in thermal properties (most importantly, the radiogenic heat generation in the upper crust), largely building on the methodology of Van Wees et al. (2009). The transient thermal modelling workflow is extended with an inversion framework to constrain model parameters with present-day temperature observations to allow the validation of the resulting model predictions. We demonstrate and apply the new methodology to the NW part of the Pannonian Basin (Fig. 1).
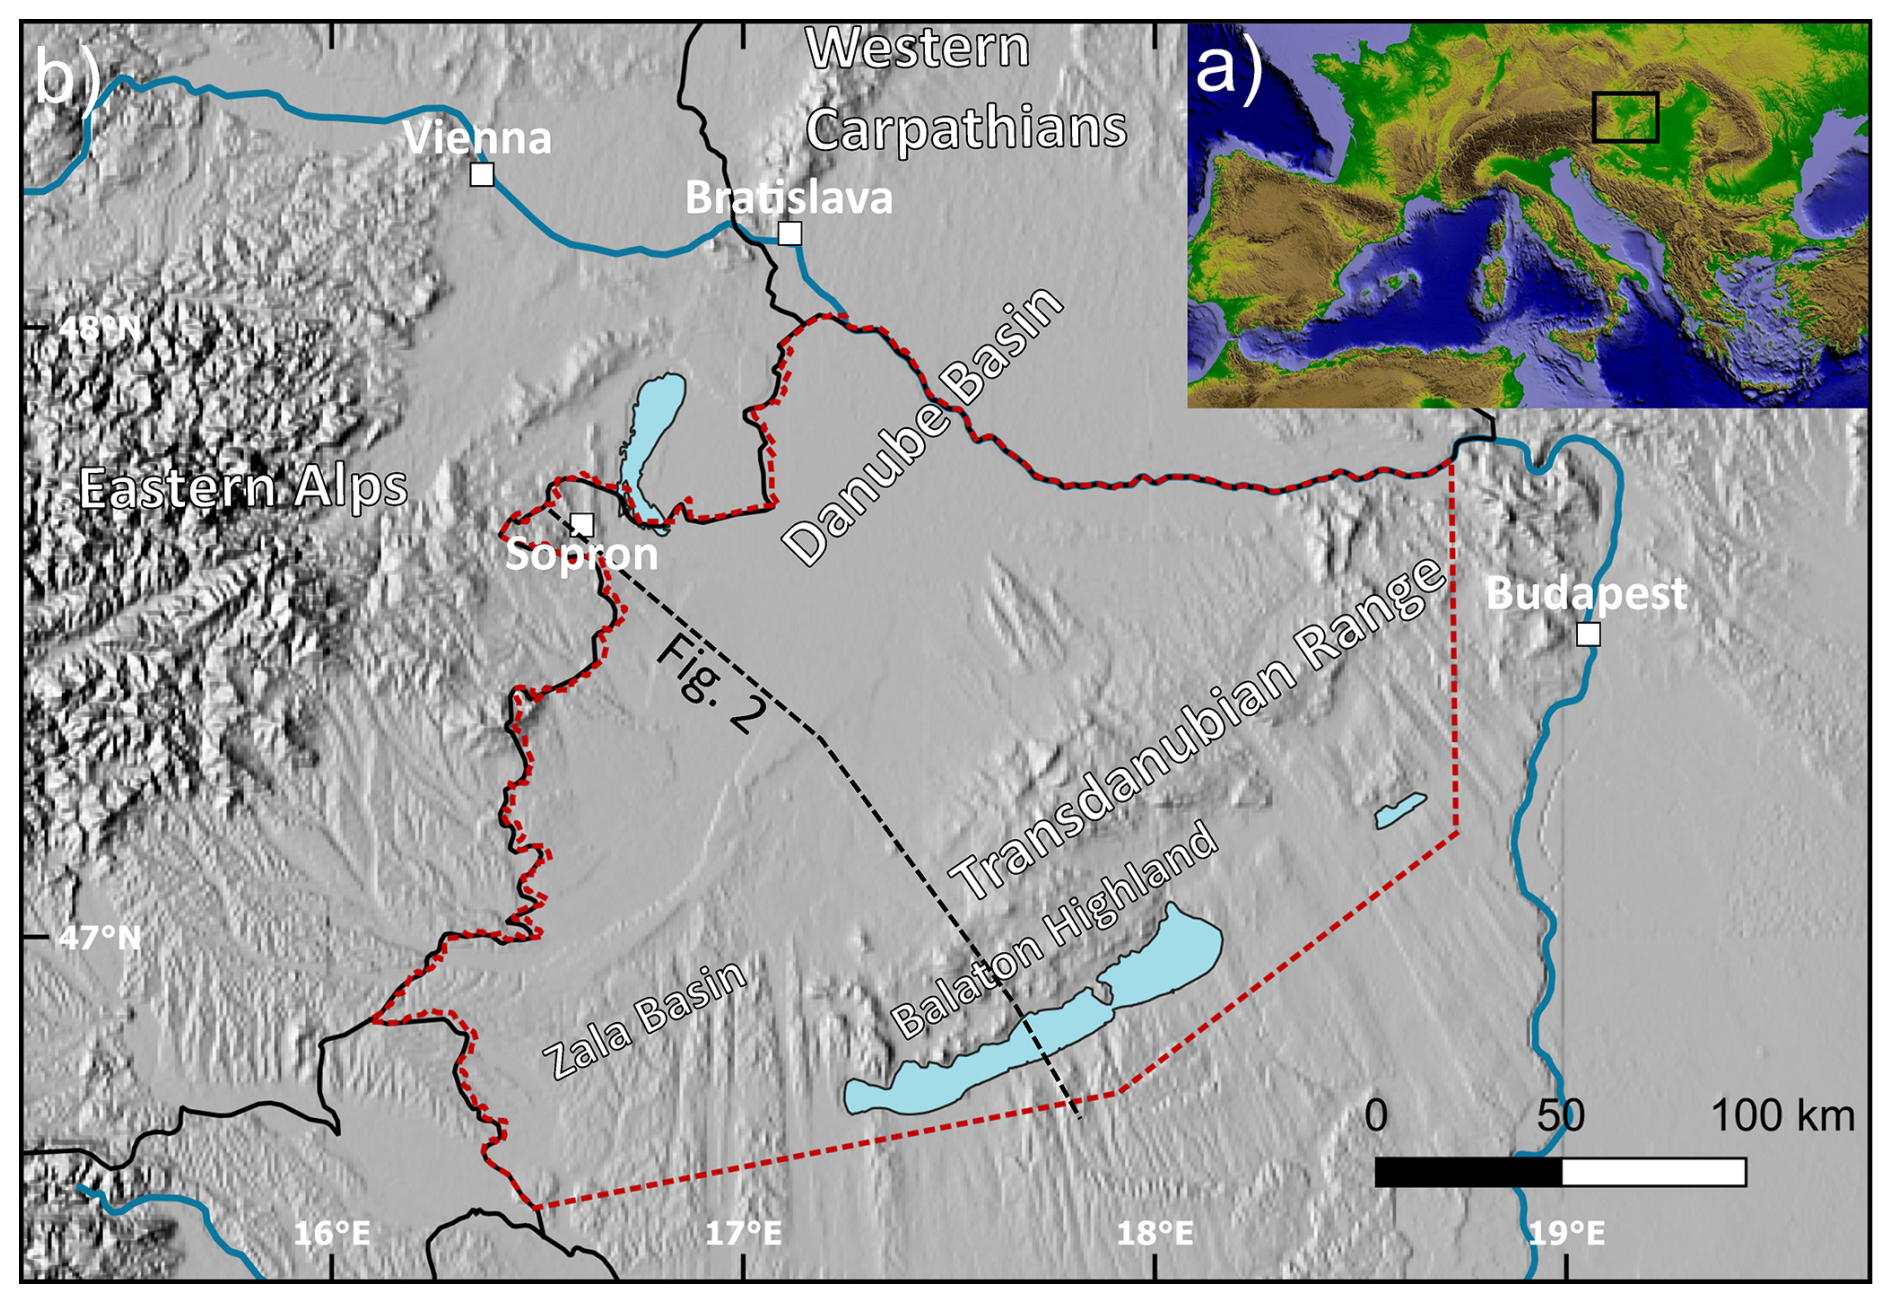
Figure 1(a) Topographic map of Europe based on the SRTM digital elevation model (Farr et al., 2007), showing the outline of Fig. 1b (black rectangle) (b) Geography of the study area based on the GMTED2010 elevation model (Danielson and Gesch, 2011). The red polygon denotes the extent of the thermal model (restricted to the borders of Hungary due to data availability), and black lines denote state borders.
The Pannonian Basin exhibits an attenuated crust and lithosphere (Hetényi and Bus, 2007; Kalmár et al., 2021; Kalmár et al., 2023) and therefore a high heat flow (an average of 90 mW m−2) and geothermal gradient (an average of 45 °C km−1), constituting one of the hottest basins in Europe (Lenkey et al., 2002; Békési et al., 2018; Horváth et al., 2015; Limberger et al., 2018), together with the Tyrrhenian and Aegean basins (e.g. Mendrinos et al., 2010; Giovanni et al., 2005). Lithosphere extension in the Pannonian Basin took place in the Miocene migrating from NW towards SE. Consequently, the surface heat flow and geothermal gradient in the NW part of the basin constituting the study area are generally lower, but the thermal footprint of extension is still notable. Extension was followed by post-rift cooling and subsidence accompanied by contractional basin inversion from the Late Miocene (e.g. Balázs et al., 2016; Fodor et al., 2005; Horváth and Cloetingh, 1996; Tari, 1994; Tari et al., 2020) to the present day (Grenerczy et al., 2005; Bada et al., 2007; Porkoláb et al., 2023; Békési et al., 2023). Despite the inversional overprint, the thermal footprint of Miocene lithosphere extension is still the most important factor that determines the present-day thermal state of the lithosphere. Consequently, the past and present-day temperature distribution in the lithosphere can only be fully captured by modelling the transient thermal effect of syn-rift extension and post-rift cooling, accompanied by changes in lithosphere structure and thermal properties (i.e. changes in thermal properties due to sedimentation, upper-crustal radiogenic heat generation).
Physics-based thermal models constructed for (parts of) the Pannonian Basin partly focused on the representation of the temperature distribution within the upper crust, providing boundary conditions for geothermal exploration (Lenkey et al., 2017; Békési et al., 2018). Such models either were constructed without performing actual transient calculations (Békési et al., 2018) or were not conditioned by temperature measurements (only the forward-modelling exercise was performed; Lenkey et al., 2017). The thermal evolution of the lithosphere of (parts) of the Pannonian Basin was also modelled (Balázs et al., 2021; Majcin et al., 2015), without the direct incorporation of temperature measurements. We aim to provide temperature predictions that can further improve on existing models to represent past and present-day temperature distribution within the whole lithosphere. Additionally, we test the effect of a range of initial model parameters on the resulting thermal field and estimate the amount of lithosphere stretching in the area for a selected case of model parameters. We discuss implications for the thermal state and thermal evolution of the region and for the rheology and structure of the lithosphere.
Our study area in NW Hungary comprises sub-basins of the Miocene Pannonian Basin system (Danube Basin, Zala Basin) and the Transdanubian Range, where the pre-Cenozoic basement units outcrop over a hilly region (Figs. 1 and 2). The Danube Basin (also called the Little Hungarian Plain) is one of the deepest (up to 9 km; Kilényi et al., 1991) sub-basins of the Pannonian Basin and is framed by the Eastern Alps to the west, the western Carpathians to the north, and the Transdanubian Range to the southeast. The sedimentary succession of the Danube Basin overlies an Alpine nappe stack of basement units consisting of Adria-derived thrust sheets (Austroalpine nappe system), remnants of the Alpine Tethys Ocean (Penninic nappe), and units of the lower plate (Europe-derived units). During the Miocene opening of the Danube Basin, normal faults partially reactivated and partially cut through the Alpine nappe contacts in the basement (Tari et al., 2021). The Alpine nappe stack is exposed on the NW and SE margins of the Danube Basin, with the lower Austroalpine nappe in the Sopron Mountains and the upper Austroalpine units in the Transdanubian Range (Fig. 2, Tari, 1994; Schmid et al., 2008). The Transdanubian Range exhibits a thick Mesozoic platform carbonate succession (Fig. 2) that defines its characteristic thermal properties (Table 1) and typical karstic hydrology (Mádl-Szőnyi and Tóth, 2015). The SE limit of the Transdanubian Range is the Mid-Hungarian Shear Zone (Csontos and Nagymarosy, 1998), where basement units are buried below Neogene sediments (Fig. 2).
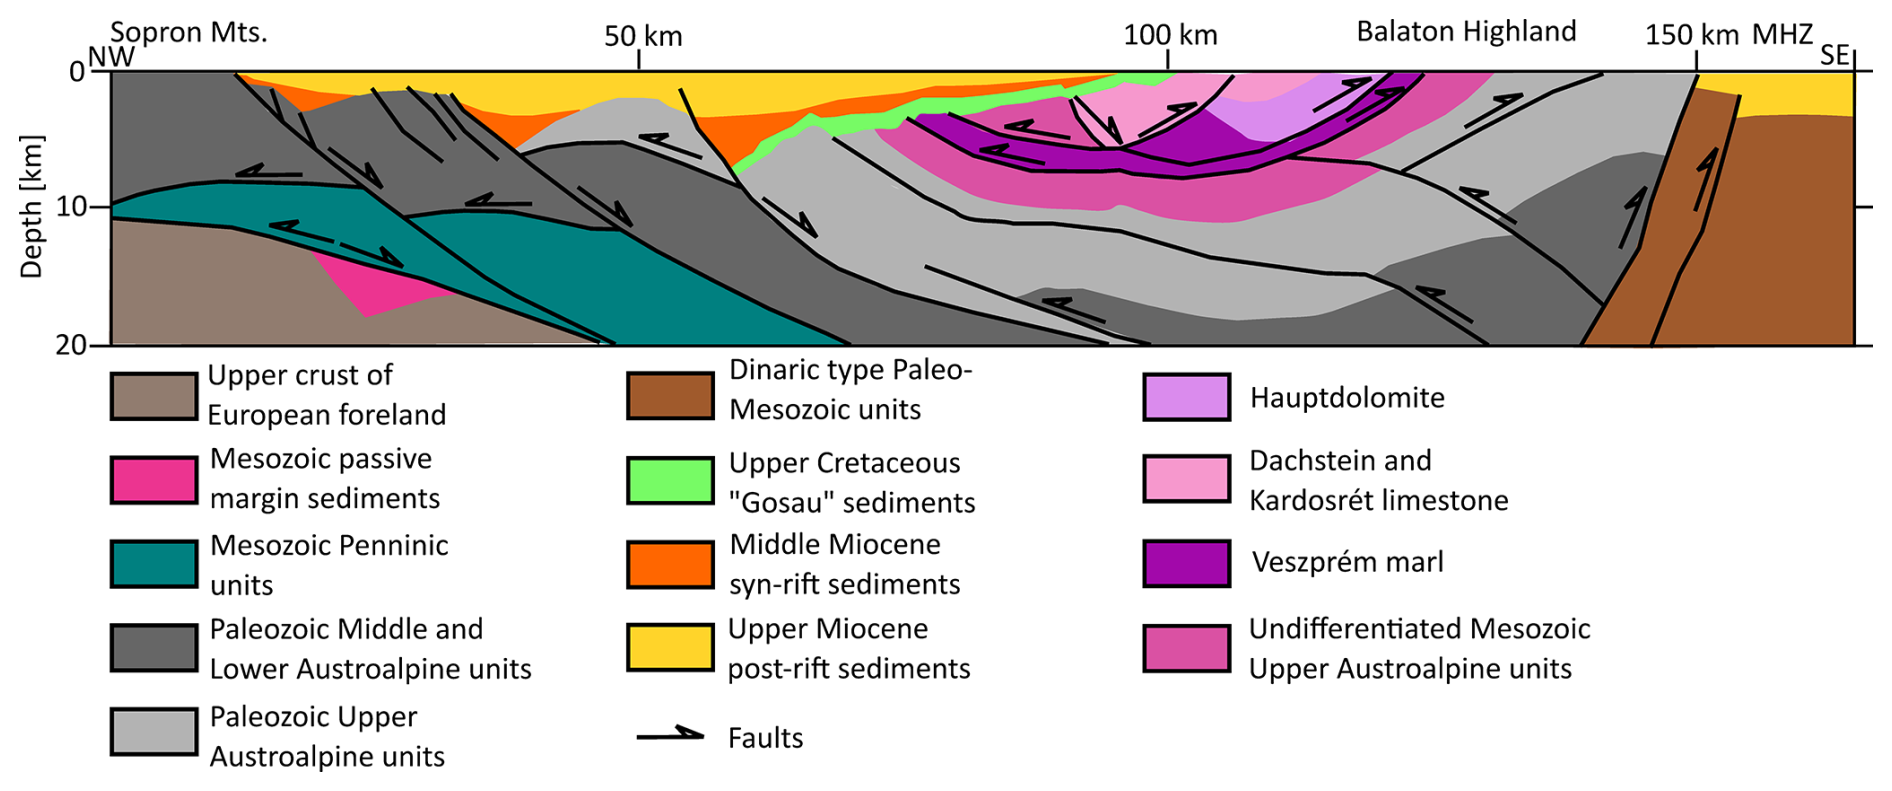
Figure 2Geological cross-section through the study area (for location, see Fig. 1) showing the most important regional units and faults, modified after Szafián et al. (1999). MHZ: Mid-Hungarian Shear Zone.
3.1 Model geometry and thermal properties
The temperature model extends to the whole lithosphere in the NW part of the Pannonian Basin, restricted to its Hungarian part. Restricting the model area to the Hungarian part was necessary due to the availability of geological horizons and temperature measurements. The model was built in the Hungarian coordinate system (HD72/EOV) with a horizontal resolution of ∼ 3 km and a vertical resolution of 200 m for the uppermost 5 and 2.5 km down to 135 km depth, which was selected as the bottom of the lithosphere prior to extension.
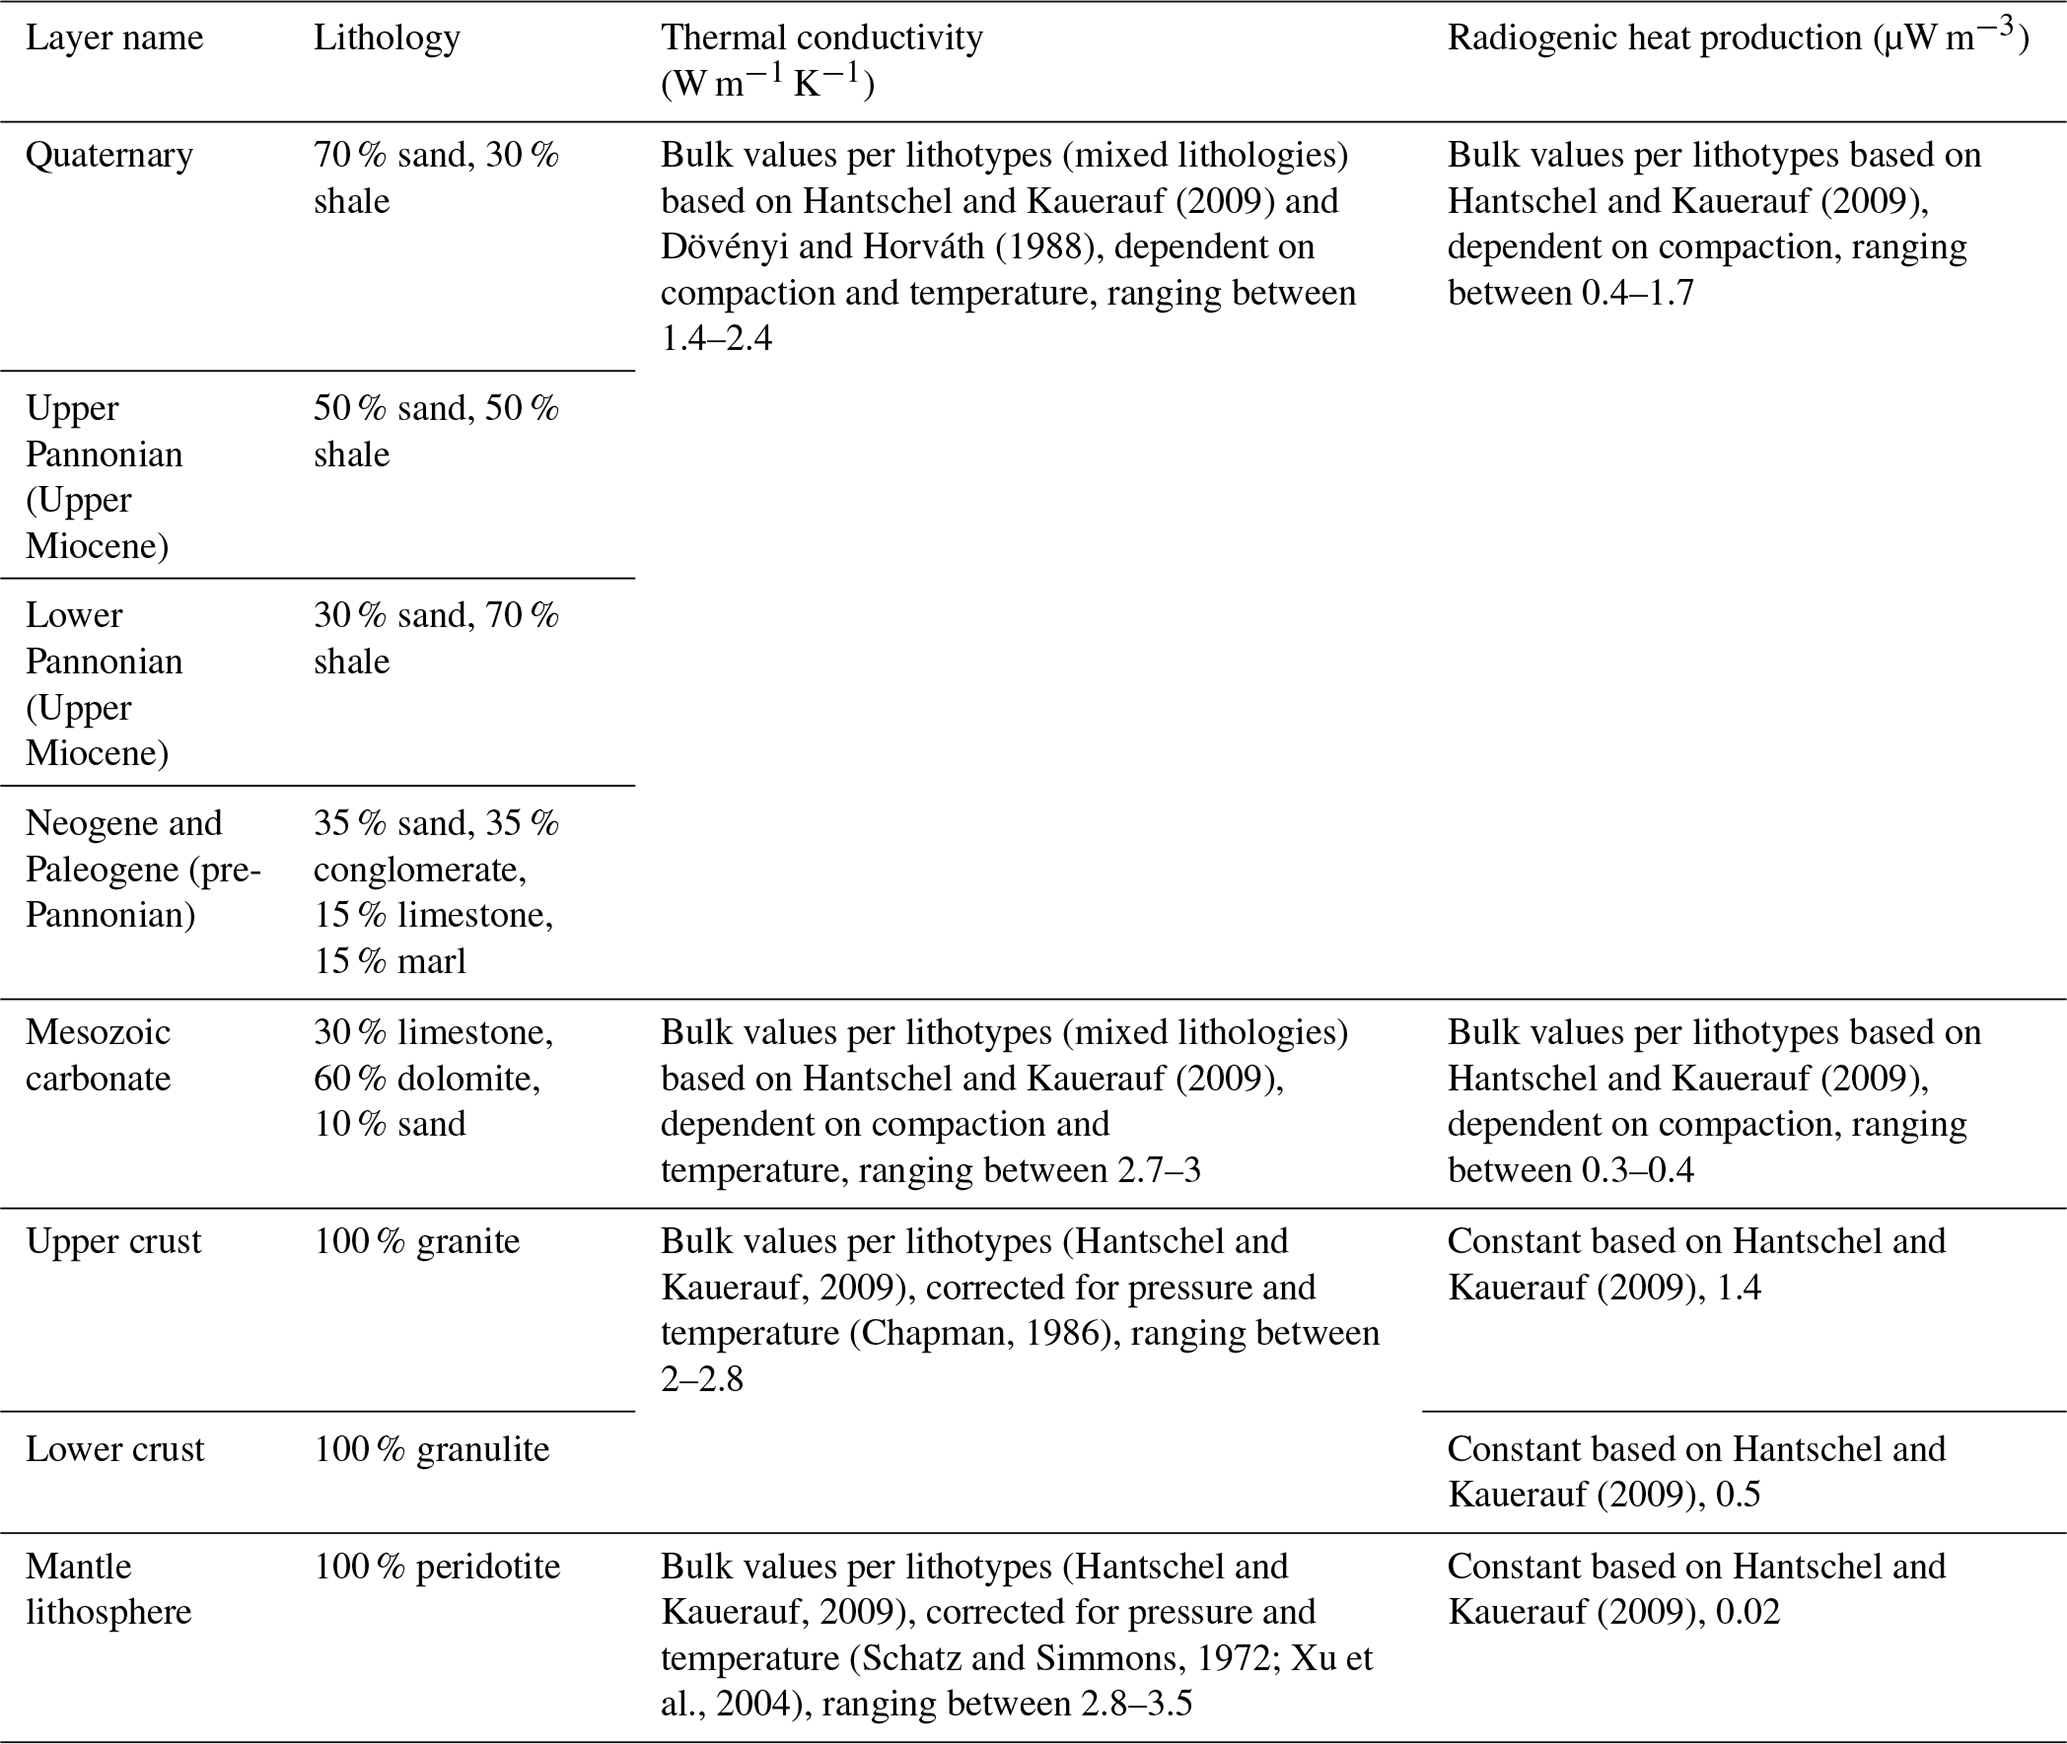
The model is built up by the present configuration of sedimentary layers, upper crust, lower crust, and lithospheric mantle. The sediments were sub-divided into four layers, Quaternary, Upper Pannonian (Upper Miocene post-rift), Lower Pannonian (Upper Miocene post-rift), and pre-Pannonian Neogene (Middle Miocene syn-rift), and into Paleogene units built up by the mixture of clastic sediments (Table 1). Paleogene sediments were not sub-divided from the pre-Pannonian Neogene sediments because of their limited overall extent in the study area but were accounted for in the selection of the composition, based on Babinszki et al. (2024b). The compositions of sedimentary layers were determined based on interpreted seismic sections and well logs and on derived geological models (Babinszki et al., 2024b; Fodor et al., 2013; Sztanó et al., 2016). For the geometry of the pre-Cenozoic basement, we followed Haas et al. (2014). We included an additional layer for the Mesozoic carbonate basement units, since they constitute relatively thick (up to a few kilometres) successions throughout parts of the study area and have significantly different thermal properties compared to crystalline basement units. We constructed a thickness map (Békési et al., 2024) and a composition ratio for the carbonates based on published cross-sections and geological models (Budai et al., 1999; Szafián et al., 1999; Héja et al., 2022; Haas et al., 2014; Babinszki et al., 2024a). For the depth of the lower and upper crust in the present-day model, we used the most recent crustal models constructed from seismological observations (Kalmár et al., 2021). Except for the starting model for the time-dependent calculations (representing the thermal state of the lithosphere prior to extension), we allowed the lithospheric mantle to stretch with a spatially variable factor (subcrustal stretching factor; see Sect. 3.3) instead of using any present-day lithospheric thickness maps. We tested a range of initial lithosphere and crustal thickness values (Table A1) to evaluate the effect of initial parameter selection on the resulting modelled temperatures. The depth of the lithosphere–asthenosphere boundary (LAB) prior to stretching, corresponding to 1330 °C, was set to a constant 135 km, and the initial crustal thickness was set to 40 km for the preferred model. These initial conditions are considered suitable to represent the over-thickened pre-extension lithosphere of the region (e.g. Balázs et al., 2016). The initial crustal thickness of 40 km, representing the relatively thick crust of the Alpine–Carpathian region prior to extension (e.g. Faccenna et al., 2014), is realistic for most of the study area; however, crustal thickness was possibly even larger in the western periphery of the study area, most importantly in the area of the Rechnitz core complex.
For the calculation of thermal conductivities of the sediments, we used matrix thermal conductivity values for shale and sandstone (pelite and psammite) in the Pannonian Basin (Dövényi and Horváth, 1988) and typical values after Hantschel and Kauerauf (2009) for conglomerate and marl. The matrix thermal conductivities were corrected for in situ temperature using the formula of Sekiguchi (1984). For the carbonate layers built up predominantly by dolomites and limestones (Table 1), we adopted values reported in Dövényi et al. (1983). Since each sedimentary layer and the carbonate layer are built up by various lithotypes, the bulk rock matrix thermal conductivities were calculated by taking the harmonic mean of the individual matrix thermal conductivities of the lithotypes. The sediment bulk thermal conductivities were finally obtained using the geometric mean of the bulk matrix conductivities and the thermal conductivity of the pore fluid as described in e.g. Limberger et al. (2018) . For the calculation of porosity of sediments, we estimated compaction coefficients and depositional porosities based on the porosity–depth trends of Szalay (1982) for shale and sand(stone) (pelite and psammite) and adopted typical values reported by Hantschel and Kauerauf (2009) for conglomerate and marl.
The range of thermal conductivity values of Neogene sediments varies between 1.4 and 2.4 (Table 1), which is lower than the mean measured thermal conductivity values of shale and sandstone samples reported in Mihályka et al. (2023). This can partly be explained by the low thermal conductivity of highly porous unconsolidated Quaternary and Upper Pannonian sediments in shallow depth and by the dominance of shales with low thermal conductivity in the Lower Pannonian layer.
We calculated the thermal conductivities of the crust and the lithosphere using the thermal and petrophysical parameters of Hantschel and Kauerauf (2009). Typical thermal conductivity values of the upper and lower crust and lithospheric mantle were corrected for pressure and temperature conditions based on Chapman (1986) in the case of the crust and Schatz and Simmons (1972) and Xu et al. (2004) for the mantle lithosphere.
Radiogenic heat generation of each layer was calculated as a mixture of typical values of lithotypes after Hantschel and Kauerauf (2009), corrected for compaction (values in sediments generally increase with depth due to decreasing porosity). The radiogenic heat generated in the granitic upper crust is generally considerably larger than in the case of sedimentary, lower-crustal, and lithospheric mantle units. Therefore, it was increasingly important to distinguish the carbonate and crystalline basement units for the proper prediction of upper-crustal temperatures. Since the radiogenic heat generation of compacted shale layers is in the order of magnitude of the upper crust, maximum values of the sediment heat generation corresponding to the deep Lower Pannonian shales are up to 1.7 µW m−3 (Table 1). The radiogenic heat generation of the crust and lithospheric mantle was selected to constants. For the upper crust, we chose a typical continental upper-crustal heat generation value of 1.4 µW m−3, while the lower-crustal and mantle lithosphere heat generation were selected to 0.4 and 0.002 µW m−3 based on Hantschel and Kauerauf (2009) (Table 1).
3.2 Temperature observations and data uncertainties
We calibrated the thermal model with subsurface temperature measurements from hydrocarbon and geothermal wells. Measurements from the Geothermal Database of Hungary (Dövényi and Horváth, 1988; Dövényi et al., 2002) and the Geothermal Information System (OGRe, 2020) were collected, including bottom-hole temperatures (BHTs), drill stem tests (DSTs), steady-state temperature logs, and outflowing water temperatures from geothermal wells. Temperature measurements were carefully reviewed, and observations from areas where the conductive thermal field is strongly influenced by fluid flow and observations with errors larger than 10 °C were excluded from the dataset. This was necessary, as the model, focusing primarily on lithosphere-scale processes, could not account for convective heat transfer, and temperature measurements influenced by fluid flow would have biased the predicted lithosphere temperatures. The influence of fluid flow was checked in the individual temperature measurements of wells and on the shallow (500 m) temperature map (Lenkey et al., 2021). The resulting number of temperature observations used for calibration was 319, covering the depth interval of 200–5100 m (Fig. 3a; Békési et al., 2024). Measurements are not evenly distributed throughout the study area; most of them are available from basinal locations, especially from the surroundings of the Zala Basin (Fig. 3b). Observations from the vicinity of the Transdanubian Range are rather limited due to the presence of regional deep fluid pathways (Mádl-Szőnyi and Tóth, 2015; Tóth et al., 2023) and the resulting convective thermal field, also evidenced by the low surface heat flow due to the infiltration of cold meteoric water (Lenkey et al., 2002).
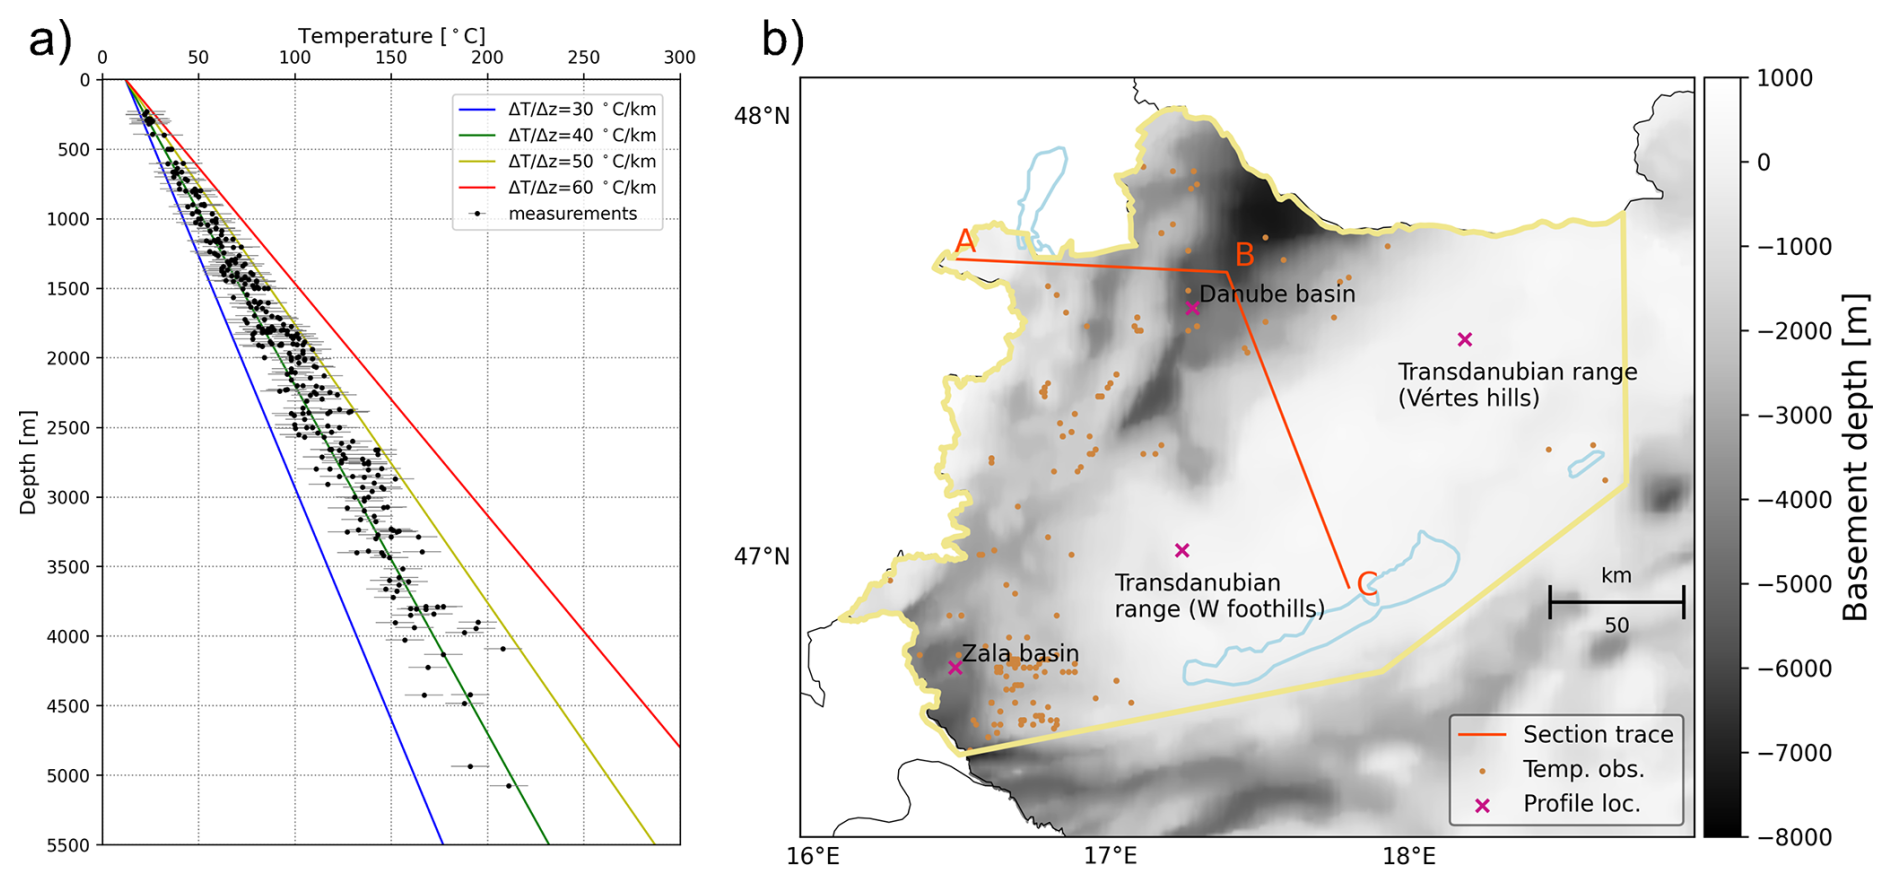
Figure 3(a) Temperature dataset used for the calibration of the thermal model. Temperature measurements were obtained from the Geothermal Database of Hungary (Dövényi and Horváth, 1988; Dövényi et al., 2002) and the Geothermal Information System (OGRe, 2020). Colours represent geotherms between 30 to 60 °C km−1. (b) Locations of temperature measurements (light-brown circles), locations of temperature profiles (pink crosses), and the section trace (red line), shown in Figs. 7–9, plotted on top of the pre-Cenozoic basement map (Haas et al., 2014).
Symmetrical uncertainties were chosen for the measurements, between ±5 to ±10 °C, and uncertainties were selected identically for the same measurement types for simplicity, similar to previously published studies (Békési et al., 2018, 2020). DSTs were marked by uncertainties of ±5 °C, while, for BHTs and outflow temperatures, a maximum error of ±10 °C was chosen. For the remaining temperature measurements, we adopted the errors reported in the Geothermal Database of Hungary (Dövényi and Horváth, 1988; Dövényi et al., 2002).
Temperature measurements selected for calibration mostly scatter around the 40 °C km−1 geotherm (Fig. 3a), while several observations, both in shallower and deeper intervals, approximate the 50 °C km−1 geotherm. The overall geothermal gradient of the temperature dataset is 42 °C km−1, which is slightly below the average geothermal gradient for the central part of the Pannonian Basin (∼ 45 °C km−1), although it is still much higher than the average continental values, representing the thermal effect of the thinned lithosphere in the study area.
3.3 Forward model
The modelling procedure consists of three main steps, including steady-state conductive forward-model calculations, transient calculations incorporating the thermal effect of lithosphere-scale processes, and the inversion procedure. In the first step, we calculated the thermal field prior to lithosphere extension (Sect. 3.3.1). In the second step, we used crustal and subcrustal stretching factors and sedimentation rates to account for the effects of lithosphere extension and subsequent cooling, as well as syn- and post-rift sedimentation (Sect. 3.3.2) damping of the thermal footprint of extension. The third step concerns the inversion workflow (Sect. 3.4), incorporating temperature measurements into the model as target observations to constrain the amount of lithosphere attenuation and, as a result, obtain more realistic temperature estimates during and after rifting.
3.3.1 Steady-state calculations
The steady-state modelling approach provides initial conditions for the transient model calculations by solving the heat equation for conduction in 3D:
where λ is the thermal conductivity (W m−1 K−1), T (K or °C) is the temperature, A is the radiogenic heat production (W m−3), and is the nabla operator. Equation (1) is solved numerically by a finite-difference approximation using the preconditioned conjugate gradient method. Temperature boundary conditions at the top and bottom of the model were selected as 12 and 1330 °C, respectively. The top boundary condition of 12 °C was selected as a mean surface temperature. The depth of the bottom boundary condition was selected to 135 km, which was assumed to be the depth of the LAB prior to lithosphere extension. The vertical edges of the model were assumed to be insulating, with a fixed heat flow of zero. These boundary conditions also remained active for the transient model calculations both with and without incorporating the inversion procedure, since the steady-state model provided the initial setting of the transient modelling. Please note that the steady-state geotherm is based on the present-day (actual) crustal and sediment configuration in target prediction time (present day). As demonstrated in Van Wees et al. (2009) in high-resolution 1D simulations, the steady-state solution at prediction time target, corrected for transient effects related to kinematic effects of lithosphere deformation, and sedimentation provide a reliable thermal solution for the top 5–10 km of the model in particular.
3.3.2 Transient calculations
To correct the steady-state solution (Eq. 1) for transient effects, the thermal effects of lithosphere extension were incorporated in the model by integrating over simulation time for
where t is the time (s), ρ is the density (kg m−3), ct is the specific heat capacity (J kg−1 K−1), and vz is the vertical velocity of the sediment, crust, and mantle in the Eulerian finite-difference framework as a function of the tectonic stretching and sedimentation (see Van Wees et al., 2009; Bonté et al., 2012; Corver et al., 2009). The transient term was estimated based on crustal (δ) and subcrustal (β) stretching factors and accounting for sedimentation, based on Van Wees et al. (2009). Crustal and subcrustal stretching factors represent the ratio between the initial and thinned crustal thickness and mantle lithosphere thickness, respectively, with values > 1 (e.g. Royden and Keen, 1980). For the transient numerical modelling of the temperature evolution of Eq. (2), a 3D explicit three-step Runge–Kutta finite-difference approach was used (Verwer, 1996) with a finite-volume approximation. For instance, in the case of an initial crustal thickness of 30 km and a thinned crustal thickness of 20 km, δ is equal to 1.5 (Fig. 4).
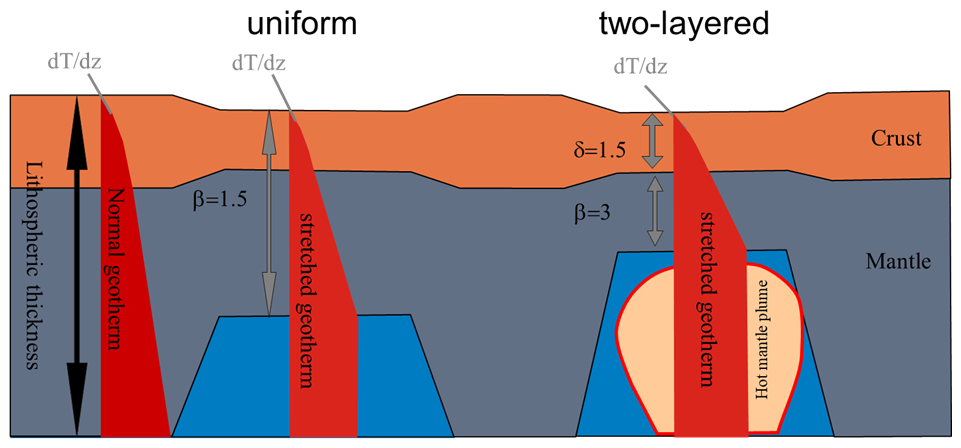
Figure 4An illustration of the crustal (δ) and subcrustal (β) stretching factors. d represents the temperature gradient with depth showing a disturbed geotherm in the stretched part of the model. Non-uniform stretching of the crust and mantle lithosphere (with or without the presence of mantle plumes) can be accounted for by β > δ after Van Wees et al. (2009) and Corver et al. (2009).
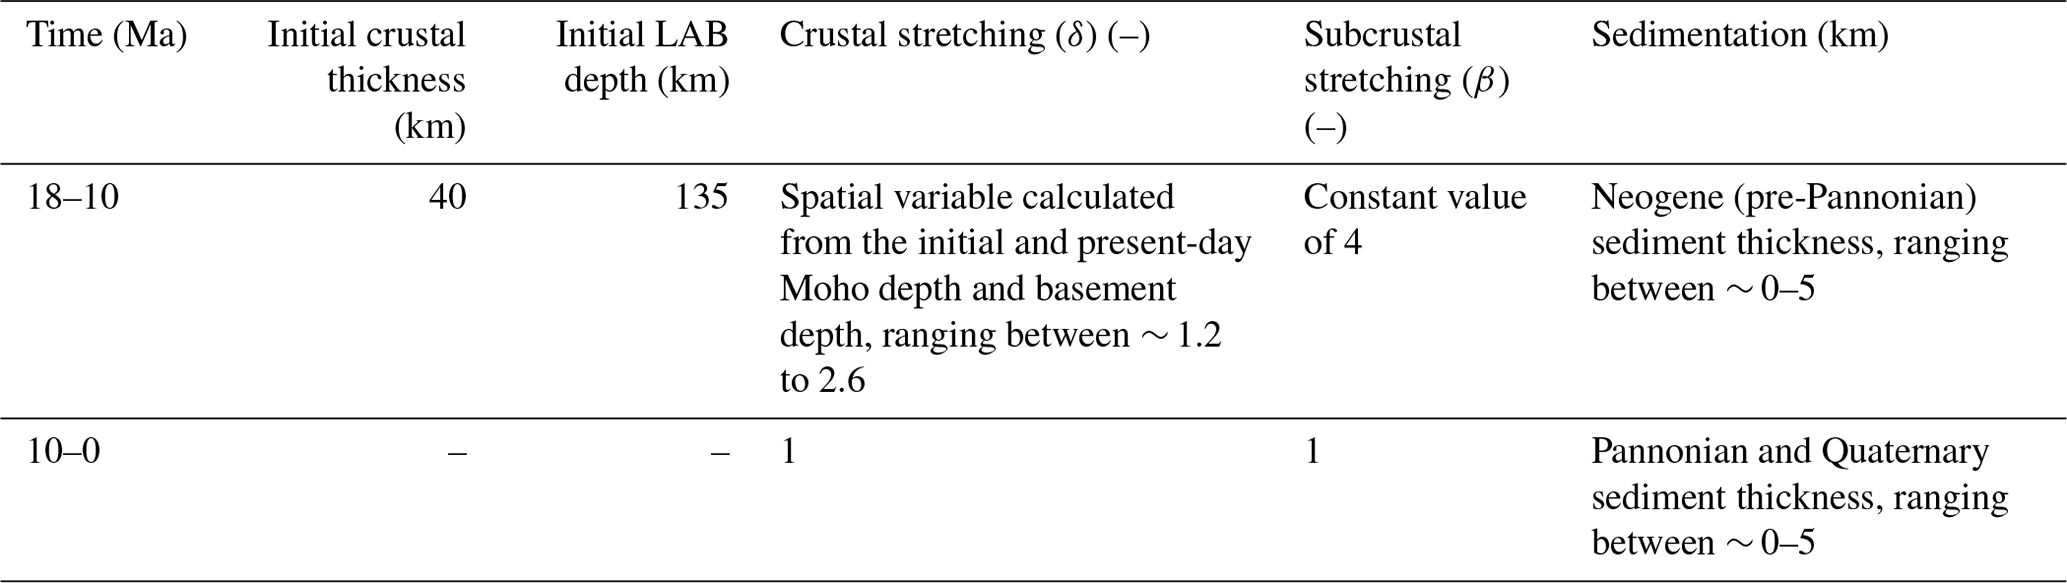
The timing of the main extensional phase was not uniform in the study area. The highest rates in the Zala Basin are inferred between 19–15 Ma, while, in the western part of the Transdanubian Range, active normal faulting started only at ∼ 15 Ma and persisted until 8 Ma (Fodor et al., 2021). In the Danube Basin, the syn-rift phase was active between ∼ 16–10 Ma (Šujan et al., 2021). In the thermal model, we assumed a uniform timing for active rifting in the whole study area for simplicity, which took place between 18–10 Ma (Table 2). It was necessary to later invert for subcrustal stretching factors in one step. For this period, we also considered sedimentation corresponding to the deposition of pre-Pannonian Neogene sediments (Table 2).
During the active rifting phase, we calculated the transient thermal effect of extension using crustal (δ) and subcrustal (β) stretching factors for the area. Lenkey (1999) calculated these factors for the entire Pannonian Basin, although, after testing them, we decided not to use them, due to the low β values predicted for the Transdanubian Range, resulting in unrealistically low present-day temperatures (almost identical to the thermal field prior to extension) in the area. We calculated new crustal stretching values similar to the methodology without heat flow observations described in Lenkey (1999) but based on the most recent present-day Moho depth of Kalmár et al. (2021) (zMoho present). To be able to compare the new δ grid with the earlier work of Lenkey (1999), we chose an initial crustal thickness (zcrust init) of 40 km. We calculated the present-day crustal thickness using the present-day basement depth (Haas et al., 2014). The equation for the crustal stretching factor δ is as follows:
The resulting crustal stretching factors are between ∼ 1.2 to 2.6 (Fig. 5a), where smaller values indicate almost no thinning of the crust corresponding to areas with no or minor sediment coverage, while highest values are attributed to basinal locations. Subcrustal stretching values cannot be calculated in the same way as the crustal stretching but by using the present-day LAB depth, since the base of the lithosphere immediately after extension has considerably changed through post-rift cooling (Lenkey, 1999). Therefore, we selected constant prior values for β, which we updated through the inversion procedure (Sect. 3.4) to account for its potential spatial variations. We tested several starting values for β between 2 and 4 (Appendix A), and we finally chose β= 4, since this value provided the prior model with the best fit to temperature observations. In comparison with previous lithosphere thermal modelling studies for the Danube Basin, for instance, Majcin et al. (2015) used β value of 1 to 3 but with lower initial lithosphere thickness (120 km). Considering the initial lithosphere thickness of 135 km and an initial crustal thickness of 40 km, β= 4 would mean that the thickness of the mantle lithosphere reduced from 95 to ∼ 24 km during rifting. The active rifting phase was followed by post-rift thermal subsidence and corresponding post-rift sedimentation. We incorporated the effect of post-rift sedimentation by assuming constant sedimentation rates between 10–0 Ma, based on the thickness of Pannonian (Upper Miocene) and Quaternary sediments (Table 2). Post-rift cooling was incorporated in the model by defining stretching of 1 after the syn-rift period.
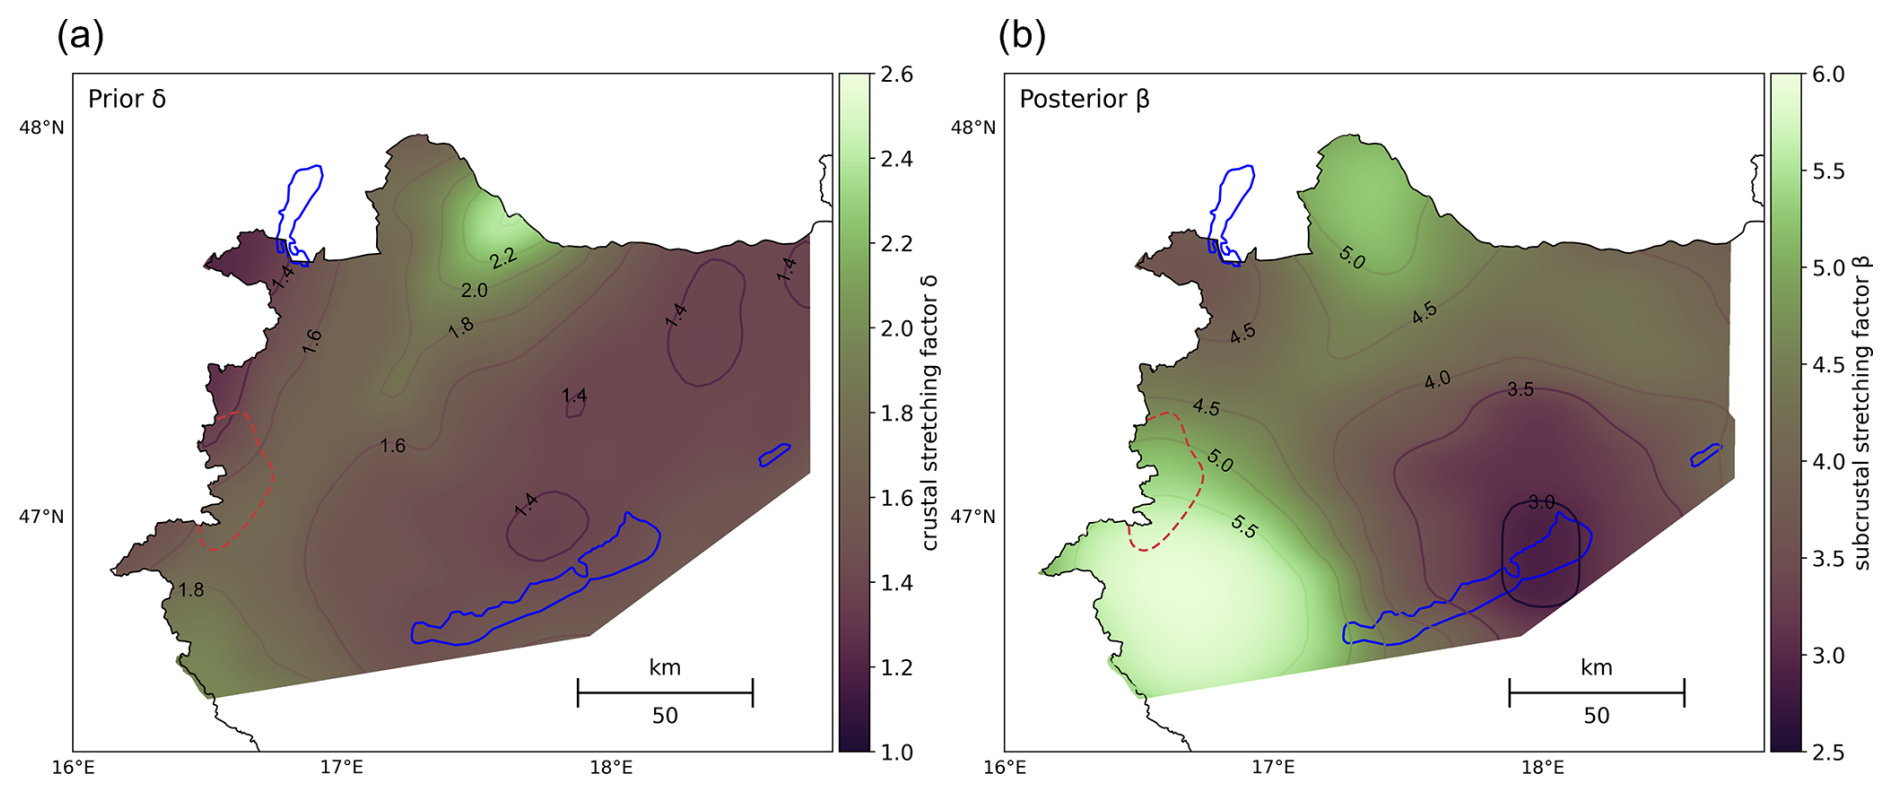
Figure 5(a) Prior crustal stretching (δ) and (b) posterior subcrustal stretching (β) values representing the extension of the crust and mantle lithosphere. Note that δ shown in panel (a) and β = 3 were used as input parameters for the stretching module and that β shown in panel (b) is the posterior mantle stretching factor resulting from the inversion procedure, conditioned with temperature observations. The outline of the Rechnitz core complex based on Fodor et al. (2021), where δ and β cannot be considered reliable due to model assumptions, is shown with the dashed red line.
3.4 Inversion procedure
We conditioned the thermal model with temperature observations from wells, using a selection of temperature measurements with assigned uncertainties described in Sect. 3.2. Since only one observation within each grid cell is supported, observations were restricted to 200 m deep intervals, and measurements with lower uncertainties were considered. In the case of multiple observations with the same error per grid cell, the deeper one was used for calibration. During the inversion procedure, the only model parameter we updated was the subcrustal stretching factor β. We selected only β for the model update, as we were primarily interested in lithosphere-scale thermal field and thermal evolution. We did not update the shallower part of the model (e.g. thermal parameters of the sediments), since a good fit with temperature observations was already achieved by only modifying β, which is responsible for the large-scale thermal perturbations affecting the model area.
To estimate the subcrustal stretching factor (β), we applied ensemble-based probabilistic inversion. The Ensemble Smoother (ES; Emerick and Reynolds, 2013b) estimates the model parameters by a global update, incorporating all data available. This allows the solution of inverse problems with a large number of observations in a computationally efficient way. For non-linear forward models, the ES requires several iterations, where the prediction of the previous run is used as an input for the subsequent data assimilation step (ES-MDA; Emerick and Reynolds, 2013a).
The solution for a single data assimilation for the updated model ensemble is
In Eq. (4), M is the prior ensemble of model parameters, GM is the result of the forward model working on all ensemble members, and GM' is the difference between GM and its mean. Ne represents the number of ensembles, and D is an ensemble of data realizations, created by perturbing the measurements according to their covariance matrix (Cd). The mean of the ensemble is taken as the best estimate, which is used as input for the next update in the case of ES-MDA. The number of data assimilation steps, Na, must be selected a priori. The data covariances used for the update steps are increased by a multiplication factor, αi, for , Na, and αi must be selected as (Emerick and Reynolds, 2013a). This is necessary to compensate for the effect of multiple applications of an ES.
The prior uncertainty in β was taken into account by scaling the initial β values of 3 to a uniform distribution between 2 and 6. The spatial variability of β was determined through a spherical variogram, representing the variability of subcrustal stretching as a function of distance. The radius of the variogram includes 15 model cells, which corresponds to ∼ 45 km. This relatively large distance was selected because variations in subcrustal stretching were considered to be large-scale. During the ES-MDA procedure, we chose four iterations, each with 700 model runs (ensembles). The resulting β field (Fig. 5b) shows variations between 2.5–6, where the largest values correspond to the Zala Basin, and the areas marked by less intense subcrustal stretching are predicted for the Transdanubian Range and the NW part of the model area.
4.1 Shallow (0–5 km) temperature field
Present-day posterior model temperatures, calculated with the updated subcrustal stretching factors, β, are in general higher in basinal areas (Zala Basin, Danube Basin) and lower in peripheral areas (Transdanubian Range, Sopron Mts.) (Fig. 6). The largest positive thermal anomaly at 2 km depth corresponds to the Zala Basin in the SW, reaching up to 100 °C (Fig. 6, left panel). The pattern of anomalies at 4 km depth is slightly different: a pronounced positive anomaly also shows in the Danube Basin in the north, with temperatures up to 170 °C, meaning a geothermal gradient of ∼ 39.5 °C km−1. Since convection connected to fluid flow is not considered in the model, the modelled thermal anomalies can be explained with conductive thermal effects. Positive anomalies are the reflection of sediment blanketing, meaning the insulating effect of sediments at shallower depth, with low thermal conductivity. Negative anomalies can be attributed to outcropping/near-surface basement rocks (mostly carbonates) having significantly higher thermal conductivities and to lower lithospheric stretching relative to the basin areas (Fig. 5b). It is important to note that the conductive thermal modelling approach is a valid assumption for most of the study area, resulting in realistic predicted temperatures; however, the conductive assumption is not fully valid for parts of the Transdanubian Range built up by fractured and karstified carbonate rocks (Fig. 6) and for buried carbonates in the vicinity of the Transdanubian Range. Groundwater flow up to the top 5 km alters the conductive regime at these areas; therefore predicted temperatures cannot be considered reliable in the shallow part of the model. Misfits between modelled and observed temperatures do not indicate this bias, since temperature measurements affected by fluid flow were excluded from the calibration dataset to properly account for the transient effect of lithosphere extension (see Sect. 3.2).
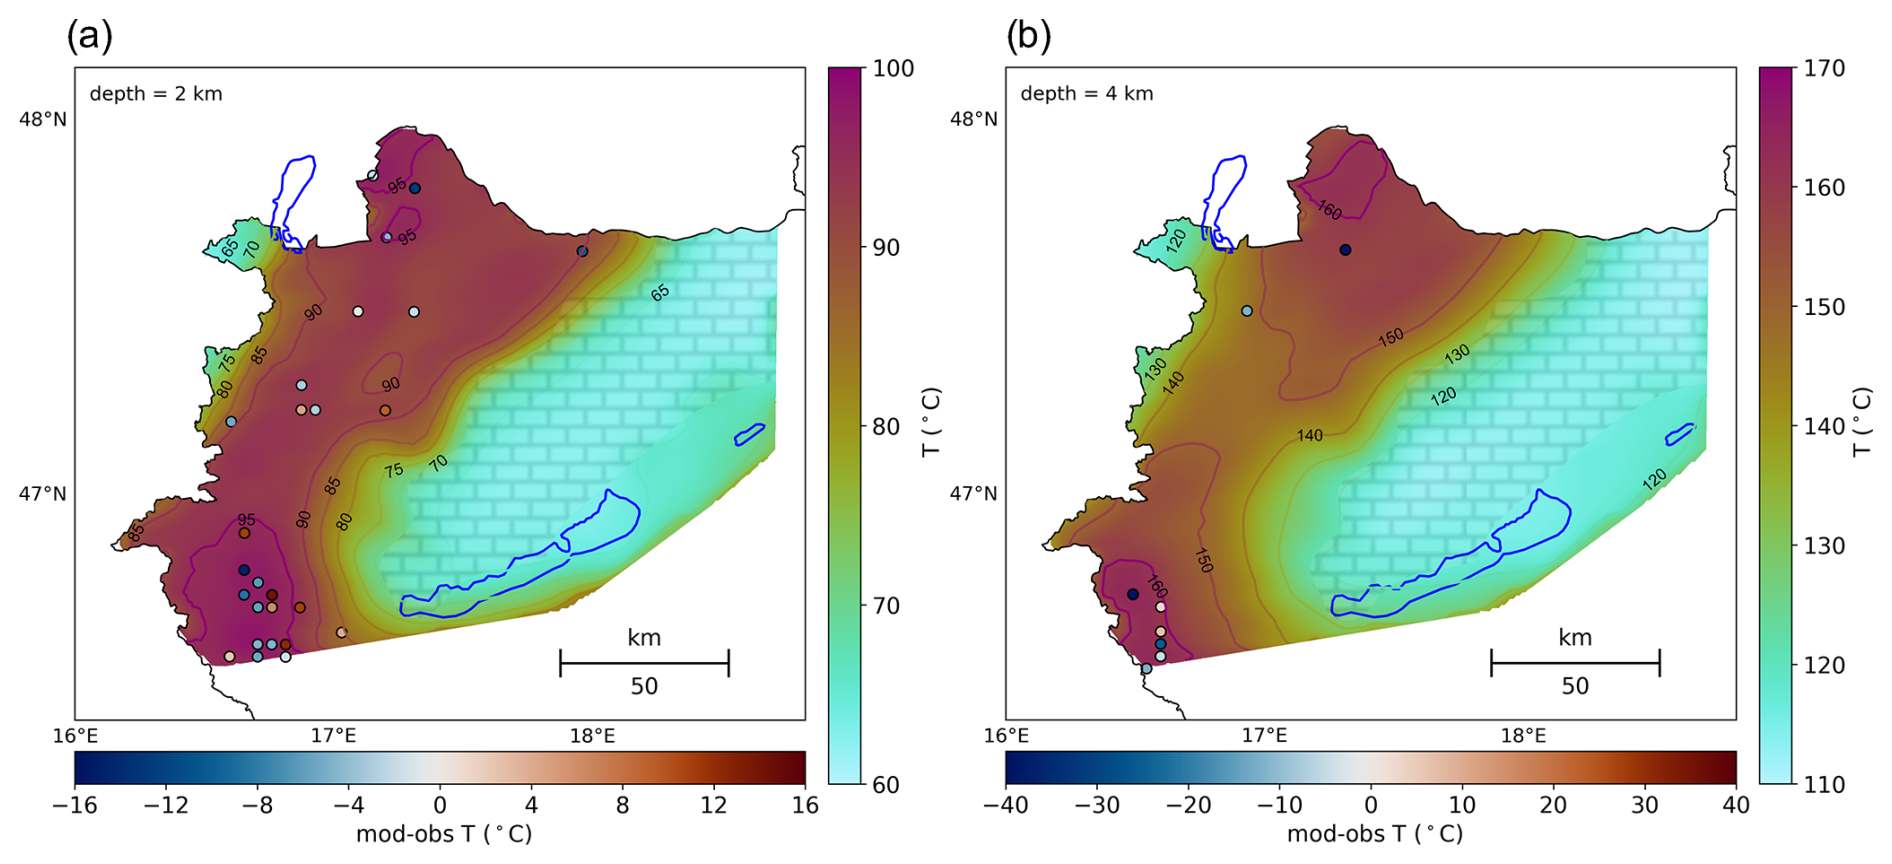
Figure 6(a) Isodepth temperature maps predicted by the present-day posterior model at 2 km (a) and 4 km (b) depth. The misfits between modelled and observed temperatures are indicated with colour-coded circles, within the depth interval of ±200 m. The area of the outcropping carbonates of the Transdanubian Range, where the shallow (up to 5 km) part of the model is not fully reliable due to the presence of fluid flow, is shown with the rectangle pattern.
The effect of sediment blanketing at shallow (0–5 km) depth is also clearly visible in the temperature–depth profiles (Fig. 7.). Temperatures are higher in basinal profiles (Fig. 7a, b) than in marginal settings (Fig. 7c, d), which is a result of the combined effect of sedimentation and higher crustal and lithospheric stretching in the basins. In all cases, the thermal effect of lithosphere extension is clearly visible: temperatures prior to stretching (Fig. 7, black lines) are significantly lower than present-day geotherms (Fig. 7, blue lines). Modelled present-day temperatures show a generally good fit with observations, although misfits in the deeper parts (> ∼ 3.5 km) exist in both the Danube and Zala basins. Some of these misfits may be explained by measurement errors but may also be attributed to changes in sediment geometry and composition further away from the profile location or can even be caused by local fluid convection, e.g. in the carbonate basement (Fig. 7c).
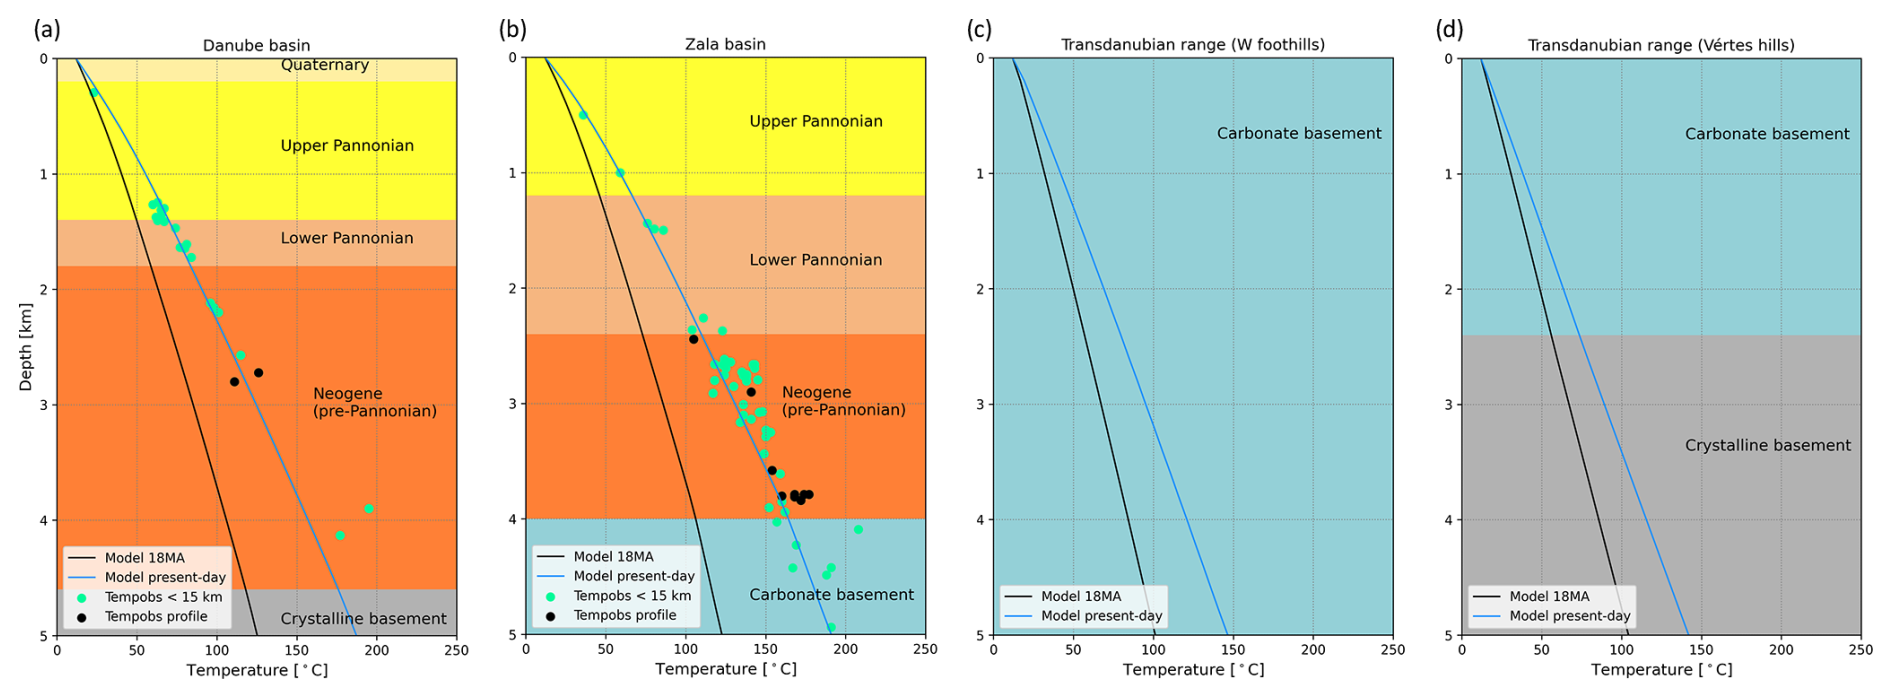
Figure 7Shallow (0–5 km) temperature–depth profiles in the Danube Basin (a), in the Zala Basin (b), and in two locations within the Transdanubian Range (c: western foothills; d: Vértes hills). The blue line represents the present-day geotherm, and the black line shows the geotherm prior to lithosphere extension. Black circles show temperature measurements from wells at the location of the profile, while green circles indicate measurements from wells within 15 km distance. For the locations of the profiles, see Fig. 3.
4.2 Lithosphere thermal field
The transient thermal field in the whole lithosphere was calculated by stretching the initial thermal model prior to extension (representing the thermal state of the lithosphere at 18 Ma) using crustal (δ) and subcrustal (β) stretching factors described in Sect. 3.2. β was initially set to a constant value for the prior modelling, then a spatial variation of β was introduced and β values were updated to fit present-day model temperatures to temperature observations (described in detail in Sect. 3.2). The resulting updated β values vary between 2.5 and 6 (Fig. 5), suggesting that more than half of the initial mantle lithosphere was attenuated during extension in the entire area.
Lithosphere geotherms prior to stretching at 18 Ma (black lines in Fig. 8) are significantly colder than past extension geotherms. The initial geotherms at 18 Ma indicate variations in geothermal gradient at two major compositional variations (sediment/basement and upper/lower crust boundary) according to the present-day model geometry. This is explained by the fact that present-day upper-crustal geometries were used as a primary model input, since this setting provided the most appropriate initial conditions for the stretched models. Since no sediments and a thicker upper crust existed before extension, the initial thermal model representing the temperature field at 18 Ma is slightly biased in upper-crustal levels. Going deeper, predicted initial lithosphere temperatures are almost identical for all locations (Fig. 8a–d), which agrees with expectations that no major lateral temperature variations are expected in the lithosphere at 18 Ma.
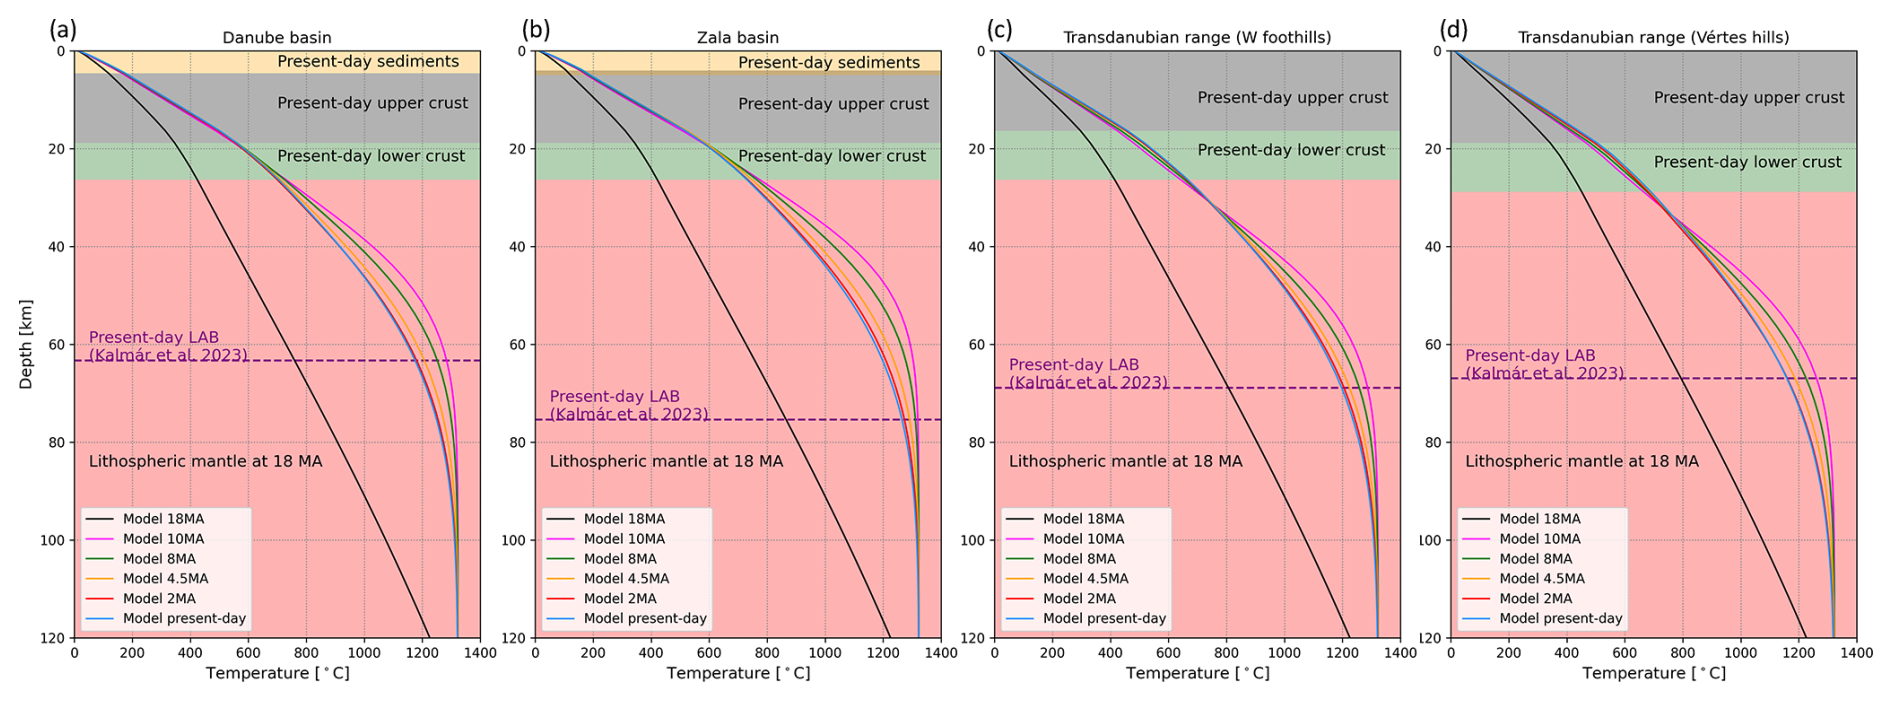
Figure 8Lithosphere temperature–depth profiles in the Danube Basin (a), in the Zala Basin (b), and in two locations within the Transdanubian Range (c: western foothills; d: Vértes hills). Colour-coded lines represent geotherms from different times between 18 Ma–present. The depth extent of major units is also indicated, together with the present-day LAB (dashed purple line) from Kalmár et al. (2023), which is the approximate maximum depth where post-stretching models are considered reliable. For the locations of the profiles, see Fig. 3.
We present the modelled thermal field affected by lithosphere extension for various representative time intervals (10, 8, 4.5, 2, 0 Ma; Fig. 7). All temperature profiles reach 1330 °C at the depth of 120 km associated with the LAB, prescribed as a bottom boundary condition for all models. The actual post-stretching LAB is significantly shallower, as suggested by the 10–0 Ma geotherms. Since heat transport processes are only considered in the lithosphere and not in the asthenosphere, the post-stretching models are only applicable in the thinned lithosphere. The present-day LAB (Kalmár et al., 2023) plotted on each profile therefore indicates the approximate depth until the models can be considered reliable (Fig. 8). The highest temperatures in the lithospheric mantle are attributed to the 10 Ma model (purple line in Fig. 8), representing the thermal state right after extension. Models of 10–0 Ma represent the conductive cooling (thermal relaxation) of the lithosphere. Cooling is combined with the thermal effect of post-rift sedimentation, which is most pronounced at the shallower parts of the models in basinal locations (Fig. 8a, b). Present-day lithosphere temperature predictions, along with the elevated geothermal gradient and surface heat flow of the area (Lenkey et al., 2002), show evidence that the thermal state of the lithosphere has not yet reached steady state.
Present-day modelled temperatures are generally (slightly) elevated in basinal areas than the peripheral locations throughout the entire lithosphere (Figs. 8 and 9). Higher temperatures in the Danube Basin through the temperature profile in Fig. 9 represent the combined effect of lithosphere extension (controlling the thermal field in the mantle lithosphere) and sediment blanketing (having major influence in the crustal thermal field). Elevated deep-lithosphere temperatures in the Danube Basin can be explained by higher subcrustal thinning (Fig. 5b). Lithosphere temperatures reach 1200 °C at a depth of around 70 km, which agrees with the average LAB depth along the section (Kalmár et al., 2023).
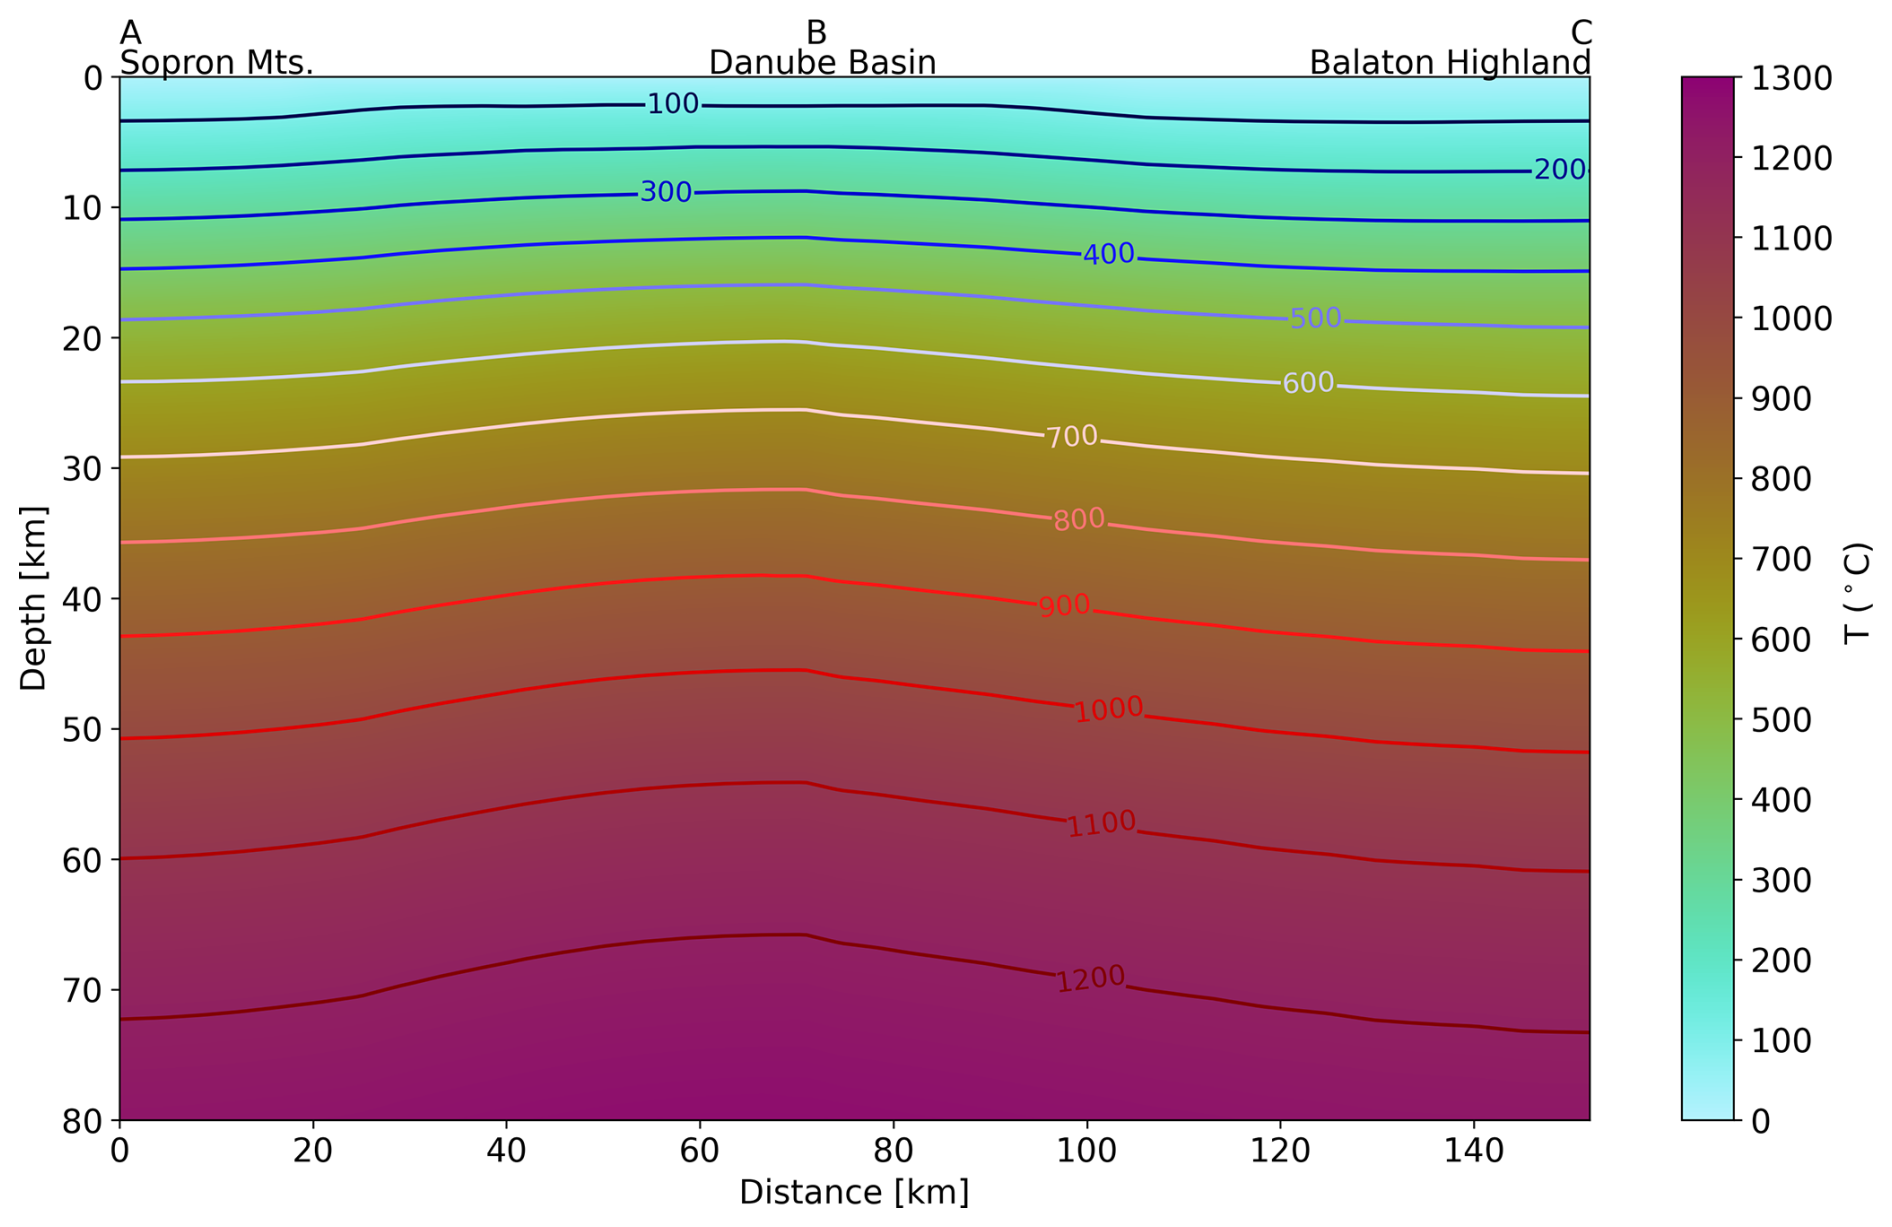
Figure 9Lithosphere temperature cross-section representing present-day predicted temperatures from the Sopron Mts. through the Danube Basin to the Balaton Highland. For the location of the section, see Fig. 3.
5.1 Model uncertainties and limitations
To quantify the added value of the inversion procedure through updating the subcrustal stretching factor (β), we compared the overall misfit between modelled and observed temperatures of the present day prior (β= 4) and posterior model (inversion with spatial variation in β). Through the inversion, the median misfit has decreased from −3.13 to −0.64 °C. The RMS of the posterior model also decreased from 1.53 to 1.35, but this decrease is less significant. More significant improvements of the misfit, especially in terms of the RMS where positive and negative errors do not cancel out, could be achieved by updating the thermal properties of the shallower part of the model (e.g. thermal conductivity of sediments, radiogenic heat generation in the upper crust). This exercise was excluded from the current study, as here we focus mainly on lithospheric-scale thermal processes and thermal evolution of the lithosphere, which is primarily captured by the crustal and subcrustal stretching factors.
We tested the influence of initial crustal and lithosphere thickness and the selection of the prior subcrustal stretching factors to modelled temperatures by performing a sensitivity analysis (Appendix A). This was necessary to select realistic input parameters. The initial crustal thickness of 35, 40, and 45 km and the initial lithospheric thickness of 120, 135, and 150 km were tested, with constant prior β values of 2, 3, and 4 (Table A1). All models showed the smallest RMS misfit with the highest tested β, while the influence of initial crustal and lithosphere thickness on resulting temperature predictions and associated RMS errors was less significant (Table A1, Fig. A1). Therefore, β= 4 was used as the final prior model presented in this study (corresponding to Model 2c in the parameter test; Appendix A). The uncertainty of posterior β values resulting from the inversion procedure is estimated in terms of standard deviation (Békési et al., 2024), with values up to 1.2. The standard deviation of beta values therefore provides a qualitative estimate of uncertainty in the relationship of observed temperatures and subcrustal lithosphere model effects. It is important to note that standard deviations cannot fully capture the overall uncertainty of the estimated subcrustal stretching due to further model input parameter selections based on assumptions, and this is discussed in the following paragraph.
The prior and posterior models represent a specific case where several input parameters (initial conditions, thermal parameters, sedimentation rates, crustal stretching) were fixed. The selection of these parameters was performed carefully, as the uncertainties of these input assumptions cannot be neglected; therefore the resulting model predicts lithosphere temperatures that are specific to this case. The most important simplifications are (1) a uniform timing of the extension for the entire study area, (2) the application of a constant sedimentation rate, (3) uniform upper- and lower-crustal stretching factors, (4) the indirect consideration of the basin inversion stage, and (5) the neglection of fluid flow (the thermal field is purely conductive). Extension started and ceased significantly earlier in the Danube Basin (Šujan et al., 2021) compared to the Zala Basin and the Transdanubian Range (Fodor et al., 2021). The neglection of this difference in the timing of rifting could potentially result, for instance, in the underestimation of subcrustal stretching in the Danube Basin. The assumption of a constant sedimentation rate is valid for the basinal areas of the model but is not fully valid for basin peripheries, where erosion due to basin inversion took place (e.g. Szafián et al., 1999). This assumption can therefore result in more uncertain temperature and stretching factor predictions in the basin peripheries, most importantly in the Rechnitz core complex (Fig. 5), likely also affected by different upper- and lower-crustal stretching. Still, the geometry and structure of the uplifted basin margins were taken into account by the present-day crustal geometry that is used as a model input, which has the most important influence on the resulting thermal field. Further effects of the neotectonic inversion on the temperature field were considered negligible, due to the minor amount of shortening and thickening of the crust (Porkoláb et al., 2023). The neglection of fluid flow mainly concerns the shallow part of the model, most importantly in fractured/karstified carbonates (Fig. 6), where the conductive temperature field is disturbed by regional-scale groundwater flow (e.g. Mádl-Szőnyi and Tóth, 2015); therefore the modelled temperatures cannot be considered reliable. Furthermore, models could be improved and validated by incorporating vitrinite reflectance data from wells, but this option has not yet been implemented in the modelling workflow.
5.2 Implications for the thermal evolution of the lithosphere
Royden et al. (1983) suggested that the elevated heat flow and geothermal gradient in the Pannonian Basin can only be explained if the mantle lithosphere attenuation was more pronounced than crustal stretching (β > δ). Crustal and subcrustal stretching factors calculated by Lenkey (1999) largely support this finding, while they predict large variations in subcrustal stretching in the study area, extending from β= 1 in the Balaton Highland to β= 3.5 in the Zala Basin. Predicted subcrustal stretching in this study for the same area represents generally higher β values between 2.5–6 (Fig. 5b). Posterior β values are generally higher in basins (Zala Basin, Danube Basin) than in basin margins. The estimated subcrustal stretching is highest in the Zala Basin (up to ∼ 6), while β is slightly lower (∼ 5) in the Danube Basin. This does not necessarily mean that lithosphere thinning was less pronounced but can also be due to the fact that extension in the NW part of the study area happened earlier compared to the Zala Basin and the Transdanubian Range (Šujan et al., 2021; Fodor et al., 2021). Lower predicted β values in the Danube Basin can simply mean that the thermal relaxation of the lithosphere is in a more advanced stage here, due to the older main stretching phase that is not considered in the model.
Using these crustal and subcrustal stretching factors for mantle lithosphere extension between 18–10 Ma, together with accounting for the thermal effect of sedimentation and changes in upper-crustal heat generation, we were able to reproduce present-day temperature observations representing a conductive thermal regime. It must be noted that the predicted subcrustal stretching might not be entirely correct due to changes in the timing of stretching throughout the study area and further model limitations (Sect. 5.1), but it provides a realistic picture for the degree of lithosphere attenuation for the selected input parameter combinations.
The moderate lateral variations in modelled past and present-day lithosphere temperatures (Figs. 8 and 9) and β field (Fig. 5b) suggest that the lateral variations in the past and present-day lithosphere thickness are rather limited in the study area. This agrees with the LAB depth recently inferred from seismological observations (Kalmár et al., 2023), with predictions between ∼ 60–80 km in the study area (dashed purple lines in Fig. 8 based on Kalmár et al., 2023). Previous LAB depth maps (Horváth et al., 2006; Tari et al., 1999) infer significantly higher values up to ∼ 105 km in the NW part of the study area, while these were constructed based on limited seismological data derived from a lower number of seismic stations compared to Kalmár et al. (2023). Lithosphere-scale thermal models of Lenkey et al. (2017) and Békési et al. (2018) building on the previous LAB depth map may therefore predict inaccurate temperatures deep down in the lithosphere in NW Hungary. We compared the present-day posterior model with one of the temperature models of Békési et al. (2018) incorporating the thermal footprint of extension without actual transient calculations. Lithosphere temperatures below ∼ 10 km depth in Békési et al. (2018) are significantly higher than in the case of the current model, suggesting that steady-state model assumptions to mimic transient thermal processes led to the overestimation of deep-lithosphere temperatures. The predicted post-extension temperature field generally shows a similar trend of evolution to previous studies (e.g. Balázs et al., 2021; Majcin et al., 2015), although direct comparisons with these models were not made due to the different input parameters, modelling approaches, model presentations, and timing of modelled temperatures.
In terms of the shallow (< 5 km) temperature field, predicted temperatures in the Danube Basin and Zala Basin are generally in the range of those presented in Lenkey et al. (2017) and Lenkey et al. (2021), while they are slightly lower than the conductive thermal model predictions in the OGRe database (OGRe, 2020). Additionally, higher lithosphere thickness adopted in Lenkey et al. (2017) on the western periphery of Hungary, discussed in the previous section, might be partly responsible for the lower predicted temperatures also in the shallow sedimentary units of the western periphery of the study area. The thermal model assumes a conductive thermal regime and predicts slightly higher temperatures than the measured and interpolated values (Lenkey et al., 2021) over the Transdanubian Range at 0–2 km depth, where groundwater flow in fractured/karstified carbonates influences/dominates the temperature field (Mádl-Szőnyi and Tóth, 2015; Tóth et al., 2023). The gravity-driven flow system can penetrate deeper into the carbonates (Horváth et al., 2015), while temperature measurements below 2 km are not available to constrain the depth of the flow system. Deeper down in the lithosphere, below the carbonates, we consider past and present-day conductive temperature predictions to be realistic.
Temperature distribution has a major influence on the rheology of the lithosphere. The transient thermal model presented here is significantly more realistic below ca. 10 km depth with respect to previous models (Békési et al., 2018; Limberger et al., 2018); hence, it allows a more precise evaluation of lithosphere rheology. Rheological models based on the presented temperature model show good agreement with seismicity distribution and suggest that lithospheric strength is concentrated in the shallow parts (< 10 km) of the upper crust, which is the only brittle layer in the Pannonian lithosphere (Porkoláb et al., 2025). Another potential implication of the thermal model is to decipher the structure of the lower lithosphere via the understanding of the vertical distribution of upper-mantle-derived rocks. Bakony–Balaton Highland Volcanic Field in the Balaton Highland (Fig. 1) would be a potential case study to constrain the origin of the depths of xenoliths with the help of the geotherms calculated for various times in the past, representing different stages of the thermal evolution of the lithosphere. However, for such studies, a detailed assessment of deep-lithosphere temperatures and uncertainties is required, considering a wide range of possible deep-lithosphere processes that have a major influence on the deep thermal field. Modelled temperatures can provide input for constraining geodynamic processes in the area, and present-day temperature predictions can serve as first-order boundary conditions for geo-energy projects, most importantly for geothermal exploration.
The presented methodology of incorporating transient thermal effects, using crustal and subcrustal stretching factors, and accounting for sedimentation proved successful in reproducing the most important thermal footprints of basin evolution. The extension of the forward model with the inversion workflow to condition the model with temperature observations provided quantitative measures for the reliability of the models and allowed us to constrain model parameters. Further model uncertainties resulting from the selection of model input parameters were investigated through a sensitivity analysis. Additional model limitations and assumptions that add to the overall uncertainties of the modelled (deep-lithospheric) temperatures and stretching factors are discussed, to provide a more complete picture of model uncertainties. Past and present-day temperature predictions for NW Hungary can be considered realistic within the whole lithosphere, while it should be noted that the predicted thermal field and stretching factors are valid for the specific case of input parameters. The calculated crustal and estimated subcrustal stretching values indicate that (1) subcrustal stretching was indeed much more important than crustal stretching in the Pannonian Basin (at least half of the mantle lithosphere through the study area was attenuated) and that (2) subcrustal stretching affected the study area with higher degrees compared to crustal stretching (the crust at several marginal areas remained (almost) intact, while crustal thickness under basins decreased to more than half of the assumed pre-stretching setting). These findings generally agree with expectations such as the rise of the asthenosphere translates to larger-scale ductile deformation of the lower part of the lithosphere, while the extension through faulting in the brittle (upper) crust is more localized. Additionally, the predicted present-day lithosphere temperatures suggest that the depth of the current LAB is relatively homogenous, supporting the new seismological model of Kalmár et al. (2023). The presented methodology can be adopted and applied to model the thermal evolution of sedimentary basins worldwide. The resulting past and present-day temperature predictions can further be used to constrain geodynamic processes, rheological models, and the structure of the lithosphere in the study area and provide first-order input for geothermal exploration.
Table A1Overview of the sensitivity analysis for initial crustal and lithospheric thickness and subcrustal stretching factors and the resulting model errors (RMS). n/a: not applicable
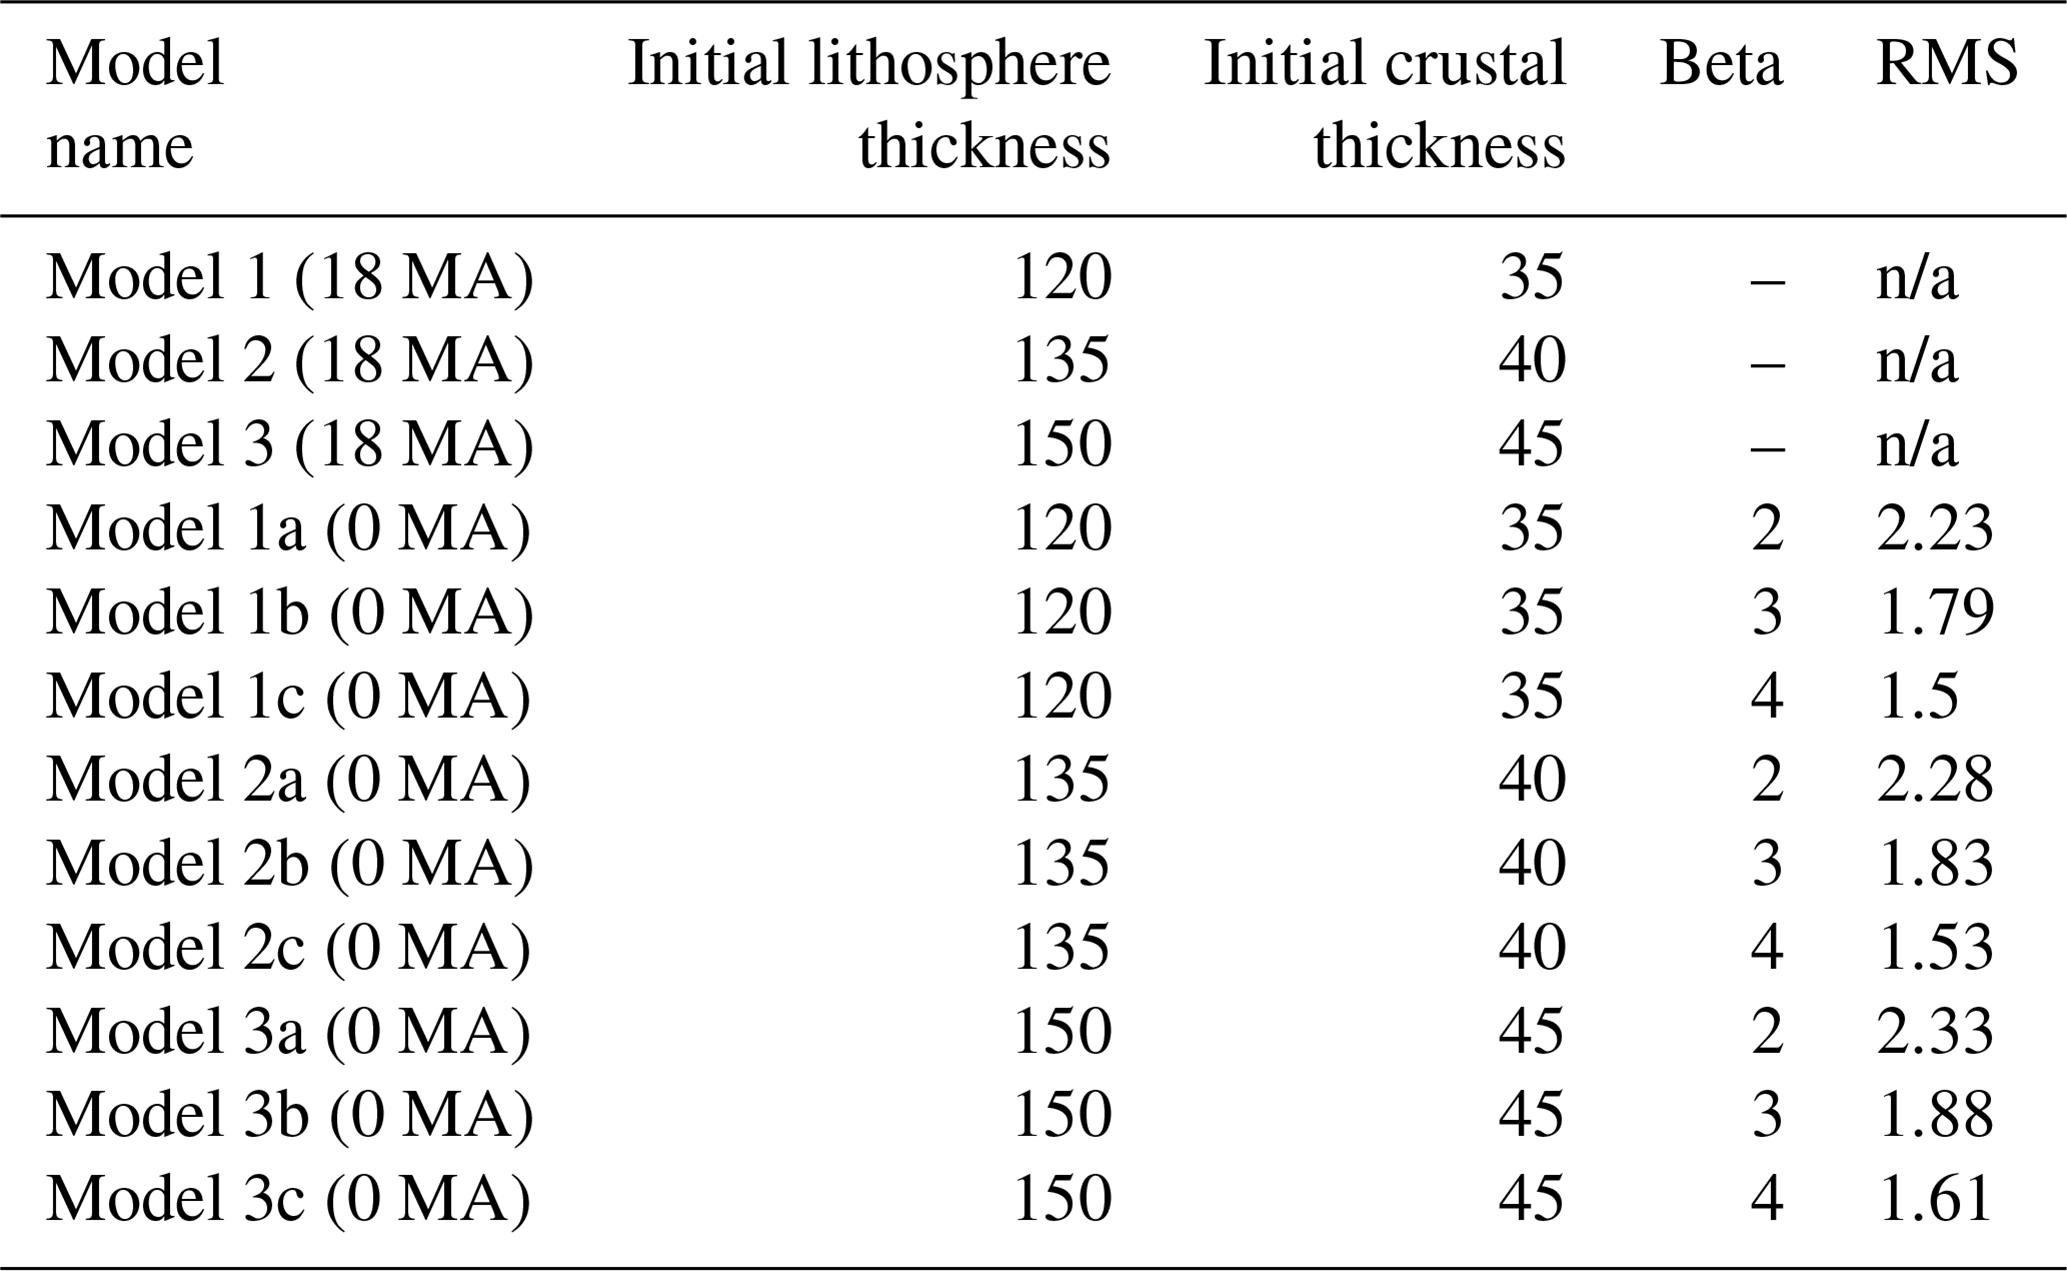
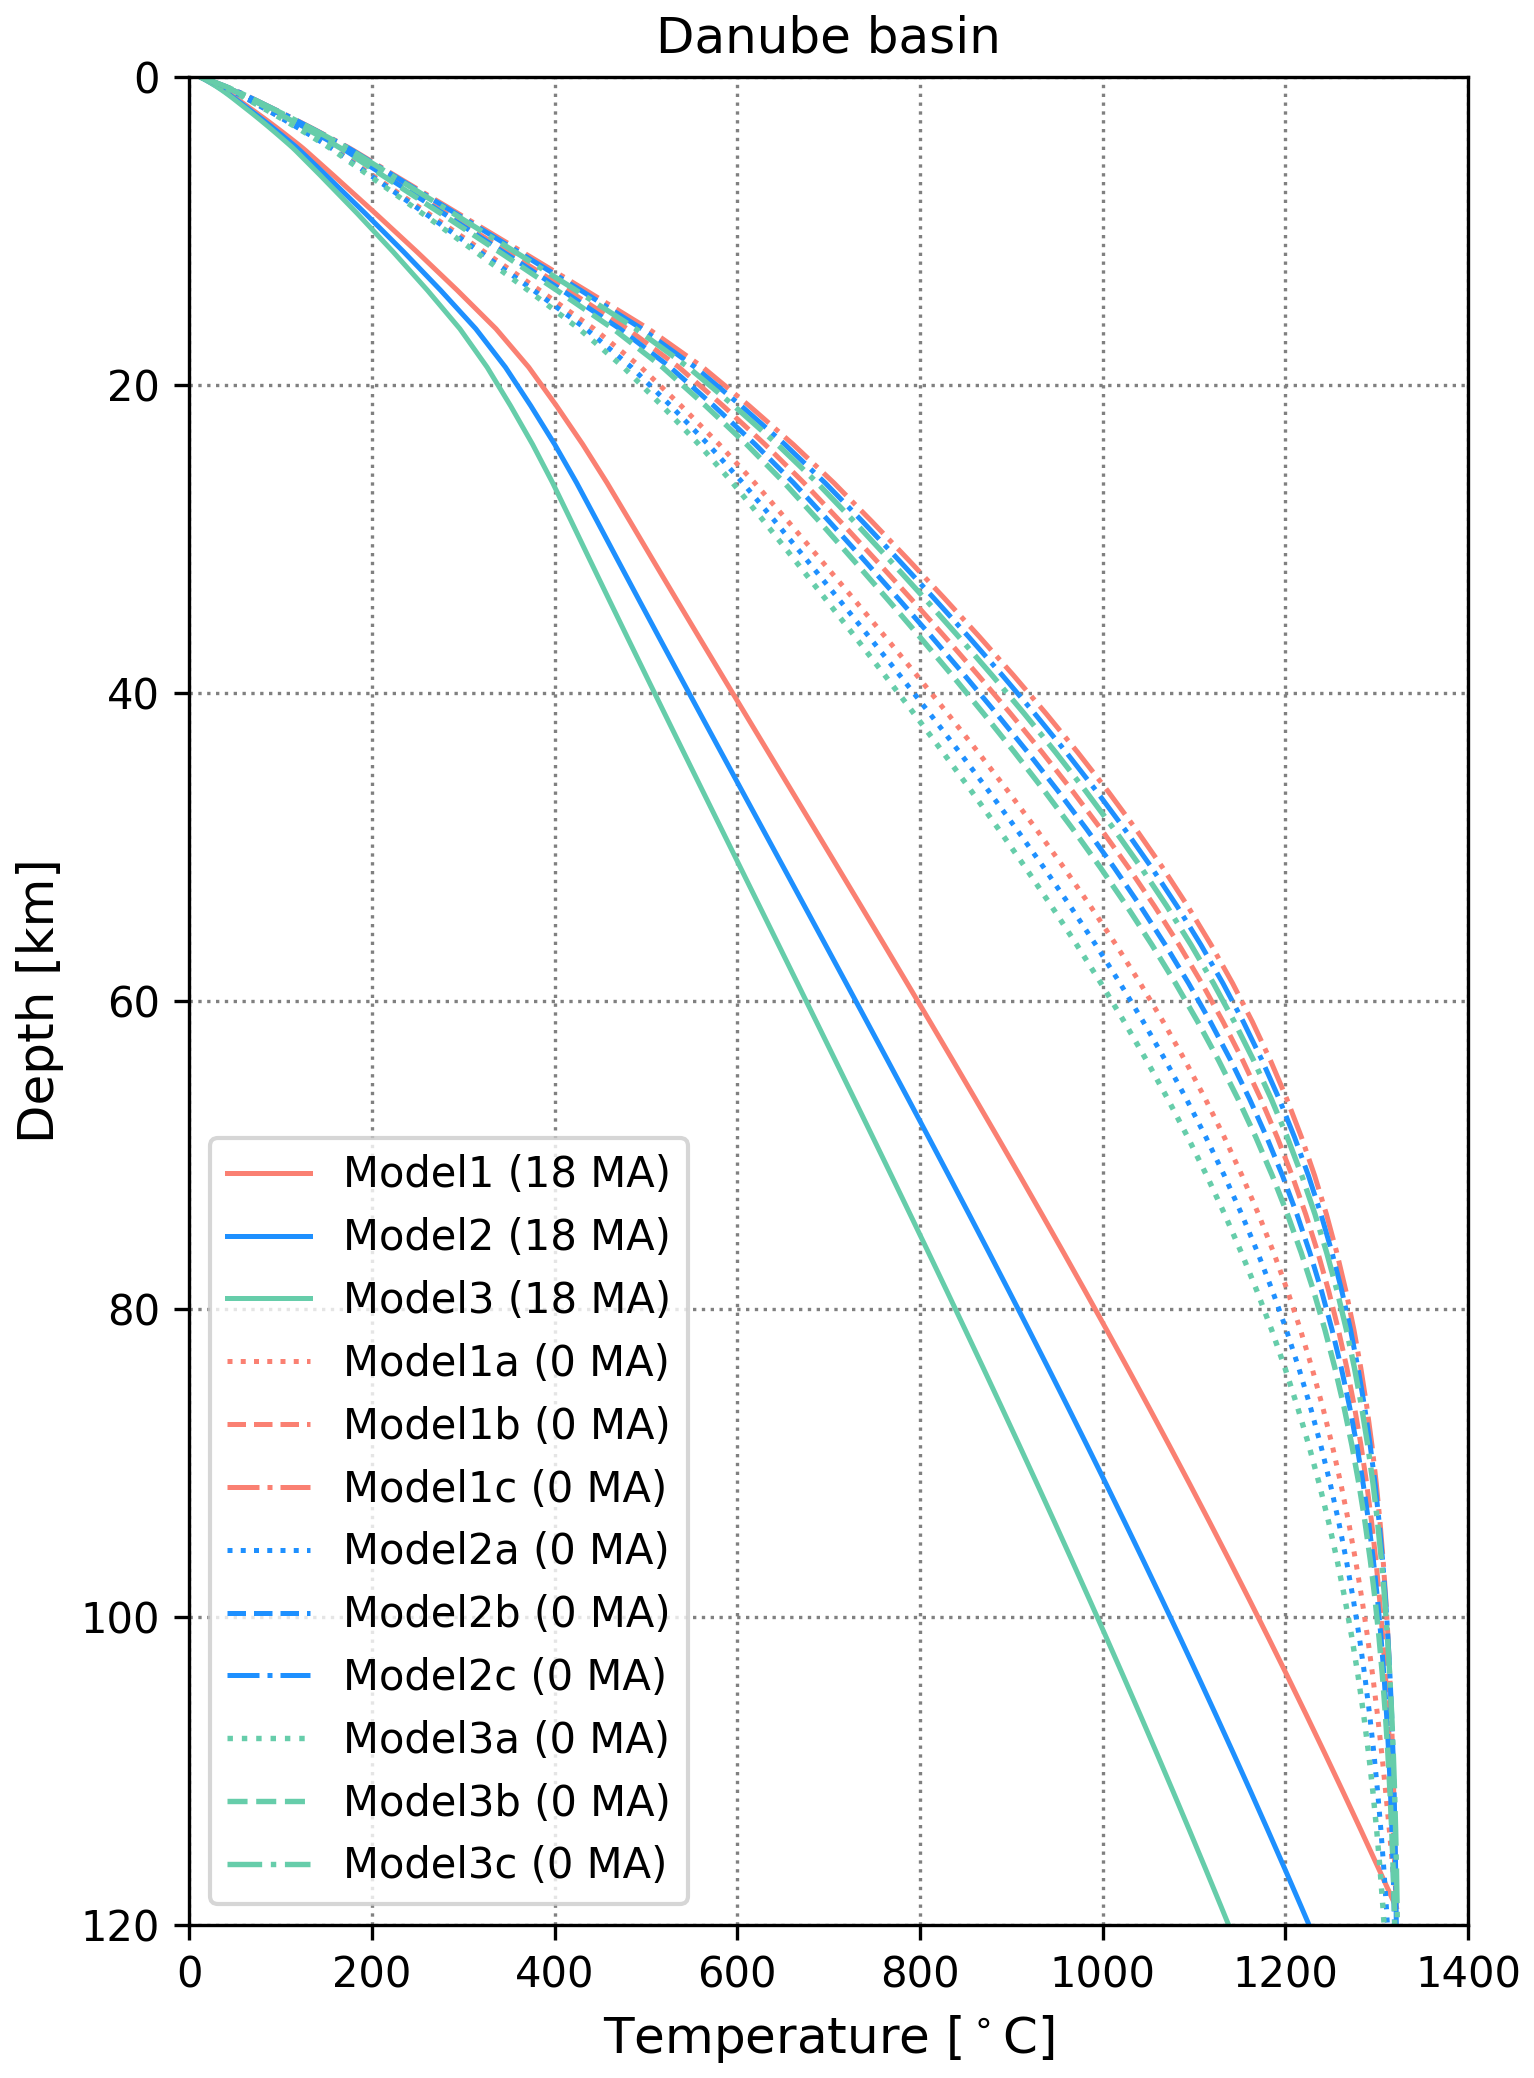
Figure A1Resulting temperature profiles of the sensitivity analysis at the location of the Danube Basin (for location, see Fig. 3).
Figures were created with QGIS, Inkscape, and Python, using the scientific colour maps (when applicable) of Fabio Crameri (https://doi.org/10.5281/zenodo.1243862, Crameri, 2018).
Temperature models are deposited in Mendeley, with the following accession link: https://doi.org/10.17632/vp7jdp79y4.1 (Békési et al., 2024).
EB: conceptualization, investigation, methodology, validation, visualization, and writing (original draft and review and editing. JDvW: conceptualization, methodology, resources, software, supervision, validation, roles (original draft), and writing (review and editing). KP: conceptualization, visualization, roles (original draft), and writing (review and editing). MH: writing (review and editing). MB: conceptualization, investigation, project administration, resources, roles (original draft), and writing (review and editing).
The contact author has declared that none of the authors has any competing interests.
Publisher’s note: Copernicus Publications remains neutral with regard to jurisdictional claims made in the text, published maps, institutional affiliations, or any other geographical representation in this paper. While Copernicus Publications makes every effort to include appropriate place names, the final responsibility lies with the authors.
We thank the editor and reviewers for their work on this paper.
This research has been supported by the Hungarian Academy of Sciences (grant no. LP2022-2/2022) and the National Research, Development and Innovation Fund, Hungary (grant no. PD147116).
This paper was edited by Patrice Rey and reviewed by László Lenkey and one anonymous referee.
Babinszki, E., Piros, O., Budai, T., Gyalog, L., Halász, A., Király, E., Haranginé Lukács, R., and M Tóth, T.: Litostratigraphic Units of Hungary I. Precainozoic Formations, Supervisory Authority for Regulatory Affairs Hungary, Budapest, http://publicatio.bibl.u-szeged.hu/id/eprint/35296 (last access: 12 July 2024), ISBN 9789636713331, 2024a.
Babinszki, E., Piros, O., Csillag, G., Fodor, L., Gyalog, L., Kercsmár, Z., Less, G., Lukács, R., Sebe, K., and Selmeczi, I.: Litostratigraphic Units of Hungary II. Cenozoic Formations, Supervisory Authority for Regulatory Affairs Hungary, Budapest, https://sztfh.hu/downloads/foldtan/cenozoic_online.pdf (last access: 12 July 2024), ISBN 9789636713362, 2024b.
Bada, G., Horváth, F., Dövényi, P., Szafián, P., Windhoffer, G., and Cloetingh, S.: Present-day stress field and tectonic inversion in the Pannonian basin, Global Planet. Change, 58, 165–180, https://doi.org/10.1016/j.gloplacha.2007.01.007, 2007.
Balázs, A., Matenco, L., Magyar, I., Horváth, F., and Cloetingh, S.: The link between tectonics and sedimentation in back-arc basins: New genetic constraints from the analysis of the Pannonian Basin, Tectonics, 35, 1526–1559, https://doi.org/10.1002/2015TC004109, 2016.
Balázs, A., Maţenco, L., Granjeon, D., Alms, K., François, T., and Sztanó, O.: Towards stratigraphic-thermo-mechanical numerical modelling: Integrated analysis of asymmetric extensional basins, Global Planet. Change, 196, 103386, https://doi.org/10.1016/j.gloplacha.2020.103386, 2021.
Békési, E., Lenkey, L., Limberger, J., Porkoláb, K., Balázs, A., Bonté, D., Vrijlandt, M., Horváth, F., Cloetingh, S., and van Wees, J.-D.: Subsurface temperature model of the Hungarian part of the Pannonian Basin, Global Planet. Change, 171, 48–64, https://doi.org/10.1016/j.gloplacha.2017.09.020, 2018.
Békési, E., Struijk, M., Bonté, D., Veldkamp, H., Limberger, J., Fokker, P. A., Vrijlandt, M., and van Wees, J.-D.: An updated geothermal model of the Dutch subsurface based on inversion of temperature data, Geothermics, 88, 101880, https://doi.org/10.1016/j.geothermics.2020.101880, 2020.
Békési, E., Porkoláb, K., Wesztergom, V., and Wéber, Z.: Updated stress dataset of the Circum-Pannonian region: Implications for regional tectonics and geo-energy applications, Tectonophysics, 856, 229860, https://doi.org/10.1016/j.tecto.2023.229860, 2023.
Békési, E., van Wees, J. D., Porkoláb, K., Hencz, M., and Berkesi, M.: Lithosphere temperature models for NW Hungary, Mendeley Data [data set], https://doi.org/10.17632/vp7jdp79y4.1, 2024.
Bonté, D., Van Wees, J.-D., and Verweij, J.: Subsurface temperature of the onshore Netherlands: new temperature dataset and modelling, Neth. J. Geosci., 91, 491–515, https://doi.org/10.1017/S0016774600000354, 2012.
Buck, W. R., Martinez, F., Steckler, M. S., and Cochran, J. R.: Thermal consequences of lithospheric extension: pure and simple, Tectonics, 7, 213–234, 1988.
Budai, T., Császár, G., Csillag, G., Dudko, A., Koloszár, L., and Majoros, G.: The geology of the Balaton Highland, Geological Institute of Hungary, Budapest, Hungary, 257 pp., ISBN 9636712247, 1999.
Chapman, D.: Thermal gradients in the continental crust, Geological Society, London, Special Publications, 24, 63–70, https://doi.org/10.1144/GSL.SP.1986.024.01.07, 1986.
Cloetingh, S., Van Wees, J. D., Ziegler, P., Lenkey, L., Beekman, F., Tesauro, M., Förster, A., Norden, B., Kaban, M., and Hardebol, N.: Lithosphere tectonics and thermo-mechanical properties: an integrated modelling approach for Enhanced Geothermal Systems exploration in Europe, Earth-Sci. Rev., 102, 159–206, https://doi.org/10.1016/j.earscirev.2010.05.003, 2010.
Corver, M. P., Doust, H., van Wees, J. D., Bada, G., and Cloetingh, S.: Classification of rifted sedimentary basins of the Pannonian Basin System according to the structural genesis, evolutionary history and hydrocarbon maturation zones, Mar. Petrol. Geol., 26, 1452–1464, https://doi.org/10.1016/j.marpetgeo.2008.12.001, 2009.
Crameri, F.: Scientific colour maps, Zenodo [code], https://doi.org/10.5281/zenodo.1243862, 2018.
Csontos, L. and Nagymarosy, A.: The Mid-Hungarian line: a zone of repeated tectonic inversions, Tectonophysics, 297, 51–71, https://doi.org/10.1016/S0040-1951(98)00163-2, 1998.
Danielson, J. J. and Gesch, D. B.: Global multi-resolution terrain elevation data 2010 (GMTED2010), US Geological Survey, Open-File Report, 2011-1073, 34 pp., https://doi.org/10.3133/ofr20111073, 2011.
Dövényi, P. and Horváth, F.: A Review of Temperature, Thermal Conductivity, and Heat Flow Data for the Pannonian Basin: Chapter 16, in: The Pannonian Basin: A Study in Basin Evolution, Royden, L. H. and Horváth, F., American Association of Petroleum Geologists, https://doi.org/10.1306/M45474C16, 1988.
Dövényi, P., Horváth, F., Liebe, P., Gálfi, J., and Erki, I.: Geothermal conditions of Hungary, Geophys. Transactions, 29, 3–114, 1983.
Dövényi, P., Horváth, F., and Drahos, D.: Geothermal thermic map (Hungary), in: Atlas of geothermal resources in Europe, Office for Official Publications of the European Communities (Luxembourg), 36–38, ISBN 92-828-0999-4, 2002.
Emerick, A. A. and Reynolds, A. C.: Ensemble smoother with multiple data assimilation, Comput. Geosci., 55, 3–15, https://doi.org/10.1016/j.cageo.2012.03.011, 2013a.
Emerick, A. A. and Reynolds, A. C.: Investigation of the sampling performance of ensemble-based methods with a simple reservoir model, Comput. Geosci., 17, 325–350, https://doi.org/10.1007/s10596-012-9333-z, 2013b.
Faccenna, C., Becker, T. W., Auer, L., Billi, A., Boschi, L., Brun, J. P., Capitanio, F. A., Funiciello, F., Horvàth, F., and Jolivet, L.: Mantle dynamics in the Mediterranean, Rev. Geophys., 52, 283–332, https://doi.org/10.1002/2013RG000444, 2014.
Farr, T. G., Rosen, P. A., Caro, E., Crippen, R., Duren, R., Hensley, S., Kobrick, M., Paller, M., Rodriguez, E., and Roth, L.: The shuttle radar topography mission, Rev. Geophys., 45, RG2004, https://doi.org/10.1029/2005RG000183, 2007.
Fodor, L., Bada, G., Csillag, G., Horváth, E., Ruszkiczay-Rüdiger, Z., Palotás, K., Síkhegyi, F., Timár, G., Cloetingh, S., and Horváth, F.: An outline of neotectonic structures and morphotectonics of the western and central Pannonian Basin, Tectonophysics, 410, 15–41, https://doi.org/10.1016/j.tecto.2005.06.008, 2005.
Fodor, L., Uhrin, A., Palotás, K., Selmeczi, I., Tóthné Makk, Á., Rižnar, I., Trajanova, M., Rifelj, H., Jelen, B., and Budai, T.: Geological and structural model of the Mura–Zala Basin and its rims as a basis for hydrogeological analysis, Annual Report of the Geological Institute of Hungary, 2011, 47–92, 2013.
Fodor, L., Balázs, A., Csillag, G., Dunkl, I., Héja, G., Jelen, B., Kelemen, P., Kövér, S., Németh, A., and Nyíri, D.: Crustal exhumation and depocenter migration from the Alpine orogenic margin towards the Pannonian extensional back-arc basin controlled by inheritance, Global Planet. Change, 201, 103475, https://doi.org/10.1016/j.gloplacha.2021.103475, 2021.
Giovanni, B., Guido, C., and Adolfo, F.: Characteristics of geothermal fields in Italy, Giornale di Geologia Applicata, 1, 247–254, 2005.
Grenerczy, G., Sella, G., Stein, S., and Kenyeres, A.: Tectonic implications of the GPS velocity field in the northern Adriatic region, Geophys. Res. Lett., 32, L16311, https://doi.org/10.1029/2005GL022947, 2005.
Haas, J., Budai, T., Csontos, L., Fodor, L., Konrád, G., and Koroknai, B.: Geology of the pre-Cenozoic basement of Hungary, Geological and Geophysical Institute of Hungary, Budapest, Hungary, 71 pp., ISBN 9789636712990, 2014.
Hantschel, T. and Kauerauf, A. I.: Fundamentals of basin and petroleum systems modeling, Springer Science & Business Media, https://doi.org/10.1007/978-3-540-72318-9, 2009.
Héja, G., Ortner, H., Fodor, L., Németh, A., and Kövér, S.: Modes of oblique inversion: A case study from the Cretaceous fold and thrust belt of the western Transdanubian Range (TR), West Hungary, Tectonics, 41, e2021TC006728, https://doi.org/10.1029/2021TC006728, 2022.
Hetényi, G. and Bus, Z.: Shear wave velocity and crustal thickness in the Pannonian Basin from receiver function inversions at four permanent stations in Hungary, J. Seismol., 11, 405–414, https://doi.org/10.1007/s10950-007-9060-4, 2007.
Horváth, F. and Cloetingh, S.: Stress-induced late stage subsidence anomalies in the Pannonian Basin, Tectonophysics, 266, 287–300, https://doi.org/10.1016/S0040-1951(96)00194-1, 1996.
Horváth, F., Bada, G., Szafián, P., Tari, G., Ádám, A., and Cloetingh, S.: Formation and deformation of the Pannonian Basin: constraints from observational data, Geological Society, London, Memoirs, 32, 191–206, https://doi.org/10.1144/GSL.MEM.2006.032.01.11, 2006.
Horváth, F., Musitz, B., Balázs, A., Végh, A., Uhrin, A., Nádor, A., Koroknai, B., Pap, N., Tóth, T., and Wórum, G.: Evolution of the Pannonian basin and its geothermal resources, Geothermics, 53, 328–352, https://doi.org/10.1016/j.geothermics.2014.07.009, 2015.
Kalmár, D., Hetényi, G., Balázs, A., Bondár, I., and Group, A. W.: Crustal thinning from orogen to back-arc basin: The structure of the Pannonian Basin region revealed by P-to-S converted seismic waves, J. Geophys. Res.-Sol. Ea., 126, e2020JB021309, https://doi.org/10.1029/2020JB021309, 2021.
Kalmár, D., Petrescu, L., Stipčević, J., Balázs, A., János Kovács, I., AlpArray, and PACASE Working Groups: Lithospheric Structure of the Circum-Pannonian Region Imaged by S-To-P Receiver Functions, Geochem. Geophy. Geosy., 24, e2023GC010937, https://doi.org/10.1029/2023GC010937, 2023.
Kilényi, É., Kröll, A., Obernauer, D., Sefara, J., Steinhauser, P., Szabó, Z., and Wessely, G., Pre-Tertiary basement contour map of the Carpathian Basin beneath Austria, Czechoslovakia and Hungary: Geophysical Transactions, 36, 15–36, http://epa.niif.hu/02900/02941/00075/pdf/EPA02941_geofizikai_kozlemenyek_1991_36_1-2_015-036.pdf, (last access: 5 July 2024), 1991
Lenkey, L.: Geothermics of the Pannonian basin and its bearing on the tectonics of basin evolution, PhD thesis, Vrije Universiteit, Amsterdam, 215 pp., https://hdl.handle.net/1871.1/2686075b-7e46-4c55-9c44-50ee40f7e984 (last access: 5 July 2024), 1999.
Lenkey, L., Dövényi, P., Horváth, F., and Cloetingh, S.: Geothermics of the Pannonian basin and its bearing on the neotectonics, EGU Stephan Mueller Special Publication Series, 3, 29–40, https://doi.org/10.5194/smsps-3-29-2002, 2002.
Lenkey, L., Raáb, D., Goetzl, G., Lapanje, A., Nádor, A., Rajver, D., Rotár-Szalkai, Á., Svasta, J., and Zekiri, F.: Lithospheric scale 3D thermal model of the Alpine–Pannonian transition zone, Acta Geod. Geophys., 52, 161–182, https://doi.org/10.1007/s40328-017-0194-8, 2017.
Lenkey, L., Mihályka, J., and Paróczi, P.: Review of geothermal conditions of Hungary, Földtani Közlöny, 151, 65–65, https://doi.org/10.23928/foldt.kozl.2021.151.1.65, 2021.
Limberger, J., van Wees, J.-D., Tesauro, M., Smit, J., Bonté, D., Békési, E., Pluymaekers, M., Struijk, M., Vrijlandt, M., Beekman, F., and Cloetingh, S.: Refining the thermal structure of the European lithosphere by inversion of subsurface temperature data, Global Planet. Change, 171, 18–47, https://doi.org/10.1016/j.gloplacha.2018.07.009, 2018.
Mádl-Szőnyi, J. and Tóth, Á.: Basin-scale conceptual groundwater flow model for an unconfined and confined thick carbonate region, Hydrogeol. J., 23, 1359–1380, https://doi.org/10.1007/s10040-015-1274-x, 2015.
Majcin, D., Bilčík, D., and Klučiar, T.: Thermal state of the lithosphere in the Danube Basin and its relation to tectonics, Contributions to Geophysics and Geodesy, 45, 193–218, https://doi.org/10.1515/congeo-2015-0020, 2015.
Mendrinos, D., Choropanitis, I., Polyzou, O., and Karytsas, C.: Exploring for geothermal resources in Greece, Geothermics, 39, 124–137, https://doi.org/10.1016/j.geothermics.2009.11.002, 2010.
Mihályka, J., Paróczi, P., Balázs, L., Drahos, D., and Lenkey, L.: Thermal conductivity of sediments from well-logs and its application to determine heat flow density in the Pannonian Basin, Hungary, Tectonophysics, 868, 230095, https://doi.org/10.1016/j.tecto.2023.230095, 2023.
OGRe: Geothermals Information System, MBFSZ, https://map.hugeo.hu/ogre_en/ (last access: 5 July 2024), 2020.
Petersen, K., Armitage, J., Nielsen, S., and Thybo, H.: Mantle temperature as a control on the time scale of thermal evolution of extensional basins, Earth Planet. Sc. Lett., 409, 61–70, https://doi.org/10.1016/j.epsl.2014.10.043, 2015.
Porkoláb, K., Broerse, T., Kenyeres, A., Békési, E., Tóth, S., Magyar, B., and Wesztergom, V.: Active tectonics of the Circum-Pannonian region in the light of updated GNSS network data, Acta Geod. Geophys., 58, 149–173, https://doi.org/10.1007/s40328-023-00409-8, 2023.
Porkoláb, K., Békési, E., Győri, E., Broerse, T., Czecze, B., Kenyeres, A., Tari, G., and Wéber, Z.: Present-day stress field, strain rate field and seismicity of the Pannonian region: overview and integrated analysis, Geological Society, London, Special Publications, 554, SP554-2023-2219, https://doi.org/10.1144/SP554-2023-219, 2025.
Ranalli, G. and Rybach, L.: Heat flow, heat transfer and lithosphere rheology in geothermal areas: features and examples, J. Volcanol. Geoth. Res., 148, 3–19, https://doi.org/10.1016/j.jvolgeores.2005.04.010, 2005.
Royden, L. and Keen, C.: Rifting process and thermal evolution of the continental margin of eastern Canada determined from subsidence curves, Earth Planet. Sc. Lett., 51, 343–361, https://doi.org/10.1016/0012-821X(80)90216-2, 1980.
Royden, L., Horváth, F., Nagymarosy, A., and Stegena, L.: Evolution of the Pannonian basin system: 2. Subsidence and thermal history, Tectonics, 2, 91–137, https://doi.org/10.1029/TC002i001p00091, 1983.
Schatz, J. F. and Simmons, G.: Thermal conductivity of earth materials at high temperatures, J. Geophys. Res., 77, 6966–6983, https://doi.org/10.1029/JB077i035p06966, 1972.
Schmid, S. M., Bernoulli, D., Fügenschuh, B., Matenco, L., Schefer, S., Schuster, R., Tischler, M., and Ustaszewski, K.: The Alpine-Carpathian-Dinaridic orogenic system: correlation and evolution of tectonic units, Swiss J. Geosci., 101, 139–183, https://doi.org/10.1007/s00015-008-1247-3, 2008.
Sekiguchi, K.: A method for determining terrestrial heat flow in oil basinal areas, Tectonophysics, 103, 67–79, https://doi.org/10.1016/0040-1951(84)90075-1, 1984.
Šujan, M., Rybár, S., Kováč, M., Bielik, M., Majcin, D., Minár, J., Plašienka, D., Nováková, P., and Kotulová, J.: The polyphase rifting and inversion of the Danube Basin revised, Global Planet. Change, 196, 103375, https://doi.org/10.1016/j.gloplacha.2020.103375, 2021.
Szafián, P., Tari, G., Horváth, F., and Cloetingh, S.: Crustal structure of the Alpine–Pannonian transition zone: a combined seismic and gravity study, Int. J. Earth Sci., 88, 98–110, https://doi.org/10.1007/s005310050248, 1999.
Szalay, Á.: A rekonstrukciós szemléletű földtani kutatás lehetőségei a szénhidrogén perspektívák előrejelzésében a DK-Alföld neogén süllyedékek területén (Possibilities of conceptual hydrocarbon exploration based on dynamic structural restoration in the prediction of hydrocarbon potential of Neogene depocenters in SE Hungary), Hungarian Academy of Sciences, Budapest, 1982.
Sztanó, O., Kovac, M., Magyar, I., Sujan, M., Fodor, L., Uhrin, A., Rybár, S., Csillag, G., and Tőkés, L.: Late Miocene sedimentary record of the Danube/Kisalföld Basin: interregional correlation of depositional systems, stratigraphy and structural evolution, Geol. Carpath., 67, 525–542, https://doi.org/10.1515/geoca-2016-0033, 2016.
Tari, G., Dövényi, P., Dunkl, I., Horváth, F., Lenkey, L., Stefanescu, M., Szafián, P., and Tóth, T.: Lithospheric structure of the Pannonian basin derived from seismic, gravity and geothermal data, Geological Society, London, Special Publications, 156, 215–250, https://doi.org/10.1144/GSL.SP.1999.156.01.12, 1999.
Tari, G., Arbouille, D., Schléder, Z., and Tóth, T.: Inversion tectonics: a brief petroleum industry perspective, Solid Earth, 11, 1865–1889, https://doi.org/10.5194/se-11-1865-2020, 2020.
Tari, G., Bada, G., Beidinger, A., Csizmeg, J., Danišik, M., Gjerazi, I., Grasemann, B., Kováč, M., Plašienka, D., and Šujan, M.: The connection between the Alps and the Carpathians beneath the Pannonian Basin: Selective reactivation of Alpine nappe contacts during Miocene extension, Global Planet. Change, 197, 103401, https://doi.org/10.1016/j.gloplacha.2020.103401, 2021.
Tari, G. C.: Alpine tectonics of the Pannonian Basin, Rice University, PhD thesis, Rice University, Huston, Texas, United States, 510 pp., https://www.researchgate.net/profile/Gabor-Tari/publication/236449756_Alpine_Tectonics_of_the_Pannonian_Basin/links/56a0041908ae2c638eb7d7ae/Alpine-Tectonics-of-the-Pannonian-Basin.pdf (last access: 1 February 2024), 1994.
Tóth, Á., Baják, P., Szijártó, M., Tiljander, M., Korkka-Niemi, K., Hendriksson, N., and Mádl-Szőnyi, J.: Multimethodological Revisit of the Surface Water and Groundwater Interaction in the Balaton Highland Region – Implications for the Overlooked Groundwater Component of Lake Balaton, Hungary, Water, 15, 1006, https://doi.org/10.3390/w15061006, 2023.
Van Wees, J., Van Bergen, F., David, P., Nepveu, M., Beekman, F., Cloetingh, S., and Bonté, D.: Probabilistic tectonic heat flow modeling for basin maturation: Assessment method and applications, Mar. Petrol. Geol., 26, 536–551, https://doi.org/10.1016/j.marpetgeo.2009.01.020, 2009.
Verwer, J. G.: Explicit Runge-Kutta methods for parabolic partial differential equations, Appl. Numer. Math., 22, 359–379, https://doi.org/10.1016/S0168-9274(96)00022-0, 1996.
Xie, X. and Heller, P. L.: Plate tectonics and basin subsidence history, Geol. Soc. Am. Bull., 121, 55–64, https://doi.org/10.1130/B26398.1, 2009.
Xu, Y., Shankland, T. J., Linhardt, S., Rubie, D. C., Langenhorst, F., and Klasinski, K.: Thermal diffusivity and conductivity of olivine, wadsleyite and ringwoodite to 20 GPa and 1373 K, Phys. Earth Planet. In., 143, 321–336, https://doi.org/10.1016/j.pepi.2004.03.005, 2004.