the Creative Commons Attribution 4.0 License.
the Creative Commons Attribution 4.0 License.
 | 14 Jul 2025
The size distributions of fractures and earthquakes: implications for orogen-internal seismogenic deformation
Sandro Truttmann
Tobias Diehl
Marco Herwegh
Stefan Wiemer
Pre-existing geological discontinuities such as faults and fractures represent structural and mechanical discontinuities in rocks which influence earthquake processes. As earthquakes occur in the subsurface, seismogenic reactivation of pre-existing fracture networks is difficult to investigate in natural settings. However, it is well-known that there exists a physical link between both fractures and earthquakes since an earthquake's magnitude is related to the ruptured fracture area and therefore fracture length. Furthermore, fractures and earthquakes exhibit similar statistical properties, as their size distributions follow power laws.
In this study, we exploit the relation between the size (or length) distributions of pre-existing fractures and earthquakes to decipher the seismic deformation processes within the exhumation-related orogen-internal setting of the southwestern Swiss Alps, which due to its well-monitored seismic activity and the excellent outcrop conditions provides an ideal study site. Characterizing exhumed fracture networks from different tectonic units based on multi-scale drone-based mapping, we find that power law exponents of 3D fracture size distributions generally range between 3 and 3.6. Comparing these values with the depth-dependent exponents of estimated earthquake rupture lengths, we observe significantly larger values of 5 to 8 for earthquake ruptures at shallow depths (< 3 km below sea level (b.s.l.)). At intermediate crustal depths (∼ 3 to 9 km b.s.l.), the power law exponents of fractures and earthquakes appear to be similar. These findings imply depth-dependent differences in the seismogenic reactivation of pre-existing fractures in the study region: while partial rupturing is the prevailing deformation mechanism at shallow depths, fractures are more likely to rupture along their entire length at intermediate crustal depths. Therefore, the present-day near-surface differential stresses are likely insufficient to rupture entire pre-existing fractures seismogenically. Our findings have direct implications for seismic hazard considerations, as earthquakes that rupture along entire fractures appear to become less likely with decreasing depth.
- Article
(9393 KB) - Full-text XML
-
Supplement
(815 KB) - BibTeX
- EndNote


Within the Earth's crust, the occurrence of earthquakes is commonly attributed to the reactivation of pre-existing geological discontinuities, commonly referred to as fractures. Nevertheless, in regions characterized by extensive fracturing and scattered seismic activity, like in collisional orogens such as the Alps, the task of assigning earthquakes to specific fracture segments becomes notably complex. This challenge limits our ability to decipher the current deformation processes and discern the significance of such intricate pre-existing fracture networks in influencing the underlying seismic events.
Despite their complexity, fractures in nature often appear qualitatively self-similar at different scales. This qualitative self-similarity can be quantified by power law distributions, which inherently implies scale invariance and thus the absence of a characteristic length scale. This means that, strictly speaking, fracture segments do not have a unique length but that a measure of the length of a fracture is always dependent on the scale of observation. Previous studies have shown that a power law is best suited for describing the size (or length) distribution of natural fracture traces (Odling, 1997; Bonnet et al., 2001; Torabi and Berg, 2011; Yielding et al., 1996; Davy et al., 2010; Scholz, 2019), even if other types such as exponential or log-normal distributions have been proposed (Cowie et al., 1995, 1993; Ackermann et al., 2001; Nicol et al., 1996). A power law distribution defines the number n of features of a given length l as
where α represents the power law exponent (i.e., the slope of the linear trend in a log–log plot), and c denotes the density constant. The power law exponent α is of main interest herein, since it measures the relative proportion of short and long features (Davy, 1993; Pickering et al., 1995). As fracture data are often acquired at a single mapping scale, a major problem for the identification of power law distributions is the limited dynamic length range of the fracture traces and the uncertainties related to sampling bias, which can lead to size distributions that appear to deviate from power laws (Odling, 1997; Scholz, 2007, 2019; Torabi and Berg, 2011).
Similar to fractures, it is well-known that earthquake magnitudes follow power law distributions, often referred to as the Gutenberg–Richter law (Gutenberg and Richter, 1944) or magnitude–frequency distribution, implying that also earthquakes are scale invariant. As proposed by Hatton et al. (1993), “the observed fractal nature of both fracture length distributions and earthquake magnitude–frequency distributions suggest that there may be a relationship between the structure of active fracture systems and the resulting seismicity.” This is supported by the fact that the statistical properties of micro-fracturing at the laboratory scale are similar to those of earthquakes (e.g., Scholz, 1968; Mogi, 1962). Furthermore, fractures represent the geometrical anisotropies that provide planes of weakness within the rock masses and are thus most likely to be reactivated seismically if suitably oriented with respect to the local stress field. Fractures and earthquakes can thus be regarded as the long- and short-timescale phenomena of brittle tectonics (Scholz, 2019), and there should exist an inherent relation between the size distributions of fractures and earthquakes (Scholz, 1998; Turcotte, 1997). However, the relationship between these size distributions in natural datasets has so far received little attention, mainly due to the challenging acquisition of reliable quantitative information of fracture networks due to limited outcrop conditions and small dynamic range. The southwestern Swiss Alps, with (i) a long-lasting exhumation history of about 20×106 years (e.g., Egli et al., 2017; Herwegh et al., 2020; Boutoux et al., 2016; Cardello et al., 2024), (ii) well-preserved extensive Neogene faulting in high-Alpine regions with formation depths similar to the present-day earthquakes (Cardello and Mancktelow, 2015; Huggenberger and Aebli, 1989; Cardello et al., 2024), (iii) an increased and exceptionally well-recorded seismic activity (e.g., Diehl et al., 2021a; Lee et al., 2023), and (iv) ongoing vertical tectonics (e.g., Ustaszewski and Pfiffner, 2008; Brockmann et al., 2012; Herwegh et al., 2024; Piña-Valdés et al., 2022) implying a similar stress field to the time of fracture formation, provide a unique natural laboratory to investigate the link between the size distributions of fractures and earthquakes. Owing to the abundant occurrence of thermal springs, the region is also a potential target for the exploitation of geothermal energy, where knowledge of faulting at depth and constraints on the potential risks of induced seismicity are critical.
Herein, we explore the relation between the size distributions of fractures (fracture length) and earthquakes (rupture length) and its implications for orogen-internal seismogenic deformation in the exhumation-related (vertical) tectonic setting of the Rawil depression region (southwestern Swiss Alps) (Fig. 1). We use field observations and drone-based fracture trace mapping on multiple scales to quantitatively characterize the size and orientation distributions of fracture networks in different tectonic units. We employ a multi-scale power law fitting approach on the fracture network data, which allows us to expand the limited dynamic length range of single-scale observations. We then exploit the relationship of the fracture orientation and size distributions with similar properties of the recent seismic activity and discuss the implications for seismogenic fracture reactivation processes in the subsurface.
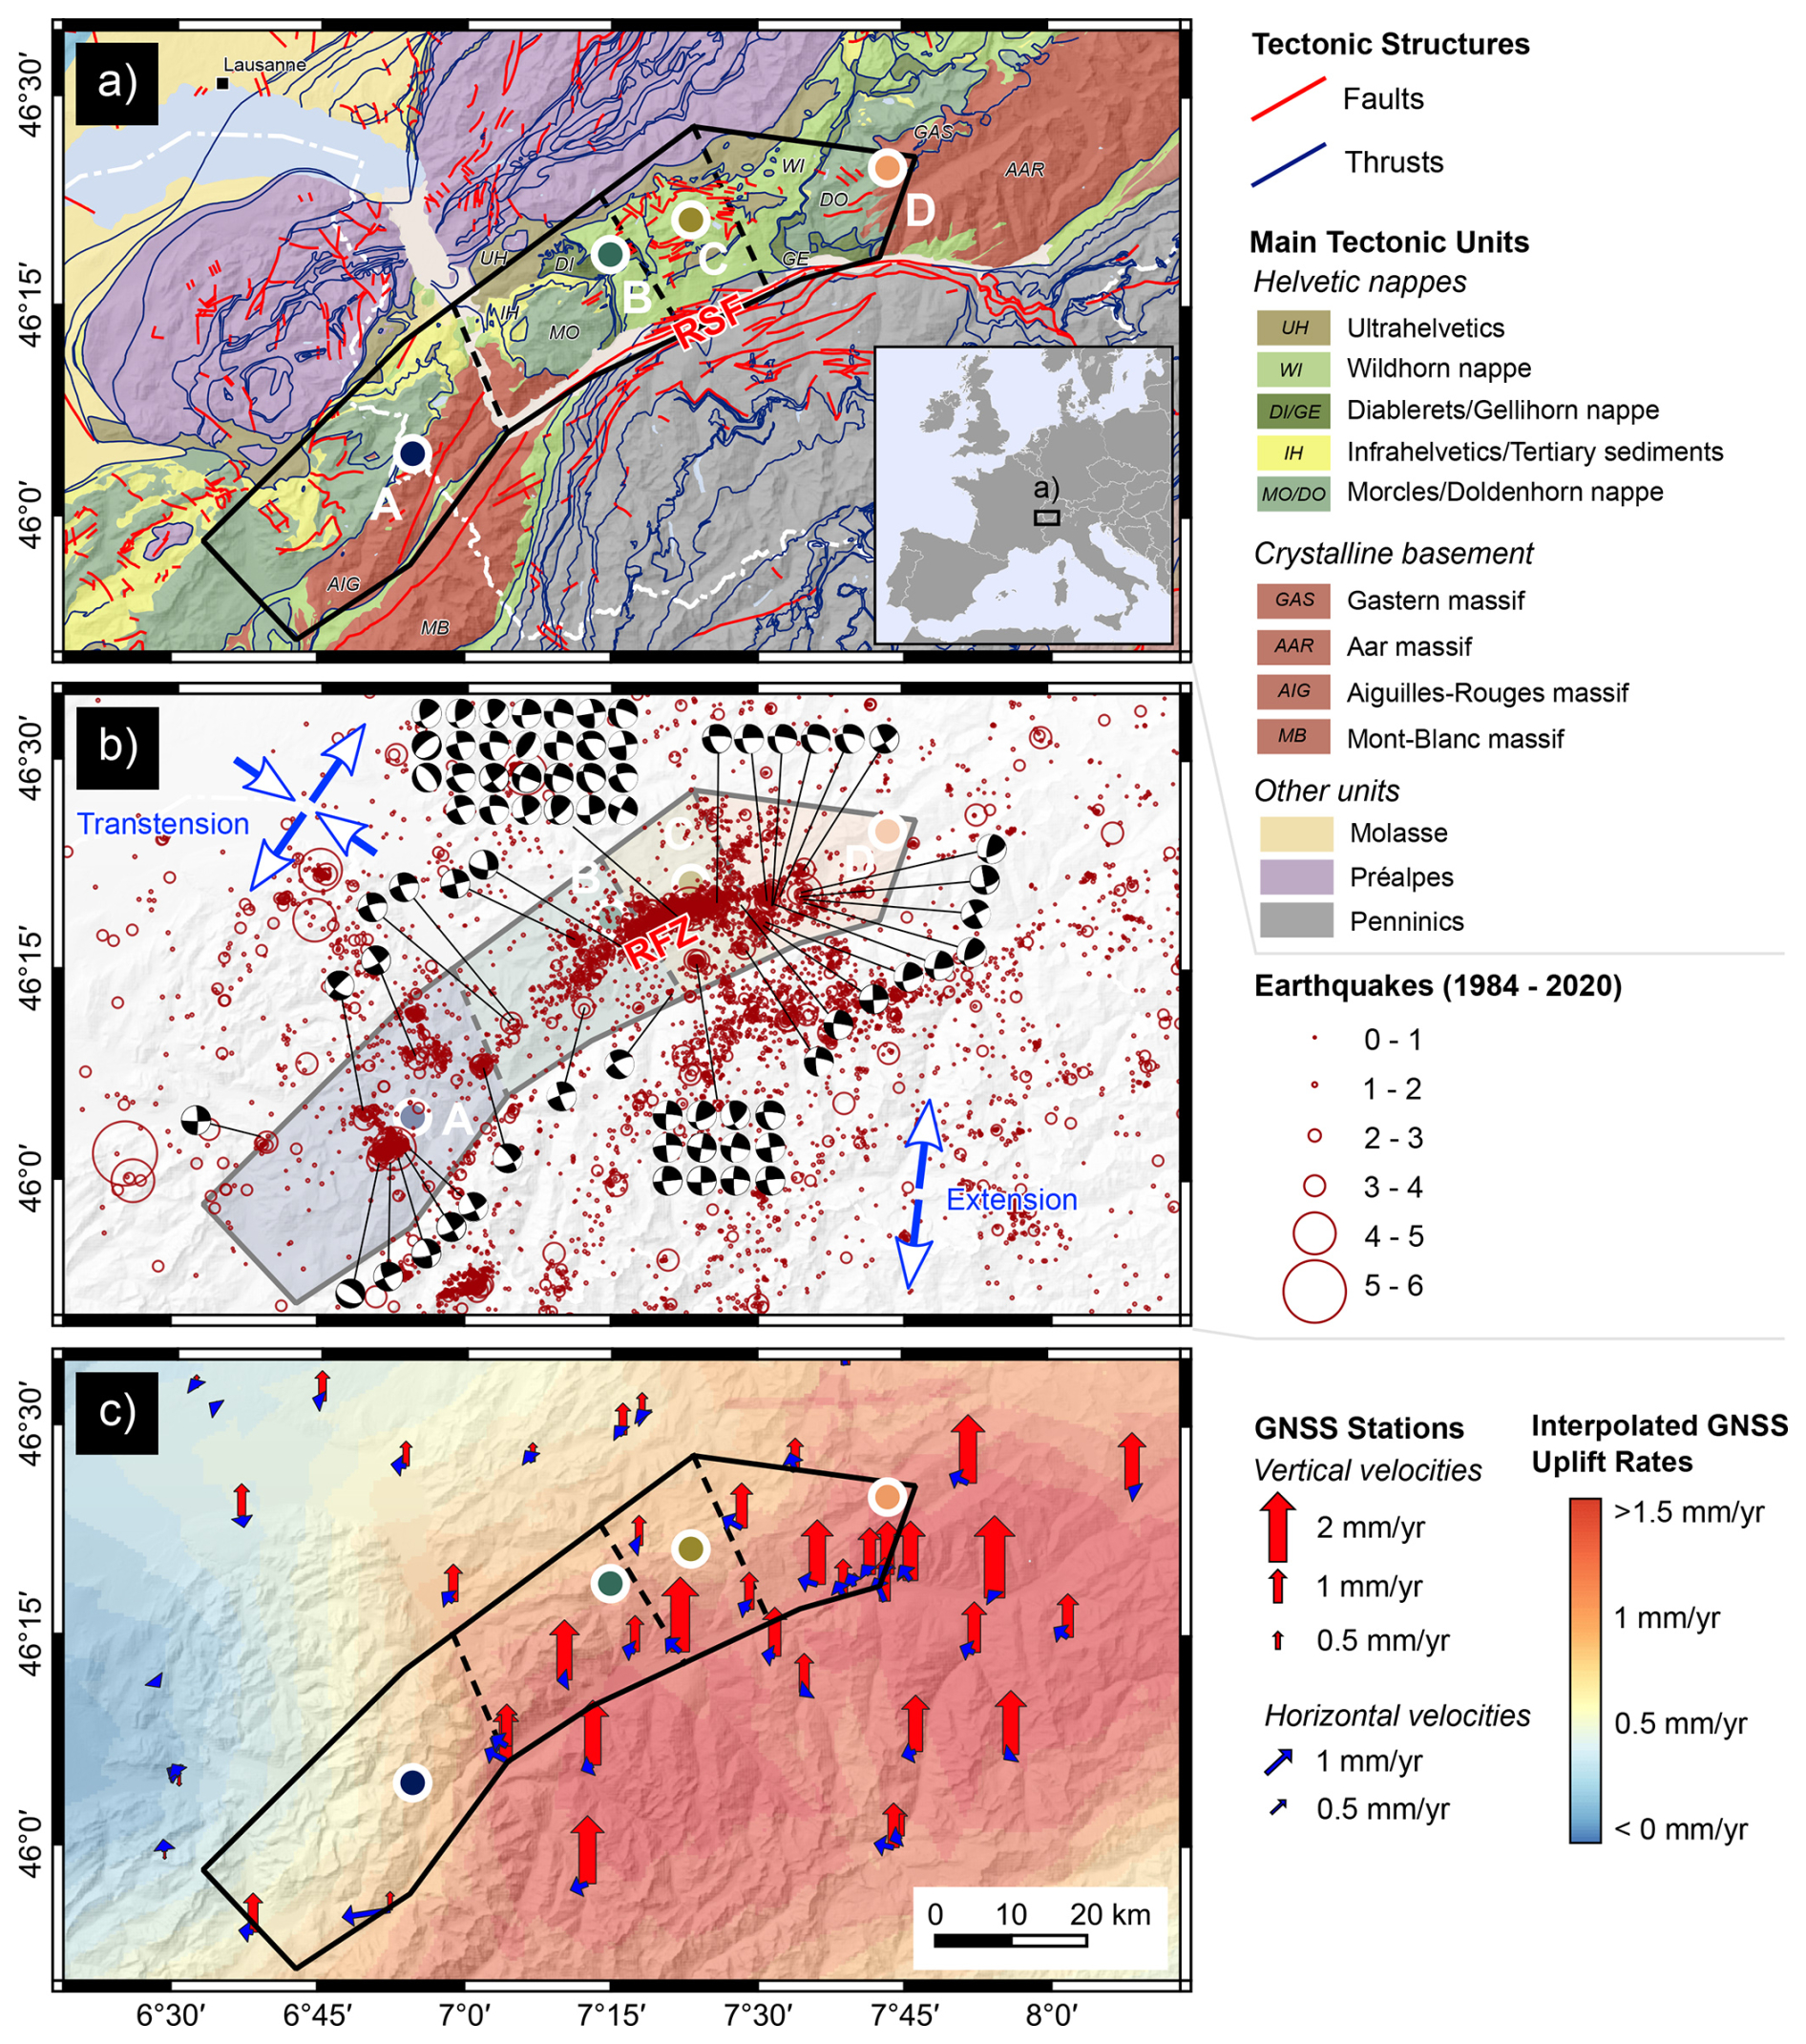
Figure 1Regional setting of the investigated seismotectonic domain z21 of Wiemer et al. (2016) (black polygon), with the four fracture mapping locations (A–D) shown as circles. (a) Tectonic map (1:500 000; © swisstopo). RSF: Rhône-Simplon Fault Zone. (b) Earthquakes from 1984 to 2020 (Diehl et al., 2021b) and available focal mechanism data (see main text for references). Blue arrows show the recent crustal stress field orientations after Kastrup et al. (2004), with contrasting stress regimes north and south of the RSF. The shaded colors indicate the different subdomains A–D. RFZ: conceptual Rawil Fault Zone. (c) Recent crustal displacement rates based on GNSS surface velocities in the vicinity of the study area with reference to stable Europe (data: EUREF Permanent GNSS Network (Bruyninx et al., 2019); swisstopo). Digital elevation model: EU-DEM v1.1 (© European Union, Copernicus Land Monitoring Service 2023, European Environment Agency (EEA)).
In the framework of a nation-wide seismic hazard assessment, Switzerland was zoned into different seismotectonic domains (Wiemer et al., 2016). We herein focus on seismotectonic domain z21 in the southwestern Swiss Alps, mainly due to its well-exposed rock outcrops and the exceptionally well-monitored natural seismic activity (Fig. 1). In the study area, several external crystalline massifs (ECMs) are exposed: the Aiguilles Rouges massif in the west and the Aar and Gastern massifs in the east (Fig. 1a). Between their exhumed parts, these basement units form a saddle-like structure, commonly referred to as the Rawil depression, which is overthrusted by the Helvetic limestone nappes (Burkhard, 1988; Dietrich, 1989; Dietrich and Casey, 1989; Ramsay, 1989, 1981). The Helvetic nappe system is composed of different, heavily folded nappes which have been stacked on top of each other during an early thin-skinned deformation phase of the Alpine orogen (thrusts in Fig. 1a; e.g., Musso Piantelli et al., 2022; Escher et al., 1993; Pfiffner 1993; Burkhard, 1988; Ramsay, 1981, 1989). In a late-Alpine stage, dominated by thick-skinned vertical tectonics, both the crystalline basement units and the Helvetic limestones were heavily affected by late-Alpine deformation, resulting in pervasive and complex faulting that affects all tectonic units and crosscut the older thrusts (faults in Fig. 1a; Cardello and Mancktelow, 2015; Gasser and Mancktelow, 2010; Huggenberger and Aebli, 1989; Herwegh et al., 2020, 2024; Cardello et al., 2024). Some of the predominantly subvertical late-Alpine faults have been linked to the regional seismic activity (Cardello and Mancktelow, 2015; Pavoni, 1980a; Ustaszewski et al., 2007; Ustaszewski and Pfiffner, 2008; Pavoni and Mayer-Rosa, 1978; Cardello et al., 2024). With the exception of the Rhône-Simplon Fault Zone (RSF), a steeply south-dipping dextral strike-slip fault system along the southern margin of the study area (e.g., Campani et al., 2014, 2010; Egli and Mancktelow, 2013; Mancktelow, 1985), regional-scale faults are largely absent at the surface of the study area. The nappes of the Helvetic units are separated by shallow-dipping thrust faults which are arguably not seismically active nowadays (Lee et al., 2023), so we herein do not discuss these thrusts further.
The presently dense seismic monitoring network in the region resolves the seismic activity exceptionally well, detecting earthquakes with a magnitude of completeness MC of about ML≈ 1.5 until 2016 and about ML≈ 1.0 thereafter (Diehl et al., 2021a; Lee et al., 2023). The earthquakes predominantly occur in a NE–SW-striking, elongated corridor in the center of the Rawil depression (Fig. 1b), which is referred to as the conceptual Rawil Fault Zone (RFZ) (Lee et al., 2023). The seismicity at depth arguably reactivates a complex system of subvertically oriented faults (Diehl et al., 2021a, 2018; Lee et al., 2023; Truttmann et al., 2023). This is supported by the variety of previously published, predominantly strike-slip-type focal mechanisms shown in Fig. 1b (Baer et al., 2005, 2003, 1997; Deichmann et al., 2012, 2006, 2002, 2000; Delacou et al., 2005; Diehl et al., 2021a, 2018, 2013; Jimenez and Pavoni, 1983; Maurer, 1993; Maurer and Deichmann, 1995; Pavoni et al., 1997; Truttmann et al., 2023), suggesting an overall transtensional regime (Kastrup et al., 2004; Houlié et al., 2018; Maurer et al., 1997).
The southwestern Swiss Alps are further characterized by their long-lasting vertical tectonics. During the latest stage of the Alpine orogeny, thick-skinned tectonics prevailed and led to the exhumation of the ECMs associated with intense faulting (faults in Fig. 1a; e.g., Herwegh et al., 2020, 2024; Boutoux et al., 2016). Recent uplift rates in the range of 1 mm per year (Brockmann et al., 2012; Piña-Valdés et al., 2022) and the pronounced seismic activity document the ongoing exhumation (Fig. 1b and c). As a consequence of these long-lasting vertical tectonics, a similar stress field likely prevailed during both the formation of the exhumed fracture networks and today's earthquakes.
In summary, the investigated seismotectonic domain reveals complex and pervasive fracture networks, well-recorded seismic activity, and long-lasting vertical tectonics. In our view, the Rawil depression region in the southwestern Swiss Alps thus provides a unique natural laboratory to elaborate on the statistical link between fractures and earthquakes in an orogen-internal setting.
3.1 Fracture networks
3.1.1 Fracture data
We selected four sites along the Rawil depression to conduct a detailed analysis of the fracture networks in the ECM units of (A) the Aiguilles Rouges massif and (D) the Gastern massif, as well as in the Helvetic limestones of (B) the Diablerets and (C) the Wildhorn nappes (Fig. 1). As pronounced glacial and fluvial erosion, vegetation, and Quaternary cover greatly limit the outcrop conditions and thus affect reliable sampling of fracture networks, we selected sites with little weathering, vegetation, and Quaternary cover, as well as flat terrain, to minimize topographic effects of fracture lengths and directions (Baumberger et al., 2022), which were encountered only at high-altitude sites.
At each site, we performed a detailed characterization of the fracture networks (Fig. 2a). We carried out drone-based surveys (DJI Mavic 2 Pro; Hasselblad L1D-20c camera) at two different observation heights to produce orthorectified images (orthophotos) and digital elevation models (DEMs) with Agisoft Metashape (v1.6.6) at millimeter and centimeter ground resolutions (see Table 1). Additionally, we used orthophoto and DEM products at DM ground resolution from the Federal Office of Topography swisstopo. We then manually digitized the visible fracture traces at fixed mapping scales of 1:10, 1:100, and 1:1000 within circular mapping areas, preferring circular extents to minimize potential orientation bias (e.g., Bonnet et al., 2001) (Table 1, Fig. 2a). Fracture traces are herein defined as curvilinear features that represent the intersections between a fracture plane and the Earth's surface (Baumberger et al., 2022; O'Leary et al., 1976), which serve as a proxy for the pre-existing geometrical anisotropies. Because such pre-existing anisotropies are likely to be reactivated also in today's stress field if suitably oriented and because the power law exponents are insensitive to fracture type (Bonnet et al., 2001; Marrett et al., 1999), we chose not to distinguish between fracture types in our analysis. Unambiguous differentiation of fractures from other discontinuities such as bedding structures based on remote sensing alone is often ambiguous, which is why we systematically validated the fracture maps in the field to ensure their representativeness of the real fracture populations. We also measured both the 3D orientations of the fractures and where possible the kinematic indicators (slickenfibres, slickolites) in the field.
Table 1Overview of the orthoimages and digital elevation models (DEM) used that serve as a basis for the fracture trace maps. Orthoimages and DEMs of the 1:1000 mapping scale (DM resolution) are publicly available from swisstopo.
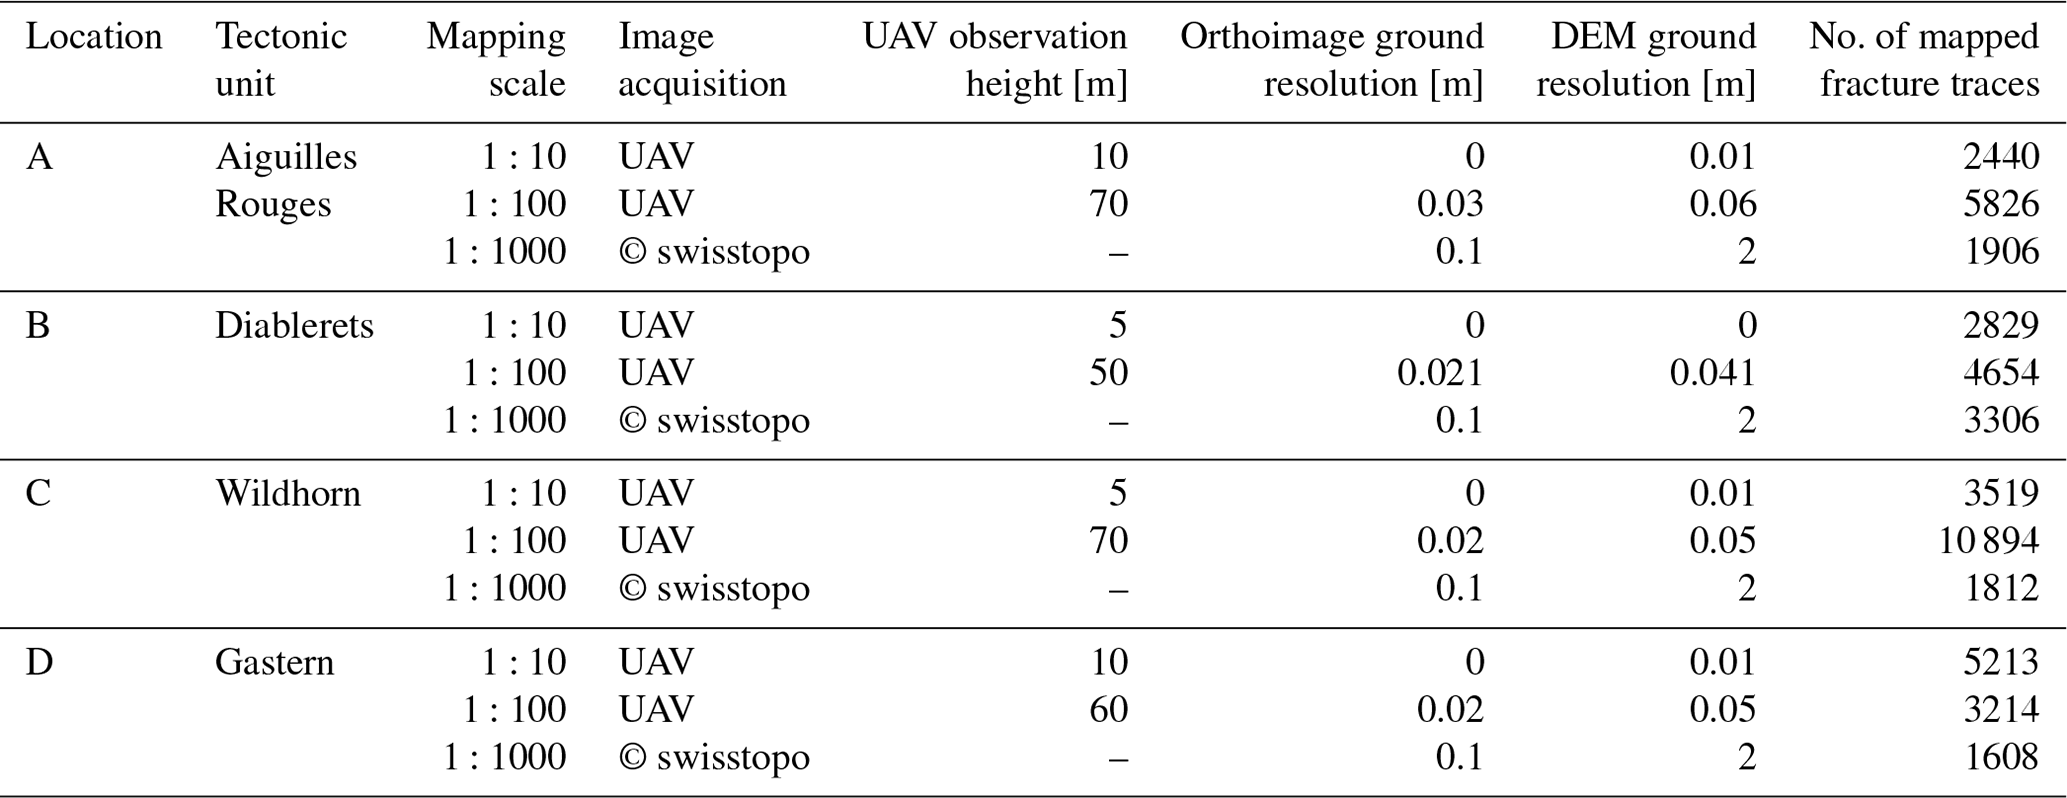
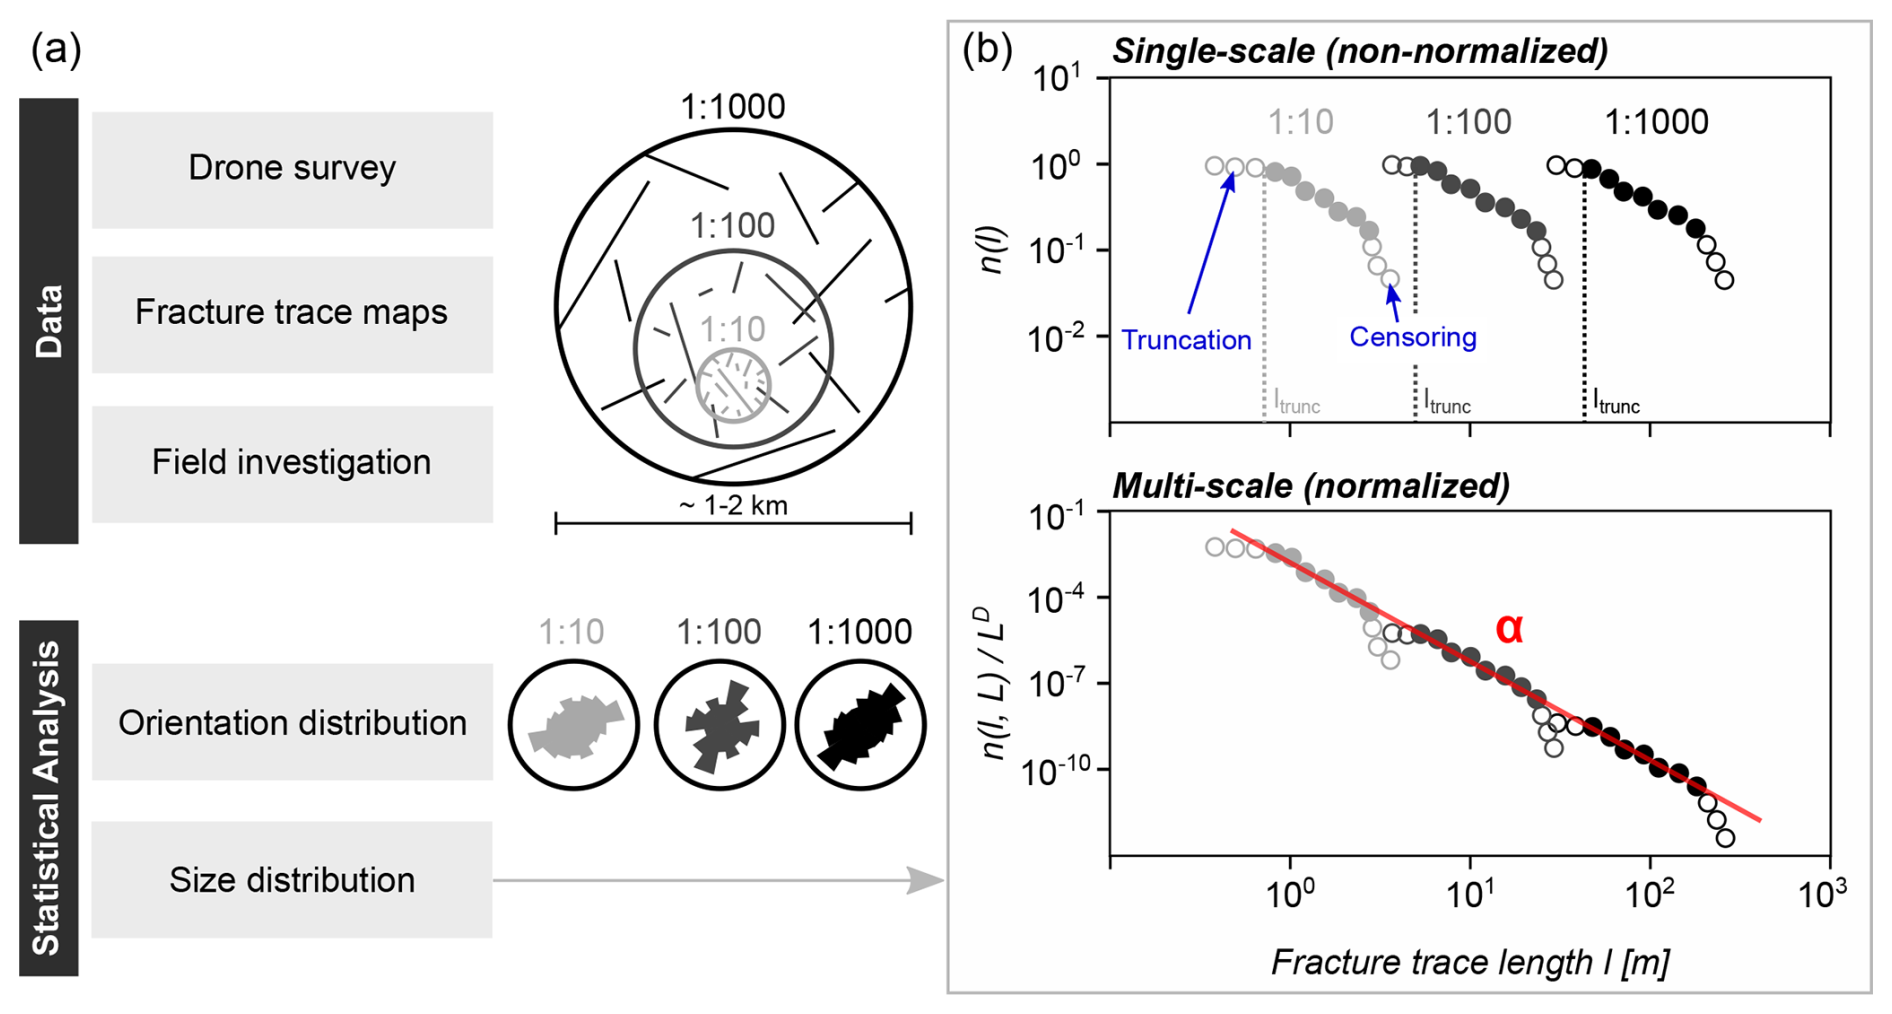
Figure 2(a) Workflow of the fracture network analysis conducted separately for each location, combining observations from three different mapping scales of 1:1000, 1:100, and 1:10 (for details see “Data and methods”). (b) Examples of size distributions of the fracture networks, plotted with the non-normalized single-scale approach, treating the data from each mapping scale individually (upper panel), and the multi-scale approach, combining all information across scales by normalization with the fractal area (lower panel).
Despite thorough data collection, the mapping of fracture traces includes several limitations. The detectability of fracture traces by remote sensing depends on both the fracture length, the image resolution, the mapping scale, and the degree of erosion of the related tectonites (i.e., the resulting morphological incision). Furthermore, image artifacts caused by illumination or shadow effects in low-contrast domains or by partial coverage of the bedrock by Quaternary debris or vegetation can prohibit the appropriate identification of fractures. These factors lead to deviations from the true fracture trace length which in turn influences the quantitative analysis (e.g., Cao and Lei, 2018). To minimize such potential artifacts, we carefully selected sites with little Quaternary cover and topographic effects and acquired the images in similar light conditions. Areas covered by debris or vegetation were excluded as “no data” areas. The influence of the remaining uncertainties is further discussed in Sect. 5.1.
3.1.2 Statistical analysis of fracture networks
We used the data from the fracture trace maps to quantify both the orientation and size distributions of the fracture networks. To describe their 2D orientation distribution, we derived length-weighted rose diagrams from the fracture traces for each individual dataset presented in Table 1 (Fig. 2a). Additionally, we used field measurements to characterize the 3D orientation distribution of the fracture networks, as well as their kinematics. The 2D and 3D distributions capture different aspects of the fracture orientations: while the 3D distribution yields information about the dip range of the fracture sets, the 2D orientation distribution from the fracture trace maps represents a better-suited quantitative measure of the dominant strike orientations.
In a next step, we evaluated the size distribution of the fracture networks from the four sites. We assume an underlying power law distribution, which is most commonly used to model fracture size distributions (e.g., Bonnet et al., 2001; Bour et al., 2002; Odling, 1997; Scholz et al., 1993; Torabi and Berg, 2011; Yielding et al., 1996; Davy et al., 2010; Scholz, 2019). In nature, all power laws must have upper and lower limits (Bonnet et al., 2001; Torabi and Berg, 2011; Turcotte, 1997, 1989). For fractures, the upper limit is likely related to the thickness of the crust or the stratigraphic layering, while the lower limit is constrained by a physical length scale (e.g., grain size). Defining these limits is nontrivial, and deviations from a power law in the tails of the size distribution of fracture networks commonly occur presumably independent of the physical limits of the system. Instead, sampling bias such as truncation and censoring effects can result in size distributions that appear to be exponential or log-normal (Bonnet et al., 2001; Odling, 1997; Odling et al., 1999; Torabi and Berg, 2011). Due to the underestimation of the frequency of small fractures, these structures are systematically underrepresented due to the limited resolution of the orthophotos and DEMs, which is commonly referred to as truncation (Bonnet et al., 2001; Bour et al., 2002; Torabi and Berg, 2011) (Fig. 2b). The truncation length ltrunc defines the length above which fractures can be reliably detected. Similarly, large fractures are more likely to lie partially outside the boundaries of the sampling area, so their lengths and frequencies are often systematically underestimated (Bonnet et al., 2001; Pickering et al., 1995). This leads to a steepening of the curve at the upper tail of the distribution, commonly called the censoring effect (Fig. 2b). Note that the fracture lengths at which truncation and censoring effects occur do not necessarily correspond to the true physical limits of the power law distribution (Bonnet et al., 2001). Since both truncation and censoring effects in natural fracture datasets are often rather pronounced, it is a major challenge to identify the scaling range where the distribution follows a power law. It is therefore crucial to ensure that the power law fitting is based on a large range of fracture lengths, ideally spanning values over 2 to 3 orders of magnitude (Bonnet et al., 2001). Practical issues and mapping bias (see previous section), however, prevent the acquisition of high-resolution orthophotos over large areas that would be required for this. On a single observation scale, the length range is thus limited, rendering the identification of power law distributions challenging (Bonnet et al., 2001; Bour et al., 2002; Davy et al., 2006; Pickering et al., 1995; Scholz, 2007).
To overcome these limitations, we herein used a multi-scale approach, combining the observations from different mapping scales (Fig. 2b). The basic idea is to normalize the fracture density with the fractal area, which allows us to greatly extend the length range (e.g., Bonnet et al., 2001; Heffer and Bevan, 1990; Odling, 1997). The normalized density size distribution is given as (Bour et al., 2002; Davy et al., 1990)
with l as the fracture trace length, c representing the fracture density, αF as the power law exponent of the fracture networks, and LD denoting the area term. The latter is defined by the diameter of the study area L and the fractal dimension D of the fracture trace barycenters (i.e., the centroids of the fracture traces) and fixes the number of structures of a given length per unit fractal area independently from the observation scale and is thus a scale-independent measure (Davy et al., 1990; Bour et al., 2002). This allows for comparison of the data obtained at different scales.
The fractal dimension D was derived with the two-point correlation function C2 (Hentschel and Procaccia, 1983; Vicsek, 1992), which describes the spatial correlation of fracture trace barycenters and has been suggested as an appropriate measure for D of fracture networks (Bonnet et al., 2001; Bour et al., 2002; Bour and Davy, 1999; Davy et al., 1990). It is defined as
where N is the total number of fracture trace barycenters and Nd is the number of pairs whose barycenter interdistance is less than r (Hentschel and Procaccia, 1983). For fractal populations, C2 scales with r as rD, with D as the correlation dimension. Following Bonnet et al. (2001), we estimated the fractal dimension by identifying a plateau of the local slopes of D.
To then fit the fracture trace data with Eq. (2), we only extracted the unbiased data from each fracture trace map. To account for truncation effects, we determined the truncation length ltrunc with the statistical approach of Alstott et al. (2014) and Clauset et al. (2009), using the Kolmogorov–Smirnov (KS) distance as a measure for the goodness of fit between the fitted power law and the data. Hereby, the minimum KS distance defines ltrunc (Fig. S1 in the Supplement). We then removed all fracture traces with lengths smaller than ltrunc. We also accounted for censoring effects by removing fractures that intersect the sampling window (Lei et al., 2015). The cleaned fracture densities of each mapping scale n(l) were then normalized with the area term LD. We finally fitted the normalized dataset with a power law using maximum likelihood estimation (MLE). This is commonly preferred over linear regression (Clauset et al., 2009; Goldstein et al., 2004). We finally obtained power law size distributions which, owing to the multi-scale approach, span several magnitudes of fracture lengths (Fig. 2b). As the number of fracture traces is critical for the reliable extraction of power law exponents (Zeeb et al., 2013) and the number of fractures is rather small for non-dominant orientations, we chose to not incorporate orientation-dependent αF values but rather derived a single bulk value of αF for the respective site.
3.2 Earthquakes
We analyzed the recent seismicity within four subdomains of the seismotectonic domain z21 of Wiemer et al. (2016), each associated with one of the fracture mapping sites A to D (Fig. 1b). In analogy to the fracture data, we characterized both the orientation and size distributions of the earthquakes within these subdomains.
The orientation of the rupture plane activated during an earthquake often remains unknown, and the determination of the orientation distribution of seismic ruptures is thus challenging. However, focal mechanisms (e.g., determined by the polarities of the first arriving P waves) give a first-order constraint on the orientation of the ruptured plane for earthquakes with significant energy release. Such first-motion focal mechanisms yield an ambiguous solution with two possible rupture plane orientations. Additional constraints such as the spatial distribution of hypocenters can in some cases be used to decipher the activated ruptured plane (e.g., Truttmann et al., 2023), but this information is often lacking. For this study, we compiled previously published focal mechanism data as shown in Fig. 1b (Baer et al., 2005, 2003, 1997; Deichmann et al., 2012, 2006, 2002, 2000; Delacou et al., 2005; Diehl et al., 2021a, 2018, 2013; Jimenez and Pavoni, 1983; Maurer, 1993; Maurer and Deichmann, 1995; Pavoni et al., 1997; Truttmann et al., 2023), which partially incorporates information about the active rupture plane deciphered from the spatial distribution of fore- and aftershocks. Based on these focal mechanisms, we evaluated the 3D orientation distribution of earthquake ruptures within each subdomain by plotting the nodal planes in stereographic projections and incorporate, where available, the information about the effectively ruptured plane.
We consecutively analyzed the size distribution of earthquakes, using the data from the earthquake catalog published by Diehl et al. (2021b) only considering natural earthquakes (Fig. 1b). Indications exists that the ML magnitudes in the SED bulletin include inconsistencies between earlier and modern epochs due to changes in instrumentation and determination procedures of magnitudes (Staudenmaier et al., 2018). We therefore only considered events after 2005, for which the ML magnitudes are derived from digital data in a relatively consistent manner. Since we are interested in a measure that is directly comparable to the size distribution of fractures, here we derive the size distribution of earthquake ruptures, where size refers to length lR, defined as the diameter of a circular earthquake rupture, rather than magnitude or seismic moment, which serves as a proxy for the recently activated part of the fracture network at depth. This approach is justified by the fact that the earthquake magnitude is directly related to the ruptured fracture length (e.g., Wells and Coppersmith, 1994). Therefore, we translated the local magnitudes ML to the earthquake rupture lengths lR. After converting the recorded local earthquake magnitude ML to the moment magnitude Mw after Goertz-Allmann et al. (2011) using an empirical ML−MW scaling relationship, we derived the earthquake rupture area AR, given as
where a and b represent constants derived from empirical scaling relations (e.g., Wells and Coppersmith, 1994). We herein used three different scaling relations determined for strike-slip earthquakes in stable continental regions with a= 4.18 and b= 1 (Leonard, 2014), a= 3.49 and b= 0.94 (Thingbaijam et al., 2017), and a= 3.98 and b= 1.02 (Wells and Coppersmith, 1994). From AR, we then calculated the earthquake rupture length lR under the assumption of a circular rupture plane. Based on this new dataset containing a rupture length for each earthquake, we then employed the MLE power law fitting procedure of Alstott et al. (2014) and Clauset et al. (2009) using Eq. (1) to derive the power law exponent αR of the earthquake ruptures. αR represents a modified b value that is the commonly used power law exponent in seismology. Similar to the fitting procedure of the fracture data, we used the minimum KS distance as a measure for the optimal truncation length (Fig. S2), which is comparable to Mc often used by seismologists.
4.1 Fracture networks
Based on remote sensing, we mapped between 1608 and 10 894 fracture traces at each of the three different mapping scales on the four study sites (Table 1, Fig. 3). In the following, we use these data to characterize the fracture networks in terms of their orientation and size distributions.
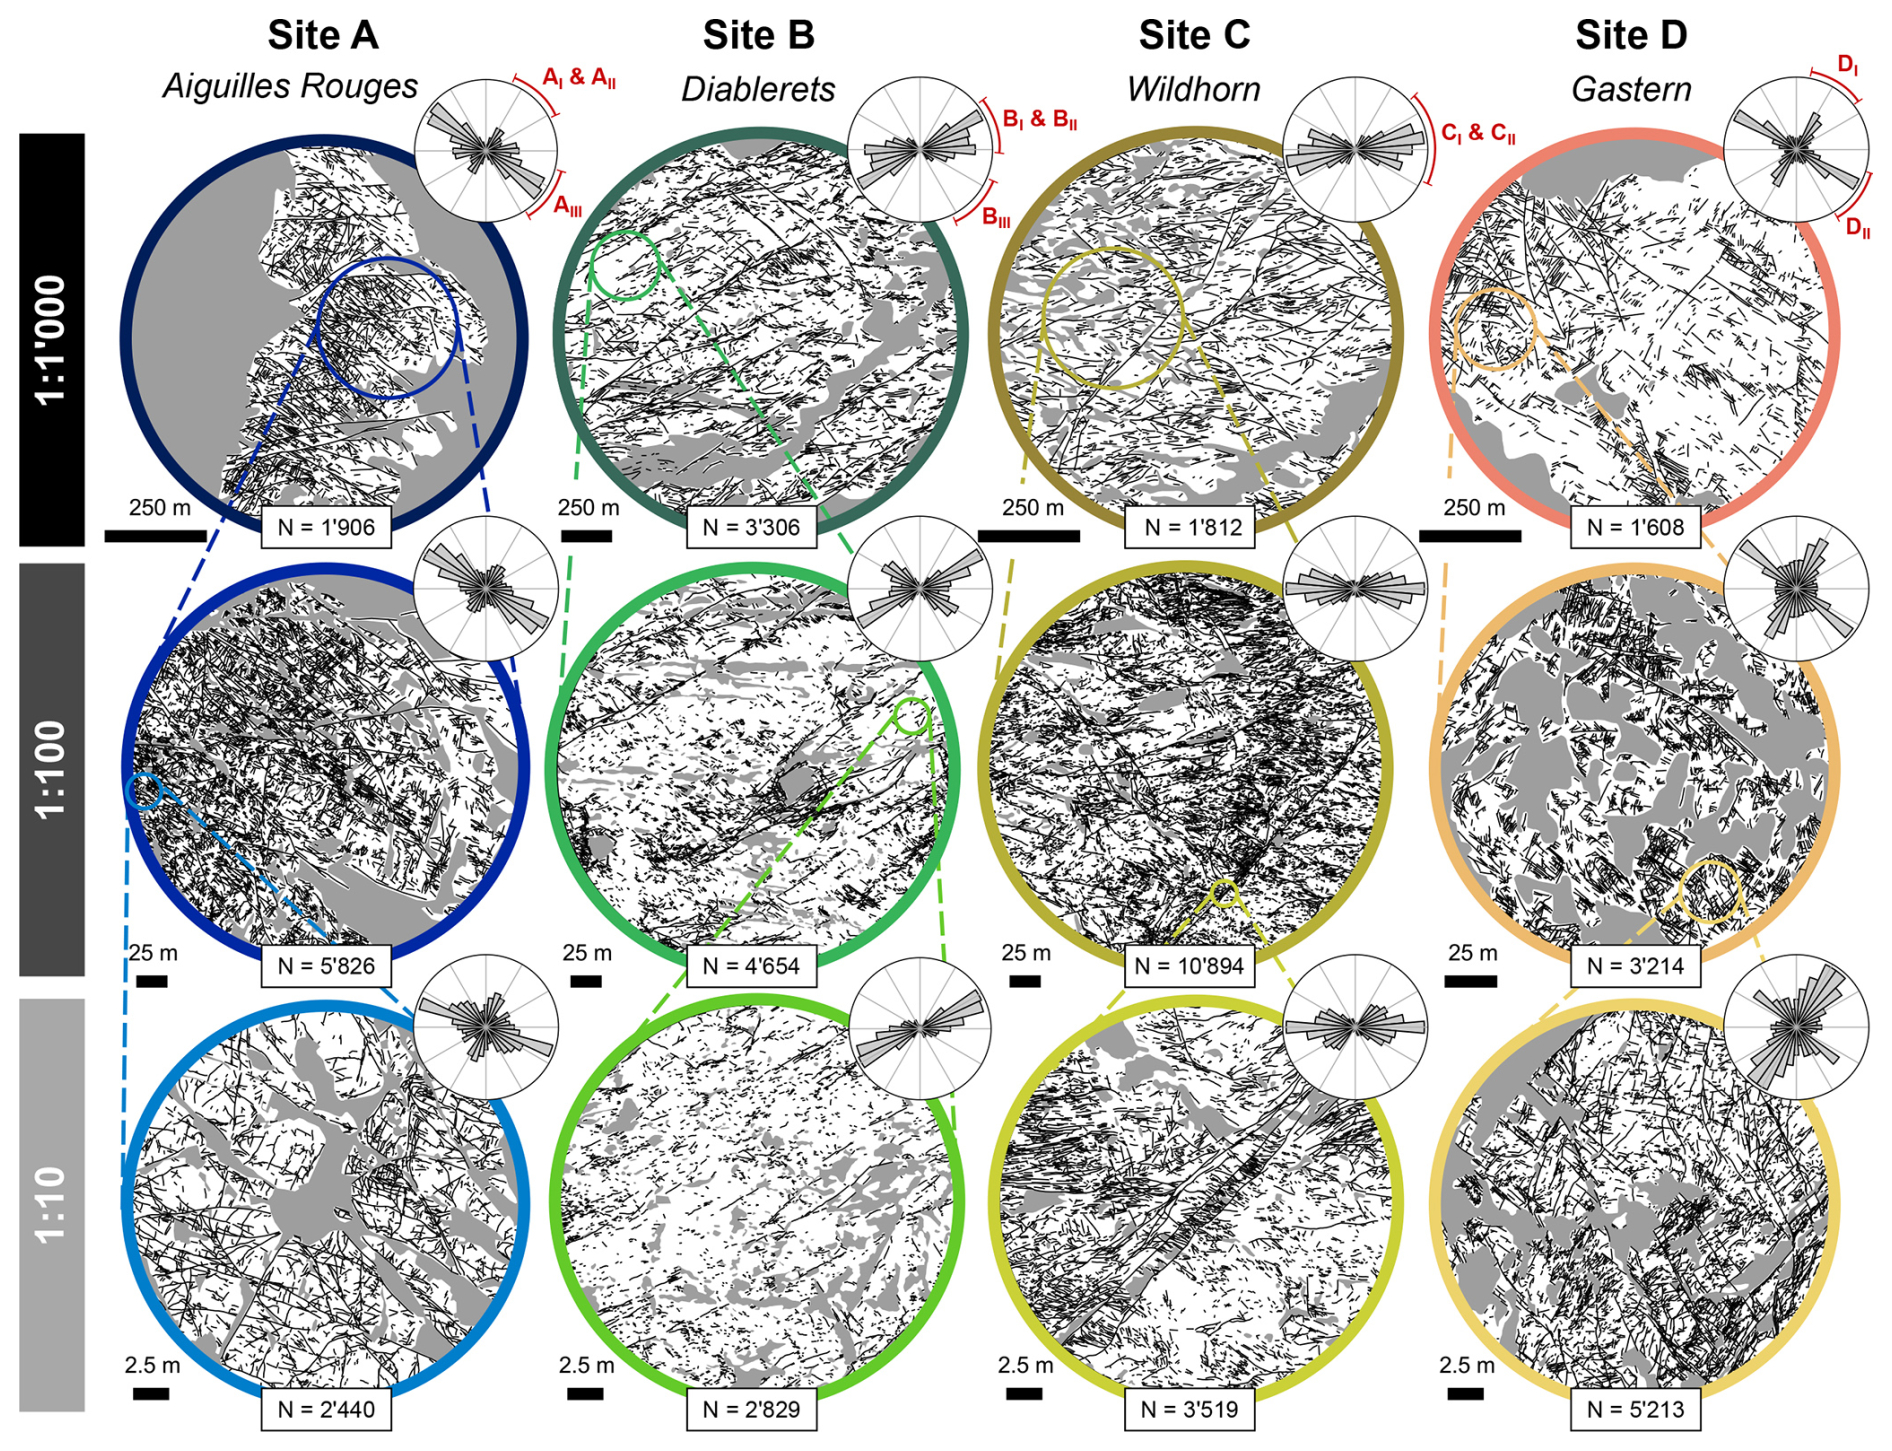
Figure 3Fracture trace maps at different mapping scales (rows) for all four study sites (columns). The maps show both fracture traces (black lines) and no data areas (grey areas). The length-weighted rose diagrams to the top right of each map show the 2D orientation distribution of the fracture traces (strike directions). N indicates the number of mapped fracture traces.
4.1.1 Orientation distribution
Site A is characterized by three main sets of subvertical fractures identified in the field (Fig. 4a): a NE–SW-striking set dipping towards the SE (AI) and a similarly striking but NW-dipping set (AII), as well as an almost perpendicular NW–SE-striking set (AIII). Set AI consistently indicates normal movements, while AII fractures reveal a reverse shear sense (Fig. 4b). For set AIII, we only observed a single kinematic indicator, revealing oblique sinistral movements. The length-weighted rose diagrams for site A suggest that the NW–SE-striking AIII fractures are the dominant set (Fig. 3).

Figure 4Field-based characterization of the fracture populations. The stereoplots in the upper row show the 3D orientation distributions (black dots: poles to planes on a lower-hemisphere projection) with Kamb density contours in red (2σ interval) for all study sites. The lower row shows the respective kinematic indicators from fracture observations (lower-hemisphere projection). The dots represent the slip vectors, colored after fracture type and shear sense.
At site B, the measured fracture planes reveal a similar 3D orientation distribution with a slight clockwise rotation compared to site A (Fig. 4c). The NW–SE-striking set BI, dipping SE, is oriented parallel to fracture set BII and perpendicular to the NW–SE-striking set BIII. Both BI and BII exhibit dextral strike-slip movements (Fig. 4d), while fractures of set BIII mostly indicate normal movements. The rose diagrams in Fig. 3 show that the NE–SW-striking BI and BII fractures are the most prominent sets at all scales.
Also at site C, NE–SW striking and steeply SE fractures (CI) and NW-dipping fractures (CII) are the dominant sets (Fig. 4e). Set CI exhibits large variations in strike directions, ranging from NNE–SSW to E–W. Both sets predominantly imply dextral strike-slip movements (Fig. 4f). The rose diagrams indicate that E–W to ENE–WSW are the dominant fracture strike orientations, corresponding to both fracture sets CI and CII (Fig. 3).
The fracture network at site D is characterized by two main sets, with a diffusely oriented, approximately NE–SW-striking set (DI) and a dominant subvertical, NW–SE-striking fracture set (DII) (Fig. 4g). For neither set DI nor DII do the kinematic indicators reveal a clear pattern (Fig. 4h). The rose diagrams in Fig. 3 reveal a bimodal distribution, with both sets DI and DII equally abundant.
In summary, we document a change in dominant fracture orientations, from NW–SE striking in the Aiguilles Rouges massif (site A), to E–W and NE–SW dominated in the limestone nappes in the center of the Rawil depression (sites B and C), and to a NE–SW and NW–SE bimodal fracture distribution in the Gastern massif (site D).
4.1.2 Size distribution
To combine the fracture trace data from the different scales, we first derive the fractal dimension D for each fracture trace map. Using the two-point correlation function C2, we obtain values of D between 1.64 and 1.83 (Fig. 5), suggesting a relatively homogeneous spatial fracture distribution, as D= 2 would imply a perfectly homogeneous spatial distribution. This is in good agreement with the qualitative observation of widespread and pervasive fracturing in the area. Since the datasets from different scales reveal consistent values of D, we argue that the fractal dimension is scale-independent.
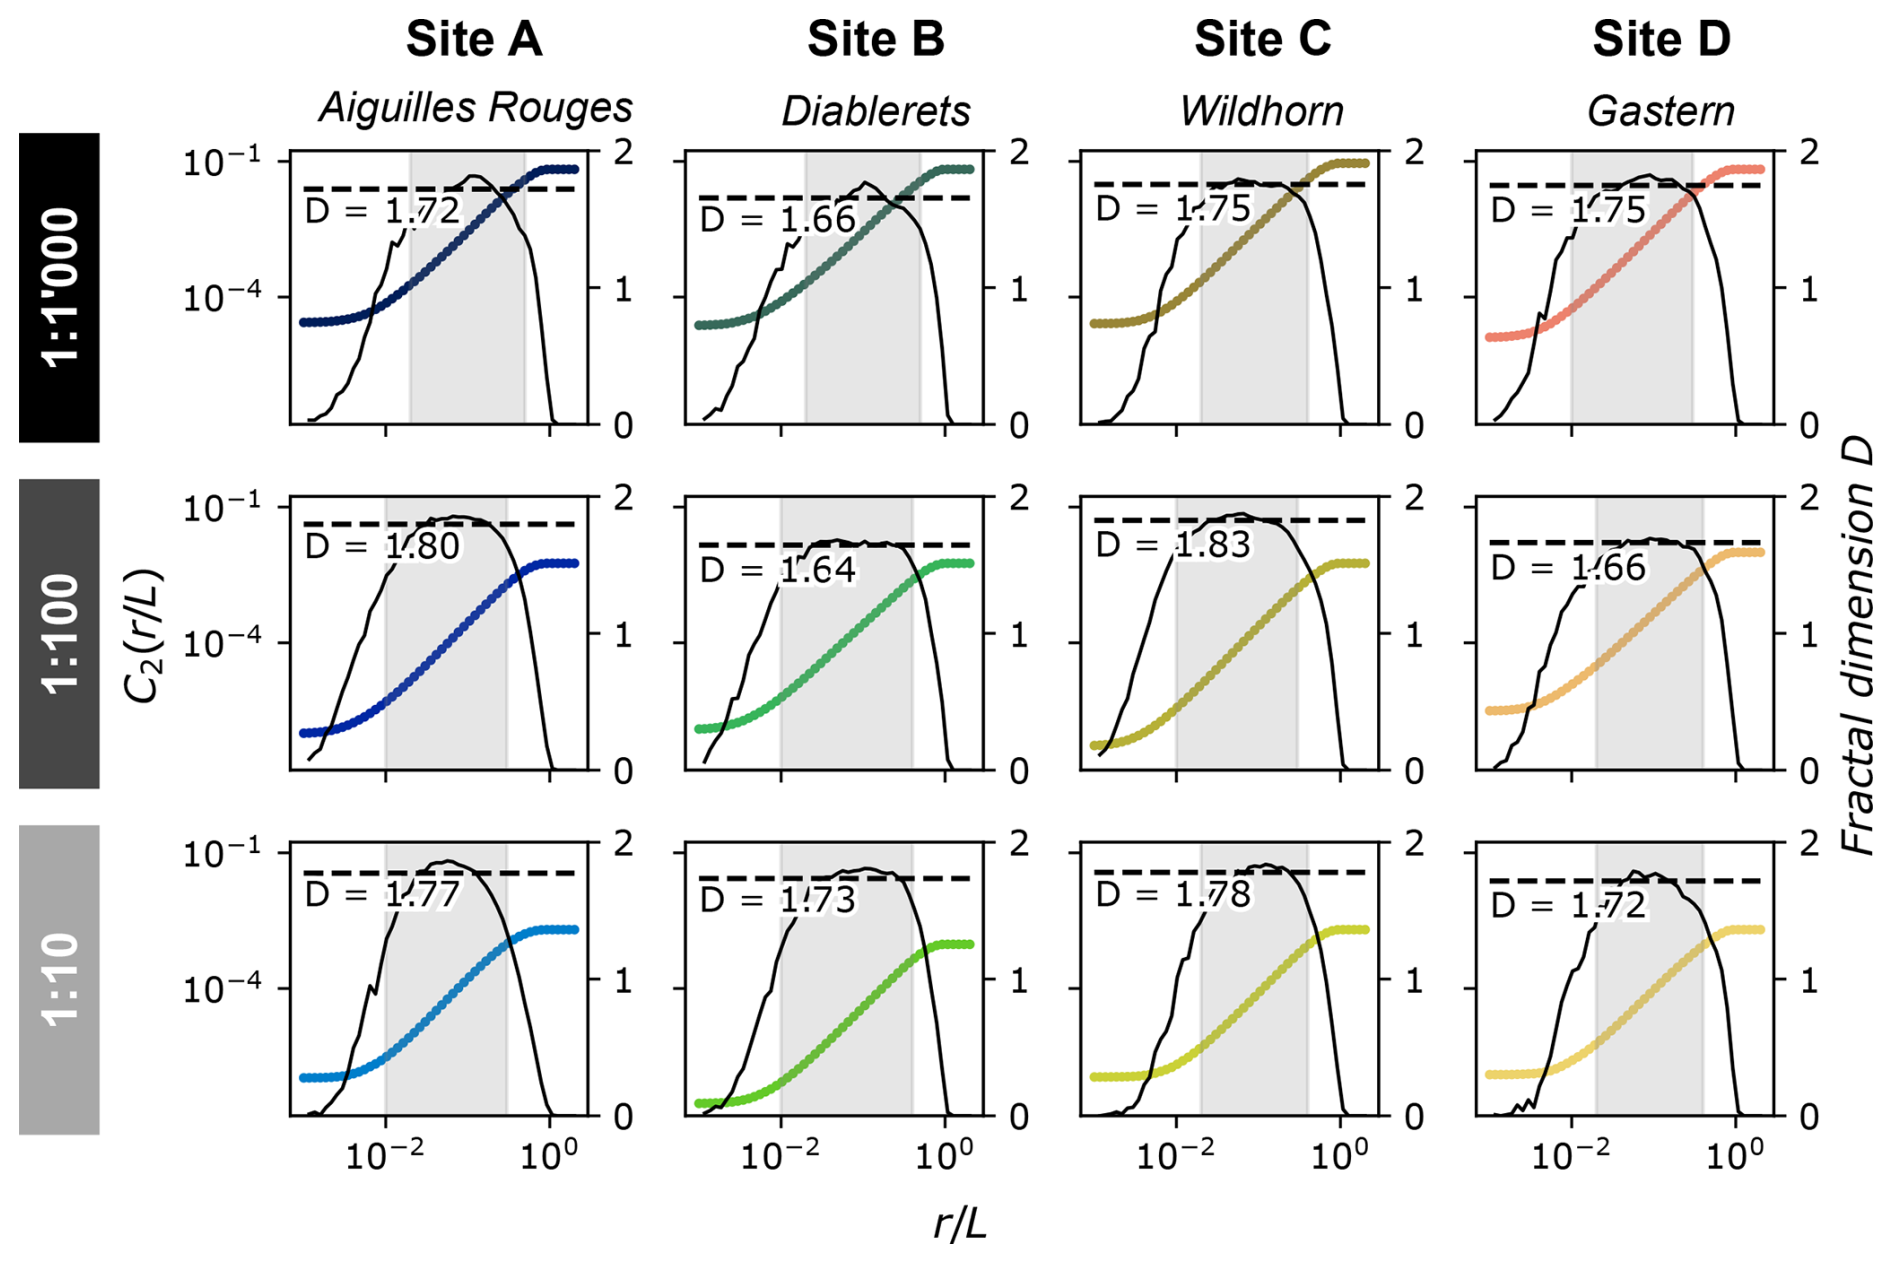
Figure 5Estimation of the fractal dimension D for each individual fracture network based on the two-point correlation function C2 (colored line). The black line shows the local slopes of C2 (derivative of C2; right-hand axis). The plateau in the local slopes within the grey shaded area approximates the fractal dimension D, which is represented by the dashed black lines.
Using the obtained values of D for the area normalization (see Sect. 3.1.2), we find that the normalized fracture size data follow a linear trend in a log–log plot for all study sites, supporting the assumption of an underlying power law distribution (Fig. 6). The power law scaling seems to hold over a length range of 3 orders of magnitude for fracture lengths between ca. 100 to 103 m. However, as can be seen for the data of site C, for example, individual datasets slightly deviate from the power law behavior. Such deviations can be caused by sampling bias such as the choice of the sampling area of the consecutive mapping scale, since subareas with anomalously high or low fracture densities can lead to an offset in the multi-scale size distributions. We will further discuss potential uncertainties in Sect. 5.1.
The obtained fracture power law exponents αF, which are of main interest for comparison with the earthquake data, range between 2.43 and 2.73 (Fig. 6), which suggests that little regional variations exist. As the fracture networks are sampled in both crystalline basement rocks and the Helvetic limestone units, αF seems to be relatively insensitive to differences in lithologies. For the dimensionless fracture density term c, we observe somewhat larger variations. With a value of , site B reveals the lowest fracture density term, while sites A, C, and D show larger c values of up to . Even though all c values range in the same order of magnitude, the fracture density term varies by a factor of 3 for the different sites, however, without any clear regional trends.
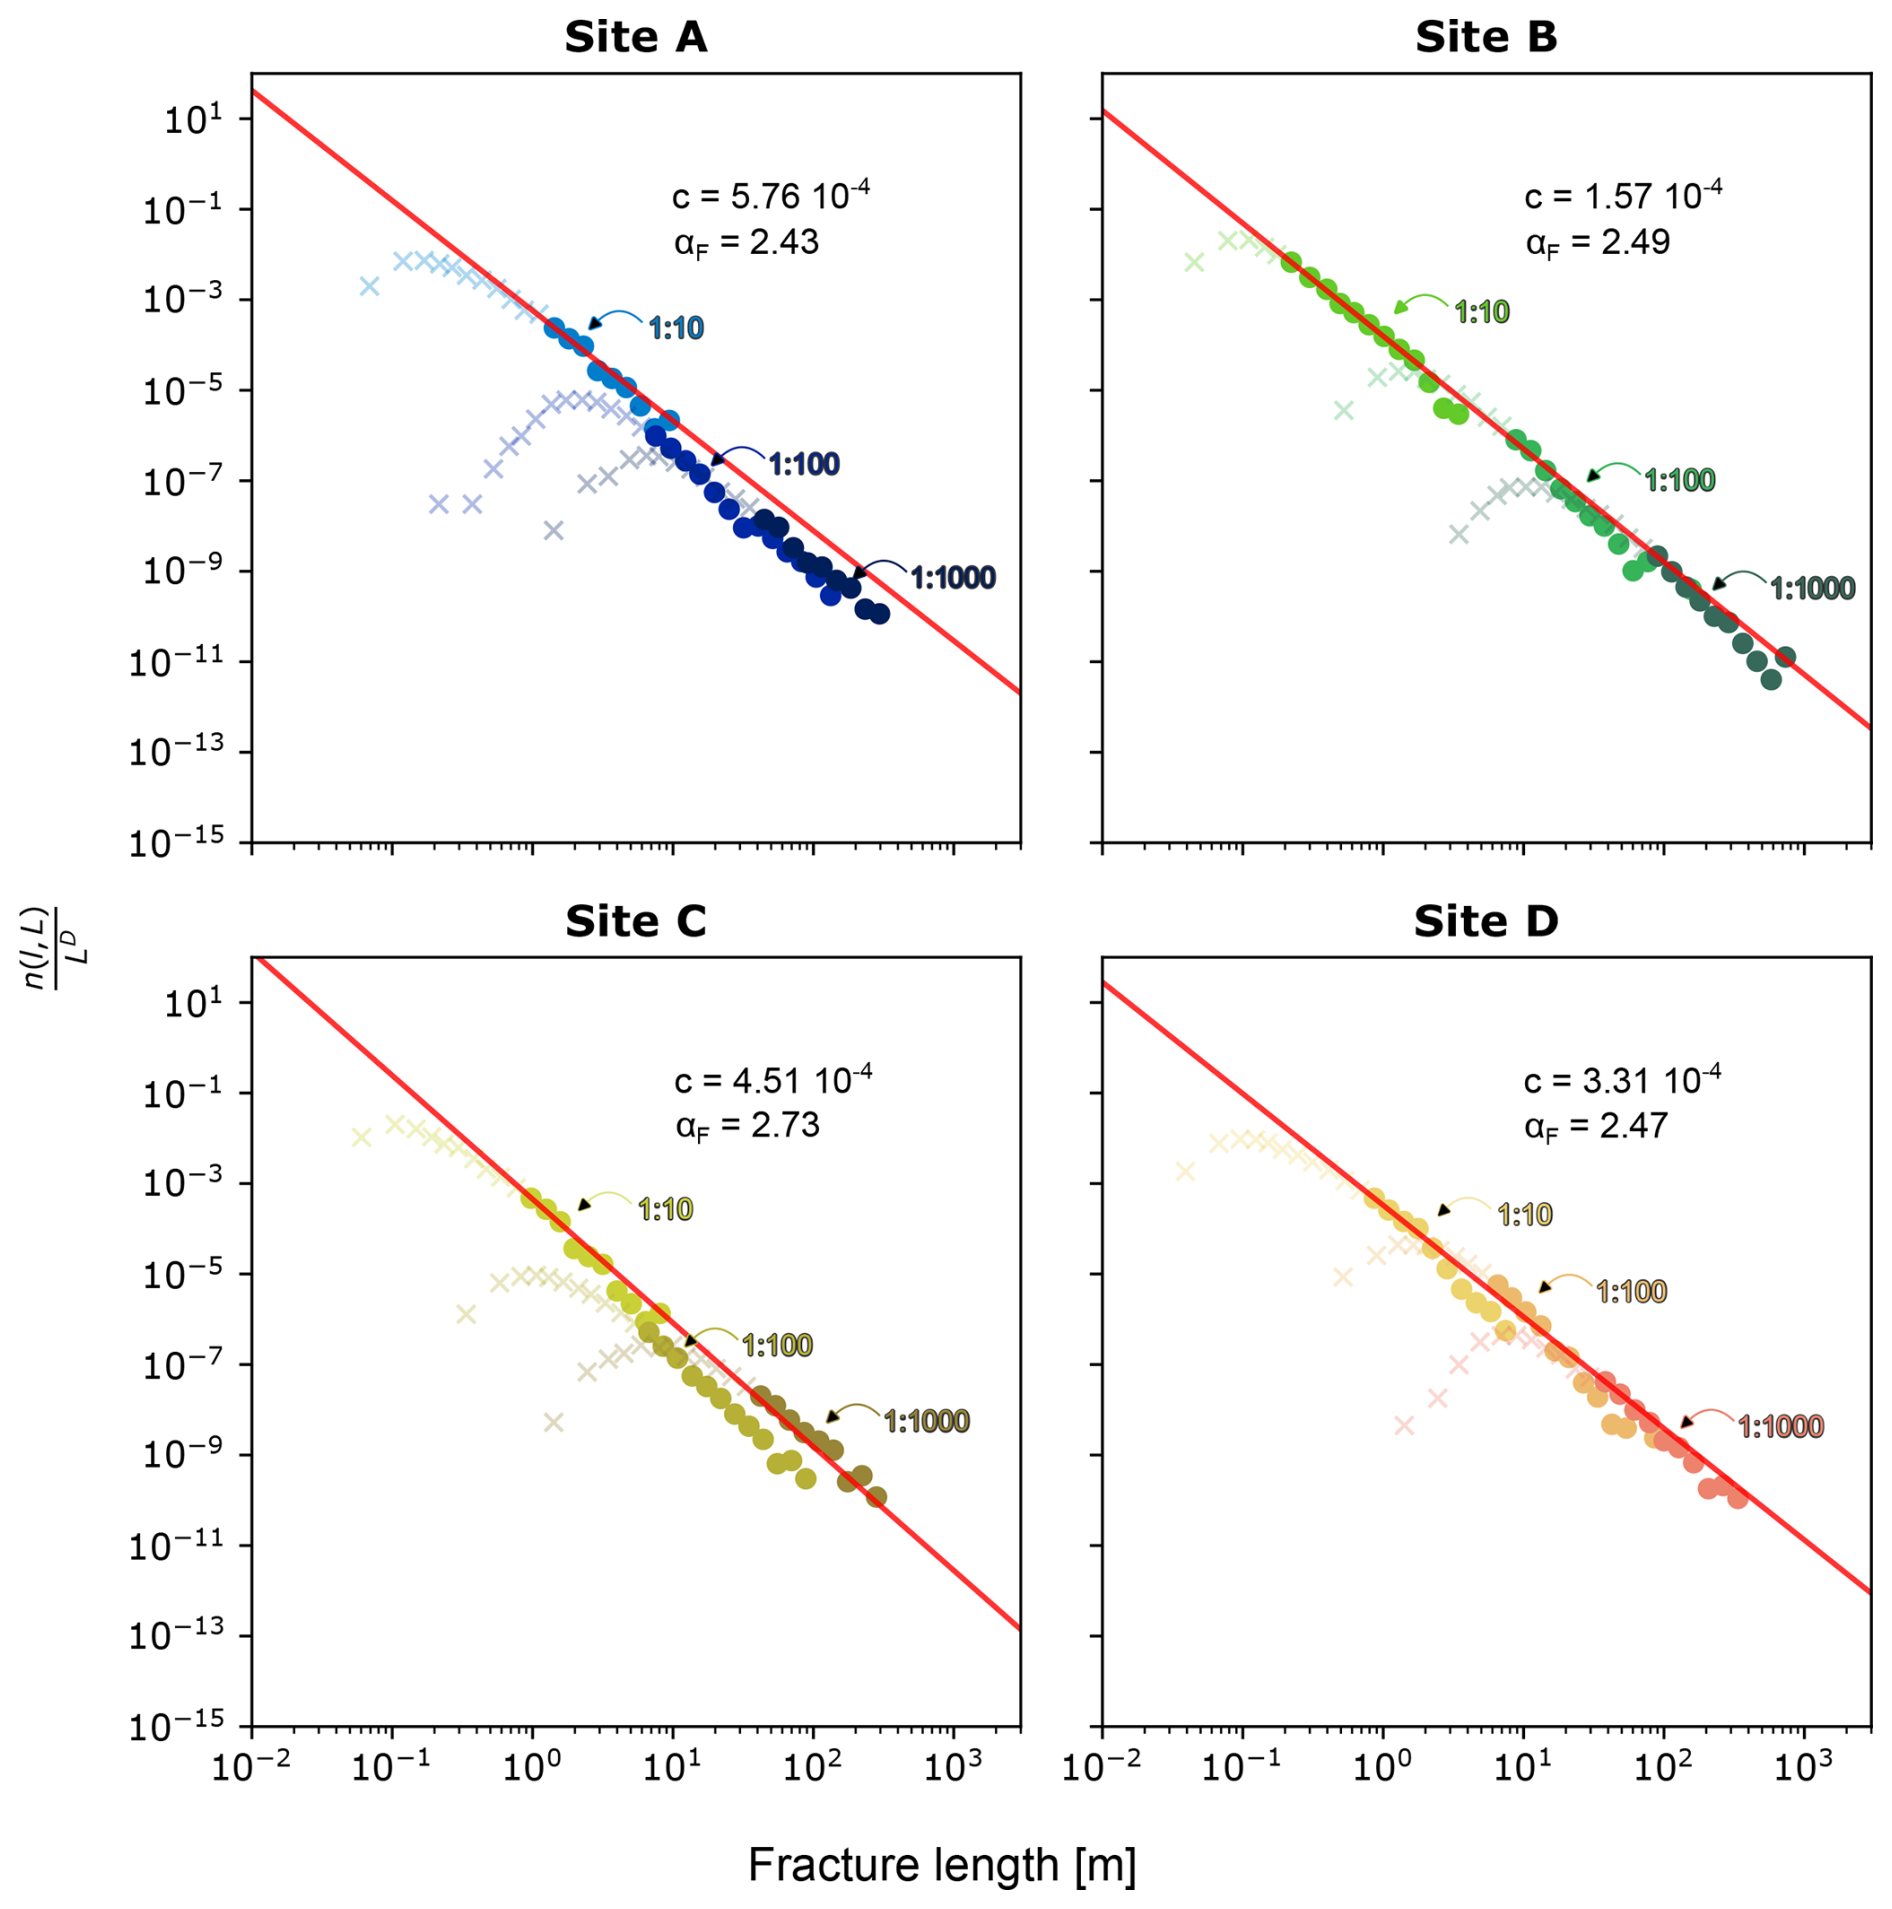
Figure 6Normalized size distributions of the fracture networks for all four study sites, derived from the multi-scale approach. Circles denote the unbiased data, while crosses show the truncated and censored parts of the data. The different color shades represent data from the three mapping scales. The respective fracture density term c and the power law exponent αF are given at the top right.
4.2 Earthquake ruptures
Next, we assess the orientation and size distributions of seismic rupturing at depth, derived from focal mechanism data and earthquake rupture lengths for the different subdomains denoted in Fig. 1b. We therefore use a compilation of 69 previously published focal mechanisms and 4612 earthquakes of the earthquake catalog of Diehl et al. (2021b) that lie within the seismotectonic domain z21 shown in Fig. 1 (see Sect. 3.2).
4.2.1 Orientation distribution
The data from the focal mechanism catalog reveal consistent rupture orientations within the different subdomains, with known earthquake ruptures predominantly occurring along subvertical, E–W- to NE–SW-striking planes (Fig. 7). While in subdomain A in the Aiguilles Rouges massif, the known active planes dip steeply towards the south (Fig. 7a), steeply north-dipping earthquake ruptures are observed additionally in the central and eastern subdomains C and D (Fig. 7c and d). For the data of subdomain B, currently no active rupture planes are provided in the published focal mechanism data, but ENE–WSW-striking nodal planes render similar active rupture orientations possible (Fig. 7b). Together with the observation of the NE–SW-directed clustering of the seismicity (Fig. 1b), this implies that the majority of the seismicity in the Rawil region occurs along subvertically oriented E–W- to NE–SW-striking fractures.
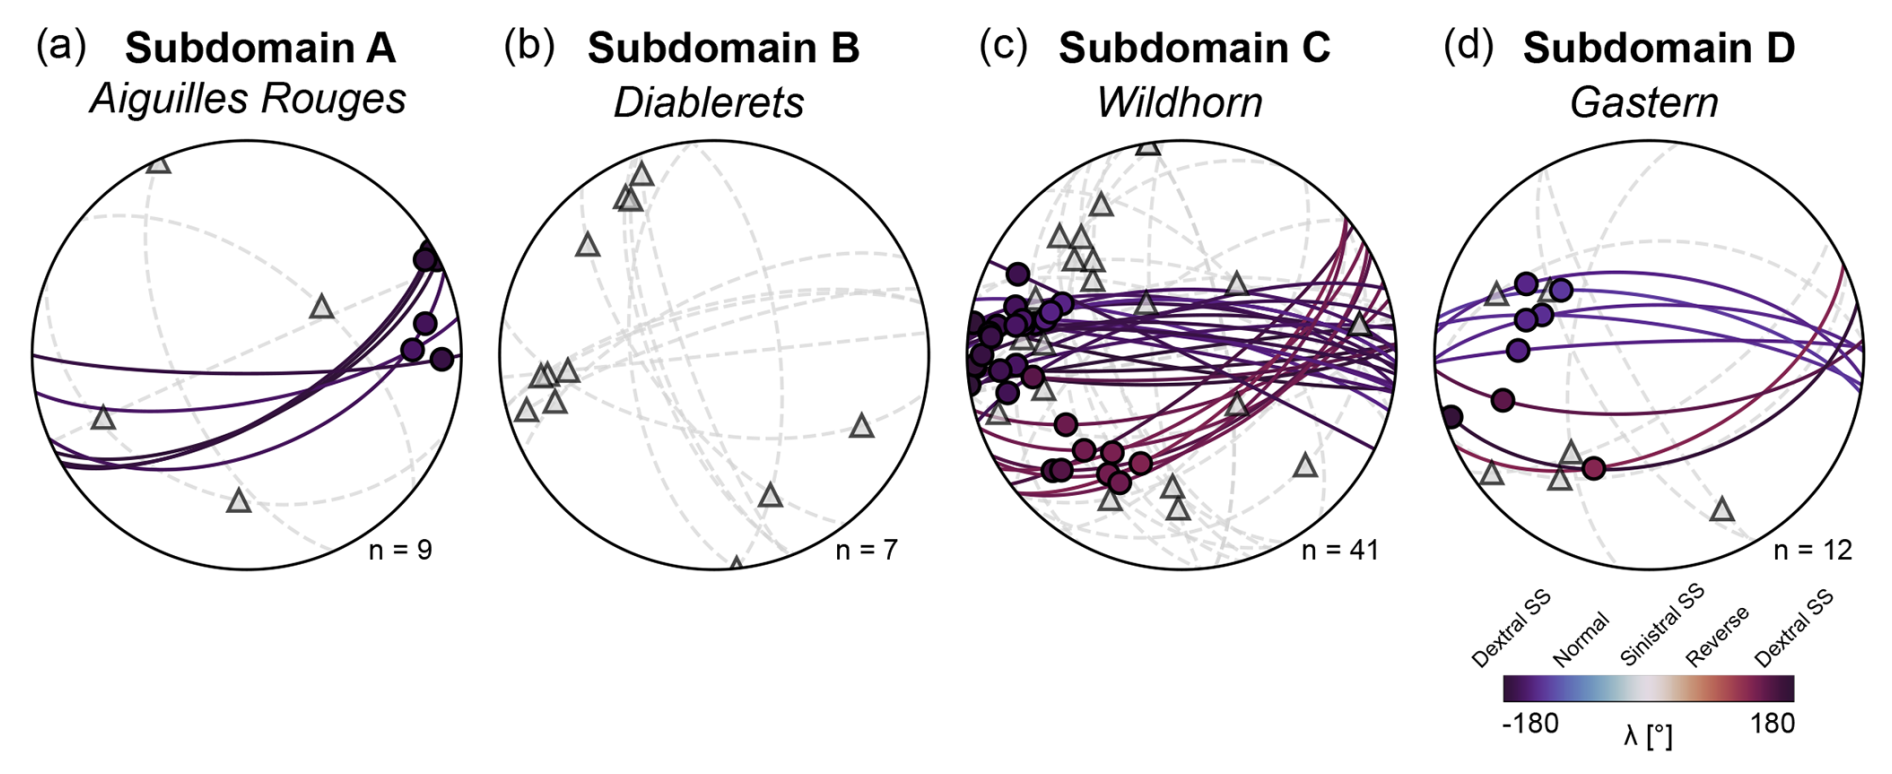
Figure 7Three-dimensional orientation distributions of earthquake ruptures based on the nodal planes from published focal mechanism data (see text for references). Solid colored lines: known active fracture planes with slip vectors plotted as circles. Focal mechanisms without a known active fracture plane are represented by dashed grey lines (planes) and triangles (slip vectors). Secondary nodal planes for focal mechanisms with a known active plane are not shown in the figure.
4.2.2 Size distribution
As shown in Fig. 8, the size distribution of earthquake ruptures for the different subdomains all follow power laws at length scales between about 102 and 103 m. For the data of subdomains A and D, we observe a deviation from power law behavior in the upper tail of the distribution, likely related to individual larger earthquakes. In subdomain A, this can be attributed to the ML= 4.9 Vallorcine earthquake in 2005 (Fréchet et al., 2011), while in subdomain D, it relates to the ML= 4.1 Salgesch earthquake in 2016 (Diehl et al., 2018). In subdomains B and C, we observe well-defined power law distributions for the earthquake rupture lengths. The three empirical Mw−AR scaling laws used all yield similar values of αR, which indicates that a significant dependency from the empirical scaling relations used on the obtained power law exponents appears unlikely (Fig. 8). In general, the derived earthquake rupture power law exponents αR all range between values of 3.88 and 4.81 regardless of the earthquake rupture scaling law used (L14, T17, and WC94), implying little along-strike variations in the αR values. As the size distribution of earthquakes often shows variations with depth, we further investigate a possible depth dependency in Sect. 5.4.
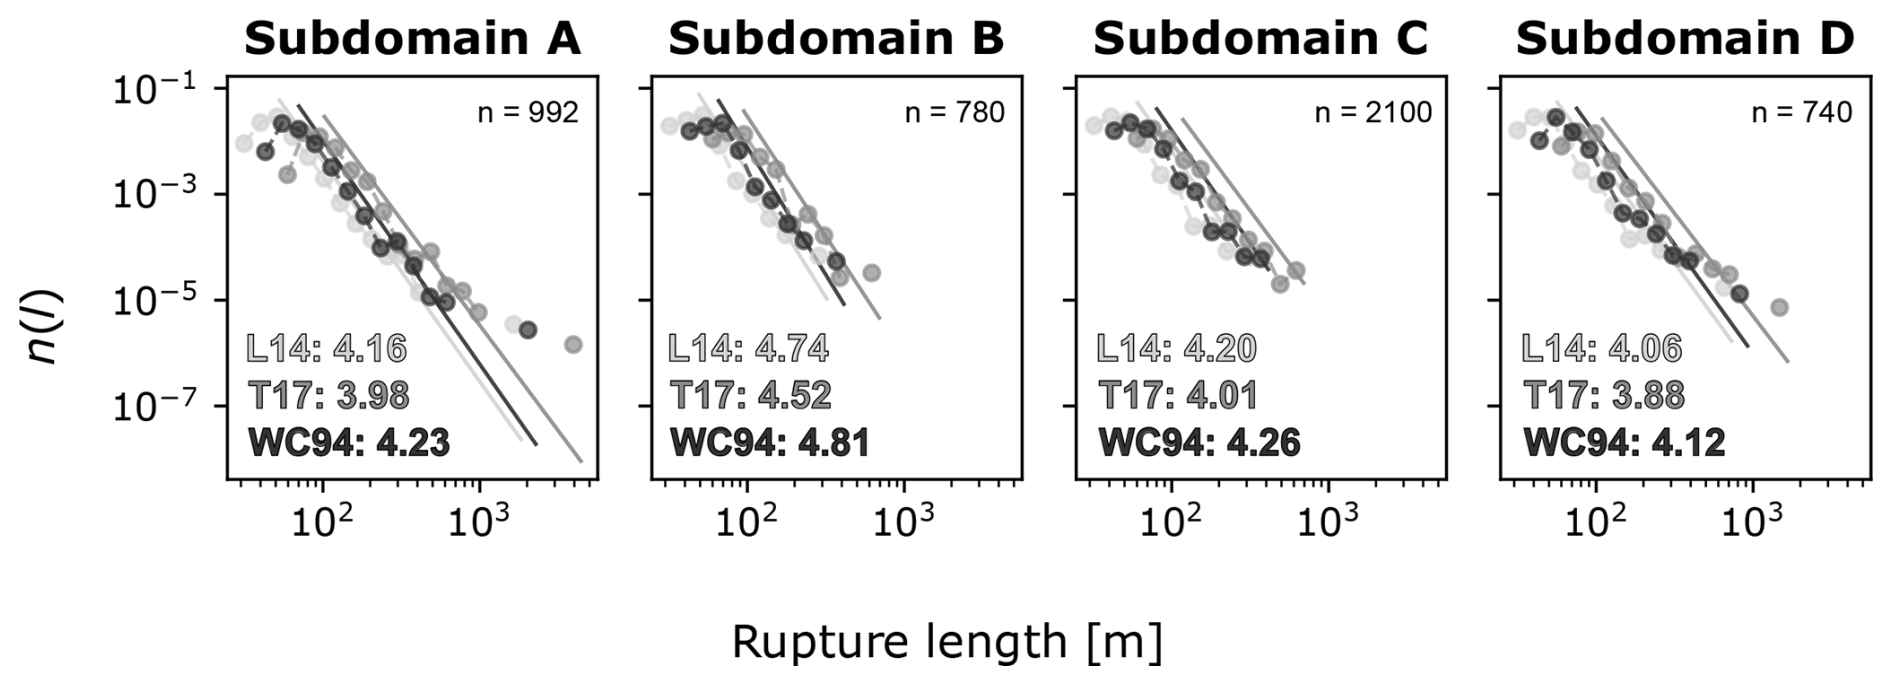
Figure 8Three-dimensional size distribution of earthquake ruptures for the four subdomains. The earthquake magnitudes Mw were converted into rupture lengths LR with the scaling laws of Leonard (2014) as L14, Thingbaijam et al. (2017) as T17, and Wells and Coppersmith (1994) as WC94 represented by the different grey scales, yielding three slightly different size distributions and αR values. The values in the bottom left indicate the respective values of αR.
Overall, the αR and αF exponents exhibit significant differences that are unlikely to be solely attributed to uncertainties. These differences will be further explored in the discussion section.
5.1 Uncertainties in fracture size distributions
In the following, we discuss two of the major uncertainties related to data sampling that can affect the fracture size distributions: (i) the finite mapping resolution of fracture trace lengths and (ii) the choice of the subsampling mapping area as well as the potential bias due to manual mapping.
Mapping fracture traces on a fixed mapping scale on imagery with a given finite resolution necessarily leads to a bias in the derived fracture lengths, as the terminations of the fracture traces can only be mapped with a certain accuracy that is dependent on the image resolution. This potentially shifts the data along the horizontal axis of a log–log plot, leading to variations in the derived power law exponent αF. We here use the rather conservative assumption that the fracture trace lengths are mapped with errors ϵ of 0.05 m (1:10), 0.5 m (1:100), and 5 m (1:1000) at the different mapping scales. We then randomly perturb all measured fracture traces with length values between [−ϵ, ϵ] with a uniform distribution and calculate the αF value for 100 Monte Carlo (MC) simulations. As shown in Fig. 9a, the normalized density distributions show relatively little variation. The derived mean power law exponents αF between 2.14 and 2.80 are similar to the values reported in Fig. 6, and the standard deviations of up to 0.15 suggests that the influence of uncertainties related to fracture length estimation on αF is small (Fig. 9b).
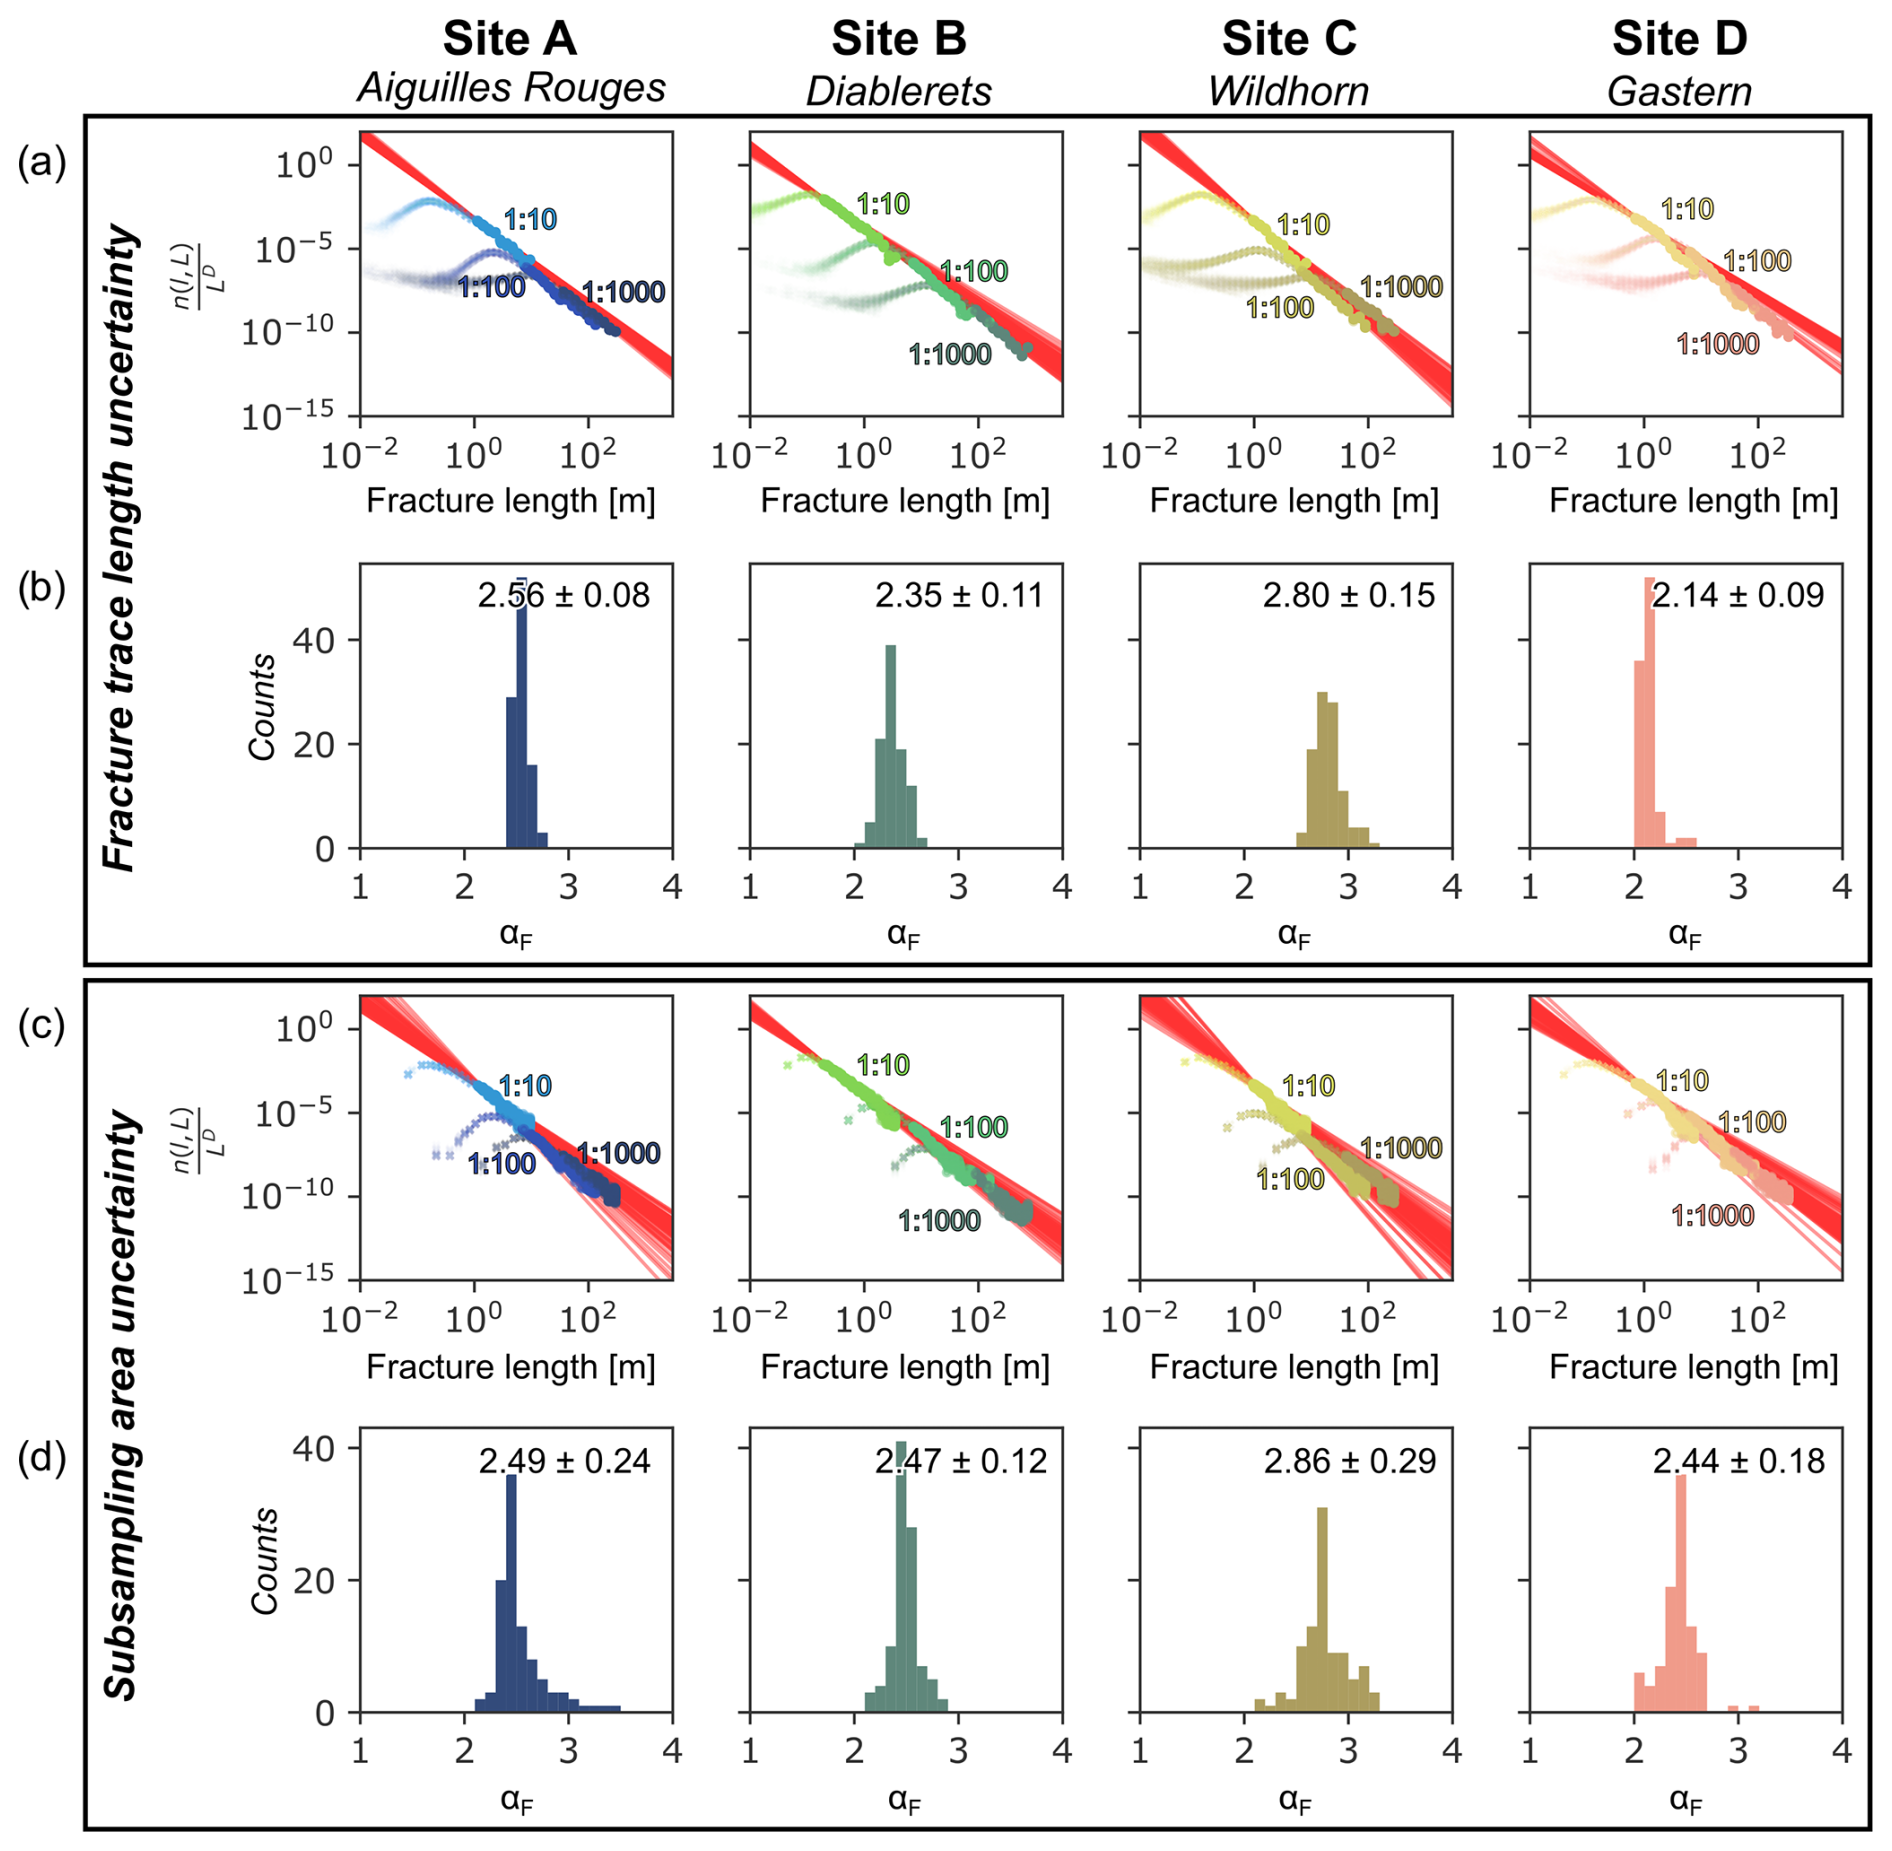
Figure 9(a) Assessment of the fracture trace length uncertainties. The plots show the normalized density size distributions with fracture trace lengths perturbed with values 0.05, 0.5, and 5 m. (b) Histogram of the derived αF values. The values report the mean αF value and the respective standard deviation. (c) Assessment of the subsampling area uncertainties, showing the normalized density size distributions with the number of fractures in each dataset randomly altered between −25 % and +25 %. (d) Histogram of the derived αF values of the sampling area uncertainties. The values report the mean αF value and the respective standard deviation.
As the multi-scale approach used in this study relies on fracture datasets from different scales, it is critical to assess the influence of the choice of different subsampling areas. The derived fractal dimension values below 2 suggest that the fracture density is not a perfectly homogeneous property in the investigated fracture networks (Figs. 3 and 5). Therefore, the spatial choice of the subsampling area for the next detailed scale leads to uncertainties in the size distribution, as differences in fracture densities shift the data along the vertical axis, affecting the calculation of αF. Additionally, fracture traces may be overlooked or linear features not representing fractures may be interpreted as fractures during manual mapping of fracture traces, leading to a similar effect. When selecting subsampling areas, we tried to avoid specific geometric features (i.e., fracture linkages, fracture terminations) and focused on minimizing topographic effects and Quaternary cover, since these factors can significantly bias the power law exponent estimates, leading to an overestimation of αF (Cao and Lei, 2018). To assess the influence of changes in fracture densities due to the arbitrary choice of the subsampling area, we randomly altered the number of mapped fractures from −25 % to +25 % and derive αF for 100 MC simulations. Compared to the fracture trace length uncertainties, the effect of the subsampling area uncertainties is more pronounced (Fig. 9c and d). However, the derived αF values still vary in a small range between 2.44 and 2.86, with standard deviations of up to 0.29.
We conclude from this analysis that both uncertainties related to the fracture trace length estimation and the choice of the subsampling area and manual mapping have a limited influence on the derived power law exponents αF. We thus expect the true power law exponents of the fracture networks αF to range between 2.5 and 3, with little regional and lithological variation.
5.2 Fracture network characteristics
The fracture networks from the four different study sites across the Rawil depression illustrate the pervasive but systematic fracturing in the study area (Fig. 3). Interestingly, the 2D orientation distributions for an individual site appear to be consistent across scales (Fig. 3), which is in agreement with the findings of Odling (1997). This implies that the fracture orientations are self-similar, and thus scale-independent, suggesting that a single-scale mapping should be sufficient to capture accurate information on the orientation distribution within a fracture network. Comparing the fracture networks of the different sites, however, we observe variations in the dominant strike orientations (Fig. 3). While in the ECMs, at both site A in the Aiguilles Rouges massif and site D in the Gastern massif, NW–SE- and NE–SW-striking fractures prevail, the limestone nappes overlying the central part of the Rawil depression are characterized by predominantly E–W- to NE–SW-striking fractures. NE–SW-striking fractures are, however, also present in both sites A and D, implying that these fractures are regional features, roughly following the direction of the RSF and the seismogenic RFZ (Fig. 1a).
The αF values for the four different study sites are all in the same order and range between 2.5 and 3 (Fig. 6). As shown in Table 2, these results are in good agreement with previously published values that generally lie between 2 and 3, which suggests that this range can be seen as a first-order universal law of fracture size distributions, independent of the host rock lithology. Also the derived fractal dimension D values of around 1.7 are consistent with values reported in the literature (Bonnet et al., 2001, and references therein).
Table 2Compilation of published power law exponents αF from fracture size distributions sorted by the analysis approach used (single- vs. multi-scale power law fitting), with complementary information deduced where available. As both cumulative (CDF) and probability density functions (PDF) are used for fitting fracture length data, we have to make the CDF-based values comparable to our PDF-based αF values by using αCDF+1 (Bonnet et al., 2001). N: total number of data; αF (published): published power law exponent and the distribution used; αF (PDF): power law exponents converted to PDF values (Bonnet et al., 2001); lower and upper limit: approximate bounds of the power law scaling range. Bold font emphasizes PDF-converted values (directly comparable to our values).
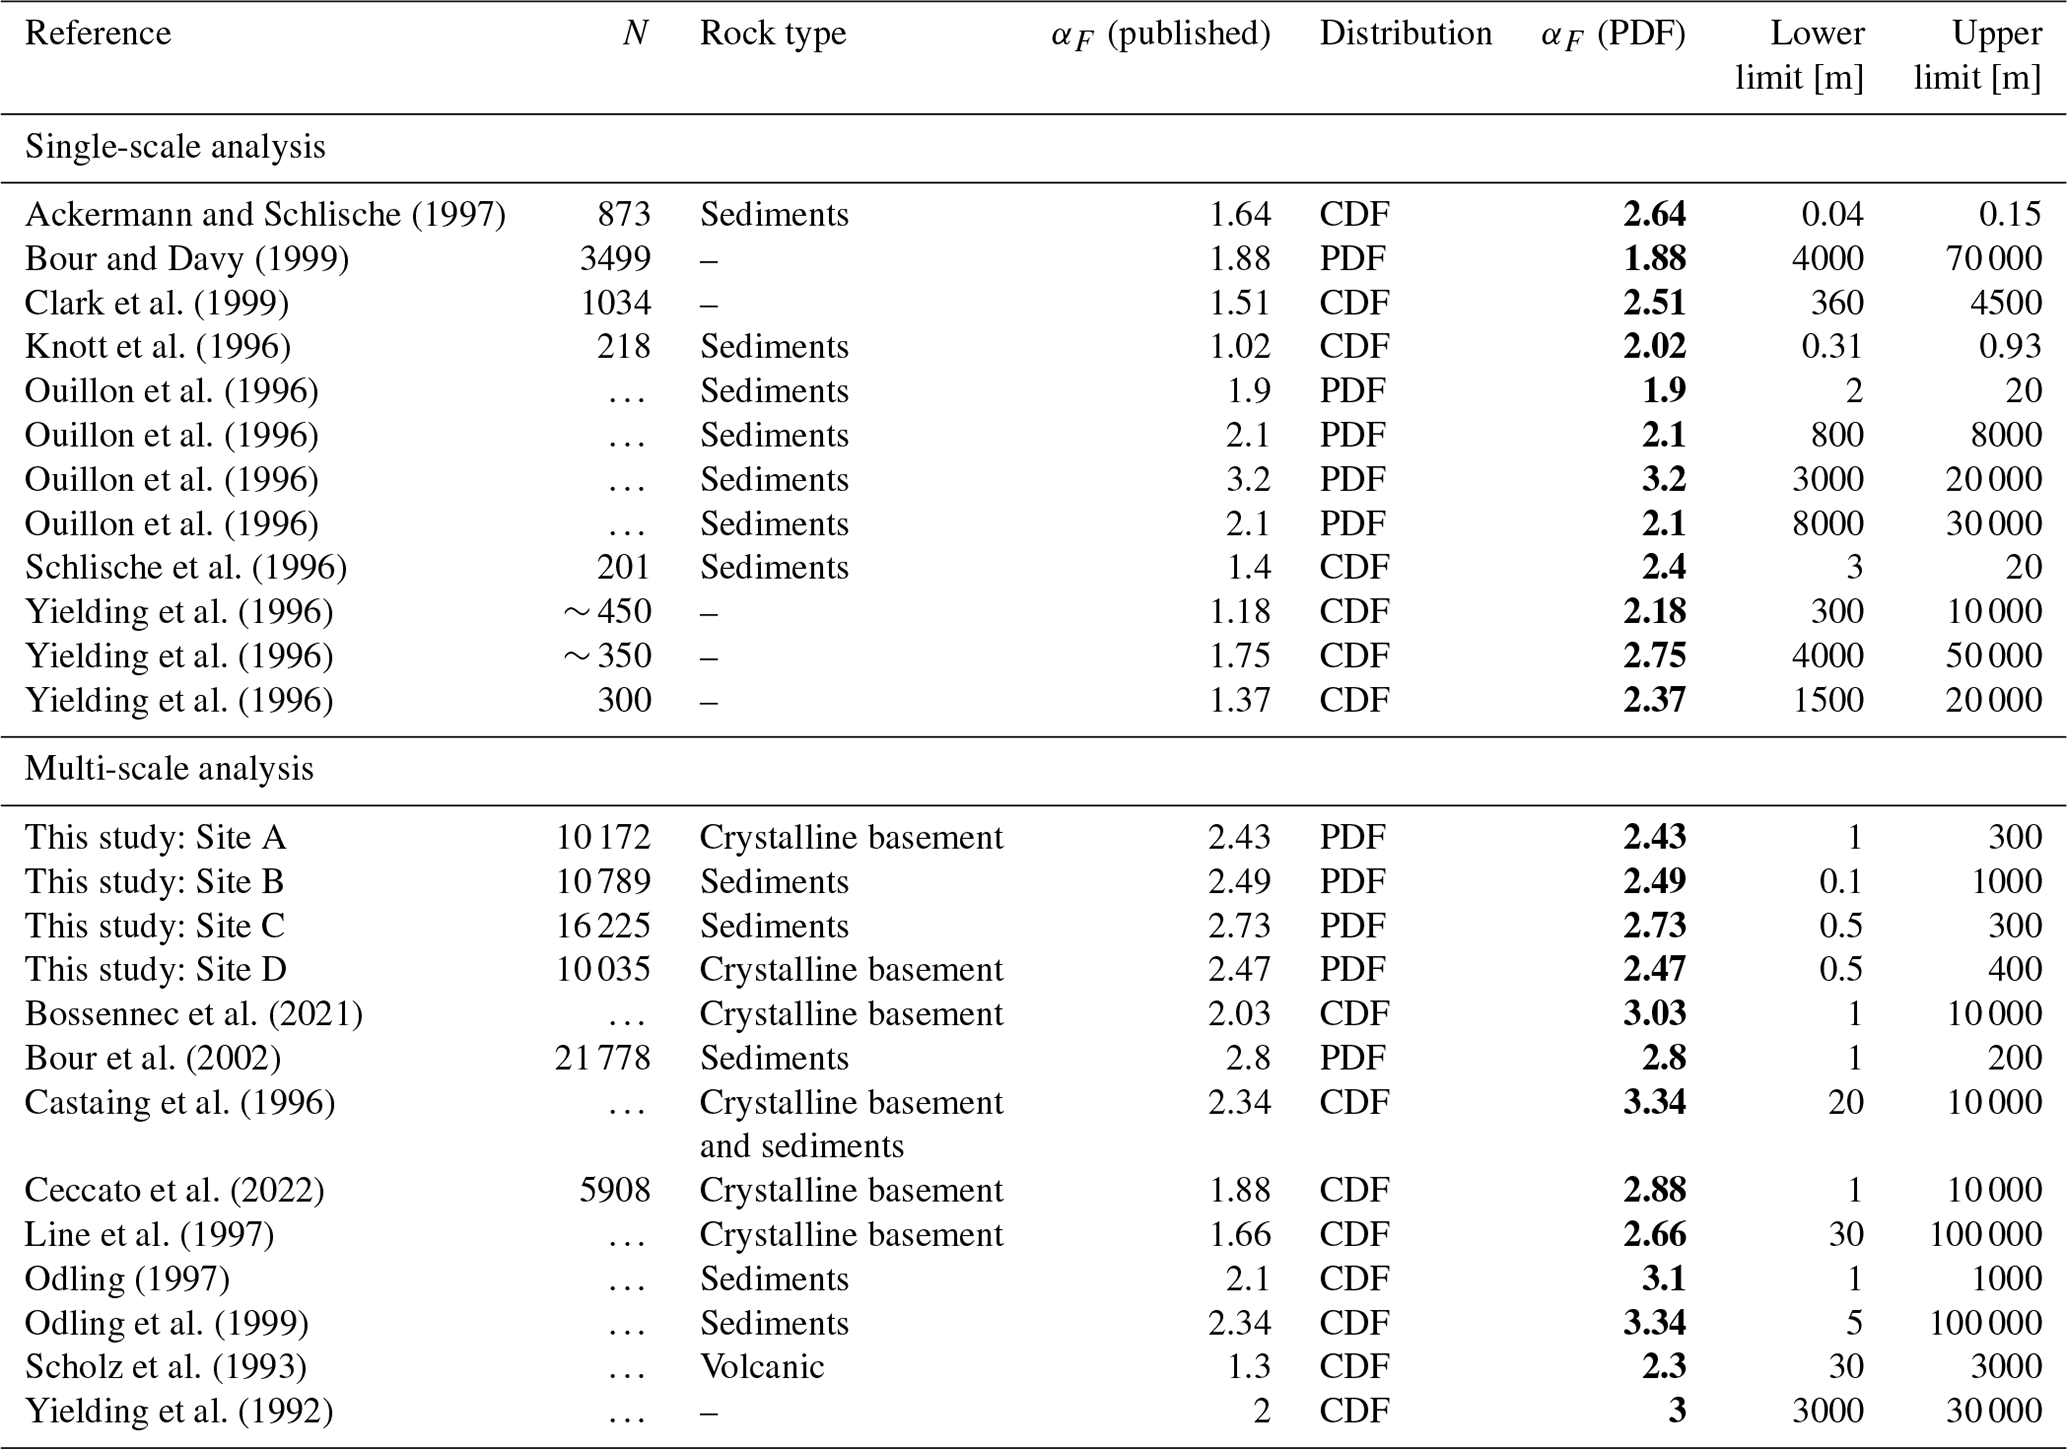
The multi-scale approach used herein has the benefit to greatly expand the length range of the individual fracture trace datasets compared to single-scale analysis (Figs. 2b and 6). The power law distributions derived in this study cover fracture length scales of 3 orders of magnitude between about 100 and 103 m, and it is likely that the power law holds also for smaller and larger fractures. In nature, however, all power laws must have upper and lower physical limits (Bonnet et al., 2001; Torabi and Berg, 2011; Turcotte, 1997, 1989). The detected lower scaling limit of 100 m likely does not reflect the actual physical length scale (e.g., caused by grain size effects), and we thus speculate that our analysis does not incorporate the lower limit of the power law scaling. Identifying the true limit of the power law would require a similar analysis of high-resolution datasets at smaller scales. The derived upper limit of around 103 m is way below the assumed thickness of the seismogenic part of the crust of around 15 km, as well as the thickness of the Helvetic nappe system of a few kilometers (Burkhard, 1988; Levato et al., 1994; Pfiffner et al., 1997; Steck et al., 1997). However, stratigraphic layering effects within the Helvetic nappes (e.g., Pfiffner, 1993) could influence the upper limit of the power law size distributions (Odling, 1997), at least for sites B and C. Since the upper scaling limits do not significantly differ between the different lithologies, we consider this effect to be of minor importance within the observed length range. We thus assume that our data only cover a limited length range of the actual fracture size distribution and that the power law scaling holds for smaller and larger fractures than studied herein. This interpretation is supported by the fact that the previously reported αF values for lengths between 10−1 and 105 m all lie in a similar range (Table 2).
5.3 Potential links to the seismicity
The strong vertical components due to the exhumation-related tectonics during the latest stage of the Alpine orogeny, accompanied by enhanced glacial surface erosion in the past 2 Myr (Häuselmann et al., 2007; Glotzbach et al., 2010; Valla et al., 2012; Fox et al., 2015; Sternai et al., 2019), led to the exposure of the fracture networks studied herein (Egli et al., 2017; Herwegh et al., 2020; Cardello et al., 2024). Based on observations of both exhumed fracture patterns, earthquake hypocenter locations, and focal mechanisms, previous authors suggested that the exhumed fracture networks in the region of the Rawil depression were formed under a similar stress field to that which prevails today (Cardello and Mancktelow, 2015; Maurer et al., 1997; Pavoni, 1980a, b). As earthquakes and fractures are inherently related, they are expected to exhibit similar orientation and size distributions (Bonnet et al., 2001; Scholz, 2007, 1998, 1997). In the following, we attempt to compare these statistical properties of the exhumed fracture networks with the same properties of the seismicity in the study region.
Comparing the orientation distributions of the fracture networks (Figs. 3 and 4) with the earthquake ruptures (Fig. 7) in a first step, we observe a correlation only in the center of the Rawil depression for study sites and subdomains B and C. The E–W- to NE–SW-striking fracture set CI (Fig. 4e and f) correlates with the active fracture planes from the respective subdomain C (Fig. 7c). The dextral strike-slip kinematics of the NE–SW-striking fractures reveals striking similarities to the kinematics of the earthquake ruptures (Figs. 4f and 7c). In subdomain B, where no active fracture planes are deciphered (Fig. 7b), the average orientation of the fracture planes generally renders earthquake rupturing along E–W- to NE–SW-striking planes possible, which would correspond to the reactivation of fracture sets BI and BII (Figs. 4c and d). However, recent high-precision hypocenter datasets suggest that NW–SE-striking fracture planes are reactivated at least in the northern part of the Rawil depression (Diehl et al., 2024). In the ECMs on both sides of the Rawil depression, the correlation between the orientation distributions is less clear. In subdomain A, earthquake ruptures strike ENE–WSW (Fig. 7a), likely corresponding to the similarly oriented AI fractures (Fig. 4a). It thus seems that the recent earthquakes mainly reactivate prevailing AI fractures as strike-slip faults (Fig. 7a). The E–W-striking active rupture planes in subdomain D (Fig. 7d) are not reflected by the bimodal fracture network of site D at all (Fig. 4g), which is therefore likely not a good proxy for the E–W-directed seismicity in subdomain D. This might be due to the fact that the chosen study site lies slightly outside the main seismic corridor. This difference could be explained by mechanically detached Aar and Gastern massifs, which also exhibit significantly lower seismic activity (Fig. 1b). The mapped NW–SE-striking fractures could thus represent the eastern lateral boundary of the main E–W- to NE–SW-striking seismogenic RFZ (e.g., Lee et al., 2023). Overall, earthquake ruptures in the Rawil depression and the RFZ seem to occur mainly along subvertical E–W- to NE–SW-striking planes, and the exhumed fracture networks show similar directions at least in the central part of the Rawil depression above the main earthquake corridor (Fig. 1b). This implies that the active fractures in the basement are consistent with exhumed fracture networks in the Helvetic nappes, indicating a link across various structural levels and different lithologies. Combined with the observation that αF values reveal little sensitivity to lithological variations, we argue that the fracture networks of sites B and C serve as a good first-order analog of the seismically reactivated fracture networks at depth.
5.4 Implications for orogen-internal settings
As earthquakes usually occur several kilometers below the surface where direct information about the prevailing fracture networks is sparse, the underlying processes of seismogenic deformation often remain uncovered. However, (i) the good agreement of fractures and earthquakes in terms of their orientation distributions, (ii) the insensitivity of αF to lithological variations across different structural levels, and (iii) the observation that both features arguably formed in a similar stress field (Cardello and Mancktelow, 2015; Maurer et al., 1997; Pavoni, 1980a, b) imply that the exhumed fracture networks in our study area might serve as a good first-order analog for the fracture networks at depth. We therefore attempt to compare the size distributions of the fracture networks and earthquake ruptures in a next step. As the power law exponent of fracture networks is dependent on the dimensionality of the data (e.g., Bonnet et al., 2001), we have to consider that the power law exponents were obtained from 2D (fractures) and 3D (earthquake ruptures) observations. Stereological considerations have demonstrated that the differing dimensionalities can be corrected for by employing the equation (Bonnet et al., 2001; Borgos et al., 2000; Hatton et al., 1993). Consequently, the 3D power law exponents of the fracture networks αF(3D) range somewhere between 3 and 3.6.
The power law exponent of the earthquake size distributions, commonly referred to as b value by seismologists, has been proposed to decrease with increasing differential stress and thus depth (Mori and Abercrombie, 1997; Spada et al., 2013; Scholz, 2019, 2015). We therefore assess the depth-dependent variations in the frequency and size distribution of earthquake ruptures. As no significant lateral variations in αR values were observed within the investigated seismotectonic domain (Fig. 8), we calculate αR values for depth slices that incorporate the entire seismotectonic domain. To minimize potential bias due to the data selection, we randomly iterate through different depth ranges and only fit a power law for datasets with more than 200 entries. Since the majority of vertical uncertainties in the modern era of the earthquake catalog are in the subkilometer range (Diehl et al., 2021b; Lee et al., 2023), we do not consider hypocenter uncertainties.
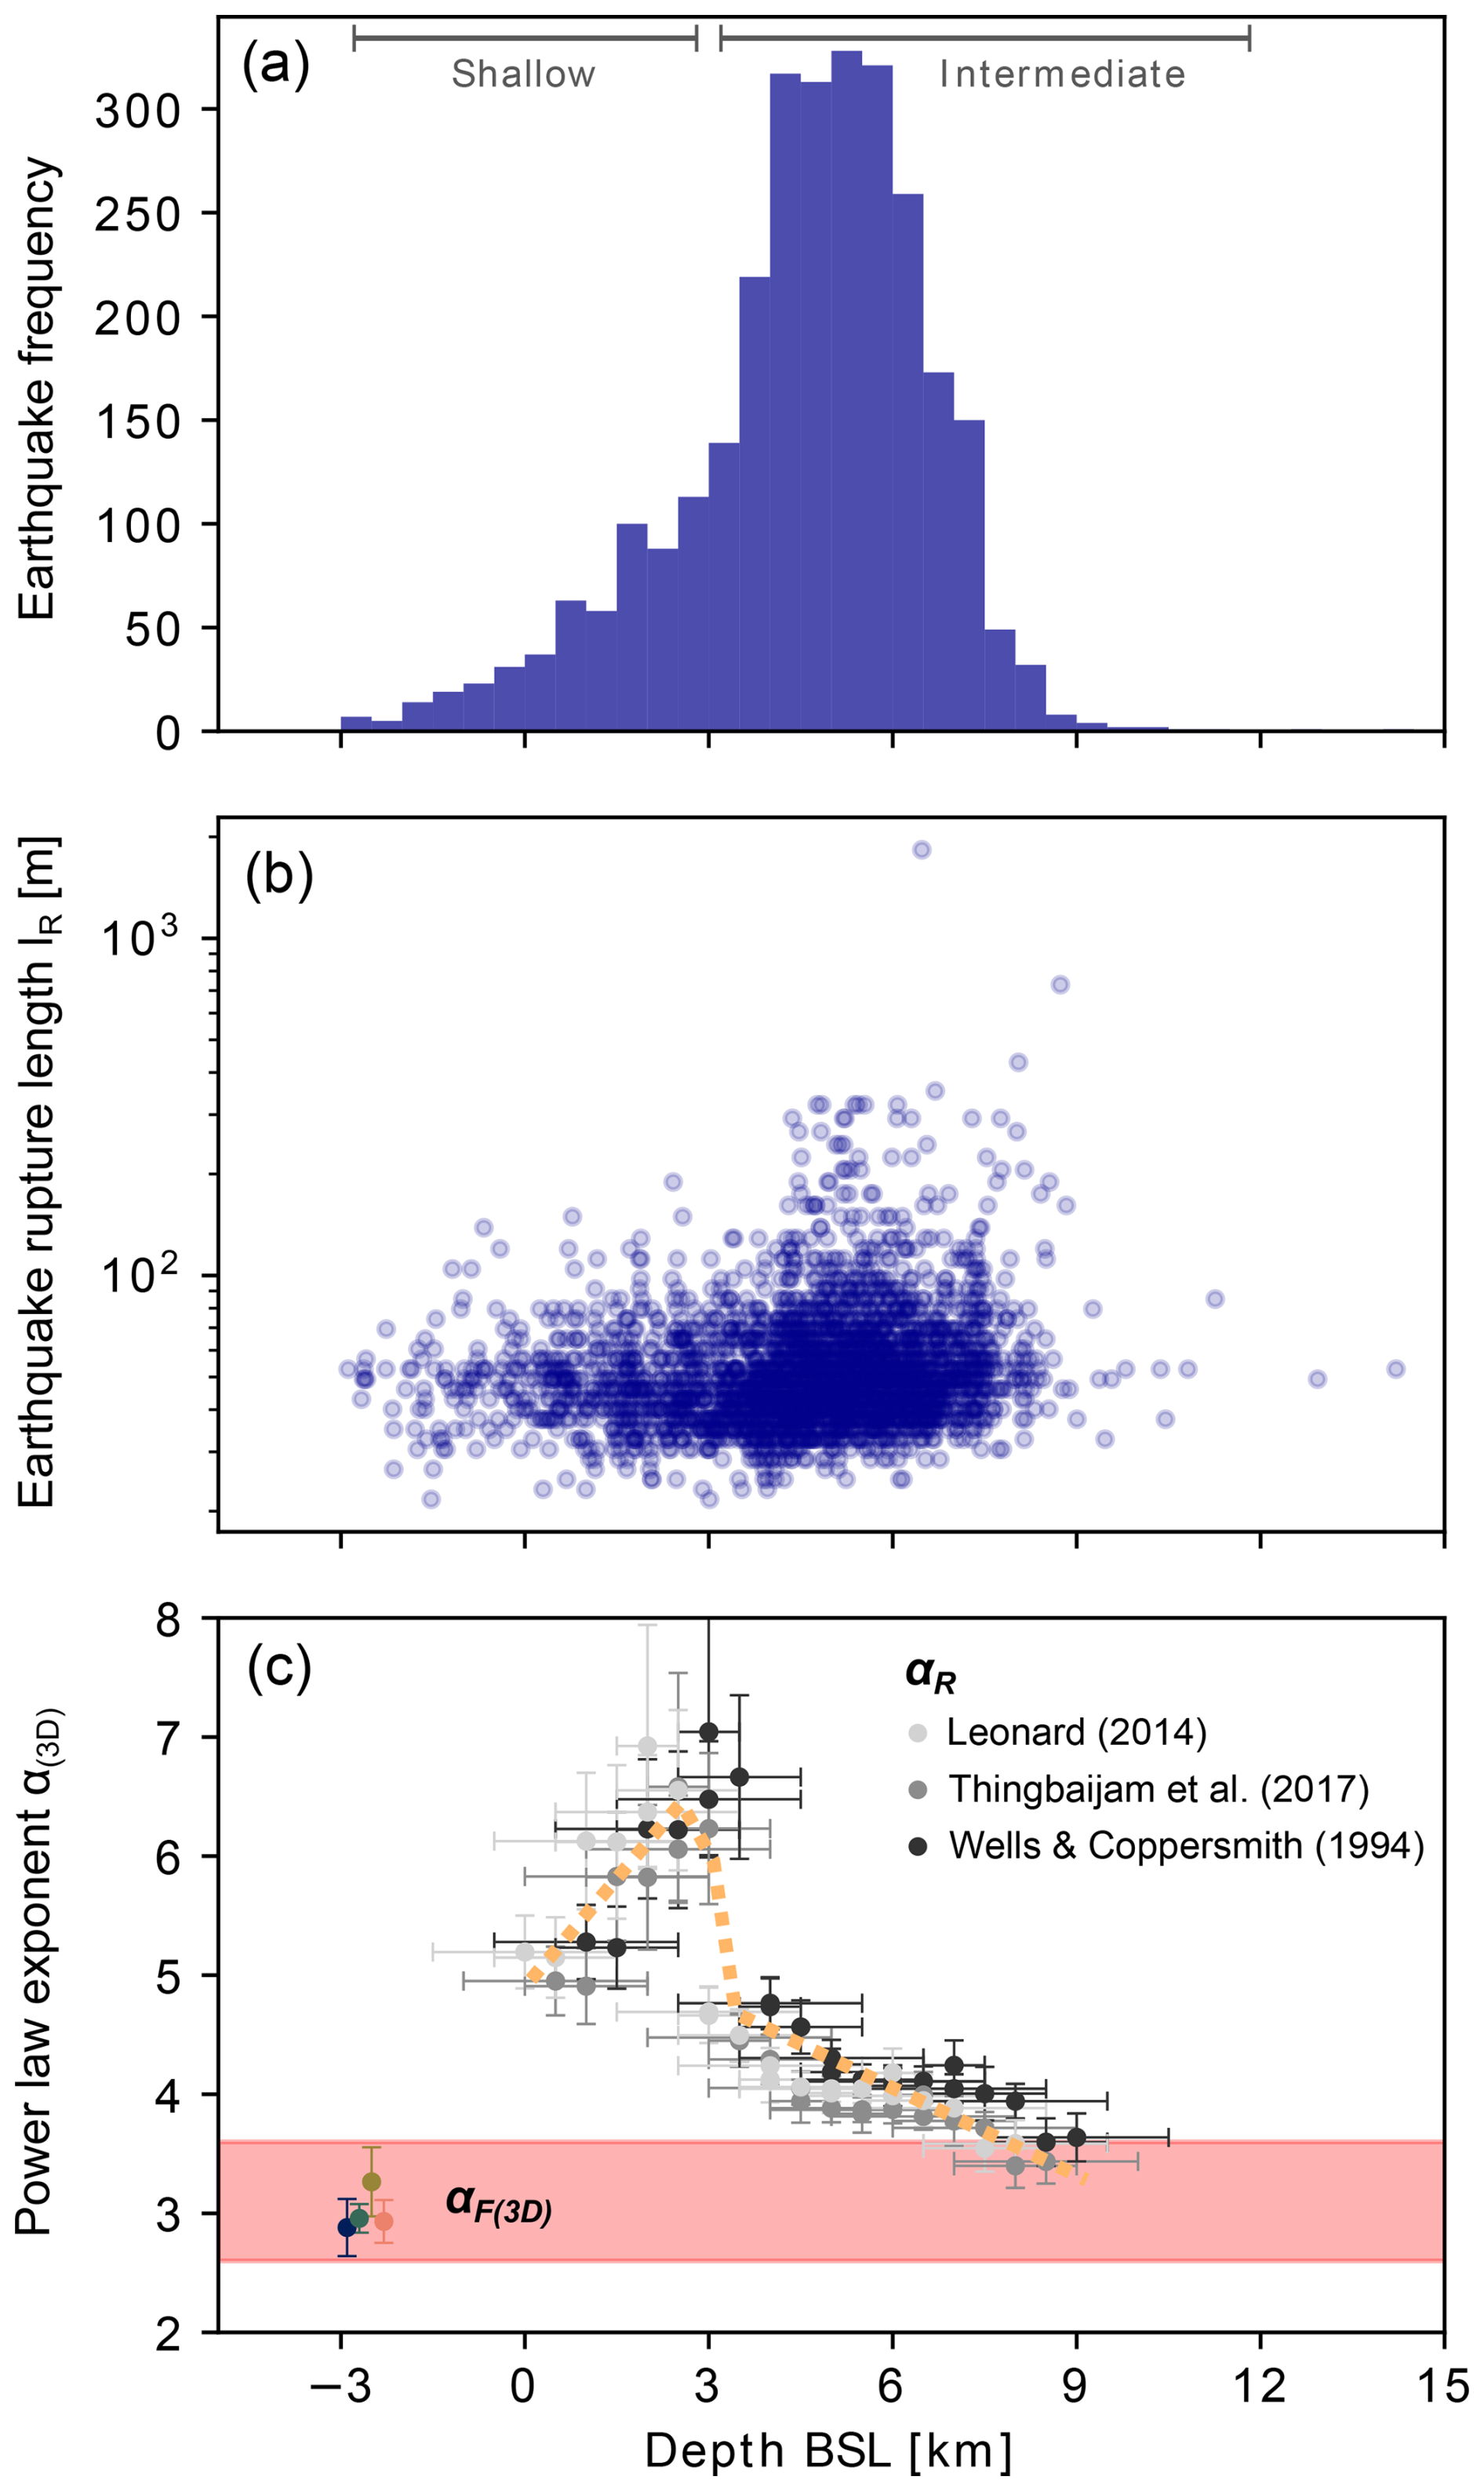
Figure 10Depth dependency of the seismicity in terms of (a) the number of earthquakes, (b) the rupture length lR of the individual earthquakes, and (c) the derived power law exponents α(3D) for both the earthquake ruptures (greyscale) and the fracture networks (colored bars and red box). Error bars denote 1σ uncertainties of the power law exponents (vertical bars) and the depth interval used (horizontal bars).
As shown in Fig. 10a, earthquakes in the study area occur most frequently at depths between 3 and 8 km. The maximum rupture lengths lie, with few exceptions, on the order of 102 m for depths shallower than 3 km, with significantly larger ruptures up to 103 m occurring at depths between 3 and 9 km (Fig. 10b). At greater depths, the seismicity becomes sparse and maximum rupture lengths generally decrease, which could be due to the increasing component of temperature-dependent viscous deformation representing the frictional-viscous transition at the lower depth end (e.g., Wehrens et al., 2016). As expected αR values generally decrease with depth (Fig. 10c), in line with previous studies (e.g., Mori and Abercrombie, 1997; Spada et al., 2013). However, the values for shallow (< 3 km) and intermediate (3–9 km depth) crustal earthquakes differ significantly: while shallow earthquakes reveal αR values of around 5 to 8, values for intermediate earthquakes constantly decrease with depth to values of around 3.5. Comparing the αR values with αF(3D) of the exhumed fracture networks, we notice that for shallow earthquake ruptures a significant discrepancy in the αF(3D) values exists (Fig. 10c). For intermediate earthquakes, αR and αF(3D) values converge towards similar values at around 8 km depth. This observation could potentially be explained by the following two hypotheses.
First, it could be stated that similarly to αR, also αF(3D) values decrease with depth. This cannot be strictly proven, as fracture networks at depth are not directly accessible. The enhanced earthquake frequency at depths > 3 km, however, suggests that the majority of brittle fractures are formed at intermediate depth levels (Fig. 10a). Even though fracturing certainly occurs at shallow depths < 3 km during exhumation as well, the significantly lower earthquake frequency implies that the majority of fractures in the exhumed fracture networks were formed at intermediate depth levels. This interpretation is supported by the proposed formation depths of exhumed fractures in the surroundings of the Rawil depression derived from geological field observations (Cardello and Mancktelow, 2015; Gasser and Mancktelow, 2010; Ustaszewski et al., 2007; Cardello et al., 2024). Together with the absence of significant lithological variations in αF and the consistency with previously reported values from a large variety of tectonic settings (Table 2), we consider this first hypothesis as unlikely.
As a second hypothesis, we thus propose that the αF(3D) values are relatively constant with depth, and αF(3D) and αR converge towards similar values at intermediate depths. According to this argumentation, the decrease in αR values therefore records variations in the reactivation potential of pre-existing fractures at different depth levels due to increasing differential stresses. As the differential stresses are smaller at shallow depths, rupture initiations are more likely to stop before growing into large earthquakes, which leads to larger αR values (Mori and Abercrombie, 1997). In contrast, with increasing differential stress, the likelihood of a rupture initiation (i) to grow into a large earthquake that reactivates the full available fracture length and (ii) to jump across multiple fracture segments is increasing (Manighetti et al., 2007), leading to a convergence of αR and αF(3D) values at intermediate depths. We propose that the similarities in the power law exponents at depths of around 6 to 8 km reveal that earthquakes are more likely to rupture along the entire fracture length at these depths.
Apart from the influence of differential stress, previous studies have shown that also other factors such as the fracture type (Gulia and Wiemer, 2010; Petruccelli et al., 2019a, b; Schorlemmer et al., 2005) or material heterogeneities (Mori and Abercrombie, 1997; Mogi, 1962; Goebel et al., 2017) can lead to changes in the earthquake power law exponents. As the dominant orientations of both the fracture networks and earthquake ruptures are in good agreement (Figs. 4 and 7) and the focal mechanisms mostly imply transtensional movements (Kastrup et al., 2004; Houlié et al., 2018), we argue that the fracturing style has a minor influence on the observed variations in our case. Material heterogeneities, such as differences in lithologies, could potentially explain the increased αR values at shallow depths above 3 km, as this depth correlates with the proposed basement-cover contact below the Rawil depression (Burkhard, 1988; Levato et al., 1994; Pfiffner et al., 1997; Steck et al., 1997; Lee et al., 2023). Stratigraphic layering effects due to the finite thickness of the Helvetic limestone units may limit the size of earthquake ruptures, increasing the αR values at this lithological boundary (Ouillon et al., 1996). However, since the derived αF(3D) values of the limestone and crystalline basement units are rather similar, and the discrepancy between the size distributions of exhumed fractures and earthquake ruptures occurs at shallow depths, we argue that the elevated αR values at shallow depths cannot be explained by differences in material heterogeneities alone, in line with the findings of Scholz (1968). As an additional factor, the existence of fluids impacting pore pressure and friction can weaken the strength of the fractures in the uppermost crust, preventing accumulation of larger amounts of stresses.
In summary, the depth-dependent comparison of the size distributions of fractures and earthquakes suggests that the likelihood of an earthquake rupture to reactivate the entire fracture length is higher at intermediate crustal depths, while for shallower earthquakes differential stresses are rather small, rendering earthquakes that rupture the full available fracture length less likely, which is similar to the interpretations of Tormann et al. (2014) and Hetényi et al. (2018). As illustrated in Fig. 11, partial seismic rupturing thus seems to be the common seismogenic deformation mode at shallow depth in the Rawil depression region. However, it should be noted that other factors, such as lithological changes and the presence of fluids, can influence fracture strength. Consequently, the observed depth-dependent fracture reactivation potential may differ in other regions. To assess the universality of this observation, further investigations in different settings are required.
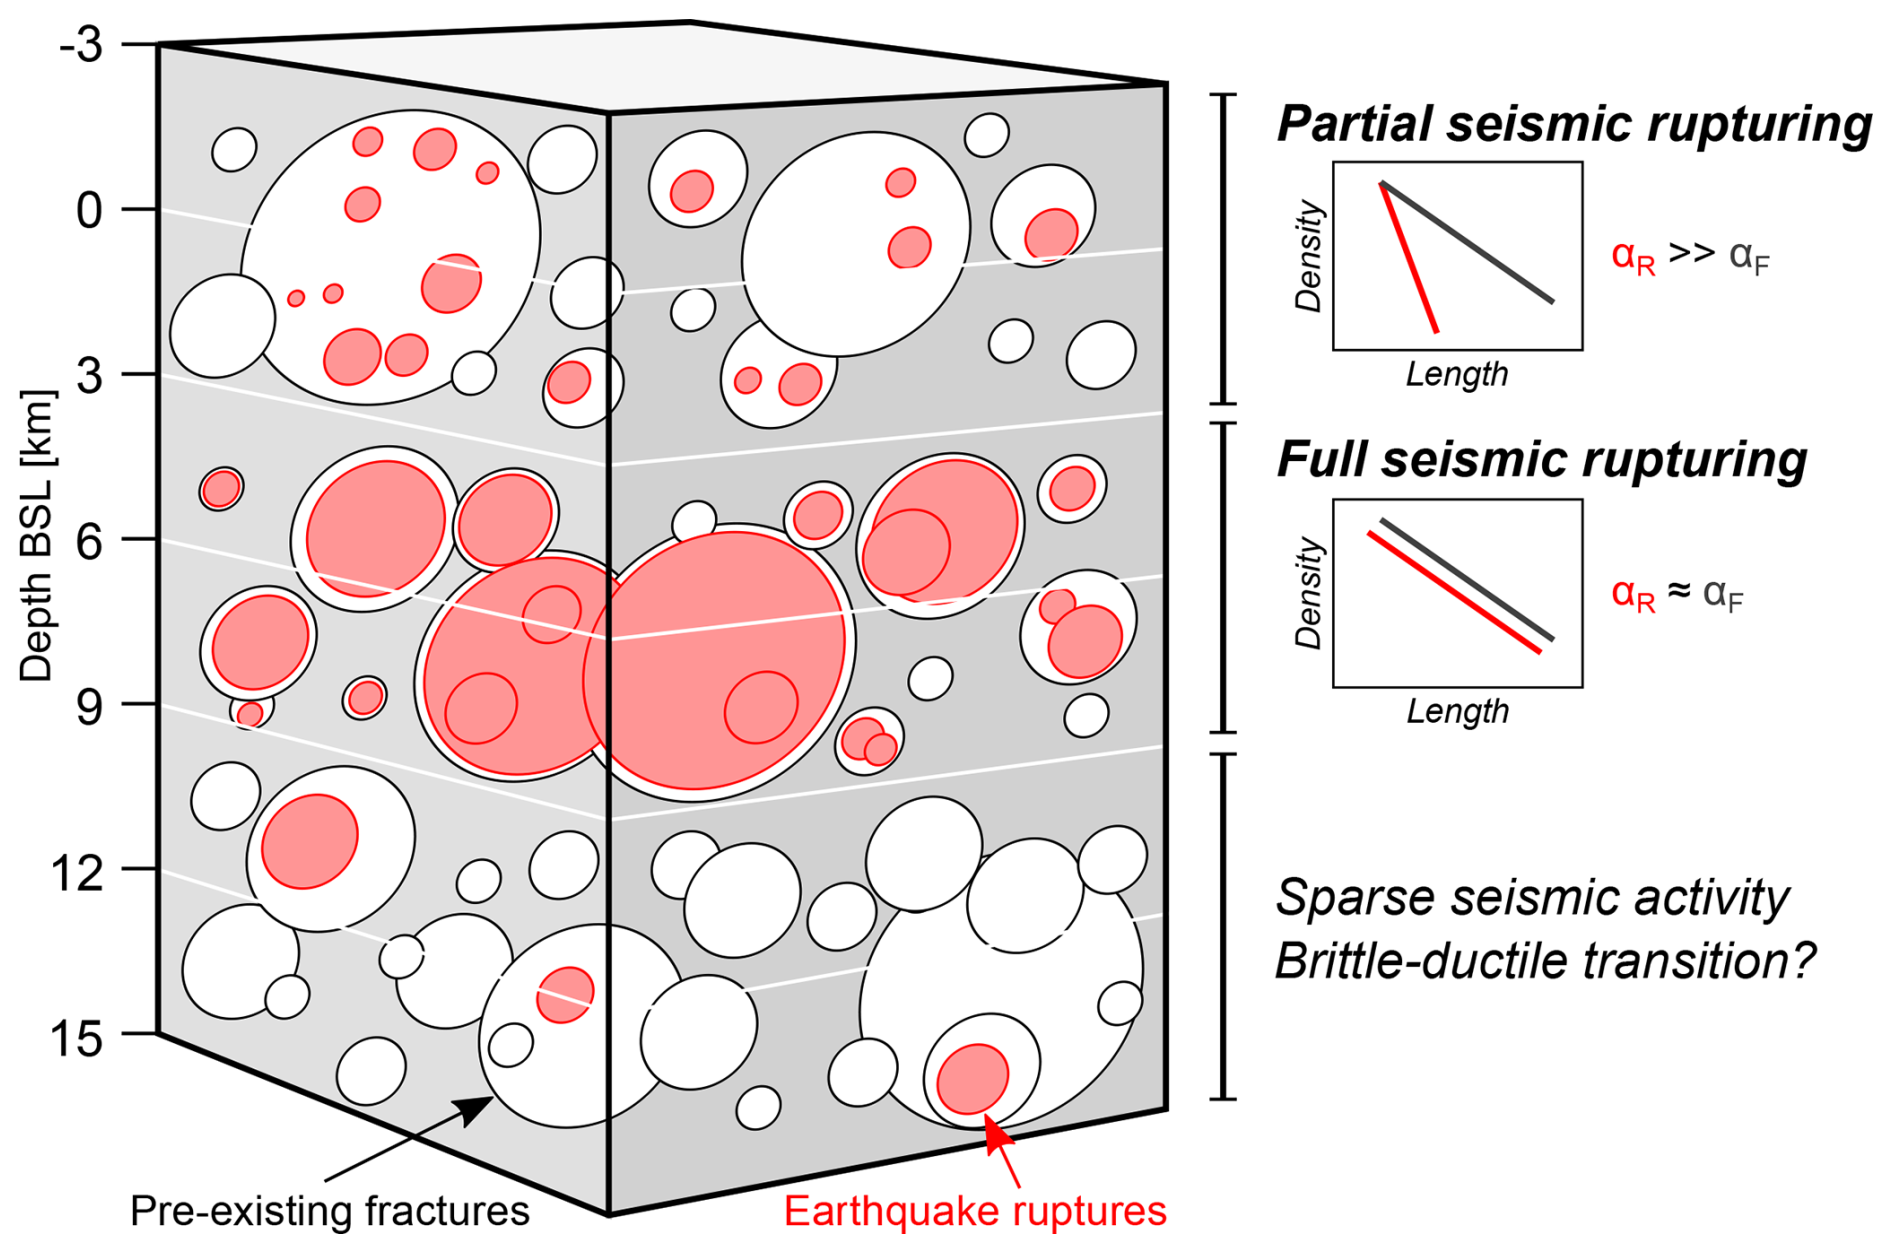
Figure 11Schematic block diagram illustrating the depth-dependent seismogenic fracture reactivation patterns observed herein by relating the power law exponents of the fracture networks (αF) to the exponents of recent earthquakes (αR). Full seismogenic fracture reactivation appears to occur predominantly at depths between 3 and 9 km below sea level (b.s.l.).
The comparison of the statistical properties of fractures and earthquakes points towards differences in the seismogenic deformation processes in the investigated orogen-internal setting, characterized by pervasive fracturing and distributed seismicity. Our findings show that the potential of pre-existing fractures to reactivate seismically seems to vary with depth, likely associated with depth-dependent changes in differential stresses (Fig. 11): while partial seismogenic rupturing of fractures is the dominant deformation mode at shallow depths (< 3 km b.s.l.), earthquakes are more likely to reactivate the entire fracture length at intermediate depths (ca. 3 to 9 km b.s.l.) in the Rawil depression region. Initiating earthquake ruptures thus reactivates the full available fracture length predominantly at intermediate crustal depths.
The earthquake activity at shallow and intermediate depths furthermore documents ongoing brittle deformation in the Rawil depression region. As a consequence, recent fracturing processes likely enhance the permeability of pre-existing fractures, which could be of great interest for the exploration of the geothermal potential within such orogen-internal settings. In light of potential induced seismicity, our findings indicate that shallow fracture systems are less likely to rupture over the entire length than deeper ones. Furthermore, quantitative information about orientation and size distributions of fracture networks such as that obtained herein is crucial for accurate modeling of recent fluid flow within intricate fracture networks. Similar investigations incorporating the statistical properties of both fracture networks and earthquake datasets could therefore potentially be used for innovative geothermal exploration in orogen-internal settings.
The data that support the findings of this study are openly available from Zenodo at https://doi.org/10.5281/zenodo.13829055 (Truttmann et al., 2024).
The supplement related to this article is available online at https://doi.org/10.5194/se-16-641-2025-supplement.
ST and MH conducted fieldwork. ST performed the formal data analysis with support of all co-authors. ST, TD, MH, and SW wrote, reviewed, and edited the manuscript
The contact author has declared that none of the authors has any competing interests.
Publisher's note: Copernicus Publications remains neutral with regard to jurisdictional claims made in the text, published maps, institutional affiliations, or any other geographical representation in this paper. While Copernicus Publications makes every effort to include appropriate place names, the final responsibility lies with the authors.
Comments by Francesco Iezzi and an anonymous reviewer helped to substantially improve an earlier version of the manuscript and are thankfully acknowledged.
This research has been funded by the Swiss Geophysical Commission and the Swiss Federal Office of Topography swisstopo.
This paper was edited by Florian Fusseis and reviewed by Francesco Iezzi and one anonymous referee.
Ackermann, R. V. and Schlische, R. W.: Anticlustering of small normal faults around larger faults, Geology, 25, 1127, https://doi.org/10.1130/0091-7613(1997)025<1127:AOSNFA>2.3.CO;2, 1997.
Ackermann, R. V., Schlische, R. W., and Withjack, M. O.: The geometric and statistical evolution of normal fault systems: an experimental study of the effects of mechanical layer thickness on scaling laws, J. Struct. Geol., 23, 1803–1819, https://doi.org/10.1016/S0191-8141(01)00028-1, 2001.
Alstott, J., Bullmore, E., and Plenz, D.: Powerlaw: a Python package for analysis of heavy-tailed distributions, PLoS ONE, 9, e85777, https://doi.org/10.1371/journal.pone.0085777, 2014.
Baer, M., Deichmann, N., Fäh, D., Kradolfer, U., Mayer-Rosa, D., Ruettener, E., Schler, T., Sellami, S., and Smit, P.: Earthquakes in Switzerland and surrounding regions during 1996, Eclogae Geol. Helv., 90, 557–567, 1997.
Baer, M., Deichmann, N., Braunmiller, J., Bernardi, F., Cornou, C., Fäh, D., Giardini, D., Huber, S., Kaestli, P., Kind, F., Kradolfer, U., Mai, M., Maraini, S., Oprsal, I., Schler, T., Schorlemmer, D., Sellami, S., Steimen, S., Wiemer, S., Woessner, J., and Wyss, A.: Earthquakes in Switzerland and surrounding regions during 2002, Eclogae Geol. Helv., 96, 313–324, 2003.
Baer, M., Deichmann, N., Braunmiller, J., Husen, S., Fäh, D., Giardini, D., Kästli, P., Kradolfer, U., and Wiemer, S.: Earthquakes in Switzerland and surrounding regions during 2004, Eclogae Geol. Helv., 98, 407–418, https://doi.org/10.1007/s00015-005-1168-3, 2005.
Baumberger, R., Herwegh, M., and Kissling, E.: Remote Sensing and Field Data Based Structural 3D Modelling (Haslital, Switzerland) in Combination with Uncertainty Estimation and Verification by Underground Data, in: 3D Digital Geological Models, edited by: Bistacchi, A., Massironi, M., and Viseur, S., Wiley, 159–197, https://doi.org/10.1002/9781119313922.ch10, 2022.
Bonnet, E., Bour, O., Odling, N. E., Davy, P., Main, I., Cowie, P., and Berkowitz, B.: Scaling of fracture systems in geological media, Rev. Geophys., 39, 347–383, https://doi.org/10.1029/1999RG000074, 2001.
Borgos, H. G., Cowie, P. A., and Dawers, N. H.: Practicalities of extrapolating one-dimensional fault and fracture size-frequency distributions to higher-dimensional samples, J. Geophys. Res., 105, 28377–28391, https://doi.org/10.1029/2000JB900260, 2000.
Bossennec, C., Frey, M., Seib, L., Bär, K., and Sass, I.: Multiscale Characterisation of Fracture Patterns of a Crystalline Reservoir Analogue, Geosciences, 11, 371, https://doi.org/10.3390/geosciences11090371, 2021.
Bour, O. and Davy, P.: Clustering and size distributions of fault patterns: Theory and measurements, Geophys. Res. Lett., 26, 2001–2004, https://doi.org/10.1029/1999GL900419, 1999.
Bour, O., Davy, P., Darcel, C., and Odling, N.: A statistical scaling model for fracture network geometry, with validation on a multiscale mapping of a joint network (Hornelen Basin, Norway), J. Geophys. Res., 107, 2113, https://doi.org/10.1029/2001JB000176, 2002.
Boutoux, A., Bellahsen, N., Nanni, U., Pik, R., Verlaguet, A., Rolland, Y., and Lacombe, O.: Thermal and structural evolution of the external Western Alps: Insights from (U–Th–Sm) He thermochronology and RSCM thermometry in the Aiguilles Rouges/Mont Blanc massifs, Tectonophysics, 683, 109–123, https://doi.org/10.1016/j.tecto.2016.06.010, 2016.
Brockmann, E., Ineichen, D., Marti, U., Schaer, S., Schlatter, A., and Villiger, A.: Determination of Tectonic Movements in the Swiss Alps Using GNSS and Levelling, in: Geodesy for Planet Earth, vol. 136, edited by: Kenyon, S., Pacino, M. C., and Marti, U., Springer Berlin Heidelberg, Berlin, Heidelberg, 689–695, https://doi.org/10.1007/978-3-642-20338-1_85, 2012.
Bruyninx, C., Legrand, J., Fabian, A., and Pottiaux, E.: GNSS metadata and data validation in the EUREF Permanent Network, GPS Solut., 23, 106, https://doi.org/10.1007/s10291-019-0880-9, 2019.
Burkhard, P. M.: L'Helvétique de la bordure occidentale du massif de l'Aar (évolution tectonique et métamorphique), Eclogae Geol. Helv., 81, 63–114, 1988.
Campani, M., Mancktelow, N., Seward, D., Rolland, Y., Müller, W., and Guerra, I.: Geochronological evidence for continuous exhumation through the ductile-brittle transition along a crustal-scale low-angle normal fault: Simplon Fault Zone, central Alps, Tectonics, 29, 2009TC002582, https://doi.org/10.1029/2009TC002582, 2010.
Campani, M., Mancktelow, N., and Courrioux, G.: The 3D interplay between folding and faulting in a syn-orogenic extensional system: the Simplon Fault Zone in the Central Alps (Switzerland and Italy), Swiss J. Geosci., 107, 251–271, https://doi.org/10.1007/s00015-014-0163-y, 2014.
Cao, W. and Lei, Q.: Influence of Landscape Coverage on Measuring Spatial and Length Properties of Rock Fracture Networks: Insights from Numerical Simulation, Pure Appl. Geophys., 175, 2167–2179, https://doi.org/10.1007/s00024-018-1774-4, 2018.
Cardello, G. L. and Mancktelow, N. S.: Veining and post-nappe transtensional faulting in the SW Helvetic Alps (Switzerland), Swiss J. Geosci., 108, 379–400, https://doi.org/10.1007/s00015-015-0199-7, 2015.
Cardello, G. L., Bernasconi, S. M., Fellin, M. G., Rahn, M., Rosskopf, R., Maden, C., and Mancktelow, N. S.: Carbonate deformation through the brittle-ductile transition: The case of the SW Helvetic nappes, Switzerland, J. Struct. Geol., 181, 105083, https://doi.org/10.1016/j.jsg.2024.105083, 2024.
Castaing, C., Halawani, M. A., Gervais, F., Chilès, J. P., Genter, A., Bourgine, B., Ouillon, G., Brosse, J. M., Martin, P., Genna, A., and Janjou, D.: Scaling relationships in intraplate fracture systems related to Red Sea rifting, Tectonophysics, 261, 291–314, https://doi.org/10.1016/0040-1951(95)00177-8, 1996.
Ceccato, A., Tartaglia, G., Antonellini, M., and Viola, G.: Multiscale lineament analysis and permeability heterogeneity of fractured crystalline basement blocks, Solid Earth, 13, 1431–1453, https://doi.org/10.5194/se-13-1431-2022, 2022.
Clark, R. M., Cox, S. J. D., and Laslett, G. M.: Generalizations of power-law distributions applicable to sampled fault-trace lengths: model choice, parameter estimation and caveats: Power-law distributions and fault-trace lengths, Geophys. J. Int., 136, 357–372, https://doi.org/10.1046/j.1365-246X.1999.00728.x, 1999.
Clauset, A., Shalizi, C. R., and Newman, M. E. J.: Power-Law Distributions in Empirical Data, SIAM Rev., 51, 661–703, https://doi.org/10.1137/070710111, 2009.
Cowie, P. A., Vanneste, C., and Sornette, D.: Statistical physics model for the spatiotemporal evolution of faults, J. Geophys. Res., 98, 21809–21821, https://doi.org/10.1029/93JB02223, 1993.
Cowie, P. A., Sornette, D., and Vanneste, C.: Multifractal scaling properties of a growing fault population, Geophys. J. Int., 122, 457–469, https://doi.org/10.1111/j.1365-246X.1995.tb07007.x, 1995.
Davy, P.: On the frequency-length distribution of the San Andreas Fault System, J. Geophys. Res., 98, 12141–12151, https://doi.org/10.1029/93JB00372, 1993.
Davy, P., Bour, O., De Dreuzy, J.-R., and Darcel, C.: Flow in multiscale fractal fracture networks, Geological Society, London, Special Publications, 261, 31–45, https://doi.org/10.1144/GSL.SP.2006.261.01.03, 2006.
Davy, P., Le Goc, R., Darcel, C., Bour, O., de Dreuzy, J. R., and Munier, R.: A likely universal model of fracture scaling and its consequence for crustal hydromechanics, J. Geophys. Res., 115, B10411, https://doi.org/10.1029/2009JB007043, 2010.
Davy, Ph., Sornette, A., and Sornette, D.: Some consequences of a proposed fractal nature of continental faulting, Nature, 348, 56–58, https://doi.org/10.1038/348056a0, 1990.
Deichmann, N., Baer, M., Braunmiller, J., Ballarin Dolfin, D., Bay, F., Delouis, B., Fäh, D., Giardini, D., Kastrup, U., Kind, F., Kradolfer, U., Kuenzle, W., Roethlisberger, S., Schler, T., Salichon, J., Sellami, S., Spuehler, E., and Wiemer, S.: Earthquakes in Switzerland and surrounding regions during 1999, Eclogae Geol. Helv., 93, 395–406, 2000.
Deichmann, N., Baer, M., Braunmiller, J., Ballarin Dolfin, D., Bay, F., Bernardi, F., Delouis, B., Fäh, D., Gerstenberger, M., Giardini, D., Huber, S., Kradolfer, U., Maraini, S., Oprsal, I., Schibler, R., Schler, T., Sellami, S., Steimen, S., Wiemer, S., Woessner, J., and Wyss, A.: Earthquakes in Switzerland and surrounding regions during 2001, Eclogae Geol. Helv., 95, 294–261, 2002.
Deichmann, N., Baer, M., Braunmiller, J., Husen, S., Fäh, D., Giardini, D., Kästli, P., Kradolfer, U., and Wiemer, S.: Earthquakes in Switzerland and surrounding regions during 2005, Eclogae Geol. Helv., 99, 443–452, https://doi.org/10.1007/s00015-006-1201-1, 2006.
Deichmann, N., Clinton, J., Husen, S., Edwards, B., Haslinger, F., Fäh, D., Giardini, D., Kästli, P., Kradolfer, U., and Wiemer, S.: Earthquakes in Switzerland and surrounding regions during 2011, Swiss J. Geosci., 105, 463–476, https://doi.org/10.1007/s00015-012-0116-2, 2012.
Delacou, B., Deichmann, N., Sue, C., Thouvenot, F., Champagnac, J.-D., and Burkhard, M.: Active strike-slip faulting in the Chablais area (NW Alps) from earthquake focal mechanisms and relative locations, Eclogae Geol. Helv., 98, 189–199, https://doi.org/10.1007/s00015-005-1159-4, 2005.
Diehl, T., Deichmann, N., Clinton, J., Husen, S., Kraft, T., Plenkers, K., Edwards, B., Cauzzi, C., Michel, C., Kästli, P., Wiemer, S., Haslinger, F., Fäh, D., Kradolfer, U., and Woessner, J.: Earthquakes in Switzerland and surrounding regions during 2012, Swiss J. Geosci., 106, 543–558, https://doi.org/10.1007/s00015-013-0154-4, 2013.
Diehl, T., Clinton, J., Deichmann, N., Cauzzi, C., Kästli, P., Kraft, T., Molinari, I., Böse, M., Michel, C., Hobiger, M., Haslinger, F., Fäh, D., and Wiemer, S.: Earthquakes in Switzerland and surrounding regions during 2015 and 2016, Swiss J. Geosci., 111, 221–244, https://doi.org/10.1007/s00015-017-0295-y, 2018.
Diehl, T., Clinton, J., Cauzzi, C., Kraft, T., Kästli, P., Deichmann, N., Massin, F., Grigoli, F., Molinari, I., B?se, M., Hobiger, M., Haslinger, F., Fäh, D., and Wiemer, S.: Earthquakes in Switzerland and surrounding regions during 2017 and 2018, Swiss J. Geosci., 114, 4, https://doi.org/10.1186/s00015-020-00382-2, 2021a.
Diehl, T., Kissling, E., Herwegh, M., and Schmid, S. M.: Improving Absolute Hypocenter Accuracy With 3D Pg and Sg Body-Wave Inversion Procedures and Application to Earthquakes in the Central Alps Region, J. Geophys. Res.-Sol. Ea., 126, e2021JB022155, https://doi.org/10.1029/2021JB022155, 2021b.
Diehl, T., Heilig, J., Cauzzi, C., Deichmann, N., Clinton, J., Truttmann, S., Herwegh, M., and Wiemer, S.: SECOS24: New insights into seismicity, deformation and crustal stresses in the Central Alps Region from a baseline seismotectonic earthquake catalog, EGU General Assembly 2024, Vienna, Austria, 14–19 Apr 2024, EGU24-12811, https://doi.org/10.5194/egusphere-egu24-12811, 2024.
Dietrich, D.: Fold-axis parallel extension in an arcuate fold- and thrust belt: the case of the Helvetic nappes, Tectonophysics, 170, 183–212, https://doi.org/10.1016/0040-1951(89)90271-0, 1989.
Dietrich, D. and Casey, M.: A new tectonic model for the Helvetic nappes, Geological Society, London, Special Publications, 45, 47–63, https://doi.org/10.1144/GSL.SP.1989.045.01.03, 1989.
Egli, D. and Mancktelow, N.: The structural history of the Mont Blanc massif with regard to models for its recent exhumation, Swiss J. Geosci., 106, 469–489, https://doi.org/10.1007/s00015-013-0153-5, 2013.
Egli, D., Mancktelow, N., and Spikings, R.: Constraints from 40Ar/39 Ar geochronology on the timing of Alpine shear zones in the Mont Blanc-Aiguilles Rouges region of the European Alps, Tectonics, 36, 730–748, https://doi.org/10.1002/2016TC004450, 2017.
Escher, A., Masson, H., and Steck, A.: Nappe geometry in the Western Swiss Alps, J. Struct. Geol., 15, 501–509, https://doi.org/10.1016/0191-8141(93)90144-Y, 1993.
Fox, M., Herman, F., Kissling, E., and Willett, S. D.: Rapid exhumation in the Western Alps driven by slab detachment and glacial erosion, Geology, 43, 379–382, https://doi.org/10.1130/G36411.1, 2015.
Fréchet, J., Thouvenot, F., Frogneux, M., Deichmann, N., and Cara, M.: The MW 4.5 Vallorcine (French Alps) earthquake of 8 September 2005 and its complex aftershock sequence, J. Seismol., 15, 43–58, https://doi.org/10.1007/s10950-010-9205-8, 2011.
Gasser, D. and Mancktelow, N. S.: Brittle faulting in the Rawil depression: field observations from the Rezli fault zones, Helvetic nappes, Western Switzerland, Swiss J. Geosci., 103, 15–32, https://doi.org/10.1007/s00015-010-0004-6, 2010.
Glotzbach, C., Reinecker, J., Danišík, M., Rahn, M., Frisch, W., and Spiegel, C.: Thermal history of the central Gotthard and Aar massifs, European Alps: Evidence for steady state, long-term exhumation, J. Geophys. Res.-Earth, 115, F03017, https://doi.org/10.1029/2009JF001304, 2010.
Goebel, T. H. W., Kwiatek, G., Becker, T. W., Brodsky, E. E., and Dresen, G.: What allows seismic events to grow big?: Insights from b-value and fault roughness analysis in laboratory stick-slip experiments, Geology, 45, 815–818, https://doi.org/10.1130/G39147.1, 2017.
Goertz-Allmann, B. P., Edwards, B., Bethmann, F., Deichmann, N., Clinton, J., Fah, D., and Giardini, D.: A New Empirical Magnitude Scaling Relation for Switzerland, B. Seismol. Soc. Am., 101, 3088–3095, https://doi.org/10.1785/0120100291, 2011.
Goldstein, M. L., Morris, S. A., and Yen, G. G.: Problems with ?tting to the power-law distribution, Eur. Phys. J. B, 41, 255–258, 2004.
Gulia, L. and Wiemer, S.: The influence of tectonic regimes on the earthquake size distribution: A case study for Italy, Geophys. Res. Lett., 37, L10305, https://doi.org/10.1029/2010GL043066, 2010.
Gutenberg, B. and Richter, C. F.: Frequency of Earthquakes in California, B. Seismol. Soc. Am., 34, 185–188, 1944.
Hatton, C. G., Main, I. G., and Meredith, P. G.: A comparison of seismic and structural measurements of scaling exponents during tensile subcritical crack growth, J. Struct. Geol., 15, 1485–1495, 1993.
Häuselmann, P., Granger, D. E., Jeannin, P.-Y., and Lauritzen, S.-E.: Abrupt glacial valley incision at 0.8 Ma dated from cave deposits in Switzerland, Geology, 35, 143, https://doi.org/10.1130/G23094A, 2007.
Heffer, K. J. and Bevan, T. G.: Scaling Relationships in Natural Fractures: Data, Theory, and Application, Society of Petroleum engineers, European Petroleum Conference, The Hague, the Netherlands, October 1990, https://doi.org/10.2118/20981-MS, 1990.
Hentschel, H. G. E. and Procaccia, I.: The infinite number of generalized dimensions of fractals and strange attractors, Phys. D, 8, 435–444, https://doi.org/10.1016/0167-2789(83)90235-X, 1983.
Herwegh, M., Berger, A., Glotzbach, C., Wangenheim, C., Mock, S., Wehrens, P., Baumberger, R., Egli, D., and Kissling, E.: Late stages of continent-continent collision: Timing, kinematic evolution, and exhumation of the Northern rim (Aar Massif) of the Alps, Earth-Sci. Rev., 200, 102959, https://doi.org/10.1016/j.earscirev.2019.102959, 2020.
Herwegh, M., Berger, A., Bellashen, N., Rolland, Y., and Kissling, E.: Evolution of the External Crystalline Massifs of the European Alps: From Massif to Lithosphere Scale, in: Geodynamics of the Alps, ISTE-Wiley, London, https://doi.org/10.1002/9781394299560.ch2, 2024.
Hetényi, G., Epard, J.-L., Colavitti, L., Hirzel, A. H., Kiss, D., Petri, B., Scarponi, M., Schmalholz, S. M., and Subedi, S.: Spatial relation of surface faults and crustal seismicity: a first comparison in the region of Switzerland, Acta Geod. Geophys., 53, 439–461, https://doi.org/10.1007/s40328-018-0229-9, 2018.
Houlié, N., Woessner, J., Giardini, D., and Rothacher, M.: Lithospere strain rate and stress field orientations near the Alpine arc in Switzerland, Sci. Rep., 8, 2018, https://doi.org/10.1038/s41598-018-20253-z, 2018.
Huggenberger, P. and Aebli, H.: Bruchtektonik und Blattverschiebungen im Gebiet des Rawil-Passes: Resultat einer E-W gerichteten dextralen Scherbewegung im kristallinen Untergrund?, Schweiz. Miner. Petrog., 69, 173–180, https://doi.org/10.5169/SEALS-52783, 1989.
Jimenez, M.-J. and Pavoni, N.: Focal mechanisms of recent earthquakes, 1976-1982, and seismotectonics in Switzerland, in: Proc. Sess. 12, IASPEI XVIII Assembly, Hamburg 1983, 77–84, 1983.
Kastrup, U., Zoback, M. L., Deichmann, N., Evans, K. F., Giardini, D., and Michael, A. J.: Stress field variations in the Swiss Alps and the northern Alpine foreland derived from inversion of fault plane solutions, J. Geophys. Res., 109, B01402, https://doi.org/10.1029/2003JB002550, 2004.
Knott, S. D., Beach, A., Brockbank, P. J., Lawson Brown, J., McCallum, J. E., and Welbon, A. I.: Spatial and mechanical controls on normal fault populations, J. Struct. Geol., 18, 359–372, https://doi.org/10.1016/S0191-8141(96)80056-3, 1996.
Lee, T., Diehl, T., Kissling, E., and Wiemer, S.: New insights into the Rhône–Simplon fault system (Swiss Alps) from a consistent earthquake catalogue covering 35 yr, Geophys. J. Int., 232, 1568–1589, https://doi.org/10.1093/gji/ggac407, 2023.
Lei, Q., Latham, J.-P., Tsang, C.-F., Xiang, J., and Lang, P.: A new approach to upscaling fracture network models while preserving geostatistical and geomechanical characteristics: A New Fracture Network Upscaling Method, J. Geophys. Res.-Sol. Ea., 120, 4784–4807, https://doi.org/10.1002/2014JB011736, 2015.
Leonard, M.: Self-Consistent Earthquake Fault-Scaling Relations: Update and Extension to Stable Continental Strike-Slip Faults, B. Seismol. Soc. Am., 104, 2953–2965, https://doi.org/10.1785/0120140087, 2014.
Levato, L., Sellami, S., Epard, J.-L., Pruniaux, B., Olivier, R., Wagner, J.-J., and Masson, H.: The cover-basement contact beneath the Rawil axial depression (western Alps): True amplitude seismic processing, petrophysical properties, and modelling, Tectonophysics, 232, 391–409, https://doi.org/10.1016/0040-1951(94)90099-X, 1994.
Line, C. E. R., Snyder, D. B., and Hobbs, R. W.: The sampling of fault populations in dolerite sills of Central Sweden and implications for resolution of seismic data, J. Struct. Geol., 19, 687–701, https://doi.org/10.1016/S0191-8141(96)00087-9, 1997.
Mancktelow, N.: The Simplon Line: a major displacement zone in the western Lepontine Alps, Eclogae Geol. Helv., 78, 73–96, https://doi.org/10.5169/SEALS-165644, 1985.
Manighetti, I., Campillo, M., Bouley, S., and Cotton, F.: Earthquake scaling, fault segmentation, and structural maturity, Earth Planet. Sc. Lett., 253, 429–438, https://doi.org/10.1016/j.epsl.2006.11.004, 2007.
Marrett, R., Ortega, O. J., and Kelsey, C. M.: Extent of power-law scaling for natural fractures in rock, Geology, 27, 799, https://doi.org/10.1130/0091-7613(1999)027<0799:EOPLSF>2.3.CO;2, 1999.
Maurer, H.: Seismotectonics and upper crustal structure in the western Swiss Alps, Dissertation, ETH Zürich, https://doi.org/10.3929/ethz-a-000926318, 1993.
Maurer, H. and Deichmann, N.: Microearthquake cluster detection based on waveform similarities, with an application to the western Swiss Alps, Geophys. J. Int., 123, 588–600, https://doi.org/10.1111/j.1365-246X.1995.tb06873.x, 1995.
Maurer, H. R., Burkhard, M., Deichmann, N., and Green, A. G.: Active tectonism in the central Alps: contrasting stress regimes north and south of the Rhone Valley, Terra Nova, 9, 91–94, https://doi.org/10.1111/j.1365-3121.1997.tb00010.x, 1997.
Mogi, K.: Study of Elastic Shocks Caused by the Fracture of Heterogeneous Materials and its Relations to Earthquake Phenomena, Bulletin of the Earthquake Research Institute, 40, 125–173, 1962.
Mori, J. and Abercrombie, R. E.: Depth dependence of earthquake frequency-magnitude distributions in California: Implications for rupture initiation, J. Geophys. Res., 102, 15081–15090, https://doi.org/10.1029/97JB01356, 1997.
Musso Piantelli, F., Mair, D., Berger, A., Schlunegger, F., Wiederkehr, M., Kurmann, E., Baumberger, R., Möri, A., and Herwegh, M.: 4D reconstruction of the Doldenhorn nappe-basement system in the Aar massif: Insights into late-stage continent-continent collision in the Swiss Alps, Tectonophysics, 843, 229586, https://doi.org/10.1016/j.tecto.2022.229586, 2022.
Nicol, A., Walsh, J. J., Watterson, J., and Gillespie, P.: Fault size distributions – are they really power-law?, J. Struct. Geol., 18, 191–197, 1996.
Odling, N. E.: Scaling and connectivity of joint systems in sandstones from western Norway, J. Struct. Geol., 19, 1257–1271, https://doi.org/10.1016/S0191-8141(97)00041-2, 1997.
Odling, N. E., Gillespie, P., Bourgine, B., Castaing, C., Chiles, J.-P., Christensen, N. P., Fillion, E., Genter, A., Olsen, C., Thrane, L., Trice, R., Aarseth, E., Walsh, J. J., and Watterson, J.: Variations in fracture system geometry and their implications for fluid flow in fractured hydrocarbon reservoirs, Petrol. Geosci., 5, 373–384, 1999.
O'Leary, D. W., Friedman, J. D., and Pohn, H. A.: Lineament, linear, lineation: Some proposed new standards for old terms, Geol. Soc. Am. Bull., 87, 1463, https://doi.org/10.1130/0016-7606(1976)87<1463:LLLSPN>2.0.CO;2, 1976.
Ouillon, G., Castaing, C., and Sornette, D.: Hierarchical geometry of faulting, J. Geophys. Res., 101, 5477–5487, https://doi.org/10.1029/95JB02242, 1996.
Pavoni, N.: Comparison of focal mechanisms of earthquakes and faulting in the Helvetic zone of the Central Valais, Swiss Alps, Eclogae Geol. Helv., 73, 551–558, https://doi.org/10.5169/SEALS-164973, 1980a.
Pavoni, N.: Crustal Stresses Inferred from Fault-Plane Solutions of Earthquakes and Neotectonic Deformation in Switzerland, in: Tectonic Stresses in the Alpine-Mediterranean Region, vol. 9, edited by: Scheidegger, A. E., Springer Vienna, Vienna, 63–68, https://doi.org/10.1007/978-3-7091-8588-9_8, 1980b.
Pavoni, N. and Mayer-Rosa, D.: Seismotektonische Karte der Schweiz 1:750000, Eclogae Geol. Helv., 71, 293–295, https://doi.org/10.5169/SEALS-164732, 1978.
Pavoni, N., Maurer, H., Roth, P., and Deichmann, N.: Seismicity and seismotectonics of the Swiss Alps, Birkhaeuser, Basel, 1997.
Petruccelli, A., Schorlemmer, D., Tormann, T., Rinaldi, A. P., Wiemer, S., Gasperini, P., and Vannucci, G.: The influence of faulting style on the size-distribution of global earthquakes, Earth Planet. Sc. Lett., 527, 115791, https://doi.org/10.1016/j.epsl.2019.115791, 2019a.
Petruccelli, A., Gasperini, P., Tormann, T., Schorlemmer, D., Rinaldi, A. P., Vannucci, G., and Wiemer, S.: Simultaneous dependence of the earthquake-size distribution on faulting style and depth, Geophys. Res. Lett., 46, 11044–11053, https://doi.org/10.1029/2019GL083997, 2019b.
Pfiffner, O. A.: The structure of the Helvetic nappes and its relation to the mechanical stratigraphy, J. Struct. Geol., 15, 511–521, 1993.
Pfiffner, O. A., Sahli, S., and Stäuble, M.: Structure and evolution of the external basement massifs (Aar, Aiguilles-Rouges/Mt.Bland), Deep Structure of the Alps, results of NRP20, Birkhäuser, 1997.
Pickering, G., Bull, J. M., and Sanderson, D. J.: Sampling power-law distributions, Tectonophysics, 248, 1–20, 1995.
Piña-Valdés, J., Socquet, A., Beauval, C., Doin, M., D'Agostino, N., and Shen, Z.: 3D GNSS Velocity Field Sheds Light on the Deformation Mechanisms in Europe: Effects of the Vertical Crustal Motion on the Distribution of Seismicity, J. Geophys. Res.-Sol. Ea., 127, e2021JB023451, https://doi.org/10.1029/2021JB023451, 2022.
Ramsay, J. G.: Tectonics of the Helvetic Nappes, Thrust and Nappe Tectonics, Geological Society, London, Special Publications, https://doi.org/10.1144/gsl.sp.1981.009.01.26, 1981.
Ramsay, J. G.: Fold and fault geometry in the western Helvetic nappes of Switzerland and France and its implication for the evolution of the arc of the western Alps, Geological Society, London, Special Publications, 45, 33–45, https://doi.org/10.1144/GSL.SP.1989.045.01.02, 1989.
Schlische, R. W., Young, S. S., Ackermann, R. V., and Gupta, A.: Geometry and scaling relations of a population of very small rift-related normal faults, Geology, 24, 683, https://doi.org/10.1130/0091-7613(1996)024<0683:GASROA>2.3.CO;2, 1996.
Scholz, C. H.: The frequency-magnitude relation of microfracturing in rock and its relation to earthquakes, B. Seismol. Soc. Am., 58, 399–415, 1968.
Scholz, C. H.: Size Distributions for Large and Small Earthquakes, B. Seismol. Soc. Am., 87, 1074–1077, 1997.
Scholz, C. H.: A further note on earthquake size distributions, B. Seismol. Soc. Am., 88, 1325–1326, 1998.
Scholz, C. H.: Fault Mechanics, in: Treatise on Geophysics, Elsevier B.V., https://doi.org/10.1016/B978-044452748-6.00111-5, 441–483, 2007.
Scholz, C. H.: On the stress dependence of the earthquake b value, Geophys. Res. Lett., 42, 1399–1402, https://doi.org/10.1002/2014GL062863, 2015.
Scholz, C. H.: The Mechanics of Earthquakes and Faulting, 3rd edn., Cambridge University Press, https://doi.org/10.1017/9781316681473, 2019.
Scholz, C. H., Dawers, N. H., Yu, J.-Z., Anders, M. H., and Cowie, P. A.: Fault growth and fault scaling laws: Preliminary results, J. Geophys. Res., 98, 21951–21961, https://doi.org/10.1029/93JB01008, 1993.
Schorlemmer, D., Wiemer, S., and Wyss, M.: Variations in earthquake-size distribution across different stress regimes, Nature, 437, 539–542, https://doi.org/10.1038/nature04094, 2005.
Spada, M., Tormann, T., Wiemer, S., and Enescu, B.: Generic dependence of the frequency-size distribution of earthquakes on depth and its relation to the strength profile of the crust: THE B -VALUES WITH DEPTH, Geophys. Res. Lett., 40, 709–714, https://doi.org/10.1029/2012GL054198, 2013.
Staudenmaier, N., Cauzzi, C., and Wiemer, S.: Magnitude Scaling Relationships in Parkfield and Switzerland and their relevance for PSHA, Report, Swiss Seismological Service (SED) at ETH Zurich, 2018.
Steck, A., Epard, J.-L., Escher, A., Lehner, P., Marchant, R., and Masson, H.: Geological interpretation of the seismic of the seismic profiles through Western Switzerland: Rawil (W1), Val d'Anniviers (W2), Mattertal (W3), Zmutt-Zermatt-Findelen (W4) and Val de Bagnes (W5), Deep Structure of the Alps, results of NRP20, Birkhäuser, 1997.
Sternai, P., Sue, C., Husson, L., Serpelloni, E., Becker, T. W., Willett, S. D., Faccenna, C., Di Giulio, A., Spada, G., Jolivet, L., Valla, P., Petit, C., Nocquet, J.-M., Walpersdorf, A., and Castelltort, S.: Present-day uplift of the European Alps: Evaluating mechanisms and models of their relative contributions, Earth-Sci. Rev., 190, 589–604, https://doi.org/10.1016/j.earscirev.2019.01.005, 2019.
Thingbaijam, K. K. S., Martin Mai, P., and Goda, K.: New Empirical Earthquake Source-Scaling Laws, B. Seismol. Soc. Am., 107, 2225–2246, https://doi.org/10.1785/0120170017, 2017.
Torabi, A. and Berg, S. S.: Scaling of fault attributes: A review, Mar. Petrol. Geol., 28, 1444–1460, https://doi.org/10.1016/j.marpetgeo.2011.04.003, 2011.
Tormann, T., Wiemer, S., and Mignan, A.: Systematic survey of high-resolution b value imaging along Californian faults: Inference on asperities, J. Geophys. Res.-Sol. Ea., 119, 2029–2054, https://doi.org/10.1002/2013JB010867, 2014.
Truttmann, S., Diehl, T., and Herwegh, M.: Hypocenter-Based 3D Imaging of Active Faults: Method and Applications in the Southwestern Swiss Alps, J. Geophys. Res.-Sol. Ea., 128, e2023JB026352, https://doi.org/10.1029/2023JB026352, 2023.
Truttmann, S., Diehl, T., Herwegh, M., and Wiemer, S.: The Size Distributions of Faults and Earthquakes: Implications for Orogen-Internal Seismogenic Deformation, Zenodo [data set], https://doi.org/10.5281/zenodo.13829055, 2024.
Turcotte, D. L.: Fractals in geology and geophysics, PAGEOPH, 131, 171–196, https://doi.org/10.1007/BF00874486, 1989.
Turcotte, D. L.: Fractals and Chaos in Geology and Geophysics, 2nd edn., Cambridge University Press, https://doi.org/10.1017/CBO9781139174695, 1997.
Ustaszewski, M. and Pfiffner, O. A.: Neotectonic faulting, uplift and seismicity in the central and western Swiss Alps, Geological Society, London, Special Publications, 298, 231–249, https://doi.org/10.1144/SP298.12, 2008.
Ustaszewski, M., Herwegh, M., McClymont, A. F., Pfiffner, O. A., Pickering, R., and Preusser, F.: Unravelling the evolution of an Alpine to post-glacially active fault in the Swiss Alps, J. Struct. Geol., 29, 1943–1959, https://doi.org/10.1016/j.jsg.2007.09.006, 2007.
Valla, P. G., van der Beek, P. A., Shuster, D. L., Braun, J., Herman, F., Tassan-Got, L., and Gautheron, C.: Late Neogene exhumation and relief development of the Aar and Aiguilles Rouges massifs (Swiss Alps) from low-temperature thermochronology modeling and 4He 3He thermochronometry, J. Geophys. Res.-Earth, 117, F01004, https://doi.org/10.1029/2011JF002043, 2012.
Vicsek, T.: Fractal growth phenomena, World Scientific, 1992.
Wehrens, P., Berger, A., Peters, M., Spillmann, T., and Herwegh, M.: Deformation at the frictional-viscous transition: Evidence for cycles of fluid-assisted embrittlement and ductile deformation in the granitoid crust, Tectonophysics, 693, 66–84, https://doi.org/10.1016/j.tecto.2016.10.022, 2016.
Wells, D. L. and Coppersmith, K. J.: New Empirical Relationships among Magnitude, Rupture Length, Rupture Width, Rupture Area, and Surface Displacement, B. Seismol. Soc. Am., 84, 974–1002, 1994.
Wiemer, S., Danciu, L., Edwards, B., Marti, M., Fäh, D., Hiemer, S., Woessner, J., Cauzzi, C., Kästli, P., and Kremer, K.: Seismic Hazard Model 2015 for Switzerland (SUIhaz2015), Report, Swiss Seismological Service (SED) at ETH Zurich, https://doi.org/10.12686/a2, 2016.
Yielding, G., Walsh, J. J., and Watterson, J.: The prediction of small scale faulting in reservoirs, First Break, 10, 449–460, 1992.
Yielding, G., Needham, T., and Jones, H.: Sampling of fault populations using sub-surface data: a review, J. Struct. Geol., 18, 135–146, https://doi.org/10.1016/S0191-8141(96)80039-3, 1996.
Zeeb, C., Gomez-Rivas, E., Bons, P. D., and Blum, P.: Evaluation of sampling methods for fracture network characterization using outcrops, Bulletin, 97, 1545–1566, https://doi.org/10.1306/02131312042, 2013.