the Creative Commons Attribution 4.0 License.
the Creative Commons Attribution 4.0 License.
 | 08 Sep 2025
The crustal magma reservoir geometry and seismic activity beneath the Wudalianchi volcano in northeast China: implications for the multilevel magmatic system
Ziqiang Lü
Qinghan Kong
Jianshe Lei
Yinshuang Ai
Understanding the spatial correlation between crustal magma reservoirs and seismicity is crucial for investigating the dynamics of volcanic systems. However, due to the relatively low resolution of existing crustal tomography, especially for the middle-lower crustal magma reservoir, it is still difficult to accurately characterize the crustal magma system beneath the Wudalianchi volcano in northeast China. Here, we present a high-resolution 3-D shear-wave velocity crustal model obtained by applying full-wave ambient noise tomography. High-quality empirical Green functions are extracted from ambient seismic noise at periods of 3–20 s based on 30 latest broadband seismic stations throughout the Wudalianchi volcano. Our new tomographic model reveals a distinct low-velocity body located at depths of ∼10–23 km below the Wudalianchi volcano, suggesting the presence of a magma reservoir in the middle-lower crust, which establishes an important link for better understanding of the magma evolution processes. Additionally, the geometry of the observed magma reservoir, together with the earthquake distribution, provides new insights into the magmatic activity of the active Wudalianchi volcano. The magma ascent from the potential middle-lower crustal magma reservoir might exert pressure on the overlying brittle crust, resulting in the generation of earthquakes below the Wudalianchi volcano. The presence of partial melting could make the strength of the surrounding rocks more susceptible to ductile deformation, suggesting that the earthquake nucleation is more difficult within the interior of the crustal magma reservoir beneath the Wudalianchi (WDLC) volcano.
- Article
(12166 KB) - Full-text XML
-
Supplement
(1281 KB) - BibTeX
- EndNote


The magmatic system consists of multi-level complex magma reservoirs and channels for storing and transporting magmatic materials. The middle-lower crustal magma reservoir, as a significant transit station, controls magma storage, accumulation, and differentiation. However, due to the sparse distribution of the seismograph network, the underlying middle-lower crustal magmatic structure of the Wudalianchi (WDLC) volcano remains poorly understood. The WDLC volcano, named for five connected lava-dammed lakes, is situated on the northern flank of the Songliao Basin in northeast China (Fig. 1). The volcanic field contains 14 cinder cones surrounded by basaltic lava flows (Zhao et al., 2014). The diameters of most cone bases range from 500 to 1200 m and their heights range from 40 to 170 m, and these cones are predominantly arranged along multiple northeast–southwest orientations (Wei et al., 2003). As one of the youngest volcanoes in northeast China, the WDLC volcano has notable volcanic activity. The evolution of the WDLC volcano can be traced back to the early Pleistocene, with the latest volcanic activity recorded occurred in ∼1721, and the lava flows formed during past eruptions span an area of ∼70 km2 (Rasskazov et al., 2016). In 1776, the most recent volcanic activity took place in Laoheishan, a sub-volcano within the WDLC volcanic area (Chen et al., 2021).
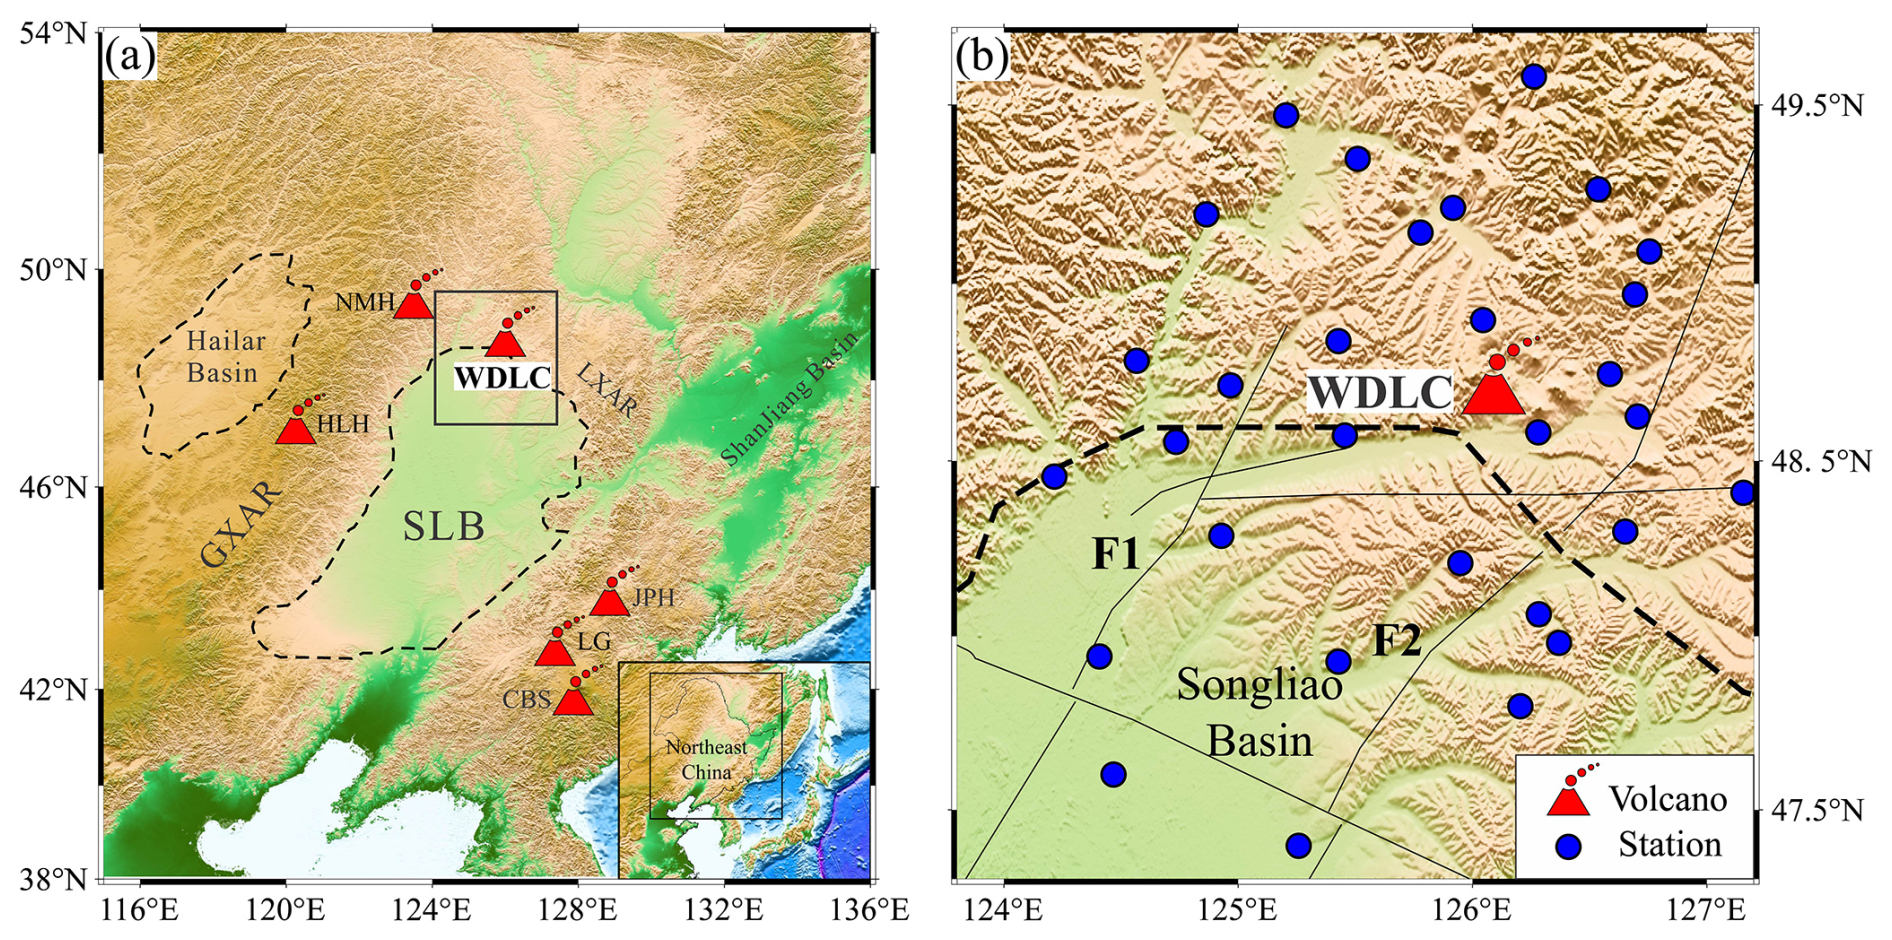
Figure 1Map view of the surface topography and major tectonic settings of the Wudalianchi (WDLC) volcanic field. The blue circles denote seismic stations used in this study. The dashed line and thin black lines mark the outlines of the basins and major faults, respectively. CBS, Changbaishan; HLH, Halaha; LG, Longgang; JPH, Jingpohu; NMH, Nuominhe; SLB, Songliao Basin; GXAR, Great Xing'an range; LXAR, Lesser Xing'an range; F1, Nenjiang fault; F2, Hailun-Renmin fault.
The distribution of earthquakes under the volcano can provide insights into the development of magmatic activity. An earthquake swarm was detected between 2015 and 2023 in the WDLC volcanic region recorded by the earthquake catalog from the China Earthquake Administration (Figs. 2, S1, and S2 in the Supplement). This swarm includes 243 earthquakes, and the largest earthquake had a magnitude of 2.9. The local earthquake locations show that the seismic activities are mainly distributed in the depth range of ∼5–15 km beneath the WDLC volcano.
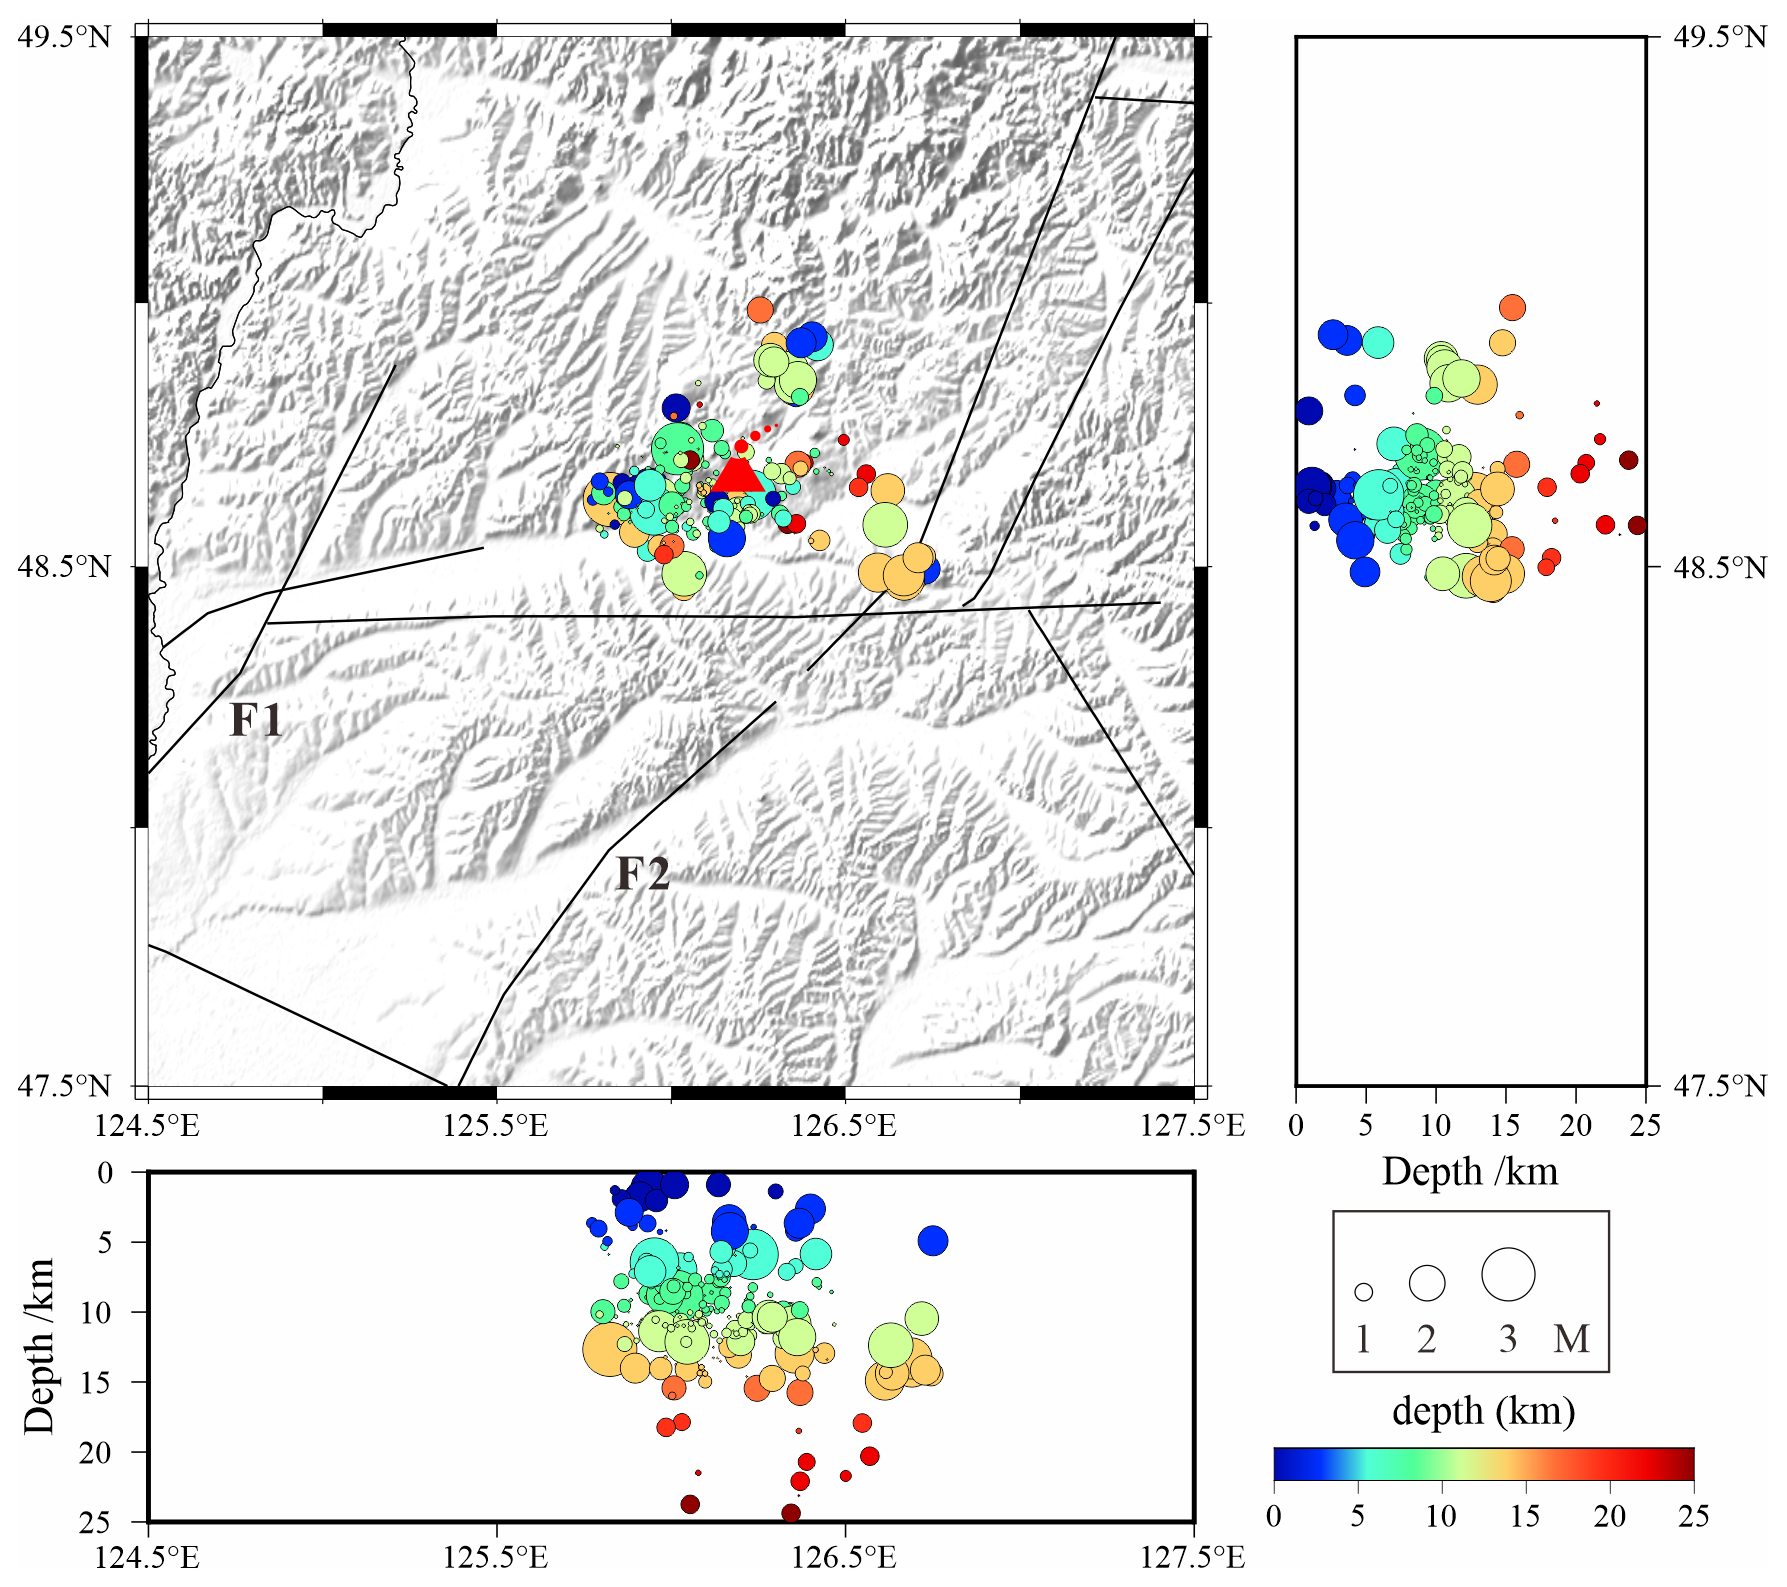
Figure 2The spatial distribution of the earthquakes in the Wudalianchi volcanic field. The circles denote the earthquakes with different depths and magnitudes. The scales are shown in the right corner.
The intraplate volcanism in northeast China remains a topic of ongoing research and debate, and several different mechanisms have been proposed to explain the formation of intraplate volcanism. Previous body-wave tomographic results have identified significant low-velocity anomalies reaching as low as −3 % with a diameter of about 200 km, extending consistently to a depth of 400 km (Lei and Zhao, 2005), indicating that the WDLC volcano results from the presence of hot and wet upwelling flows within the big mantle wedge above the subducting Pacific slab located in the mantle transition zone beneath East Asia (Zhao et al., 2007; Zhang and Wu, 2019). Additionally, a continuous slow velocity anomaly down to the mantle transition zone was observed in northeast China, interpreted as the subduction-related mantle upwelling that escaped through a slab “gap” in the transition zone (Tang et al., 2014). Ambient noise tomography and two-plane surface wave tomography revealed a downwelling high-velocity anomaly beneath the Songliao Basin, which has the potential to trigger localized convection in the asthenosphere, leading to the formation of local volcanoes (Guo et al., 2016). Numerical simulation results indicate that the Cenozoic volcanic activity in northeast China may be attributed to the interaction between the subducting Pacific plate and the hydrated mantle transition zone (Yang and Faccenda, 2020). However, these hypotheses for the large-scale volcanism are not adequate to fully explain the WDLC volcanism as well as its spatial pattern of seismic activity.
The lithospheric mantle and shallow upper crustal structures have been imaged by previous studies (Li et al., 2016; Liu et al., 2017; Gao et al., 2020; Chen et al., 2021; Fan et al., 2021). The regional-scale lithospheric tomographic results revealed a high-velocity anomaly beneath the WDLC lithospheric mantle, which is likely caused by the interaction between low-degree melts from the asthenosphere and the underlying subcontinental lithospheric mantle (Fan et al., 2021). In contrast, a prominent low-velocity anomaly is observed extending from the Moho to a depth of 100 km beneath the WDLC volcano, interpreted as local asthenospheric upwelling (Chen et al., 2021). In general, the underlying lithospheric structures of the WDLC volcano are still the subject of ongoing debate. Additionally, for the shallow crustal structure, a prominent low-velocity anomaly is imaged in the upper crust based on a small-scale dense seismic array with ambient noise tomography (Li et al., 2016), and the low-resistance structures in the upper crust are observed beneath the WDLC volcano by the magnetotelluric imaging based on a dense magnetotelluric network with average site spacing of ∼1 km (Gao et al., 2020). However, small-scale tomographic results are only focused on the upper crustal structures of the volcano. In order to couple the deep mantle with the shallow upper crustal magmatic systems, a strong understanding of the middle-lower crustal magmatic structure and its corresponding seismicity is necessary.
Benefiting from the WAVESArray seismic stations deployed in northeast China, more detailed features have been imaged by ray-based ambient noise tomography (Song et al., 2025) and full-wave ambient noise tomography (Lü et al., 2024b, c). However, the ray-based seismic tomography may affect the resolution of seismic anomalies due to the wavefront healing effect (Nolet and Dahlen, 2000), especially in resolving small-scale low-V anomaly patterns and amplitudes (Song et al., 2025). Moreover, the previous full-wave ambient noise tomographic results depicted large-scale seismic features with a relatively low resolution of ∼40 km and lacked an analysis of correlation with seismic activity. In this study, we select the denser temporary stations around the WDLC volcanic field and construct a higher-resolution (∼27 km) crustal shear-velocity model. The improved resolution model reveals detailed features of the low-velocity zones, providing insights into the geometry of the crustal magma reservoir, a more accurate estimation of the melt fraction, and a clearer understanding of its spatial correlation with seismic activity.
We deployed 30 temporary stations that operated from January 2018 to April 2019, spreading throughout the WDLC volcano (Fig. 1b). The temporary stations were equipped with three-component seismometers that are capable of measuring seismic signals over a broad range of frequencies from 50 Hz to 120 s, and these instruments record the data with a high sampling rate of 40 Hz. Due to the dense network of stations (average inter-station spacing is ∼30 km and the closest spacing is ∼10 km), we can construct a detailed high-resolution shear-wave velocity model beneath the WDLC volcanic field, specifically focusing on understanding the structure and dynamics of the volcanic system and assessing potential hazards.
The cross-correlation of vertical waveforms is used for extraction of the empirical Green functions (EGFs) between each station pair. After the removal of the instrument responses, the waveforms are downsampled to 5 Hz, and a frequency–time-normalization technique is applied to expand their frequency range (Shen et al., 2012). Specifically, the seismograms are filtered by using a series of narrow-frequency band-pass filters ranging from 0.0125 to 2 Hz. Subsequently, each filtered seismogram is normalized by its envelope and then summed to obtain the final frequency–time normalized seismograms. This technique has been proven to enhance the signal-to-noise ratio of the resultant EGFs, enabling the acquisition of longer-period signals (Lü et al., 2019, 2021). The daily cross-correlations are then stacked to obtain EGFs for each set of stations. The resulting high-quality Rayleigh wave EGFs can be retrieved at different period bands in both positive and negative time lags (Fig. 3). To measure the phase delays of Rayleigh wave EGFs, we cross-correlate the observed EGFs with synthetic waveforms for different periods. The targeted time windows of Rayleigh waves are calculated with their typical minimum and maximum shear velocity of 2.5 and 5 km s−1. We minimize the discrepancies between the synthetics and EGFs with amplitude normalization applied to account for amplitude fluctuations (Fig. S3 in the Supplement), and we analyze four periods ranging from 10–20 s, 7–15 s, 5–10 s, and 3–7 s (Fig. 4). In contrast to the longer-period data (10–20 s, 7–15 s), the shorter-period data (5–10 s, 3–7 s) are relatively scattered due to the shallow structure not being well defined. We only consider EGFs with a signal-to-noise ratio ≥4 and a correlation coefficient of at least 0.6 between the synthetic and observed waveforms. Here The signal-to-noise ratio is calculated as the ratio of the peak signal amplitude within the analysis window to the maximum standard error of the mean derived from monthly EGFs in the same window (Lü et al., 2019). These criteria ensured that the phase delay measurement was based on high-quality data with a strong correlation between the observed EGFs and synthetic signals.
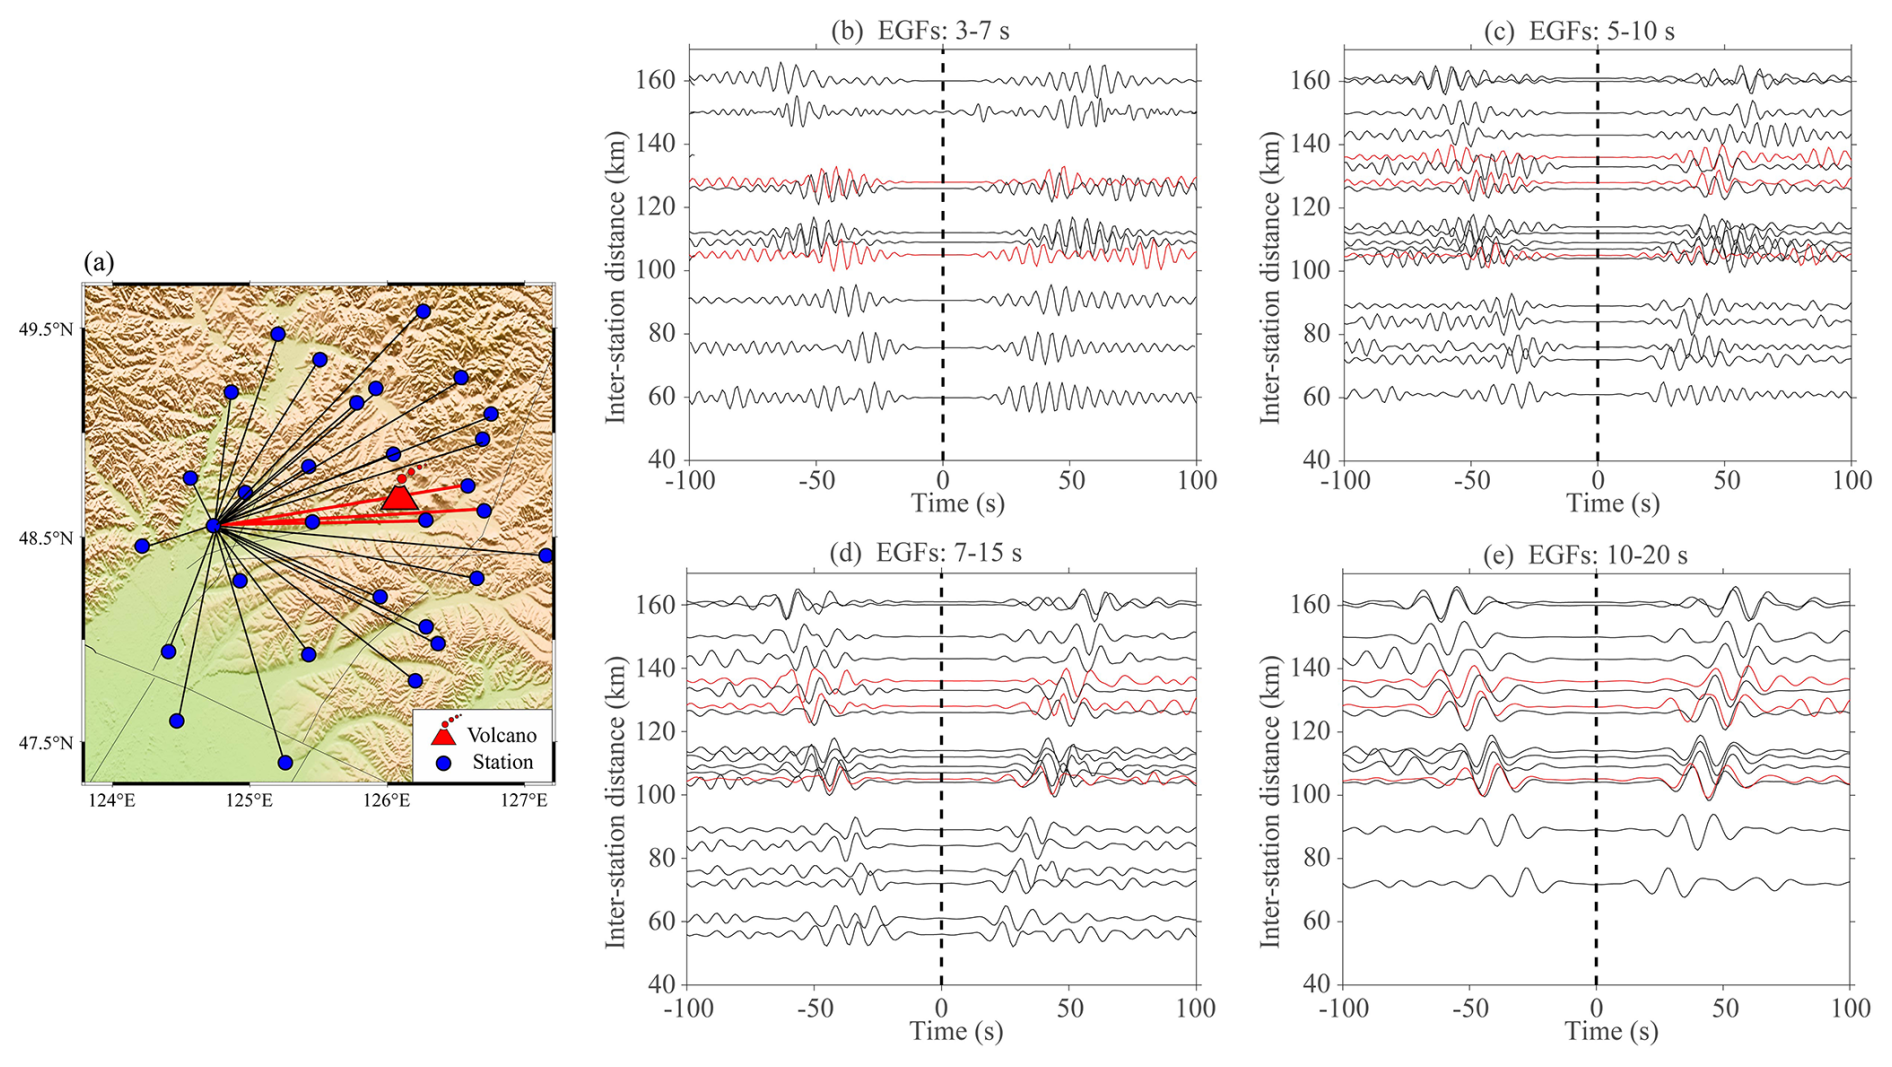
Figure 3Examples of empirical Green functions derived from ambient noise data. The ray paths are shown in panel (a), and the red lines represent the ray paths around the WDLC volcano. The waveforms are filtered at (b) 3–7 s, (c) 7–15 s, (d) 7–15 s, and (e) 10–20 s periods, respectively. The red traces correspond to the station pairs crossing the WDLC volcano with the red ray paths in panel (a).
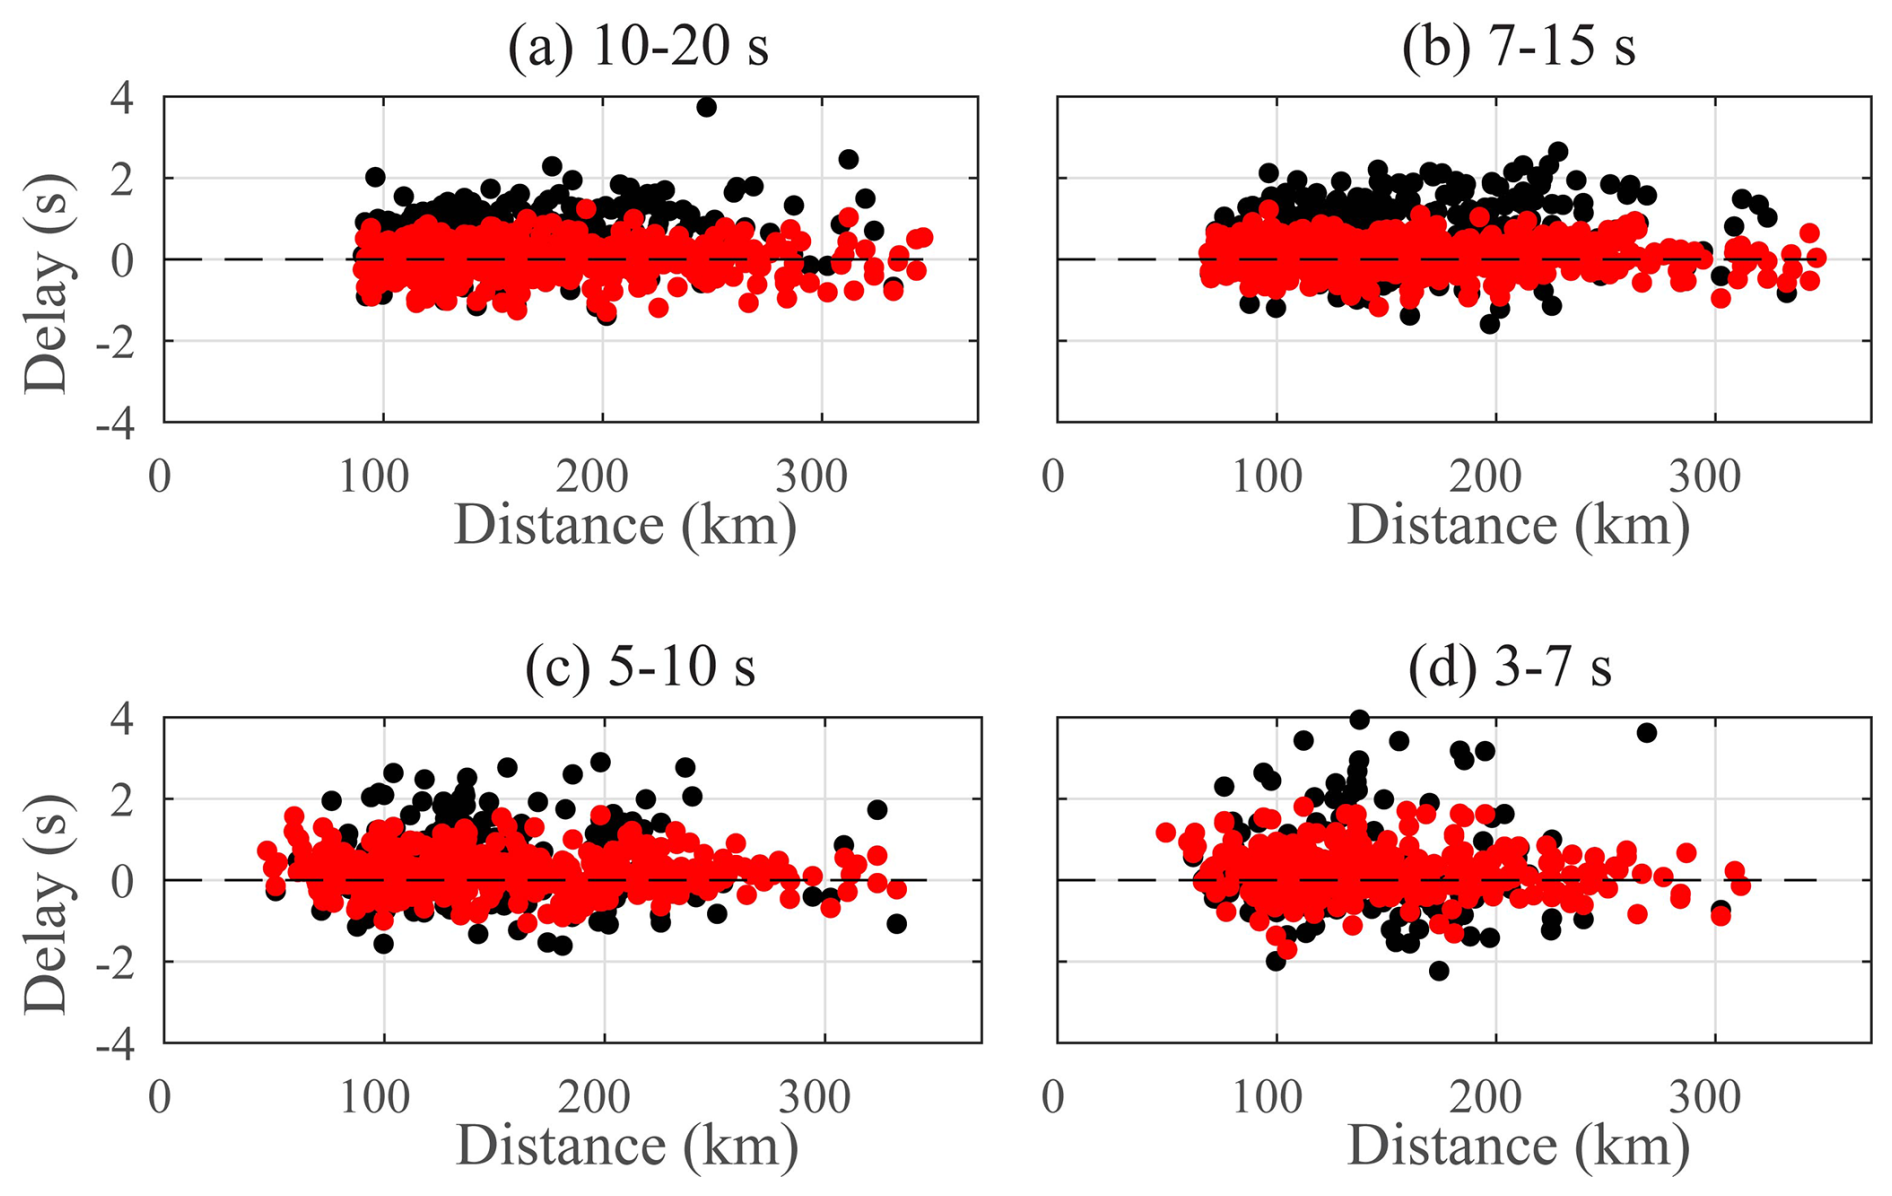
Figure 4Distribution of phase delays between the observed empirical Green functions and the synthetics computed using the initial velocity model (black dots) and the final velocity model (red dots). Phase delays are measured at periods of (a) 10–20 s, (b) 7–15 s, (c) 5–10 s, and (d) 3–7 s, respectively.
Waveform propagation in the 3-D heterogeneous Earth structure is simulated using the non-staggered grid finite-difference method, as described by Zhang et al. (2012). The initial 3-D model is based on a 0.5°×0.5° shear-wave velocity model underneath mainland China based on surface wave dispersion (Shen et al., 2016). This model has limited resolution to capture detailed variations within the crust due to the limitation of station coverage and the assumption of a one-dimensional layered medium during its construction. We define the initial model grid spanning the region from 47 to 50° latitude and 123 to 128° longitude, extending from the Earth's surface down to 199 km depth with a vertical interval of 0.5 km. To enhance the efficiency of the finite-difference algorithm, a non-uniform grid spacing is utilized for discretization. The lateral grid spacing is set at 0.025°×0.025° in the longitudinal and latitudinal directions, while the vertical grid size varies continuously. The vertical grid interval near the surface is ∼0.9 km and increases to ∼2.7 km at 25 km depth. The compressional wave velocity and density in the initial model are derived from empirical relationships (Christensen and Mooney, 1995). Synthetic waveforms are calculated using a half width of 4.5 s Gaussian pulse as the source-time function at each station. Updated synthetic waveforms are computed for the iteratively refined 3-D velocity model in each iteration. To cover the longest inter-station distance in the study, a total of 2000 steps are run with a time step of 0.15 s to model wave propagation over 300 s.
The 3-D finite-frequency sensitivities of the Rayleigh wave are computed for each period band using the scattering-integral method (Zhao et al., 2005). This approach can be utilized to establish an accurate high-resolution 3-D velocity model in comparison with the ray theory. Both P and S waves contribute to the Rayleigh wave propagation, especially in the shallower layers (Gao and Shen, 2014; Lü et al., 2019). Our method involves analyzing sensitivity kernels for both P and S wave velocities in the joint inversion, providing enhanced constraints on shallow crustal properties and yielding more precise and reliable solutions for deeper structures (Lü and Lei, 2022). Density was not explicitly included in the inversion process. However, density is updated through an empirical relationship between the compressional wave velocity and density (Christensen and Mooney, 1995). During each iteration, new sensitivity kernels were calculated by simulating wave propagation with the updated velocity model. Following the construction of sensitivity kernels, the joint inversion is solved using the LSQR algorithm with a series of damping and smoothing constraints (Paige and Saunders, 1982). We select the optimal smoothing and damping parameters based on the tradeoff between the model norm and data misfit (Fig. S4 in the Supplement). The velocity perturbations are then updated and added to the 3-D reference model after each iteration.
By incorporating the latest temporary broadband seismic array, the high-resolution seismic features at finer scales have been significantly enhanced. To qualitatively assess the spatial resolution scale, a series of checkerboard tests are conducted at different depths (Fig. 5). The checkerboard input models are designed with ±6 % alternating velocity perturbations at varying depths. The synthetic phase delays are determined by utilizing the sensitivity kernels that are calculated from the last iteration. The checkerboard resolution tests revealed that the input model exhibits excellent recoverability at depths ranging from 11 to 17 km with different cell sizes (Fig. 5). At 3 km depth, the input velocity perturbations can be well resolved with a cell size larger than 37 km. The amplitude of the checkerboard pattern appears to be underestimated at shallow (3 km) and lower crustal (25 km) depths due to the reduction of data for shorter (3–7 s) and longer (10–20 s) periods. Overall, the checkerboard tests demonstrate that the small-scale crustal features with a horizontal scale larger than 27 km can be effectively resolved in the upper-middle crust where most earthquakes are prone to generate. In addition, to further validate the credibility of a significant low-velocity feature, we carry out a specific model recovery test in terms of the anomaly pattern (Fig. S5 in the Supplement). The pattern and magnitude of the anomaly can be well recovered with a minor amount of unavoidable smearing at corresponding depths. Our resolution tests indicate that the observed key structural features beneath the WDLC volcanic field are reliable based on the current dense broadband seismic array data coverage.
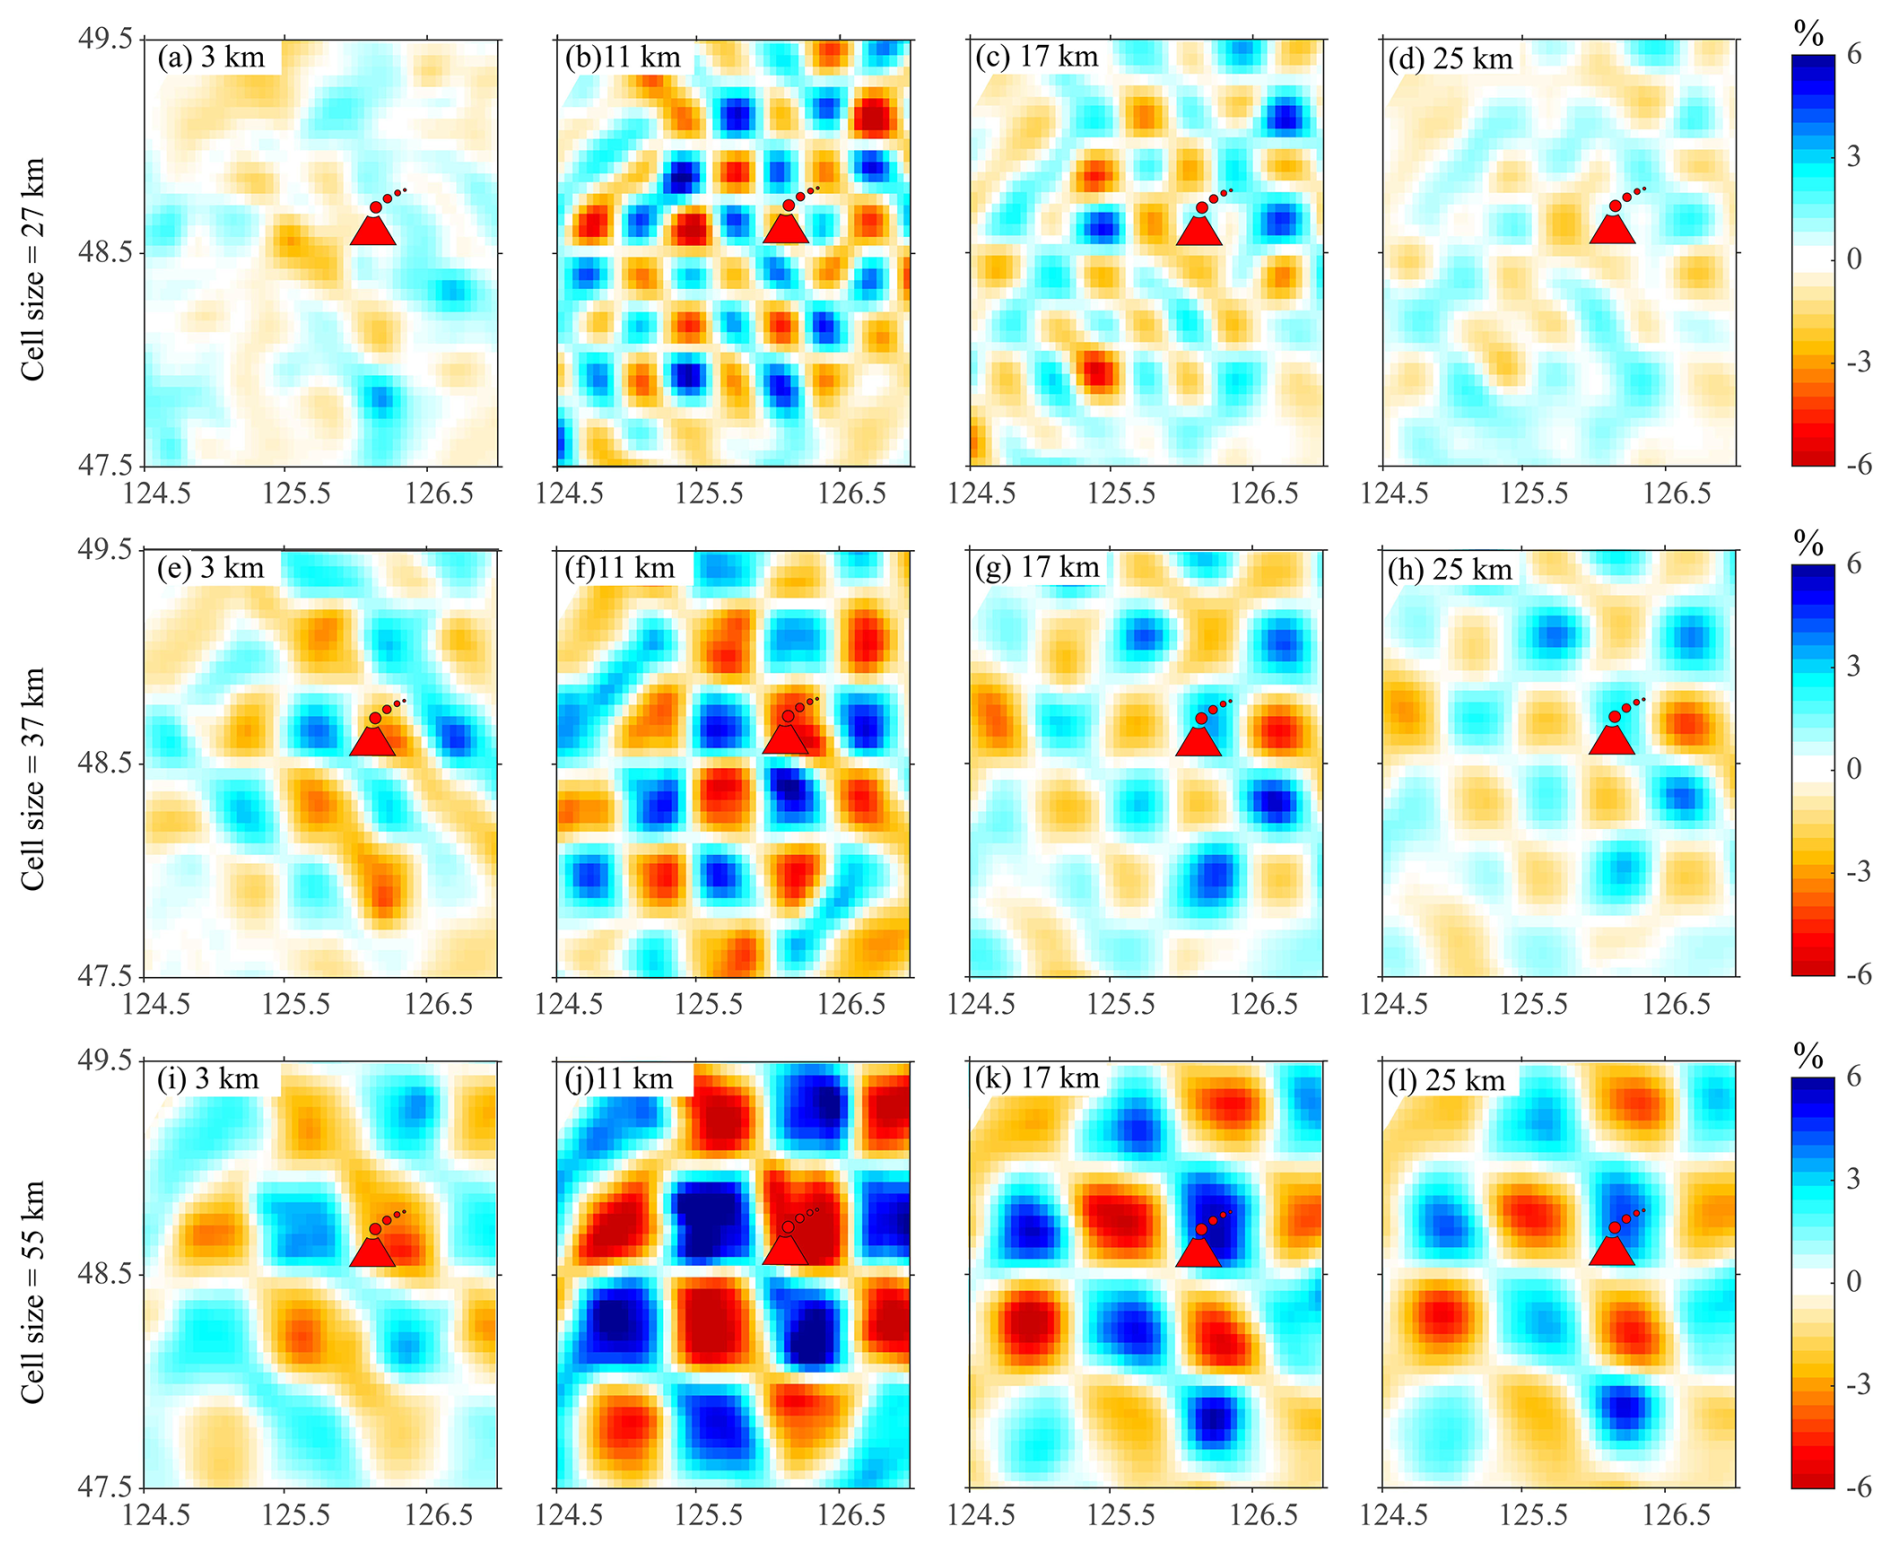
Figure 5Checkerboard resolution tests at multiple depths for the shear wave velocity models. The velocity perturbation varies within a range of ±6 %.
Our new shear-wave velocity model reveals remarkable details in seismic velocity features at various depths (Fig. 6). The short-period Rayleigh waves are most sensitive to P-wave velocity at shallow depths (Gao and Shen, 2014), and a strong correlation is observed between the P-wave velocity anomaly and the regional faults at 3 km depth (Fig. S6 in the Supplement). However, the P-wave velocity structure is not well constrained at 11 km depth in comparison with the shear-wave structure due to the limited resolution (Fig. S7 in the Supplement). Here, we only interpret shear-wave velocity model observed in the study region. The obvious low-velocity anomalies are observed beneath the Songliao Basin, whereas high-velocity anomalies are visible under the mountain ranges at a depth of 3 km. The low-velocity anomalies beneath the Songliao Basin are gradually concentrated between the Nenjiang fault (F1) and the Hailun-Renmin fault (F2) at 11 km depth. At the middle-lower crust, a distinct low-velocity anomaly exists beneath the WDLC volcano, extending from 17 km down to about 25 km depth, contrasting with strong high-velocity anomalies imaged between the F1 and F2 faults (Fig. 6). The strong lateral variations of the shear-wave velocity contrast underlying the WDLC volcano within the crust are prominently imaged in the vertical cross-sections (Fig. 7). Beneath the WDLC volcano, we observe significant low-velocity features at depths of ∼10–23 km. The velocity beneath the Songliao Basin is significantly lower than the regional average value. The earthquakes are mainly located in the low-velocity anomalies or the transition zones from low-velocity to high-velocity anomalies in the upper-middle crust.
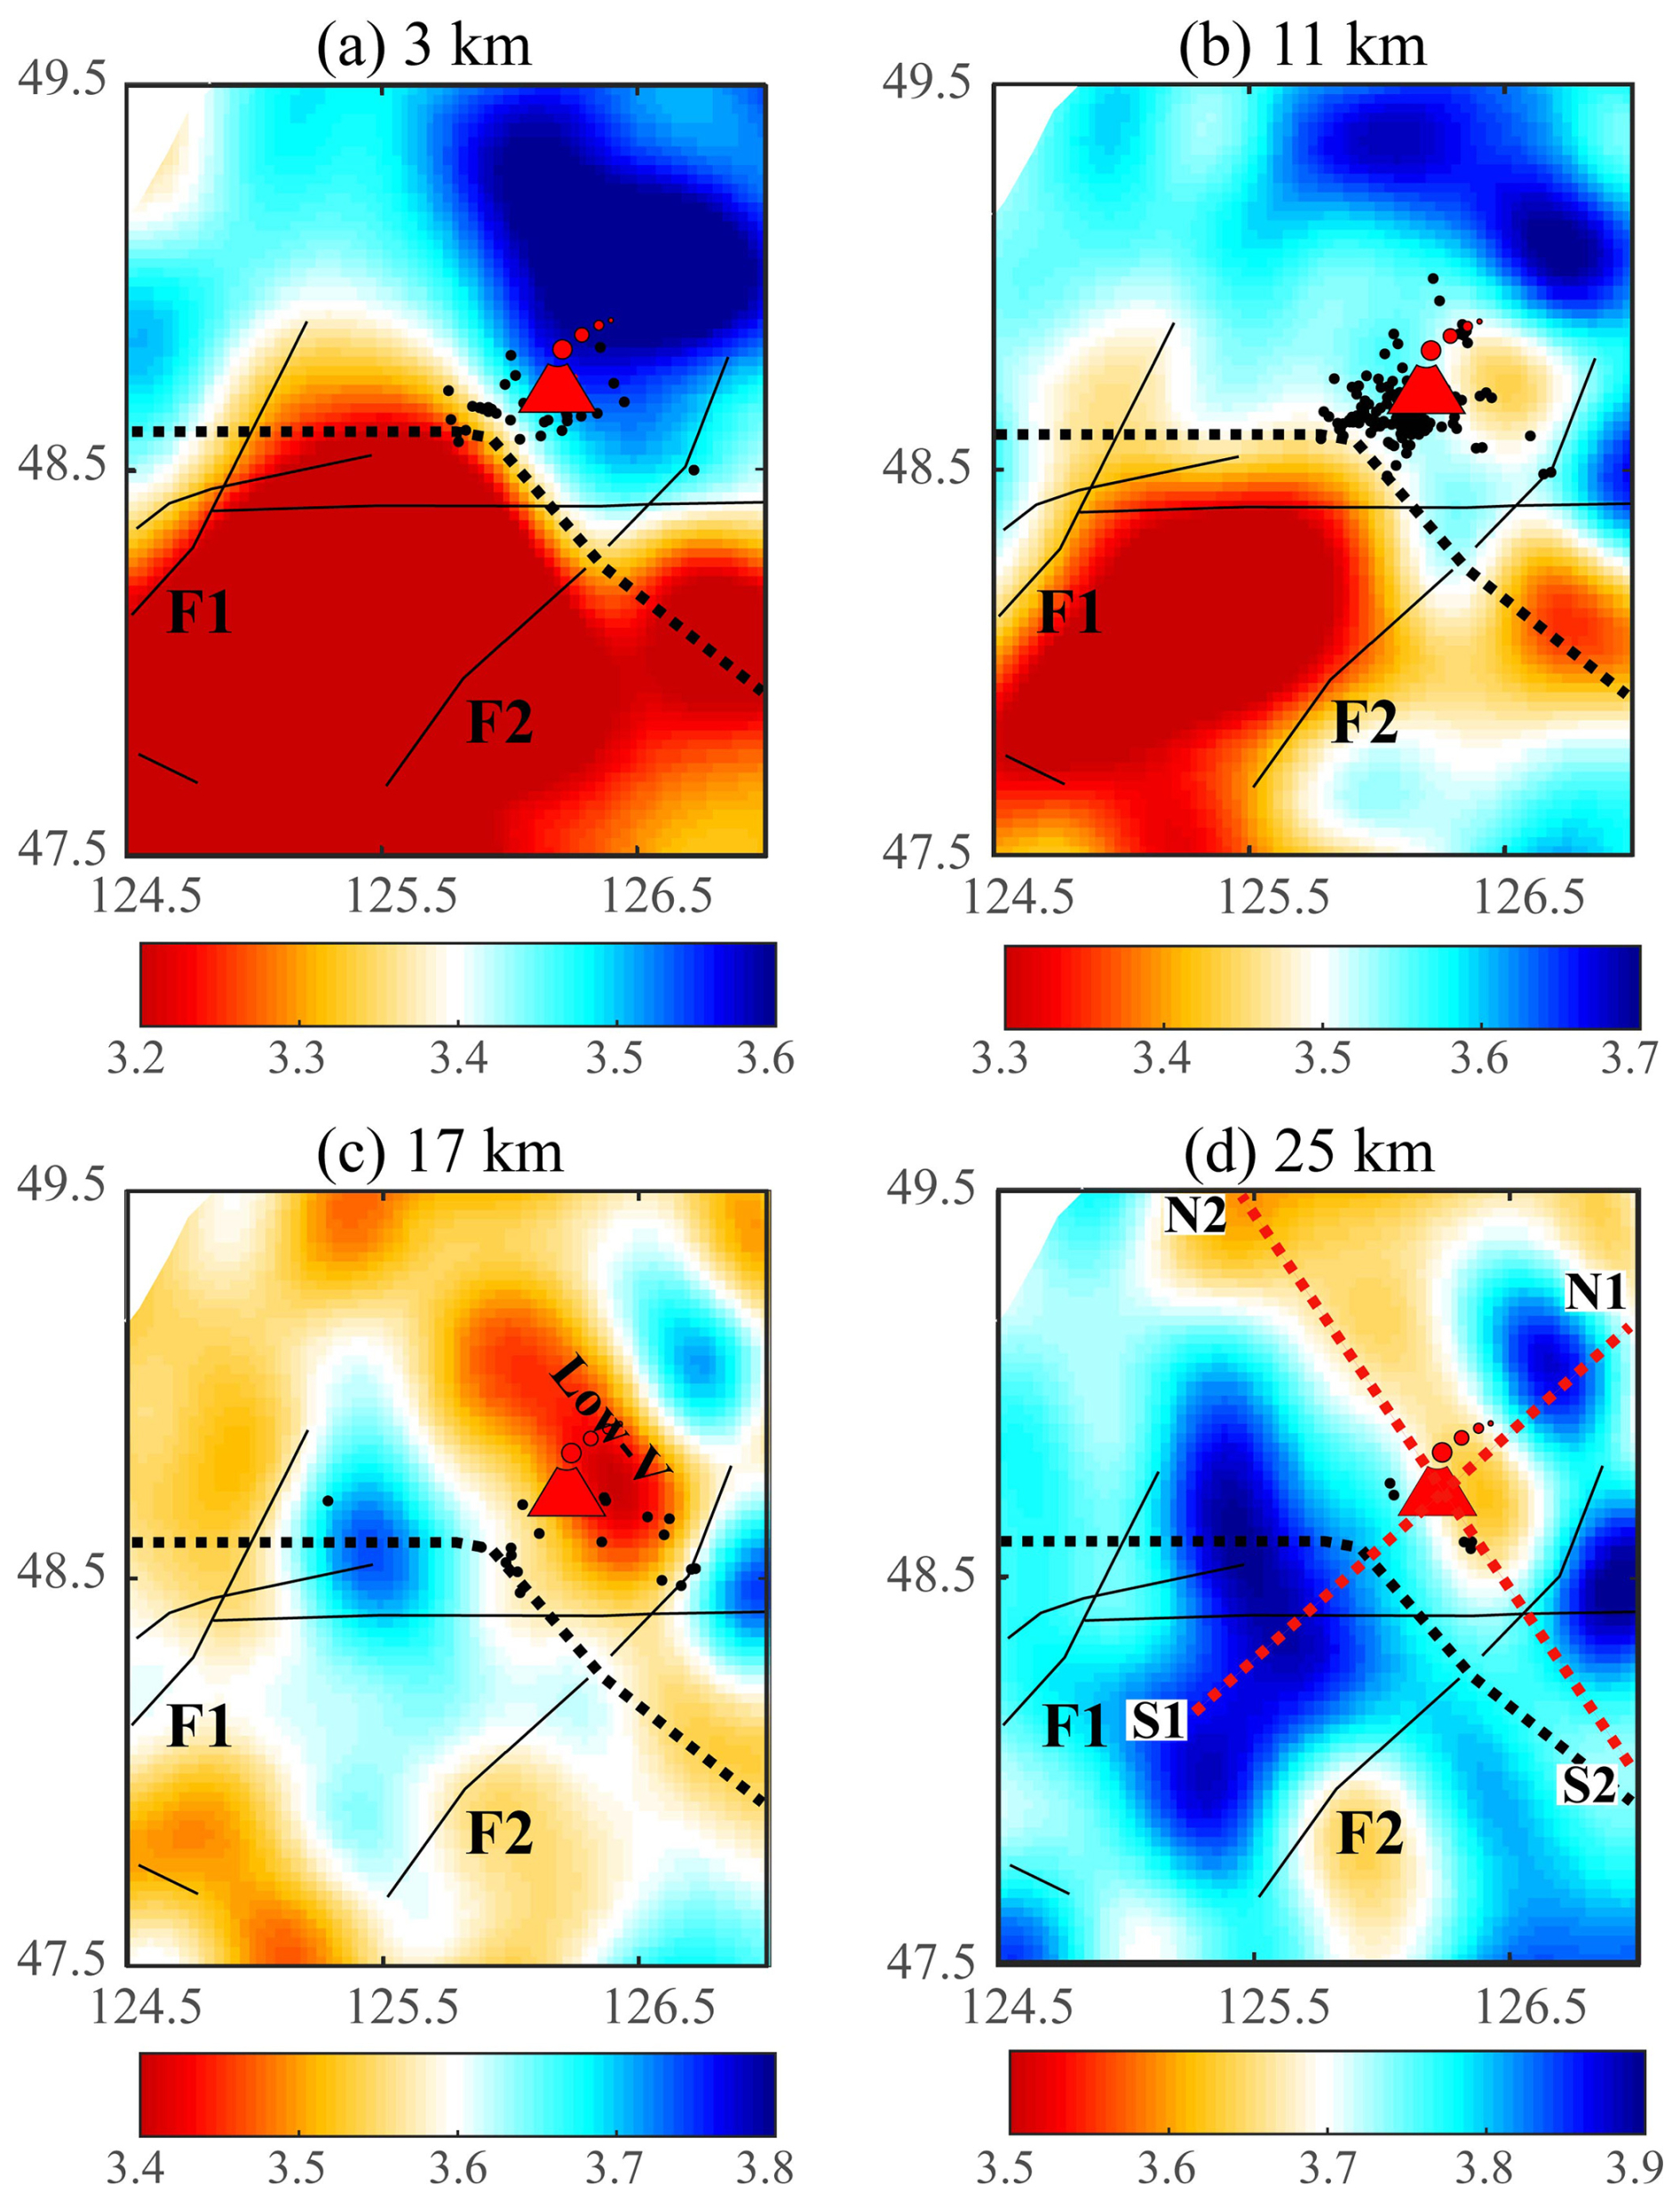
Figure 6Shear-wave velocity structures at multiple depths. The red dashed lines in panel (d) mark the profile locations in Fig. 7. The black dashed lines mark the outlines of the Songliao Basin. The black dots represent the earthquakes beneath the WDLC volcano. Other labels are the same as those in Fig. 1.
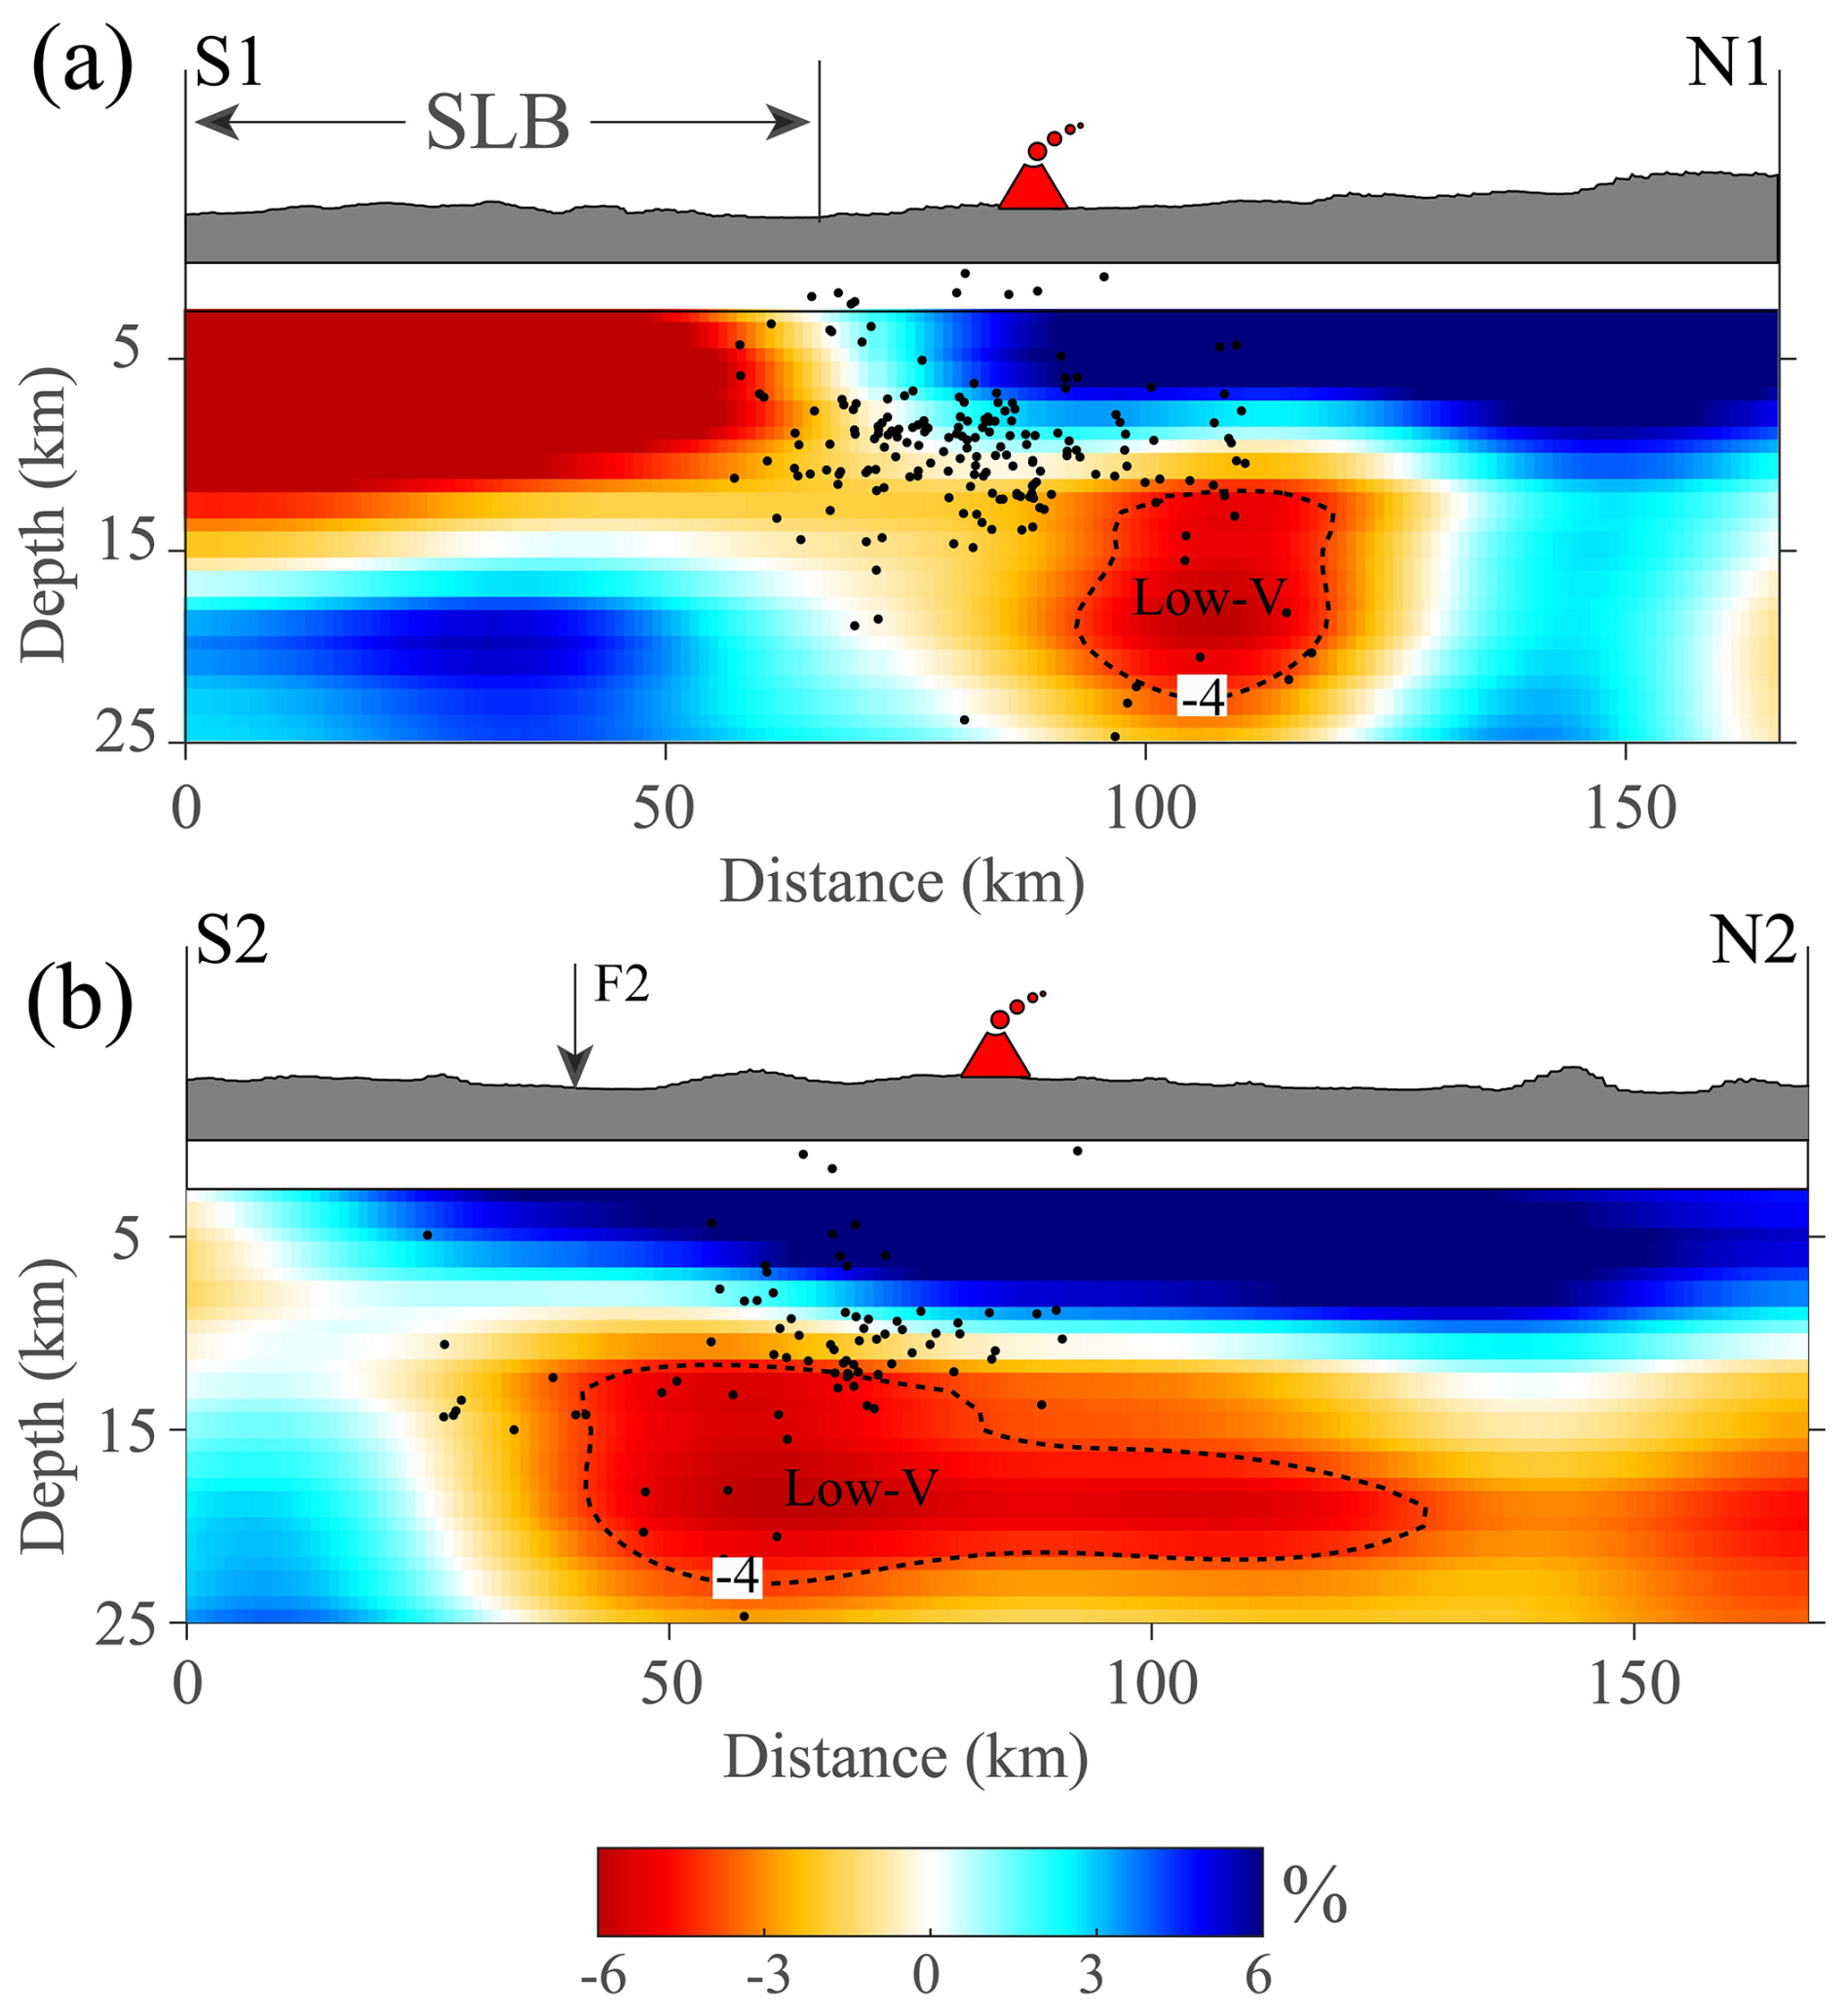
Figure 7Cross-section view of the shear-wave velocity model and the distribution of the earthquakes. See Fig. 6d for the profile locations. Topographic elevation is plotted atop each cross-section. The black dots represent the earthquakes in the study region. The dashed line represents the −4 % velocity reduction boundary in each cross-section.
4.1 Comparison with recent shear-wave velocity models
Our new shear-wave velocity model reveals seismic features showing tight correlations with the major elements of the WDLC volcanic field at various depths, in comparison with recent shear-wave velocity models from traditional ambient noise tomography (Figs. 8 and S8 in the Supplement), such as Shen et al. (2016), Fan et al. (2021), Chen et al. (2021), and Song et al. (2025).
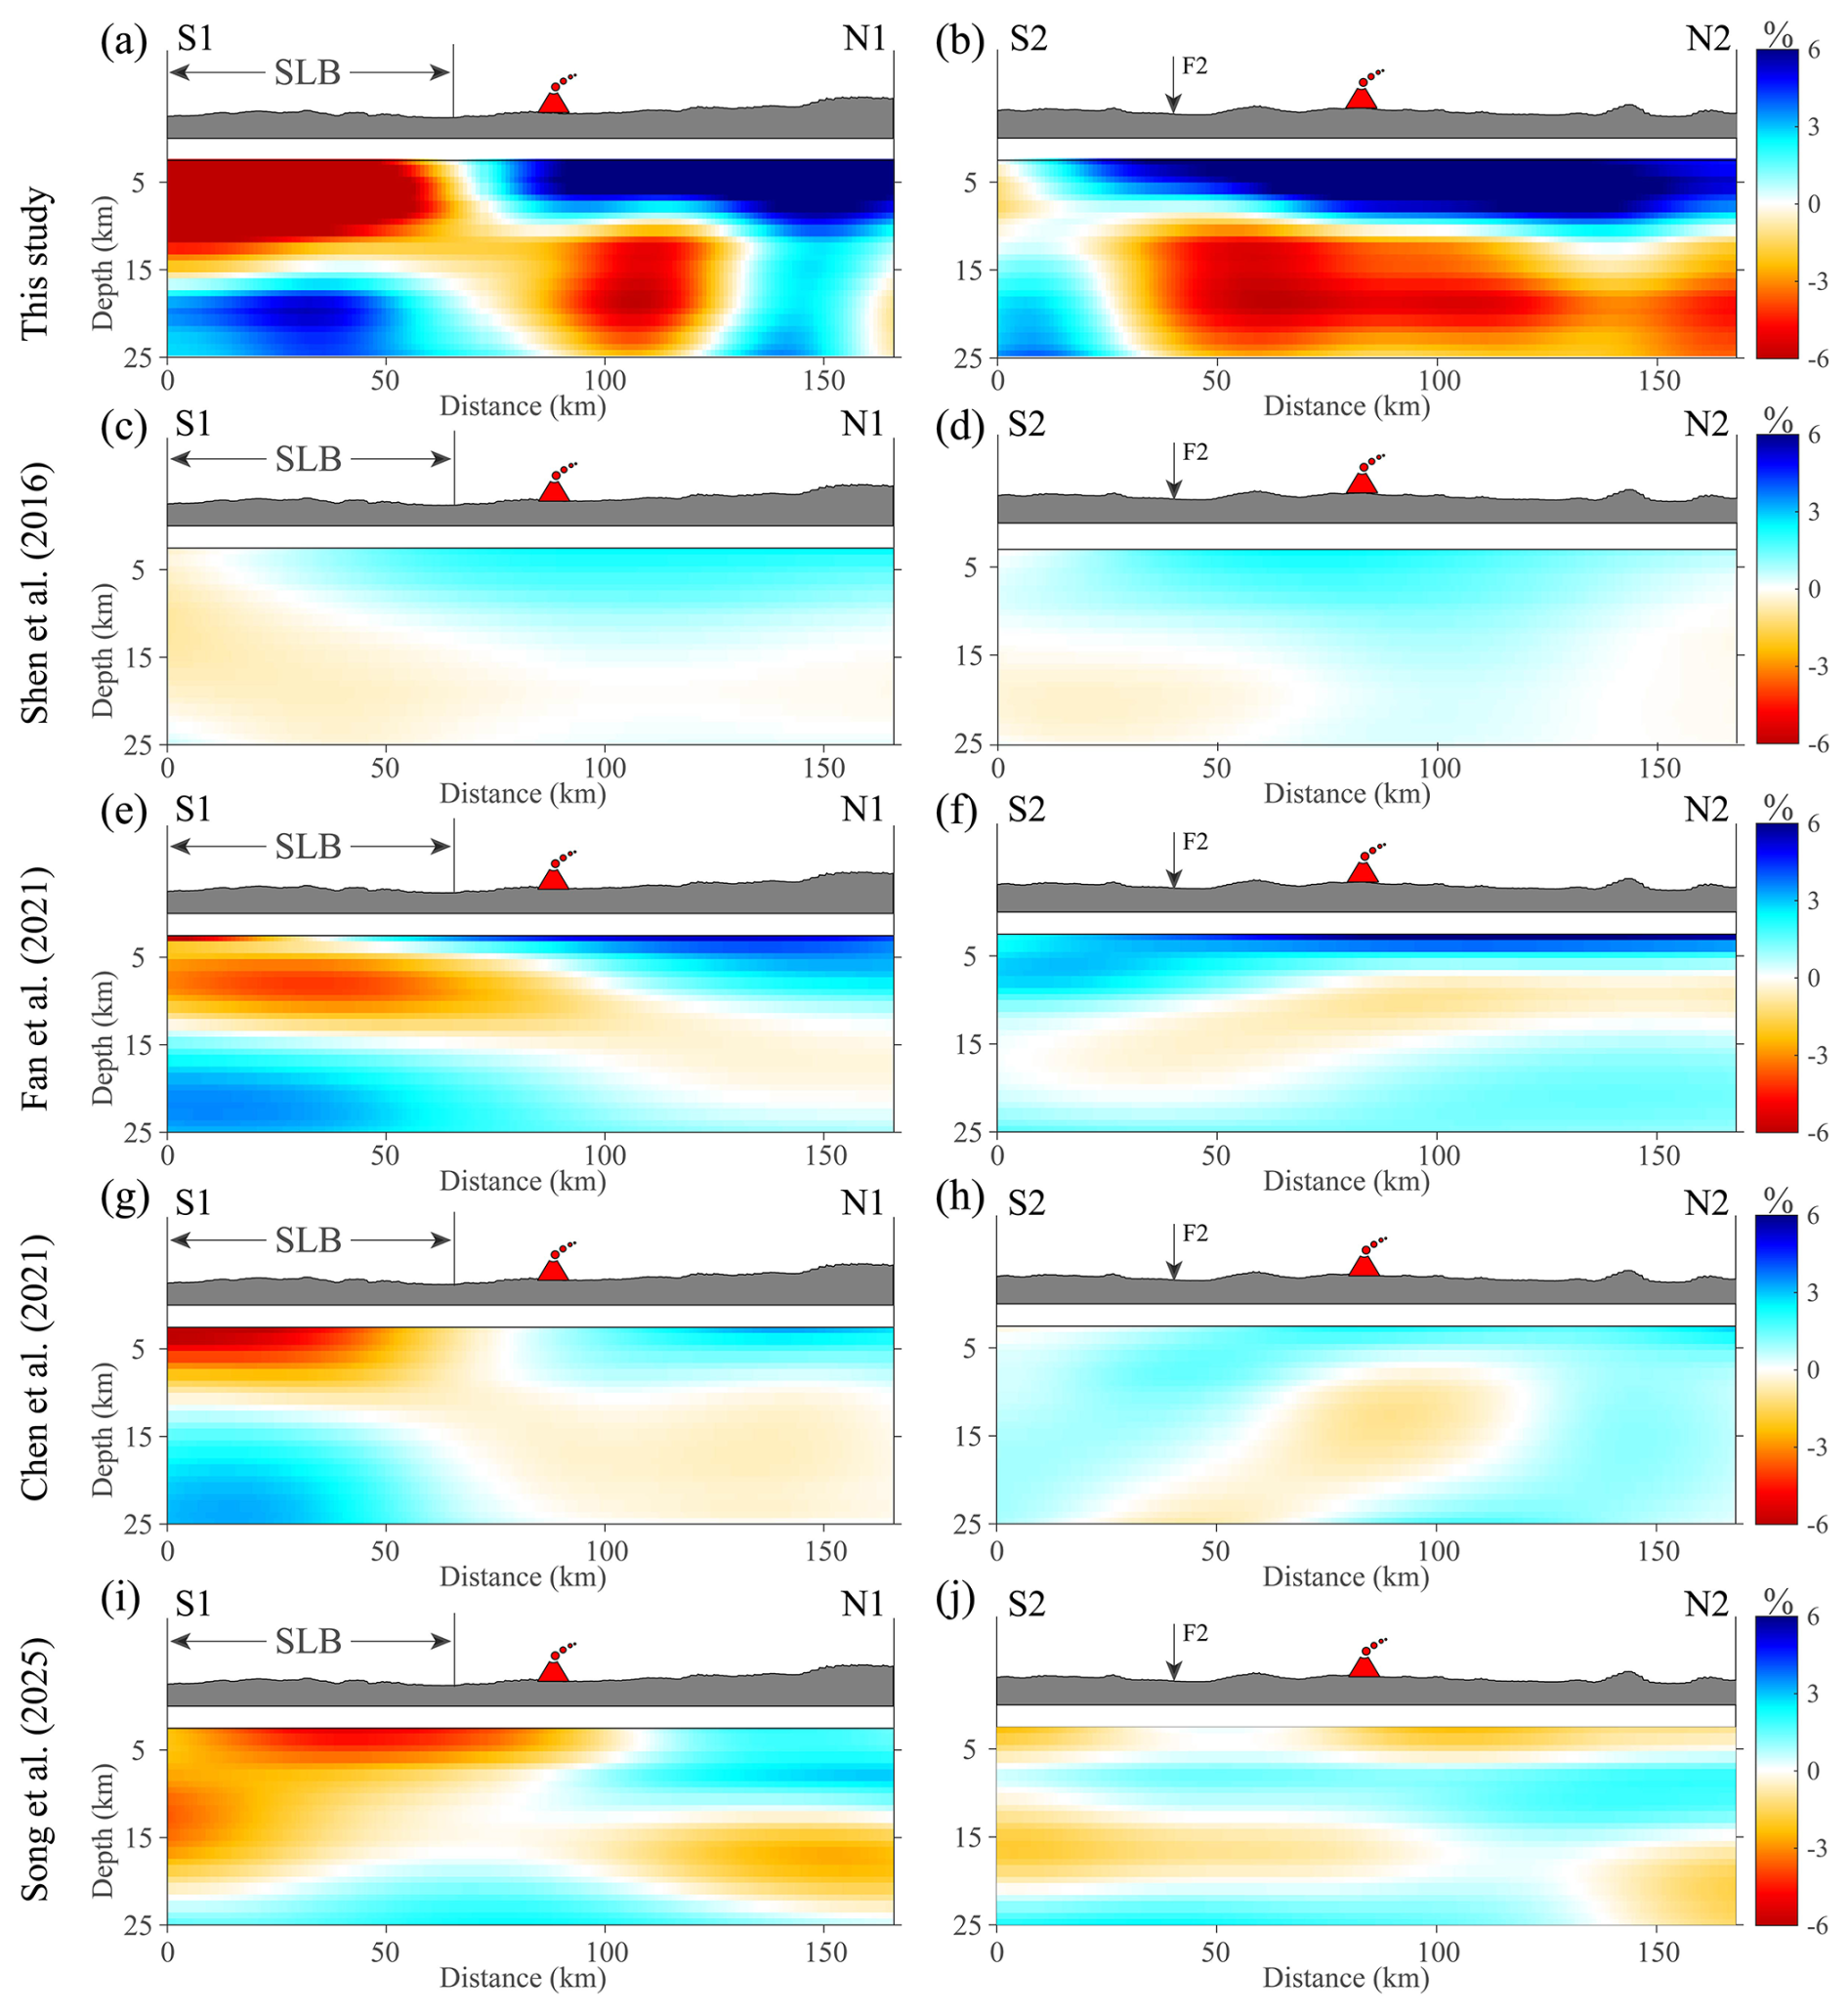
Figure 8Comparison of cross-sections between our shear-wave velocity model and recent shear-wave velocity models. The symbols are the same as in Fig. 7.
The traditional ambient noise tomography is based on the ray-based inversion method and assumes that the Rayleigh wave phase velocity is mainly sensitive to shear wave velocity (Lü et al., 2024a). Due to wavefront healing (Nolet and Dahlen, 2000), the recovered shear-wave anomalies could be decreased by a factor of 2 or more (Maguire et al., 2022). Additionally, our deployment of a denser seismic network yields a higher crustal resolution compared to previous regional models (Shen et al., 2016; Fan et al., 2021). Moreover, compared to the model of Lü et al. (2024c), we retrieve higher-frequency signals that enhance the sensitivity to shallow structure. The full-wave methods simulate the synthetic waveforms accounting for the physics of seismic wave propagation in the 3-D Earth model, calculate numerical sensitivity kernels, and iteratively invert the shear-wave velocity structure. Theoretically, the full-wave method is more accurate to obtain a high-resolution model (Nolet and Dahlen, 2000; Maguire et al., 2022; Gao and Shen, 2014; Lü et al., 2019). For example, at 3 km depth, compared with recent shear-wave velocity models that demonstrate pervasive low-velocity anomalies surrounding the Songliao Basin, our model reveals obvious low-velocity anomalies corresponding to the outline of the Songliao Basin (Fig. S8). At the depths of 17–25 km, our model demonstrates distinct low-velocity anomalies beneath the WDLC volcano compared with the shear-wave velocity from the recent models. Moreover, our model also reveals some new seismic features. The F1 and F2 faults are significant velocity contrast boundaries at a depth of 11–25 km. In the vertical cross-sections (Fig. 8), our model reveals a circular low-velocity body in the middle-lower crust, which clearly reflects the shape of the middle-lower crustal magma reservoir. Additionally, the dense array provides better coverage and higher sensitivity to small-scale velocity anomalies, enabling us to clearly delineate the low-velocity zone directly beneath the WDLC volcano. It is noted that this feature was not clearly identified by the recent models. Those observations reveal remarkable details in seismic velocity features and provide a tighter spatial linkage with the underlying volcanic system.
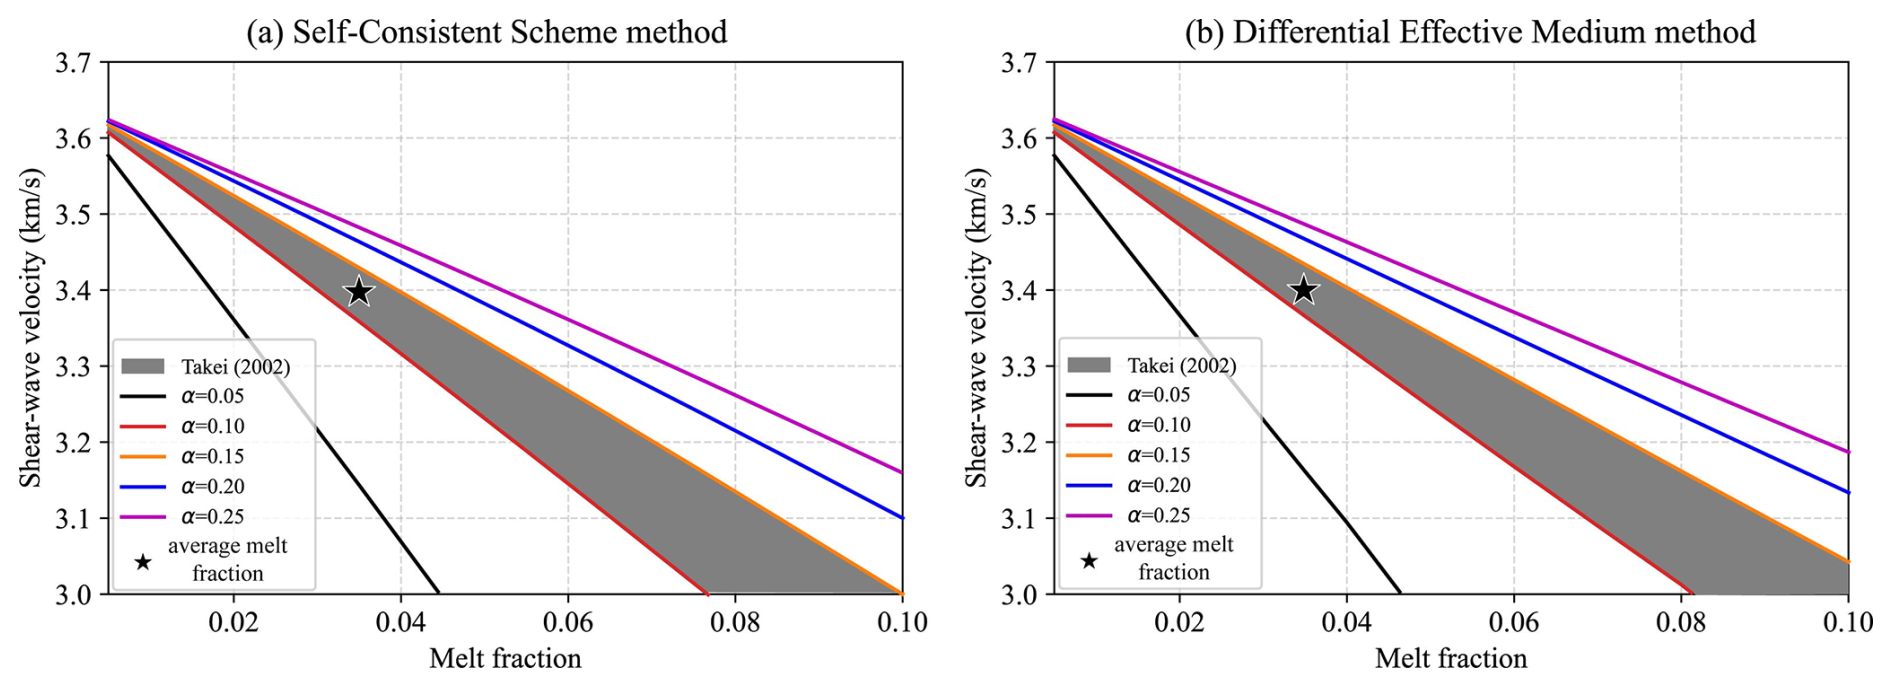
Figure 9Estimation of the melt fraction for the middle-lower crustal magma reservoir beneath the WDLC volcano. The black star is the average melt fraction for the middle-lower crustal magma reservoir using the aspect ratio suggested by Takei (2002).
4.2 Correlation with seismicity
The spatial distribution of earthquakes provides insights into the development of magmatic activity. Earthquake activity beneath a volcano typically increases prior to an eruption due to the movement of magma and gases, which exert pressure on the surrounding rocks, leading to the fracturing of rocks or the vibration of existing cracks (Roman and Cashman, 2018). The earthquake activity beneath the WDLC volcano appears to be strongly influenced by the observed features in the shear-wave velocity model (Fig. 7). The earthquakes are located in relatively large velocity gradients above the middle-lower crustal magma reservoir beneath the WDLC volcano. This spatial association is interpreted as stress concentration at structural discontinuities induced by magmatic processes such as magma ascent. The magma ascent exerts pressure on the overlying brittle crust, resulting in the generation of the earthquakes (Kiser et al., 2016; Korger and Schlindwein, 2014). Since 2021, the frequency of microseismic events has shown a notable increase, indicating a progressive intensification of magmatic activity beneath the volcano. This increased seismicity likely points to ongoing magma migration and the pressurization of the middle-lower crustal reservoirs. Notably, a few earthquakes occurred in the center of the low-velocity body of the middle-lower crustal magma reservoir. To estimate the melt fraction, we follow the approach of Paulatto et al. (2022), considering a range of spheroidal melt inclusion aspect ratios for dry basalt. This allows us to derive the relationship between absolute seismic velocities and melt fraction. We use 6.56 and 3.54 km s−1 as the P- and S-wave velocities for basalt crystals in the middle crust, respectively, extrapolated from Christensen and Stanley (2003) using a second-order polynomial fit. For dry molten basalt, we use a density of 2.70 g cm−3 and a P-wave velocity of 2.83 km s−1 based on the experimentally constrained model of Ueki and Iwamori (2016). Using the Self-Consistent Scheme and Differential Effective Medium method (Paulatto et al., 2022), we compute melt fraction curves for basalt at 18 km depth, assuming a bulk density of 2.882 g cm−3. From the velocity-anomaly–melt-fraction relationships (Takei, 2002), we infer an average melt fraction of ∼3.5 % within the middle-lower crustal magma reservoir, corresponding to an S-wave velocity of 3.40 km s−1 (Fig. 9). The presence of partial melt within the magma reservoir could make the strength of the surrounding rocks more susceptible to ductile deformation, implying that the earthquake nucleation is more difficult within the middle-lower crustal magma reservoir beneath the WDLC volcano. Therefore, combining the seismicity and our observed low-velocity structures, we suggest that the magma upward migration from the middle-lower crustal magma reservoir would drive rock fracturing above the magma reservoir, which might be responsible for the earthquakes beneath the WDLC volcano. The sustained monitoring is essential for detecting precursory signals of potential eruptions, understanding the dynamics of magmatic activity, and mitigating volcanic hazards.
4.3 Implication for multi-level magmatic system
Here we propose a schematic model to illustrate the key seismic features observed beneath the WDLC volcano as well as possible interpretations based on our and recent shear-wave models (Fig. 10). However, we cannot rule out other possible causes for the deep magmatic system. The geometry of the observed middle-lower crustal magma reservoir beneath the WDLC volcano plays a key role in understanding magma accumulation and feeding systems, which may establish an important link for better defining the volcanic dynamics from deep mantle to shallow crust. Deep mantle-scale tomographic studies revealed a low-velocity anomaly down to about 410 km depth beneath the WDLC volcano (Lei and Zhao, 2005; Zhao et al., 2007; Zhang and Wu, 2019). According to the lithospheric-scale tomography study, a prominent channel-like low-velocity body was identified extending from the Moho to a depth of 100 km beneath the WDLC volcano (Chen et al., 2021). Li et al. (2016) discovered a low-velocity zone at upper crust depth (∼7–13 km) beneath a sub-volcano in the WDLC volcanic region based on a short-period dense seismic array with ambient noise tomography. Comparatively, due to the wave complexity, the signal-to-noise ratio of the observed EGFs is relatively lower at short periods. Combined with a lateral resolution of ∼27 km, our model cannot confidently image small-scale crustal reservoirs with a scale of a few kilometers as reported by Li et al. (2016). By combining our new model with previous tomographic images, we present a possible comprehensive understanding of the volcanic genesis of the WDLC volcano. The origin of the WDLC volcano is associated with the upwelling of asthenospheric materials within the big mantle wedge (Lei and Zhao, 2005). Geochemical research on rocks in the WDLC volcanic field demonstrates that the magma originates from the mantle transition zone, directly linked to the stagnation of the deeply subducted western Pacific slab (Wang et al., 2017). Subsequently, the rising asthenospheric material accumulates at the base of the lithosphere as a mantle magma reservoir, feeding the WDLC volcano and neighboring volcanoes (Chen et al., 2021). This inference is also supported by the Pn tomographic result that observed a low-velocity zone in the uppermost mantle beneath the WDLC volcanic field in northeast China (Du et al., 2022). After a long period of accumulation, the mantle magma penetrated the uppermost mantle into the middle-lower crustal magma reservoir, corresponding to our observed low-velocity anomalies in the crust beneath the WDLC volcano. Given that the last eruption of a sub-volcano in the WDLC volcanic region occurred approximately 300 years ago, combined with the constraints from the deep mantle, lithosphere, and upper crustal structures, our observed middle-lower crustal magma reservoir could potentially act as a significant reservoir for recharging the shallow magma reservoir in the upper crust. Furthermore, a well in the region exhibits an exceptionally high CO2 concentration, further indicating the activity of the WDLC volcano (Lü, 1994). In general, the active intraplate WDLC volcano demonstrates a vertical multi-level magma system from the mantle source to the upper crust (Fig. 10). The upwelling asthenospheric material driven by the deep subduction and stagnation of Pacific slab ponds at the lithospheric base then migrates to the middle-lower crustal magma reservoir that supplies the upper crustal magma reservoir. The observed middle-lower crustal magma reservoir establishes a robust connection between the accumulation of mafic magma and the generation of melts to supply the upper crustal magma reservoir as imaged by Li et al. (2016). The individual magma reservoir in the upper crust reaches local thermal equilibrium within 103 years. In contrast, large igneous systems could persist for 105 to 107 years (Cashman et al., 2017). Given that the last eruption of the WDLC volcanoes was ∼300 years ago, the upper crustal magma reservoir may be continuously supplied by the observed middle-lower crustal magma reservoir. K–Ar dating results reveal that the Wudalianchi volcano has erupted about 30 times in the past 1 Ma (Wang and Chen, 2005), which preliminarily implies that magma transport to a shallow reservoir may require ∼30 ka. In the future, more geochemical and modeling approaches are required to further evaluate magma transport processes in the multi-level magma system.
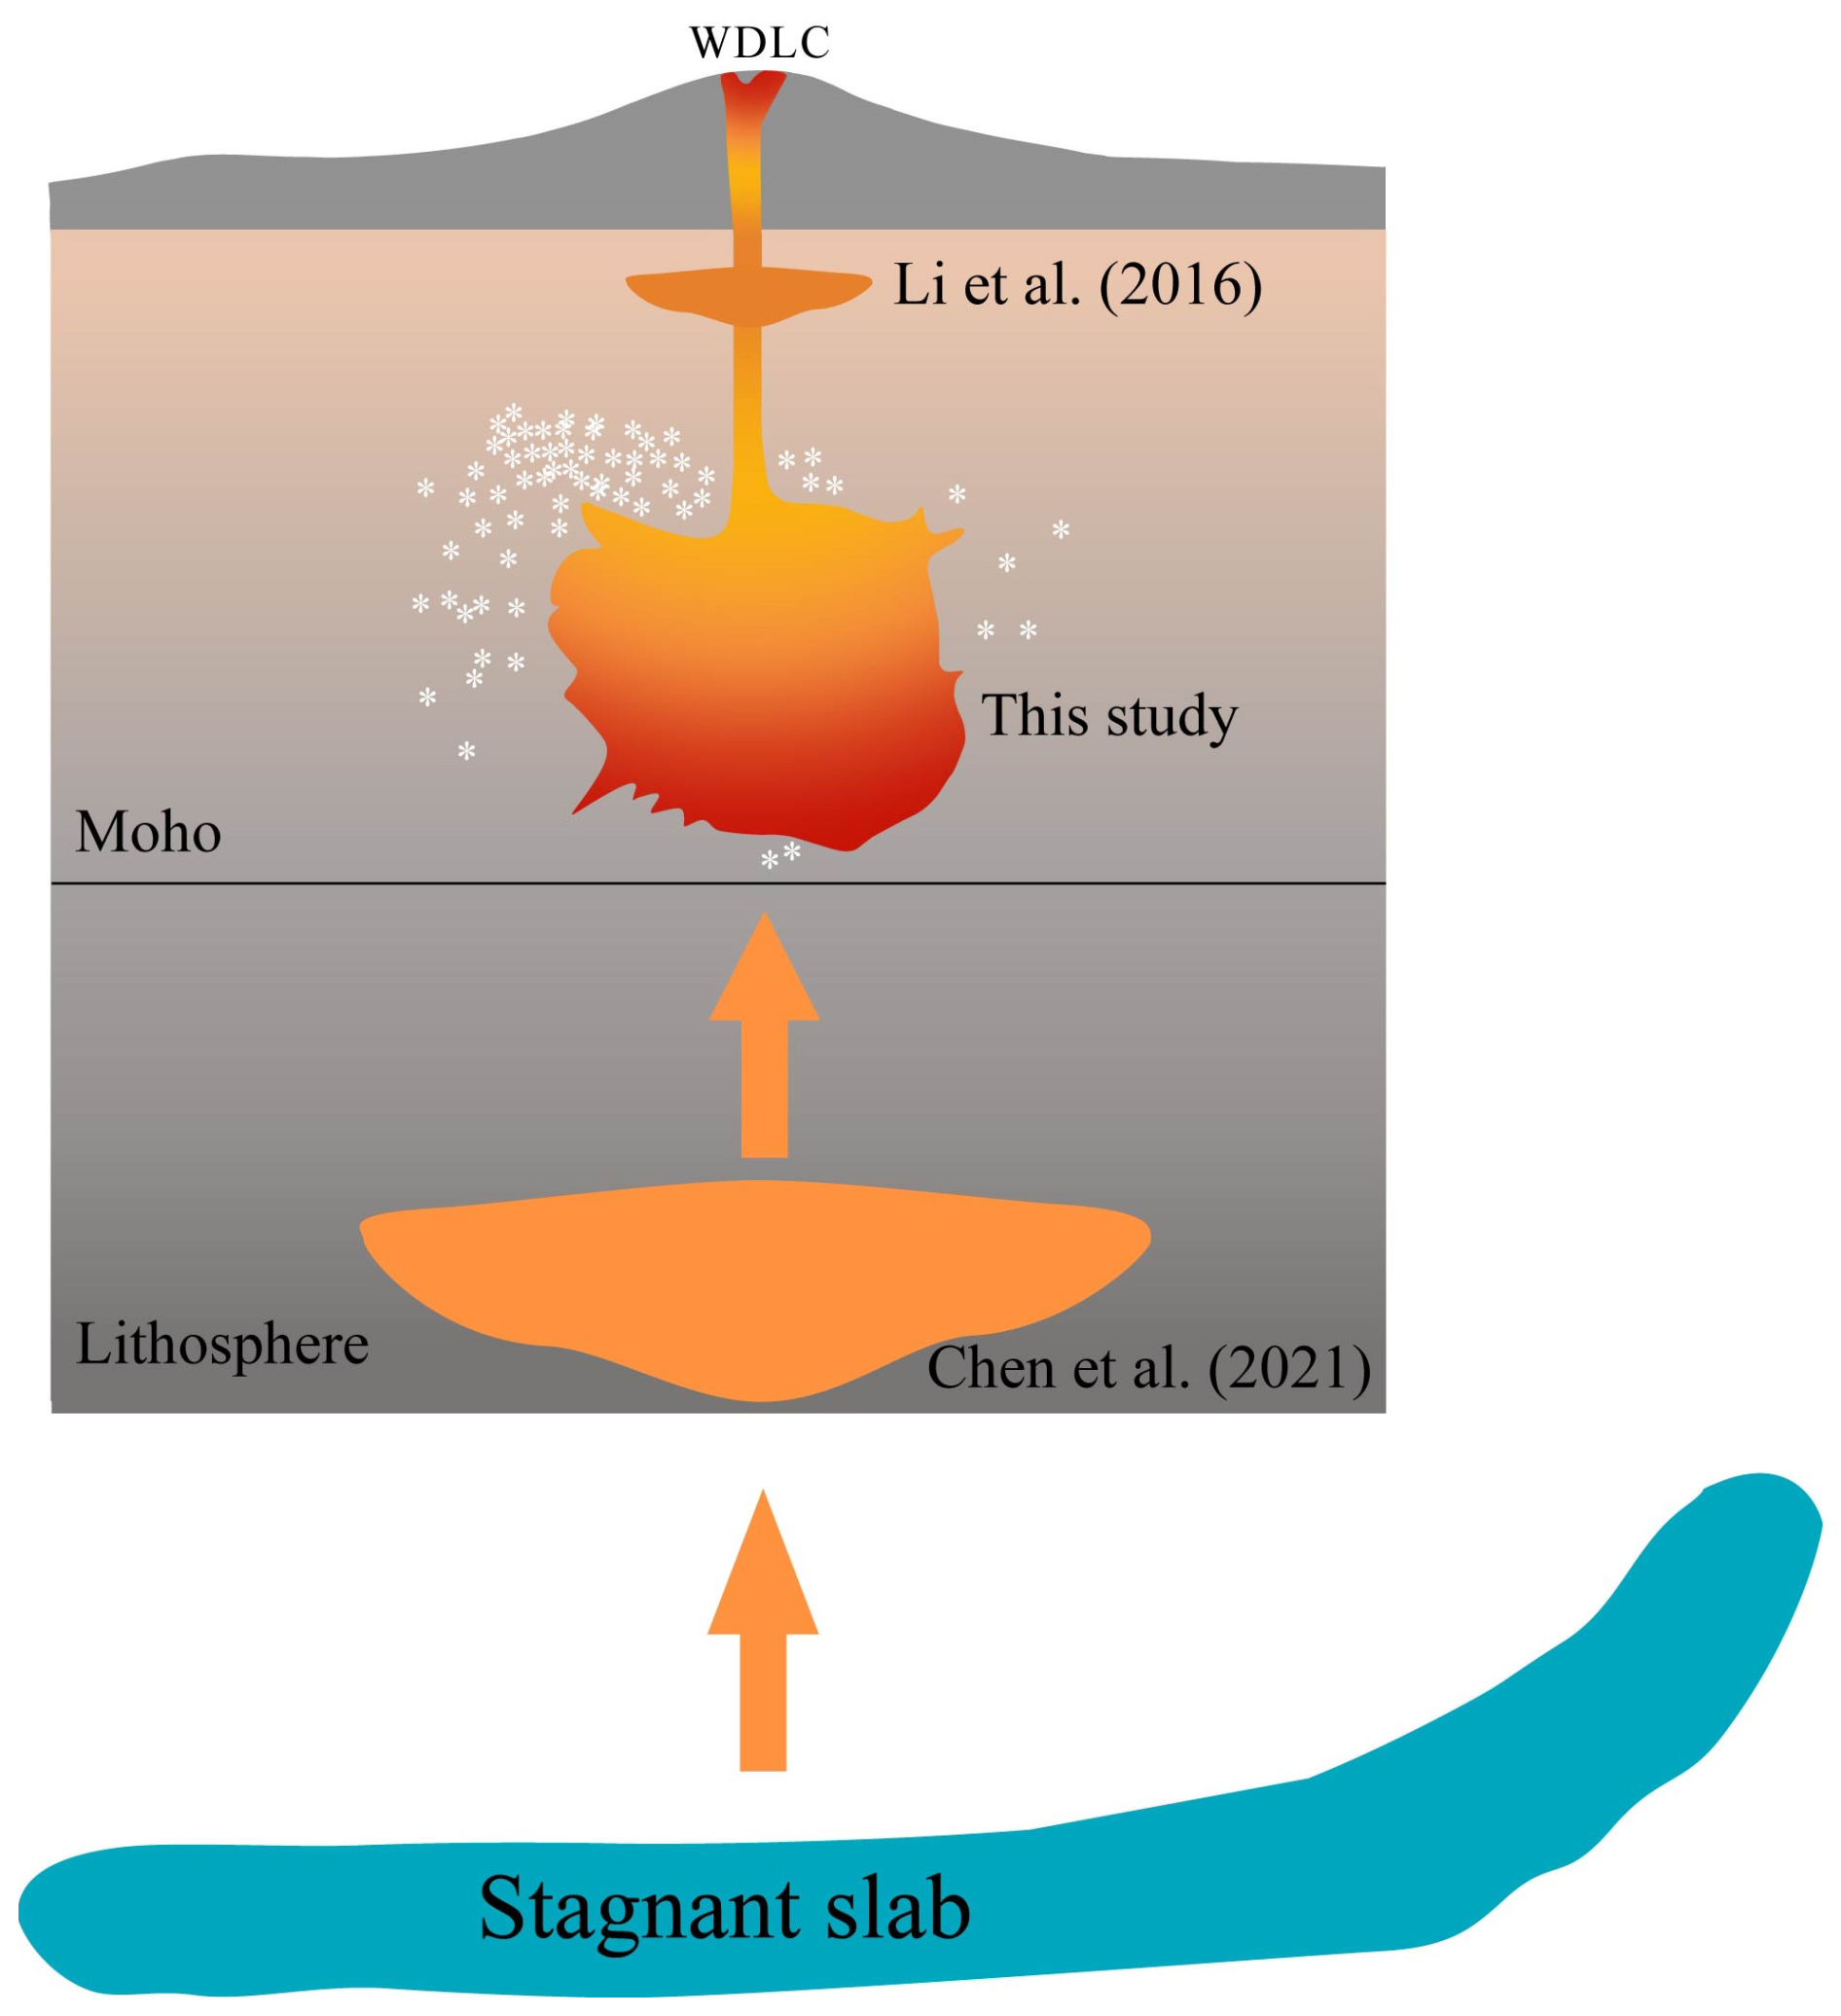
Figure 10A schematic diagram illustrating the vertical multi-level magma system and seismicity beneath the WDLC volcano. Illustrations here are not to scale. The magma ascent from our observed middle-lower crustal magma reservoir may exert pressure on the overlying brittle crust, resulting in the generation of the earthquakes below the WDLC volcano. The white stars represent the earthquakes. The lithospheric magma reservoir was imaged by Chen et al. (2021), and the upper crustal magma reservoir was imaged by Li et al. (2016).
The spatial correlation between the middle-lower crustal magma reservoir and the seismicity of the WDLC volcano plays a crucial role in understanding the magmatic system and potential hazards. In this study, we construct a high-resolution crustal shear-wave velocity model beneath the WDLC volcanic field using the full-wave ambient noise tomographic method based on our latest temporary stations. Our tomographic model reveals a distinct low-velocity body existing at depths of ∼10–23 km beneath the WDLC volcano, indicating the middle-lower crustal magma reservoir with an average estimated melt fraction of ∼3.5 %. The earthquakes beneath the WDLC volcano are located above the crustal magma reservoir revealed by this study, suggesting the active volcanic seismicity could be related to the magma upward migration deriving from the crustal magma reservoir. By combining the existing velocity models in different scales, the WDLC intraplate volcanism might be related to the multi-level magmatic system from deep mantle to shallow crust. These new findings provide valuable perspectives on the WDLC volcanic monitoring and hazard assessment for future eruption.
The seismic waveform data used in the study are archived in a repository (https://doi.org/10.5281/zenodo.11609148, LYU, 2024).
The supplement related to this article is available online at https://doi.org/10.5194/se-16-807-2025-supplement.
ZL and JL were responsible for the conception of this study. QK analyzed the data. JL and YA were responsible for designing the network. ZL prepared the paper, and all authors critically reviewed it. All authors also contributed to reviewing and editing the paper.
The contact author has declared that none of the authors has any competing interests.
Publisher's note: Copernicus Publications remains neutral with regard to jurisdictional claims made in the text, published maps, institutional affiliations, or any other geographical representation in this paper. While Copernicus Publications makes every effort to include appropriate place names, the final responsibility lies with the authors.
This article is part of the special issue “Seismic imaging from the lithosphere to the near surface”. It is not associated with a conference.
We thank all the WDLCArray fieldwork members for their efforts in collecting the data. We are grateful to the handling associate editor Ayse Kaslilar and three anonymous reviewers for their valuable comments and suggestions.
This research has been supported by the National Natural Science Foundation of China (grant nos. U1939206, 42274129, 41530212, and 41674091).
This paper was edited by Ayse Kaslilar and reviewed by three anonymous referees.
Cashman, K. V., Sparks, R. S. J., and Blundy, J. D.: Volcanology vertically extensive and unstable magmatic systems: A unified view of igneous processes, Science, 355, 1–9, 2017.
Chen, Y., Ai, Y., Jiang, M., Yang, Y., and Lei, J.: New insights into potassic intraplate volcanism in Northeast China from joint tomography of ambient noise and teleseismic surface waves, J. Geophys. Res.-Sol. Ea., 126, e2021JB021856, https://doi.org/10.1029/2021JB021856, 2021.
Christensen, N. I. and Mooney, W. D.: Seismic velocity structure and composition of the continental crust: A global view, J. Geophys. Res., 100, 9761–9788, 1995.
Christensen, N. I. and Stanley, D.: Seismic velocities and densities of rocks, International Geophysics, 81, 1587–1594, 2003.
Du, M., Lei, J., Zhao, D., and Lu, H.: Pn anisotropic tomography of Northeast Asia: New insight into subduction dynamics and volcanism, J. Geophys. Res.-Sol. Ea., 127, e2021JB023080, https://doi.org/10.1029/2021JB023080, 2022.
Fan, X., Chen, Q., Ai, Y., Chen, L., Jiang, M., Wu, Q., and Guo, Z.: Quaternary sodic and potassic intraplate volcanism in northeast China controlled by the underlying heterogeneous lithospheric structures, Geology, 49, 1260–1264, 2021.
Gao, H. and Shen, Y.: Upper mantle structure of the Cascades from full-wave ambient noise tomography: Evidence for 3D mantle upwelling in the back-arc, Earth Planet. Sc. Lett., 390, 222–233, 2014.
Gao, J., Zhang, H., Zhang, S., Xin, H., Li, Z., Tian, W., Bao, F., Cheng, Z., Jia, X., and Fu, L.: Magma recharging beneath the Weishan volcano of the intraplate Wudalianchi volcanic field, northeast China, implied from 3-D magnetotelluric imaging, Geology, 48, 913–918, 2020.
Guo, Z., Chen, Y., Ning, J., Yang, Y., Afonso, J. C., and Tang, Y.: Seismic evidence of ongoing sublithosphere upper mantle convection for intraplate volcanism in Northeast China, Earth Planet. Sc. Lett., 433, 31–43, 2016.
Kiser, E., Palomeras, I., Levander, A., Zelt, C., Harder, S., Schmandt, B., Hansen, S., Creager, K., and Ulberg, C.: Magma reservoirs from the upper crust to the moho inferred from high-resolution VP and VS models beneath Mount St. Helens, Washington State, USA, Geology, 44, 411–414, 2016.
Korger, E. and Schlindwein, V.: Seismicity and structure of the 85° E volcanic complex at the ultraslow spreading Gakkel Ridge from local earthquake tomography, Geophys. J. Int., 196, 539–551, 2014.
Lei, J. and Zhao, D.: P-wave tomography and origin of the Changbai intraplate volcano in Northeast Asia, Tectonophysics, 397, 281–295, 2005.
Li, Z., Ni, S., Zhang, B., Bao, F., Zhang, S., Deng, Y., and Yuen, D. A.: Shallow magma chamber under the Wudalianchi Volcanic Field unveiled by seismic imaging with dense array, Geophys. Res. Lett., 43, 4954–4961, 2016.
Liu, Y., Niu, F., Chen, M., and Yang, W.: 3-D crustal and uppermost mantle structure beneath NE China revealed by ambient noise adjoint tomography, Earth Planet. Sc. Lett., 461, 20–29, 2017.
Lü, Z.: Volcanic structure of the present-day volcanic group Wudalianchi and its forming mechanism, Volcanology and Mineral Resources, 15, 6–21, 1994.
Lü, Z. and Lei, J.: Seismic evidence for crustal modification across the Tanlu fault zone in eastern China, Geophys. Res. Lett., 49, e2022GL099761, https://doi.org/10.1029/2022GL099761, 2022.
Lü, Z., Gao, H., Lei, J., Yang, X., Rathnayaka, S., and Li, C.: Crustal and upper mantle structure of the Tien Shan orogenic belt from full-wave ambient noise tomography, J. Geophys. Res.-Sol. Ea., 124, 3987–4000, 2019.
Lü, Z., Lei, J., Zhao, L., Fu, X., Chen, J., Li, G., and Kong, Q.: Crustal deformation of intermontane basins beneath Central Tien Shan revealed by full-wave ambient noise tomography, Tectonophysics, 821, 229143, https://doi.org/10.1016/j.tecto.2021.229143, 2021.
Lü, Z., Lei, J., Kong, Q., Liu, Q., and Sun, J.: Seismic structure of the 2015 Mw 7.8 Gorkha earthquake revealed by ambient seismic noise and teleseismic surface wave tomography, Sci. Rep.-UK, 14, 7921, https://doi.org/10.1038/s41598-024-57713-8, 2024a.
Lü, Z., Lei, J., and Yang, X.: Seismic structure of the Wudalianchi volcanic field in Northeast China: insights into magma reservoir and crustal magmatic plumbing systems, B. Volcanol., 86, 92, https://doi.org/10.1007/s00445-024-01782-0, 2024b.
Lü, Z., Lei, J., Zhao, D., Xu, Y., Liu, L., Sun, C., Ai, Y., and Taymaz, T.: The magmatic plumbing beneath the Wudalianchi volcanic region, northeast China, is recharged by magma reservoirs under Keluo volcano, Commun. Earth Environ., 5, 575, https://doi.org/10.1038/s43247-024-01748-2, 2024c.
LYU: The stacked waveforms in the Wudalianchi volcano, Zenodo [data set], https://doi.org/10.5281/zenodo.11609148, 2024.
Maguire, R., Schmandt, B., Chen, M., Jiang, C., Li, J., and Wilgus, J.: Resolving continental magma reservoirs with 3D surface wave tomography, Geochem. Geophy. Geosy., 23, e2022GC010446, https://doi.org/10.1029/2022GC010446, 2022.
Nolet, G. and Dahlen, F.: Wave front healing and the evolution of seismic delay times, J. Geophys. Res., 105, 19043–19054, 2000.
Paige, C. and Saunders, M.: LSQR: An algorithm for sparse linear equations and sparse least squares, ACM T. Math. Software, 8, 43–71, 1982.
Paulatto, M., Hooft, E. E. E., Chrapkiewicz, K., Heath, B., Toomey, D. R., and Morgan, J. V.: Advances in seismic imaging of magma and crystal mush, Front. Earth Sci., 10, 2005, https://doi.org/10.3389/feart.2022.970131, 2022.
Rasskazov, S. V., Chuvashova, I. S., Sun, Y.-M., Yang, C., Xie, Z., Yasnygina, T. A., Saranina, E. V., and Fang, Z.: Sources of Quaternary potassic volcanic rocks from Wudalianchi, China: Control by transtension at the lithosphere-asthenosphere boundary layer, Geodynamics & Tectonophysics, 7, 555–592, 2016.
Roman, D. C. and Cashman, K. V.: Top-down precursory volcanic seismicity: Implications for “Stealth” magma ascent and long-term eruption forecasting, Front. Earth Sci., 6, 124, https://doi.org/10.3389/feart.2018.00124, 2018.
Shen, W., Ritzwoller, M., Kang, D., Kim, Y., Lin, F., Ning, J., Wang, W., Zheng, Y., and Zhou, L.: A seismic reference model for the crust and uppermost mantle beneath China from surface wave dispersion, Geophys. J. Int., 206, 954–979, 2016.
Shen, Y., Ren, Y., Gao, H., and Savage, B.: An improved method to extract very-broadband empirical Green's functions from ambient seismic noise, B. Seismol. Soc. Am., 102, 1872–1877, 2012.
Song, X., Lei, J., Zhao, D., and Ai, Y.: Crust and uppermost mantle S-wave velocity structure of the Wudalianchi volcanic belt from direct surface-wave tomography, J. Asian Earth Sci., 278, 106426, https://doi.org/10.1016/j.jseaes.2024.106426, 2025.
Takei, Y.: Effect of pore geometry on Vp/Vs: From equilibrium geometry to crack, J. Geophys. Res., 107, 2043, https://doi.org/10.1029/2001JB000522, 2002.
Tang, Y., Obayashi, M., Niu, F., Grand, S. P., Chen, Y. J., Kawakatsu, H., Tanaka, S., Ning, J., and Ni, J.: Changbaishan volcanism in northeast China linked to subduction-induced mantle upwelling, Nat. Geosci., 7, 470–475, 2014.
Ueki, K. and Iwamori, H.: Density and seismic velocity of hydrous melts under crustal and upper mantle conditions, Geochem. Geophy. Geosy., 17, 1799–1814, 2016.
Wang, X., Chen, L., Hofmann, A., Mao, F., Liu, J., Zhong, Y., Xie, L., and Yang, Y.: Mantle transition zone–derived EM1 component beneath NE China: Geochemical evidence from Cenozoic potassic basalts, Earth Planet. Sc. Lett., 465, 16–28, 2017.
Wang, Y. and Chen, H.: Tectonic controls on the Pleistocene–Holocene Wudalianchi volcanic field (northeastern China), J. Asian Earth Sci., 24, 419–431, 2005.
Wei, H., Sparks, R., Liu, R., Fan, Q., Hong, H., Zhang, H., Chen, H., Jiang, C., Dong, J., Zheng, Y., and Pan, Y.: Three active volcanoes in China and their hazards, J. Asian Earth Sci., 21, 515–526, 2003.
Yang, J. and Faccenda, M.: Intraplate volcanism originating from upwelling hydrous mantle transition zone, Nature, 579, 88–91, 2020.
Zhang, F. and Wu, Q.: Velocity structure in upper mantle and its implications for the volcanism nearby the north edge of Songliao Basin, Chin, J. Geophys., 62, 2918–2929, 2019.
Zhang, W., Shen, Y., and Zhao, L.: Three-dimensional anisotropic seismic wave modeling in spherical coordinate by a collocated-grid finite difference method, Geophys. J. Int., 188, 1359–1381, 2012.
Zhao, D., Maruyama, S., and Omori, S.: Mantle dynamics of Western Pacific and East Asia: Insight from seismic tomography and mineral physics, Gondwana Res., 11, 120–131, 2007.
Zhao, L., Jordan, T. H., Olsen, K. B., and Chen, P.: Fréchet kernels for imaging regional Earth structure based on three-dimensional reference models, B. Seismol. Soc. Am., 95, 2066–2080, 2005.
Zhao, Y., Li, N., Fan, Q., Zou, H., and Xu, Y.: Two episodes of volcanism in the Wudalianchi volcanic belt, NE China: Evidence for tectonic controls on volcanic activities, J. Volcanol. Geoth. Res., 285, 170–179, 2014.