
the Creative Commons Attribution 4.0 License.
the Creative Commons Attribution 4.0 License.
 | 02 Nov 2026
The role of brittle shear zones and the associated fractures in the formation and characteristics of bedrock surface depressions in crystalline bedrock (Turku, southwestern Finland)

Pietari Skyttä
Kati Marjukka Ahlqvist
Nicklas Nordbäck
Pelayo Barron
Kaisa Nikkilä
While the impact of shear zones on the surface morphology of crystalline bedrock is well recognised, the contribution of associated smaller-scale structures is often overlooked. This leads to inaccurate interpretation of the bedrock surface elevation, for example, in studies that require knowledge about the overburden thickness overlying the bedrock surface.
In this study, multi-scale analysis and 3D modelling of the bedrock surface in the Turku area, Western Finland, enhance our understanding of how brittle structures contribute to the formation and characteristics of bedrock surface depressions. We measured the prevailing orientation of foliation and fracture sets using standard field mapping on the bedrock outcrops. The orientation of the brittle shear zones and elongated depressions was first detected in remote sensing data and subsequently evaluated using our interpolated digital elevation model of the bedrock surface. The results of these analyses enabled us to examine the relationship between bedrock structures and bedrock surface morphology across different scales.
Our findings indicate that the orientations of brittle shear zones, elongated bedrock depressions, and foliation are correlated, as expected. Even parallel outcrop-scale fracture sets are distinguished; prevailing fracture orientations are striking NNE to NNW, which does not correlate with large-scale bedrock structures. Therefore, these outcrop-scale fractures occurring in greater numbers near the brittle shear zones largely determine the dimensions and detailed surface morphology of the bedrock depressions.
- Article
(20513 KB) - Full-text XML
- BibTeX
- EndNote


Bedrock surface depressions are characteristically formed along structural discontinuities within the crystalline bedrock, including fracture systems and diverse shear zones and faults (DesRoches et al., 2014; Eyles, 2012; Glasser et al., 1998; Gleeson and Novakowski, 2009; Ruuska et al., 2023; Skyttä et al., 2015). Shear zones are characterised by rocks with high overall strain and dense fracturing, in which the orientation of early fractures is controlled by factors such as slip direction, stress conditions, lithology, and fluid interactions. In many cases, fracture orientation is inherited from older ductile structures (Crider, 2015; Mancktelow and Pennacchioni, 2005; Regenauer-Lieb and Yuen, 2008; Skyttä and Torvela, 2018). Subsequent glacial erosion, such as quarrying (plucking), abrasion and glacial ripping, utilises the most preferential fracture orientation to generate elongate depressions along the eroded bedrock surface, which, consequently, contributes to their morphology (Bukhari et al., 2021; Dühnforth et al., 2010; Glasser et al., 2020; Krabbendam et al., 2022). As the bedrock surface works as a depositional basement for younger sediments, the elongate depressions are overlain by thick sedimentary overburden, and consequently, detailed knowledge about the bedrock surface morphology and the geological structures within the crystalline bedrock is unavailable (Ruuska et al., 2023). Previous studies (Lane et al., 2015; Scott and Wohl, 2019; Skyttä et al., 2023) have demonstrated that the orientation of fault surfaces, together with associated fractures observed at the outcrop scale, is the main controlling geological feature on the morphology of the fault-related elongate bedrock depressions.
As several studies have shown, the brittle structures of the bedrock are scalable from outcrop-scale observations to regional-scale features (Bertrand et al., 2015; Hall and Gillespie, 2017; Heffer and Bevan, 1990; Kirkpatrick et al., 2013; Nordbäck et al., 2023; Samsu et al., 2020). It is justified to bridge these scale gaps and correlate individual fractures with larger brittle structures in the bedrock, including those associated with depressions in the covered bedrock surface. Scalability is particularly valid for analysing length and orientation distributions of the fracture networks (Bonnet et al., 2001; Chabani et al., 2021; Dichiarante et al., 2020; Hardebol et al., 2015; Marrett et al., 1999), and also for topological properties of the contained fractures (Ovaskainen et al., 2022; Sanderson and Nixon, 2015). This concept is relevant in the Turku region (SW Finland), where the landscape is characterised by abrupt changes in topography, reflecting heterogeneous glacial erosion across highly variable bedrock in both lithology and surface morphology (Hietanen, 1947; Niemelä et al., 1987; Ahlqvist et al., 2026). The rough bedrock surface topography has been attributed to the presence of an elongate ENE-striking bedrock depression system generated by either one set or repeatedly cross-cutting sets of shear zones (Härme, 1960; Niemelä et al., 1987; Väisänen and Hölttä, 1999). This interpretation is supported by the elongate depressions recently recognised in a new and comprehensive digital elevation model of the eroded bedrock surface (bedrock-DEM) compiled for the Turku region (Ahlqvist et al., 2026). However, no studies illustrate how bedrock structures, ranging from ductile to brittle deformation and including variations in spatial occurrence and intensity, contribute to the development of heterogeneous bedrock surface topography. The most prominent elongate depressions are asymmetric (Ahlqvist et al., 2026), but the causes of the asymmetry in the underlying bedrock remain uncharacterized.
This study provides new insights about the bedrock structures that contribute to the development of complex bedrock surface morphologies within depressions controlled by brittle deformation and kinematics along underlying brittle shear zones. The term “brittle shear zone” is used for clarity, as the study focuses on brittle structures within the affected area, where the intensity of ductile deformation remains undetermined due to the sedimentary overburden. We state that the asymmetry of bedrock depressions is controlled by the fracture network within the damage zone of brittle shear zones, which deviates from the prevailing ductile trend in the bedrock. To justify the above statements, we provide structural data on the relationship between structures at two scales and highlight the role of brittle shear zones and associated fracture patterns in controlling the morphology of the bedrock surface. Our approach focuses on variations in geometry associated with ductile deformation and the systematics of brittle fractures, based on analyses of orientation, intensity, and topology, and on their correlation with ductile domains. This characterisation of the bedrock structures supports our 3D interpretation of the structurally constrained bedrock surface, with detailed analysis along cross-sections and a 100×100 m outcrop, where a photogrammetric model is generated using an uncrewed aerial vehicle (UAV). These analyses provide knowledge for recognising (i) the morphological variations of the bedrock surface within the brittle shear zones, (ii) the most effective fracture orientations contributing to the bedrock surface morphology within the damage zone of brittle shear zones, and (iii) the significance of the analyses of the bedrock structures for generating geologically realistic bedrock surface 3D-interpretations within sediment-covered areas. The results of this study show that a geologically realistic interpretation of the bedrock surface can be achieved, providing essential background knowledge for, e.g., civil engineering and infrastructure purposes.
The bedrock of the study area is within the southwestern part of the Southern Finland Subprovince (SFS) formed and modified during the 1.9–1.8 Ga Svecofennian orogeny (Bogdanova et al., 2015; Hermansson et al., 2008; Hietanen, 1975; Lahtinen et al., 2009; Nironen, 1997). The lithology of the study area is characterised by late orogenic s-type granites and associated migmatites (Ehlers et al., 1993; Kähkönen, 2005; Kurhila et al., 2005).
Four major deformation phases (D1–D4) and associated structures have been recognised in the western part of the SFS (Väisänen and Hölttä, 1999). D1 structures comprise a foliation parallel to the primary bedding, deformed during the later deformation phases (Väisänen and Hölttä, 1999). These structures were deformed during D2 to tight to isoclinal folds with subhorizontal axial planes (Väisänen and Hölttä, 1999). D3 included intensive NW-SE shortening, causing refolding of the early D1/D2 structures into E- and NE-striking, upright-to overturned isoclinal structures (Väisänen and Hölttä, 1999), and contributed to further thickening of the crust at 1.84–1.83 Ga (Ehlers et al., 1993). Together with subhorizontal or moderately plunging fold axes, steep fold axes occur on the limbs of the regional folds, together forming dome-basin structures (Väisänen and Hölttä, 1999). The intensity of D3 folding varies, as shown by the variation from isoclinal to open folds with occasionally sheared fold limbs. D4 structures are N- to NE-trending localised shear zones that show both brittle and ductile deformation features, and cross-cut and deflect older structures (Väisänen and Hölttä, 1999; Väisänen and Skyttä, 2007).
The earliest shear zones were generated during the D3 Stage on the limbs of the folds and are oriented parallel to the general D3 structural trends (Hietanen, 1947; Väisänen and Hölttä, 1999). The major shear zones in southwestern Finland form a pattern where the shorter ∼NE-striking Mynälahti Shear Zone (MSZ) and Paimio Shear Zone (PSZ) abut the 150–200 km long ∼ E-striking Somero Shear Zone (SSZ) in the north and the Southern Finland Shear Zone (SFSZ) in the south (Fig. 1; Nordbäck et al., 2023; Torvela and Ehlers, 2010; Väisänen and Skyttä, 2007). The SFSZ and SSZ are dextral strike-slip faults, whereas the NE-trending ones are dip-slip faults (Väisänen and Skyttä, 2007). The main deformation within these contractional shear zones took place at 1.83–1.82 Ga (Torvela et al., 2008; Väisänen and Skyttä, 2007). The earlier ductile reverse slip along the abutting NE-trending zones during the transpression was followed by E-side-down normal slip, which demonstrates a fundamental change in the orogeny from the compressional to the extensional setting at around 1.79 Ga (Väisänen and Skyttä, 2007). The subvertical NE-striking Airisto Shear Zone (ASZ), characterised by dip-slip kinematics (Simelius, 2013), is likely also related to the extensional phase. According to Torvela and Kurhila (2022), the extensional phase may have been transient at 1.82–1.81 Ga and was followed by dominant strike-slip shearing at 1.80–1.79 Ga, reactivating the E-striking shear zones. The age of shearing remains to be discussed, but the MSZ close to the Vehmaa rapakivi granite is overprinted by post-tectonic micas, indicating that the faulting preceded the rapakivi magmatism and controlled the emplacement of the post-orogenic granitoids (Väisänen and Skyttä, 2007).
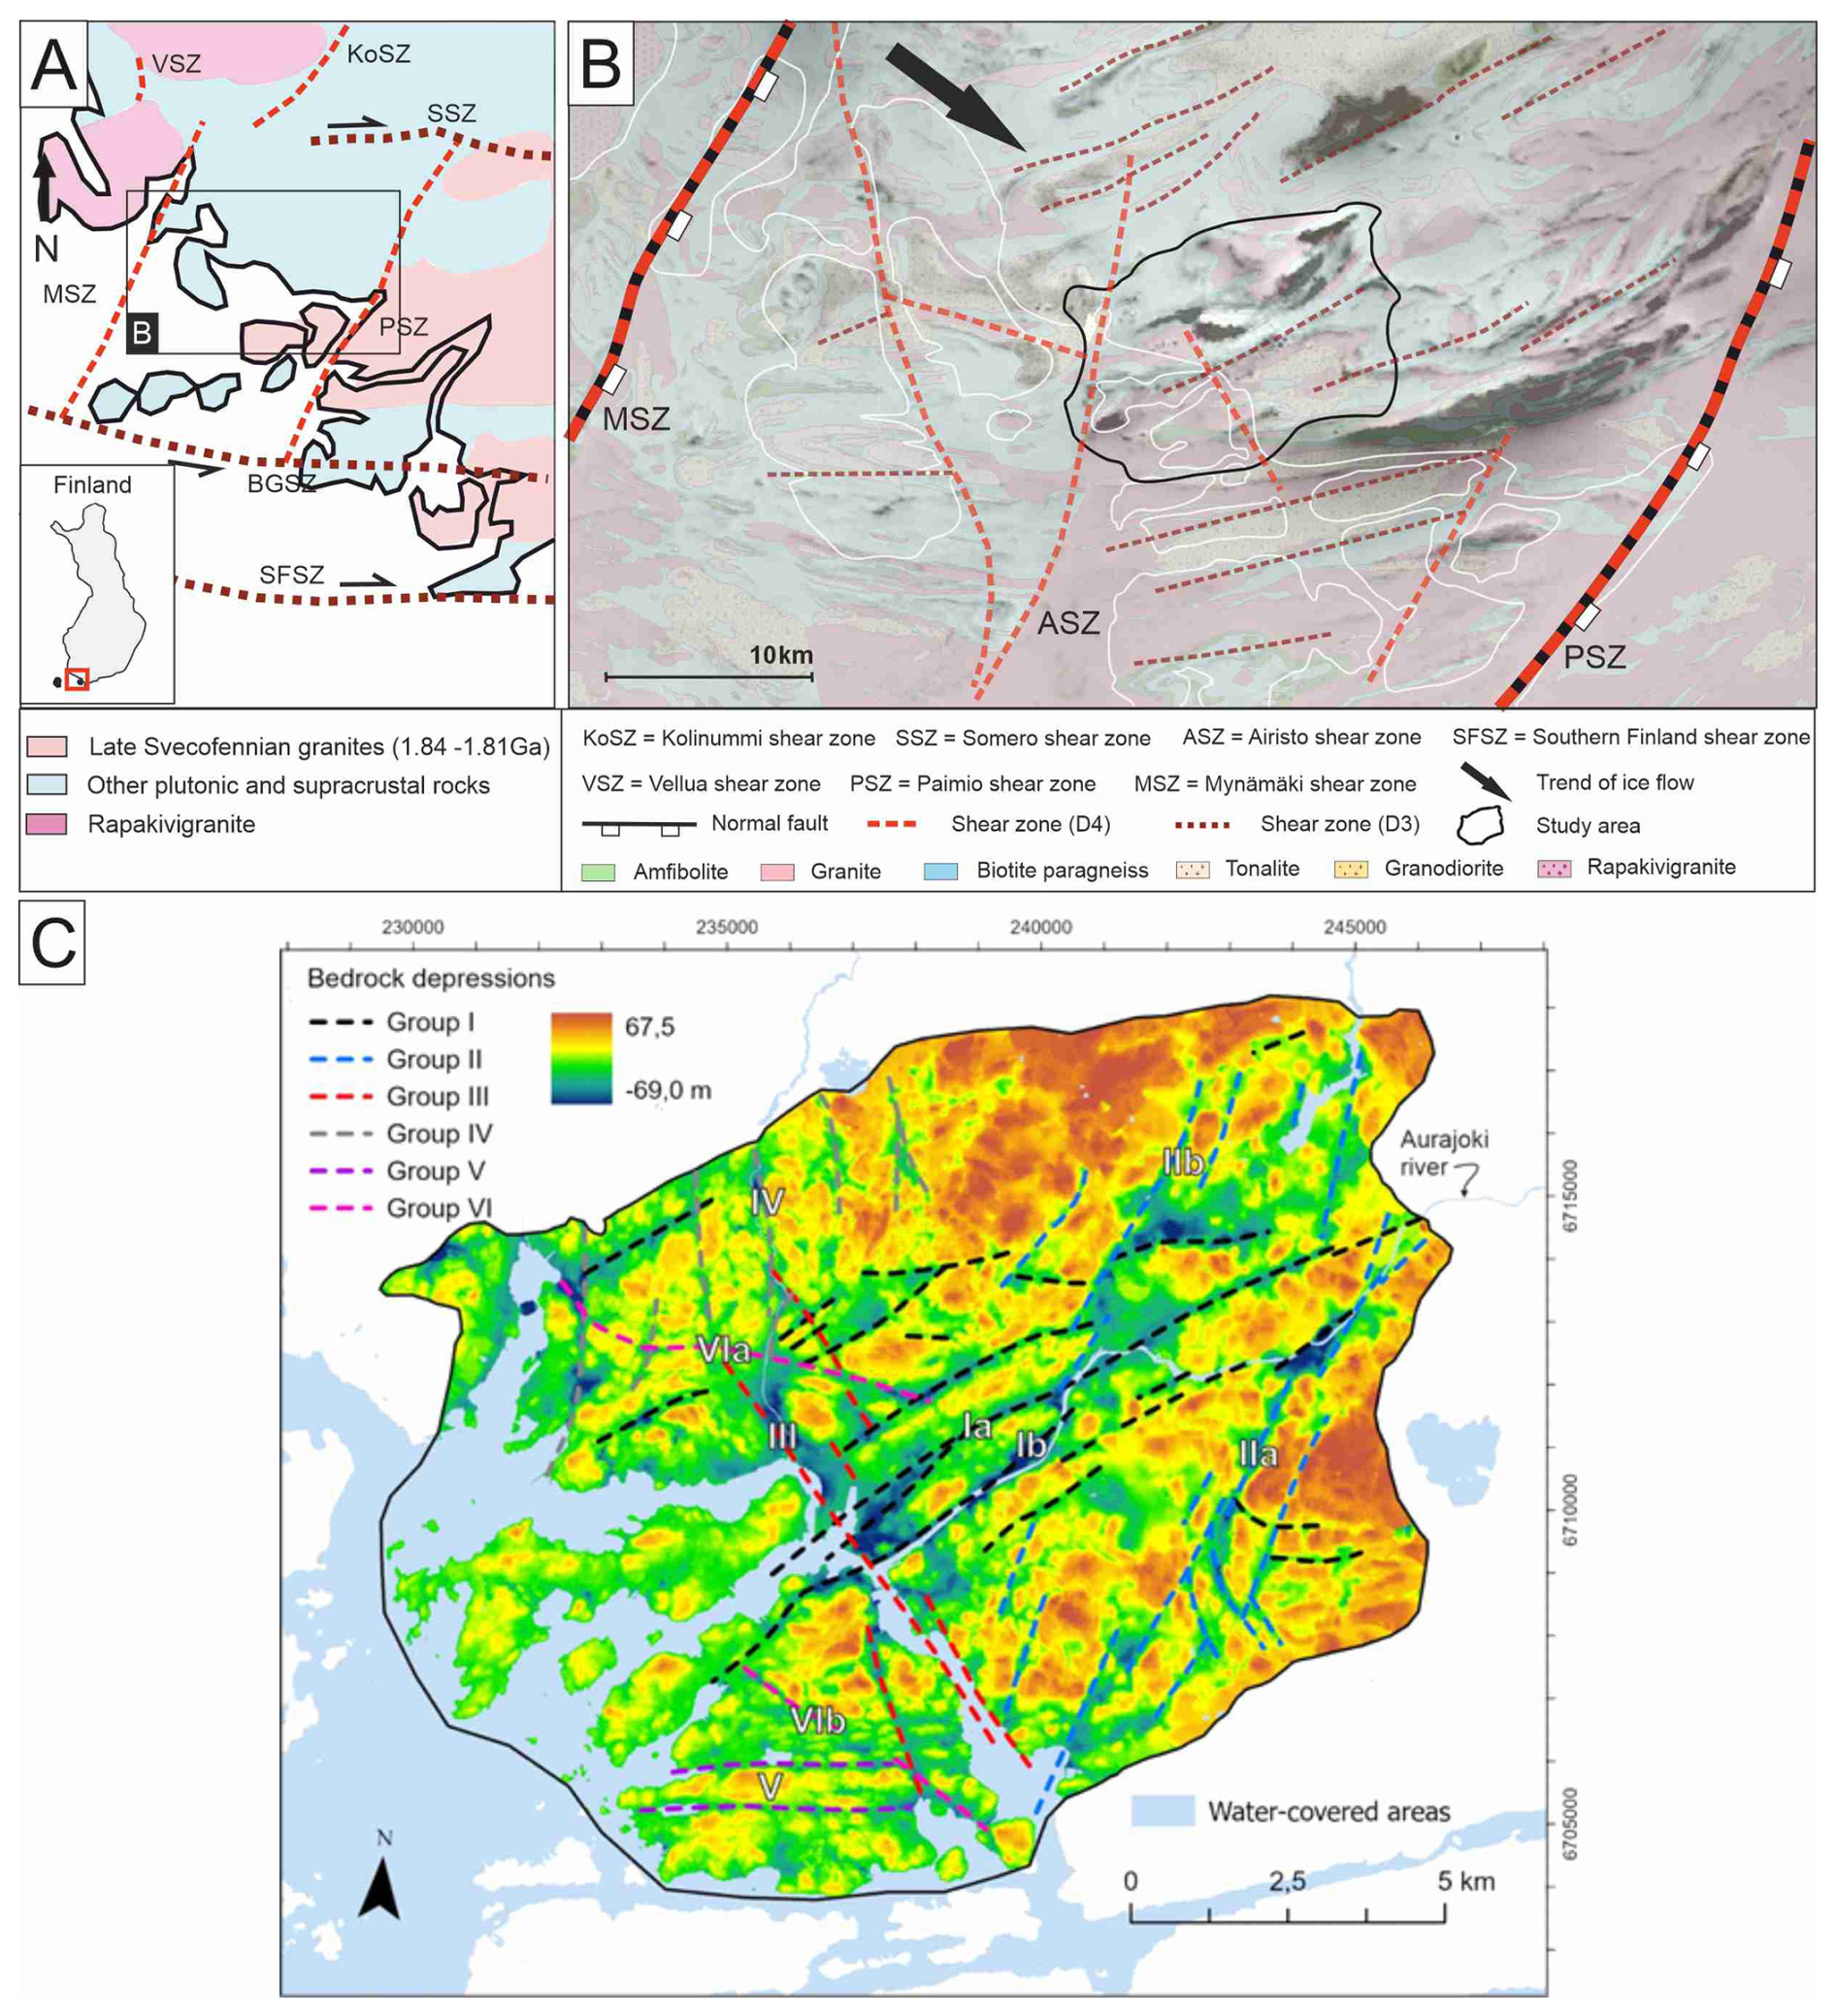
Figure 1(A) The main shear zones and the generalised bedrock lithology of southwestern Finland. (B) More detailed structural and lithological setting around the study area. Shear zones and faults modified after the Bedrock of Finland map (1:200 000; Geological Survey of Finland (GTK), 2022). Bedrock of Finland map and low-altitude aeromagnetic map (Geological Survey of Finland (GTK), 2016) (GTK) in the background (C) The bedrock surface elevation model and main bedrock depressions by Ahlqvist et al., (2026).
Multistage evolution of the brittle structures has been acknowledged in the southwestern part of SFS (Mattila and Viola, 2014; Nordbäck et al., 2024) including: (i) onset of the brittle deformation due to NW–SE compression ca. 1.75 Ga, (ii) with N–S oriented transpressional compression shortly after, (iii) NW-SE extension during the rapakivi magmatism around 1.64 Ga, (iv) WNW-ESE to NNW-SSE compression, which reactivated the NE-SW trending shear zones and generated E–W trending strike-slip faults around 1.55–1.4 Ga, (v) NW-SE extensional stage around 1.3–1.2 Ga, and intrusion of the diabase sills (Suominen, 1991) belonging to the Central Scandinavian Dolerite Group (Elming and Mattsson, 2001) and (vi) NW–SE to ENE–WSW compression during the Sveconorwegian orogeny.
Using bedrock-DEM modelling, Ahlqvist et al. (2026) recognised several bedrock surface depressions and classified them into six groups based on their trend (I–VI; Fig. 1c). Depressions of Group I strike ENE across the study area in the central part along the Aura River, where they generate a distinct contrast in the bedrock elevation. The eastern part is featured by several shorter, NE-striking bedrock depressions (Group II). In contrast, Group III is featured by a distinct NW-trending depression separating the mainland and the archipelago within the study area. The southern and northern parts include individual bedrock depressions belonging to Groups IV, V and VI (Fig. 1c), which show only minor contribution to the bedrock surface topography. Thus, bedrock topography is primarily controlled by the intersecting and abutting bedrock depressions of Groups I, II and III, which are concordant with the regional foliation.
The applied approach comprises three main components: (i) Method-specific structural analysis at a regional scale from remote sensing data together with the outcrop-scale analysis from 2D-photogrammetry and field mapping measurements. (ii) Bedrock surface modelling including regeneration and improvement of bedrock-DEM from regional to detailed scale. (iii) Development of a structural synthesis that integrates the results of method-specific structural analyses and bedrock surface modelling by emphasising the correlation between structural features observed from remote sensing, field mapping and bedrock surface models.
3.1 Method-specific structural analysis
The structural analysis aimed to define the geometric framework of both ductile and brittle structures within the study area. Remote sensing data were used to compile 2D foliation, folds, and brittle shear zones, as well as a lineament interpretation of linear brittle features in the bedrock. Aeromagnetic maps were used to identify 2D ductile form lines (Geological Survey of Finland), supported by field observations, and ground-surface elevation LiDAR (National Land Survey of Finland, 2026) for LiDAR lineaments. LiDAR lineaments ranged from approximately 50 to 500 m in length, thus providing larger-scale support for fracture measurements obtained during field mapping.
Fractures are commonly divided into sets based on different criteria (e.g. Peacock and Sanderson, 2018), which guides analyses of the fracture networks, and helps us to determine potential inheritance relationships with fractures and ductile structures (e.g. Crider, 2015). During the field mapping, we investigated 152 horizontal and vertical bedrock exposures and collected structural measurements of the foliation and fractures (including outcrop walls). Fractures, observed both as traces and exposed fracture-controlled outcrop walls, were divided into major (R1) and minor (R2) groups based on the length of the fractures (e.g. Hamdani and Baali, 2019). R1 fractures represented the most continuous fracture orientation per outcrop relative to the size of the outcrop exposure, whereas other fracture orientations were classified as R2. The number of subhorizontal fractures was limited due to the scattered locations of the vertical outcrops. Field measurements and remote sensing data (LiDAR, aeromagnetic maps) were used to generate two separate thematic interpretations that emphasised the characteristic ductile trends (form lines) and brittle discontinuities (LiDAR lineaments) in the bedrock.
The 2D-photogrammetry model was generated to analyse fracture orientation and topology and to compare the results with the overall fracture pattern and orientation of the bedrock depression within the study area, with a particular focus on the bedrock depression along the Aura River (Figs. 1c, 2). Aerial photographs were acquired using a UAV at a flight elevation of 20 m, with a minimum overlap of 60 % to 70 % between photographs. Agisoft Metashape software was used to generate an orthomosaic from the aerial photographs, with eight ground control points. The compiled ortomosaic covered an area of ca. 100 × 100 m. A total of 1185 fracture traces were manually digitised on the 2D-photogrammetry model, and nodes of the fracture topology were interpreted by using the NetworkGT plugin (Nyberg et al., 2018) in the QGIS software. The same plugin was used to create the rose plots.
3.2 Bedrock surface modelling
Data on bedrock surface elevation were based on geotechnical drillings in the covered areas and on bedrock outcrop elevation points derived from ground-surface LiDAR, as described in detail by Ahlqvist et al. (2026). To account for the impact of the 2D form lines on the bedrock surface in the sea area, control points (Fig. 2a) were introduced to adjust the elevation of the interpreted high bedrock surface where geotechnical drilling data were unavailable. The elevation of the control points was set to −40 m a.s.l. (meter above sea level) at sea and −15 m a.s.l. in a small area of land along the ASZ. Additional control points with elevation between −15 and −16 m a.s.l. were added to fill data gaps in the SE part of the study area (Fig. 2). The elevations of the control points were determined on the basis of the estimated thickness of the sediment deposits in the bedrock depressions within the study area.
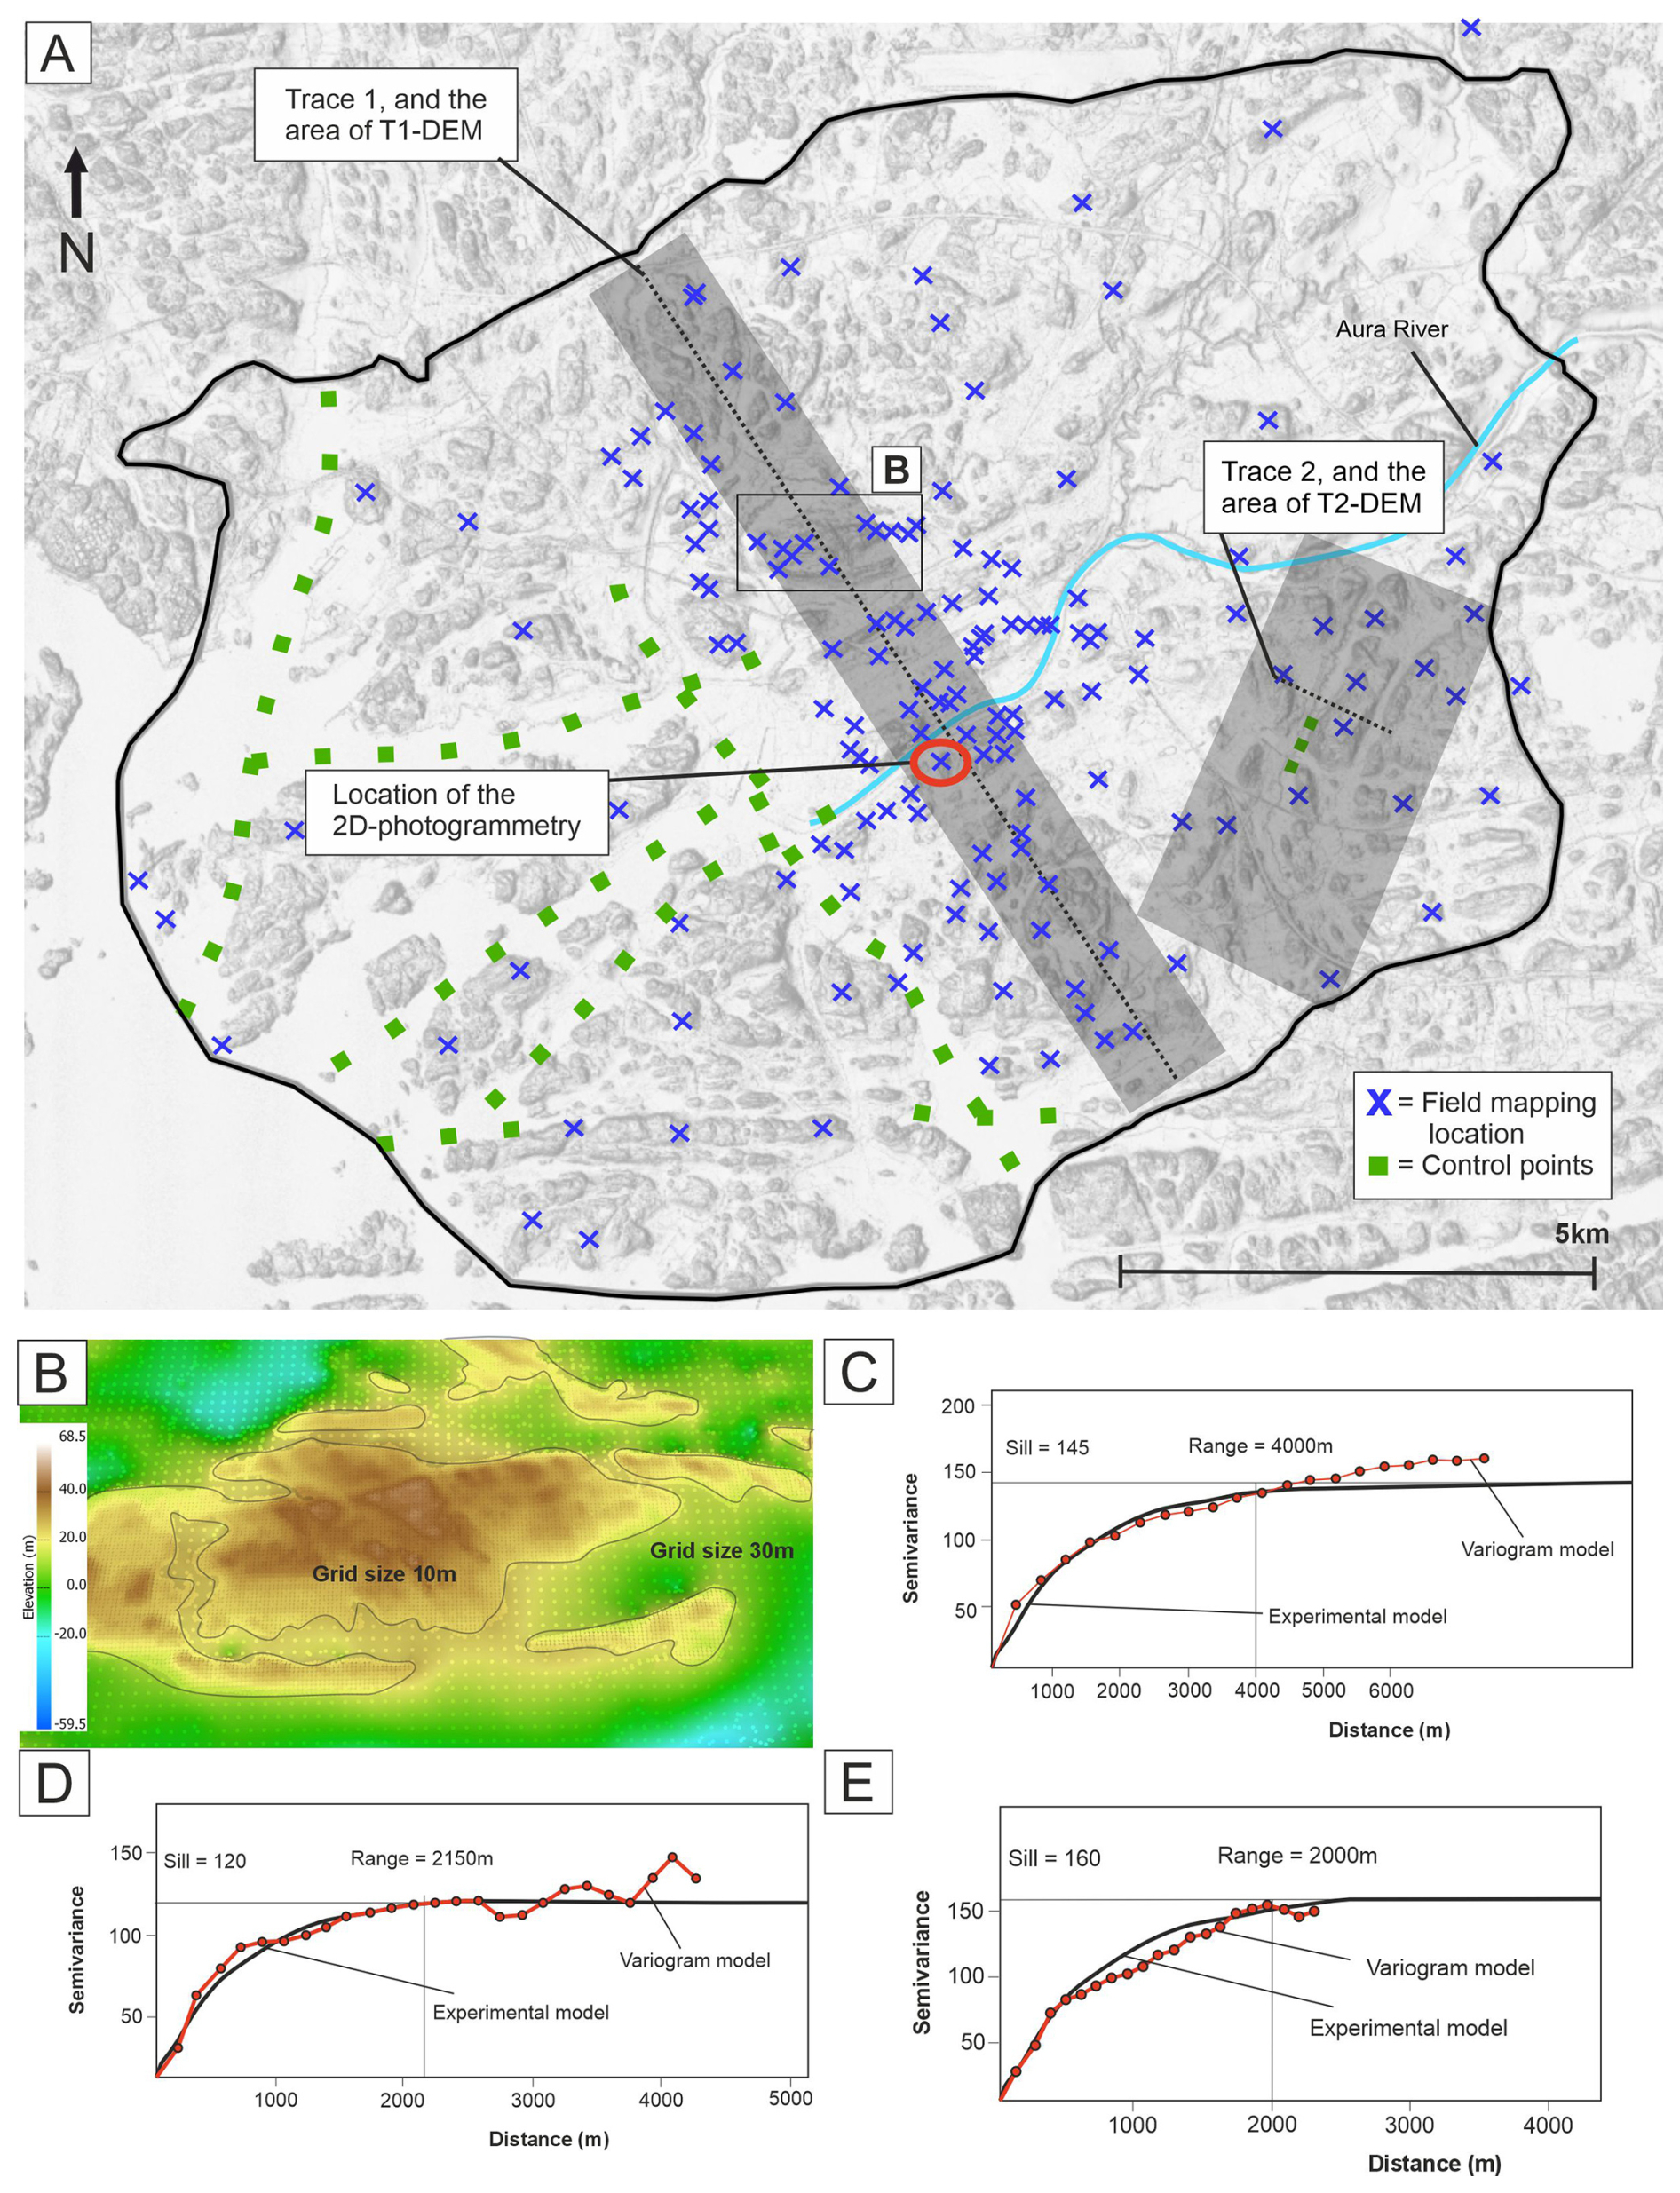
Figure 2(A) Borders of the study area and location of the field mapping outcrops, control points (approximate), 2D-photogrammetry model, cross-section-DEM areas and their trace lines. Ground surface elevation LiDAR in the background (National Land Survey of Finland, 2026). (B) Interpolation of bedrock surfaces with differing grid sizes (Honour points method in OK interpolation in MOVE). (C) Semivariogram of the bedrock-DEM. (D) Semivariogram of the T1-DEM. (E) Semivariogram of the T2-DEM.
Three bedrock surface models were generated (Fig. 2), including (i) the bedrock-DEM showing the bedrock surface elevation within the whole study area, and two cross-section DEMs across (ii) the central part of the study area (T1-DEM), and (iii) the SE part of the study area (T2-DEM). The bedrock-DEM and the cross-section DEMs were generated in MOVE Suite (3D-modelling software provided by PE Limited) using the Ordinary Kriging (OK) interpolation method. The OK interpolation was guided by the semivariogram (Fig. 2c, d, e), which measures the average degree of dissimilarity between unsampled values and nearby values (Oliver and Webster, 1990).
The bedrock-DEM was interpolated onto a 30 m grid using an exponential experimental model. In the kriging semivariogram, an experimental model was fitted to the variogram, representing our data with high accuracy (Fig. 2c). Furthermore, we used the honour points method in MOVE, which allows more accurate guidance of the interpolation by data points relative to the grid size. This approach increased accuracy to a 10 m grid in areas where bedrock surface elevations were derived from ground-surface LiDAR data (Fig. 2b).
The cross-section DEMs (T1-DEM & T2-DEM) were interpolated using a 10 m grid size, with increased accuracy of 2 to 5 m in areas where bedrock elevation was detected in ground-surface LiDAR data. Bedrock surface elevation and bedrock structures data were selected within 750 m of Trace 1 for the T1-DEM. In contrast, the data for T2-DEM covered an area of ca. 3000 × 5000 m in the SE part of the study area (Fig. 2). Best-fit interpolation was achieved using an exponential experimental model in both cross-section DEMs, although semivariogram settings were adjusted separately due to the different datasets (Fig. 2d, e). The cross-section of the T1-DEM focused on the steepness of the foliation and its interaction with the geometry of the brittle shear zones and fracturing. A cross-section of the T2-DEM emphasised the association between data coverage and the analysis of brittle structures to generate geologically realistic bedrock surface morphology. As the final step of the analysis, a structural synthesis was compiled to illustrate how bedrock structures influence bedrock surface morphology. The characterisation of the bedrock structural framework was accomplished by integrating brittle shear zones, LiDAR lineaments, and fracture data. The elongated bedrock depressions were interpreted from the bedrock-DEM and compiled with the integrated setting of the brittle bedrock structures to improve the identification of major structural features of the bedrock, including previously undetected brittle shear zones. This analysis was subsequently conducted at a more detailed scale using cross-section DEMs, in which the relationships between detailed bedrock surface morphology and LiDAR lineaments and fractures were analysed near major structural features. Lastly, based on the compilation of bedrock structures and detailed analyses of the cross-section DEMs, a final structural synthesis was generated, revealing a complex network of brittle shear zones and associated brittle structures within the damage zones that control the bedrock surface morphology.
4.1 Distributed ductile structures
The ductile structural fabric of the study area is dominated by a subvertical foliation throughout. Biotite paragneisses have stronger foliation than the granites, which are weakly foliated in general. However, foliation becomes moderately developed in the vicinity of the brittle shear zones (Fig. 3a). Subhorizontal foliation occurs within an open upright synform-antiform structure in the central part of the study area (Figs. 3b, 4). Foliation shows a prevailing ENE strike, which shifts to more E-striking in the southern part of the study area (Fig. 4). Other foliation orientations are sporadic and localised in the proximity of the brittle shear zones or fold structures. shear zones
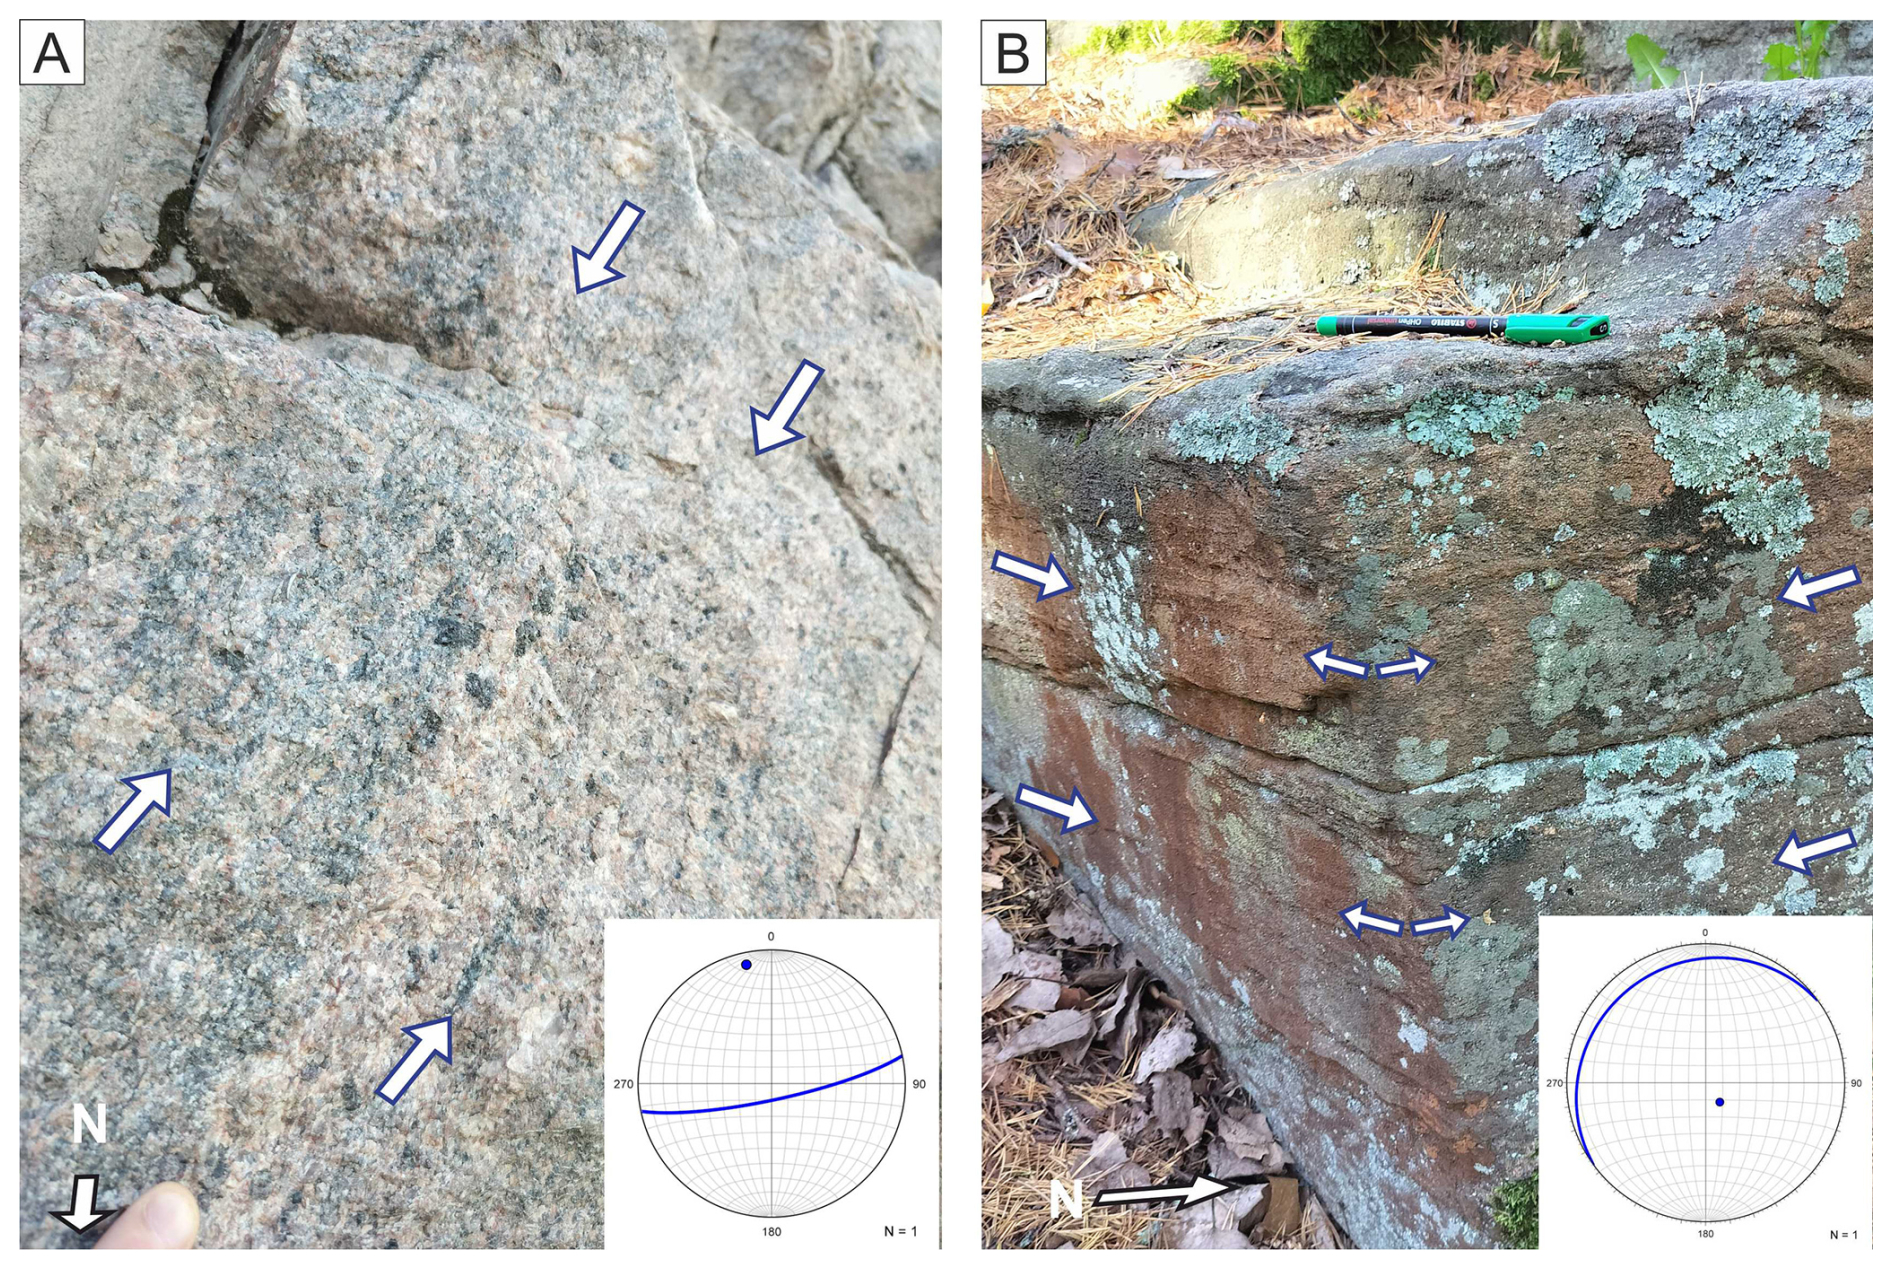
Figure 3(A) Subvertical foliation in granitic rock near ARSZ. (B) Subhorizontal foliation in biotite paragneissic rock within the open antiform. Arrows point to the orientation of the foliation. Stereonets show the foliation plane and its pole. The locations of the outcrops are marked in Fig. 4.
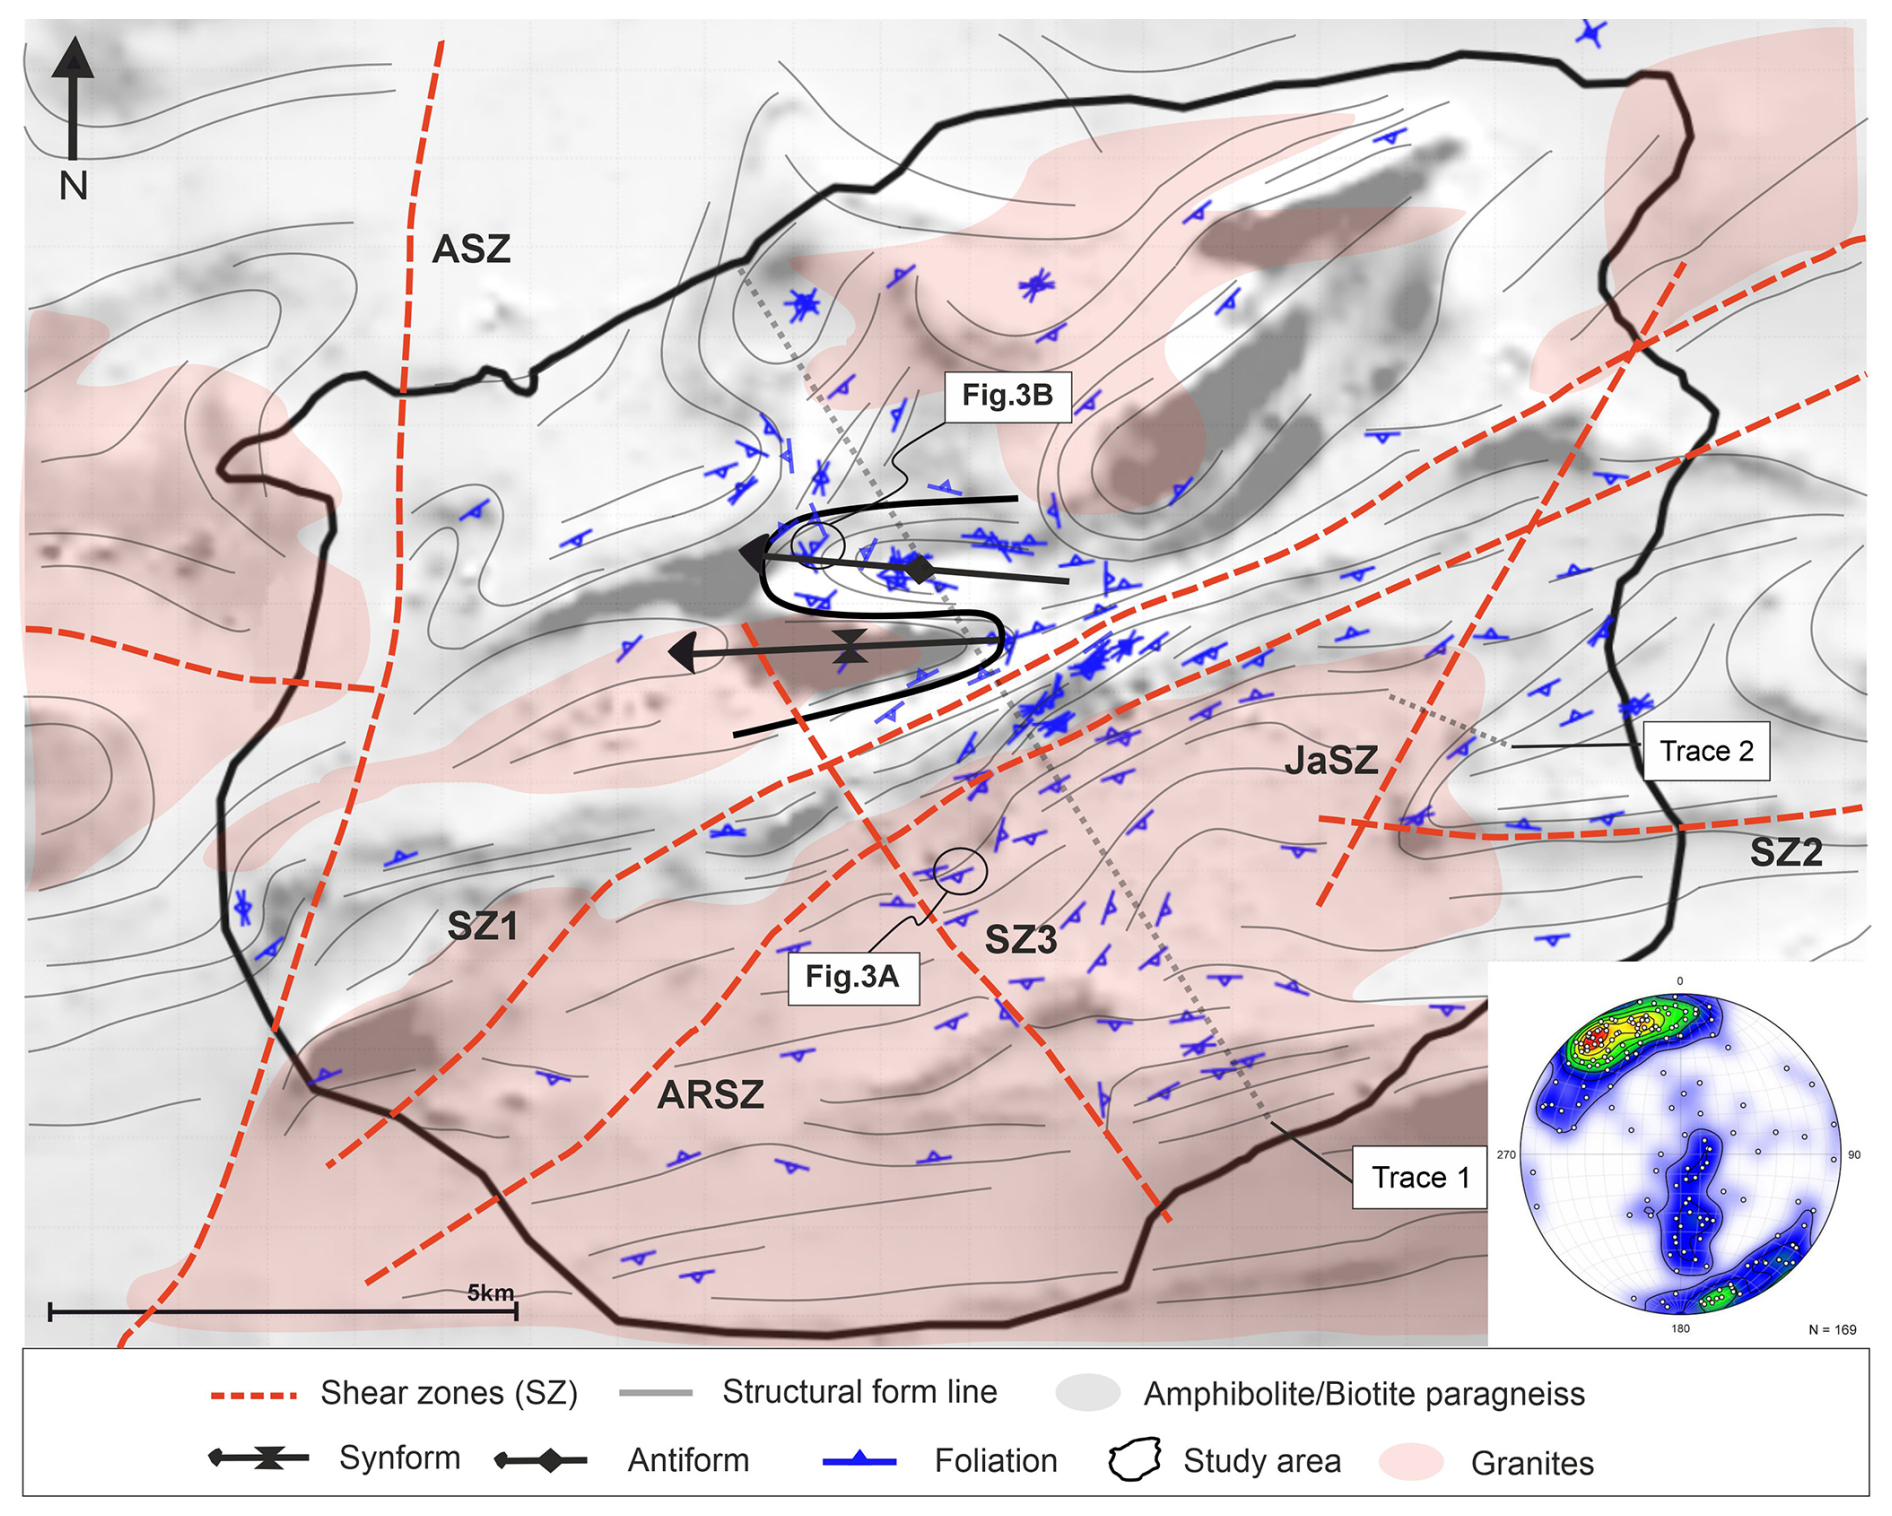
Figure 4Brittle shear zones, foliation, fold structures (black line) and simplified lithology of the study area. Low-altitude aeromagnetic map in the background (Geological survey of Finland). Equal-area, lower hemisphere stereonet shows poles normal to foliation plane, and the colour map indicates their density distributions.
4.2 Localised deformation: Brittle shear zones
Five brittle shear zones were identified within the study area (Fig. 4). Aura River Shear Zone (ARSZ; Ib in Fig. 1c), SZ1 (Ia in Fig. 1c) and SZ2 have a subparallel strike with the regional foliation, whereas Jaaninoja Shear Zone (JaSZ; IIA in Fig. 1c) and SZ3 (III in Fig. 1c) strike obliquely to the foliation (Fig. 4). The ENE-striking ARSZ and SZ1 are the most distinct brittle shear zones with a continuation across the whole study area. These brittle shear zones are subparallel with the lithological boundaries of the bedrock, which is dominated by granitic rocks in the south and biotite paragneisses in the north. The discontinuous SZ2 strikes E–W, thus corresponding to the shift of the foliation strike from ENE to E in the southern part of the study area. SZ3 strikes NW and extends beyond the study area in the north. In the central part of the study area, SZ3 intersect ARSZ and SZ1, and likely terminates on the western side of the open-folded synform structure (Fig. 4). JaSZ is an NE-striking zone that intersects ARSZ and SZ1 in the northeastern part and SZ2 in the southwestern part.
4.3 Outcrop fracture data
The fracture pattern observed on a typical outcrop comprises one major subvertical fracture orientation (R1), occurring either as an individual fracture or as a set of parallel fractures, often accompanied by at least one minor (R2) fracture set (Fig. 5). While R1-fractures are continuous and regularly occurring on the outcrops, R2-fractures are short and they often abut to the R1-fractures (Figs. 5b, 6b). The N-striking subvertical fractures are the most distinct R1 orientation, while the ENE-, NW- and E-striking subvertical fractures are more often categorised as R2-fractures (Fig. 7b–d).
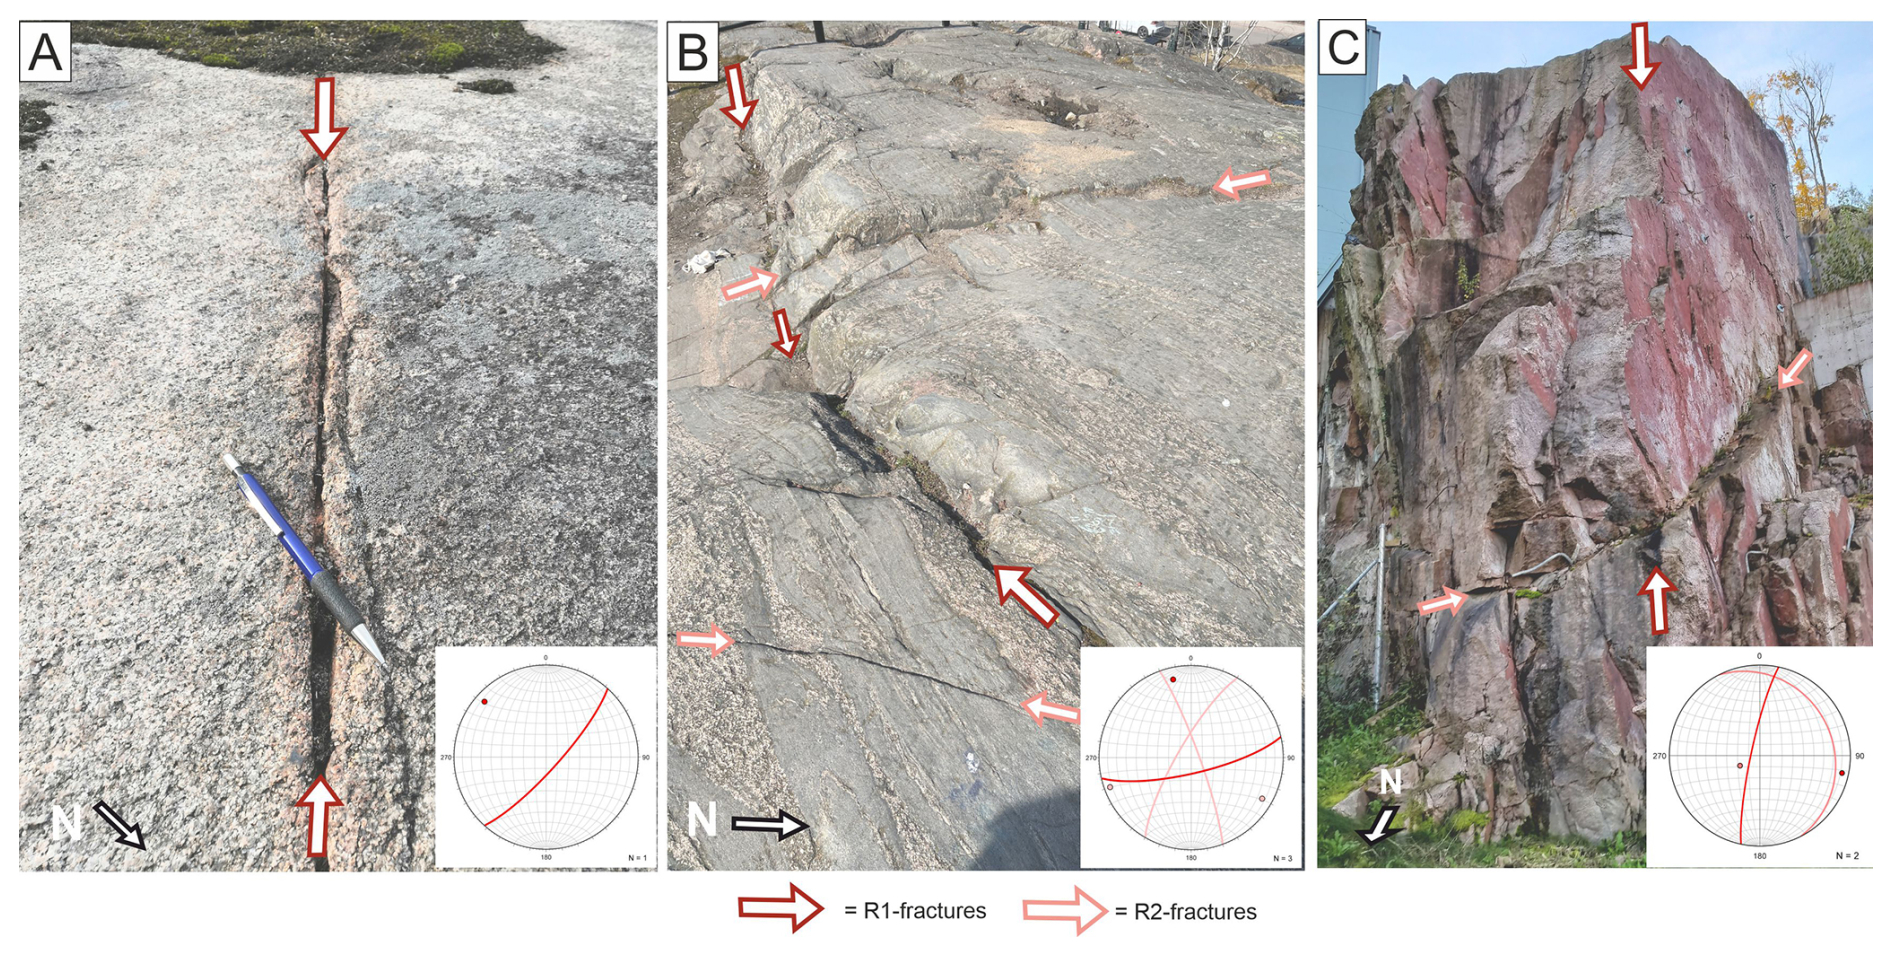
Figure 5(A) R1-fracture without R2-fractures. (B) R1-fracture with two R2-fracture sets. (C) Subvertical R1-fracture set shown as distinct outcrop walls (reddish fracture surfaces), and subhorizontal R2-fracture set. Stereonets show the foliation plane and its pole. The locations of the outcrops are marked in Fig. 6.
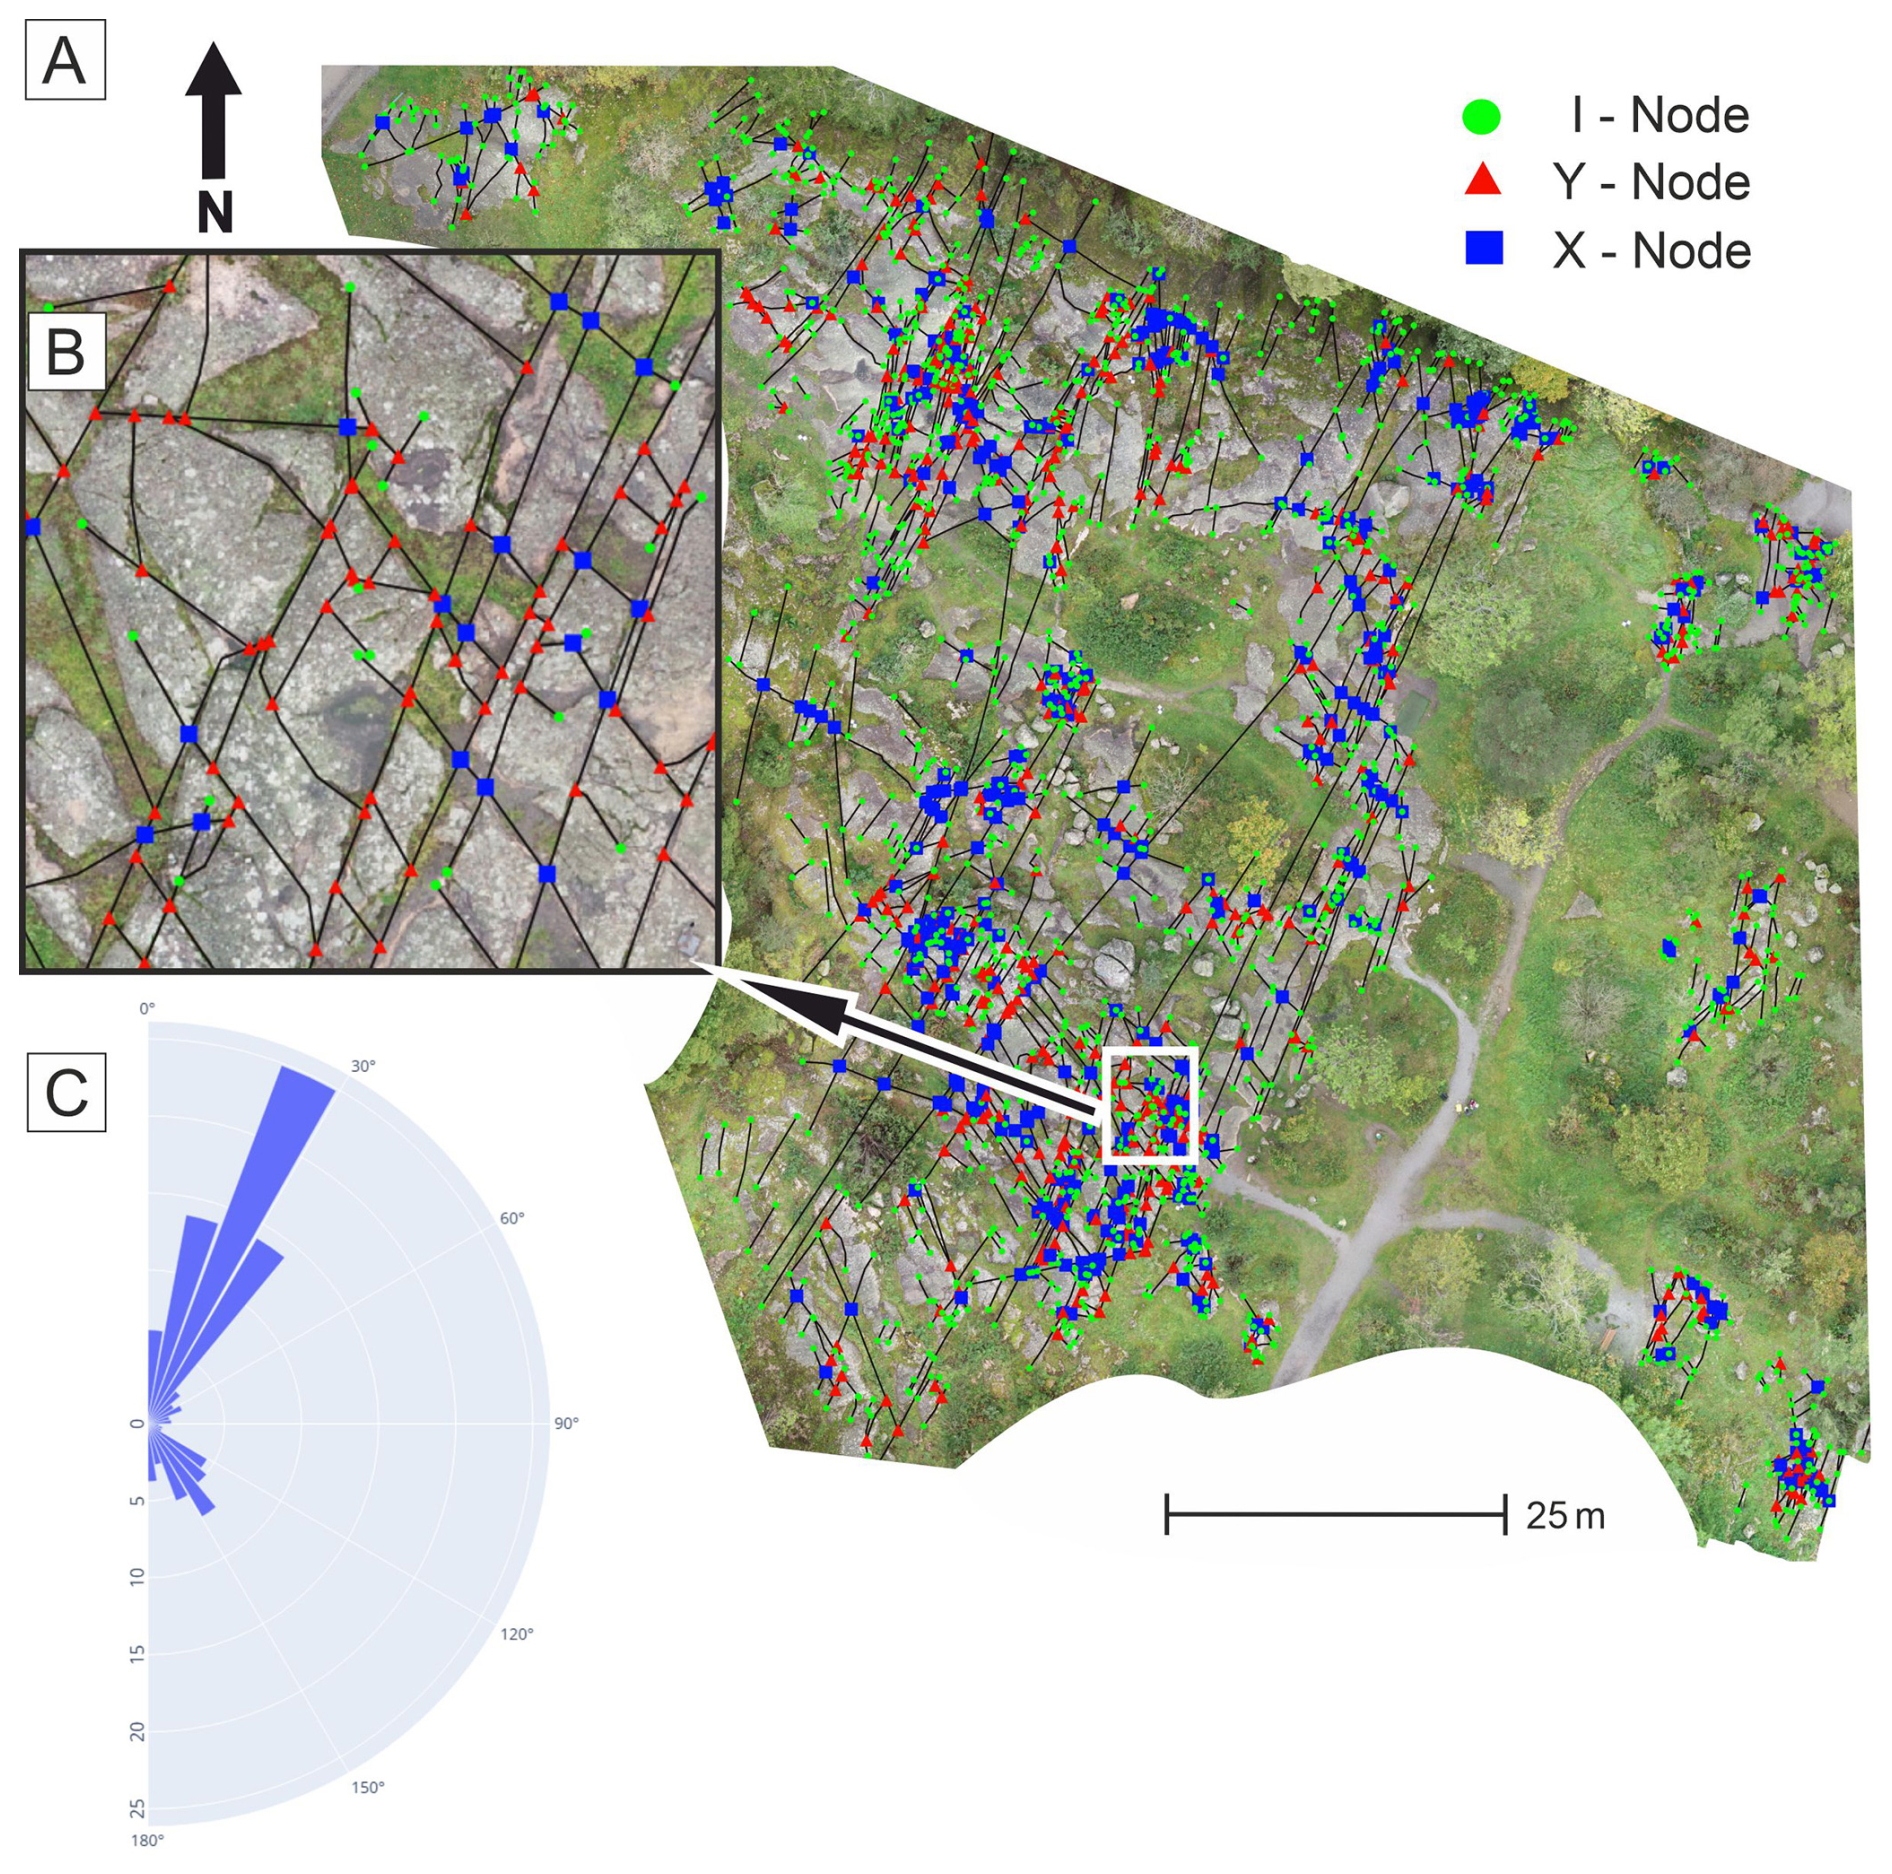
Figure 62D-photogrammetry model. (A) Outcrop of the 2D-photogrammetry with topological features (i, y and x-nodes). (B) Detailed image from the southern part of the outcrop illustrates the typical topological setting, in which NE-striking fractures often abut (y-nodes) the continuous NNE-striking fractures. (C) Rose plot presenting a percentage strike distribution of the fractures.
The 2D photogrammetry model reveals fracture patterns in which the major (R1) and minor (R2) fractures, along with their relationships, are readily distinguished (Fig. 6a, b). The NNE-striking fractures (R1) reach up to +100 m in length and are closely spaced, with approximately two fractures per metre. The minor fractures (R2) include NW-striking fractures throughout the outcrop, whereas N-striking fractures are restricted to the northeastern and eastern parts of the outcrop. Topology analysis shows that NW-striking fractures often abut the NNE-striking ones (y-nodes in Fig. 6b) and, less frequently, intersect them (x-nodes in Fig. 6b). The isolated i-nodes commonly occur at the outcrop boundaries, where the bedrock surface disappears beneath the vegetation. This suggests that many of these fractures likely continue beyond the exposed bedrock and may abut or intersect other fractures that are not visible within the mapped area.
4.4 LiDAR lineaments
The LiDAR lineaments comprise three main orientation sets that strike ENE, NNE and NW in order of abundance (Fig. 7a, e). When calculating the number of lineaments in these sets, they account for 46 % of all interpreted lineaments (two highest columns included per set; Fig. 7e). The ENE-striking lineaments characterise the central part of the study area, whereas E-striking lineaments prevail in the southern part, both showing sporadic appearance elsewhere (Fig. 7a). NNE- and NW-striking lineaments are spatially distributed throughout the study area (Fig. 7a). The NNE-striking lineaments are prevailing in the southeastern part of the study area. The NW-striking lineaments are evident in the northwestern part of the study area, which hosts a more variable and densely interpreted lineament system than other parts.
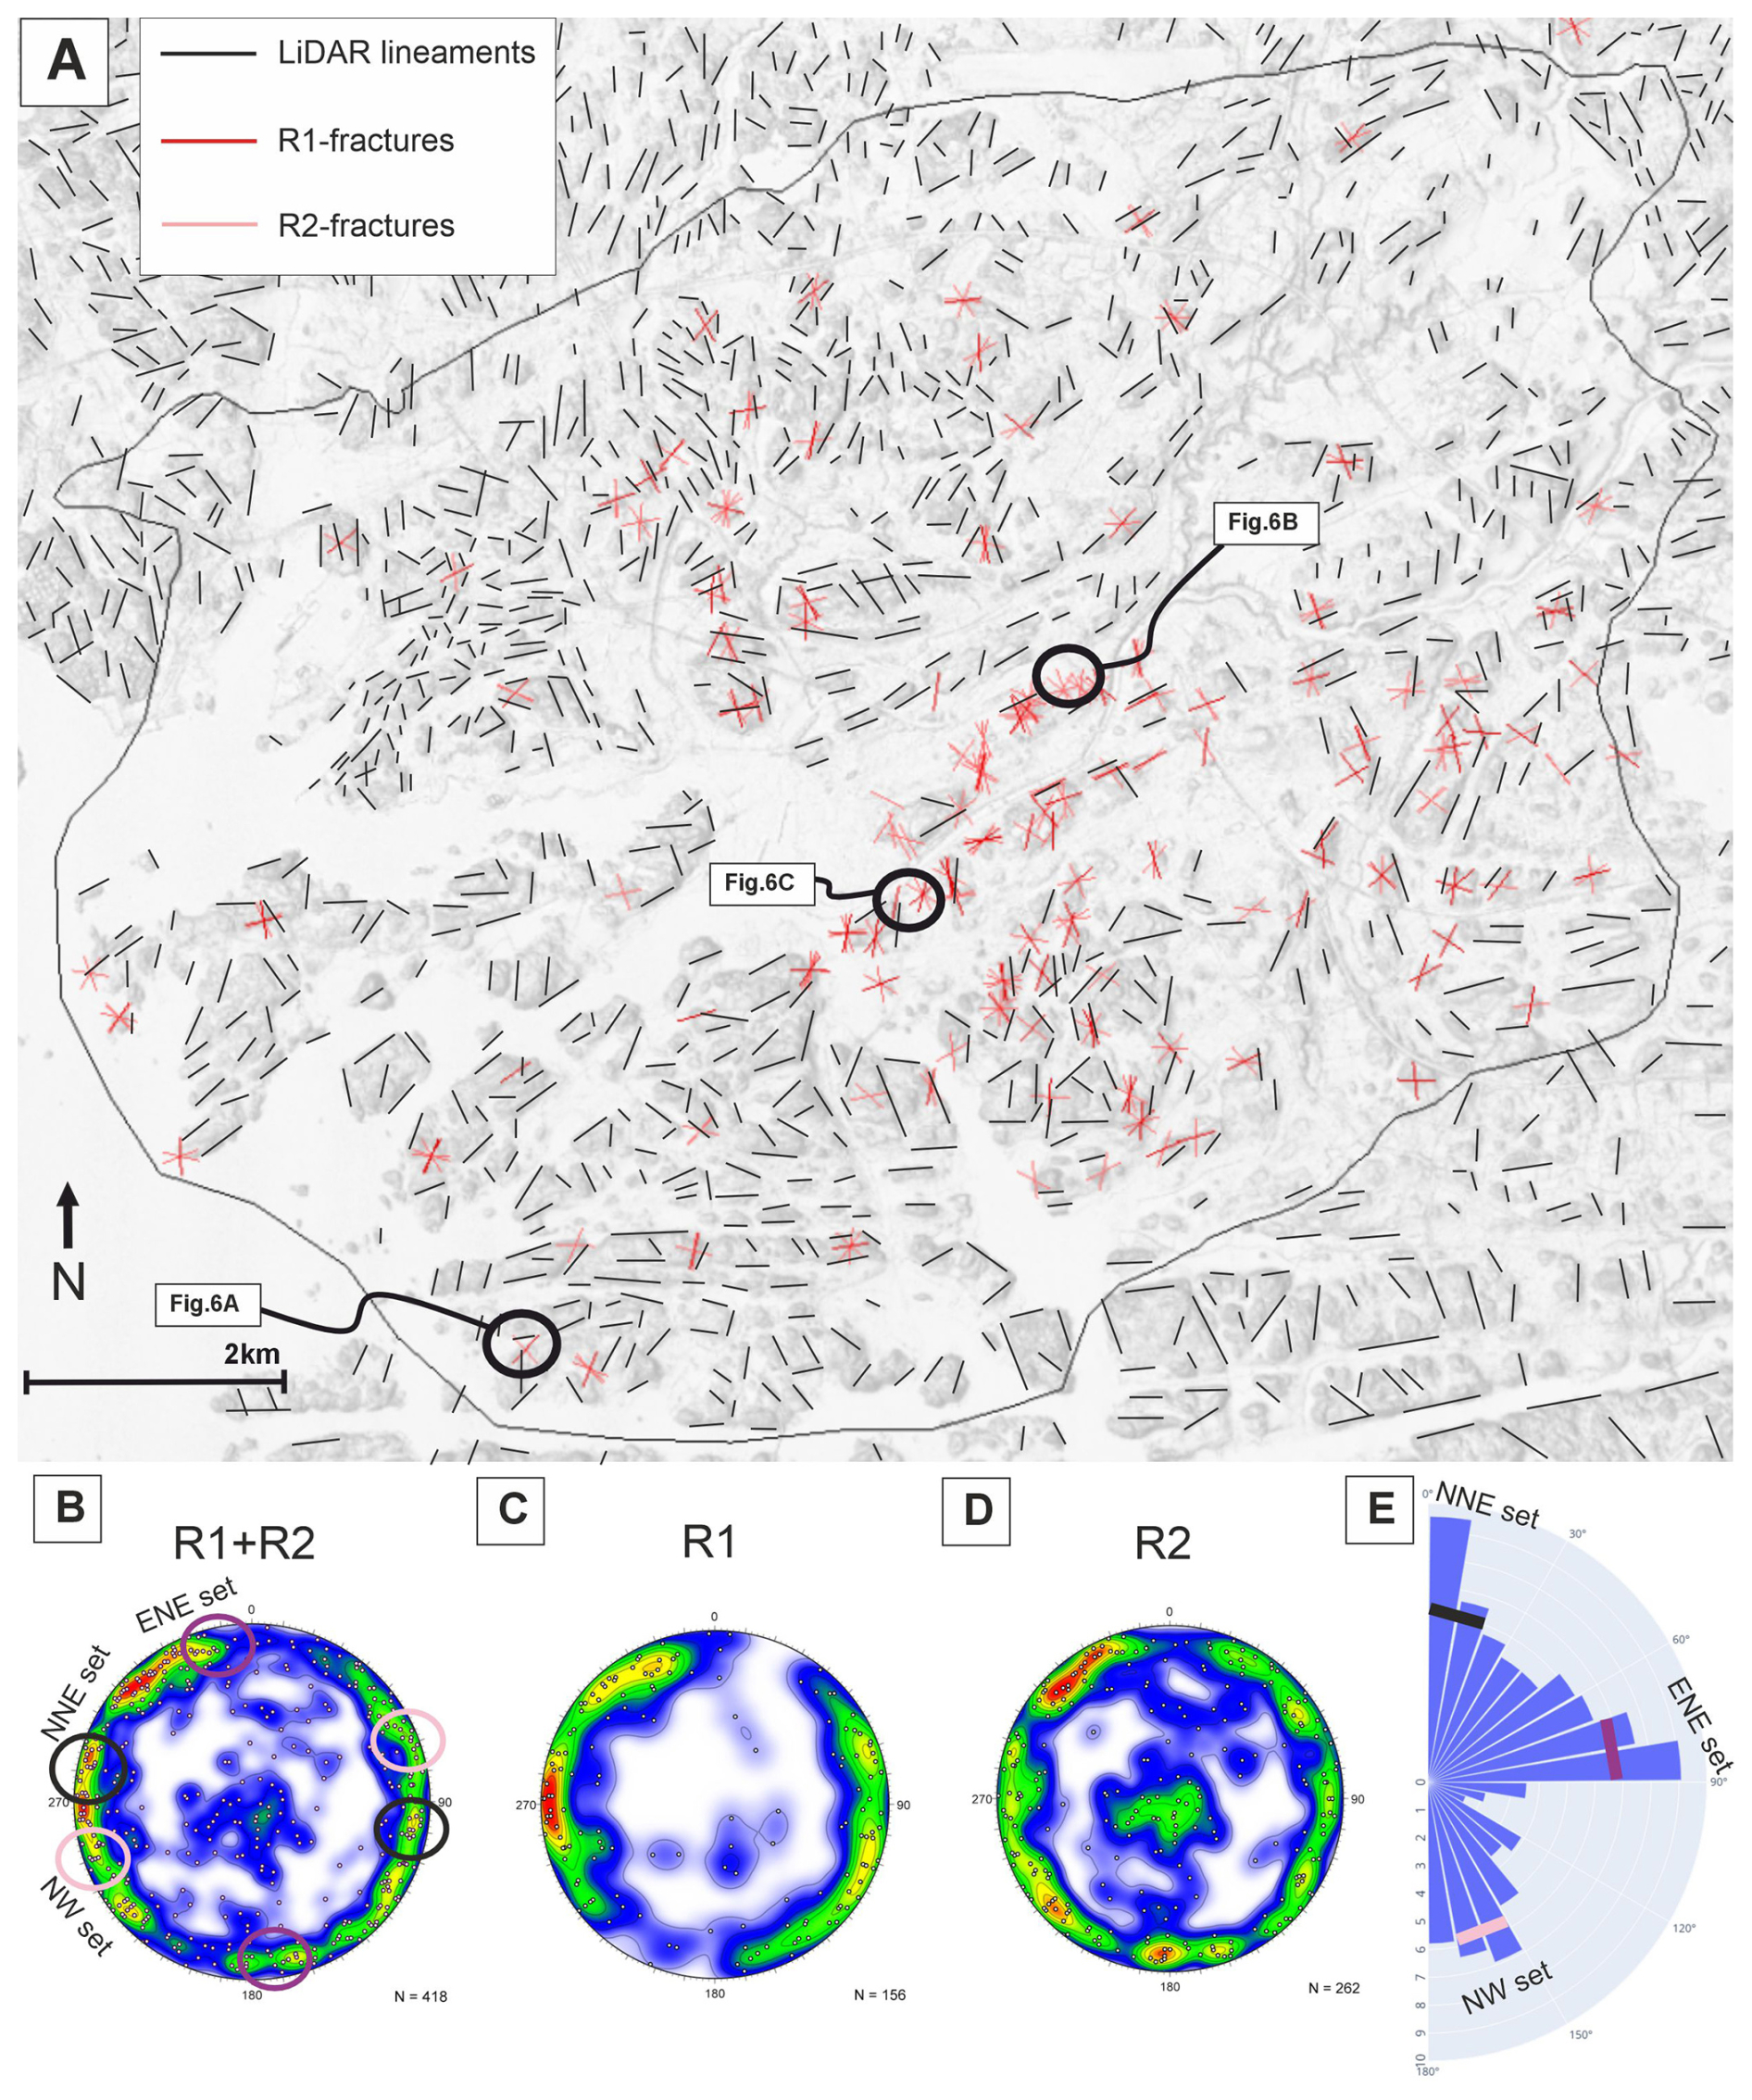
Figure 7Brittle structures within the study area. (A) LiDAR lineaments and outcrop fractures. Ground surface elevation LiDAR in the background. Stereonets represent all of the fractures (B), R1-fractures (C) and R2-fractures (D). Equal-area, lower hemisphere stereonets show poles normal to the fracture plane, and the colour map indicates their density distributions. (E) Rose plot presenting a percentage strike distribution of the LiDAR lineaments.
4.5 Structural patterns of the bedrock-DEM
The bedrock surface elevation varies from 60 m below to 70 m above sea level (−60 to 70 m a.s.l.), showing abrupt changes due to elongated bedrock depressions with varying strikes throughout the bedrock-DEM (Fig. 8). Bedrock depressions show four orientation sets with ENE, NNE to NE, NW and E strikes. The ENE-striking depressions are the predominant morphological features of the bedrock surface. Extending through the central and northern parts of the study area, these depressions form prominent linear features and produce pronounced contrasts in bedrock surface elevation. The most common orientation of the bedrock depressions is NNE to NE (Fig. 8), but these are narrow and discontinuous compared to the ENE depressions. The NW-striking bedrock depressions are mainly scattered in the north and south. However, one extends through the study area, separating the mainland from the archipelago and becoming more N-striking in the north. E-striking bedrock depressions are almost exclusively found in the southern part of the study area.
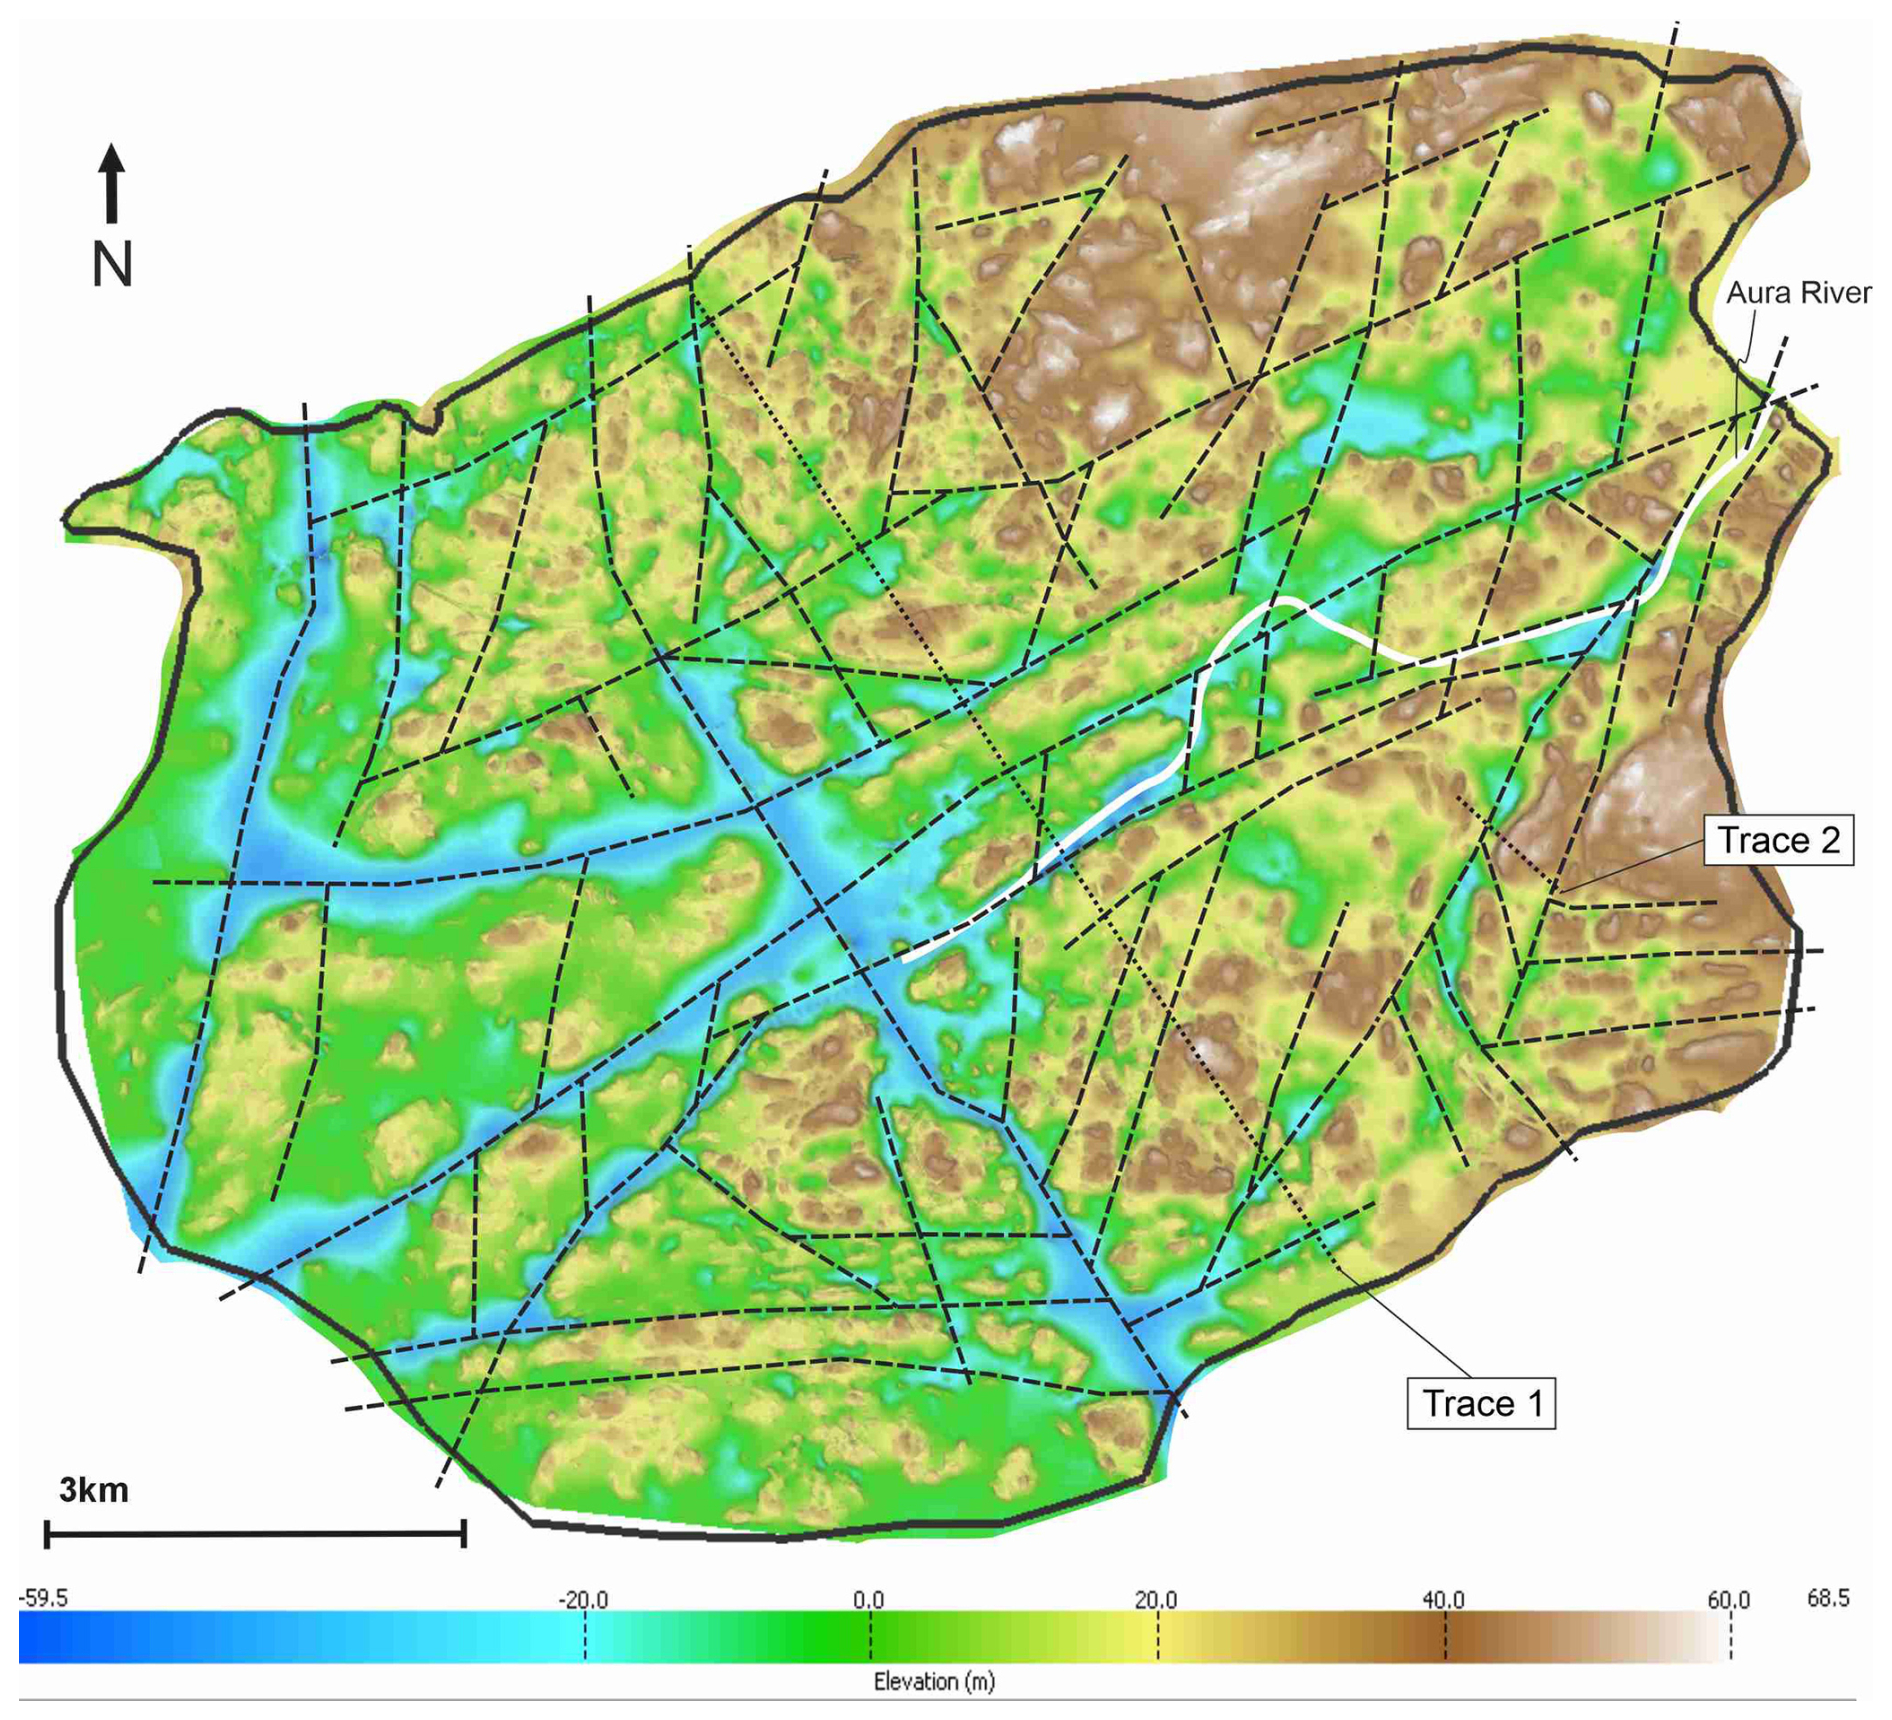
Figure 8The bedrock-DEM and the elongated bedrock depressions (dashed lines). Traces 1 and 2 represent cross-section lines for T1-DEM and T2-DEM, respectively. Interpretation further developed from Ahlqvist et al. (2026).
4.6 Structural analysis within cross-section DEMs
4.6.1 T1-DEM
The SSE-side of T1-DEM is controlled by ENE-striking and SSE-dipping subvertical foliation, whereas the NW-part is characterised by isoclinal to open folding. The NW part comprises an openly folded antiform structure (OA in Fig. 9a, e, f) surrounded by isoclinal folding in the NW, and within the ENE-trending brittle shear zones. Cross-section of Trace 1 ascertains that the ARSZ, which occurs along the Aura River depression and coincides spatially with the deepest part of the bedrock surface, acts as a boundary for different foliation and fracture systems on the SE- and NW-side of the ARSZ.
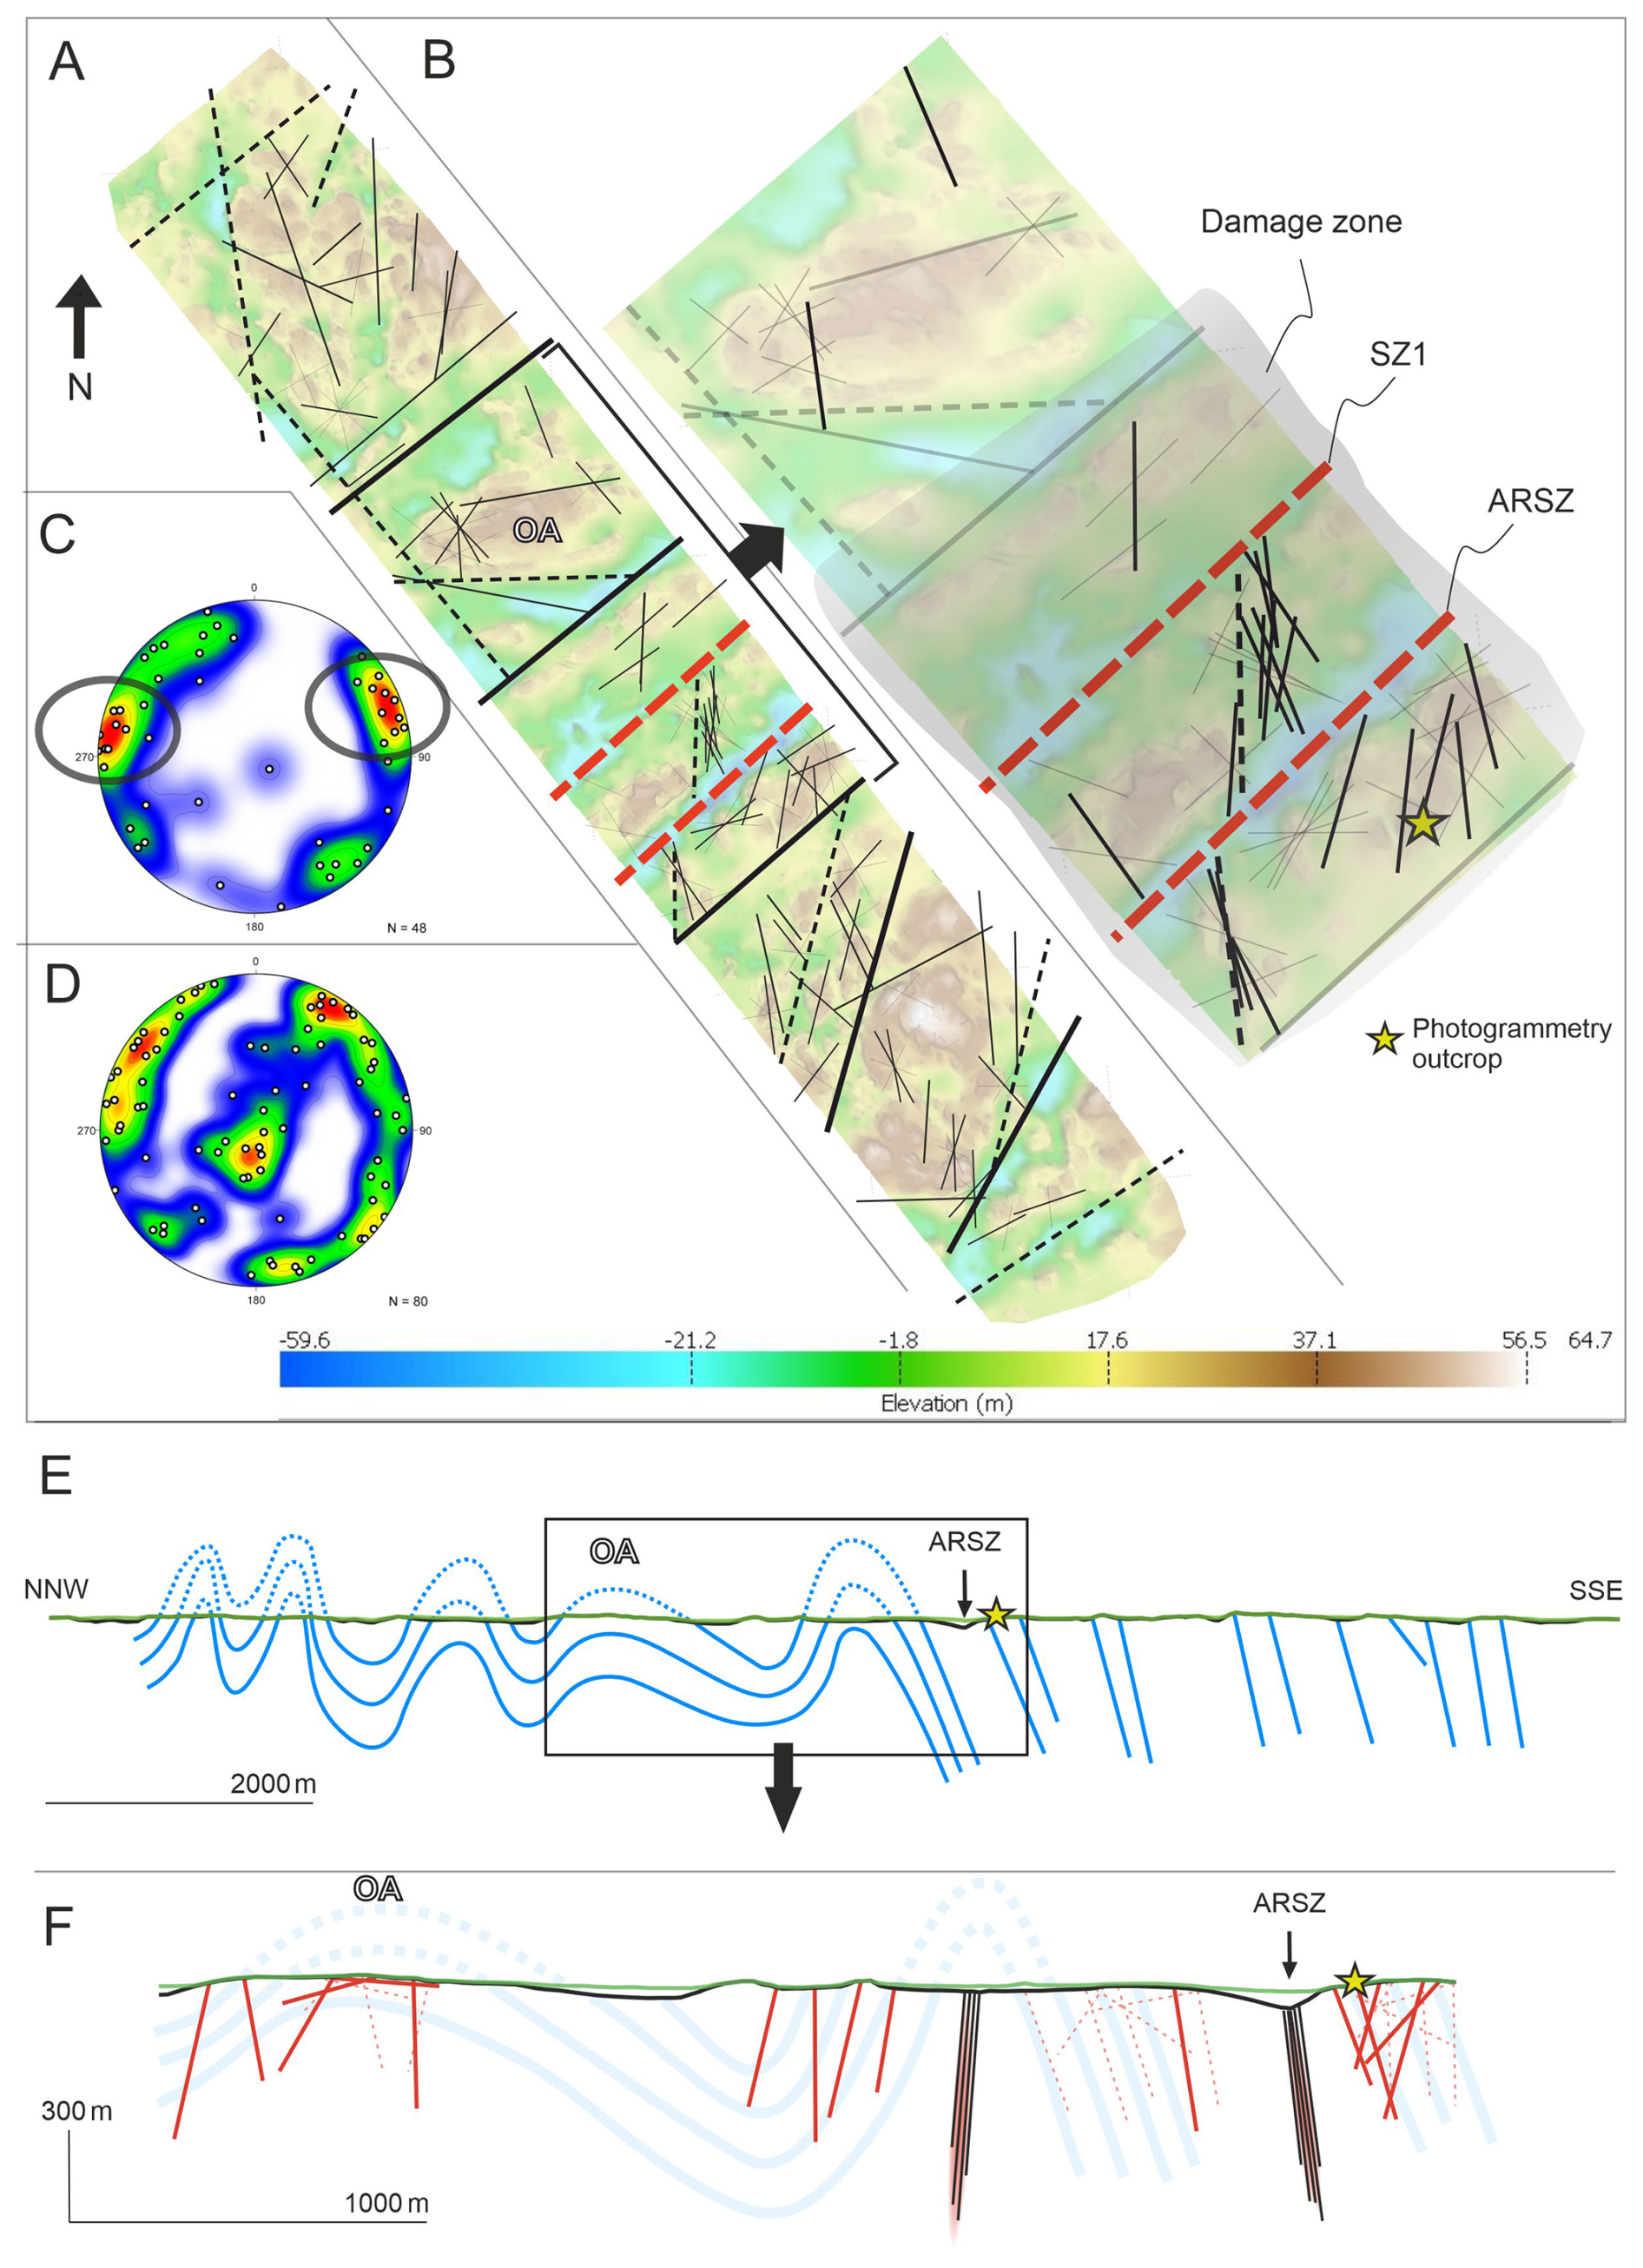
Figure 9(A) T1-DEM with brittle structures. Black bolded lines = brittle shear zones, Black dashed lines = bedrock depressions; black thin lines = integration of LiDAR lineaments and fractures. (B) Orientation of the brittle structures near ARSZ (NNE to NNW-striking brittle structures bolded). (C) R1-fractures within T1-DEM (NNE- to NNW-striking fractures circled in the stereoplot). (D) R2-fractures within T1-DEM. Equal-area, lower hemisphere stereonets show dots normal to the fracture plane, and the colours indicate their density distributions. (E) Cross-section along T1-DEM (Trace 1) with foliation orientations. (F) Cross-section with fracture orientation and brittle shear zones. R1-fractures = red lines, R2-fractures = dotted red lines, brittle shear zones (SZ1 and SZ2) = black line swarm, bedrock surface = black line, ground surface = green line.
Fractures within the T1-DEM area are mostly subvertical, though a few gently dipping fractures occur within the open antiform structure and near the ARSZ. Subvertical R1-fractures produce two distinct NNE- and NNW-striking sets (Fig. 9c), whereas R2-fracturing strike more towards NE and NW (Fig. 9d). NNE- and NNW-striking fractures are present throughout the T1-DEM, with high volume within the damage zone of SZ2 (black lineaments; Fig. 10b). NNE- and secondary NW-striking fractures in the 2D photogrammetry model correlate well with the observed R1- and R2-fracture orientations along the ARSZ (Fig. 9b) and with the overall fracturing trends within the study area (Fig. 7). The fracture sets in the photogrammetry model also correspond with R1/R2 orientations within T1-DEM. Therefore, the photogrammetry model outcrop lies within the ARSZ damage zone, indicated by the high intensity of NNE-striking fractures, suggesting that the damage zone width is at least 400 m. NNE- and NNW-striking fractures are dominant on the south side of SZ2 but become more irregular towards the north from the ARSZ (Fig. 9a). NW- and NE-striking R2-fractures occur regularly throughout the T1-DEM, indicating that the ARSZ does not affect these fracture trends.
The elevation of the bedrock surface within T1-DEM ranges from −59.6 to 64.7 m a.s.l., nearly matching the elevation range of the whole bedrock-DEM. The deepest part of T1-DEM lies along the ARSZ, and low elevations also occur along other ENE-striking brittle shear zones (Fig. 9a). Furthermore, low-lying bedrock elevation is observed in the SE part of T1-DEM, where several continuous NNE-, NE- and E-striking bedrock depressions occur (Fig. 9a). The NNE-striking depression may represent a diminished continuation of the JaSZ (Figs. 4, 8).
4.6.2 T2-DEM
NNW- to N-striking fractures are the prevailing R1 orientation and are localised near the JaSZ (Fig. 10b, c). NE-striking fractures are the most frequent fracture set within T2-DEM and occur in both R1 and R2 classes (Fig. 10c, d). NE-striking fractures occur regularly throughout T2-DEM but show no spatial concentration. E-striking R2-fractures occur in the southern part of T2-DEM, mainly as subsidiary fracturing.
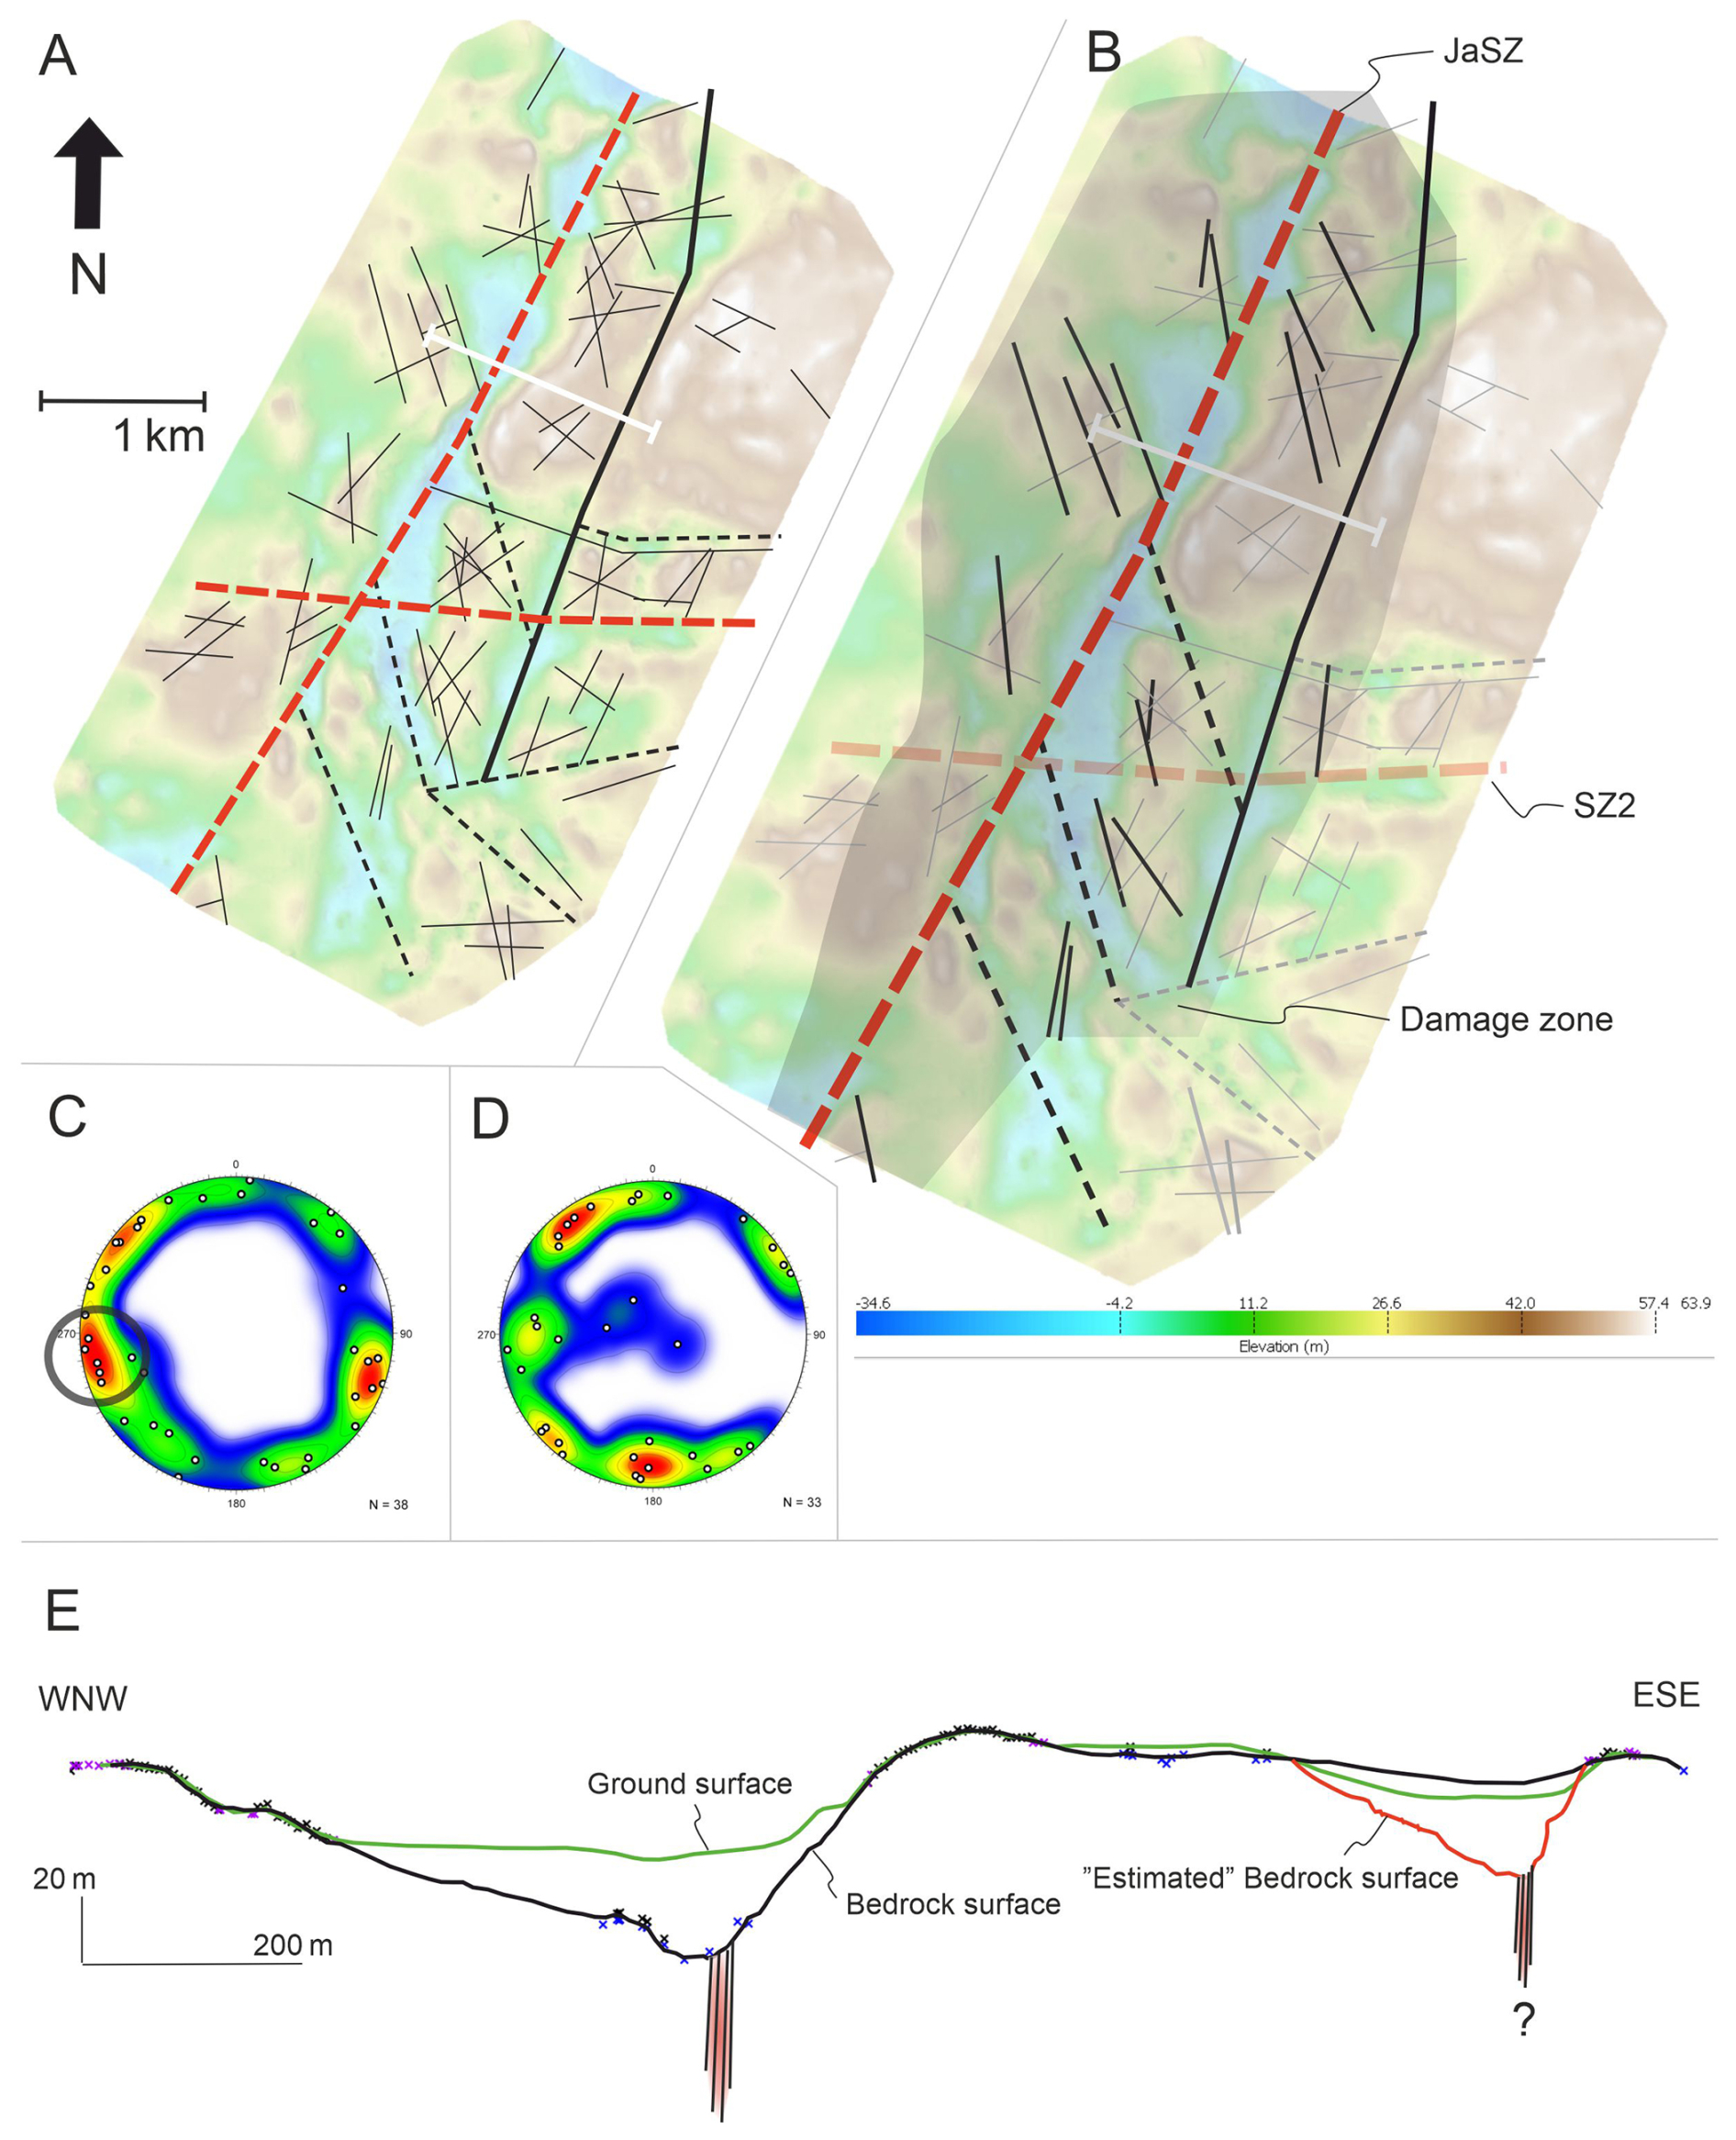
Figure 10(A) Brittle structures within the T2-DEM. Black bolded lines = faults, Black dashed lines = bedrock depressions, black thin lines = integration of LiDAR lineaments and fractures. (B) NNW-striking brittle structures highlighted near JaSZ. (C) R1-fractures (circled area corresponds to the brittle structures highlighted in panel (B). (D) R2-fractures. Equal-area, lower hemisphere stereonets show dots normal to the fracture plane, and the colours indicate their density distributions. (E) Cross-section across JaSZ emphasises the difference between the ground surface and bedrock surface (z-value exaggerated ×3.5). Note the inaccurate interpolation of the bedrock surface in the ESE part of the cross-section, which lacks bedrock surface data points.
Bedrock elevation in the T2-DEM reveals major NNE-striking bedrock depressions along the JaSZ, where depth reaches −35 m a.s.l. (Fig. 10a, b). Small-scale, E-striking bedrock depressions in the southern part of the T2-DEM also emphasise the roughness of the bedrock surface. Bedrock elevation shows weaker contrast along the E-branch of the brittle shear zone, where the interpolated bedrock surface is incorrectly positioned above the ground surface due to a lack of bedrock surface data (Fig. 10e). Even with the interpolation method used for the T2-DEM, the “estimated” bedrock surface is often predicted to lie deeper along the brittle bedrock structures unless data coverage is exceptionally comprehensive.
5.1 Networking and kinematics of the ARSZ and JaSZ
The network of brittle shear zones suggests that large-scale brittle structures do not uniformly align with the ductile framework within the study area. Brittle shear zones that conform to the ductile framework of the bedrock are primarily concentrated in the central and southern regions of the study area, exhibiting strike directions of ENE and E, respectively, as exemplified by ARSZ. Additionally, NNE- to NE-striking shear zones, such as JaSZ, characterise the setting of large-scale brittle structures and are extensively distributed throughout the study area. N–S-striking R1 fractures, which show separate NNE- and NNW-striking sets in the T1-DEM and T2-DEM, indicate that these fractures form in response to movement within the brittle shear zones. Cross-section DEMs illustrate that ARSZ and JaSZ control the spatial occurrence of these fractures by bordering and enhancing the expression of the NNW- to NNE-striking fractures within the damage zones. The findings challenge the notion that pre-existing ductile shear zones preferentially localise brittle deformation, as proposed, e.g., by Mancktelow and Pennacchioni (2005) and Skyttä and Torvela (2018).
Instead, the localisation of brittle deformation appears to have been influenced by the orientation of the stress field relative to the pre-existing structures, as also suggested by Saintot et al. (2011) and Viola et al. (2016). This implies that the reactivation potential of pre-existing structures was controlled not only by their inherited mechanical weakness but also by their geometric relationship to the prevailing stress regimes. Based on the prevailing NNW- and NNE-oriented compressional stress regime in southwestern Finland at ca. 1.75–1.65 Ga (Mattila and Viola, 2014), we suggest that NNE and NNW lineaments and fractures represent tensional fractures formed in different stress regimes. That interpretation, and a well-developed system of Riedel fractures, suggests sinistral kinematics for both JaSZ and ARSZ (Fig. 11).
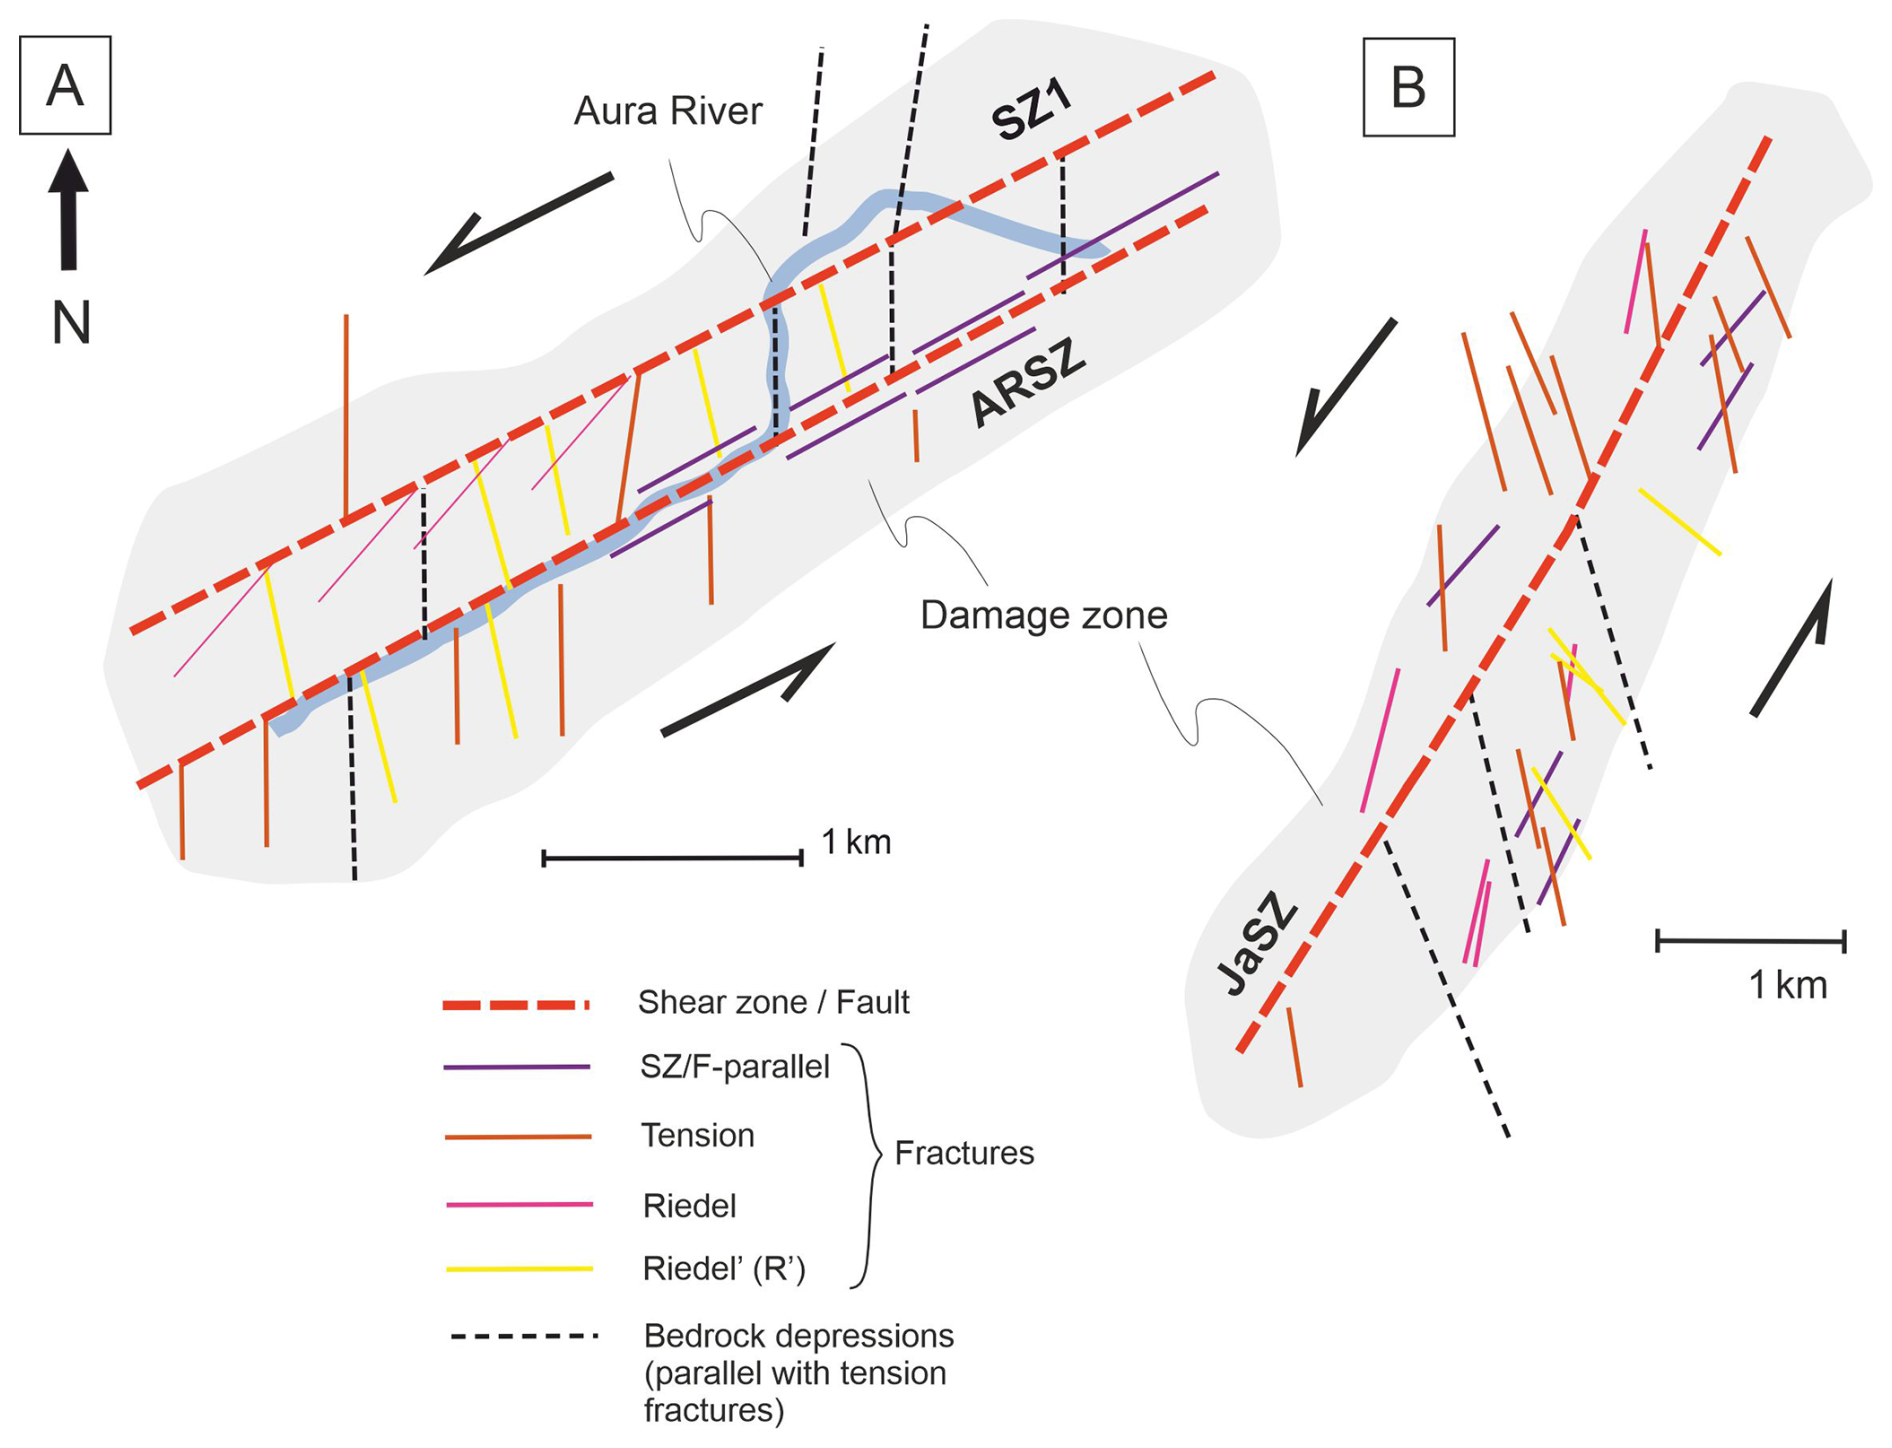
Figure 11Simplified sketch of brittle structures and kinematics along (A) ARSZ and (B) the JaSZ.
The ARSZ and JaSZ, however, differ in both their fracture characteristics and orientations. In the ARSZ, NNE-striking tension fractures and NNW-striking Riedel' fractures are prevailing, whereas in the JaSZ, NNE-striking tension fractures are prevailing. Therefore, we suggest that brittle deformation within the ARSZ and JASZ reflects distinct events rather than a single regionally uniform deformation event. Sinistral JaSZ shows a geometry similar to that of the Fault System I distinguished by Nordbäck et al. (2022) during NNW compression. Whereas the fracture setting in the ARSZ corresponds to NNE compression, suggesting that this reactivation of the ARSZ generated the characteristic fracture pattern in the ARSZ. In addition, the JaSZ has cross-cutting relationships with the ARSZ (Figs. 4, 12), suggesting that the JaSZ is the result of a younger event. The reported later brittle events and reactivations (Nordbäck et al., 2023) seem to have a limited effect on the brittle structures within the ARSZ and JaSZ, or their potential effect is confined to the unexposed core domains.
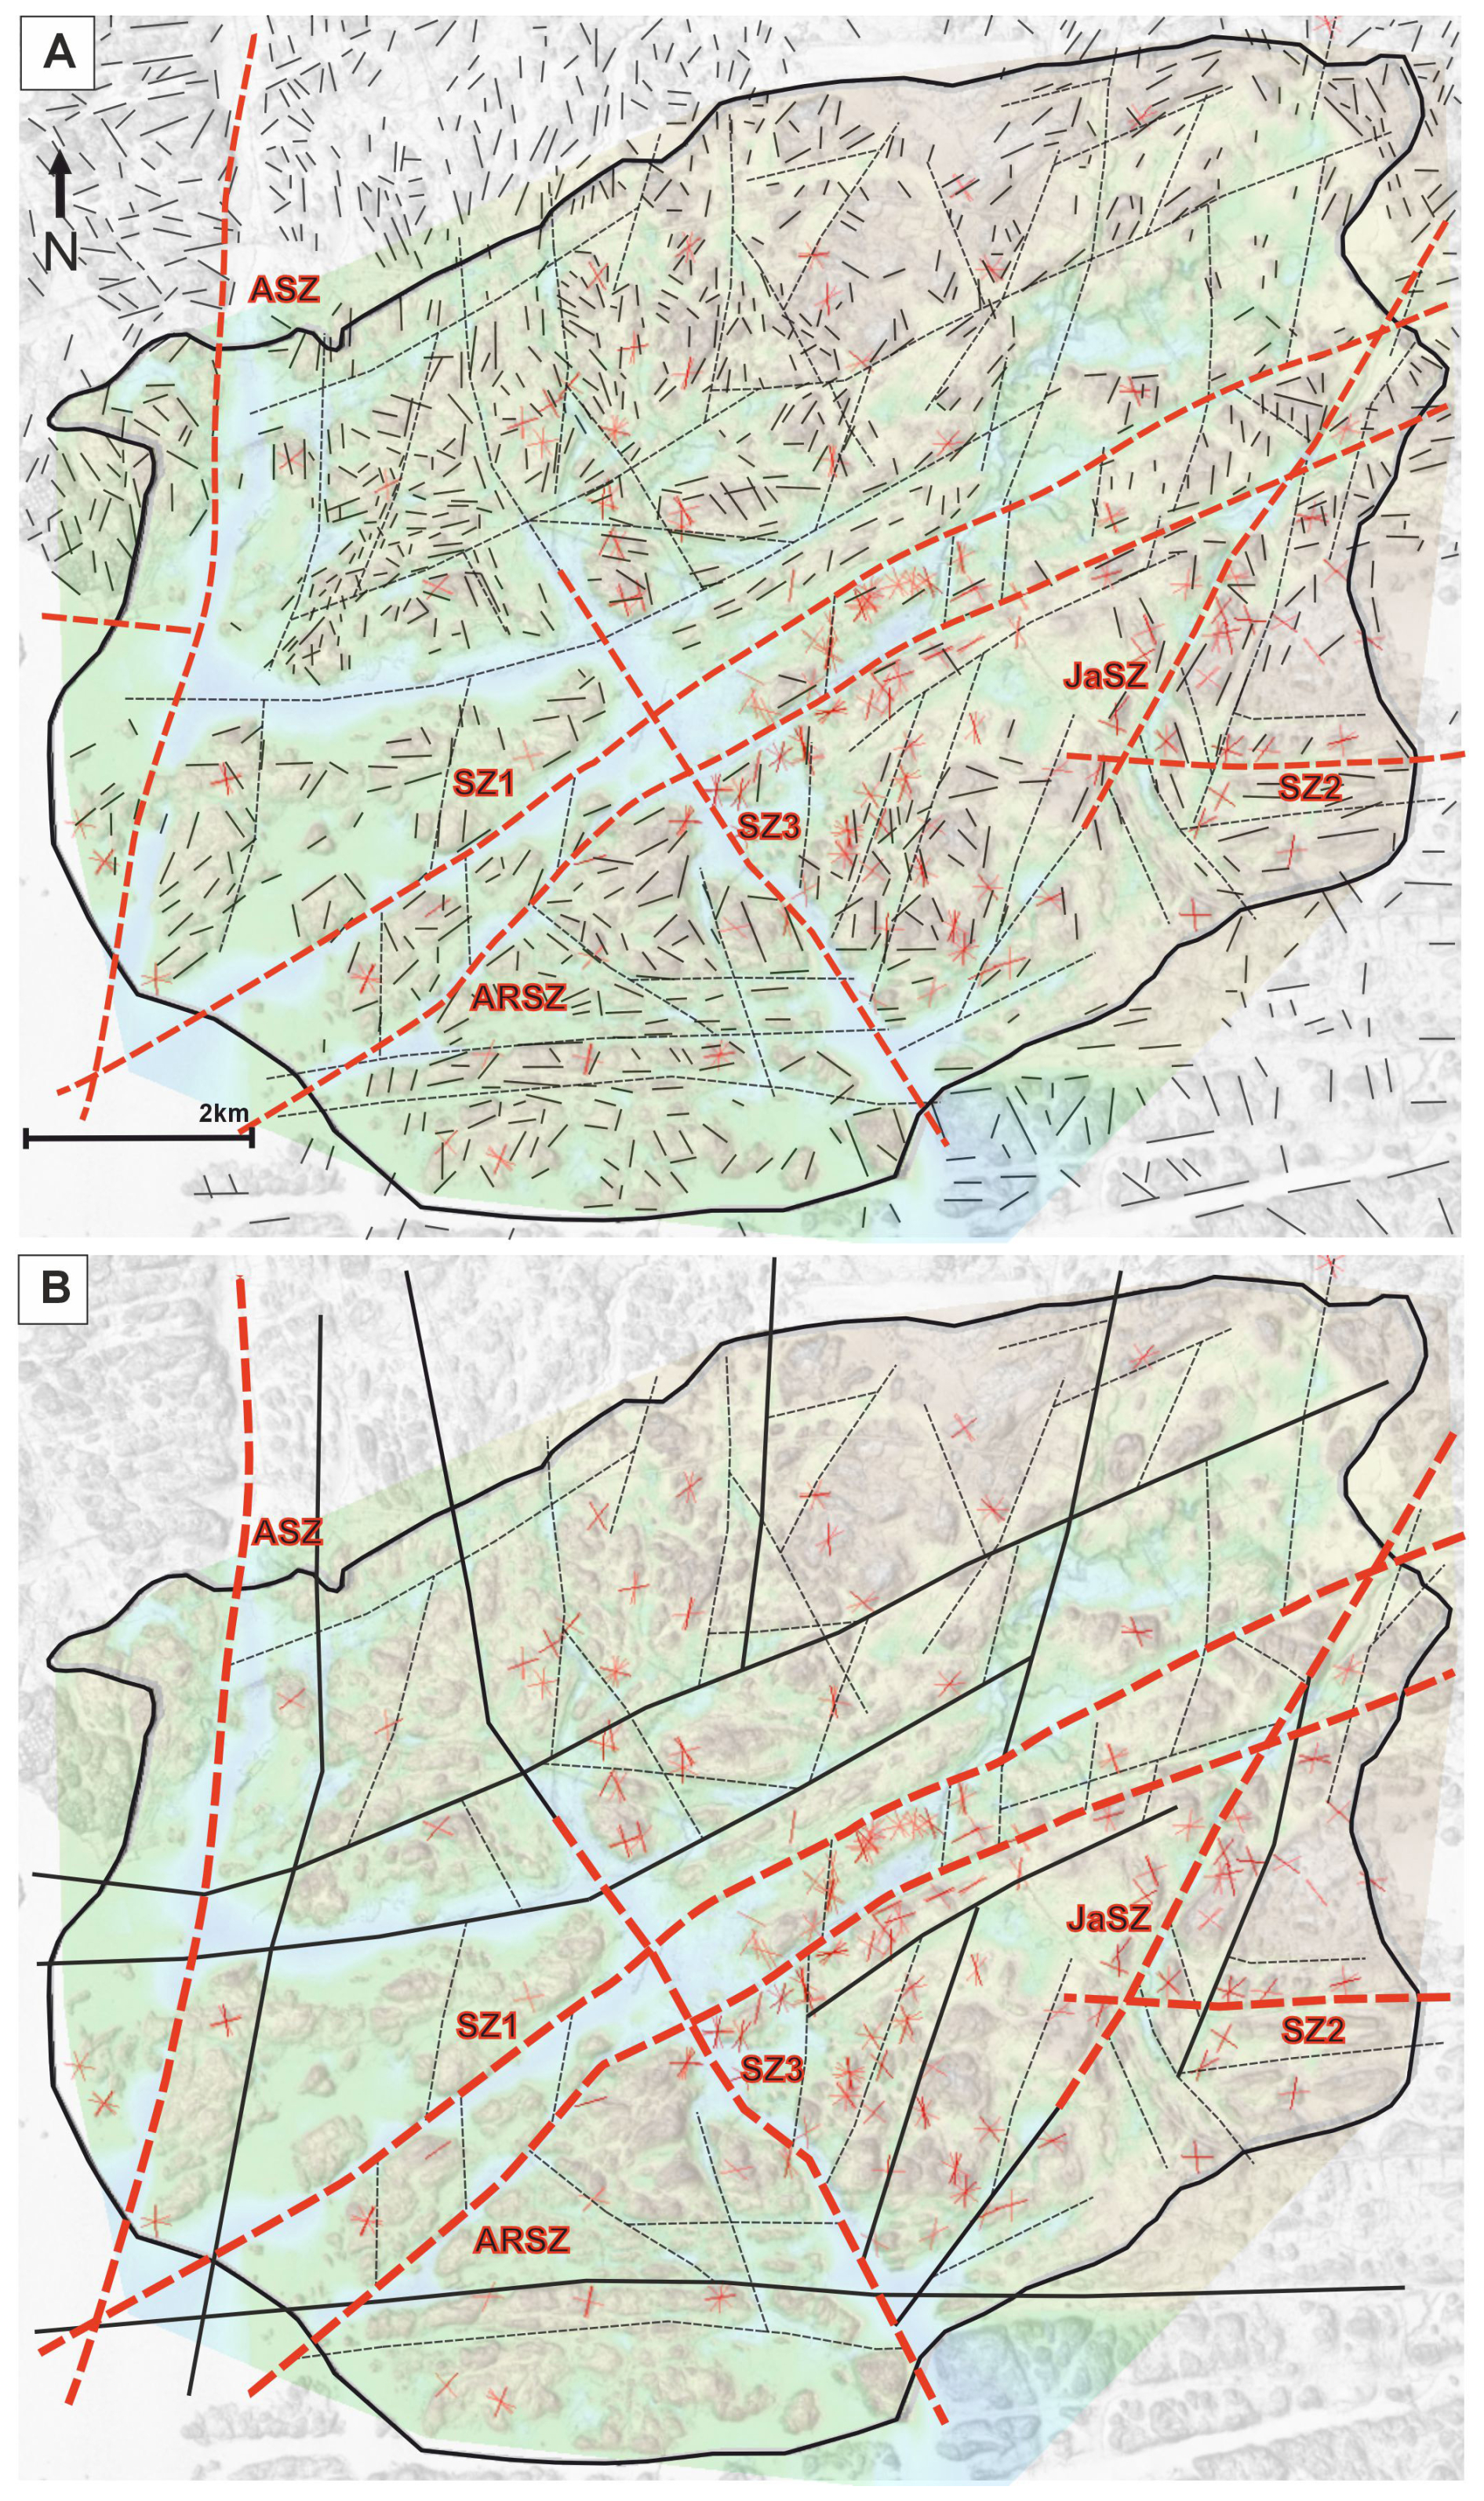
Figure 12(A) Fractures (red lines), LiDAR lineaments (black lines), elongated bedrock depressions (black dashed lines) and brittle shear zones (red dashed lines) visualised together. (B) The network of major brittle structures in the bedrock, including potential shear zones (black bolded lines), distinguished shear zones, elongated bedrock depressions and fractures. Ground surface LiDAR and Bedrock-DEM in the background (transparent colour map equivalent to Fig. 8).
5.2 Structural synthesis: The influence of the brittle structures upon the surface morphology of the bedrock depressions
Our results indicate that the large-scale brittle structures (lineaments and shear zones), particularly the main ENE-striking brittle shear zones, closely correlate with elongated topographic depressions along the eroded bedrock surface identified in the bedrock-DEM. However, the slopes of the bedrock depressions exhibit morphological irregularities at a detailed scale due to prevailing NNE- to NNW-striking tension fractures within the brittle shear zones. Figure 12a shows the overall relationship between the LiDAR lineaments, bedrock depressions, and brittle shear zones. This structural relationship is further illustrated in Fig. 12b, which shows the comprehensive network of brittle shear zones (black solid lines) alongside fracture measurements (red lines). In addition, the figure includes distinctive bedrock depressions that were not interpreted as shear zones (black dashed lines) due to their weaker contrast in bedrock elevation and/or discontinuous character.
The ductile framework of bedrock in southwestern Finland is characterised by ∼ NE–SW-striking foliation (Väisänen and Hölttä, 1999), and ∼ E- and ∼ NE-striking shear zone patterns (Nordbäck et al., 2023; Torvela and Ehlers, 2010; Väisänen and Skyttä, 2007). The bedrock-DEM reveals that the bedrock depressions along the ENE- and NW-striking brittle shear zones are wider than the narrow, sharply defined depressions along the NNE- to NE-striking zones. This observation suggests that brittle deformation localised along pre-existing ductile shear zones was more distributed than deformation along the brittle shear zones lacking such precursors. Consequently, reactivation of inherited ductile fabrics produced wider damage zones with more extensively fragmented bedrock. The NNE to NE-striking bedrock depressions tend to terminate against the continuous ENE-striking depressions. The deepest parts of the bedrock elevation are at the intersections of two or more bedrock depressions and are underlain by brittle shear zones.
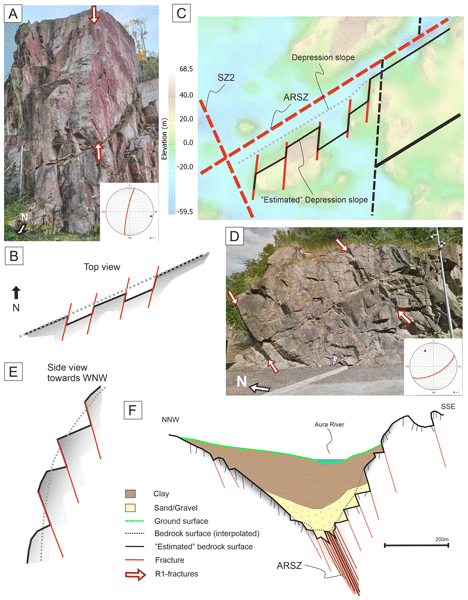
The strikes of the elongate bedrock depressions align with the orientation of the brittle shear zones, whereas the oblique NNW- and NNE-striking fractures control the morphology of the slopes of the bedrock depressions identified near the ARSZ and JaSZ in the T1-DEM and T2-DEM, respectively. Bedrock elevation, particularly along the ARSZ in the T1-DEM, does not increase gradually away from the shear zone but instead forms zigzag patterns on the slopes of the depressions, controlled by the intense NNE-striking fractures (Fig. 13a, b, c). In a cross-sectional/vertical perspective, the bedrock depression slope is characterised by abrupt breaks when the controlling fracture set is subvertical or dips in the opposite direction to the slope (Fig. 13d, e, f). The interpolated bedrock surface in the cross-sections also shows that the SSE-side of the depression wall along the ARSZ and the ESE-side depression wall along the JaSZ are steeper than the respective opposite slopes.
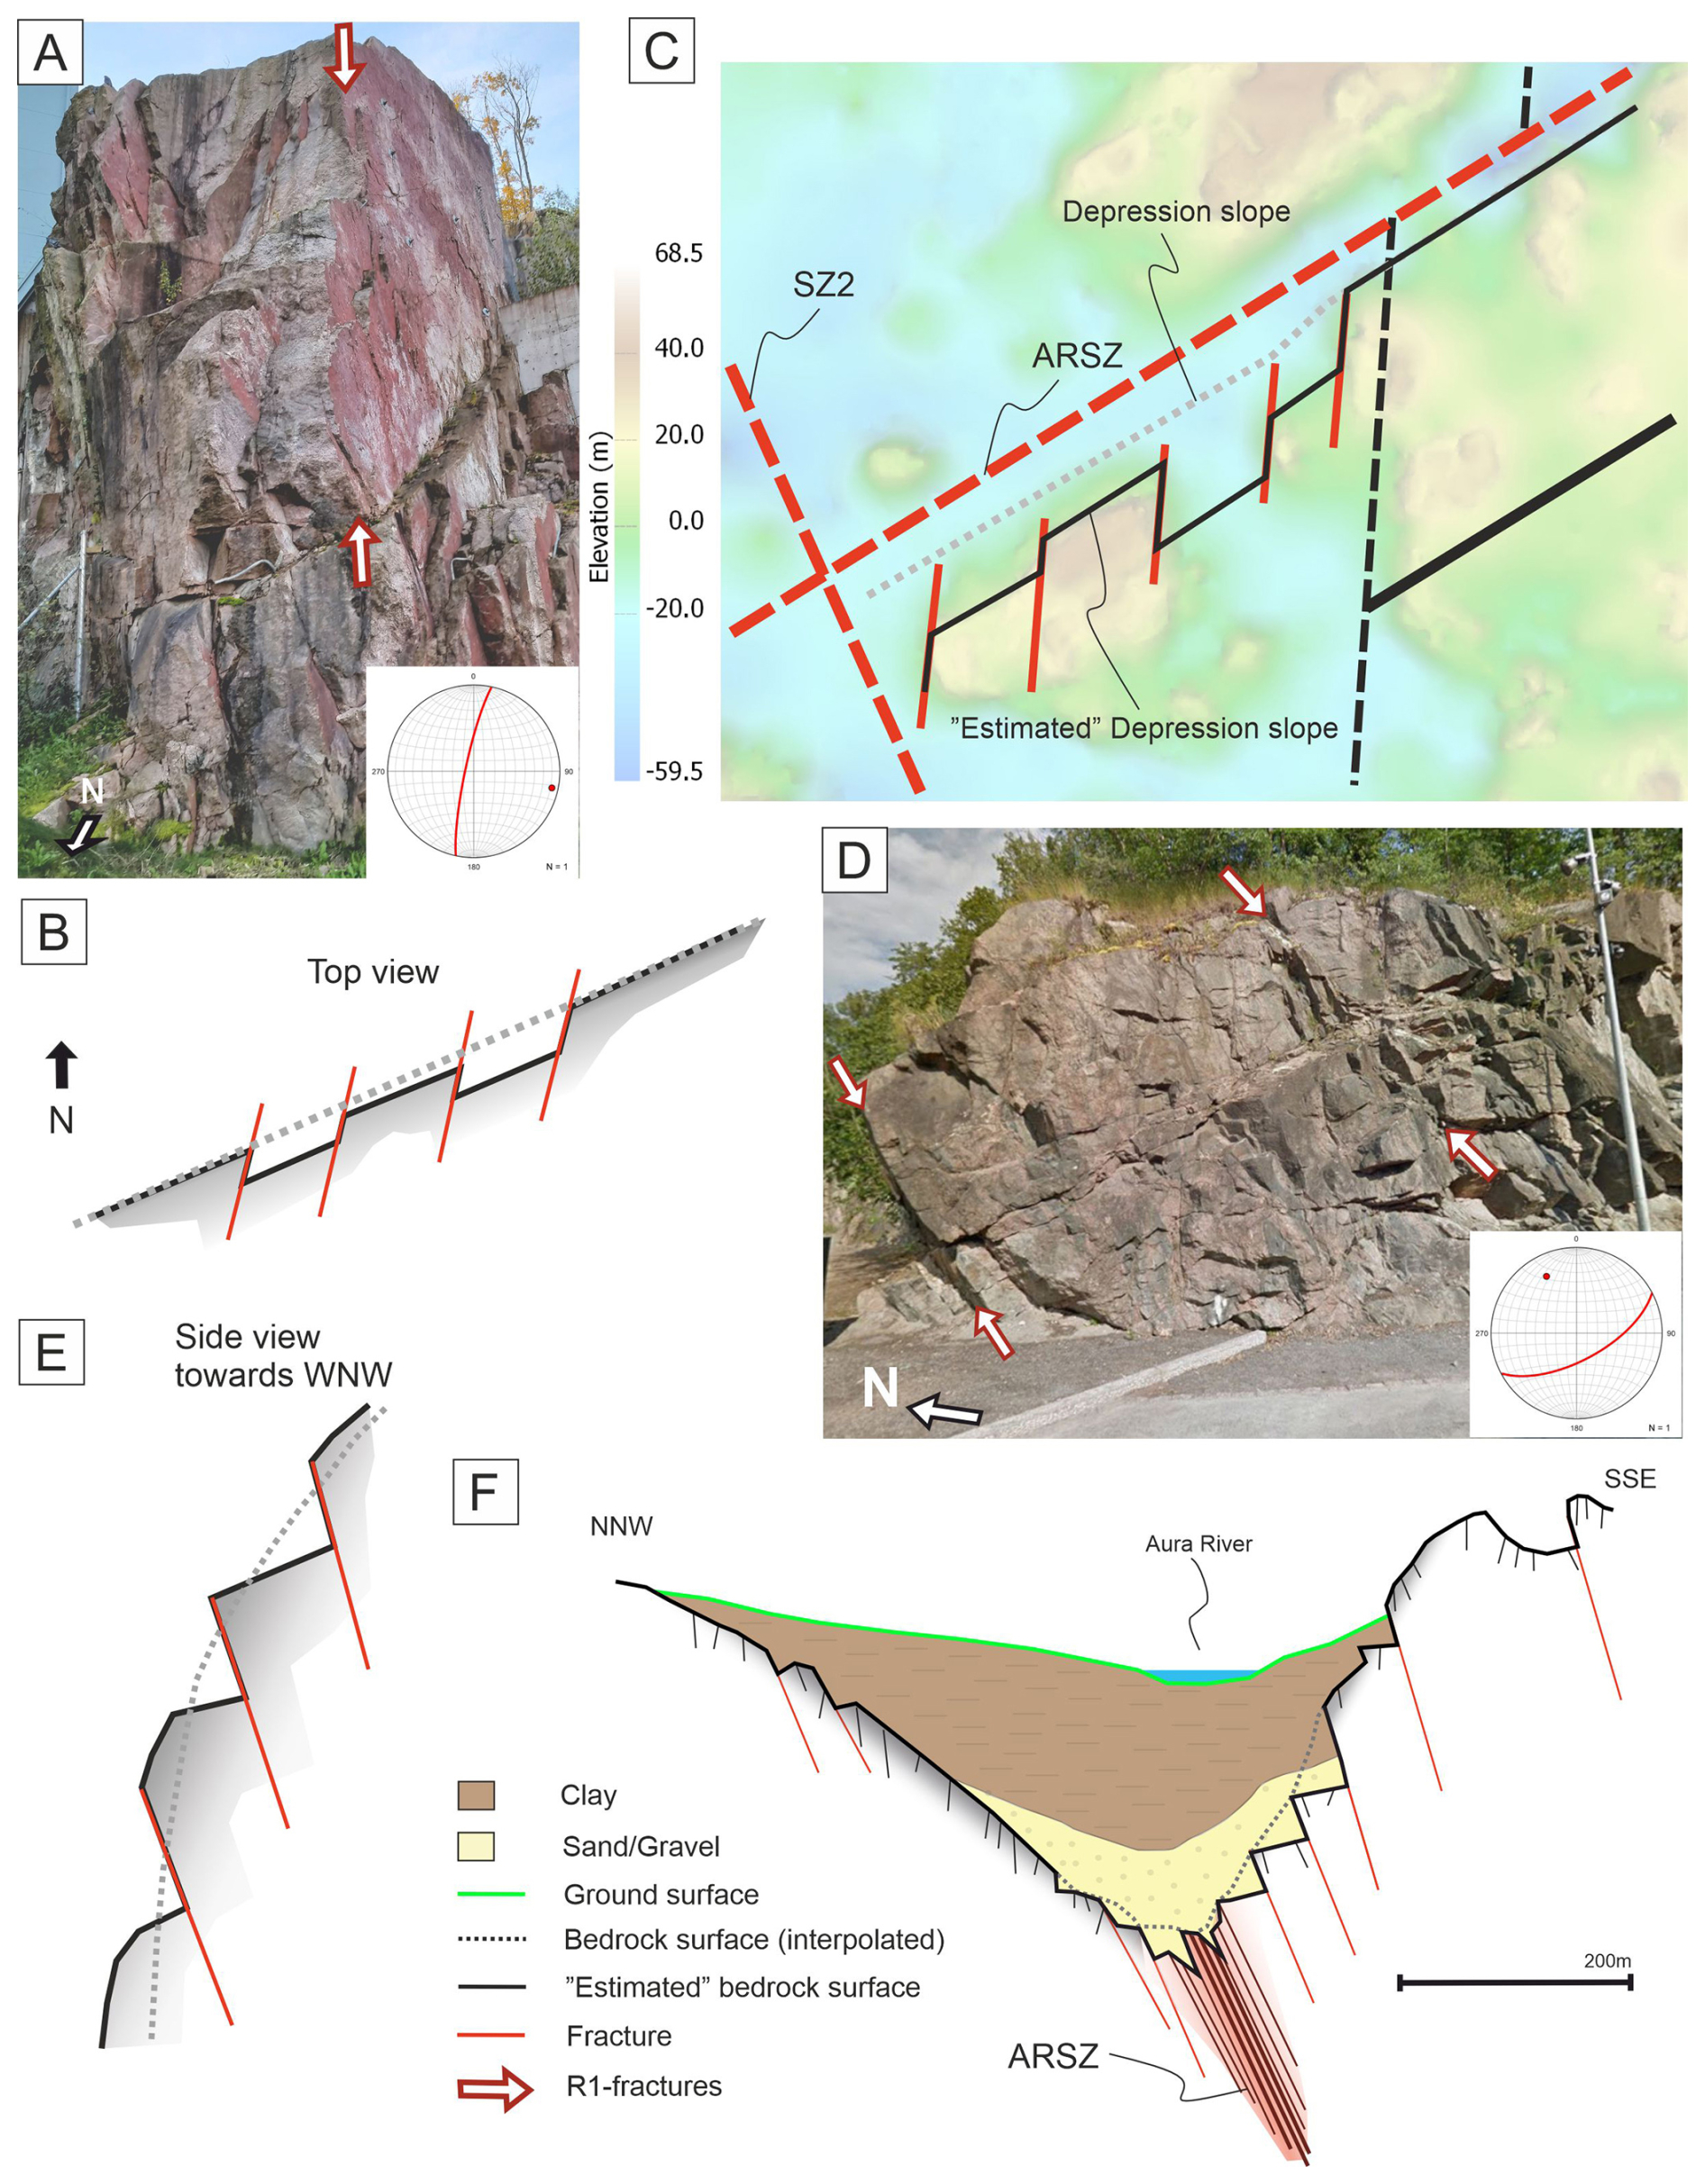
Figure 13(A), (B) and (C) show how fractures control the bedrock surface morphology viewed from the top, and (D), (E) and (F) show it viewed from the side. (A) R1-fracture orientation controls the morphology of the outcrop wall. (B) A simplified sketch to illustrate how the R1-fractures control the outcrop wall in the top view. (C) Interpretation of how fracture-controlled outcrop walls generate “estimated” depression slopes with zig-zag patterns along the ARSZ. (D) R1-fracture orientation controls the morphology of the outcrop wall in the side view. The outcrop is located along Trace 1 on the southeastern side of the ARSZ. (E) A simplified sketch to show how the R1-fractures control the outcrop wall in the side view. (F) A sketch of bedrock depression along the ARSZ shows how the “true” bedrock surface morphology is controlled by subvertical fractures. z-value is exaggerated.
Glacial ripping and quarrying are primary erosion mechanisms that fragment bedrock along fractures in shear zones, creating abrupt surface breaks (Dühnforth et al., 2010; Lane et al., 2015; Bukhari et al., 2021; Skyttä et al., 2023). In Turku, bedrock depressions are wider and deeper along NW-striking shear zones due to their favourable orientation to NW-SE glacial flow, which enhances erosion. ENE-striking depressions, even perpendicular to flow, show deep features possibly from lee-side plucking (Krabbendam and Bradwell, 2011).
The combined influence of pre-existing bedrock structures and glacial erosion processes produces a complex bedrock surface morphology. The interpolation method applied in this study yields more precise results in areas of high-elevation bedrock surface, but similar accuracy cannot be achieved along the elongated bedrock depression due to insufficient data points. Therefore, multi-scale structural analysis provides important, albeit often indirect, constraints on the morphology of the bedrock surface within these depressions. Integrating structural geological information with interpolation results enables the construction of a more geologically and structurally realistic bedrock-DEM, particularly in areas where direct observations are sparse.
The bedrock surface is highly irregular, with elevation variations up to +100 m, and is distinguished by elongated depressions aligned with brittle shear zones. The ARSZ and SZ1 are continuous, ENE-striking shear zones with ductile precursors, whereas JaSZ and SZ3 are oriented NNE and NW, respectively. The orientation distribution of LiDAR lineaments correlates with the brittle shear zones, with 46 % of lineaments parallel to them. Bedrock depth increases at depression intersections, such as along the ARSZ, where the maximum bedrock depth of −59.5 m above sea level is observed. At the outcrop scale, fractures predominantly strike N–S, with two separated sets of NNE- and NNW-striking fractures determined within the damage zones of ARSZ and JaSZ. Outside these zones, fracture orientations tend to align more closely with the ductile structural framework. Secondary fracturing induced by slip along shear zones produces these NNE- and NNW-oriented fractures that contribute to irregular, zigzagging slopes and steep bedrock faces. Fractures with dips of 75 to 90° increase surface roughness and induce abrupt topographical variations. The true bedrock surface appears more irregular and tens of metres higher than the interpolated bedrock DEMs because small-scale structural features remain unresolved. Our multiscale structural analysis improves understanding of how fracture orientations affect depression asymmetry and helps develop a more precise bedrock model suitable for geological and engineering investigations.
Technical drill data is not publicly available due to municipal regulations in Turku, Raisio and Kaarina. Data on structural measurements and elevation models of the bedrock surface are available upon reasonable request from the main author.
ER: design of the study, methodology, fieldwork, data acquisition, data interpretation, writing the original draft, drafting of figures. PS: design of the study, methodology, fieldwork, data acquisition, data interpretation, writing. KA: design of the study, methodology, data interpretation, writing. NN: fieldwork, data acquisition, data interpretation, writing. PB: fieldwork, data acquisition, data interpretation, writing. KN: fieldwork, data acquisition, writing.
The contact author has declared that none of the authors has any competing interests.
Publisher's note: Copernicus Publications remains neutral with regard to jurisdictional claims made in the text, published maps, institutional affiliations, or any other geographical representation in this paper. The authors bear the ultimate responsibility for providing appropriate place names. Views expressed in the text are those of the authors and do not necessarily reflect the views of the publisher.
We thank the people of the Structural Geology Group in Turku who participate in the field mapping. We further acknowledge the reviews by two anonymous reviewers, Karin Högdahl, and the editorial handling by Christoph von Hagke.
This research has been supported by the Maa- ja Vesitekniikan Tuki Ry (grant no. 19-9906-10).
This paper was edited by Christoph von Hagke and reviewed by K. Högdahl and two anonymous referees.
Ahlqvist, K. M., Skyttä, P., Anttila, N., Ojala, A. E., and Ruuska, E.: Recognizing bedrock deformation zones through integrated 3D modelling of bedrock topography and sedimentary deposits, Turku, SW Finland, B. Eng. Geol. Environ., 85, 309, https://doi.org/10.1007/s10064-026-04984-2, 2026.
Bertrand, L., Géraud, Y., Le Garzic, E., Place, J., Diraison, M., Walter, B., and Haffen, S.: A multiscale analysis of a fracture pattern in granite: A case study of the Tamariu granite, Catalunya, Spain, J. Struct. Geol., 78, 52–66, https://doi.org/10.1016/j.jsg.2015.05.013, 2015.
Bogdanova, S., Gorbatschev, R., Skridlaite, G., Soesoo, A., Taran, L., and Kurlovich, D.: Trans-baltic palaeoproterozoic correlations towards the reconstruction of supercontinent Columbia/Nuna, Precambrian Res., 259, 5–33, https://doi.org/10.1016/j.precamres.2014.11.023, 2015.
Bonnet, E., Bour, O., Odling, N. E., Davy, P., Main, I., Cowie, P., and Berkowitz, B.: Scaling of fracture systems in geological media, Rev. Geophys., 39, 347–383, https://doi.org/10.1029/1999RG000074, 2001.
Bukhari, S., Eyles, N., Sookhan, S., Mulligan, R., Paulen, R., Krabbendam, M., and Putkinen, N.: Regional subglacial quarrying and abrasion below hard-bedded palaeo-ice streams crossing the Shield–Palaeozoic boundary of central Canada: the importance of substrate control, Boreas, 50, 781–805, https://doi.org/10.1111/bor.12522, 2021.
Chabani, A., Trullenque, G., Ledésert, B. A., and Klee, J.: Multiscale characterization of fracture patterns: A case study of the Noble Hills Range (Death Valley, CA, USA), application to geothermal reservoirs, Geosciences, 11, 280, https://doi.org/10.3390/geosciences11070280, 2021.
Crider, J. G.: The initiation of brittle faults in crystalline rock, J. Struct. Geol., 77, 159–174, https://doi.org/10.1016/j.jsg.2015.05.001, 2015.
DesRoches, A., Danielescu, S., and Butler, K.: Contrôles structuraux sur les écoulements souterrains d'un aquifère de roche fracturée au droit d'une région agricole au nord-ouest de New Brunswick au Canada, Hydrogeol. J., 22, 1067–1086, https://doi.org/10.1007/s10040-014-1134-0, 2014.
Dichiarante, A. M., McCaffrey, K. J. W., Holdsworth, R. E., Bjørnarå, T. I., and Dempsey, E. D.: Fracture attribute scaling and connectivity in the Devonian Orcadian Basin with implications for geologically equivalent sub-surface fractured reservoirs, Solid Earth, 11, 2221–2244, https://doi.org/10.5194/se-11-2221-2020, 2020.
Dühnforth, M., Anderson, R. S., Ward, D., and Stock, G. M.: Bedrock fracture control of glacial erosion processes and rates, Geology, 38, 423–426, https://doi.org/10.1130/G30576.1, 2010.
Ehlers, C., Lindroos, A., and Selonen, O.: The late Svecofennian granite-migmatite zone of southern Finland: a belt of transpressive deformation and granite emplacement, Precambrian Res., 64, 295–309, https://doi.org/10.1016/0301-9268(93)90083-E, 1993.
Elming, S. Å. and Mattsson, H.: Post Jotnian basic intrusions in the Fennoscandian Shield, and the break up of Baltica from Laurentia: a palaeomagnetic and AMS study, Precambrian Res., 108, 215–236, https://doi.org/10.1016/S0301-9268(01)00131-0, 2001.
Eyles, N.: Rock drumlins and megaflutes of the Niagara Escarpment, Ontario, Canada: a hard bed landform assemblage cut by the Saginaw-Huron Ice Stream, Quaternary Sci. Rev., 55, 34–49, https://doi.org/10.1016/j.quascirev.2012.09.001, 2012.
Geological Survey of Finland (GTK): Aeromagnetic anomaly map of Finland, Version 1.0, HAKKU data service, https://hakku.gtk.fi/fi/locations?id=6 (last access: 20 May 2026), 2016.
Geological Survey of Finland (GTK): Bedrock of Finland 1:200 000: Version 2.3, HAKKU data service, https://hakku.gtk.fi/fi/locations?id=2 (last access: 20 May 2026), 2022.
Glasser, N. F., Crawford, K. R., Hambrey, M. J., Bennett, M. R., and Huddart, D.: Lithological and structural controls on the surface wear characteristics of glaciated metamorphic bedrock surfaces: Ossian Sarsfjellet, Svalbard, J. Geol., 106, 319–329, https://doi.org/10.1086/516025, 1998.
Glasser, N. F., Roman, M., Holt, T. O., Žebre, M., Patton, H., and Hubbard, A. L.: Modification of bedrock surfaces by glacial abrasion and quarrying: Evidence from North Wales, Geomorphology, 365, 107283, https://doi.org/10.1016/j.geomorph.2020.107283, 2020.
Gleeson, T. and Novakowski, K.: Identifying watershed-scale barriers to groundwater flow: Lineaments in the Canadian Shield, Geol. Soc. Am. Bull., 121, 333–347, https://doi.org/10.1130/B26241.1, 2009.
Hall, A. M. and Gillespie, M. R.: Fracture controls on valley persistence: the Cairngorm Granite pluton, Scotland, Int. J. Earth Sci., 106, 2203–2219, https://doi.org/10.1007/s00531-016-1423-z, 2017.
Hamdani, N. and Baali, A.: Fracture network mapping using Landsat 8 OLI data and linkage with the karst system: a case study of the Moroccan Central Middle Atlas, Remote Sens. Earth Syst. Sci., 2, 1–17, 2019.
Hardebol, N. J., Maier, C., Nick, H., Geiger, S., Bertotti, G., and Boro, H.: Multiscale fracture network characterization and impact on flow: A case study on the Latemar carbonate platform, J. Geophys. Res.-Sol. Ea., 120, 8197–8222, https://doi.org/10.1002/2015JB011879, 2015.
Härme, M.: Suomen geologinen yleiskartta: kivilajikartan selitys [The General Geological Map of Finland], Lehti (Sheet) B1, Turku, Geological Survey of Finland (Geologinen tutkimuslaitos), Helsinki, 78 pp., https://hakku.gtk.fi/fi/publications?id=2396 (last access: 20 May 2026), 1960.
Heffer, K. and Bevan, T.: Scaling relationships in natural fractures: Data, theory, and application, in: SPE Annual Conference and Exhibition, the Hague, Netherlands, SPE-20981-MS, https://doi.org/10.2118/20981-MS, 1990.
Hermansson, T., Stephens, M. B., Corfu, F., Page, L. M., and Andersson, J.: Migratory tectonic switching, western Svecofennian orogen, central Sweden: Constraints from U/Pb zircon and titanite geochronology, Precambrian Res., 161, 250–278, https://doi.org/10.1016/j.precamres.2007.08.008, 2008.
Hietanen, A.: Archean geology of the Turku district in southwestern Finland, Geol. Soc. Am. Bull., 58, 1019–1084, 1947.
Hietanen, A.: Generation of potassium-poor magmas in the northern Sierra Nevada and the Svecofennian in Finland, J. Res. U.S. Geol. Surv., 3, 631–645, 1975.
Kähkönen, Y.: Svecofennian supracrustal rocks, in: Precambrian Geology of Finland, edited by: Lehtinen, M., Nurmi, P. A., and Rämö, O. T., Elsevier, Amsterdam, 343–405, https://doi.org/10.1016/S0166-2635(05)80009-X, 2005.
Kirkpatrick, J. D., Bezerra, F. H. R., Shipton, Z. K., Do Nascimento, A. F., Pytharouli, S. I., Lunn, R. J., and Soden, A. M.: Scale-dependent influence of pre-existing basement shear zones on rift faulting: A case study from NE Brazil, J. Geol. Soc., 170, 237–247, https://doi.org/10.1144/jgs2012-043, 2013.
Krabbendam, M. and Bradwell, T.: Lateral plucking as a mechanism for elongate erosional glacial bedforms: explaining megagrooves in Britain and Canada, Earth Surf. Proc. Land., 36, 1335–1349, https://doi.org/10.1002/esp.2157, 2011.
Krabbendam, M., Hall, A. M., Palamakumbura, R. M., and Finlayson, A.: Glaciotectonic disintegration of roches moutonnées during glacial ripping in east Sweden, Geogr. Ann. A, 104, 35–56, https://doi.org/10.1080/04353676.2021.2022356, 2022.
Kurhila, M., Vaasjoki, M., Mänttäri, I., Rämö, T., and Nironen, M.: U-Pb ages and Nd isotope characteristics of the late-orogenic, migmatizing microcline granites in southwestern Finland, B. Geol. Soc. Finland, 77, 105–128, https://doi.org/10.17741/bgsf/77.2.002, 2005.
Lahtinen, R., Korja, A., Nironen, M., and Heikkinen, P.: Palaeoproterozoic accretionary processes in Fennoscandia, Geol. Soc. Spec. Publ., 318, 237–256, https://doi.org/10.1144/SP318.8, 2009.
Lane, T. P., Roberts, D. H., Rea, B. R., Ó Cofaigh, C., and Vieli, A.: Controls on bedrock bedform development beneath the Uummannaq Ice Stream onset zone, West Greenland, Geomorphology, 231, 301–313, https://doi.org/10.1016/j.geomorph.2014.12.019, 2015.
Mancktelow, N. S. and Pennacchioni, G.: The control of precursor brittle fracture and fluid-rock interaction on the development of single and paired ductile shear zones, J. Struct. Geol., 27, 645–661, https://doi.org/10.1016/j.jsg.2004.12.001, 2005.
Marrett, R., Ortega, O. J., and Kelsey, C. M.: Extent of power-law scaling for natural fractures in rock, Geology, 27, 799–802, https://doi.org/10.1130/0091-7613(1999)027<0799:EOPLSF>2.3.CO;2, 1999.
Mattila, J. and Viola, G.: New constraints on 1.7 Gyr of brittle tectonic evolution in southwestern Finland derived from a structural study at the site of a potential nuclear waste repository (Olkiluoto Island), J. Struct. Geol., 67, 50–74, https://doi.org/10.1016/j.jsg.2014.07.003, 2014.
National Land Survey of Finland (NLS): Laser scanning data of ground surface (LiDAR), https://www.maanmittauslaitos.fi/ (last access: 20 May 2026), 2026.
Niemelä, J., Stén, C.-G., Taka, M., and Winterhalter, B.: Turun-Salon seudun maaperä [Quaternary deposits in the Turku-Salo map-sheet areas], Suomen geologinen kartta 1:100 000, maaperäkarttojen selitykset, sheets 1043 and 2021, Geological Survey of Finland, Espoo, 83 pp. + 3 appendices, ISBN 951-690-263-4, 1987.
Nironen, M.: The Svecofennian Orogen: A tectonic model, Precambrian Res., 86, 21–44, https://doi.org/10.1016/S0301-9268(97)00039-9, 1997.
Nordbäck, N., Mattila, J., Zwingmann, H., and Viola, G.: Precambrian fault reactivation revealed by structural and K-Ar geochronological data from the spent nuclear fuel repository in Olkiluoto, southwestern Finland, Tectonophysics, 824, 229208, https://doi.org/10.1016/j.tecto.2022.229208, 2022.
Nordbäck, N., Ovaskainen, N., Markovaara-Koivisto, M., Skyttä, P., Ojala, A., Engström, J., and Nixon, C.: Multiscale mapping and scaling analysis of the censored brittle structural framework within the crystalline bedrock of southern Finland, B. Geol. Soc. Finland, 95, 5–32, https://doi.org/10.17741/bgsf/95.1.001, 2023.
Nordbäck, N., Skyttä, P., Engström, J., Ovaskainen, N., Mattila, J., and Aaltonen, I.: Mesoproterozoic strike-slip faulting within the Åland Rapakivi Batholith, southwestern Finland, Tektonika, 2, 1–26, https://doi.org/10.55575/tektonika2024.2.1.51, 2024.
Nyberg, B., Nixon, C. W., and Sanderson, D. J.: NetworkGT: A GIS tool for geometric and topological analysis of two-dimensional fracture networks, Geosphere, 14, 1618–1634, 2018.
Oliver, M. A. and Webster, R.: Kriging: a method of interpolation for geographical information systems, Int. J. Geogr. Inf. Syst., 4, 313–332, 1990.
Ovaskainen, N., Nordbäck, N., Skyttä, P., and Engström, J.: A new subsampling methodology to optimize the characterization of two-dimensional bedrock fracture networks, J. Struct. Geol., 155, 104528, https://doi.org/10.1016/j.jsg.2022.104528, 2022.
Peacock, D. C. P. and Sanderson, D. J.: Structural analyses and fracture network characterisation: Seven pillars of wisdom, Earth-Sci. Rev., 184, 13–28, 2018.
Regenauer-Lieb, K. and Yuen, D. A.: Multiscale brittle-ductile coupling and genesis of slow earthquakes, Pure Appl. Geophys., 165, 523–543, https://doi.org/10.1007/s00024-008-0326-8, 2008.
Ruuska, E., Skyttä, P., Putkinen, N., and Valjus, T.: Contribution of bedrock structures to the bedrock surface topography and groundwater flow systems within deep glaciofluvial aquifers in Kurikka, Western Finland, Earth Surf. Proc. Land., 48, 2039–2056, https://doi.org/10.1002/esp.5602, 2023.
Saintot, A., Stephens, M. B., Viola, G., and Nordgulen, Ø.: Brittle tectonic evolution and paleostress field reconstruction in the southwestern part of the Fennoscandian Shield, Forsmark, Sweden, Tectonics, 30, TC4002, https://doi.org/10.1029/2010TC002716, 2011.
Samsu, A., Cruden, A. R., Micklethwaite, S., Grose, L., and Vollgger, S. A.: Scale matters: The influence of structural inheritance on fracture patterns, J. Struct. Geol., 130, 103896, https://doi.org/10.1016/j.jsg.2019.103896, 2020.
Sanderson, D. J. and Nixon, C. W.: The use of topology in fracture network characterization, J. Struct. Geol., 72, 55–66, https://doi.org/10.1016/j.jsg.2015.01.005, 2015.
Scott, D. N. and Wohl, E. E.: Bedrock fracture influences on geomorphic process and form across process domains and scales, Earth Surf. Proc. Land., 44, 27–45, https://doi.org/10.1002/esp.4473, 2019.
Simelius, C.: Airiston hiertovyöhyke – Duktiilista deformaatiosta hauraiden rakenteiden ympäristöksi, MS thesis, Department of Geography and Geology, University of Turku, Turku, Finland, 93 pp., https://utuvolter.fi/discovery/fulldisplay?docid=alma9916053225405971&context=L&vid=358FIN_UTUR:VU1&lang=fi&search_scope=MyInst_and_CI&adaptor=Local Search Engine&tab=Everything&query=any,contains,simelius&offset=20 (last access: 6 October 2026), 2013.
Skyttä, P., Kinnunen, J., Palmu, J. P., and Korkka-Niemi, K.: Bedrock structures controlling the spatial occurrence and geometry of 1.8 Ga younger glaciofluvial deposits: example from First Salpausselkä, southern Finland, Global Planet. Change, 135, 66–82, https://doi.org/10.1016/j.gloplacha.2015.10.007, 2015.
Skyttä, P., Nordbäck, N., Ojala, A., Putkinen, N., Aaltonen, I., Engström, J., Mattila, J., and Ovaskainen, N.: The interplay of bedrock fractures and glacial erosion in defining the present-day land surface topography in mesoscopically isotropic crystalline rocks, Earth Surf. Proc. Land., 48, 1956–1968, https://doi.org/10.1002/esp.5596, 2023.
Skyttä, P. and Torvela, T.: Brittle reactivation of ductile precursor structures: The role of incomplete structural transposition at a nuclear waste disposal site, Olkiluoto, Finland, J. Struct. Geol., 116, 253–259, https://doi.org/10.1016/j.jsg.2018.06.009, 2018.
Suominen, V.: The chronostratigraphy of southwestern Finland with special reference to Postjotnian and Subjotnian diabases, Geol. Surv. Finland Bull., Geological Survey of Finland, Espoo, 356, 100 pp., ISBN 951-690-452-1, 1991.
Torvela, T. and Ehlers, C.: From ductile to brittle deformation: Structural development and strain distribution along a crustal-scale shear zone in SW Finland, Int. J. Earth Sci., 99, 1133–1152, https://doi.org/10.1007/s00531-009-0451-3, 2010.
Torvela, T. and Kurhila, M.: Timing of syn-orogenic, high-grade transtensional shear zone formation in the West Uusimaa Complex, Finland, B. Geol. Soc. Finland, 94, 5–22, https://doi.org/10.17741/bgsf/94.1.001, 2022.
Torvela, T., Mänttäri, I., and Hermansson, T.: Timing of deformation phases within the South Finland shear zone, SW Finland, Precambrian Res., 160, 277–298, https://doi.org/10.1016/j.precamres.2007.08.002, 2008.
Väisänen, M. and Hölttä, P.: Structural and metamorphic evolution of the Turku migmatite complex, southwestern Finland, B. Geol. Soc. Finland, 71, 177–218, 1999.
Väisänen, M. and Skyttä, P.: Late Svecofennian shear zones in southwestern Finland, Geological Society of Sweden, 129, 55–64, https://doi.org/10.1080/11035890701291055, 2007.
Viola, G., Venvik Ganerød, G., Wahlgren, C.-H., and Olesen, O.: Deconvoluting complex structural histories archived in brittle fault zones, Nat. Commun., 7, 13448, https://doi.org/10.1038/ncomms13448, 2016.