the Creative Commons Attribution 4.0 License.
the Creative Commons Attribution 4.0 License.
 | 02 Aug 2019
Extrusion dynamics of deepwater volcanoes revealed by 3-D seismic data
Christopher A.-L. Jackson
Craig Magee
Samuel J. Mitchell
Xinong Xie
Submarine volcanism accounts for ca. 75 % of the Earth's volcanic activity. Yet difficulties with imaging their exteriors and interiors mean that the extrusion dynamics and erupted volumes of deepwater volcanoes remain poorly understood. Here, we use high-resolution 3-D seismic reflection data to examine the external and internal geometry and extrusion dynamics of two late Miocene–Quaternary deepwater (> 2 km emplacement depth) volcanoes buried beneath 55–330 m of sedimentary strata in the South China Sea. The volcanoes have crater-like bases, which truncate underlying strata and suggest extrusion was initially explosive, and erupted lava flows that feed lobate lava fans. The lava flows are > 9 km long and contain lava tubes that have rugged basal contacts defined by m high erosional ramps. We suggest the lava flows eroded down into and were emplaced within wet, unconsolidated, near-seafloor sediments. Extrusion dynamics were likely controlled by low magma viscosities as a result of increased dissolved H2O due to high hydrostatic pressure and soft, near-seabed sediments, which are collectively characteristic of deepwater environments. We calculate that long-runout lava flows account for 50 %–97 % of the total erupted volume, with a surprisingly minor component (∼3 %–50 %) being preserved in the main volcanic edifice. Accurate estimates of erupted volumes therefore require knowledge of volcano and lava basal surface morphology. We conclude that 3-D seismic reflection data are a powerful tool for constraining the geometry, volumes, and extrusion dynamics of ancient or active deepwater volcanoes and lava flows.
- Article
(15233 KB) - Full-text XML
- BibTeX
- EndNote


The external morphology of volcanoes and their eruptive products reflect, and provide insights into, the processes controlling magma extrusion and volcano construction (e.g. Walker, 1993; Planke et al., 2000; Grosse and Kervyn, 2018). By collecting high-resolution quantitative data on the morphology of modern volcanic edifices and surrounding lava flows from airborne–shuttle radar topography or time-lapse multibeam bathymetry, we can estimate erupted volumes, at least for individual eruptive episodes (e.g. Holcomb et al., 1988; Walker, 1993; Goto and McPhie, 2004; Cocchi et al., 2016; Somoza et al., 2017; Allen et al., 2018; Chadwick et al., 2018; Grosse and Kervyn, 2018). Whilst remote sensing data capture the external morphology of volcanoes and lava flows both before, during, and after eruptions, they do not image their basal surface or internal architecture. Without access to the full 3-D structure of these extrusive systems, it is difficult to assess the accuracy of estimated volumes of total erupted materials over multiple eruptive episodes and thus to test long-term volcano growth and lava emplacement models.
Several studies demonstrate that seismic reflection data can be used to map the external morphology and internal architecture of buried volcanoes in 3-D (e.g. Planke et al., 2000; Calvès et al., 2011; Jackson, 2012; Magee et al., 2013; Arnulf et al., 2014, 2018; Reynolds et al., 2017). To date, most seismic-based studies have focused on volcanoes formed in subaerial or shallow-marine environments (e.g. Planke et al., 2000; Jackson, 2012; Magee et al., 2013; Keen et al., 2014; Reynolds et al., 2018), although seismic reflection surveys have been used to image the shallowly buried flanks of deepwater volcanoes (e.g. Funck et al., 1996). The 3-D geometry, internal structure, and volume of deepwater volcanoes thus remain poorly documented. Without such information on the structure of deepwater volcanoes, we cannot assess how they grow or what hazards they may pose (e.g. tsunamis induced by flank collapse, seabed deformation, and instability induced by highly explosive eruptions).
We use high-resolution 3-D seismic reflection data to examine the external morphology and internal architecture of two late Miocene–Quaternary submarine volcanoes that were emplaced in deep water (> 2.0 km) on highly stretched continental crust in the northern South China Sea (Fig. 1). The volcanoes and associated lava flows are now buried by a ∼55–330 m thick sedimentary succession (Fig. 1). These two volcanoes are physically isolated and appear to have been fed by independent, sub-volcanic intrusive bodies (i.e. sills; see below); we can thus confidently characterize each individual volcano and its associated lava flows (Fig. 1b). By interpreting volcano and lava flow 3-D structure, distribution, and size, we aim to determine extrusion dynamics, calculate accurate erupted volumes, and relate our findings to modern deepwater volcanoes using bathymetry and remote sensing data. We show that the basal surfaces of these volcanic edifices and lava flows are erosive, with 50 %–97 % of the total erupted material hosted within the lava flows; i.e. the volcano edifices only comprise a small portion of the total erupted volume. We suggest that the high hydrostatic pressure of the deepwater environment controlled melt H2O content and internal lava viscosity, effusion rate, and consequently volcano and lava flow morphology and runout distance. Our results also show that erupted volumes calculated from airborne–shuttle radar topography or time-lapse multibeam bathymetry data, without knowledge of the detailed geometry of the basal surfaces of the lava flows and the volcanoes themselves, may be grossly underestimated, particularly if extrusion was explosive and/or involved erosion of the seabed.
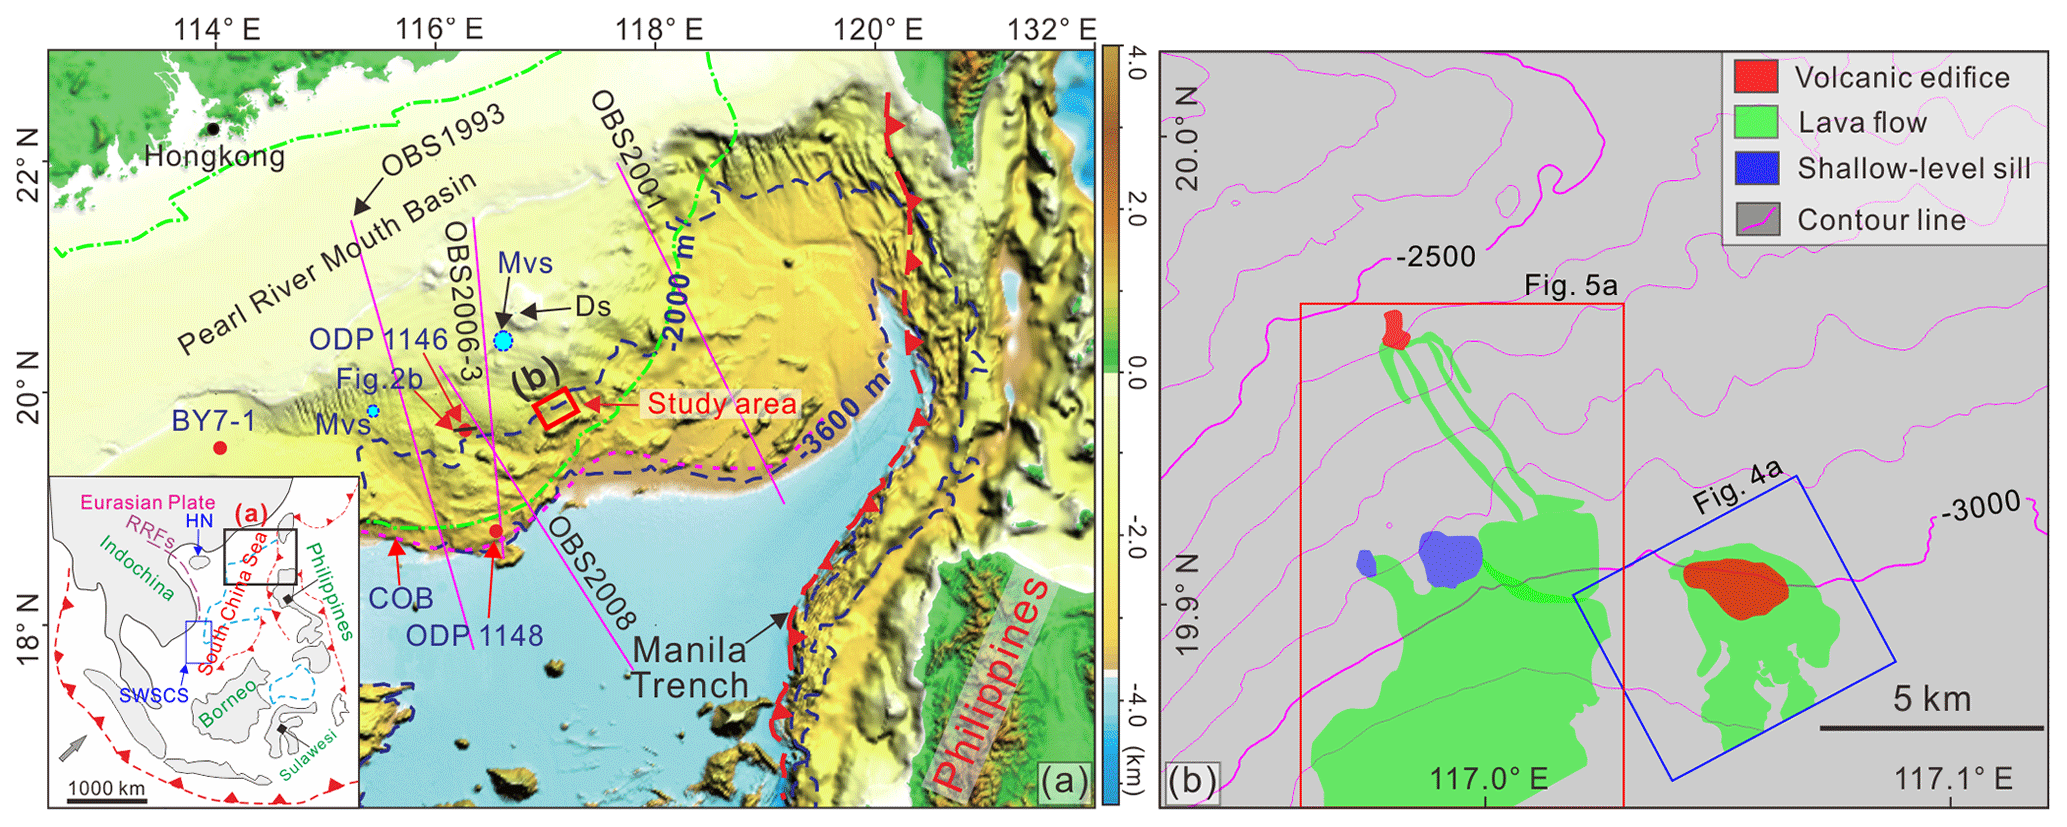
Figure 1Geological setting of the study area. (a) Inset: regional setting of the South China Sea that is bounded by the Red River strike-slip faults (RRFs) to the west and by the subduction trench (Manila Trench) to the east. The island of Hainan (HN; Tu et al., 1991; Shi et al., 2011) and the southwestern South China Sea (SWSCS; Li et al., 2013) in which the magmatism has similar ages as the studied volcanoes labelled in blue. (a) The study area (marked with red square) is located to the south of Dongsha Islands (labelled Ds). The green dashed line outlines the boundary of the Pearl River Mouth basin. Locations of boreholes (red dots; exploration well BY7-1 and ODP sites 1146 and 1148), crustal structure profiles (purple solid lines; OBS1993, Yan et al., 2001; OBS2001, Wang et al., 2006; OBS2006-3, Wei et al., 2011; OBS2008, Chiu, 2010), and mud volcanoes (Mvs) (light blue dots; Sun et al., 2012; Yan et al., 2017) are labelled. Ds – Dongsha Islands; COB – continent–ocean boundary (adopted from Sibuet et al., 2016). The base map is modified from Yang et al. (2015); (b) seabed morphologies of the study area. Distributions of volcano edifices (red), sills (blue), lava flows (green), and locations of Figs. 4a and 5a are labelled. The contour lines are in 100 ms (two-way travel time).
The study area is located south of the Pearl River Mouth basin, on the northern, highly stretched continental crust of the South China Sea (Franke, 2013; Zhao et al., 2016) (Fig. 1a). The South China Sea was an area of subduction in the late Mesozoic, before the onset of continental rifting and subsequent seafloor spreading (∼33–15 Ma) in the Cenozoic (e.g. Taylor and Hayes, 1983; Briais et al., 1993; Franke et al., 2014; Li et al., 2014; Z. Sun et al., 2014; Ding and Li, 2016). A lack of seaward-dipping reflections (SDRs) and low volumes of rift-related igneous rocks suggest that the northern part of the South China Sea is a magma-poor margin (e.g. Clift et al., 2001; Yan et al., 2006; Cameselle et al., 2017). Seafloor spreading ceased at ∼15 Ma (Li et al., 2014), with post-rift thermal cooling driving subsidence of the northern South China Sea margin since the early Miocene (Ru and Pigott, 1986; Yu, 1994). During this phase of thermal subsidence, the Dongsha Event (∼5.3 Ma) occurred, which involved widespread uplift and normal faulting (e.g. Lüdmann et al., 2001). Several mechanisms may have triggered the Dongsha Event, including the collision between Taiwan and the East Asian continent (Lüdmann et al., 2001; Hall, 2002), isostatic rebound (Zhao et al., 2012), post-rift magmatism (Franke, 2013), lithospheric bending (Wu et al., 2014), and/or subduction of the South China Sea beneath the Philippine Sea plate (Xie et al., 2017).
Post-spreading magmatism in the South China Sea may reflect the ascent of magma triggered by subduction of the South China Sea along the Manila Trench and collision with Taiwan (Lüdmann et al., 2001), convective removal of continental lithosphere by warm a asthenosphere (Lester et al., 2014), or magma ascent from a high-velocity layer in the lower crust fed by the Hainan mantle plume (Xia et al., 2016; Fan et al., 2017). Volcanoes generated by post-rift magmatism in the early Miocene and Quaternary were emplaced both onshore and offshore (e.g. Zou et al., 1995; Yan et al., 2006; Franke, 2013; Li et al., 2014; Q. L. Sun et al., 2014; Zhao et al., 2014, 2016; Fan et al., 2017), with the latter typically extruded onto the continental slope in relatively shallow water depths (< 300 m; Yan et al., 2006; Zhao et al., 2016). Boreholes reveal that these shallow-water volcanoes are composed of basalt, dacite, and rhyolitic tuff (Li and Liang, 1994; Yan et al., 2006; Zhao et al., 2016). In addition to the onshore and shallow-water volcanoes, several volcanoes were emplaced further basinwards on the continental slope in deeper water, close to the continent–ocean boundary (COB; Fig. 1) (Clift et al., 2001; Wang et al., 2006; Cameselle et al., 2017). We examine two of these deepwater volcanoes, which are situated in an area currently characterized by water depths of 1850–2680 m and are now buried beneath sedimentary strata up to 330 m thick (Fig. 1). Micropalaeontological data from the Pearl River Mouth basin (Xu et al., 1995; Qin, 1996), and microfauna data from ODP borehole sites 1146 and 1148 indicate that middle Miocene (16.5 Ma) to Holocene nanofossil-bearing clays overlying the volcanoes were deposited in a deepwater setting (1.0–3.0 km; Wang et al., 2000).
2.1 Data and methods
We use a time-migrated 3-D seismic reflection survey acquired in 2012 covering an area of ∼350 km2 (Fig. 1b). The seismic data are zero-phase processed and displayed with SEG (Society of Exploration Geophysicists) normal polarity, whereby a downward increase in acoustic impedance (a function of rock velocity and density) corresponds to a positive reflection event (red on seismic profiles) (e.g. Brown, 2004). The in-line and cross-line spacings are 25 m. The seismic data have a dominant frequency in the interval of interest (i.e. 0–400 ms two-way time – twt) of ∼40 Hz.
Stacking velocities are not available for the survey and no wells intersect the studied late Miocene–Quaternary buried deepwater volcanic features. We thus have no direct observations of the composition or velocities of the seismically imaged volcanic materials. Depth conversion of volcano edifice and lava flow thickness measurements in milliseconds (twt) to metres is therefore based on velocity estimates, which introduces some uncertainty into our erupted volume calculations. To derive a reasonable velocity estimate, we use velocity data obtained from boreholes (i.e. BY7-1 and U1431) (Li et al., 2015; Zhao et al., 2016) and OBS (ocean bottom seismometer) profiles (Yan et al., 2001; Wang et al., 2006; Chiu, 2010; Wei et al., 2011) in the South China Sea. The boreholes, which are situated > 300 km away from our study area, intersect buried basaltic volcanoes with P-wave velocities of ∼4.5 km s−1 (BY7-1; Zhao et al., 2016) and ∼3.0–5.0 km s−1 (IODP U1431; Li et al., 2015). OBS profiles reveal that submarine volcanoes located 140 km from the study area (Fig. 1a) typically have P-wave velocities of > 3.0 km s−1 and occasionally up to ∼5.5 km s−1 (Yan et al., 2001; Wang et al., 2006; Chiu, 2010; Wei et al., 2011). These P-wave velocities of ∼3.0–5.5 km s−1 are consistent with P-wave velocity data for shallow-water, mafic volcanoes located offshore of western India (∼3.3–5.5 km s−1; Calvès et al., 2011) and southern Australia in the Bight (∼2.4–6.7 km s−1, with an average velocity of 4.0 km s−1; Magee et al., 2013) and Bass (∼2.2–4.0 km s−1, with an average of 3.0 km s−1; Reynolds et al., 2018) basins. Based on these velocity data, we assume the imaged volcanic deposits here have mafic compositions and P-wave velocities of 4.0 (±1.0) km s−1. It is important to note that using a range of estimated velocities does not affect our calculation of the relative amount of material contained within volcanic edifices versus the flanking lava flows.
We calculate a vertical resolution (λ∕4) of ∼10 m for the sedimentary strata overlying the volcanic materials, given a dominant frequency of 40 Hz and assuming a seismic velocity of 2.2 km s−1 for the nanofossil-bearing clay (based on seismic refraction profile OBS1993, Yan et al., 2001; OBS2001, Wang et al., 2006; OBS2006-3, Wei et al., 2011). The calculated vertical resolution for the volcanic materials is 19–31 m based on a dominant frequency of 40 Hz and estimated seismic velocities of 4.0 (±1.0) km s−1. The top and base of volcanic structures can be distinguished in seismic reflection data when their thickness is greater than the estimated vertical resolution (i.e. 19–31 m) (Brown, 2004). Volcanic structures with thicknesses below the vertical resolution, but above the detection limit (i.e. –16 m), are imaged as tuned reflection packages whereby reflections from their top and base contacts interfere on their return to the surface and cannot be distinguished (Brown, 2004). The lava flows we image are typically > 2 seismic reflections thick (> 41±10 m), suggesting they too are thicker than the tuning thickness and are represented by discrete top and basal reflections (Tables 1–3).
Table 1Dimensions of volcano edifices.

* Diameter and dip are average values.
Table 2Dimensions of lava flow apron.

* Diameter is calculated from the area as a circle. V – volcano edifice.
We used a regional 2-D seismic profile and interpreted four seismic surfaces tied to ODP site 1146, which is located ∼65 km west of the study area (Figs. 1a, 2), and two horizons locally mappable around the volcanoes: T0 (∼2.58 Ma), T1 (∼5.3 Ma), TRa (∼6.5 Ma), TRb (∼8.2 Ma), TM (top of the volcanic material), and BM (base of the volcanic material). The youngest age of the volcanoes and associated lava flows is determined using the first seismic reflection that onlaps or overlies them (Fig. 3). After mapping TM and BM, we calculated the volumes of the volcanic features (Tables 1–4), with errors largely arising from uncertainties in the velocities (4.0±1.0 km s−1) used to undertake the depth conversion (see above).
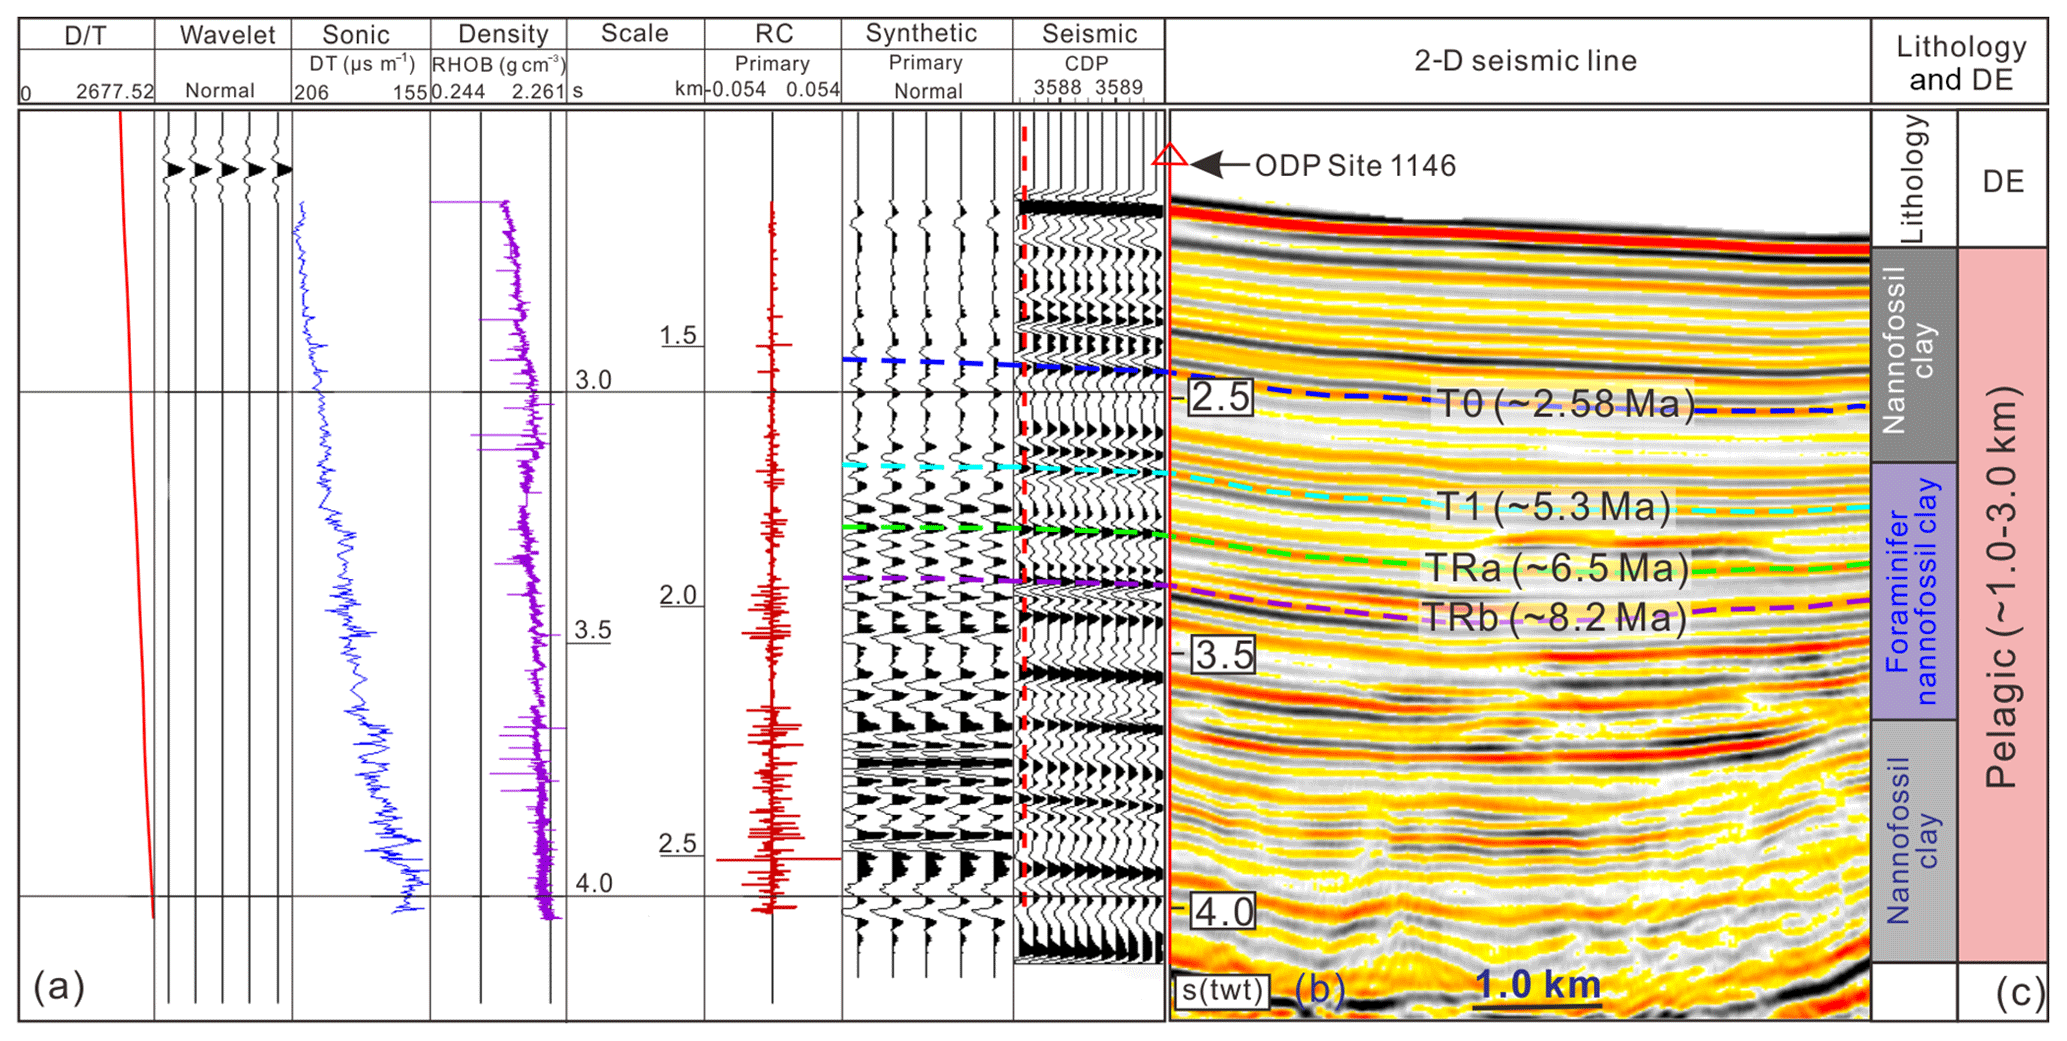
Figure 2(a) Synthetic seismogram of ODP site 1146 (modified from Sun et al., 2017); D∕T – depth/time; DT – interval transit time; RHOB – lithologic density; RC – reflection coefficient; (b) seismic profile crossing through ODP site 1146. The four seismic surfaces (T0, ∼2.58 Ma; T1, ∼5.3 Ma; TRa, ∼6.5 Ma; and TRb, ∼8.2 Ma) are labelled; (c) lithology and depositional environment (DE) of ODP site 1146 (modified from Wang et al., 2000, and Clift et al., 2001).
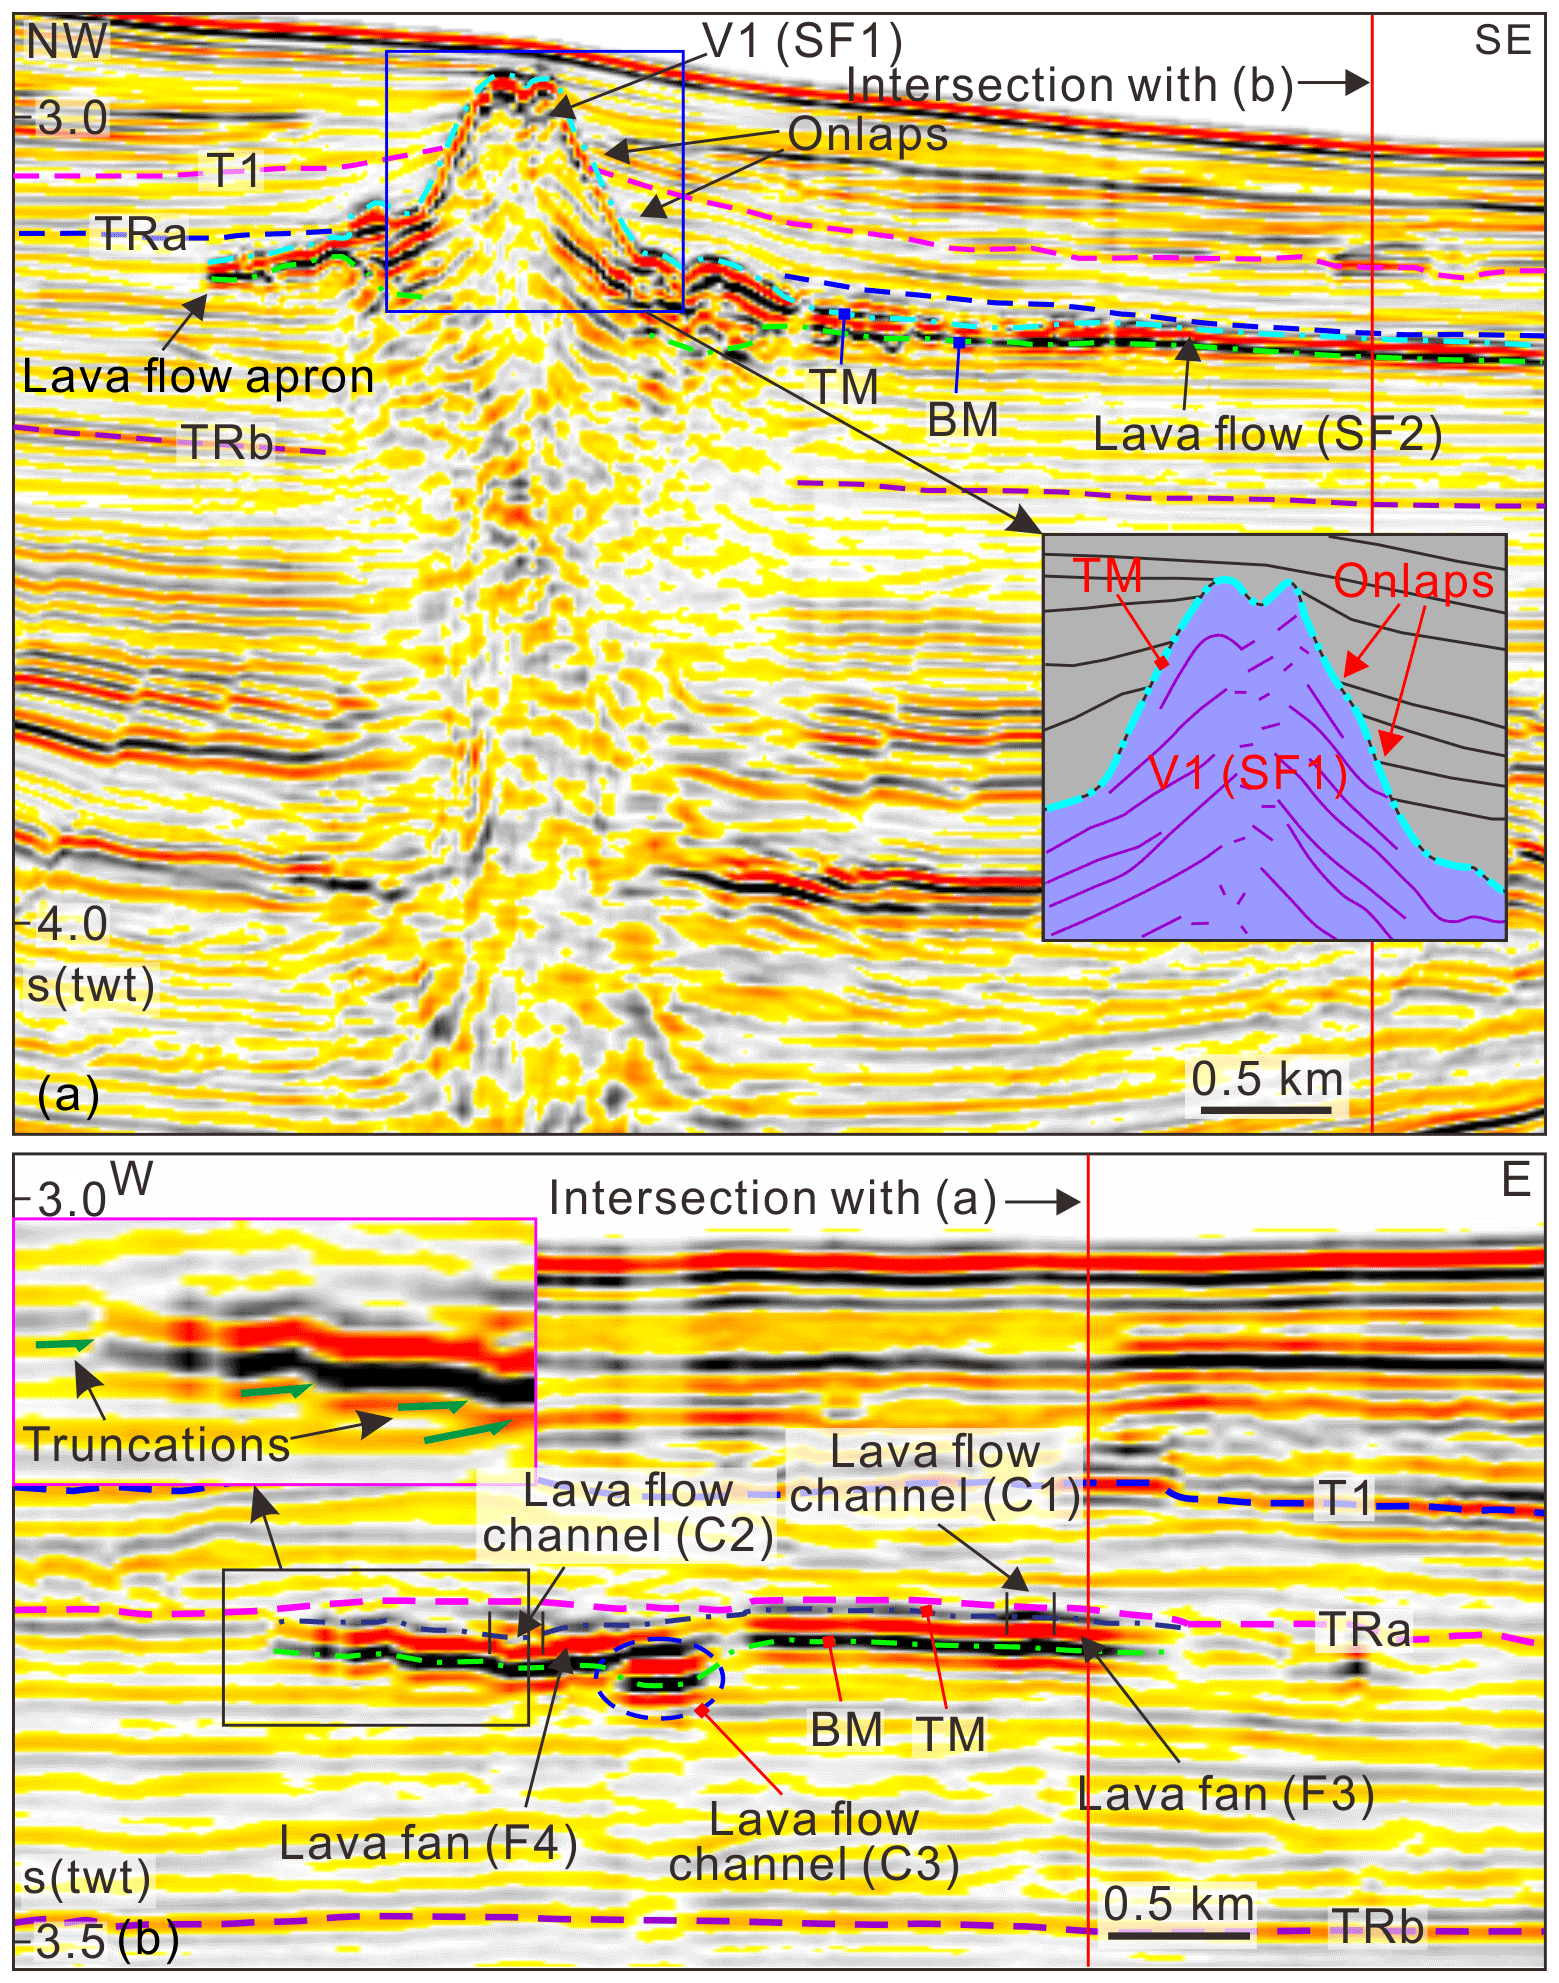
Figure 3Seismic characteristics of a deepwater volcano (V1) and associated lava flow channels and fans. (a) Seismic profile cross-cuts the volcano edifice and associated lava flow; (b) seismic profile cross-cuts the lava flow (enhanced seismic anomalies). TM – top of volcano–lava flow; BM – base of volcano–lava flow. See locations of seismic profiles in Fig. 4.
Root mean square (RMS) amplitude extractions and slices through a variance volume were used to constrain the geometry, scale, and distribution of the submarine volcanoes (Figs. 3–8). The RMS amplitude attribute computes the square root of the sum of squared amplitudes, divided by the number of samples within the specified window used; put simply, the RMS attribute measures the reflectivity of a given thickness of seismic data (Fig. 4a) (Brown, 2004). The variance attribute is free of interpreter bias because it is directly derived from the processed data (Fig. 5). Variance measures the variability in shape between seismic traces; this can be done in a specified window along a picked horizon or within a full 3-D seismic volume. Variance is typically used to map structural and stratigraphic discontinuities related to, for example, faults and channels (Brown, 2004).

Figure 4(a, b) RMS amplitude map (±30 ms along the surface BM) and its interpretations. Volcanic apron, lava flow channels, and fans are labelled. See map location in Fig. 1b. Red lines in panel (a) show locations of seismic profiles in Fig. 3.
3.1 Observations
We identify three main types of seismic structures and associated facies related to these buried deepwater volcanoes. (1) The first is Seismic Facies 1 (SF1), which are two (V1 and V2) conical-shaped features up to ∼202 ms twt ( m) thick, which internally are weakly to moderately reflective or chaotic with distinguished reflections downlapping onto BM, capped by a positive polarity, high-amplitude reflection (TM) onlapped by overlying strata (Figs. 3a, 7) (2) The second is Seismic Facies 2 (SF2), which are ribbon-like, broadly strata-concordant, high-amplitude, positive polarity reflections that emanate from the conical structures (SF1) and extend up to ∼9.2 km downslope (Figs. 3a–b, 6–7). and (3) The third is Seismic Facies 3 (SF3), which are saucer-shaped, strata-discordant, high-amplitude reflections situated beneath SF1 and SF2 (Fig. 6).
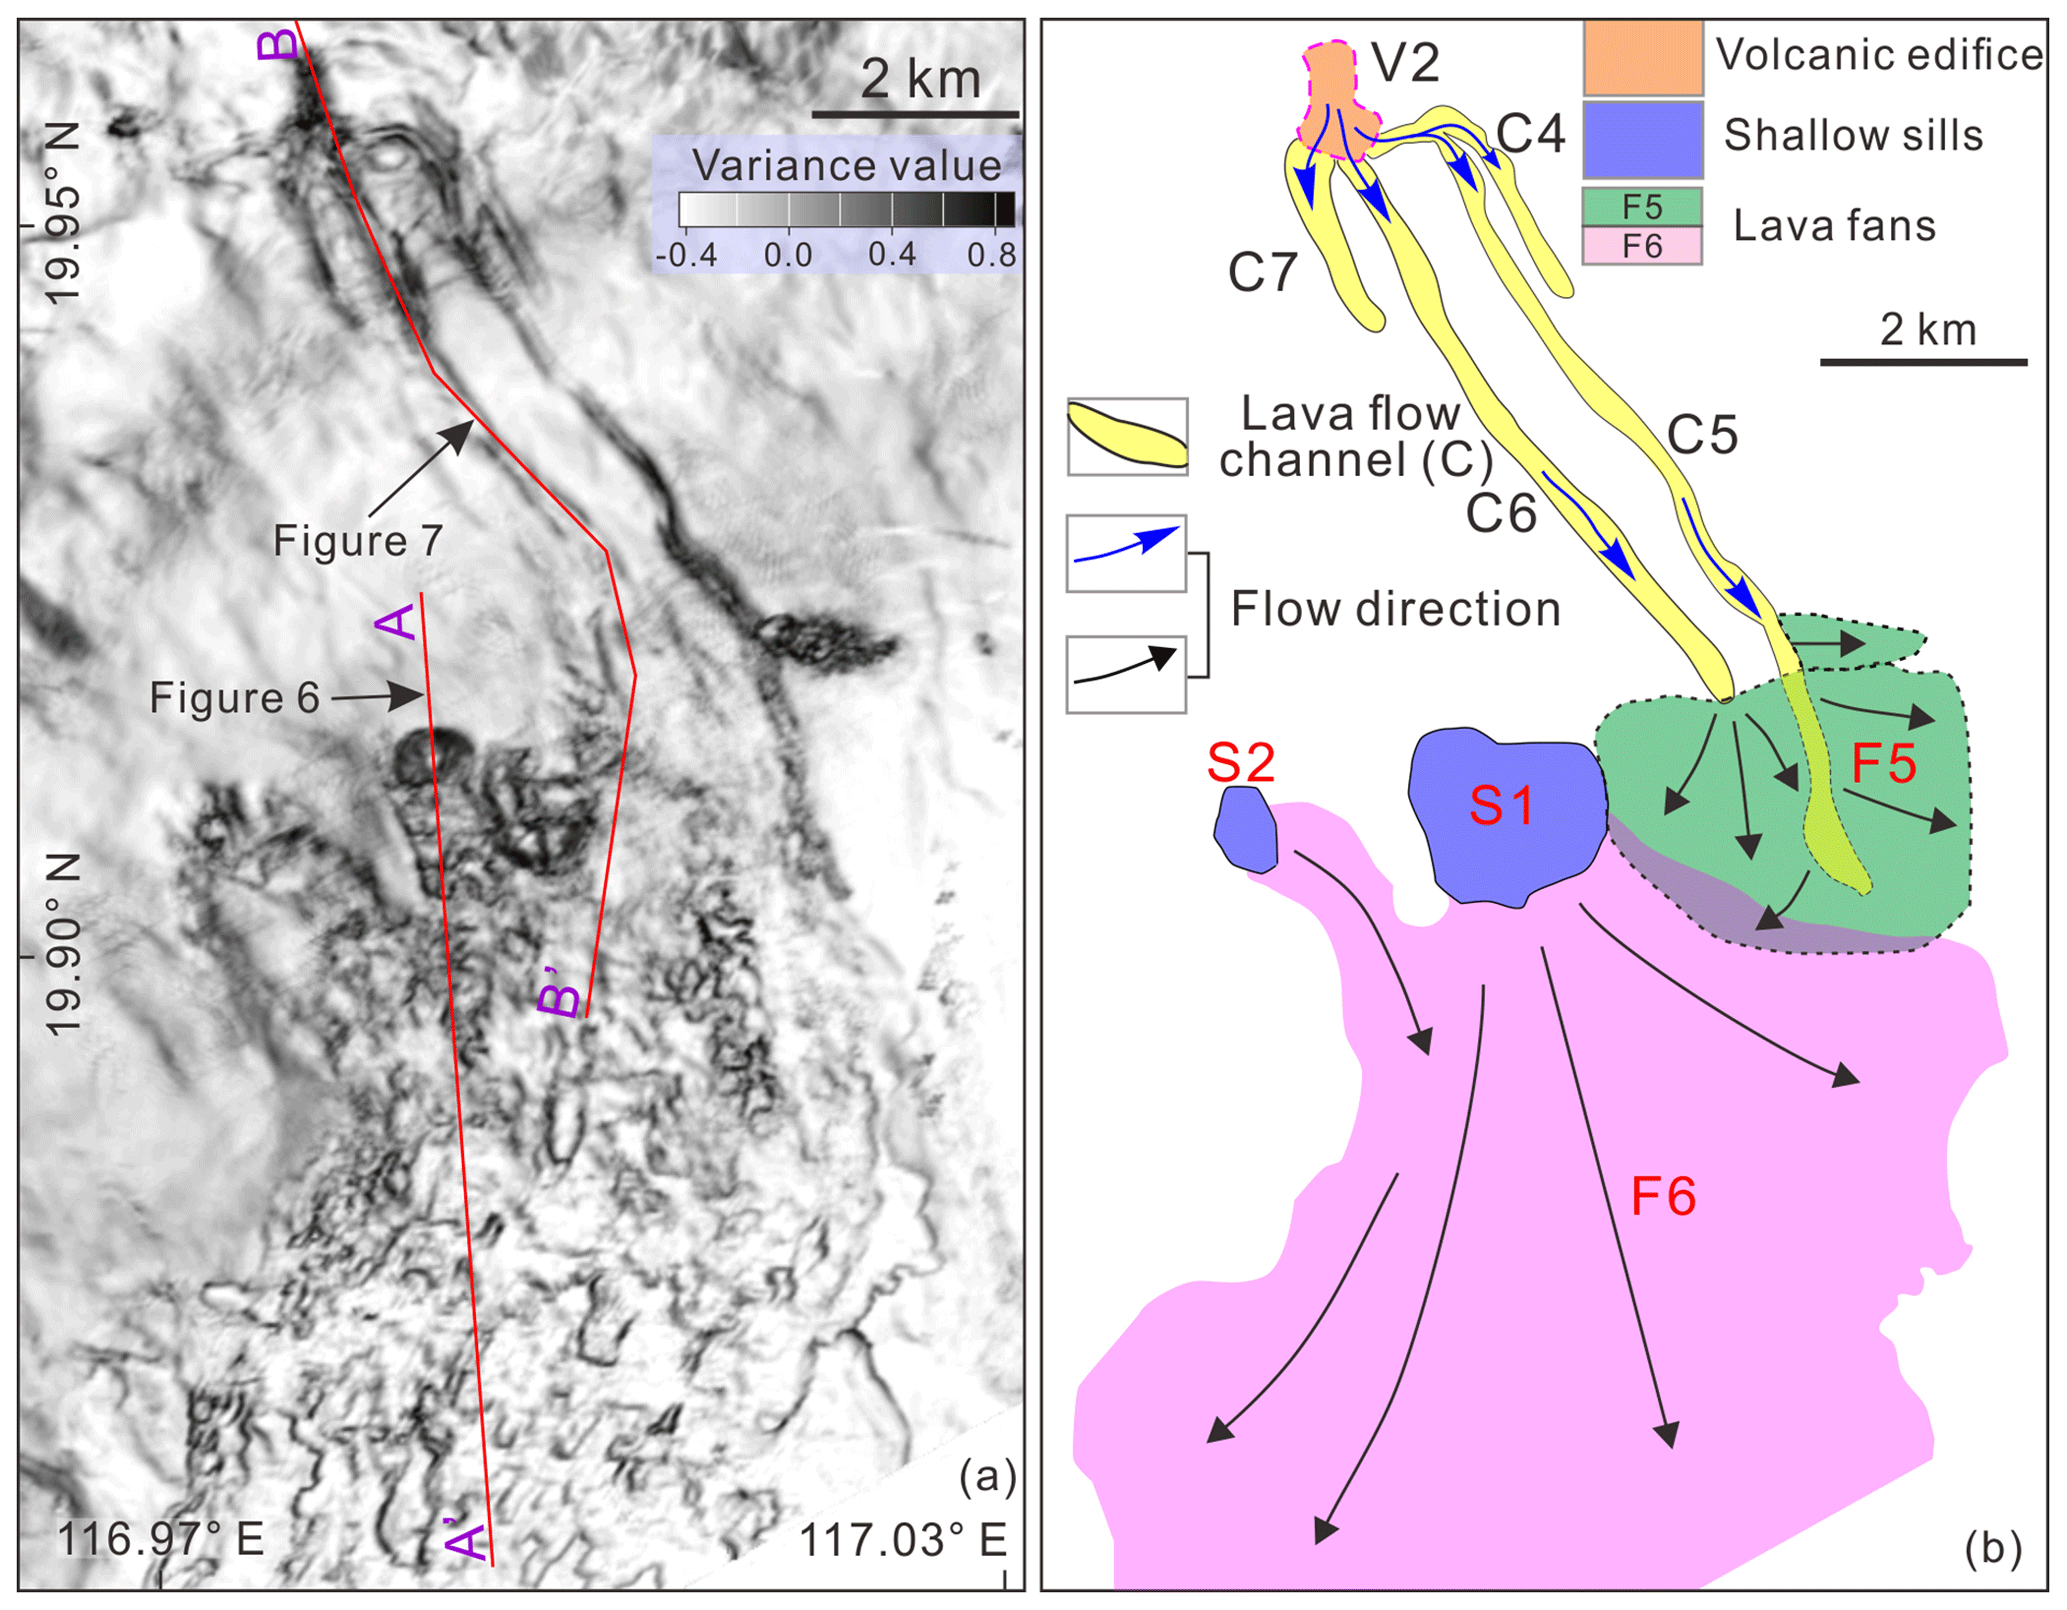
Figure 5(a) Variance slice (extracted from the surface BM) and (b) its interpretations. Lava flows are clearly identified by their texture and marked in (b). C – lava flow channel; S – shallow sill; F – lava fan. Red lines A–A' and B–B' in (a) are seismic profiles shown in Figs. 6 and 7.
3.2 Interpretations
The conical shape of SF1 and downlap of its internal reflections (where developed) onto BM, coupled with the onlap of overlying reflections onto TM, suggest SF1 is an extrusive rather than intrusive feature. SF1 is similar in terms of its conical shape, highly reflective top, and internally chaotic reflections to mud volcanoes documented elsewhere in the northern South China Sea (Sun et al., 2012; Yan et al., 2017). It is therefore plausible that SF1 could represent a mud volcano that fed long-runout mudflows (i.e. SF2). Alternatively, the highly reflective, ribbon-like geometry of SF2 is similar to that associated with shallow and/or free gas accumulations (Sun et al., 2012). We consider these two interpretations unlikely because (i) the limited supply and high viscosity of mud mean that mud volcanoes are rarely associated with long-runout flows, although we note that one mudflow in the Indus Fan was ∼5.0 km long (Calvès et al., 2009); and (ii) the top of SF2 is defined by a positive polarity reflection (downward increase in acoustic impedance), which is opposite to that typically associated with shallow and/or free gas accumulations (e.g. Judd and Hovland, 2007; Sun et al., 2012). Based on their geometric and geophysical characteristics, spatial relationships, and similarity to structures observed on other rifted continental margins, we interpret these features as volcanic edifices (SF1), genetically related lava flows (SF2), and saucer-shaped shallow sills (SF3) (e.g. Berndt et al., 2000; Planke et al., 2000; Thomson and Hutton, 2004; Calvès et al., 2011; Jackson, 2012; Magee et al., 2013; Keen et al., 2014; Reynolds et al., 2018). We now focus on the detailed external morphology and internal architecture of the two deepwater volcanoes that are shallowly buried (< 330 m) and thus well-imaged.
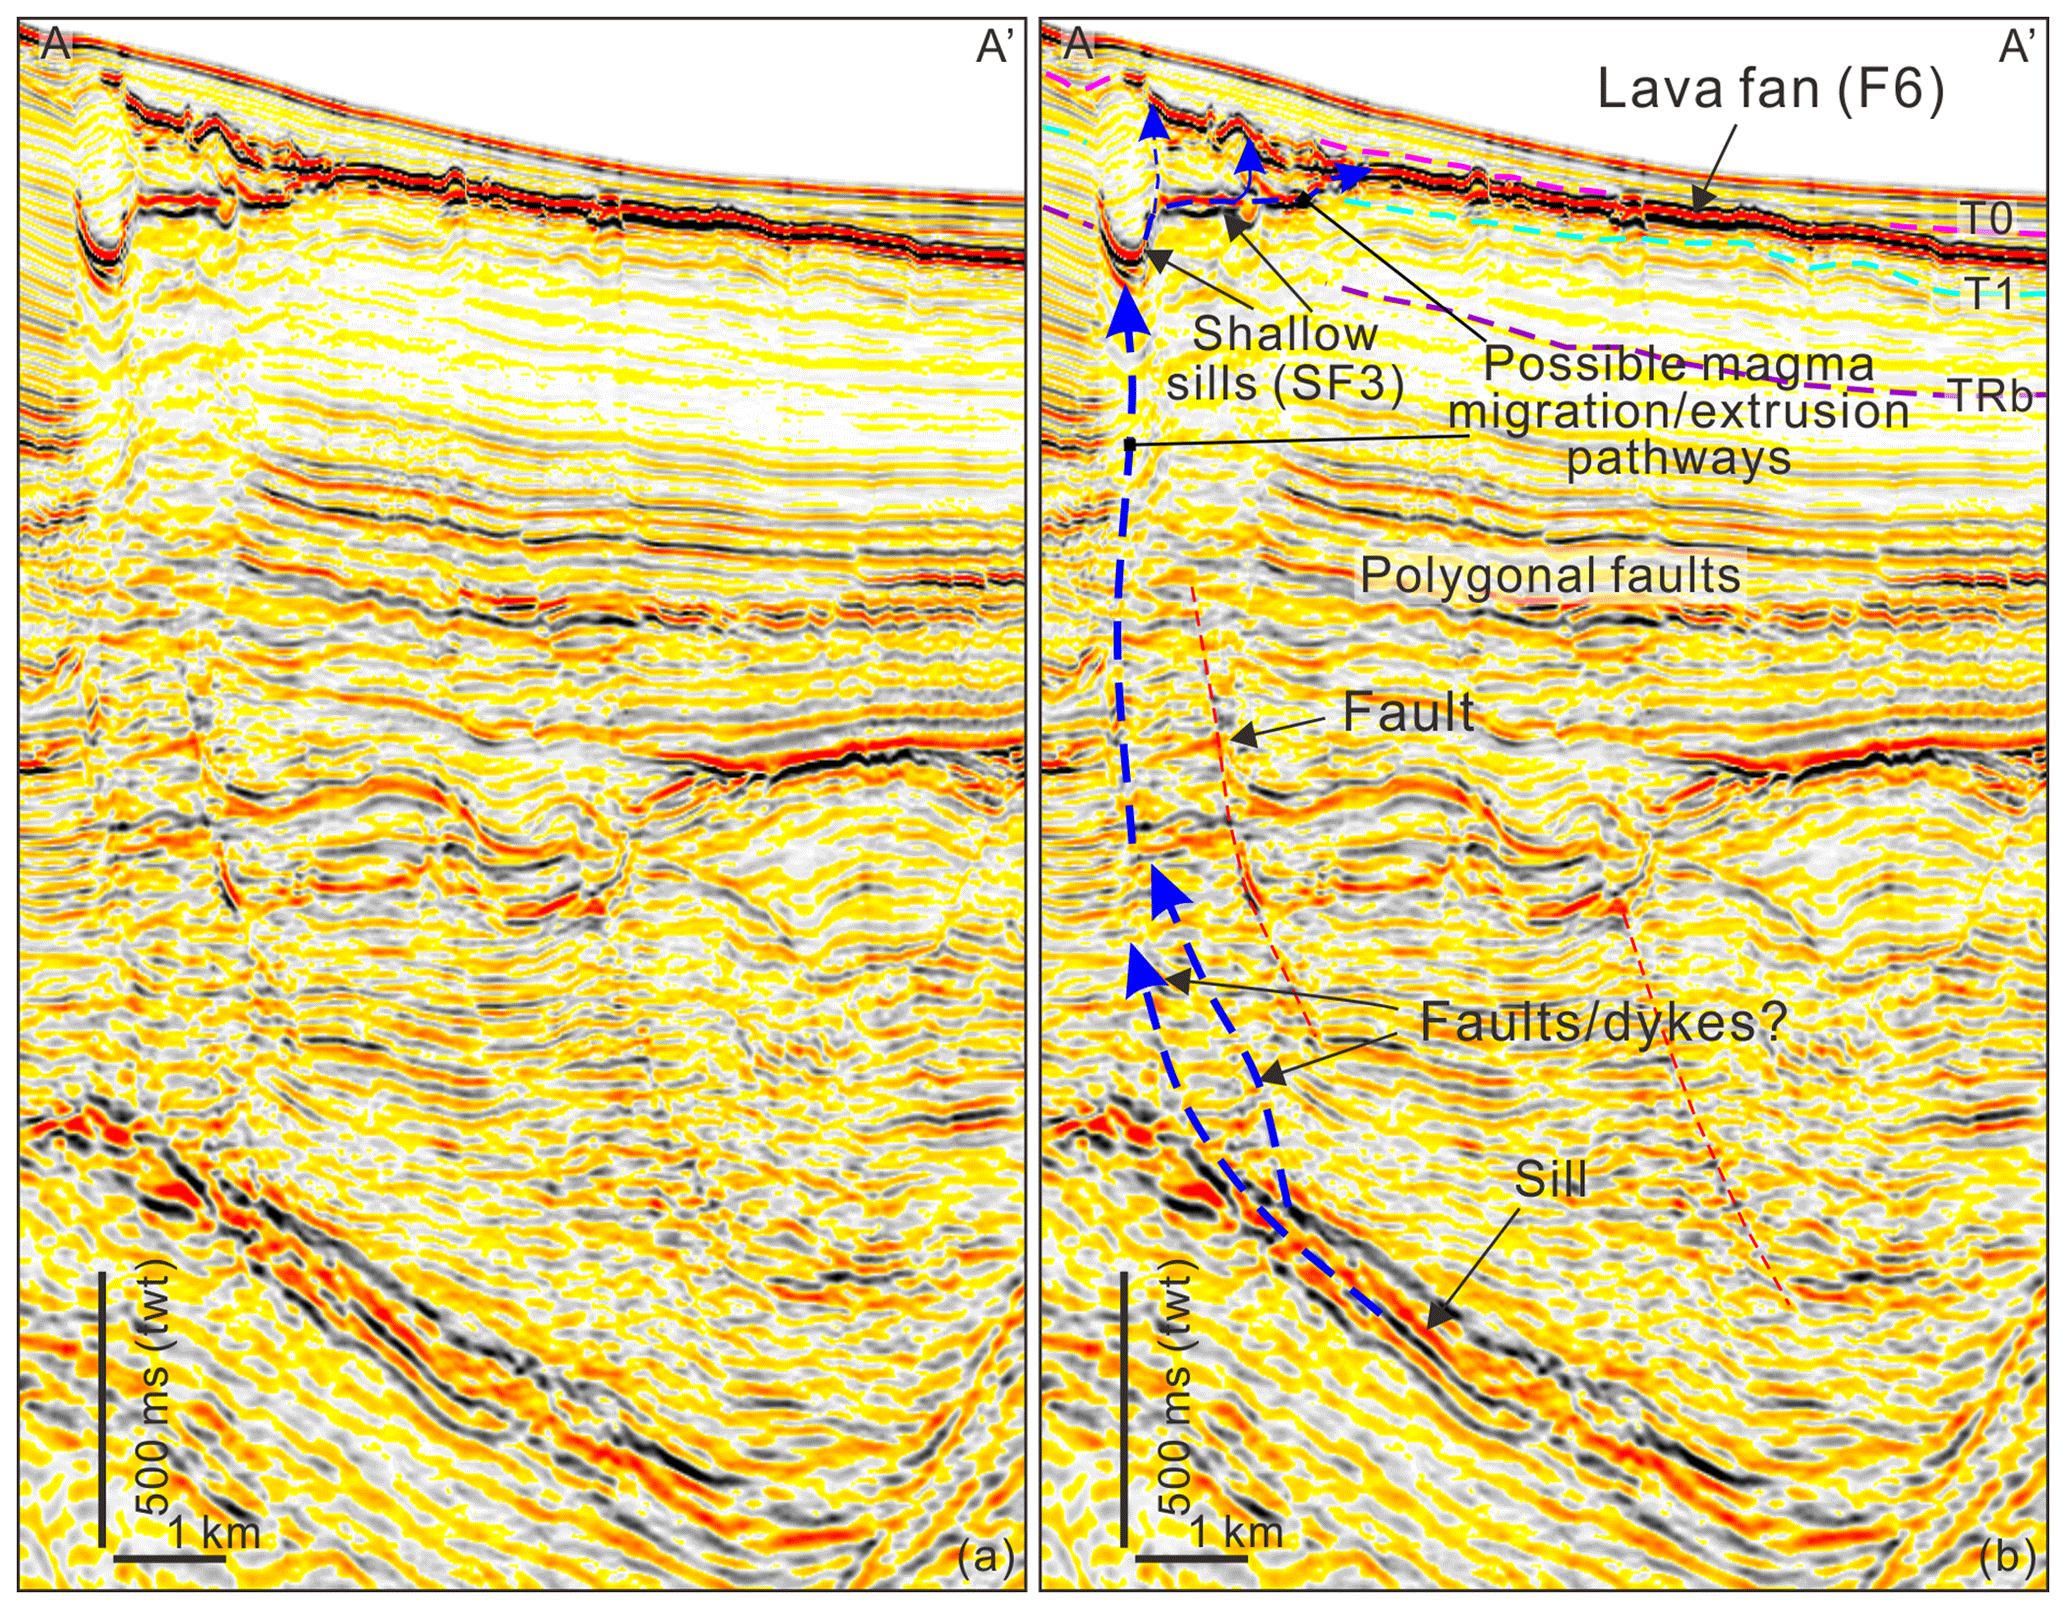
Figure 6(a) The seismic profile and (b) its interpretation show a magma pluming system from a deep-seated sill, shallow sill (S1), and lava fan (F6). See location of seismic profile A–A' in Fig. 5a.
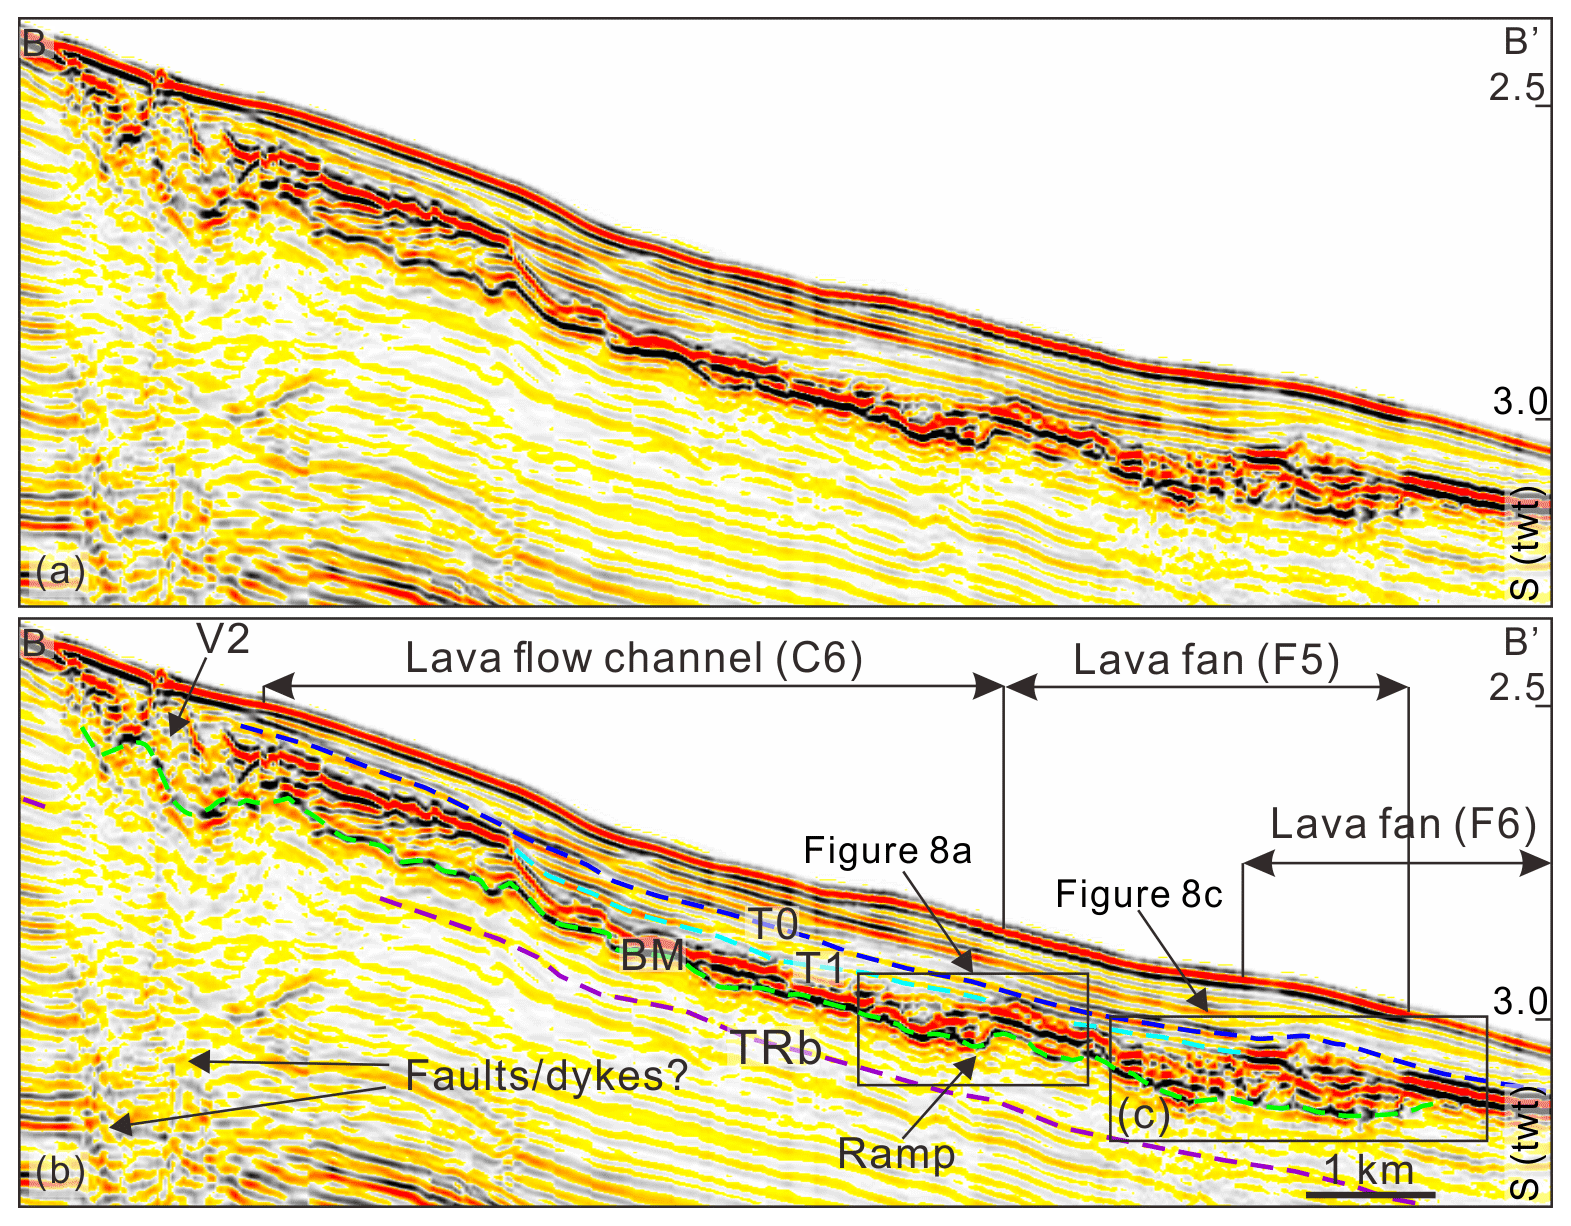
Figure 7(a) The seismic profile and (b) its interpretation cross-cut V2 and along the lava flow channel (C6) and lava fans (F5 and F6). V2 has a sharp boundary to the upslope. Lava fan 6 (F6) is directly overlying lava fan 5 (F5). BM – base of volcano–lava flow; see the location of seismic profile B–B' in Fig. 5a.
3.3 Volcano edifice 1 (V1) and associated lava flows
V1 is a prominent, ∼202 ms twt high (404±101 m), ∼ 3.0 km diameter conical volcanic edifice covering ∼7.2 km2, with a volume of km3 and an average flank dip of ∼15.0∘ ± 3.6∘ (Figs. 3–4; Table 1). V1 is onlapped by overlying reflections, with the oldest onlapping reflection correlating with TRa (∼6.5 Ma); this suggests V1 was emplaced in the latest Miocene (> 6.5 Ma) (Fig. 3a). V1 is underlain by a downward-tapering, > 1.1 km deep, up to 2.0 km wide, sub-vertical zone of chaotic reflections (Fig. 3a). We attribute the poor imaging within this chaotic sub-vertical zone to the following: (1) the presence of sub-vertical feeder intrusions that disrupt background reflections and scatter energy (see Thomson, 2007); (2) increased fluid flow and hydrothermal alteration in fractured and deformed host rock adjacent to the magma plumbing system; and/or (3) the scattering of energy travelling through the volcano, leading to “washout” of the underlying data (i.e. a geophysical artefact; Magee et al., 2013). This reduction in imaging beneath the volcanoes partly obscures their basal surface, but where visible it is clear that BM undulates and truncates underlying stratal reflections (Fig. 3b).
Table 3Dimensions of lava flow channels (C). Please note that all the lengths of lava flow channels are measured along their axes.
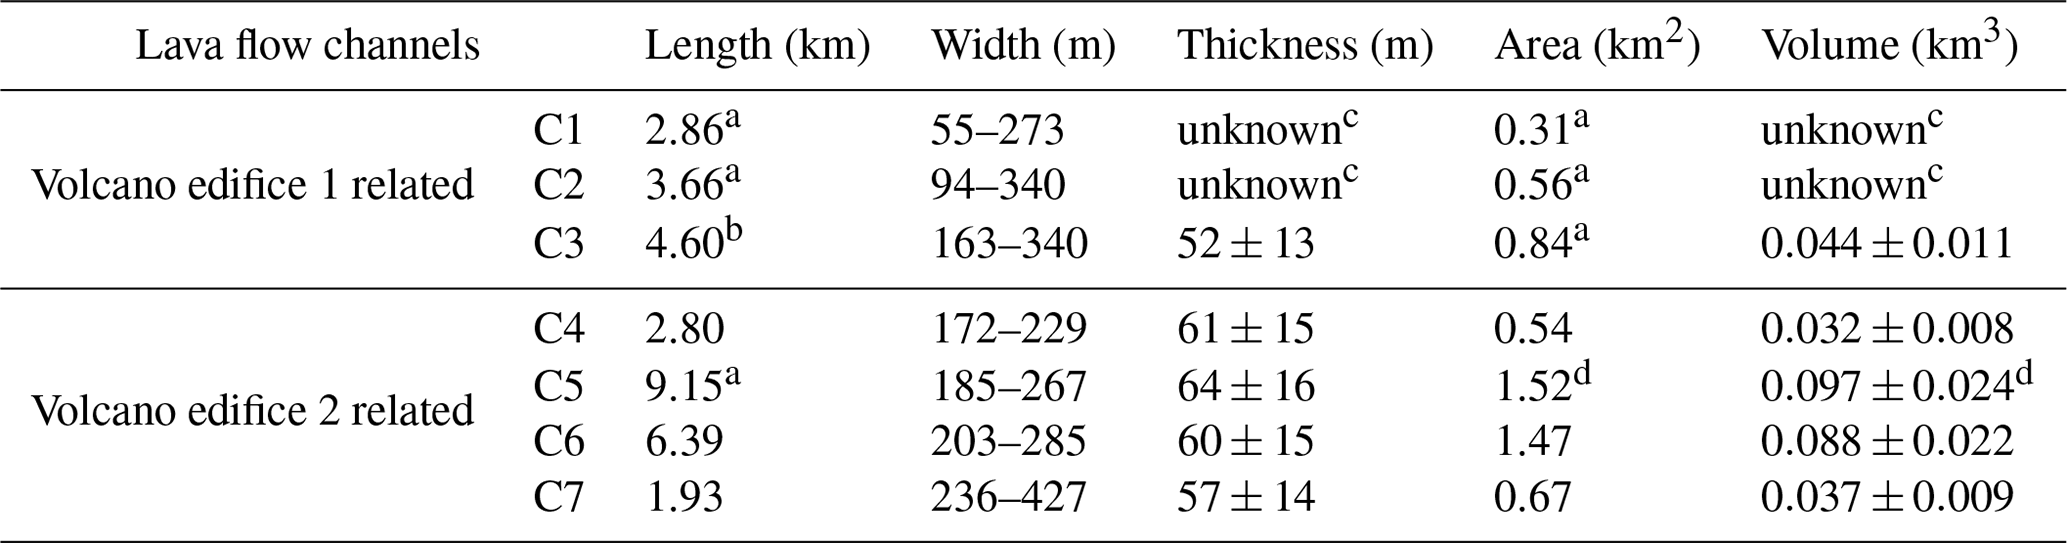
a Maximum lengths (including the inferred part of lava flow channels); b minimum length (C3 extends beyond the 3-D survey); c thicknesses cannot be measured because of lava flow channels (C1 and C2) are only identified on the plan-view map (RMS and variance slice map); d area and volume do not include the inferred part of C5.
Volcano V1 is surrounded by an asymmetric apron of moderate- to high-amplitude reflections extending up to 1.5 km from the main edifice. The apron is up to ∼115 ms twt thick ( m) and has a dip of < 0.5∘ (Fig. 4a–b; Table 2). A package of moderate- to very-high-amplitude reflections extending a further ca. 1.5 km down-dip of this apron contains very-high-amplitude, channel-like geometries (marked C1–C3 in Fig. 4a), which terminate down-dip into or are flanked at prominent bends by moderate-amplitude, fan-like geometries (marked F1–F4 in Fig. 4a). We interpret these two features as lava flow channels and fans, respectively (Figs. 3–4). The lava flow channels are sinuous, < 340 m wide, and usually bisect the lava fans (Fig. 4a–b). Lava-flow-related features (i.e. apron, channels, and fans) emanating from V1 cover an area of ∼14 km2 (Tables 3–4), have an average thickness of ∼33 ms twt ( m), and have a volume of km3; this volume is nearly equal to that of V1 ( km3) and thus represents ∼50 % of the total erupted volume ( km3).
Table 4Dimensions of lava flow fans.
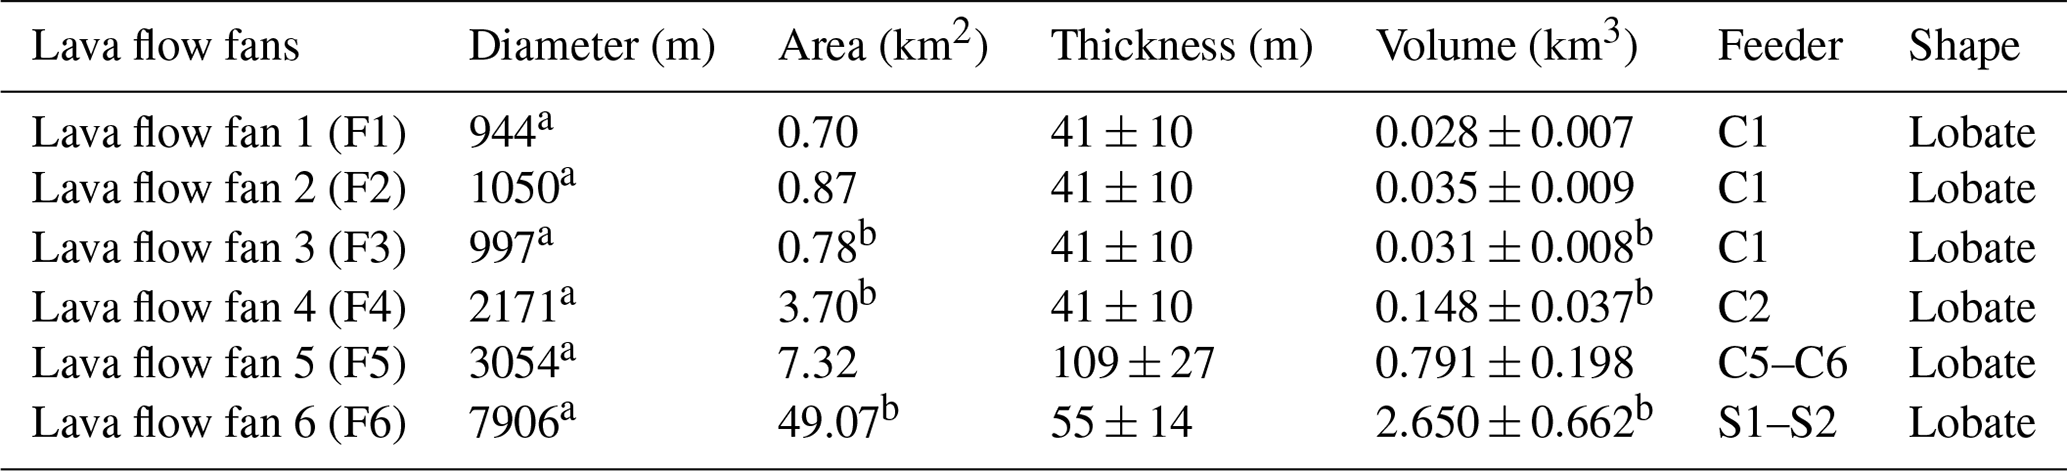
a Diameter is calculated from the area as a circle. b Minimum areas and volumes because of limited data coverage. C – lava flow channel; S – sill.
3.4 Volcano edifice 2 (V2) and associated lava flows
V2 covers ∼0.44 km2 and is elliptical in plan view, with long and short axes of ∼1.2 and ∼0.6 km, respectively (Figs. 5, 7). The volcano is ∼100 ms twt high (∼ 200 ±50 m), with an irregular base, has flank dips of ∼ 27.8∘ ± 5.9∘, and has a volume of 0.03±0.01 km3 (Figs. 5, 7; Table 1). The top of V2 is of moderate amplitude and is irregular, with the oldest onlapping reflections correlating with reflector T1 (∼5.3 Ma), suggesting that V2 is latest Miocene–earliest Pliocene (> 5.3 Ma) but probably younger than V1 (> 6.5 Ma) (Fig. 7). Reflections within V2 are chaotic and, similar to V1, V2 is underlain by a vertical zone of disturbance (Fig. 7). V2 lacks a lava apron, instead being directly flanked by relatively straight, > 9.2 km long lava flow channels extending beyond the seismic survey boundary on its southeastern side (C4–C7) (Fig. 5a). Lava flow C6 is unusual in that underlying strata are truncated at the base of the flow, defining “ramps” that are up to ∼32.5 ms twt high ( m) and dip towards V2 at ∼25.5∘ ± 5.8∘ (Fig. 8). Beyond the main ramp at the base of lava flow C6 (Fig. 5b), the lava flow thickens to ∼130 ms twt ( m), where it is defined by stacked, high-amplitude reflections that have a lobate geometry in plan view (F5) (Figs. 5, 7, 8c–d). At its distal end, the pinch-out of F5 occurs where it abuts a basal ramp that is m tall and dips ∼9.3∘ ± 2.3∘ (Fig. 8c–d). F5 is capped by a younger lava fan (F6) (Fig. 8c–d). The V2-sourced lava flows (C4–C7 and F5) cover ∼11.5 km2; ∼4.20 km2 of this comprises lava flow channels and ∼7.32 km2 lava fan. Given the average thickness of the lava flow channels ( m) and fans ( m), we estimate the total volume of V2-sourced lava flows to be km3; this volume estimate is ∼35 times greater than that of the main V2 edifice (0.03±0.01 km3), representing ∼97 % of the total erupted volume.

Figure 8(a, b) Enlargement of the end of lava flow channel (ramp structure) and its line drawings; (c, d) enlargement and its line drawings of the lava fans (F5 and F6). BM – base of volcano–lava flow. See locations in Fig. 7.
3.5 Shallow sills and associated lava flows
South of V2, we map two areally extensive, partly merged lava flows emanating from the upper tips of inclined sheets fringing saucer-shaped sills (i.e. S1 and S2) (Figs. 1b, 5–6). A narrow, vertical, seismically chaotic blanking zone occurs directly below the saucer-shaped sills (Fig. 6). Several linear structures, rooted at the junction between sills and feeding the overlying lava fan (F6), are also observed (Fig. 6). F6 covers an area of ∼49 km2, with a diameter of ∼7.9 km and a thickness of 55±14 m (Table 4). F6 is directly onlapped by surface T0 (∼2.58 Ma), suggesting it was emplaced in the latest Pliocene (> 2.58 Ma) (Fig. 6). Similar to other lava fans, F6 is characterized by a single, positive, high-amplitude seismic event (Fig. 6). F6 extends beyond the seismic coverage and is much bigger than other lava fans imaged in the study area (Figs. 5–6; Table 4).
4.1 Water depths during volcano emplacement
The different burial depths and onlap relationships of the volcano edifices and lava flows studied here suggest three phases of volcanism: i.e. ∼6.5 Ma for V1, ∼5.3 Ma for V2, and ∼2.58 Ma for S1–S2 (Figs. 2–3, 6–7). According to the relative sea-level change curve of the Pearl River Mouth basin acquired from nanofossils (Xu et al., 1995; Qin, 1996) and the dating of volcanic phases, the water depths during V1 and V2 emplacement were likely ∼75 and ∼150 m shallower than the present depths of ∼2.25 and ∼2.14 km, respectively. The water depth during the emplacement of F6, fed by S1–S2, was probably ∼150 m greater than the present depth of ∼2.32 km (Xu et al., 1995; Qin, 1996). To be conservative, we estimate that volcanism in the study area occurred in water depths of a little over 2.0 km.
4.2 Origin of post-spreading volcanism in the SCS
The volcanoes documented here (∼6.3–2.58 Ma) have similar ages as those documented at Hainan (e.g. Tu et al., 1991; Shi et al., 2011) and the southwestern SCS (e.g. Li et al., 2013) (Fig. 1a). However, these volcanoes are substantially younger than those previously observed in the central SCS (∼13.8–7.0 Ma; Expedition 349 Scientists, 2014; Li et al., 2015) and on the middle–lower slope of the northern SCS (∼23.8–17.0 Ma; Yan et al., 2006; Zhao et al., 2016; Fan et al., 2017). We note that the small-scale, buried, post-spreading volcanic features studied here have not been identified by lower-resolution techniques (e.g. gravity, magnetism, OBS, and 2-D seismic data). These young volcanic features may be widespread and diagnostic of post-spreading magmatism across the northern SCS (e.g. Briais et al., 1993; Yan et al., 2006).
Given that the volcanoes documented here were emplaced after SCS rifting (> 32 Myr ago; e.g. Taylor and Hayes, 1983; Franke et al., 2014; Li et al., 2015) and spreading (> 15 Myr ago; Li et al., 2014), it is clear they have a different origin than the breakup-related volcanoes described elsewhere (e.g. Yan et al., 2006; Expedition 349 Scientists, 2014; Li et al., 2015; Zhao et al., 2016; Fan et al., 2017). The post-spreading age of volcanism may suggest that mantle melting (Clift et al., 2001) and the convective removal of continental lithosphere by a warm asthenosphere (Lester et al., 2014), processes typically associated with rifting and breakup, were not responsible for the generation of this phase of igneous activity. Magmatism gets younger southeastwards, from ∼23.8–17.0 Ma on the proximal continental slope (Yan et al., 2006; Zhao et al., 2016; Fan et al., 2017) to ∼6.30–2.58 Ma in the deeper-water study area. This observation is seemingly in agreement with the results of teleseismic imaging, which show southeastward migration of the eastern branch of the Hainan mantle plume (Xia et al., 2016). This suggests that plume melt (Xia et al., 2016; Fan et al., 2017) may have supplied magma to these volcanoes. However, where the Hainan mantle plume was located or even whether the Hainan mantle plume occurred or not are still controversial at present (e.g. Wheeler and White, 2000; He and Wen, 2011; Zhang and Li, 2018). Another possibility for the origin of the magma feeding these volcanoes is related to the Dongsha Event, which may have triggered mantle upwelling as well as transtensional faulting (Lüdmann et al., 1999). The Dongsha Event peaked at ∼5.3 and 2.58 Ma (Lüdmann et al., 2001) and was broadly synchronous with the main period of eruptive magmatism documented here. Faults generated during the Dongsha Event may have provided high-permeability zones that promoted the vertical migration of magma that fed the eruptive centres.
4.3 Volcano construction
Both V1 and V2 are underlain by sub-vertical, pipe-like zones of chaotic reflections, which we suggest demarcate the limits of their magma plumbing systems. The basal surfaces of V1 and V2 truncate underlying strata (Figs. 3a, 7). Apparent erosion of the sub-volcanic substrate may indicate the initial eruptions were explosive. Alternatively, subsidence of the volcano load into underlying, wet, unconsolidated sediments may have caused the strata to locally compact and thereby change the reflection configuration, making it appear that they are truncated.
Internal reflections that lie subparallel to the flanks of V1 and V2 suggest the volcanoes grew by increasing both edifice height and diameter by the accretion of volcanic material (Magee et al., 2013). Flank dips of ∼15–28∘ likely indicate that the volcanic material building the edifices constitutes coherent lava flows and/or a dome structure rather than a pyroclastic cone of tephra (Francis and Thorpe, 1974; Griffiths and Fink, 1992). Construction via the emplacement of coherent lava flows is consistent with the presence of internal reflections in V1 and V2; i.e. boundaries between blocky lava flows would be irregular and scatter seismic energy, meaning they would not likely be imaged.
4.4 Lava flow extrusion dynamics
In addition to the formation of volcanic edifices, both V1 and V2, as well as S1 and S2, are associated with extensive lava flows. In particular, we show that V1 and V2 are flanked either by an asymmetric lava apron, which is broader on their downslope (SE) side, or lava flow channels that flowed southeastwards for up to > 9 km (Figs. 3a, 4a–b, 5a). At subaerial volcanoes (e.g. Walker, 1993; Cashman et al., 1999), high eruption rates and low magma viscosities are the dominant causes of long-runout lava flows. Extensive lava flows have also been observed at other deepwater volcanoes (e.g. Chadwick et al., 2018; Embley and Rubin, 2018; Ikegami et al., 2018) where greater dissolved H2O contents in melt imply lower melt viscosity while the lavas were mobile. These low-viscosity, highly mobile lavas could potentially have longer runout distances. Higher ambient pressure can also affect bulk lava rheology, e.g. decreased vesicularity and crystal content. Lower gas fractions will also suppress magma decompression and ascent prior to eruption and thereby suppress effusion rates and extrusion dynamics (Bridges, 1997; Gregg and Fornari, 1998). For example, upon eruption of a 1200–1100 ∘C basalt (mid-ocean ridge basalt composition) at a confining pressure of 20 MPa (i.e. a hydrostatic equivalent water depth of 2 km), the melt can contain up to 1.4 wt % H2O at equilibrium volatile solubility (Newman and Lowenstern, 2002). Using the viscosity model of Giordano et al. (2008) and 1.4 wt % H2O, the resulting lava viscosity of 9–38 Pa s is significantly lower than a dry (e.g. 0.1 wt % H2O) subaerial basalt having a viscosity range of 41–248 Pa s. Higher H2O content in lavas erupted in deep water compared to those extruded in subaerial settings will mean that (1) there are fewer bubbles from suppressed degassing or brittle fragmentation to hinder flow (Gregg and Fornari, 1998); (2) crystallization may be inhibited, reducing the effect of crystal interactions on viscosity; and (3) the glass transition temperature is suppressed (Giordano et al., 2008), allowing lavas to flow further as the interiors cool.
From our seismic reflection data it is also clear that channelization in lava tubes, in addition to the water content effects described above, also facilitated long-distance lava transport. We suggest these tubes formed by rapid cooling and thickening of a surficial crust that insulated and focused lava flow through a core channel (e.g. Cashman et al., 1999). Based on the long-runout lava distances, we consider our initial assumption that the imaged volcanic features have a mafic composition to be likely. Overall, whilst we do not know the composition of the lavas imaged in our seismic reflection data, pressure-related changes in lava rheology and channelization of any lava type (i.e. mafic to silicic) will allow it to flow hotter for longer. Given the downslope topographic control during eruption, a combination of rheology changes and channelization allowed lavas to flow for > 9 km from associated volcanic edifices.
The overall geometry and internal architecture of the imaged lava flows indicate that substrate rheology also controlled emplacement dynamics. Our 3-D seismic reflection data show that relatively long-runout lava flows (> 9 km) erupted from deepwater volcanoes have a rugged basal surface that is locally defined by erosional basal “ramps”. Truncation of underlying strata suggests the lavas were able to erode down into the seabed, perhaps because the pre-eruption substrate was cold, wet, and unconsolidated. We suggest that the erosion of the lava substrate was promoted by (1) the dense (bubble-poor) lava sinking down into or “dredging” the soft sediments (Duffield et al., 1986; Ikegami et al. 2018); (2) thermal erosion (Griffiths, 2000); and/or (3) more “turbulent” flow dynamics of channelized lava, consistent with the inferred low viscosities (< 10 Pa s).
Lava flows eventually ceased in distal areas due to gradual cooling and crystallization (Cashman et al., 1999). We suggest that, in the case of the straight lava flows (C5 and C6), lava transported within the axial tube temporarily accumulated at the end of the flow. Lava entering the tube from the ongoing volcanic eruption caused an increase in pressure, with the cooled and crystallized material at the flow toe forming a transient barrier. Eventually, pressure build-up was sufficient to rupture this frontal barrier, leading to emplacement of a down-dip fan (F5; Figs. 5a, 7–8) (Griffiths, 2000). However, in the case of fans (e.g. F1–4) fed by sinuous channels (Fig. 4a–b), we suggest these were emplaced in a process similar to that documented by Miles and Cartwright (2010), with lobate lava flows fed and bisected by a “lava tube” through magma inflation and increases in eruption rate. At the end of sinuous lava flow channels (e.g. C1), the main channel bifurcated to form a lobate fan (F3, Fig. 4a–b), which was also probably caused by flow branching triggered by magma cooling (Griffiths, 2000).
4.5 Volume balance of volcano edifice and lava flow
Inaccurate constraints on total erupted volumes limit our understanding of volcano construction, lava propagation, eruption rates, eruption durations, magma storage conditions, melting processes, and risk assessment of volcanism in deepwater settings (Carey et al., 2018). High-resolution 3-D seismic reflection data allow us to calculate the volumes of material contained within volcano edifices and in flanking lava flows if they are thick enough to be imaged. In this study, we show that most (i.e. 50 %–97 %) of the erupted material was transported away from the imaged edifices. An important result of our work is that flanking lava flows, and to a lesser extent the volcanic edifices, have rugged and discordant bases (Fig. 7); accurately calculating the volume of deepwater volcanoes and lava flows therefore requires an understanding of their pre-eruption basal morphology. Erupted volume estimates based solely on remote sensing of the post-eruption seabed may thus be incorrect (e.g. Robinson and Eakins, 2006). Although we show that the accuracy of total erupted volume estimates can be improved by constraining basal volcano and lava morphologies, seismic images capturing the geological record of deepwater volcanoes cannot determine how much, if any, clastic volcanic material was transported away from the eruption site as pumice rafts or through ocean current clast suspension and subsequent transport (e.g. Jutzeler et al., 2014; Carey et al., 2018). Nevertheless, 3-D seismic imaging can significantly improve quantitative volume estimates of recent and ancient volcanic edifices and lava flows, either outcropping on the seafloor or buried by sedimentary successions.
High-resolution 3-D seismic data from the South China Sea allow us to image and map the internal structure, calculate the volume of erupted material, and to better understand the extrusion dynamics of buried deepwater volcanoes; such insights cannot readily be gained from analysis of remote sensing data (e.g. airborne–shuttle radar topography). Volcanism occurred ∼6.3–2.58 Ma, after seafloor spreading had ceased in the area, and may be related to the Dongsha Event and/or a hypothesized Hainan mantle plume. High hydrostatic pressure, an inclined seabed (∼1∘), and low-strength, very fine-grained, near-seabed sediments, combined with the formation of lava tubes and the extrusion of low-viscosity magmas, are likely responsible for the observed long-distance lava runouts (> 9 km) in this deepwater environment. We show that the imaged volcanic edifices and associated lava flows have rugged, erosional bases, meaning that traditional remote-sensing-based volume calculations of deepwater volcanic features, which typically assume smooth bases, are underestimated. We calculate that a large amount (as high as ∼97 %) of the erupted materials were transported away from the volcano edifices as lava flows, suggesting that the volume of deepwater volcanic edifices may not faithfully archive eruption size or magma production. Considering the fact that deepwater conditions (e.g. high hydrostatic pressure and unconsolidated sediments) in the study area are common elsewhere, the conclusions derived from this study can likely be used in other deepwater sedimentary basins and perhaps sedimentary mid-ocean ridges. Our study highlights the fact that 3-D seismic reflection data can contribute to an understanding of volcano morphology in 3-D and accurately estimating the volumes of erupted materials.
We use the seismic reflection data from CNOOC, which can be accessed only by those whose employers licence the data from CNOOC.
QLS, CALJ, CM, and XX have contributed to conceptualization, data analysis, and writing and revising the original draft. SJM contributed to conceptualization and revising the original draft.
The authors declare that they have no conflict of interest.
We thank the China National Offshore Oil Company (CNOOC) for permission to release the data. Dieter Franke, Gerome Calvès, and Nick Schofield are thanked for their invaluable comments and suggestions on a previous version of this paper. We thank Weiwei Ding, Alexander Peace, and William Chadwick for their constructive comments on this version of the paper and Antonella Longo for editorial handling. Rebecca Bell is thanked for generously providing office space during the visit of Qiliang Sun to Imperial College.
This research has been supported by the National Scientific Foundation of China (grant nos. 91528301, 41676051, and 41372112), the Programme of Introducing Talents of Discipline to Universities (grant no. B14031), and the Fundamental Research Funds for the Central Universities–-China University of Geosciences (Wuhan) (grant no. CUG160604).
This paper was edited by Antonella Longo and reviewed by William W. Chadwick and Weiwei Ding.
Allen, R. W., Berry, C., Henstock, T. J., Collier, J. S., Dondin, F. J.-Y., Rietbrock, A., Latchman, J. L., and Robertson, R. E. A.: 30 Years in the Life of an Active Submarine Volcano: A Time – Lapse Bathymetry Study of the Kick-'em-Jenny Volcano, Lesser Antilles, Geochem. Geophy. Geosy., 19, 715–731, https://doi.org/10.1002/2017GC007270, 2018.
Arnulf, A. F., Harding, A. J., Kent, G. M., Carbotte, S. M., Canales, J. P., and Nedimovic, M. R.: Anatomy of an active submarine volcano, Geology, 42, 655–658, https://doi.org/10.1130/G35629.1, 2014.
Arnulf, A. F., Harding, A. J., Kent, G. M., and Wilcock, W. S. D.: Structure, Seismicity, and Accretionary Processes at the Hot Spot-Influenced Axial Seamount on the Juan de Fuca Ridge, J. Geophy. Res., 19, 4618–4646, https://doi.org/10.1029/2017JB015131, 2018.
Berndt, C., Skogly, O. P., Planke, S., Eldholm, O., and Mjelde, R.: High-velocity break up-related sills in the Vøring Basin, off Norway, J. Geophy. Res., 105, 28443–28454, https://doi.org/10.1029/2000JB900217, 2000.
Briais, A., Patriat, P., and Tapponnier, P.: Updated interpretation of magnetic anomalies and seafloor spreading stages in the South China Sea: Implications for the Tertiary tectonics of Southeast Asia, J. Geophy. Res., 98, 6299–6328, https://doi.org/10.1029/92JB02280, 1993.
Bridges, N. T.: Ambient effects on basalt and rhyolite lavas under Venusian, subaerial, and subaqueous conditions, J. Geophy. Res., 102, 9243–9255, https://doi.org/10.1029/97JE00390, 1997.
Brown, A.R.: Interpretation of three-dimensional seismic data: AAPG Memoir 42, 6 ed., SEG Investigations in Geophysics, The American Association of Petroleum Geologists and the Society of Exploration Geophysicists, Tulsa, Oklahoma, USA, 2004.
Calvès, G., Schwab, A. M., Huuse, M., van Rensbergen, P., Clift, P. D., Tabrez, A. R., and Inam, A.: Cenozoic mud volcanoe activity along the Indus Fan: offshore Pakistan, Basin Res., 22, 398–413, https://doi.org/10.1111/j.1365-2117.2009.00448.x, 2009.
Calvès, G., Schwab, A. M., Huuse, M., Clift, P. D., Gaina, C., Jolley, D., Tabrez, A. R., and Inam, A.: Seismic volcanostratigraphy of the western Indian rifted margin: The pre-Deccan igneous province, J. Geophy. Res., 116, B01101, https://doi.org/10.1029/2010JB000862, 2011.
Cameselle, A. L., Ranero, C. R., Franke, D., and Barckhausen, U.: The continent-ocean transition on the northwestern South China Sea, Basin Res., 29, 73–95, https://doi.org/10.1111/bre.12137, 2017.
Carey, R., Soule, S. A., Manga, M., White, J. D. L., McPhie, J., Wysoczanski, R., Jutzeler, M., Tani, K., Yoerger, D., Fornari, D., Caratori-Tontini, F., Houghton, B., Mitchell, S., Ikegami, F., Conway, C., Murch, A., Fauria, K., Jones, M., Cahalan, R., and McKenzie, W.: The largest deep-ocean silicic volcanic eruption of the past century, Sci. Adv., 4, e1701121, https://doi.org/10.1126/sciadv.1701121, 2018.
Cashman, K. V., Thornber, C. R., and Kauahikaua, J. P.: Cooling and crystallization of lava in open channels, and the transition of pahoehoe lava to `a`a, B. Volcanol., 61, 306–323, https://doi.org/10.1007/s004450050299, 1999.
Chadwick Jr, W. W., Merle, S. G., Baker, E. T., Walker, S. L., Resing, J. A., Butterfield, D. A., Anderson, M. O., Baumberger, T., and Bobbitt, A. M.: A recent volcanic eruption discovered on the central Mariana back-arc spreading center, Front. Earth Sci., 6, 172, https://doi.org/10.3389/feart.2018.00172, 2018.
Chiu, M.: The P-wave velocity modeling of the transitional crust in northern South China Sea continental margin, M.S. dissertation, National Taiwan Ocean University, Keelung, 112 pp., 2010.
Clift, P.D., Lin, J., and ODP Leg 184 Scientific Party: Patterns of extension and magmatism along the continent-ocean boundary, South China margin, Geol. Soc. London Spec. Pub., 187, 489–510, https://doi.org/10.1144/GSL.SP.2001.187.01.24, 2001.
Cocchi, L., Masetti, G., Muccini, F., and Carmisciano, C.: Geophysical mapping of Vercelli Seamount: Implications for Miocene evolution of the Tyrrhenian back arc basin, Geosci. Front., 7, 835–849, https://doi.org/10.1016/j.gsf.2015.06.006, 2016.
Ding, W. W. and Li, J. B.: Propagated rifting in the Southwest Sub-basin, South China Sea: Insights from analogue modelling, J. Geodynam., 100, 71–86, https://doi.org/10.1016/j.jog.2016.02.004, 2016.
Duffield, W. A., Bacon, C. R., and Delaney, P. T.: Deformation of poorly consolidated sediment during shallow emplacement of a basalt sill, Coso Range, California, B. Volcanol., 48, 97–107, https://doi.org/10.1007/BF01046545, 1986.
Embley, R. W. and Rubin, K. H.: Extensive young silicic volcanism produces large deep submarine lava flows in the NE Lau Basin, B. Volcanol., 80, 36, https://doi.org/10.1007/s00445-018-1211-7, 2018.
Expedition 349 Scientists: South China Sea tectonics: Opening of the South China Sea and its implications for southeast Asian tectonics, climates, and deep mantle processes since the late Mesozoic, International Ocean Discovery Program Preliminary Report, 349, https://doi.org/10.14379/iodp.pr.349.2014, 2014.
Fan, C. Y., Xia, S. H., Zhao, F., Sun, J. L., Cao, J. H., Xu, H. L., and Wan, K. Y.: New insights into the magmatism in the northern margin of the South China Sea: Spatial features and volume of intraplate seamounts, Geochem. Geophy. Geosy., 18, 2216–2239, https://doi.org/10.1002/2016GC006792, 2017.
Francis, P. W. and Thorpe, R. S.: Significance of lithologic and morphologic variations of pyroclastic cones, Geol. Soc. Am. Bull., 85, 927–930, https://doi.org/10.1130/0016-7606(1974)85<927:SOLAMV>2.0.CO;2, 1974.
Franke, D.: Rifting, lithosphere breakup and volcanism: comparison of magma-poor and volcanic rifted margins, Mar. Petrol. Geol., 43, 63–87, https://doi.org/10.1016/j.marpetgeo.2012.11.003, 2013.
Franke, D., Savva, D., Pubellier, M., Steuer, S., Mouly, B., Auxietre, J., Meresse, F., and Chamot-Rooke, N.: The final rifting evolution in the South China Sea, Mar. Petrol. Geol., 58, 704–720, https://doi.org/10.1016/j.marpetgeo.2013.11.020, 2014.
Funck, T.: Structure of the volcanic apron north of Gran Canaria deduced from reflection seismic, bathymetric and borehole data, Ph.D. dissertation, University of Kiel, 156 pp., 1996.
Giordano, D., Russell, J. K., and Dingwell, D. B.: Viscosity of magmatic liquids: a model, Earth Planet. Sc. Lett., 271, 123–134, https://doi.org/10.1016/j.epsl.2008.03.038, 2008.
Goto, Y. and McPhie, J.: Morphology and propagation styles of Miocene submarine basanite lavas at Stanley, northwestern Tasmania, Australia, J. Volcanol. Geoth. Res., 130, 307–328, https://doi.org/10.1016/S0377-0273(03)00311-1, 2004.
Grosse, P. and Kervyn, M.: Morphometry of terrestrial shield volcanoes, Geomorphology, 304, 1–14, https://doi.org/10.1016/j.geomorph.2017.12.017, 2018.
Greeley, R.: The role of lava tubes in Hawaiian volcanoes, U.S. Geological Survey Professional Paper 1350, 1589–1602, 1987.
Gregg, T. K. P. and Fornari, D. J.: Long submarine lava flows: Observations and results from numerical modeling, J. Geophy. Res., 103, 27517-27531, https://doi.org/10.1029/98JB02465, 1998.
Griffiths, R. W. and Fink, J. H.: Solidification and morphology of submarine lavas: A dependence on extrusion rate, J. Geophy. Res., 97, 19729–19737, https://doi.org/10.1029/92JB01594, 1992.
Griffiths, R. W.: The Dynamics of lava flows, Annu. Rev. Fluid Mech., 32, 477–518, https://doi.org/10.1146/annurev.fluid.32.1.477, 2000.
Hall, R.: Cenozoic geological and plate tectonic evolution of SE Asia and the SW Pacific: Computer-based reconstructions, model and animations, J. Asian Earth Sci., 20, 353–431, https://doi.org/10.1016/S1367-9120(01)00069-4, 2002.
He, Y. M. and Wen, L. X.: Seismic velocity structures and detailed features of the D′′ discontinuity near the core-mantle boundary beneath eastern Eurasia, Phys. Earth Planet. In., 189, 176–184, https://doi.org/10.1016/j.pepi.2011.09.002, 2011.
Holcomb, R. T., Moore, J. G., Lipman, P. W., and Belderson, R. H.: Voluminous submarine lava flows from Hawaiian volcanoes, Geology, 16, 400–404, https://doi.org/10.1130/0091-7613(1988)016<0400:VSLFFH>2.3.CO;2, 1988.
Ikegami, F., McPhie, J., Carey, R., Mundana, R., Soule, S. A., and Jutzeler, M.: The eruption of submarine rhyolite lavas and domes in the deep ocean–Havre 2012, Kermadec Arc, Front. Earth Sci., 6, 147, https://doi.org/10.3389/feart.2018.00147, 2018.
Jackson, C.A.-L.: Seismic reflection imaging and controls on the preservation of ancient sill-fed magmatic vents, J. Geol. Soc. London, 169, 503–506, https://doi.org/10.1144/0016-76492011-147, 2012.
Judd, A. G. and Hovland, M. (Eds.): Seabed Fluid Flow: The Impact on Geology, Biology and the Marine Environment, Cambridge University Press, Cambridge, 2007.
Jutzeler, M., Marsh, R., Carey, R. J., White, J. D., Talling, P. J., and Karlstrom, L.: On the fate of pumice rafts formed during the 2012 Havre submarine eruption, Nat. Commun., 5, 3660, https://doi.org/10.1038/ncomms4660, 2014.
Keen, C. E., Dafoe, L. T., and Dickie, K.: A volcanic province near the western termination of the Charlie-Gibbs Fracture Zone at the rifted margin, offshore northeast Newfoundland, Tectonics, 33, 1133–1153, https://doi.org/10.1002/2014TC003547, 2014.
Lester, R., Van Avendonk, H. J. A., McIntosh, K., Lavier, L., Liu, C. S., Wang, T. K., and Wu, F.: Rifting and magmatism in the northeastern South China Sea from wide-angle tomography and seismic reflection imaging, J. Geophy. Res., 119, 2305–2323, https://doi.org/10.1002/2013JB010639, 2014.
Li, C. F., Xu, X., Lin, J., Sun, Z., Zhu, J., Yao, Y. J., Zhao, X. X., Liu, Q. S., Kulhanek, D. K., Wang, J., Song, T. R., Zhao, J. F., Qiu, N., Guan, Y. X., Zhou, Z. Y., Williams, T., Bao, R., Briais, A., Brown, E. A., Chen, Y. F., Clift, P. D., Colwell, F. S., Dadd, K. A., Ding, W. W., Almeida, I. H., Huang, X. L., Hyun, S., Jiang, T., Koppers, A. A. P., Li, Q. Y., Liu, C. L., Liu, Z. F., Nagai, R. H., Peleo-Alampay, A., Su, X., Tejada, M. L. G., Trin, H. S., Yeh, Y. C., Zhang, C. L., Zhang, F., and Zhang, G. L.: Ages and magnetic structures of the South China Sea constrained by the deep tow magnetic surveys and IODP Expedition 349, Geochem. Geophy. Geosy., 15, 4958–4983, https://doi.org/10.1002/2014JB011686, 2014.
Li, C. F., Lin, J., Kulhanek, D. K., and the Expedition 349 Scientists: Proceedings of the International Ocean Discovery Program, 349, https://doi.org/10.14379/iodp.proc.349.103.2015, 2015.
Li, L., Clift, P. D., and Nguyen, H. T.: The sedimentary, magmatic and tectonic evolution of the southwestern South China Sea revealed by seismic stratigraphic analysis, Mar. Geophys. Res., 34, 341–365, https://doi.org/10.1007/s11001-013-9171-y, 2013.
Li, P. and Liang, H.: Cenozoic magmatism in the Pearl River Mouth Basin and its relationship to the basin evolution and petroleum accumulation, Guangdong Geology, 9, 23–34, 1994.
Lüdmann, T. and Wong, H. K.: Neotectonic regime on the passive continental margin of the northern South China Sea, Tectonophysics, 311, 113–138, https://doi.org/10.1016/S0040-1951(99)00155-9, 1999.
Lüdmann, T., Wong, H. K., and Wang, P.: Plio-Quaternary sedimentation processes and neotectonics of the northern continental margin of the South China Sea, Mar. Geol., 172, 331–356, https://doi.org/10.1016/S0025-3227(00)00129-8, 2001.
Magee, C., Hunt-Stewart, E., and Jackson, C.A.-L.: Volcano growth mechanisms and the role of sub-volcanic intrusions: Insights from 2-D seismic reflection data, Earth Planet. Sc. Lett., 373, 41–53, https://doi.org/10.1016/j.epsl.2013.04.041, 2013.
Miles, A. and Cartwright, J.: Hybrid flow sills: A new mode of igneous sheet intrusion, Geology, 38, 343–346, https://doi.org/10.1130/G30414.1, 2010.
Newman, S. and Lowenstern, J. B.: VolatileCalc: a silicate melt-H2O-CO2 solution model written in Visual Basic for excel, Comput. Geosci., 28, 597–604, https://doi.org/10.1016/S0098-3004(01)00081-4, 2002,
Planke, S., Symonds, P., Alvestad, E., and Skogseid, J.: Seismic volcanostratigraphy of large-volume basaltic extrusive complexes on rifted margins, J. Geophy. Res., 105, 19335–19351, https://doi.org/10.1029/1999JB900005, 2000.
Qin, G. Q.: Application of micropaleontology to the sequence stratigraphic studies of late Cenozoic in the Pearl River Mouth Basin, Mar. Geol. Quat. Geol., 16, 1–18, 1996.
Reynolds, P., Holford, S., Schofield, N., and Ross, A.: Three-dimensional seismic imaging of ancient submarine lava flows: an example from the southern Australian margin, Geochem. Geophy. Geosy., 18, 3840–3853, https://doi.org/10.1002/2017GC007178, 2017.
Reynolds, P., Schofield, N., Brown, R. J., and Holford, S. P.: The architecture of submarine monogenetic volcanoes-insights from 3-D seismic data, Basin Res., 30, 437–451, https://doi.org/10.1111/bre.12230, 2018.
Robinson, J. E. and Eakins, B. W.: Calculated volumes of individual shield volcanoes at the young end of the Hawaiian Ridge, J. Volcanol. Geoth. Res., 151, 309–617, https://doi.org/10.1016/j.jvolgeores.2005.07.033, 2006.
Ru, K. and Pigott, J. D.: Episodic rifting and subsidence in the South China Sea, AAPG Bull., 9, 1136–1155, 1986.
Shi, X., Kohn, B., Spencer, S., Guo, X., Li, Y., Yang, X., Shi, H., and Gleadow, A.: Cenozoic denudation history of southern Hainan Island, South China Sea: constraints from low temperature thermochronology, Tectonophysics, 504, 100–115, https://doi.org/10.1016/j.tecto.2011.03.007, 2011.
Sibuet, J.-C., Yeh, Y.-C., and Lee, C.-S.: Geodynamics of the South China Sea, Tectonophysics, 692, 98–119, https://doi.org/10.1016/j.tecto.2016.02.022, 2016.
Somoza, L., Gonzalez, F. J., Barker, S. J., Madureira, P., Medialdea, T., de Ignacio, C., Lourenco, N., Leon, R., Vazquez, J. T., and Palomino, D.: Evolution of submarine eruptive activity during the 2011–2012 El Hierro event as documented by hydroacoustic images and remotely operated vehicle observations, Geochem. Geophy. Geosy., 18, 3109–3137, https://doi.org/10.1002/2016GC006733, 2017.
Sun, Q. L., Wu, S. G., Cartwright, J., and Dong, D. D.: Shallow gas and focused fluid flow systems in the Pearl River Mouth Basin, northern South China Sea, Mar. Geol., 315–318, 1–14, https://doi.org/10.1016/j.margeo.2012.05.003, 2012.
Sun, Q. L., Wu, S. G., Cartwright, J., Wang, S. H., Lu, Y. T., Chen, D. X., and Dong, D. D.: Neogene igneous intrusions in the northern South China Sea: evidence from high resolution three dimensional seismic data, Mar. Petrol. Geol., 54, 83–95, https://doi.org/10.1016/j.marpetgeo.2014.02.014, 2014.
Sun, Q. L., Xie, X. N., Piper, D. J. W., Wu, J., and Wu, S. G.: Three dimensional seismic anatomy of multi-stage mass transport deposits in the Pearl River Mouth Basin, northern South China Sea: Their ages and kinematics, Mar. Geol., 393, 93–108, https://doi.org/10.1016/j.margeo.2017.05.005, 2017.
Sun, Z., Xu, Z., Sun, L., Pang, X., Yan, C., Li, Y., Zhao, Z., Wang, Z., and Zhang, C.: The mechanism of post-rift fault activities in the Baiyun Sag, Pearl River Mouth Basin, J. Asian Earth Sci., 89, 76–87, https://doi.org/10.1016/j.jseaes.2014.02.018, 2014.
Taylor, B. and Hayes, D. E.: Origin and history of the South China Sea Basin, in: The Tectonic and Geologic Evolution of Southeast Asian Seas and Islands, edited by: Hayes, D. E., AGU, Washington, DC, 23–56, 1983.
Thomson, K.: Determining magma flow in sills, dykes and laccoliths and their implications for sill emplacement mechanisms, B. Volcanol., 70, 183–201, https://doi.org/10.1007/s00445-007-0131-8, 2007.
Thomson, K. and Hutton, D.: Geometry and growth of sill complexes: Insights using 3-D seismic from the North Rockall Trough, B. Volcanol., 66, 364–375, https://doi.org/10.1007/s00445-003-0320-z, 2004.
Tu, K., Flower, M. F. J., Carlson, R. W., Zhang, M., and Xie, G.: Sr, Nd, and Pb isotopic compositions of Hainan basalts (south China): implications for a subcontinental lithosphere Dupal source, Geology, 19, 567–569, https://doi.org/10.1130/0091-7613(1991)019<0567:SNAPIC>2.3.CO;2, 1991.
Walker, G. P. L.: Basaltic-volcano systems, in: Magmatic Processes and Plate Tectonics, edited by Pritchard, H.M., Alabaster, T., Harris, N.B.W., and Neary, C.R., Geol. Soc. Spec. Pub., 76, 3–38, 1993.
Wang, P., Prell, W. L., and ODP 184 scientists: Proceedings of the Ocean Drilling Program, Initial Reports, 184, Ocean Drilling Program, College Station, TX 2000, 2000.
Wang, T. K., Chen, M. K., Lee, C. S., and Xia, K. Y.: Seismic imaging of the transitional crust across the northeastern margin of the South China Sea, Tectonophysics, 412, 237–254, https://doi.org/10.1016/j.tecto.2005.10.039, 2006.
Wei, X. D., Ruan, A. G., Zhao, M. H., Qiu, X. L., Li, J. B., Zhu, J. J., Wu, Z. L., and Ding, W. W.: A wide-angle OBS profile across the Dongsha uplift and Chaoshan depression in the mid-northern South China Sea, Chinese J. Geophys.-CH., 54, 3325–3335, https://doi.org/10.3969/j.issn.0001-5733.2011.12.030, 2011.
Wheeler, P. and White, N.: Quest for dynamic topography: observations from Southeast Asia. Geology, 28, 963–966, https://doi.org/10.1130/0091-7613(2000)28<963:QFDTOF>2.0.CO;2, 2000.
Wu, S. G., Gao, J. W., Zhao, S. J., Lüdmann, T., Chen, D. X., and Spence, G.: Post-rift uplift and focused fluid flow in the passive margin of Northern South China Sea, Tectonophysics, 615–616, 27–39, https://doi.org/10.1016/j.tecto.2013.12.013, 2014.
Xia, S. H., Zhao, D. P., Sun, J. L., and Huang, H. B.: Teleseismic imaging of the mantle beneath southernmost China: new insights into the Hainan plume, Gondwana Res., 36, 33–43, https://doi.org/10.1016/j.gr.2016.05.003, 2016.
Xie, Z. Y., Sun, L. T., Pang, X., Zheng, J. Y., and Sun, Z.: Origin of the Dongsha Event in the South China Sea: Mar. Geophys. Res., 38, 357–371, https://doi.org/10.1007/s11001-017-9321-8, 2017.
Xu, S. C., Yang, S. K., and Huang, L. F.: The application of sequence stratigraphy to stratigraphic correlation, Earth Sci. Front., 2, 115–123, 1995.
Yan, P., Zhou, D., and Liu, Z. S.: A crustal structure profile across the northern continental margin of the South China Sea, Tectonophysics, 338, 1–21, https://doi.org/10.1016/S0040-1951(01)00062-2, 2001.
Yan, P., Deng, H., Liu, H. L., Zhang, Z., and Jiang, Y.: The temporal and spatial distribution of volcanism in the South China Sea region, J. Asian Earth Sci., 27, 647–659, https://doi.org/10.1016/j.jseaes.2005.06.005, 2006.
Yan, P., Wang, Y. L., Liu, J., Zhong, G. J., and Liu, X. J.: Discovery of the southwest Dongsha Island mud volcanoes amid the northern margin of the South China Sea, Mar. Petrol. Geol., 88, 858–870, https://doi.org/10.1016/j.marpetgeo.2017.09.021, 2017.
Yang, S., Qiu, Y., and Zhu, B.: Atlas of Geology and Geophysics of the South China Sea, China Navigation Publications, Tianjin, 2015.
Yu, H. S.: Structure, stratigraphy and basin subsidence of Tertiary basins along the Chinese southeastern continental margin, Tectonophysics, 253, 63–76, 1994.
Zhang, N. and Li, Z. X.: Formation of mantle “lone plumes” in the global downwelling zone – A multiscale modelling of subduction-controlled plume generation beneath the South China Sea, Tectonophysics, 723, 1–13, https://doi.org/10.1016/j.tecto.2017.11.038, 2018.
Zhao, F., Wu, S. G., Sun, Q. L., Huuse, M., Li, W., and Wang, Z. J.: Submarine volcanic mounds in the Pearl River Mouth Basin, northern South China Sea, Mar. Geol., 355, 162–172, https://doi.org/10.1016/j.margeo.2014.05.018, 2014.
Zhao, F., Alves, T. M., Wu, S. G., Li, W., Huuse, M., Mi, L. J., Sun, Q. L., and Ma, B. J.: Prolonged post-rift magmatism on highly extended crust of divergent continental margins (Baiyun Sag, South China Sea), Earth Planet. Sc. Lett., 445, 79–91, https://doi.org/10.1016/j.epsl.2016.04.001, 2016.
Zhao, S. J., Wu, S. G., Shi, H. S., Dong, D. D., Chen, D. X., and Wang, Y.: Structures and dynamic mechanism related to the Dongsha Event at the northern margin of the South China Sea, Prog. Geophys., 27, 1008–1019, https://doi.org/10.6038/j.issn.1004-2903.2012.03.022, 2012.
Zou, H., Li, P., and Rao, C.: Geochemistry of Cenozoic volcanic rocks in Zhu Jiangkou Basin and its geodynamic significance, Geochimica, 24, 33–45, 1995.