the Creative Commons Attribution 4.0 License.
the Creative Commons Attribution 4.0 License.
 | 07 Mar 2019
Calibrating a new attenuation curve for the Dead Sea region using surface wave dispersion surveys in sites damaged by the 1927 Jericho earthquake
Yaniv Darvasi
Amotz Agnon
Instrumental strong motion data are not common around the Dead Sea region. Therefore, calibrating a new attenuation equation is a considerable challenge. However, the Holy Land has a remarkable historical archive, attesting to numerous regional and local earthquakes. Combining the historical record with new seismic measurements will improve the regional equation.
On 11 July 1927, a rupture, in the crust in proximity to the northern Dead Sea, generated a moderate 6.2 ML earthquake. Up to 500 people were killed, and extensive destruction was recorded, even as far as 150 km from the focus. We consider local near-surface properties, in particular, the shear-wave velocity, as an amplification factor. Where the shear-wave velocity is low, the seismic intensity far from the focus would likely be greater than expected from a standard attenuation curve. In this work, we used the multichannel analysis of surface waves (MASW) method to estimate seismic wave velocity at anomalous sites in Israel in order to calibrate a new attenuation equation for the Dead Sea region.
Our new attenuation equation contains a term which quantifies only lithological effects, while factors such as building quality, foundation depth, topography, earthquake directivity, type of fault, etc. remain out of our scope. Nonetheless, about 60 % of the measured anomalous sites fit expectations; therefore, this new ground-motion prediction equation (GMPE) is statistically better than the old ones.
From our local point of view, this is the first time that integration of the 1927 historical data and modern shear-wave velocity profile measurements improved the attenuation equation (sometimes referred to as the attenuation relation) for the Dead Sea region. In the wider context, regions of low-to-moderate seismicity should use macroseismic earthquake data, together with modern measurements, in order to better estimate the peak ground acceleration or the seismic intensities to be caused by future earthquakes. This integration will conceivably lead to a better mitigation of damage from future earthquakes and should improve maps of seismic hazard.
- Article
(15393 KB) - Full-text XML
-
Supplement
(23012 KB) - BibTeX
- EndNote


Generating a modern and applicable attenuation equation is one of applied seismologists' main interests. Considering the Dead Sea area, for which instrumental strong motion data are not available, this task is particularly challenging. Using the Holy Land's historically rich database, researchers had defined seismic intensities and estimated earthquake locations. Investigating anomalous sites, with seismic intensities higher or lower than predicted from the basic regional attenuation relation, may lead to a better attenuation equation. The local geological conditions can strongly influence the nature and severity of shaking at a given site. Assessing the local geological conditions by geophysical techniques at these anomalous sites, and adding a logarithmic term to a basic attenuation equation, should improve the equation.
This work focuses on the 1927 event, but it is part of wider research which extends to additional earthquakes. The 1927 event was chosen as it is the only devastating one recorded, albeit teleseismically, during the instrumented period.
Our main goal in this research is a tighter constraint on the attenuation equation derived from this event. This should allow us to examine whether this preliminary work coincides with our expectations of site amplification and de-amplification due to the local lithology.
1.1 Site response
Ground motion is controlled by a number of variables, including source characteristics, source distance, propagation directivity, near-surface geology, etc. The elastic properties of near-surface materials and their effect on seismic wave propagation are crucial to earthquake and civil engineering, and environmental and Earth science studies.
Seismic surface waves are initiated at the moment that the earthquake wave front impinges on the surface. These waves spread out, and the surface shakes as they pass. Surface wave amplitude at the surface is controlled by the mechanical properties of the rocks below. These often consist of low-velocity weathered rock over bedrock with much higher velocities. When seismic waves pass from a high-velocity layer to a low-velocity layer, their amplitudes and duration typically increase. The phenomena of site amplification, as a result of soft sediments overlying hard bedrock, is well known since the early days of seismology (Milne, 1898). Site effects are also well known and were investigated after several major earthquakes: Mexico City 1985 (Singh et al., 1988), Yerevan 1989 (Borcherdt et al., 1989), San Francisco 1989 (Hough et al., 1990), Los Angeles 1994 (Hall et al., 1994) and Kobe 1995 (Aguirre and Irikura, 1997). Therefore, local lithology is a crucial factor for estimating site amplification, defined as the amplitude ratio between the surface layer and the underlying bedrock. Site amplification at a specific site can be attributed to many factors, such as basin effects, focusing effects, topography and reverberation of the seismic waves in the upper layers due to acoustic impedance differences (Fig. 1).
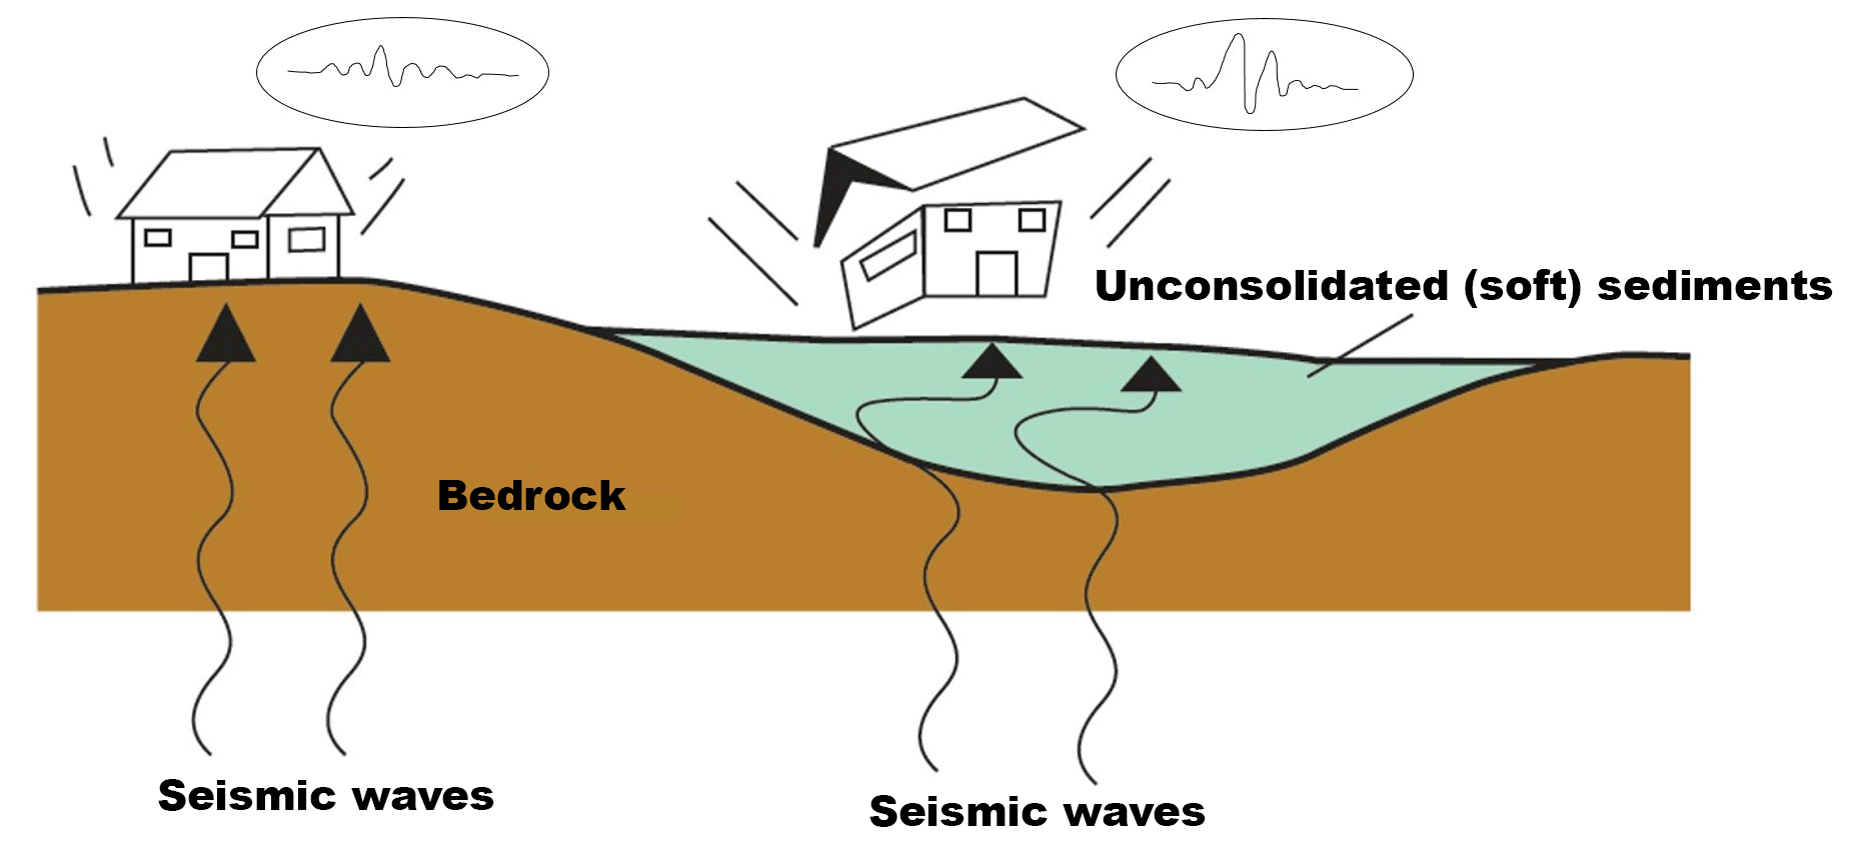
Figure 1Schematic view of site amplification. Seismogram at the surface shows amplification in comparison to the seismogram located over the bedrock (modified after Ciaccio and Cultrera, 2014).
The amplification, A, is proportional to the reciprocal square root of the product of the shear-wave velocity, Vs (Eq. 1) (Aki and Richards, 2002):
where ρ is the density of the investigated soil. As shear-wave velocity decreases by a given fraction, the amplification increases by half that fraction (for a constant density). Since density plays a minor role (Dal Moro, 2014; Xia et al., 1999), the Vs value can be used to represent site conditions.
The most widely used index in the classification of the soil response is the average shear-wave velocity in the uppermost 30 m, the . This index was accepted for site classification in the US National Earthquake Hazards Reduction Program (NEHRP) (Building Seismic Safety Council, 2001). In Europe, by the new provisions of Eurocode 8 (CEN, 2011), and in Israel, it is accepted by the design provisions for earthquake resistance of structures – SI 413 (The Standards Institution of Israel, 2013). The value of 30 m comes from the US and European building codes, where it was found empirically that this depth is directly proportional to deeper and shallower values (Boore et al., 2011). Zaslavsky et al. (2012) argued that the use of is a simplification that cannot be justified in the complex geological conditions in Israel, yet no alternatives have thus far been proposed. Therefore, in this scenario, the Standards Institution of Israel still adopts the index.
In modern attenuation equations, also known as ground-motion prediction equations (GMPEs), coefficients are derived from strong motion data, namely from ground acceleration measurements. In the past, and in areas lacking the technology to record earthquakes, it was impossible to measure the peak ground acceleration (PGA) directly. Therefore, it is common to categorize historical earthquakes with seismic intensity scales that describe the damage at each site or area (Ambraseys, 2009; Guidoboni and Comastri, 2005).
1.2 The 6.2 ML 1927 Jericho earthquake
The left-lateral Dead Sea transform separates the Sinai–Levant Block from the Arabian Plate (Fig. 2). The 6.2 ML 11 July 1927 Jericho earthquake (Ben-Menahem et al., 1976; Shapira, 1979) was the strongest and most destructive earthquake to hit the Holy Land during that century. Furthermore, it was the first to be instrumentally recorded by seismographs. The epicentral location was originally estimated to be a few kilometers south of the Damia Bridge, which is 30 km north of Jericho (International Seismological Summary – ISS Bulletin of 1927). In the following decades, new estimates have been published: Shapira et al. (1993) calculated the epicenter to be near Mitzpe Shalem. Zohar and Marco (2012) estimated the epicenter to be near the Almog settlement, about 30 km north of Shapira's epicenter, and Kagan et al. (2011) surmised that the source was somewhere on the Kalia fault, located in the northern part of the Dead Sea graben, perpendicular to the main Dead Sea fault (Fig. 2).
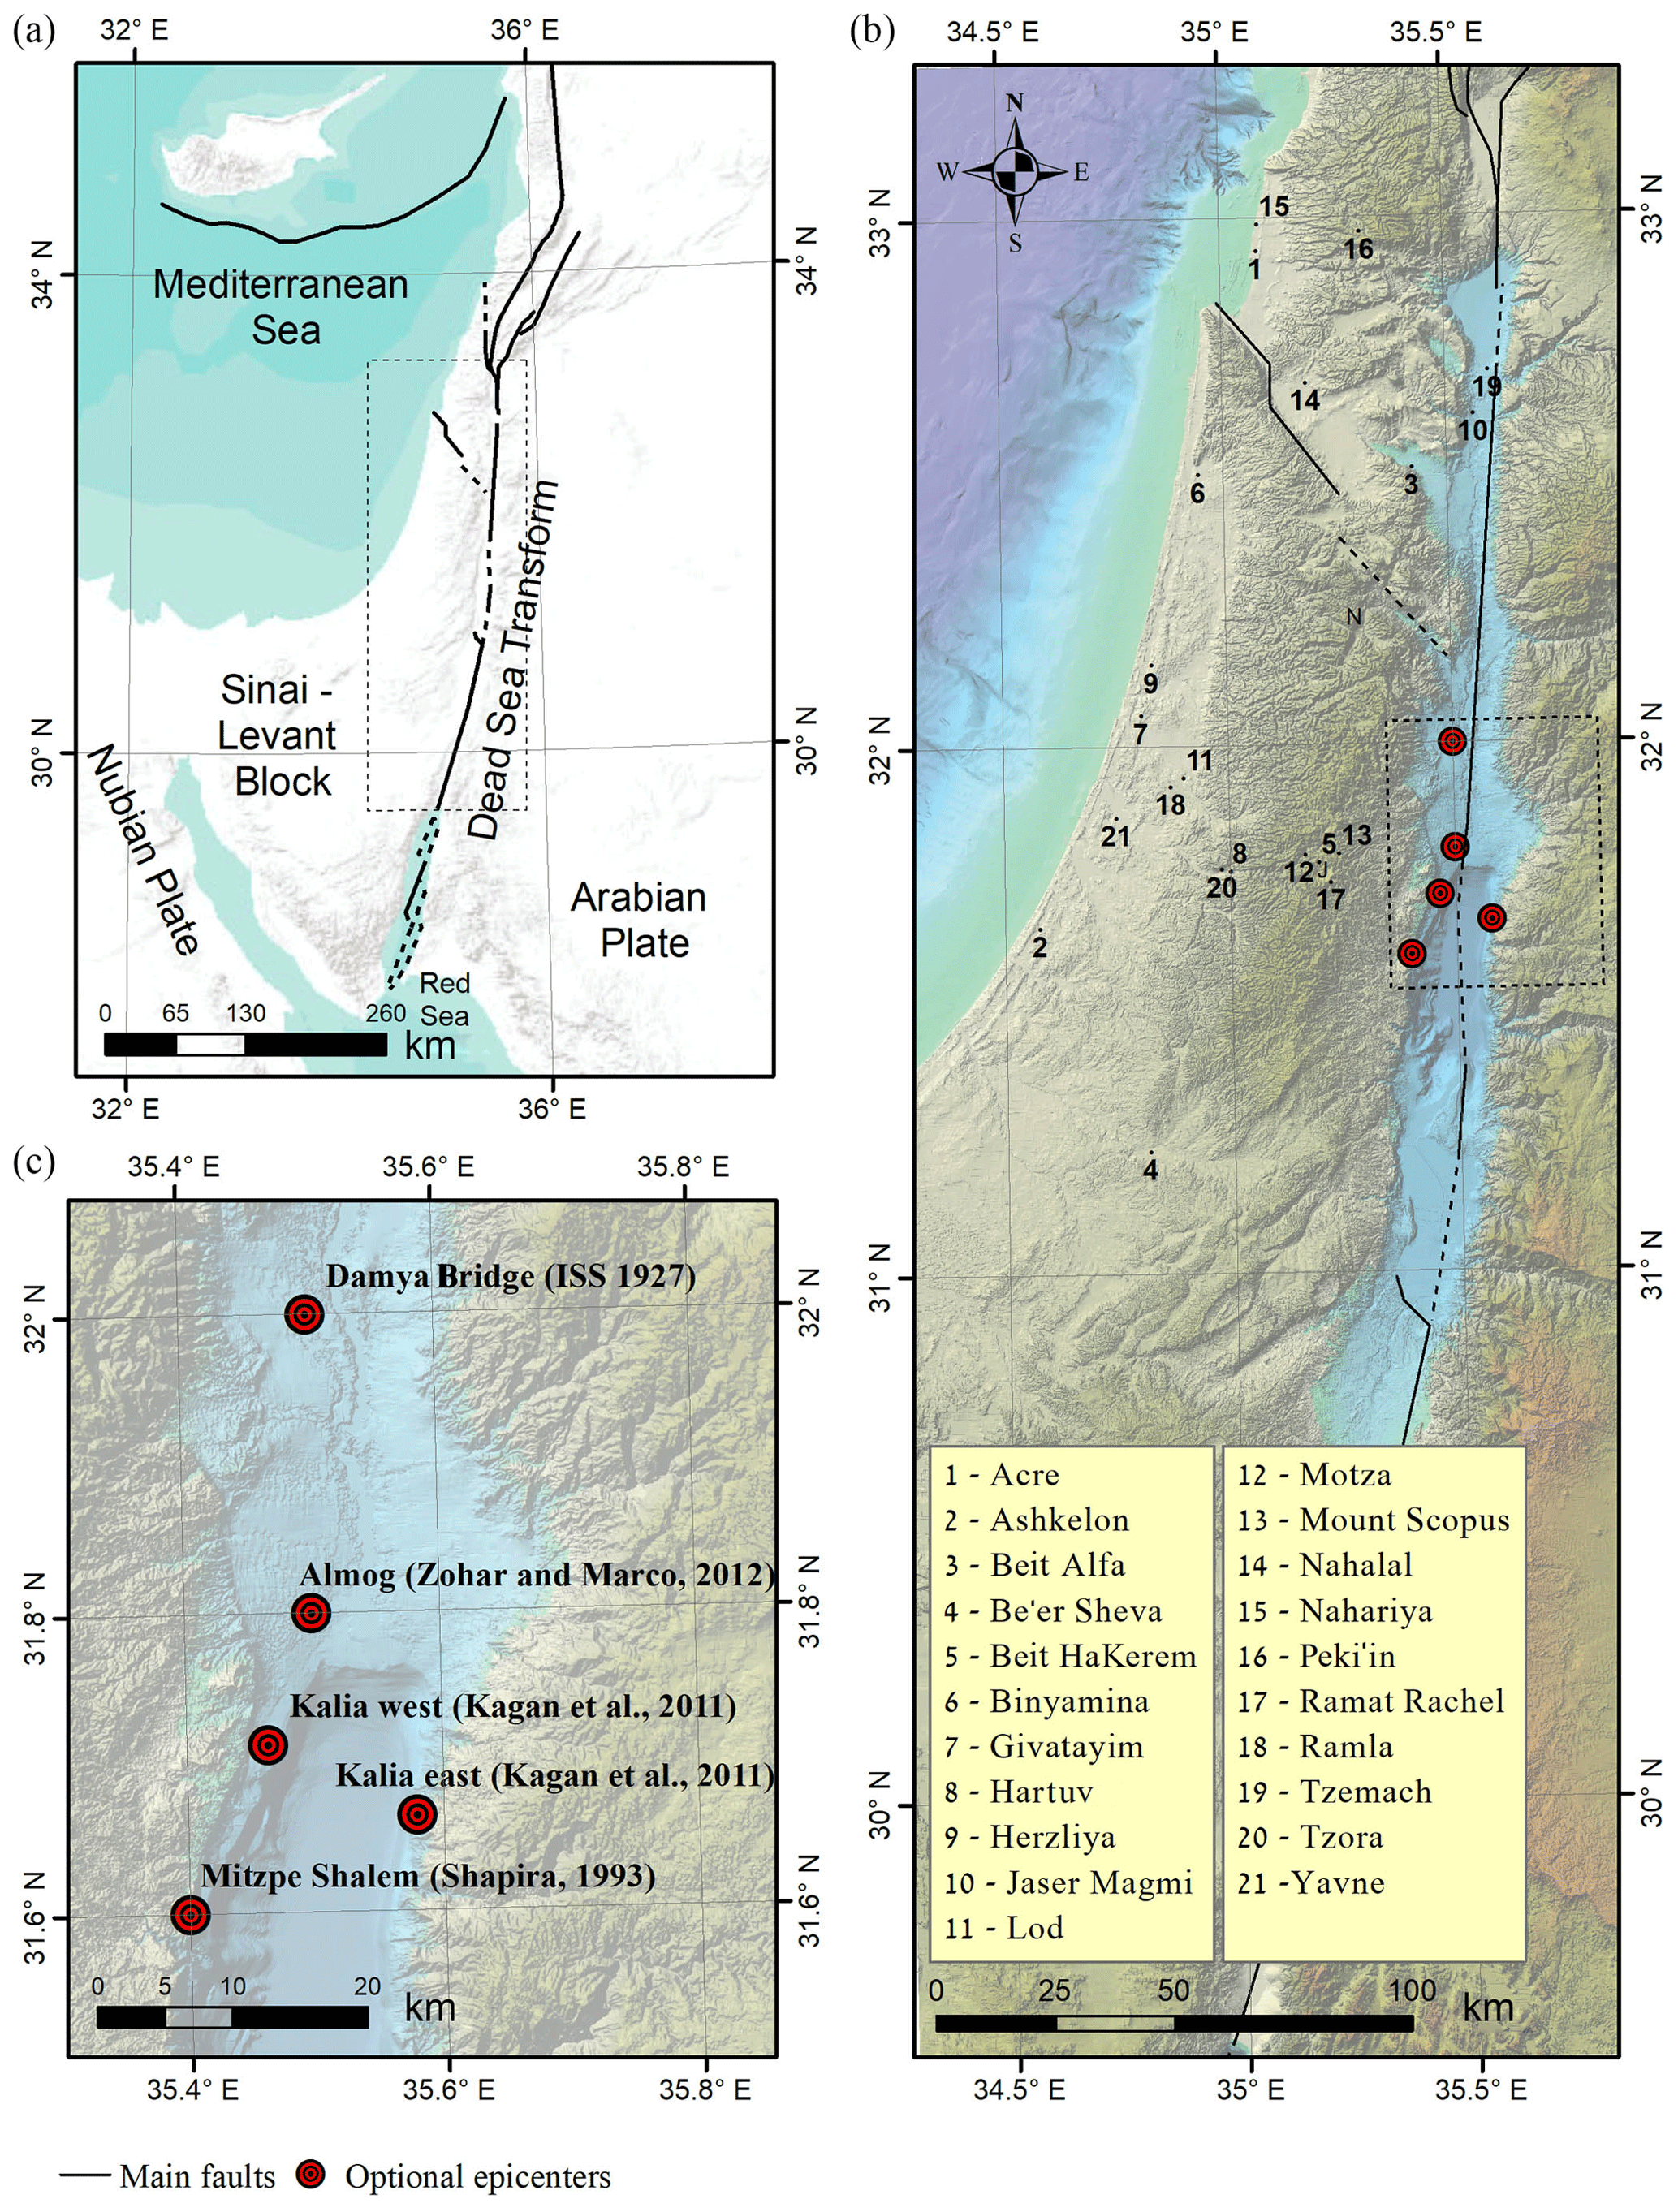
Figure 2Research area: (a) Middle East area with the main tectonic elements. (b) Proposed epicenters for the 1927 earthquake event with all sites that were investigated placed over a 25 m digital terrain model (DTM) image (Hall, 2008). (c) Detailed location of the proposed epicenters. Also shown are sites mentioned in the text: Jerusalem (J) and Nablus (N).
The damage from the earthquake was heavy, especially in places near the source but not only there. In Nablus, located 70 km from the epicenter (Fig. 2), 60 people were killed, 474 were injured, and more than 700 structures were destroyed, most of which were built on soft sediments (Blanckenhorn, 1927; Willis, 1928). By comparison, Jerusalem is only about 30 km from the source and the damage there was much smaller, especially in property. However, at Mount Scopus and the Mount of Olives (eastern neighborhoods in Jerusalem), the damage exceeded that in other parts of Jerusalem (Abel, 1927; Brawer, 1928). Other cities also suffered from this earthquake. Tens of people were injured and even died, and hundreds of houses were ruined in Ramla and Lod (Brawer, 1928). Jericho in the Jordan Valley also suffered significant damage, especially in terms of buildings collapsing (Fig. 3). The total number of victims was about 350–500 (Ambraseys and Melville, 1988; Amiran, 1952; Arieh, 1967; Ben-Menahem, 1991). Beyond the casualties, several environmental effects were reported. The Jordan River flow ceased near the Damia Bridge for about 21.5 h (Willis, 1928) and a 1 m seiche wave was observed in the Dead Sea (Abel, 1927; Blanckenhorn, 1927). Some evidence suggests that the earthquake was felt up to 700 km from the epicenter (Ben-Menahem, 1991), although a different interpretation suggests this distance was only 300 km (Ambraseys and Melville, 1988).
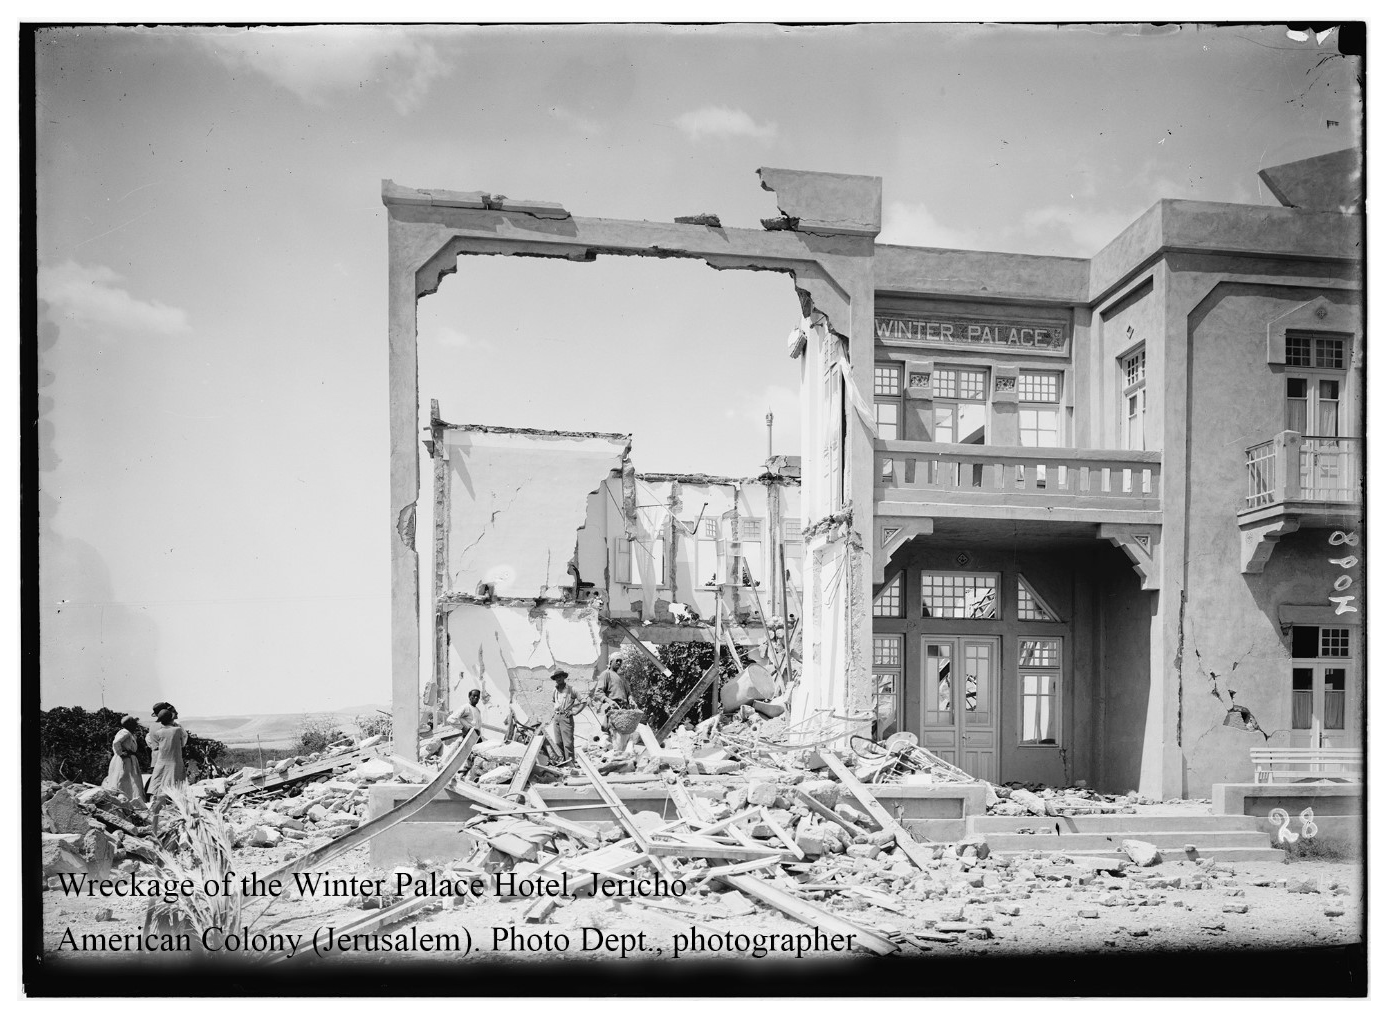
Figure 3Wreckage of the Winter Palace Hotel, Jericho, after the 1927 earthquake. American Colony (Jerusalem). Photo Dept., photographer.
Compiling historical evidence, Avni (1999), in his PhD thesis, estimated the seismic intensities (MSK or the Medvedev–Sponheuer–Karnik scale) (Medvedev et al., 1965) at 133 different locations around Israel, Palestine, Jordan, Lebanon, Syria and Egypt (Fig. 4 for locations and the Supplement). The curve that Avni (1999) fit to his scattered MSK vs. d points represents his basic attenuation equation and had an R2 of about 0.26. Based on the methodology proposed by Bakun and Wentworth (1997), Hough and Avni (2011) published a new attenuation equation for the Dead Sea region:
where MMI is the modified Mercalli intensity (assumed to be equivalent to MSK), M is the magnitude, and d is the distance from the epicenter.
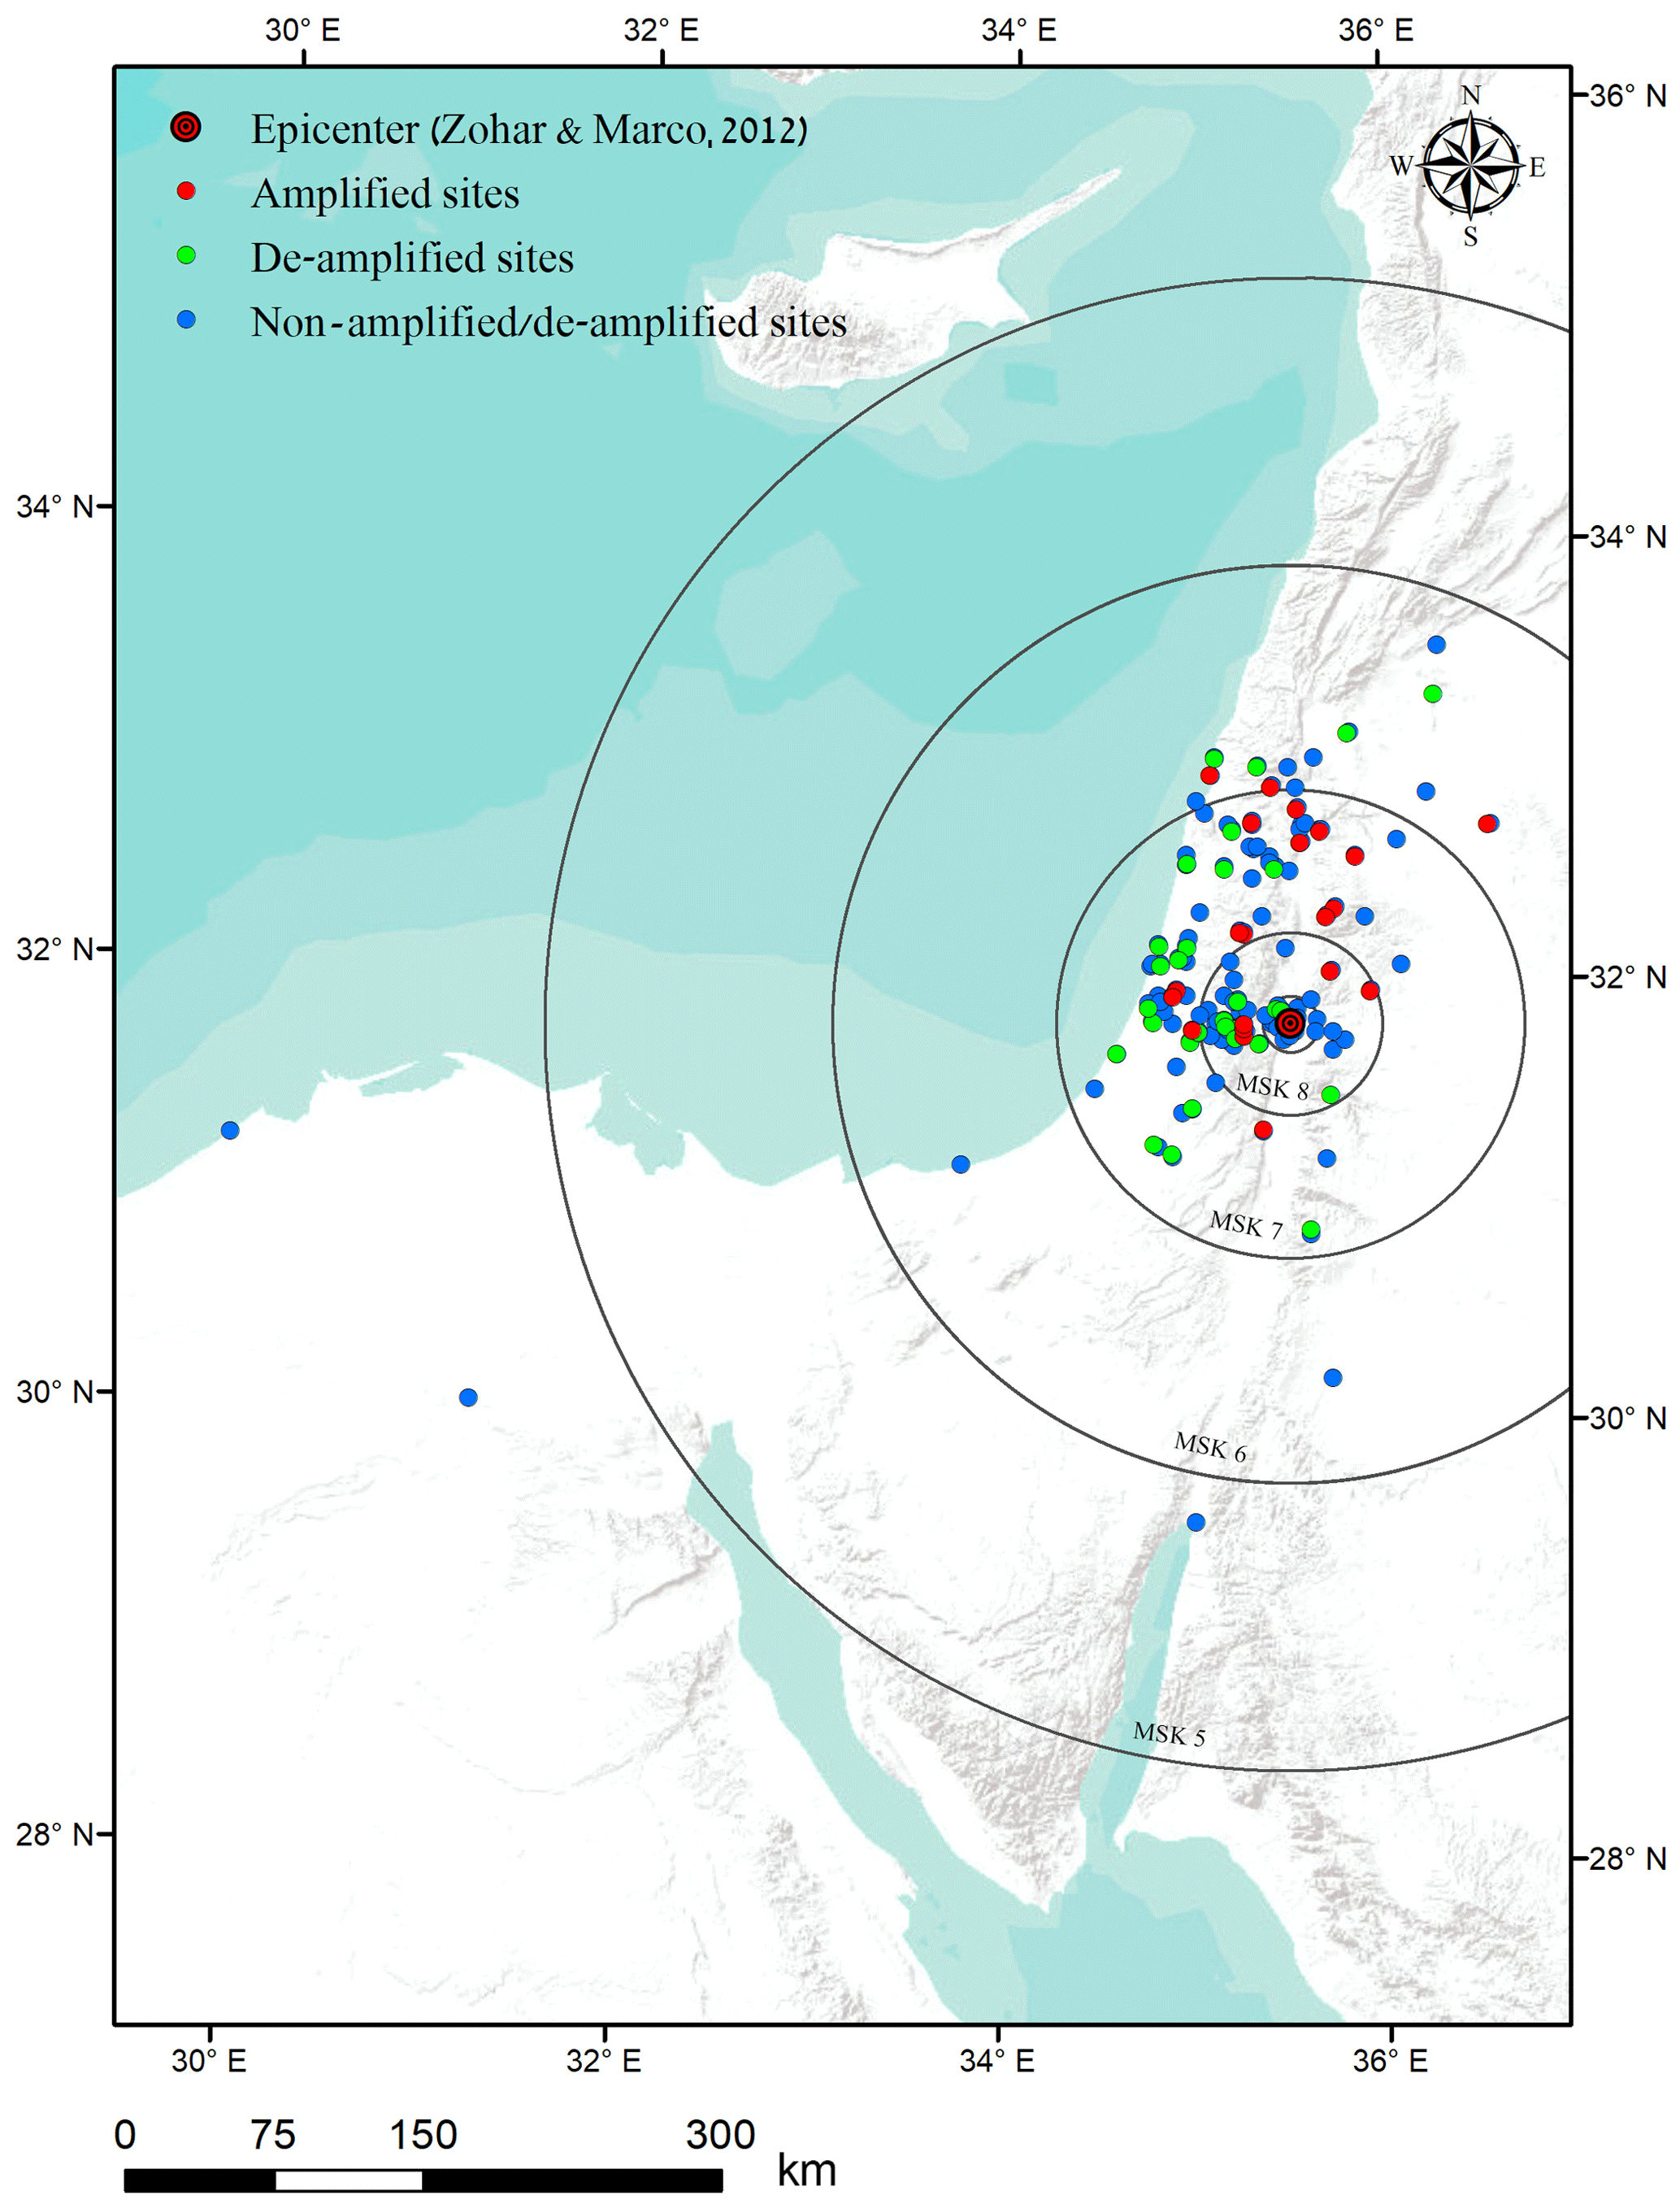
Figure 4Isoseismal map. The epicentral location is in red and black circles. Red and green dots are suspected amplified or de-amplified sites (respectively). Blue dots are sites which have MSK values expected from the attenuation equation (with a 60 % prediction boundary).
The multichannel analysis of surface waves (MASW) method is environmentally friendly, non-invasive, low cost, rapid and robust, and provides reliable data (Xia et al., 2002). Multichannel shallow seismic surveys make it possible to separate different wave fields in the frequency and velocity domains. Fundamental and higher modes can be analyzed simultaneously, but generally, only the fundamental mode is used because it has the highest energy (Park et al., 1998).
The MASW method consists of three main steps: (a) acquisition of experimental data, (b) signal processing to obtain the experimental dispersion curve and (c) inversion to estimate (Fig. 5). The inverse problem consists of estimating a set of parameters that describe the soil deposit, based on an experimental dispersion curve. Inversion problems based on wave propagation theory cannot be solved in a direct way due to their non-linearity. Thus, iterative methods must be used where a theoretical dispersion curve is determined for a given layer model and compared to the previously obtained experimental dispersion curve (Ryden et al., 2004). typically does not converge to a single stable value. In other words, for the same dispersion curve, one will get slightly different depending on the initial model.
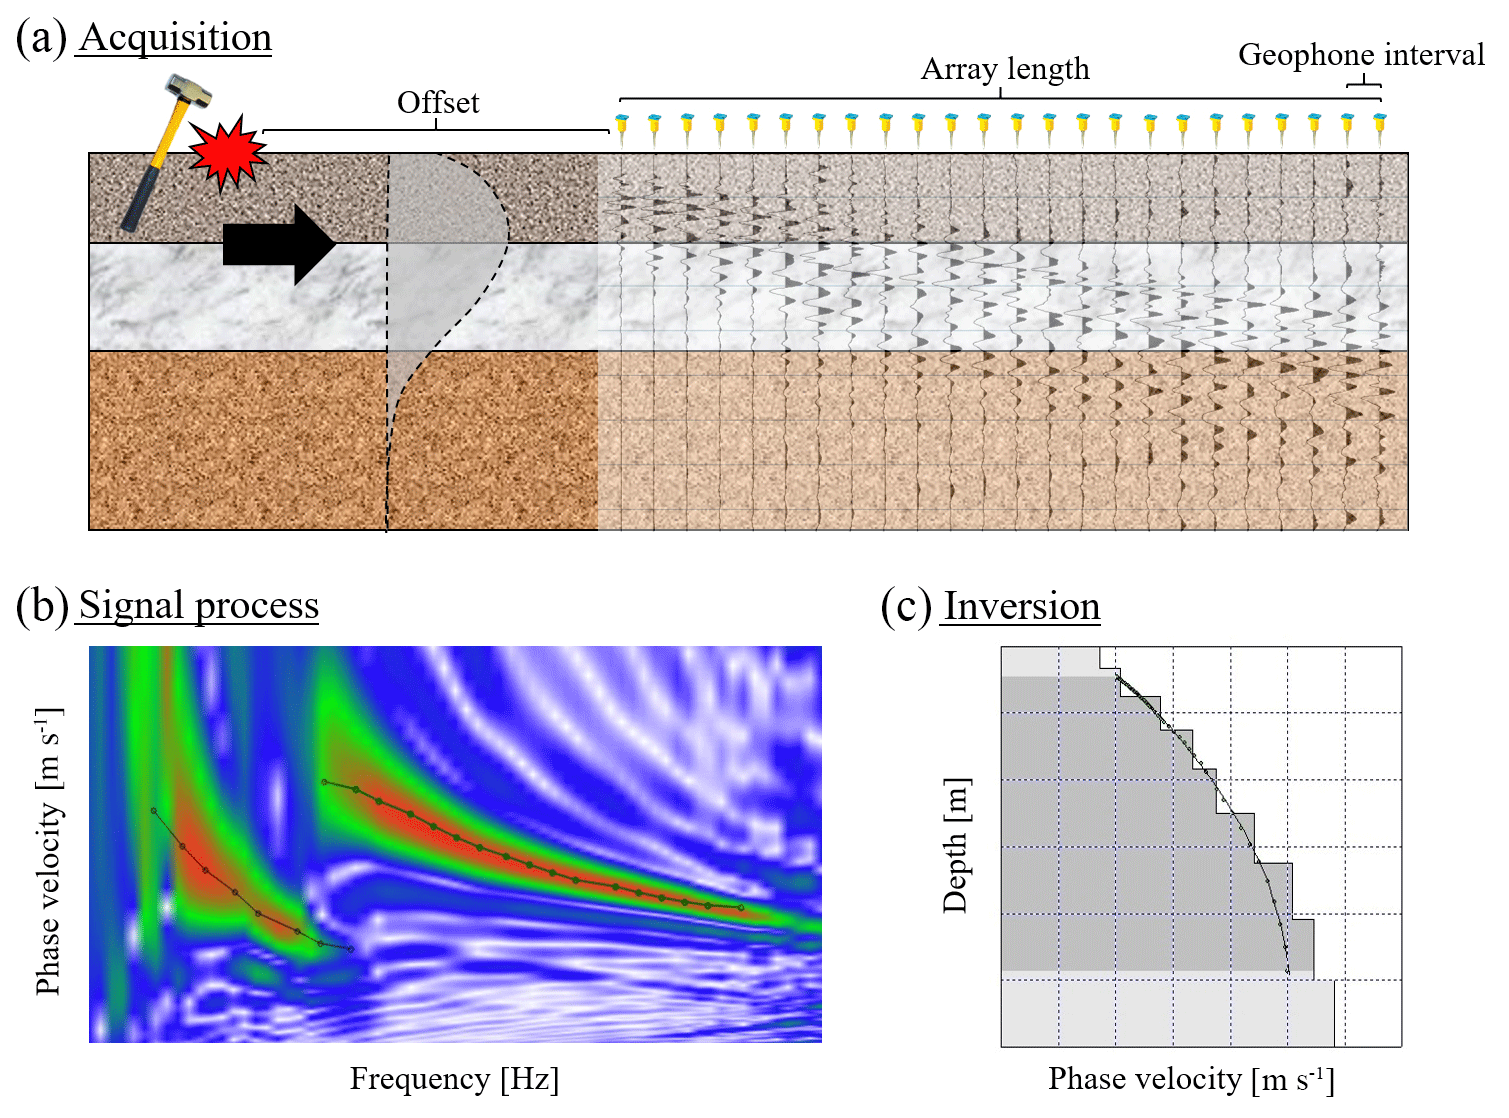
Figure 5Multichannel analysis of surface waves (MASW) technique: (a) acquisition – using a sledgehammer as an artificial source and a linear array of geophones that receives all wavelets. (b) Signal process – a fundamental mode and first higher mode over the dispersion image. (c) Inversion – final Vs profile which best fits the dispersion curve.
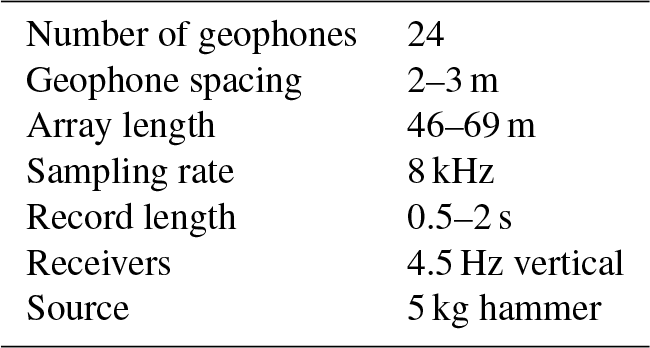
We carried out the surveys with a linear array of 24 vertical geophones (R. T. Clark's geophones with a natural frequency of 4.5 Hz) at equal intervals of 2–3 m over a total length of 46–69 m. For the survey sound source, we used a 5 kg sledgehammer striking a 20 cm square aluminum plate at variable offsets of 5, 10, 15, 20, 25 and 30 m (both forward and reversed) (Fig. 6a). The seismic data were recorded on a Geometrics Geode seismograph at a sampling rate mostly of 8 kHz for 0.5–2 s (Table 1). For an acceptable signal-to-noise ratio, we used the so-called “vertical stacking” approach, which is a summation of multiple synchronized repetitions of the test (usually five times).

Figure 6Data processing with WinMASW® (example from Binyamina): (a) raw data of four different offsets. (b) The four relative dispersion images calculated from the raw data. (c) Best dispersion image (offset 15): pink dots are the analyst's dispersion curve picking. The blue line and yellow dashed lines are, respectively, the best and the mean curves from the final model. (d) Shear-wave velocity model (blue profile for the best one and red dashed line is the mean profile from 100 lower rms).
Rayleigh wave dispersion curves are obtained by the MASW module of the RadExPro® software, whose calculation procedure is based on a paper by Park et al. (1998), and also by the WinMASW® software. From all the dispersion images that we calculated from each offset shot (Fig. 6b), we chose the smoothest and clearest one (Fig. 6c) to compute the site's profile. An inversion process then finds the shear-wave velocity profile whose theoretical dispersion curve is as close as possible to the experimental curve (Fig. 6d). The data and coefficients are automatically inverted via genetic algorithms which represent an optimization procedure belonging to the classification of global-search methods. Genetic algorithms are commonly used to generate high-quality solutions to optimization and search problems by relying on bio-inspired operators such as mutation, crossover and selection compared to traditional linear inversion methods based on gradient methods (Jacobian matrix). These inversion techniques produce a very reliable result in terms of precision and completeness (Dal Moro et al., 2007).
From 24 surveys, we succeeded in extracting for 19 of the 20 sites studied (the Hartuv data were too noisy for interpretation) (Table 2 and the Supplement). These would be used to recalibrate the attenuation equation arrived at by previous investigators at 19 of the 133 sites.

3.1 Velocity model
All ground models were considered to be a stack of horizontal homogeneous elastic layers, neglecting lateral variations in soil properties. The number of unknowns for a layered model, when considering only shear-wave velocity, is three for each layer: density, thickness and one elastic constant. Therefore, the number of unknowns is 3n−1 (where n represents the number of layers). The change in density with depth is usually small in comparison to the change in shear modulus and is normally neglected (Park et al., 1997).
3.2 Number of layers and layer thicknesses
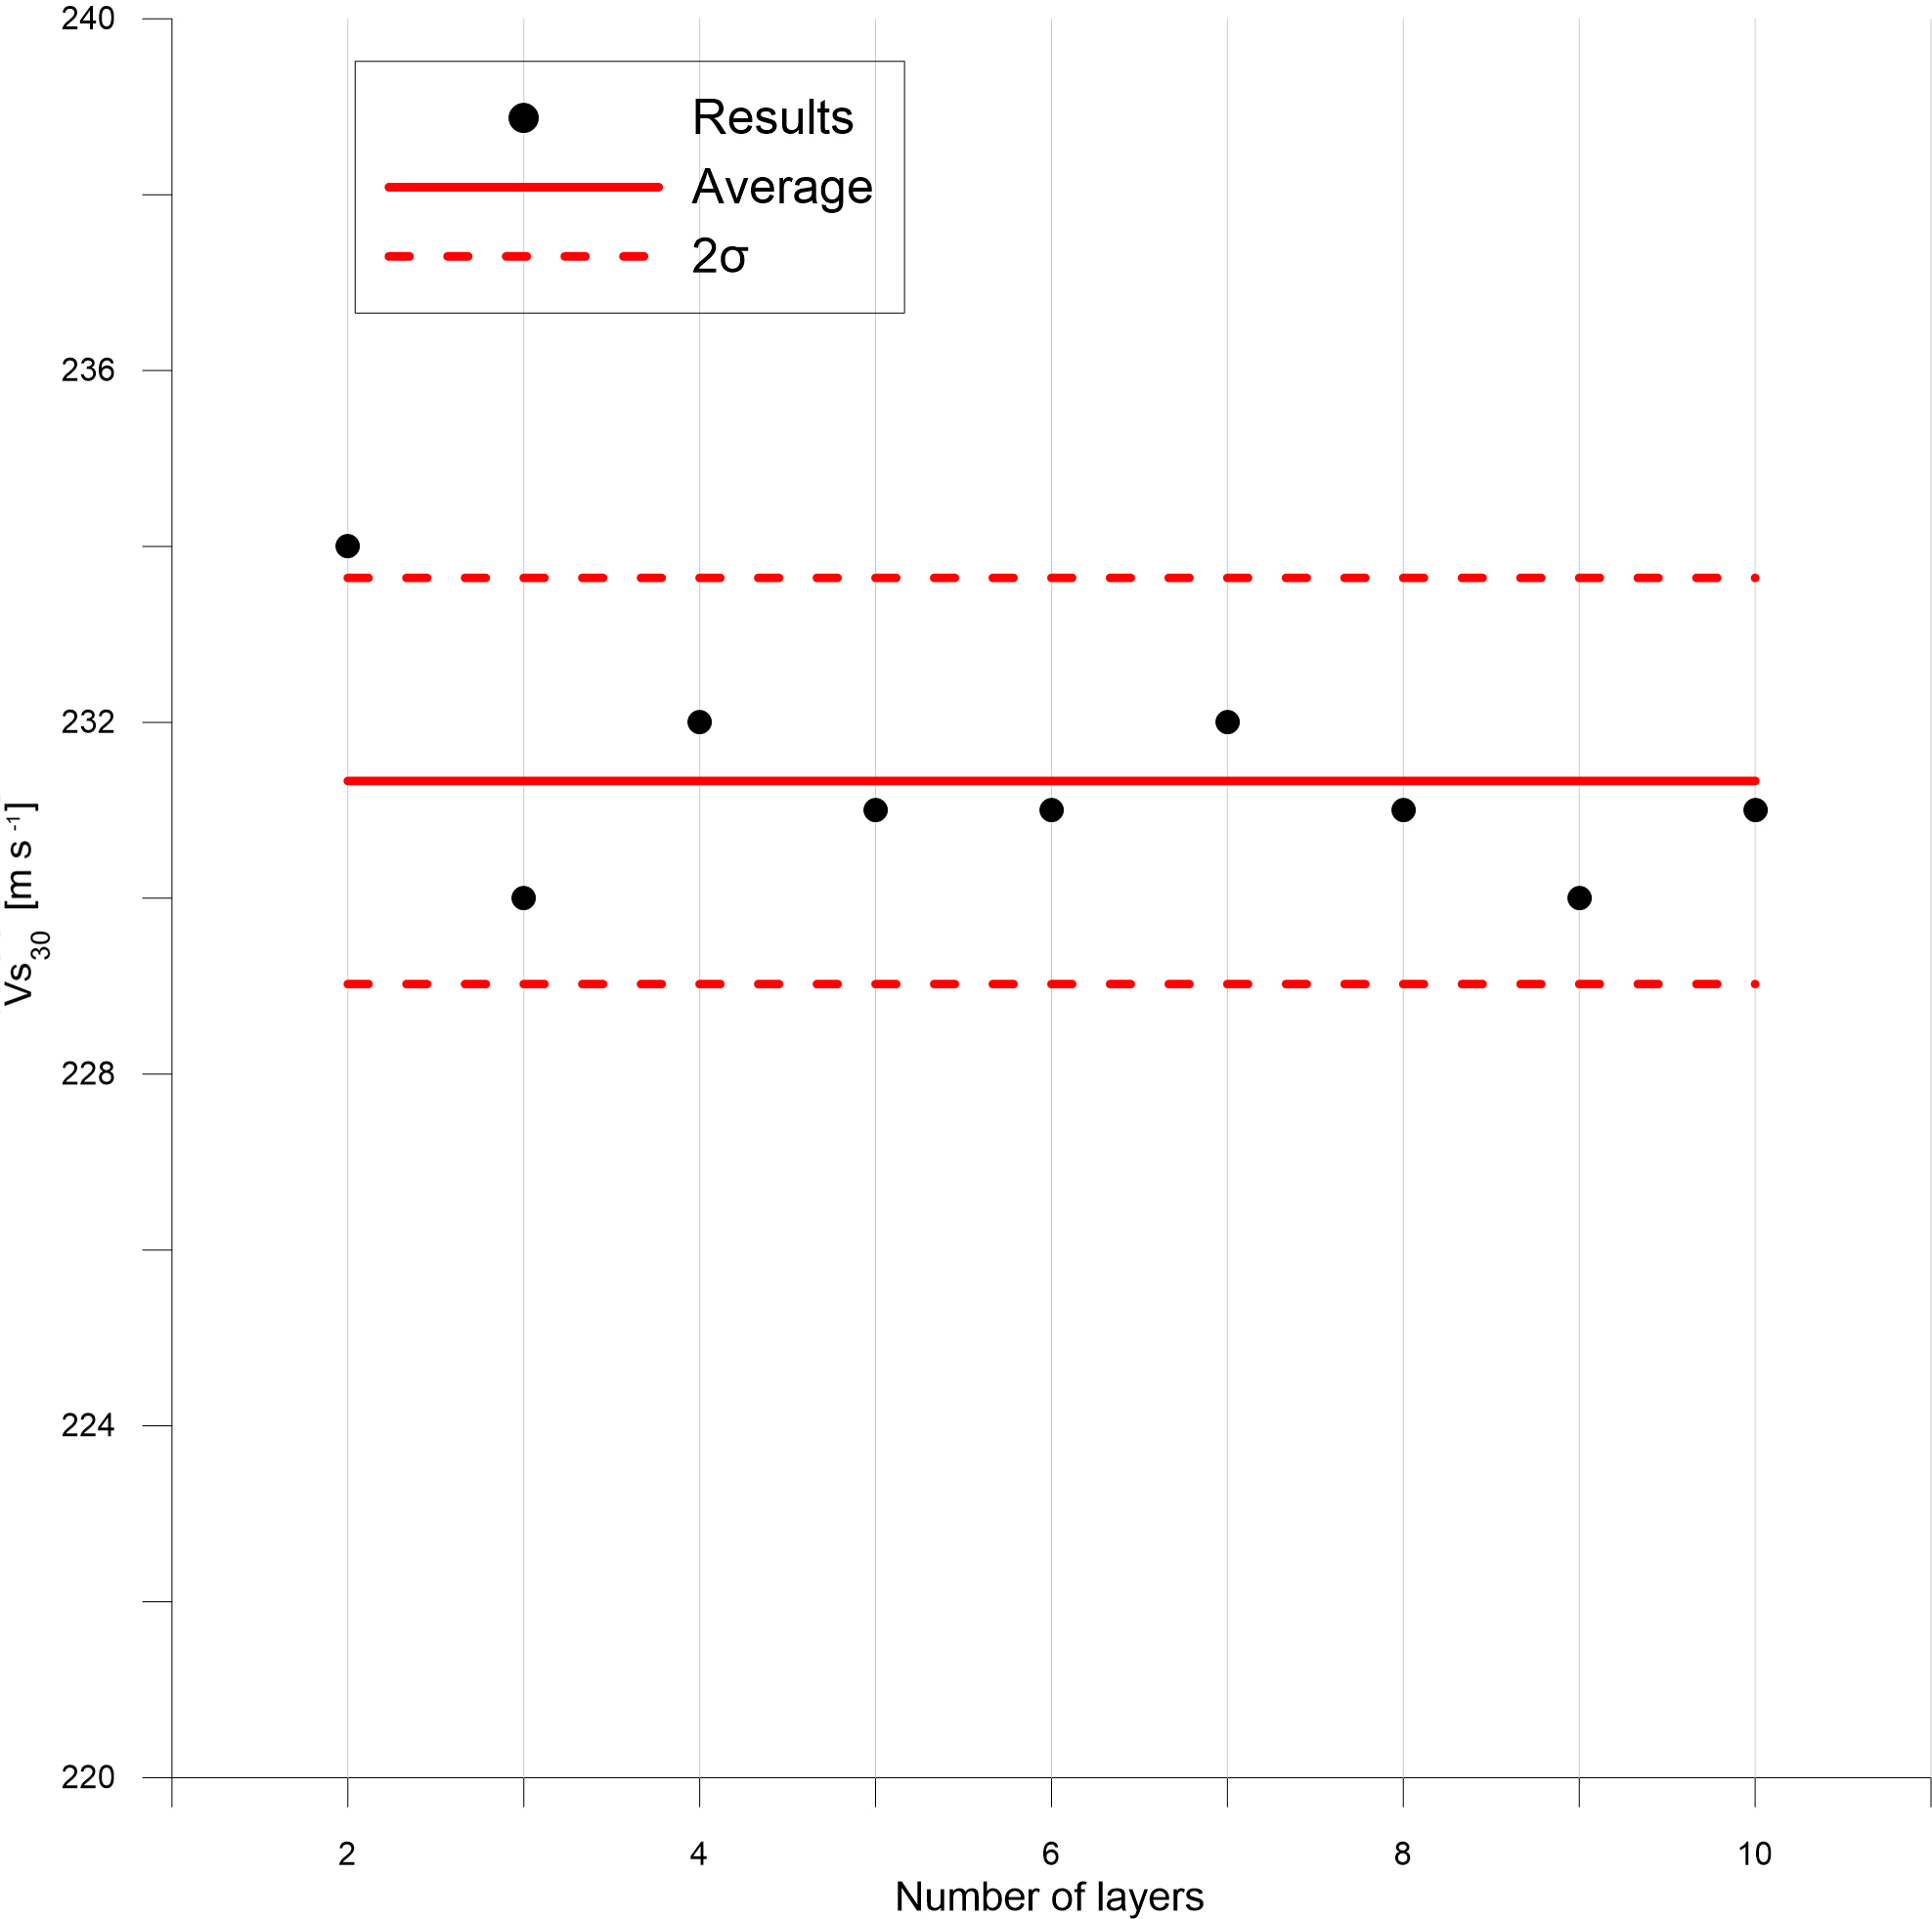
The resolution of surface wave surveys decreases with depth. Thin layers are well resolved when they are close to the surface, whereas at great depth, the resolution is limited and only large changes can be detected (Foti et al., 2014). Regardless of the number of the layers at the site, is almost the same in each case (Fig. 7). For these reasons, as well as the lack of density information, we did not restrict each model to a specific number of layers. Without boreholes or other direct lithostratigraphic constraint, which is the case in our work, a useful rule of thumb is to assume layer thicknesses increasing with depth, to compensate for the decreased resolution with depth, an intrinsic shortcoming of surface wave testing (Foti et al., 2014).
3.3 Depth of investigation
We used a 5 kg sledgehammer and summed up five strikes. For some sites, this type of source is insufficient to determinate a shear-wave profile down to 30 m. In addition, at some sites, we were not able to spread the geophones at intervals of more than 2 m, which limited the length of the seismic line. This length probably excludes longer wavelengths which limit the depth of investigation. Lastly, as the shear-wave velocity of the lowest frequency is higher, more data are available for deeper layers. Therefore, the penetration depth will decrease in areas with low shear-wave velocity. For instance, if we can clearly detect a phase velocity of about 300 m s−1 at 5 Hz, we can roughly estimate a depth of investigation of approximately 20–30 m according to the following equation:
where n ranges between 2 and 3 (Foti et al., 2014; Dal Moro, 2014). In other words, this equation emphasizes that the depth of investigation is about a half to a third of the largest wavelength observed.
3.4 Recent improvement of the 1927 epicenter
Zohar and Marco (2012) relocated the 1927 epicenter to a point near the Almog settlement. We used this most recently published epicenter to calculate new epicentral distances for the 133 sites. Since Eq. (2) above is dependent upon d, we checked the variable scatter in the points but found that the changes in the best-fit coefficients were very minor, so we assumed for all purposes to use the original.
Figure 8 shows a scatter plot of the original MMI (assumed equivalent to MSK) vs. new d for their 133 sites. Hough and Avni (2011) fit these data with a curve whose equation best describes the attenuation equation for this event. Using the mathematical form of their curve, we calculated upper and lower limits such that 60 % of the points are enclosed. This we call the 60 % prediction boundary. We consider that the lithological effects probably account for much of the scatter beyond this boundary, due to amplification and de-amplification.
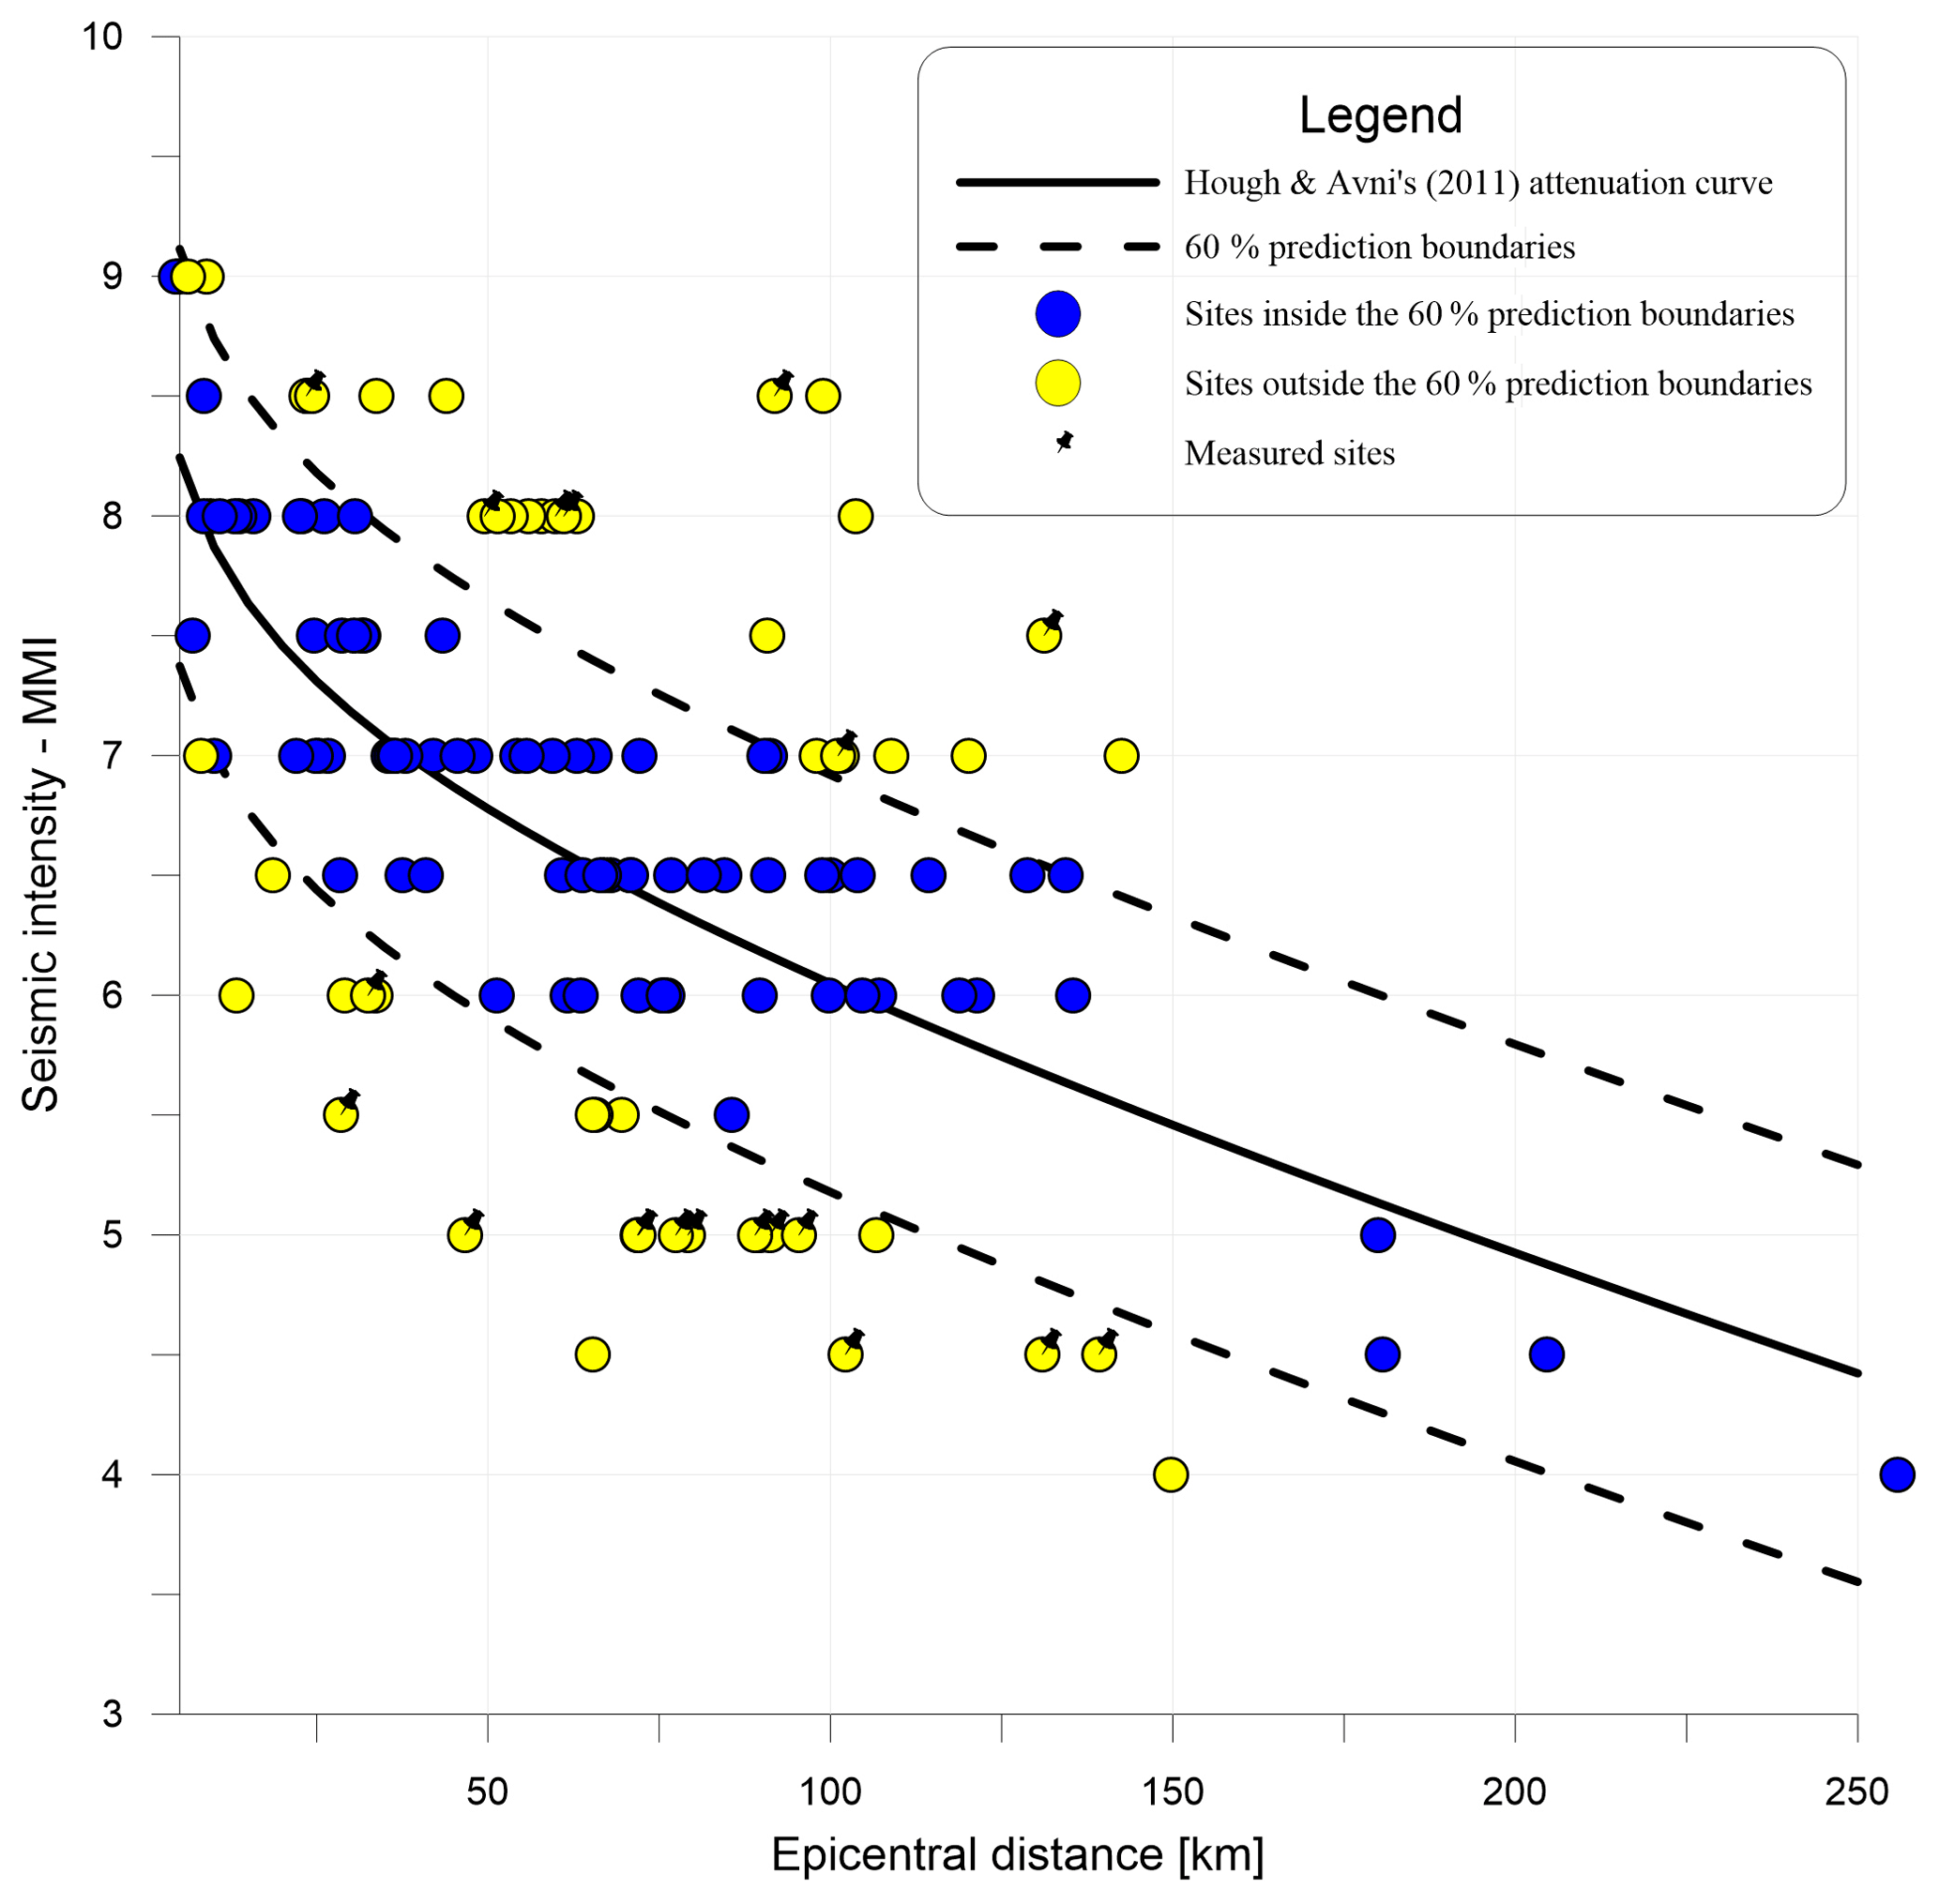
Figure 8Avni's seismic intensity (MMI) estimates of all the 133 sites. Distance is corrected according to the Zohar and Marco epicenter. Yellow dots are suspected amplified or de-amplified sites. Sites with pins are sites where we measured the Vs profile. Blue dots are sites which have MMI values expected from the attenuation equation (within the 60 % prediction boundary).
A number of researchers have studied the 1927 event. Avni (1999) tried to reduce the impact of local geology and attempted to generate basic attenuation curves for specific azimuths. Zohar and Marco (2012) relocated the source position, while Shani-Kadmiel et al. (2016) studied directivity of the source pattern. None of these publications address the measurements. An attenuation equation with a term that depends on the index should lead to a better understanding of past events and to more useful predictions of future earthquakes.
4.1 Survey locations and validation
The decision as to where exactly each survey should take place was based on Avni's thesis (1999). Where the location was not sufficiently known, we rechecked the reference given by Avni. In most cases, there was evidence of specific damaged buildings. We tried to locate these buildings on historical maps (1927–1945). Unfortunately, most sites were located inside urban areas, where we could not carry out the seismic surveys. Therefore, we surveyed in nearby open areas as close as possible to the referenced damage zones.
To validate our results, we compared them with a summary of thousands of seismic evaluations around Israel carried out over the years by the Geophysical Institute of Israel (GII) and compiled in a report by Aksinenko and Hofstetter (2012). These evaluations were based upon refraction and borehole velocity measurements yielding Vs and/or Vp values, as well as the effects of topography and geology. The spacing of their data was such that often a number of GII sites had to be averaged to provide a value within several kilometers for comparison with our MASW values. However, Fig. 9 shows that the GII-based values are in consistent agreement with those of the MASW. However, this comparison is a bit tricky because results for two sites 5 km or much less distant could be significantly different, as shown in Fig. 10. Remembering that enters a logarithmic term, we find our approach potentially useful.
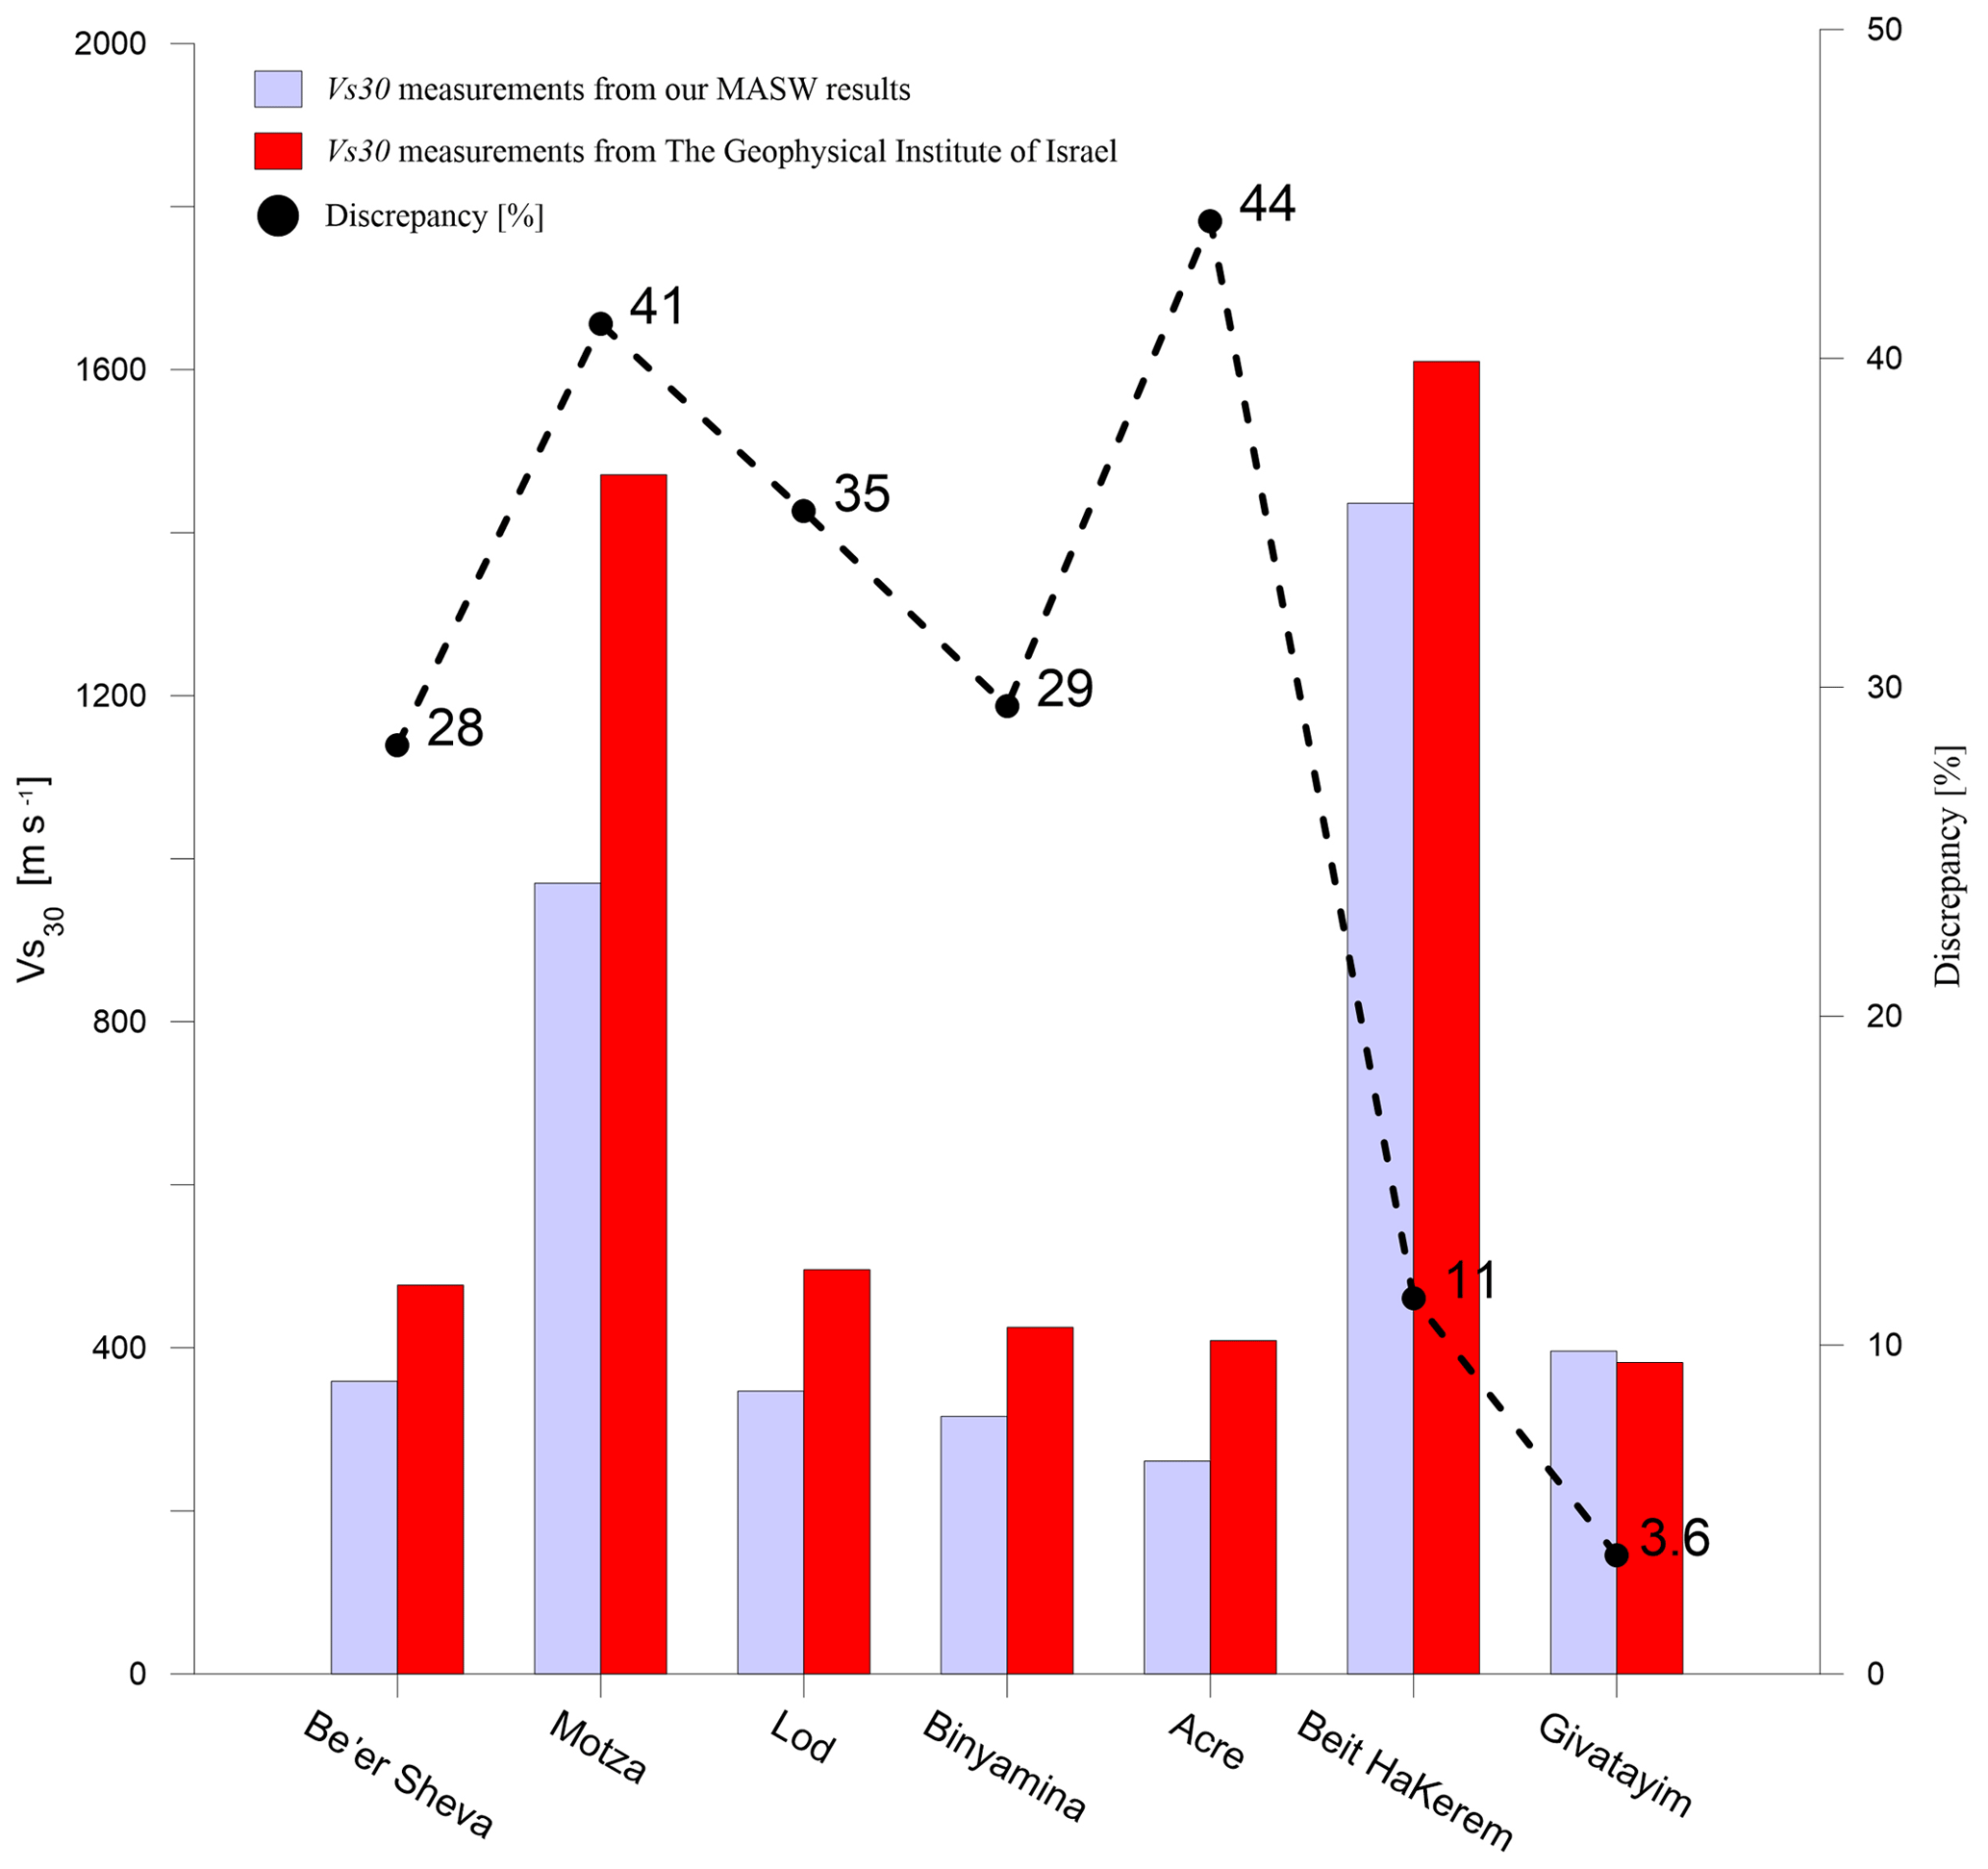
Figure 9Comparison between our results (light blue) and those calculated from GII's report (red) (Aksinenko and Hofstetter, 2012).
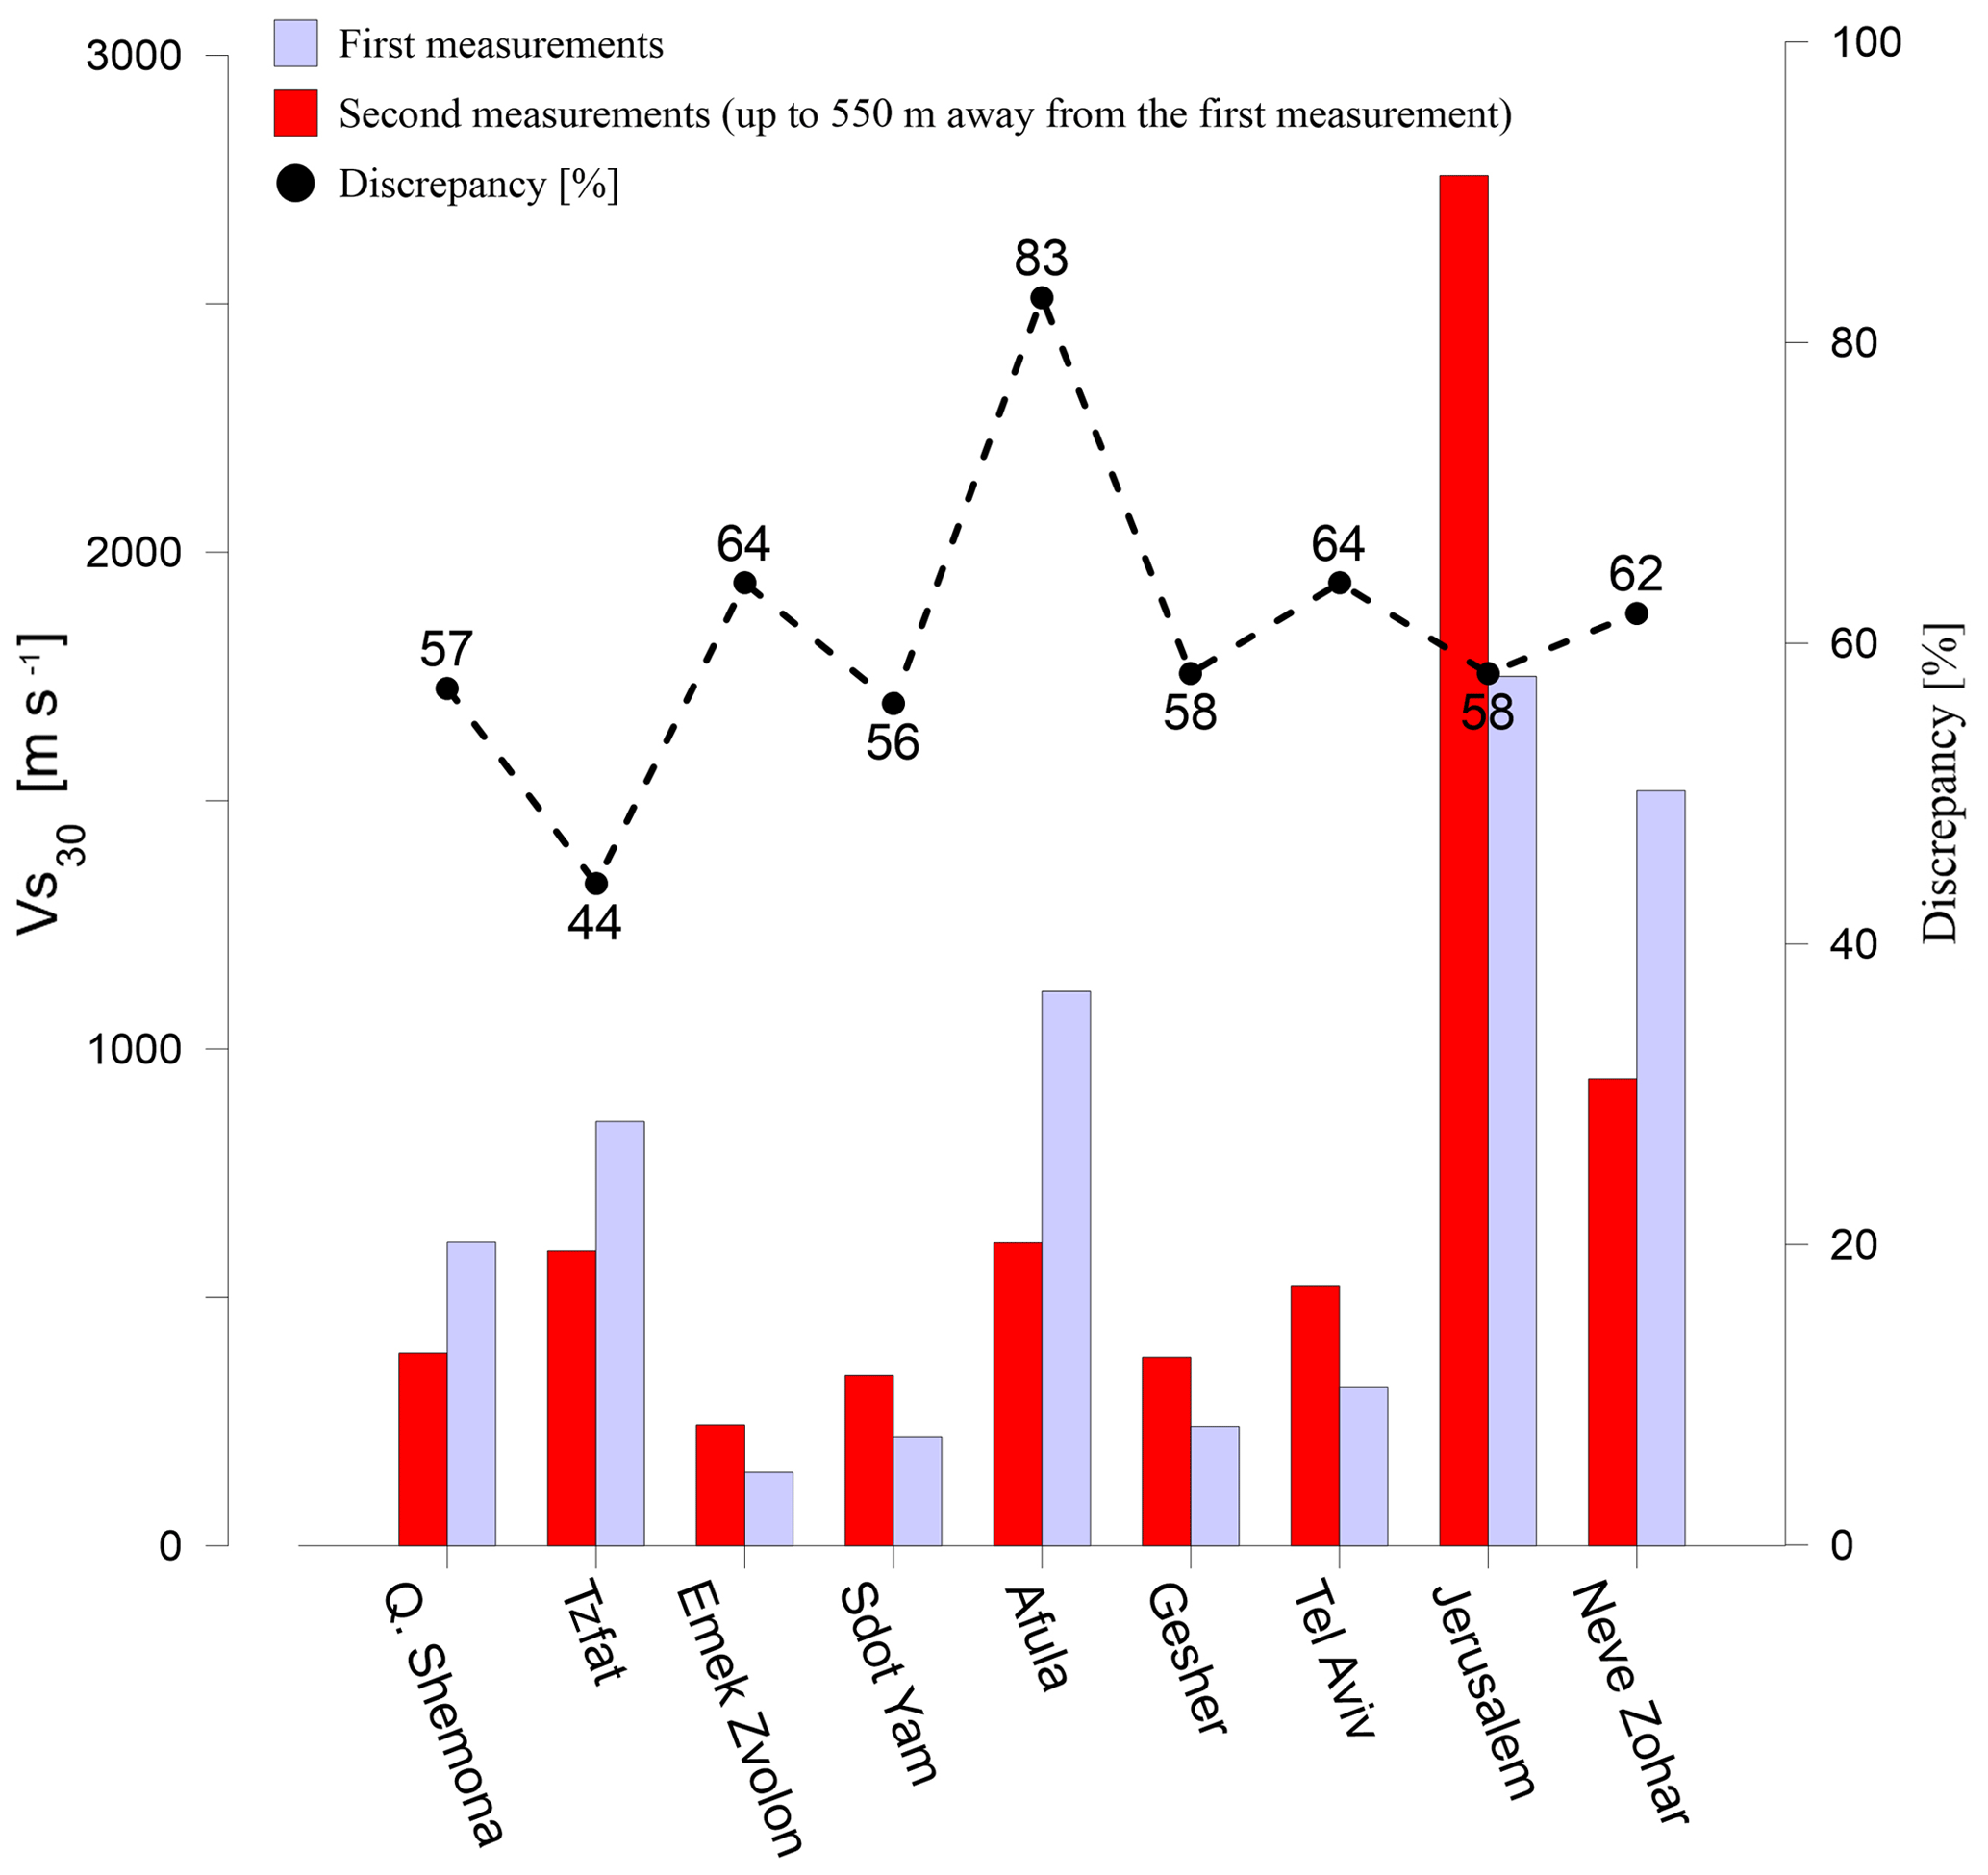
Table 2 lists our 24 sites alphabetically, with their respective values, the computed errors and epicentral distances, d. The values vary from a low of 232 m s−1 in Beit Alfa, −85 m a.s.l. (Fig. 11), in the thick and active alluvial plain of the famous valley of Gilboa some 10 km from the Dead Sea rift and a site of many millennia of agriculture. The highest value is 1444 m s−1 in Peki'in, 680 m a.s.l. (Fig. 11), in an area of ancient hillside orchards and massive carbonate bedrock. On the other hand, the two Motza sites (Fig. 11) lie in Emek HaArazim (valley of the cedars) on the western flank of Jerusalem within the massive anticlinorium of the Judean Hills, at about 570 m a.s.l. Motza 1 (1065 m s−1) is on a compacted dirt parking lot above alluvium and the Soreq Fm., while Motza 2 (874 m s−1) is farther up the valley on a gentle hillside above the Beit Meir Fm. Both are of similar limestone and marl composition and Cretaceous age.
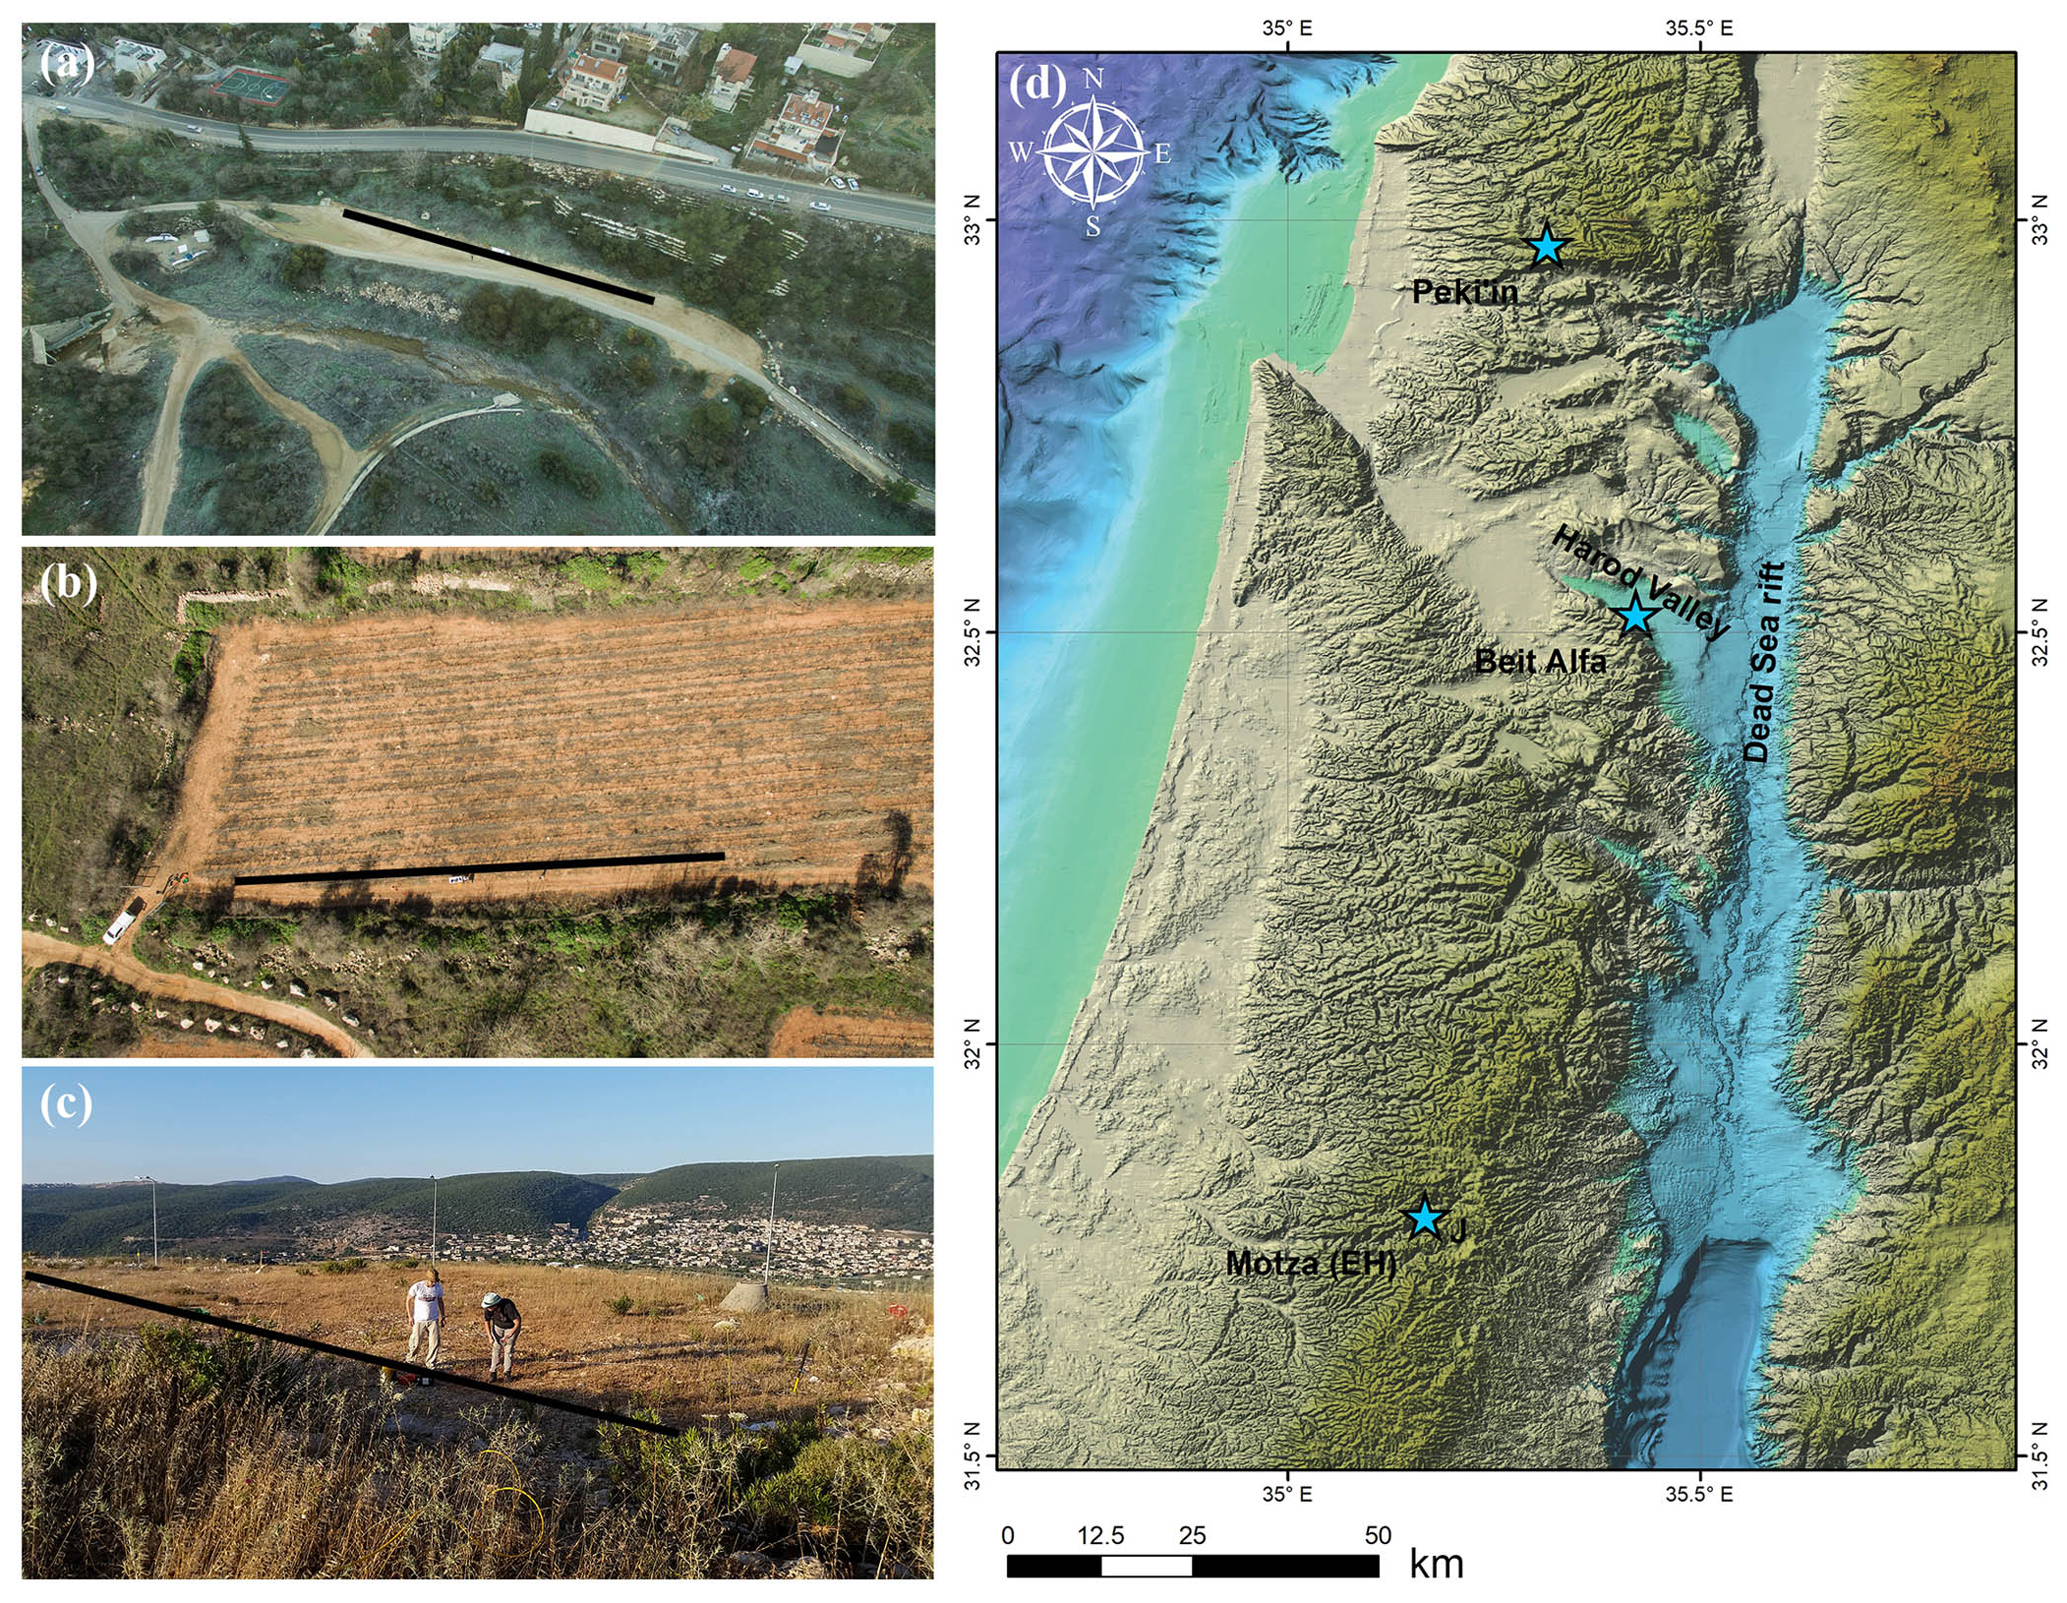
Figure 11Three of the sites investigated: (a) Motza 1, (b) Motza 2 and (c) Peki'in. Black lines represent the seismic line location. (d) The locations of the sites over a 25 m DTM image (Hall, 2008). Also shown are sites mentioned in the text: Jerusalem (J) and Emek HaArazim (EH).
4.2 A new attenuation equation
In the present case of the 1927 earthquake, the sources of the data are mostly historical documents and not strong data measurements. This makes it difficult to quantify site response into a single equation. In the practical modern attenuation relationship, is a crucial index. A term that depends on has previously been constrained for several large data sets (Abrahamson et al., 2014; Boore et al., 1997; Campbell and Bozorgnia, 2008). We chose the Boore et al. (1997) attenuation equation (Eq. 4) in order to emphasize site response:
where Y is the ground-motion variable (peak horizontal acceleration or pseudo-acceleration response in g), M is the moment magnitude, r is the epicentral distance in kilometers, and VA and all b terms are frequency-dependent coefficients to be determined. By adding Boore et al.'s (1997) Vs term to the Hough and Avni (2011) attenuation equation (Eq. 2), we suggest a new equation for the region:
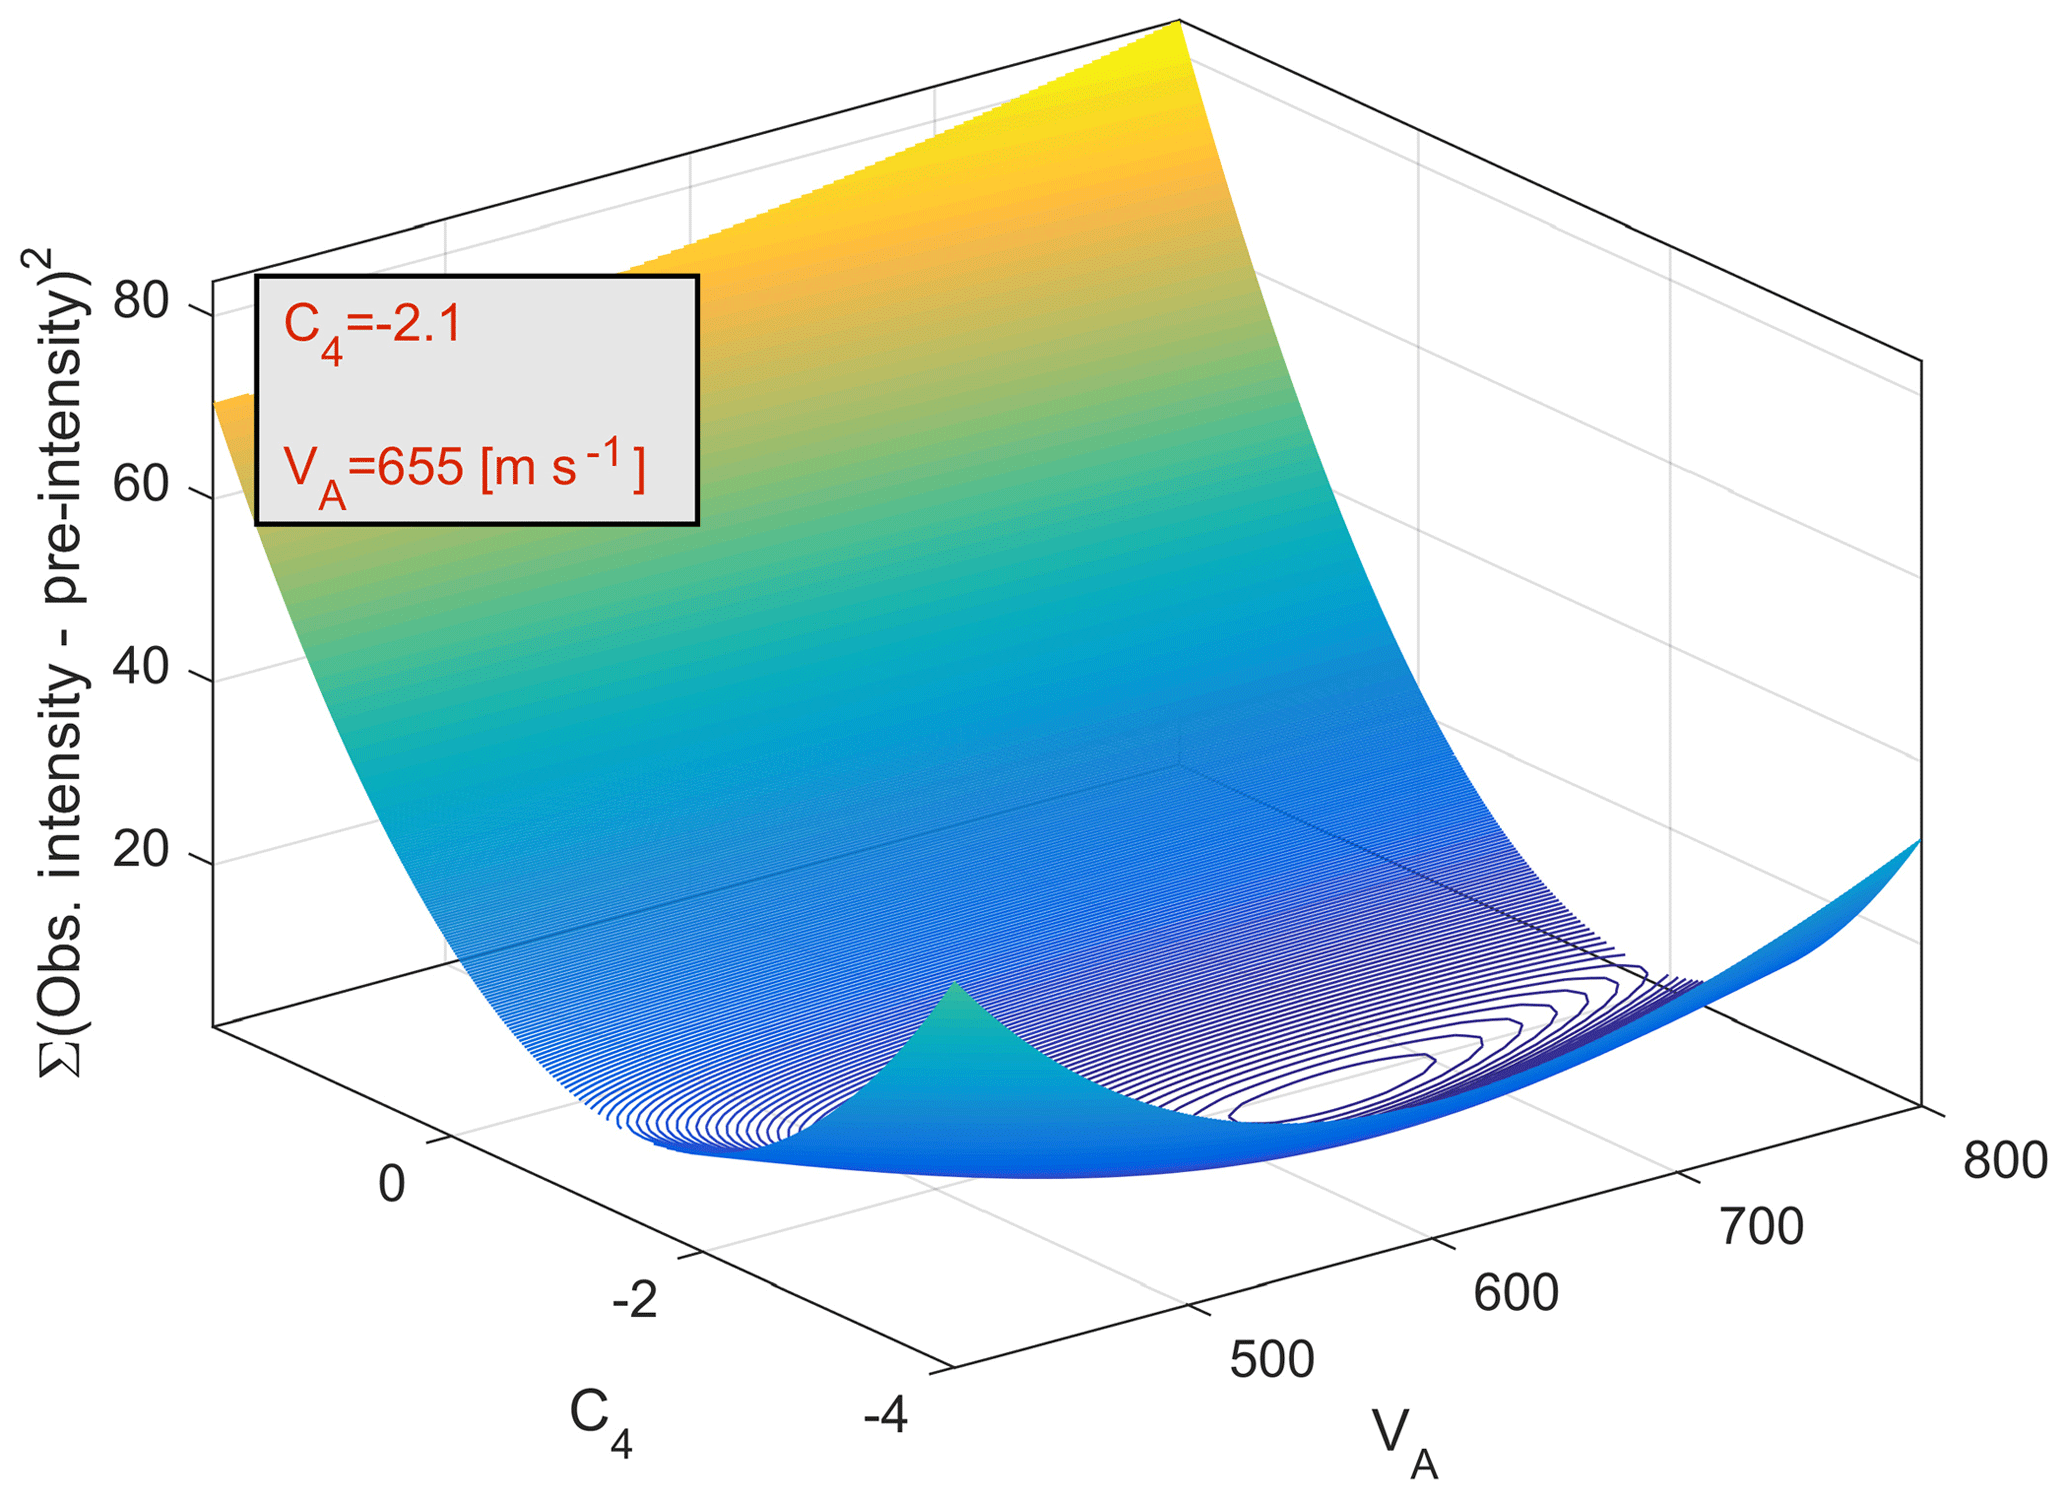
where VA and C4 are adjustable coefficients. The first four coefficients remain the same as we assert that the magnitude, attenuation, geometrical spreading and site response are all independent. We adopt the value of VA from Boore et al.'s (1997) equation (Eq. 4), as it represents a single value independent of the frequency. We took formerly derived GMPE, with its coefficients, and added another term, by regressing only for the new coefficient, then optimizing C4 and VA by least squares fitting (LSF), as shown in Fig. 12; we get the final equation:
4.3 The performance of the new attenuation equation
With these coefficients, 58 %, or 11 of 19 sites, were amplified or de-amplified as we expected. For the entire distance range (up to 250 km), the corrections leave 42 % of sites out of the prediction boundary (8 of 19 sites). Seismic intensities at all eight sites are overpredicted by the attenuation equation (Eq. 2) (Fig. 13). We expect that at these sites will be higher than 655 m s−1 in order to obtain de-amplification. However, our results show the opposite effect – these eight sites are characterized by lower , which drives amplification. This can be caused by the fact that measurements were taken over agricultural fields, of which the upper layers (the first few meters) are characterized by low shear-wave velocity, decreasing the average Vs. Another reasonable explanation is that we did not succeed in extracting the average shear-wave velocity down to 30 m and perhaps we missed some high-velocity shear-wave layers in deeper layers. In such cases, we constrain the last layer to be thicker in order to estimate for all our surveys.

Figure 13Site response corrections: yellow dots are MMI before site correction, and black dots, with error bars due to Vs uncertainty, represent the MMI after reducing site effects.
In this research, we investigate site amplification and de-amplification around Israel. According to previous studies (Aki, 1988; Boore, 2003; Borcherdt, 1994; Field and Jacob, 1995; Joyner and Boore, 1988), the local lithology can amplify or de-amplify wave amplitude. The commonly used modern seismic method – MASW – allowed the extraction of Vs profiles at 19 sites reportedly damaged by the 1927 6.2 ML earthquake. We use these profiles to update the attenuation equation for the Dead Sea region by including the term.
According to this new equation, 11 sites, which constitute 58 % of our measured samples, move into the 60 % prediction boundary. This suggests that the prediction boundary actually encompasses over 80 % of the macroseismic observations. This fit is better than any available attenuation equation for the Dead Sea region. However, as we have used only 19 sites, we should consider further research and provide wider results. Although our final equation (Eq. 6) shows amplification and de-amplification depending on , it does not take into consideration any other factor, such as building quality, foundation depth, topography, earthquake directivity, type of fault, etc. Obviously, for better results, we must use additional methods and jointly invert some other seismic data such as refraction (S and P waves), horizontal-to-vertical spectral ratio (HVSR), MASW of the transverse component of Love waves, MASW of the radial component of Rayleigh wave, extended spatial autocorrelation (ESAC), etc. Also, with these data in hand, a full inversion for the epicenter will be in order.
Despite the scarcity of data, this is the first time that an integration of historical data with shear-wave velocity profile measurements improved the attenuation relation. In order to better estimate the peak ground acceleration or the seismic intensities that will be caused by future earthquakes, attenuation relations are necessary for areas characterized by high seismicity. Some of the regions of low-to-moderate seismicity have rich sources of historical earthquake data. The integration of historical data with modern shear-wave velocity profile measurements will lead to a better understanding of future earthquakes.
The entire database of the Vs measurements can be found at https://doi.org/10.6084/m9.figshare.7775972.v1 (Davarsi and Agnon, 2019).
The supplement related to this article is available online at: https://doi.org/10.5194/se-10-379-2019-supplement.
The authors declare that they have no conflict of interest.
This article is part of the special issue “Environmental changes and hazards in the Dead Sea region (NHESS/ACP/HESS/SE inter-journal SI)”. It is not associated with a conference.
We thank the Neev Center for Geoinfomatics's facilities and its students. We
are especially grateful to John K. Hall, founder of the Center, for his
ongoing support. We are grateful to the Helmholtz Association of German
Research Centers for funding this research. We thank Moshe Reshef for
comments and suggestions on an earlier draft and Ran Bachrach for
valuable advice. We acknowledge the contribution of Michael Weber and
the geophysical deep sounding section at GFZ. Finally, we thank Amit Ronen
for his assistance.
Edited by: Charlotte
Krawczyk
Reviewed by: two anonymous referees
Abel, F.-M.: Le recent tremblement de terre en Palestine, Rev. Biblique, 36, 571–578, 1927.
Abrahamson, N. A., Silva, W. J., and Kamai, R.: Summary of the ASK14 ground motion relation for active crustal regions, Earthq. Spectra, 30, 1025–1055, 2014.
Aguirre, J. and Irikura, K.: Nonlinearity, liquefaction, and velocity variation of soft soil layers in Port Island, Kobe, during the Hyogo-ken Nanbu earthquake, B. Seismol. Soc. Am., 87, 1244–1258, 1997.
Aki, K.: Local site effect on ground motion, Earthq. Eng. Soil Dyn. II Recent Adv. Ground-Motion Eval., 1988.
Aki, K. and Richards, P. G.: Quantitative seismology, Mill Valley, Calif: University Science Book, 2002.
Aksinenko, T. and Hofstetter, A.: 1-D semi-empirical modeling of the subsurface across Israel for site effect evaluations, State of Israel GII Report ES_17_2012, Ministry of Energy and Water Resources, 2012.
Ambraseys, N.: Earthquakes in the Mediterranean and Middle East: a multidisciplinary study of seismicity up to 1900, Cambridge University Press, Cambridge, 2009.
Ambraseys, N. N. and Melville, C. P.: An analysis of the eastern Mediterranean earthquake of 20 May 1202, in: Historical Seismograms and Earthquakes of the World, edited by: Lee, W., Academic Press, San Diego, CA, 181–200, 1988.
Amiran, D. H. K.: A revised earthquake-catalogue of Palestine, Isr. Explor. J., 2, 48–65, 1952.
Arieh, E.: Seismicity of Israel and adjacent areas, Geol. Surv. Isr. Bull., 43, 10–14, 1967.
Avni, R.: The 1927 Jericho earthquake, comprehensive macroseismic analysis based on contemporary sources, Ben-Gurion Univ. Negev, Beersheba, 203, 1999.
Bakun, W. H. U. and Wentworth, C. M.: Estimating earthquake location and magnitude from seismic intensity data, B. Seismol. Soc. Am., 87, 1502–1521, 1997.
Ben-Menahem, A., Nur, A., and Vered, M.: Tectonics, seismicity and structure of the Afro-Eurasian junction – the breaking of an incoherent plate, Phys. Earth Planet. Inter., 12, 1–50, 1976.
Ben-Menahem, A.: Four thousand years of seismicity along the Dead Sea rift, J. Geophys. Res.-Sol. Ea., 96, 20195–20216, 1991.
Blanckenhorn, M.: Das Erdbeben im Juli 1927 in Palästina, Z. Deut. Palastina-Ver., 4, 288–296, 1927.
Boore, D. M.: Simulation of ground motion using the stochastic method, Pure Appl. Geophys., 160, 635–676, 2003.
Boore, D. M., Joyner, W. B., and Fumal, T. E.: Equations for estimating horizontal response spectra and peak acceleration from western North American earthquakes: A summary of recent work, Seismol. Res. Lett., 68, 128–153, 1997.
Boore, D. M., Thompson, E. M., and Cadet, H.: Regional correlations of and velocities averaged over depths less than and greater than 30 meters, B. Seismol. Soc. Am., 101, 3046–3059, 2011.
Borcherdt, R., Glassmoyer, G., Andrews, M., and Cranswick, E.: 3 Effect of Site Conditions On Ground Motion and Damage, Earthq. Spectra, 5, 23–42, 1989.
Borcherdt, R. D.: Estimates of site-dependent response spectra for design (methodology and justification), Earthq. Spectra, 10, 617–653, 1994.
Brawer, A. Y.: Earthquakes events in Israel from July 1927 to August 1928, Jew. Pal. Expl. Soc., 316–325, 1928. (in Hebrew)
Building Seismic Safety Council (BSSC): NEHRP recommended provisions for seismic regulations for new buildings and other structures, Part 1: Provisions, Federal Emergency Management Agency, 368, Washington, D.C., 2001.
Campbell, K. W. and Bozorgnia, Y.: NGA ground motion model for the geometric mean horizontal component of PGA, PGV, PGD and 5 % damped linear elastic response spectra for periods ranging from 0.01 to 10 s, Earthq. Spectra, 24, 139–171, 2008.
CEN, EN 1998-1 Eurocode 8: Design of Structures for Earthquake Resistance, Part 1: General Rules, Seismic Actions and Rules for Buildings, CEN, European Committee for Standardization, 2005.
Ciaccio, M. G. and Cultrera, G.: Terremoto e rischio sismico, Ediesse, Italy, 2014.
Dal Moro, G.: Surface wave analysis for near surface applications, Elsevier, Italy, 2014.
Dal Moro, G., Pipan, M., and Gabrielli, P.: Rayleigh wave dispersion curve inversion via genetic algorithms and marginal posterior probability density estimation, J. Appl. Geophys., 61, 39–55, 2007.
Darvasi, Y. and Agnon, A.: Database of Vs measurements, https://doi.org/10.6084/m9.figshare.7775972.v1, 2019.
Field, E. H. and Jacob, K. H.: A comparison and test of various site-response estimation techniques, including three that are not reference-site dependent, B. Seismol. Soc. Am., 85, 1127–1143, 1995.
Foti, S., Lai, C. G., Rix, G. J., and Strobbia, C.: Surface wave methods for near-surface site characterization, CRC press, Boca Raton, 2014.
Guidoboni, E. and Comastri, A.: Catalogue of Earthquakes and Tsunamis in the Mediterranean Area from the 11th to the 15th Century, SGA, Roma-Bologna, 2005.
Hall, J. F. (Ed.): Northridge Earthquake January 17, 1994: Preliminary Reconnaissance Report, Publ. No. 94-01, Earthquake Engineering Research Institute, Oakland, Calif., 1994.
Hall, J. K.: The 25-m DTM (digital terrain model) of Israel, Isr. J. Earth Sci., 57, 145–147, 2008.
Hough, S. E. and Avni, R.: The 1170 and 1202 CE Dead Sea Rift earthquakes and long-term magnitude distribution of the Dead Sea Fault Zone, Isr. J. Earth Sci., 58, 295–308, https://doi.org/10.1560/IJES.58.3-4.295, 2011.
Hough, S. E., Friberg, P. A., Busby, R., Field, E. F., Jacob, K. H., and Borcherdt, R. D.: Sediment-induced amplification and the collapse of the Nimitz Freeway, Nature, 344, 853–855, 1990.
Joyner, W. B. and Boore, D. M.: Measurement, characterization, and prediction of strong ground motion, in: Earthquake Engineering and Soil Dynamics II, Proceedings of American Society of Civil Engineers Geotechnical Engineering Division Specialty Conference, Park City, Utah, 27–30 June, 43–102, 1988.
Kagan, E., Stein, M., Agnon, A., and Neumann, F.: Intrabasin paleoearthquake and quiescence correlation of the late Holocene Dead Sea, J. Geophys. Res.-Sol. Ea., 116, https://doi.org/10.1029/2010JB007452, 2011.
Medvedev, S. V., Sponheuer, W., and Karnik, V.: Seismic intensity scale version MSK 1964, United nation Educ. Sci. Cult. Organ. Paris, 7, 1965.
Milne, J.: Seismology: London, Kegan Paul, Trench, Truber, London, 1898.
Park, C. B., Miller, R. D., and Xia, J.: Multi-channel analysis of surface waves (MASW) – a summary report of technical aspects, experimental results, and perspective, Kansas Geol. Surv., open file report No: 97-10, 1997.
Park, C. B., Miller, R. D., and Xia, J.: Imaging dispersion curves of surface waves on multi-channel record, in: SEG Technical Program Expanded Abstracts 1998, 1377–1380, Society of Exploration Geophysicists, 1998.
Ryden, N., Park, C. B., Ulriksen, P., and Miller, R. D.: Multimodal approach to seismic pavement testing, J. Geotech. Geoenvironmental Eng., 130, 636–645, 2004.
Shani-Kadmiel, S., Tsesarsky, M., and Gvirtzman, Z.: Distributed Slip Model for Forward Modeling Strong Earthquakes, B. Seismol. Soc. Am., 106, 93–103, 2016.
Shapira, A.: Redetermined magnitudes of earthquakes in the Afro-Eurasian Junction, Isr. J. Earth Sci., 28, 107–109, 1979.
Shapira, A., Avni, R., and Nur, A.: A new estimate for the epicenter of the Jericho earthquake of 11 July 1927, Isr. J. Earth Sci., 42, 93–96, 1993.
Singh, S. K., Lermo, J., Dominguez, T., Ordaz, M., Espinosa, J. M., Mena, E. and Quaas, R.: The Mexico earthquake of September 19, 1985 – a study of amplification of seismic waves in the valley of Mexico with respect to a hill zone site, Earthq. Spectra, 4, 653–673, 1988.
The Standards Institution of Israel (SII): Israeli Standard SI 413 Amendment No. 5, 2013.
Willis, B.: Earthquakes in the holy land, B. Seismol. Soc. Am., 18, 73–103, 1928.
Xia, J., Miller, R. D., and Park, C. B.: Estimation of near-surface shear-wave velocity by inversion of Rayleigh waves, Geophysics, 64, 691–700, 1999.
Xia, J., Miller, R. D., Park, C. B., Hunter, J. A., Harris, J. B., and Ivanov, J.: Comparing shear-wave velocity profiles inverted from multichannel surface wave with borehole measurements, Soil Dyn. Earthq. Eng., 22, 181–190, 2002.
Zaslavsky, Y., Shapira, A., Gorstein, M., Perelman, N., Ataev, G., and Aksinenko, T.: Questioning the applicability of soil amplification factors as defined by NEHRP (USA) in the Israel building standards, Nat. Sci., 4, 631–639, https://doi.org/10.4236/ns.2012.428083, 2012.
Zohar, M. and Marco, S.: Re-estimating the epicenter of the 1927 Jericho earthquake using spatial distribution of intensity data, J. Appl. Geophys., 82, 19–29, 2012.