the Creative Commons Attribution 4.0 License.
the Creative Commons Attribution 4.0 License.
 | 22 Mar 2019
Submarine groundwater discharge site in the First Salpausselkä ice-marginal formation, south Finland
Joonas J. Virtasalo
Jan F. Schröder
Samrit Luoma
Juha Majaniemi
Juha Mursu
Jan Scholten
Submarine groundwater discharge (SGD) has been implicated as a significant source of nutrients and potentially harmful substances to the coastal sea. Although the number of reported SGD sites has increased recently, their stratigraphical architecture and aquifer geometry are rarely investigated in detail. This study analyses a multifaceted dataset of offshore seismic sub-bottom profiles, multibeam and side-scan sonar images of the seafloor, radon measurements of seawater and groundwater, and onshore ground-penetrating radar and refraction seismic profiles in order to establish the detailed stratigraphical architecture of a high-latitude SGD site, which is connected to the Late-Pleistocene First Salpausselkä ice-marginal formation on the Hanko Peninsula in Finland. The studied location is characterized by a sandy beach, a sandy shore platform that extends 100–250 m seaward sloping gently to ca. 4 m water depth, and a steep slope to ca. 17 m water depth within ca. 50 m distance. The onshore radar and offshore seismic profiles are correlated based on unconformities, following the allostratigraphical approach. The aquifer is hosted in the distal sand-dominated part of a subaqueous ice-contact fan. It is interpreted that coarse sand interbeds and lenses in the distal fan deposits, and, potentially, sandy couplet layers in the overlying glaciolacustrine rhythmite, provide conduits for localized groundwater flow. The SGD takes place predominantly through pockmarks on the seafloor, which are documented on the shore platform slope by multibeam and side-scan sonar images. Elevated radon-222 activity concentrations measured 1 m above seafloor confirm SGD from two pockmarks in fine sand sediments, whereas there was no discharge from a third pockmark that was covered with a thin organic-rich mud layer. The thorough understanding of the local stratigraphy and the geometry and composition of the aquifer that have been acquired in this study are crucial for successful hydrogeological modelling and flux studies at the SGD site.
- Article
(7193 KB) - Full-text XML
-
Supplement
(21557 KB) - BibTeX
- EndNote


Submarine groundwater discharge (SGD) is understood as the flow of groundwater, or quite often a mixture of groundwater and seawater, from the seabed to the coastal sea (Burnett et al., 2003; Moore, 2010). Although SGD is generally small compared to riverine inflow, it contributes high concentrations of nutrients, trace metals, and other land-derived contaminants (e.g. Moore, 2010; Szymczycha et al., 2012, 2016). Therefore, SGD-associated fluxes potentially have considerable effects on the marine ecosystems.
Eutrophication is a major concern for large parts of the Baltic Sea (Andersen et al., 2017). The main cause of this poor ecological status is the excess supply of nutrients by rivers and the atmosphere. Although the main nutrient-supply routes to the Baltic Sea are well known, detailed studies of SGD and associated fluxes have been carried out only at a couple of locations along the south coast: the Eckernförde Bay in Germany (e.g. Whiticar and Werner, 1981; Schlüter et al., 2004) and the Puck Bay in Poland (e.g. Jankowska et al., 1994; Szymczycha et al., 2012, 2016). In addition, seafloor morphological features such as terraces and pockmarks, interpreted to be produced by SGD, have been documented from the Stockholm Archipelago (Söderberg and Flodén, 1997; Jakobsson et al., 2016) and SGD rates have been modelled through a 224Ra mass balance offshore Forsmark in Sweden (Krall et al., 2017). For the Puck Bay, Szymczycha et al. (2012) calculated that SGD contributes ca. 3 % of the local annual influx of dissolved inorganic nitrogen and as much as 30 % of the annual influx of phosphate. Although further studies are required, SGD-associated fluxes can be expected to significantly impact the ecological status of the Baltic Sea.
The key sub-seafloor aquifers in the Eckernförde Bay and Forsmark are Late Pleistocene glacigenic sand deposits (Jensen et al., 2002; Krall et al., 2017). In the Stockholm Archipelago, silty couplet layers in glacial varved clays act as groundwater conduits (Söderberg and Flodén, 1997). Although comparable glacigenic sediments are well-known from Finland, no SGD sites have been documented previously from the Finnish waters.
Coastal aquifers are vulnerable to seawater intrusion, either as a result of sea-level rise or storm surges, both of which are predicted to increase due to climate change (Wong et al., 2014; Pellikka et al., 2018). Groundwater abstraction for the needs of coastal cities further increases the vulnerability of low-lying aquifers to high sea levels (Ferguson and Gleeson, 2012). Recent groundwater modelling and hydrogeochemical studies show that the water quality of a glacigenic coastal aquifer in the Hanko Peninsula, south Finland, may be compromised due to groundwater pumping and the predicted sea-level rise and increase in precipitation (Luoma and Okkonen, 2014; Luoma et al., 2015).
Over the last years, measurements of radon (222Rn) in seawater have been widely employed to trace and quantify SGD from shallow coastal aquifers (e.g. Burnett et al., 2003, 2008; Peterson et al., 2008; Gleeson et al., 2013; Tait et al., 2013; Schubert et al., 2014; Sadat-Noori et al., 2015). In the Baltic Sea, 222Rn has been previously used for studying SGD from pockmarks in the Eckernförde Bay (Schlüter et al., 2004). Radon is a natural radioactive noble gas that is highly enriched in groundwater by 2 to 4 orders of magnitude compared to seawater (Prakash et al., 2018) due to the decay of 226Ra in aquifer sediments (Andrews and Wood, 1972; Mullinger et al., 2009).
The aim of this study is to reconstruct the detailed stratigraphical architecture and aquifer geometry of a SGD site in the Late Pleistocene First Salpausselkä ice-marginal formation on the Hanko Peninsula in Finland. Whereas the majority of known SGD sites are situated in low- and mid-latitudes, this study provides a less frequently reported case from high latitudes. This is also the first study of a SGD site to combine offshore and onshore subsurface profiling surveys in order to obtain a full picture of the local stratigraphy and aquifer geometry across the shoreline. The offshore reflection seismic profiles and the onshore ground-penetrating radar (GPR) and refraction seismic profiles are collected by fundamentally different techniques, but can be correlated on the basis of unconformities recognized in the profiles, following the allostratigraphical approach (North American Commission on Stratigraphic Nomenclature, 2005). Multibeam and side-scan sonar images document pockmarks on the seafloor, which are interpreted to be produced by SGD. Finally, radon measurements demonstrate groundwater discharge from two of the three measured pockmarks.
The coastal aquifer studied here belongs to the First Salpausselkä ice-marginal formation, which runs as a wide ridge on the Hanko Peninsula, located on the southern coast of Finland (Fig. 1). The Late Pleistocene deposits rest on the Paleoproterozoic crystalline bedrock that mainly consists of quartz diorite and granodiorite (Kielosto et al., 1996). The First Salpausselkä was deposited during the Younger Dryas climatic event in the course of deglaciation of the Fennoscandian continental ice sheet. According to varve chronology and palaeomagnetic dating, the deposition of the First Salpausselkä began at ca. 12 300 varve years before the year 2000 (Saarnisto and Saarinen, 2001; Donner, 2010). Varve counting by Sauramo (1923) indicates that the First Salpausselkä was deposited over 217 years, and the ice margin retreated from the area ca. 12 100 varve years ago. A cosmogenic 10Be age of 12 500±700 for the ice-margin retreat supports the varve chronology (Rinterknecht et al., 2004). The First Salpausselkä was deposited as a narrow ridge of contiguous meltwater fans and local feeding eskers that were formed along the ice-margin grounding line (Virkkala, 1963; Glückert, 1986; Fyfe, 1990; Kujansuu et al., 1993) in an ice-contact lake that was more than 100 m deep in Hanko (Fyfe, 1990). After the ice-margin retreat, the till and subaqueous ice-contact fan deposits were successively covered by glaciolacustrine rhythmically alternating (varved) silt and clay, and postglacial lacustrine poorly bedded clay (Virtasalo et al., 2007, 2014). At ca. 7600 years ago, the deposition of postglacial lacustrine clay came to an end with erosion and the emplacement of a thin transgressive silt-sand sheet as a result of the mid-Holocene marine flooding and establishment of brackish-water conditions in the Baltic Sea Basin (Virtasalo et al., 2007, 2016). The deposition soon resumed with the organic-rich brackish-water mud drift that is strongly influenced by waves and near-bottom currents, and still continues today.
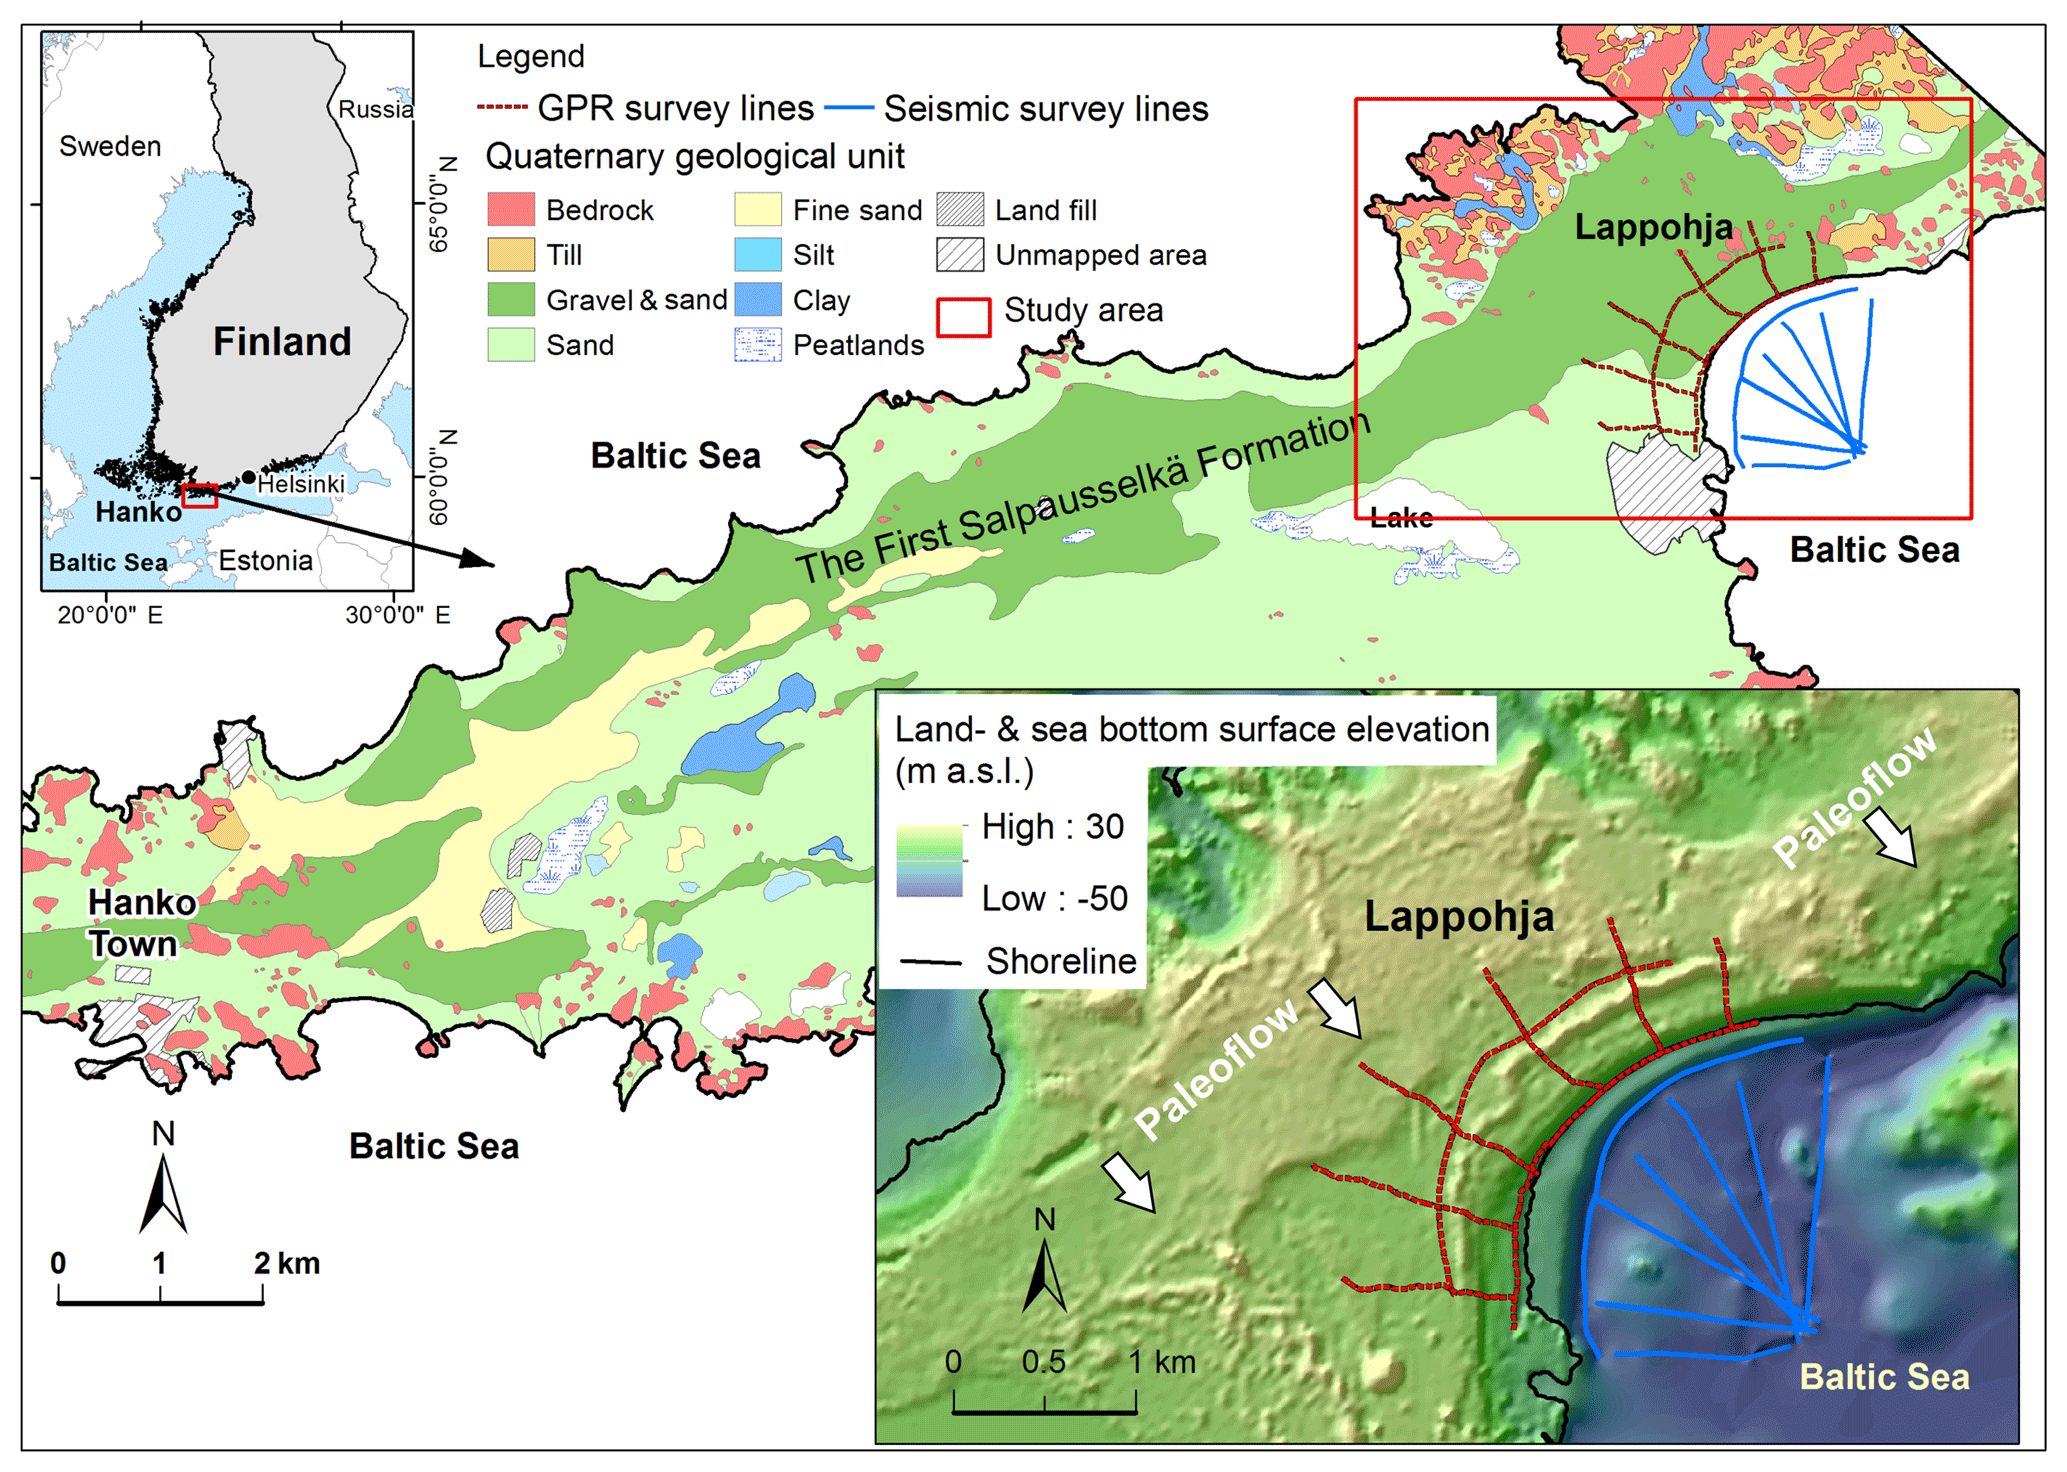
Figure 1Quaternary geological map of the study area and location of survey lines in south Finland, northern Baltic Sea. Red lines indicate the GPR survey lines. Blue lines indicate the offshore seismic survey lines. White arrows mark the paleoflow approximate directions.
As a result of the initially rapid glacio-isostatic land uplift (today 4 mm yr−1; Kakkuri, 2012), the highest peaks of the First Salpausselkä in Hanko began to emerge from the sea by 5000 years ago (Eronen et al., 2001). The top of the ice-marginal formation was exposed to waves and eventually to wind as it gradually rose from the sea. The original ridge morphology became truncated and flattened from the top, the glaciolacustrine and postglacial lacustrine silts and clays were removed, and the underlying subaqueous ice-contact fan deposits were reworked by wind waves and currents (Virkkala, 1963; Glückert, 1986; Fyfe, 1990; Kujansuu et al., 1993). Fine sand was redeposited as beach ridges on the south side of the peninsula and partially reworked into aeolian dunes (Fyfe, 1990).
The Hanko area belongs to the temperate mixed-coniferous forest climate zone with cold, wet winters. The mean annual air temperature is 6 ∘C, with the mean minimum temperature of −4.2 ∘C and the mean maximum temperature of 16.6 ∘C. The mean annual precipitation is 670 mm during the period 1981–2010 (unpublished statistics from the Finnish Meteorological Institute, 2017). The annual mean sea surface salinity ranges between 4.5 and 6.5 PSU and the sea surface temperature between 4 and 9 ∘C during the period 1927–2011 (Merkouriadi and Leppäranta, 2014). The low salinity results from the high riverine runoff from the large Baltic Sea catchment area, and from the long distance to the narrow connection to the North Sea through the Danish straits. The sea is annually covered by ice on average 69 days (1891–2012), and the ice season usually ends in April (Merkouriadi and Leppäranta, 2014). The sea is essentially non-tidal, but irregular water level fluctuations of as much as ±2.5 m take place as a result of variations in wind and atmospheric pressure.
Seafloor seismoacoustic surveys were carried out in May 2017. The surveys were run at 5 knots using a suite of multibeam and side-scan sonar and seismic survey equipment on board R/V Geomari of the Geological Survey of Finland: 200 kHz Atlas Fansweep 20 multibeam sonar, 100 and 500 kHz Klein 3000 side-scan sonar, Meridata 28 kHz pinger sub-bottom reflection profiler, Massa TR-61A 3.5–8 kHz compressed high-intensity radar pulse (CHIRP) reflection profiler, and ELMA 250–1300 Hz seismic reflection profiler. The parallel survey lines were spaced at 75 m intervals to permit full multibeam coverage, and orientated N–S on the basis of typical wind (wave) direction. Shore-normal seismic survey lines were collected in order to permit correlation with onshore profiles. Sound velocity profiles of the water column were measured using a Reson SVP 15T profiler. Multibeam data were collected and processed with Hypack, and visualized with Fledermaus 7.4.4b software. A relative backscatter mosaic was produced using the GeoCoder algorithm. Sub-bottom profiler and side-scan sonar data were collected and interpreted using Meridata MDCS and MDPS software. The seismic units and corresponding sediment types were interpreted following Virtasalo et al. (2007, 2014). Sound velocities used for converting the seismic two-way travel time to sediment unit thickness were as follows: brackish-water mud, 1480 m s−1; postglacial lacustrine and glaciolacustrine clay, 1550 m s−1; subaqueous ice-contact fan deposits, 1600 m s−1; and till, 1850 m s−1 (Sviridov, 1977; Virtasalo et al., 2014).
Onshore GPR profiles were recorded in October 2017, along survey lines that were oriented as to continue the offshore seismic survey lines, and along perpendicular survey lines that followed the arc-shaped shoreline and the shore-parallel road 500–800 m inland. The GPR profiles were collected using a GSSI SIR 4000 control unit with a GSSI antenna operating at 200 MHz central frequency. Data were recorded using a 220 ns time window. Location was recorded using a Trimble GeoXH 6000 handheld GPS receiver with VRS network correction. Location, topography, and GPR profiles were combined and processed using Geodoctor 3.2 software. Signal processing methods applied were background removal, low-pass and high-pass filtering, and linear gain. A relative permittivity value of 6 was used, which corresponds to sandy dry soil (Annan, 2009). The GPR profiles were interpreted following Neal (2004). The interpretation was aided by eight unpublished groundwater drill logs from the survey area, obtained from the POVET database (unpublished database at the Finnish Environment Agency, 2018) and databases of the Geological Survey of Finland.
A refraction seismic survey was run in April 2018 along the shoreline. The survey consisted of nine linear spreads of 24 geophones. The geophones were positioned at 5 m intervals, except in the middle and both ends of the spreads where the geophones were positioned at 2.5 m intervals. The total length of each spread was 100 m. The beach sand surface was frozen at the time of survey, so the geophones were installed in drilled holes. The position of each geophone was recorded by GPS. A small explosive charge (80–120 g dynamite), drilled to 50–70 cm below ground, was used as a source of seismic wave. Five source points (shot points) were used for each spread (at both ends, in the middle, and 100 m away from both ends, and outside of the geophone spread). Seismic refraction data were recorded by a digital 24-channel Geometrics StrataVisor NZXP seismograph, using a sampling interval of 0.125 ms and a record length of 0.3 s. The seismograph was triggered by a signal from the blasting device. The first arrival times of P waves were extracted from seismograms using Rimrock Geophysics Sipik software. Elevation data for geophone and shot point locations were obtained from lidar data. The P-wave first arrival data were interpreted using the ray tracing technique in Geometrics SeisImager software.
Radon-222 measurements of seawater and groundwater were carried out in May 2018. First, a survey of seawater surface 222Rn activity concentrations was carried out on board the research boat Gridi of the Geological Survey of Finland. The survey was run at 1.4 knots along the edge of the shore platform, as well as along a couple of shore-normal transects. Two pumps that continuously supplied water for the 222Rn measurements were fixed at ca. 50 cm water depth in the same frame with a Sea & Sun Technology CTD90M multiprobe that was recording pressure (depth), temperature, conductivity (salinity), dissolved oxygen, turbidity, and flow velocity and direction values at 1 min intervals. Seawater 222Rn measurements were carried out using two identical systems in parallel, each equipped with a 3M MiniModule gas contractor that separates the dissolved gas from the continuously pumped water (Schmidt et al., 2008). The gas was dried with a Drierite gas-drying unit, and analysed with a Durridge RAD7 radon detector (Burnett and Dulaiova, 2003). The 222Rn-in-water activity concentrations were calculated using the salinity- and temperature-dependent fractionation of 222Rn between air and water (Schubert et al., 2012). The pressure, temperature, conductivity and optical dissolved oxygen sensors were manufactured by Sea & Sun Technology GmbH, the optical backscatter turbidity sensor by Seapoint Sensors Inc., and the ISM-2001C inductive 2-D flowmeter with compass by HS Engineers GmbH. The position was recorded by differential Global Positioning System (DGPS) on the boat navigation system. Second, near-bottom water was measured at pockmark locations that were identified in the multibeam and side-scan sonar images. The frame that included the pumps and the CTD90M multiprobe was lowered to ca. 1 m above the seafloor, controlled by the boat echosounder and winch. The boat was anchored above the pockmarks, but drifted ca. 10 m from side to side during the measurements because of wind. The near-bottom water was pumped and 222Rn and the CTD90M parameters measured for a minimum of 30 min at each location. In addition, a vertical water column profile was measured at 0.1 dbar (ca. 10 cm) intervals using the CTD90M multiprobe at each of the locations. Finally, groundwater was pumped from 8–10 m below the water table from the observation well HP101, and measured for 222Rn activity concentration. Radon was also measured in water that was gently leaking from the wall of an obsolete water station well near the shoreline. These groundwater 222Rn activity concentrations were measured by using the “soda bottle aerator” system (Durridge Inc.) in 500 mL bottles, in conjunction with the RAD7 detector and the CAPTURE software for data evaluation.
Sediment cores were collected using a box corer from the pockmark locations where radon was measured. The cores were visually inspected for sedimentary structures and grain size. The cores were cut in 1 cm subsample slices, which were analysed for Caesium-137 activity content in order to determine the amount of sediment in each core that was deposited after the fallout from the 1986 Chernobyl nuclear disaster. The 137Cs activity content of fresh subsamples was measured for 60 min using a BrightSpec bMCA-USB pulse height analyser coupled to a well-type NaI(Tl) detector at the Geological Survey of Finland. The same subsamples were then analysed for weight loss on ignition (LOI), which is informative of sediment organic content, by weighing subsamples after drying at 105 ∘C for 16 h and weighing again after ignition at 550 ∘C for 2 h (Bengtsson and Enell, 1986).
4.1 Offshore seismic units
Seven seismic units (SUs) are recognized in offshore sub-bottom profiles that were collected along shore-normal transects and along the shore platform edge (Fig. 2a). The denser units SU1–SU3 are identified in the deeper-penetrating reflection seismic profiles (Fig. 3c, d), whereas the units SU4–SU7 of lower acoustic impedance are better visible in the CHIRP profiles (Fig. 3a, b). The pinger had poor penetration in this area, likely because of the high sand content in the sediments.

Figure 2Maps of the study area. (a) Interpreted depth of till top surface (pink, SU2) and the interpreted thickness of subaqueous ice-contact fan (yellow, SU3). The interpretations are based on offshore reflection seismic profiles as described in the text. Black lines indicate the offshore seismic survey lines. Green lines indicate the GPR survey lines. White lines indicate the survey lines in Figs. 3, 4, and 6d. HP101 indicates the groundwater observation well. WS indicates the obsolete water station. (b) Multibeam bathymetric image over the offshore survey area. (c) Measured 222Rn activity concentration in the sea surface water (0.5 m water depth). (d) Close-up multibeam backscatter image of the seafloor with pockmarks E, D, and B indicated. (e) Picture taken 4 May on the beach ridge toward the sea. The exact location is indicated by a white triangle in (a). The dark patches in the winter ice are presumably caused by SGD. Coordinate system ETRS-TM35FINṄautical chart: S-57 Finnish Transport Agency 2017. Topographic map: National Land Survey of Finland digital elevation model 2 m 2017. Aerial photograph: National Land Survey of Finland Topographic Database 04/2017.
4.1.1 SU1: Bedrock
Description. SU1 is the seismic substratum (Fig. 3d). In the reflection seismic profiles, its upper reflector is an irregular steep-relief unconformity surface, whereas the internal reflector configuration is chaotic.
Interpretation. The irregular surface and chaotic internal reflector configuration are consistent with crystalline bedrock. Palaeoproterozoic crystalline rocks dominate the bedrock in the study area (Kielosto et al., 1996).

Figure 3Offshore sub-bottom profiles collected along the survey line indicated in Fig. 1a. (a) 3.5–8 kHz CHIRP sub-bottom profile, and (b) interpretation of the profile. (c) 250–1300 Hz reflection seismic sub-bottom profile, and (d) interpretation of the profile. See text for details about the interpretation of seismic units.
4.1.2 SU2: Till
Description. SU2 covers the substratum as a thin layer, and is generally less than 3 m thick, but may reach up to 10 m in local depressions of the substratum (Fig. 3d). In the reflection seismic profiles, its upper reflector is an irregular unconformity surface with high amplitude. The internal reflector configuration is chaotic to locally stratified.
Interpretation. The chaotic to locally stratified internal reflector configuration indicates massive deposits with little or no stratification and local stratified pockets, consistent with subglacial till (Eyles et al., 1985; Powell and Cooper, 2002). The stratified pockets were produced by local meltwater processes. Similar surface reflector and external form have been reported for subglacial till in the neighbouring sea areas (Häkkinen, 1990; Rantataro, 1992; Nuorteva, 1994; Virtasalo et al., 2014). In the nearby land areas, the till thickness typically is less than 4 m, but can reach 40 m in bedrock depressions and till landforms such as pre-crag drumlins (Kielosto et al., 1996).
4.1.3 SU3: Subaqueous ice-contact fan
Description. SU3 is present along the west–north (ice-proximal) margin of the survey area (Fig. 2a). It has a wedge-shaped external form with the highest thickness of up to 6 m along the shore-parallel margin of the survey area, but which thins out within ca. 700 m from the shore. In reflection seismic profiles, it is characterized by subparallel discontinuous reflectors that have lower amplitude than SU1 and SU2 (Fig. 3c, d).
Interpretation. The low-amplitude reflectors indicate finer grained sediments than in SU2, perhaps sand or fine sand. The discontinuity of internal reflectors indicates weak stratification. The stratigraphical position immediately above the till, as well as the proximity and increasing unit thickness towards the First Salpausselkä ice-marginal formation, indicates meltwater origin for the sandy deposit. SU3 is interpreted to comprise a distal part of a subaqueous ice-contact fan that is part of the First Salpausselkä formation (Virkkala, 1963; Glückert, 1986; Fyfe, 1990; Kujansuu et al., 1993). The poorly stratified fine-sand beds were deposited probably by density flows and occasional debris flows from the upper fan slope (Winsemann et al., 2009; Lang and Winsemann, 2013; Lang et al., 2017).
4.1.4 SU4: Glaciolacustrine rhythmite
Description. In CHIRP profiles, SU4 is characterized by a lower part with subparallel discontinuous reflectors, and an upper part with closely spaced parallel reflectors of high amplitude (Fig. 3a, b). The upper parallel reflectors in general are parallel to reflectors in the overlying SU3, which indicates no significant erosion at the contact. On topographic highs, however, the SU4 reflector structure is truncated at the top, indicating erosion.
Interpretation. The poorly stratified lower part of SU4 in CHIRP profiles probably reflects high sand content, whereas the closely spaced parallel reflectors in the upper part of SU4 are typical of rhythmically alternating, glaciolacustrine fine sand–silt and clay layer couplets deposited by underflows and suspension settling during seasonal changes in glacial melting and sediment influx (De Geer, 1912; Sauramo, 1923; Eyles et al., 1985; Powell and Cooper, 2002; Virtasalo et al., 2007, 2014). The overall upward trend of fining grain size reflects the ice-margin retreat.
4.1.5 SU5: Postglacial lacustrine clay
Description. SU5 forms a conformal drape with a constant thickness of 2–3 m, but is truncated at the top above topographic highs (Fig. 3a, b). In CHIRP profiles, it is characterized by closely spaced parallel reflectors reminiscent of SU4, but with lower amplitudes and slightly smoother reflector angles due to the levelling of the underlying topography by SU4. The top boundary is a strong reflector.
Interpretation. The drape-like geometry indicates deposition in deep water with limited reworking by near-bottom currents. The low-amplitude closely spaced parallel reflector structure indicates weakly bedded to structureless fine-grained sediment, typical of the postglacial lacustrine silty clay (Virtasalo et al., 2007, 2014). The truncation of the unit above topographic highs is a consequence of erosion.
4.1.6 SU6 and SU7: Brackish-water mud drifts
Description. SU6 and SU7 have a similar asymmetric basin-fill external form, and frequent, low-amplitude, convex to onlapping parallel reflectors in CHIRP profiles (Fig. 3a, b). Both units have strong basal reflectors, and their reflector structure is frequently truncated at the top. SU6 is widely distributed, whereas SU7 is present on top of SU6 in topographic depressions. SU7 has slightly smoother reflector angles due to the levelling of the underlying topography by SU6. The thickness of the units is variable, but both may reach 10 m in depressions. Attenuation (absorption and scattering) of the acoustic signal by free gas within the sediment (acoustic blanking) is common in areas of the highest unit thickness.
Interpretation. The asymmetric external form and the convex to onlapping reflector configuration reflect sediment-drift deposition that is controlled by currents and wave action, typical of the Baltic Sea brackish-water mud (Virtasalo et al., 2007). The frequent truncation of the reflector configuration at the top of the units is due to erosion. The basal reflector of SU6 is distinctive, and in fact traceable long distances in seismic profiles over the Baltic Sea (Virtasalo et al., 2016). The unconformity that subdivides the brackish-water mud into SU6 and SU7 with different internal reflector angles results from a shift in the lateral accretion of sediment due to land uplift and changed near-bottom current patterns. Similar unconformities within the brackish-water mud have been reported previously from the neighbouring sea areas (Virtasalo et al., 2007, 2014).

Figure 4Onshore sub-bottom profiles. (a) Ground-penetrating radar profile indicated in Fig. 1a, and (b) interpretation of the profile. (c) Interpreted surfaces from a shore-parallel refraction seismic profile indicated in Fig. 1a. See text for details about the interpretation of seismic units. Vp is compressional sound velocity.
4.2 Ground-penetrating radar (GPR) units
Three radar units (RUs) are recognized in the onshore GPR profiles, which were recorded along survey lines that were oriented to continue the offshore seismic survey lines, and along perpendicular survey lines that followed the arc-shaped shoreline and the shore-parallel road 500–800 m inland (Fig. 2a). The penetration depth of the GPR electromagnetic wave in the studied deposits is ca. 12 m (Fig. 4a). The available drill logs from the survey area show, however, that the crystalline bedrock can be covered by more than 50 m of sand with silty and gravelly interbeds and lenses. The GPR profiles, therefore, capture only the upper part of the sandy deposits. The groundwater table is observable as a high-amplitude continuous reflector, which is at sea level in the seaward ends of the profiles, but rises to ca. 12 m a.s.l. within 1 km distance to the shoreline. The groundwater is hosted in unit RU1. The collected GPR profiles are available in the Supplement to this article.
4.2.1 RU1: Subaqueous ice-contact fan
Description. The upper 8–12 m of RU1 are visible in the GPR profiles. Below that depth the GPR electromagnetic wave is attenuated (Fig. 4a, b). The internal reflector configuration is highly variable in the northwestern (ice-proximal) part of the profiles, being characterized by lenticular and sheet-like reflector packages with local northwestward (upflow) and frequent southeastward (downflow) gently to steeply dipping reflectors of low to high amplitude. The reflector packages have unconformable contacts. In the southeastern (ice-distal) parts of the profiles, the unit is dominated by steeply southeastward-dipping oblique low-amplitude reflectors. The internal reflector configuration of RU1 is truncated from the top by the basal reflector surface of RU2.
Interpretation. The highly variable internal reflector configuration of RU1 with lenticular and sheet-like packages is similar to the distal sand-rich parts of subaqueous ice-contact fans (Winsemann et al., 2009; Lang and Winsemann, 2013; Lang et al., 2017). The northwestern (upflow) parts of RU1 reflect dynamic net deposition of probable antidune and (humpback) dune deposits by density flows (Lang et al., 2017). Local high-amplitude reflectors indicate gravelly interbeds and lenses in the sand-dominated deposit. The presence of gravel and coarse-sand interlayers in the sandy deposit is supported by available drill logs from the survey area. The steeply downflow-dipping oblique low-amplitude reflectors that dominate the southeastern (ice-distal) parts of the profiles document fine-sand-dominated clinoforms with dip angles between 12 and 17∘. The comparably steep clinoforms were presumably deposited from waning density flows (Gerber et al., 2008; Lang et al., 2017). It is worth noting that the thickness of sandy deposits in the available drill logs can exceed 50 m, and that only their upper part was imaged in the GPR profiles.
4.2.2 RU2: shoreface lag deposit
Description. RU2 is a thin, < 2 m thick, sheet that is characterized by high-amplitude sub-horizontal discontinuous reflectors (Fig. 4a, b). The reflectors downlap onto the basal reflection surface to RU1.
Interpretation. The sheet-like geometry and high-amplitude sub-horizontal downlapping internal reflectors indicate a coarse shoreface lag deposit, likely composed of gravel (Tamura et al., 2008). Such a deposit was formed by wave, current, and winter-ice reworking of the primary ice-contact fan deposits (RU1) during emergence from the sea (Virkkala, 1963; Glückert, 1986; Fyfe, 1990; Kujansuu et al., 1993; Nemec et al., 1999).
4.2.3 RU3: Beach ridges
Description. RU3 is the uppermost reflector unit that covers most of the land surface. It has an asymmetric external form, with the unit thickness varying from below the GPR resolution to as much as 6 m in large ridges (Fig. 4a, b). The internal reflection configuration is characterized by low-amplitude gently seaward-dipping subparallel reflectors, and local landward-dipping reflectors on the landward sides of large ridges. The reflectors downlap onto the top reflection surface of RU2.
Interpretation. Beach ridges typically are dominated by seaward-dipping subparallel reflectors, and local landward-dipping reflectors on their landward sides. The seaward-dipping subparallel reflectors represent sand with gravel interbeds, which were deposited at the beachface by wave swash and back-swash, whereas the local landward-dipping reflectors on the landward sides of the ridges represent aeolian sands (Clemmensen and Nielsen, 2010; Rosentau et al., 2013; Muru et al., 2018).
4.3 Refraction seismic profile
The 900 m long refraction seismic profile was collected along the shoreline on the sandy beach (Fig. 2a). A refraction surface at a depth of ca. 50 m in the western part of the profile rises to ca. 20 m depth in the eastern part of the profile (Fig. 4c). This surface is interpreted to be the bedrock surface that is unconformably overlain by the sand-dominated subaqueous ice-contact fan deposits. This interpretation is in line with the available drill logs from the area, which show that the bedrock surface can be buried deeper than 50 m below sea level. Another refraction surface at sea level is interpreted to be the groundwater table.
4.4 Seafloor morphology and pockmarks
Multibeam bathymetry over the survey area shows a gently undulating seafloor with water depths ranging between 5 and 25 m (Fig. 2b). The seafloor is covered with brackish-water mud (SU7), except erosional exposures of till (SU2) at small elevations in the southwestern and eastern parts of the area. An arc-shaped shore platform with sandy sediment extends 100–250 m seaward from the shoreline, sloping gently to ca. 4 m water depth (Fig. 2b). From the platform edge, the seafloor slopes to ca. 17 m depth within ca. 50 m distance. The shore platform was too shallow for R/V Geomari to navigate, and therefore no seismoacoustic surveys were carried out there.
The multibeam image shows approximately twenty pockmarks up to 25 m wide and 2 m deep (Fig. 5) on the shore platform slope and at the base of the slope down to ca. 16 m water depth (Fig. 2b). In CHIRP profiles, the pockmarks are incised in the topmost unit SU7 (Fig. 6d). Sub-vertical columns of disrupted reflectors, which are interpreted to be groundwater conduits, extend down from the pockmark base through SU7–SU5 to the upper well-stratified part of SU4 (glaciolacustrine rhythmite) at least. The seismic signal is attenuated below this stratigraphical level, likely because of the higher sand content, and the full vertical extents of the disrupted reflector columns are unclear in the profiles. The columns tend to be localized at elevations in the SU4 top, which may have acted as natural leak-off points for overpressured pore fluids (Cartwright et al., 2007). Reflectors are commonly folded up along the column margins in SU4 and SU5, in line with upward fluid flow. In the upper part of SU6 and in SU7 (brackish-water mud drifts), however, the reflectors are folded down along column margins, recording the upward migration of pockmark base with sediment deposition (Cartwright et al., 2007).
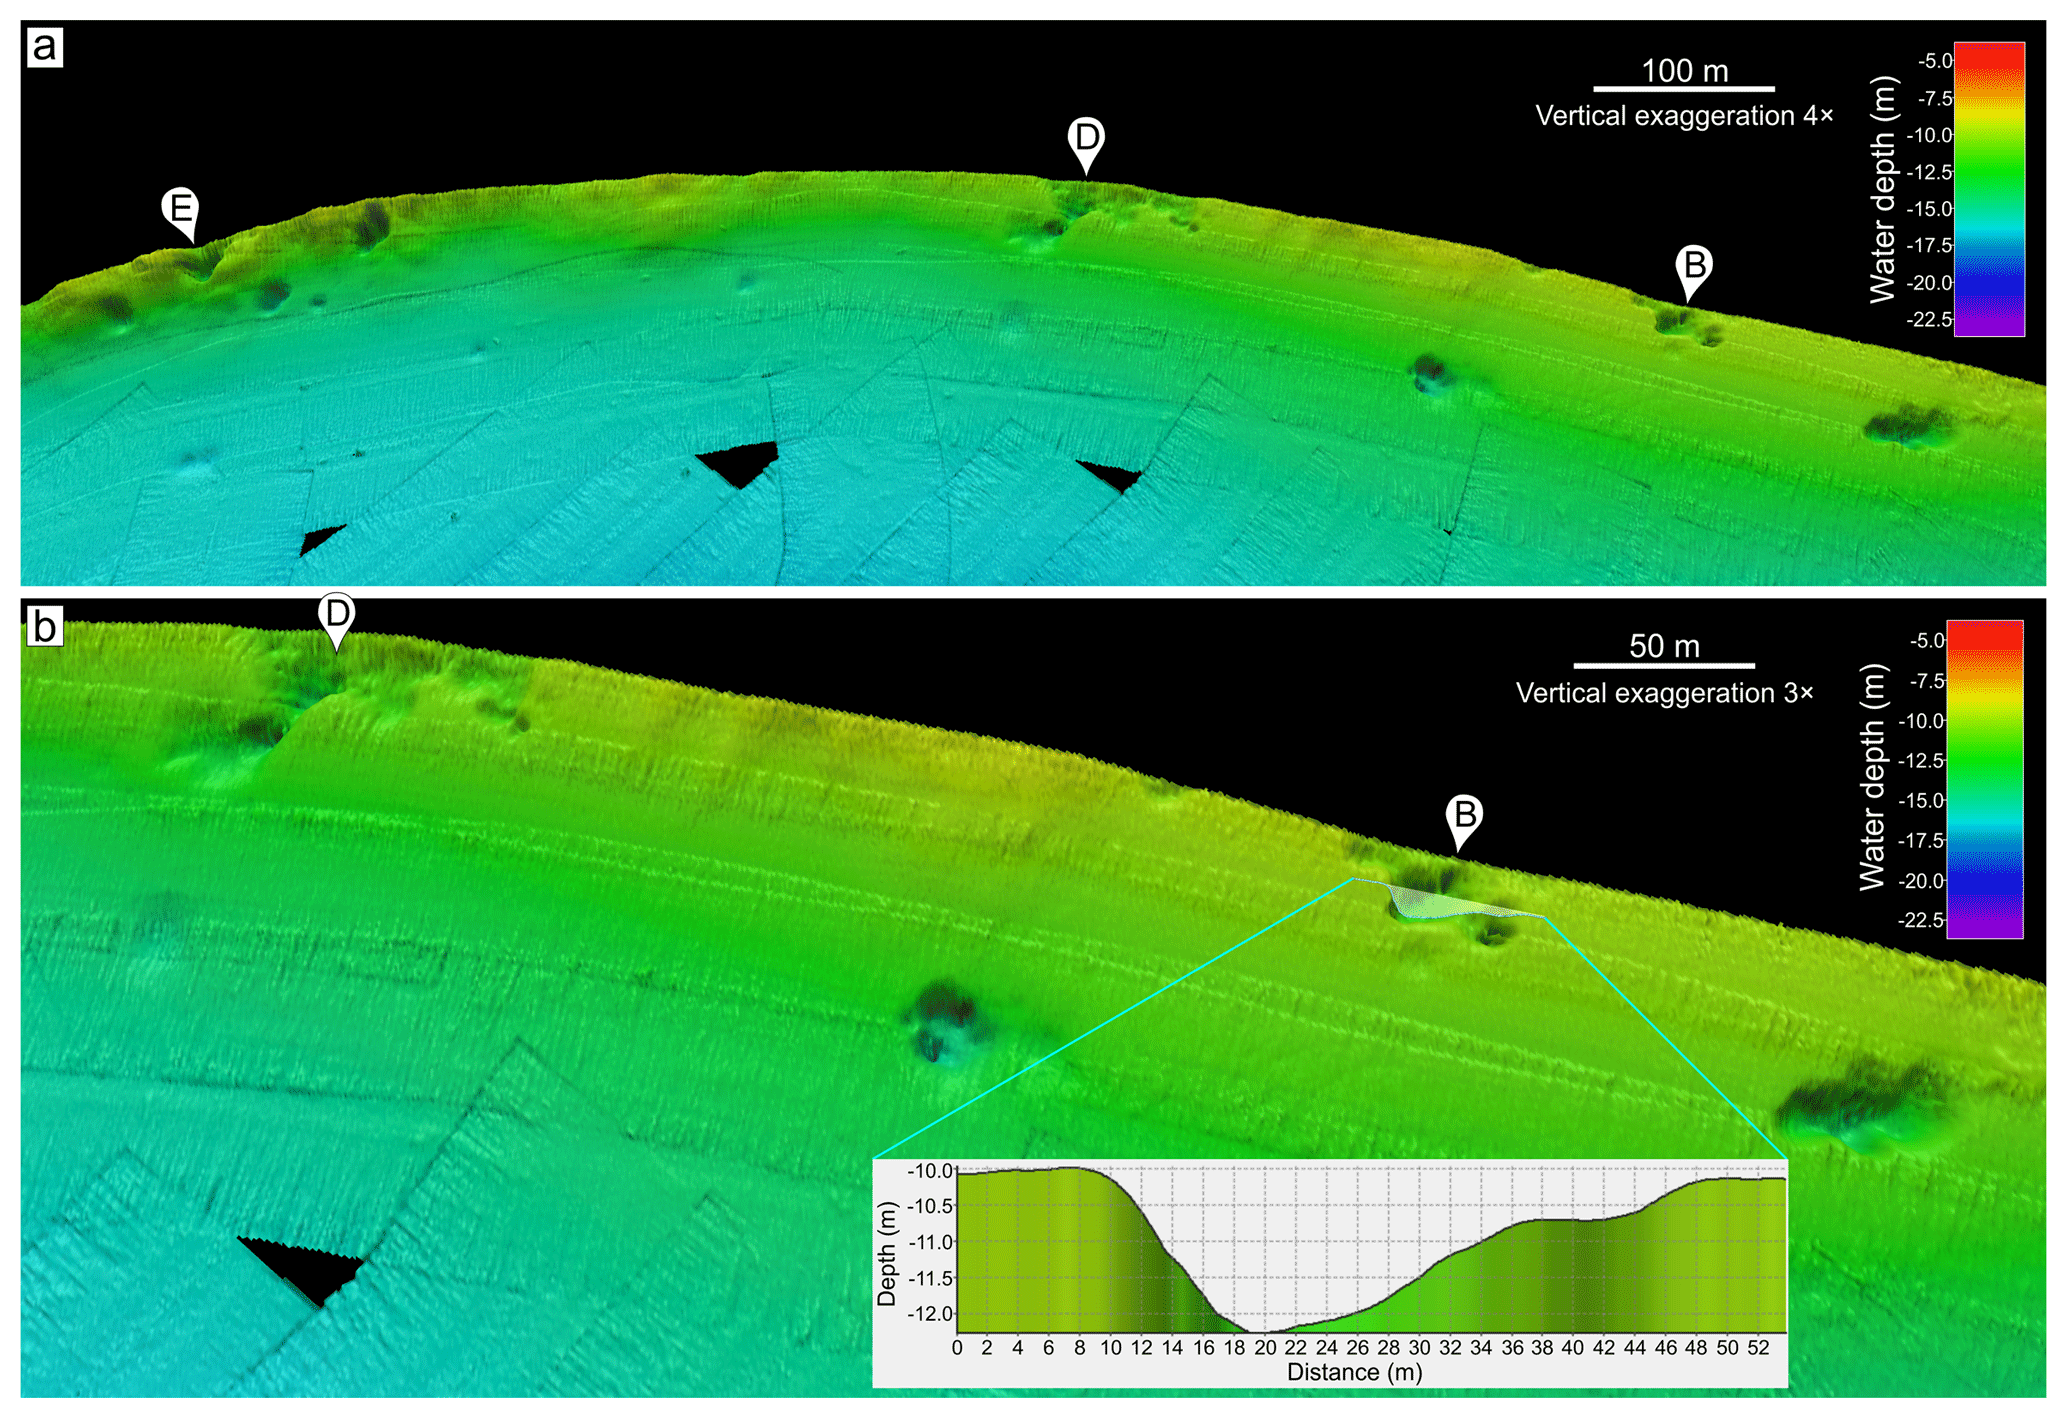
Figure 5Multibeam bathymetric images of pockmarks. (a) Multibeam image over pockmarks E, D, and B. (b) Close-up multibeam image over pockmarks D and B. Inset shows a depth profile over pockmark B.
The box-core sediment sample (MGBC-2018-2) collected from pockmark D is composed of structureless fine sand with very low organic content (Fig. 7a). The sample MGBC-2018-1 from pockmark B is very similar. In contrast, the sample MGBC-2018-3 collected from pockmark E is covered with a 7 cm thick surface layer of organic-rich mud, which is underlain by structureless fine sand of very low organic content (Fig. 7b). The surface of MGBC-2018-3 is overgrown by Stuckenia spp. Caesium-137 activity contents in the sand in MGBC-2018-3 are below 20 Bq kg−1, which is a normal level for sediments deposited before the 1986 Chernobyl nuclear disaster, whereas the 137Cs contents are substantially higher in the surficial mud layer (range 27.9–44.2 Bq kg−1). However, these values are still low compared to the present values exceeding 1000 Bq kg−1 in sediments that were deposited off the Finnish south coast soon after the disaster (e.g. Jokinen et al., 2015; Vallius, 2015). It appears that the 137Cs-enriched mud layer that covers pockmark E was deposited sometime after 1986, possibly within the past several years. The measured LOI and 137Cs values are available in PANGAEA (Virtasalo et al., 2019).
4.5 Hydrographic and radon measurements
Profiles measured by the CTD90M multiprobe show that the seawater is stratified with respect to temperature, with the thermocline located at 5–8 m depth (Fig. 6a–c). The temperature range is 13.2–15.9 ∘C above the thermocline, and 7.8–10.2 ∘C below. The salinity range is 4.61–5.13 PSU in the upper layer, whereas the bottom layer has a narrower range of 5.44–5.54 PSU. The water mass is well oxygenated with generally higher values in the bottom layer. Turbidity is low with slightly higher values in the upper layer. The measured hydrographic data are available in PANGAEA (Virtasalo et al., 2019).
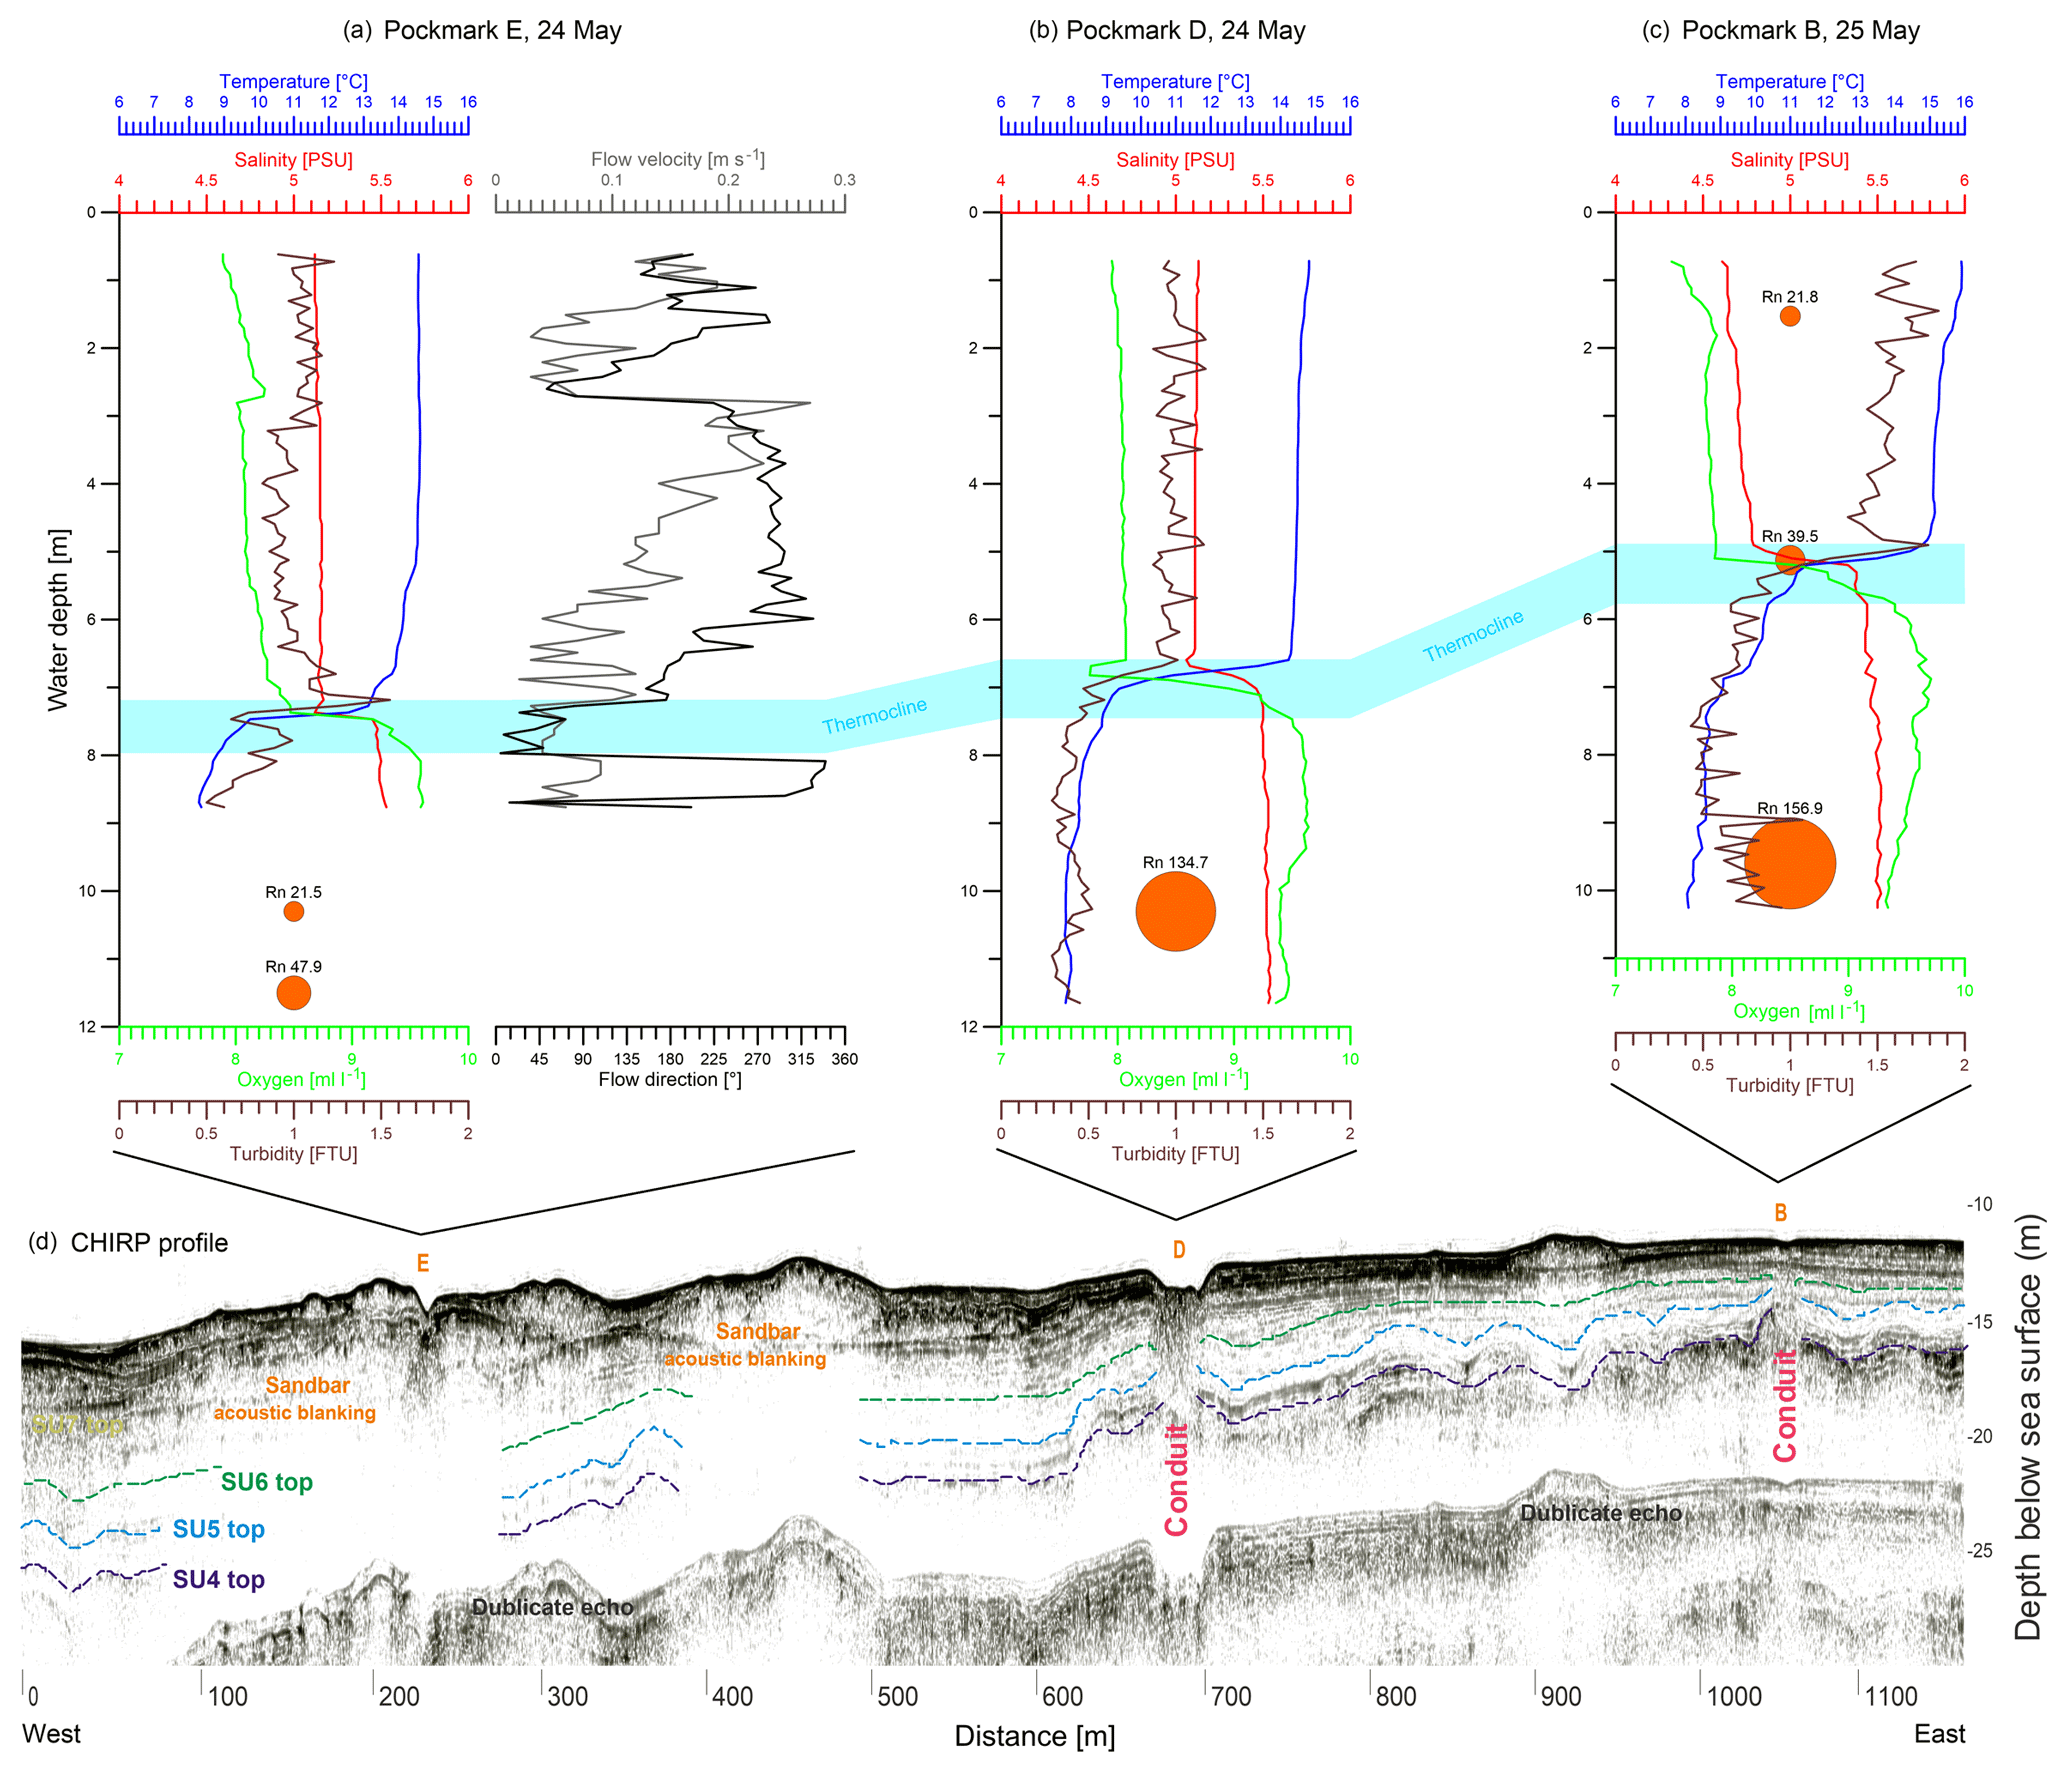
Figure 6Water column measurements and a CHIRP profile over pockmarks E, D, and B. (a) Water column profiles and radon point measurements at pockmark E. (b) Water column profiles and a radon point measurement at pockmark D. (c) Water column profiles and radon point measurements at pockmark B. Radon activity concentrations are in units of Bq m−3 (see also Table 1). (d) Interpreted 3.5–8 kHz CHIRP sub-bottom profile indicated in Fig. 1a.
The mean 222Rn activity concentration in the seawater surface is 16.9 Bq m−3, with locally slightly elevated concentrations of up to 49.9 Bq m−3 near the shoreline (Fig. 2c; Table 1). These elevated concentrations may result from localized groundwater seepage through the beach sand and/or from the local upwelling of 222Rn-bearing water from below the thermocline. The measured surface seawater 222Rn concentrations are available in PANGAEA (Virtasalo et al., 2019).
Table 1Measured 222Rn activity concentrations in sea and groundwater.
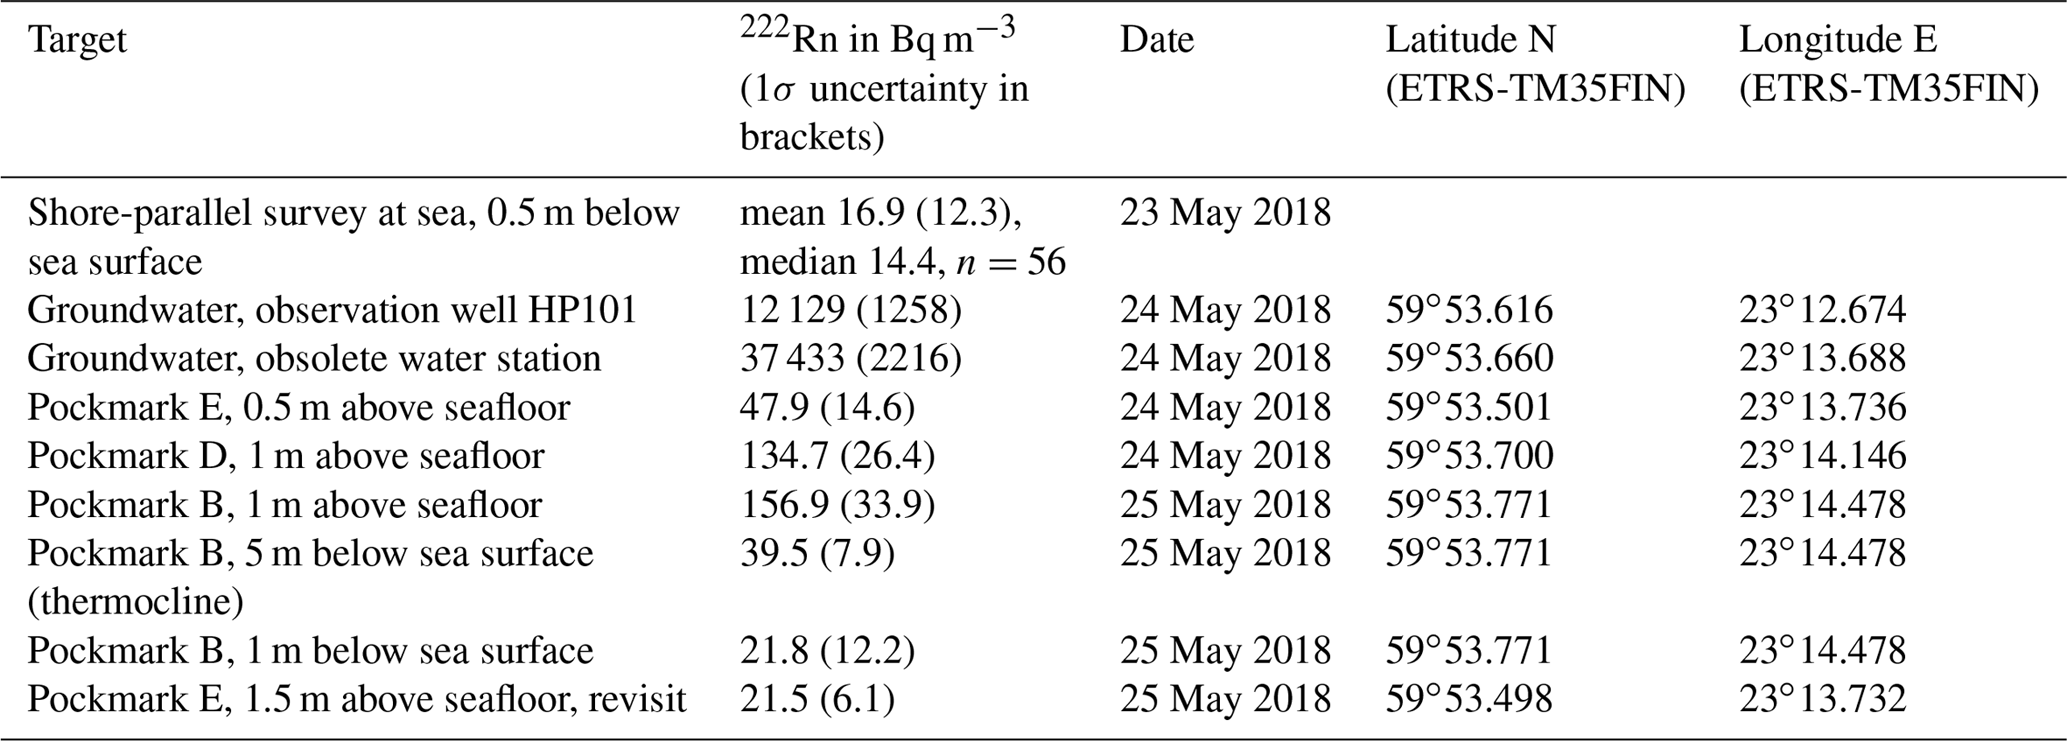
Significantly higher 222Rn activity concentrations were measured ca. 1 m above the bottom at pockmarks D and B (134.7 and 156.9 Bq m−3, respectively; Fig. 6b, c; Table 1). Above pockmark B, an elevated 222Rn concentration (39.5 Bq m−3) was measured in the upper part of thermocline at 5.1 m water depth, and a concentration of 21.8 Bq m−3 was measured at 1.5 m water depth, which is in the range of surface seawater concentrations. Apparently, the thermocline reduces the mixing of 222Rn-enriched bottom waters with surface waters. Notably, 222Rn concentrations measured ca. 1 and 2 m above the bottom of pockmark E (47.9 and 21.5 Bq m−3, respectively) are in the range of seawater surface and thermocline concentrations, and significantly lower than at pockmarks B and D. Therefore, 222Rn measurements indicate no recent SGD from pockmark E because the measured concentrations may result from 222Rn diffusion from sediments and/or advection. Flow directions measured below the thermocline at pockmark E (Fig. 6a) range between west and north, which makes 222Rn advection from pockmarks D and B in the west likely.
Radon activity concentrations in groundwater, measured in the observation well HP101 (12 129 Bq m−3) and in the obsolete water station that is located 7 m inland from the shoreline (37 433 Bq m−3), are substantially higher than those measured in seawater (Table 1).
A multifaceted dataset comprising offshore seismic sub-bottom profiles, multibeam and side-scan sonar images of the seafloor, radon measurements of sea- and groundwater, and onshore GPR and refraction seismic profiles has been studied with the aim to reconstruct the detailed stratigraphical architecture and aquifer geometry of a SGD site in the First Salpausselkä ice-marginal formation on the Hanko Peninsula in Finland.
5.1 Allostratigraphical architecture
Marine seismic reflection and onshore GPR profiling methods are similar in that both are based on wave propagation through water and sediments, and on wave reflection from subsurface structures and boundaries. However, they are different in the type of wave used for profiling. The seismic wave is reflected from interfaces where the acoustic impedance of sediment sharply changes (e.g. Sheriff and Geldart, 1995), whereas the GPR electromagnetic wave is sensitive to water content, and the ability of sedimentary structures and layers to hold water governs GPR reflections (Annan, 2009). The seismic refraction method is different from the reflection methods in that the seismic wave returns to the surface by refraction at subsurface interfaces with a strong acoustic impedance contrast (e.g. Sheriff and Geldart, 1995). Because of the technological differences, profiles obtained by these methods record different properties of the subsurface, and, therefore, are not inter-comparable. Significant unconformities in sediments, however, are typically associated with a change in the sediment acoustic impedance and water content, which is expressed in the different profiles by strong reflectors that can be correlated between the profiles following an allostratigraphical approach.
The use of allostratigraphy (North American Commission on Stratigraphic Nomenclature, 2005) is recommended for glacial and glacially influenced strata, which typically have frequent unconformities and high lithological heterogeneity that complicates lithostratigraphical classification (e.g. Virtasalo et al., 2007, 2014; Räsänen et al., 2009). Indeed, sediment deposition and erosion in the study area have been controlled by several independent processes, namely the retreat of the Fennoscandian continental ice sheet and the dynamics of the ice margin, the relative water level fall due to postglacial land uplift, the mid-Holocene marine incursion and the associated short-lived transgression as well as the establishment of brackish-water conditions, and, finally, coastal and aeolian processes (Virkkala, 1963; Glückert, 1986; Fyfe, 1990; Kujansuu et al., 1993; Virtasalo et al., 2007, 2014, 2016). As a result of the complex depositional history, allostratigraphy has recently gained popularity as a stratigraphical classification approach both in the Baltic Sea (e.g. Virtasalo et al., 2007, 2014; Tsyrulnikov et al., 2012; Hyttinen et al., 2017; Jensen et al., 2017) and on the surrounding land areas (Räsänen et al., 2009; Ojala et al., 2018).
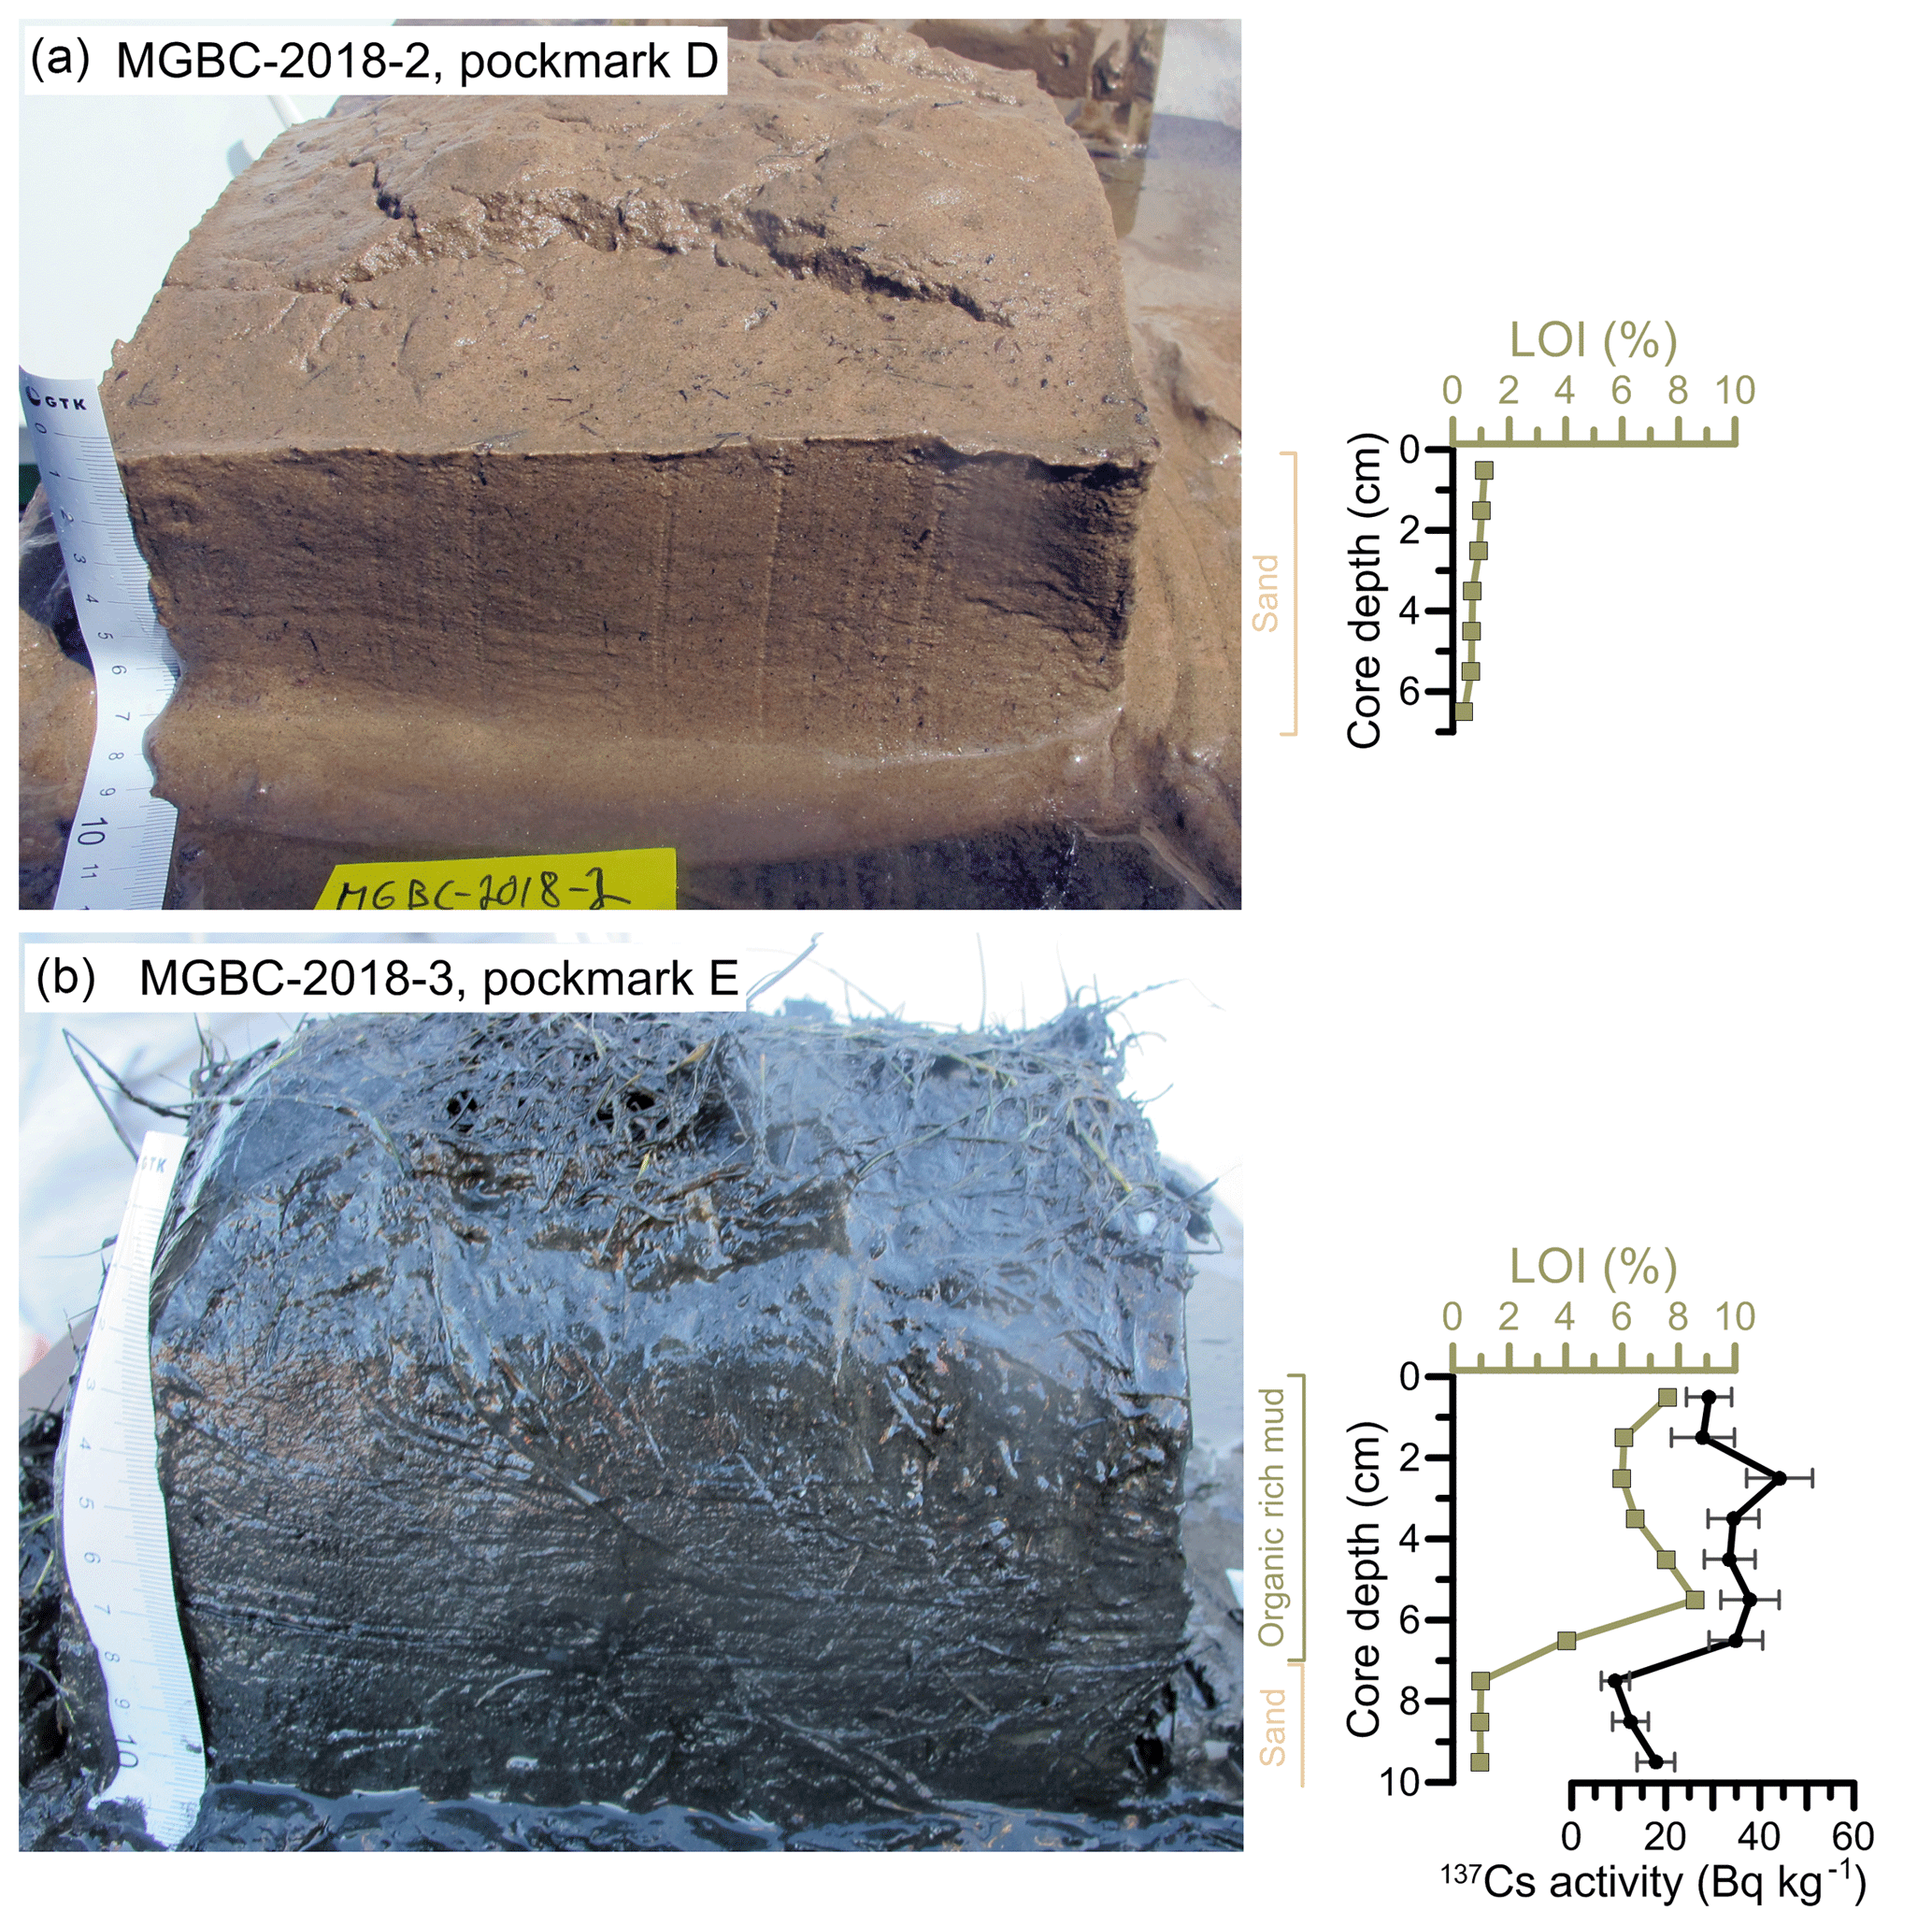
Figure 7Images of sediment box cores with the measured weight loss on ignition (LOI) and 137Cs activity content. (a) Core MGBC-2018-2 from pockmark D. (b) Core MGBC-2018-3 from pockmark E.
In this study, allostratigraphy is used, for the first time, for the correlation of unconformities recognized in offshore seismic profiles to those in onshore GPR and refraction seismic profiles in order to establish the local stratigraphic architecture across the shoreline. Five significant unconformities are recognized in the offshore seismic profiles (Fig. 3), whereas two are recognized in the onshore GPR profiles and one in the refraction seismic profile (Fig. 4). The offshore unconformities are correlated with those onshore based on the interpreted composition and sedimentary environment of their bounded units in the deglacial to postglacial depositional succession (Fig. 8).
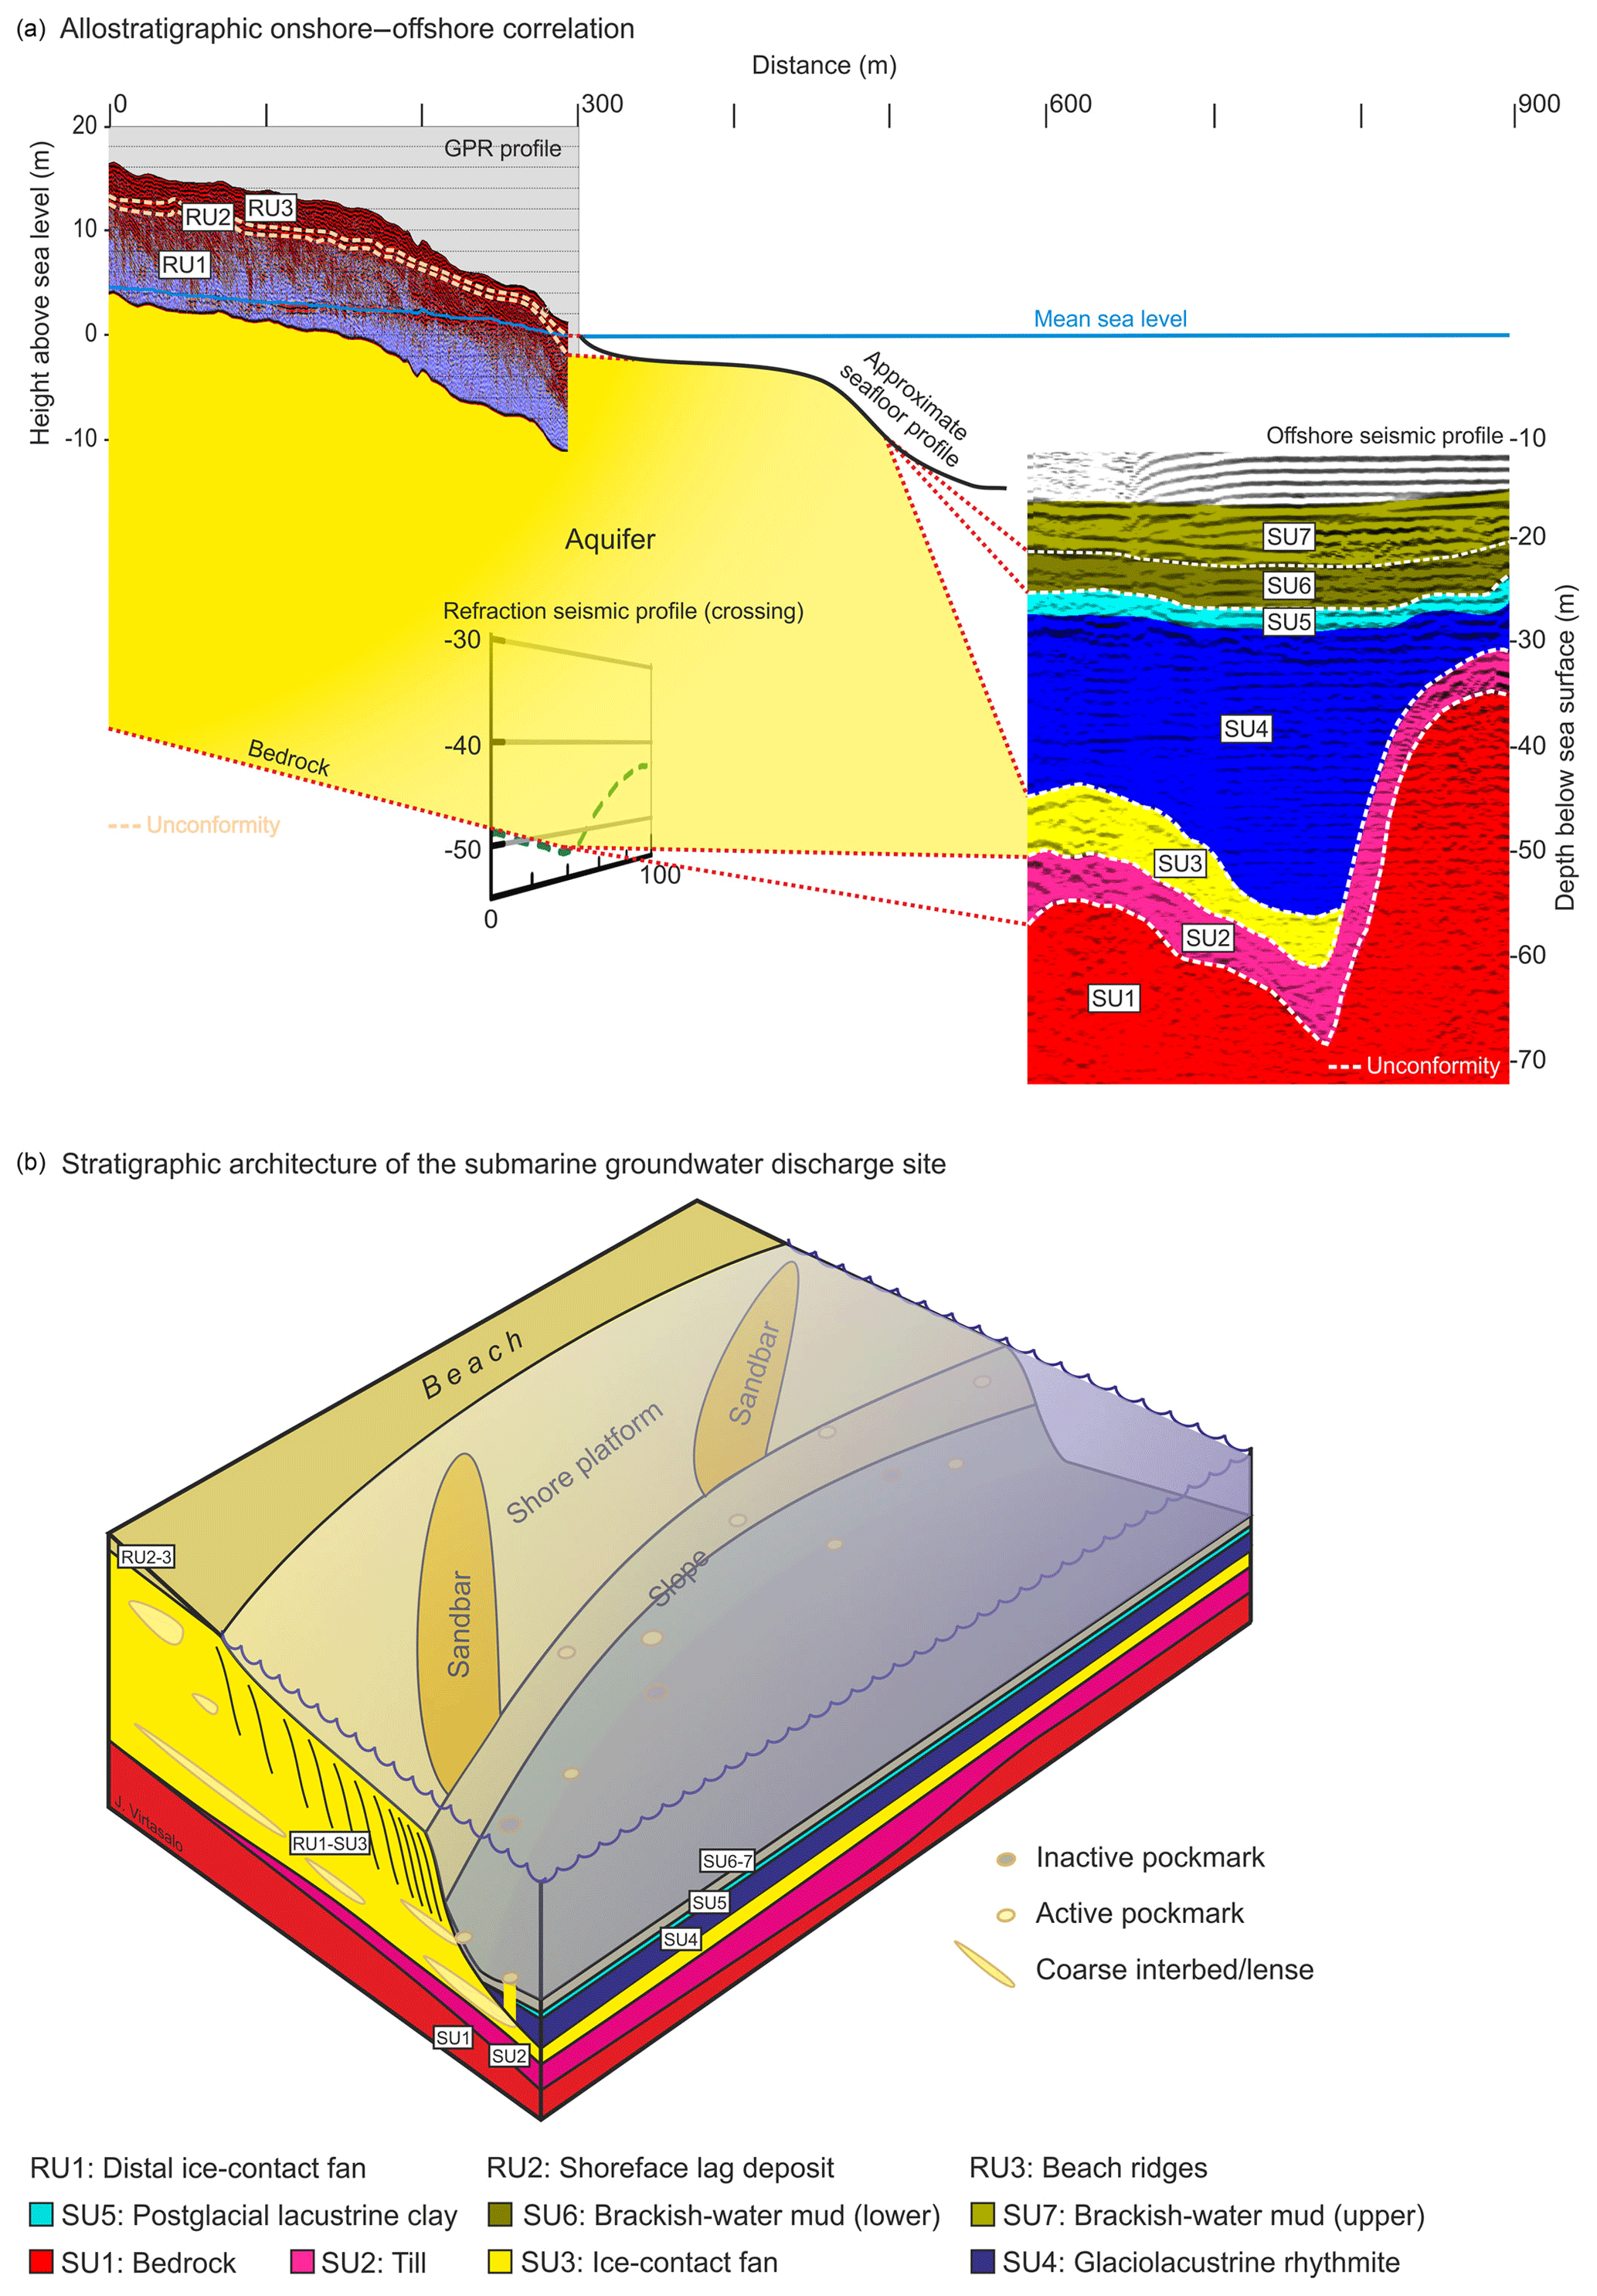
Figure 8Summary diagrams. (a) Allostratigraphical correlation of unconformities between the onshore ground-penetrating radar and refraction seismic profiles, and the offshore seismic profiles. (b) Stratigraphical architecture of the studied submarine groundwater discharge site; not to scale.
The lowermost unit with identifiable bottom and top reflectors in the offshore reflection seismic profiles is till (SU2; Fig. 3). The till layer is not discernible in the GPR profiles (Fig. 4a, b), which may be due to (1) the insufficient depth penetration of the electromagnetic wave, (2) the thinness or even absence of the till layer because of the higher bedrock elevation on the land area, or (3) the poor penetration of the electromagnetic wave in tills with a fine-grained matrix (e.g. Sutinen, 1992). Likewise, no surface that could be associated with a till layer covering the bedrock is observed in the refraction seismic profile (Fig. 4c). Geological mapping shows that bedrock elevations in the area often lack till cover (Kujansuu et al., 1993). Furthermore, unpublished drill logs of groundwater observation wells in the study area document no till layer on the bedrock.
The only unit that can be traced from the offshore seismic profiles to the onshore GPR profiles is the subaqueous ice-contact fan on land (RU1) and its most distal part offshore (SU3; Fig. 8). Such subaqueous ice-contact fans form a significant part of the First Salpausselkä ice-marginal formation (Virkkala, 1963; Glückert, 1986; Fyfe, 1990; Kujansuu et al., 1993). The unit is erosionally exposed at seafloor on the shore platform.
The glaciolacustrine, postglacial lacustrine, and lower brackish-water deposits (SU4 to SU6) were deposited over the whole study area (Virtasalo et al., 2007, 2014), but have since been removed from the GPR-profiled land area as a consequence of erosion by waves, currents, and winter ice during emergence from the sea. The coarse lag sheet (RU2) in the GPR profiles is the product of this erosion and associated preferential removal of fine-grained material. The overlying beach ridge deposits (RU3) were formed at the beachface during emergence and by later aeolian processes. The upper brackish-water mud unit (SU7) represents modern mud drift deposition at sea.
5.2 Submarine groundwater discharge
The main coastal aquifer on the Hanko Peninsula is hosted in the First Salpausselkä ice-marginal formation (e.g. Luoma et al., 2015), which is a ridge of contiguous subaqueous ice-contact fans and local feeding eskers (Virkkala, 1963; Glückert, 1986; Fyfe, 1990; Kujansuu et al., 1993). The studied SGD site is situated in the distal part of a subaqueous ice-contact fan (RU1-SU3; Fig. 8). Based on low reflector amplitudes in the offshore seismic profiles (SU3; Fig. 3c, d) and available unpublished drill logs from the land area, the subaqueous fan deposits are dominated by fine sand, which typically has moderate hydraulic conductivity (e.g. Bear, 1972). However, GPR profiles and the drill logs show interbeds and lenses of coarse sand and gravel in the subaqueous fan. Slug tests carried out in the area demonstrate high hydraulic conductivities for such coarser beds (K < 13.8 m d−1; Luoma and Pullinen, 2011). It is thus likely that the interbedded coarser deposits in the fine-sand-dominated distal part of the subaqueous fan provide conduits for localized groundwater flow to pockmarks that are visible on the shore platform slope (Figs. 2b, 2d, 5). In addition, coarse couplet layers in the superimposed glaciolacustrine rhythmite can act as groundwater conduits to the pockmarks (Söderberg and Flodén, 1997; Virtasalo et al., 2007). The offshore stratigraphical units – till (SU2), postglacial lacustrine poorly bedded silty clay (SU5), and organic-rich brackish-water mud (SU6 and SU7) – have low hydraulic conductivities, and the silty clay and mud units likely act as confining layers (e.g. Bear, 1972). No faults are observed in the studied profiles, and the groundwater conduits do not seem to be linked with faulting.
Significantly elevated radon activity concentrations measured 1 m above pockmarks D and B strongly indicate SGD from these locations (Fig. 4b, c). In comparison, 222Rn concentrations measured above pockmark E are not elevated but similar to those measured in the thermocline above pockmark D and in surface seawater (Figs. 2c, 4a; Table 1), which precludes significant SGD from pockmark E at the time of measurements. It can thus be concluded that pockmarks are the most significant locations of SGD in the study area, and that not all of the pockmarks observed in the multibeam and side-scan sonar images are active. Although pockmarks are known to form also as a result of gas seepage from seafloor (e.g. Hovland et al., 2002), the significant groundwater (radon) flux from the studied pockmarks implies submarine groundwater discharge as the most likely mechanism of their formation. Furthermore, low organic contents make significant methane production less likely in the glacigenic deposits.
In order to roughly estimate the rate of SGD from pockmark B, the 222Rn inventory of ∼781 Bq m−2 is calculated on the basis of concentration gradient between pockmark B bottom and the thermocline upper boundary. Assuming steady state and that SGD is the only major source of radon, the calculated 222Rn inventory will decay at the rate of 142 Bq m−2 d−1, which must be balanced by SGD. Using the measured 222Rn concentrations of groundwater in the well HP 101 and the obsolete water station (Table 1) we arrive at SGD rates between 0.4 and 1.2 cm d−1. This simple model does not consider the lateral export of 222Rn due to bottom currents, for example. The 222Rn inventory and SGD rates, therefore, must be considered lower limits. These first SGD rate estimates can be improved, for example, by a more robust 222Rn mass balance as outlined in Burnett et al. (2006) by advection and diffusion modelling of porewater Cl profiles (e.g. Schlüter et al., 2004), and by three-dimensional groundwater flow modelling (e.g. Luoma and Okkonen, 2014).
Sediment samples collected from pockmarks D and B are composed of fine sand, whereas pockmark E is covered with soft organic-rich mud (Fig. 7). Considering the lack of SGD from pockmark E as demonstrated by the low 222Rn activity concentrations, it would seem plausible that SGD prevents permanent organic-rich mud deposition in pockmarks D and B. Indeed, our unpublished video observations show that percolating subsurface fluids cause the resuspension of fine sediment in the pockmarks (see also Schlüter et al., 2004). The resuspended fine sediment is then removed by near-bottom flows, resulting in lower relative sedimentation rate and coarser grain size in the pockmark (Hammer et al., 2009). The absence of significantly elevated rims around the pockmarks (Figs. 5, 6d) further supports the efficient lateral sediment transport and precludes significant subsurface sediment mobilization and transport of particles to the seafloor (Loher et al., 2016). 137Cs activity contents in the organic-rich surface mud layer in pockmark E are at the post-Chernobyl level (Fig. 7b), which suggests that SGD from the pockmark ceased several years after 1986.
SGD depends on the hydraulic head gradient between the elevated part of the aquifer on land, and the top of the permeable unit at sea (Burnett et al., 2003; Moore, 2010). The GPR profiles show that groundwater is hosted in the subaqueous fan deposits (RU1; Fig. 4). Seaward groundwater flow at the study area could have initiated only after the subaqueous fan deposits had been uplifted sufficiently high above sea level in order to produce the required hydraulic head. The change in the direction of folding of reflectors along the margins of groundwater conduits from a folded-up to a folded-down direction in the upper part of SU6 in the CHIRP profiles indicates a shift from the post-depositional folding by upward fluid expulsion to the upward migration of the pockmark bottom with sediment deposition (Fig. 6d; Cartwright et al., 2007). This timing of the formation of pockmarks and the initiation of SGD must have taken place after the beginning of the brackish-water mud (SU6) deposition at ca. 7600 years ago (Virtasalo et al., 2007). According to shore displacement studies, the subaqueous fan deposits that today rise as much as 20 m above sea level in the area began to emerge from the sea ca. 5000 years ago (Eronen et al., 2001), which is in good agreement with the reflector-folding interpretation of CHIRP profiles. Probably it took several hundreds of years before the subaqueous fan deposits were uplifted sufficiently high above sea level for the initiation SGD and the formation of first pockmarks.
Radon activity concentrations measured in the groundwater observation well (HP101, 12 129 Bq m−3) and in the obsolete water station (37 433 Bq m−3) are substantially higher than those measured in seawater (Table 1). The measured values are below the mean 222Rn activity concentration of 92 000 Bq m−3 in 961 springs and dug wells in southern Finland (Salonen, 1988), and well below the upper permissible limit for 222Rn in public drinking water in Finland that is set to 300 000 Bq m−3 (Ministry of Social Affairs and Health, 2001).
Allostratigraphical architecture and aquifer geometry have been established for a SGD site in the First Salpausselkä ice-marginal formation on the Hanko Peninsula in Finland. Significant unconformities recognized in the offshore seismic and onshore GPR and refraction seismic profiles permitted the allostratigraphical correlation across the shoreline. The studied location is characterized by a sandy beach, a sandy shore platform that extends 100–250 m seaward sloping gently to ca. 4 m water depth, and a steep slope to ca. 17 m water depth within ca. 50 m distance. The aquifer is hosted in the distal sand-dominated part of a subaqueous ice-contact fan with coarse sand and gravel interbeds and lenses. Presumably, the coarser interbeds and lenses in the fan deposits, and, potentially, coarse couplet layers in the overlying glaciolacustrine rhythmite, provide conduits for localized groundwater flow, which is discharged predominantly through pockmarks that are visible on the shore platform slope in multibeam and side-scan sonar images. Radon measurements confirmed SGD from pockmarks D and B, while pockmark E was inactive and covered by an organic-rich mud surface layer of several years. The SGD initiated after brackish-water conditions were established in the northern Baltic Sea, probably soon after 5000 years ago when the highest ice-contact fan deposits emerged above sea level as a result of postglacial land uplift.
Hydrographic data, surface seawater 222Rn activity concentration, and LOI and 137Cs values of sediment samples are available in PANGAEA (Virtasalo et al., 2019; https://doi.org/10.1594/PANGAEA.898674).
The supplement related to this article is available online at: https://doi.org/10.5194/se-10-405-2019-supplement.
JJV devised the study and was responsible for the offshore seismic surveys, hydrographic measurements, and data interpretation. JSchr and JScho were responsible for sea and groundwater radon measurements, and data interpretation. SL participated in planning the study, and together with JMa collected and processed the GPR data. JMu was responsible of the collection and interpretation of refraction seismic data. JJV prepared the manuscript with contributions from all co-authors.
The authors declare that they have no conflict of interest.
This work resulted from the BONUS SEAMOUNT project supported by BONUS (Art 185), funded jointly by the EU, the Academy of Finland (grant no. 311983), and the Federal Ministry of Education and Research, Germany (grant no. 03F0771B). This study has utilized research infrastructure facilities provided by FINMARI (Finnish Marine Research Infrastructure network). Tapio Lepikkö from Uudenmaan virkistysalueyhdistys is thanked for permission for the refraction seismic survey. Jutta Winsemann and an anonymous reviewer provided thoughtful comments that helped improve the manuscript. Christoffer Boström identified Stuckenia spp.
This paper was edited by Elias Samankassou and reviewed by Jutta Winsemann and one anonymous referee.
Andersen, J. H., Carstensen, J., Conley, D. J., Dromph, K., Fleming-Lehtinen, V., Gustafsson, B. G., Josefson, A. B., Norkko, A., Villnäs, A., and Murray, C.: Long-term temporal and spatial trends in eutrophication status of the Baltic Sea, Biol. Rev., 92, 135–149, https://doi.org/10.1111/brv.12221, 2017.
Andrews, J. N. and Wood, D. F.: Mechanism of radon release in rock matrices and entry into groundwaters, T. I. Min. Metall. B, 81, 197–209, 1972.
Annan, A. P.: Electromagnetic principles of ground penetrating radar, in: Ground Penetrating Radar: Theory and Applications, edited by: Jol, H. M., Elsevier, Amsterdam, the Netherlands, 3–40, 2009.
Bengtsson, L. and Enell, M.: Chemical analysis, in: Handbook of Holocene Palaeoecology and Palaeohydrology, edited by: Berglund, D. E., Wiley, Chichester, UK, 423–451, 1986.
Bear, J.: Dynamics of fluids in porous media, Elsevier, New York, USA, 756 pp., 1972.
Burnett, W. C. and Dulaiova, H.: Estimating the dynamics of groundwater input into the coastal zone via continuous radon-222 measurements, J. Environ. Radioactiv., 69, 21–35, https://doi.org/10.1016/S0265-931X(03)00084-5, 2003.
Burnett, W. C., Bokuniewicz, H., Huettel, M., Moore, W. S., and Taniguchi, M.: Groundwater and pore water inputs to the coastal zone, Biogeochemistry, 66, 3–33, https://doi.org/10.1023/B:BIOG.0000006066.21240.53, 2003.
Burnett, W. C., Aggarwal, P. K., Aureli, A., Bokuniewicz, H., Cable, J. E., Charette, M. A., Kontar, E., Krupa, S., Kulkarni, K. M., Loveless, A., Moore, W. S., Oberdorfer, J. A., Oliveira, J., Ozyurt, N., Povinec, P., Privitera, A. M. G., Rajar, R., Ramessur, R. T., Scholten, J., Stieglitz, T., Taniguchi, M., and Turner, J. V.: Quantifying submarine groundwater discharge in the coastal zone via multiple methods, Sci. Total Environ., 367, 498–543, https://doi.org/10.1016/j.scitotenv.2006.05.009, 2006.
Burnett, W. C., Peterson, R., Moore, W. S., and de Oliveira, J.: Radon and radium isotopes as tracers of submarine groundwater discharge – Results from the Ubatuba, Brazil SGD assessment intercomparison, Estuar. Coast. Shelf S., 76, 501–511, https://doi.org/10.1016/j.ecss.2007.07.027, 2008.
Cartwright, J., Huuse, M., and Aplin, A.: Seal bypass systems, AAPG Bull., 91, 1141–1166, https://doi.org/10.1306/04090705181, 2007.
Clemmensen, L. B. and Nielsen, L.: Internal architecture of a raised beach ridge system (Anholt, Denmark) resolved by ground-penetrating radar investigations, Sediment. Geol., 223, 281–290, https://doi.org/10.1016/j.sedgeo.2009.11.014, 2010.
De Geer, G.: Geochronologie der letzten 12000 Jahre, Geol. Rundsch., 3, 457–471, https://doi.org/10.1007/BF01802565, 1912.
Donner, J.: The Younger Dryas age of the Salpausselkä moraines in Finland, Bull. Geol. Soc. Finl., 82, 69–80, https://doi.org/10.17741/bgsf/82.2.001, 2010.
Eronen, M., Glückert, G., Hatakka, L., van de Plassche, O., van der Plicht, J., and Rantala, P.: Rates of Holocene isostatic uplift and relative sea-level lowering of the Baltic in SW Finland based on studies of isolation contacts, Boreas, 30, 17–30, https://doi.org/10.1111/j.1502-3885.2001.tb00985.x, 2001.
Eyles, C. H., Eyles, N., and Miall, A. D.: Models of glaciomarine sedimentation and their application to the interpretation of ancient glacial sequences, Palaeogeogr. Palaeocl., 51, 15–84, https://doi.org/10.1016/0031-0182(85)90080-X, 1985.
Ferguson, G. and Gleeson, T.: Vulnerability of coastal aquifers to groundwater use and climate change, Nat. Clim. Change, 2, 342–345, https://doi.org/10.1038/nclimate1413, 2012.
Fyfe, G. J.: The effect of water depth on ice-proximal glaciolacustrine sedimentation: Salpausselka I, southern Finland, Boreas, 19, 147–164, https://doi.org/10.1111/j.1502-3885.1990.tb00576.x, 1990.
Gerber, T. P., Pratson, L. F., Wolinsky, M. A., Steel, R., Mohr, J., Swenson, J. B., and Paola, C.: Clinoform progradation by turbidity currents: modeling and experiments, J. Sediment. Res., 78, 220–238, https://doi.org/10.2110/jsr.2008.023, 2008.
Gleeson, J., Santos, I. R., Maher, D. T., and Golsby-Smith, L.: Groundwater–surface water exchange in a mangrove tidal creek: evidence from natural geochemical tracers and implications for nutrient budgets, Mar. Chem., 156, 27–37, https://doi.org/10.1016/j.marchem.2013.02.001, 2013.
Glückert, G.: The First Salpausselkä at Lohja, southern Finland, Bull. Geol. Soc. Finl., 58, 45–55, 1986.
Häkkinen, A.: Saaristomeren vedenalaiset maa-ainesvarat, Varsinais-Suomen seutukaavaliitto, Turku, Finland, 58 pp., 1990.
Hammer, Ø., Webb, K. E., and Depreiter, D.: Numerical simulation of upwelling currents in pockmarks and data from the Inner Oslofjord, Norway, Geo-Mar. Lett., 29, 269–275, https://doi.org/10.1007/s00367-009-0140-z, 2009.
Hovland, M., Gardner, J. V., and Judd, A. G.: The significance of pockmarks to understanding fluid flow processes and geohazards, Geofluids, 2, 127–136, https://doi.org/10.1046/j.1468-8123.2002.00028.x, 2002.
Hyttinen, O., Kotilainen, A. T., Virtasalo, J. J., Kekäläinen, P., Snowball, I., Obrochta, S., and Andrén, T.: Holocene stratigraphy of the Ångermanälven River estuary, Bothnian Sea, Geo-Mar. Lett., 37, 273–288, https://doi.org/10.1007/s00367-016-0490-2, 2017.
Jakobsson, M., O'Regan, M., Gyllencreutz, R., and Flodén, T.: Seafloor terraces and semi-circular depressions related to fluid discharge n Stockholm Archipelago, Baltic Sea, in: Atlas of Submarine Glacial Landforms: Modern, Quaternary and Ancient, edited by: Dowdeswell, J. A., Canals, M., Jakobsson, M., Todd, B. J., Dowdeswell, E. K., and Hogan, K. A., Geological Society, London, Memoirs, 46, 305–306, https://doi.org/10.1144/M46.162, 2016.
Jankowska, H., Matciak, M., and Nowacki, J.: Salinity variations as an effect of groundwater seepage through the seabed (Puck Bay, Poland), Oceanologia, 36, 33–46, 1994.
Jensen, J. B., Kuijpers, A., Bennike, O., Laier, T., and Werner, F.: New geological aspects for freshwater seepage and formation in Eckernförde Bay, western Baltic, Cont. Shelf Res., 22, 2159–2173, https://doi.org/10.1016/S0278-4343(02)00076-6, 2002.
Jensen, J. B., Moros, M., Endler, R., and IODP Expedition 347 Members.: The Bornholm Basin, southern Scandinavia: a complex history from Late Cretaceous structural developments to recent sedimentation, Boreas, 46, 3–17, https://doi.org/10.1111/bor.12194, 2017.
Jokinen, S. A., Virtasalo, J. J., Kotilainen, A. T., and Saarinen, T.: Varve microfabric record of seasonal sedimentation and bottom flow-modulated mud deposition in the coastal northern Baltic Sea, Mar. Geol., 366, 79–96, https://doi.org/10.1016/j.margeo.2015.05.003, 2015.
Kakkuri, J.: Fennoscandian land uplift: past, present and future, in: From the Earth's Core to Outer Space, edited by: Haapala, I., Lecture Notes in Earth System Sciences, 137, 127–136, https://doi.org/10.1007/978-3-642-25550-2_8, 2012.
Kielosto, S., Kukkonen, M., Stén, C.-G., and Backman, B.: Hangon ja Perniön kartta-alueiden maaperä. Summary: Quaternary deposits in the Hanko and Perniö map-sheet areas, Geological map of Finland 1:100 000. Explanation to the maps of Quaternary deposits, sheets 2011 and 2012, Geological Survey of Finland, Espoo, Finland, 104 pp., 1996.
Krall, L., Trezzi, G., Garcia-Orellana, J., Rodellas, V., Mörth, C.-M., and Andersson, P.: Submarine groundwater discharge at Forsmark, Gulf of Bothnia, provided by Ra isotopes, Mar. Chem., 196, 162–172, https://doi.org/10.1016/j.marchem.2017.09.003, 2017.
Kujansuu, R., Uusinoka, R., Herola, E., and Sten, C.-G.: Tammisaaren kartta-alueen maaperä. Summary: Quaternary deposits in the Tammisaari map-sheet area, Geological map of Finland 1:100 000. Explanation to the maps of Quaternary deposits, sheet 2014, Geological Survey of Finland, Espoo, Finland, 90 pp., 1993.
Lang, J. and Winsemann, J.: Lateral and vertical facies relationships of bedforms deposited by aggradating supercritical flows: from cyclic steps to humpback dunes, Sediment. Geol., 296, 36–54, https://doi.org/10.1016/j.sedgeo.2013.08.005, 2013.
Lang, J., Sievers, J., Loewer, M., Igel, J., and Winsemann, J.: 3D architecture of cyclic-step and antidune deposits in glacigenic subaqueous fan and delta settings: integrating outcrop and ground-penetrating radar data, Sediment. Geol., 362, 83–100, https://doi.org/10.1016/j.sedgeo.2017.10.011, 2017.
Loher, M., Reusch, A., and Strasser M.: Long-term pockmark maintenance by fluid seepage and subsurface sediment mobilization – sedimentological investigations in Lake Neuchâtel, Sedimentology, 63, 1168–1186, https://doi.org/10.1111/sed.12255, 2016.
Luoma, S. and Okkonen, J.: Impacts of future climate change and Baltic Sea level rise on groundwater recharge, groundwater levels, and surface leakage in the Hanko aquifer in Southern Finland, Water, 6, 3671–3700, https://doi.org/10.3390/w6123671, 2014.
Luoma, S. and Pullinen, A.: Field Investigation and Estimates of Hydraulic Conductivity from Slug Tests in the First Salpausselkä formation in the Santala area, Hanko, south Finland, Archived report, Geological Survey of Finland, Espoo, 2011.
Luoma, S., Okkonen, J., Korkka-Niemi, K., Hendriksson, N., and Backman, B.: Confronting the vicinity of the surface water and sea shore in a shallow glaciogenic aquifer in southern Finland, Hydrol. Earth Syst. Sci., 19, 1353–1370, https://doi.org/10.5194/hess-19-1353-2015, 2015.
Merkouriadi, I. and Leppäranta, M.: Long-term analysis of hydrography and sea-ice data in Tvärminne, Gulf of Finland, Baltic Sea, Climatic Change, 124, 849–859, https://doi.org/10.1007/s10584-014-1130-3, 2014.
Ministry of Social Affairs and Health: Decree 401/2001, Sosiaali- ja terveysministeriön asetus pienten yksiköiden talousveden laatuvaatimuksista ja valvontatutkimuksista, 2001.
Moore, W. S.: The effect of submarine groundwater discharge on the ocean, Annu. Rev. Mar. Sci., 2, 59–88, https://doi.org/10.1146/annurev-marine-120308-081019, 2010.
Mullinger, N. J., Pates, J. M., Binley, A. M., and Crook, N. P.: Controls on the spatial and temporal variability of 222Rn in riparian groundwater in a lowland Chalk catchment, J. Hydrol., 376, 58–69, https://doi.org/10.1016/j.jhydrol.2009.07.015, 2009.
Muru, M., Rosentau, A., Preusser, F., Plado, J., Sibul, I., Jõeleht, A., Bjursäter, S., Aunap, R., and Kriiska, A.: Reconstructing Holocene shore displacement and Stone Age palaeogeography from a foredune sequence on Ruhnu Island, Gulf of Riga, Baltic Sea, Geomorphology, 303, 434–445, https://doi.org/10.1016/j.geomorph.2017.12.016, 2018.
Neal, A.: Ground-penetrating radar and its use in sedimentology: principles, problems and progress, Earth-Sci. Rev., 66, 261–330, https://doi.org/10.1016/j.earscirev.2004.01.004, 2004.
Nemec, W., Lønne, I., and Blikra, L. H.: The Kregnes moraine in Gauldalen. west-central Norway: anatomy of a Younger Dryas proglacial delta in a palaeofjord basin, Boreas, 28, 454–476, https://doi.org/10.1111/j.1502-3885.1999.tb00234.x, 1999.
North American Commission on Stratigraphic Nomenclature: North American stratigraphic code, AAPG Bull., 89, 1547–1591, https://doi.org/10.1306/07050504129, 2005.
Nuorteva, J.: Topographically influenced sedimentation in Quaternary deposits – a detailed acoustic study from the western part of the Gulf of Finland, Geological Survey of Finland, Report of Investigation, 122, 1–88, 1994.
Ojala, A. E. K., Saresma, M., Virtasalo, J. J., and Huotari-Halkosaari, T.: An allostratigraphic approach to subdivide fine-grained sediments for urban planning, B. Eng. Geol. Environ., 77, 879–892, https://doi.org/10.1007/s10064-016-0981-4, 2018.
Pellikka, H., Leijala, U., Johansson, M. M., Leinonen, K., and Kahma, K. K.: Future probabilities of coastal floods in Finland, Cont. Shelf Res., 157, 32–42, https://doi.org/10.1016/j.csr.2018.02.006, 2018.
Peterson, R. N., Burnett, W. C., Taniguchi, M., Chen, J., Santos, I. R., and Ishitobi, T.: Radon and radium isotope assessment of submarine groundwater discharge in the Yellow River Delta, China, J. Geophys. Res., 113, C09021, https://doi.org/10.1029/2008JC004776, 2008.
Powell, R. D. and Cooper, J. M.: A glacial sequence stratigraphic model for temperate, glaciated continental shelves, in: Glacier-Influenced Sedimentation on High-Latitude Continental Margins, edited by: Dowdeswell, J. A. and Ó Cofaigh, C., Geological Society, London, Special Publications, 203, 215–244, https://doi.org/10.1144/GSL.SP.2002.203.01.12, 2002.
Prakash, R., Srinivasamoorthy, K., Gopinath, S., Saravanan, K., Vinnarasi, F., Ponnumani, G., Chidambaram, S., and Anandhan, P.: Radon isotope assessment of submarine groundwater discharge (SGD) in Coleroon River Estuary, Tamil Nadu, India, J. Radioanal. Nucl. Ch., 317, 25–36, https://doi.org/10.1007/s10967-018-5877-2, 2018.
Rantataro, J.: Pääkaupunkiseudun edustan vedenalaiset maa-ainesvarat, Helsingin seutukaavaliiton julkaisuja, C31, 1–84, 1992.
Räsänen, M. E., Auri, J. M., Huitti, J. V., Klap, A. K., and Virtasalo, J. J.: A shift from lithostratigraphic to allostratigraphic classification of Quaternary glacial deposits, GSA Today, 19, 4–11, https://doi.org/10.1130/GSATG20A.1, 2009.
Rinterknecht, V. R., Clark, P. U., Raisbeck, G. M., Yiou, F., Brook, E. J., Tschudi, S., and Lunkka, J. P.: Cosmogenic 10Be dating of the Salpausselkä I moraine in southwestern Finland, Quaternary Sci. Rev., 23, 2283–2289, https://doi.org/10.1016/j.quascirev.2004.06.012, 2004.
Rosentau, A., Joeleht, A., Plado, J., Aunap, R., Muru, M., and Eskola, K. O.: Development of the Holocene foredune plain in the Narva-Joesuu area, eastern Gulf of Finland, Geol. Q., 57, 89–100, https://doi.org/10.7306/gq.1077, 2013.
Saarnisto, M. and Saarinen, T.: Deglaciation chronology of the Scandinavian Ice Sheet from the Lake Onega Basin to the Salpausselkä end moraines, Global Planet. Change, 31, 387–405, https://doi.org/10.1016/S0921-8181(01)00131-X, 2001.
Sadat-Noori, M., Santos, I. R., Sanders, C. J., Sanders, L. M., and Maher, D. T.: Groundwater discharge into an estuary using spatially distributed radon time series and radium isotopes, J. Hydrol., 528, 703–719, https://doi.org/10.1016/j.jhydrol.2015.06.056, 2015.
Salonen, L.: Natural radionuclides in ground water in Finland, Radiat. Prot. Dosim., 24, 163–166, https://doi.org/10.1093/oxfordjournals.rpd.a080263, 1988.
Sauramo, M.: Studies on the Quaternary varve sediments in southern Finland, Bulletin de la Commission géologique de Finlande, 60, 1–164, 1923.
Schlüter, M., Sauter, E. J., Andersen, C. E., Dahlgaard, H., and Dando, P. R.: Spatial distribution and budget for submarine groundwater discharge in Eckernförde Bay (western Baltic Sea), Limnol. Oceanogr., 49, 157–167, https://doi.org/10.4319/lo.2004.49.1.0157, 2004.
Schmidt, A., Schlueter, M., Melles, M., and Schubert, M.: Continuous and discrete on-site detection of radon-222 in ground- and surface waters by means of an extraction module, Appl. Radiat. Isotopes, 66, 1939–1944, https://doi.org/10.1016/j.apradiso.2008.05.005, 2008.
Schubert, M., Paschke, A., Lieberman, E., and Burnett, W. C.: Air-water partitioning of 222Rn and its dependence on water temperature and salinity, Environ. Sci. Technol., 46, 3905–3911, https://doi.org/10.1021/es204680n, 2012.
Schubert, M., Scholten, J., Schmidt, A., Comanducci, J. F., Pham, M. K., Mallast, U., and Knoeller, K.: Submarine groundwater discharge at a single spot location: evaluation of different detection approaches, Water, 6, 584–601, https://doi.org/10.3390/w6030584, 2014.
Sheriff, R. E. and Geldart, L. P.: Exploration seismology, Cambridge University Press, Cambridge, UK, 592 pp., 1995.
Söderberg, P. and Flodén, T.: Stratabound submarine terraces and pockmarks – indicators of spring sapping in glacial clay, Stockholm Archipelago, Sweden, Sveriges Geologiska Undersökning, Ser. Ca 86, 173–178, 1997.
Sutinen, R.: Glacial deposits, their electrical properties and surveying by image interpretation and ground penetrating radar, Geological Survey of Finland, Bulletin, 359, 1–123, 1992.
Sviridov, N. I.: Results of sound velocity measurements in the Baltic Sea bottom sediments, Baltica, 6, 173–180, 1977.
Szymczycha, B., Vogler, S., and Pempkowiak, J.: Nutrient fluxes via submarine groundwater discharge to the Bay of Puck, southern Baltic Sea, Sci. Total Environ., 438, 86–93, https://doi.org/10.1016/j.scitotenv.2012.08.058, 2012.
Szymczycha, B., Kroeger, K. D., and Pempkowiak, J.: Significance of groundwater discharge along the coast of Poland as a source of dissolved metals to the southern Baltic Sea, Mar. Pollut. Bull., 109, 151–162, https://doi.org/10.1016/j.marpolbul.2016.06.008, 2016.
Tamura, T., Murakami, F., Nanayama, F., Watanabe, K., and Saito, Y.: Ground-penetrating radar profiles of Holocene raised-beach deposits in the Kujukuri strand plain, Pacific coast of eastern Japan, Mar. Geol., 248, 11–27, https://doi.org/10.1016/j.margeo.2007.10.002, 2008.
Tait, D. R., Santos, I. R., Erler, D. V., Befus, K. M., Cardenas, M. B., and Eyre, B. D.: Estimating submarine groundwater discharge in a South Pacific coral reef lagoon using different radioisotope and geophysical approaches, Mar. Chem., 156, 49–60, https://doi.org/10.1016/j.marchem.2013.03.004, 2013.
Tsyrulnikov, A., Tuuling, I., Kalm, V., Hang, T., and Flodén, T.: Late Weichselian and Holocene seismostratigraphy and depositional history of the Gulf of Riga, NE Baltic Sea, Boreas, 41, 673–689, https://doi.org/10.1111/j.1502-3885.2012.00257.x, 2012.
Vallius, H.: Sediment and carbon accumulation rates off the southern coast of Finland, Baltica, 28, 81–88, https://doi.org/10.5200/baltica.2015.28.08, 2015.
Virkkala, K.: On ice-marginal features in southwestern Finland, Bulletin de la Commission géologique de Finlande, 210, 1–76, 1963.
Virtasalo, J. J., Kotilainen, A. T., Räsänen, M. E., and Ojala, A. E. K.: Late-glacial and post-glacial deposition in a large, low relief, epicontinental basin: the northern Baltic Sea, Sedimentology, 54, 1323–1344, https://doi.org/10.1111/j.1365-3091.2007.00883.x, 2007.
Virtasalo, J. J., Hämäläinen, J., and Kotilainen, A. T.: Toward a standard stratigraphical classification practice for the Baltic Sea sediments: the CUAL approach, Boreas, 43, 924–938, https://doi.org/10.1111/bor.12076, 2014.
Virtasalo, J. J., Endler, M., Moros, M., Jokinen, S. A., Hämäläinen, J., and Kotilainen, A. T.: Base of brackish-water mud as key regional stratigraphic marker of mid-Holocene marine flooding of the Baltic Sea Basin, Geo-Mar. Lett., 36, 445–456, https://doi.org/10.1007/s00367-016-0464-4, 2016.
Virtasalo, J. J., Schröder, J. F., Luoma, S., Majaniemi, J., Mursu, J., and Scholten, J. C.: Hydrographic data, surface seawater radon-222 concentration, and loss on ignition and caesium-137 values of sediment samples from the Hanko submarine groundwater discharge site, northern Baltic Sea, Finland, PANGAEA, https://doi.org/10.1594/PANGAEA.898674, 2019.
Winsemann, J., Hornung, J. J., Meinsen, J., Asprion, U., Polom, U., Brandes, C., Bußmann, M., and Weber, C.: Anatomy of a subaqueous ice-contact fan and delta complex, Middle Pleistocene, north-west Germany, Sedimentology, 56, 1041–1076, https://doi.org/10.1111/j.1365-3091.2008.01018.x, 2009.
Whiticar, M. J. and Werner, F.: Pockmarks: submarine vents of natural gas or freshwater seeps, Geo-Mar. Lett., 1, 193–199, https://doi.org/10.1007/BF02462433, 1981.
Wong, P. P., Losada, I. J., Gattuso, J.-P., Hinkel, J., Khattabi, A., McInnes, K. L., Saito, Y., and Sallenger, A.: Coastal systems and low-lying areas, in: Climate Change 2014: Impacts, Adaptation, and Vulnerability, Part A: Global and Sectoral Aspects, Contribution of Working Group II to the Fifth Assessment Report of the Intergovernmental Panel on Climate Change, edited by: Field, C. B., Barros, V. R., Dokken, D. J., Mach, K. J., Mastrandrea, M. D., Bilir, T. E., Chatterjee, M., Ebi, K. L., Estrada, Y. O., Genova, R. C., Girma, B., Kissel, E. S., Levy, A. N., MacCracken, S., Mastrandrea, P. R., and White, L. L., Cambridge University Press, Cambridge, UK, 361–409, 2014.