the Creative Commons Attribution 4.0 License.
the Creative Commons Attribution 4.0 License.
 | 23 May 2019
Moment magnitude estimates for central Anatolian earthquakes using coda waves
A proper estimate of moment magnitude, which is a physical measure of the energy released at an earthquake source, is essential for better seismic hazard assessments in tectonically active regions. Here a coda wave modeling approach that enables the source displacement spectrum modeling of the examined event was used to estimate moment magnitudes of central Anatolia earthquakes. To achieve this aim, three-component waveforms of local earthquakes with magnitudes recorded at 69 seismic stations, which were operated between 2013 and 2015 within the framework of the Continental Dynamics–Central Anatolian Tectonics (CD–CAT) passive seismic experiment, were utilized. An inversion on the coda wave traces of each selected single event in the database was performed in five different frequency bands between 0.75 and 12 Hz. The resultant moment magnitudes (Mw coda) exhibit a good agreement with routinely reported local magnitude (ML) estimates for the study area. Apparent move-out that is particularly significant around the scattered variation of ML–Mw coda data points for small earthquakes (ML < 3.5) can be explained by possible biases of wrong assumptions to account for anelastic attenuation and seismic recordings with a finite sampling interval. Finally, I present an empirical relation between Mw coda and ML for central Anatolian earthquakes.
Please read the corrigendum first before continuing.
-
Notice on corrigendum
The requested paper has a corresponding corrigendum published. Please read the corrigendum first before downloading the article.
-
Article
(6901 KB)
-
The requested paper has a corresponding corrigendum published. Please read the corrigendum first before downloading the article.
- Article
(6901 KB) - Full-text XML
- Corrigendum
- BibTeX
- EndNote


Robust and stable knowledge of source properties (e.g., moment magnitude estimates) is crucial in seismically active countries such as Turkey for a better evaluation of seismic hazard potential as this highly depends on the establishment of reliable seismicity catalogs. Moreover, accurate information on source parameters could be important when developing regional attenuation properties.
Conventional types of magnitude scales (ML, mb, MS), such as the empirically derived results of using direct wave analyses, can be biased due to various effects such as source radiation pattern, directivity, and heterogeneities along the path since they may cause drastic changes in direct wave amplitude measurements (e.g., Favreau and Archuleta, 2003). Several early studies depending on the analysis of local and/or regional coda envelopes have indicated that coda wave amplitudes are significantly less variable by a factor of 3 to 5 compared to direct wave amplitudes (e.g., Mayeda and Walter, 1996; Mayeda et al., 2003; Eken et al., 2004; Malagnini et al., 2004; Gök et al., 2016). In fact, local or regional coda waves are usually considered to be generally composed of scattered waves. These wave trains can be simply explained by the single-scattering model of Aki (1969), which has been proven to be virtually insensitive to any source radiation pattern effect in contrast to direct waves due to the volume-averaging property of the coda waves sampling the entire focal sphere (e.g., Aki and Chouet, 1975; Rautian and Khalturin, 1978). In Sato and Fehler (1998) and Sato et al. (2012) an extensive review of the theoretical background of coda generation and advances in empirical observations and modeling efforts can be found.
There have been several approaches used for extracting information on earthquake source size via coda wave analyses. These approaches can be mainly divided into two groups. The first group of studies can be considered the parametric approach and essentially employs a coda normalization strategy in which measurements require a correction for empirically derived quality factors representing seismic attenuation parameters (e.g., intrinsic and scattering). In this case, the adjustment of final source properties is achieved with the help of some reference events whose seismic moments are previously estimated based on waveform inversion methods. For the forward generation of synthetic coda envelopes, either single-backscattering or more advanced multiple-backscattering approximations are used. An example for this group is an empirical method originally developed by Mayeda et al. (2003) to investigate seismic source parameters such as energy, moment, and apparent stress drop in the western United States and in the Middle East. They corrected observed coda envelopes for various influences, for instance path effect, S-to-coda transfer function, site effect, and any distance-dependent changes in coda envelope shape. Empirical coda envelope methods have been successfully applied to different regions with complicated tectonics such as northern Italy (e.g., Morasca et al., 2008), Turkey and the Middle East (e.g., Eken et al., 2004; Gök et al., 2016), and the Korean Peninsula (e.g., Yoo et al., 2011).
The second type of approach depends on estimating source and structural properties through a joint inversion technique. This technique employs a simultaneous optimization of source-, path-, and site-specific terms via a fitting procedure between a physically derived synthetic coda envelope and an observed coda envelope within a selected time window that includes both the observed coda and direct S-wave parts. Although the conventional coda normalization method essentially relies on a correction for undesired effects of the source and site amplifications, it may fail for small events with a shorter coda. This mainly stems from random seismic noise that dominates the coda, which does not satisfy the requirement of the homogeneous distribution of energy in space. In the present study, I avoid this shortcoming by involving source excitation and site amplification terms in the inversion process. To achieve this, radiative transfer theory (RTT) is employed for analytic expression of synthetic coda wave envelopes. The method was originally developed by Sens-Schönfelder and Wegler (2006) and successfully tested on local and regional earthquakes () detected by the German Regional Seismic Network. Further, it has been applied to investigate source- and frequency-dependent attenuation properties in different geological settings such as the upper Rhine Graben and Molasse basin regions in Germany, western Bohemia–Vogtland in Czechia (Eulenfeld and Wegler, 2016), the entire United States (Eulenfeld and Wegler, 2017), and the central and western North Anatolian Fault Zone (Gaebler et al., 2018; Izgi et al., 2018). A more realistic earth model with anisotropic scattering conditions was considered earlier by Gusev and Abubakirov (1996) and yielded peak broadening effects of direct seismic wave arrivals. This approach that examines the propagation of P-wave elastic energy and the effect of conversion between P- and S-wave energies was later used in Zeng et al. (1991), Przybilla and Korn (2008), and Gaebler et al. (2015).
In the current work I present source spectra as the output of a joint inversion of S-wave and coda wave parts extracted from 487 local earthquakes with magnitudes detected in central Anatolia. The approach used here employs an isotropic acoustic RTT approach for the forward calculation of synthetic coda envelopes. Gaebler et al. (2015) have observed that modeling results from isotropic scattering were almost comparable with those inferred from relatively more complex elastic RTT simulations with anisotropic scattering conditions. The use of a joint inversion technique is advantageous since it is insensitive to any potential bias, which could be introduced by external information, i.e., source properties of a reference that is obtained separately from other methods for calibration. This is mainly because of the fact that I utilize an analytical expression of a physical model involving source- and path-related parameters to describe the scattering process. Moreover, the type of optimization during joint inversion enables estimates for source parameters of relatively small-sized events compared to the one used in coda normalization methods.
The present tectonic setting of Anatolia and the surrounding regions is mainly the outcome of northward-converging movements among the African, Arabian, and Eurasian plates. To the west, the subducting African Plate with slab rollback dynamics beneath Anatolia along the Hellenic Trench has led to back-arc extension in the Aegean and western Anatolia, while compressional deformation to the east around the Bitlis–Zagros suture was explained by collisional tectonics (e.g., Taymaz et al., 1990; Bozkurt, 2001) (Fig. 1). Central Anatolia is located between an extensional regime to the west due to subduction and a compressional regime to the east due to collisional tectonics. There are several fault systems responsible for ongoing seismic activity in the region. The major fault zone, the Central Anatolian Fault Zone (CAFZ) (Fig. 2), which primarily represents a transtensional fault structure with a small amount of left-lateral offset during the Miocene (e.g., Koçyiğit and Beyhan, 1998), can be considered a boundary between the carbonate nappes of the Anatolide–Tauride block and the highly deformed and metamorphosed rocks in the Kırşehir block. To the northwest of the CAFZ, the Tuz Gölü Fault Zone (TGFZ) (Fig. 2), which is characterized by a right-lateral strike-slip motion with a significant oblique-slip normal component, appears to be collocated with the Tuz Gölü Basin sedimentary deposits as well as the crystalline rocks within the Kırşehir block (e.g., Çemen et al., 1999; Bozkurt, 2001; Taymaz et al., 2004; Çubuk et al., 2014). At the southwest tip of the study region, the EAFZ generates large seismic activity that can be identified by a rather complicated seismotectonic setting: predominantly left-lateral strike-slip motion that is well correlated with the regional deformation pattern and with existing local clusters of thrust and normal faulting events on NS- and EW-trending subsidiary faults, respectively (Bulut et al., 2012). Such complicated behavior explains kinematic models (e.g., Riedel shear, anti-Riedel shear models) of the shear deformation zone evolution (Tchalenko, 1970). It connects to the NAFZ at the Karlıova Triple Junction (Bozkurt, 2001) and to the south splits into various segments near the Adana Basin (Kaymakci et al., 2006) (Fig. 2). Toward the south, the EAFZ reaches the Dead Sea Fault Zone (DSFZ) that has a key role in accommodating northward relative motions of the Arabian and African plates with respect to Eurasia.
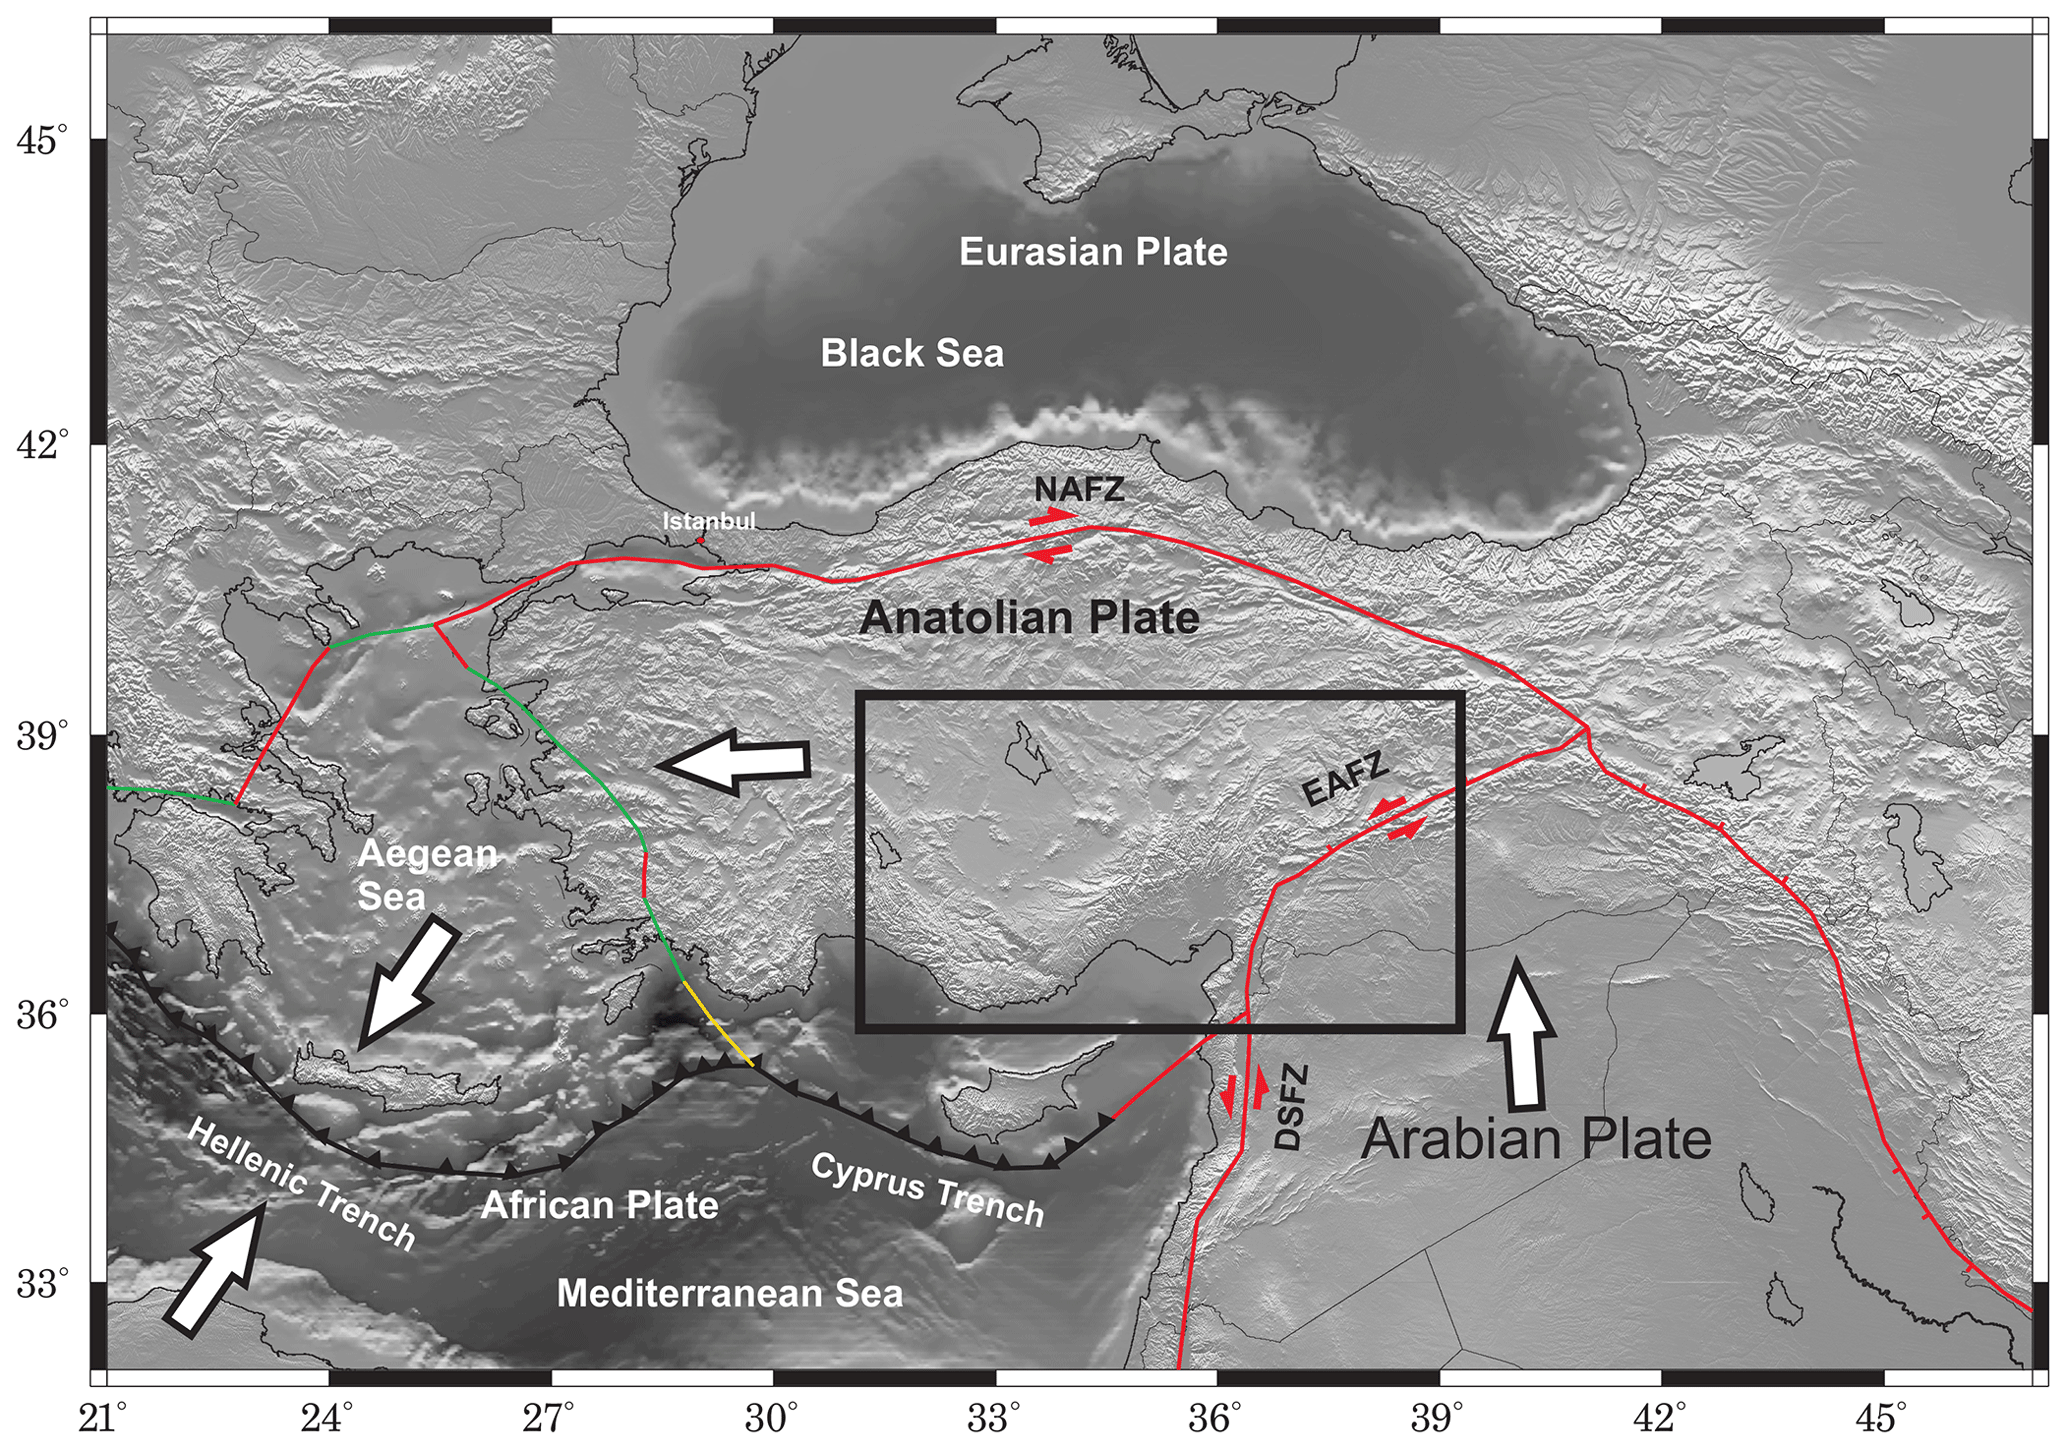
Figure 1Major tectonic features of Turkey and the adjacent areas. The plate boundary data used here are taken from Bird (2003). Subduction zones are black, continental transform faults are red, continental rift boundaries are green, and spreading ridge boundaries are yellow. NAFZ, EAFZ, and DSFZ are the North Anatolian Fault, East Anatolian Fault, and the Dead Sea Fault, respectively.

Figure 2Epicentral distribution of all local events selected from the study area in the KOERI catalog. Gray circles represent earthquakes with poor quality that are not considered for the current study, while black indicates the location of local events with good quality. Red circles among these events are 487 events used in coda wave inversion since they are successful at passing the quality criteria for a further preprocessing procedure.
The present work utilizes three-component waveforms of local seismic activity detected at 72 broadband seismic stations (Fig. 2) that were operated for 2 years between 2013 and 2015 within the framework of a temporary passive seismic experiment, Continental Dynamics–Central Anatolian Tectonics (CD–CAT) (Portner et al., 2018). I benefit from revisited standard earthquake catalog information that is routinely released by the Kandilli Observatory and Earthquake Research Institute (KOERI) (publicly available at http://www.koeri.boun.edu.tr, last access: 15 February 2019) to extract waveform data for a total of 2231 examined events with station–event pair distance less than 120 km and focal depths less than 10 km. Most of the detected seismic activity in the study area is associated with several fault zones in the region, i.e., the EAFZ, CAFZ, DSFZ, and TGFZ. Here I note that the use of only local earthquakes is to exclude possible biases, which may be introduced by Moho-boundary-guided Sn waves. Upper crustal earthquakes with less than 10 km focal depths are preferred in this study to exclude the effect of relatively large-scale heterogeneities on coda wave trains. Additionally, I performed a visual inspection over all waveforms to ensure high-quality waveforms. The final event number was reduced to 1193. Selected station and event distributions can be seen in Fig. 2.
Observed waveforms were prepared at five different frequency bands with central frequencies at 0.75, 1.5, 3.0, 6.0, and 12.0 Hz via a Butterworth band-pass filtering process. In the next step, I applied a Hilbert transform to filtered waveform data in order to obtain the total energy envelopes. An average crustal velocity model was used to predict P- and S-wave onsets on envelopes and then based on this information: (i) the noise level prior to the P-wave onset was eliminated; (ii) the S-wave window was determined starting at 3 s prior to and 7 s after S-wave onset, as this allowed for the inclusion of all direct S-wave energy; and (iii) starting at the end of the S-wave window, a coda window of 100 s at maximum was determined. The length of coda windows can be shorter when the signal-to-noise ratio (SNR) is less than 2.5 or when there are coda waves from two earthquakes (e.g., because of an aftershock sequence) within the same analysis window, which can cause another rise instead of a decline in the envelope. I omit earthquakes with less than 10 s of coda length from the database. Taking into account these criteria, coda waveforms extracted from 6541 source–receiver pairs were used for further data processing.
I adopted an inversion procedure that was originally developed by Sens-Schönfelder and Wegler (2006) and later modified by Eulenfeld and Wegler (2016). The forward part, which involves the calculation of energy density for a specific frequency band under the assumption of an isotropic source, is expressed in Sens-Schönfelder and Wegler (2006) as follows:
where W gives the source term and is frequency dependent. R(r) indicates the energy site amplification factor and b is the intrinsic attenuation parameter. represents Green's function, which includes the scattered wave field as well as the direct wave and its expression, and is given by Paasschens (1997) as follows:
Here the term within the Dirac delta function represents the direct wave and the other term indicates scattered waves. v0 describes the mean S-wave velocity, while g0 is the scattering coefficient.
Possible discrepancies between predicted (Eq. 1) and observed energy densities for each event at each station with Nij time samples (index k) in a specific frequency band can be minimized using
Here, the numbers of stations (index i) and events (index j) are shown by NS and NE, respectively. Optimization of g will be achieved by fulfilling the following equality:
or
Equation (5) simply defines an overdetermined inversion problem with equation systems and with variables, and thus b, Ri, and Wj can be solved via a least-squares technique. ϵ(g) can be defined as a sum over the squared residuals of the solution. As can be seen from Eq. (1), there is an obvious trade-off between Ri and Wj, which I can manage by fixing the geometrical mean of Ri to 1 (ΠRi=1). Equation (1) also implies a rather moderate trade-off between Wj and b. The trade-off between g and other inverted parameters is usually small since this parameter is fixed through the energy ratio of the direct S wave and the level of the coda waves (Gaebler et al., 2018).
Eulenfeld and Wegler (2016) present a simple procedure to perform the inversion.
- i.
Calculate Green's functions through the analytic approximation of the solution for 3-D isotropic radiative transfer (e.g., Paasschens, 1997; Sens-Schönfelder and Wegler, 2006) by using fixed scattering parameters, and minimize Eq. (5) to solve for b, Ri, and Wj via a weighted least-squares approach.
- ii.
Calculate ϵ(g) using Eq. (3).
- iii.
Repeat (i) and (ii) by selecting different g to find the optimal parameters g, b, Ri, and Wj that finally minimize the error function ϵ.
In Fig. 3 an example for the minimization process that was applied at five different frequency bands is displayed for one selected event at recorded stations of the CD–CAT project.
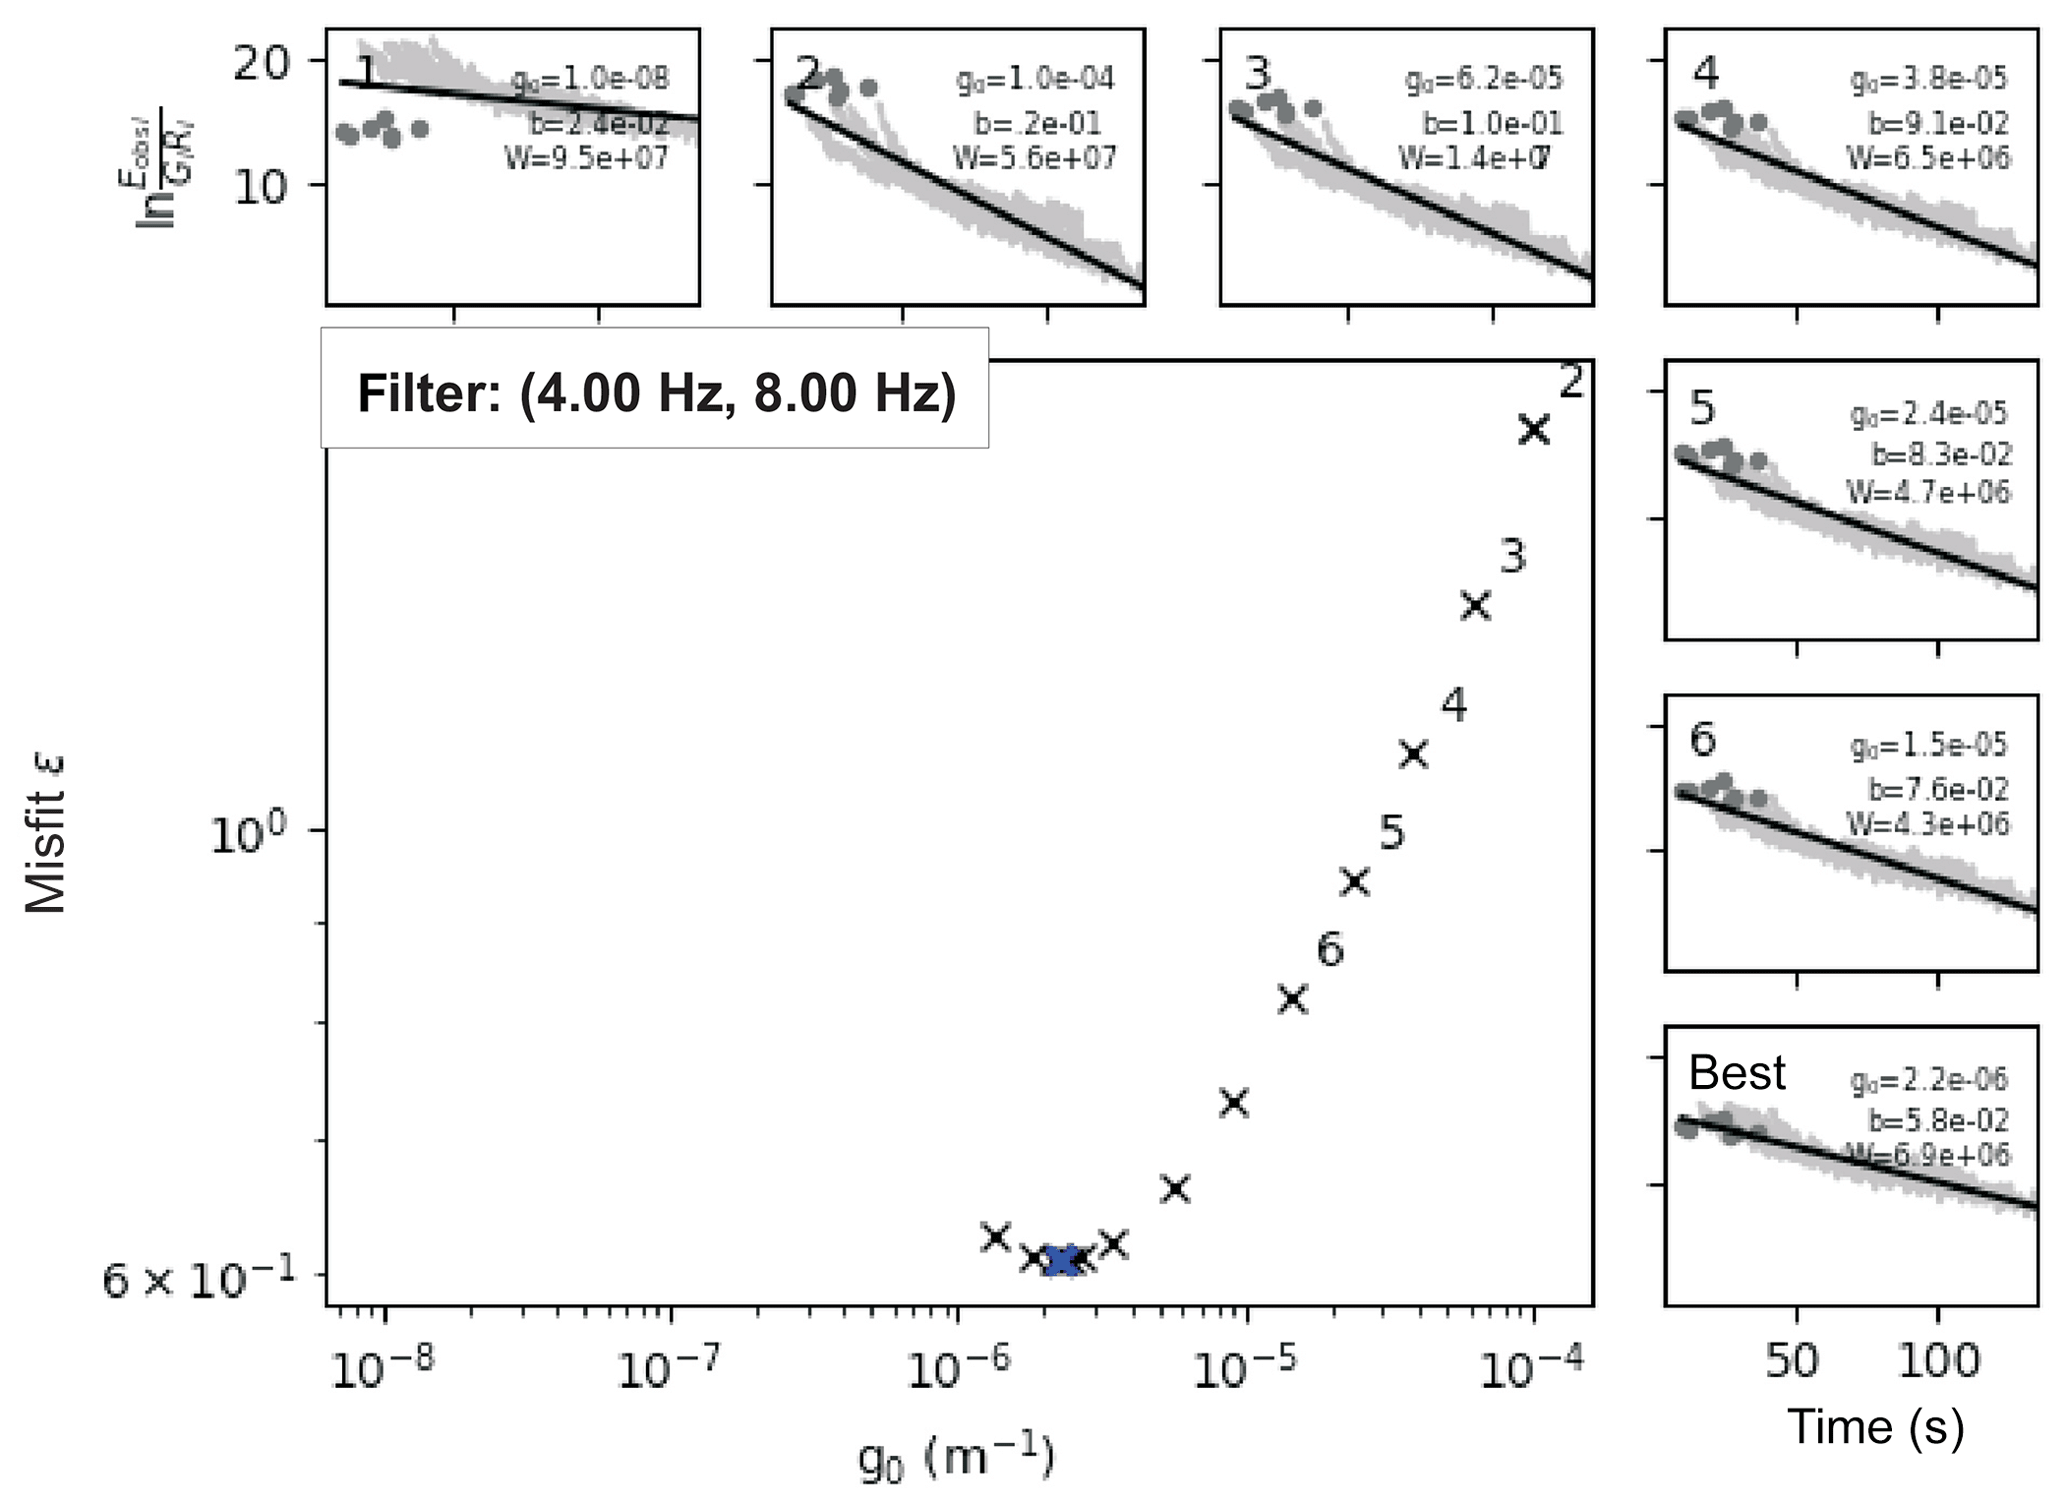
Figure 3An example from the inversion procedure explained in Sect. 4. Here coda envelope fitting optimization is performed on band-pass-filtered (4–8 Hz) digital recordings of an earthquake (9 April 2014, Mw coda 3.2) extracted for seven seismic stations that operated within the CD–CAT array. The large panel displays the error function ε as a function of g0. The thick blue cross represents the optimal value of g=g0. The small panels show the least-squares solution of the weighted linear equation system for the first six guesses and the optimal guess for g0. The dots and gray curves indicate the ratio between energy (Eobs) and the Green's function (G) obtained for direct S waves and observed envelopes at various stations, respectively (please note that during this optimization process envelopes are corrected for the obtained site corrections Ri). The slope of the linear curve in each small panel yields −b in relation to the intrinsic attenuation. The linear curve has an intercept of W, representing source-related terms in the right-hand side of Eq. (5).
The minimization described above for different frequencies will yield an unknown spectral source energy term, Wj, as well as a site response, Ri, and attenuation parameters, b and g, that will satisfy optimal fitting between observed and predicted coda wave envelopes. An example for this fitting can be seen in Fig. 4. The present study deals with the frequency dependency of Wj since this information can later be useful to obtain the source displacement spectrum and thus seismic moment and moment magnitudes of analyzed earthquakes using the formula of the S-wave source displacement spectrum for a double-coupled source in the far field, which is given by Sato et al. (2012):
where W indicates the radiated S-wave energy at a center frequency f, while v0 and ρ0 represent the mean S-wave speed and medium density, respectively.
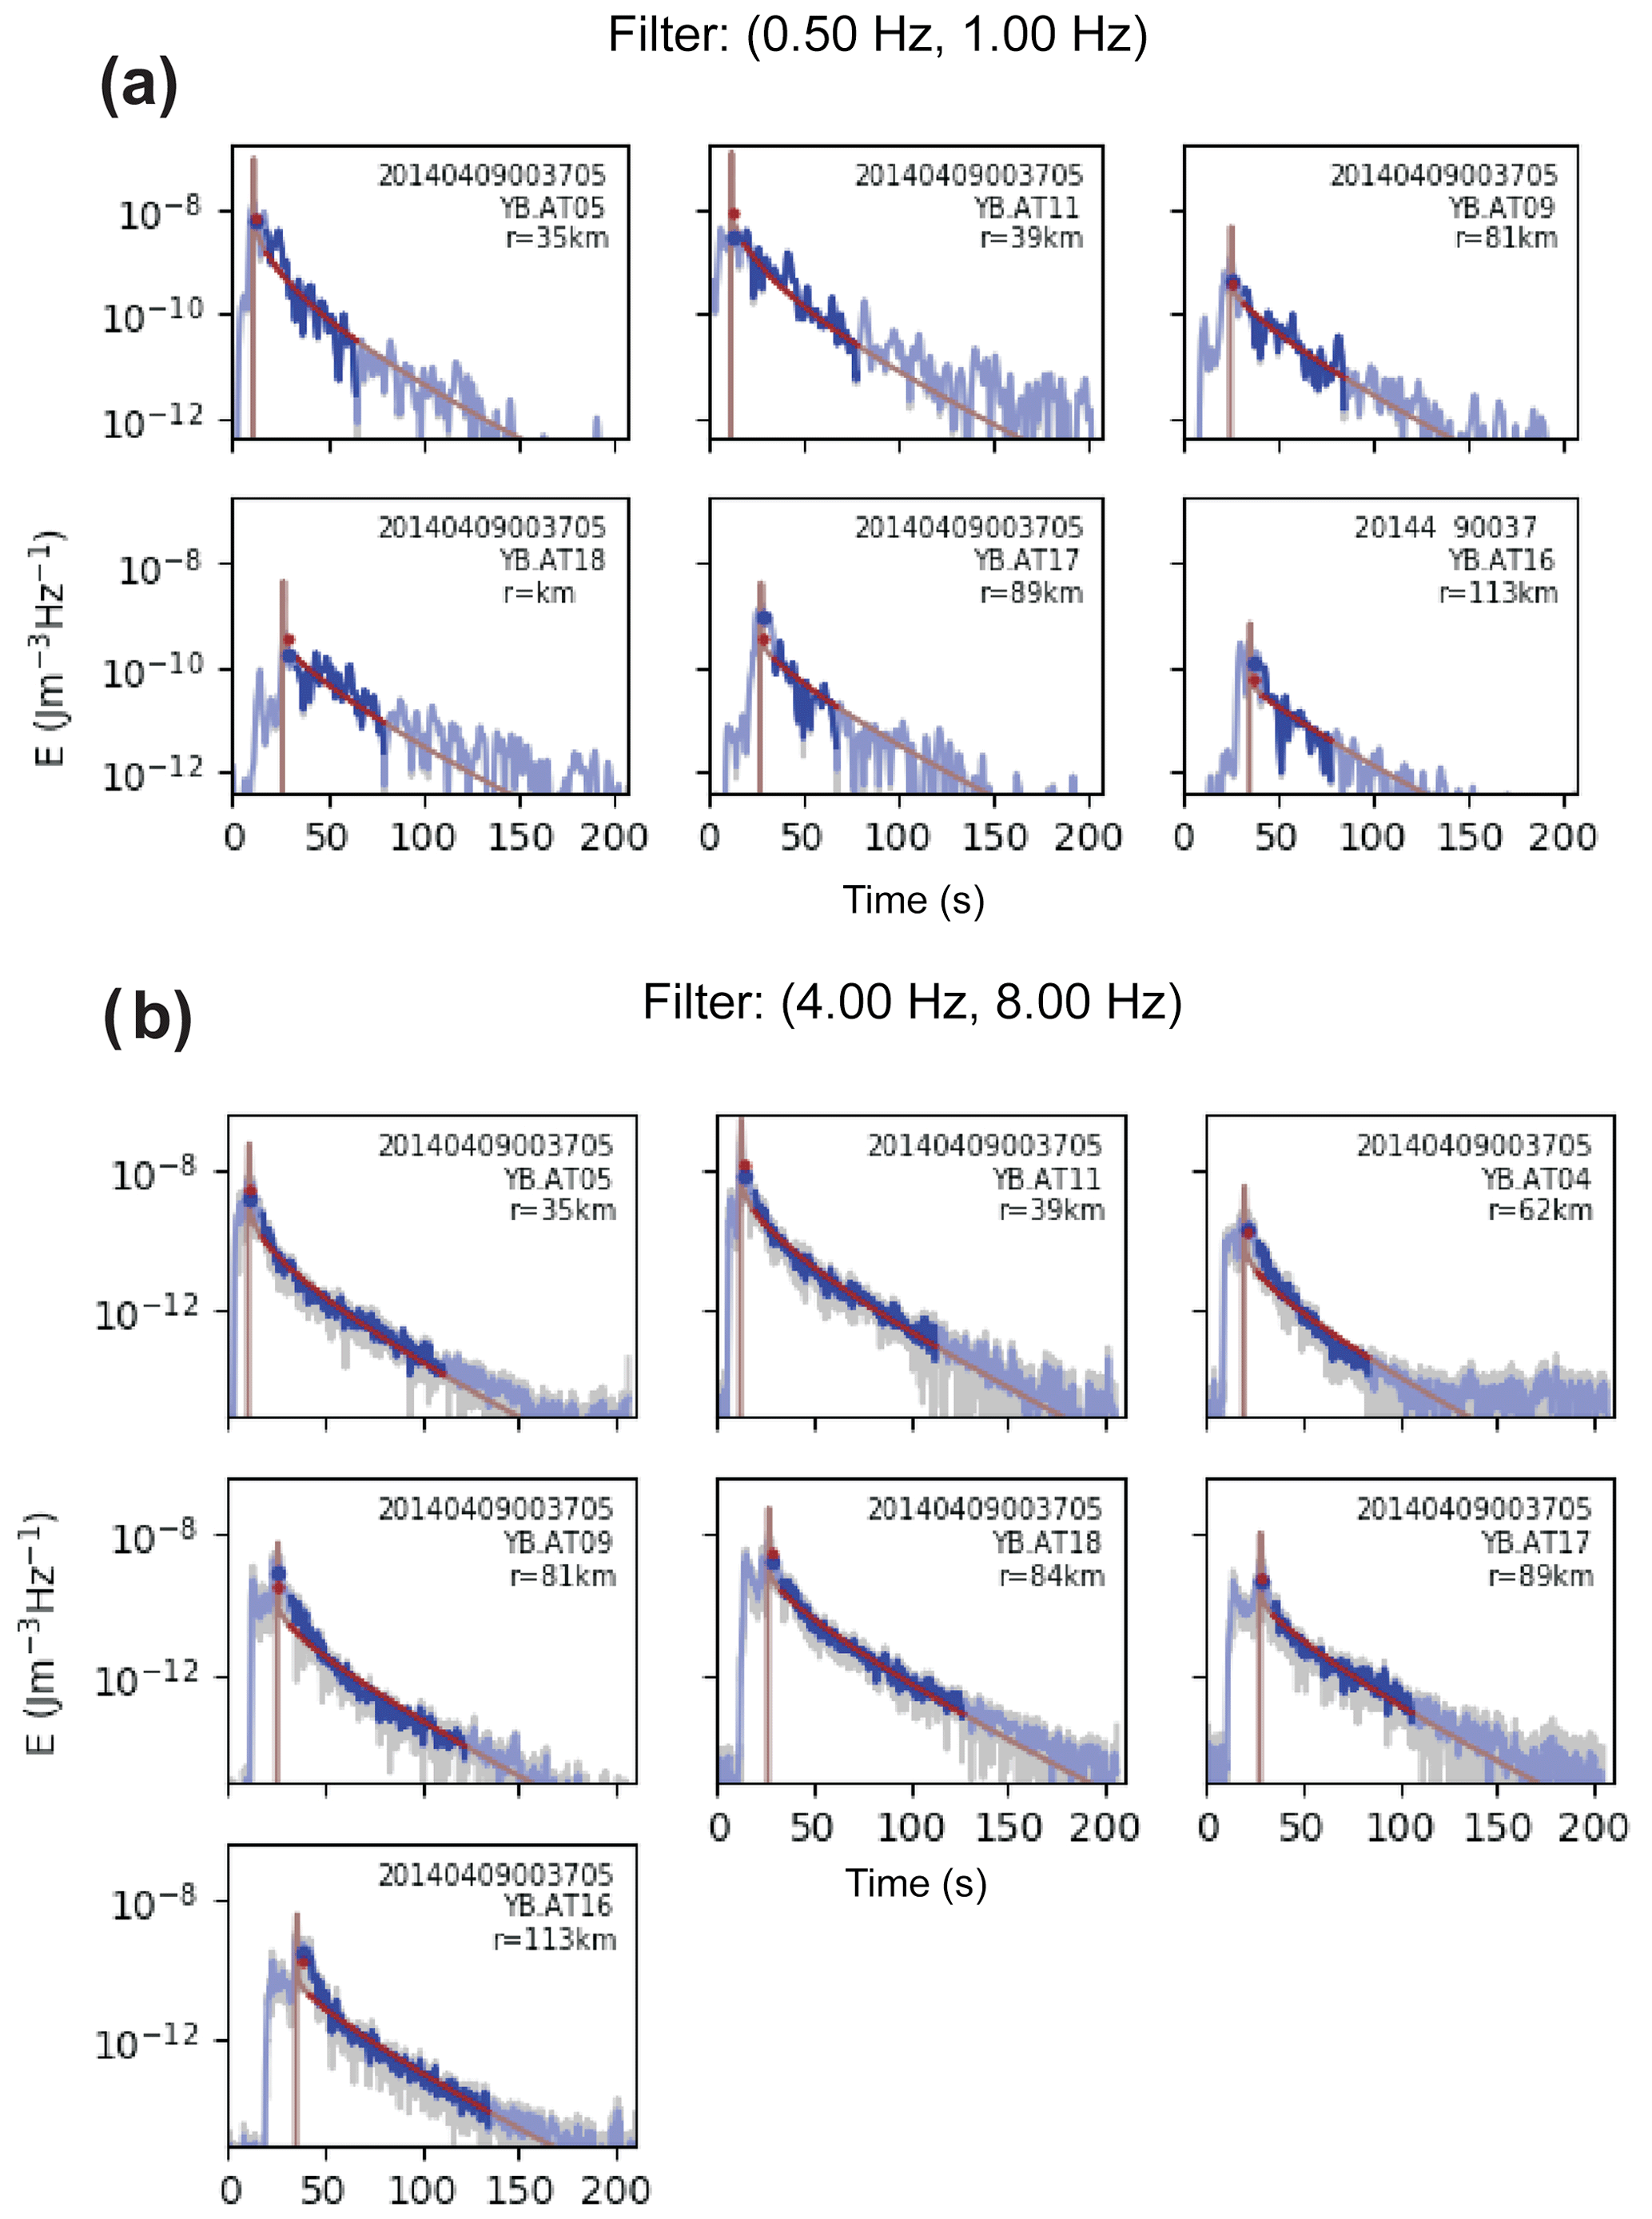
Figure 4(a) Results of the inversion for the 9 April 2014 Mwcoda 3.2 earthquake: sample fits between observed and calculated energy densities in the frequency band 0.5–1.0 Hz are given for six different stations (see the upper right corner for event ID, station name, and distance to hypocenter). Note that light blue curves represent the observed envelope. Smoothed observed and calculated envelopes in each panel are presented by blue and red curves, respectively. Blue and red dots show the location of the average value for observed and calculated envelopes within the S-wave window, respectively. (b) The same as in (a) obtained in the frequency band 4.0–8.0 Hz.
The relation between the obtained source displacement spectrum and seismic moment value was described earlier in Abercrombie (1995) by
where n is related to the high-frequency falloff and γ is known as a shape parameter that controls the sharpness of the spectrum at corner frequencies between the constant level M0 (low-frequency part) and the falloff with f−n (high-frequency part). Taking the logarithm of Eq. (7) gives
Equation (8) describes an optimization problem in which the observed source displacement spectrum data (left-hand side) can be inverted for four unknown source parameters, M0, γ, n, and fc (right-hand side), in a simultaneous least-squares inversion scheme. Finally, moment magnitude, Mw, can be calculated from the modeled source parameters and seismic moment, M0, using a formula given by Hanks and Kanamori (1979):
5.1 Coda wave source spectra
Figure 5 displays observed values of source spectra established by inserting the inverted spectral source energy term W at each frequency in Eq. (6) for all analyzed events. Each curve in this figure represents the model spectrum estimate based on the inversion procedure described in the previous section. Modeled spectrum characteristics computed for 487 local earthquakes whose geographical distribution is presented in Fig. 2 suggest, in general, that I was able to obtain a typically expected source displacement spectrum with a flat region around the low-frequency limit and a decaying behavior above a corner frequency.
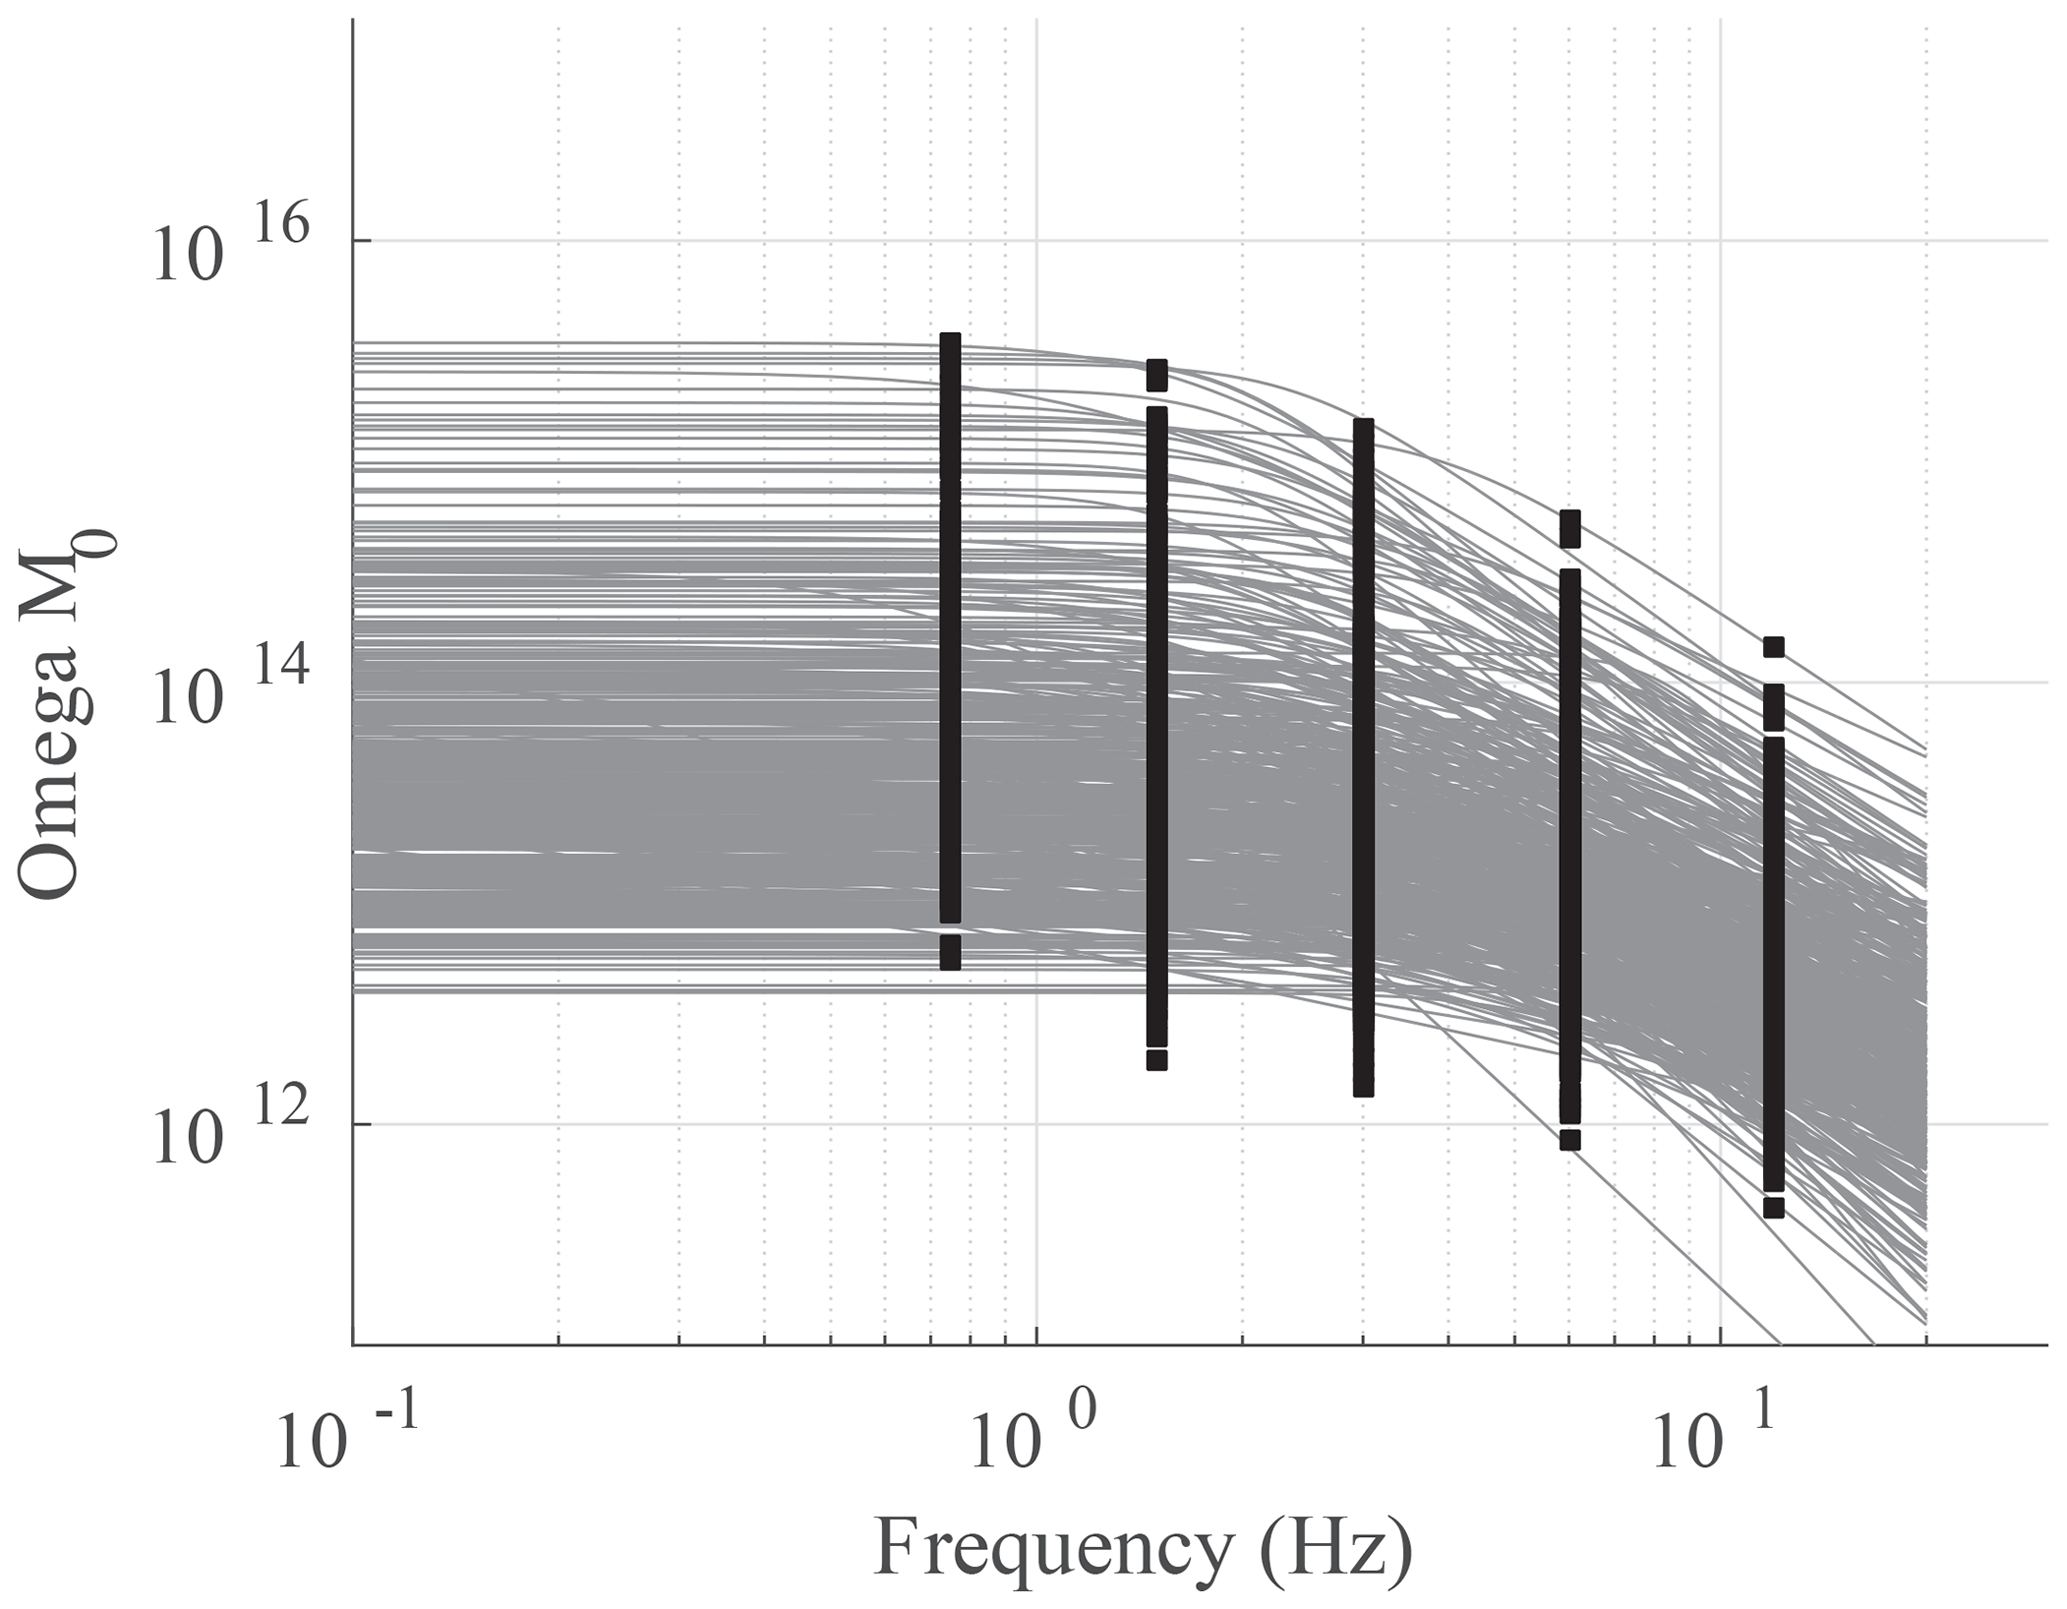
Figure 5All individual observed (black squares) and predicted (gray curve) source displacement spectra observed at 72 stations from 487 local earthquakes in central Anatolia.
Owing to the multiple-scattering process within small-scale heterogeneities that make coda waves gain an averaging nature, the variation in coda amplitudes due to differences in the source radiation pattern and path effect is reduced (Walter et al., 1995; Mayeda et al., 2003). Eulenfeld and Wegler (2016) found that the radiation pattern has only a minor influence on the S-wave coda, while it might disturb attenuation models inferred from direct S-wave analyses unless the station distribution relative to the earthquakes indicates good azimuthal coverage.
Conventional approaches (e.g., Abercrombie, 1995; Kwiatek et al., 2011) to estimate source parameters, such as corner frequency, seismic moment, and high-frequency falloff through fitting of observed displacement spectra observed at a given station in an inversion scheme, could be misleading since these methods usually (i) assume a constant value of attenuation effect (no frequency variation) defined by a factor exponent () over the spectrum (ii) and assume an omega-square model with a constant high-frequency falloff parameter, n=2. Following Sens-Schönfelder and Wegler (2006) and Eulenfeld and Wegler (2016), however, I estimate attenuation parameters (intrinsic and scattering) separately within a simultaneous inversion procedure in which the high-frequency falloff parameter varies. This is fairly consistent with early studies (e.g., Ambeh and Fairhead, 1991; Eulenfeld and Wegler, 2016) wherein significant deviations from the omega-square model (n>3) were reported, implying that the omega-square model as a source model for small earthquakes must be reconsidered in its general acceptance. It has been previously observed that the source spectra, especially for large earthquakes, could be better explained by models of two corner frequencies (e.g., Papageorgiou and Aki, 1983; Joyner, 1984; Atkinson, 1990). Recently, Denolle et al. (2016) observed that a conventional spectral model of a single-corner frequency and high-frequency falloff rate could not explain P-wave source spectra of thrust earthquakes with magnitudes Mw 5.5 and above. Instead, they suggested the double-corner frequency model for large global thrust earthquakes with a lower-corner frequency related to source duration and with an upper-corner frequency suggesting a shorter timescale unrelated to source duration, which exhibits its own scaling relation. Uchide and Imanishi (2016) reported that similar differences from the omega-square model would also be valid for smaller earthquakes by using a spectral ratio technique that involves empirical Green's function (EGF) events to avoid having complete knowledge of path and site effects for shallow target earthquakes (Mw 3.2–4.0) in Japan. The source spectra for many of the target events in their study suggested a remarkable discrepancy from the omega-square model for relatively small earthquakes. They explained such differences by incoherent rupture due to heterogeneities in fault properties and applied stress, the double-corner frequency model, and the possibility of a high-frequency falloff exponent value slightly higher than 2. In my case, the smallest event was with Mw coda larger than 2.0; thus, I had no chance to make a similar comparison to that of Eulenfeld and Wegler (2016). However, high-frequency falloff parameters varied from n=0.5 to n=4. A notable observation in the distribution of n was n=2 or n=2.5, which would be better explained for earthquakes with Mw coda > 4.0, whereas the smaller magnitudes exhibited a more scattered pattern of variation in n (Fig. 7). Eulenfeld and Wegler (2016) claimed that the use of separate estimates of attenuation or correction for the path effect via an empirically determined Green's function would be a better strategy to invert station displacement spectra for source parameters. This is mainly because for smaller earthquakes (with n>2), in particular, assuming an omega-square model can distort the estimates of corner frequency and even seismic moment, especially in regions where Q is strongly frequency dependent. Thus, independent estimates of Q during station displacement spectra inversions for source parameters must be taken into account or the influence of paths such as attenuation must be removed via empirically determined Green's functions (Eulenfeld and Wegler, 2016).
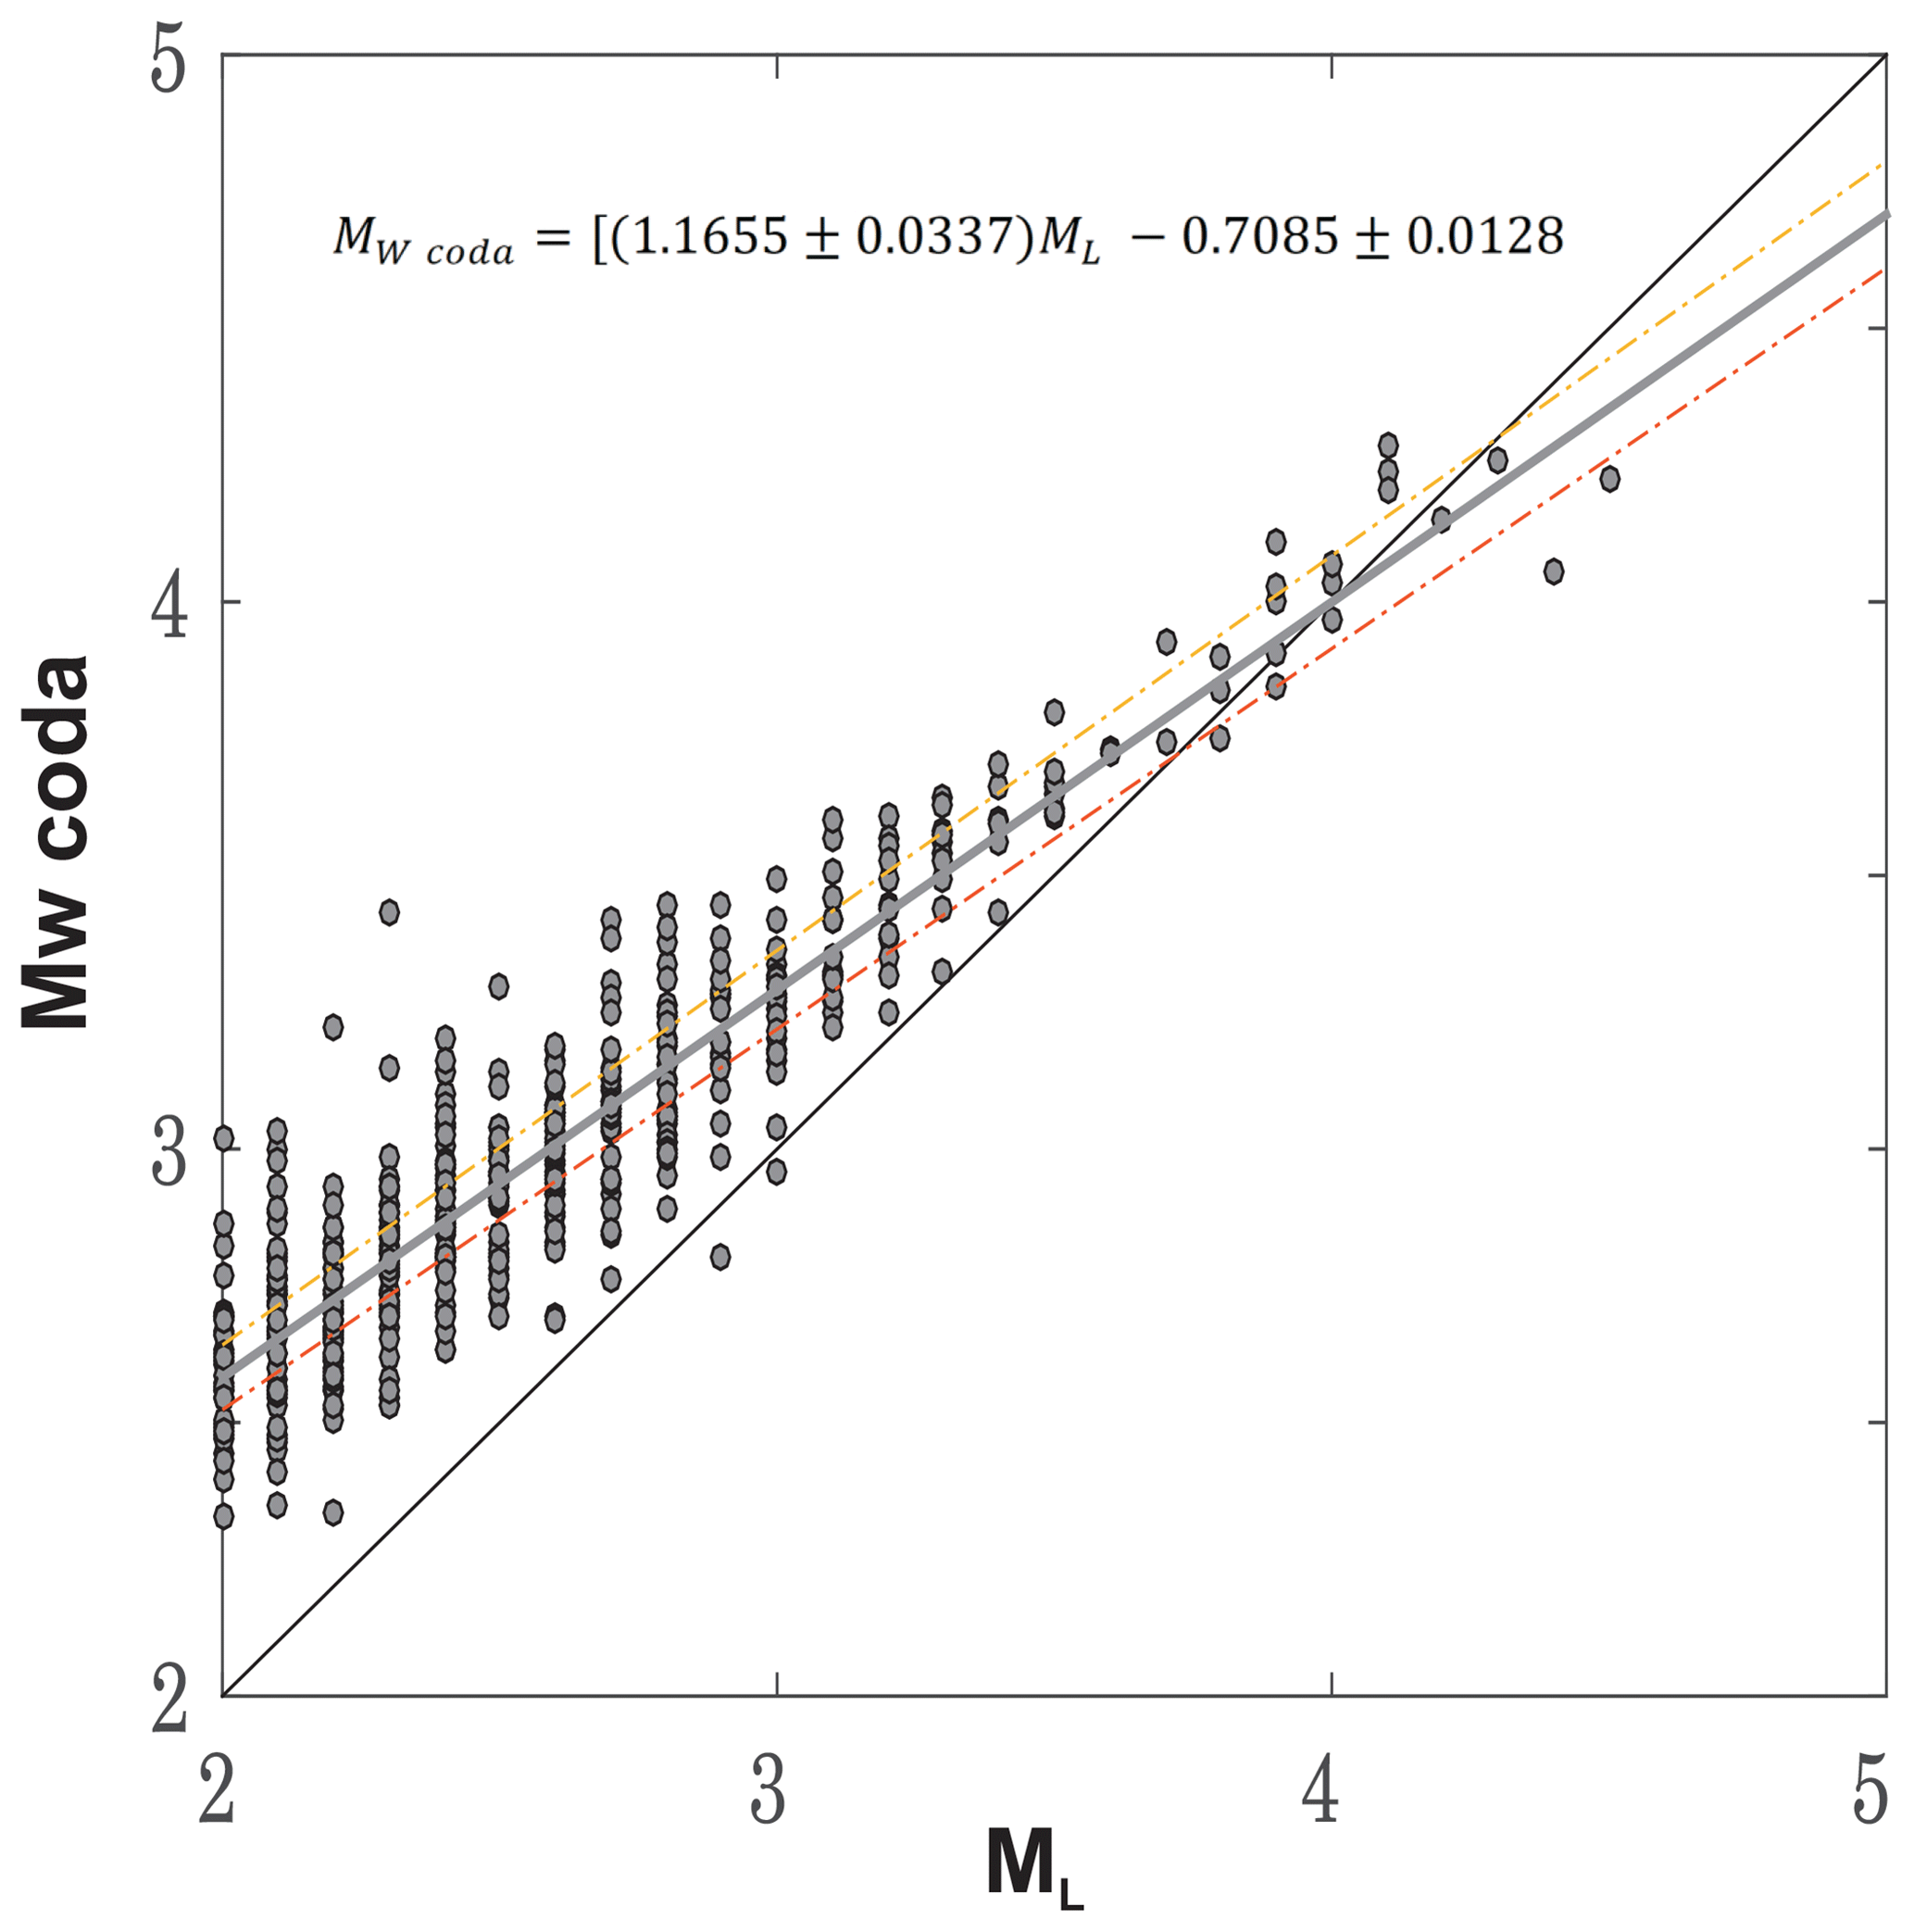
Figure 6Scatter plot between local magnitudes (ML) of analyzed events with coda-wave-derived magnitudes (Mw coda) of the same events. The outcome of a linear regression analysis yielded an empirical formula (e.g., Eq. 10) to identify the overall agreement represented by the gray straight line. Yellow and red dashed lines indicate the upper and lower limit of linearly fitting to that scatter.
5.2 Coda-wave-derived magnitude vs. ML catalog magnitude
A scatter plot between catalog magnitudes based on local magnitudes (ML) and my coda-derived magnitudes (Mw coda), which are inferred from the resultant frequency-dependent source displacement spectra and thus seismic moment (e.g., Eq. 9), is shown in Fig. 6. Such a comparison suggests an overall coherency between both types of magnitudes. This implies that a very simple model of a first-order approximation for S-wave scattering with an isotropic acoustic radiative transfer approach can be efficient to link the amplitude and decaying character of coda wave envelopes to the seismic moment of the source.
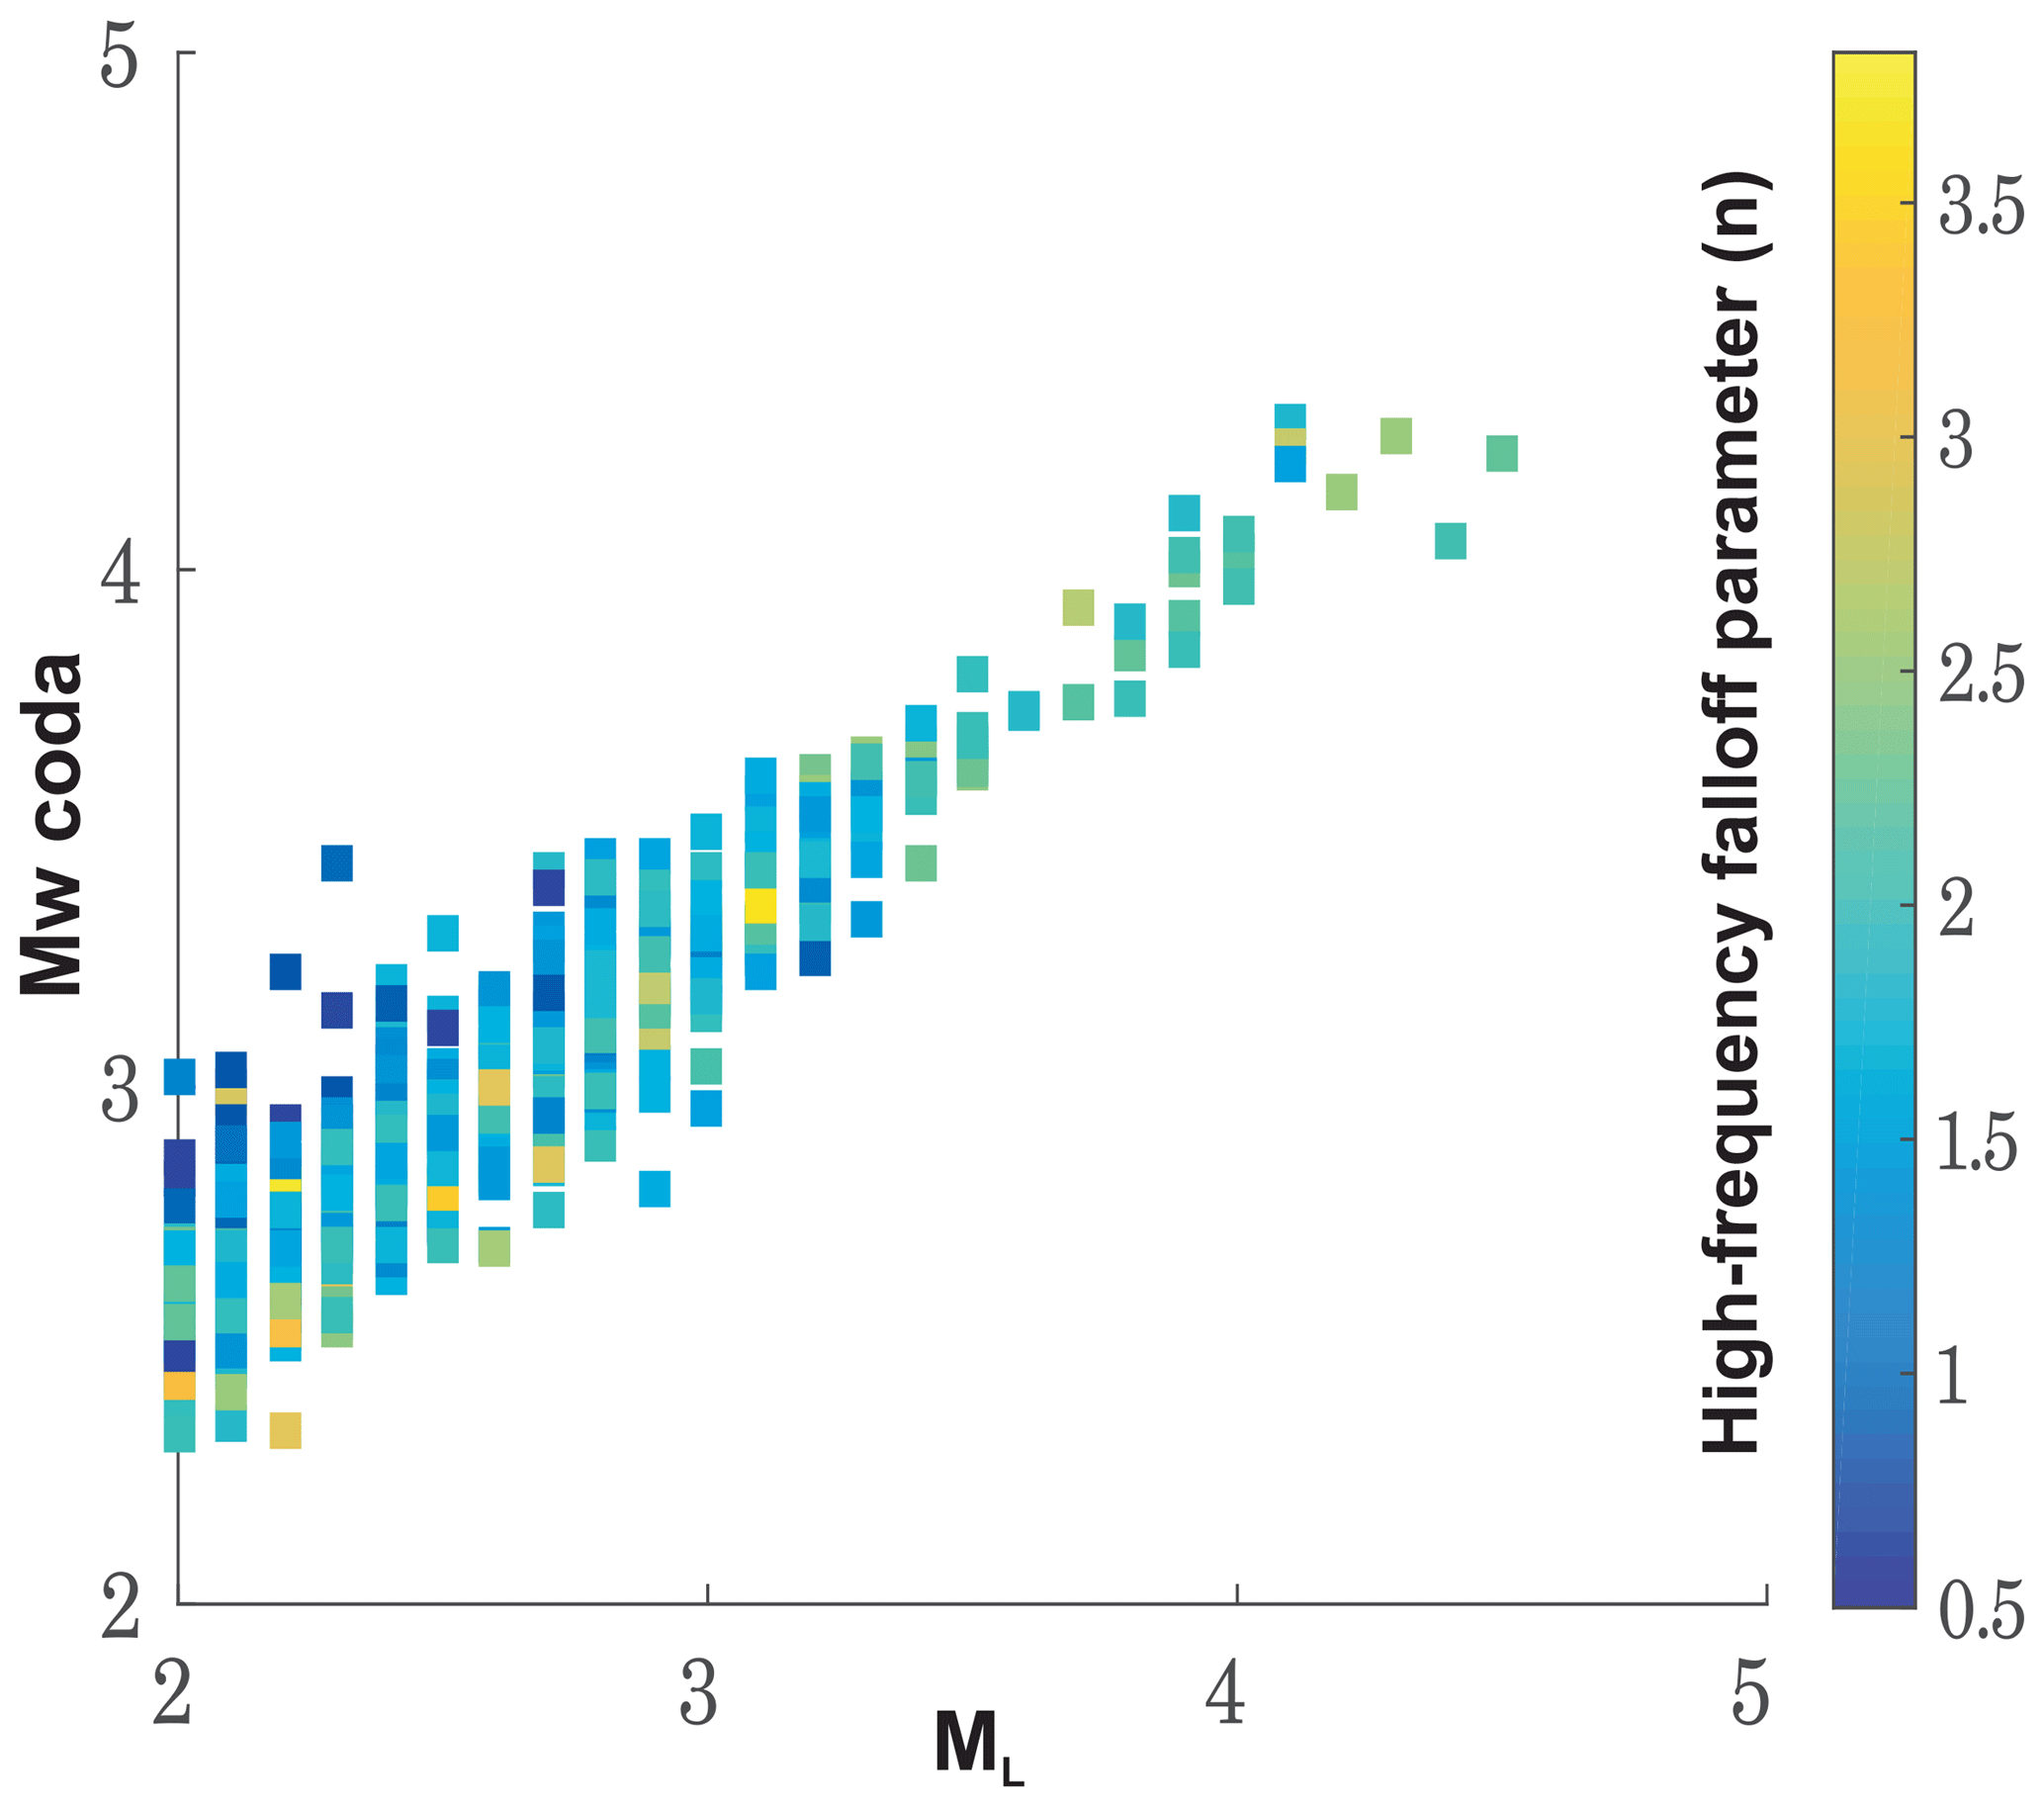
Figure 7Same scatter plot displayed in Fig. 6. Here the color code indicates the estimated high-frequency falloff parameter for each inverted event.
In the present study, a linear regression analysis performed between Mw coda and ML magnitudes (Fig. 5) resulted in an empirical formula that can be employed to convert local magnitudes into a coda-derived moment magnitude calculation of local earthquakes in this region:
Bakun and Lindh (1977) empirically described the linear log seismic moment–local magnitude relation between seismic moments (Mo) and local magnitudes (ML) for earthquakes near Oroville, California. Several other studies have also investigated an optimum relation between Mw and ML by implementing linear and/or nonlinear curve-fitting approaches. Malagnini and Munafò (2018) proposed that two different linear fits separated by a crossover ML=4.31 could represent ML–Mw data points obtained from earthquakes in the central and northern Apennines, Italy. Several coefficient-of-regression analyses in their fits account for the combined effects of source scaling and crustal attenuation as well as regional attenuation, focal depth, and rigidity at the source. Goertz-Allmann et al. (2011), for instance, introduced a hybrid type of scaling relation that is linear below ML 2 and above ML 4 with a quadratic relation in between () for earthquakes in Switzerland detected between 1998 and 2009. Edwards and Rietbrock (2009) employed a second-order polynomial equation to relate local values routinely reported in Japan Meteorological Agency (JMA) magnitudes and moment magnitudes. More recently, using multiple spectral ratio analyses, Uchide and Imanishi (2018) estimated relative moment magnitudes for the Fukushima Hamadori and northern Ibaraki prefecture areas of Japan and reported a quadratic form of correlation between JMA magnitudes and moment magnitudes. The resultant empirical curve in Uchide and Imanishi (2018) implied a considerable discrepancy between the moment magnitudes and the JMA magnitudes, with a slope of 1∕2 for microearthquakes suggesting possible biases introduced by anelastic attenuation and the recording by a finite sampling interval.
The apparent move-out in Fig. 5 and Eq. (10) presumably stems from the use of different magnitude scales for comparison. Conventional magnitude scales such as ML, inferred from phase amplitude measurements, are seemingly sensitive to attenuation and 2-D variation along the path (Pasyanos et al., 2016). Unlike local magnitude scales, seismic-moment-based moment magnitude (Mw) essentially represents a direct measure of the strength of an earthquake caused by fault slip and is estimated from a relatively flat portion of source spectra at lower frequencies that can be less sensitive to near-surface attenuation effects. The consistency between coda-derived moment magnitude and local magnitude scales for the earthquakes with Mw coda > 3.0 indicates that my nonempirical approach successfully worked in this tectonically complex region. This observation is anticipated for relatively large earthquakes, since more energy will be characteristic at lower frequencies. I observed a similar type of consistency in early studies that investigate source properties of local and regional earthquakes based on empirical coda methods with simple 1-D radially symmetric path correction (e.g., Eken et al., 2004; Gök et al., 2016). Coda-wave-derived source parameters were obtained with high precision in Mayeda et al. (2005), Phillips et al. (2014), and Pasyanos et al. (2016) following the use of 2-D path-corrected station techniques to consider amplitude–distance relationships. Observable outliers in Fig. 5 for events with less than Mw 3.5, however, can be attributed to possible biases in local magnitude values taken from the catalog or small biases in my intrinsic () and scattering () attenuation terms. Another possible contribution to such a mismatch might be associated with the influences of mode conversions between body and surface waves or surface-to-surface wave scattering that are not restricted to low frequencies (< 1 Hz) (Sens-Schönfelder and Wegler, 2006).
This study provides moment magnitude estimates as a direct physical measure of seismic energy for local earthquakes with magnitudes recorded at 69 seismic stations in central Anatolia. The source displacement spectra were obtained following the application of a coda wave modeling procedure that employs a simultaneous optimization of source-, path-, and site-specific terms by fitting physically derived synthetic coda envelopes and observed coda envelopes. Radiative transfer theory was used for the analytic expression of synthetic coda wave envelopes. Overall consistency between Mw coda and ML suggests that my nonempirical approach successfully worked in this tectonically complex region. Variation of the high-frequency falloff parameter indicated that for smaller earthquakes (n>2) assuming an omega-square model can distort the estimates of corner frequency and even seismic moment, especially in regions where Q is strongly frequency dependent. Since the present study mainly focuses on source properties of local earthquakes in the study area, scattering and intrinsic attenuation properties that are other products of my coda envelope fitting procedure will be examined in detail within a future work. Finally, a linear regression analysis resulted in an empirical relation developed between Mw coda and ML, which will be a useful tool in the future to quickly convert catalog magnitudes into moment magnitudes for local earthquakes in the study area.
The Python code used for carrying out the inverse modeling is available under the permissive MIT license and is distributed at https://github.com/trichter/qopen (last access: 2 September 2018). I am grateful to the IRIS Data Management Center for maintaining, archiving, and making the continuous broadband data used in this study open to the international scientific community. The KOERI is specially thanked for providing publicly open local seismicity catalogs. Data for the CD–CAT experiment (https://doi.org/10.7914/SN/YB_2013; Sandvol, 2013) are available from the IRIS Data Management Center at http://www.iris.edu/hq/ (last access: 17 August 2018).
The author declares no conflict of interest.
This article is part of the special issue “Environmental changes and hazards in the Dead Sea region (NHESS/ACP/HESS/SE inter-journal SI)”. It is not associated with a conference.
The facilities of IRIS Data Services, specifically the IRIS Data Management Center, were used for access to waveforms, related metadata, and/or derived products used in this study. IRIS Data Services are funded through the Seismological Facilities for the Advancement of Geoscience and EarthScope (SAGE) Proposal of the National Science Foundation under cooperative agreement EAR-1261681. Tuna Eken acknowledges financial support from the Alexander von Humboldt (AvH) Foundation towards computational and peripheral resources. I thank Peter Gaebler and Tom Eulenfeld for their early instructions on Qopen utility. I am grateful to the topical editor, Charlotte Krawczyk, for handling the revision process and Takahiko Uchide and Ludovic Margerin for their valuable opinions on the improvement of the paper.
This paper was edited by CharLotte Krawczyk and reviewed by Takahiko Uchide and Ludovic Margerin.
Abercrombie, R. E.: Earthquake source scaling relationships from −1 to 5 ML using seismograms recorded at 2.5-km depth, J. Geophys. Res., 100, 24015–24036, 1995.
Aki, K.: Analysis of the seismic coda of local earthquakes as scattered waves, J. Geophys. Res., 74, 615–631, 1969.
Aki, K. and Chouet, B.: Origin of coda waves: Source, attenuation, and scattering effects, J. Geophys. Res., 80, 3322–3342, 1975.
Ambeh, W. and Fairhead, J.: Spectral characteristics and source parameters of microearthquakes from the Mt Cameroon volcanic region, West Africa, Geophys. J. Int., 106, 229–237, 1991.
Atkinson, G. M.: A comparison of eastern North American ground motion observations with theoretical predictions, Seismol. Res. Lett., 61, 171–180, 1990.
Bakun, W. H. and Lindh, A. G.: Local Magnitudes, Seismic Moments, and Coda Durations for Earthquakes Near Oroville, California, B. Seismol. Soc. Am., 67, 615–629, 1977.
Bird, P.: An updated digital model of plate boundaries, Geochem. Geophy. Geosy., 4, 1027, https://doi.org/10.1029/2001GC000252, 2003.
Bozkurt, E.: Neotectonics of Turkey – A synthesis, Geodinam. Acta, 14, 3–30, 2001.
Bulut, F., Bohnhoff, M., Eken, T., Janssen, C., Kılıç, T., and Dresen, G.: The East Anatolian fault zone: Seismotectonic setting and spatiotemporal characteristics of seismicity based on precise earthquake locations, J. Geophys. Res., 117, B07304, https://doi.org/10.1029/2011JB008966, 2012.
Çemen, I., Göncüoglu, M. C., and Dirik, K.: Structural evolution of the Tuz Gölü basin in central Anatolia, Turkey, J. Geol., 107, 693–706, https://doi.org/10.1086/314379, 1999.
Çubuk, Y., Yolsal-Çevikbilen, S., and Taymaz, T.: Source parameters of the 20052008 Balâ-Sırapınar (central Turkey) earthquakes: Implications for the internal deformation of the Anatolian plate, Tectonophysics, 635, 125–153, 2014.
Denolle, M. A. and Shearer, P. M.: New perspectives on self-similarity for shallow thrust earthquakes, J. Geophys. Res.-Sol. Ea., 121, 6533–6565, 2016.
Edwards, B., and Rietbrock, A.: A comparative study on attenuation and source-scaling relations in the Kantō, Tokai, and Chubu regions of Japan, using data from Hi-net and KiK-net, B. Seismol.l Soc. Am., 99, 2435–2460, 2009.
Eken, T., Mayeda, K., Hofstetter, A., Gök, R., Orgülü, G., and Turkelli, N.: An application of the coda methodology for moment-rate spectra using broadband stations in Turkey, Geophys. Res. Lett, 31, L11609, https://doi.org/10.1029/2004GL019627, 2004.
Eulenfeld, T. and Wegler, U.: Measurement of intrinsic and scattering attenuation of shear waves in two sedimentary basins and comparison to crystalline sites in Germany, Geophys. J. Int., 205, 744–757, 2016.
Eulenfeld, T. and Wegler, U.: Crustal intrinsic and scattering attenuation of high-frequency shear waves in the contiguous United States, J. Geophys. Res., 122, 4676–4690, https://doi.org/10.1002/2017JB014038, 2017.
Favreau, P. and Archuleta, R. J.: Direct seismic energy modelling and application to the 1979 Imperial Valley earthquake, Geophys. Res. Lett., 30, 1198, https://doi.org/10.1029/170GM28, 2003.
Gaebler, P. J., Eulenfeld, T., and Wegler, U.: Seismic scattering and absorption parameters in the W-Bohemia/Vogtland region from elastic and acoustic radiative transfer theory, Geophys. J. Int., 203, 1471–1481, 2015.
Gaebler, P. J., Eken, T., Bektaş, H. Ö., Eulenfeld, T., Wegler, U., and Taymaz, T.: Imaging of Shear Wave Attenuation Along the Central Part of the North Anatolian Fault Zone, Turkey, J. Seismol., accepted, 2018.
Goertz-Allmann, B. P., Edwards, B., Bethmann, F., Deichmann, N., Clinton, J., Fäh, D., and Giardini, D.: A new empirical magnitude scaling relation for Switzerland, B. Seismol. Soc. Am., 101, 3088–3095, 2011.
Gök, R., Kaviani, A., Matzel, E. M., Pasyanos, M. E., Mayeda, K., Yetirmishli, G., El-Hussain, I., Al-Amri, A., Al-Jeri, F., Godoladze, T., Kalafat, D., Sandvol, E. A., and Walter, W. R.: Moment Magnitudes of Local/Regional Events from 1D Coda Calibrations in the Broader Middle East Region, B. Seismol Soc. Am., 106, 1926–1938, 2016.
Gusev, A. A. and Abubakirov, I. R.: Simulated envelopes of non-isotropically scattered body waves as compared to observed ones: another manifestation of fractal heterogeneity, Geophys. J. Int., 127, 49–60, 1996.
Hanks, T. C. and Kanamori, H.: A moment magnitude scale, J. Geophys. Res., 84, 2348–2350, 1979.
Izgi, G., Eken, T., Gaebler, P., and Taymaz, T.: Frequency-Dependent Shear Wave Attenuation Along the Western Part of the North Anatolian Fault Zone, Geophys. Res. Abstr., 20, EGU2018-629-2, 2018.
Joyner, W. B.: A Scaling Law for the Spectra of Large Earthquakes, B. Seismol. Soc. Am., 74, 1167–1188, 1984.
Kaymakci, N., Inceöz, M., and Ertepinar, P.: 3D architecture and Neogene evolution of the Malatya Basin: inferences for the kinematics of the Malatya and Ovacik Fault Zones, T. J. Earth Sci., 15, 123–154, 2006.
Koçyiğit, A. and Beyhan, A.: A new intracontinental transcurrent structure: The Central Anatolian fault zone, Turkey, Tectonophysics, 284, 317–336, https://doi.org/10.1016/S0040-1951(97)00176-5, 1998.
Kwiatek, G., Plenkers, K., and Dresen, G.: Source parameters of pico-seismicity recorded at Mponeng Deep Gold Mine, South Africa: implications for scaling relations, B. Seism. Soc. Am., 101, 2592–2608, 2011.
Malagnini, L., Mayeda, K., Akinci, A., and Bragato, P. L.: Estimating absolute site effects, B. Seismol. Soc. Am., 94, 1343–1352, 2004.
Malagnini, L. and Munafò., I.: On the Relationship between ML and Mw in a Broad Range: An Example from the Apennines, Italy, B. Seismol. Soc. Am., 108, 1018–1024, 2018.
Mayeda, K. and Walter, W. R.: Moment, energy, stress drop, and source spectra of western United States earthquakes from regional coda envelopes, J. Geophys. Res., 101, 11195–11208, 1996.
Mayeda, K., Hofstetter, A., O'Boyle, J. L., and Walter, W. R.: Stable and transportable regional magnitudes based on coda-derived moment-rate spectra, B. Seismol. Soc. Am., 93, 224–239, 2003.
Mayeda, K., Malagnini, L., Phillips, W. S., Walter, W. R., and Dreger, D.: 2D or not 2D, that is the question: A Northern California Test, Geophys. Res. Lett., 32, L12301, https://doi.org/10.1029/2005GL022882, 2005.
Morasca, P., Mayeda, K., Gök, R., Phillips, W. S., and Malagnini, L.: Coda-derived source spectra, moment magnitudes and energy-moment scaling in the western Alps, Geophys. J. Int., 160, 263–275, 2008.
Paasschens, J.: Solution of the time-dependent Boltzmann equation, Phys. Rev. E, 56, 1135–1141, 1997.
Papageorgiou, A. and Aki, K.: A specific barrier model for the quantitative description of inhomogeneous faulting and the prediction of strong ground motion I: Description of the model, B. Seismol. Soc. Am., 73, 693–722, 1983.
Pasyanos, M. E., Gök, R., and Walter, W. R.: 2-D variations in coda amplitudes in the Middle East, B. Seismol. Soc. Am., 106, 1915–1925, https://doi.org/10.1785/0120150336, 2016.
Phillips, W. S., Mayeda, K. M., and Malagnini, L.: How to invert multi-band, regional phase amplitudes for 2-d attenuation and source parameters: Tests using the usarray, Pure Appl. Geophys., 171, 469–484, 2014.
Portner, D. E., Delph, J. R., Biryol, C. B., Beck, S. L., Zandt, G., Özacar, A. A., Sandvol, E., and Türkelli, N.: Subduction termination through progressive slab deformation across Eastern Mediterranean subduction zones from updated P-wave tomography beneath Anatolia, Geosphere, 14, 907–925, 2018.
Przybilla, J. and Korn, M.: Monte Carlo simulation of radiative energy transfer in continuous elastic random mediathree-component envelopes and numerical validation, Geophys. J. Int., 173, 566–576, 2008.
Rautian, T. G. and Khalturin, V. I.: The use of the coda for determination of the earthquake source spectrum, B. Seism. Soc. Am., 68, 923–948, 1978.
Sandvol, E.: Continental Dynamics/Central Anatolian Tectonics: Surface to mantle dynamics during collision to escape, International Federation of Digital Seismograph Networks, Dataset/Seismic Network, https://doi.org/10.7914/SN/YB_2013, 2013.
Sato, H. and Fehler, M. C.: Seismic Wave Propagation and Scattering in the Heterogeneous Earth, Springer-Verlag, New York, 1998.
Sato, H., Fehler, M. C., and Maeda, T.: Seismic Wave Propagation, and Scattering in the Heterogeneous Earth, 2nd edn, Springer, Berlin Heidelberg, 2012.
Sens-Schönfelder, C. and Wegler, U.: Radiative transfer theory for estimation of the seismic moment, Geophys. J. Int., 167, 1363–1372, 2006.
Taymaz, T., Jackson, J., and Westaway, R.: Earthquake mechanisms in the Hellenic Trench near Crete, Geophys. J. Int., 102, 695–731, 1990.
Taymaz, T., Westaway, R., and Reilinger, R.: Active faulting and crustal deformation in the eastern Mediterranean Region, Spec. Issue Tectonophys., 391, 1–9, https://doi.org/10.1016/j.tecto.2004.07.005, 2004.
Tchalenko, J. S.: Similarities between shear zones of different magnitudes, Geol. Soc. Am. Bull., 81, 1625–1640, 1970.
Uchide, T. and Imanishi, K.: Small earthquakes deviate from the omega-square model as revealed by multiple spectral ratio analysis, B. Seismol. Soc. Am., 106, 1357–1363, 2016.
Uchide, T. and Imanishi, K.: Underestimation of microearthquake size by the magnitude scale of the Japan Meteorological Agency: Influence on earthquake statistics, J. Geophys. Res.-Sol. Ea., 123, 606–620, 2018.
Walter, W. R., Mayeda, K., and Patton, H. J.: Phase and spectral ratio discrimination between NTS earthquakes and explosions, I, Empirical observations, Bull. Seism. Soc. Am., 85, 1050–1067, 1995.
Yoo, S.-H., Rhie, J., Choi, H.-S., and Mayeda, K.: Coda-derived source parameters of earthquakes and their scaling relationships in the Korean Peninsula, B. Seismol. Soc. Am., 101, 2388–2398, 2011.
Zeng, Y., Su, F., and Aki, K.: Scattering wave energy propagation in a random isotropic scattering medium: 1. Theory, J. Geophys. Res., 96, 607–619, 1991.
The requested paper has a corresponding corrigendum published. Please read the corrigendum first before downloading the article.
- Article
(6901 KB) - Full-text XML