the Creative Commons Attribution 4.0 License.
the Creative Commons Attribution 4.0 License.
 | 11 Aug 2020
Pre-inversion normal fault geometry controls inversion style and magnitude, Farsund Basin, offshore southern Norway
Thomas B. Phillips
Christopher A.-L. Jackson
James R. Norcliffe
Compressional strains may manifest along pre-existing structures within the lithosphere, far from the plate boundaries along which the causal stress is greatest. The style and magnitude of the related contraction is expressed in different ways, depending on the geometric and mechanical properties of the pre-existing structure. A three-dimensional approach is thus required to understand how compression may be partitioned and expressed along structures in space and time. We here examine how post-rift compressional strains are expressed along the northern margin of the Farsund Basin during Late Cretaceous inversion and Palaeogene–Neogene pulses of uplift. At the largest scale, stress localises along the lithosphere-scale Sorgenfrei-Tornquist Zone, where it is expressed in the upper crust as hangingwall folding, reverse reactivation of the basin-bounding normal fault, and bulk regional uplift. The geometry of the northern margin of the basin varies along strike, with a normal fault system passing eastward into an unfaulted ramp. Late Cretaceous compressive stresses, originating from the convergence between Africa, Iberia, and Europe, selectively reactivated geometrically simple, planar sections of the fault, producing hangingwall anticlines and causing long-wavelength folding of the basin fill. The amplitude of these anticlines decreases upwards due to tightening of pre-existing fault propagation folds at greater depths. In contrast, later Palaeogene–Neogene uplift is accommodated by long-wavelength folding and regional uplift of the entire basin. Subcrop mapping below a major, uplift-related unconformity and borehole-based compaction analysis show that uplift increases to the north and east, with the Sorgenfrei-Tornquist Zone representing a hinge line rather than a focal point to uplift, as was the case during earlier Late Cretaceous compression. We show how compressional stresses may be accommodated by different mechanisms within structurally complex settings. Furthermore, the prior history of a structure may also influence the mechanism and structural style of shortening that it experiences.
- Article
(21470 KB) - Full-text XML
- BibTeX
- EndNote


Compressional stresses originating at plate boundaries can be transmitted great distances into continental interiors where they may localise along and drive the reactivation and shortening of pre-existing lithospheric heterogeneities (e.g. Berthelsen, 1998; Sandiford and Hand, 1998; Turner and Williams, 2004; Dyksterhuis and Müller, 2008; Buiter et al., 2009; Stephenson et al., 2009; Heron et al., 2018). Inversion is intimately related to intraplate compressional stresses, describing the process by which previously extensional structures are folded and/or uplifted (in the case of rift basins), or undergo reverse reactivation (in the case of a normal fault), in response to a change from an extensional to compressional tectonic stress (Cooper et al., 1989). In addition to long-wavelength folding of the basin fill (e.g. Liboriussen et al., 1987; Jensen and Schmidt., 1993) and reverse fault reactivation (e.g. McClay, 1995; Panien et al., 2006; Kelly et al., 1999; Reilly et al., 2017; Patruno et al., 2019; Rodriguez-Salgado et al., 2019; Scisciani et al., 2019), compressional stress may also be accommodated by additional mechanisms including the following: (i) folding of strata atop a ductile detachment surface (e.g. Kockel, 2003) and (ii) the formation of new reverse and strike-slip faults (e.g. Kelly et al., 1999; Rodriguez-Salgado et al., 2019).
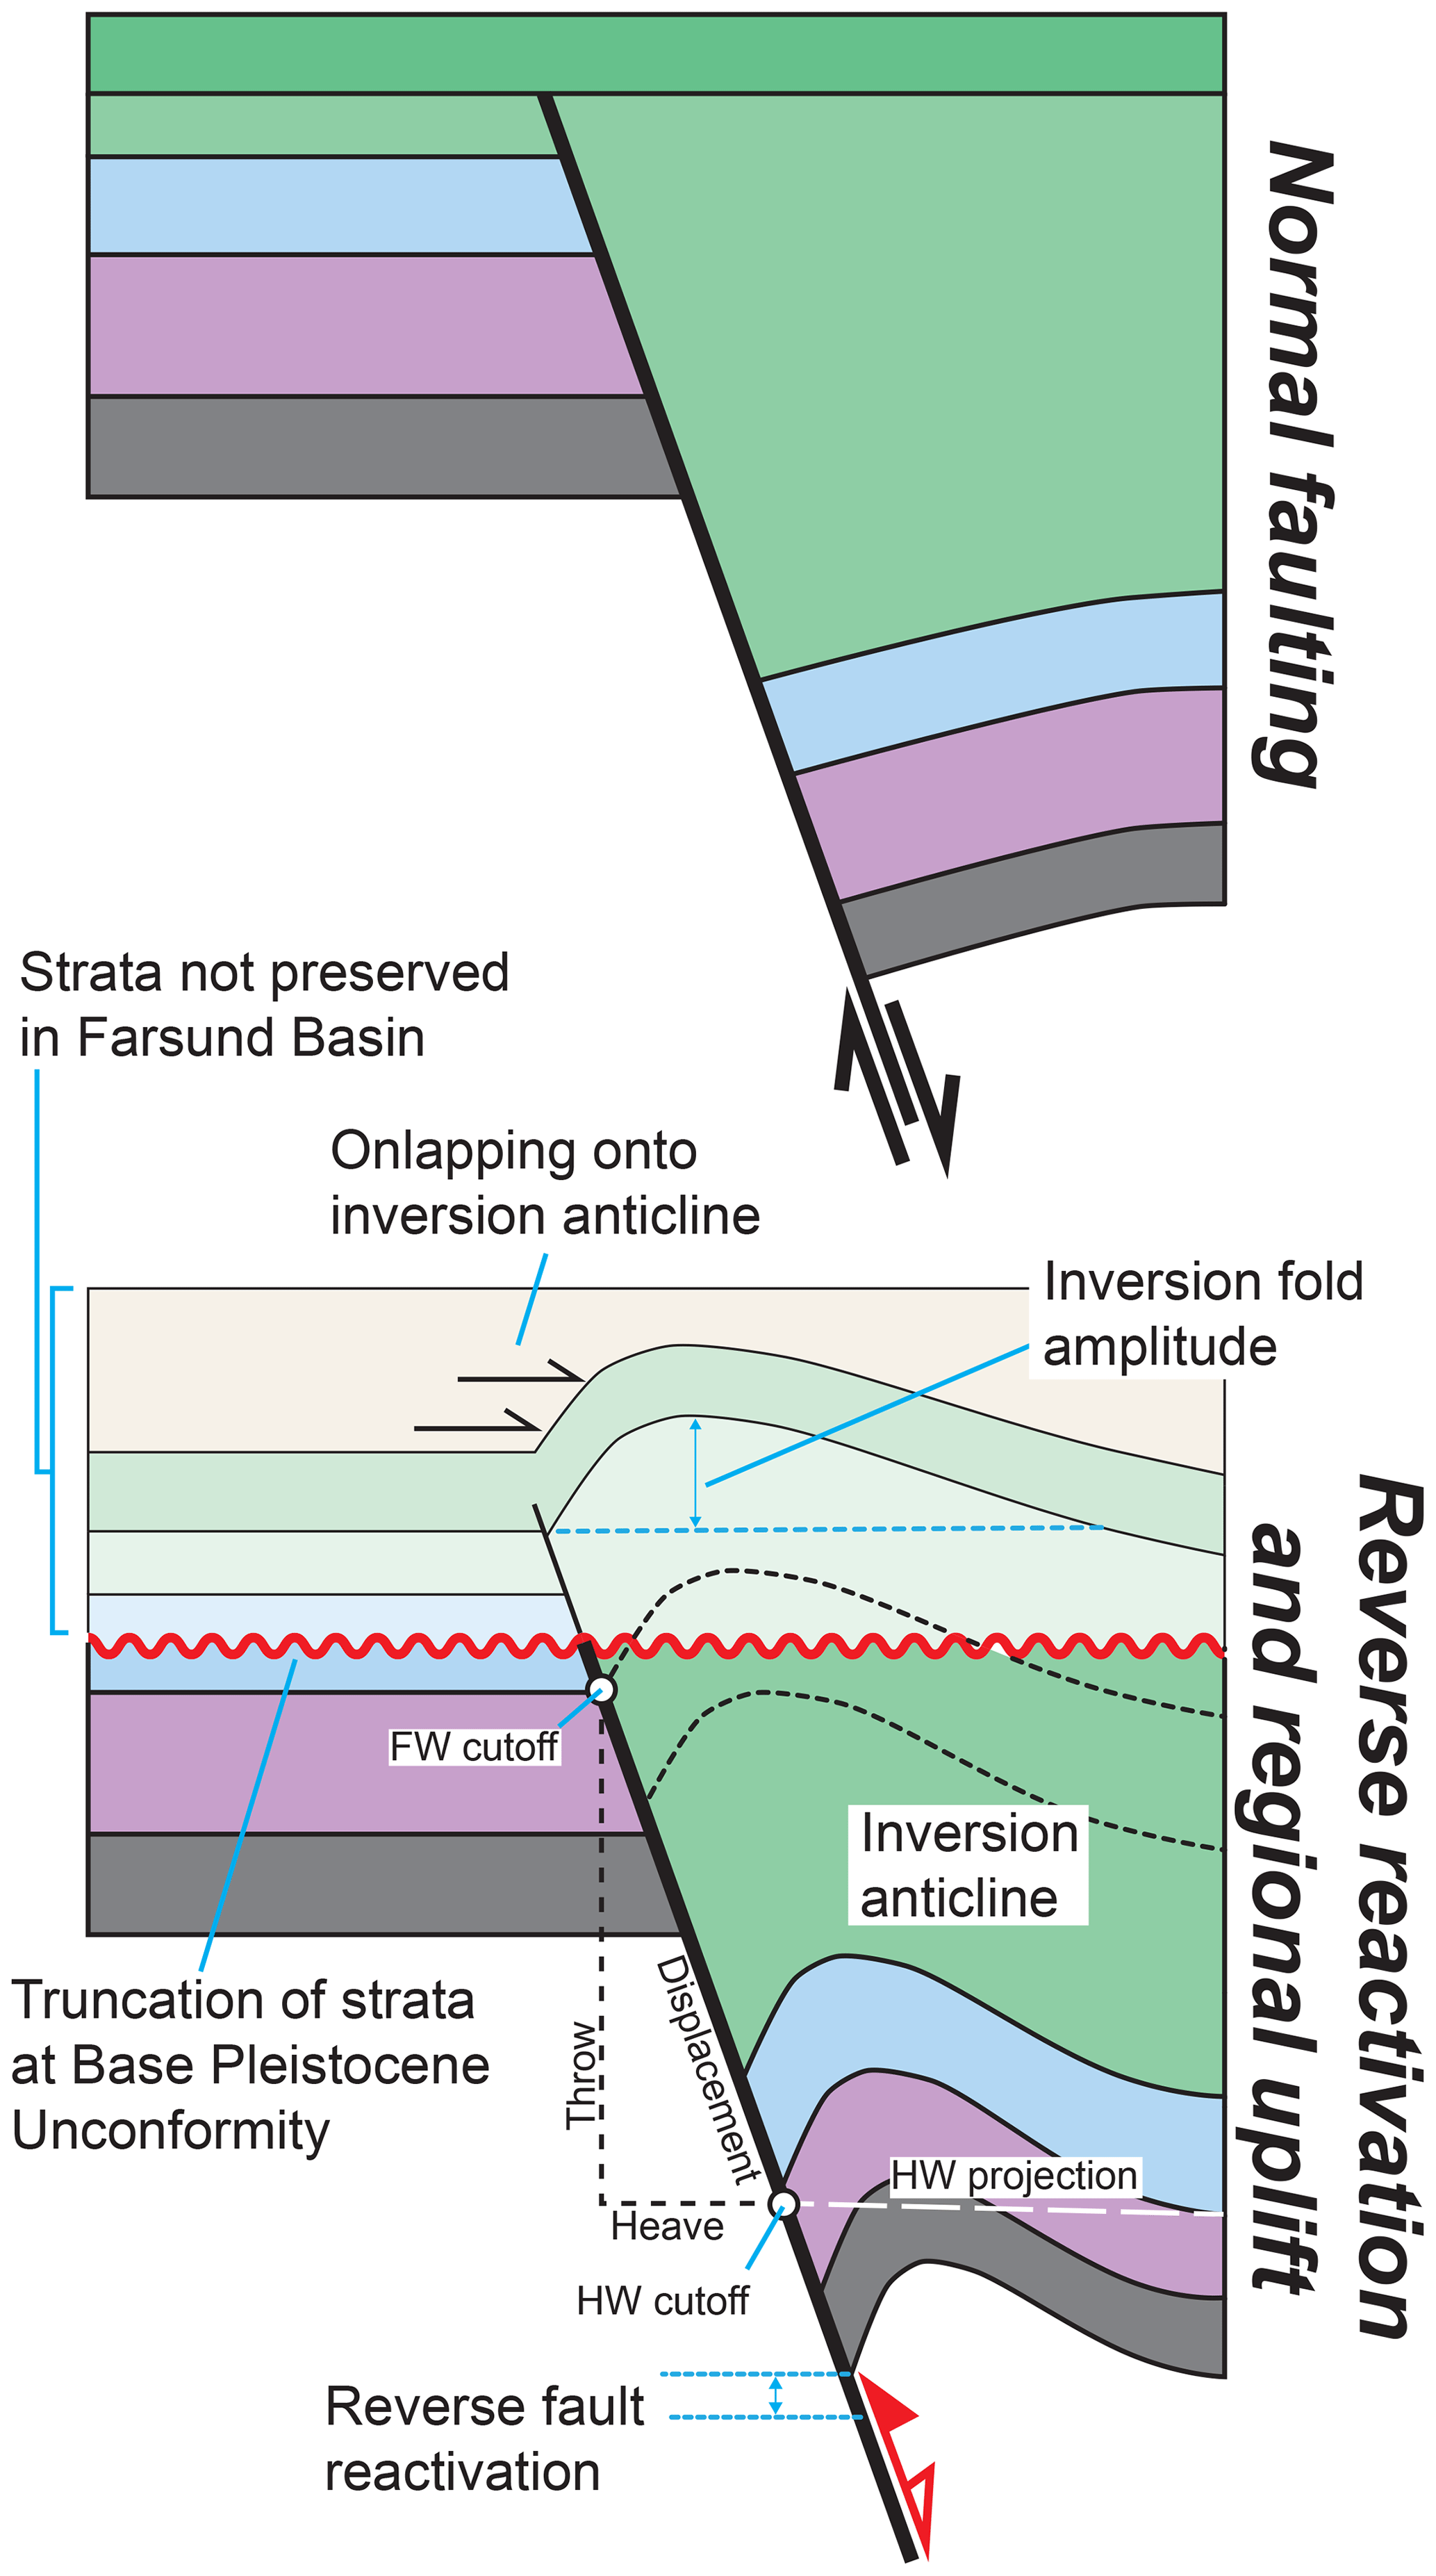
Figure 1Conceptual model of the reverse reactivation of a previously extensional normal fault. Ductile folding occurs in the hangingwall of the fault, producing an anticline displaying a constant amplitude with depth. Strata onlapping onto the limb of the fold at the free surface indicate the age of folding and therefore inversion. In the case of the Farsund Basin, the upper part of the anticline is eroded by the base Pleistocene unconformity, meaning that we have no constraints on the timing of inversion. Projected hangingwall cutoffs and the footwall cutoff used for throw analyses are also shown.
The geometry and mechanical strength of pre-existing structures – and their relative position with respect to adjacent structures – may control if, to what extent, and how different structures will be behave when subject to compressional stresses (Kelly et al., 1999; Walsh et al., 2001; Panien et al., 2005; Reilly et al., 2017). According to Andersonian fault mechanics, low-angle structures are typically easier to reactivate under compression, whereas subvertical structures may be easier to reactivate in a strike-slip sense (Anderson, 1905; Daly et al., 1989). “Weaker” structures, such as those characterised by high pore pressures and/or pervasive fabrics, are typically easier to reactivate than stronger, more homogeneous structures (Youash, 1969; Gontijo-Pascutti et al., 2010; Chattopadhyay and Chakra, 2013). Furthermore, certain structures may be preferentially reactivated, regardless of their strength, due to their location with respect to other structures – i.e. those located in the strain shadows of larger structures are unlikely to be reactivated (Walsh et al., 2001; Reilly et al., 2017). Once a structure does reactivate, our understanding of the structural styles and mechanisms of the associated reactivation are typically thought of in only a 2D sense, with inverted normal faults producing relatively simple inversion-related anticlines (Fig. 1). Such an approach negates the inherent along-strike variability and prior evolution of structures and, thus, leaves a number of unanswered questions. For example, (i) how does the prior evolution and geometry of a structure affect its propensity to reactivate when subject to compression? (ii) how does the style and magnitude of this reactivation vary along strike? and (iii) how are different styles of deformation, (uplift, long-wavelength folding, reverse reactivation, etc.) partitioned along a structure?
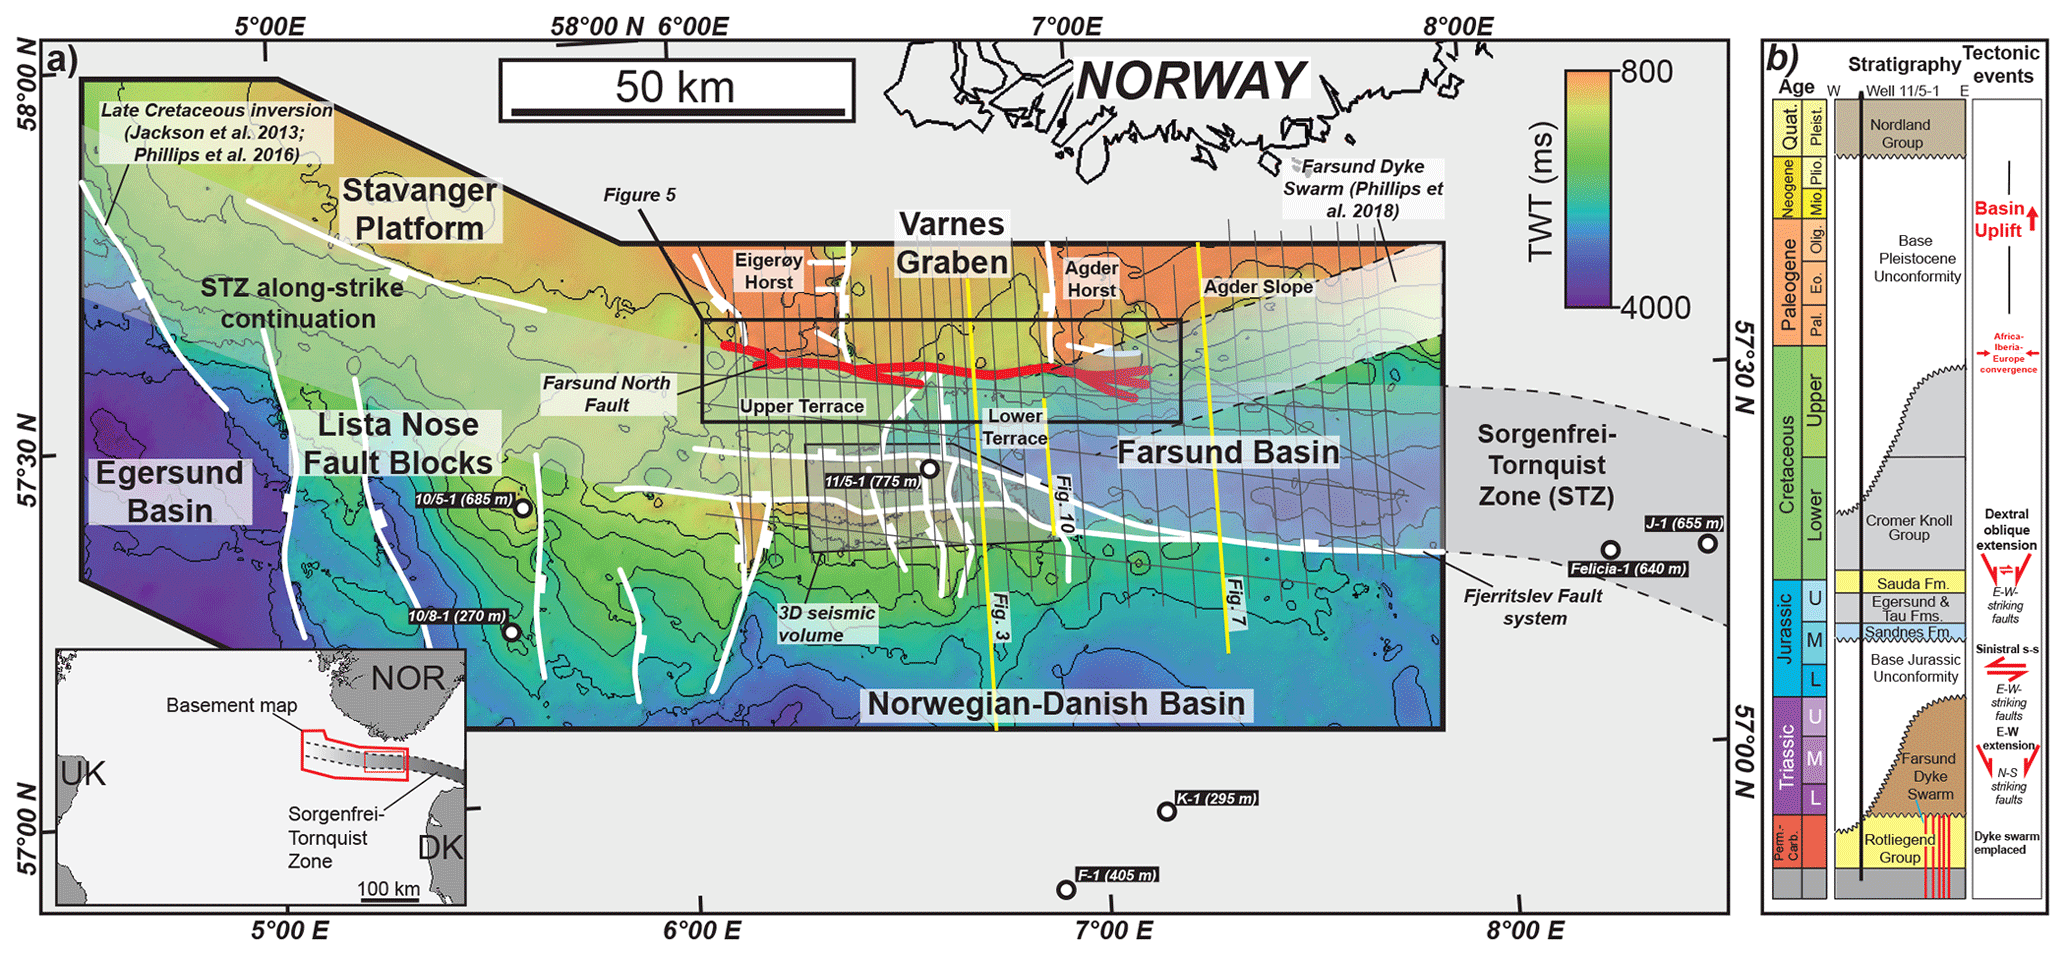
Figure 2(a) Regional two-way-time (TWT) structure map showing the top acoustic basement surface (typically base Triassic/base Zechstein Supergroup evaporites) across the region. The locations and calculated total uplift values of wells, used to constrain the ages of stratigraphic horizons across the area are shown. Grey lines indicate the locations of 2D seismic lines referred to in this study. Seismic data used to create the rest of the acoustic basement surface can be found in Phillips et al. (2016). Inset – Regional map showing the location of the study area and Sorgenfrei-Tornquist Zone. (b) Tectonostratigraphic column for the Farsund Basin based on lithological information from well 11/5-1 (after Phillips et al., 2019), showing the main lithologies and tectonic events.
We use borehole-constrained 2D and 3D seismic reflection data from the Farsund Basin, an inverted graben located offshore southern Norway, to examine how compression and uplift-related stresses were partitioned between different styles and mechanisms of deformation across a structurally complex rift basin (Fig. 2a). The Farsund Basin has experienced a complex and protracted geological evolution, being located above the westernmost extent of the lithosphere-scale Sorgenfrei-Tornquist Zone (STZ) (Fig. 2a). The STZ corresponds to a pronounced step in lithospheric thickness at subcrustal depths (e.g. Pegrum, 1984; Mogensen, 1994, 1995; Deeks and Thomas, 1995; Cotte and Pedersen, 2002; Babuška and Plomerová, 2004; Bergerat et al., 2007) and has repeatedly reactivated in response to regional tectonic events, such as Carboniferous–Permian transtension, Early Cretaceous extension, and Late Cretaceous compression (Fig. 2b) (Mogensen, 1995; Berthelsen, 1998; Phillips et al., 2018). This multiphase and protracted evolution produced a complex rift system along its length, including the Farsund Basin. In addition, the Farsund Basin area experienced further phases of uplift throughout the Palaeogene and Neogene, associated with regional uplift of southern Scandinavia (Japsen and Chalmers, 2000; Japsen et al., 2007a, 2018; Baig et al., 2019). This important tectonic event resulted in the formation of a large unconformity and the removal of large thicknesses of strata from across the basin (Figs. 1, 2b).
We focus on the northern margin of the Farsund Basin, which is defined by the complex S-dipping Farsund North Fault in the west and a S-dipping ramp to the east (Fig. 2a). Specifically, using borehole-based compaction analyses, subcrop mapping, and qualitative (i.e. seismic–stratigraphic) and quantitative analysis of fault-related folds, we examine how deformation was partitioned along this structure during Late Cretaceous compression and Palaeogene–Neogene uplift events. Reverse reactivation of the basin-bounding Farsund North Fault occurs locally and was associated with the formation of near-fault hangingwall anticlines and long-wavelength folding of the basin fill. The hangingwall anticline decreases in amplitude upwards; this is in contrast to the relatively constant amplitude typically encountered along inversion-related folds. We suggest that this structural style is related to the presence of fault propagation folds formed along the fault prior to inversion. We find that reverse reactivation preferentially occurs along geometrically simple fault sections; areas that display a more complex fault geometry or where rift-bounding faults are not present are not reactivated, and shortening is largely manifest as regional uplift. We relate the reverse reactivation of the Farsund North Fault and the buckling of basin strata to compressional stresses associated with the convergence of Africa, Iberia, and Europe during the Late Cretaceous, prior to the main Alpine orogeny (Kley and Voigt, 2008). This compression localised along and was buttressed against the lithosphere-scale STZ and, locally within the Farsund Basin, the Farsund North Fault. We attribute the regional uplift and erosion to Cenozoic uplift of onshore Norway, with the STZ acting as a hinge line between areas of relative uplift and those of subsidence.
This study highlights how stresses associated with regional compression and uplift, initially localised along the lithospheric-scale STZ, may be expressed via different deformation mechanisms within complex upper-crustal rift systems. We show how the magnitude and style of compression- and uplift-related deformation can vary along strike of a single structure, depending on its geometric complexity and prior tectonic history.
The Farsund Basin, located ∼50 km offshore southern Norway, is an E-trending Early Cretaceous graben that underwent shortening and uplift during the Late Cretaceous and throughout the Cenozoic respectively (Jensen and Schmidt 1993; Mogensen, 1995). The basin is defined by the N-dipping Fjerritslev Fault system along its southern margin and the S-dipping Farsund North Fault along its northern margin (Phillips et al., 2018). The basin is separated into an upper and lower terrace by a series of N–S-striking faults that also define the Varnes Graben and the Eigerøy and Agder horsts to the north (Fig. 2a). East of the eastern termination of the Farsund North Fault and the Agder Horst, the northern margin of the Farsund Basin is represented by the S-dipping Agder Slope (Fig. 2a).
Detailed accounts of the structural and stratigraphic evolution of the Farsund Basin can be found in Phillips et al. (2018, 2019) respectively. We here outline the key phases in the pre-Late Cretaceous evolution of the basin, before detailing how the Late Cretaceous compression and later Palaeogene–Neogene uplift events were expressed across the basin and wider region.
2.1 Pre-Late Cretaceous evolution of the Farsund Basin
The Farsund Basin is situated towards the westernmost extent of the Sorgenfrei-Tornquist Zone, which forms the northwestern section of the lithosphere-scale Tornquist Zone (Pegrum, 1984; Berthelsen, 1998; Thybo, 2000; Cotte and Pedersen 2002; Mazur et al., 2015). The Tornquist Zone represents a sharp change in lithospheric thickness and structure between thick cratonic lithosphere of the Eastern European Craton to the north and east and younger, relatively thin lithosphere of central and western Europe to the southwest (e.g. Kind et al., 1997; Cotte and Pedersen, 2002; Babuška and Plomerová, 2004). At upper-crustal depths, the Tornquist Zone has been periodically reactivated during multiple tectonic events and is described as a “buffer zone” to regional tectonic stresses (Mogensen et al., 1995; Berthelsen, 1998).
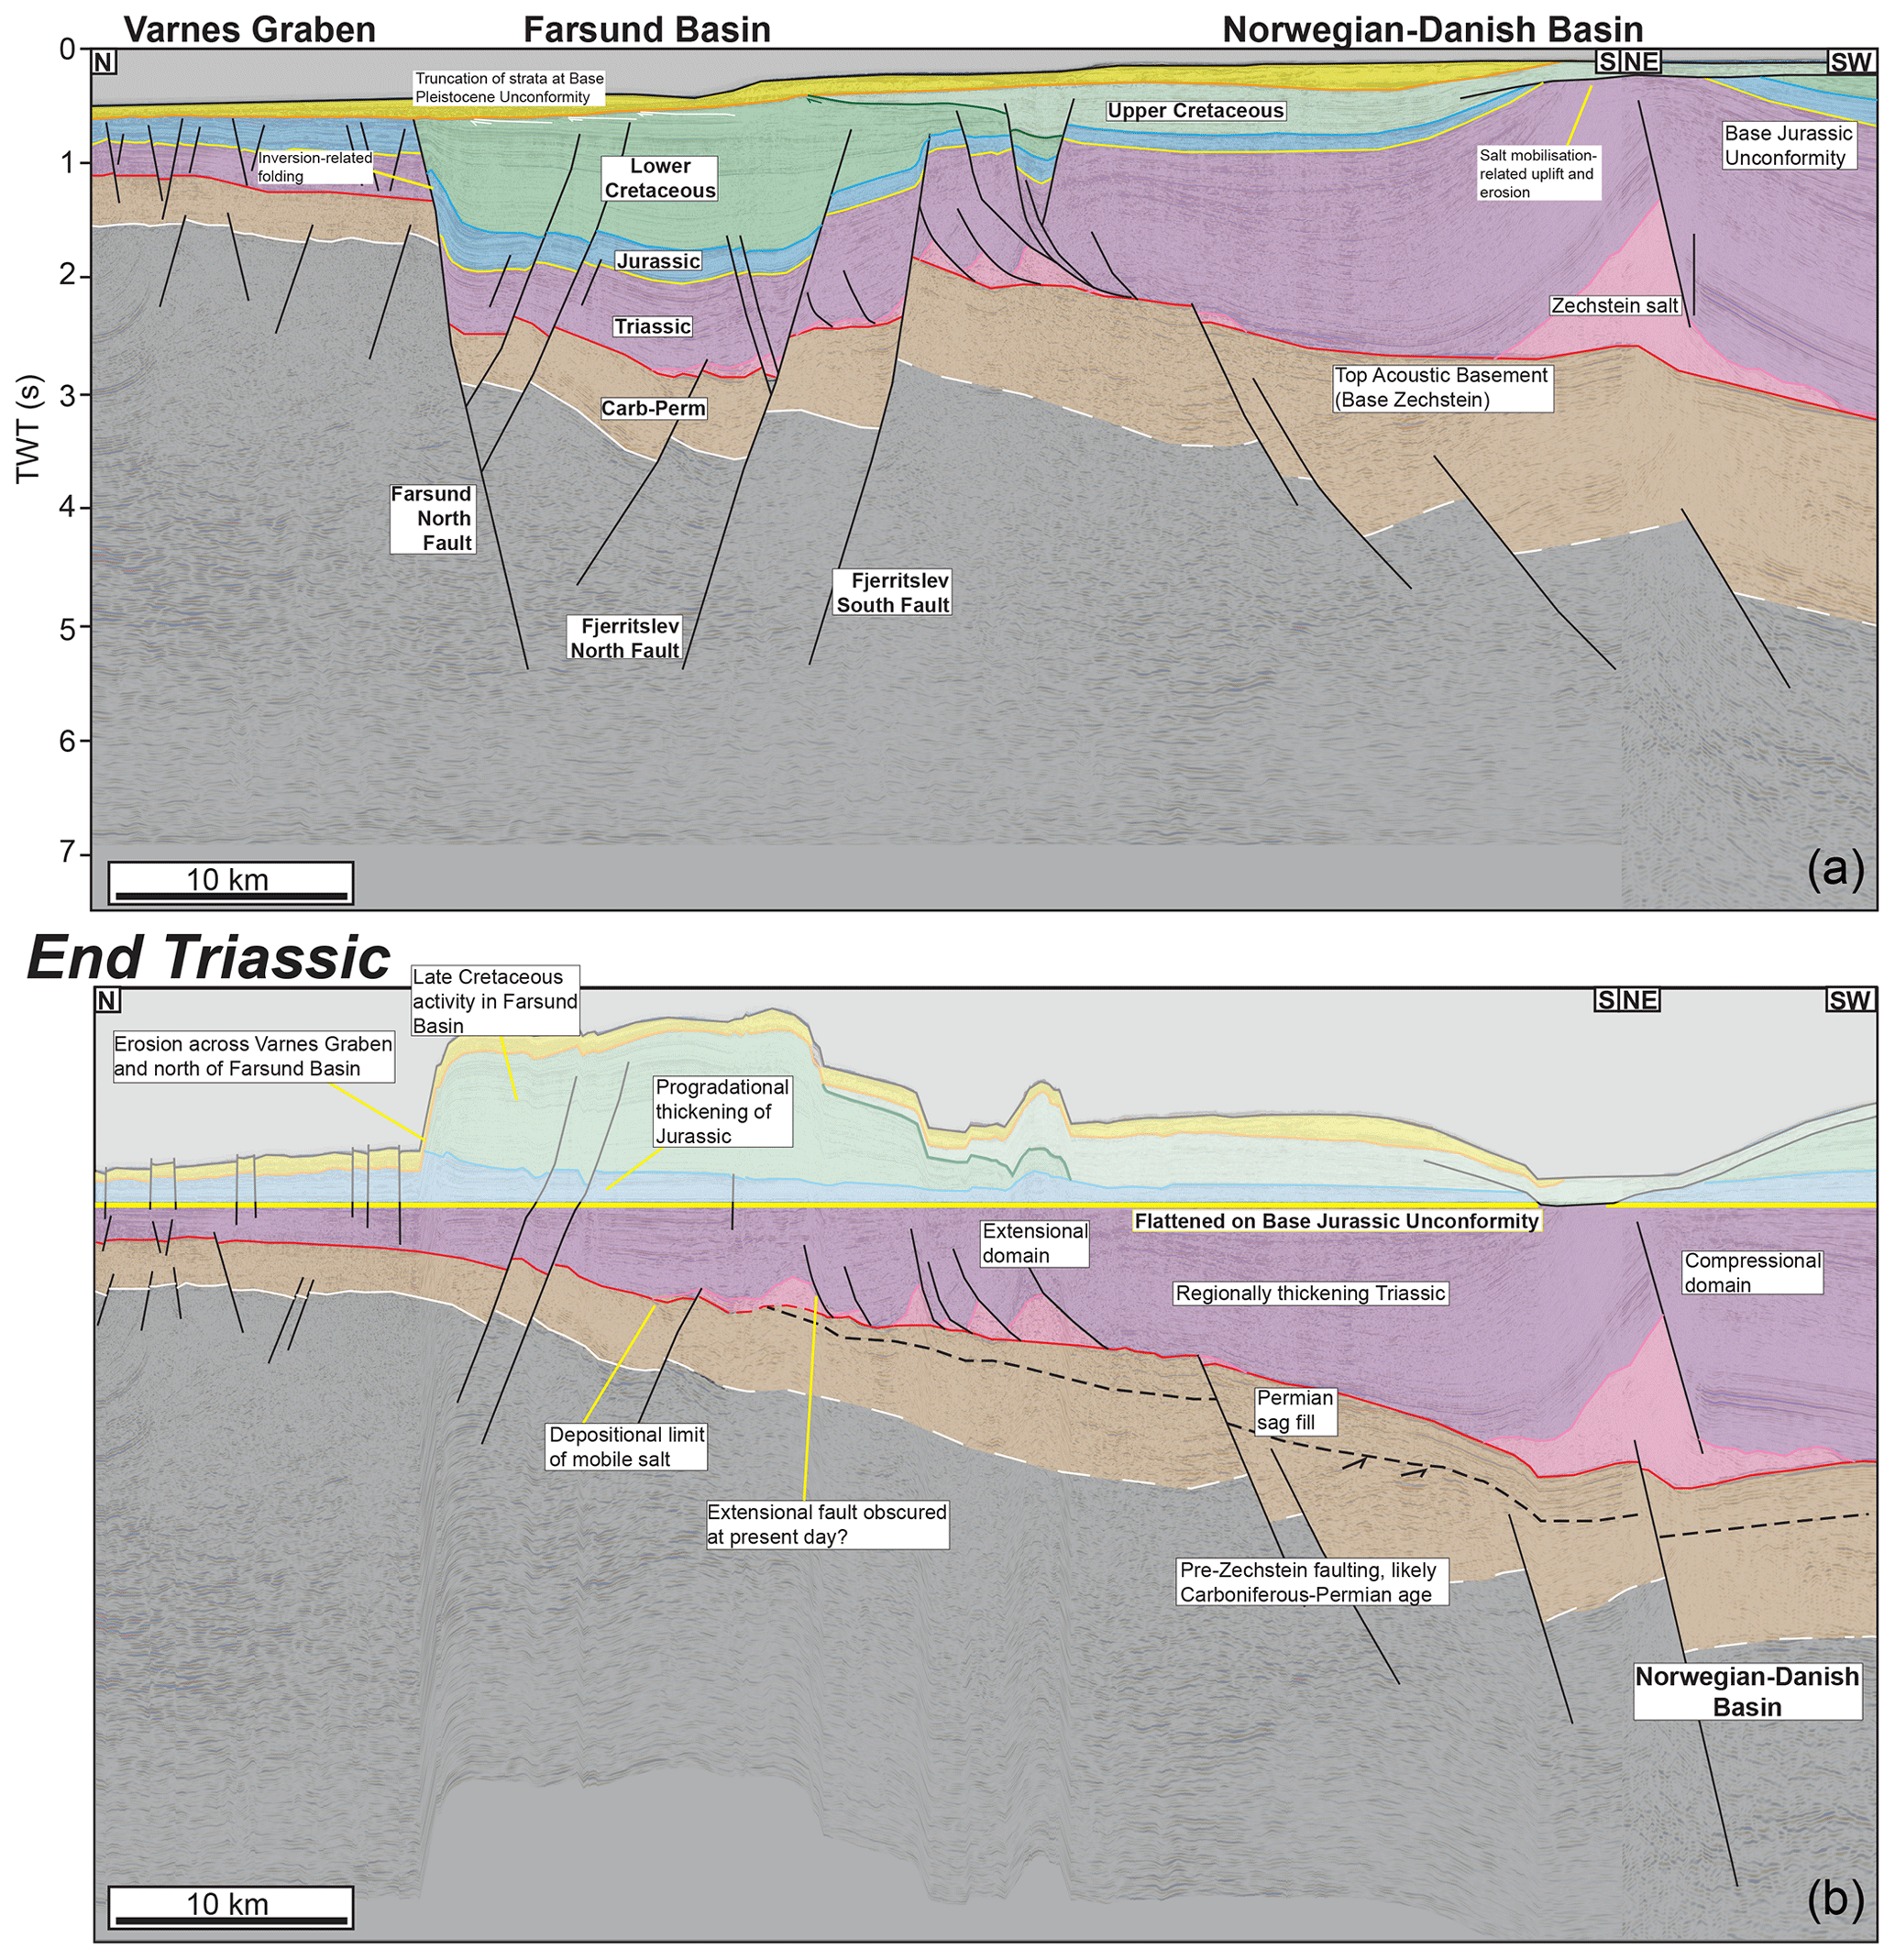
Figure 3(a) Interpreted N–S oriented seismic section highlighting the present geometry of the Farsund Basin. (b) The same section flattened on the base Jurassic unconformity highlighting the rough structural and stratal geometries present at the beginning of the Jurassic. The Farsund Basin has not formed at this time and is contiguous with the Varnes Graben and Norwegian–Danish Basin to the north and south, respectively. Triassic strata show only regional thinning towards the north, with salt mobilisation occurring down the palaeoslope into the Norwegian–Danish Basin. See Fig. 2 for location.
Transtensional reactivation of the STZ during the Carboniferous–Permian was associated with rift activity and voluminous magmatism, including the emplacement of the WSW-trending Farsund Dyke Swarm (Fig. 2b) (Heeremans and Faleide, 2004; Heeremans et al., 2004; Wilson et al., 2004; Phillips et al., 2017; Malehmir et al., 2018). However, no Carboniferous–Permian fault activity is identified in the Farsund Basin (Phillips et al., 2018), although some pre-Upper Permian faulting, likely related to Carboniferous–Permian extension, occurred in the Norwegian–Danish and Egersund basins (Skjerven et al., 1983; Jackson and Lewis, 2013) (Figs. 2, 3).
E–W oriented Triassic extension formed N–S-striking faults across the area, including those that internally dissect the Farsund Basin and those that bound the Varnes Graben (Fig. 2) (Vejbæk, 1990; Phillips et al., 2018). The fault defining the western margin of the Varnes Graben – and those internally dissecting the Farsund Basin – likely formed a single structure during the Triassic that bounded the eastern margin of the Stavanger Platform (Fig. 2a) (Phillips et al., 2018, 2019). Upon their deposition, Triassic and likely Jurassic strata were contiguous with those in the Varnes Graben to the north (Fig. 3). At this time, the proto-Farsund Basin resided along the northern margin of the Norwegian–Danish Basin, which continued northwards into the present Varnes Graben (Figs. 2, 3) (Phillips et al., 2019). During the Early–Middle Jurassic, the N–S-striking fault along the eastern margin of the Stavanger Platform was sinistrally offset by roughly E–W-striking strike-slip faults. However, away from where they directly offset the N–S-striking faults (which act as piercing points in the kinematic analysis of Phillips et al., 2018), the precise location and geometry of the strike-slip faults is unknown due to erosion at the base Jurassic unconformity (Phillips et al., 2018).
Dextral transtensional reactivation of the STZ occurred during the Early Cretaceous (Fig. 2b) (Mogensen, 1995; Erlström et al., 1997; Phillips et al., 2018). This was associated with the formation of the E–W-striking normal faults bounding the Farsund Basin, forming a graben and separating it from the Norwegian–Danish Basin (Figs. 2, 3). Early Cretaceous extension in the Farsund Basin was associated with relatively rapid slip on the basin-bounding faults and correspondingly high rates of basin subsidence and accommodation generation (Phillips et al., 2018). Sediment accumulation rates eventually outpaced accommodation generation, and the faults were buried (Fig. 3). Cretaceous and younger strata are eroded across the study area below the base Pleistocene unconformity (Fig. 3).
2.2 Late Cretaceous compression and Palaeogene–Neogene uplift
Compression and shortening, which was accommodated by a range of deformation mechanisms, occurred along the length of the Tornquist Zone due to Late Cretaceous convergence between Africa, Iberia, and Europe (Fig. 2a) (e.g. Deeks and Thomas, 1995; Berthelsen, 1998; Hansen et al., 2000; Kley and Voigt, 2008). West of the Farsund Basin, mild inversion of the Stavanger Fault System occurred from the latest Turonian to early Maastrichtian (Fig. 2a) (Jackson et al., 2013). Further fault inversion is documented elsewhere in the North Sea around this time (Biddle and Rudolph, 1988; Cartwright, 1989; Jensen and Schmidt, 1993; Jackson et al., 2013).
Following Late Cretaceous compression, multiple phases of uplift occurred across southern Scandinavia and the North Sea throughout the Palaeogene and Neogene (Clausen et al., 2000; Japsen et al., 2007a, 2018). As a result of this uplift, Cretaceous, Palaeogene, and Neogene strata are missing beneath the base Pleistocene unconformity across much of the study area. These uplift events may be related to uplift of the South Swedish and South Scandes domes across southern Scandinavia, likely as a result of upper-mantle movements and changing plate tectonic forces associated with opening of the North Atlantic (e.g. Jensen and Schmidt, 1993; Clausen et al., 2000, Japsen and Chalmers, 2000; Japsen et al., 2002, 2007a, 2018; Stoker et al., 2005; Kalani et al., 2015; Baig et al., 2019). Because Late Cretaceous–Neogene strata are missing across much of the study area, we do not distinguish between the distinct post-Cretaceous uplift events, instead referring to them collectively as Palaeogene–Neogene uplift.
3.1 Data
We use a 2D seismic reflection dataset covering the Farsund Basin. This dataset consists of 31 N-trending seismic sections tied by five E-trending sections (Fig. 2a). These data record to 7 s two-way-travel time (s TWT) and are closely spaced (∼3 km), allowing us to correlate our interpretations between individual sections. The seismic data are displayed as zero phase and follow the SEG (Society of Exploration Geophysicists) reverse polarity convention: a downward increase in acoustic impedance is represented by a trough (red) and a downward decrease in acoustic impedance is represented by a peak (black). The 2D seismic sections data were locally augmented by a 3D seismic volume providing coverage of the southern margin of the basin, which images to 4 s TWT (Fig. 2a).
The ages of mapped seismic horizons were constrained by well 11/5-1, located on the southern margin of the basin (Fig. 2a). Wells 9/3-1, 10/5-1, 10/7-1 and 11/9-1, located outside of the main study area, provided additional stratigraphic age constraints (Fig. 2a). Velocity log information from well 11/5-1, two additional wells within the STZ (J-1, Felicia-1), and four wells in the Norwegian–Danish Basin (10/5-1, 10/8-1, F-1, K-1) were used to estimate the amount of uplift across the region (see Sect. 3.4.2). Due to incomplete coverage of the velocity log through the interval penetrated by 11/5-1, and in order to not introduce additional errors into our measurements, we did not depth convert the data. Well reports were also used to extract lithological information from each well in order to remove unsuitable lithologies from the porosity analyses.
3.2 Seismic interpretation
We mapped seven seismic horizons that define the present structure and allow us to constrain the temporal evolution of the study area (Fig. 3): (i) top crystalline basement, corresponding to the base of a Carboniferous–Permian-aged interval; (ii) top acoustic basement, corresponding to the base Upper Permian Zechstein Supergroup evaporites where present and the base Triassic where the evaporites are absent; (iii) the base Jurassic unconformity (BJU); (iv) top Jurassic; (v) top Lower Cretaceous; (vi) top Cretaceous; and (vii) the base Pleistocene unconformity. Additional horizons were interpreted within the Lower Cretaceous interval to help constrain the geometry and evolution of inversion-related structures.
3.3 Quantitative fault analyses
We calculated throw-length profiles along the Farsund North Fault to determine its kinematic evolution (e.g. Walsh et al., 2003; Duffy et al., 2015; Yielding, 2016). To accurately constrain the evolution of a fault we need to account for all slip-related strain, including both brittle faulting and ductile folding. Therefore, where necessary, such as in areas displaying complex fault geometries or fault-parallel short-wavelength folding, we project horizon cutoffs onto the fault plane from a regional datum (Fig. 1) (e.g. Walsh et al., 1996; Long and Imber, 2010). We minimise potential errors in our measurements by measuring fault throw as opposed to displacement, removing the potential for errors associated with depth conversion (Fig. 1). Some errors inevitably persist in our calculations, primarily relating to measurement error, geometrical distortions originating from changing interval velocity with depth, and burial-related compaction of sedimentary strata. We find that the measurement errors are negligible and nonsystematic and, therefore, have a negligible effect on the overall throw distribution along faults. Errors associated with interval velocity changes and sediment compaction also have only a minor influence as lithologies do not drastically change along strike of our throw-length plots. Furthermore, we focus on the overall throw patterns along the fault rather than specific values, with the former unaffected by any potential changes in interval velocity or compaction of the strata. We calculated throw-length plots for the acoustic basement, base Jurassic unconformity, and top Jurassic horizons, as these were almost fully preserved in both the hangingwall and footwall of the Farsund North Fault (Fig. 1). The top Jurassic horizon is missing in the footwall of the fault in some areas due to erosion below the base Pleistocene unconformity; estimates of throw at this stratigraphic level therefore represent a minimum estimate. No Triassic strata are preserved on the upper terrace of the Farsund Basin (Fig. 2a); in these areas the BJU forms a composite surface with the top acoustic basement. To quantify the magnitude of inversion experienced along the Farsund North Fault, we measured the amplitude of the fold, between the fold crest and a regional base level, at multiple stratigraphic levels. The base level was a projection of each stratigraphic horizon, taken from an area away from the fold and unaffected by folding.
3.4 Quantifying uplift and erosion
3.4.1 Seismic–stratigraphic analysis
To estimate the amount of uplift and erosion that occurred along the northern margin of the Farsund Basin, truncated stratigraphic horizons were projected above the base Pleistocene unconformity. By approximating their pre-erosion stratigraphic thickness, we can estimate the amount of missing strata and therefore erosion that occurred across the basin (Fig. 4). The top of the Cromer Knoll Group (Lower Cretaceous) represents the shallowest mapped horizon that is truncated by the base Pleistocene unconformity. This horizon is interpreted as the base of the syn-inversion sequence along the Stavanger Fault System, 100 km to the west (Fig. 2a) (Jackson et al., 2013). The deepest regionally mappable horizon truncated by the base Pleistocene unconformity is typically the acoustic basement. We measure uplift between the projections of these horizons, with the measurement taken at the truncation of the deeper horizon. However, in some areas we measure uplift at the Farsund North Fault to avoid assumptions about projected stratal thicknesses across the fault (Fig. 4). As a result, our seismic–stratigraphic technique provides only a minimum estimate of the amount of uplift. We provide two measurements of (minimum) inversion-related uplift along the basin margin by (1) projecting strata linearly from the immediate subcrop and (2) modifying the subcrop projections to take into account regional thickness changes within the underlying stratigraphic intervals (Fig. 4). These uplift calculations are based solely on geometrical projections of truncated strata and do not incorporate any decompaction of the projected strata. Upon burial, sedimentary strata are compacted; layers are thus thinner at their present burial depths than they were when deposited. Therefore, our uplift estimates based on the geometric projection of “compacted” sedimentary intervals, which is based on their buried rather than at-surface thicknesses, represent a minimum value only. We primarily use this technique to analyse the spatial distribution of uplift across the Farsund Basin in locations where no boreholes are available and where we therefore lack information on the present porosity of the intervals at depth. Although the estimated magnitude would change upon decompaction, the overall pattern of uplift will not be affected.
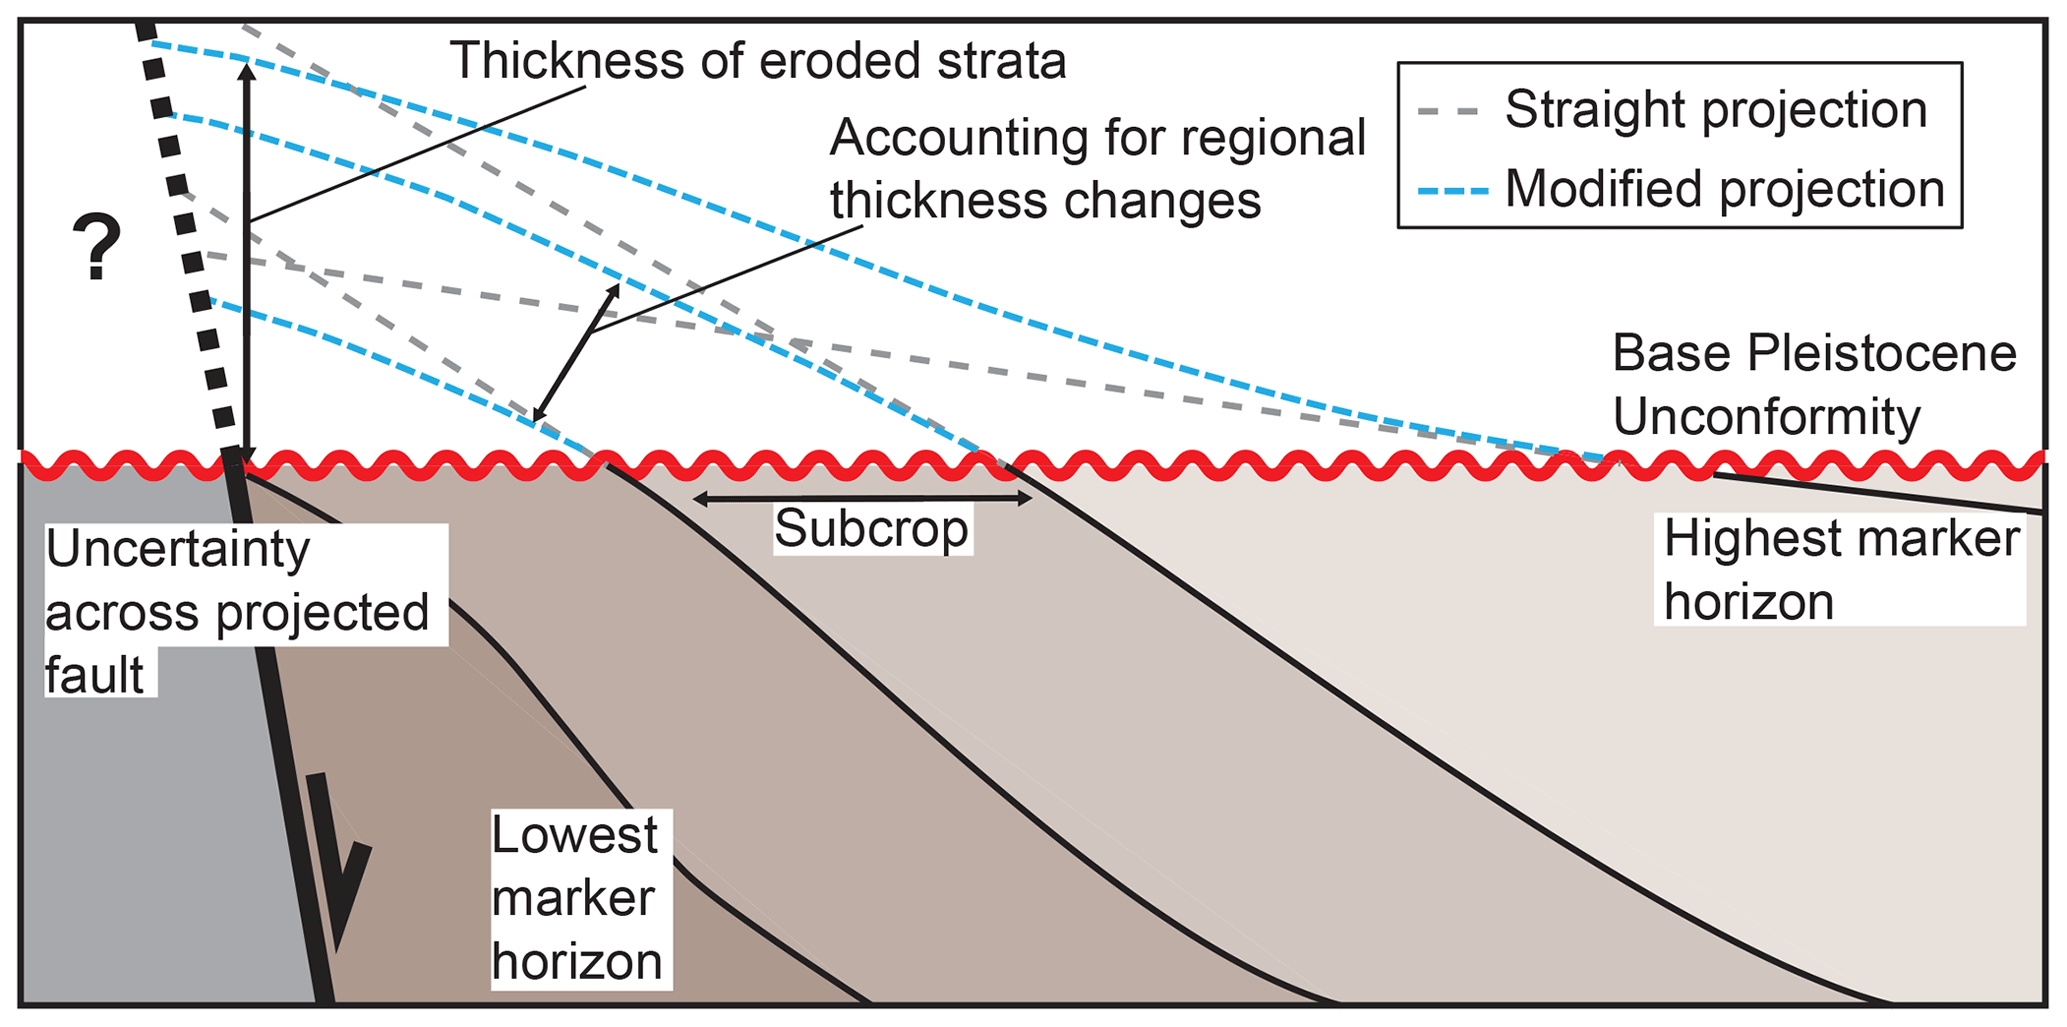
Figure 4Schematic diagram showing how uplift is calculated by projecting truncated stratigraphy above an unconformity. Uplift estimates based on straight and modified projections of strata are calculated. Where possible, measurements are taken at the largest possible value; however, projections are not calculated across faults.
3.4.2 Well-based compaction analysis
In addition to using seismic–stratigraphic techniques to estimate inversion-related, basin-scale uplift, we also utilise porosity–depth trends and compaction analyses from seven wells within and surrounding the Farsund Basin (Fig. 2a). This process is based on the recognition that due to mechanical compaction and diagenesis, sedimentary rocks lose porosity (∅) with increasing burial depth (z) (Magara, 1979; Sclater and Christie, 1980). This porosity loss is largely inelastic (Giles et al., 1998), meaning that if a rock is uplifted it will be overcompacted relative to its new depth of burial (Magara, 1979; Japsen, 1998; Japsen et al., 2007a). The net magnitude of vertical exhumation (EN) can hence be calculated by subtracting the porosity measured at present-day burial depth (Bpresent-day) from the maximum depth of burial (Bmax) (Corcoran and Doré, 2005) as follows:
Bmax is commonly predicted from porosity–depth relationships calibrated in settings characterised by continuous subsidence and progressive burial (Jensen and Schmidt, 1993; Doré and Jensen, 1996; Williams et al., 2005; Burns et al., 2007; Japsen et al 2007a; Tassone et al., 2014). Whilst such trends have been generated for discrete lithologies (e.g. Sclater and Christie, 1980), it is more accurate to use regionally calibrated relationships for specific stratigraphic intervals (Japsen et al., 2007b).
Here, we use porosity–depth data to estimate the exhumation of Lower Cretaceous mudstone and to quantify the magnitude of inversion-related basin-scale uplift. We used the Lower Cretaceous interval because it is the only mudstone-bearing interval encountered in all seven wells, where it varies in vertical thickness from 105 to 615 m. Six of these wells (10/8-1, 10/5-1, K1, F1, J1, and Felicia-1) were included in previous regional studies of basin exhumation, although different stratigraphic intervals (i.e. Late Cretaceous chalks) were used in these previous analyses (Japsen and Bidstrup, 1999; Japsen et al., 2007a). Well 11/5-1, which is located on the south flank of the Farsund Basin (Fig. 2a), has not previously been used for exhumation analysis and thus provides new constraints on inversion-related regional uplift of the Farsund Basin. No overpressure is identified in the Lower Cretaceous interval across any of the wells analysed in this study, and hence they are assumed to be hydrostatic; this is in agreement with other studies in the region (e.g. Japsen et al., 1998). In keeping with previous well-based studies of compaction in the region, we do not account for compaction due to the water column.
Two porosity–depth relationships have been proposed for Norwegian Shelf Cretaceous–Tertiary shales (Hansen, 1996), one linear and one exponential:
These relations represent the average Tertiary–Lower Cretaceous porosity–depth trend; scatter in the original dataset may relate to variations in grain size and the proportion of shale in the lithological column. Aside from compaction, local porosity–depth trends may also be affected by the mineralogy, palaeogeographic setting, and burial rate of the shales. In order to compare wells from different regions, we compare to this average porosity–depth trend, which largely smooths out these more local effects. Although both trends were derived statistically from porosity–depth data from 29 wells from areas that have not been uplifted (Hansen, 1996), we use the exponential relationship because it better conforms to rock physics models in that it does not predict negative porosities at depths greater than 3444 m, as is the case for the linear trend (Japsen et al., 2007b).
To compare well-log data to regional predictions of Bmax, slowness values (Δt, measured in microseconds per foot), measured by the sonic log, were converted into porosities using a regionally calibrated modification (Hansen, 1996) of the Wyllie time-average equation (Wyllie et al., 1956) as follows:
Given that this relationship is valid only for shales, sonic log readings of intra-Lower Cretaceous sandstone and limestone beds were identified (via the well report) and removed from the analysis; anomalous reading were likewise removed. Intra-shale porosities were then averaged over 5 m intervals and plotted against the depth (below the seabed) midpoint for this interval.
Following log editing and porosity estimations, we calculated net exhumation (EN) (Eq. 1) for each porosity–depth data point from each well. These EN estimates were then averaged to produce one exhumation estimate per well. Across the Farsund Basin, the base Pleistocene unconformity is overlaid by ∼100–200 m of sediments (∼156 m in 11/5-1) (Fig. 3). This indicates that any exhumation recorded by the Lower Cretaceous shales has been followed by further burial. If not properly accounted for, this post-uplift burial (BE) will obscure porosity-derived exhumation estimates. The following equation (Corcoran and Doré, 2005) was used to derive the gross exhumation (EG) from the net exhumation (EN):
In each well, BE was assumed to equal the vertical thickness of supra-base Pleistocene unconformity sediments. Our borehole-based compaction analyses provide spot measurements of uplift in the Farsund Basin and surrounding areas. We combined these results with those derived from the seismic–stratigraphic techniques described above, allowing us to determine how uplift varied spatially across the area.
The structural style of the northern margin of the Farsund Basin varies along strike (Fig. 5a). Early–Middle Jurassic strike-slip activity resulted in across-fault juxtaposition of different structural elements (i.e. the hangingwalls and footwalls of N–S striking faults), which were then extensionally offset by the Farsund North Fault during the Early Cretaceous (Phillips et al., 2018). Based on the structural elements in the hangingwall and footwall of the fault, we define four structural domains along the northern margin of the basin (Fig. 5a): (A) the western end of the Farsund North Fault, with the Eigerøy Horst in the footwall and the upper terrace of the Farsund Basin in the hangingwall; (B) a structurally complex zone along the Farsund North Fault with the Varnes Graben in the footwall and the upper terrace of the Farsund Basin in the hangingwall; (C) the eastern end of the Farsund North Fault, with the Varnes Graben in the footwall and the lower terrace of the Farsund Basin in the hangingwall; and (D) east of the Farsund North Fault, incorporating the eastern termination of the fault, with the Agder Horst in its footwall, and the Agder slope further east.
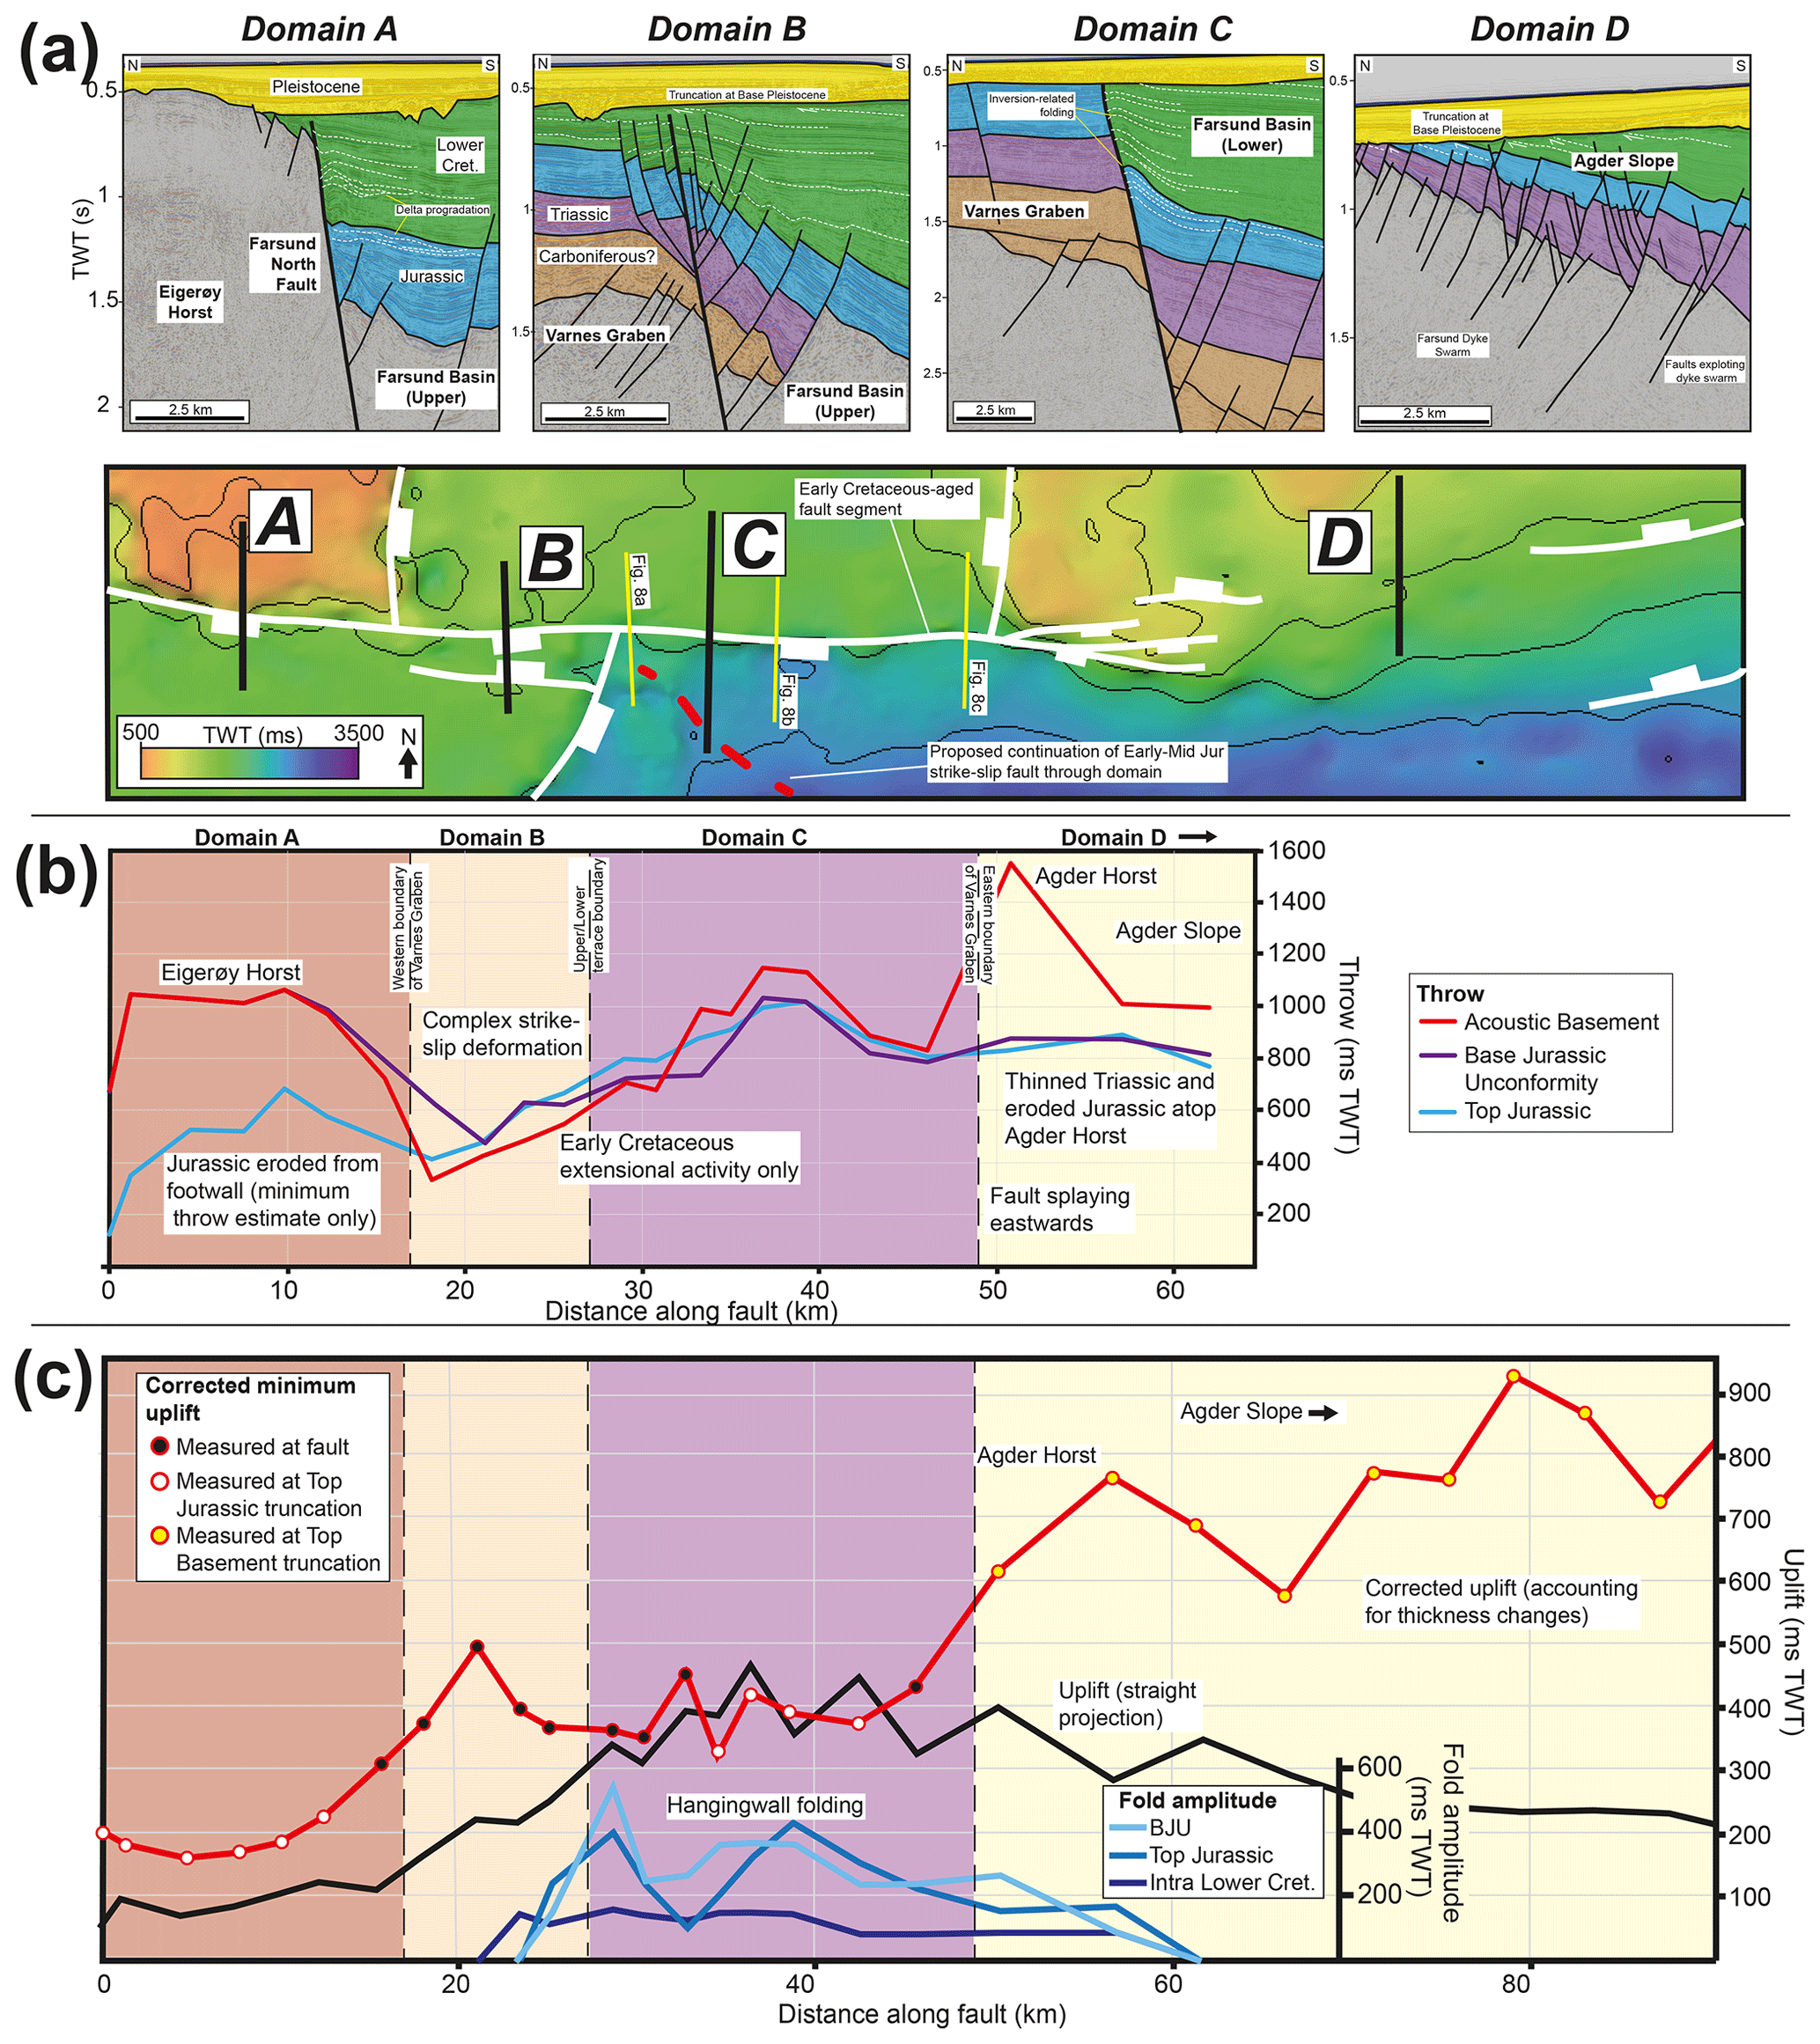
Figure 5(a) Two-way-time structure map of the acoustic basement horizon and seismic sections highlighting the characteristic structural style associated with each fault domain (a–d). Black lines show the location of individual domain sections, and the dashed red line indicates the potential continuation of the strike-slip fault in Domain C. (b) Throw-length profiles calculated across the Farsund North Fault for the acoustic basement, base Jurassic unconformity, and top Jurassic horizons. Background colours correspond to different domains. (c) Calculated uplift values (red and black) calculated along the northern margin of the Farsund Basin through the projections of truncated strata. Blue lines show the amplitudes of the hangingwall inversion folds at various structural levels.
4.1 Domain A – reactivation of an older fault?
No Triassic strata are present in Domain A due to erosion at the BJU (Fig. 5a). Throw across the equivalent acoustic basement and BJU horizons reaches a maximum of ∼1000 ms TWT in the centre of the domain. Throw across the top Jurassic horizon is ∼500 ms TWT, reaching a maximum of ∼600 ms TWT, although we note this represents a minimum throw estimate due to erosion of Jurassic strata across the Eigerøy Horst in the footwall of the Farsund North Fault (Fig. 5a). Early–Middle Jurassic strike-slip activity likely occurred along the fault in this area, although we are unable to determine the geometry of the strike-slip fault system due to erosion at the BJU (Phillips et al., 2018) (Fig. 5a). Earlier pre-Zechstein fault activity may also have occurred in this area, similar to that identified to the west in the Egersund Basin (Jackson and Lewis, 2013), although we are unable to confirm this. We identify a clinoform-bearing interval in the Upper Jurassic, likely related to the Farsund Delta system identified by Phillips et al. (2019). Further clinoform-bearing intervals are present in the Early Cretaceous succession; these may be locally sourced from erosion of the Eigerøy Horst. The Farsund North Fault and Lower Cretaceous strata in its immediate hangingwall are truncated by the base Pleistocene unconformity, indicating they have experienced some uplift. The lack of major hangingwall deformation suggests that the Farsund North Fault in this area experienced little to no reverse reactivation (Fig. 5a).
4.2 Domain B – complex strike-slip-related faulting
Domain B is characterised by a complex zone of faulting, consisting of a main central fault that is flanked by numerous antithetic and synthetic faults (Fig. 5a). Triassic strata are preserved in the footwall (i.e. the Varnes Graben) but eroded from the hangingwall (see Phillips et al., 2018). In contrast, Jurassic strata are continuous across the fault. Throw is constant (∼500 ms TWT) across the fault for all horizons (Fig. 5b). Cretaceous strata thicken from the footwall to hangingwall of the fault and are truncated at the overlying base Pleistocene unconformity. Phillips et al. (2018) estimated this domain experienced ∼10 km of sinistral strike-slip offset during the Early–Middle Jurassic, based on the offset of the N–S striking fault, which bounds the western margin of the Varnes Graben, and the N–S-striking fault, NS1, which partitions the Farsund Basin to the south (Phillips et al., 2018). We suggest that the proposed strike-slip fault continues westwards, along the present location of the Farsund North Fault, in Domain A. Further east, the Farsund North Fault shows only Early Cretaceous extensional activity, with no strike-slip precursor present along the fault in Domain C. Therefore, we suggest that the strike-slip fault continues in a NW–SE orientation, to the south of the Farsund North Fault (Fig. 5a). Phillips et al. (2018) documented a similar relationship along the southern margin of the Farsund Basin, where the strike-slip fault system is proposed to continue in a NW–SE orientation to the north of an Early Cretaceous fault segment, displaying a complementary relationship to that proposed here along the northern margin. The truncation of Lower Cretaceous strata beneath the base Pleistocene unconformity in Domain B suggests that some uplift and erosion have occurred.
4.3 Domain C – reverse reactivation and hangingwall folding
Triassic and Jurassic strata are isochronous and display relatively constant throw across Domain C (Fig. 5a, b). Throw increases from ∼600 ms TWT in the west to a maximum of ∼1100 ms TWT in the centre, before decreasing to ∼800 ms TWT at the boundary with the Agder Horst to the east (Fig. 5b). Unlike Domain B, we suggest that this area did not experience any Early–Middle Jurassic strike-slip faulting, with the strike-slip fault, collocated with the Farsund North Fault in Domain B to the west, continuing to the southeast, south of the Farsund North Fault, in Domain C (Phillips et al., 2018) (Fig. 5a). The Farsund North Fault in this area forms a planar structure that slipped only during the Early Cretaceous. Some antithetic faults in the hangingwall merge with the main fault plane at depth. A large anticline is present in the hangingwall of the Farsund North Fault in Domain C, the amplitude of which is greatest at the top of the Jurassic and decreases upwards (Fig. 5c). The amplitude of the fold also decreases towards the edges of Domain C, suggesting it is a pericline. Lower Cretaceous strata are truncated by the base Pleistocene unconformity and are not preserved on the footwall of the fault. Based on the stratigraphic relationships outlined above, we suggest that Domain C represents an Early Cretaceous segment of the Farsund North Fault. The throw maxima along the Farsund North Fault in Domains A and C suggest that the fault is formed of two linked segments separated by the complex deformation zone and strike-slip faulting within Domain B. We suggest that Domain C propagated away from the pre-existing strike-slip fault and this area of complex deformation (Domain B) during the Early Cretaceous, forming a new fault segment.
4.4 Domain D – basin uplift and erosion
Domain D is largely characterised by the S-dipping Agder Horst, which hosts numerous low-displacement, E–W-striking, N-dipping faults. At the western end of the domain, the Farsund North Fault terminates eastwards into numerous S-dipping splays; further eastwards propagation of the fault was potentially inhibited by the basement-hosted Farsund Dyke Swarm (Fig. 5a) (Phillips et al., 2017). Strata are progressively truncated northwards at the base Pleistocene unconformity, indicating long-wavelength basin-scale uplift and erosion (Fig. 5a).
5.1 Regional uplift and erosion
Strata along the northern margin of the Farsund Basin are variably truncated at the base Pleistocene unconformity. We here use compaction analyses and seismic–stratigraphic methods to quantify the amount and patterns of uplift driving this erosion.
5.1.1 Well-based compaction analyses
We plotted porosity–depth data from seven wells against the Lower Cretaceous compaction curve of Hansen (1996). This normal compaction curve, which assumes continuous burial and hydrostatic stress conditions, lies below data from each of the wells (Fig. 6a), indicating that overcompaction is present regionally. Porosity–depth data from each well show significant scatter, which is likely a result of minor lithological variations, possibly relating to temporal changes in palaeoenvironment. There are also likely to be lithological and mineralogical changes between wells. However, we interpret the regional and ubiquitous presence of overcompaction relative to the baseline to determine the magnitude of exhumation.
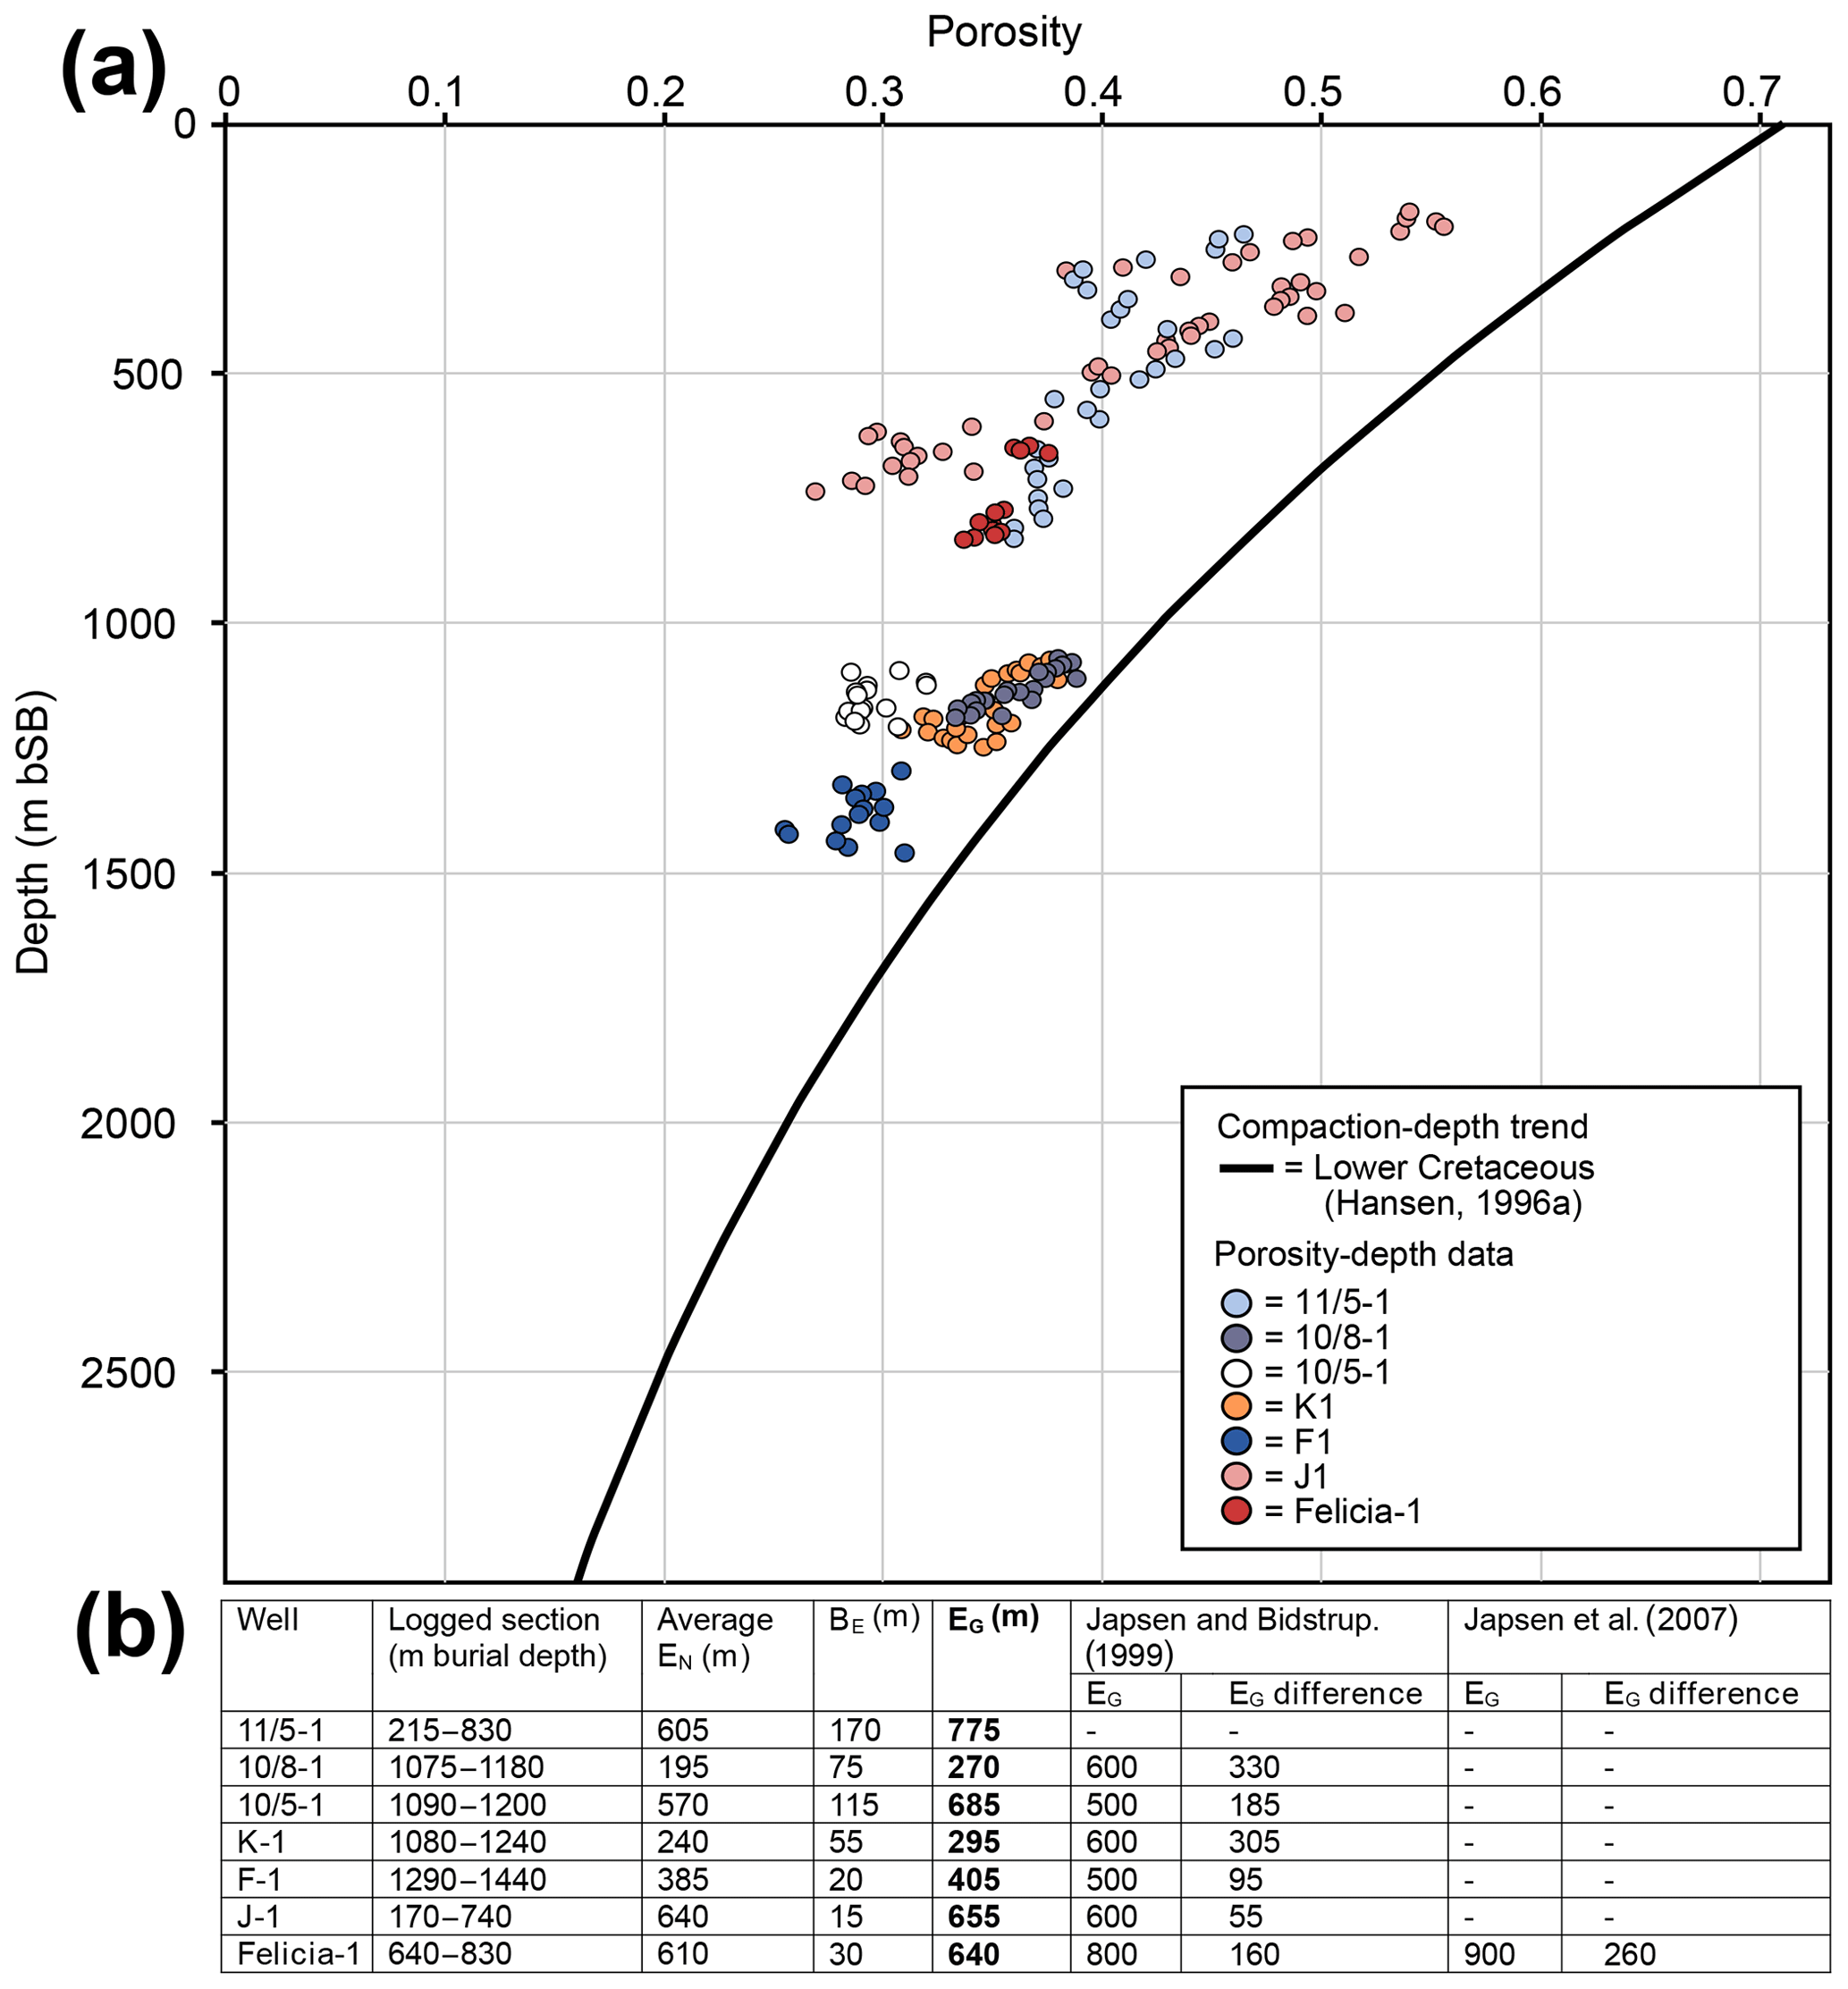
Figure 6(a) Lower Cretaceous porosity–depth data from seven wells in the region, including one from the Farsund Basin (11/5-1). Depth measured in metres below seabed (m bSB). A normal compaction curve for Norwegian Shelf Lower Cretaceous shales is also shown (Hansen, 1996). (b) Estimates of net exhumation (EN) and gross exhumation (EG), which takes into account the vertical thickness of supra-Pleistocene unconformity sediments (BE). Also shown are values of EG from earlier studies using different stratigraphic intervals from several of the same boreholes. The difference between these estimates of EG and those calculated in this study are shown (EG difference). See Fig. 2 for the locations of each of the wells.
Porosity–depth data cluster in two depth-intervals (170–825 m and 1080–1460 m depth; Fig. 6a). The shallower cluster contains data from wells 11/5-1, Felicia-1, and J1, all of which are located within the STZ (Fig. 2a). These wells record gross-exhumation values 647–775 m, with 11/5-1 recording the greatest amount of exhumation (775 m) (Fig. 6b). The deeper cluster contains data from wells 10/5-1, 10/8-1, F-1, and K-1; all of which are situated south of the Farsund Basin and STZ (Fig. 2a). Importantly, exhumation estimates from these wells are overall lower than those to the north, varying from 273–683 m. In this group, well 10/5-1, which is located closest to the STZ, records the highest gross exhumation (683 m), whereas wells 10/8-1, F-1, and K-1 record values of 270, 405, and 295 m respectively (Fig. 6b). In summary, our analyses show that the amount of exhumation increases towards the STZ (Fig. 2a); no well information is available north of the STZ.
5.1.2 Seismic–stratigraphic analyses
By projecting strata as a straight line based on the dip at the point they are truncated beneath the base Pleistocene unconformity, we estimate ∼100 ms TWT uplift in Domain A, increasing to a maximum of ∼400 ms TWT in Domain C. This value then decreases to ∼250 ms TWT across the Agder Slope (Fig. 5c). Our other technique, which varies the dip of the projected strata to account for underlying stratal geometries, suggests ∼200 ms TWT of uplift in Domain A increasing to ∼400 ms TWT in Domains B and C; these values are thus similar to those obtained using a straight projection method. Corrected projection measurements predict ∼800 ms TWT in Domain D (Fig. 5c). Here, the straight projection method underestimates uplift as truncated strata become more steeply south dipping to the north. Older strata progressively subcrop the base Pleistocene unconformity towards the north and east (Figs. 7, 8). Acoustic basement subcrops the base Pleistocene unconformity on the Eigerøy and Agder horsts, due to their location in the footwalls of the bounding faults of the Varnes Graben. The ages of strata subcropping the base Pleistocene unconformity also increases northwards across the Agder Slope. Jurassic and Lower Cretaceous strata subcrop the base Pleistocene unconformity in the Varnes Graben (Fig. 8). The increase in erosion to the north and east, combined with the projections of truncated strata, suggests that the magnitude of the causal uplift increases in these directions. Uplift particularly increases eastwards past the eastern termination of the Farsund North Fault (Domain D). As no fault is present here, long-wavelength, regional uplift appears to represent the main mechanism operating in this domain (Fig. 7).
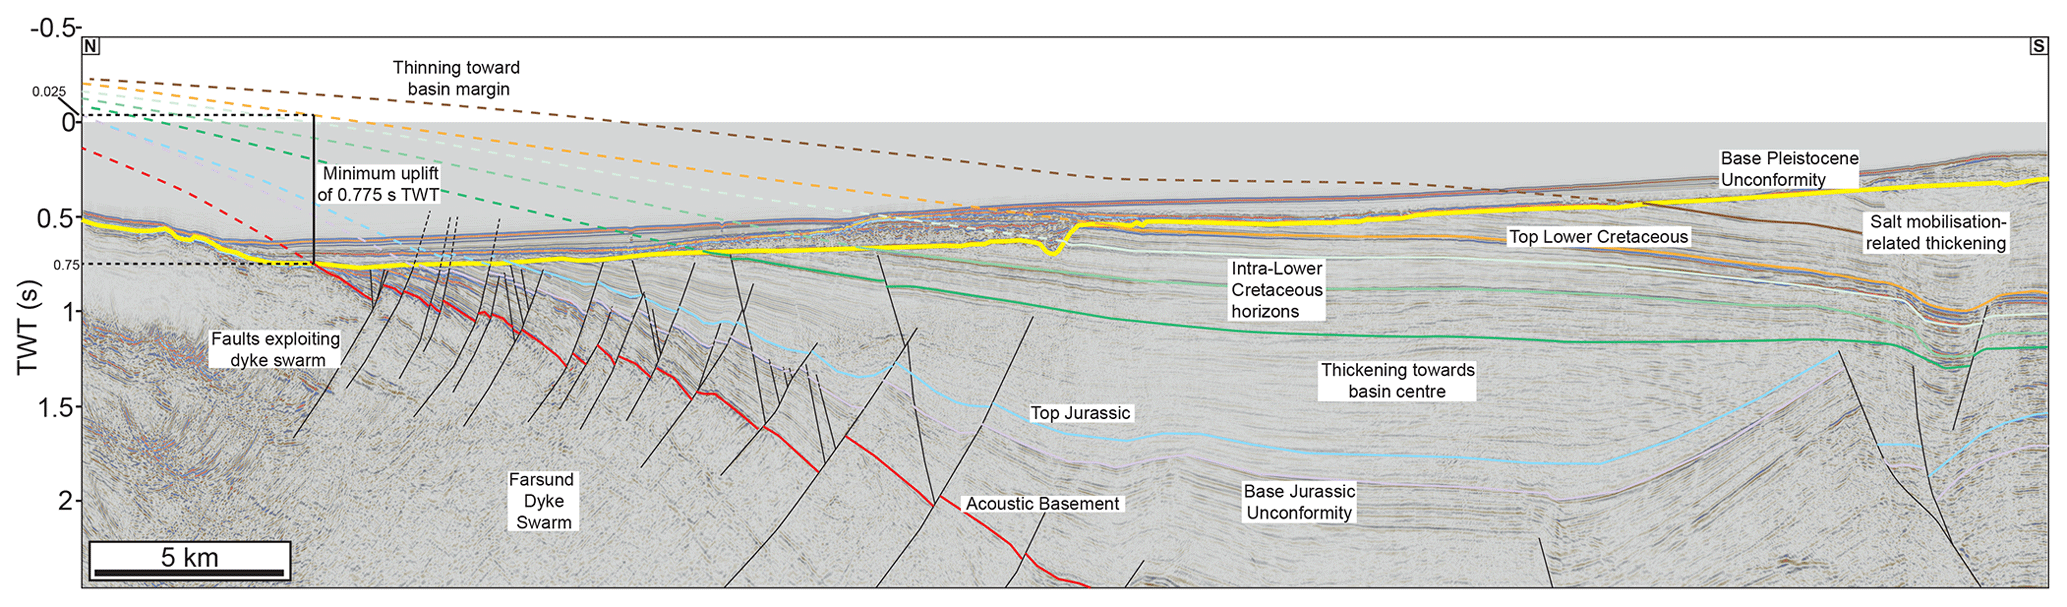
Figure 7Interpreted seismic section across the Farsund Basin and Agder Slope, showing subcrop projections, taking into account underlying stratal geometries, and associated uplift. See Fig. 2 for location.
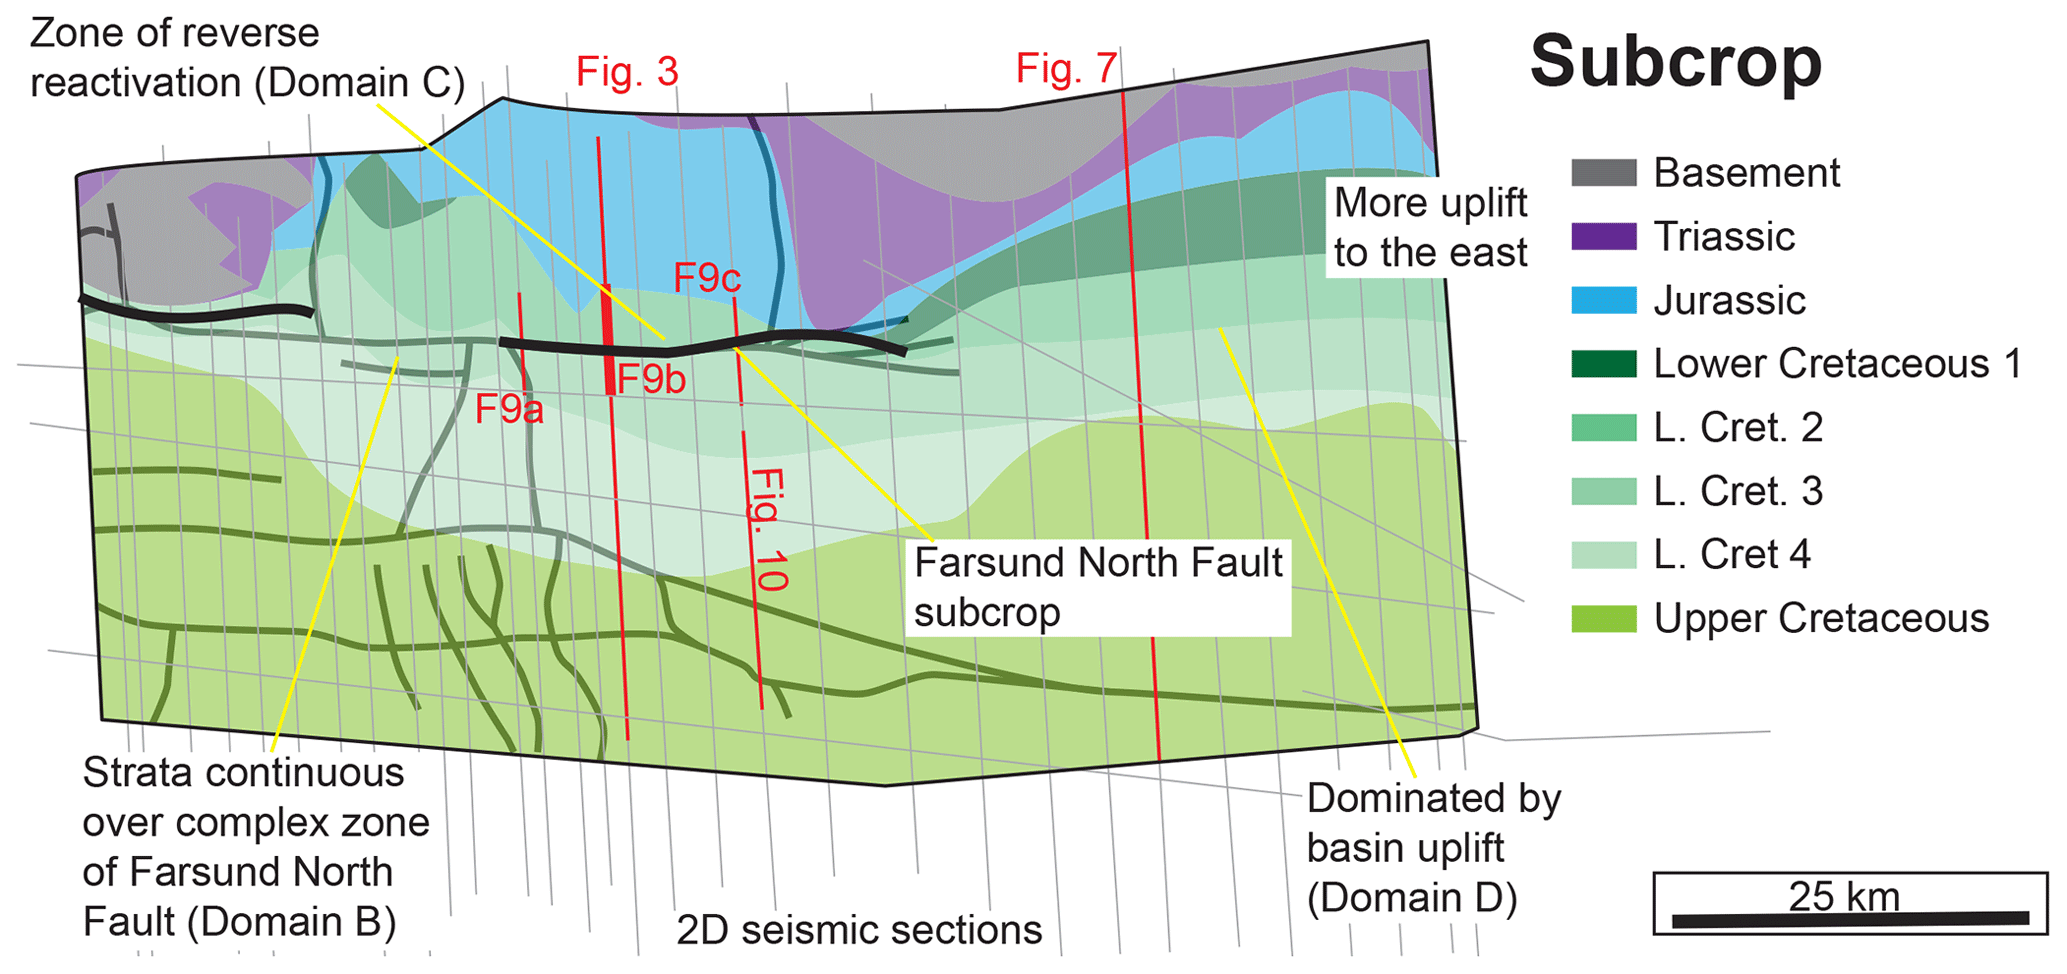
Figure 8Subcrop map across the Farsund Basin at the base Pleistocene unconformity. Black lines show the locations of faults that are truncated by the base Pleistocene unconformity; thick grey lines show fault geometries at the acoustic basement level. Thin grey lines show the location of 2D seismic sections used to create the map, with those referred to elsewhere in the study in red.
5.2 Evidence for fault reactivation
A prominent hangingwall anticline occurs in Domain C of the Farsund North Fault (Figs. 5a, 9). The fold incorporates Upper Triassic to Lower Cretaceous strata, before it is truncated upwards by the base Pleistocene unconformity (Fig. 9). The fold is ∼35 km long, extending from the westernmost part of Domain B in the west and terminating to the east next to the Agder Horst in Domain D (Fig. 5a, c). The amplitude of the fold is greatest in the middle of Domain C (∼200 ms TWT), decreasing to zero at its lateral terminations. The amplitude of the fold varies with depth; it is similar at top Jurassic and base Jurassic unconformity levels (∼150 ms TWT), decreasing upwards into the Lower Cretaceous (∼80 ms TWT) (Fig. 5c). The fold is typically tightest close to or just above the top of the Jurassic, where it is often deformed by normal faults at its hinge (Fig. 9a). Although the absolute fold amplitude will be affected by compaction of strata, we suggest that this will not alter how the amplitude changes along strike and with depth, i.e. that fold amplitude is greatest at the centre of the fold and at depth. Lower Cretaceous strata thin by up to 50 % onto the hangingwall-facing limb of the fold and often onlap onto this limb at deeper levels (Fig. 9b, c).
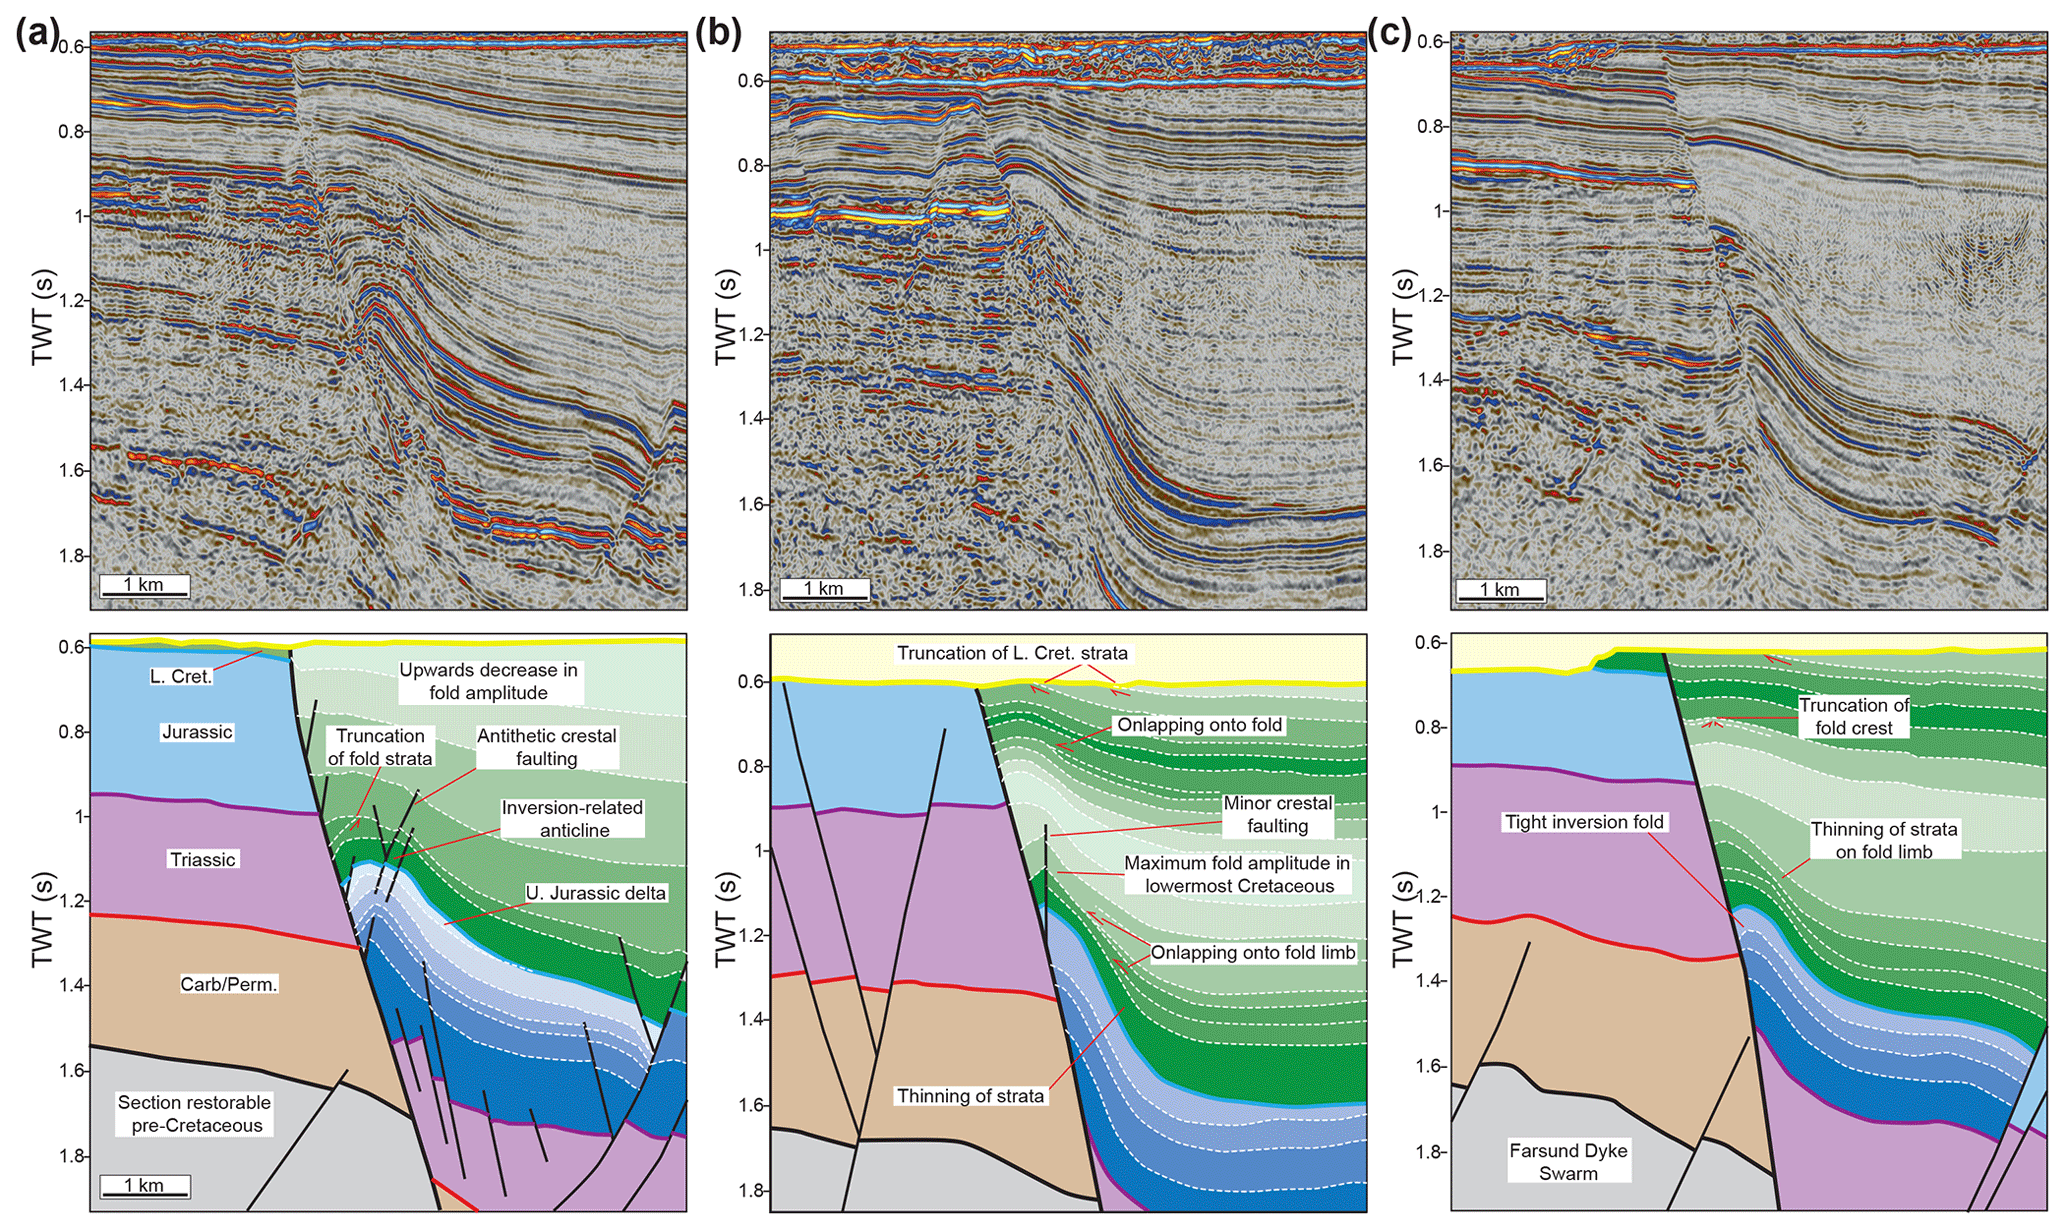
Figure 9Uninterpreted and interpreted seismic sections highlighting the along-strike variability in fold geometry within Domain C. See Fig. 5a for locations. (a) Fold geometry in the west of Domain C showing a hangingwall anticline which decreases in amplitude upwards. (b) Section from the centre of Domain C; note how lowermost Lower Cretaceous strata onlap onto the limb of the fold at deeper levels. (c) Section from the east of Domain C; note how Lower Cretaceous strata thin onto the limb of the fold at deeper levels.
Stratigraphic thinning and onlap onto fault parallel hangingwall folds are characteristic of extensional growth folds (also known as “fault-propagation folds” or “forced folds”; see review by Coleman et al., 2019). These folds, which are initially expressed as basinward-facing monoclines, typically form above the propagating upper tip lines of blind normal faults (Mitra and Islam, 1994). These folds are subsequently breached during subsequent fault slip and tip propagation. However, in the Farsund Basin, the fault-parallel fold is anticlinal as opposed to monoclinal, suggesting that this is not the cause of the folding. Anticlinal fault-parallel hangingwall folds may form as fault-bend folds due to changes in fault dip (e.g. Suppe, 1983; Withjack and Schlische, 2006). However, we discount such an origin here due to the relatively planarity of the fault and lack of major dip changes (Fig. 9).
Based on the observations outlined above, we interpret the fault-parallel hangingwall fold as an inversion-related anticline (e.g. Dart et al., 1995; Lowell, 1995; Turner and Williams, 2004; Yamada and McClay, 2004). No null point is identified along the fault, with all horizons displaying net extension, indicating the magnitude of the initial extension was much greater than the subsequent inversion. Due to erosion at the base Pleistocene unconformity, the crest of the fold and any associated growth strata are not preserved, providing no direct constraints on the timing of fold formation or causal inversion (Figs. 1, 9). However, the folding (and inversion) must have occurred post-Early Cretaceous, given Lower Cretaceous strata are incorporated in the fold (Fig. 9).
We also identify a minor graben in the centre of the Farsund Basin, bound by faults that span a depth range of ∼1000 ms TWT in the thickest part of the Lower Cretaceous syn-rift succession (Fig. 10). These faults are basement detached, terminating downwards at ∼1500 ms TWT and upwards, either within the upper levels of the Lower Cretaceous interval or by truncation at the base Pleistocene unconformity (Fig. 10). They are associated with relatively low displacements (∼10–20 ms TWT) that are greater at shallower levels (∼20 ms TWT). At depth, fault displacements are typically below seismic resolution, but the faults can be identified by clear fault plane reflections (Fig. 10).
We interpret these structures as outer-arc flexural faults formed in response to basin compression and related hangingwall buckling (e.g. Panien et al., 2005, 2006). The decrease in throw with depth suggests arching of the basin fill, whilst their relatively uniform termination depth may define the fold neutral surface, with areas above under extension and below under overall compression (Fig. 10). A ∼65 ms TWT thick clinoform-bearing interval is present at ∼750 ms TWT in the Lower Cretaceous interval, prograding basinwards from the southern margin of the basin (Fig. 10). The presence of basinwards prograding clinoforms indicates that the basin still represented a depocentre at that time.
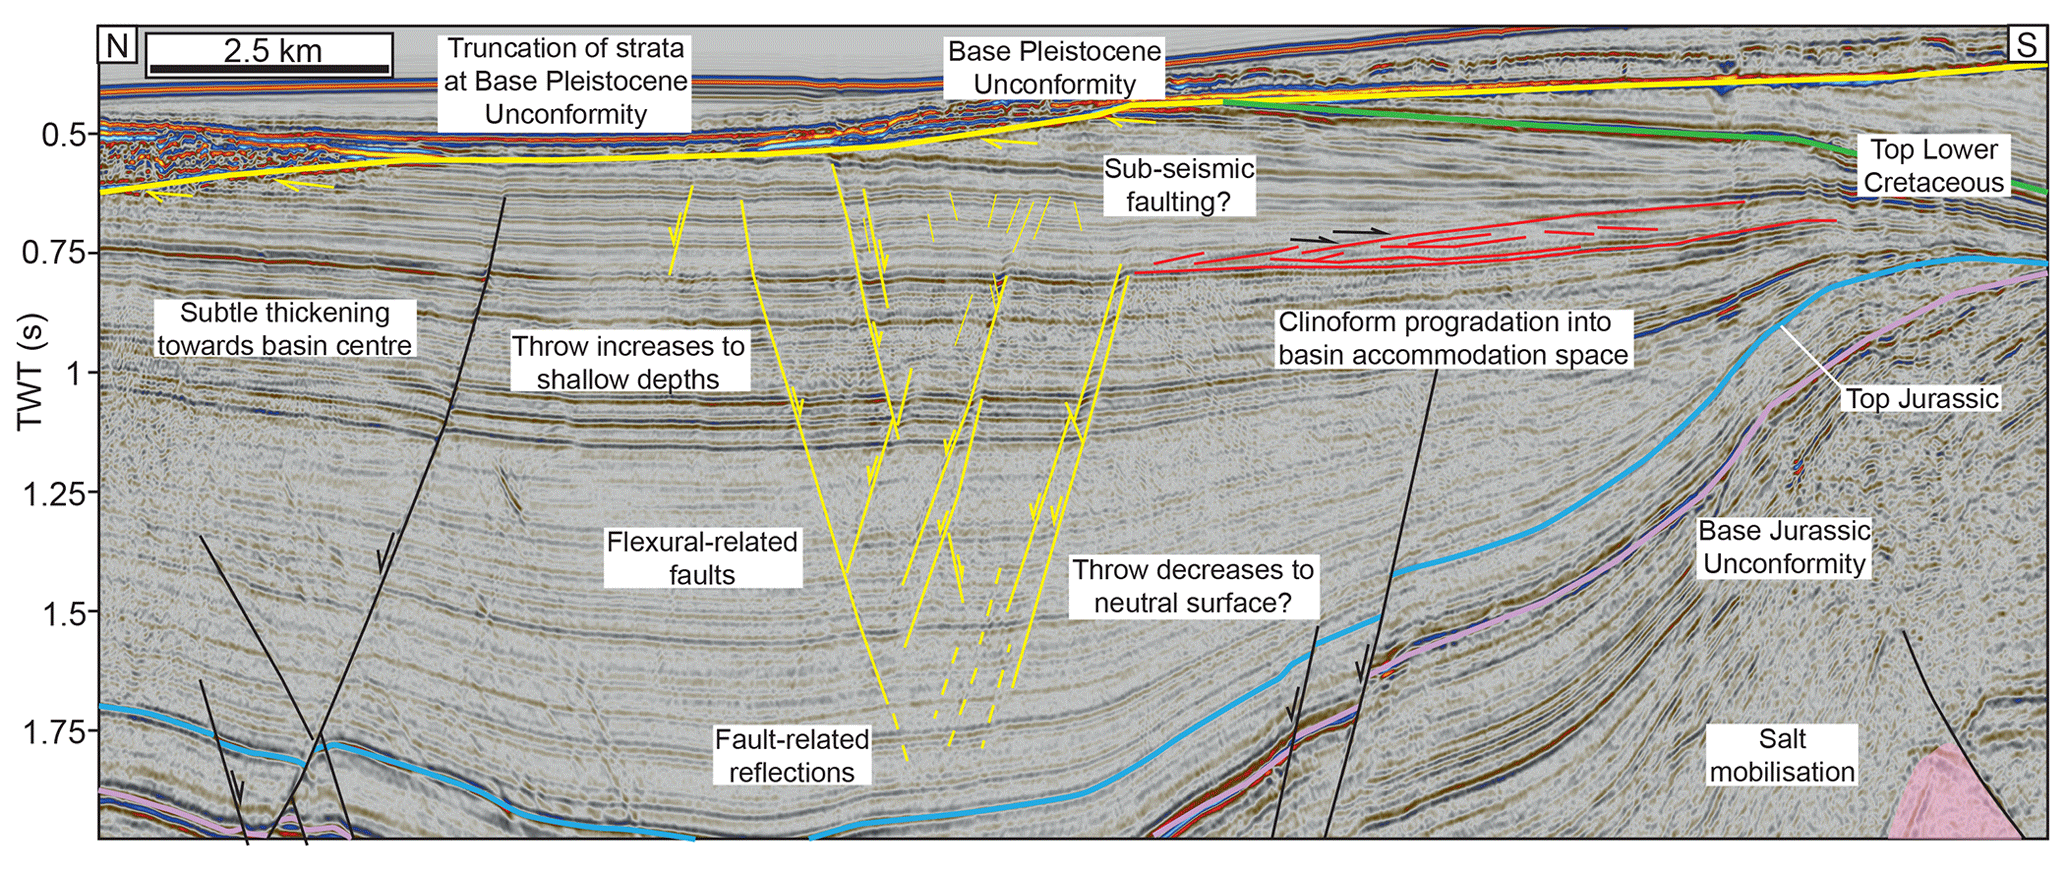
Figure 10Interpreted seismic section across the centre of the Farsund Basin. See Fig. 2 for location. Lower and Upper Cretaceous strata are truncated at the base Pleistocene unconformity, and a series of low-displacement faults are developed in the centre of the basin.
6.1 Structural styles and expression of inversion
Inversion-induced hangingwall folding only occurs locally along the eastern segment of the Farsund North Fault (Domain C), with little direct evidence for reverse reactivation being observed elsewhere (Fig. 5a). The fault in Domain B is characterised by a complex zone of deformation formed during Early–Middle Jurassic strike-slip faulting (Phillips et al., 2018); this domain is located between two segments of the Farsund North Fault of potentially differing ages (Fig. 5a). The eastern fault segment (Domain C) only initiated in the Early Cretaceous, with Carboniferous–Permian strata being isopachous across the fault (Fig. 3). The western segment of the Farsund North Fault (Domains A and B) was also active during Early Cretaceous extension, and may have been active as a strike-slip structure during the Early–Middle Jurassic (Phillips et al., 2018) and, potentially, as a normal fault during the Carboniferous–Permian activity along the Sorgenfrei-Tornquist Zone (e.g. Skjerven et al., 1983; Mogensen, 1994; Erlström et al., 1997). However, we are unable to confirm this due to a lack of preserved strata (Fig. 5a). Similarly, along the southern margin of the Farsund Basin, the Fjerritslev South Fault was inactive prior to the Early Cretaceous extension, at which time it propagated westwards from a pre-existing segment of the fault that had previously experienced strike-slip motion (Fig. 2a) (Phillips et al., 2018). We also suggest that the Farsund North Fault propagated eastwards in the Early Cretaceous from an area where a pre-existing, previously strike-slip fault segment was present (Domains A and B). The eastern segment (Domain C) thus represents the youngest – and accordingly the least complex – section of the Farsund North Fault, forming a simple planar structure (Fig. 9). We suggest that the relatively simple geometry of the eastern segment of the Farsund North Fault caused it to undergo preferential reverse reactivation during Late Cretaceous compression. Whilst other sections of the fault may have been weaker, they were not reactivated due to their more complex geometry, related to their prior evolution and segmentation. Similar links are made between highly deformed and complex fabrics within shear zones (such as those typified by recumbent and isoclinal folding); in these settings, the lack of major fault exploitation during subsequent extension reflects the complexity of the shear zone fabric, which may inhibit lateral fault propagation (Morley, 1995; Salomon et al., 2015). Along the Farsund North Fault, local stress field interactions between different structures and fault segments may result in an obscuring of any pervasive anisotropy, inhibiting strain localisation and therefore reactivation.
Typically, during reverse reactivation, pre-inversion strata in the hangingwall of the fault are folded into an inversion-related anticline of constant amplitude with depth (Fig. 1) (Mitra and Islam, 1994; Lowell, 1995; McClay, 1995). However, observations of the eastern segment of the Farsund North Fault (Domain C) diverge from this, with fold amplitude decreasing towards shallow depths (Figs. 5c, 9). Some of this decrease in amplitude may be attributed to the interplay between the folding of competent and incompetent units in the fold core. More competent units will deform via folding and maintain a constant thickness, whereas less competent units will not maintain thickness and may be extruded from the core of the fold. The increased compaction of deeper buried strata would result in a potential decrease in fold amplitude with depth, the opposite to that observed in the Farsund Basin (Fig. 5c). The Lower Cretaceous interval comprises relatively homogeneous siltstones, with no major changes in lithology and competency expected. Although lithologies do vary within the Jurassic interval (Phillips et al., 2019), this does not correlate to the location of the change in fold amplitude (Fig. 9). Furthermore, the magnitude of the amplitude change is likely too large to be explained by the mechanical properties of the strata alone.
Along the Farsund North Fault, strata within the lower sections of the Lower Cretaceous interval onlap folded strata within the inversion anticline and thin onto the hangingwall limb of the fold (Fig. 9). These stratal relationships suggest some relief at the free surface in the hangingwall of the Farsund North Fault during Early Cretaceous faulting. Fault propagation folding of Jurassic and Early Cretaceous strata occurs along the southern margin of the Farsund Basin, associated with Early Cretaceous faulting (Phillips et al., 2018); we suggest that the Farsund North Fault may have experienced similar fault-propagation folding during Early Cretaceous extension.
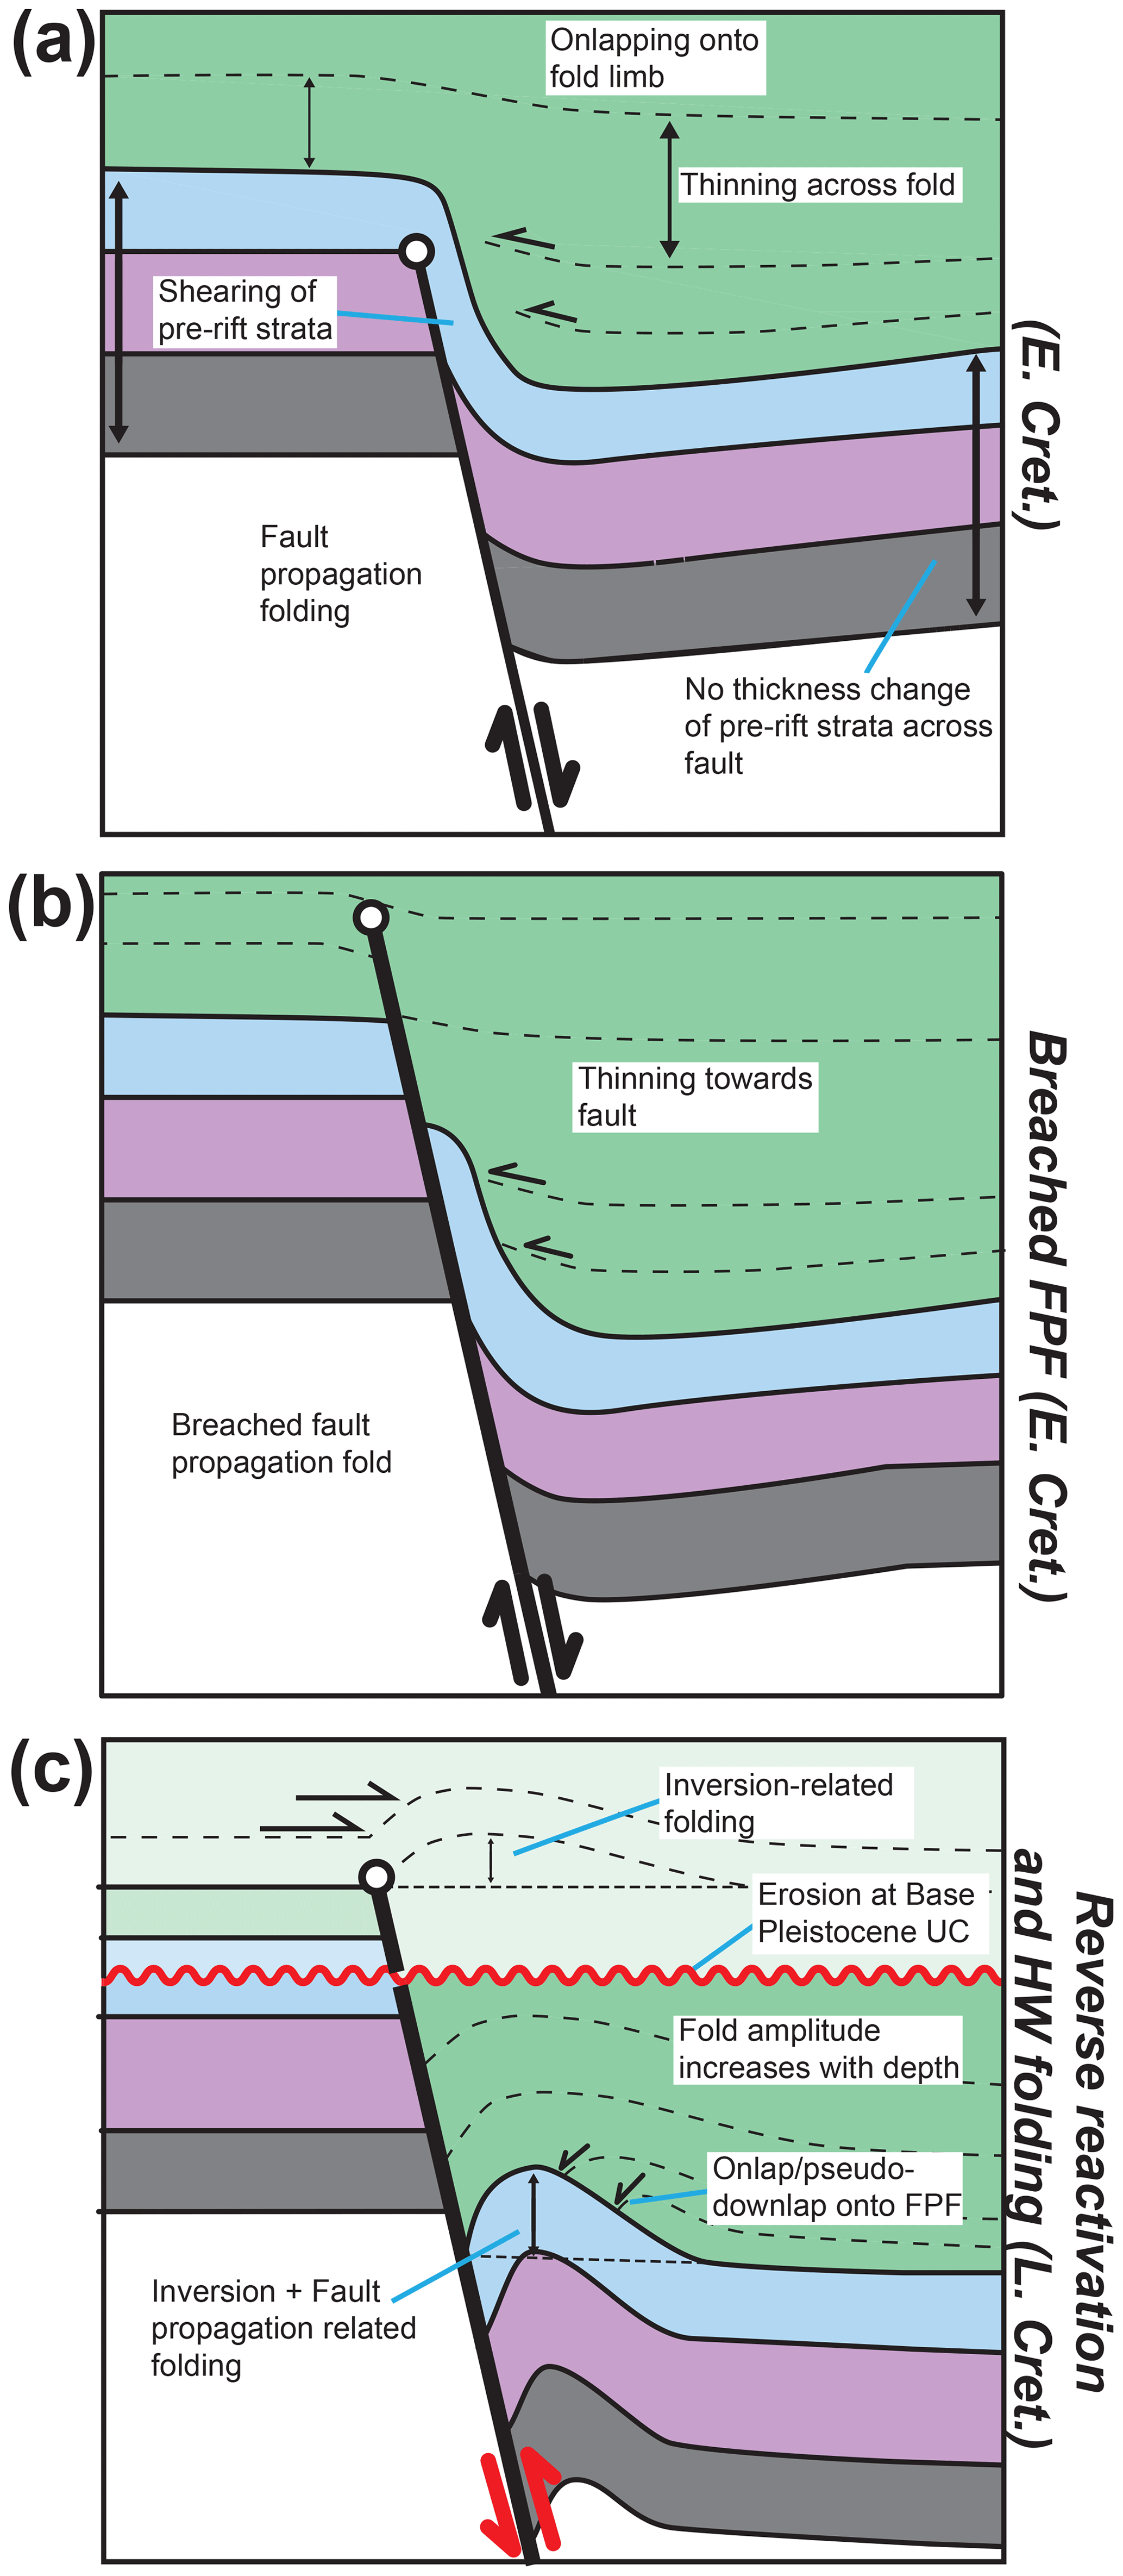
Figure 11Schematic model illustrating the inversion of a pre-existing fault propagation fold. (a) An initial stage of fault propagation folding occurred during Early Cretaceous slip along the fault. Lower Cretaceous strata onlap onto the basinward-facing limb of the fold. (b) Following further slip along the fault, the fault propagation fold becomes breached. (c) Reverse reactivation of the fault and folding of hangingwall strata occur during the Late Cretaceous. At shallow depths, this creates an inversion-related monocline, whereas at greater depths, the pre-existing monocline is tightened, forming a composite Early Cretaceous fault propagation and Late Cretaceous inversion-related fold.
Based on the variable fold amplitude and stratal relationships within the hangingwall of the Farsund North Fault, we propose the following model to explain the structural style of the inversion-related anticline. The eastern segment of the Farsund North Fault (Domain C) formed as a new structure, propagating eastwards away from the pre-existing strike-slip fault during Early Cretaceous extension (Figs. 2a, 5a). This extension was associated with fault propagation folding of Jurassic and lowermost Lower Cretaceous strata; the fault propagation fold was subsequently breached and buried within the uppermost Lower Cretaceous succession (Fig. 11a, b). During Late Cretaceous compression, folding of near-fault strata within the upper parts of the Lower Cretaceous succession produced a ∼60 ms TWT amplitude inversion-related anticline in the immediate hangingwall of the fault (Figs. 5c, 12c). However, at deeper structural levels, where pre-inversion strata were already folded, the initial monoclinal fold was tightened and rotated, forming a higher-amplitude, inversion-related anticline (Fig. 12c). The amplitude of the resultant composite fold at depth thus reflects both the Early Cretaceous fault propagation folding and the subsequent Late Cretaceous inversion, similar to fold structures produced by Mitra and Islam (1994). Towards the lateral terminations of the fold, at the boundaries of Domain C, we observe a more monoclinal fold geometry (Fig. 9c). We speculate that the centre of the fault is likely weaker than the fault tips and therefore easier to reactivate under compression (Reilly et al., 2017; Rodriguez-Salgado et al., 2019). As a result, the fault tips typically experience less reverse reactivation than in the fault centre, thus preserving more of the earlier monoclinal fold geometry in the former location.
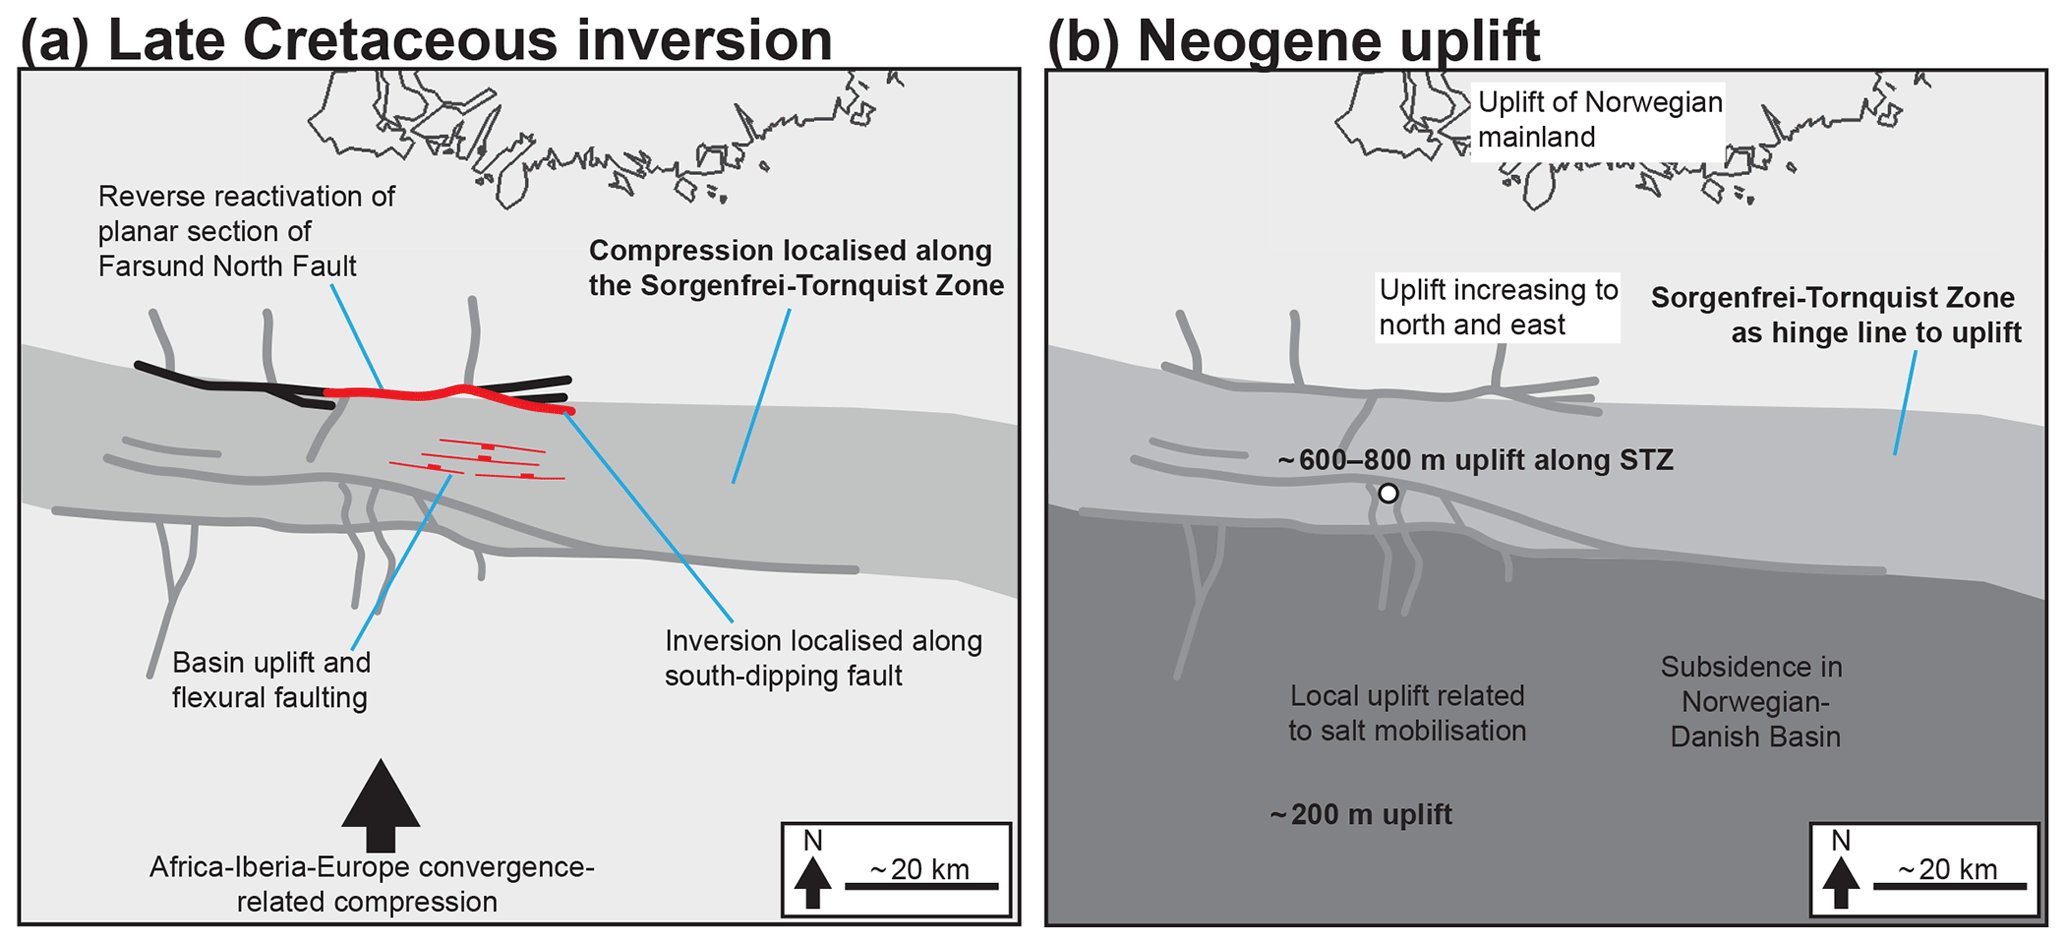
Figure 12The different styles by which compressional stresses are expressed along the Sorgenfrei-Tornquist Zone throughout Late Cretaceous and Neogene events. (a) The STZ localises compression originating from the south, at upper-crustal depths, this is buttressed against the Farsund North Fault via reverse reactivation and long-wavelength folding of hangingwall strata. (b) The STZ acts as a hinge line during the Neogene, separating areas of relatively low uplift in the Norwegian–Danish Basin, from the areas of relatively high uplift further north towards the Norwegian mainland.
6.2 Temporal and spatial partitioning of inversion styles
The Farsund Basin experienced a period of shortening during the Late Cretaceous followed by pulses of regional uplift throughout the Cenozoic, largely during the Palaeogene and Neogene (Hansen et al., 2000; Gemmer et al., 2002; Kalani et al., 2015; Kley, 2018). During these events, various deformation mechanisms were spatially partitioned across the Farsund Basin; regional uplift occurred across the whole of the northern basin margin (Fig. 7); the Farsund North Fault underwent local reverse reactivation (Fig. 9), and the basin fill was buckled into an open long-wavelength anticline (Fig. 10). Due to truncation of syn-inversion strata at the base Pleistocene unconformity, we cannot directly assign these different mechanisms to the Late Cretaceous or Palaeogene–Neogene events.
Late Cretaceous compression is related to convergence between Africa, Iberia, and Europe, with three distinct compressional pulses recognised in the Danish area during the Late Cretaceous and Palaeogene (Kley and Voigt, 2008; Hansen et al., 2000; Gemmer et al., 2002). Within the upper crust, the STZ is defined by a zone of Late Cretaceous shortening (e.g. Pegrum, 1984; Liboriussen et al., 1987; Michelsen and Nielsen, 1993; Mogensen and Jensen, 1994; Deeks and Thomas, 1995; Mogensen, 1995; Bergerat et al., 2007). Along the Tornquist Zone, Late Cretaceous inversion is expressed via numerous mechanisms, including reverse fault reactivation (Krzywiec, 2002), transpression (Deeks and Thomas, 1995), and basin-scale compression and uplift (Liboriussen et al., 1987; Erlström et al., 1997; Hansen et al., 2000). Late Cretaceous inversion has also been observed westwards along strike of the STZ in the Egersund Basin (Pegrum, 1984; Sørensen et al., 1992; Phillips et al., 2016), where inversion of the Stavanger Fault System initiated during the Coniacian (∼86.3 Ma) to Santonian (∼82.6 Ma) and continued until the Maastrichtian (∼66 Ma) (Jackson et al., 2013). Inversion was relatively mild in the Egersund Basin, producing inversion-related folds of 300–450 m amplitude (Jackson et al., 2013). In comparison, the degree of inversion accommodated by hangingwall folding along the Farsund North Fault produces an inversion anticline that has an amplitude of ∼80 ms TWT at shallower depths. We suggest the amplitude of the fold at shallow depths is more representative of the structural style forming during Late Cretaceous shortening, with the amplitude of the fold at greater depths accentuated by earlier fault propagation folding (Fig. 11 – see above). Comparison with inversion along the Stavanger Fault System in the adjacent Egersund Basin suggests that the Farsund Basin also experienced mild shortening during the Late Cretaceous. Some components of inversion within the Farsund Basin may also have been partitioned into regional uplift and long-wavelength folding of the basin fill, as well as the reverse reactivation of the previously extensional normal faults and associated hangingwall folding.
Based on similarities in the magnitude and style of inversion between the Farsund and Egersund basins, we suggest that the reverse reactivation of the Farsund North Fault likely occurred during the Late Cretaceous. Long-wavelength folding of the basin fill, the formation of outer-arc flexural faults within the basin, and the formation of Tornquist Zone-adjacent Late Cretaceous depocentres resembles the long-wavelength folding and basin inversion observed elsewhere along the Tornquist Zone (Fig. 10) (Liboriussen et al., 1987; Japsen et al., 2002), also suggesting this deformation is Late Cretaceous. At this time, the Farsund North Fault acted as a buttress to Late Cretaceous compression, undergoing reverse reactivation and folding in the immediate hangingwall with simultaneous long-wavelength folding and uplift of the basin fill (Fig. 12a).
As well as reverse fault reactivation and long-wavelength folding of the basin fill, the entire northern margin of the Farsund Basin was uplifted, as is evident from subcrop projections (Fig. 7). In contrast to Late Cretaceous compression, this uplift is not buttressed by the Farsund North Fault, increasing north and east towards the Norwegian mainland and across the Agder Slope (Fig. 5c). Some of this uplift may be attributed to Late Cretaceous compression, although we are unable to distinguish between this and later uplift due to a lack of preserved post-Late Cretaceous strata (Fig. 7). Offshore southern Norway, Palaeogene–Neogene uplift has been proposed to be related to the uplift of the South Scandes Dome beneath southern Norway to the north, exposing Proterozoic basement on shore, and uplift of the South Swedish Dome beneath southern Scandinavia to the east (Jensen and Schmidt, 1992; Japsen et al., 2002). The distribution of these domes is consistent with observations of uplift from the Egersund Basin (Kalani et al., 2015) and our observations of the increase in uplift to the north and east being related to the South Scandes and South Swedish domes respectively.
6.3 Localisation of inversion along pre-existing structures
The STZ may act as a weak buffer zone to regional tectonic stresses, effectively shielding the cratonic lithosphere of the Eastern European Craton to the north and east (e.g. Berthelsen, 1998; Hansen et al., 2000; Mogensen and Korstgård, 2003). During Late Cretaceous compression, the pronounced change in lithospheric thickness and properties across the zone localises far-field stresses originating from the south associated with the convergence between Africa, Iberia, and Europe (Fig. 12a) (Kley and Voigt, 2008). Such long-lived and lithosphere-scale structures, upon which strain can localise, are lacking in the relatively young lithosphere beneath central and western Europe and the North Sea (Pharaoh, 1999). How this compression localises along various parts of the STZ is largely governed by the structural style and pre-existing rift physiography present.
Numerical modelling has highlighted that deformation will localise along weak lithosphere-scale structures, such as the STZ (Gemmer et al., 2002). Far-field stresses focus along heterogeneities situated at great depths or spanning large depth ranges within the lithosphere. Structures within the mantle lithosphere can control the location of rifting in extensional settings (i.e. the Davis Strait in the Labrador Sea) and orogenic belts in compressional settings (i.e. the Ouachita orogeny, USA) (Heron et al., 2018, 2019). Rift basins may also form crustal-scale heterogeneities prone to inversion, even long after extension stops. Weaknesses developed at mid-crustal depths during rift-related crustal necking – or irregularities along the Moho – may prime rift systems for later inversion (Hansen and Nielsen, 2003; Buiter et al., 2009). Crustal-scale faults, such as those bounding the Farsund Basin, also weaken the lithosphere and increase the likelihood of basin and fault inversion during subsequent regional compression (Lie and Husebye, 1994; Hansen and Nielsen, 2003; Phillips et al., 2018). The relatively young, Early Cretaceous, age of the Farsund Basin and the relatively short time between Early Cretaceous extension and Late Cretaceous inversion may also increase its propensity to be inverted when subject to compression (Huyghe and Mugnier, 1995). Specifically, the relatively young eastern segment of the Farsund North Fault, which initiated as a new fault during the Early Cretaceous, may have been more prone to reverse reactivation when subject to subsequent compression (Huyghe and Mugnier, 1995). Furthermore, the easterly trend of the Farsund North Fault, compared to the typical NW trend observed elsewhere along the STZ, may have been more optimally oriented for reactivation when subject to Late Cretaceous compression.
At the crustal scale, inversion preferentially occurs on larger structures that are typically weaker, having experienced more deformation (Reilly et al., 2017). The geometry and relative location of fault segments and systems within a larger fault array, as opposed to the inherent strength of the fault itself, form a primary control on whether and to what extent a structure will reactivate (Walsh et al., 2001; Reilly et al., 2017). Optimally located structures tend to increasingly localise strain, growing larger at the expense of smaller structures residing in “strain shadows”, which ultimately become inactive. The larger, typically more continuous structures are preferentially reactivated in later events. Although areas of the Farsund North Fault may have experienced more deformation and be weaker than other areas, they often display a more complex geometry than newly formed structures. For example, the eastern segment of the Farsund North Fault represented a single structure that formed a focal point for Late Cretaceous compression and underwent inversion; faults bounding the southern margin of the Farsund Basin were not inverted. The southwards dip of the Farsund North Fault, coupled with its crustal-scale geometry and location along the northern boundary of the STZ buttress, means the fault was ideally situated to accommodate Late Cretaceous compressional stresses and undergo reverse reactivation (Fig. 12a).
Whilst the STZ and the Farsund North Fault localise stresses during Late Cretaceous compression, this is not apparent during Palaeogene–Neogene uplift (Fig. 12). Uplift increases regionally from zero in the Norwegian–Danish Basin south of the study area, to 1000 m across the Skagerrak–Kattegat Platform to the northeast (Japsen et al., 2002). Based on basin modelling and regional borehole-based porosity analyses of Upper Cretaceous chalks, Japsen et al. (2002) proposed 600–800 m uplift along the STZ, consistent with our estimation of 775 m uplift in the Farsund Basin, based on borehole-based porosity analysis of the Lower Cretaceous interval penetrated in well 11/5-1. These values are also consistent with our estimates of uplift from the Felicia-1 (640 m) and J-1 (655 m) boreholes located further eastwards along the STZ. Uplift decreases southwards away from the STZ to around ∼300 m within the Norwegian–Danish Basin. Relatively high uplift values (∼400 m) are documented in the F-1 well (Fig. 2a), although this may in part relate to local salt mobilisation (Fig. 3). The regional south–north uplift gradient drastically increases at the STZ, as evidenced by the two clusters of uplift estimates from nearby wells; those wells situated atop the STZ typically experience 600–800 m uplift, whereas those further the south document only ∼300 m (Figs. 2a, 6a). Uplift within the STZ may be locally augmented by Late Cretaceous uplift related to fault reactivation and localised hangingwall uplift; however, as the uplift increases away from the STZ and the Farsund North Fault to the north and east, we suggest that any pre-Cenozoic (i.e. Late Cretaceous) uplift contributes only a negligible amount of uplift to the regional values. Locally, within the Farsund Basin, uplift increases northwards away from the STZ (Fig. 12b). To the east, where uplift also increases, the STZ rotates to strike NW–SE, such that east of Domain D may be located north of the STZ and uplift again increases. Rather than localising deformation as it does in response to Late Cretaceous compression, we suggest that the STZ represents a relative hinge line throughout the Palaeogene and Neogene uplift events (Fig. 12b), modulating and partitioning vertical motions in the Norwegian–Danish Basin to the south, from those larger motions occurring to the north, supporting the interpretation of previous regional studies (Japsen et al., 2007a, 2018).
In this study, we show how deformation may be expressed along a complex pre-existing structure via various mechanisms during Late Cretaceous shortening and Palaeogene–Neogene uplift events.
Late Cretaceous compression was accommodated via selective reverse reactivation of the Farsund North Fault, forming a prominent hangingwall anticline. This reactivation occurred along the relatively young and geometrically simple eastern segment of the fault, which propagated from a pre-existing structure during Early Cretaceous extension. We suggest that the likelihood of a structure to be reactivated and undergo inversion is not solely related to the size and “weakness” of the structure; the relative complexity of the structure also plays an important role. We find that the geometrically simple areas of the Farsund North Fault are preferentially inverted, whereas areas along strike with a more complex geometry that experienced a more protracted evolution typically do not localise strain and are not inverted. Late Cretaceous compression was also expressed as long-wavelength folding of the basin fill, buttressed against the Farsund North Fault, resulting in basin inversion and uplift and erosion.
We find that the geometry and prior evolution of a structure also influence the structural style of the resultant inversion-related structures. The presence of an extensional fault propagation fold, formed prior to inversion, along the Farsund North Fault results in the formation of an inversion-related hangingwall anticline that decreases in amplitude upwards. Fold amplitude at shallow depths reflects the inversion event and reverse reactivation of the fault, whereas fold amplitude at depth reflects both inversion-related and earlier fault propagation folding.
Following Late Cretaceous compression, the Farsund Basin experienced widespread uplift throughout the Palaeogene and Neogene related to uplift onshore Norway and Sweden. Based on borehole-based porosity analyses within the Farsund Basin and surrounding area, we find that uplift increased to the north and east of the basin, with relatively smaller amounts of uplift occurring in the Norwegian–Danish Basin to the south. To the east of the basin, where the Farsund North Fault was not present, this represents the only mechanism of uplift expressed in the basin.
Late Cretaceous compression localised along the lithosphere-scale STZ; in contrast, stresses associated with Palaeogene–Neogene uplift were not localised along the STZ, with the STZ instead representing a relative hinge line, separating areas of low uplift to the south, from relatively large amounts of uplift further north.
The Farsund North Fault along the northern margin of the STZ acted as a buttress to compression within the upper crust, with inversion expressed as reverse reactivation, long-wavelength hangingwall folding, and regional basin-scale uplift. At upper-crustal depths, the prior evolution and geometric complexity of a pre-existing structure play an important role in how and to what extent that structure may be reactivated during late compression.
The seismic data used throughout this study are publicly available for download via the DISKOS online portal (https://portal.diskos.cgg.com, DISKOS, 2020).
TBP is the primary author on this study, responsible for the interpretation and writing of the article. CALJ contributed to the genesis of the manuscript and the writing and editing of the article. JRN carried out to the borehole-based compaction analyses and contributed to the writing and editing of the article.
The authors declare that they have no conflict of interest.
This article is part of the special issue “Inversion tectonics – 30 years later” . It is not associated with a conference.
This research is funded by a Leverhulme Trust Early Career Fellowship (ECF-2018-645) awarded to Thomas B. Phillips. The authors thank Schlumberger for providing academic licences to Durham University and Imperial College for use of the Petrel Software. The authors would also like to thank Pablo Rodriguez-Salgado and Fabian Jähne-Klingberg for their constructive and detailed reviews that greatly improved the article.
This research has been supported by the Leverhulme Trust (Early Career Fellowship (grant no. ECF-2018-645)).
This paper was edited by Jonas Kley and reviewed by Pablo Rodríguez Salgado and Fabian Jähne-Klingberg.
Anderson, E. M.: The dynamics of faulting, Transactions of the Edinburgh Geol. Soc., 8, 387–402, 1905.
Babuška, V. and Plomerová, J.: The Sorgenfrei–Tornquist Zone as the mantle edge of Baltica lithosphere: new evidence from three-dimensional seismic anisotropy, Terra Nova, 16, 243–249, https://doi.org/10.1111/j.1365-3121.2004.00558.x, 2004.
Baig, I., Faleide, J. I., Mondol, N. H., and Jahren, J.: Burial and exhumation history controls on shale compaction and thermal maturity along the Norwegian North Sea basin margin areas, Mar. Petrol. Geol., 104, 61–85, https://doi.org/10.1016/j.marpetgeo.2019.03.010, 2019.
Bergerat, F., Angelier, J., and Andreasson, P.-G.: Evolution of paleostress fields and brittle deformation of the Tornquist Zone in Scania (Sweden) during Permo-Mesozoic and Cenozoic times, Tectonophysics, 444, 93–110, https://doi.org/10.1016/j.tecto.2007.08.005, 2007.
Berthelsen, A.: The Tornquist Zone northwest of the Carpathians: An intraplate pseudosuture, GFF, 120, 223–230, https://doi.org/10.1080/11035899801202223, 1998.
Biddle, K. T. and Rudolph, K. W.: Early Tertiary structural inversion in the Stord Basin, Norwegian North Sea, J. Geol. Soc., 145, 603–611, https://doi.org/10.1144/gsjgs.145.4.0603, 1988.
Buiter, S. J. H., Pfiffner, O. A., and Beaumont, C.: Inversion of extensional sedimentary basins: A numerical evaluation of the localisation of shortening, Earth Planet. Sc. Lett., 288, 492–504, https://doi.org/10.1016/j.epsl.2009.10.011, 2009.
Burns, W. M., Hayba, D. O., Rowan, E. L., Houseknecht, D. W., Haeussler, P., and Galloway, J.: Estimating the amount of eroded section in a partially exhumed basin from geophysical well logs: an example from the North Slope, US Geological Survey professional paper, 1–18, 2007.
Cartwright, J. A.: The kinematics of inversion in the Danish Central Graben, Geol. Soc. Lond. Spec. Publ., 44, 153–175, https://doi.org/10.1144/GSL.SP.1989.044.01.10, 1989.
Chattopadhyay, A. and Chakra, M.: Influence of pre-existing pervasive fabrics on fault patterns during orthogonal and oblique rifting: an experimental approach, Mar. Petrol. Geol., 39, 74–91, https://doi.org/10.1016/j.marpetgeo.2012.09.009, 2013.
Clausen, O. R., Nielsen, O. B., Huuse, M., and Michelsen, O.: Geological indications for Palaeogene uplift in the eastern North Sea Basin, Global Planet. Change, 24, 175–187, https://doi.org/10.1016/S0921-8181(00)00007-2, 2000.
Coleman, A. J., Duffy, O. B., and Jackson, C. A. L.: Growth folds above propagating normal faults, Earth-Sci. Rev., 196, 102885, https://doi.org/10.1016/j.earscirev.2019.102885, 2019.
Cooper, M. A., Williams, G. D., De Graciansky, P. C., Murphy, R. W., Needham, T., De Paor, D., Stoneley, R., Todd, S., Turner, J., and Ziegler, P. A.: Inversion tectonics – a discussion, Geol. Soc. Lond. Spec. Publ., 44, 335–347, 1989.
Corcoran, D. and Doré, A.: A review of techniques for the estimation of magnitude and timing of exhumation in offshore basins, Earth-Sci. Rev., 72, 129–168, https://doi.org/10.1016/j.earscirev.2005.05.003, 2005.
Cotte, N. and Pedersen, H. A.: Sharp contrast in lithospheric structure across the Sorgenfrei–Tornquist Zone as inferred by Rayleigh wave analysis of TOR1 project data, Tectonophysics, 360, 75–88, https://doi.org/10.1016/S0040-1951(02)00348-7, 2002.
Daly, M. C., Chorowicz, J., and Fairhead, J. D.: Rift basin evolution in Africa: the influence of reactivated steep basement shear zones, Geol. Soc. Lond. Spec. Publ., 44, 309, https://doi.org/10.1144/GSL.SP.1989.044.01.17, 1989.
Dart, C. J., McClay, K., and Hollings, P. N.: 3D analysis of inverted extensional fault systems, southern Bristol Channel basin, UK, Geol. Soc. Lond. Spec. Publ., 88, 393, https://doi.org/10.1144/GSL.SP.1995.088.01.21, 1995.
Deeks, N. R. and Thomas, S. A.: Basin inversion in a strike-slip regime: the Tornquist Zone, Southern Baltic Sea, Geol. Soc. Lond. Spec. Publ., 88, 319, https://doi.org/10.1144/GSL.SP.1995.088.01.18, 1995.
DISKOS: Public Portal, available at: https://portal.diskos.cgg.com, last access: 7 August 2020.
Doré, A. G. and Jensen, L. N.: The impact of late Cenozoic uplift and erosion on hydrocarbon exploration: offshore Norway and some other uplifted basins, Global Planet. Change, 12, 415–436, https://doi.org/10.1016/0921-8181(95)00031-3, 1996.
Duffy, O. B., Bell, R. E., Jackson, C. A.-L., Gawthorpe, R. L., and Whipp, P. S.: Fault growth and interactions in a multiphase rift fault network: Horda Platform, Norwegian North Sea, J. Struct. Geol., 80, 99–119, https://doi.org/10.1016/j.jsg.2015.08.015, 2015.
Dyksterhuis, S. and Müller, R. D.: Cause and evolution of intraplate orogeny in Australia, Geology, 36, 495–498, https://doi.org/10.1130/G24536A.1, 2008.
Erlström, M., Thomas, S. A., Deeks, N., and Sivhed, U.: Structure and tectonic evolution of the Tornquist Zone and adjacent sedimentary basins in Scania and the southern Baltic Sea area, Tectonophysics, 271, 191–215, https://doi.org/10.1016/S0040-1951(96)00247-8, 1997.
Gemmer, L., Huuse, M., Clausen, O. R., and Nielsen, S. B.: Mid-Palaeocene palaeogeography of the eastern North Sea basin: integrating geological evidence and 3D geodynamic modelling, Basin Res., 14, 329–346, https://doi.org/10.1046/j.1365-2117.2002.00182.x, 2002.
Gontijo-Pascutti, A., Bezerra, F. H. R., La Terra, E., and Almeida, J. C. H.: Brittle reactivation of mylonitic fabric and the origin of the Cenozoic Rio Santana Graben, southeastern Brazil, J. S. Am. Earth Sci., 29, 522–536, https://doi.org/10.1016/j.jsames.2009.06.007, 2010.
Giles, M., Indrelid, S., and James, D.: Compaction – the great unknown in basin modelling, Geol. Soc. Lond. Spec. Publ., 141, 15–43, https://doi.org/10.1144/GSL.SP.1998.141.01.02, 1998.
Hansen, S.: A compaction trend for Cretaceous and Tertiary shales on the Norwegian shelf based on sonic transit times, Petrol. Geosci., 2, 159–166, https://doi.org/10.1144/petgeo.2.2.159, 1996.
Hansen, D. L., Nielsen, S. B., and Lykke-Andersen, H.: The post-Triassic evolution of the Sorgenfrei–Tornquist Zone – results from thermo-mechanical modelling, Tectonophysics, 328, 245–267, https://doi.org/10.1016/S0040-1951(00)00216-X, 2000.
Hansen, D. L. and Nielsen, S. B.: Why rifts invert in compression, Tectonophysics, 373, 5–24, https://doi.org/10.1016/S0040-1951(03)00280-4, 2003.
Heeremans, M. and Faleide, J. I.: Late Carboniferous-Permian tectonics and magmatic activity in the Skagerrak, Kattegat and the North Sea, Geol. Soc. Lond. Spec. Publ., 223, 157–176, https://doi.org/10.1144/GSL.SP.2004.223.01.07, 2004.
Heeremans, M., Faleide, J. I., and Larsen, B. T.: Late Carboniferous -Permian of NW Europe: an introduction to a new regional map, Geol. Soc. Lond. Spec. Publ., 223, 75–88, 2004.
Heron, P. J., Pysklywec, R. N., Stephenson, R., and van Hunen, J.: Deformation driven by deep and distant structures: Influence of a mantle lithosphere suture in the Ouachita orogeny, southeastern United States, Geology, 47, 147–150, https://doi.org/10.1130/G45690.1, 2018.
Heron, P. J., Peace, A. L., McCaffrey, K., Welford, J. K., Wilson, R., van Hunen, J., and Pysklywec, R. N.: Segmentation of rifts through structural inheritance: Creation of the Davis Strait, Tectonics, 38, 2411–2430, https://doi.org/10.1029/2019TC005578, 2019.
Huyghe, P. and Mugnier, J. L.: A comparison of inverted basins of the Southern North Sea and inverted structures of the external Alps, edited by: Buchanan, J. G. and Buchanan, P. G., in: Basin Inversion, Geol. Soc. Lond. Spec. Publ., 88, 339–353, https://doi.org/10.1144/GSL.SP.1995.088.01.19, 1995.
Jackson, C. A. L. and Lewis, M. M.: Physiography of the NE margin of the Permian Salt Basin: new insights from 3D seismic reflection data, J. Geol. Soc., 170, 857–860, https://doi.org/10.1144/jgs2013-026, 2013.
Jackson, C. A. L., Chua, S. T., Bell, R. E., and Magee, C.: Structural style and early stage growth of inversion structures: 3D seismic insights from the Egersund Basin, offshore Norway, J. Struct. Geol., 46, 167–185, https://doi.org/10.1016/j.jsg.2012.09.005, 2013.
Japsen, P.: Regional velocity-depth anomalies, North Sea Chalk; a record of overpressure and Neogene uplift and erosion, AAPG Bulletin, 82, 2031–2074, 1998.
Japsen, P. and Bidstrup, T.: Quantification of late Cenozoic erosion in Denmark based on sonic data and basin modelling, Bulletin of the Geological Society of Denmark, 46, 79–99, 1999.
Japsen, P. and Chalmers, J. A.: Neogene uplift and tectonics around the North Atlantic: overview, Global Planet. Change, 24, 165–173, https://doi.org/10.1016/S0921-8181(00)00006-0, 2000.
Japsen, P., Bidstrup, T., and Lidmar-Bergström, K.: Neogene uplift and erosion of southern Scandinavia induced by the rise of the South Swedish Dome, Geol. Soc. Lond. Spec. Publ., 196, 183, https://doi.org/10.1144/GSL.SP.2002.196.01.12, 2002.
Japsen, P., Green, P. F., Nielsen, L. H., Rasmussen, E. S., and Bidstrup, T.: Mesozoic–Cenozoic exhumation events in the eastern North Sea Basin: a multi-disciplinary study based on palaeothermal, palaeoburial, stratigraphic and seismic data, Basin Res., 19, 451–490, https://doi.org/10.1111/j.1365-2117.2007.00329.x, 2007a.
Japsen, P., Mukerji, T., and Mavko, G.: Constraints on velocity-depth trends from rock physics models, Geophys. Prospect., 55, 135–154, https://doi.org/10.1111/j.1365-2478.2007.00607.x, 2007b.
Japsen, P., Green, P. F., Chalmers, J. A., and Bonow, J. M.: Mountains of southernmost Norway: uplifted Miocene peneplains and re-exposed Mesozoic surfaces, J. Geol. Soc., 175, 721, https://doi.org/10.1144/jgs2017-157, 2018.
Jensen, L. and Schmidt, B.: Late Tertiary uplift and erosion in the Skagerrak area: magnitude and consequences, Norsk Geologisk Tidsskrift, 72, 275–279, 1992
Jensen, L. and Schmidt, B.: Neogene uplift and erosion offshore south Norway: magnitude and consequences for hydrocarbon exploration in the Farsund Basin, Generation, accumulation and production of Europe's hydrocarbons III, Springer, 79–88, 1993.
Kalani, M., Jahren, J., Mondol, N. H., and Faleide, J. I.: Compaction processes and rock properties in uplifted clay dominated units – the Egersund Basin, Norwegian North Sea, Mar. Petrol. Geol., 68, 596–613, https://doi.org/10.1016/j.marpetgeo.2014.08.015, 2015.
Kelly, P., Peacock, D., Sanderson, D., and McGurk, A.: Selective reverse-reactivation of normal faults, and deformation around reverse-reactivated faults in the Mesozoic of the Somerset coast, J. Struct. Geol., 21, 493–509, https://doi.org/10.1016/S0191-8141(99)00041-3, 1999.
Kind, R., Gregersen, S., Hanka, W., and Bock, G.: Seismological evidence for a very sharp Sorgenfrei-Tornquist Zone in southern Sweden, Geol. Mag., 134, 591–595, 1997.
Kley, J. and Voigt, T.: Late Cretaceous intraplate thrusting in central Europe: Effect of Africa-Iberia-Europe convergence, not Alpine collision, Geology, 36, 11, 839–842, https://doi.org/10.1130/G24930A.1, 2008.
Kley, J.: Timing and spatial patterns of Cretaceous and Cenozoic inversion in the Southern Permian Basin, Geol. Soc. Lond. Spec. Publ., 469, 19–31, https://doi.org/10.1144/SP469.12, 2018.
Kockel, F.: Inversion structures in Central Europe – Expressions and reasons, an open discussion, Geologie en Mijnbouw, Netherlands J. Geosci., 82, 367–382, 2003.
Krzywiec, P.: Mid-Polish Trough inversion–seismic examples, main mechanisms and its relationship to the Alpine–Carpathian collision, EGU Stephan Mueller Special Publication Series, 1, 151–165, 2002.
Liboriussen, J., Ashton, P., and Tygesen, T.: The tectonic evolution of the Fennoscandian Border Zone in Denmark, Tectonophysics, 137, 21–29, https://doi.org/10.1016/0040-1951(87)90310-6, 1987.
Lie, J. and Husebye, E.: Simple-shear deformation of the Skagerrak lithosphere during the formation of the Oslo Rift, Tectonophysics, 232, 133–141, https://doi.org/10.1016/0040-1951(94)90080-9, 1994.
Long, J. J. and Imber, J.: Geometrically coherent continuous deformation in the volume surrounding a seismically imaged normal fault-array, J. Struct. Geol., 32, 222–234, 2010.
Lowell, J. D.: Mechanics of basin inversion from worldwide examples, Geol. Soc. Lond. Spec. Publ., 88, 39, https://doi.org/10.1144/GSL.SP.1995.088.01.04, 1995.
Magara, K.: Thickness of Removed Sedimentary Rocks, Paleopore Pressure, and Paleotemperature, Southwestern Part of Western Canada Basin, AAPG Bulletin, 63, 814–815, https://doi.org/10.1306/83D92401-16C7-11D7-8645000102C1865D, 1979.
Malehmir, A., Bergman, B., Andersson, B., Sturk, R., and Johansson, M.: Seismic imaging of dyke swarms within the Sorgenfrei-Tornquist Zone (Sweden) and implications for thermal energy storage, Solid Earth, 9, 1469–1485, https://doi.org/10.5194/se-9-1469-2018, 2018.
Mazur, S., Mikolajczak, M., Krzywiec, P., Malinowski, M., Buffenmyer, V., and Lewandowski, M.: Is the Teisseyre-Tornquist Zone an ancient plate boundary of Baltica?, Tectonics, 34, 2465–2477, https://doi.org/10.1002/2015TC003934, 2015.
McClay, K. R.: The geometries and kinematics of inverted fault systems: a review of analogue model studies, Geol. Soc. Lond. Spec. Publ., 88, 97, https://doi.org/10.1144/GSL.SP.1995.088.01.07, 1995.
Michelsen, O. and Nielsen, L. H.: Structural development of the Fennoscandian border zone, offshore Denmark, Mar. Petrol. Geol., 10, 124–134, https://doi.org/10.1016/0264-8172(93)90017-M, 1993.
Mitra, S. and Islam, Q. T.: Experimental (clay) models of inversion structures, Tectonophysics, 230, 211–222, https://doi.org/10.1016/0040-1951(94)90136-8, 1994.
Mogensen, T. and Jensen, L.: Cretaceous subsidence and inversion along the Tornquist Zone from Kattegat to the Egersund Basin, First Break, 12, 211–222, 1994.
Mogensen, T. E.: Palaeozoic structural development along the Tornquist Zone, Kattegat area, Denmark, Tectonophysics, 240, 191–214, https://doi.org/10.1016/0040-1951(94)90272-0, 1994.
Mogensen, T. E.: Triassic and Jurassic structural development along the Tornquist Zone, Denmark, Tectonophysics, 252, 197–220, https://doi.org/10.1016/0040-1951(95)00110-7, 1995.
Mogensen, T. E. and Korstgård, J. A.: Triassic and Jurassic transtension along part of the Sorgenfrei-Tornquist Zone in the Danish Kattegat, Geol. Surv. Den. Greenl., 1, 439–458, 2003.
Morley, C. K.: Developments in the structural geology of rifts over the last decade and their impact on hydrocarbon exploration, Geol. Soc. Lond. Spec. Publ., 80, 1, https://doi.org/10.1144/GSL.SP.1995.080.01.01, 1995.
Panien, M., Buiter, S., Schreurs, G., and Pfiffner, O.-A.: Inversion of a symmetric basin: insights from a comparison between analogue and numerical experiments, Geol. Soc. Lond. Spec. Publ., 253, 253–270, https://doi.org/10.1144/GSL.SP.2006.253.01.13, 2006.
Panien, M., Schreurs, G., and Pfiffner, A.: Sandbox experiments on basin inversion: testing the influence of basin orientation and basin fill, J. Struct. Geol., 27, 433–445, https://doi.org/10.1016/j.jsg.2004.11.001, 2005.
Patruno, S., Reid, W., Berndt, C., and Feuilleaubois, L.: Polyphase tectonic inversion and its role in controlling hydrocarbon prospectivity in the Greater East Shetland Platform and Mid North Sea High, UK, Geol. Soc. Lond. Spec. Publ., 471, 177, https://doi.org/10.1144/SP471.9, 2019.
Pegrum, R. M.: The extension of the Tornquist Zone in the Norwegian North Sea, Norsk Geologisk Tidsskrift, 64, 39–68, https://doi.org/10.1080/11035898509454679, 1984.
Pharaoh, T. C.: Palaeozoic terranes and their lithospheric boundaries within the Trans-European Suture Zone (TESZ): a review, Tectonophysics, 314, 17–41, https://doi.org/10.1016/S0040-1951(99)00235-8, 1999.
Phillips, T. B., Jackson, C. A., Bell, R. E., Duffy, O. B., and Fossen, H.: Reactivation of intrabasement structures during rifting: A case study from offshore southern Norway, J. Struct. Geol., 91, 54–73, https://doi.org/10.1016/j.jsg.2016.08.008, 2016.
Phillips, T. B., Magee, C., Jackson, C. A. L., and Bell, R. E.: Determining the three-dimensional geometry of a dike swarm and its impact on later rift geometry using seismic reflection data, Geology, 46, 119–122, https://doi.org/10.1130/G39672.1, 2017.
Phillips, T. B., Jackson, C. A.-L., Bell, R. E., and Duffy, O. B.: Oblique reactivation of lithosphere-scale lineaments controls rift physiography – the upper-crustal expression of the Sorgenfrei-Tornquist Zone, offshore southern Norway, Solid Earth, 9, 403–429, https://doi.org/10.5194/se-9-403-2018, 2018.
Phillips, T. B., Jackson, C. A. L., Bell, R. E., and Valencia, A. A.: Rivers, reefs and deltas: geomorphological evolution of the Jurassic of the Farsund Basin, offshore southern Norway, Petrol. Geosci., 26, 81–100, https://doi.org/10.1144/petgeo2018-056, 2019.
Reilly, C., Nicol, A., and Walsh, J.: Importance of pre-existing fault size for the evolution of an inverted fault system, Geometry and Growth of Normal Faults, 439, 447–463, https://doi.org/10.1144/SP439.2, 2017.
Rodríguez-Salgado, P., Childs, C., Shannon, P. M., and Walsh, J. J.: Structural evolution and the partitioning of deformation during basin growth and inversion: A case study from the Mizen Basin Celtic Sea, offshore Ireland. Basin Res., 0, 1–24, https://doi.org/10.1111/bre.12402, 2019.
Salomon, E., Koehn, D., and Passchier, C.: Brittle reactivation of ductile shear zones in NW Namibia in relation to South Atlantic rifting, Tectonics, 34, 70–85, https://doi.org/10.1002/2014TC003728, 2015.
Sandiford, M. and Hand, M.: Controls on the locus of intraplate deformation in central Australia, Earth Planet. Sc. Lett., 162, 97–110, https://doi.org/10.1016/S0012-821X(98)00159-9, 1998.
Scisciani, V., Patruno, S., Tavarnelli, E., Calamita, F., Pace, P., and Iacopini, D.: Multi-phase reactivations and inversions of Paleozoic-Mesozoic extensional basins during the Wilson Cycle: case studies from the North Sea (UK) and Northern Apennines (Italy), Geol. Soc. Lond. Spec. Publ., 470, 205–243, https://doi.org/10.1144/SP470-2017-232, 2019.
Sclater, J. G. and Christie, P. A.: Continental stretching: An explanation of the post-mid-Cretaceous subsidence of the central North Sea basin, J. Geophys. Res.-Sol. Ea., 85, 3711–3739, https://doi.org/10.1029/JB085iB07p03711, 1980.
Skjerven, J., Rijs, F., and Kalheim, J.: Late Palaeozoic to Early Cenozoic structural development of the south-southeastern Norwegian North Sea, in: Petroleum Geology of the Southeastern North Sea and the Adjacent Onshore Areas, edited by: Kaasschieter, J. P. H. and Reijers, T. J. A., Springer, 35–45 https://doi.org/10.1007/978-94-009-5532-5_3, 1983.
Sørensen, S., Morizot, H., and Skottheim, S.: A tectonostratigraphic analysis of the southeast Norwegian North Sea Basin, in: Structural and Tectonic Modelling and its Application to Petroleum Geology, edited by: Larsen, R. M., Brekke, H., Larsen, B. T., and Talleraas, E., Elsevier, Amsterdam, 19–42, https://doi.org/10.1016/B978-0-444-88607-1.50007-3, 1992.
Stephenson, R., Egholm, D. L., Nielsen, S. B., and Stovba, S. M.: Role of thermal refraction in localizing intraplate deformation in southeastern Ukraine, Nat. Geosci., 2, 290–293, https://doi.org/10.1038/ngeo479, 2009.
Stoker, M. S., Hoult, R. J., Nielsen, T., Hjelstuen, B. O., Laberg, J. S., Shannon, P. M., Praeg, D., Mathiesen, A., van Weering, T. C. E., and McDonnell, A.: Sedimentary and oceanographic responses to early Neogene compression on the NW European margin, Mar. Petrol. Geol., 22, 1031–1044, 2005.
Suppe, J.: Geometry and kinematics of fault-bend folding, Am. J. Sci., 283, 684–721, https://doi.org/10.2475/ajs.283.7.684, 1983.
Tassone, D., Holford, S., Stoker, M. S., Green, P., Johnson, H., Underhill, J. R., and Hillis, R.: Constraining Cenozoic exhumation in the Faroe-Shetland region using sonic transit time data, Basin Res., 26, 38–72, https://doi.org/10.1111/bre.12052, 2014.
Thybo, H.: Crustal structure and tectonic evolution of the Tornquist Fan region as revealed by geophysical methods, Bulletin of the Geological Society of Denmark, 46, 145–160, 2000.
Turner, J. P. and Williams, G. A.: Sedimentary basin inversion and intra-plate shortening, Earth-Sci. Rev., 65, 277–304, https://doi.org/10.1016/j.earscirev.2003.10.002, 2004.
Vejbæk, O. V.: The Horn Graben, and its relationship to the Oslo Graben and the Danish Basin, Tectonophysics, 178, 29–49, 1990.
Walsh, J. J., Childs, C., Meyer, V., Manzocchi, T., Imber, J., Nicol, A., Tuckwell, G., Bailey, W. R., Bonson, C. G., Watterson, J., Nell, P. A., and Strand, J.: Geometric controls on the evolution of normal fault systems, Geol. Soc. Lond. Spec. Publ., 186, 157, https://doi.org/10.1144/GSL.SP.2001.186.01.10, 2001.
Walsh, J. J., Bailey, W. R., Childs, C., Nicol, A., and Bonson, C. G.: Formation of segmented normal faults: a 3-D perspective, J. Struct. Geol., 25, 1251–1262, 2003.
Williams, G. A., Turner, J. P., and Holford, S. P.: Inversion and exhumation of the St. George's Channel basin, offshore Wales, UK, J. Geol. Soc., 162, 97–110, https://doi.org/10.1144/0016-764904-023, 2005.
Wilson, M., Neumann, E.-R., Davies, G. R., Timmerman, M., Heeremans, M., and Larsen, B. T.: Permo-Carboniferous magmatism and rifting in Europe: introduction, Geol. Soc. Lond. Spec. Publ., 223, 1–10, https://doi.org/10.1144/GSL.SP.2004.223.01.01, 2004.
Withjack, M. O. and Schlische, R. W.: Geometric and experimental models of extensional fault-bend folds, Geol. Soc. Lond. Spec. Publ., 253, 285, https://doi.org/10.1144/GSL.SP.2006.253.01.15, 2006.
Wyllie, M. R. J., Gregory, A. R., and Gardner, L. W.: Elastic wave velocities in heterogeneous and porous media, Geophysics, 21, 41–70, https://doi.org/10.1190/1.1438217, 1956.
Yamada, Y. and McClay, K.: 3-D analog modeling of inversion thrust structures, edited by: McClay, K. R., Thrust Tectonics and Hydrocarbon Systems, https://doi.org/10.1306/M82813C16, 2004.
Yielding, G.: The geometry of branch lines, Geol. Soc. Lond. Spec. Publ., 439, 11–22, 2016.
Youash, Y.: Tension Tests on Layered Rocks, Geological Society of America Bulletin, 80, 303–306, https://doi.org/10.1130/0016-7606(1969)80[303:TTOLR]2.0.CO;2, 1969.
- Abstract
- Introduction
- Geological setting and evolution
- Data and methods
- Structural style variability along the northern margin of the Farsund Basin
- Styles of inversion
- Discussion
- Conclusions
- Data availability
- Author contributions
- Competing interests
- Special issue statement
- Acknowledgements
- Financial support
- Review statement
- References